UNITED STATES
SECURITIES AND EXCHANGE COMMISSION
Washington, D.C. 20549
FORM N-CSR/A
CERTIFIED SHAREHOLDER REPORT OF REGISTERED
MANAGEMENT INVESTMENT COMPANIES
Investment Company Act file number: 811-21295
JPMorgan Trust I
(Exact name of registrant as specified in charter)
277 Park Avenue
New York, NY 10172
(Address of principal executive offices) (Zip code)
Gregory S. Samuels
277 Park Avenue
New York, NY 10172
(Name and Address of Agent for Service)
Registrant’s telephone number, including area code: (800) 480-4111
Date of fiscal year end: October 31
Date of reporting period: November 1, 2018 through April 30, 2023
Form N-CSR is to be used by management investment companies to file reports with the Commission not later than 10 days after the transmission to stockholders of any report that is required to be transmitted to stockholders under Rule 30e-1 under the Investment Company Act of 1940 (17 CFR 270.30e-1). The Commission may use the information provided on Form N-CSR in its regulatory, disclosure review, inspection, and policymaking roles.
A registrant is required to disclose the information specified by Form N-CSR, and the Commission will make this information public. A registrant is not required to respond to the collection of information contained in Form N-CSR unless the Form displays a currently valid Office of Management and Budget (“OMB”) control number. Please direct comments concerning the accuracy of the information collection burden estimate and any suggestions for reducing the burden to Secretary, Securities and Exchange Commission, 450 Fifth Street, NW, Washington, DC 20549-0609. The OMB has reviewed this collection of information under the clearance requirements of 44 U.S.C. Section 3507.
ITEM 1. REPORTS TO STOCKHOLDERS.
a.) The following is a copy of the report transmitted to shareholders pursuant to Rule 30e-1 under the Investment Company Act of 1940 (17 CFR 270.30e-1).
b.) A copy of the notice transmitted to shareholders in reliance on Rule 30e-3 under the 1940 Act that contains disclosures specified by paragraph (c)(3) of that rule is included in the Annual Report. Not Applicable. Notices do not incorporate disclosures from the shareholder reports.
Semi-Annual Report
J.P. Morgan Specialty Funds
April 30, 2023 (Unaudited)
April 30, 2022 (Unaudited)
April 30, 2021 (Unaudited)
April 30, 2020 (Unaudited)
April 30, 2019 (Unaudited)
JPMorgan Research Market Neutral Fund

CONTENTS
Investments in the Fund are not deposits or obligations of, or guaranteed or endorsed by, any bank and are not insured or guaranteed by the FDIC, the Federal Reserve Board or any other government agency. You could lose money if you sell when the Fund’s share price is lower than when you invested.
Past performance is no guarantee of future performance. The general market views expressed in this report are opinions based on market and other conditions through the end of the reporting period and are subject to change without notice. These views are not intended to predict the future performance of the Fund or the securities markets. Prospective investors should refer to the Fund’s prospectuses for a discussion of the Fund’s investment objectives, strategies and risks. Call J.P. Morgan Funds Service Center at 1-800-480-4111 for a prospectus containing more complete information about the Fund, including management fees and other expenses. Please read it carefully before investing.
LETTER TO SHAREHOLDERS
JUNE 15, 2023 (Unaudited)
Dear Shareholder,
Financial markets largely generated positive returns for the six months ended April 30, 2023, even as rising interest rates, weaker corporate earnings and geopolitical uncertainty weighed on global economic growth. Overall, global equity markets — led by European stocks — generally outperformed bond markets for the reporting period.
| | |
 | | “While the effects of rising interest rates is likely to adversely impact economic growth in the months ahead, other factors may aid the global economic outlook, as energy prices have trended downward in recent months and the re-opening of China’s economy may provide support for increased global trade.” —Brian S. Shlissel |
While economic growth has slowed in recent quarters, to date, the U.S. has avoided formal entry into a recession. Moreover, inflation has decelerated from last year’s historical highs as energy and electricity prices receded in 2023, allowing the U.S. Federal Reserve in June 2023 to refrain from further raising interest rates for the first time since January 2022, though the central bank stated it may find it necessary to raise rates in the future. The job market in the U.S. remained strong throughout the period as the reported monthly unemployment rate ranged between 3.6% and 3.4% for the six months ended April 30, 2023.
Across Europe, inflationary pressures remained high and both the European Central Bank and the Bank of England continued to raise interest rates during the period. Unemployment across the EU stood at 6%, while the U.K. jobless rate fell to 3.8% in April 2023. Notably, European equity markets generally outperformed other developed markets during the period, potentially driven by more attractive valuations relative to U.S. companies.
The International Monetary Fund’s (IMF) April 2023 economic outlook warned that global output is likely to decline to 2.8% for 2023, amid weakness in parts of the financial sector, continued inflationary pressures and the ongoing war in Ukraine. Further, the IMF forecast developed market economies to decelerate at a faster pace than emerging market economies.
While the effects of rising interest rates is likely to adversely impact economic growth in the months ahead, other factors may aid the global economic outlook, as energy prices have trended downward in recent months and the re-opening of China’s economy may provide support for increased global trade. Regardless of the economic backdrop, we believe investors who hold a well-diversified portfolio and a long-term outlook may be better positioned to benefit from opportunities presented by global financial markets. Our suite of investment solutions seeks to provide investors with ability to build durable portfolios that can meet their financial goals.
Sincerely,

Brian S. Shlissel
President, J.P. Morgan Funds
J.P. Morgan Asset Management
1-800-480-4111 or www.jpmorganfunds.com for more information
| | | | | | | | | | |
| | | | | |
| | | J.P. MORGAN SPECIALTY FUNDS | | | | | | | | 1 |
J.P. Morgan Specialty Funds
MARKET OVERVIEWS
SIX MONTHS ENDED APRIL 30, 2023 (Unaudited)
Global financial markets largely generated positive returns for the period and completed a rebound from the sell-offs that marked the middle of 2022. Developed markets equity generally outperformed emerging markets equity, while European equity markets outperformed U.S. equity.
However, equity markets performance was mixed on a month-to-month basis, even if the overall trend was upward. For the six months ended April 30, 2023, the MSCI EAFE Index returned 24.19%, the MSCI Emerging Markets Index returned 16.36% and the S&P 500 Index returned 8.63%.
Leading central banks continued to raise interest rates throughout the six-month period, though the size of increases narrowed in 2023 as the policy response to inflationary pressure grew less aggressive. Notably, the Bank of Japan maintained its negative interest rate policy amid weak consumption data and marginal economic growth.
While global inflation rates remained elevated during the period, they retreated from the 40-year highs reached in 2022, and price data in the U.S. and the Euro Area indicated a slowing trend. Though inflation in the U.K. declined in the final months of 2022, the U.K. consumer price index rose more than expected in 2023.
Lower energy prices were a leading contributor to declining global inflation in the second half of the period. Following Russia’s invasion of Ukraine in late February 2022, the European Union and the U.K. largely avoided an extended energy crisis by securing alternative sources to Russian natural gas and moved to build up reserves of both natural gas and petroleum ahead of the winter months.
Meanwhile, economic activity and aggregate demand in China accelerated after the country’s leadership lifted strict anti-pandemic policies in late 2022. The rebound in China helped to lift equity prices in China and its leading emerging market trading partners.
| | | | | | | | | | |
| | | | | |
| 2 | | | | | | | | J.P. MORGAN SPECIALTY FUNDS | | |
J.P. Morgan Specialty Funds
MARKET OVERVIEWS
SIX MONTHS ENDED APRIL 30, 2022 (Unaudited)
While developed market equities rallied in the final months of 2021, a resurgence in the pandemic, surging inflation and Russia’s invasion of Ukraine in late February 2022 dented the global economic outlook and erased equity market gains for the six month period. Overall, both global equity and fixed income markets largely generated negative returns for the period, with emerging markets largely underperforming developed markets.
U.S. equity prices largely maintained upward momentum in the final months of 2021 amid low interest rates, a boom in household wealth and record corporate earnings and revenues. However, investor concerns about the emergence of the Omicron variant of COVID-19 and surging inflationary pressure fueled market volatility in 2022 and Russia’s military build-up and invasion of Ukraine in February 2022 put further pressure on U.S. equity prices.
In mid-March 2022, the U.S. Federal Reserve followed through on its stated plan and raised interest rates for the first time since December 2018, and pledged to raise rates six more times in 2022. While U.S. equity prices rebounded somewhat for the month, both equity and bond markets slumped in April as negotiations to end the Ukraine conflict failed and global supply-chain disruptions increased. Notably, the U.S. dollar strengthened against other major currencies in early 2022, which provided a significant drag on both the domestic economy and corporate earnings. However, job growth in the U.S. continued throughout the six month period.
European and U.K. equities largely ended 2021 with gains but the reimposition of social restrictions in response to the spread of Omicron and the outbreak of fighting in Ukraine weighed on financial markets in early 2022. While initial multilateral trade and financial sanctions against Russia excluded its energy sector, prices for natural gas and petroleum rose sharply across Europe and the potential disruption of energy supplies hurt investor sentiment.
Unemployment in both the Euro area and the U.K. had fallen to near multi-decade lows by the end of April 2022 but consumer sentiment across both regions tumbled lower in 2022. During the six month period, the European Central Bank maintained its ultra-low interest rate policy, while the Bank of England raised rates three times during the period amid the highest annual inflation rate in 30 years.
Within emerging markets, both equities and bonds underperformed throughout the six month period. China proved be the largest drag on emerging markets during the period as investor concerns about tighter regulatory scrutiny of large technology companies in 2021 gave way to strict lockdowns in several large cities amid a resurgence in COVID-19 infections throughout the country. The expected slowdown in China’s economy, and in its manufacturing sector in particular, weighed down financial markets in its emerging market trading partners. Rising prices for energy and a range of other commodities also raised investor concerns about economic growth across emerging market nations, particularly net importers of petroleum and natural gas. Additionally, the prospect of rising U.S. interest rates weighed on emerging market bond prices.
The S&P 500 Index returned -9.65%, the MSCI EAFE Index returned -11.58% and the MSCI Emerging Markets Index returned 14.04% for the six months ended April 30, 2022.
| | | | | | | | | | |
| | | | | |
| | J.P. MORGAN SPECIALTY FUNDS | | | | | | | | 3 |
J.P. Morgan Specialty Funds
MARKET OVERVIEWS
SIX MONTHS ENDED APRIL 30, 2021 (Unaudited)
Globally, equity market valuations climbed higher during the period, initially fueled by the massive pandemic response of leading central banks and fiscal authorities and extended by the development of multiple vaccines in late 2020 and the advent of mass vaccinations in 2021. The rebound in asset prices during the period — partly led by U.S. equity — swept across both emerging markets and developed markets.
The final months of the 2020 included a continued rebound in global prices for petroleum and a range of other commodities as manufacturing data and consumer sentiment strengthened. November and December saw broad gains in global equity, partly driven by continued investor demand for U.S. large cap stocks, particularly in the technology sector. Emerging markets equity surged ahead of developed markets in December as China, Taiwan and other emerging market nations appeared to have greater success in containing the pandemic.
Global equity markets surged from February through April 2021 amid a general surge in corporate earnings and consumer and business spending. Developed market equity provided strong returns, while emerging markets equity was weighed down by investor concern about large pandemic outbreaks in select nations, particularly Brazil and India.
U.S. equity markets generally led the rally, supported by a $1.9 trillion U.S. fiscal relief and recovery package and the prospect of additional federal government spending plans. Better-than-expected corporate earnings and revenues in 2021, combined with strong growth consumer spending and improved manufacturing data, drove global equity prices further upward toward the end of the period.
For the six months ended April 30, 2021, the MSCI EAFE Index returned 29.13%, the S&P 500 Index returned 28.85% and the MSCI Emerging Markets Index returned 23.09%.
| | | | | | | | | | |
| | | | | |
| 4 | | | | | | | | J.P. MORGAN SPECIALTY FUNDS | | |
J.P. Morgan Specialty Funds
MARKET OVERVIEWS
SIX MONTHS ENDED APRIL 30, 2020 (Unaudited)
While developed markets equity generally rallied in the final months of 2019, the global response to the COVID-19 pandemic led to a dramatic increase in financial market volatility and drove asset prices sharply lower in February and March of 2020 before equity prices posted a small rebound in April 2020.
Global equity markets, led by the U.S. and Europe, largely recorded gains for the final two months of 2019 on the back of accommodative policies from leading central banks and investor expectations of a reduction in trade tensions. Even as economic data showed slowing or flat growth in China, Europe and the U.S. in the final quarter of 2019, there were no indicators that the longest recorded economic expansion in the U.S. would necessarily end. In the second half of December 2019, the U.S. and China reached a “Phase One” agreement that reduced trade tariffs and headed off the implementation of new tariffs. Combined with less aggressive U.S. trade rhetoric toward Mexico and toward European and Japanese auto industries, the U.S.-China trade agreement fueled price gains in developed equity markets.
In the U.K., the Conservative Party won a large majority in national elections in December 2019, which appeared to remove investor concerns about the possibility of a non-negotiated “hard Brexit” departure from the EU. Equity prices in the U.K. and the British pound briefly rallied on the election results.
Early January 2020 saw continued investor support for global equity that weathered a brief flare up in military tension between the U.S. and Iran. However, investor sentiment began to turn as the outbreak of COVID-19 began to impact large parts of China’s economy. Emerging markets equity led a slump in global equity markets and U.S. and European government bonds largely gained. Notably, prices for benchmark Brent crude oil plummeted 11.9% in January amid shrinking demand from China and other economies hit by the pandemic.
U.S. equity prices found support in early February 2020 as companies began to report better-than-expected earnings from the final quarter of 2019. By the end of the month, global equity prices had fallen significantly and global demand for petroleum had declined for the first time since the 2009 financial crisis. China’s central bank responded to the impact of COVID-19 by cutting the prime lending rate and regional authorities across China enacted a range of actions to counter the sharp drop in economic activity. By the end of February, yields on benchmark 10-year U.S. Treasury bonds had fallen to a record low 1.1% as investors sought the perceived safety of government-backed bonds.
The month of March 2020 proved to be worse for global equity and a range of other asset classes as COVID-19 was declared a pandemic and national, regional and municipal governments implemented at-home quarantines and a range of other actions designed to prevent hospitals and health care systems from being overwhelmed. The U.S. Federal Reserve slashed interest rates, restarted its quantitative easing or asset purchasing program, and unleashed an array of programs to maintain liquidity and functioning in short-term commercial debt markets. The European Central Bank also stepped in to shore up economic activity via negative interest rates and a commitment to continue purchasing assets until no longer necessary. Statements of broad support from both central banks, along with fiscal stimulus and/or wage protection policies from national governments across the globe, helped to reduce record high volatility in financial markets. However, leading equity indexes lost 20% or more of their value during the first quarter of 2020. Corporate bond prices generally fell and the prices of Brent crude oil ended the first quarter down by 60%. Only developed market sovereign bonds and commodity gold experienced price appreciation in March 2020.
Global equity markets rebounded slightly in April 2020 and fixed income markets rallied somewhat as investors reacted positively to the actions of central banks and national governments to mitigate the economic impact of the pandemic. Price gains were seen in large cap technology stocks and pharmaceutical sector stocks. Fixed income investments benefitted from accommodative central bank policies and high quality corporate credit outperformed government bonds for the month. However, a glut in global petroleum markets sent futures prices for benchmark West Texas Intermediate crude oil into negative territory.
For the six months ended April 30, 2020, the S&P 500 Index returned -3.16%, the MSCI EAFE Index returned -14.00% and the MSCI EME Index returned 10.39%. Among bond market indexes, the Bloomberg Barclays U.S. Aggregate Index returned 4.86% and the Bloomberg Barclays Emerging Markets Index returned -5.69%.
| | | | | | | | | | |
| | | | | |
| | J.P. MORGAN SPECIALTY FUNDS | | | | | | | | 5 |
JPMorgan Research Market Neutral Fund
FUND COMMENTARY (AS RESTATED, SEE NOTE 8)
SIX MONTHS ENDED APRIL 30, 2023 (Unaudited)
| | | | |
| REPORTING PERIOD RETURN: | |
| Fund (Class I Shares)* | | | 5.46% | |
| ICE BofA 3-Month US Treasury Bill Index | | | 2.10% | |
| |
| Net Assets After Future Share Reacquisition Adjustment as of 4/30/2023 (In Thousands) | | $ | 166,443 | |
INVESTMENT OBJECTIVE**
The JPMorgan Research Market Neutral Fund (the “Fund”) seeks to provide long-term capital appreciation from a broadly diversified portfolio of U.S. stocks while neutralizing the general risks associated with stock market investing.
WHAT WERE THE MAIN DRIVERS OF THE FUND’S PERFORMANCE?
The Fund’s Class I Shares outperformed the ICE BofA 3-Month US Treasury Bill Index (the “Benchmark”) for the six months ended April 30, 2023.
The Fund’s security selection in the media sector and the software & hardware sector was a leading contributor to performance relative to the Benchmark, while the Fund’s security selection in the industrial cyclical and utilities sector was a leading detractor from relative performance.
Leading individual contributors to relative performance included the Fund’s long position in Meta Platforms Inc. and its short positions in Lumen Technologies Inc. and Roblox Corp. Shares of Meta Platforms, an interactive media and services provider, rose after the company reported better-than-expected earnings, revenue and Facebook advertising sales for the first quarter of 2023. Shares of Lumen Technologies, a communications technology provider, fell after the company lowered its cash flow forecast for 2023. Shares of Roblox, an interactive home entertainment provider, fell after the company reported it had financial exposure to the failed Silicon
Valley Bank and after the release of weaker-than-expected user metrics for March 2023.
Leading individual detractors from relative performance included the Fund’s short positions in General Electric Co. an Boeing Co., and its long position in Liberty SiriusXM Group Shares of General Electric, an industrial conglomerate, rose after the company reported better-than-expected earnings and revenue for the first quarter of 2023 and revised upward its full-year earnings forecast. Shares of Boeing, an aerospace and defense manufacturer, rose after the company reported better-than-expected revenue for the first quarter of 2023 and maintained its production targets for 2023. Shares of Liberty SiriusXM Group, a cable and satellite TV and radio provider, fell amid broader weakness in the telecommunications sector.
HOW WAS THE FUND POSITIONED?
The Fund’s portfolio managers aimed to construct a portfolio of long and short positions with a low correlation to the broader market for stocks and bonds. The Fund’s portfolio managers used fundamental research to estimate companies’ long-term earnings forecasts, ranking approximately 600 large and mid-cap stocks into five quintiles. The Fund’s portfolio managers looked to the top two quintiles for potential long positions in stocks that they believed were undervalued and the bottom two quintiles for potential short positions in stocks that they believed were overvalued.
| | | | | | | | | | |
| | | | | |
| 6 | | | | | | | | J.P. MORGAN SPECIALTY FUNDS | | |
| | | | | | | | |
TOP TEN LONG POSITIONS OF THE
PORTFOLIO AS OF APRIL 30, 2023 | | PERCENT OF
TOTAL
INVESTMENTS | |
| | 1. | | | Meta Platforms, Inc., Class A | | | 2.5 | % |
| | 2. | | | Mastercard, Inc., Class A | | | 1.8 | |
| | 3. | | | Taiwan Semiconductor Manufacturing Co. Ltd. (Taiwan) | | | 1.8 | |
| | 4. | | | Endeavor Group Holdings, Inc., Class A | | | 1.6 | |
| | 5. | | | Seagate Technology Holdings plc | | | 1.6 | |
| | 6. | | | Progressive Corp. (The) | | | 1.6 | |
| | 7. | | | Intuit, Inc. | | | 1.4 | |
| | 8. | | | Teradyne, Inc. | | | 1.3 | |
| | 9. | | | Amazon.com, Inc. | | | 1.3 | |
| | 10. | | | Howmet Aerospace, Inc. | | | 1.2 | |
| | | | | | | | |
TOP TEN SHORT POSITIONS OF THE
PORTFOLIO AS OF APRIL 30, 2023 | | PERCENT OF
TOTAL
INVESTMENTS | |
| | 1. | | | Applied Materials, Inc. | | | 3.2 | % |
| | 2. | | | Microchip Technology, Inc. | | | 2.7 | |
| | 3. | | | Cisco Systems, Inc. | | | 2.4 | |
| | 4. | | | Kroger Co. (The) | | | 1.9 | |
| | 5. | | | Hewlett Packard Enterprise Co. | | | 1.9 | |
| | 6. | | | 3M Co. | | | 1.7 | |
| | 7. | | | Boeing Co. (The) | | | 1.7 | |
| | 8. | | | Sysco Corp. | | | 1.6 | |
| | 9. | | | Paramount Global, Class B | | | 1.6 | |
| | 10. | | | Stanley Black & Decker, Inc. | | | 1.5 | |
| | | | |
LONG POSITION PORTFOLIO COMPOSITION BY SECTOR AS OF APRIL 30, 2023 | | PERCENT OF
TOTAL
INVESTMENTS | |
| Information Technology | | | 16.0 | % |
| Financials | | | 12.7 | |
| Industrials | | | 11.9 | |
| Health Care | | | 9.2 | |
| Consumer Discretionary | | | 8.1 | |
| Communication Services | | | 7.9 | |
| Utilities | | | 3.6 | |
| Consumer Staples | | | 3.2 | |
| Energy | | | 2.7 | |
| Real Estate | | | 1.9 | |
| Materials | | | 1.1 | |
| Short-Term Investments | | | 21.7 | |
| | | | |
SHORT POSITION PORTFOLIO COMPOSITION BY SECTOR AS OF APRIL 30, 2023 | | PERCENT OF
TOTAL
INVESTMENTS | |
| Industrials | | | 20.4 | % |
| Information Technology | | | 18.2 | |
| Financials | | | 15.8 | |
| Health Care | | | 9.6 | |
| Communication Services | | | 9.0 | |
| Consumer Staples | | | 8.0 | |
| Consumer Discretionary | | | 6.7 | |
| Utilities | | | 5.3 | |
| Real Estate | | | 3.0 | |
| Energy | | | 2.9 | |
| Materials | | | 1.1 | |
| * | | The return shown is based on net asset values calculated for shareholder transactions and may differ from the return shown in the financial highlights, which reflects adjustments made to the net asset values in accordance with accounting principles generally accepted in the United States of America. |
| ** | | The adviser seeks to achieve the Fund’s objective. There can be no guarantee it will be achieved. |
| | | | | | | | | | |
| | | | | |
| | J.P. MORGAN SPECIALTY FUNDS | | | | | | | | 7 |
JPMorgan Research Market Neutral Fund
FUND COMMENTARY (AS RESTATED, SEE NOTE 8)
SIX MONTHS ENDED APRIL 30, 2023 (Unaudited) (continued)
| | | | | | | | | | | | | | | | | | |
AVERAGE ANNUAL TOTAL RETURNS AS OF APRIL 30, 2023 | |
| | | | | |
| | | INCEPTION DATE OF
CLASS | | 6 MONTH* | | | 1 YEAR | | | 5 YEAR | | | 10 YEAR | |
CLASS A SHARES | | February 28, 2002 | | | | | | | | | | | | | | | | |
With Sales Charge** | | | | | (0.15 | )% | | | (0.08 | )% | | | 3.02 | % | | | 1.80 | % |
Without Sales Charge | | | | | 5.37 | | | | 5.45 | | | | 4.14 | | | | 2.35 | |
CLASS C SHARES | | November 2, 2009 | | | | | | | | | | | | | | | | |
With CDSC*** | | | | | 4.12 | | | | 3.93 | | | | 3.63 | | | | 1.95 | |
Without CDSC | | | | | 5.12 | | | | 4.93 | | | | 3.63 | | | | 1.95 | |
CLASS I SHARES | | November 2, 2009 | | | 5.46 | | | | 5.70 | | | | 4.39 | | | | 2.61 | |
| ** | | Sales Charge for Class A Shares is 5.25%. |
| *** | | Assumes a 1% CDSC (contingent deferred sales charge) for the 6 month and one year periods and 0% CDSC thereafter. |
TEN YEAR FUND PERFORMANCE (4/30/13 TO 4/30/23) (AS RESTATED, SEE NOTE 8)
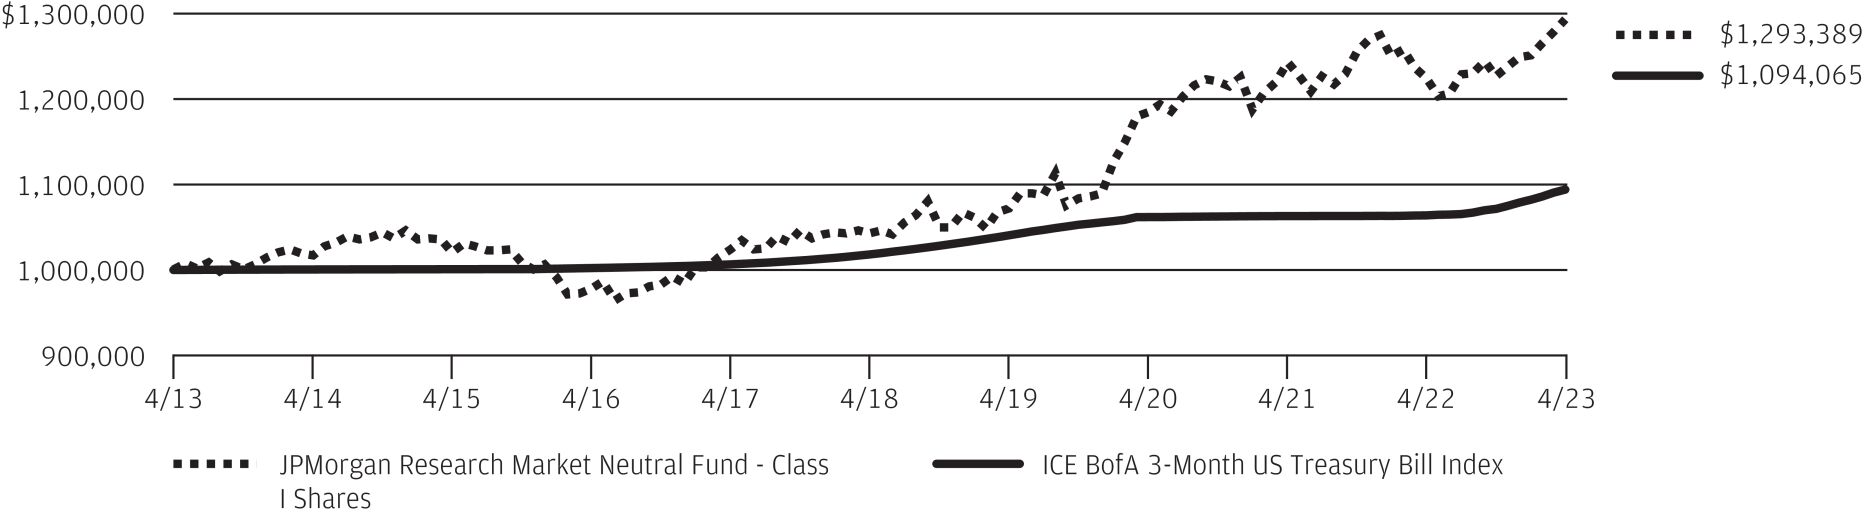
The performance quoted is past performance and is not a guarantee of future results. Mutual funds are subject to certain market risks. Investment returns and principal value of an investment will fluctuate so that an investor’s shares, when redeemed, may be worth more or less than their original cost. Current performance may be higher or lower than the performance data shown. For up-to-date month-end performance information, please call 1-800-480-4111.
The graph illustrates comparative performance for $1,000,000 invested in Class I Shares of the JPMorgan Research Market Neutral Fund and ICE BofA 3-Month US Treasury Bill Index from April 30, 2013 to April 30, 2023. The performance of the Fund assumes reinvestment of all dividends and capital gain distributions, if any, and does not include a sales charge. The performance of the ICE BofA 3-Month US Treasury Bill Index does not reflect the deduction of expenses or a sales charge associated with a mutual fund and has been adjusted to reflect reinvestment of all dividends and capital gain distributions of the securities included in the benchmark, if applicable. The ICE BofA 3-Month US Treasury Bill Index is comprised of a single issue purchased at the beginning of the month and held for a full month. Each month the index is rebalanced and
the issue selected is the outstanding Treasury Bill that matures closest to, but not beyond, 3 months from the rebalancing date. Investors cannot invest directly in an index.
Class I Shares have a $1,000,000 minimum initial investment.
Fund performance may reflect the waiver of the Fund’s fees and reimbursement of expenses for certain periods. Without these waivers and reimbursements, performance would have been lower. Also, performance shown in this section does not reflect the deduction of taxes that a shareholder would pay on Fund distributions or on gains resulting from redemptions of Fund shares.
Because Class C Shares automatically convert to Class A Shares after 8 years, the 10 year average annual total return shown above for Class C reflects Class A performance for the period after conversion.
The returns shown are based on net asset values calculated for shareholder transactions and may differ from the returns shown in the financial highlights, which reflect adjustments made to the net asset values in accordance with accounting principles generally accepted in the United States of America.
| | | | | | | | | | |
| | | | | |
| 8 | | | | | | | | J.P. MORGAN SPECIALTY FUNDS | | |
JPMorgan Research Market Neutral Fund
FUND COMMENTARY (AS RESTATED, SEE NOTE 8)
SIX MONTHS ENDED APRIL 30, 2022 (Unaudited)
| | | | |
| REPORTING PERIOD RETURN: | |
| Fund (Class I Shares)* | | | (2.59)% | |
| ICE BofAML 3-Month US Treasury Bill Index | | | 0.07% | |
| |
| Net Assets After Future Share Reacquisition Adjustment as of 4/30/2022 (In Thousands) | | $ | 126,587 | |
INVESTMENT OBJECTIVE**
The JPMorgan Research Market Neutral Fund (the “Fund”) seeks to provide long-term capital appreciation from a broadly diversified portfolio of U.S. stocks while neutralizing the general risks associated with stock market investing.
WHAT WERE THE MAIN DRIVERS OF THE FUND’S PERFORMANCE?
The Fund’s Class I Shares underperformed the ICE BofAML 3-Month US Treasury Bill Index (the “Benchmark”) for the six months ended April 30, 2022.
The Fund’s security selection and overweight position in the media sector and its security selection in the retail sector were leading detractors from performance relative to the Benchmark, while the Fund’s security selection in the pharmaceuticals & health care sector and industrial cyclical sectors was a leading contributor to relative performance.
Leading individual detractors from relative performance included the Fund’s short positions in Kroger Co. and Omnicom Group Inc. and its long position in Shopify Inc. Shares of Kroger, a supermarket and department store chain, rose after the company reported better-than-expected earnings and revenue for the fourth quarter of 2021. Shares of Omicron Group, an advertising and marketing company, rose after the company reported better-than-expected earnings and revenue for the fourth quarter of 2021 and the first quarter of 2022. Shares of
Shopify, an online merchant sales platform provider, fell after the company reported declining growth amid reduced online spending by consumers during the period.
Leading individual contributors to relative performance included the Fund’s short position in Moderna Inc., and its long positions in Mastercard Inc. and Vertex Pharmaceuticals Inc.
Shares of Moderna, a pharmaceutical maker, underperformed amid investor concerns about disappointing clinical data for the company’s flu vaccine and slowing demand for its COVID-19 vaccine. Shares of Mastercard, a payment processing provider, rose after the company reported better-than-expected earnings and revenue for the fourth quarter of 2021. Shares of Vertex Pharmaceuticals, a biotechnology company, rose after the company reported better-than-expected earnings and revenue for the fourth quarter of 2021.
HOW WAS THE FUND POSITIONED?
The Fund’s portfolio managers aimed to construct a portfolio of long and short positions with a low correlation to the broader market for stocks and bonds. The Fund’s portfolio managers used fundamental research to estimate companies’ long-term earnings forecasts, ranking approximately 600 large and mid-cap stocks into five quintiles. The Fund’s portfolio managers looked to the top two quintiles for potential long positions in stocks that they believed were undervalued and the bottom two quintiles for potential short positions in stocks that they believed were overvalued.
| | | | | | | | | | |
| | | | | |
| | J.P. MORGAN SPECIALTY FUNDS | | | | | | | | 9 |
JPMorgan Research Market Neutral Fund
FUND COMMENTARY (AS RESTATED, SEE NOTE 8)
SIX MONTHS ENDED APRIL 30, 2022 (Unaudited) (continued)
| | | | | | | | |
TOP TEN LONG POSITIONS OF THE
PORTFOLIO AS OF APRIL 30, 2022 | | PERCENT OF
TOTAL
INVESTMENTS | |
| | 1. | | | Mastercard, Inc., Class A | | | 2.5 | % |
| | 2. | | | NXP Semiconductors NV (China) | | | 2.0 | |
| | 3. | | | Amazon.com, Inc. | | | 1.4 | |
| | 4. | | | Diamondback Energy, Inc. | | | 1.4 | |
| | 5. | | | Deere & Co. | | | 1.2 | |
| | 6. | | | AbbVie, Inc. | | | 1.2 | |
| | 7. | | | Exelon Corp. | | | 1.1 | |
| | 8. | | | Wells Fargo & Co. | | | 1.0 | |
| | 9. | | | Advanced Micro Devices, Inc. | | | 1.0 | |
| | 10. | | | FleetCor Technologies, Inc. | | | 1.0 | |
| | | | | | | | |
TOP TEN SHORT POSITIONS OF THE
PORTFOLIO AS OF APRIL 30, 2022 | | PERCENT OF
TOTAL
INVESTMENTS | |
| | 1. | | | Kroger Co. (The) | | | 3.3 | % |
| | 2. | | | Omnicom Group, Inc. | | | 3.1 | |
| | 3. | | | 3M Co. | | | 2.3 | |
| | 4. | | | Enbridge, Inc. | | | 2.2 | |
| | 5. | | | Paramount Global, Class B | | | 2.1 | |
| | 6. | | | Intel Corp. | | | 1.9 | |
| | 7. | | | Walmart, Inc. | | | 1.8 | |
| | 8. | | | Apple, Inc. | | | 1.8 | |
| | 9. | | | NetApp, Inc. | | | 1.6 | |
| | 10. | | | Cisco Systems, Inc. | | | 1.6 | |
| | | | |
LONG POSITION PORTFOLIO COMPOSITION
BY SECTOR AS OF APRIL 30, 2022 | | PERCENT OF
TOTAL
INVESTMENTS | |
| Information Technology | | | 13.4 | % |
| Industrials | | | 11.7 | |
| Health Care | | | 9.9 | |
| Consumer Discretionary | | | 8.0 | |
| Financials | | | 6.2 | |
| Energy | | | 4.7 | |
| Communication Services | | | 4.5 | |
| Utilities | | | 3.8 | |
| Real Estate | | | 2.3 | |
| Consumer Staples | | | 2.2 | |
| Materials | | | 1.9 | |
Short-Term Investments | | | 31.4 | |
| | | | |
SHORT POSITION PORTFOLIO COMPOSITION
BY SECTOR AS OF APRIL 30, 2022 | | PERCENT OF
TOTAL
INVESTMENTS | |
| Information Technology | | | 16.8 | % |
| Industrials | | | 16.4 | |
| Health Care | | | 11.3 | |
| Financials | | | 10.9 | |
| Consumer Staples | | | 10.2 | |
| Communication Services | | | 9.9 | |
| Energy | | | 5.9 | |
| Utilities | | | 5.8 | |
| Consumer Discretionary | | | 5.7 | |
| Real Estate | | | 4.4 | |
| Materials | | | 2.7 | |
| * | | The return shown is based on net asset values calculated for shareholder transactions and may differ from the return shown in the financial highlights, which reflects adjustments made to the net asset values in accordance with accounting principles generally accepted in the United States of America. |
| ** | | The adviser seeks to achieve the Fund’s objective. There can be no guarantee it will be achieved. |
| | | | | | | | | | |
| | | | | |
| 10 | | | | | | | | J.P. MORGAN SPECIALTY FUNDS | | |
| | | | | | | | | | | | | | | | | | |
AVERAGE ANNUAL TOTAL RETURNS AS OF APRIL 30, 2022 | |
| | | | | |
| | | INCEPTION DATE OF
CLASS | | 6 MONTH* | | | 1 YEAR | | | 5 YEAR | | | 10 YEAR | |
CLASS A SHARES | | February 28, 2002 | | | | | | | | | | | | | | | | |
With Sales Charge** | | | | | (7.80 | )% | | | (6.82 | )% | | | 2.26 | % | | | 1.42 | % |
Without Sales Charge | | | | | (2.69 | ) | | | (1.68 | ) | | | 3.37 | | | | 1.97 | |
CLASS C SHARES | | November 2, 2009 | | | | | | | | | | | | | | | | |
With CDSC*** | | | | | (3.92 | ) | | | (3.14 | ) | | | 2.87 | | | | 1.56 | |
Without CDSC | | | | | (2.92 | ) | | | (2.14 | ) | | | 2.87 | | | | 1.56 | |
Class I SHARES | | November 2, 2009 | | | (2.59 | ) | | | (1.50 | ) | | | 3.64 | | | | 2.23 | |
| ** | | Sales Charge for Class A Shares is 5.25%. |
| *** | | Assumes a 1% CDSC (contingent deferred sales charge) for the 6 month and one year periods and 0% CDSC thereafter. |
TEN YEAR FUND PERFORMANCE (4/30/12 TO 4/30/22) (AS RESTATED, SEE NOTE 8)
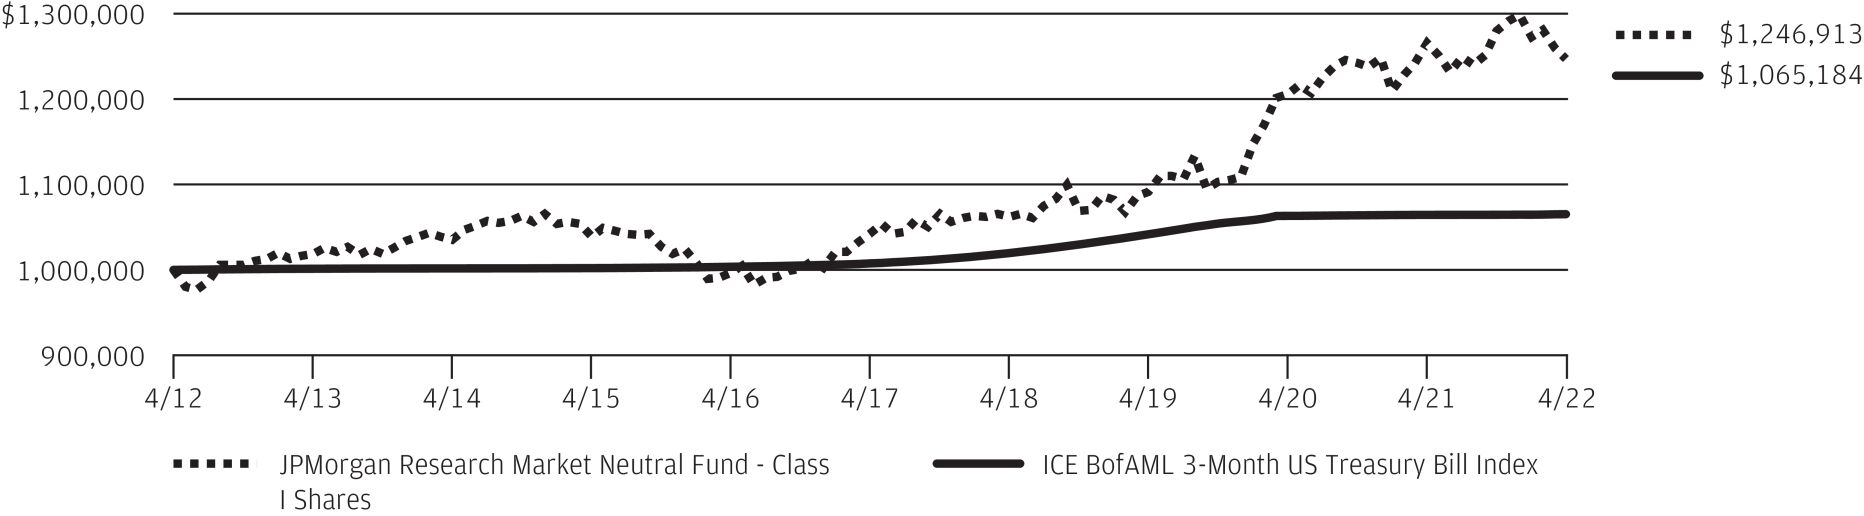
The performance quoted is past performance and is not a guarantee of future results. Mutual funds are subject to certain market risks. Investment returns and principal value of an investment will fluctuate so that an investor’s shares, when redeemed, may be worth more or less than their original cost. Current performance may be higher or lower than the performance data shown. For up-to-date month-end performance information please call 1-800-480-4111.
The graph illustrates comparative performance for $1,000,000 invested in Class I Shares of the JPMorgan Research Market Neutral Fund and ICE BofAML 3-Month US Treasury Bill Index from April 30, 2012 to April 30, 2022. The perf ormance of the Fund assumes reinvestment of all dividends and capital gain distributions, if any, and does not include a sales charge. The performance of the ICE BofAML 3-Month US Treasury Bill Index does not reflect the deduction of expenses or a sales charge associated with a mutual fund and has been adjusted to reflect reinvestment of all dividends and capital gain distributions of the securities included in the benchmark, if applicable. The ICE BofAML 3-Month US Treasury Bill Index is comprised of a single issue purchased at the beginning of the month and held for a full month. Each month the index is rebalanced and
the issue selected is the outstanding Treasury Bill that matures closest to, but not beyond, 3 months from the rebalancing date. Investors cannot invest directly in an index.
Class I Shares have a $1,000,000 minimum initial investment.
Fund performance may reflect the waiver of the Fund’s fees and reimbursement of expenses for certain periods. Without these waivers and reimbursements, performance would have been lower. Also, performance shown in this section does not reflect the deduction of taxes that a shareholder would pay on Fund distributions or on gains resulting from redemptions of Fund shares.
Because Class C Shares automatically convert to Class A Shares after 8 years, the 10 year average annual total return shown above for Class C reflects Class A performance for the period after conversion.
The returns shown are based on net asset values calculated for shareholder transactions and may differ from the returns shown in the financial highlights, which reflect adjustments made to the net asset values in accordance with accounting principles generally accepted in the United States of America.
| | | | | | | | | | |
| | | | | |
| | J.P. MORGAN SPECIALTY FUNDS | | | | | | | | 11 |
JPMorgan Research Market Neutral Fund
FUND COMMENTARY (AS RESTATED, SEE NOTE 8)
SIX MONTHS ENDED APRIL 30, 2021 (Unaudited)
| | | | |
| REPORTING PERIOD RETURN: | |
| Fund (Class I Shares)* | | | 1.81% | |
| ICE BofAML 3-Month US Treasury Bill Index | | | 0.05% | |
| |
| Net Assets After Future Share Reacquisition Adjustment as of 4/30/2021 (In Thousands) | | | $95,977 | |
INVESTMENT OBJECTIVE**
The JPMorgan Research Market Neutral Fund (the “Fund”) seeks to provide long-term capital appreciation from a broadly diversified portfolio of U.S. stocks while neutralizing the general risks associated with stock market investing.
WHAT WERE THE MAIN DRIVERS OF THE FUND’S PERFORMANCE?
The Fund’s Class I Shares outperformed the ICE BofAML 3-Month US Treasury Bill Index (the “Benchmark”) for the six months ended April 30, 2021. During the period, equity markets generally outperformed bond markets.
The Fund’s security selections in the media and semiconductors sectors were leading contributors to performance relative to the Benchmark, while the Fund’s security selections in the retail and industrial cyclical sectors were leading detractors from relative performance.
Leading individual contributors to relative performance included the Fund’s long positions in Diamondback Energy Inc. and Lyft Inc., and its short position in Take-Two Interactive Software Inc. Shares of Diamondback Energy, an oil and gas company focused on U.S. shale deposits, rose amid a rebound in global energy demand and the company’s improved earnings outlook. Shares of Lyft, an online ride-hailing service, rose amid a rebound in demand for its services in 2021. Shares of Take-Two Interactive Software, a video game publisher, fell after the company reported lower-than-expected results for the fourth quarter of 2020.
Leading individual detractors from relative performance included the Fund’s short positions in Acuity Brands Inc.,
ViacomCBS Inc. and General Electric Co. Shares of Acuity Brands, a provider of lighting and building management systems, rose after the company reported consecutive quarters of better-than-expected earnings. Shares of ViacomCBS, a media content and distribution company, rebounded from a sharp sell off in March 2020 amid the collapse of Archegos Capital Management. Shares of General Electric, an industrial and financial services company, rose amid investor expectations that the company would benefit from the Biden administration’s plans for infrastructure and renewable energy spending.
HOW WAS THE FUND POSITIONED?
The Fund’s portfolio managers aimed to construct a portfolio of long and short positions with a low correlation to the broader market for stocks and bonds. The Fund’s portfolio managers used fundamental research to estimate companies’ long-term earnings forecasts, ranking approximately 600 large and mid cap stocks into five quintiles. The Fund’s portfolio managers looked to the top two quintiles for potential long positions in stocks that they believed were undervalued and the bottom two quintiles for potential short positions in stocks that they believed were overvalued.
| * | | The return shown is based on net asset values calculated for shareholder transactions and may differ from the return shown in the financial highlights, which reflects adjustments made to the net asset values in accordance with accounting principles generally accepted in the United States of America. |
| ** | | The adviser seeks to achieve the Fund’s objective. There can be no guarantee it will be achieved. |
| | | | | | | | | | |
| | | | | |
| 12 | | | | | | | | J.P. MORGAN SPECIALTY FUNDS | | |
| | | | | | | | |
TOP TEN LONG POSITIONS OF THE
PORTFOLIO AS OF APRIL 30, 2021 | | PERCENT OF
TOTAL
INVESTMENTS | |
| | 1. | | | Diamondback Energy, Inc. | | | 2.1 | % |
| | 2. | | | Mastercard, Inc., Class A | | | 2.0 | |
| | 3. | | | Amazon.com, Inc. | | | 1.8 | |
| | 4. | | | Alphabet, Inc., Class C | | | 1.5 | |
| | 5. | | | Discovery, Inc., Class C | | | 1.5 | |
| | 6. | | | Lyft, Inc., Class A | | | 1.4 | |
| | 7. | | | Seagate Technology plc | | | 1.4 | |
| | 8. | | | Stanley Black & Decker, Inc. | | | 1.3 | |
| | 9. | | | Facebook, Inc., Class A | | | 1.2 | |
| | 10. | | | Trane Technologies plc | | | 1.2 | |
| | | | | | | | |
TOP TEN SHORT POSITIONS OF THE
PORTFOLIO AS OF APRIL 30, 2021 | | PERCENT OF
TOTAL
INVESTMENTS | |
| | 1. | | | Kroger Co. (The) | | | 2.4 | % |
| | 2. | | | Walmart, Inc. | | | 2.1 | |
| | 3. | | | Take-Two Interactive Software, Inc. | | | 2.1 | |
| | 4. | | | Discovery, Inc., Class A | | | 2.0 | |
| | 5. | | | Intel Corp. | | | 1.9 | |
| | 6. | | | Enbridge, Inc. (Canada) | | | 1.8 | |
| | 7. | | | Interpublic Group of Cos., Inc. (The) | | | 1.7 | |
| | 8. | | | Amgen, Inc. | | | 1.7 | |
| | 9. | | | HP, Inc. | | | 1.6 | |
| | 10. | | | 3M Co. | | | 1.5 | |
| | | | |
LONG POSITION PORTFOLIO COMPOSITION
BY SECTOR AS OF APRIL 30, 2021 | | PERCENT OF
TOTAL
INVESTMENTS | |
| Information Technology | | | 14.7 | % |
| Industrials | | | 14.6 | |
| Consumer Discretionary | | | 11.4 | |
| Health Care | | | 9.2 | |
| Communication Services | | | 9.2 | |
| Financials | | | 8.3 | |
| Energy | | | 6.3 | |
| Materials | | | 4.4 | |
| Utilities | | | 3.1 | |
| Real Estate | | | 3.0 | |
| Consumer Staples | | | 2.5 | |
| Short-Term Investments | | | 13.3 | |
| | | | |
SHORT POSITION PORTFOLIO COMPOSITION
BY SECTOR AS OF APRIL 30, 2021 | | PERCENT OF
TOTAL
INVESTMENTS | |
| Industrials | | | 14.8 | % |
| Information Technology | | | 14.0 | |
| Communication Services | | | 13.1 | |
| Financials | | | 12.0 | |
| Consumer Staples | | | 10.9 | |
| Health Care | | | 8.9 | |
| Energy | | | 7.6 | |
| Materials | | | 5.0 | |
| Real Estate | | | 4.9 | |
| Utilities | | | 4.6 | |
| Consumer Discretionary | | | 4.2 | |
| | | | | | | | | | |
| | | | | |
| | J.P. MORGAN SPECIALTY FUNDS | | | | | | | | 13 |
JPMorgan Research Market Neutral Fund
FUND COMMENTARY (AS RESTATED, SEE NOTE 8)
SIX MONTHS ENDED APRIL 30, 2021 (Unaudited) (continued)
| | | | | | | | | | | | | | | | | | |
AVERAGE ANNUAL TOTAL RETURNS AS OF APRIL 30, 2021 | |
| | | | | |
| | | INCEPTION DATE OF
CLASS | | 6 MONTH* | | | 1 YEAR | | | 5 YEAR | | | 10 YEAR | |
CLASS A SHARES | | February 28, 2002 | | | | | | | | | | | | | | | | |
With Sales Charge** | | | | | (3.70 | )% | | | (0.92 | )% | | | 3.48 | % | | | 1.19 | % |
Without Sales Charge | | | | | 1.61 | | | | 4.55 | | | | 4.61 | | | | 1.73 | |
CLASS C SHARES | | November 2, 2009 | | | | | | | | | | | | | | | | |
With CDSC*** | | | | | 0.43 | | | | 3.06 | | | | 4.10 | | | | 1.33 | |
Without CDSC | | | | | 1.43 | | | | 4.06 | | | | 4.10 | | | | 1.33 | |
CLASS I SHARES | | November 2, 2009 | | | 1.81 | | | | 4.89 | | | | 4.89 | | | | 2.00 | |
| ** | | Sales Charge for Class A Shares is 5.25%. |
| *** | | Assumes a 1% CDSC (contingent deferred sales charge) for the 6 month and one year periods and 0% CDSC thereafter. |
TEN YEAR FUND PERFORMANCE (4/30/11 TO 4/30/21) (AS RESTATED, SEE NOTE 8)
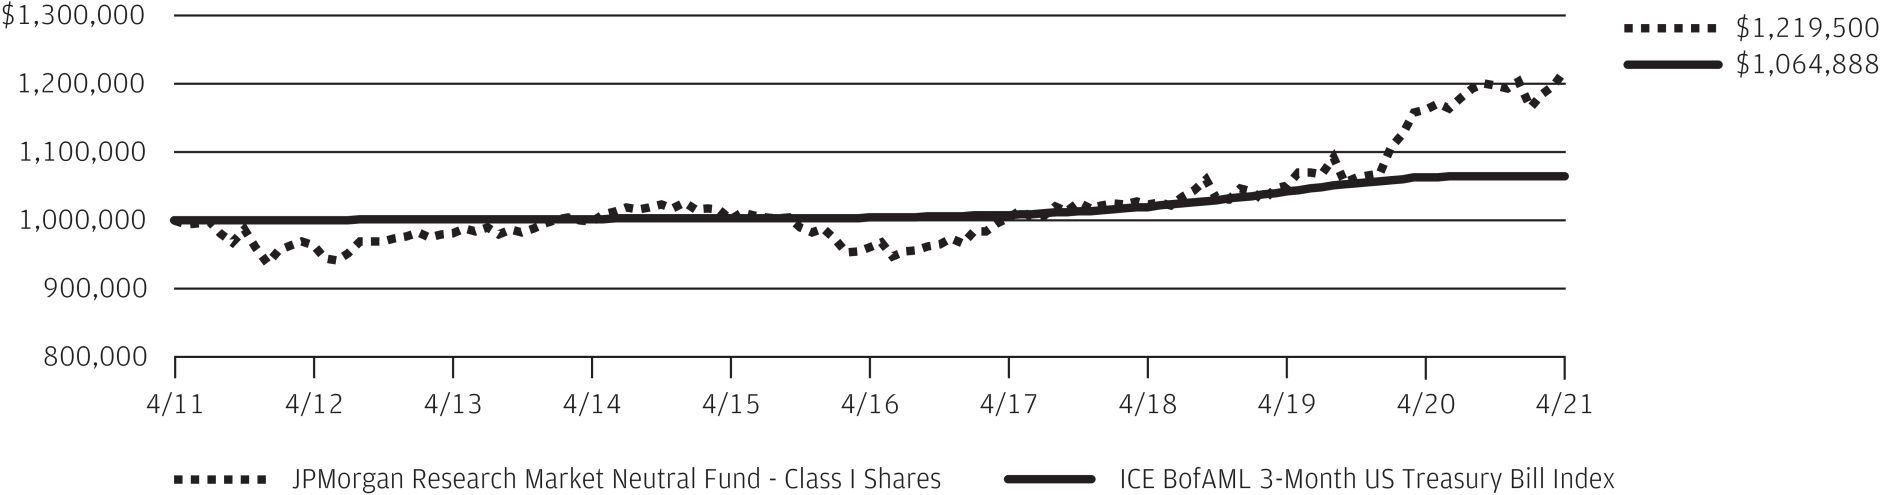
The performance quoted is past performance and is not a guarantee of future results. Mutual funds are subject to certain market risks. Investment returns and principal value of an investment will fluctuate so that an investor’s shares, when redeemed, may be worth more or less than their original cost. Current performance may be higher or lower than the perform ance data shown. For up-to-date month-end performance information please call 1-800-480-4111.
The graph illustrates comparative performance for $1,000,000 invested in Class I Shares of the JPMorgan Research Market Neutral Fund and ICE BofAML 3-Month US Treasury Bill Index from April 30, 2011 to April 30, 2021. The perf ormance of the Fund assumes reinvestment of all dividends and capital gain distributions, if any, and does not include a sales charge. The performance of the ICE BofAML 3-Month US Treasury Bill Index does not reflect the deduction of expenses or a sales charge associated with a mutual fund and has been adjusted to reflect reinvestment of all dividends and capital gain distributions of the securities included in the benchmark, if applicable. The ICE BofAML 3-Month US Treasury Bill Index is comprised of a single issue purchased at the beginning of the month and held for a full month. Each month the index is rebalanced and
the issue selected is the outstanding Treasury Bill that matures closest to, but not beyond, 3 months from the rebalancing date. Investors cannot invest directly in an index.
Class I Shares have a $1,000,000 minimum initial investment.
Fund performance may reflect the waiver of the Fund’s fees and reimbursem ent of expenses for certain periods. Without these waivers and reimbursem ents, performance would have been lower. Also, performance shown in this section does not reflect the deduction of taxes that a shareholder would pay on Fund distributions or on gains resulting from redemptions of Fund shares.
Because Class C Shares automatically convert to Class A Shares after 8 years, the 10 year average annual total return shown above for Class C reflects Class A performance for the period after conversion.
The returns shown are based on net asset values calculated for shareholder transactions and may differ from the returns shown in the financial highlights, which reflect adjustments made to the net asset values in accordance with accounting principles generally accepted in the United States of America.
| | | | | | | | | | |
| | | | | |
| 14 | | | | | | | | J.P. MORGAN SPECIALTY FUNDS | | |
JPMorgan Research Market Neutral Fund
FUND COMMENTARY (AS RESTATED, SEE NOTE 8)
SIX MONTHS ENDED APRIL 30, 2020 (Unaudited)
| | | | |
| REPORTING PERIOD RETURN: | |
| Fund (Class L Shares)* | | | 9.50% | |
| ICE BofAML 3-Month U.S. Treasury Bill Index | | | 0.85% | |
| |
| Net Assets After Future Share Reacquisition Adjustment as of 4/30/2020 (In Thousands) | | | $83,298 | |
INVESTMENT OBJECTIVE**
The JPMorgan Research Market Neutral Fund (the “Fund”) seeks to provide long-term capital appreciation from a broadly diversified portfolio of U.S. stocks while neutralizing the general risks associated with stock market investing.
WHAT WERE THE MAIN DRIVERS OF THE FUND’S PERFORMANCE?
The Fund’s Class L Shares outperformed the ICE BofAML 3-Month US Treasury Bill Index (the “Benchmark”) for the six months ended April 30, 2020.
The Fund’s security selection in the media, real estate investment trusts and retail sectors was a leading contributor to performance relative to the Benchmark, while the Fund’s security selection in the consumer stable and banks & brokers sectors was a leading detractor from relative performance.
Leading individual contributors to relative performance included the Fund’s long position in Amazon.com Inc. and its short positions in Boeing Co. and Cinemark Holdings Inc. Shares of Amazon, a provider of online retail shopping and related services, rose amid investor expectations that its business would benefit from at-home quarantines imposed in response to the COVID-19 pandemic. Shares of Boeing, an airplane manufacturing and aerospace company, fell amid investor expectations that orders for new planes will shrink as commercial airlines suffer financial stress due to reductions in flights in response to COVID-19. Shares of Cinemark Holdings, an operator of movie theaters, fell after the company reported lower-than-expected revenue and earnings for the fourth quarter of 2019.
Leading individual detractors from relative performance included the Fund’s short positions in Kroger Co., Enbridge Inc. and Activision Blizzard Inc. Shares of Kroger, a grocery supermarket chain, rose as consumers stocked up on food and other items ahead of at-home quarantines imposed in response to the COVID-19 pandemic and then continued to eat meals at home. Shares of Enbridge, a master limited partnership that operates petroleum and natural gas pipelines and storage facilities, rose as investors sought higher dividends. Shares of Activision Blizzard, an interactive entertainment software publisher, rose as consumers under at-home quarantine spent more on online games and entertainment.
HOW WAS THE FUND POSITIONED?
The Fund’s portfolio managers aimed to construct a portfolio of long and short positions with a low correlation to the broader market for stocks and bonds. The Fund’s portfolio managers used fundamental research to estimate companies’ long-term earnings forecasts, ranking approximately 600 large and mid cap stocks into five quintiles. The Fund’s portfolio managers looked to the top two quintiles for potential long positions in stocks that they believed were undervalued and the bottom two quintiles for potential short positions in stocks that they believed were overvalued.
| * | | The return shown is based on net asset values calculated for shareholder transactions and may differ from the return shown in the financial highlights, which reflects adjustments made to the net asset values in accordance with accounting principles generally accepted in the United States of America. |
| ** | | The adviser seeks to achieve the Fund’s objective. There can be no guarantee it will be achieved. |
| | | | | | | | | | |
| | | | | |
| | J.P. MORGAN SPECIALTY FUNDS | | | | | | | | 15 |
JPMorgan Research Market Neutral Fund
FUND COMMENTARY (AS RESTATED, SEE NOTE 8)
SIX MONTHS ENDED APRIL 30, 2020 (Unaudited) (continued)
| | | | | | | | |
| TOP TEN LONG POSITIONS OF THE PORTFOLIO*** | |
| | 1. | | | Alphabet, Inc., Class C | | | 2.1 | % |
| | 2. | | | Amazon.com, Inc. | | | 2.0 | |
| | 3. | | | Norfolk Southern Corp. | | | 1.9 | |
| | 4. | | | Linde plc | | | 1.8 | |
| | 5. | | | Microsoft Corp. | | | 1.6 | |
| | 6. | | | Citigroup, Inc. | | | 1.5 | |
| | 7. | | | PayPal Holdings, Inc. | | | 1.4 | |
| | 8. | | | Leidos Holdings, Inc. | | | 1.4 | |
| | 9. | | | NextEra Energy, Inc. | | | 1.4 | |
| | 10. | | | Northrop Grumman Corp. | | | 1.3 | |
| | | | | | | | |
| TOP TEN SHORT POSITIONS OF THE PORTFOLIO**** | |
| | 1. | | | Juniper Networks, Inc. | | | 2.5 | % |
| | 2. | | | NetApp, Inc. | | | 2.4 | |
| | 3. | | | Clorox Co. (The) | | | 2.4 | |
| | 4. | | | Western Union Co. (The) | | | 1.8 | |
| | 5. | | | Walt Disney Co. (The) | | | 1.8 | |
| | 6. | | | Cisco Systems, Inc. | | | 1.8 | |
| | 7. | | | Omnicom Group, Inc. | | | 1.8 | |
| | 8. | | | Spotify Technology SA | | | 1.7 | |
| | 9. | | | Robert Half International, Inc. | | | 1.7 | |
| | 10. | | | AT&T, Inc. | | | 1.5 | |
| | | | |
LONG POSITION PORTFOLIO COMPOSITION BY SECTOR*** | |
| Information Technology | | | 21.1 | % |
| Industrials | | | 11.4 | |
| Health Care | | | 8.4 | |
| Consumer Discretionary | | | 8.3 | |
| Financials | | | 8.1 | |
| Communication Services | | | 6.0 | |
| Materials | | | 5.0 | |
| Utilities | | | 3.6 | |
| Energy | | | 3.6 | |
| Consumer Staples | | | 3.1 | |
| Real Estate | | | 2.9 | |
| Short-Term Investments | | | 18.5 | |
| | | | |
SHORT POSITION PORTFOLIO COMPOSITION BY SECTOR**** | |
| Information Technology | | | 16.6 | % |
| Industrials | | | 16.2 | |
| Financials | | | 12.5 | |
| Communication Services | | | 11.9 | |
| Health Care | | | 9.8 | |
| Energy | | | 7.5 | |
| Materials | | | 6.0 | |
| Consumer Discretionary | | | 5.8 | |
| Consumer Staples | | | 4.8 | |
| Utilities | | | 4.5 | |
| Real Estate | | | 4.4 | |
| *** | | Percentages indicated are based on total long investments as of April 30, 2020. The Fund’s portfolio composition is subject to change. |
| **** | | Percentages indicated are based on total short investments as of April 30, 2020. The Fund’s portfolio composition is subject to change. |
| | | | | | | | | | |
| | | | | |
| 16 | | | | | | | | J.P. MORGAN SPECIALTY FUNDS | | |
| | | | | | | | | | | | | | | | | | |
AVERAGE ANNUAL TOTAL RETURNS AS OF APRIL 30, 2020 | |
| | | | | |
| | | INCEPTION DATE OF
CLASS | | 6 MONTH* | | | 1 YEAR | | | 5 YEAR | | | 10 YEAR | |
CLASS A SHARES | | February 28, 2002 | | | | | | | | | | | | | | | | |
With Sales Charge** | | | | | 3.53 | % | | | 4.51 | % | | | 1.66 | % | | | 0.60 | % |
Without Sales Charge | | | | | 9.23 | | | | 10.32 | | | | 2.76 | | | | 1.14 | |
CLASS C SHARES | | November 2, 2009 | | | | | | | | | | | | | | | | |
With CDSC*** | | | | | 7.94 | | | | 8.77 | | | | 2.24 | | | | 0.74 | |
Without CDSC | | | | | 8.94 | | | | 9.77 | | | | 2.24 | | | | 0.74 | |
CLASS I SHARES | | November 2, 2009 | | | 9.35 | | | | 10.55 | | | | 3.03 | | | | 1.40 | |
CLASS L SHARES | | December 30, 1998 | | | 9.50 | | | | 10.76 | | | | 3.17 | | | | 1.60 | |
| ** | | Sales Charge for Class A Shares is 5.25%. |
| *** | | Assumes a 1% CDSC (contingent deferred sales charge) for the 6 month and one year periods and 0% CDSC thereafter. |
TEN YEAR FUND PERFORMANCE (4/30/10 TO 4/30/20) (AS RESTATED, SEE NOTE 8)
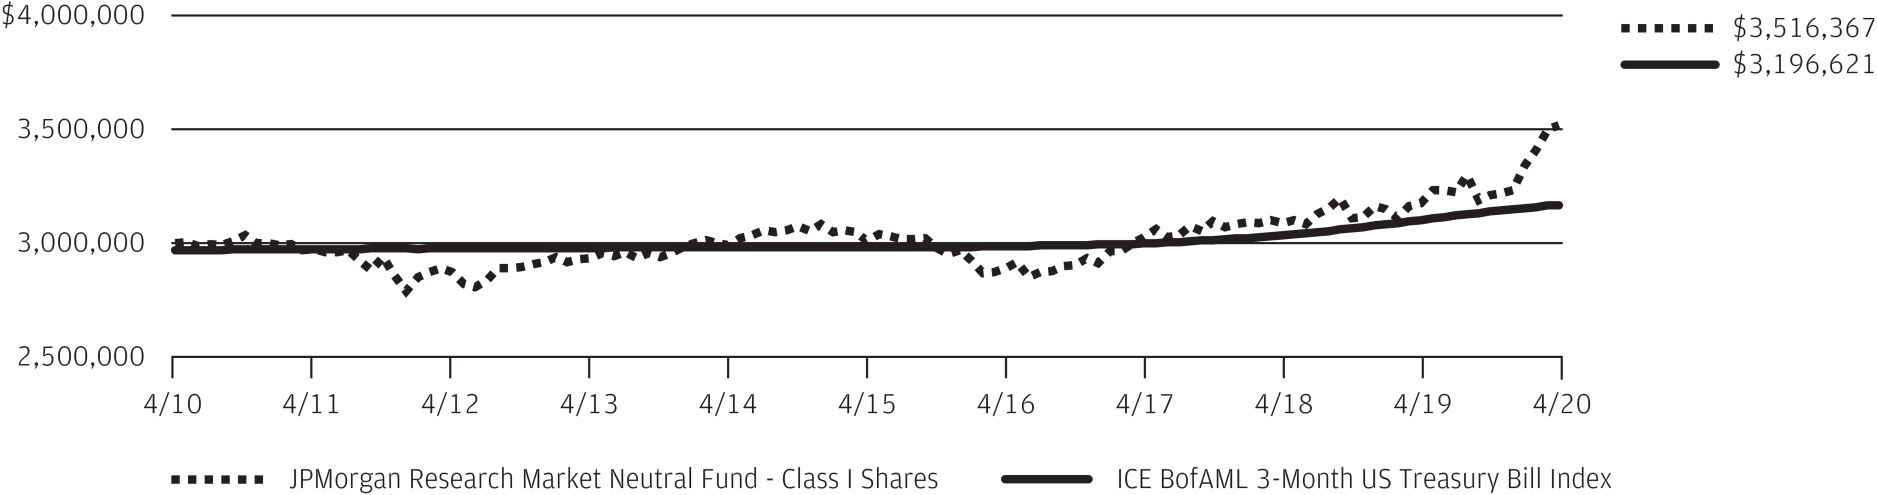
The performance quoted is past performance and is not a guarantee of future results. Mutual funds are subject to certain market risks. Investment returns and principal value of an investment will fluctuate so that an investor’s shares, when redeemed, may be worth more or less than their original cost. Current performance may be higher or lower than the perform ance data shown. For up-to-date month-end performance information please call 1-800-480-4111.
The graph illustrates comparative performance for $3,000,000 invested in Class L Shares of the JPMorgan Research Market Neutral Fund and ICE BofAML 3-Month U.S. Treasury Bill Index from April 30, 2010 to April 30, 2020. The perf ormance of the Fund assumes reinvestment of all dividends and capital gain distributions, if any, and does not include a sales charge. The performance of the ICE BofAML 3-Month U.S. Treasury Bill Index does not reflect the deduction of expenses or a sales charge associated with a mutual fund and has been adjusted to reflect reinvestment of all dividends and capital gain distributions of the securities included in the benchmark, if applicable. The ICE BofAML 3-Month U.S. Treasury Bill Index is comprised of a single issue
purchased at the beginning of the month and held for a full month. Each month the index is rebalanced and the issue selected is the outstanding Treasury Bill that matures closest to, but not beyond, 3 months from the rebalancing date. Investors cannot invest directly in an index.
Class L Shares have a $3,000,000 minimum initial investment.
Fund performance may reflect the waiver of the Fund’s fees and reimbursem ent of expenses for certain periods since the applicable inception date. Without these waivers and reimbursements, performance would have been lower. Also, performance shown in this section does not reflect the deduction of taxes that a shareholder would pay on Fund distributions or on gains resulting from redemptions of Fund shares.
The returns shown are based on net asset values calculated for shareholder transactions and may differ from the returns shown in the financial highlights, which reflect adjustments made to the net asset values in accordance with accounting principles generally accepted in the United States of America.
| | | | | | | | | | |
| | | | | |
| | J.P. MORGAN SPECIALTY FUNDS | | | | | | | | 17 |
JPMorgan Research Market Neutral Fund
FUND COMMENTARY (AS RESTATED, SEE NOTE 8)
SIX MONTHS ENDED APRIL 30, 2019 (Unaudited)
| | | | |
| REPORTING PERIOD RETURN: | |
| Fund (Class L Shares)* | | | 2.04% | |
| ICE BofAML 3-Month U.S. Treasury Bill Index | | | 1.18% | |
| |
| Net Assets After Future Share Reacquisition Adjustment as of 4/30/2019 (In Thousands) | | | $73,466 | |
INVESTMENT OBJECTIVE**
The JPMorgan Research Market Neutral Fund (the “Fund”) seeks to provide long-term capital appreciation from a broadly diversified portfolio of U.S. stocks while neutralizing the general risks associated with stock market investing.
WHAT WERE THE MAIN DRIVERS OF THE FUND’S PERFORMANCE?
The Fund’s Class L Shares outperformed the ICE BofAML 3-Month U.S. Treasury Bill Index (the “Benchmark”) for the six months ended April 30, 2019. The Fund’s security selection in the industrial cyclical sector and the software & hardware sector was a leading contributor to performance relative to the Benchmark, while the Fund’s security selection in the pharmaceutical & health care sector and the semiconductors sector was a leading detractor from relative performance.
Leading individual contributors to relative performance included the Fund’s short positions in Albemarle Corp. and Range Resources Corp. and its long position in Pioneer Natural Resources Co. Shares of Albemarle, a specialty chemicals manufacturer, fell in late 2018 after the company reported lower-than-expected earnings and flat sales in its lithium products business for the third quarter of 2018. Shares of Range Resources, an oil and gas producer, fell amid investor concerns about the company’s debt level and 2019 production outlook. Shares of Pioneer Natural Resources, a shale oil and gas producer, rose amid investor expectations that the company would become a takeover target.
Leading individual detractors from relative performance included the Fund’s short position in Chipotle Mexican Grill Inc.
and its long positions in Nvidia Corp. and Cigna Corp. Shares of Chipotle Mexican Grill, a fast food chain, rose after the company reported better-than-expected earnings and sales for the first quarter of 2019. Shares of Nvidia, a maker of semiconductors, fell amid weak demand for semiconductors. Shares of Cigna, a health insurance provider, fell along with the broader health insurance sector amid investor concerns about state and federal legislative interest in drug pricing and health care structure.
HOW WAS THE FUND POSITIONED?
The Fund’s portfolio managers aimed to construct a portfolio of long and short positions with a low correlation to the broader market for stocks and bonds. The Fund’s portfolio managers used fundamental research to estimate companies’ long-term earnings forecasts, ranking approximately 600 large and mid cap stocks into five quintiles. The Fund’s portfolio managers looked to the top two quintiles for potential long positions in stocks that they believed were undervalued and the bottom two quintiles for potential short positions in stocks that they believed were overvalued.
| * | | The return shown is based on net asset values calculated for shareholder transactions and may differ from the return shown in the financial highlights, which reflects adjustments made to the net asset values in accordance with accounting principles generally accepted in the United States of America. |
| ** | | The adviser seeks to achieve the Fund’s objective. There can be no guarantee it will be achieved. |
| | | | | | | | | | |
| | | | | |
| 18 | | | | | | | | J.P. MORGAN SPECIALTY FUNDS | | |
| | | | | | | | | | | | | | | | | | |
AVERAGE ANNUAL TOTAL RETURNS AS OF APRIL 30, 2019 | |
| | | | | |
| | | INCEPTION DATE OF
CLASS | | 6 MONTH* | | | 1 YEAR | | | 5 YEAR | | | 10 YEAR | |
CLASS A SHARES | | February 28, 2002 | | | | | | | | | | | | | | | | |
With Sales Charge** | | | | | (3.43 | )% | | | (2.98 | )% | | | (0.29 | )% | | | (0.05 | )% |
Without Sales Charge | | | | | 1.89 | | | | 2.40 | | | | 0.79 | | | | 0.49 | |
CLASS C SHARES | | November 2, 2009 | | | | | | | | | | | | | | | | |
With CDSC*** | | | | | 0.65 | | | | 0.88 | | | | 0.28 | | | | 0.08 | |
Without CDSC | | | | | 1.65 | | | | 1.88 | | | | 0.28 | | | | 0.08 | |
CLASS I SHARES | | November 2, 2009 | | | 2.09 | | | | 2.70 | | | | 1.05 | | | | 0.76 | |
CLASS L SHARES | | December 31, 1998 | | | 2.04 | | | | 2.78 | | | | 1.20 | | | | 0.96 | |
| ** | | Sales Charge for Class A Shares is 5.25%. |
| *** | | Assumes a 1% CDSC (contingent deferred sales charge) for the 6 month and one year periods and 0% CDSC thereafter. |
TEN YEAR FUND PERFORMANCE (4/30/09 TO 4/30/19) (AS RESTATED, SEE NOTE 8)
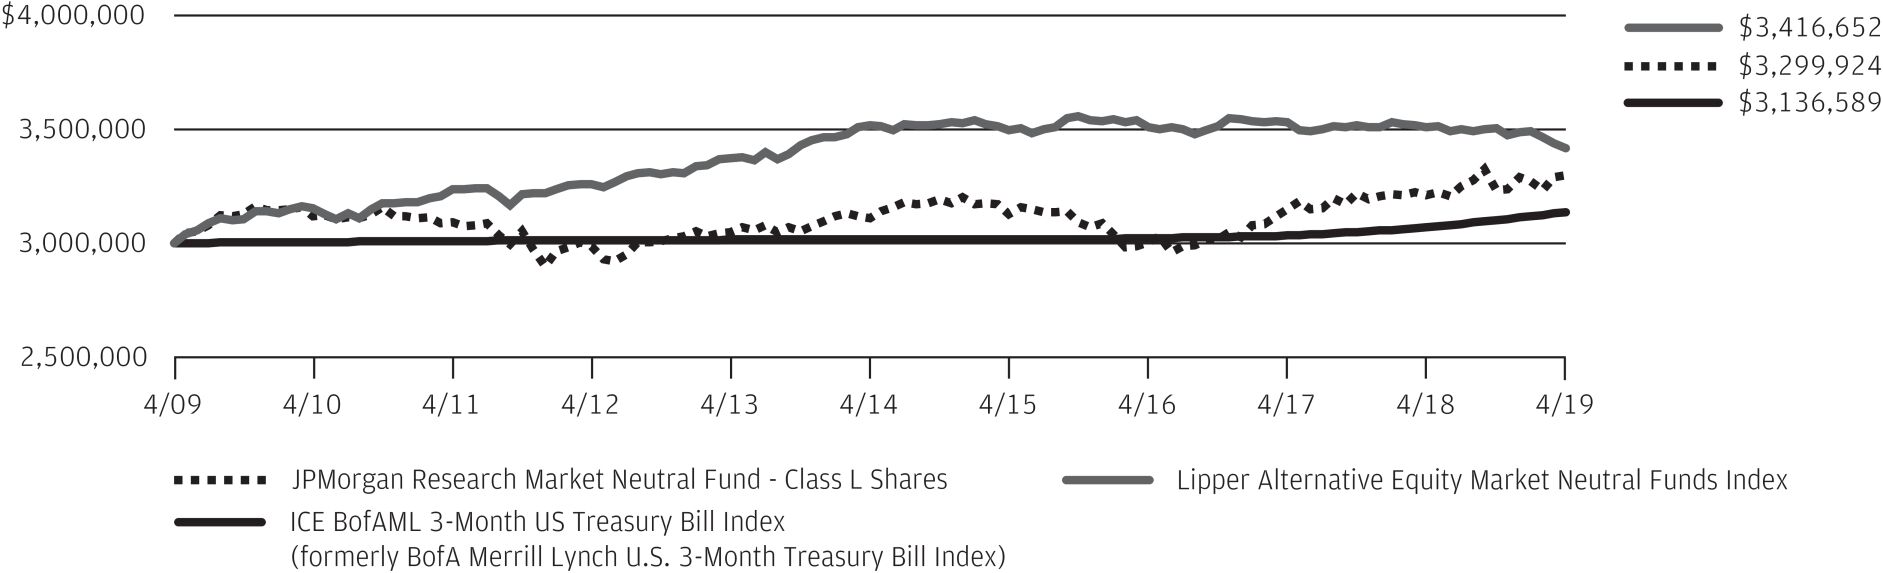
The performance quoted is past performance and is not a guarantee of future results. Mutual funds are subject to certain market risks. Investment returns and principal value of an investment will fluctuate so that an investor’s shares, when redeemed, may be worth more or less than their original cost. Current performance may be higher or lower than the performance data shown. For up-to-date month-end performance information please call 1-800-480-4111.
Returns for Class I Shares prior to its inception date are based on the performance of Class L Shares. The actual returns for Class I Shares would have been lower than shown because Class I Shares have higher expenses than Class L Shares.
Returns for Class C Shares prior to its inception date are based on the performance of Class B Shares, all of which converted to Class A Shares on June 19, 2015. The actual returns of Class C Shares would have been similar to those shown because Class C Shares have similar expenses to Class B Shares.
The graph illustrates comparative performance for $3,000,000 invested in Class L Shares of the JPMorgan Research Market Neutral Fund, ICE BofAML 3-Month US Treasury Bill Index and Lipper Alternative Equity Market Neutral Funds Index from April 30, 2009 to April 30, 2019. The performance of the Fund assumes reinvestment of all dividends and capital gain distributions, if any, and does not include a sales charge. The performance of the ICE BofAML 3-Month US Treasury Bill Index does not reflect the deduction of expenses or a sales charge associated with a mutual fund and has been adjusted to reflect
reinvestment of all dividends and capital gain distributions of the securities included in the benchmark, if applicable. The performance of the Lipper Alternative Equity Market Neutral Funds Index includes expenses associated with a mutual fund, such as investment management fees. These expenses are not identical to the expenses incurred by the Fund. The ICE BofAML 3-Month US Treasury Bill Index is comprised of a single issue purchased at the beginning of the month and held for a full month. Each month the index is rebalanced and the issue selected is the outstanding Treasury Bill that matures closest to, but not beyond, 3 months from the rebalancing date. Investors cannot invest directly in an index. The Lipper Alternative Equity Market Neutral Funds Index is an average based on the total returns of all mutual funds within the Fund’s designated category as determined by Lipper, Inc.
Class L Shares have a $3,000,000 minimum initial investment.
Fund performance may reflect the waiver of the Fund’s fees and reimbursement of expenses for certain periods since the inception date. Without these waivers and reimbursements, performance would have been lower. Also, performance shown in this section does not reflect the deduction of taxes that a shareholder would pay on Fund distributions or redemptions of Fund shares.
The returns shown are based on net asset values calculated for shareholder transactions and may differ from the returns shown in the financial highlights, which reflect adjustments made to the net asset values in accordance with accounting principles generally accepted in the United States of America.
| | | | | | | | | | |
| | | | | |
| | J.P. MORGAN SPECIALTY FUNDS | | | | | | | | 19 |
JPMorgan Research Market Neutral Fund
SCHEDULE OF PORTFOLIO INVESTMENTS
AS OF APRIL 30, 2023 (AS RESTATED, SEE NOTE 8) (Unaudited)
| | | | | | | | |
| INVESTMENTS | | SHARES (000) | | | VALUE ($000) | |
Long Positions — 99.1% | | | | | | | | |
Common Stocks — 77.6% | | | | | | | | |
| | |
Aerospace & Defense — 2.9% | | | | | | | | |
| | |
Howmet Aerospace, Inc. | | | 46 | | | | 2,057 | |
| | |
Northrop Grumman Corp. (a) | | | 2 | | | | 949 | |
| | |
Raytheon Technologies Corp. | | | 14 | | | | 1,428 | |
| | |
TransDigm Group, Inc. | | | 1 | | | | 359 | |
| | | | | | | | |
| | |
| | | | | | | 4,793 | |
| | | | | | | | |
| | |
Air Freight & Logistics — 0.3% | | | | | | | | |
| | |
FedEx Corp. | | | — | | | | 79 | |
| | |
United Parcel Service, Inc., Class B | | | 3 | | | | 488 | |
| | | | | | | | |
| | |
| | | | | | | 567 | |
| | | | | | | | |
| | |
Automobile Components — 0.6% | | | | | | | | |
| | |
Aptiv plc * | | | 2 | | | | 224 | |
| | |
Lear Corp. | | | 2 | | | | 203 | |
| | |
Mobileye Global, Inc., Class A (Israel) * | | | 13 | | | | 488 | |
| | | | | | | | |
| | |
| | | | | | | 915 | |
| | | | | | | | |
| | |
Automobiles — 0.1% | | | | | | | | |
| | |
Rivian Automotive, Inc., Class A * | | | 3 | | | | 33 | |
| | |
Tesla, Inc. * | | | 1 | | | | 196 | |
| | | | | | | | |
| | |
| | | | | | | 229 | |
| | | | | | | | |
| | |
Banks — 1.8% | | | | | | | | |
| | |
Bank of America Corp. | | | 15 | | | | 437 | |
| | |
Fifth Third Bancorp | | | 29 | | | | 753 | |
| | |
Truist Financial Corp. | | | 17 | | | | 561 | |
| | |
US Bancorp | | | 3 | | | | 124 | |
| | |
Wells Fargo & Co. (a) | | | 28 | | | | 1,105 | |
| | | | | | | | |
| | |
| | | | | | | 2,980 | |
| | | | | | | | |
| | |
Beverages — 1.4% | | | | | | | | |
| | |
Coca-Cola Co. (The) | | | 6 | | | | 404 | |
| | |
Constellation Brands, Inc., Class A | | | 1 | | | | 93 | |
| | |
Keurig Dr Pepper, Inc. | | | 3 | | | | 107 | |
| | |
Monster Beverage Corp. * | | | 21 | | | | 1,170 | |
| | |
PepsiCo, Inc. | | | 3 | | | | 617 | |
| | | | | | | | |
| | |
| | | | | | | 2,391 | |
| | | | | | | | |
| | |
Biotechnology — 5.2% | | | | | | | | |
| | |
AbbVie, Inc. | | | 13 | | | | 2,020 | |
| | |
Biogen, Inc. * | | | 6 | | | | 1,757 | |
| | |
BioMarin Pharmaceutical, Inc. * | | | 13 | | | | 1,288 | |
| | |
Regeneron Pharmaceuticals, Inc. * | | | 2 | | | | 1,331 | |
| | |
Sarepta Therapeutics, Inc. * | | | 8 | | | | 942 | |
| | |
Vertex Pharmaceuticals, Inc. * (a) | | | 4 | | | | 1,255 | |
| | | | | | | | |
| | |
| | | | | | | 8,593 | |
| | | | | | | | |
| | | | | | | | |
| INVESTMENTS | | SHARES (000) | | | VALUE ($000) | |
| | | | | | | | |
| | | | | | | | |
| | |
Broadline Retail — 1.3% | | | | | | | | |
| | |
Amazon.com, Inc. * (a) | | | 20 | | | | 2,100 | |
| | | | | | | | |
| | |
Building Products — 1.1% | | | | | | | | |
| | |
Trane Technologies plc | | | 10 | | | | 1,853 | |
| | | | | | | | |
| | |
Capital Markets — 3.4% | | | | | | | | |
| | |
Charles Schwab Corp. (The) | | | 13 | | | | 674 | |
| | |
CME Group, Inc. | | | 6 | | | | 1,136 | |
| | |
Morgan Stanley | | | 8 | | | | 679 | |
| | |
Raymond James Financial, Inc. | | | 16 | | | | 1,445 | |
| | |
S&P Global, Inc. | | | 4 | | | | 1,459 | |
| | |
State Street Corp. | | | 2 | | | | 184 | |
| | | | | | | | |
| | |
| | | | | | | 5,577 | |
| | | | | | | | |
| | |
Chemicals — 0.8% | | | | | | | | |
| | |
Air Products and Chemicals, Inc. (a) | | | 1 | | | | 376 | |
| | |
Dow, Inc. | | | 1 | | | | 88 | |
| | |
DuPont de Nemours, Inc. (a) | | | 6 | | | | 406 | |
| | |
Linde plc | | | 1 | | | | 329 | |
| | |
PPG Industries, Inc. | | | 1 | | | | 112 | |
| | | | | | | | |
| | |
| | | | | | | 1,311 | |
| | | | | | | | |
| | |
Commercial Services & Supplies — 0.8% | | | | | | | | |
| | |
Waste Connections, Inc. | | | 10 | | | | 1,368 | |
| | | | | | | | |
| | |
Communications Equipment — 0.4% | | | | | | | | |
| | |
Juniper Networks, Inc. | | | 21 | | | | 643 | |
| | | | | | | | |
| | |
Construction Materials — 0.1% | | | | | | | | |
| | |
Martin Marietta Materials, Inc. | | | 1 | | | | 212 | |
| | | | | | | | |
| | |
Consumer Finance — 0.2% | | | | | | | | |
| | |
American Express Co. (a) | | | 3 | | | | 415 | |
| | | | | | | | |
| | |
Consumer Staples Distribution & Retail — 0.9% | | | | | | | | |
| | |
Costco Wholesale Corp. | | | 2 | | | | 991 | |
| | |
Dollar General Corp. | | | 2 | | | | 465 | |
| | | | | | | | |
| | |
| | | | | | | 1,456 | |
| | | | | | | | |
| | |
Diversified REITs — 0.1% | | | | | | | | |
| | |
WP Carey, Inc. | | | 1 | | | | 81 | |
| | | | | | | | |
| | |
Electric Utilities — 1.7% | | | | | | | | |
| | |
NextEra Energy, Inc. | | | 13 | | | | 1,003 | |
| | |
PG&E Corp. * | | | 82 | | | | 1,401 | |
| | |
PPL Corp. | | | 18 | | | | 507 | |
| | | | | | | | |
| | |
| | | | | | | 2,911 | |
| | | | | | | | |
| | |
Electrical Equipment — 0.5% | | | | | | | | |
| | |
Eaton Corp. plc | | | 5 | | | | 856 | |
| | | | | | | | |
SEE NOTES TO FINANCIAL STATEMENTS.
| | | | | | | | | | |
| | | | | |
| 20 | | | | | | | | J.P. MORGAN SPECIALTY FUNDS | | |
| | | | | | | | |
| INVESTMENTS | | SHARES (000) | | | VALUE ($000) | |
Long Positions — (continued) | | | | | | | | |
Common Stocks — (continued) | | | | | | | | |
|
Electronic Equipment, Instruments & Components — 1.5% | |
| | |
Corning, Inc. | | | 50 | | | | 1,657 | |
| | |
Keysight Technologies, Inc. * | | | 6 | | | | 842 | |
| | | | | | | | |
| | |
| | | | | | | 2,499 | |
| | | | | | | | |
| | |
Energy Equipment & Services — 0.5% | | | | | | | | |
| | |
Baker Hughes Co. | | | 26 | | | | 754 | |
| | | | | | | | |
| | |
Entertainment — 3.3% | | | | | | | | |
| | |
Endeavor Group Holdings, Inc., Class A * (a) | | | 103 | | | | 2,646 | |
| | |
Netflix, Inc. * (a) | | | 5 | | | | 1,800 | |
| | |
Take-Two Interactive Software, Inc. * | | | 9 | | | | 1,123 | |
| | | | | | | | |
| | |
| | | | | | | 5,569 | |
| | | | | | | | |
| | |
Financial Services — 4.3% | | | | | | | | |
| | |
Block, Inc. * | | | 4 | | | | 249 | |
| | |
Fidelity National Information Services, Inc. | | | 6 | | | | 349 | |
| | |
Fiserv, Inc. * | | | 9 | | | | 1,161 | |
| | |
FleetCor Technologies, Inc. * | | | 6 | | | | 1,363 | |
| | |
Jack Henry & Associates, Inc. | | | 2 | | | | 306 | |
| | |
Mastercard, Inc., Class A (a) | | | 8 | | | | 3,041 | |
| | |
WEX, Inc. * | | | 4 | | | | 647 | |
| | | | | | | | |
| | |
| | | | | | | 7,116 | |
| | | | | | | | |
| | |
Food Products — 0.5% | | | | | | | | |
| | |
Hershey Co. (The) | | | 3 | | | | 683 | |
| | |
Mondelez International, Inc., Class A | | | 1 | | | | 97 | |
| | | | | | | | |
| | |
| | | | | | | 780 | |
| | | | | | | | |
| | |
Ground Transportation — 2.0% | | | | | | | | |
| | |
Canadian National Railway Co. (Canada) | | | 2 | | | | 253 | |
| | |
CSX Corp. | | | 14 | | | | 426 | |
| | |
Knight-Swift Transportation Holdings, Inc. | | | 3 | | | | 173 | |
| | |
Norfolk Southern Corp. | | | 3 | | | | 528 | |
| | |
Old Dominion Freight Line, Inc. | | | 1 | | | | 245 | |
| | |
Uber Technologies, Inc. * (a) | | | 38 | | | | 1,181 | |
| | |
Union Pacific Corp. | | | 2 | | | | 441 | |
| | | | | | | | |
| | |
| | | | | | | 3,247 | |
| | | | | | | | |
| | |
Health Care Equipment & Supplies — 1.3% | | | | | | | | |
| | |
Boston Scientific Corp. * | | | 9 | | | | 474 | |
| | |
Intuitive Surgical, Inc. * | | | 2 | | | | 530 | |
| | |
Stryker Corp. | | | 3 | | | | 874 | |
| | |
Zimmer Biomet Holdings, Inc. | | | 2 | | | | 350 | |
| | | | | | | | |
| | |
| | | | | | | 2,228 | |
| | | | | | | | |
| | |
Health Care Providers & Services — 1.6% | | | | | | | | |
| | |
Centene Corp. * | | | 2 | | | | 170 | |
| | |
HCA Healthcare, Inc. | | | 2 | | | | 424 | |
| | | | | | | | |
| INVESTMENTS | | SHARES (000) | | | VALUE ($000) | |
| | |
| | | | | | | | |
| | |
| | | | | | | | |
|
Health Care Providers & Services — continued | |
| | |
Humana, Inc. | | | 1 | | | | 634 | |
| | |
McKesson Corp. | | | 1 | | | | 293 | |
| | |
UnitedHealth Group, Inc. (a) | | | 2 | | | | 1,110 | |
| | | | | | | | |
| | |
| | | | | | | 2,631 | |
| | | | | | | | |
| | |
Health Care REITs — 0.0% ^ | | | | | | | | |
| | |
Ventas, Inc. | | | 1 | | | | 60 | |
| | | | | | | | |
| | |
Hotel & Resort REITs — 0.0% ^ | | | | | | | | |
| | |
Host Hotels & Resorts, Inc. | | | 3 | | | | 50 | |
| | | | | | | | |
| | |
Hotels, Restaurants & Leisure — 3.0% | | | | | | | | |
| | |
Booking Holdings, Inc. * | | | — | | | | 733 | |
| | |
Chipotle Mexican Grill, Inc. * | | | 1 | | | | 1,241 | |
| | |
DoorDash, Inc., Class A * | | | 2 | | | | 145 | |
| | |
Hilton Worldwide Holdings, Inc. | | | 5 | | | | 703 | |
| | |
McDonald’s Corp. | | | 3 | | | | 887 | |
| | |
Yum! Brands, Inc. (a) | | | 9 | | | | 1,274 | |
| | | | | | | | |
| | |
| | | | | | | 4,983 | |
| | | | | | | | |
| | |
Household Products — 0.1% | | | | | | | | |
| | |
Procter & Gamble Co. (The) | | | 1 | | | | 99 | |
| | | | | | | | |
| | |
Industrial Conglomerates — 1.2% | | | | | | | | |
| | |
Honeywell International, Inc. (a) | | | 10 | | | | 1,987 | |
| | | | | | | | |
| | |
Industrial REITs — 0.7% | | | | | | | | |
| | |
Prologis, Inc. | | | 9 | | | | 1,121 | |
| | | | | | | | |
| | |
Insurance — 2.9% | | | | | | | | |
| | |
Globe Life, Inc. | | | 18 | | | | 1,952 | |
| | |
Progressive Corp. (The) (a) | | | 19 | | | | 2,610 | |
| | |
Travelers Cos., Inc. (The) | | | 1 | | | | 242 | |
| | | | | | | | |
| | |
| | | | | | | 4,804 | |
| | | | | | | | |
| | |
Interactive Media & Services — 2.6% | | | | | | | | |
| | |
Alphabet, Inc., Class A * | | | 3 | | | | 349 | |
| | |
Meta Platforms, Inc., Class A * (a) | | | 17 | | | | 4,059 | |
| | | | | | | | |
| | |
| | | | | | | 4,408 | |
| | | | | | | | |
| | |
IT Services — 0.4% | | | | | | | | |
| | |
Cognizant Technology Solutions Corp., Class A | | | 4 | | | | 222 | |
| | |
MongoDB, Inc. * | | | 1 | | | | 189 | |
| | |
Snowflake, Inc., Class A * | | | 1 | | | | 176 | |
| | | | | | | | |
| | |
| | | | | | | 587 | |
| | | | | | | | |
| | |
Life Sciences Tools & Services — 0.3% | | | | | | | | |
| | |
Danaher Corp. | | | 1 | | | | 205 | |
| | |
Thermo Fisher Scientific, Inc. | | | — | | | | 245 | |
| | | | | | | | |
| | |
| | | | | | | 450 | |
| | | | | | | | |
SEE NOTES TO FINANCIAL STATEMENTS.
| | | | | | | | | | |
| | | | | |
| | J.P. MORGAN SPECIALTY FUNDS | | | | | | | | 21 |
JPMorgan Research Market Neutral Fund
SCHEDULE OF PORTFOLIO INVESTMENTS
AS OF APRIL 30, 2023 (AS RESTATED, SEE NOTE 8) (Unaudited) (continued)
| | | | | | | | |
| INVESTMENTS | | SHARES (000) | | | VALUE ($000) | |
Long Positions — (continued) | | | | | | | | |
Common Stocks — (continued) | | | | | | | | |
| | |
Machinery — 2.3% | | | | | | | | |
| | |
Deere & Co. (a) | | | 4 | | | | 1,545 | |
| | |
Dover Corp. | | | 10 | | | | 1,460 | |
| | |
Ingersoll Rand, Inc. | | | 14 | | | | 819 | |
| | | | | | | | |
| | |
| | | | | | | 3,824 | |
| | | | | | | | |
| | |
Media — 1.5% | | | | | | | | |
| | |
Charter Communications, Inc., Class A * | | | 3 | | | | 1,237 | |
| | |
Comcast Corp., Class A | | | 5 | | | | 194 | |
| | |
Liberty Media Corp.-Liberty SiriusXM, Class A * | | | 40 | | | | 1,133 | |
| | | | | | | | |
| | |
| | | | | | | 2,564 | |
| | | | | | | | |
| | |
Metals & Mining — 0.2% | | | | | | | | |
| | |
Freeport-McMoRan, Inc. | | | 9 | | | | 360 | |
| | | | | | | | |
| | |
Multi-Utilities — 1.8% | | | | | | | | |
| | |
CenterPoint Energy, Inc. | | | 14 | | | | 438 | |
| | |
Dominion Energy, Inc. | | | 10 | | | | 561 | |
| | |
DTE Energy Co. | | | 4 | | | | 452 | |
| | |
Public Service Enterprise Group, Inc. | | | 11 | | | | 668 | |
| | |
Sempra Energy | | | 6 | | | | 939 | |
| | | | | | | | |
| | |
| | | | | | | 3,058 | |
| | | | | | | | |
| | |
Oil, Gas & Consumable Fuels — 2.2% | | | | | | | | |
| | |
Cheniere Energy, Inc. | | | 3 | | | | 467 | |
| | |
ConocoPhillips | | | 7 | | | | 733 | |
| | |
Diamondback Energy, Inc. | | | 5 | | | | 675 | |
| | |
EOG Resources, Inc. | | | 5 | | | | 567 | |
| | |
Exxon Mobil Corp. | | | 4 | | | | 441 | |
| | |
HF Sinclair Corp. | | | 8 | | | | 337 | |
| | |
Marathon Oil Corp. | | | 8 | | | | 206 | |
| | |
Targa Resources Corp. | | | 3 | | | | 241 | |
| | | | | | | | |
| | |
| | | | | | | 3,667 | |
| | | | | | | | |
| | |
Passenger Airlines — 0.0% ^ | | | | | | | | |
| | |
Delta Air Lines, Inc. * | | | 2 | | | | 77 | |
| | | | | | | | |
| | |
Personal Care Products — 0.3% | | | | | | | | |
| | |
Estee Lauder Cos., Inc. (The), Class A | | | 2 | | | | 542 | |
| | | | | | | | |
| | |
Pharmaceuticals — 0.7% | | | | | | | | |
| | |
Bristol-Myers Squibb Co. (a) | | | 15 | | | | 968 | |
| | |
Elanco Animal Health, Inc. * | | | 26 | | | | 248 | |
| | | | | | | | |
| | |
| | | | | | | 1,216 | |
| | | | | | | | |
| | |
Professional Services — 0.7% | | | | | | | | |
| | |
Booz Allen Hamilton Holding Corp. | | | 5 | | | | 449 | |
| | |
Leidos Holdings, Inc. (a) | | | 7 | | | | 642 | |
| | | | | | | | |
| | |
| | | | | | | 1,091 | |
| | | | | | | | |
| | | | | | | | |
| INVESTMENTS | | SHARES (000) | | | VALUE ($000) | |
| | |
| | | | | | | | |
| | |
| | | | | | | | |
| | |
Residential REITs — 0.6% | | | | | | | | |
| | |
Sun Communities, Inc. | | | 5 | | | | 733 | |
| | |
UDR, Inc. | | | 8 | | | | 338 | |
| | | | | | | | |
| | |
| | | | | | | 1,071 | |
| | | | | | | | |
| | |
Retail REITs — 0.1% | | | | | | | | |
| | |
Kimco Realty Corp. | | | 7 | | | | 129 | |
| | | | | | | | |
|
Semiconductors & Semiconductor Equipment — 7.9% | |
| | |
Advanced Micro Devices, Inc. * (a) | | | 16 | | | | 1,412 | |
| | |
Analog Devices, Inc. | | | 9 | | | | 1,669 | |
| | |
Marvell Technology, Inc. | | | 36 | | | | 1,401 | |
| | |
NVIDIA Corp. | | | 6 | | | | 1,694 | |
| | |
NXP Semiconductors NV (China) | | | 9 | | | | 1,440 | |
| | |
Qorvo, Inc. * | | | 4 | | | | 387 | |
| | |
Taiwan Semiconductor Manufacturing Co. Ltd., ADR (Taiwan) | | | 35 | | | | 2,970 | |
| | |
Teradyne, Inc. | | | 24 | | | | 2,157 | |
| | | | | | | | |
| | |
| | | | | | | 13,130 | |
| | | | | | | | |
| | |
Software — 3.7% | | | | | | | | |
| | |
Adobe, Inc. * | | | — | | | | 163 | |
| | |
DocuSign, Inc. * | | | 1 | | | | 71 | |
| | |
Intuit, Inc. (a) | | | 5 | | | | 2,246 | |
| | |
Microsoft Corp. | | | 3 | | | | 892 | |
| | |
Oracle Corp. | | | 7 | | | | 640 | |
| | |
PTC, Inc. * | | | 1 | | | | 160 | |
| | |
Roper Technologies, Inc. | | | 1 | | | | 638 | |
| | |
Salesforce, Inc. * | | | 4 | | | | 758 | |
| | |
ServiceNow, Inc. * | | | 1 | | | | 232 | |
| | |
Workday, Inc., Class A * | | | 2 | | | | 277 | |
| | | | | | | | |
| | |
| | | | | | | 6,077 | |
| | | | | | | | |
| | |
Specialized REITs — 0.3% | | | | | | | | |
| | |
SBA Communications Corp. | | | 2 | | | | 541 | |
| | | | | | | | |
| | |
Specialty Retail — 2.3% | | | | | | | | |
| | |
AutoNation, Inc. * | | | 4 | | | | 455 | |
| | |
AutoZone, Inc. * | | | — | | | | 802 | |
| | |
Burlington Stores, Inc. * | | | 3 | | | | 640 | |
| | |
Lowe’s Cos., Inc. | | | 6 | | | | 1,230 | |
| | |
O’Reilly Automotive, Inc. * (a) | | | 1 | | | | 761 | |
| | | | | | | | |
| | |
| | | | | | | 3,888 | |
| | | | | | | | |
|
Technology Hardware, Storage & Peripherals — 2.1% | |
| | |
Dell Technologies, Inc., Class C | | | 18 | | | | 804 | |
| | |
Seagate Technology Holdings plc | | | 45 | | | | 2,637 | |
| | | | | | | | |
| | |
| | | | | | | 3,441 | |
| | | | | | | | |
SEE NOTES TO FINANCIAL STATEMENTS.
| | | | | | | | | | |
| | | | | |
| 22 | | | | | | | | J.P. MORGAN SPECIALTY FUNDS | | |
| | | | | | | | |
| INVESTMENTS | | SHARES (000) | | | VALUE ($000) | |
Long Positions — (continued) | | | | | | | | |
Common Stocks — (continued) | | | | | | | | |
| | |
Textiles, Apparel & Luxury Goods — 0.8% | | | | | | | | |
| | |
NIKE, Inc., Class B | | | 10 | | | | 1,316 | |
| | | | | | | | |
| | |
Wireless Telecommunication Services — 0.3% | | | | | | | | |
| | |
T-Mobile US, Inc. * | | | 4 | | | | 538 | |
| | | | | | | | |
| | |
Total Common Stocks
(Cost $110,060) | | | | | | | 129,154 | |
| | | | | | | | |
Short-Term Investments — 21.5% | | | | | | | | |
| | |
Investment Companies — 21.5% | | | | | | | | |
| | |
JPMorgan Prime Money Market Fund Class Institutional Shares, 4.88% (b) (c)
(Cost $35,790) | | | 35,782 | | | | 35,792 | |
| | | | | | | | |
| | |
Total Long Positions
(Cost $145,850) | | | | | | | 164,946 | |
| | | | | | | | |
Short Positions — (73.5)% | | | | | | | | |
Common Stocks — (73.5)% | | | | | | | | |
| | |
Aerospace & Defense — (2.7)% | | | | | | | | |
| | |
Boeing Co. (The) * | | | (10 | ) | | | (2,102 | ) |
| | |
General Dynamics Corp. | | | (7 | ) | | | (1,520 | ) |
| | |
Huntington Ingalls Industries, Inc. | | | (4 | ) | | | (821 | ) |
| | |
L3Harris Technologies, Inc. | | | (1 | ) | | | (76 | ) |
| | | | | | | | |
| | |
| | | | | | | (4,519 | ) |
| | | | | | | | |
| | |
Air Freight & Logistics — (0.9)% | | | | | | | | |
| | |
CH Robinson Worldwide, Inc. | | | (12 | ) | | | (1,192 | ) |
| | |
Expeditors International of Washington, Inc. | | | (3 | ) | | | (362 | ) |
| | | | | | | | |
| | |
| | | | | | | (1,554 | ) |
| | | | | | | | |
| | |
Automobile Components — (0.3)% | | | | | | | | |
| | |
Autoliv, Inc. (Sweden) | | | (2 | ) | | | (168 | ) |
| | |
BorgWarner, Inc. | | | (7 | ) | | | (352 | ) |
| | | | | | | | |
| | |
| | | | | | | (520 | ) |
| | | | | | | | |
| | |
Automobiles — (0.8)% | | | | | | | | |
| | |
Ford Motor Co. | | | (65 | ) | | | (769 | ) |
| | |
General Motors Co. | | | (14 | ) | | | (458 | ) |
| | |
Harley-Davidson, Inc. | | | (2 | ) | | | (91 | ) |
| | | | | | | | |
| | |
| | | | | | | (1,318 | ) |
| | | | | | | | |
| | |
Banks — (1.5)% | | | | | | | | |
| | |
Comerica, Inc. | | | (17 | ) | | | (744 | ) |
| | |
Huntington Bancshares, Inc. | | | (65 | ) | | | (728 | ) |
| | |
PNC Financial Services Group, Inc. (The) | | | (5 | ) | | | (676 | ) |
| | |
Regions Financial Corp. | | | (22 | ) | | | (391 | ) |
| | | | | | | | |
| | |
| | | | | | | (2,539 | ) |
| | | | | | | | |
| | | | | | | | |
| INVESTMENTS | | SHARES (000) | | | VALUE ($000) | |
| | |
| | | | | | | | |
| | |
| | | | | | | | |
| | |
Beverages — (0.4)% | | | | | | | | |
| | |
Brown-Forman Corp., Class B | | | (2 | ) | | | (133 | ) |
| | |
Molson Coors Beverage Co., Class B | | | (9 | ) | | | (536 | ) |
| | | | | | | | |
| | |
| | | | | | | (669 | ) |
| | | | | | | | |
| | |
Biotechnology — (2.4)% | | | | | | | | |
| | |
Amgen, Inc. | | | (4 | ) | | | (1,004 | ) |
| | |
Gilead Sciences, Inc. | | | (17 | ) | | | (1,390 | ) |
| | |
Moderna, Inc. * | | | (12 | ) | | | (1,533 | ) |
| | | | | | | | |
| | |
| | | | | | | (3,927 | ) |
| | | | | | | | |
| | |
Broadline Retail — (1.0)% | | | | | | | | |
| | |
eBay, Inc. | | | (35 | ) | | | (1,614 | ) |
| | | | | | | | |
| | |
Building Products — (1.8)% | | | | | | | | |
| | |
Allegion plc | | | (6 | ) | | | (634 | ) |
| | |
Johnson Controls International plc | | | (25 | ) | | | (1,528 | ) |
| | |
Lennox International, Inc. | | | (3 | ) | | | (777 | ) |
| | |
Masco Corp. | | | (1 | ) | | | (55 | ) |
| | | | | | | | |
| | |
| | | | | | | (2,994 | ) |
| | | | | | | | |
| | |
Capital Markets — (3.9)% | | | | | | | | |
| | |
BlackRock, Inc. | | | (1 | ) | | | (381 | ) |
| | |
Coinbase Global, Inc., Class A * | | | (5 | ) | | | (244 | ) |
| | |
FactSet Research Systems, Inc. | | | (1 | ) | | | (446 | ) |
| | |
Franklin Resources, Inc. | | | (36 | ) | | | (967 | ) |
| | |
LPL Financial Holdings, Inc. | | | (3 | ) | | | (735 | ) |
| | |
Moody’s Corp. | | | (1 | ) | | | (228 | ) |
| | |
MSCI, Inc. | | | (1 | ) | | | (604 | ) |
| | |
Nasdaq, Inc. | | | (17 | ) | | | (939 | ) |
| | |
Northern Trust Corp. | | | (11 | ) | | | (840 | ) |
| | |
T. Rowe Price Group, Inc. | | | (10 | ) | | | (1,140 | ) |
| | | | | | | | |
| | |
| | | | | | | (6,524 | ) |
| | | | | | | | |
| | |
Chemicals — (0.2)% | | | | | | | | |
| | |
Ecolab, Inc. | | | — | | | | (34 | ) |
| | |
Westlake Corp. | | | (3 | ) | | | (326 | ) |
| | | | | | | | |
| | |
| | | | | | | (360 | ) |
| | | | | | | | |
| | |
Commercial Services & Supplies — (0.1)% | | | | | | | | |
| | |
Waste Management, Inc. | | | (1 | ) | | | (151 | ) |
| | | | | | | | |
| | |
Communications Equipment — (1.7)% | | | | | | | | |
| | |
Cisco Systems, Inc. | | | (62 | ) | | | (2,923 | ) |
| | | | | | | | |
| | |
Consumer Finance — (0.9)% | | | | | | | | |
| | |
Capital One Financial Corp. | | | (8 | ) | | | (784 | ) |
| | |
Synchrony Financial | | | (27 | ) | | | (800 | ) |
| | | | | | | | |
| | |
| | | | | | | (1,584 | ) |
| | | | | | | | |
SEE NOTES TO FINANCIAL STATEMENTS.
| | | | | | | | | | |
| | | | | |
| | J.P. MORGAN SPECIALTY FUNDS | | | | | | | | 23 |
JPMorgan Research Market Neutral Fund
SCHEDULE OF PORTFOLIO INVESTMENTS
AS OF APRIL 30, 2023 (AS RESTATED, SEE NOTE 8) (Unaudited) (continued)
| | | | | | | | |
| INVESTMENTS | | SHARES (000) | | | VALUE ($000) | |
Short Positions — (continued) | | | | | | | | |
Common Stocks — (continued) | | | | | | | | |
| | |
Consumer Staples Distribution & Retail — (4.0)% | | | | | | | | |
| | |
Dollar Tree, Inc. * | | | (1 | ) | | | (130 | ) |
| | |
Kroger Co. (The) | | | (48 | ) | | | (2,354 | ) |
| | |
Sysco Corp. | | | (26 | ) | | | (1,983 | ) |
| | |
Walgreens Boots Alliance, Inc. | | | (14 | ) | | | (512 | ) |
| | |
Walmart, Inc. | | | (12 | ) | | | (1,777 | ) |
| | | | | | | | |
| | |
| | | | | | | (6,756 | ) |
| | | | | | | | |
| | |
Containers & Packaging — (0.6)% | | | | | | | | |
| | |
International Paper Co. | | | (29 | ) | | | (954 | ) |
| | |
Packaging Corp. of America | | | (1 | ) | | | (104 | ) |
| | | | | | | | |
| | |
| | | | | | | (1,058 | ) |
| | | | | | | | |
| | |
Diversified Telecommunication Services — (1.3)% | | | | | | | | |
| | |
AT&T, Inc. | | | (37 | ) | | | (646 | ) |
| | |
Lumen Technologies, Inc. | | | (56 | ) | | | (133 | ) |
| | |
Verizon Communications, Inc. | | | (33 | ) | | | (1,303 | ) |
| | | | | | | | |
| | |
| | | | | | | (2,082 | ) |
| | | | | | | | |
| | |
Electric Utilities — (3.1)% | | | | | | | | |
| | |
American Electric Power Co., Inc. | | | (10 | ) | | | (953 | ) |
| | |
Duke Energy Corp. | | | (12 | ) | | | (1,164 | ) |
| | |
Edison International | | | (16 | ) | | | (1,161 | ) |
| | |
Evergy, Inc. | | | (3 | ) | | | (191 | ) |
| | |
Eversource Energy | | | (8 | ) | | | (625 | ) |
| | |
Exelon Corp. | | | (16 | ) | | | (673 | ) |
| | |
FirstEnergy Corp. | | | (11 | ) | | | (448 | ) |
| | | | | | | | |
| | |
| | | | | | | (5,215 | ) |
| | | | | | | | |
| | |
Electrical Equipment — (0.5)% | | | | | | | | |
| | |
Acuity Brands, Inc. | | | (3 | ) | | | (447 | ) |
| | |
Hubbell, Inc. | | | (1 | ) | | | (231 | ) |
| | |
Rockwell Automation, Inc. | | | — | | | | (160 | ) |
| | | | | | | | |
| | |
| | | | | | | (838 | ) |
| | | | | | | | |
| | |
Entertainment — (1.7)% | | | | | | | | |
| | |
Electronic Arts, Inc. | | | (9 | ) | | | (1,102 | ) |
| | |
ROBLOX Corp., Class A * | | | (23 | ) | | | (824 | ) |
| | |
Warner Bros Discovery, Inc. * | | | (62 | ) | | | (848 | ) |
| | | | | | | | |
| | |
| | | | | | | (2,774 | ) |
| | | | | | | | |
| | |
Financial Services — (1.7)% | | | | | | | | |
| | |
Affirm Holdings, Inc. * | | | (12 | ) | | | (121 | ) |
| | |
Global Payments, Inc. | | | (10 | ) | | | (1,109 | ) |
| | |
Voya Financial, Inc. | | | (11 | ) | | | (853 | ) |
| | |
Western Union Co. (The) | | | (68 | ) | | | (737 | ) |
| | | | | | | | |
| | |
| | | | | | | (2,820 | ) |
| | | | | | | | |
| | | | | | | | |
| INVESTMENTS | | SHARES (000) | | | VALUE ($000) | |
| | |
| | | | | | | | |
| | |
| | | | | | | | |
| | |
Food Products — (1.3)% | | | | | | | | |
| | |
Campbell Soup Co. | | | (11 | ) | | | (624 | ) |
| | |
Conagra Brands, Inc. | | | (4 | ) | | | (141 | ) |
| | |
General Mills, Inc. | | | (7 | ) | | | (589 | ) |
| | |
Kellogg Co. | | | (6 | ) | | | (419 | ) |
| | |
Kraft Heinz Co. (The) | | | (9 | ) | | | (343 | ) |
| | | | | | | | |
| | |
| | | | | | | (2,116 | ) |
| | | | | | | | |
| | |
Gas Utilities — (0.4)% | | | | | | | | |
| | |
National Fuel Gas Co. | | | (13 | ) | | | (745 | ) |
| | | | | | | | |
| | |
Ground Transportation — (0.6)% | | | | | | | | |
| | |
Canadian Pacific Kansas City Ltd. (Canada) | | | (1 | ) | | | (53 | ) |
| | |
Heartland Express, Inc. | | | (20 | ) | | | (297 | ) |
| | |
JB Hunt Transport Services, Inc. | | | (2 | ) | | | (313 | ) |
| | |
Werner Enterprises, Inc. | | | (7 | ) | | | (306 | ) |
| | | | | | | | |
| | |
| | | | | | | (969 | ) |
| | | | | | | | |
| | |
Health Care Equipment & Supplies — (0.2)% | | | | | | | | |
| | |
Edwards Lifesciences Corp. * | | | (2 | ) | | | (170 | ) |
| | |
Medtronic plc | | | (1 | ) | | | (125 | ) |
| | | | | | | | |
| | |
| | | | | | | (295 | ) |
| | | | | | | | |
| | |
Health Care Providers & Services — (0.8)% | | | | | | | | |
| | |
Henry Schein, Inc. * | | | (10 | ) | | | (811 | ) |
| | |
Quest Diagnostics, Inc. | | | (4 | ) | | | (503 | ) |
| | | | | | | | |
| | |
| | | | | | | (1,314 | ) |
| | | | | | | | |
| | |
Hotels, Restaurants & Leisure — (0.7)% | | | | | | | | |
| | |
Starbucks Corp. | | | (10 | ) | | | (1,113 | ) |
| | | | | | | | |
| | |
Household Durables — (0.8)% | | | | | | | | |
| | |
Mohawk Industries, Inc. * | | | (5 | ) | | | (552 | ) |
| | |
NVR, Inc. * | | | — | | | | (245 | ) |
| | |
PulteGroup, Inc. | | | (5 | ) | | | (358 | ) |
| | |
Toll Brothers, Inc. | | | (4 | ) | | | (221 | ) |
| | | | | | | | |
| | |
| | | | | | | (1,376 | ) |
| | | | | | | | |
| | |
Household Products — (0.2)% | | | | | | | | |
| | |
Clorox Co. (The) | | | (2 | ) | | | (255 | ) |
| | | | | | | | |
| | |
Industrial Conglomerates — (1.5)%
3M Co. | | | (20 | ) | | | (2,104 | ) |
| | |
General Electric Co. | | | (3 | ) | | | (314 | ) |
| | | | | | | | |
| | |
| | | | | | | (2,418 | ) |
| | | | | | | | |
| | |
Insurance — (3.5)% | | | | | | | | |
| | |
Aflac, Inc. | | | (23 | ) | | | (1,597 | ) |
| | |
Allstate Corp. (The) | | | (10 | ) | | | (1,094 | ) |
| | |
American International Group, Inc. | | | (5 | ) | | | (246 | ) |
| | |
Aon plc, Class A | | | — | | | | (80 | ) |
SEE NOTES TO FINANCIAL STATEMENTS.
| | | | | | | | | | |
| | | | | |
| 24 | | | | | | | | J.P. MORGAN SPECIALTY FUNDS | | |
| | | | | | | | |
| INVESTMENTS | | SHARES (000) | | | VALUE ($000) | |
Short Positions — (continued) | | | | | | | | |
Common Stocks — (continued) | | | | | | | | |
| | |
Insurance — (continued) | | | | | | | | |
| | |
Arthur J Gallagher & Co. | | | — | | | | (83 | ) |
| | |
Marsh & McLennan Cos., Inc. | | | (1 | ) | | | (207 | ) |
| | |
Principal Financial Group, Inc. | | | (12 | ) | | | (916 | ) |
| | |
Ryan Specialty Holdings, Inc. * | | | (4 | ) | | | (175 | ) |
| | |
WR Berkley Corp. | | | (24 | ) | | | (1,422 | ) |
| | | | | | | | |
| | |
| | | | | | | (5,820 | ) |
| | | | | | | | |
| | |
Interactive Media & Services — (0.3)% | | | | | | | | |
| | |
Alphabet, Inc., Class C * | | | (2 | ) | | | (262 | ) |
| | |
ZoomInfo Technologies, Inc. * | | | (10 | ) | | | (219 | ) |
| | | | | | | | |
| | |
| | | | | | | (481 | ) |
| | | | | | | | |
| | |
IT Services — (1.3)% | | | | | | | | |
| | |
Accenture plc, Class A | | | (1 | ) | | | (381 | ) |
| | |
DXC Technology Co. * | | | (9 | ) | | | (221 | ) |
| | |
EPAM Systems, Inc. * | | | (2 | ) | | | (452 | ) |
| | |
Infosys Ltd. (India) | | | (31 | ) | | | (472 | ) |
| | |
International Business Machines Corp. | | | (5 | ) | | | (625 | ) |
| | | | | | | | |
| | |
| | | | | | | (2,151 | ) |
| | | | | | | | |
| | |
Life Sciences Tools & Services — (0.7)% | | | | | | | | |
| | |
Agilent Technologies, Inc. | | | (2 | ) | | | (300 | ) |
| | |
Repligen Corp. * | | | (2 | ) | | | (217 | ) |
| | |
Waters Corp. * | | | (2 | ) | | | (726 | ) |
| | | | | | | | |
| | |
| | | | | | | (1,243 | ) |
| | | | | | | | |
| | |
Machinery — (3.2)% | | | | | | | | |
| | |
Caterpillar, Inc. | | | (1 | ) | | | (151 | ) |
| | |
Donaldson Co., Inc. | | | (14 | ) | | | (927 | ) |
| | |
IDEX Corp. | | | (5 | ) | | | (969 | ) |
| | |
Illinois Tool Works, Inc. | | | (4 | ) | | | (882 | ) |
| | |
PACCAR, Inc. | | | (6 | ) | | | (484 | ) |
| | |
Stanley Black & Decker, Inc. | | | (21 | ) | | | (1,845 | ) |
| | | | | | | | |
| | |
| | | | | | | (5,258 | ) |
| | | | | | | | |
| | |
Media — (3.4)% | | | | | | | | |
| | |
Fox Corp., Class A | | | (26 | ) | | | (855 | ) |
| | |
Interpublic Group of Cos., Inc. (The) | | | (25 | ) | | | (891 | ) |
| | |
Omnicom Group, Inc. | | | (18 | ) | | | (1,679 | ) |
| | |
Paramount Global, Class B | | | (82 | ) | | | (1,921 | ) |
| | |
Sirius XM Holdings, Inc. | | | (75 | ) | | | (284 | ) |
| | | | | | | | |
| | |
| | | | | | | (5,630 | ) |
| | | | | | | | |
| | |
Multi-Utilities — (0.3)% | | | | | | | | |
| | |
WEC Energy Group, Inc. | | | (6 | ) | | | (574 | ) |
| | | | | | | | |
| | |
Office REITs — 0.0% ^ | | | | | | | | |
| | |
Orion Office REIT, Inc. | | | — | | | | — | |
| | | | | | | | |
| INVESTMENTS | | SHARES (000) | | | VALUE ($000) | |
| | |
| | | | | | | | |
| | |
| | | | | | | | |
| | |
Office REITs — (continued) | | | | | | | | |
| | |
SL Green Realty Corp. | | | — | | | | — | |
| | | | | | | | |
| | |
| | | | | | | — | |
| | | | | | | | |
| | |
Oil, Gas & Consumable Fuels — (2.2)% | | | | | | | | |
| | |
APA Corp. | | | (19 | ) | | | (684 | ) |
| | |
Coterra Energy, Inc. | | | (9 | ) | | | (240 | ) |
| | |
Devon Energy Corp. | | | (12 | ) | | | (645 | ) |
| | |
Enbridge, Inc. (Canada) | | | (15 | ) | | | (592 | ) |
| | |
Marathon Petroleum Corp. | | | (2 | ) | | | (236 | ) |
| | |
ONEOK, Inc. | | | (10 | ) | | | (689 | ) |
| | |
Phillips 66 | | | (1 | ) | | | (83 | ) |
| | |
Williams Cos., Inc. (The) | | | (15 | ) | | | (450 | ) |
| | | | | | | | |
| | |
| | | | | | | (3,619 | ) |
| | | | | | | | |
| | |
Passenger Airlines — (0.1)% | | | | | | | | |
| | |
United Airlines Holdings, Inc. * | | | (3 | ) | | | (154 | ) |
| | | | | | | | |
| | |
Pharmaceuticals — (3.0)% | | | | | | | | |
| | |
Eli Lilly & Co. | | | (4 | ) | | | (1,401 | ) |
| | |
Johnson & Johnson | | | (4 | ) | | | (659 | ) |
| | |
Merck & Co., Inc. | | | (11 | ) | | | (1,308 | ) |
| | |
Pfizer, Inc. | | | (31 | ) | | | (1,196 | ) |
| | |
Zoetis, Inc. | | | (2 | ) | | | (418 | ) |
| | | | | | | | |
| | |
| | | | | | | (4,982 | ) |
| | | | | | | | |
| | |
Professional Services — (3.3)% | | | | | | | | |
| | |
Automatic Data Processing, Inc. | | | (2 | ) | | | (463 | ) |
| | |
Ceridian HCM Holding, Inc. * | | | (16 | ) | | | (1,033 | ) |
| | |
Equifax, Inc. | | | (4 | ) | | | (820 | ) |
| | |
Paychex, Inc. | | | (7 | ) | | | (796 | ) |
| | |
Paycom Software, Inc. * | | | (4 | ) | | | (1,123 | ) |
| | |
Robert Half International, Inc. | | | (4 | ) | | | (274 | ) |
| | |
Verisk Analytics, Inc. | | | (5 | ) | | | (967 | ) |
| | | | | | | | |
| | |
| | | | | | | (5,476 | ) |
| | | | | | | | |
| | |
Residential REITs — (0.4)% | | | | | | | | |
| | |
AvalonBay Communities, Inc. | | | — | | | | (80 | ) |
| | |
Equity LifeStyle Properties, Inc. | | | (8 | ) | | | (521 | ) |
| | | | | | | | |
| | |
| | | | | | | (601 | ) |
| | | | | | | | |
| | |
Retail REITs — (0.7)% | | | | | | | | |
| | |
National Retail Properties, Inc. | | | (2 | ) | | | (80 | ) |
| | |
Simon Property Group, Inc. | | | (10 | ) | | | (1,142 | ) |
| | | | | | | | |
| | |
| | | | | | | (1,222 | ) |
| | | | | | | | |
|
Semiconductors & Semiconductor Equipment — (6.7)% | |
| | |
Applied Materials, Inc. | | | (34 | ) | | | (3,904 | ) |
SEE NOTES TO FINANCIAL STATEMENTS.
| | | | | | | | | | |
| | | | | |
| | J.P. MORGAN SPECIALTY FUNDS | | | | | | | | 25 |
JPMorgan Research Market Neutral Fund
SCHEDULE OF PORTFOLIO INVESTMENTS
AS OF APRIL 30, 2023 (AS RESTATED, SEE NOTE 8) (Unaudited) (continued)
| | | | | | | | |
| INVESTMENTS | | SHARES (000) | | | VALUE ($000) | |
Short Positions — (continued) | | | | | | | | |
Common Stocks — (continued) | | | | | | | | |
|
Semiconductors & Semiconductor Equipment — (continued) | |
| | |
Broadcom, Inc. | | | (2 | ) | | | (1,360 | ) |
| | |
Intel Corp. | | | (16 | ) | | | (485 | ) |
| | |
KLA Corp. | | | (3 | ) | | | (1,039 | ) |
| | |
Lam Research Corp. | | | (1 | ) | | | (697 | ) |
| | |
Microchip Technology, Inc. | | | (45 | ) | | | (3,266 | ) |
| | |
QUALCOMM, Inc. | | | (3 | ) | | | (346 | ) |
| | | | | | | | |
| | |
| | | | | | | (11,097 | ) |
| | | | | | | | |
| | |
Software — (0.3)% | | | | | | | | |
| | |
Palantir Technologies, Inc., Class A * | | | (52 | ) | | | (402 | ) |
| | |
UiPath, Inc., Class A * | | | (9 | ) | | | (133 | ) |
| | | | | | | | |
| | |
| | | | | | | (535 | ) |
| | | | | | | | |
| | |
Specialized REITs — (1.1)% | | | | | | | | |
| | |
Extra Space Storage, Inc. | | | (6 | ) | | | (926 | ) |
| | |
Iron Mountain, Inc. | | | (16 | ) | | | (895 | ) |
| | | | | | | | |
| | |
| | | | | | | (1,821 | ) |
| | | | | | | | |
| | |
Specialty Retail — (1.1)% | | | | | | | | |
| | |
CarMax, Inc. * | | | (3 | ) | | | (214 | ) |
| | |
Home Depot, Inc. (The) | | | (4 | ) | | | (1,303 | ) |
| | |
Williams-Sonoma, Inc. | | | (3 | ) | | | (321 | ) |
| | | | | | | | |
| | |
| | | | | | | (1,838 | ) |
| | | | | | | | |
|
Technology Hardware, Storage & Peripherals — (3.3)% | |
| | |
Apple, Inc. | | | (10 | ) | | | (1,760 | ) |
| | |
Hewlett Packard Enterprise Co. | | | (162 | ) | | | (2,315 | ) |
| | |
NetApp, Inc. | | | (22 | ) | | | (1,361 | ) |
| | |
Xerox Holdings Corp. | | | (5 | ) | | | (79 | ) |
| | | | | | | | |
| | |
| | | | | | | (5,515 | ) |
| | | | | | | | |
| | |
Textiles, Apparel & Luxury Goods — (0.2)% | | | | | | | | |
| | |
VF Corp. | | | (17 | ) | | | (393 | ) |
| | | | | | | | |
| | | | | | | | |
| INVESTMENTS | | SHARES (000) | | | VALUE ($000) | |
| | |
| | | | | | | | |
| | |
| | | | | | | | |
|
Trading Companies & Distributors — (0.4)% | |
| | |
Fastenal Co. | | | (11 | ) | | | (596 | ) |
| | | | | | | | |
| | |
Total Common Stocks
(Proceeds $(127,615)) | | | | | | | (122,346 | ) |
| | | | | | | | |
| | |
Total Short Positions
(Proceeds $(127,615)) | | | | | | | (122,346 | ) |
| | | | | | | | |
Total Investments — 25.6%
(Cost $18,235) | | | | | | | 42,600 | |
Other Assets Less Liabilities — 70.0% | | | | | | | 116,556 | |
| | | | | | | | |
Net Assets — 95.6% | | | | | | | 159,156 | |
| | | | | | | | |
Future share reacquisition adjustment — 4.4% | | | | | | | 7,287 | |
| | | | | | | | |
Net assets after future share reacquisition adjustment — 100% | | | | | | $ | 166,443 | |
| | | | | | | | |
Percentages indicated are based on net assets.
Amounts presented as a dash (“-”) represent amounts that round to less than a thousand.
Abbreviations
| | |
| ADR | | American Depositary Receipt |
| REIT | | Real Estate Investment Trust |
| |
| ^ | | Amount rounds to less than 0.1% of net assets. |
| * | | Non-income producing security. |
| (a) | | All or a portion of this security is segregated as collateral for short sales. The total value of securities and cash segregated as collateral is $22,338 and $120,196, respectively. |
| (b) | | Investment in an affiliated fund, which is registered under the Investment Company Act of 1940, as amended, and is advised by J.P. Morgan Investment Management Inc. |
| (c) | | The rate shown is the current yield as of April 30, 2023. |
| | | | | | | | | | | | | | | | | | |
| Futures contracts outstanding as of April 30, 2023 (amounts in thousands, except number of contracts): | |
| DESCRIPTION | | NUMBER OF CONTRACTS | | | EXPIRATION
DATE | | | TRADING
CURRENCY | | NOTIONAL AMOUNT ($) | | | VALUE AND UNREALIZED APPRECIATION (DEPRECIATION) ($) | |
Short Contracts | |
S&P 500 E-Mini Index | | | (31 | ) | | | 06/16/2023 | | | USD | | | (6,493 | ) | | | (159 | ) |
| | | | | | | | | | | | | | | | | | |
Abbreviations
SEE NOTES TO FINANCIAL STATEMENTS.
| | | | | | | | | | |
| | | | | |
| 26 | | | | | | | | J.P. MORGAN SPECIALTY FUNDS | | |
JPMorgan Research Market Neutral Fund
SCHEDULE OF PORTFOLIO INVESTMENTS
AS OF APRIL 30, 2022 (AS RESTATED, SEE NOTE 8) (Unaudited)
| | | | | | | | |
| INVESTMENTS | | SHARES
(000) | | | VALUE
($000) | |
Long Positions — 96.7% | | | | | | | | |
Common Stocks — 66.3% | | | | | | | | |
| | |
Aerospace & Defense — 1.6% | | | | | | | | |
| | |
Howmet Aerospace, Inc. | | | 12 | | | | 417 | |
| | |
Northrop Grumman Corp. | | | 2 | | | | 719 | |
| | |
Raytheon Technologies Corp. | | | 6 | | | | 562 | |
| | |
Textron, Inc. | | | 3 | | | | 243 | |
| | |
TransDigm Group, Inc. * | | | — | | | | 97 | |
| | | | | | | | |
| | |
| | | | | | | 2,038 | |
| | | | | | | | |
| | |
Air Freight & Logistics — 0.4% | | | | | | | | |
| | |
FedEx Corp. | | | — | | | | 70 | |
| | |
United Parcel Service, Inc., Class B | | | 3 | | | | 500 | |
| | | | | | | | |
| | |
| | | | | | | 570 | |
| | | | | | | | |
| | |
Auto Components — 0.7% | | | | | | | | |
| | |
Aptiv plc * | | | 2 | | | | 237 | |
| | |
Lear Corp. | | | 1 | | | | 137 | |
| | |
Magna International, Inc. (Canada) | | | 9 | | | | 498 | |
| | | | | | | | |
| | |
| | | | | | | 872 | |
| | | | | | | | |
| | |
Automobiles — 0.1% | | | | | | | | |
| | |
Rivian Automotive, Inc., Class A * | | | 4 | | | | 133 | |
| | | | | | | | |
| | |
Banks — 2.3% | | | | | | | | |
| | |
Fifth Third Bancorp | | | 18 | | | | 657 | |
| | |
M&T Bank Corp. | | | 2 | | | | 345 | |
| | |
SVB Financial Group * | | | 1 | | | | 359 | |
| | |
Truist Financial Corp. | | | 6 | | | | 293 | |
| | |
Wells Fargo & Co. (a) | | | 29 | | | | 1,278 | |
| | | | | | | | |
| | |
| | | | | | | 2,932 | |
| | | | | | | | |
| | |
Beverages — 1.2% | | | | | | | | |
| | |
Coca-Cola Co. (The) | | | 6 | | | | 362 | |
| | |
Constellation Brands, Inc., Class A | | | 1 | | | | 280 | |
| | |
Monster Beverage Corp. * | | | 4 | | | | 341 | |
| | |
PepsiCo, Inc. | | | 3 | | | | 529 | |
| | | | | | | | |
| | |
| | | | | | | 1,512 | |
| | | | | | | | |
| | |
Biotechnology — 3.9% | | | | | | | | |
| | |
AbbVie, Inc. (a) | | | 10 | | | | 1,423 | |
| | |
Biogen, Inc. * | | | 3 | | | | 610 | |
| | |
BioMarin Pharmaceutical, Inc. * | | | 4 | | | | 373 | |
| | |
Neurocrine Biosciences, Inc. * | | | 3 | | | | 272 | |
| | |
Regeneron Pharmaceuticals, Inc. * | | | 1 | | | | 674 | |
| | |
Sarepta Therapeutics, Inc. * | | | 5 | | | | 335 | |
| | |
Vertex Pharmaceuticals, Inc. * | | | 4 | | | | 1,217 | |
| | | | | | | | |
| | |
| | | | | | | 4,904 | |
| | | | | | | | |
| | | | | | | | |
| INVESTMENTS | | SHARES
(000) | | | VALUE
($000) | |
| | | | | | | | |
| | | | | | | | |
| | |
Building Products — 0.8% | | | | | | | | |
| | |
Fortune Brands Home & Security, Inc. | | | — | | | | 23 | |
| | |
Trane Technologies plc | | | 7 | | | | 952 | |
| | | | | | | | |
| | |
| | | | | | | 975 | |
| | | | | | | | |
| | |
Capital Markets — 1.4% | | | | | | | | |
| | |
Charles Schwab Corp. (The) | | | 9 | | | | 590 | |
| | |
CME Group, Inc. | | | 1 | | | | 188 | |
| | |
Morgan Stanley | | | 1 | | | | 68 | |
| | |
S&P Global, Inc. | | | 2 | | | | 744 | |
| | |
State Street Corp. | | | 1 | | | | 120 | |
| | | | | | | | |
| | |
| | | | | | | 1,710 | |
| | | | | | | | |
| | |
Chemicals — 0.9% | | | | | | | | |
| | |
Air Products and Chemicals, Inc. (a) | | | 1 | | | | 157 | |
| | |
DuPont de Nemours, Inc. (a) | | | 5 | | | | 368 | |
| | |
Eastman Chemical Co. (a) | | | 2 | | | | 182 | |
| | |
Linde plc (United Kingdom) | | | 1 | | | | 389 | |
| | |
PPG Industries, Inc. | | | 1 | | | | 102 | |
| | | | | | | | |
| | |
| | | | | | | 1,198 | |
| | | | | | | | |
| | |
Commercial Services & Supplies — 0.8% | | | | | | | | |
| | |
Republic Services, Inc. | | | 4 | | | | 561 | |
| | |
Waste Connections, Inc. | | | 4 | | | | 483 | |
| | | | | | | | |
| | |
| | | | | | | 1,044 | |
| | | | | | | | |
| | |
Communications Equipment — 0.1% | | | | | | | | |
| | |
Juniper Networks, Inc. | | | 5 | | | | 154 | |
| | | | | | | | |
| | |
Construction Materials — 0.5% | | | | | | | | |
| | |
Martin Marietta Materials, Inc. | | | 1 | | | | 445 | |
| | |
Vulcan Materials Co. | | | 1 | | | | 190 | |
| | | | | | | | |
| | |
| | | | | | | 635 | |
| | | | | | | | |
| | |
Consumer Finance — 0.8% | | | | | | | | |
| | |
American Express Co. | | | 5 | | | | 962 | |
| | | | | | | | |
| | |
Electric Utilities — 1.9% | | | | | | | | |
| | |
Alliant Energy Corp. | | | 1 | | | | 72 | |
| | |
Exelon Corp. | | | 29 | | | | 1,376 | |
| | |
FirstEnergy Corp. | | | 14 | | | | 593 | |
| | |
Xcel Energy, Inc. | | | 5 | | | | 366 | |
| | | | | | | | |
| | |
| | | | | | | 2,407 | |
| | | | | | | | |
| | |
Electrical Equipment — 0.6% | | | | | | | | |
| | |
Eaton Corp. plc | | | 5 | | | | 706 | |
| | | | | | | | |
|
Electronic Equipment, Instruments & Components — 0.6% | |
| | |
Corning, Inc. | | | 10 | | | | 371 | |
| | |
Keysight Technologies, Inc. * | | | 3 | | | | 410 | |
| | | | | | | | |
| | |
| | | | | | | 781 | |
| | | | | | | | |
SEE NOTES TO FINANCIAL STATEMENTS.
| | | | | | | | | | |
| | | | | |
| | J.P. MORGAN SPECIALTY FUNDS | | | | | | | | 27 |
JPMorgan Research Market Neutral Fund
SCHEDULE OF PORTFOLIO INVESTMENTS
AS OF APRIL 30, 2022 (AS RESTATED, SEE NOTE 8) (Unaudited) (continued)
| | | | | | | | |
| INVESTMENTS | | SHARES
(000) | | | VALUE
($000) | |
Long Positions — continued | | | | | | | | |
Common Stocks — continued | | | | | | | | |
|
Energy Equipment & Services — 0.4% | |
| | |
Baker Hughes Co. | | | 18 | | | | 565 | |
| | | | | | | | |
| | |
Entertainment — 0.7% | | | | | | | | |
| | |
Endeavor Group Holdings, Inc., Class A * | | | 40 | | | | 914 | |
| | | | | | | | |
|
Equity Real Estate Investment Trusts (REITs) — 2.3% | |
| | |
American Homes 4 Rent, Class A | | | 6 | | | | 250 | |
| | |
Camden Property Trust | | | 2 | | | | 373 | |
| | |
Equinix, Inc. | | | — | | | | 136 | |
| | |
Host Hotels & Resorts, Inc. | | | 3 | | | | 63 | |
| | |
Invitation Homes, Inc. | | | 9 | | | | 334 | |
| | |
Kimco Realty Corp. | | | 12 | | | | 288 | |
| | |
Prologis, Inc. | | | 2 | | | | 355 | |
| | |
Sun Communities, Inc. | | | 2 | | | | 341 | |
| | |
UDR, Inc. | | | 5 | | | | 271 | |
| | |
Ventas, Inc. | | | 1 | | | | 69 | |
| | |
WP Carey, Inc. | | | 1 | | | | 88 | |
| | |
Cousins Properties, Inc. | | | 9 | | | | 306 | |
| | | | | | | | |
| | |
| | | | | | | 2,874 | |
| | | | | | | | |
|
Food Products — 0.7% | |
| | |
Hershey Co. (The) | | | 3 | | | | 679 | |
| | |
Mondelez International, Inc., Class A | | | 3 | | | | 196 | |
| | | | | | | | |
| | |
| | | | | | | 875 | |
| | | | | | | | |
|
Health Care Equipment & Supplies — 1.2% | |
| | |
Becton Dickinson and Co. | | | 1 | | | | 215 | |
| | |
Boston Scientific Corp. * | | | 16 | | | | 685 | |
| | |
Intuitive Surgical, Inc. * | | | 2 | | | | 433 | |
| | |
Zimmer Biomet Holdings, Inc. | | | 2 | | | | 238 | |
| | | | | | | | |
| | |
| | | | | | | 1,571 | |
| | | | | | | | |
|
Health Care Providers & Services — 2.3% | |
| | |
Centene Corp. * | | | 8 | | | | 643 | |
| | |
CVS Health Corp. (a) | | | 9 | | | | 927 | |
| | |
Humana, Inc. | | | 1 | | | | 365 | |
| | |
UnitedHealth Group, Inc. (a) | | | 2 | | | | 1,005 | |
| | | | | | | | |
| | |
| | | | | | | 2,940 | |
| | | | | | | | |
|
Hotels, Restaurants & Leisure — 2.7% | |
| | |
Booking Holdings, Inc. * | | | — | | | | 170 | |
| | |
Chipotle Mexican Grill, Inc. * | | | 1 | | | | 672 | |
| | |
Domino’s Pizza, Inc. | | | 1 | | | | 315 | |
| | |
Expedia Group, Inc. * | | | 2 | | | | 361 | |
| | |
Hilton Worldwide Holdings, Inc. * | | | — | | | | 47 | |
| | |
Marriott International, Inc., Class A * | | | 2 | | | | 397 | |
| | |
McDonald’s Corp. | | | 4 | | | | 901 | |
| | | | | | | | |
| INVESTMENTS | | SHARES
(000) | | | VALUE
($000) | |
| | | | | | | | |
| | | | | | | | |
|
Hotels, Restaurants & Leisure — continued | |
| | |
Yum! Brands, Inc. (a) | | | 4 | | | | 501 | |
| | | | | | | | |
| | |
| | | | | | | 3,364 | |
| | | | | | | | |
|
Household Durables — 0.3% | |
| | |
Toll Brothers, Inc. | | | 7 | | | | 333 | |
| | | | | | | | |
|
Household Products — 0.2% | |
| | |
Procter & Gamble Co. (The) | | | 1 | | | | 207 | |
| | | | | | | | |
|
Industrial Conglomerates — 0.0% ^ | |
| | |
Roper Technologies, Inc. | | | — | | | | 47 | |
| | | | | | | | |
|
Insurance — 1.5% | |
| | |
Arthur J Gallagher & Co. | | | 3 | | | | 487 | |
| | |
Hartford Financial Services Group, Inc. (The) | | | 5 | | | | 318 | |
| | |
Progressive Corp. (The) (a) | | | 10 | | | | 1,118 | |
| | | | | | | | |
| | |
| | | | | | | 1,923 | |
| | | | | | | | |
|
Interactive Media & Services — 1.9% | |
| | |
Alphabet, Inc., Class C * | | | — | | | | 561 | |
| | |
Alphabet, Inc., Class A * | | | — | | | | 301 | |
| | |
Meta Platforms, Inc., Class A * | | | 3 | | | | 624 | |
| | |
Snap, Inc., Class A * | | | 31 | | | | 861 | |
| | | | | | | | |
| | |
| | | | | | | 2,347 | |
| | | | | | | | |
|
Internet & Direct Marketing Retail — 1.4% | |
| | |
Amazon.com, Inc. * (a) | | | — | | | | 1,748 | |
| | |
DoorDash, Inc., Class A * | | | 1 | | | | 57 | |
| | | | | | | | |
| | |
| | | | | | | 1,805 | |
| | | | | | | | |
|
IT Services — 4.8% | |
| | |
Affirm Holdings, Inc. * | | | 9 | | | | 273 | |
| | |
Automatic Data Processing, Inc. | | | 1 | | | | 185 | |
| | |
Fidelity National Information Services, Inc. | | | 1 | | | | 129 | |
| | |
FleetCor Technologies, Inc. * | | | 5 | | | | 1,233 | |
| | |
Mastercard, Inc., Class A (a) | | | 9 | | | | 3,097 | |
| | |
Shopify, Inc., Class A (Canada) * (a) | | | 1 | | | | 542 | |
| | |
Visa, Inc., Class A | | | 1 | | | | 171 | |
| | |
WEX, Inc. * | | | 3 | | | | 446 | |
| | | | | | | | |
| | |
| | | | | | | 6,076 | |
| | | | | | | | |
| | |
Life Sciences Tools & Services — 1.2% | | | | | | | | |
| | |
Danaher Corp. | | | 2 | | | | 413 | |
| | |
PerkinElmer, Inc. | | | 3 | | | | 383 | |
| | |
Thermo Fisher Scientific, Inc. (a) | | | 1 | | | | 709 | |
| | | | | | | | |
| | |
| | | | | | | 1,505 | |
| | | | | | | | |
| | |
Machinery — 3.1% | | | | | | | | |
| | |
Deere & Co. (a) | | | 4 | | | | 1,464 | |
SEE NOTES TO FINANCIAL STATEMENTS.
| | | | | | | | | | |
| | | | | |
| 28 | | | | | | | | J.P. MORGAN SPECIALTY FUNDS | | |
| | | | | | | | |
| INVESTMENTS | | SHARES
(000) | | | VALUE
($000) | |
Long Positions — continued | | | | | | | | |
Common Stocks — continued | | | | | | | | |
| | |
Machinery — continued | | | | | | | | |
| | |
Dover Corp. | | | 8 | | | | 1,067 | |
| | |
Ingersoll Rand, Inc. | | | 5 | | | | 225 | |
| | |
Otis Worldwide Corp. | | | 11 | | | | 819 | |
| | |
Parker-Hannifin Corp. | | | 2 | | | | 363 | |
| | | | | | | | |
| | |
| | | | | | | 3,938 | |
| | | | | | | | |
| | |
Media — 1.1% | | | | | | | | |
| | |
Charter Communications, Inc., Class A * | | | 1 | | | | 401 | |
| | |
Comcast Corp., Class A | | | 7 | | | | 262 | |
| | |
Liberty Media Corp.-Liberty SiriusXM, Class A * | | | 17 | | | | 723 | |
| | | | | | | | |
| | |
| | | | | | | 1,386 | |
| | | | | | | | |
| | |
Metals & Mining — 0.4% | | | | | | | | |
| | |
Freeport-McMoRan, Inc. | | | 11 | | | | 448 | |
| | | | | | | | |
| | |
Multiline Retail — 0.4% | | | | | | | | |
| | |
Dollar General Corp. | | | 2 | | | | 446 | |
| | | | | | | | |
| | |
Multi-Utilities — 1.7% | | | | | | | | |
| | |
Ameren Corp. (a) | | | 13 | | | | 1,218 | |
| | |
CenterPoint Energy, Inc. | | | 16 | | | | 478 | |
| | |
NiSource, Inc. | | | 9 | | | | 274 | |
| | |
Sempra Energy | | | 2 | | | | 232 | |
| | | | | | | | |
| | |
| | | | | | | 2,202 | |
| | | | | | | | |
| | |
Oil, Gas & Consumable Fuels — 4.1% | | | | | | | | |
| | |
Cheniere Energy, Inc. | | | 3 | | | | 466 | |
| | |
ConocoPhillips (a) | | | 11 | | | | 1,014 | |
| | |
Coterra Energy, Inc. | | | 5 | | | | 146 | |
| | |
Diamondback Energy, Inc. (a) | | | 13 | | | | 1,686 | |
| | |
EOG Resources, Inc. | | | 5 | | | | 565 | |
| | |
ONEOK, Inc. | | | 5 | | | | 290 | |
| | |
Phillips 66 | | | 8 | | | | 703 | |
| | |
Pioneer Natural Resources Co. (a) | | | 1 | | | | 318 | |
| | | | | | | | |
| | |
| | | | | | | 5,188 | |
| | | | | | | | |
| | |
Personal Products — 0.1% | | | | | | | | |
| | |
Estee Lauder Cos., Inc. (The), Class A | | | — | | | | 123 | |
| | | | | | | | |
| | |
Pharmaceuticals — 0.9% | | | | | | | | |
| | |
Bristol-Myers Squibb Co. | | | 12 | | | | 892 | |
| | |
Eli Lilly & Co. | | | 1 | | | | 316 | |
| | | | | | | | |
| | |
| | | | | | | 1,208 | |
| | | | | | | | |
| | |
Professional Services — 0.9% | | | | | | | | |
| | |
Booz Allen Hamilton Holding Corp. | | | 5 | | | | 406 | |
| | |
Leidos Holdings, Inc. (a) | | | 7 | | | | 697 | |
| | | | | | | | |
| | |
| | | | | | | 1,103 | |
| | | | | | | | |
| | | | | | | | |
| INVESTMENTS | | SHARES
(000) | | | VALUE
($000) | |
| | | | | | | | |
| | | | | | | | |
| | |
Road & Rail — 3.1% | | | | | | | | |
| | |
Canadian National Railway Co. (Canada) | | | 2 | | | | 235 | |
| | |
CSX Corp. | | | 9 | | | | 303 | |
| | |
Knight-Swift Transportation Holdings, Inc. | | | 5 | | | | 243 | |
| | |
Lyft, Inc., Class A * (a) | | | 35 | | | | 1,146 | |
| | |
Norfolk Southern Corp. (a) | | | 3 | | | | 825 | |
| | |
Old Dominion Freight Line, Inc. | | | 2 | | | | 620 | |
| | |
Uber Technologies, Inc. * (a) | | | 12 | | | | 379 | |
| | |
Union Pacific Corp. | | | 1 | | | | 55 | |
| | |
XPO Logistics, Inc. * | | | 2 | | | | 100 | |
| | | | | | | | |
| | |
| | | | | | | 3,906 | |
| | | | | | | | |
| |
Semiconductors & Semiconductor Equipment — 5.4% | | | | | |
| | |
Advanced Micro Devices, Inc. * (a) | | | 15 | | | | 1,261 | |
| | |
Analog Devices, Inc. | | | 3 | | | | 519 | |
| | |
Lam Research Corp. (a) | | | 1 | | | | 525 | |
| | |
Marvell Technology, Inc. | | | 3 | | | | 150 | |
| | |
Microchip Technology, Inc. | | | 5 | | | | 293 | |
| | |
NXP Semiconductors NV (China) | | | 14 | | | | 2,418 | |
| | |
ON Semiconductor Corp. * | | | 7 | | | | 346 | |
| | |
Taiwan Semiconductor Manufacturing Co. Ltd., ADR (Taiwan) | | | 3 | | | | 270 | |
| | |
Teradyne, Inc. | | | 4 | | | | 449 | |
| | |
Texas Instruments, Inc. | | | 3 | | | | 554 | |
| | | | | | | | |
| | |
| | | | | | | 6,785 | |
| | | | | | | | |
| | |
Software — 1.1% | | | | | | | | |
| | |
Autodesk, Inc. * | | | 1 | | | | 250 | |
| | |
Coupa Software, Inc. * | | | 4 | | | | 299 | |
| | |
DocuSign, Inc. * | | | 3 | | | | 213 | |
| | |
Intuit, Inc. | | | — | | | | 140 | |
| | |
Microsoft Corp. | | | 1 | | | | 326 | |
| | |
Workday, Inc., Class A * | | | 1 | | | | 183 | |
| | | | | | | | |
| | |
| | | | | | | 1,411 | |
| | | | | | | | |
| | |
Specialty Retail — 2.3% | | | | | | | | |
| | |
AutoZone, Inc. * | | | — | | | | 430 | |
| | |
Best Buy Co., Inc. | | | 4 | | | | 325 | |
| | |
Burlington Stores, Inc. * | | | 3 | | | | 597 | |
| | |
Lowe’s Cos., Inc. (a) | | | 4 | | | | 797 | |
| | |
O’Reilly Automotive, Inc. * (a) | | | 1 | | | | 745 | |
| | | | | | | | |
| | |
| | | | | | | 2,894 | |
| | | | | | | | |
|
Technology Hardware, Storage & Peripherals — 0.9% | |
| | |
Hewlett Packard Enterprise Co. | | | 22 | | | | 339 | |
| | |
Seagate Technology Holdings plc | | | 10 | | | | 836 | |
| | | | | | | | |
| | |
| | | | | | | 1,175 | |
| | | | | | | | |
SEE NOTES TO FINANCIAL STATEMENTS.
| | | | | | | | | | |
| | | | | |
| | J.P. MORGAN SPECIALTY FUNDS | | | | | | | | 29 |
JPMorgan Research Market Neutral Fund
SCHEDULE OF PORTFOLIO INVESTMENTS
AS OF APRIL 30, 2022 (AS RESTATED, SEE NOTE 8) (Unaudited) (continued)
| | | | | | | | |
| INVESTMENTS | | SHARES
(000) | | | VALUE
($000) | |
| | | | | | | | |
Long Positions — continued | | | | | | | | |
Common Stocks — continued | | | | | | | | |
| | |
Wireless Telecommunication Services — 0.6% | | | | | | | | |
| | |
T-Mobile US, Inc. * | | | 7 | | | | 812 | |
| | | | | | | | |
| | |
Total Common Stocks
(Cost $73,623) | | | | | | | 83,904 | |
| | | | | | | | |
Short-Term Investments — 30.4% | | | | | | | | |
| | |
Investment Companies — 30.4% | | | | | | | | |
| | |
JPMorgan Prime Money Market Fund Class Institutional Shares, 0.36% (b) (c)
(Cost $38,464) | | | 38,460 | | | | 38,468 | |
| | | | | | | | |
| | |
Total Long Positions
(Cost $112,087) | | | | | | | 122,372 | |
| | | | | | | | |
Short Positions — (62.4)% | | | | | | | | |
Common Stocks — (62.4)% | | | | | | | | |
| | |
Aerospace & Defense — (0.9)% | | | | | | | | |
| | |
Hexcel Corp. | | | (3 | ) | | | (152 | ) |
| | |
Huntington Ingalls Industries, Inc. | | | (4 | ) | | | (795 | ) |
| | |
L3Harris Technologies, Inc. | | | — | | | | (142 | ) |
| | | | | | | | |
| | |
| | | | | | | (1,089 | ) |
| | | | | | | | |
| | |
Air Freight & Logistics — (1.0)% | | | | | | | | |
| | |
CH Robinson Worldwide, Inc. | | | (7 | ) | | | (737 | ) |
| | |
Expeditors International of Washington, Inc. | | | (5 | ) | | | (542 | ) |
| | | | | | | | |
| | |
| | | | | | | (1,279 | ) |
| | | | | | | | |
| | |
Auto Components — (0.8)% | | | | | | | | |
| | |
Autoliv, Inc. (Sweden) | | | (6 | ) | | | (438 | ) |
| | |
BorgWarner, Inc. | | | (16 | ) | | | (575 | ) |
| | | | | | | | |
| | |
| | | | | | | (1,013 | ) |
| | | | | | | | |
| | |
Automobiles — (0.1)% | | | | | | | | |
| | |
Harley-Davidson, Inc. | | | (2 | ) | | | (81 | ) |
| | | | | | | | |
| | |
Banks — (2.0)% | | | | | | | | |
| | |
First Republic Bank | | | (4 | ) | | | (623 | ) |
| | |
Huntington Bancshares, Inc. | | | (56 | ) | | | (734 | ) |
| | |
KeyCorp | | | (38 | ) | | | (727 | ) |
| | |
PNC Financial Services Group, Inc. (The) | | | (3 | ) | | | (493 | ) |
| | | | | | | | |
| | |
| | | | | | | (2,577 | ) |
| | | | | | | | |
| | |
Beverages — (0.1)% | | | | | | | | |
| | |
Brown-Forman Corp., Class B | | | (2 | ) | | | (125 | ) |
| | | | | | | | |
| | |
Biotechnology — (2.0)% | | | | | | | | |
| | |
Amgen, Inc. | | | (2 | ) | | | (448 | ) |
| | |
Gilead Sciences, Inc. | | | (15 | ) | | | (888 | ) |
| | |
Moderna, Inc. * | | | (9 | ) | | | (1,197 | ) |
| | | | | | | | |
| | |
| | | | | | | (2,533 | ) |
| | | | | | | | |
| | | | | | | | |
| INVESTMENTS | | SHARES
(000) | | | VALUE
($000) | |
| | | | | | | | |
| | | | | | | | |
| | |
Building Products — (1.3)% | | | | | | | | |
| | |
Allegion plc | | | (3 | ) | | | (359 | ) |
| | |
Carrier Global Corp. | | | (15 | ) | | | (557 | ) |
| | |
Johnson Controls International plc | | | (10 | ) | | | (614 | ) |
| | |
Masco Corp. | | | (2 | ) | | | (130 | ) |
| | | | | | | | |
| | |
| | | | | | | (1,660 | ) |
| | | | | | | | |
| | |
Capital Markets — (2.3)% | | | | | | | | |
| | |
BlackRock, Inc. | | | (1 | ) | | | (443 | ) |
| | |
Franklin Resources, Inc. | | | (24 | ) | | | (602 | ) |
| | |
Goldman Sachs Group, Inc. (The) | | | (1 | ) | | | (351 | ) |
| | |
Moody’s Corp. | | | (2 | ) | | | (672 | ) |
| | |
MSCI, Inc. | | | (1 | ) | | | (311 | ) |
| | |
Northern Trust Corp. | | | (5 | ) | | | (527 | ) |
| | | | | | | | |
| | |
| | | | | | | (2,906 | ) |
| | | | | | | | |
| | |
Chemicals — (0.5)% | | | | | | | | |
| | |
Dow, Inc. | | | (7 | ) | | | (432 | ) |
| | |
Ecolab, Inc. | | | (1 | ) | | | (150 | ) |
| | |
Sherwin-Williams Co. (The) | | | — | | | | (65 | ) |
| | | | | | | | |
| | |
| | | | | | | (647 | ) |
| | | | | | | | |
| | |
Commercial Services & Supplies — (0.2)% | | | | | | | | |
| | |
Waste Management, Inc. | | | (1 | ) | | | (224 | ) |
| | | | | | | | |
| | |
Communications Equipment — (1.0)% | | | | | | | | |
| | |
Cisco Systems, Inc. | | | (26 | ) | | | (1,266 | ) |
| | | | | | | | |
| | |
Consumer Finance — (1.0)% | | | | | | | | |
| | |
Capital One Financial Corp. | | | (9 | ) | | | (1,073 | ) |
| | |
Discover Financial Services | | | (1 | ) | | | (172 | ) |
| | | | | | | | |
| | |
| | | | | | | (1,245 | ) |
| | | | | | | | |
| | |
Containers & Packaging — (1.2)% | | | | | | | | |
| | |
AptarGroup, Inc. | | | (3 | ) | | | (386 | ) |
| | |
Ball Corp. | | | (4 | ) | | | (311 | ) |
| | |
International Paper Co. | | | (7 | ) | | | (307 | ) |
| | |
Packaging Corp. of America | | | (1 | ) | | | (112 | ) |
| | |
Silgan Holdings, Inc. | | | (8 | ) | | | (376 | ) |
| | | | | | | | |
| | |
| | | | | | | (1,492 | ) |
| | | | | | | | |
| | |
Diversified Telecommunication Services — (1.6)% | | | | | | | | |
| | |
AT&T, Inc. | | | (36 | ) | | | (684 | ) |
| | |
Lumen Technologies, Inc. | | | (60 | ) | | | (599 | ) |
| | |
Verizon Communications, Inc. | | | (16 | ) | | | (741 | ) |
| | | | | | | | |
| | |
| | | | | | | (2,024 | ) |
| | | | | | | | |
| | |
Electric Utilities — (3.1)% | | | | | | | | |
| | |
American Electric Power Co., Inc. | | | (12 | ) | | | (1,140 | ) |
SEE NOTES TO FINANCIAL STATEMENTS.
| | | | | | | | | | |
| | | | | |
| 30 | | | | | | | | J.P. MORGAN SPECIALTY FUNDS | | |
| | | | | | | | |
| INVESTMENTS | | SHARES
(000) | | | VALUE
($000) | |
Short Positions — continued | | | | | | | | |
Common Stocks — continued | | | | | | | | |
| | |
Electric utilities — continued | | | | | | | | |
| | |
Duke Energy Corp. | | | (7 | ) | | | (739 | ) |
| | |
Eversource Energy | | | (5 | ) | | | (416 | ) |
| | | | | | | | |
| | |
Pinnacle West Capital Corp. | | | (6 | ) | | | (461 | ) |
| | |
PPL Corp. | | | (13 | ) | | | (361 | ) |
| | |
Southern Co. (The) | | | (10 | ) | | | (758 | ) |
| | | | | | | | |
| | |
| | | | | | | (3,875 | ) |
| | | | | | | | |
| | |
Electrical Equipment — (1.3)% | | | | | | | | |
| | |
Acuity Brands, Inc. | | | (3 | ) | | | (478 | ) |
| | |
Emerson Electric Co. | | | (5 | ) | | | (464 | ) |
| | |
Hubbell, Inc. | | | (3 | ) | | | (677 | ) |
| | |
Sensata Technologies Holding plc * | | | (2 | ) | | | (93 | ) |
| | | | | | | | |
| | |
| | | | | | | (1,712 | ) |
| | | | | | | | |
|
Electronic Equipment, Instruments & Components — (0.1)% | |
| | |
Cognex Corp. | | | (3 | ) | | | (176 | ) |
| | | | | | | | |
| | |
Energy Equipment & Services — (0.5)% | | | | | | | | |
| | |
Schlumberger NV | | | (17 | ) | | | (651 | ) |
| | | | | | | | |
| | |
Entertainment — (0.3)% | | | | | | | | |
| | |
AMC Entertainment Holdings, Inc., Class A * | | | (22 | ) | | | (339 | ) |
| | |
Warner Bros Discovery, Inc. * | | | — | | | | — | |
| | | | | | | | |
| | |
| | | | | | | (339 | ) |
| | | | | | | | |
| |
Equity Real Estate Investment Trusts (REITs) — (2.8)% | | | | | |
| | |
AvalonBay Communities, Inc. | | | — | | | | (101 | ) |
| | |
Duke Realty Corp. | | | (6 | ) | | | (331 | ) |
| | |
Equity Residential | | | (1 | ) | | | (98 | ) |
| | |
Iron Mountain, Inc. | | | (19 | ) | | | (996 | ) |
| | |
National Retail Properties, Inc. | | | (14 | ) | | | (592 | ) |
| | |
Orion Office REIT, Inc. | | | — | | | | — | |
| | |
Realty Income Corp. | | | (3 | ) | | | (221 | ) |
| | |
Simon Property Group, Inc. | | | (6 | ) | | | (735 | ) |
| | |
SL Green Realty Corp. | | | (4 | ) | | | (239 | ) |
| | |
Vornado Realty Trust | | | (5 | ) | | | (200 | ) |
| | | | | | | | |
| | |
| | | | | | | (3,513 | ) |
| | | | | | | | |
| | |
Food & Staples Retailing — (4.0)% | | | | | | | | |
| | |
Costco Wholesale Corp. | | | — | | | | (100 | ) |
| | |
Kroger Co. (The) | | | (48 | ) | | | (2,574 | ) |
| | |
Walgreens Boots Alliance, Inc. | | | (23 | ) | | | (987 | ) |
| | |
Walmart, Inc. | | | (10 | ) | | | (1,448 | ) |
| | | | | | | | |
| | |
| | | | | | | (5,109 | ) |
| | | | | | | | |
| | |
Food Products — (1.3)% | | | | | | | | |
| | |
Campbell Soup Co. | | | (9 | ) | | | (429 | ) |
| | |
Conagra Brands, Inc. | | | (6 | ) | | | (226 | ) |
| | | | | | | | |
| INVESTMENTS | | SHARES
(000) | | | VALUE
($000) | |
| | | | | | | | |
| | | | | | | | |
| | |
Food Products — continued | | | | | | | | |
| | |
General Mills, Inc. | | | (6 | ) | | | (401 | ) |
| | |
Kellogg Co. | | | (9 | ) | | | (585 | ) |
| | | | | | | | |
| | |
| | | | | | | (1,641 | ) |
| | | | | | | | |
| | |
Gas Utilities — (0.3)% | | | | | | | | |
| | |
National Fuel Gas Co. | | | (6 | ) | | | (438 | ) |
| | | | | | | | |
| | |
Health Care Equipment & Supplies — (1.1)% | | | | | | | | |
| | |
Baxter International, Inc. | | | (9 | ) | | | (652 | ) |
| | |
Stryker Corp. | | | (3 | ) | | | (774 | ) |
| | | | | | | | |
| | |
| | | | | | | (1,426 | ) |
| | | | | | | | |
| | |
Health Care Providers & Services — (1.0)% | | | | | | | | |
| | |
Henry Schein, Inc. * | | | (5 | ) | | | (390 | ) |
| | |
Quest Diagnostics, Inc. | | | (5 | ) | | | (630 | ) |
| | |
Universal Health Services, Inc., Class B | | | (1 | ) | | | (198 | ) |
| | | | | | | | |
| | |
| | | | | | | (1,218 | ) |
| | | | | | | | |
| | |
Hotels, Restaurants & Leisure — (0.9)% | | | | | | | | |
| | |
Starbucks Corp. | | | (15 | ) | | | (1,132 | ) |
| | | | | | | | |
| | |
Household Durables — (0.3)% | | | | | | | | |
| | |
Mohawk Industries, Inc. * | | | (1 | ) | | | (106 | ) |
| | |
NVR, Inc. * | | | — | | | | (171 | ) |
| | |
PulteGroup, Inc. | | | (3 | ) | | | (137 | ) |
| | | | | | | | |
| | |
| | | | | | | (414 | ) |
| | | | | | | | |
| | |
Household Products — (0.9)% | | | | | | | | |
| | |
Church & Dwight Co., Inc. | | | (2 | ) | | | (233 | ) |
| | |
Clorox Co. (The) | | | (4 | ) | | | (587 | ) |
| | |
Kimberly-Clark Corp. | | | (3 | ) | | | (377 | ) |
| | | | | | | | |
| | |
| | | | | | | (1,197 | ) |
| | | | | | | | |
| | |
Industrial Conglomerates — (2.1)% | | | | | | | | |
| | |
3M Co. | | | (13 | ) | | | (1,829 | ) |
| | |
General Electric Co. | | | (11 | ) | | | (830 | ) |
| | | | | | | | |
| | |
| | | | | | | (2,659 | ) |
| | | | | | | | |
| | |
Insurance — (1.5)% | | | | | | | | |
| | |
Allstate Corp. (The) | | | (4 | ) | | | (500 | ) |
| | |
Aon plc, Class A | | | — | | | | (119 | ) |
| | |
Chubb Ltd. | | | (3 | ) | | | (639 | ) |
| | |
Ryan Specialty Group Holdings, Inc., Class A * | | | (7 | ) | | | (273 | ) |
| | |
W R Berkley Corp. | | | (3 | ) | | | (188 | ) |
| | |
Willis Towers Watson plc | | | (1 | ) | | | (138 | ) |
| | | | | | | | |
| | |
| | | | | | | (1,857 | ) |
| | | | | | | | |
| | |
Internet & Direct Marketing Retail — (0.6)% | | | | | | | | |
| | |
eBay, Inc. | | | (15 | ) | | | (796 | ) |
| | | | | | | | |
SEE NOTES TO FINANCIAL STATEMENTS.
| | | | | | | | | | |
| | | | | |
| | J.P. MORGAN SPECIALTY FUNDS | | | | | | | | 31 |
JPMorgan Research Market Neutral Fund
SCHEDULE OF PORTFOLIO INVESTMENTS
AS OF APRIL 30, 2022 (AS RESTATED, SEE NOTE 8) (Unaudited) (continued)
| | | | | | | | |
| INVESTMENTS | | SHARES
(000) | | | VALUE
($000) | |
Short Positions — continued | | | | | | | | |
Common Stocks — continued | | | | | | | | |
| | |
IT Services — (2.5)% | | | | | | | | |
| | |
Cognizant Technology Solutions Corp., Class A | | | (7 | ) | | | (531 | ) |
| | |
DXC Technology Co. * | | | (4 | ) | | | (107 | ) |
| | |
Global Payments, Inc. | | | (3 | ) | | | (385 | ) |
| | |
Jack Henry & Associates, Inc. | | | (1 | ) | | | (207 | ) |
| | |
Paychex, Inc. | | | (5 | ) | | | (607 | ) |
| | | | | | | | |
| | | | | | | | |
| | |
PayPal Holdings, Inc. * | | | (1 | ) | | | (100 | ) |
| | |
Western Union Co. (The) | | | (70 | ) | | | (1,179 | ) |
| | | | | | | | |
| | |
| | | | | | | (3,116 | ) |
| | | | | | | | |
| | |
Life Sciences Tools & Services — (0.8)% | | | | | | | | |
| | |
Agilent Technologies, Inc. | | | (3 | ) | | | (438 | ) |
| | |
Waters Corp. * | | | (2 | ) | | | (533 | ) |
| | | | | | | | |
| | |
| | | | | | | (971 | ) |
| | | | | | | | |
| | |
Machinery — (1.5)% | | | | | | | | |
| | |
Caterpillar, Inc. | | | (2 | ) | | | (451 | ) |
| | |
Donaldson Co., Inc. | | | (4 | ) | | | (206 | ) |
| | |
IDEX Corp. | | | (1 | ) | | | (210 | ) |
| | |
Illinois Tool Works, Inc. | | | (4 | ) | | | (674 | ) |
| | |
PACCAR, Inc. | | | (5 | ) | | | (406 | ) |
| | | | | | | | |
| | |
| | | | | | | (1,947 | ) |
| | | | | | | | |
| | |
Media — (4.3)% | | | | | | | | |
| | |
Interpublic Group of Cos., Inc. (The) | | | (27 | ) | | | (888 | ) |
| | |
Omnicom Group, Inc. | | | (32 | ) | | | (2,426 | ) |
| | |
Paramount Global, Class B | | | (57 | ) | | | (1,650 | ) |
| | |
Sirius XM Holdings, Inc. | | | (83 | ) | | | (499 | ) |
| | | | | | | | |
| | |
| | | | | | | (5,463 | ) |
| | | | | | | | |
| | |
Multiline Retail — (0.3)% | | | | | | | | |
| | |
Macy’s, Inc. | | | (6 | ) | | | (151 | ) |
| | |
Target Corp. | | | (1 | ) | | | (215 | ) |
| | | | | | | | |
| | |
| | | | | | | (366 | ) |
| | | | | | | | |
| | |
Multi-Utilities — (0.2)% | | | | | | | | |
| | |
Dominion Energy, Inc. | | | (3 | ) | | | (231 | ) |
| | | | | | | | |
| | |
Oil, Gas & Consumable Fuels — (3.1)% | | | | | | | | |
| | |
Enbridge, Inc. (Canada) | | | (40 | ) | | | (1,733 | ) |
| | |
Exxon Mobil Corp. | | | (11 | ) | | | (948 | ) |
| | |
Hess Corp. | | | (10 | ) | | | (1,037 | ) |
| | |
Marathon Oil Corp. | | | (11 | ) | | | (269 | ) |
| | | | | | | | |
| | |
| | | | | | | (3,987 | ) |
| | | | | | | | |
| | |
Pharmaceuticals — (2.2)% | | | | | | | | |
| | |
Johnson & Johnson | | | (3 | ) | | | (571 | ) |
| | |
Merck & Co., Inc. | | | (10 | ) | | | (845 | ) |
| | | | | | | | |
| INVESTMENTS | | SHARES
(000) | | | VALUE
($000) | |
| | | | | | | | |
| | | | | | | | |
| | |
Pharmaceuticals — continued | | | | | | | | |
| | |
Pfizer, Inc. | | | (16 | ) | | | (806 | ) |
| | |
Zoetis, Inc. | | | (3 | ) | | | (526 | ) |
| | | | | | | | |
| | |
| | | | | | | (2,748 | ) |
| | | | | | | | |
| | |
Professional Services — (0.5)% | | | | | | | | |
| | |
Equifax, Inc. | | | — | | | | (48 | ) |
| | |
TransUnion | | | (4 | ) | | | (349 | ) |
| | |
Verisk Analytics, Inc. | | | (1 | ) | | | (211 | ) |
| | | | | | | | |
| | |
| | | | | | | (608 | ) |
| | | | | | | | |
| | |
Road & Rail — (1.0)% | | | | | | | | |
| | |
Canadian Pacific Railway Ltd. (Canada) | | | (2 | ) | | | (162 | ) |
| | |
Heartland Express, Inc. | | | (19 | ) | | | (257 | ) |
| | |
JB Hunt Transport Services, Inc. | | | (2 | ) | | | (289 | ) |
| | |
Werner Enterprises, Inc. | | | (13 | ) | | | (515 | ) |
| | | | | | | | |
| | |
| | | | | | | (1,223 | ) |
| | | | | | | | |
| |
Semiconductors & Semiconductor Equipment — (3.0)% | | | | | |
| | |
Broadcom, Inc. | | | (3 | ) | | | (1,244 | ) |
| | |
Intel Corp. | | | (34 | ) | | | (1,491 | ) |
| | |
QUALCOMM, Inc. | | | (6 | ) | | | (847 | ) |
| | |
Universal Display Corp. | | | (1 | ) | | | (135 | ) |
| | | | | | | | |
| | |
| | | | | | | (3,717 | ) |
| | | | | | | | |
| | |
Software — (1.4)% | | | | | | | | |
| | |
Ceridian HCM Holding, Inc. * | | | (10 | ) | | | (558 | ) |
| | |
Oracle Corp. | | | (1 | ) | | | (46 | ) |
| | |
Palantir Technologies, Inc., Class A * | | | (13 | ) | | | (135 | ) |
| | |
Paycom Software, Inc. * | | | (2 | ) | | | (504 | ) |
| | |
Salesforce, Inc. * | | | (1 | ) | | | (270 | ) |
| | |
VMware, Inc., Class A | | | (2 | ) | | | (231 | ) |
| | | | | | | | |
| | |
| | | | | | | (1,744 | ) |
| | | | | | | | |
| | |
Specialty Retail — (0.3)% | | | | | | | | |
| | |
CarMax, Inc. * | | | (3 | ) | | | (268 | ) |
| | |
Williams-Sonoma, Inc. | | | (1 | ) | | | (162 | ) |
| | | | | | | | |
| | |
| | | | | | | (430 | ) |
| | | | | | | | |
|
Technology Hardware, Storage & Peripherals — (2.6)% | |
| | |
Apple, Inc. | | | (9 | ) | | | (1,410 | ) |
| | |
HP, Inc. | | | (13 | ) | | | (488 | ) |
| | |
NetApp, Inc. | | | (17 | ) | | | (1,275 | ) |
| | |
Xerox Holdings Corp. | | | (5 | ) | | | (79 | ) |
| | | | | | | | |
| | |
| | | | | | | (3,252 | ) |
| | | | | | | | |
| | |
Textiles, Apparel & Luxury Goods — (0.2)% | | | | | | | | |
| | |
VF Corp. | | | (5 | ) | | | (280 | ) |
| | | | | | | | |
SEE NOTES TO FINANCIAL STATEMENTS.
| | | | | | | | | | |
| | | | | |
| 32 | | | | | | | | J.P. MORGAN SPECIALTY FUNDS | | |
| | | | | | | | |
| INVESTMENTS | | SHARES
(000) | | | VALUE
($000) | |
Short Positions — continued | | | | | | | | |
Common Stocks — continued | | | | | | | | |
| | |
Trading Companies & Distributors — (0.4)% | | | | | | | | |
| | |
Fastenal Co. | | | (10 | ) | | | (566 | ) |
| | | | | | | | |
| | |
Total Common Stocks
(Proceeds $(84,734)) | | | | | | | (78,963 | ) |
| | | | | | | | |
| | | | | | | | |
| | |
Total Short Positions
(Proceeds $(84,734)) | | | | | | | (78,963 | ) |
| | | | | | | | |
Total Investments — 34.3%
(Cost $27,353) | | | | | | | 43,409 | |
Other Assets Less Liabilities — 61.5% | | | | | | | 77,843 | |
| | | | | | | | |
Net Assets — 95.8% | | | | | | | 121,252 | |
| | | | | | | | |
Future share reacquisition adjustment — 4.2% | | | | | | | 5,335 | |
| | | | | | | | |
Net assets after future share reacquisition adjustment — 100% | | | | | | $ | 126,587 | |
| | | | | | | | |
Percentages indicated are based on net assets.
Amounts presented as a dash (“-“) represent amounts that round to less than a thousand.
| | |
Abbreviations | | |
| ADR | | American Depositary Receipt |
| |
| ^ | | Amount rounds to less than 0.1% of net assets. |
| * | | Non-income producing security. |
| (a) | | All or a portion of this security is segregated as collateral for short sales. The total value of securities and cash segregated as collateral is $14,707 and $80,921, respectively. |
| (b) | | Investment in an affiliated fund, which is registered under the Investment Company Act of 1940, as amended, and is advised by J.P. Morgan Investment Management Inc. |
| (c) | | The rate shown is the current yield as of April 30, 2022. |
SEE NOTES TO FINANCIAL STATEMENTS.
| | | | | | | | | | |
| | | | | |
| | J.P. MORGAN SPECIALTY FUNDS | | | | | | | | 33 |
JPMorgan Research Market Neutral Fund
SCHEDULE OF PORTFOLIO INVESTMENTS
AS OF APRIL 30, 2021 (AS RESTATED, SEE NOTE 8) (Unaudited)
| | | | | | | | |
| INVESTMENTS | | SHARES
(000) | | | VALUE
($000) | |
Long Positions — 98.3% | |
Common Stocks — 85.2% | |
|
Aerospace & Defense — 1.4% | |
| | |
Howmet Aerospace, Inc. * | | | 5 | | | | 150 | |
| | |
Northrop Grumman Corp. | | | 1 | | | | 337 | |
| | |
Raytheon Technologies Corp. | | | 10 | | | | 817 | |
| | | | | | | | |
| | |
| | | | | | | 1,304 | |
| | | | | | | | |
|
Air Freight & Logistics — 0.7% | |
| | |
FedEx Corp. | | | 1 | | | | 350 | |
| | |
United Parcel Service, Inc., Class B | | | 1 | | | | 276 | |
| | | | | | | | |
| | |
| | | | | | | 626 | |
| | | | | | | | |
|
Airlines — 0.1% | |
| | |
American Airlines Group, Inc. * | | | 2 | | | | 52 | |
| | | | | | | | |
|
Auto Components — 0.6% | |
| | |
Aptiv plc * | | | — | (a) | | | 49 | |
| | |
Lear Corp. | | | — | (a) | | | 68 | |
| | |
Magna International, Inc. (Canada) | | | 5 | | | | 431 | |
| | | | | | | | |
| | |
| | | | | | | 548 | |
| | | | | | | | |
|
Automobiles — 0.1% | |
| | |
General Motors Co. * | | | 1 | | | | 48 | |
| | | | | | | | |
|
Banks — 3.0% | |
| | |
Bank of America Corp. | | | 11 | | | | 457 | |
| | |
SVB Financial Group * | | | 2 | | | | 925 | |
| | |
Truist Financial Corp. | | | 8 | | | | 480 | |
| | |
Wells Fargo & Co. | | | 23 | | | | 1,045 | |
| | | | | | | | |
| | |
| | | | | | | 2,907 | |
| | | | | | | | |
|
Beverages — 0.9% | |
| | |
Coca-Cola Co. (The) | | | 4 | | | | 202 | |
| | |
Constellation Brands, Inc., Class A | | | 1 | | | | 168 | |
| | |
PepsiCo, Inc. | | | 4 | | | | 516 | |
| | | | | | | | |
| | |
| | | | | | | 886 | |
| | | | | | | | |
|
Biotechnology — 2.7% | |
| | |
AbbVie, Inc. | | | 8 | | | | 933 | |
| | |
Biogen, Inc. * | | | 2 | | | | 451 | |
| | |
BioMarin Pharmaceutical, Inc. * | | | 2 | | | | 194 | |
| | |
Regeneron Pharmaceuticals, Inc. * | | | 1 | | | | 510 | |
| | |
Vertex Pharmaceuticals, Inc. * | | | 2 | | | | 532 | |
| | | | | | | | |
| | |
| | | | | | | 2,620 | |
| | | | | | | | |
|
Building Products — 1.8% | |
| | |
Carrier Global Corp. | | | 7 | | | | 318 | |
| | |
Fortune Brands Home & Security, Inc. | | | 1 | | | | 139 | |
| | |
Johnson Controls International plc | | | 3 | | | | 186 | |
| | |
Trane Technologies plc | | | 6 | | | | 1,103 | |
| | | | | | | | |
| | |
| | | | | | | 1,746 | |
| | | | | | | | |
| | | | | | | | |
| INVESTMENTS | | SHARES
(000) | | | VALUE
($000) | |
| | | | | | | | |
| | | | | | | | |
|
Capital Markets — 2.4% | |
| | |
Ameriprise Financial, Inc. | | | — | (a) | | | 56 | |
| | |
Charles Schwab Corp. (The) | | | 10 | | | | 672 | |
| | |
CME Group, Inc. | | | 1 | | | | 202 | |
| | |
Intercontinental Exchange, Inc. | | | 2 | | | | 222 | |
| | |
Morgan Stanley | | | 5 | | | | 437 | |
| | |
State Street Corp. | | | 6 | | | | 511 | |
| | |
T. Rowe Price Group, Inc. | | | 1 | | | | 187 | |
| | | | | | | | |
| | |
| | | | | | | 2,287 | |
| | | | | | | | |
|
Chemicals — 3.8% | |
| | |
Air Products and Chemicals, Inc. (b) | | | 1 | | | | 222 | |
| | |
Celanese Corp. | | | 3 | | | | 469 | |
| | |
Corteva, Inc. | | | 3 | | | | 166 | |
| | |
DuPont de Nemours, Inc. | | | 14 | | | | 1,069 | |
| | |
Eastman Chemical Co. (b) | | | 6 | | | | 647 | |
| | |
Linde plc (United Kingdom) | | | 2 | | | | 490 | |
| | |
PPG Industries, Inc. | | | 4 | | | | 619 | |
| | | | | | | | |
| | |
| | | | | | | 3,682 | |
| | | | | | | | |
|
Consumer Finance — 1.3% | |
| | |
American Express Co. | | | 1 | | | | 182 | |
| | |
Capital One Financial Corp. (b) | | | 7 | | | | 1,092 | |
| | | | | | | | |
| | |
| | | | | | | 1,274 | |
| | | | | | | | |
|
Containers & Packaging — 0.1% | |
| | |
Crown Holdings, Inc. | | | 1 | | | | 125 | |
| | | | | | | | |
|
Diversified Financial Services — 0.2% | |
| | |
Voya Financial, Inc. | | | 3 | | | | 230 | |
| | | | | | | | |
|
Electric Utilities — 1.7% | |
| | |
Evergy, Inc. | | | 7 | | | | 435 | |
| | |
FirstEnergy Corp. | | | 21 | | | | 792 | |
| | |
NextEra Energy, Inc. | | | 4 | | | | 281 | |
| | |
Xcel Energy, Inc. (b) | | | 2 | | | | 124 | |
| | | | | | | | |
| | |
| | | | | | | 1,632 | |
| | | | | | | | |
|
Electrical Equipment — 0.8% | |
| | |
AMETEK, Inc. | | | — | (a) | | | 57 | |
| | |
Eaton Corp. plc | | | 5 | | | | 684 | |
| | | | | | | | |
| | |
| | | | | | | 741 | |
| | | | | | | | |
|
Electronic Equipment, Instruments & Components — 0.1% | |
| | |
TE Connectivity Ltd. | | | 1 | | | | 132 | |
| | | | | | | | |
|
Energy Equipment & Services — 0.5% | |
| | |
Baker Hughes Co. | | | 23 | | | | 458 | |
| | | | | | | | |
SEE NOTES TO FINANCIAL STATEMENTS.
| | | | | | | | | | |
| | | | | |
| 34 | | | | | | | | J.P. MORGAN SPECIALTY FUNDS | | |
| | | | | | | | |
| INVESTMENTS | | SHARES
(000) | | | VALUE
($000) | |
Long Positions — continued | |
Common Stocks — continued | |
|
Entertainment — 2.2% | |
| | |
Electronic Arts, Inc. | | | 6 | | | | 847 | |
| | |
Endeavor Group Holdings, Inc., Class A * | | | 22 | | | | 611 | |
| | |
Netflix, Inc. * (b) | | | 1 | | | | 655 | |
| | | | | | | | |
| | |
| | | | | | | 2,113 | |
| | | | | | | | |
|
Equity Real Estate Investment Trusts (REITs) — 2.9% | |
| | |
Brixmor Property Group, Inc. | | | 19 | | | | 432 | |
| | |
Camden Property Trust | | | 3 | | | | 354 | |
| | |
Cousins Properties, Inc. | | | 8 | | | | 308 | |
| | |
Equity LifeStyle Properties, Inc. | | | 5 | | | | 335 | |
| | |
Host Hotels & Resorts, Inc. * | | | 10 | | | | 188 | |
| | |
Invitation Homes, Inc. | | | 3 | | | | 102 | |
| | |
Kimco Realty Corp. | | | 12 | | | | 248 | |
| | |
Prologis, Inc. | | | 2 | | | | 252 | |
| | |
SBA Communications Corp. | | | — | (a) | | | 62 | |
| | |
Sun Communities, Inc. | | | — | (a) | | | 74 | |
| | |
UDR, Inc. | | | 7 | | | | 314 | |
| | |
Ventas, Inc. | | | 1 | | | | 69 | |
| | |
WP Carey, Inc. | | | 1 | | | | 82 | |
| | | | | | | | |
| | |
| | | | | | | 2,820 | |
| | | | | | | | |
|
Food Products — 0.5% | |
| | |
Hershey Co. (The) | | | 1 | | | | 176 | |
| | |
Mondelez International, Inc., Class A | | | 4 | | | | 266 | |
| | | | | | | | |
| | |
| | | | | | | 442 | |
| | | | | | | | |
|
Health Care Equipment & Supplies — 2.8% | |
| | |
Becton Dickinson and Co. | | | 2 | | | | 490 | |
| | |
Boston Scientific Corp. * | | | 10 | | | | 415 | |
| | |
Danaher Corp. | | | 1 | | | | 193 | |
| | |
Medtronic plc | | | 6 | | | | 789 | |
| | |
Teleflex, Inc. | | | — | (a) | | | 181 | |
| | |
Zimmer Biomet Holdings, Inc. | | | 3 | | | | 614 | |
| | | | | | | | |
| | |
| | | | | | | 2,682 | |
| | | | | | | | |
|
Health Care Providers & Services — 2.0% | |
| | |
Centene Corp. * | | | 8 | | | | 486 | |
| | |
Cigna Corp. (b) | | | 2 | | | | 575 | |
| | |
CVS Health Corp. | | | 7 | | | | 509 | |
| | |
UnitedHealth Group, Inc. (b) | | | 1 | | | | 392 | |
| | | | | | | | |
| | |
| | | | | | | 1,962 | |
| | | | | | | | |
|
Hotels, Restaurants & Leisure — 2.8% | |
| | |
Booking Holdings, Inc. * | | | — | (a) | | | 476 | |
| | |
Darden Restaurants, Inc. | | | 3 | | | | 424 | |
| | |
Hilton Worldwide Holdings, Inc. * | | | 1 | | | | 95 | |
| | | | | | | | |
| INVESTMENTS | | SHARES
(000) | | | VALUE
($000) | |
| |
| |
|
Hotels, Restaurants & Leisure — continued | |
| | |
Las Vegas Sands Corp. * | | | 3 | | | | 196 | |
| | |
McDonald’s Corp. | | | 3 | | | | 822 | |
| | |
Yum! Brands, Inc. (b) | | | 6 | | | | 662 | |
| | | | | | | | |
| | |
| | | | | | | 2,675 | |
| | | | | | | | |
|
Household Durables — 1.0% | |
| | |
KB Home | | | 8 | | | | 400 | |
| | |
Lennar Corp., Class A | | | 1 | | | | 126 | |
| | |
Mohawk Industries, Inc. * | | | — | (a) | | | 78 | |
| | |
Toll Brothers, Inc. | | | 5 | | | | 300 | |
| | | | | | | | |
| | |
| | | | | | | 904 | |
| | | | | | | | |
|
Household Products — 0.2% | |
| | |
Kimberly-Clark Corp. | | | — | (a) | | | 30 | |
| | |
Procter & Gamble Co. (The) | | | 1 | | | | 157 | |
| | | | | | | | |
| | |
| | | | | | | 187 | |
| | | | | | | | |
|
Industrial Conglomerates — 0.0% (c) | |
| | |
Roper Technologies, Inc. | | | — | (a) | | | 45 | |
| | | | | | | | |
|
Insurance — 1.2% | |
| | |
Chubb Ltd. | | | 1 | | | | 189 | |
| | |
Hartford Financial Services Group, Inc. (The) | | | 4 | | | | 281 | |
| | |
Lincoln National Corp. | | | 1 | | | | 66 | |
| | |
Marsh & McLennan Cos., Inc. | | | 1 | | | | 81 | |
| | |
Progressive Corp. (The) | | | 1 | | | | 74 | |
| | |
Prudential Financial, Inc. | | | 4 | | | | 384 | |
| | |
RenaissanceRe Holdings Ltd. (Bermuda) | | | — | (a) | | | 68 | |
| | | | | | | | |
| | |
| | | | | | | 1,143 | |
| | | | | | | | |
|
Interactive Media & Services — 3.3% | |
| | |
Alphabet, Inc., Class A * | | | — | (a) | | | 198 | |
| | |
Alphabet, Inc., Class C * (b) | | | 1 | | | | 1,421 | |
| | |
Facebook, Inc., Class A * | | | 4 | | | | 1,147 | |
| | |
ZoomInfo Technologies, Inc., Class A * | | | 8 | | | | 409 | |
| | | | | | | | |
| | |
| | | | | | | 3,175 | |
| | | | | | | | |
|
Internet & Direct Marketing Retail — 2.1% | |
| | |
Amazon.com, Inc. * (b) | | | — | (a) | | | 1,647 | |
| | |
DoorDash, Inc., Class A * | | | 3 | | | | 366 | |
| | | | | | | | |
| | |
| | | | | | | 2,013 | |
| | | | | | | | |
|
IT Services — 3.9% | |
| | |
Fiserv, Inc. * (b) | | | 3 | | | | 412 | |
| | |
FleetCor Technologies, Inc. * | | | 2 | | | | 702 | |
| | |
Mastercard, Inc., Class A (b) | | | 5 | | | | 1,906 | |
| | |
Shopify, Inc., Class A (Canada) * | | | — | (a) | | | 294 | |
| | |
WEX, Inc. * | | | 2 | | | | 459 | |
| | | | | | | | |
| | |
| | | | | | | 3,773 | |
| | | | | | | | |
SEE NOTES TO FINANCIAL STATEMENTS.
| | | | | | | | | | |
| | | | | |
| | J.P. MORGAN SPECIALTY FUNDS | | | | | | | | 35 |
JPMorgan Research Market Neutral Fund
SCHEDULE OF PORTFOLIO INVESTMENTS
AS OF APRIL 30, 2021 (AS RESTATED, SEE NOTE 8) (Unaudited) (continued)
| | | | | | | | |
| INVESTMENTS | | SHARES
(000) | | | VALUE
($000) | |
Long Positions — continued | |
Common Stocks — continued | |
|
Life Sciences Tools & Services — 0.4% | |
| | |
Thermo Fisher Scientific, Inc. | | | 1 | | | | 373 | |
| | | | | | | | |
|
Machinery — 3.7% | |
| | |
Deere & Co. | | | 2 | | | | 902 | |
| | |
Ingersoll Rand, Inc. * | | | 16 | | | | 786 | |
| | |
Parker-Hannifin Corp. (b) | | | 2 | | | | 602 | |
| | |
Stanley Black & Decker, Inc. (b) | | | 6 | | | | 1,242 | |
| | | | | | | | |
| | |
| | | | | | | 3,532 | |
| | | | | | | | |
|
Media — 2.7% | |
| | |
Charter Communications, Inc., Class A * | | | 1 | | | | 652 | |
| | |
Comcast Corp., Class A | | | 11 | | | | 606 | |
| | |
Discovery, Inc., Class C * | | | 42 | | | | 1,372 | |
| | | | | | | | |
| | |
| | | | | | | 2,630 | |
| | | | | | | | |
|
Metals & Mining — 0.3% | |
| | |
Freeport-McMoRan, Inc. | | | 9 | | | | 324 | |
| | | | | | | | |
|
Multiline Retail — 0.3% | |
| | |
Dollar General Corp. | | | 1 | | | | 144 | |
| | |
Dollar Tree, Inc. * | | | 1 | | | | 137 | |
| | | | | | | | |
| | |
| | | | | | | 281 | |
| | | | | | | | |
|
Multi-Utilities — 1.4% | |
| | |
CenterPoint Energy, Inc. | | | 33 | | | | 806 | |
| | |
Sempra Energy | | | 4 | | | | 500 | |
| | | | | | | | |
| | |
| | | | | | | 1,306 | |
| | | | | | | | |
|
Oil, Gas & Consumable Fuels — 5.8% | |
| | |
Cabot Oil & Gas Corp. | | | 8 | | | | 129 | |
| | |
Cheniere Energy, Inc. * | | | 8 | | | | 649 | |
| | |
Cimarex Energy Co. | | | 4 | | | | 236 | |
| | |
ConocoPhillips | | | 17 | | | | 872 | |
| | |
Diamondback Energy, Inc. | | | 24 | | | | 1,985 | |
| | |
EOG Resources, Inc. | | | 3 | | | | 198 | |
| | |
Pioneer Natural Resources Co. (b) | | | 6 | | | | 989 | |
| | |
TC Energy Corp. (Canada) | | | 4 | | | | 190 | |
| | |
Williams Cos., Inc. (The) | | | 11 | | | | 277 | |
| | | | | | | | |
| | |
| | | | | | | 5,525 | |
| | | | | | | | |
|
Personal Products — 0.9% | |
| | |
Estee Lauder Cos., Inc. (The), Class A | | | 3 | | | | 820 | |
| | | | | | | | |
|
Pharmaceuticals — 1.1% | |
| | |
Bristol-Myers Squibb Co. | | | 9 | | | | 561 | |
| | |
Elanco Animal Health, Inc. * | | | 4 | | | | 139 | |
| | |
Eli Lilly & Co. | | | 2 | | | | 373 | |
| | | | | | | | |
| | |
| | | | | | | 1,073 | |
| | | | | | | | |
| | | | | | | | |
| INVESTMENTS | | SHARES
(000) | | | VALUE
($000) | |
| |
| |
|
Professional Services — 1.6% | |
| | |
Booz Allen Hamilton Holding Corp. | | | 3 | | | | 262 | |
| | |
IHS Markit Ltd. | | | 6 | | | | 658 | |
| | |
Leidos Holdings, Inc. (b) | | | 7 | | | | 685 | |
| | | | | | | | |
| | |
| | | | | | | 1,605 | |
| | | | | | | | |
|
Road & Rail — 4.3% | |
| | |
Canadian Pacific Railway Ltd. (Canada) | | | 1 | | | | 282 | |
| | |
CSX Corp. | | | 5 | | | | 523 | |
| | |
Lyft, Inc., Class A * | | | 24 | | | | 1,324 | |
| | |
Norfolk Southern Corp. (b) | | | 4 | | | | 995 | |
| | |
Old Dominion Freight Line, Inc. | | | 1 | | | | 381 | |
| | |
Uber Technologies, Inc. * (b) | | | 6 | | | | 318 | |
| | |
Union Pacific Corp. | | | 1 | | | | 265 | |
| | | | | | | | |
| | |
| | | | | | | 4,088 | |
| | | | | | | | |
|
Semiconductors & Semiconductor Equipment — 5.2% | |
| | |
Advanced Micro Devices, Inc. * (b) | | | 7 | | | | 605 | |
| | |
Analog Devices, Inc. (b) | | | 5 | | | | 752 | |
| | |
Applied Materials, Inc. | | | 1 | | | | 143 | |
| | |
Lam Research Corp. (b) | | | 1 | | | | 656 | |
| | |
Marvell Technology, Inc. | | | 6 | | | | 288 | |
| | |
Microchip Technology, Inc. | | | 1 | | | | 137 | |
| | |
Micron Technology, Inc. * | | | 8 | | | | 730 | |
| | |
NXP Semiconductors NV (Netherlands) | | | 5 | | | | 1,052 | |
| | |
ON Semiconductor Corp. * | | | 6 | | | | 242 | |
| | |
Taiwan Semiconductor Manufacturing Co. Ltd., ADR (Taiwan) | | | 1 | | | | 96 | |
| | |
Texas Instruments, Inc. | | | 2 | | | | 284 | |
| | | | | | | | |
| | |
| | | | | | | 4,985 | |
| | | | | | | | |
|
Software — 3.2% | |
| | |
Ceridian HCM Holding, Inc. * | | | 11 | | | | 1,084 | |
| | |
Coupa Software, Inc. * | | | 1 | | | | 264 | |
| | |
Intuit, Inc. (b) | | | 1 | | | | 538 | |
| | |
Microsoft Corp. (b) | | | 3 | | | | 794 | |
| | |
Paylocity Holding Corp. * | | | — | (a) | | | 78 | |
| | |
Workday, Inc., Class A * | | | 1 | | | | 320 | |
| | | | | | | | |
| | |
| | | | | | | 3,078 | |
| | | | | | | | |
|
Specialty Retail — 3.7% | |
| | |
AutoZone, Inc. * | | | — | (a) | | | 647 | |
| | |
Best Buy Co., Inc. | | | 2 | | | | 283 | |
| | |
Burlington Stores, Inc. * | | | 1 | | | | 305 | |
| | |
Home Depot, Inc. (The) | | | 1 | | | | 207 | |
| | |
Lowe’s Cos., Inc. (b) | | | 6 | | | | 1,082 | |
SEE NOTES TO FINANCIAL STATEMENTS.
| | | | | | | | | | |
| | | | | |
| 36 | | | | | | | | J.P. MORGAN SPECIALTY FUNDS | | |
| | | | | | | | |
| INVESTMENTS | | SHARES
(000) | | | VALUE
($000) | |
Long Positions — continued | |
Common Stocks — continued | |
|
Specialty Retail — continued | |
| | |
O’Reilly Automotive, Inc. * (b) | | | 2 | | | | 952 | |
| | |
Ross Stores, Inc. | | | — | (a) | | | 26 | |
| | |
TJX Cos., Inc. (The) | | | — | (a) | | | 34 | |
| | | | | | | | |
| | |
| | | | | | | 3,536 | |
| | | | | | | | |
|
Technology Hardware, Storage & Peripherals — 2.0% | |
| | |
Hewlett Packard Enterprise Co. | | | 39 | | | | 632 | |
| | |
Seagate Technology plc | | | 14 | | | | 1,282 | |
| | | | | | | | |
| | |
| | | | | | | 1,914 | |
| | | | | | | | |
|
Textiles, Apparel & Luxury Goods — 0.7% | |
| | |
Carter’s, Inc. * | | | 1 | | | | 130 | |
| | |
NIKE, Inc., Class B | | | 4 | | | | 578 | |
| | | | | | | | |
| | |
| | | | | | | 708 | |
| | | | | | | | |
|
Wireless Telecommunication Services — 0.8% | |
| | |
T-Mobile US, Inc. * (b) | | | 5 | | | | 724 | |
| | | | | | | | |
| |
Total Common Stocks
(Cost $54,766) | | | | 81,734 | |
| | | | | |
Short-Term Investments — 13.1% | |
|
Investment Companies — 13.1% | |
| | |
JPMorgan Prime Money Market Fund Class Institutional Shares, 0.07% (d) (e)
(Cost $12,593) | | | 12,590 | | | | 12,596 | |
| | | | | | | | |
| |
Total Long Positions
(Cost $67,359) | | | | 94,330 | |
| | | | | |
Short Positions — (74.4)% | |
|
Common Stocks — (74.4)% | |
|
Aerospace & Defense — (1.7)% | |
| | |
Boeing Co. (The) * | | | (2 | ) | | | (396 | ) |
| | |
HEICO Corp. | | | (1 | ) | | | (202 | ) |
| | |
Hexcel Corp. * | | | (2 | ) | | | (109 | ) |
| | |
Huntington Ingalls Industries, Inc. | | | (2 | ) | | | (480 | ) |
| | |
L3Harris Technologies, Inc. | | | (1 | ) | | | (116 | ) |
| | |
Lockheed Martin Corp. | | | — | (a) | | | (110 | ) |
| | |
Textron, Inc. | | | (5 | ) | | | (299 | ) |
| | | | | | | | |
| | |
| | | | | | | (1,712 | ) |
| | | | | | | | |
|
Air Freight & Logistics — (0.7)% | |
| | |
CH Robinson Worldwide, Inc. | | | (3 | ) | | | (288 | ) |
| | |
Expeditors International of Washington, Inc. | | | (3 | ) | | | (357 | ) |
| | | | | | | | |
| | |
| | | | | | | (645 | ) |
| | | | | | | | |
|
Airlines — (0.1)% | |
| | |
United Airlines Holdings, Inc. * | | | (1 | ) | | | (51 | ) |
| | | | | | | | |
| | | | | | | | |
| INVESTMENTS | | SHARES
(000) | | | VALUE
($000) | |
| | | | | | | | |
| | | | | | | | |
|
Auto Components — (0.4)% | |
| | |
Autoliv, Inc. (Sweden) * | | | (4 | ) | | | (380 | ) |
| | | | | | | | |
|
Automobiles — (0.2)% | |
| | |
Ford Motor Co. * | | | (5 | ) | | | (60 | ) |
| | |
Harley-Davidson, Inc. | | | (2 | ) | | | (93 | ) |
| | | | | | | | |
| | |
| | | | | | | (153 | ) |
| | | | | | | | |
|
Banks — (3.1)% | |
| | |
Associated Banc-Corp. | | | (3 | ) | | | (66 | ) |
| | |
Citizens Financial Group, Inc. | | | (8 | ) | | | (371 | ) |
| | |
First Republic Bank | | | (2 | ) | | | (395 | ) |
| | |
Huntington Bancshares, Inc. | | | (35 | ) | | | (529 | ) |
| | |
KeyCorp | | | (23 | ) | | | (491 | ) |
| | |
PNC Financial Services Group, Inc. (The) | | | (5 | ) | | | (887 | ) |
| | |
US Bancorp | | | (5 | ) | | | (290 | ) |
| | | | | | | | |
| | |
| | | | | | | (3,029 | ) |
| | | | | | | | |
|
Beverages — (0.1)% | |
| | |
Brown-Forman Corp., Class B | | | (1 | ) | | | (64 | ) |
| | | | | | | | |
|
Biotechnology — (2.3)% | |
| | |
Amgen, Inc. | | | (5 | ) | | | (1,189 | ) |
| | |
Gilead Sciences, Inc. | | | (15 | ) | | | (971 | ) |
| | | | | | | | |
| | |
| | | | | | | (2,160 | ) |
| | | | | | | | |
|
Building Products — (0.3)% | |
| | |
Lennox International, Inc. | | | (1 | ) | | | (187 | ) |
| | |
Masco Corp. | | | (1 | ) | | | (66 | ) |
| | | | | | | | |
| | |
| | | | | | | (253 | ) |
| | | | | | | | |
|
Capital Markets — (3.8)% | |
| | |
BlackRock, Inc. | | | (1 | ) | | | (800 | ) |
| | |
Franklin Resources, Inc. | | | (7 | ) | | | (197 | ) |
| | |
Moody’s Corp. | | | (2 | ) | | | (775 | ) |
| | |
MSCI, Inc. | | | (1 | ) | | | (713 | ) |
| | |
Nasdaq, Inc. | | | (3 | ) | | | (504 | ) |
| | |
Northern Trust Corp. | | | (6 | ) | | | (668 | ) |
| | | | | | | | |
| | |
| | | | | | | (3,657 | ) |
| | | | | | | | |
|
Chemicals — (0.8)% | |
| | |
Albemarle Corp. | | | — | (a) | | | (52 | ) |
| | |
Dow, Inc. | | | (4 | ) | | | (281 | ) |
| | |
Ecolab, Inc. | | | — | (a) | | | (85 | ) |
| | |
RPM International, Inc. | | | (3 | ) | | | (284 | ) |
| | |
Sherwin-Williams Co. (The) | | | — | (a) | | | (111 | ) |
| | | | | | | | |
| | |
| | | | | | | (813 | ) |
| | | | | | | | |
|
Commercial Services & Supplies — (0.6)% | |
| | |
Republic Services, Inc. | | | (5 | ) | | | (531 | ) |
| | | | | | | | |
SEE NOTES TO FINANCIAL STATEMENTS.
| | | | | | | | | | |
| | | | | |
| | J.P. MORGAN SPECIALTY FUNDS | | | | | | | | 37 |
JPMorgan Research Market Neutral Fund
SCHEDULE OF PORTFOLIO INVESTMENTS
AS OF APRIL 30, 2021 (AS RESTATED, SEE NOTE 8) (Unaudited) (continued)
| | | | | | | | |
| INVESTMENTS | | SHARES
(000) | | | VALUE
($000) | |
Short Positions — continued | |
Common Stocks — continued | |
|
Construction Materials — (0.1)% | |
| | |
Martin Marietta Materials, Inc. | | | — | (a) | | | (92 | ) |
| | |
Vulcan Materials Co. | | | — | (a) | | | (37 | ) |
| | | | | | | | |
| | |
| | | | | | | (129 | ) |
| | | | | | | | |
|
Consumer Finance — (0.3)% | |
| | |
Discover Financial Services | | | (3 | ) | | | (302 | ) |
| | | | | | | | |
|
Containers & Packaging — (2.4)% | |
| | |
Avery Dennison Corp. | | | — | (a) | | | (60 | ) |
| | |
Ball Corp. | | | (3 | ) | | | (312 | ) |
| | |
International Paper Co. | | | (14 | ) | | | (783 | ) |
| | |
Packaging Corp. of America | | | (1 | ) | | | (89 | ) |
| | |
Sealed Air Corp. | | | (6 | ) | | | (275 | ) |
| | |
Silgan Holdings, Inc. | | | (6 | ) | | | (258 | ) |
| | |
Sonoco Products Co. | | | (8 | ) | | | (519 | ) |
| | | | | | | | |
| | |
| | | | | | | (2,296 | ) |
| | | | | | | | |
|
Diversified Telecommunication Services — (2.0)% | |
| | |
AT&T, Inc. | | | (29 | ) | | | (922 | ) |
| | |
Lumen Technologies, Inc. | | | (44 | ) | | | (568 | ) |
| | |
Verizon Communications, Inc. | | | (6 | ) | | | (372 | ) |
| | | | | | | | |
| | |
| | | | | | | (1,862 | ) |
| | | | | | | | |
|
Electric Utilities — (1.4)% | |
| | |
American Electric Power Co., Inc. | | | (7 | ) | | | (617 | ) |
| | |
Southern Co. (The) | | | (11 | ) | | | (698 | ) |
| | | | | | | | |
| | |
| | | | | | | (1,315 | ) |
| | | | | | | | |
|
Electrical Equipment — (1.5)% | |
| | |
Acuity Brands, Inc. | | | (6 | ) | | | (1,033 | ) |
| | |
Hubbell, Inc. | | | (2 | ) | | | (291 | ) |
| | |
Rockwell Automation, Inc. | | | — | (a) | | | (94 | ) |
| | | | | | | | |
| | |
| | | | | | | (1,418 | ) |
| | | | | | | | |
|
Electronic Equipment, Instruments & Components — (0.2)% | |
| | |
Cognex Corp. | | | (2 | ) | | | (194 | ) |
| | | | | | | | |
|
Energy Equipment & Services — (1.0)% | |
| | |
Halliburton Co. | | | (32 | ) | | | (633 | ) |
| | |
Schlumberger NV | | | (11 | ) | | | (294 | ) |
| | | | | | | | |
| | |
| | | | | | | (927 | ) |
| | | | | | | | |
|
Entertainment — (3.0)% | |
| | |
AMC Entertainment Holdings, Inc., Class A * | | | (42 | ) | | | (426 | ) |
| | |
Spotify Technology SA * | | | (4 | ) | | | (971 | ) |
| | |
Take-Two Interactive Software, Inc. * | | | (8 | ) | | | (1,490 | ) |
| | | | | | | | |
| | |
| | | | | | | (2,887 | ) |
| | | | | | | | |
| | | | | | | | |
| INVESTMENTS | | SHARES
(000) | | | VALUE
($000) | |
| |
| |
|
Equity Real Estate Investment Trusts (REITs) — (3.6)% | |
| | |
AvalonBay Communities, Inc. | | | (1 | ) | | | (239 | ) |
| | |
Crown Castle International Corp. | | | (1 | ) | | | (281 | ) |
| | |
Duke Realty Corp. | | | (5 | ) | | | (243 | ) |
| | |
Equity Residential | | | (5 | ) | | | (351 | ) |
| | |
Iron Mountain, Inc. | | | (20 | ) | | | (790 | ) |
| | |
National Retail Properties, Inc. | | | (10 | ) | | | (459 | ) |
| | |
Simon Property Group, Inc. | | | (6 | ) | | | (756 | ) |
| | |
SL Green Realty Corp. | | | (4 | ) | | | (271 | ) |
| | |
Vornado Realty Trust | | | (2 | ) | | | (108 | ) |
| | | | | | | | |
| | |
| | | | | | | (3,498 | ) |
| | | | | | | | |
|
Food & Staples Retailing — (4.8)% | |
| | |
Costco Wholesale Corp. | | | (1 | ) | | | (262 | ) |
| | |
Kroger Co. (The) | | | (47 | ) | | | (1,710 | ) |
| | |
Sysco Corp. | | | (3 | ) | | | (223 | ) |
| | |
Walgreens Boots Alliance, Inc. | | | (18 | ) | | | (941 | ) |
| | |
Walmart, Inc. | | | (11 | ) | | | (1,493 | ) |
| | | | | | | | |
| | |
| | | | | | | (4,629 | ) |
| | | | | | | | |
|
Food Products — (1.7)% | |
| | |
Campbell Soup Co. | | | (8 | ) | | | (385 | ) |
| | |
Conagra Brands, Inc. | | | (8 | ) | | | (309 | ) |
| | |
General Mills, Inc. | | | (5 | ) | | | (317 | ) |
| | |
Kellogg Co. | | | (10 | ) | | | (615 | ) |
| | | | | | | | |
| | |
| | | | | | | (1,626 | ) |
| | | | | | | | |
|
Gas Utilities — (0.1)% | |
| | |
National Fuel Gas Co. | | | (2 | ) | | | (124 | ) |
| | | | | | | | |
|
Health Care Equipment & Supplies — (1.8)% | |
| | |
Abbott Laboratories | | | (4 | ) | | | (485 | ) |
| | |
Baxter International, Inc. | | | (4 | ) | | | (372 | ) |
| | |
Stryker Corp. | | | (3 | ) | | | (905 | ) |
| | | | | | | | |
| | |
| | | | | | | (1,762 | ) |
| | | | | | | | |
|
Health Care Providers & Services — (0.2)% | |
| | |
Henry Schein, Inc. * | | | (3 | ) | | | (208 | ) |
| | | | | | | | |
|
Health Care Technology — (0.4)% | |
| | |
Cerner Corp. | | | (5 | ) | | | (392 | ) |
| | | | | | | | |
|
Hotels, Restaurants & Leisure — (0.8)% | |
| | |
Chipotle Mexican Grill, Inc. * | | | — | (a) | | | (194 | ) |
| | |
Marriott International, Inc., Class A * | | | (1 | ) | | | (82 | ) |
| | |
Starbucks Corp. | | | (4 | ) | | | (475 | ) |
| | | | | | | | |
| | |
| | | | | | | (751 | ) |
| | | | | | | | |
SEE NOTES TO FINANCIAL STATEMENTS.
| | | | | | | | | | |
| | | | | |
| 38 | | | | | | | | J.P. MORGAN SPECIALTY FUNDS | | |
| | | | | | | | |
| INVESTMENTS | | SHARES
(000) | | | VALUE
($000) | |
Short Positions — continued | |
Common Stocks — continued | |
|
Household Durables — (0.4)% | |
| | |
NVR, Inc. * | | | — | (a) | | | (135 | ) |
| | |
PulteGroup, Inc. | | | (4 | ) | | | (228 | ) |
| | | | | | | | |
| | |
| | | | | | | (363 | ) |
| | | | | | | | |
|
Household Products — (1.4)% | |
| | |
Clorox Co. (The) | | | (6 | ) | | | (1,016 | ) |
| | |
Colgate-Palmolive Co. | | | (4 | ) | | | (305 | ) |
| | | | | | | | |
| | |
| | | | | | | (1,321 | ) |
| | | | | | | | |
|
Industrial Conglomerates — (2.3)% | |
| | |
3M Co. | | | (6 | ) | | | (1,090 | ) |
| | |
General Electric Co. | | | (83 | ) | | | (1,089 | ) |
| | | | | | | | |
| | |
| | | | | | | (2,179 | ) |
| | | | | | | | |
|
Insurance — (1.7)% | |
| | |
Aflac, Inc. | | | (4 | ) | | | (232 | ) |
| | |
Allstate Corp. (The) | | | (5 | ) | | | (614 | ) |
| | |
Axis Capital Holdings Ltd. | | | (2 | ) | | | (121 | ) |
| | |
Globe Life, Inc. | | | (1 | ) | | | (91 | ) |
| | |
MetLife, Inc. | | | (2 | ) | | | (107 | ) |
| | |
Travelers Cos., Inc. (The) | | | (3 | ) | | | (428 | ) |
| | | | | | | | |
| | |
| | | | | | | (1,593 | ) |
| | | | | | | | |
|
Internet & Direct Marketing Retail — (0.2)% | |
| | |
eBay, Inc. | | | (3 | ) | | | (156 | ) |
| | | | | | | | |
|
IT Services — (3.0)% | |
| | |
Automatic Data Processing, Inc. | | | — | (a) | | | (87 | ) |
| | |
Cognizant Technology Solutions Corp., Class A | | | (3 | ) | | | (268 | ) |
| | |
EPAM Systems, Inc. * | | | — | (a) | | | (130 | ) |
| | |
Global Payments, Inc. | | | (1 | ) | | | (225 | ) |
| | |
Infosys Ltd., ADR (India) | | | (16 | ) | | | (296 | ) |
| | |
International Business Machines Corp. | | | (1 | ) | | | (151 | ) |
| | |
Paychex, Inc. | | | (6 | ) | | | (605 | ) |
| | |
PayPal Holdings, Inc. * | | | (1 | ) | | | (142 | ) |
| | |
Snowflake, Inc., Class A * | | | (1 | ) | | | (276 | ) |
| | |
Western Union Co. (The) | | | (28 | ) | | | (719 | ) |
| | | | | | | | |
| | |
| | | | | | | (2,899 | ) |
| | | | | | | | |
|
Life Sciences Tools & Services — (0.3)% | |
| | |
Agilent Technologies, Inc. | | | (2 | ) | | | (311 | ) |
| | | | | | | | |
|
Machinery — (1.9)% | |
| | |
Caterpillar, Inc. | | | (3 | ) | | | (742 | ) |
| | |
Illinois Tool Works, Inc. | | | (3 | ) | | | (706 | ) |
| | |
PACCAR, Inc. | | | (4 | ) | | | (359 | ) |
| | | | | | | | |
| | |
| | | | | | | (1,807 | ) |
| | | | | | | | |
| | | | | | | | |
| INVESTMENTS | | SHARES
(000) | | | VALUE
($000) | |
| |
| |
|
Media — (4.8)% | |
| | |
Discovery, Inc., Class A * | | | (38 | ) | | | (1,448 | ) |
| | |
Interpublic Group of Cos., Inc. (The) | | | (39 | ) | | | (1,226 | ) |
| | |
Omnicom Group, Inc. | | | (12 | ) | | | (982 | ) |
| | |
ViacomCBS, Inc. | | | (22 | ) | | | (921 | ) |
| | | | | | | | |
| | |
| | | | | | | (4,577 | ) |
| | | | | | | | |
|
Multiline Retail — (0.9)% | |
| | |
Macy’s, Inc. * | | | (38 | ) | | | (636 | ) |
| | |
Nordstrom, Inc. * | | | (5 | ) | | | (193 | ) |
| | | | | | | | |
| | |
| | | | | | | (829 | ) |
| | | | | | | | |
|
Multi-Utilities — (1.6)% | |
| | |
Consolidated Edison, Inc. | | | (12 | ) | | | (944 | ) |
| | |
Dominion Energy, Inc. | | | (7 | ) | | | (575 | ) |
| | | | | | | | |
| | |
| | | | | | | (1,519 | ) |
| | | | | | | | |
|
Oil, Gas & Consumable Fuels — (4.7)% | |
| | |
APA Corp. | | | (9 | ) | | | (189 | ) |
| | |
Devon Energy Corp. | | | (25 | ) | | | (580 | ) |
| | |
Enbridge, Inc. (Canada) | | | (33 | ) | | | (1,290 | ) |
| | |
Exxon Mobil Corp. | | | (18 | ) | | | (1,056 | ) |
| | |
Hess Corp. | | | (11 | ) | | | (855 | ) |
| | |
HollyFrontier Corp. | | | (5 | ) | | | (160 | ) |
| | |
Marathon Oil Corp. | | | (35 | ) | | | (392 | ) |
| | | | | | | | |
| | |
| | | | | | | (4,522 | ) |
| | | | | | | | |
|
Paper & Forest Products — (0.3)% | |
| | |
Domtar Corp. * | | | (7 | ) | | | (294 | ) |
| | | | | | | | |
|
Personal Products — (0.1)% | |
| | |
Coty, Inc., Class A * | | | (13 | ) | | | (132 | ) |
| | | | | | | | |
|
Pharmaceuticals — (1.6)% | |
| | |
Johnson & Johnson | | | (4 | ) | | | (586 | ) |
| | |
Pfizer, Inc. | | | (24 | ) | | | (917 | ) |
| | |
Viatris, Inc. * | | | (1 | ) | | | (10 | ) |
| | | | | | | | |
| | |
| | | | | | | (1,513 | ) |
| | | | | | | | |
|
Professional Services — (0.4)% | |
| | |
TransUnion | | | (4 | ) | | | (398 | ) |
| | | | | | | | |
|
Road & Rail — (1.3)% | |
| | |
Canadian National Railway Co. (Canada) | | | (2 | ) | | | (226 | ) |
| | |
Heartland Express, Inc. | | | (16 | ) | | | (299 | ) |
| | |
JB Hunt Transport Services, Inc. | | | (2 | ) | | | (358 | ) |
| | |
Werner Enterprises, Inc. | | | (9 | ) | | | (394 | ) |
| | | | | | | | |
| | |
| | | | | | | (1,277 | ) |
| | | | | | | | |
SEE NOTES TO FINANCIAL STATEMENTS.
| | | | | | | | | | |
| | | | | |
| | J.P. MORGAN SPECIALTY FUNDS | | | | | | | | 39 |
JPMorgan Research Market Neutral Fund
SCHEDULE OF PORTFOLIO INVESTMENTS
AS OF APRIL 30, 2021 (AS RESTATED, SEE NOTE 8) (Unaudited) (continued)
| | | | | | | | |
| INVESTMENTS | | SHARES
(000) | | | VALUE
($000) | |
Short Positions — continued | |
Common Stocks — continued | |
|
Semiconductors & Semiconductor Equipment — (3.3)% | |
| | |
Broadcom, Inc. | | | (2 | ) | | | (1,047 | ) |
| | |
Intel Corp. | | | (24 | ) | | | (1,377 | ) |
| | |
QUALCOMM, Inc. | | | (6 | ) | | | (786 | ) |
| | | | | | | | |
| | |
| | | | | | | (3,210 | ) |
| | | | | | | | |
|
Software — (0.9)% | |
| | |
Adobe, Inc. * | | | (1 | ) | | | (259 | ) |
| | |
Anaplan, Inc. * | | | (2 | ) | | | (96 | ) |
| | |
Citrix Systems, Inc. | | | (2 | ) | | | (206 | ) |
| | |
Palantir Technologies, Inc., Class A * | | | (9 | ) | | | (203 | ) |
| | |
VMware, Inc., Class A * | | | (1 | ) | | | (143 | ) |
| | | | | | | | |
| | |
| | | | | | | (907 | ) |
| | | | | | | | |
|
Specialty Retail — (0.2)% | |
| | |
Ulta Beauty, Inc. * | | | — | (a) | | | (51 | ) |
| | |
Williams-Sonoma, Inc. | | | (1 | ) | | | (183 | ) |
| | | | | | | | |
| | |
| | | | | | | (234 | ) |
| | | | | | | | |
|
Technology Hardware, Storage & Peripherals — (2.9)% | |
| | |
Apple, Inc. | | | (8 | ) | | | (1,052 | ) |
| | |
HP, Inc. | | | (33 | ) | | | (1,125 | ) |
| | |
Western Digital Corp. * | | | (7 | ) | | | (514 | ) |
| | |
Xerox Holdings Corp. | | | (4 | ) | | | (95 | ) |
| | | | | | | | |
| | |
| | | | | | | (2,786 | ) |
| | | | | | | | |
|
Textiles, Apparel & Luxury Goods — (0.2)% | |
| | |
Lululemon Athletica, Inc. * | | | — | (a) | | | (44 | ) |
| | |
VF Corp. | | | (1 | ) | | | (120 | ) |
| | | | | | | | |
| | |
| | | | | | | (164 | ) |
| | | | | | | | |
| | | | | | | | |
| INVESTMENTS | | SHARES
(000) | | | VALUE
($000) | |
| |
| |
|
Trading Companies & Distributors — (0.3)% | |
| | |
Fastenal Co. | | | (6 | ) | | | (288 | ) |
| | | | | | | | |
|
Water Utilities — (0.3)% | |
| | |
Essential Utilities, Inc. | | | (6 | ) | | | (306 | ) |
| | | | | | | | |
| |
Total Common Stocks
(Proceeds $(65,774)) | | | | (71,353 | ) |
| | | | | |
| |
Total Short Positions
(Proceeds $(65,774)) | | | | (71,353 | ) |
| | | | | |
Total Investments — 23.9%
(Cost $1,585) | | | | 22,977 | |
Other Assets Less Liabilities — 72.1% | | | | 69,176 | |
| | | | | |
Net Assets — 96.0% | | | | 92,153 | |
| | | | | |
Future share reacquisition adjustment — 4.0% | | | | | | | 3,824 | |
| | | | | | | | |
Net assets after future share reacquisition adjustment — 100% | | | | | | $ | 95,977 | |
| | | | | | | | |
Percentages indicated are based on net assets.
| | |
Abbreviations |
| ADR | | American Depositary Receipt |
| |
| (a) | | Amount rounds to less than one thousand. |
| (b) | | All or a portion of this security is segregated as collateral for short sales. The total value of securities and cash segregated as collateral is $18,431 and $71,488 respectively. |
| (c) | | Amount rounds to less than 0.1% of net assets. |
| (d) | | Investment in an affiliated fund, which is registered under the Investment Company Act of 1940, as amended, and is advised by J.P. Morgan Investment Management Inc. |
| (e) | | The rate shown is the current yield as of April 30, 2021. |
| * | | Non-income producing security. |
| | | | | | | | | | | | | | | | | | |
| Futures contracts outstanding as of April 30, 2021 (amounts in thousands, except number of contracts): | |
| DESCRIPTION | | NUMBER OF
CONTRACTS | | | EXPIRATION
DATE | | | TRADING
CURRENCY | | NOTIONAL
AMOUNT ($) | | | VALUE AND
UNREALIZED
APPRECIATION
(DEPRECIATION) ($) | |
Short Contracts | |
S&P 500 E-Mini Index | | | (10 | ) | | | 06/2021 | | | USD | | | (2,087 | ) | | | 3 | |
| | | | | | | | | | | | | | | | | | |
| | |
Abbreviations |
| USD | | United States Dollar |
SEE NOTES TO FINANCIAL STATEMENTS.
| | | | | | | | | | |
| | | | | |
| 40 | | | | | | | | J.P. MORGAN SPECIALTY FUNDS | | |
JPMorgan Research Market Neutral Fund
SCHEDULE OF PORTFOLIO INVESTMENTS
AS OF APRIL 30, 2020 (AS RESTATED, SEE NOTE 8) (Unaudited)
| | | | | | | | |
| INVESTMENTS | | SHARES
(000) | | | VALUE
($000) | |
| | | | | | | | |
Long Positions — 91.9% | |
Common Stocks — 74.9% | |
|
Aerospace & Defense — 1.7% | |
| | |
Northrop Grumman Corp. | | | 3 | | | | 1,021 | |
| | |
Raytheon Technologies Corp. | | | 6 | | | | 398 | |
| | | | | | | | |
| | |
| | | | | | | 1,419 | |
| | | | | | | | |
|
Auto Components — 0.2% | |
| | |
Magna International, Inc. (Canada) | | | 4 | | | | 169 | |
| | | | | | | | |
|
Banks — 3.1% | |
| | |
Citigroup, Inc. | | | 23 | | | | 1,135 | |
| | |
East West Bancorp, Inc. | | | 9 | | | | 299 | |
| | |
First Horizon National Corp. | | | 13 | | | | 118 | |
| | |
First Republic Bank | | | 3 | | | | 303 | |
| | |
SVB Financial Group * | | | 2 | | | | 366 | |
| | |
Truist Financial Corp. | | | 9 | | | | 340 | |
| | | | | | | | |
| | |
| | | | | | | 2,561 | |
| | | | | | | | |
|
Beverages — 0.9% | |
| | |
Coca-Cola Co. (The) | | | 4 | | | | 194 | |
| | |
PepsiCo, Inc. | | | 4 | | | | 544 | |
| | | | | | | | |
| | |
| | | | | | | 738 | |
| | | | | | | | |
|
Biotechnology — 1.5% | |
| | |
AbbVie, Inc. (a) | | | 8 | | | | 618 | |
| | |
Alexion Pharmaceuticals, Inc. * | | | 1 | | | | 143 | |
| | |
Amgen, Inc. | | | — | (b) | | | 118 | |
| | |
Biogen, Inc. * | | | 1 | | | | 199 | |
| | |
Regeneron Pharmaceuticals, Inc. * | | | — | (b) | | | 178 | |
| | | | | | | | |
| | |
| | | | | | | 1,256 | |
| | | | | | | | |
|
Building Products — 1.3% | |
| | |
Carrier Global Corp. * | | | 7 | | | | 129 | |
| | |
Masco Corp. | | | 6 | | | | 266 | |
| | |
Trane Technologies plc | | | 8 | | | | 713 | |
| | | | | | | | |
| | |
| | | | | | | 1,108 | |
| | | | | | | | |
|
Capital Markets — 3.0% | |
| | |
Ameriprise Financial, Inc. | | | 2 | | | | 269 | |
| | |
BlackRock, Inc. | | | — | (b) | | | 136 | |
| | |
Charles Schwab Corp. (The) | | | 4 | | | | 162 | |
| | |
Intercontinental Exchange, Inc. | | | 2 | | | | 200 | |
| | |
Morgan Stanley | | | 24 | | | | 939 | |
| | |
State Street Corp. | | | 10 | | | | 635 | |
| | |
T. Rowe Price Group, Inc. | | | 2 | | | | 175 | |
| | | | | | | | |
| | |
| | | | | | | 2,516 | |
| | | | | | | | |
|
Chemicals — 4.6% | |
| | |
Air Products & Chemicals, Inc. (a) | | | 3 | | | | 775 | |
| | |
Celanese Corp. | | | 7 | | | | 577 | |
| | | | | | | | |
| INVESTMENTS | | SHARES
(000) | | | VALUE
($000) | |
| | | | | | | | |
| | | | | | | | |
| | | | | | | | |
|
Chemicals — continued | |
| | |
Eastman Chemical Co. | | | 11 | | | | 647 | |
| | |
FMC Corp. | | | 5 | | | | 446 | |
| | |
Linde plc (United Kingdom) | | | 8 | | | | 1,409 | |
| | | | | | | | |
| | |
| | | | | | | 3,854 | |
| | | | | | | | |
|
Commercial Services & Supplies — 0.2% | |
| | |
Waste Management, Inc. | | | 2 | | | | 196 | |
| | | | | | | | |
|
Consumer Finance — 0.7% | |
| | |
American Express Co. | | | 6 | | | | 587 | |
| | | | | | | | |
|
Diversified Telecommunication Services — 0.1% | |
| | |
Verizon Communications, Inc. | | | 2 | | | | 107 | |
| | | | | | | | |
|
Electric Utilities — 3.0% | |
| | |
Entergy Corp. | | | 3 | | | | 284 | |
| | |
Evergy, Inc. | | | 8 | | | | 480 | |
| | |
NextEra Energy, Inc. (a) | | | 5 | | | | 1,054 | |
| | |
Xcel Energy, Inc. (a) | | | 11 | | | | 684 | |
| | | | | | | | |
| | |
| | | | | | | 2,502 | |
| | | | | | | | |
|
Electrical Equipment — 0.9% | |
| | |
AMETEK, Inc. | | | 3 | | | | 269 | |
| | |
Eaton Corp. plc | | | 6 | | | | 491 | |
| | | | | | | | |
| | |
| | | | | | | 760 | |
| | | | | | | | |
|
Electronic Equipment, Instruments & Components — 0.3% | |
| | |
Amphenol Corp., Class A | | | 3 | | | | 278 | |
| | | | | | | | |
|
Entertainment — 0.8% | |
| | |
Electronic Arts, Inc. * | | | 1 | | | | 110 | |
| | |
Netflix, Inc. * | | | 1 | | | | 580 | |
| | | | | | | | |
| | |
| | | | | | | 690 | |
| | | | | | | | |
|
Equity Real Estate Investment Trusts (REITs) — 2.7% | |
| | |
Equinix, Inc. | | | 1 | | | | 375 | |
| | |
Equity LifeStyle Properties, Inc. | | | 4 | | | | 228 | |
| | |
Prologis, Inc. | | | 11 | | | | 963 | |
| | |
Realty Income Corp. | | | 2 | | | | 87 | |
| | |
SBA Communications Corp. | | | 2 | | | | 441 | |
| | |
Ventas, Inc. | | | 5 | | | | 158 | |
| | | | | | | | |
| | |
| | | | | | | 2,252 | |
| | | | | | | | |
|
Food & Staples Retailing — 0.3% | |
| | |
Costco Wholesale Corp. | | | 1 | | | | 205 | |
| | | | | | | | |
|
Food Products — 0.2% | |
| | |
Mondelez International, Inc., Class A | | | 3 | | | | 143 | |
| | | | | | | | |
|
Health Care Equipment & Supplies — 2.1% | |
| | |
Baxter International, Inc. | | | 2 | | | | 187 | |
| | |
Becton Dickinson and Co. | | | — | (b) | | | 110 | |
SEE NOTES TO FINANCIAL STATEMENTS.
| | | | | | | | | | |
| | | | | |
| | J.P. MORGAN SPECIALTY FUNDS | | | | | | | | 41 |
JPMorgan Research Market Neutral Fund
SCHEDULE OF PORTFOLIO INVESTMENTS
AS OF APRIL 30, 2020 (AS RESTATED, SEE NOTE 8) (Unaudited) (continued)
| | | | | | | | |
| INVESTMENTS | | SHARES
(000) | | | VALUE
($000) | |
| | | | | | | | |
Long Positions — continued | |
Common Stocks — continued | |
|
Health Care Equipment & Supplies — continued | |
| | |
Boston Scientific Corp. * | | | 11 | | | | 426 | |
| | |
Medtronic plc | | | 3 | | | | 319 | |
| | |
Zimmer Biomet Holdings, Inc. | | | 6 | | | | 730 | |
| | | | | | | | |
| | |
| | | | | | | 1,772 | |
| | | | | | | | |
|
Health Care Providers & Services — 2.4% | |
| | |
Cigna Corp. (a) | | | 5 | | | | 930 | |
| | |
McKesson Corp. | | | 5 | | | | 764 | |
| | |
UnitedHealth Group, Inc. (a) | | | 1 | | | | 299 | |
| | | | | | | | |
| | |
| | | | | | | 1,993 | |
| | | | | | | | |
|
Hotels, Restaurants & Leisure — 1.0% | |
| | |
Las Vegas Sands Corp. | | | 5 | | | | 246 | |
| | |
Yum! Brands, Inc. | | | 7 | | | | 604 | |
| | | | | | | | |
| | |
| | | | | | | 850 | |
| | | | | | | | |
|
Household Durables — 0.4% | |
| | |
Lennar Corp., Class A | | | 6 | | | | 301 | |
| | | | | | | | |
|
Household Products — 0.9% | |
| | |
Kimberly-Clark Corp. | | | 2 | | | | 217 | |
| | |
Procter & Gamble Co. (The) | | | 5 | | | | 562 | |
| | | | | | | | |
| | |
| | | | | | | 779 | |
| | | | | | | | |
|
Industrial Conglomerates — 0.8% | |
| | |
Honeywell International, Inc. | | | 5 | | | | 660 | |
| | | | | | | | |
|
Insurance — 0.7% | |
| | |
Arthur J Gallagher & Co. | | | 2 | | | | 172 | |
| | |
MetLife, Inc. | | | 3 | | | | 109 | |
| | |
Progressive Corp. (The) | | | 4 | | | | 274 | |
| | | | | | | | |
| | |
| | | | | | | 555 | |
| | | | | | | | |
|
Interactive Media & Services — 1.9% | |
| | |
Alphabet, Inc., Class C * (a) | | | 1 | | | | 1,589 | |
| | | | | | | | |
|
Internet & Direct Marketing Retail — 1.8% | |
| | |
Amazon.com, Inc. * (a) | | | 1 | | | | 1,499 | |
| | | | | | | | |
|
IT Services — 7.5% | |
| | |
Automatic Data Processing, Inc. (a) | | | 2 | | | | 289 | |
| | |
Booz Allen Hamilton Holding Corp. | | | 1 | | | | 103 | |
| | |
Fidelity National Information Services, Inc. (a) | | | 7 | | | | 943 | |
| | |
Fiserv, Inc. * (a) | | | 7 | | | | 759 | |
| | |
FleetCor Technologies, Inc. * | | | 4 | | | | 857 | |
| | |
Leidos Holdings, Inc. (a) | | | 11 | | | | 1,085 | |
| | |
Mastercard, Inc., Class A (a) | | | 2 | | | | 686 | |
| | |
PayPal Holdings, Inc. * | | | 9 | | | | 1,095 | |
| | |
WEX, Inc. * | | | 3 | | | | 462 | |
| | | | | | | | |
| | |
| | | | | | | 6,279 | |
| | | | | | | | |
| | | | | | | | |
| INVESTMENTS | | SHARES
(000) | | | VALUE
($000) | |
| | | | | | | | |
| | | | | | | | |
| | | | | | | | |
|
Leisure Products — 0.1% | |
| | |
Hasbro, Inc. | | | 2 | | | | 112 | |
| | | | | | | | |
|
Life Sciences Tools & Services — 0.5% | |
| | |
Thermo Fisher Scientific, Inc. | | | 1 | | | | 385 | |
| | | | | | | | |
|
Machinery — 1.7% | |
| | |
Parker-Hannifin Corp. | | | 3 | | | | 521 | |
| | |
Snap-on, Inc. | | | 2 | | | | 266 | |
| | |
Stanley Black & Decker, Inc. | | | 6 | | | | 662 | |
| | | | | | | | |
| | |
| | | | | | | 1,449 | |
| | | | | | | | |
|
Media — 2.2% | |
| | |
Charter Communications, Inc., Class A * | | | 2 | | | | 834 | |
| | |
Comcast Corp., Class A | | | 8 | | | | 301 | |
| | |
Discovery, Inc., Class A * | | | 31 | | | | 705 | |
| | | | | | | | |
| | |
| | | | | | | 1,840 | |
| | | | | | | | |
|
Multiline Retail — 0.3% | |
| | |
Dollar Tree, Inc. * | | | 3 | | | | 225 | |
| | | | | | | | |
|
Multi-Utilities — 0.3% | |
| | |
CMS Energy Corp. | | | 4 | | | | 250 | |
| | | | | | | | |
|
Oil, Gas & Consumable Fuels — 3.3% | |
| | |
Cheniere Energy, Inc. * | | | 3 | | | | 142 | |
| | |
Chevron Corp. (a) | | | 10 | | | | 931 | |
| | |
Diamondback Energy, Inc. | | | 11 | | | | 471 | |
| | |
Parsley Energy, Inc., Class A | | | 32 | | | | 305 | |
| | |
Pioneer Natural Resources Co. (a) | | | 4 | | | | 330 | |
| | |
TC Energy Corp. (Canada) | | | 7 | | | | 313 | |
| | |
Williams Cos., Inc. (The) | | | 13 | | | | 248 | |
| | | | | | | | |
| | |
| | | | | | | 2,740 | |
| | | | | | | | |
|
Pharmaceuticals — 1.2% | |
| | |
Bristol-Myers Squibb Co. | | | 10 | | | | 591 | |
| | |
Eli Lilly & Co. | | | 1 | | | | 162 | |
| | |
Merck & Co., Inc. | | | 3 | | | | 217 | |
| | | | | | | | |
| | |
| | | | | | | 970 | |
| | | | | | | | |
|
Road & Rail — 3.8% | |
| | |
CSX Corp. | | | 10 | | | | 635 | |
| | |
Kansas City Southern (a) | | | 3 | | | | 397 | |
| | |
Lyft, Inc., Class A * | | | 2 | | | | 77 | |
| | |
Norfolk Southern Corp. (a) | | | 9 | | | | 1,465 | |
| | |
Union Pacific Corp. | | | 3 | | | | 555 | |
| | | | | | | | |
| | |
| | | | | | | 3,129 | |
| | | | | | | | |
|
Semiconductors & Semiconductor Equipment — 6.7% | |
| | |
Advanced Micro Devices, Inc. * | | | 8 | | | | 440 | |
| | |
Analog Devices, Inc. | | | 5 | | | | 595 | |
SEE NOTES TO FINANCIAL STATEMENTS.
| | | | | | | | | | |
| | | | | |
| 42 | | | | | | | | J.P. MORGAN SPECIALTY FUNDS | | |
| | | | | | | | |
| INVESTMENTS | | SHARES
(000) | | | VALUE
($000) | |
| | | | | | | | |
Long Positions — continued | |
Common Stocks — continued | |
|
Semiconductors & Semiconductor Equipment — continued | |
| | |
ASML Holding NV (Registered), NYRS (Netherlands) | | | 3 | | | | 866 | |
| | |
KLA Corp. | | | 1 | | | | 239 | |
| | |
Lam Research Corp. | | | 1 | | | | 228 | |
| | |
Micron Technology, Inc. * | | | 3 | | | | 151 | |
| | |
NXP Semiconductors NV (Netherlands) | | | 7 | | | | 733 | |
| | |
ON Semiconductor Corp. * | | | 1 | | | | 14 | |
| | |
Qorvo, Inc. * | | | 3 | | | | 255 | |
| | |
Skyworks Solutions, Inc. | | | 2 | | | | 228 | |
| | |
Taiwan Semiconductor Manufacturing Co. Ltd., ADR (Taiwan) | | | 17 | | | | 899 | |
| | |
Teradyne, Inc. | | | 3 | | | | 215 | |
| | |
Texas Instruments, Inc. (a) | | | 4 | | | | 495 | |
| | |
Xilinx, Inc. | | | 2 | | | | 194 | |
| | | | | | | | |
| | |
| | | | | | | 5,552 | |
| | | | | | | | |
|
Software — 4.1% | |
| | |
Intuit, Inc. (a) | | | 3 | | | | 811 | |
| | |
Microsoft Corp. (a) | | | 7 | | | | 1,214 | |
| | |
Paylocity Holding Corp. * | | | 5 | | | | 611 | |
| | |
salesforce.com, Inc. * | | | 1 | | | | 200 | |
| | |
ServiceNow, Inc. * | | | 2 | | | | 548 | |
| | | | | | | | |
| | |
| | | | | | | 3,384 | |
| | | | | | | | |
|
Specialty Retail — 3.7% | |
| | |
AutoZone, Inc. * | | | — | (b) | | | 390 | |
| | |
Best Buy Co., Inc. | | | 4 | | | | 337 | |
| | |
Home Depot, Inc. (The) | | | 2 | | | | 381 | |
| | |
Lowe’s Cos., Inc. | | | 7 | | | | 763 | |
| | |
O’Reilly Automotive, Inc. * (a) | | | 3 | | | | 1,011 | |
| | |
TJX Cos., Inc. (The) | | | 4 | | | | 183 | |
| | | | | | | | |
| | |
| | | | | | | 3,065 | |
| | | | | | | | |
|
Technology Hardware, Storage & Peripherals — 0.8% | |
| | |
Apple, Inc. (a) | | | 2 | | | | 635 | |
| | | | | | | | |
|
Textiles, Apparel & Luxury Goods — 0.2% | |
| | |
NIKE, Inc., Class B | | | 2 | | | | 175 | |
| | | | | | | | |
|
Tobacco — 0.6% | |
| | |
Altria Group, Inc. | | | 7 | | | | 294 | |
| | |
Philip Morris International, Inc. | | | 3 | | | | 194 | |
| | | | | | | | |
| | |
| | | | | | | 488 | |
| | | | | | | | |
|
Wireless Telecommunication Services — 0.4% | |
| | |
T-Mobile US, Inc. * | | | 4 | | | | 358 | |
| | | | | | | | |
| | |
Total Common Stocks
(Cost $51,035) | | | | | | | 62,375 | |
| | | | | |
| | | | | | | | |
| INVESTMENTS | | NO. OF Rights
(000) | | | Value
($000) | |
| | | | | | | | |
| | | | | | | | |
| | | | | | | | |
|
Rights — 0.0% (c) | |
|
Pharmaceuticals — 0.0% (c) | |
| | |
Bristol-Myers Squibb Co., CVR, expiring 12/31/2020 * (Cost $13) | | | 6 | | | | 27 | |
| | | | | | | | |
| | |
| | | Shares (000) | | | | |
Short-Term Investments — 17.0% | |
|
Investment Companies — 17.0% | |
| | |
JPMorgan Prime Money Market Fund Class Institutional Shares, 0.63% (d) (e) (Cost $14,162) | | | 14,168 | | | | 14,179 | |
| | | | | | | | |
| | |
Total Long Positions
(Cost $65,210) | | | | | | | 76,581 | |
| | | | | | | | |
Short Positions — (70.4)% | |
|
Common Stocks — (70.4)% | |
|
Aerospace & Defense — (1.7)% | |
| | |
Boeing Co. (The) | | | (4 | ) | | | (520 | ) |
| | |
HEICO Corp. | | | (4 | ) | | | (327 | ) |
| | |
Huntington Ingalls Industries, Inc. | | | (2 | ) | | | (330 | ) |
| | |
TransDigm Group, Inc. | | | (1 | ) | | | (217 | ) |
| | | | | | | | |
| | |
| | | | | | | (1,394 | ) |
| | | | | | | | |
|
Air Freight & Logistics — (1.4)% | |
| | |
CH Robinson Worldwide, Inc. | | | (7 | ) | | | (472 | ) |
| | |
Expeditors International of Washington, Inc. | | | (6 | ) | | | (401 | ) |
| | |
United Parcel Service, Inc., Class B | | | (3 | ) | | | (319 | ) |
| | | | | | | | |
| | |
| | | | | | | (1,192 | ) |
| | | | | | | | |
|
Auto Components — (0.5)% | |
| | |
Autoliv, Inc. (Sweden) | | | (7 | ) | | | (436 | ) |
| | | | | | | | |
|
Automobiles — (0.3)% | |
| | |
Ford Motor Co. | | | (25 | ) | | | (127 | ) |
| | |
Harley-Davidson, Inc. | | | (5 | ) | | | (107 | ) |
| | | | | | | | |
| | |
| | | | | | | (234 | ) |
| | | | | | | | |
|
Banks — (4.1)% | |
| | |
Associated Banc-Corp. | | | (17 | ) | | | (243 | ) |
| | |
BancorpSouth Bank | | | (7 | ) | | | (163 | ) |
| | |
Bank of Hawaii Corp. | | | (3 | ) | | | (192 | ) |
| | |
Commerce Bancshares, Inc. | | | (12 | ) | | | (705 | ) |
| | |
M&T Bank Corp. | | | (4 | ) | | | (435 | ) |
| | |
Old National Bancorp | | | (8 | ) | | | (117 | ) |
| | |
People’s United Financial, Inc. | | | (37 | ) | | | (466 | ) |
| | |
PNC Financial Services Group, Inc. (The) | | | (6 | ) | | | (665 | ) |
| | |
US Bancorp | | | (11 | ) | | | (406 | ) |
| | | | | | | | |
| | |
| | | | | | | (3,392 | ) |
| | | | | | | | |
SEE NOTES TO FINANCIAL STATEMENTS.
| | | | | | | | | | |
| | | | | |
| | J.P. MORGAN SPECIALTY FUNDS | | | | | | | | 43 |
JPMorgan Research Market Neutral Fund
SCHEDULE OF PORTFOLIO INVESTMENTS
AS OF APRIL 30, 2020 (AS RESTATED, SEE NOTE 8) (Unaudited) (continued)
| | | | | | | | |
| INVESTMENTS | | SHARES
(000) | | | VALUE
($000) | |
| | | | | | | | |
Short Positions — continued | |
Common Stocks — continued | |
|
Beverages — (0.1)% | |
| | |
Boston Beer Co., Inc. (The), Class A * | | | — | (b) | | | (104 | ) |
| | | | | | | | |
|
Biotechnology — (0.1)% | |
| | |
Gilead Sciences, Inc. | | | (1 | ) | | | (43 | ) |
| | | | | | | | |
|
Building Products — (0.8)% | |
| | |
Johnson Controls International plc | | | (14 | ) | | | (407 | ) |
| | |
Lennox International, Inc. | | | (1 | ) | | | (276 | ) |
| | | | | | | | |
| | |
| | | | | | | (683 | ) |
| | | | | | | | |
|
Capital Markets — (1.7)% | |
| | |
Bank of New York Mellon Corp. (The) | | | (8 | ) | | | (289 | ) |
| | |
Franklin Resources, Inc. | | | (14 | ) | | | (264 | ) |
| | |
Northern Trust Corp. | | | (6 | ) | | | (439 | ) |
| | |
Waddell & Reed Financial, Inc., Class A | | | (27 | ) | | | (392 | ) |
| | | | | | | | |
| | |
| | | | | | | (1,384 | ) |
| | | | | | | | |
|
Chemicals — (0.9)% | |
| | |
Albemarle Corp. | | | (6 | ) | | | (381 | ) |
| | |
Ecolab, Inc. | | | (1 | ) | | | (270 | ) |
| | |
PPG Industries, Inc. | | | (1 | ) | | | (115 | ) |
| | | | | | | | |
| | |
| | | | | | | (766 | ) |
| | | | | | | | |
|
Communications Equipment — (3.0)% | |
| | |
Cisco Systems, Inc. | | | (25 | ) | | | (1,053 | ) |
| | |
Juniper Networks, Inc. | | | (68 | ) | | | (1,466 | ) |
| | | | | | | | |
| | |
| | | | | | | (2,519 | ) |
| | | | | | | | |
|
Construction Materials — (0.6)% | |
| | |
Martin Marietta Materials, Inc. | | | (1 | ) | | | (198 | ) |
| | |
Vulcan Materials Co. | | | (2 | ) | | | (281 | ) |
| | | | | | | | |
| | |
| | | | | | | (479 | ) |
| | | | | | | | |
|
Consumer Finance — (1.0)% | |
| | |
Discover Financial Services | | | (6 | ) | | | (237 | ) |
| | |
Synchrony Financial | | | (31 | ) | | | (611 | ) |
| | | | | | | | |
| | |
| | | | | | | (848 | ) |
| | | | | | | | |
|
Containers & Packaging — (2.4)% | |
| | |
AptarGroup, Inc. | | | (2 | ) | | | (205 | ) |
| | |
Avery Dennison Corp. | | | (3 | ) | | | (294 | ) |
| | |
International Paper Co. | | | (20 | ) | | | (673 | ) |
| | |
Sealed Air Corp. | | | (9 | ) | | | (243 | ) |
| | |
Sonoco Products Co. | | | (11 | ) | | | (557 | ) |
| | | | | | | | |
| | |
| | | | | | | (1,972 | ) |
| | | | | | | | |
| | | | | | | | |
| INVESTMENTS | | SHARES
(000) | | | VALUE
($000) | |
| | | | | | | | |
| | | | | | | | |
| | | | | | | | |
|
Diversified Telecommunication Services — (1.5)% | |
| | |
AT&T, Inc. | | | (29 | ) | | | (892 | ) |
| | |
CenturyLink, Inc. | | | (29 | ) | | | (312 | ) |
| | | | | | | | |
| | |
| | | | | | | (1,204 | ) |
| | | | | | | | |
|
Electric Utilities — (1.8)% | |
| | |
Edison International | | | (5 | ) | | | (291 | ) |
| | |
Exelon Corp. | | | (9 | ) | | | (322 | ) |
| | |
Pinnacle West Capital Corp. | | | (3 | ) | | | (211 | ) |
| | |
Southern Co. (The) | | | (11 | ) | | | (642 | ) |
| | | | | | | | |
| | |
| | | | | | | (1,466 | ) |
| | | | | | | | |
|
Electrical Equipment — (0.9)% | |
| | |
Acuity Brands, Inc. | | | (6 | ) | | | (500 | ) |
| | |
Hubbell, Inc. | | | (2 | ) | | | (280 | ) |
| | | | | | | | |
| | |
| | | | | | | (780 | ) |
| | | | | | | | |
|
Electronic Equipment, Instruments & Components — (0.4)% | |
| | |
Cognex Corp. | | | (6 | ) | | | (330 | ) |
| | | | | | | | |
|
Energy Equipment & Services — (1.3)% | |
| | |
Baker Hughes Co. | | | (12 | ) | | | (171 | ) |
| | |
Halliburton Co. | | | (62 | ) | | | (648 | ) |
| | |
Schlumberger Ltd. | | | (14 | ) | | | (234 | ) |
| | | | | | | | |
| | |
| | | | | | | (1,053 | ) |
| | | | | | | | |
|
Entertainment — (3.2)% | |
| | |
Activision Blizzard, Inc. | | | (4 | ) | | | (227 | ) |
| | |
Cinemark Holdings, Inc. | | | (22 | ) | | | (315 | ) |
| | |
Spotify Technology SA * | | | (6 | ) | | | (975 | ) |
| | |
Take-Two Interactive Software, Inc. * | | | (1 | ) | | | (115 | ) |
| | |
Walt Disney Co. (The) | | | (10 | ) | | | (1,064 | ) |
| | | | | | | | |
| | |
| | | | | | | (2,696 | ) |
| | | | | | | | |
|
Equity Real Estate Investment Trusts (REITs) — (3.1)% | |
| | |
Apple Hospitality REIT, Inc. | | | (7 | ) | | | (71 | ) |
| | |
Crown Castle International Corp. | | | (1 | ) | | | (228 | ) |
| | |
Extra Space Storage, Inc. | | | (3 | ) | | | (225 | ) |
| | |
Iron Mountain, Inc. | | | (26 | ) | | | (632 | ) |
| | |
Macerich Co. (The) | | | (7 | ) | | | (55 | ) |
| | |
Public Storage | | | (1 | ) | | | (201 | ) |
| | |
Simon Property Group, Inc. | | | (11 | ) | | | (748 | ) |
| | |
Vornado Realty Trust | | | (6 | ) | | | (250 | ) |
| | |
Welltower, Inc. | | | (4 | ) | | | (192 | ) |
| | | | | | | | |
| | |
| | | | | | | (2,602 | ) |
| | | | | | | | |
|
Food & Staples Retailing — (0.4)% | |
| | |
Sysco Corp. | | | (6 | ) | | | (347 | ) |
| | | | | | | | |
SEE NOTES TO FINANCIAL STATEMENTS.
| | | | | | | | | | |
| | | | | |
| 44 | | | | | | | | J.P. MORGAN SPECIALTY FUNDS | | |
| | | | | | | | |
| INVESTMENTS | | SHARES
(000) | | | VALUE
($000) | |
| | | | | | | | |
Short Positions — continued | |
Common Stocks — continued | |
|
Food Products — (1.0)% | |
| | |
Campbell Soup Co. | | | (12 | ) | | | (583 | ) |
| | |
General Mills, Inc. | | | (4 | ) | | | (243 | ) |
| | | | | | | | |
| | |
| | | | | | | (826 | ) |
| | | | | | | | |
|
Health Care Equipment & Supplies — (2.2)% | |
| | |
Abbott Laboratories | | | (8 | ) | | | (718 | ) |
| | |
Dentsply Sirona, Inc. | | | (4 | ) | | | (164 | ) |
| | |
Stryker Corp. | | | (4 | ) | | | (688 | ) |
| | |
Varian Medical Systems, Inc. * | | | (2 | ) | | | (240 | ) |
| | | | | | | | |
| | |
| | | | | | | (1,810 | ) |
| | | | | | | | |
|
Health Care Providers & Services — (2.0)% | |
| | |
AmerisourceBergen Corp. | | | (8 | ) | | | (710 | ) |
| | |
Henry Schein, Inc. * | | | (15 | ) | | | (794 | ) |
| | |
Patterson Cos., Inc. | | | (10 | ) | | | (175 | ) |
| | | | | | | | |
| | |
| | | | | | | (1,679 | ) |
| | | | | | | | |
|
Health Care Technology — (0.8)% | |
| | |
Cerner Corp. | | | (11 | ) | | | (731 | ) |
| | | | | | | | |
|
Hotels, Restaurants & Leisure — (0.9)% | |
| | |
Chipotle Mexican Grill, Inc. * | | | — | (b) | | | (261 | ) |
| | |
Starbucks Corp. | | | (7 | ) | | | (509 | ) |
| | | | | | | | |
| | |
| | | | | | | (770 | ) |
| | | | | | | | |
|
Household Durables — (0.3)% | |
| | |
Toll Brothers, Inc. | | | (9 | ) | | | (213 | ) |
| | | | | | | | |
|
Household Products — (1.7)% | |
| | |
Clorox Co. (The) | | | (7 | ) | | | (1,379 | ) |
| | | | | | | | |
|
Industrial Conglomerates — (1.5)% | |
| | |
3M Co. | | | (5 | ) | | | (687 | ) |
| | |
General Electric Co. | | | (83 | ) | | | (566 | ) |
| | | | | | | | |
| | |
| | | | | | | (1,253 | ) |
| | | | | | | | |
|
Insurance — (2.0)% | |
| | |
Aflac, Inc. | | | (14 | ) | | | (512 | ) |
| | |
Aon plc | | | (1 | ) | | | (204 | ) |
| | |
Everest Re Group Ltd. | | | (2 | ) | | | (378 | ) |
| | |
Globe Life, Inc. | | | (5 | ) | | | (391 | ) |
| | |
Principal Financial Group, Inc. | | | (5 | ) | | | (197 | ) |
| | | | | | | | |
| | |
| | | | | | | (1,682 | ) |
| | | | | | | | |
|
Interactive Media & Services — (0.9)% | |
| | |
Twitter, Inc. * | | | (26 | ) | | | (735 | ) |
| | | | | | | | |
|
IT Services — (3.0)% | |
| | |
EPAM Systems, Inc. * | | | (1 | ) | | | (241 | ) |
| | |
Jack Henry & Associates, Inc. | | | (2 | ) | | | (385 | ) |
| | | | | | | | |
| INVESTMENTS | | SHARES
(000) | | | VALUE
($000) | |
| | | | | | | | |
| | | | | | | | |
| | | | | | | | |
|
IT Services — continued | |
| | |
Paychex, Inc. | | | (11 | ) | | | (767 | ) |
| | |
Western Union Co. (The) | | | (57 | ) | | | (1,082 | ) |
| | | | | | | | |
| | |
| | | | | | | (2,475 | ) |
| | | | | | | | |
|
Life Sciences Tools & Services — (1.8)% | |
| | |
Agilent Technologies, Inc. | | | (8 | ) | | | (588 | ) |
| | |
Mettler-Toledo International, Inc. * | | | (1 | ) | | | (389 | ) |
| | |
Waters Corp. * | | | (3 | ) | | | (510 | ) |
| | | | | | | | |
| | |
| | | | | | | (1,487 | ) |
| | | | | | | | |
|
Machinery — (2.4)% | |
| | |
Caterpillar, Inc. | | | (6 | ) | | | (654 | ) |
| | |
Donaldson Co., Inc. | | | (12 | ) | | | (523 | ) |
| | |
Illinois Tool Works, Inc. | | | (4 | ) | | | (577 | ) |
| | |
PACCAR, Inc. | | | (3 | ) | | | (204 | ) |
| | | | | | | | |
| | |
| | | | | | | (1,958 | ) |
| | | | | | | | |
|
Media — (2.8)% | |
| | |
Fox Corp., Class A | | | (7 | ) | | | (184 | ) |
| | |
Interpublic Group of Cos., Inc. (The) | | | (20 | ) | | | (343 | ) |
| | |
Omnicom Group, Inc. | | | (18 | ) | | | (1,038 | ) |
| | |
Sirius XM Holdings, Inc. | | | (131 | ) | | | (777 | ) |
| | | | | | | | |
| | |
| | | | | | | (2,342 | ) |
| | | | | | | | |
|
Multiline Retail — (1.0)% | |
| | |
Kohl’s Corp. | | | (14 | ) | | | (268 | ) |
| | |
Macy’s, Inc. | | | (65 | ) | | | (383 | ) |
| | |
Nordstrom, Inc. | | | (13 | ) | | | (242 | ) |
| | | | | | | | |
| | |
| | | | | | | (893 | ) |
| | | | | | | | |
|
Multi-Utilities — (1.4)% | |
| | |
Consolidated Edison, Inc. | | | (9 | ) | | | (689 | ) |
| | |
Public Service Enterprise Group, Inc. | | | (10 | ) | | | (498 | ) |
| | | | | | | | |
| | |
| | | | | | | (1,187 | ) |
| | | | | | | | |
|
Oil, Gas & Consumable Fuels — (4.0)% | |
| | |
Enbridge, Inc. (Canada) | | | (15 | ) | | | (452 | ) |
| | |
Exxon Mobil Corp. | | | (17 | ) | | | (790 | ) |
| | |
Hess Corp. | | | (16 | ) | | | (784 | ) |
| | |
HollyFrontier Corp. | | | (6 | ) | | | (193 | ) |
| | |
Marathon Oil Corp. | | | (27 | ) | | | (164 | ) |
| | |
Occidental Petroleum Corp. | | | (53 | ) | | | (885 | ) |
| | |
Valero Energy Corp. | | | (1 | ) | | | (63 | ) |
| | | | | | | | |
| | |
| | | | | | | (3,331 | ) |
| | | | | | | | |
|
Paper & Forest Products — (0.3)% | |
| | |
Domtar Corp. | | | (12 | ) | | | (280 | ) |
| | | | | | | | |
SEE NOTES TO FINANCIAL STATEMENTS.
| | | | | | | | | | |
| | | | | |
| | J.P. MORGAN SPECIALTY FUNDS | | | | | | | | 45 |
JPMorgan Research Market Neutral Fund
SCHEDULE OF PORTFOLIO INVESTMENTS
AS OF APRIL 30, 2020 (AS RESTATED, SEE NOTE 8) (Unaudited) (continued)
| | | | | | | | |
| INVESTMENTS | | SHARES
(000) | | | VALUE
($000) | |
| | | | | | | | |
Short Positions — continued | |
Common Stocks — continued | |
|
Personal Products — (0.2)% | |
| | |
Coty, Inc., Class A | | | (35 | ) | | | (192 | ) |
| | | | | | | | |
|
Professional Services — (1.2)% | |
| | |
Robert Half International, Inc. | | | (21 | ) | | | (974 | ) |
| | | | | | | | |
|
Road & Rail — (1.2)% | |
| | |
Heartland Express, Inc. | | | (20 | ) | | | (397 | ) |
| | |
JB Hunt Transport Services, Inc. | | | (4 | ) | | | (427 | ) |
| | |
Schneider National, Inc., Class B | | | (10 | ) | | | (210 | ) |
| | | | | | | | |
| | |
| | | | | | | (1,034 | ) |
| | | | | | | | |
|
Semiconductors & Semiconductor Equipment — (1.3)% | |
| | |
Broadcom, Inc. | | | (1 | ) | | | (217 | ) |
| | |
Intel Corp. | | | (5 | ) | | | (270 | ) |
| | |
QUALCOMM, Inc. | | | (7 | ) | | | (585 | ) |
| | | | | | | | |
| | |
| | | | | | | (1,072 | ) |
| | | | | | | | |
|
Software — (1.0)% | |
| | |
Oracle Corp. | | | (8 | ) | | | (430 | ) |
| | |
Splunk, Inc. * | | | (2 | ) | | | (331 | ) |
| | |
Teradata Corp. * | | | (4 | ) | | | (89 | ) |
| | | | | | | | |
| | |
| | | | | | | (850 | ) |
| | | | | | | | |
|
Specialty Retail — (0.8)% | |
| | |
Bed Bath & Beyond, Inc. | | | (21 | ) | | | (130 | ) |
| | |
CarMax, Inc. * | | | (1 | ) | | | (77 | ) |
| | |
Gap, Inc. (The) | | | (6 | ) | | | (49 | ) |
| | |
Williams-Sonoma, Inc. | | | (6 | ) | | | (392 | ) |
| | | | | | | | |
| | |
| | | | | | | (648 | ) |
| | | | | | | | |
|
Technology Hardware, Storage & Peripherals — (3.0)% | |
| | |
NetApp, Inc. | | | (32 | ) | | | (1,414 | ) |
| | |
Seagate Technology plc | | | (9 | ) | | | (428 | ) |
| | |
Western Digital Corp. | | | (10 | ) | | | (445 | ) |
| | |
Xerox Holdings Corp. | | | (10 | ) | | | (192 | ) |
| | | | | | | | |
| | |
| | | | | | | (2,479 | ) |
| | | | | | | | |
| | | | | | | | |
| INVESTMENTS | | SHARES
(000) | | | VALUE
($000) | |
| | | | | | | | |
| | | | | | | | |
| | |
| | | | | | | | |
|
Textiles, Apparel & Luxury Goods — (0.2)% | |
| | |
Canada Goose Holdings, Inc. (Canada) * | | | (2 | ) | | | (49 | ) |
| | |
Hanesbrands, Inc. | | | (13 | ) | | | (131 | ) |
| | | | | | | | |
| | |
| | | | | | | (180 | ) |
| | | | | | | | |
|
Trading Companies & Distributors — (0.3)% | |
| | |
Fastenal Co. | | | (7 | ) | | | (263 | ) |
| | | | | | | | |
| | |
Total Common Stocks
(Proceeds $(64,173)) | | | | | | | (58,647 | ) |
| | | | | | | | |
| | |
Total Short Positions
(Proceeds $(64,173)) | | | | | | | (58,647 | ) |
| | | | | | | | |
Total Investments — 21.5%
(Cost $1,037) | | | | | | | 17,934 | |
Other Assets Less Liabilities — 77.3% | | | | | | | 64,341 | |
| | | | | | | | |
Net Assets — 98.8% | | | | | | | 2,275 | |
| | | | | | | | |
Future share reacquisition adjustment — 1.2% | | | | 1,023 | |
| | | | | | | | |
Net assets after future share reacquisition adjustment — 100% | | | $ | 83,298 | |
| | | | | | | | |
Percentages indicated are based on net assets.
Abbreviations
| | |
| ADR | | American Depositary Receipt |
| CVR | | Contingent Value Rights |
| NYRS | | New York Registry Shares |
| REIT | | Real Estate Investment Trust |
| |
| (a) | | All or a portion of this security is segregated as collateral for short sales. The total value of securities and cash segregated as collateral is approximately $14,141,000 and $63,226,000 respectively. |
| (b) | | Amount rounds to less than one thousand. |
| (c) | | Amount rounds to less than 0.1% of net assets. |
| (d) | | Investment in an affiliated fund, which is registered under the Investment Company Act of 1940, as amended, and is advised by J.P. Morgan Investment Management Inc. |
| (e) | | The rate shown is the current yield as of April 30, 2020. |
| * | | Non-income producing security. |
Futures contracts outstanding as of April 30, 2020 (amounts in thousands, except number of contracts):
| | | | | | | | | | | | | | | | | | | | |
| DESCRIPTION | | NUMBER OF
CONTRACTS | | | EXPIRATION
DATE | | | TRADING Currency | | | NOTIONAL
AMOUNT ($) | | | VALUE AND
UNREALIZED
APPRECIATION
(DEPRECIATION) ($) | |
Short Contracts | | | | | | | | | | | | | | | | | | | | |
S&P 500 E-Mini Index | | | (8 | ) | | | 06/2020 | | | | USD | | | | (1,161 | ) | | | (25 | ) |
| | | | | | | | | | | | | | | | | | | | |
Abbreviations
SEE NOTES TO FINANCIAL STATEMENTS.
| | | | | | | | | | |
| | | | | |
| 46 | | | | | | | | J.P. MORGAN SPECIALTY FUNDS | | |
JPMorgan Research Market Neutral Fund
SCHEDULE OF PORTFOLIO INVESTMENTS
AS OF APRIL 30, 2019 (AS RESTATED, SEE NOTE 8) (Unaudited)
| | | | | | | | |
| INVESTMENTS | | SHARES
(000) | | | VALUE
($000) | |
Long Positions — 99.2% | | | | | | | | |
Common Stocks — 86.7% | | | | | | | | |
| | |
Aerospace & Defense — 2.2% | | | | | | | | |
| | |
General Dynamics Corp. (a) | | | 6 | | | | 994 | |
| | |
Northrop Grumman Corp. | | | 2 | | | | 617 | |
| | | | | | | | |
| | |
| | | | | | | 1,611 | |
| | | | | | | | |
| | |
Airlines — 0.5% | | | | | | | | |
| | |
Delta Air Lines, Inc. (a) | | | 2 | | | | 135 | |
| | |
United Continental Holdings, Inc. * | | | 3 | | | | 223 | |
| | | | | | | | |
| | |
| | | | | | | 358 | |
| | | | | | | | |
| | |
Banks — 2.3% | | | | | | | | |
| | |
Bank of America Corp. (a) | | | 12 | | | | 371 | |
| | |
Citigroup, Inc. | | | 7 | | | | 508 | |
| | |
KeyCorp | | | 27 | | | | 477 | |
| | |
Zions Bancorp NA | | | 7 | | | | 345 | |
| | | | | | | | |
| | |
| | | | | | | 1,701 | |
| | | | | | | | |
| | |
Beverages — 0.9% | | | | | | | | |
| | |
Coca-Cola Co. (The) | | | 6 | | | | 300 | |
| | |
Constellation Brands, Inc., Class A | | | 2 | | | | 359 | |
| | | | | | | | |
| | |
| | | | | | | 659 | |
| | | | | | | | |
| | |
Biotechnology — 1.8% | | | | | | | | |
| | |
Alexion Pharmaceuticals, Inc. * | | | 2 | | | | 235 | |
| | |
Celgene Corp. * | | | 7 | | | | 705 | |
| | |
Regeneron Pharmaceuticals, Inc. * | | | — | (b) | | | 87 | |
| | |
Vertex Pharmaceuticals, Inc. * | | | 2 | | | | 282 | |
| | | | | | | | |
| | |
| | | | | | | 1,309 | |
| | | | | | | | |
| | |
Building Products — 0.4% | | | | | | | | |
| | |
Masco Corp. | | | 8 | | | | 301 | |
| | | | | | | | |
| | |
Capital Markets — 1.5% | | | | | | | | |
| | |
Ameriprise Financial, Inc. | | | 2 | | | | 252 | |
| | |
BlackRock, Inc. | | | 1 | | | | 433 | |
| | |
Morgan Stanley (a) | | | 9 | | | | 449 | |
| | | | | | | | |
| | |
| | | | | | | 1,134 | |
| | | | | | | | |
| | |
Chemicals — 3.8% | | | | | | | | |
| | |
Air Products & Chemicals, Inc. | | | 2 | | | | 339 | |
| | |
Celanese Corp. | | | 8 | | | | 879 | |
| | |
Eastman Chemical Co. | | | 2 | | | | 163 | |
| | |
FMC Corp. | | | 3 | | | | 274 | |
| | |
Linde plc (United Kingdom) | | | 4 | | | | 780 | |
| | |
RPM International, Inc. | | | 4 | | | | 258 | |
| | |
Sherwin-Williams Co. (The) | | | — | (b) | | | 111 | |
| | | | | | | | |
| | |
| | | | | | | 2,804 | |
| | | | | | | | |
| | | | | | | | |
| INVESTMENTS | | SHARES
(000) | | | VALUE
($000) | |
| | | | | | | | |
| | | | | | | | |
| | |
Consumer Finance — 1.1% | | | | | | | | |
| | |
American Express Co. | | | 4 | | | | 520 | |
| | |
Synchrony Financial | | | 9 | | | | 295 | |
| | | | | | | | |
| | |
| | | | | | | 815 | |
| | | | | | | | |
| | |
Containers & Packaging — 0.3% | | | | | | | | |
| | |
Crown Holdings, Inc. * | | | 4 | | | | 205 | |
| | | | | | | | |
| | |
Electric Utilities — 5.2% | | | | | | | | |
| | |
American Electric Power Co., Inc. | | | 8 | | | | 676 | |
| | |
Edison International | | | 7 | | | | 455 | |
| | |
Exelon Corp. | | | 14 | | | | 728 | |
| | |
NextEra Energy, Inc. (a) | | | 6 | | | | 1,071 | |
| | |
Xcel Energy, Inc. (a) | | | 15 | | | | 863 | |
| | | | | | | | |
| | |
| | | | | | | 3,793 | |
| | | | | | | | |
| | |
Electrical Equipment — 0.9% | | | | | | | | |
| | |
Eaton Corp. plc | | | 2 | | | | 202 | |
| | |
Emerson Electric Co. | | | 6 | | | | 435 | |
| | | | | | | | |
| | |
| | | | | | | 637 | |
| | | | | | | | |
| | |
Entertainment — 1.5% | | | | | | | | |
| | |
Electronic Arts, Inc. * | | | 10 | | | | 920 | |
| | |
Take-Two Interactive Software, Inc. * | | | 2 | | | | 189 | |
| | | | | | | | |
| | |
| | | | | | | 1,109 | |
| | | | | | | | |
| |
Equity Real Estate Investment Trusts (REITs) — 2.5% | | | | | |
| | |
Brandywine Realty Trust | | | 14 | | | | 212 | |
| | |
Digital Realty Trust, Inc. | | | 3 | | | | 394 | |
| | |
Equity Residential | | | 4 | | | | 286 | |
| | |
Prologis, Inc. | | | 13 | | | | 959 | |
| | | | | | | | |
| | |
| | | | | | | 1,851 | |
| | | | | | | | |
| | |
Food Products — 0.8% | | | | | | | | |
| | |
Mondelez International, Inc., Class A | | | 12 | | | | 616 | |
| | | | | | | | |
| | |
Health Care Equipment & Supplies — 2.3% | | | | | | | | |
| | |
Boston Scientific Corp. * | | | 24 | | | | 895 | |
| | |
Intuitive Surgical, Inc. * | | | 1 | | | | 445 | |
| | |
Zimmer Biomet Holdings, Inc. | | | 3 | | | | 352 | |
| | | | | | | | |
| | |
| | | | | | | 1,692 | |
| | | | | | | | |
| | |
Health Care Providers & Services — 2.9% | | | | | | | | |
| | |
Anthem, Inc. | | | 1 | | | | 338 | |
| | |
Cigna Corp. | | | 4 | | | | 669 | |
| | |
DaVita, Inc. * | | | 3 | | | | 186 | |
| | |
HCA Healthcare, Inc. | | | 3 | | | | 349 | |
| | |
UnitedHealth Group, Inc. (a) | | | 2 | | | | 463 | |
| | | | | | | | |
| | |
| | | | | | | 2,005 | |
| | | | | | | | |
SEE NOTES TO FINANCIAL STATEMENTS.
| | | | | | | | | | |
| | | | | |
| | J.P. MORGAN SPECIALTY FUNDS | | | | | | | | 47 |
JPMorgan Research Market Neutral Fund
SCHEDULE OF PORTFOLIO INVESTMENTS
AS OF APRIL 30, 2019 (AS RESTATED, SEE NOTE 8) (Unaudited) (continued)
| | | | | | | | |
| INVESTMENTS | | SHARES
(000) | | | VALUE
($000) | |
Long Positions — continued | | | | | | | | |
Common Stocks — continued | | | | | | | | |
| | |
Hotels, Restaurants & Leisure — 2.5% | | | | | | | | |
| | |
Carnival Corp. | | | 5 | | | | 298 | |
| | |
Darden Restaurants, Inc. | | | 4 | | | | 432 | |
| | |
Royal Caribbean Cruises Ltd. | | | 4 | | | | 435 | |
| | |
Yum! Brands, Inc. | | | 6 | | | | 661 | |
| | | | | | | | |
| | |
| | | | | | | 1,826 | |
| | | | | | | | |
| | |
Household Durables — 0.3% | | | | | | | | |
| | |
DR Horton, Inc. | | | 5 | | | | 223 | |
| | | | | | | | |
| | |
Household Products — 0.9% | | | | | | | | |
| | |
Procter & Gamble Co. (The) | | | 6 | | | | 647 | |
| | | | | | | | |
| | |
Industrial Conglomerates — 1.3% | | | | | | | | |
| | |
Honeywell International, Inc. | | | 6 | | | | 996 | |
| | | | | | | | |
| | |
Insurance — 1.9% | | | | | | | | |
| | |
Allstate Corp. (The) | | | 4 | | | | 389 | |
| | |
Arthur J Gallagher & Co. | | | 3 | | | | 230 | |
| | |
Axis Capital Holdings Ltd. | | | 4 | | | | 240 | |
| | |
Lincoln National Corp. | | | 5 | | | | 352 | |
| | |
Travelers Cos., Inc. (The) | | | 1 | | | | 159 | |
| | | | | | | | |
| | |
| | | | | | | 1,370 | |
| | | | | | | | |
| | |
Interactive Media & Services — 2.8% | | | | | | | | |
| | |
Alphabet, Inc., Class C * (a) | | | 2 | | | | 2,056 | |
| | | | | | | | |
| | |
Internet & Direct Marketing Retail — 3.8% | | | | | | | | |
| | |
Amazon.com, Inc. * | | | 1 | | | | 2,021 | |
| | |
Expedia Group, Inc. | | | 6 | | | | 806 | |
| | | | | | | | |
| | |
| | | | | | | 2,827 | |
| | | | | | | | |
| | |
IT Services — 5.8% | | | | | | | | |
| | |
Automatic Data Processing, Inc. (a) | | | 4 | | | | 576 | |
| | |
Fidelity National Information Services, Inc. | | | 3 | | | | 342 | |
| | |
First Data Corp., Class A * | | | 18 | | | | 455 | |
| | |
Fiserv, Inc. * | | | 7 | | | | 584 | |
| | |
Mastercard, Inc., Class A | | | 4 | | | | 939 | |
| | |
PayPal Holdings, Inc. * | | | 6 | | | | 690 | |
| | |
WEX, Inc. * | | | 3 | | | | 668 | |
| | | | | | | | |
| | |
| | | | | | | 4,254 | |
| | | | | | | | |
| | |
Life Sciences Tools & Services — 0.1% | | | | | | | | |
| | |
Thermo Fisher Scientific, Inc. | | | — | (b) | | | 107 | |
| | | | | | | | |
| | |
Machinery — 1.1% | | | | | | | | |
| | |
Ingersoll-Rand plc | | | 3 | | | | 357 | |
| | |
Parker-Hannifin Corp. | | | — | (b) | | | 36 | |
| | |
Stanley Black & Decker, Inc. (a) | | | 3 | | | | 433 | |
| | | | | | | | |
| | |
| | | | | | | 826 | |
| | | | | | | | |
| | | | | | | | |
| INVESTMENTS | | SHARES
(000) | | | VALUE
($000) | |
| | | | | | | | |
| | | | | | | | |
| | |
Media — 2.8% | | | | | | | | |
| | |
Altice USA, Inc., Class A | | | 21 | | | | 497 | |
| | |
Charter Communications, Inc., Class A * | | | 2 | | | | 902 | |
| | |
Comcast Corp., Class A | | | 3 | | | | 111 | |
| | |
Discovery, Inc., Class A * | | | 13 | | | | 406 | |
| | |
Discovery, Inc., Class C * | | | 4 | | | | 113 | |
| | | | | | | | |
| | |
| | | | | | | 2,029 | |
| | | | | | | | |
| | |
Oil, Gas & Consumable Fuels — 6.6% | | | | | | | | |
| | |
Concho Resources, Inc. | | | 4 | | | | 420 | |
| | |
Diamondback Energy, Inc. | | | 6 | | | | 668 | |
| | |
EOG Resources, Inc. | | | 9 | | | | 820 | |
| | |
Marathon Petroleum Corp. | | | 14 | | | | 867 | |
| | |
ONEOK, Inc. | | | 8 | | | | 541 | |
| | |
Parsley Energy, Inc., Class A * | | | 18 | | | | 359 | |
| | |
Pioneer Natural Resources Co. (a) | | | 6 | | | | 963 | |
| | |
TransCanada Corp. (Canada) | | | 5 | | | | 223 | |
| | | | | | | | |
| | |
| | | | | | | 4,861 | |
| | | | | | | | |
| | |
Pharmaceuticals — 1.2% | | | | | | | | |
| | |
Elanco Animal Health, Inc. * | | | 3 | | | | 103 | |
| | |
Eli Lilly & Co. | | | 3 | | | | 294 | |
| | |
Merck & Co., Inc. | | | 7 | | | | 526 | |
| | | | | | | | |
| | |
| | | | | | | 923 | |
| | | | | | | | |
| | |
Road & Rail — 6.0% | | | | | | | | |
| | |
Canadian Pacific Railway Ltd. (Canada) | | | 1 | | | | 182 | |
| | |
Lyft, Inc., Class A * | | | 2 | | | | 116 | |
| | |
Norfolk Southern Corp. (a) | | | 10 | | | | 2,129 | |
| | |
Union Pacific Corp. (a) | | | 11 | | | | 1,990 | |
| | | | | | | | |
| | |
| | | | | | | 4,417 | |
| | | | | | | | |
|
Semiconductors & Semiconductor Equipment — 5.7% | |
| | |
Advanced Micro Devices, Inc. * | | | 10 | | | | 275 | |
| | |
Analog Devices, Inc. | | | 5 | | | | 603 | |
| | |
Broadcom, Inc. | | | 1 | | | | 317 | |
| | |
NVIDIA Corp. (a) | | | 6 | | | | 1,164 | |
| | |
Taiwan Semiconductor Manufacturing Co. Ltd., ADR (Taiwan) | | | 11 | | | | 497 | |
| | |
Teradyne, Inc. | | | 4 | | | | 213 | |
| | |
Texas Instruments, Inc. (a) | | | 10 | | | | 1,131 | |
| | | | | | | | |
| | |
| | | | | | | 4,200 | |
| | | | | | | | |
| | |
Software — 4.8% | | | | | | | | |
| | |
Anaplan, Inc. * | | | 12 | | | | 483 | |
| | |
Intuit, Inc. | | | 2 | | | | 421 | |
| | |
Microsoft Corp. (a) | | | 7 | | | | 912 | |
SEE NOTES TO FINANCIAL STATEMENTS.
| | | | | | | | | | |
| | | | | |
| 48 | | | | | | | | J.P. MORGAN SPECIALTY FUNDS | | |
| | | | | | | | |
| INVESTMENTS | | SHARES
(000) | | | VALUE
($000) | |
Long Positions — continued | | | | | | | | |
Common Stocks — continued | | | | | | | | |
| | |
Software — continued | | | | | | | | |
| | |
salesforce.com, Inc. * | | | 7 | | | | 1,080 | |
| | |
ServiceNow, Inc. * | | | 2 | | | | 436 | |
| | |
Workday, Inc., Class A * | | | 1 | | | | 219 | |
| | | | | | | | |
| | |
| | | | | | | 3,551 | |
| | | | | | | | |
| | |
Specialty Retail — 6.2% | | | | | | | | |
| | |
Advance Auto Parts, Inc. | | | 1 | | | | 107 | |
| | |
AutoZone, Inc. * | | | 1 | | | | 1,063 | |
| | |
Best Buy Co., Inc. | | | 5 | | | | 391 | |
| | |
Lowe’s Cos., Inc. | | | 7 | | | | 822 | |
| | |
O’Reilly Automotive, Inc. * | | | 2 | | | | 742 | |
| | |
Ross Stores, Inc. | | | 8 | | | | 821 | |
| | |
TJX Cos., Inc. (The) | | | 11 | | | | 582 | |
| | | | | | | | |
| | |
| | | | | | | 4,528 | |
| | | | | | | | |
| | |
Textiles, Apparel & Luxury Goods — 0.9% | | | | | | | | |
| | |
NIKE, Inc., Class B | | | 4 | | | | 326 | |
| | |
PVH Corp. | | | 2 | | | | 310 | |
| | | | | | | | |
| | |
| | | | | | | 636 | |
| | | | | | | | |
| | |
Tobacco — 0.9% | | | | | | | | |
| | |
Philip Morris International, Inc. | | | 8 | | | | 681 | |
| | | | | | | | |
| | |
Trading Companies & Distributors — 0.2% | | | | | | | | |
| | |
HD Supply Holdings, Inc. * | | | 4 | | | | 166 | |
| | | | | | | | |
| | |
Total Common Stocks
(Cost $46,327) | | | | | | | 63,724 | |
| | | | | | | | |
Short-Term Investments — 12.5% | | | | | | | | |
| | |
Investment Companies — 12.5% | | | | | | | | |
| | |
JPMorgan Prime Money Market Fund Class Institutional Shares, 2.48% (c) (d)
(Cost $9,176) | | | 9,175 | | | | 9,178 | |
| | | | | | | | |
| | |
Total Long Positions
(Cost $55,503) | | | | | | | 72,902 | |
| | | | | | | | |
Short Positions — (85.2)% | | | | | | | | |
Common Stocks — (85.2)% | | | | | | | | |
| | |
Aerospace & Defense — (2.4)% | | | | | | | | |
| | |
Harris Corp. | | | (1 | ) | | | (111 | ) |
| | |
Huntington Ingalls Industries, Inc. | | | (2 | ) | | | (429 | ) |
| | |
Lockheed Martin Corp. | | | (1 | ) | | | (415 | ) |
| | |
Raytheon Co. | | | (3 | ) | | | (596 | ) |
| | |
Textron, Inc. | | | (4 | ) | | | (191 | ) |
| | | | | | | | |
| | |
| | | | | | | (1,742 | ) |
| | | | | | | | |
| | |
Air Freight & Logistics — (1.2)% | | | | | | | | |
| | |
CH Robinson Worldwide, Inc. | | | (3 | ) | | | (229 | ) |
| | |
Expeditors International of Washington, Inc. | | | (2 | ) | | | (166 | ) |
| | | | | | | | |
| INVESTMENTS | | SHARES
(000) | | | VALUE
($000) | |
| | | | | | | | |
| | | | | | | | |
| | |
Air Freight & Logistics — continued | | | | | | | | |
| | |
United Parcel Service, Inc., Class B | | | (5 | ) | | | (479 | ) |
| | | | | | | | |
| | |
| | | | | | | (874 | ) |
| | | | | | | | |
| | |
Auto Components — (0.2)% | | | | | | | | |
| | |
Autoliv, Inc. (Sweden) | | | (2 | ) | | | (132 | ) |
| | | | | | | | |
| | |
Automobiles — (1.4)% | | | | | | | | |
| | |
General Motors Co. | | | (15 | ) | | | (571 | ) |
| | |
Harley-Davidson, Inc. | | | (4 | ) | | | (148 | ) |
| | |
Tesla, Inc. * | | | (1 | ) | | | (318 | ) |
| | | | | | | | |
| | |
| | | | | | | (1,037 | ) |
| | | | | | | | |
| | |
Banks — (3.0)% | | | | | | | | |
| | |
Associated Banc-Corp. | | | (23 | ) | | | (512 | ) |
| | |
BancorpSouth Bank | | | (11 | ) | | | (351 | ) |
| | |
Bank of Hawaii Corp. | | | (4 | ) | | | (297 | ) |
| | |
Commerce Bancshares, Inc. | | | (1 | ) | | | (83 | ) |
| | |
First Hawaiian, Inc. | | | (13 | ) | | | (358 | ) |
| | |
People’s United Financial, Inc. | | | (21 | ) | | | (368 | ) |
| | |
PNC Financial Services Group, Inc. (The) | | | (2 | ) | | | (218 | ) |
| | | | | | | | |
| | |
| | | | | | | (2,187 | ) |
| | | | | | | | |
| | |
Beverages — (0.8)% | | | | | | | | |
| | |
Brown-Forman Corp., Class B | | | (12 | ) | | | (650 | ) |
| | | | | | | | |
| | |
Biotechnology — (1.9)% | | | | | | | | |
| | |
AbbVie, Inc. | | | (6 | ) | | | (461 | ) |
| | |
Amgen, Inc. | | | (4 | ) | | | (643 | ) |
| | |
Gilead Sciences, Inc. | | | (6 | ) | | | (362 | ) |
| | | | | | | | |
| | |
| | | | | | | (1,466 | ) |
| | | | | | | | |
| | |
Building Products — (0.9)% | | | | | | | | |
| | |
Fortune Brands Home & Security, Inc. | | | (2 | ) | | | (119 | ) |
| | |
Johnson Controls International plc | | | (15 | ) | | | (571 | ) |
| | | | | | | | |
| | |
| | | | | | | (690 | ) |
| | | | | | | | |
| | |
Capital Markets — (3.7)% | | | | | | | | |
| | |
Charles Schwab Corp. (The) | | | (9 | ) | | | (429 | ) |
| | |
Federated Investors, Inc., Class B | | | (11 | ) | | | (348 | ) |
| | |
Franklin Resources, Inc. | | | (9 | ) | | | (307 | ) |
| | |
Goldman Sachs Group, Inc. (The) | | | (1 | ) | | | (127 | ) |
| | |
Invesco Ltd. | | | (8 | ) | | | (183 | ) |
| | |
Legg Mason, Inc. | | | (11 | ) | | | (356 | ) |
| | |
Moody’s Corp. | | | (1 | ) | | | (133 | ) |
| | |
State Street Corp. | | | (2 | ) | | | (145 | ) |
| | |
T. Rowe Price Group, Inc. | | | (1 | ) | | | (109 | ) |
| | |
TD Ameritrade Holding Corp. | | | (4 | ) | | | (205 | ) |
SEE NOTES TO FINANCIAL STATEMENTS.
| | | | | | | | | | |
| | | | | |
| | J.P. MORGAN SPECIALTY FUNDS | | | | | | | | 49 |
JPMorgan Research Market Neutral Fund
SCHEDULE OF PORTFOLIO INVESTMENTS
AS OF APRIL 30, 2019 (AS RESTATED, SEE NOTE 8) (Unaudited) (continued)
| | | | | | | | |
| INVESTMENTS | | SHARES
(000) | | | VALUE
($000) | |
Short Positions — continued | | | | | | | | |
Common Stocks — continued | | | | | | | | |
| | |
Capital Markets — continued | | | | | | | | |
| | |
Waddell & Reed Financial, Inc., Class A | | | (20 | ) | | | (366 | ) |
| | | | | | | | |
| | |
| | | | | | | (2,708 | ) |
| | | | | | | | |
| | |
Chemicals — (2.8)% | | | | | | | | |
| | |
Albemarle Corp. | | | (7 | ) | | | (489 | ) |
| | |
LyondellBasell Industries NV, Class A | | | (11 | ) | | | (995 | ) |
| | |
PPG Industries, Inc. | | | (3 | ) | | | (373 | ) |
| | |
Westlake Chemical Corp. | | | (3 | ) | | | (210 | ) |
| | | | | | | | |
| | |
| | | | | | | (2,067 | ) |
| | | | | | | | |
| | |
Communications Equipment — (0.1)% | | | | | | | | |
| | |
Juniper Networks, Inc. | | | (3 | ) | | | (84 | ) |
| | | | | | | | |
|
Diversified Telecommunication Services — (1.4)% | |
| | |
AT&T, Inc. | | | (20 | ) | | | (614 | ) |
| | |
Verizon Communications, Inc. | | | (7 | ) | | | (395 | ) |
| | | | | | | | |
| | |
| | | | | | | (1,009 | ) |
| | | | | | | | |
| | |
Electric Utilities — (2.5)% | | | | | | | | |
| | |
Duke Energy Corp. | | | (7 | ) | | | (604 | ) |
| | |
Eversource Energy | | | (5 | ) | | | (385 | ) |
| | |
Southern Co. (The) | | | (17 | ) | | | (890 | ) |
| | | | | | | | |
| | |
| | | | | | | (1,879 | ) |
| | | | | | | | |
| | |
Electrical Equipment — (2.4)% | | | | | | | | |
| | |
Acuity Brands, Inc. | | | (4 | ) | | | (537 | ) |
| | |
Hubbell, Inc. | | | (6 | ) | | | (757 | ) |
| | |
Rockwell Automation, Inc. | | | (1 | ) | | | (224 | ) |
| | |
Sensata Technologies Holding plc * | | | (5 | ) | | | (228 | ) |
| | | | | | | | |
| | |
| | | | | | | (1,746 | ) |
| | | | | | | | |
|
Electronic Equipment, Instruments & Components — (0.4)% | |
| | |
Amphenol Corp., Class A | | | (3 | ) | | | (327 | ) |
| | | | | | | | |
| | |
Energy Equipment & Services — (1.9)% | | | | | | | | |
| | |
Helmerich & Payne, Inc. | | | (6 | ) | | | (362 | ) |
| | |
National Oilwell Varco, Inc. | | | (7 | ) | | | (190 | ) |
| | |
Schlumberger Ltd. | | | (20 | ) | | | (870 | ) |
| | | | | | | | |
| | |
| | | | | | | (1,422 | ) |
| | | | | | | | |
| | |
Entertainment — (1.2)% | | | | | | | | |
| | |
Cinemark Holdings, Inc. | | | (11 | ) | | | (456 | ) |
| | |
Viacom, Inc., Class B | | | (13 | ) | | | (389 | ) |
| | | | | | | | |
| | |
| | | | | | | (845 | ) |
| | | | | | | | |
|
Equity Real Estate Investment Trusts (REITs) — (3.0)% | |
| | |
Apartment Investment & Management Co., Class A | | | (2 | ) | | | (116 | ) |
| | |
Apple Hospitality REIT, Inc. | | | (10 | ) | | | (161 | ) |
| | |
Extra Space Storage, Inc. | | | (1 | ) | | | (89 | ) |
| | | | | | | | |
| INVESTMENTS | | SHARES
(000) | | | VALUE
($000) | |
| | | | | | | | |
| | | | | | | | |
|
Equity Real Estate Investment Trusts (REITs) — continued | |
| | |
Macerich Co. (The) | | | (10 | ) | | | (412 | ) |
| | |
Realty Income Corp. | | | (7 | ) | | | (518 | ) |
| | |
Regency Centers Corp. | | | (2 | ) | | | (102 | ) |
| | |
Simon Property Group, Inc. | | | (5 | ) | | | (810 | ) |
| | | | | | | | |
| | |
| | | | | | | (2,208 | ) |
| | | | | | | | |
| | |
Food & Staples Retailing — (1.5)% | | | | | | | | |
| | |
Kroger Co. (The) | | | (24 | ) | | | (609 | ) |
| | |
Sysco Corp. | | | (3 | ) | | | (219 | ) |
| | |
Walgreens Boots Alliance, Inc. | | | (6 | ) | | | (304 | ) |
| | | | | | | | |
| | |
| | | | | | | (1,132 | ) |
| | | | | | | | |
| | |
Food Products — (0.6)% | | | | | | | | |
| | |
Hershey Co. (The) | | | (2 | ) | | | (222 | ) |
| | |
Kellogg Co. | | | (4 | ) | | | (230 | ) |
| | | | | | | | |
| | |
| | | | | | | (452 | ) |
| | | | | | | | |
| | |
Gas Utilities — (0.3)% | | | | | | | | |
| | |
National Fuel Gas Co. | | | (4 | ) | | | (213 | ) |
| | | | | | | | |
| | |
Health Care Equipment & Supplies — (1.9)% | | | | | | | | |
| | |
Abbott Laboratories | | | (5 | ) | | | (425 | ) |
| | |
Dentsply Sirona, Inc. | | | (10 | ) | | | (511 | ) |
| | |
Varian Medical Systems, Inc. * | | | (3 | ) | | | (429 | ) |
| | | | | | | | |
| | |
| | | | | | | (1,365 | ) |
| | | | | | | | |
| | |
Health Care Providers & Services — (3.2)% | | | | | | | | |
| | |
AmerisourceBergen Corp. | | | (6 | ) | | | (446 | ) |
| | |
Cardinal Health, Inc. | | | (18 | ) | | | (863 | ) |
| | |
Henry Schein, Inc. * | | | (9 | ) | | | (580 | ) |
| | |
Humana, Inc. | | | (1 | ) | | | (196 | ) |
| | |
Patterson Cos., Inc. | | | (12 | ) | | | (262 | ) |
| | | | | | | | |
| | |
| | | | | | | (2,347 | ) |
| | | | | | | | |
| | |
Health Care Technology — (0.7)% | | | | | | | | |
| | |
Cerner Corp. * | | | (7 | ) | | | (487 | ) |
| | | | | | | | |
| | |
Hotels, Restaurants & Leisure — (2.6)% | | | | | | | | |
| | |
Chipotle Mexican Grill, Inc. * | | | (2 | ) | | | (1,298 | ) |
| | |
Domino’s Pizza, Inc. | | | (1 | ) | | | (225 | ) |
| | |
Starbucks Corp. | | | (5 | ) | | | (354 | ) |
| | | | | | | | |
| | |
| | | | | | | (1,877 | ) |
| | | | | | | | |
| | |
Household Durables — (0.9)% | | | | | | | | |
| | |
Toll Brothers, Inc. | | | (6 | ) | | | (224 | ) |
| | |
Whirlpool Corp. | | | (3 | ) | | | (434 | ) |
| | | | | | | | |
| | |
| | | | | | | (658 | ) |
| | | | | | | | |
SEE NOTES TO FINANCIAL STATEMENTS.
| | | | | | | | | | |
| | | | | |
| 50 | | | | | | | | J.P. MORGAN SPECIALTY FUNDS | | |
| | | | | | | | |
| INVESTMENTS | | SHARES
(000) | | | VALUE
($000) | |
Short Positions — continued | | | | | | | | |
Common Stocks — continued | | | | | | | | |
| | |
Household Products — (2.4)% | | | | | | | | |
| | |
Church & Dwight Co., Inc. | | | (2 | ) | | | (167 | ) |
| | |
Clorox Co. (The) | | | (5 | ) | | | (735 | ) |
| | |
Colgate-Palmolive Co. | | | (12 | ) | | | (869 | ) |
| | | | | | | | |
| | |
| | | | | | | (1,771 | ) |
| | | | | | | | |
| | |
Industrial Conglomerates — (0.6)% | | | | | | | | |
| | |
3M Co. | | | (2 | ) | | | (434 | ) |
| | | | | | | | |
| | |
Insurance — (2.2)% | | | | | | | | |
| | |
Aflac, Inc. | | | (2 | ) | | | (97 | ) |
| | |
Arch Capital Group Ltd. * | | | (5 | ) | | | (172 | ) |
| | |
Chubb Ltd. | | | (4 | ) | | | (649 | ) |
| | |
RenaissanceRe Holdings Ltd. (Bermuda) | | | (1 | ) | | | (186 | ) |
| | |
Torchmark Corp. | | | (4 | ) | | | (367 | ) |
| | |
Unum Group | | | (4 | ) | | | (140 | ) |
| | | | | | | | |
| | |
| | | | | | | (1,611 | ) |
| | | | | | | | |
| | |
Interactive Media & Services — (0.2)% | | | | | | | | |
| | |
Snap, Inc., Class A * | | | (12 | ) | | | (137 | ) |
| | | | | | | | |
| | |
Internet & Direct Marketing Retail — (1.6)% | | | | | | | | |
| | |
eBay, Inc. | | | (31 | ) | | | (1,200 | ) |
| | | | | | | | |
| | |
IT Services — (1.8)% | | | | | | | | |
| | |
Infosys Ltd., ADR (India) | | | (27 | ) | | | (295 | ) |
| | |
International Business Machines Corp. | | | (4 | ) | | | (501 | ) |
| | |
Western Union Co. (The) | | | (28 | ) | | | (542 | ) |
| | | | | | | | |
| | |
| | | | | | | (1,338 | ) |
| | | | | | | | |
| | |
Leisure Products — (1.3)% | | | | | | | | |
| | |
Hasbro, Inc. | | | (5 | ) | | | (550 | ) |
| | |
Mattel, Inc. * | | | (31 | ) | | | (373 | ) |
| | | | | | | | |
| | |
| | | | | | | (923 | ) |
| | | | | | | | |
| | |
Life Sciences Tools & Services — (0.4)% | | | | | | | | |
| | |
Waters Corp. * | | | (1 | ) | | | (278 | ) |
| | | | | | | | |
| | |
Machinery — (1.0)% | | | | | | | | |
| | |
Donaldson Co., Inc. | | | (6 | ) | | | (336 | ) |
| | |
Illinois Tool Works, Inc. | | | (2 | ) | | | (358 | ) |
| | | | | | | | |
| | |
| | | | | | | (694 | ) |
| | | | | | | | |
| | |
Media — (4.4)% | | | | | | | | |
| | |
AMC Networks, Inc., Class A * | | | (11 | ) | | | (650 | ) |
| | |
CBS Corp. (Non-Voting), Class B | | | (7 | ) | | | (348 | ) |
| | |
Fox Corp., Class A * | | | (5 | ) | | | (201 | ) |
| | |
Interpublic Group of Cos., Inc. (The) | | | (16 | ) | | | (366 | ) |
| | |
News Corp., Class A | | | (47 | ) | | | (579 | ) |
| | |
Omnicom Group, Inc. | | | (13 | ) | | | (1,080 | ) |
| | | | | | | | |
| | |
| | | | | | | (3,224 | ) |
| | | | | | | | |
| | | | | | | | |
| INVESTMENTS | | SHARES
(000) | | | VALUE
($000) | |
| | | | | | | | |
| | | | | | | | |
| | |
Metals & Mining — (0.5)% | | | | | | | | |
| | |
Compass Minerals International, Inc. | | | (7 | ) | | | (381 | ) |
| | | | | | | | |
| | |
Multiline Retail — (0.4)% | | | | | | | | |
| | |
Macy’s, Inc. | | | (12 | ) | | | (278 | ) |
| | | | | | | | |
| | |
Multi-Utilities — (2.9)% | | | | | | | | |
| | |
Ameren Corp. | | | (4 | ) | | | (315 | ) |
| | |
Consolidated Edison, Inc. | | | (2 | ) | | | (156 | ) |
| | |
Dominion Energy, Inc. | | | (20 | ) | | | (1,528 | ) |
| | |
NiSource, Inc. | | | (4 | ) | | | (111 | ) |
| | | | | | | | |
| | |
| | | | | | | (2,110 | ) |
| | | | | | | | |
| | |
Oil, Gas & Consumable Fuels — (4.5)% | | | | | | | | |
| | |
Apache Corp. | | | (9 | ) | | | (296 | ) |
| | |
Chevron Corp. | | | (1 | ) | | | (115 | ) |
| | |
Enbridge, Inc. (Canada) | | | (13 | ) | | | (497 | ) |
| | |
Exxon Mobil Corp. | | | (15 | ) | | | (1,171 | ) |
| | |
Hess Corp. | | | (7 | ) | | | (439 | ) |
| | |
Kinder Morgan, Inc. | | | (5 | ) | | | (103 | ) |
| | |
Noble Energy, Inc. | | | (5 | ) | | | (125 | ) |
| | |
Phillips 66 | | | (2 | ) | | | (217 | ) |
| | |
Range Resources Corp. | | | (29 | ) | | | (260 | ) |
| | |
Williams Cos., Inc. (The) | | | (4 | ) | | | (103 | ) |
| | | | | | | | |
| | |
| | | | | | | (3,326 | ) |
| | | | | | | | |
| | |
Paper & Forest Products — (0.7)% | | | | | | | | |
| | |
Domtar Corp. | | | (11 | ) | | | (533 | ) |
| | | | | | | | |
| | |
Professional Services — (1.0)% | | | | | | | | |
| | |
Robert Half International, Inc. | | | (13 | ) | | | (784 | ) |
| | | | | | | | |
| | |
Road & Rail — (2.2)% | | | | | | | | |
| | |
Heartland Express, Inc. | | | (52 | ) | | | (1,016 | ) |
| | |
Knight-Swift Transportation Holdings, Inc. | | | (4 | ) | | | (121 | ) |
| | |
Schneider National, Inc., Class B | | | (12 | ) | | | (261 | ) |
| | |
Werner Enterprises, Inc. | | | (7 | ) | | | (231 | ) |
| | | | | | | | |
| | |
| | | | | | | (1,629 | ) |
| | | | | | | | |
|
Semiconductors & Semiconductor Equipment — (4.3)% | |
| | |
Applied Materials, Inc. | | | (6 | ) | | | (277 | ) |
| | |
Intel Corp. | | | (15 | ) | | | (770 | ) |
| | |
KLA-Tencor Corp. | | | (2 | ) | | | (300 | ) |
| | |
Lam Research Corp. | | | (2 | ) | | | (456 | ) |
| | |
Micron Technology, Inc. * | | | (15 | ) | | | (635 | ) |
| | |
Qorvo, Inc. * | | | (5 | ) | | | (347 | ) |
| | |
Skyworks Solutions, Inc. | | | (4 | ) | | | (374 | ) |
| | | | | | | | |
| | |
| | | | | | | (3,159 | ) |
| | | | | | | | |
SEE NOTES TO FINANCIAL STATEMENTS.
| | | | | | | | | | |
| | | | | |
| | J.P. MORGAN SPECIALTY FUNDS | | | | | | | | 51 |
JPMorgan Research Market Neutral Fund
SCHEDULE OF PORTFOLIO INVESTMENTS
AS OF APRIL 30, 2019 (AS RESTATED, SEE NOTE 8) (Unaudited) (continued)
| | | | | | | | |
| INVESTMENTS | | SHARES
(000) | | | VALUE
($000) | |
Short Positions — continued | | | | | | | | |
Common Stocks — continued | | | | | | | | |
| | |
Software — (0.9)% | | | | | | | | |
| | |
Citrix Systems, Inc. | | | (3 | ) | | | (306 | ) |
| | |
Teradata Corp. * | | | (7 | ) | | | (336 | ) |
| | | | | | | | |
| | |
| | | | | | | (642 | ) |
| | | | | | | | |
| | |
Specialty Retail — (4.0)% | | | | | | | | |
| | |
Abercrombie & Fitch Co., Class A | | | (3 | ) | | | (104 | ) |
| | |
Ascena Retail Group, Inc. * | | | (103 | ) | | | (122 | ) |
| | |
AutoNation, Inc. * | | | (2 | ) | | | (90 | ) |
| | |
Bed Bath & Beyond, Inc. | | | (25 | ) | | | (417 | ) |
| | |
Buckle, Inc. (The) | | | (6 | ) | | | (108 | ) |
| | |
CarMax, Inc. * | | | (7 | ) | | | (539 | ) |
| | |
Designer Brands, Inc. | | | (10 | ) | | | (230 | ) |
| | |
Express, Inc. * | | | (16 | ) | | | (57 | ) |
| | |
Gap, Inc. (The) | | | (8 | ) | | | (220 | ) |
| | |
L Brands, Inc. | | | (9 | ) | | | (221 | ) |
| | |
Tiffany & Co. | | | (3 | ) | | | (329 | ) |
| | |
Williams-Sonoma, Inc. | | | (8 | ) | | | (474 | ) |
| | | | | | | | |
| | |
| | | | | | | (2,911 | ) |
| | | | | | | | |
|
Technology Hardware, Storage & Peripherals — (3.5)% | |
| | |
Apple, Inc. | | | (2 | ) | | | (473 | ) |
| | |
Hewlett Packard Enterprise Co. | | | (13 | ) | | | (200 | ) |
| | |
HP, Inc. | | | (13 | ) | | | (254 | ) |
| | |
NetApp, Inc. | | | (4 | ) | | | (304 | ) |
| | |
Seagate Technology plc | | | (17 | ) | | | (818 | ) |
| | |
Western Digital Corp. | | | (11 | ) | | | (546 | ) |
| | | | | | | | |
| | |
| | | | | | | (2,595 | ) |
| | | | | | | | |
| | |
Textiles, Apparel & Luxury Goods — (0.7)% | | | | | | | | |
| | |
Under Armour, Inc., Class A * | | | (17 | ) | | | (392 | ) |
| | |
Under Armour, Inc., Class C * | | | (6 | ) | | | (134 | ) |
| | | | | | | | |
| | |
| | | | | | | (526 | ) |
| | | | | | | | |
| | | | | | | | |
| INVESTMENTS | | SHARES
(000) | | | VALUE
($000) | |
| | | | | | | | |
| | | | | | | | |
| | |
Water Utilities — (0.2)% | | | | | | | | |
| | |
American Water Works Co., Inc. | | | (1 | ) | | | (123 | ) |
| | | | | | | | |
| | |
Wireless Telecommunication Services — (0.6)% | | | | | | | | |
| | |
Sprint Corp. * | | | (78 | ) | | | (435 | ) |
| | | | | | | | |
| | |
Total Common Stocks
(Proceeds $(68,030)) | | | | | | | (62,646 | ) |
| | | | | | | | |
| | |
Total Short Positions
(Proceeds $(68,030)) | | | | | | | (62,646 | ) |
| | | | | | | | |
Total Investments — 14.0%
(Cost $(12,527)) | | | | | | | 10,256 | |
Other Assets Less Liabilities — 86.0% | | | | | | | 63,208 | |
| | | | | | | | |
Net Assets — 100.0% | | | | | | | 73,464 | |
| | | | | | | | |
Future share reacquisition adjustment — 0% | | | | | | | 2 | |
| | | | | | | | |
Net assets after future share reacquisition adjustment — 100% | | | | | | $ | 73,466 | |
| | | | | | | | |
Percentages indicated are based on net assets.
Abbreviations
| | |
| ADR | | American Depositary Receipt |
| REIT | | Real Estate Investment Trust |
| |
| (a) | | All or a portion of this security is segregated as collateral for short sales. The total value of securities is approximately $15,589,000, respectively. |
| (b) | | Amount rounds to less than one thousand. |
| (c) | | Investment in affiliate. Fund is registered under the Investment Company Act of 1940, as amended, and advised by J.P. Morgan Investment Management Inc. |
| (d) | | The rate shown is the current yield as of April 30, 2019. |
| * | | Non-income producing security. |
Futures contracts outstanding as of April 30, 2019 (amounts in thousands, except number of contracts):
| | | | | | | | | | | | | | | | | | | | |
| DESCRIPTION | | NUMBER OF
CONTRACTS | | | EXPIRATION
DATE | | | TRADING
CURRENCY | | | NOTIONAL
AMOUNT ($) | | | VALUE AND
UNREALIZED
APPRECIATION
(DEPRECIATION) ($) | |
Short Contracts | | | | | | | | | | | | | | | | | | | | |
S&P 500 E-Mini Index | | | (7 | ) | | | 06/2019 | | | | USD | | | | (1,032 | ) | | | (7 | ) |
| | | | | | | | | | | | | | | | | | | | |
| | | | | |
| | | | | | | | | | | | | | | | | | | (7 | ) |
| | | | | | | | | | | | | | | | | | | | |
Abbreviations
SEE NOTES TO FINANCIAL STATEMENTS.
| | | | | | | | | | |
| | | | | |
| 52 | | | | | | | | J.P. MORGAN SPECIALTY FUNDS | | |
STATEMENTS OF ASSETS AND LIABILITIES (AS RESTATED, SEE NOTE 8)
AS OF THE DATES INDICATED (Unaudited)
(Amounts in thousands, except per share amounts)
| | | | | | | | | | | | | | | | | | | | |
| | | JPMorgan Research Market Neutral Fund | |
| | | April 30, 2023 | | | April 30, 2022 | | | April 30, 2021 | | | April 30, 2020 | | | April 30, 2019 | |
ASSETS: | | | | | | | | | | | | | | | | | | | | |
Investments in non-affiliates, at a value | | $ | 129,154 | | | $ | 83,904 | | | $ | 81,734 | | | $ | 62,402 | | | $ | 63,724 | |
Investments in affiliates, at value | | | 35,792 | | | | 38,468 | | | | 12,596 | | | | 14,179 | | | | 9,178 | |
Cash | | | — | | | | — | | | | — | (a) | | | 2,678 | | | | — | |
Deposits at broker for future contracts | | | 357 | | | | 72 | | | | 142 | | | | 250 | | | | 212 | |
Deposits at broker for securities sold short | | | 120,196 | | | | 80,921 | | | | 71,488 | | | | 63,226 | | | | 61,931 | |
Receivables: | | | | | | | | | | | | | | | | | | | | |
Investment securities sold | | | 6,983 | | | | 3,524 | | | | 1,809 | | | | 4,308 | | | | 1,781 | |
Fund shares sold | | | 224 | | | | 271 | | | | 48 | | | | 1,309 | | | | 167 | |
Interest from non-affiliates | | | 515 | | | | 45 | | | | 37 | | | | 85 | | | | 17 | |
Dividends from non-affiliates | | | 71 | | | | 54 | | | | 40 | | | | — | | | | 245 | |
Dividends from affiliates | | | 125 | | | | 10 | | | | 1 | | | | 12 | | | | 46 | |
Variation margin on futures contracts | | | — | | | | — | | | | 17 | | | | 18 | | | | — | |
Class Action proceeds | | | 1,154 | | | | 1,146 | | | | 1,117 | | | | 1,077 | | | | 656 | |
| | | | | | | | | | | | | | | | | | | | |
Total Assets | | | 294,571 | | | | 208,415 | | | | 169,029 | | | | 149,544 | | | | 137,957 | |
| | | | | | | | | | | | | | | | | | | | |
| | | | | |
LIABILITIES: | | | | | | | | | | | | | | | | | | | | |
Payables: | | | | | | | | | | | | | | | | | | | | |
Due to custodian | | | 14 | | | | 9 | | | | — | | | | — | | | | — | |
Due to broker | | | — | | | | — | | | | — | | | | 2,677 | | | | 2 | |
Securities sold short, at value | | | 122,346 | | | | 78,963 | | | | 71,353 | | | | 58,647 | | | | 62,646 | |
Dividend expense to non-affiliates on securities sold short | | | 95 | | | | 72 | | | | 60 | | | | 69 | | | | 106 | |
Investment securities purchased | | | 7,012 | | | | 3,634 | | | | 1,892 | | | | 4,756 | | | | 1,328 | |
Interest expense to non-affiliates on securities sold short | | | — | | | | — | | | | 10 | | | | 10 | | | | — | |
Fund shares redeemed | | | 107 | | | | 54 | | | | 111 | | | | 215 | | | | 244 | |
Variation margin on futures contracts | | | 55 | | | | 2 | | | | — | | | | — | | | | 3 | |
Accrued liabilities: | | | | | | | | | | | | | | | | | | | | |
Investment advisory fees | | | 29 | | | | 26 | | | | 13 | | | | 28 | | | | 64 | |
Administration fees | | | 3 | | | | 3 | | | | — | | | | 1 | | | | — | |
Distribution fees | | | 6 | | | | 5 | | | | 4 | | | | 5 | | | | 6 | |
Service fees | | | 32 | | | | 25 | | | | 19 | | | | 13 | | | | 17 | |
Custodian and accounting fees | | | 16 | | | | 8 | | | | 11 | | | | 11 | | | | 10 | |
Trustees’ and Chief Compliance Officer’s fees | | | — | | | | 1 | | | | — | (a) | | | — | (a) | | | — | |
Due to shareholders upon reprocessing | | | 5,671 | | | | 4,281 | | | | 3,324 | | | | 780 | | | | 5 | |
Other | | | 29 | | | | 80 | | | | 79 | | | | 57 | | | | 62 | |
| | | | | | | | | | | | | | | | | | | | |
Total Liabilities | | | 135,415 | | | | 87,163 | | | | 76,876 | | | | 67,269 | | | | 64,493 | |
| | | | | | | | | | | | | | | | | | | | |
Net Assets | | | 159,156 | | | | 121,252 | | | | 92,153 | | | | 82,275 | | | | 73,464 | |
| | | | | | | | | | | | | | | | | | | | |
Future share reacquisition adjustment | | | 7,287 | | | | 5,335 | | | | 3,824 | | | | 1,023 | | | | 2 | |
| | | | | | | | | | | | | | | | | | | | |
Net assets after future share reacquisition adjustment | | $ | 166,443 | | | $ | 126,587 | | | $ | 95,977 | | | $ | 83,298 | | | $ | 73,466 | |
| | | | | | | | | | | | | | | | | | | | |
| (a) | Amount rounds to less than one thousand. |
SEE NOTES TO FINANCIAL STATEMENTS.
| | | | | | | | | | |
| | | | | |
| | J.P. MORGAN SPECIALTY FUNDS | | | | | | | | 53 |
STATEMENTS OF ASSETS AND LIABILITIES (AS RESTATED, SEE NOTE 8)
AS OF THE DATES INDICATED (Unaudited) (continued)
(Amounts in thousands, except per share amounts)
| | | | | | | | | | | | | | | | | | | | |
| | | JPMorgan Research Market Neutral Fund | |
| | | April 30, 2023 | | | April 30, 2022 | | | April 30, 2021 | | | April 30, 2020 | | | April 30, 2019 | |
NET ASSETS: | | | | | | | | | | | | | | | | | | | | |
Paid-in-Capital | | $ | 168,239 | | | $ | 140,524 | | | $ | 109,416 | | | $ | 95,306 | | | $ | 86,604 | |
Total distributable earnings (loss) | | | (9,083 | ) | | | (19,272 | ) | | | (17,263 | ) | | | (13,031 | ) | | | (13,140 | ) |
| | | | | | | | | | | | | | | | | | | | |
Total Net Assets | | | 159,156 | | | | 121,252 | | | | 92,153 | | | | 82,275 | | | | 73,464 | |
| | | | | | | | | | | | | | | | | | | | |
Future share reacquisition adjustment | | | 7,287 | | | | 5,335 | | | | 3,824 | | | | 1,023 | | | | 2 | |
| | | | | | | | | | | | | | | | | | | | |
Net assets after future share reacquisition adjustment | | $ | 166,443 | | | $ | 126,587 | | | $ | 95,977 | | | $ | 83,298 | | | $ | 73,466 | |
| | | | | | | | | | | | | | | | | | | | |
| | | | | |
Net Assets: | | | | | | | | | | | | | | | | | | | | |
Class A | | $ | 22,677 | | | $ | 19,920 | | | $ | 13,950 | | | $ | 16,117 | | | $ | 14,534 | |
Class C | | | 1,734 | | | | 1,149 | | | | 1,587 | | | | 2,749 | | | | 4,871 | |
Class I | | | 142,032 | | | | 105,518 | | | | 80,440 | | | | 44,317 | | | | 32,659 | |
Class L | | | — | | | | — | | | | — | | | | 20,115 | | | | 21,402 | |
| | | | | | | | | | | | | | | | | | | | |
Total | | $ | 166,443 | | | $ | 126,587 | | | $ | 95,977 | | | $ | 83,298 | | | $ | 73,466 | |
| | | | | | | | | | | | | | | | | | | | |
| | | | | |
Outstanding units of beneficial interest (shares) ($0.0001 par value; unlimited number of shares authorized): | | | | | | | | | | | | | | | | | | | | |
Class A | | | 1,749 | | | | 1,621 | | | | 1,116 | | | | 1,253 | | | | 1,107 | |
Class C | | | 151 | | | | 105 | | | | 141 | | | | 235 | | | | 402 | |
Class I | | | 10,208 | | | | 8,015 | | | | 6,023 | | | | 3,248 | | | | 2,365 | |
Class L | | | — | | | | — | | | | — | | | | 1,436 | | | | 1,516 | |
| | | | | |
Net Asset Value (a): (after future share reacquisition adjustment) | | | | | | | | | | | | | | | | | | | | |
Class A — Redemption price per share | | $ | 12.96 | | | $ | 12.29 | | | $ | 12.50 | | | $ | 12.86 | | | $ | 13.13 | |
Class C — Offering price per share (b) | | | 11.50 | | | | 10.96 | | | | 11.20 | | | | 11.67 | | | | 12.11 | |
Class I — Offering and redemption price per share | | | 13.91 | | | | 13.16 | | | | 13.33 | | | | 13.64 | | | | 13.81 | |
Class L (c) — Offering and redemption price per share | | | — | | | | — | | | | — | | | | 14.01 | | | | 14.12 | |
Class A maximum sales charge | | | 5.25 | % | | | 5.25 | % | | | 5.25 | % | | | 5.25 | % | | | 5.25 | % |
Class A maximum public offering price per share [net asset value per share/(100% – maximum sales charge)] | | $ | 13.68 | | | $ | 12.97 | | | $ | 13.19 | | | $ | 13.57 | | | $ | 13.86 | |
| | | | | | | | | | | | | | | | | | | | |
| | | | | |
Cost of investments in non-affiliates | | $ | 110,060 | | | $ | 73,623 | | | $ | 54,766 | | | $ | 51,048 | | | $ | 46,327 | |
Cost of investments in affiliates | | | 35,790 | | | | 38,464 | | | | 12,593 | | | | 14,162 | | | | 9,176 | |
Proceeds from securities sold short | | | 127,615 | | | | 84,734 | | | | 65,774 | | | | 64,173 | | | | 68,030 | |
| (a) | Per share amounts may not recalculate due to rounding of net assets and/or shares outstanding. |
| (b) | Redemption price for Class C Shares varies based upon length of time the shares are held. |
| (c) | On July 2, 2020, the Fund’s Class L Shares were converted into Class I Shares. Additionally, as of July 2, 2020, the Class L Shares are no longer offered. |
SEE NOTES TO FINANCIAL STATEMENTS.
| | | | | | | | | | |
| | | | | |
| 54 | | | | | | | | J.P. MORGAN SPECIALTY FUNDS | | |
STATEMENTS OF OPERATIONS (AS RESTATED, SEE NOTE 8)
FOR THE PERIODS INDICATED (Unaudited)
(Amounts in thousands)
| | | | | | | | | | | | | | | | | | | | |
| | | JPMorgan Research Market Neutral Fund | |
| | | Six Months
Ended
April 30, 2023 | | | Six Months
Ended
April 30, 2022 | | | Six Months
Ended
April 30, 2021 | | | Six Months
Ended
April 30, 2020 | | | Six Months
Ended
April 30, 2019 | |
INVESTMENT INCOME: | | | | | | | | | | | | | | | | | | | | |
Interest income from non-affiliates | | $ | 2,449 | | | $ | 2 | | | $ | 1 | | | $ | 7 | (a) | | $ | 10 | |
Interest income from affiliates | | | 33 | | | | — | | | | — | | | | — | | | | — | (a) |
Interest income from non-affiliates on securities sold short | | | 807 | | | | — | | | | — | | | | 199 | | | | 1,505 | |
Dividend income from non-affiliate | | | 716 | | | | 606 | | | | 702 | | | | 365 | | | | 1,200 | |
Dividend income from affiliates | | | — | | | | 17 | | | | 4 | | | | 69 | | | | 282 | |
| | | | | | | | | | | | | | | | | | | | |
Total investment income | | | 4,005 | | | | 625 | | | | 707 | | | | 640 | | | | 2,997 | |
| | | | | | | | | | | | | | | | | | | | |
| | | | | |
EXPENSES: | | | | | | | | | | | | | | | | | | | | |
Investment advisory fees | | | 275 | | | | 195 | | | | 190 | | | | 173 | | | | 665 | |
Administration fees | | | 59 | | | | 42 | | | | 41 | | | | 22 | | | | 64 | |
Distribution fees: | | | | | | | | | | | | | | | | | | | | |
Class A | | | 27 | | | | 23 | | | | 19 | | | | 17 | | | | 18 | |
Class C | | | 6 | | | | 5 | | | | 7 | | | | 11 | | | | 20 | |
Service fees: | | | | | | | | | | | | | | | | | | | | |
Class A | | | 27 | | | | 23 | | | | 19 | | | | 17 | | | | 18 | |
Class C | | | 2 | | | | 2 | | | | 2 | | | | 4 | | | | 7 | |
Class I | | | 168 | | | | 115 | | | | 115 | | | | 32 | | | | 43 | |
Class L | | | — | | | | — | | | | — | | | | 8 | | | | 56 | |
Custodian and accounting fees | | | 20 | | | | 21 | | | | 18 | | | | 14 | | | | 17 | |
Interest expense to affiliates | | | — | | | | — | | | | — | (a) | | | — | (a) | | | — | (a) |
Professional fees | | | 33 | | | | 35 | | | | 29 | | | | 31 | | | | 30 | |
Trustees’ and Chief Compliance Officer’s fees | | | 13 | | | | 13 | | | | 12 | | | | 13 | | | | 13 | |
Printing and mailing costs | | | 15 | | | | 3 | | | | 1 | | | | 14 | | | | 14 | |
Registration and filing fees | | | 30 | | | | 34 | | | | 33 | | | | 27 | | | | 28 | |
Transfer agency fees (See Note 2.I.) | | | 3 | | | | 3 | | | | 3 | | | | 5 | | | | 6 | |
Dividend expense to non-affiliates on securities sold short | | | 1,524 | | | | 1,110 | | | | 1,054 | | | | 685 | | | | 2,018 | |
Interest income to non-affiliates on securities sold short | | | — | | | | 49 | | | | 87 | | | | — | | | | — | |
Other | | | 4 | | | | 6 | | | | 3 | | | | 4 | | | | 5 | |
| | | | | | | | | | | | | | | | | | | | |
Total expenses | | | 2,206 | | | | 1,679 | | | | 1,633 | | | | 1,077 | | | | 3,022 | |
| | | | | | | | | | | | | | | | | | | | |
Less fees waived | | | (143 | ) | | | (115 | ) | | | (101 | ) | | | (96 | ) | | | (244 | ) |
Less expense reimbursements | | | (1 | ) | | | — | | | | — | | | | — | | | | — | |
| | | | | | | | | | | | | | | | | | | | |
Net expenses | | | 2,062 | | | | 1,564 | | | | 1,532 | | | | 981 | | | | 2,778 | |
| | | | | | | | | | | | | | | | | | | | |
Net investment income (loss) | | | 1,943 | | | | (939 | ) | | | (825 | ) | | | (341 | ) | | | 219 | |
| | | | | | | | | | | | | | | | | | | | |
| | | | | |
REALIZED/UNREALIZED GAINS (LOSSES): | | | | | | | | | | | | | | | | | | | | |
Net realized gain (loss) on transactions from: | | | | | | | | | | | | | | | | | | | | |
Investments in non-affiliates | | | (998 | ) | | | 5,131 | | | | 20,997 | | | | 4,130 | | | | 22,977 | |
Investments in affiliates | | | 2 | | | | (7 | ) | | | 3 | | | | (3 | ) | | | 10 | |
Futures contracts | | | 18 | | | | (485 | ) | | | (555 | ) | | | 796 | | | | 228 | |
Securities sold short | | | (647 | ) | | | (3,669 | ) | | | (18,371 | ) | | | 792 | | | | (3,147 | ) |
Foreign currency transactions | | | — | | | | — | | | | — | | | | — | | | | — | (a) |
| | | | | | | | | | | | | | | | | | | | |
Net realized gain (loss) | | | (1,625 | ) | | | 970 | | | | 2,074 | | | | 5,715 | | | | 20,068 | |
| | | | | | | | | | | | | | | | | | | | |
Change in net unrealized appreciation/depreciation on: | | | | | | | | | | | | | | | | | | | | |
Investments in non-affiliates | | | 9,347 | | | | (12,965 | ) | | | 14,117 | | | | (573 | ) | | | (8,830 | ) |
Investments in affiliates | | | — | | | | 1 | | | | (3 | ) | | | 14 | | | | (1 | )(a) |
Futures contracts | | | (158 | ) | | | 7 | | | | (82 | ) | | | (26 | ) | | | (22 | ) |
Securities sold short | | | (930 | ) | | | 9,626 | | | | (14,057 | ) | | | 300 | | | | (8,904 | ) |
Foreign currency translations | | | — | | | | — | | | | — | (a) | | | — | | | | — | |
| | | | | | | | | | | | | | | | | | | | |
Change in net unrealized appreciation/depreciation | | | 8,259 | | | | (3,331 | ) | | | (25 | ) | | | (285 | ) | | | (17,757 | ) |
| | | | | | | | | | | | | | | | | | | | |
Net realized/unrealized gains (losses | | | 6,634 | | | | (2,361 | ) | | | 2,049 | | | | 5,430 | | | | 2,311 | |
| | | | | | | | | | | | | | | | | | | | |
Change in net assets resulting from operations | | $ | 8,577 | | | $ | (3,300 | ) | | $ | 1,224 | | | $ | 5,089 | | | $ | 2,530 | |
| | | | | | | | | | | | | | | | | | | | |
| (a) | Amount rounds to less than one thousand. |
SEE NOTES TO FINANCIAL STATEMENTS.
| | | | | | | | | | |
| | | | | |
| | J.P. MORGAN SPECIALTY FUNDS | | | | | | | | 55 |
STATEMENTS OF CHANGES (AS RESTATED, SEE NOTE 8)
FOR THE PERIODS INDICATED (Unaudited)
(Amounts in thousands)
| | | | | | | | | | | | | | | | | | | | |
| | | JPMorgan Research Market Neutral Fund | |
| | | Six Months Ended
April 30, 2023 | | | Year Ended
October 31, 2022 | | | Six Months Ended
April 30, 2022 | | | Year Ended
October 31, 2021 | | | Six Months Ended
April 30, 2021 | |
CHANGE IN NET ASSETS RESULTING FROM OPERATIONS: | | | | | | | | | | | | | | | | | | | | |
Net investment income (loss) | | $ | 1,943 | | | $ | (655 | ) | | $ | (939 | ) | | $ | (1,564 | ) | | $ | (825 | ) |
Net realized gain (loss) | | | (1,625 | ) | | | 863 | | | | 970 | | | | 5,752 | | | | 2,074 | |
Change in net unrealized appreciation/depreciation | | | 8,259 | | | | (3,440 | ) | | | (3,331 | ) | | | (2,033 | ) | | | (25 | ) |
| | | | | | | | | | | | | | | | | | | | |
Change in net assets resulting from operations | | | 8,577 | | | | (3,232 | ) | | | (3,300 | ) | | | 2,155 | | | | 1,224 | |
| | | | | | | | | | | | | | | | | | | | |
| | | | | |
DISTRIBUTION TO SHAREHOLDERS | | | | | | | | | | | | | | | | | | | | |
Class A | | | — | | | | — | | | | — | | | | (1,124 | ) | | | (1,124 | ) |
Class C | | | — | | | | — | | | | — | | | | (159 | ) | | | (159 | ) |
Class I | | | — | | | | — | | | | — | | | | (6,901 | ) | | | (6,901 | ) |
Class L (a) | | | — | | | | — | | | | — | | | | — | | | | — | |
| | | | | | | | | | | | | | | | | | | | |
Total distributions to shareholders | | | — | | | | — | | | | — | | | | (8,184 | ) | | | (8,184 | ) |
| | | | | | | | | | | | | | | | | | | | |
| | | | | |
CAPITAL TRANSACTIONS: | | | | | | | | | | | | | | | | | | | | |
Change in net assets resulting from capital transactions | | | (4,217 | ) | | | 68,370 | | | | 34,894 | | | | (44,968 | ) | | | (41,542 | ) |
| | | | | | | | | | | | | | | | | | | | |
| | | | | |
NET ASSETS: | | | | | | | | | | | | | | | | | | | | |
Change in net assets | | | 4,360 | | | | 65,138 | | | | 31,594 | | | | (50,997 | ) | | | (48,502 | ) |
Beginning of period | | | 154,796 | | | | 89,658 | | | | 89,658 | | | | 140,655 | | | | 140,655 | |
| | | | | | | | | | | | | | | | | | | | |
End of period | | | 159,156 | | | | 154,796 | | | | 121,252 | | | | 89,658 | | | | 92,153 | |
| | | | | | | | | | | | | | | | | | | | |
Future share reacquisition adjustment | | | 7,287 | | | | 6,425 | | | | 5,335 | | | | 4,137 | | | | 3,824 | |
| | | | | | | | | | | | | | | | | | | | |
End of period after future share reacquisition adjustment | | $ | 166,443 | | | $ | 161,221 | | | $ | 126,587 | | | $ | 93,795 | | | $ | 95,977 | |
| | | | | | | | | | | | | | | | | | | | |
| (a) | On July 2, 2020, the Fund’s Class L Shares were converted into Class I Shares. Additionally, as of July 2, 2020, the Class L Shares are no longer offered. |
SEE NOTES TO FINANCIAL STATEMENTS.
| | | | | | | | | | |
| | | | | |
| 56 | | | | | | | | J.P. MORGAN SPECIALTY FUNDS | | |
| | | | | | | | | | | | | | |
| |
Year Ended
October 31, 2020 | | | Six Months Ended
April 30, 2020 | | | Year Ended
October 31, 2019 | | | Six Months Ended
April 30, 2019 | |
| | | | | | | | | | | | | | | |
| | | | | | | | | | | | | | |
| | $(1,082) | | | $ | (341 | ) | | $ | 125 | | | $ | 219 | |
| | 4,614 | | | | 5,715 | | | | 26,566 | | | | 20,068 | |
| 4,263 | | | | (285 | ) | | | (23,376 | ) | | | (17,757 | ) |
| | | | | | | | | | | | | | |
| 7,795 | | | | 5,089 | | | | 3,315 | | | | 2,530 | |
| | | | | | | | | | | | | | |
| | | |
| | | | | | | | | | | | | | |
| | (1,559) | | | | (1,556 | ) | | | (1,481 | ) | | | (1,479 | ) |
| | (450) | | | | (450 | ) | | | (543 | ) | | | (542 | ) |
| | (2,527) | | | | (2,515 | ) | | | (3,249 | ) | | | (3,244 | ) |
| | (1,689) | | | | (1,689 | ) | | | (8,556 | ) | | | (8,554 | ) |
| | | | | | | | | | | | | | |
| | (6,225) | | | | (6,210 | ) | | | (13,829 | ) | | | (13,819 | ) |
| | | | | | | | | | | | | | |
| | | |
| | | | | | | | | | | | | | |
| 76,043 | | | | 20,354 | | | | (112,143 | ) | | | (100,946 | ) |
| | | | | | | | | | | | | | |
| | | |
| | | | | | | | | | | | | | |
| | 77,613 | | | | 19,233 | | | | (122,657 | ) | | | (112,235 | ) |
| | 63,042 | | | | 63,042 | | | | 185,699 | | | | 185,699 | |
| | | | | | | | | | | | | | |
| | 140,655 | | | | 82,275 | | | | 63,042 | | | | 73,464 | |
| | | | | | | | | | | | | | |
| | 2,950 | | | | 1,023 | | | | 63 | | | | 2 | |
| | | | | | | | | | | | | | |
| $143,605 | | | $ | 83,298 | | | $ | 63,105 | | | $ | 73,466 | |
| | | | | | | | | | | | | | |
SEE NOTES TO FINANCIAL STATEMENTS.
| | | | | | | | | | |
| | | | | |
| | J.P. MORGAN SPECIALTY FUNDS | | | | | | | | 57 |
STATEMENTS OF CHANGES (AS RESTATED, SEE NOTE 8)
FOR THE PERIODS INDICATED (Unaudited) (continued)
(Amounts in thousands)
| | | | | | | | | | | | | | | | | | | | |
| | | JPMorgan Research Market Neutral Fund | |
| | | Six Months Ended
April 30, 2023 | | | Year Ended
October 31, 2022 | | | Six Months Ended
April 30, 2022 | | | Year Ended October 31, 2021 | | | Six Months Ended
April 30, 2021 | |
CAPITAL TRANSACTIONS: | | | | | | | | | | | | | | | | | | | | |
Class A | | | | | | | | | | | | | | | | | | | | |
Proceeds from shares issued | | $ | 4,689 | | | $ | 8,418 | | | $ | 5,623 | | | $ | 6,793 | | | $ | 2,200 | |
Distributions reinvested | | | — | | | | — | | | | — | | | | 1,075 | | | | 1,075 | |
Cost of shares redeemed | | | (3,500 | ) | | | (4,910 | ) | | | (2,398 | ) | | | (8,656 | ) | | | (6,977 | ) |
| | | | | | | | | | | | | | | | | | | | |
Change in net assets resulting from Class A capital transactions | | | 1,189 | | | | 3,508 | | | | 3,225 | | | | (788 | ) | | | (3,702 | ) |
| | | | | | | | | | | | | | | | | | | | |
Class C | | | | | | | | | | | | | | | | | | | | |
Proceeds from shares issued | | | 285 | | | | 521 | | | | 132 | | | | 417 | | | | 313 | |
Distributions reinvested | | | — | | | | — | | | | — | | | | 159 | | | | 159 | |
Cost of shares redeemed | | | (143 | ) | | | (222 | ) | | | (183 | ) | | | (1,197 | ) | | | (734 | ) |
| | | | | | | | | | | | | | | | | | | | |
Change in net assets resulting from Class C capital transactions | | | 142 | | | | 299 | | | | (51 | ) | | | (621 | ) | | | (262 | ) |
| | | | | | | | | | | | | | | | | | | | |
Class I | | | | | | | | | | | | | | | | | | | | |
Proceeds from shares issued | | | 43,204 | | | | 119,488 | | | | 62,710 | | | | 41,158 | | | | 28,134 | |
Distributions reinvested | | | — | | | | — | | | | — | | | | 6,758 | | | | 6,758 | |
Cost of shares redeemed | | | (48,752 | ) | | | (54,925 | ) | | | (30,990 | ) | | | (91,475 | ) | | | (72,470 | ) |
Conversion from Class L Shares | | | — | | | | — | | | | — | | | | — | | | | — | |
| | | | | | | | | | | | | | | | | | | | |
Change in net assets resulting from Class I capital transactions | | | (5,548 | ) | | | 64,563 | | | | 31,720 | | | | (43,559 | ) | | | (37,578 | ) |
| | | | | | | | | | | | | | | | | | | | |
Class L | | | | | | | | | | | | | | | | | | | | |
Proceeds from shares issued | | | — | | | | — | | | | — | | | | — | | | | — | |
Distributions reinvested | | | — | | | | — | | | | — | | | | — | | | | — | |
Cost of shares redeemed | | | — | | | | — | | | | — | | | | — | | | | — | |
Conversion to Class I Shares | | | — | | | | — | | | | — | | | | — | | | | — | |
| | | | | | | | | | | | | | | | | | | | |
Change in net assets resulting from Class L capital transactions | | | — | | | | — | | | | — | | | | — | | | | — | |
| | | | | | | | | | | | | | | | | | | | |
Total change in net assets resulting from capital transactions | | $ | (4,217 | ) | | $ | 68,370 | | | $ | 34,894 | | | $ | (44,968 | ) | | $ | (41,542 | ) |
| | | | | | | | | | | | | | | | | | | | |
| | | | | |
SHARE TRANSACTIONS: | | | | | | | | | | | | | | | | | | | | |
Class A | | | | | | | | | | | | | | | | | | | | |
Issued | | | 380 | | | | 683 | | | | 453 | | | | 559 | | | | 179 | |
Reinvested | | | — | | | | — | | | | — | | | | 90 | | | | 90 | |
Redeemed | | | (278 | ) | | | (395 | ) | | | (191 | ) | | | (689 | ) | | | (552 | ) |
| | | | | | | | | | | | | | | | | | | | |
Change in Class A Shares | | | 102 | | | | 288 | | | | 262 | | | | (40 | ) | | | (283 | ) |
| | | | | | | | | | | | | | | | | | | | |
Class C | | | | | | | | | | | | | | | | | | | | |
Issued | | | 27 | | | | 48 | | | | 12 | | | | 37 | | | | 27 | |
Reinvested | | | — | | | | — | | | | — | | | | 15 | | | | 15 | |
Redeemed | | | (13 | ) | | | (20 | ) | | | (16 | ) | | | (109 | ) | | | (67 | ) |
| | | | | | | | | | | | | | | | | | | | |
Change in Class C Shares | | | 14 | | | | 28 | | | | (4 | ) | | | (57 | ) | | | (25 | ) |
| | | | | | | | | | | | | | | | | | | | |
Class I | | | | | | | | | | | | | | | | | | | | |
Issued | | | 3,251 | | | | 9,115 | | | | 4,740 | | | | 3,149 | | | | 2,149 | |
Reinvested | | | — | | | | — | | | | — | | | | 532 | | | | 532 | |
Redeemed | | | (3,613 | ) | | | (4,127 | ) | | | (2,306 | ) | | | (6,877 | ) | | | (5,436 | ) |
Conversion from Class L Shares (a) | | | — | | | | — | | | | — | | | | — | | | | — | |
| | | | | | | | | | | | | | | | | | | | |
Change in Class I Shares | | | (362 | ) | | | 4,988 | | | | 2,434 | | | | (3,196 | ) | | | (2,755 | ) |
| | | | | | | | | | | | | | | | | | | | |
Class L (a) | | | | | | | | | | | | | | | | | | | | |
Issued | | | — | | | | — | | | | — | | | | — | | | | — | |
Reinvested | | | — | | | | — | | | | — | | | | — | | | | — | |
Redeemed | | | — | | | | — | | | | — | | | | — | | | | — | |
Conversion to Class I Shares | | | — | | | | — | | | | — | | | | — | | | | — | |
| | | | | | | | | | | | | | | | | | | | |
Change in Class L Shares | | | — | | | | — | | | | — | | | | — | | | | — | |
| | | | | | | | | | | | | | | | | | | | |
SEE NOTES TO FINANCIAL STATEMENTS.
| | | | | | | | | | |
| | | | | |
| 58 | | | | | | | | J.P. MORGAN SPECIALTY FUNDS | | |
| | | | | | | | | | | | | | |
| |
Year Ended
October 31, 2020 | | | Six Months Ended
April 30, 2020 | | | Year Ended October 31, 2019 | | | Six Months Ended
April 30, 2019 | |
| | | | | | | | | | | | | | |
| | | | | | | | | | | | | | |
| $ | 10,274 | | | $ | 3,887 | | | $ | 3,101 | | | $ | 1,829 | |
| | 1,461 | | | | 1,458 | | | | 1,394 | | | | 1,393 | |
| | (7,981 | ) | | | (3,427 | ) | | | (4,019 | ) | | | (2,496 | ) |
| | | | | | | | | | | | | | |
| | | |
| | 3,754 | | | | 1,918 | | | | 476 | | | | 726 | |
| | | | | | | | | | | | | | |
| | | | | | | | | | | | | | |
| | 1,554 | | | | 658 | | | | 446 | | | | 310 | |
| | 426 | | | | 426 | | | | 506 | | | | 505 | |
| | (3,677 | ) | | | (1,929 | ) | | | (2,927 | ) | | | (1,655 | ) |
| | | | | | | | | | | | | | |
| | | |
| | (1,697 | ) | | | (845 | ) | | | (1,975 | ) | | | (840 | ) |
| | | | | | | | | | | | | | |
| | | | | | | | | | | | | | |
| | 128,845 | | | | 42,380 | | | | 11,144 | | | | 7,644 | |
| | 2,418 | | | | 2,407 | | | | 3,139 | | | | 3,135 | |
| | (66,946 | ) | | | (28,915 | ) | | | (19,083 | ) | | | (10,553 | ) |
| | 26,571 | | | | — | | | | — | | | | — | |
| | | | | | | | | | | | | | |
| | | |
| | 90,888 | | | | 15,872 | | | | (4,800 | ) | | | 226 | |
| | | | | | | | | | | | | | |
| | | | | | | | | | | | | | |
| | 17,165 | | | | 10,085 | | | | 2,711 | | | | 1,855 | |
| | 1,660 | | | | 1,660 | | | | 8,526 | | | | 8,523 | |
| | (9,156 | ) | | | (8,336 | ) | | | (117,081 | ) | | | (111,436 | ) |
| | (26,571 | ) | | | — | | | | — | | | | — | |
| | | | | | | | | | | | | | |
| | | |
| | (16,902 | ) | | | 3,409 | | | | (105,844 | ) | | | (101,058 | ) |
| | | | | | | | | | | | | | |
| | | |
| $ | 76,043 | | | $ | 20,354 | | | $ | (112,143 | ) | | $ | (100,946 | ) |
| | | | | | | | | | | | | | |
| | | |
| | | | | | | | | | | | | | |
| | | | | | | | | | | | | | |
| | 812 | | | | 316 | | | | 225 | | | | 129 | |
| | 126 | | | | 126 | | | | 106 | | | | 106 | |
| | (628 | ) | | | (278 | ) | | | (290 | ) | | | (176 | ) |
| | | | | | | | | | | | | | |
| | 310 | | | | 164 | | | | 41 | | | | 59 | |
| | | | | | | | | | | | | | |
| | | | | | | | | | | | | | |
| | 136 | | | | 58 | | | | 34 | | | | 23 | |
| | 40 | | | | 40 | | | | 42 | | | | 42 | |
| | (319 | ) | | | (172 | ) | | | (229 | ) | | | (125 | ) |
| | | | | | | | | | | | | | |
| | (143 | ) | | | (74 | ) | | | (153 | ) | | | (60 | ) |
| | | | | | | | | | | | | | |
| | | | | | | | | | | | | | |
| | 9,519 | | | | 3,217 | | | | 765 | | | | 513 | |
| | 197 | | | | 196 | | | | 228 | | | | 227 | |
| | (4,916 | ) | | | (2,172 | ) | | | (1,325 | ) | | | (714 | ) |
| | 1,971 | | | | — | | | | — | | | | — | |
| | | | | | | | | | | | | | |
| | 6,771 | | | | 1,241 | | | | (332 | ) | | | 26 | |
| | | | | | | | | | | | | | |
| | | | | | | | | | | | | | |
| | 1,254 | | | | 744 | | | | 183 | | | | 122 | |
| | 132 | | | | 132 | | | | 603 | | | | 603 | |
| | (651 | ) | | | (622 | ) | | | (8,081 | ) | | | (7,686 | ) |
| | (1,917 | ) | | | — | | | | — | | | | — | |
| | | | | | | | | | | | | | |
| | (1,182 | ) | | | 254 | | | | (7,295 | ) | | | (6,961 | ) |
| | | | | | | | | | | | | | |
SEE NOTES TO FINANCIAL STATEMENTS.
| | | | | | | | | | |
| | | | | |
| | J.P. MORGAN SPECIALTY FUNDS | | | | | | | | 59 |
FINANCIAL HIGHLIGHTS
FOR THE PERIODS INDICATED
| | | | | | | | | | | | | | | | | | | | |
| | | Per share operating performance | |
| | | | | | Investment operations | | | Distributions | |
| | | Net asset value, beginning of period* | | | Net investment income (loss) (b) | | |
Net realized and unrealized gains (losses) on investments | | | Total from investment operations | | | Net realized gain | |
JPMorgan Research Market Neutral Fund | | | | | | | | | | | | | | | | | | | | |
Class A | | | | | | | | | | | | | | | | | | | | |
Six Months Ended April 30, 2023 (as restated, See Note 8) (Unaudited) | | $ | 12.30 | | | $ | 0.14 | | | $ | 0.47 | | | $ | 0.61 | | | $ | — | |
Year Ended October 31, 2022 | | | 12.63 | | | | (0.10 | ) | | | (0.32 | ) | | | (0.42 | ) | | | — | |
Six Months Ended April 30, 2022 (as restated, See Note 8) (Unaudited) | | | 12.63 | | | | (0.12 | ) | | | (0.28 | ) | | | (0.40 | ) | | | — | |
Year Ended October 31, 2021 | | | 13.23 | | | | (0.21 | ) | | | 0.41 | | | | 0.20 | | | | (0.91 | ) |
Six Months Ended April 30, 2021 (as restated, See Note 8) (Unaudited) | | | 13.23 | | | | (0.11 | ) | | | 0.24 | | | | 0.13 | | | | (0.91 | ) |
Year Ended October 31, 2020 | | | 13.26 | | | | (0.20 | ) | | | 1.51 | | | | 1.31 | | | | (1.49 | ) |
Six Months Ended April 30, 2020 (as restated, See Note 8) (Unaudited) | | | 13.26 | | | | (0.08 | ) | | | 1.15 | | | | 1.07 | | | | (1.48 | ) |
Year Ended October 31, 2019 | | | 14.32 | | | | (0.03 | ) | | | 0.41 | | | | 0.38 | | | | (1.45 | ) |
Six Months Ended April 30, 2019 (as restated, See Note 8) (Unaudited) | | | 14.32 | | | | — | (j) | | | 0.26 | | | | 0.26 | | | | (1.45 | ) |
| | | | | |
Class C | | | | | | | | | | | | | | | | | | | | |
Six Months Ended April 30, 2023 (as restated, See Note 8) (Unaudited) | | | 10.94 | | | | 0.10 | | | | 0.42 | | | | 0.52 | | | | — | |
Year Ended October 31, 2022 | | | 11.29 | | | | (0.14 | ) | | | (0.30 | ) | | | (0.44 | ) | | | — | |
Six Months Ended April 30, 2022 (as restated, See Note 8) (Unaudited) | | | 11.29 | | | | (0.13 | ) | | | (0.22 | ) | | | (0.35 | ) | | | — | |
Year Ended October 31, 2021 | | | 11.97 | | | | (0.25 | ) | | | 0.41 | | | | 0.16 | | | | (0.91 | ) |
Six Months Ended April 30, 2021 (as restated, See Note 8) (Unaudited) | | | 11.97 | | | | (0.12 | ) | | | 0.21 | | | | 0.09 | | | | (0.91 | ) |
Year Ended October 31, 2020 | | | 12.20 | | | | (0.23 | ) | | | 1.36 | | | | 1.13 | | | | (1.49 | ) |
Six Months Ended April 30, 2020 (as restated, See Note 8) (Unaudited) | | | 12.20 | | | | (0.10 | ) | | | 1.03 | | | | 0.93 | | | | (1.48 | ) |
Year Ended October 31, 2019 | | | 13.35 | | | | (0.09 | ) | | | 0.39 | | | | 0.30 | | | | (1.45 | ) |
Six Months Ended April 30, 2019 (as restated, See Note 8) (Unaudited) | | | 13.35 | | | | (0.04 | ) | | | 0.25 | | | | 0.21 | | | | (1.45 | ) |
| | | | | |
Class I | | | | | | | | | | | | | | | | | | | | |
Six Months Ended April 30, 2023 (as restated, See Note 8) (Unaudited) | | | 13.19 | | | | 0.16 | | | | 0.48 | | | | 0.64 | | | | — | |
Year Ended October 31, 2022 | | | 13.51 | | | | (0.06 | ) | | | (0.53 | ) | | | (0.59 | ) | | | — | |
Six Months Ended April 30, 2022 (as restated, See Note 8) (Unaudited) | | | 13.51 | | | | (0.11 | ) | | | (0.40 | ) | | | (0.51 | ) | | | — | |
Year Ended October 31, 2021 | | | 14.03 | | | | (0.20 | ) | | | 0.46 | | | | 0.26 | | | | (0.91 | ) |
Six Months Ended April 30, 2021 (as restated, See Note 8) (Unaudited) | | | 14.03 | | | | (0.10 | ) | | | 0.22 | | | | 0.12 | | | | (0.91 | ) |
Year Ended October 31, 2020 | | | 13.96 | | | | (0.19 | ) | | | 1.00 | | | | 0.81 | | | | (1.49 | ) |
Six Months Ended April 30, 2020 (as restated, See Note 8) (Unaudited) | | | 13.96 | | | | (0.08 | ) | | | 1.22 | | | | 1.14 | | | | (1.48 | ) |
Year Ended October 31, 2019 | | | 14.96 | | | | — | (j) | | | 0.43 | | | | 0.43 | | | | (1.45 | ) |
Six Months Ended April 30, 2019 (as restated, See Note 8) (Unaudited) | | | 14.96 | | | | 0.02 | | | | 0.28 | | | | 0.30 | | | | (1.45 | ) |
| | | | | |
Class L | | | | | | | | | | | | | | | | | | | | |
Six Months Ended April 30, 2020 (as restated, See Note 8) (Unaudited) | | | 14.28 | | | | (0.07 | ) | | | 1.21 | | | | 1.14 | | | | (1.48 | ) |
Year Ended October 31, 2019 | | | 15.27 | | | | 0.04 | | | | 0.42 | | | | 0.46 | | | | (1.45 | ) |
Six Months Ended April 30, 2019 (as restated, See Note 8) (Unaudited) | | | 15.27 | | | | 0.03 | | | | 0.27 | | | | 0.30 | | | | (1.45 | ) |
SEE NOTES TO FINANCIAL STATEMENTS.
| | | | | | | | | | |
| | | | | |
| 60 | | | | | | | | J.P. MORGAN SPECIALTY FUNDS | | |
| | | | | | | | | | | | | | | | | | | | | | | | | | | | | | | | | | |
| | | | | | Ratios/Supplemental data | |
| | | | | | | | | | Ratios to average net assets (a) | | | | | | | |
Future
share
reacquistion
adjustment | | | Net asset value, end of period* | | | Total return (excludes sales charge) (c)(d) | | | Net assets, end of period (000’s)** | | | Net expenses (including dividend expense for securities sold short) (e)(f) | | | Net investment income (loss) | | | Expenses without waivers and
reimbursements (including dividend expense for securities sold short) (f) | | | Portfolio turnover rate (excluding securities sold short) (c) | | | Portfolio turnover rate (including securities sold short) (c) | |
| | | | | | | | | | | | | | | | | | | | | | | | | | | | | | | | | | |
| | | | | | | | |
| $ | 0.05 | | | $ | 12.96 | | | | 5.37 | % | | $ | 22,677 | | | | 2.82 | % | | | 2.22 | % | | | 3.00 | % | | | 45 | % | | | 111 | % |
| | 0.09 | | | | 12.30 | | | | (2.61 | ) | | | 20,259 | | | | 2.72 | | | | (0.84 | ) | | | 2.90 | | | | 100 | % | | | 252 | |
| | 0.06 | | | | 12.29 | | | | (2.69 | ) | | | 19,920 | | | | 2.98 | (g)(h) | | | (1.86 | )(h) | | | 3.18 | (h) | | | 58 | | | | 130 | |
| | 0.11 | | | | 12.63 | | | | 2.67 | | | | 17,161 | | | | 2.92 | (i) | | | (1.71 | ) | | | 3.14 | | | | 119 | | | | 307 | |
| | 0.05 | | | | 12.50 | | | | 1.61 | | | | 13,950 | | | | 2.97 | (i) | | | (1.69 | ) | | | 3.17 | | | | 71 | | | | 204 | |
| | 0.15 | | | | 13.23 | | | | 12.39 | | | | 18,509 | | | | 3.18 | | | | (1.53 | ) | | | 3.56 | | | | 224 | | | | 531 | |
| | 0.01 | | | | 12.86 | | | | 9.23 | | | | 16,117 | | | | 3.61 | | | | (1.33 | ) | | | 3.97 | | | | 138 | | | | 305 | |
| | 0.01 | | | | 13.26 | | | | 2.92 | | | | 14,442 | | | | 3.66 | | | | (0.24 | ) | | | 4.06 | | | | 125 | | | | 356 | |
| | — | | | | 13.13 | | | | 1.89 | | | | 14,534 | | | | 3.61 | | | | (0.03 | ) | | | 3.94 | | | | 69 | | | | 208 | |
| | | | | | | | |
| | 0.04 | | | | 11.50 | | | | 5.12 | | | | 1,734 | | | | 3.30 | | | | 1.82 | | | | 3.47 | | | | 45 | | | | 111 | |
| | 0.09 | | | | 10.94 | | | | (3.10 | ) | | | 1,504 | | | | 3.21 | | | | (1.30 | ) | | | 3.39 | | | | 100 | | | | 252 | |
| | 0.02 | | | | 10.96 | | | | (2.92 | ) | | | 1,149 | | | | 3.48 | (g)(h) | | | (2.33 | )(h) | | | 3.69 | (h) | | | 58 | | | | 130 | |
| | 0.07 | | | | 11.29 | | | | 2.25 | | | | 1,233 | | | | 3.44 | (i) | | | (2.22 | ) | | | 3.67 | | | | 119 | | | | 307 | |
| | 0.05 | | | | 11.20 | | | | 1.43 | | | | 1,587 | | | | 3.46 | (i) | | | (2.18 | ) | | | 3.67 | | | | 71 | | | | 204 | |
| | 0.13 | | | | 11.97 | | | | 11.76 | | | | 1,982 | | | | 3.70 | | | | (1.94 | ) | | | 4.04 | | | | 224 | | | | 531 | |
| | 0.02 | | | | 11.67 | | | | 8.94 | | | | 2,749 | | | | 4.11 | | | | (1.73 | ) | | | 4.46 | | | | 138 | | | | 305 | |
| | — | | | | 12.20 | | | | 2.42 | | | | 3,774 | | | | 4.19 | | | | (0.73 | ) | | | 4.55 | | | | 125 | | | | 356 | |
| | — | | | | 12.11 | | | | 1.65 | | | | 4,871 | | | | 4.13 | | | | (0.54 | ) | | | 4.43 | | | | 69 | | | | 208 | |
| | | | | | | | |
| | 0.08 | | | | 13.91 | | | | 5.46 | | | | 142,032 | | | | 2.53 | | | | 2.42 | | | | 2.71 | | | | 45 | | | | 111 | |
| | 0.27 | | | | 13.19 | | | | (2.37 | ) | | | 139,458 | | | | 2.41 | | | | (0.47 | ) | | | 2.59 | | | | 100 | | | | 252 | |
| | 0.16 | | | | 13.16 | | | | (2.59 | ) | | | 105,518 | | | | 2.70 | (g)(h) | | | (1.59 | )(h) | | | 2.90 | (h) | | | 58 | | | | 130 | |
| | 0.13 | | | | 13.51 | | | | 3.10 | | | | 75,401 | | | | 2.69 | (i) | | | (1.50 | ) | | | 2.90 | | | | 119 | | | | 307 | |
| | 0.09 | | | | 13.33 | | | | 1.81 | | | | 80,440 | | | | 2.73 | (i) | | | (1.44 | ) | | | 2.91 | | | | 71 | | | | 204 | |
| | 0.75 | | | | 14.03 | | | | 12.49 | | | | 123,114 | | | | 2.87 | | | | (1.39 | ) | | | 3.23 | | | | 224 | | | | 531 | |
| | 0.02 | | | | 13.64 | | | | 9.35 | | | | 44,317 | | | | 3.23 | | | | (1.13 | ) | | | 3.54 | | | | 138 | | | | 305 | |
| | 0.02 | | | | 13.96 | | | | 3.21 | | | | 28,014 | | | | 3.40 | | | | 0.03 | | | | 3.76 | | | | 125 | | | | 356 | |
| | — | | | | 13.81 | | | | 2.09 | | | | 32,659 | | | | 3.33 | | | | 0.24 | | | | 3.63 | | | | 69 | | | | 208 | |
| | | | | | | | |
| | 0.02 | | | | 14.01 | | | | 9.50 | | | | 20,115 | | | | 3.19 | | | | (0.95 | ) | | | 3.51 | | | | 138 | | | | 305 | |
| | — | | | | 14.28 | | | | 3.21 | | | | 16,875 | | | | 3.27 | | | | 0.28 | | | | 3.57 | | | | 125 | | | | 356 | |
| | — | | | | 14.12 | | | | 2.04 | | | | 21,402 | | | | 3.26 | | | | 0.34 | | | | 3.54 | | | | 69 | | | | 208 | |
SEE NOTES TO FINANCIAL STATEMENTS.
| | | | | | | | | | |
| | | | | |
| | J.P. MORGAN SPECIALTY FUNDS | | | | | | | | 61 |
FINANCIAL HIGHLIGHTS
FOR THE PERIODS INDICATED (continued)
| * | Net asset value per share has been calculated offer future share reacquisition adjustment for the impacted periods. |
| ** | Amount presented offer future share reacquisition adjustment. |
| (a) | Annualized for periods less than one year, unless otherwise noted. |
| (b) | Calculated based upon average shares outstanding. |
| (c) | Not annualized for periods less than one year. |
| (d) | Includes adjustments in accordance with accounting principles generally accepted in the United States of America and as such, the net asset values for financial reporting purposes and the returns based upon those net asset values may differ from the net asset values and returns for shareholder transactions. |
| (e) | Includes earnings credits and interest expense, if applicable, each of which is less than 0.005% unless otherwise noted. |
| | | | | | | | | | | | | | | | | | | | | | | | | | | | | | | | | | | | |
| | | April 30, 2023 | | | October 31, 2022 (as restated,
See note 8) | | | April 30, 2022 | | | October 31, 2021 (as restated,
See note 8) | | | April 30, 2021 | | | October 31, 2020 (as restated,
See note 8) | | | April 30, 2020 | | | October 31, 2019 (as restated,
See note 8) | | | April 30, 2019 | |
Net expenses (excluding dividend and interest expense for securities sold short) | | | | | | | | | | | | | | | | | | | | | | | | | | | | | | | | | | | | |
Class A | | | 0.89 | % | | | 0.90 | % | | | 1.00 | % | | | 0.92 | % | | | 1.08 | % | | | 1.06 | % | | | 1.20 | % | | | 1.21 | % | | | 1.22 | % |
Class C | | | 1.37 | % | | | 1.39 | | | | 1.50 | % | | | 1.41 | | | | 1.56 | % | | | 1.58 | | | | 1.70 | % | | | 1.71 | | | | 1.72 | % |
Class I | | | 0.63 | % | | | 0.64 | | | | 0.74 | % | | | 0.66 | | | | 0.82 | % | | | 0.75 | | | | 0.95 | % | | | 0.95 | | | | 0.96 | % |
Class L | | | — | | | | — | | | | — | | | | — | | | | — | | | | — | | | | 0.81 | % | | | 0.82 | | | | 0.82 | % |
Expenses without waivers and reimbursements (excluding dividend and interest expense for securities sold short) | | | | | | | | | | | | | | | | | | | | | | | | | | | | | | | | | | | | |
Class A | | | 1.07 | % | | | 1.08 | | | | 1.21 | % | | | 1.14 | | | | 1.27 | % | | | 1.44 | | | | 1.57 | % | | | 1.61 | | | | 1.55 | % |
Class C | | | 1.55 | % | | | 1.57 | | | | 1.71 | % | | | 1.64 | | | | 1.75 | % | | | 1.93 | | | | 2.04 | % | | | 2.07 | | | | 2.02 | % |
Class I | | | 0.81 | % | | | 0.82 | | | | 0.95 | % | | | 0.87 | | | | 1.00 | % | | | 1.11 | | | | 1.26 | % | | | 1.31 | | | | 1.26 | % |
Class L | | | — | | | | — | | | | — | | | | — | | | | — | | | | — | | | | 1.13 | % | | | 1.12 | | | | 1.10 | % |
| (g) | Interest expense on securities sold short is 0.09%. |
| (h) | Certain non-recurring expenses incurred by the Fund were not annualized for the period indicated. |
| (i) | Interest expense on securities sold short is 0.16%. |
| (j) | Amount rounds to less than $0.005. |
| | | | | | | | | | |
| | | | | |
| 62 | | | | | | | | J.P. MORGAN SPECIALTY FUNDS | | |
SEE NOTES TO FINANCIAL STATEMENTS.
NOTES TO FINANCIAL STATEMENTS
AS OF APRIL 30, 2023, APRIL 30, 2022, APRIL 30, 2021, APRIL 30, 2020 and APRIL 30, 2019 (Unaudited)
(Dollar values in thousands)
1. Organization
JPMorgan Trust I (the “Trust”) was formed on November 12, 2004, as a Delaware statutory trust, pursuant to a Declaration of Trust dated November 5, 2004 and is registered under the Investment Company Act of 1940, as amended (the “1940 Act”), as an open-end management investment company.
The following is a separate fund of the Trust (the “Fund”) covered by this report:
| | | | |
| | | Classes Offered | | Diversification Classification |
| JPMorgan Research Market Neutral Fund | | Class A, Class C, Class I and Class L | | Diversified |
The investment objective of the Fund is to seek to provide long-term capital appreciation from a broadly diversified portfolio of U.S. stocks while neutralizing the general risks associated with stock market investing.
Up through July 1, 2020, Class L Shares of the Fund were publicly offered on a limited basis. Investors were not eligible to purchase Class L Shares of the Fund unless they met certain requirements as described in the Fund’s prospectus. On July 2, 2020, the Fund’s Class L Shares were converted into Class I Shares. Additionally, as of July 2, 2020, Class L Shares were no longer offered.
Class A Shares generally provide for a front-end sales charge while Class C Shares provide for a contingent deferred sales charge (“CDSC”). No sales charges are assessed with respect to Class I Shares. Certain Class A Shares, for which front-end sales charges have been waived, may be subject to a CDSC as described in the Funds’ prospectus. Effective October 1, 2020, Class C Shares automatically convert to Class A Shares after eight years. Prior to October 1, 2020, Class C Shares automatically converted to Class A Shares after ten years. All classes of shares have equal rights as to earnings, assets and voting privileges, except that each class may bear different transfer agency, distribution and service fees and each class has exclusive voting rights with respect to its distribution plan and shareholder servicing agreements. No sales charges were assessed with respect to Class L Shares.
J.P. Morgan Investment Management Inc. (“JPMIM”), an indirect, wholly-owned subsidiary of JPMorgan Chase & Co. (“JPMorgan”), acts as adviser (the “Adviser”) and administrator (the “Administrator”) to the Fund.
2. Significant Accounting Policies
The following is a summary of significant accounting policies followed by the Fund in the preparation of their financial statements. The Fund is an investment companies and, accordingly, follows the investment company accounting and reporting guidance of the Financial Accounting Standards Board (“FASB”) Accounting Standards Codification Topic 946 — Investment Companies, which is part of U.S. generally accepted accounting principles (“GAAP”). The preparation of financial statements in conformity with GAAP requires management to make estimates and assumptions that affect (i) the reported amounts of assets and liabilities, (ii) disclosure of contingent assets and liabilities at the date of the financial statements, and (iii) the reported amounts of increases and decreases in net assets from operations during the reporting period. Actual results could differ from those estimates.
A. Valuation of Investments — Investments are valued in accordance with GAAP and the Fund’s valuation policies set forth by, and under the supervision and responsibility of, the Board of Trustees of the Trust (the “Board”), which established the following approach to valuation, as described more fully below: (i) investments for which market quotations are readily available shall be valued at their market value and (ii) all other investments for which market quotations are not readily available shall be valued at their fair value as determined in good faith by the Board.
Effective September 9, 2022, under SEC Rule 2a-5 (Good Faith Determinations of Fair Value), the Board may designate the performance of these fair valuation determinations to a valuation designee. The Board has designated the Adviser as the “Valuation Designee” to perform fair valuation determinations for the Fund on behalf of the Board subject to appropriate oversight by the Board. The Adviser, as Valuation Designee, leverages the J.P. Morgan Asset Management Americas Valuation Committee (“AVC”) to help oversee and carry out the policies for the valuation of Investments held in the Fund. The Adviser, as Valuation Designee, remains responsible for the valuation determinations.
This oversight by the AVC includes monitoring the appropriateness of fair values based on results of ongoing valuation oversight including, but not limited to, consideration of macro or security specific events, market events, and pricing vendor and broker due diligence. The Administrator is responsible for discussing and assessing the potential impacts to the fair values on an ongoing basis, and, at least on a quarterly basis, with the AVC and the Board.
Prior to September 9, 2022, the Administrator had established the AVC to assist the Board with the oversight and monitoring of the valuation of the Fund’s investments. The Administrator implemented the valuation policies of the Fund’s investments, as directed by the Board. The AVC oversaw and carried out the policies for the valuation of investments held in the Fund. This included monitoring the appropriateness of fair values based on results of ongoing valuation oversight including, but not limited to, consideration of macro or security specific events, market events, and pricing vendor and broker due diligence. The Administrator was responsible for discussing and assessing the potential impacts to the fair values on an ongoing basis, and, at least on a quarterly basis, with the AVC and the Board.
Fixed income instruments are valued based on prices received from approved affiliated and unaffiliated pricing vendors or third party broker-dealers (collectively referred to as “Pricing Services”). The Pricing Services use multiple valuation techniques to determine the valuation of fixed
| | | | | | | | | | |
| | | | | |
| | J.P. MORGAN SPECIALTY FUNDS | | | | | | | | 63 |
NOTES TO FINANCIAL STATEMENTS
AS OF APRIL 30, 2023, APRIL 30, 2022, APRIL 30, 2021, APRIL 30, 2020 and APRIL 30, 2019 (Unaudited) (continued)
(Dollar values in thousands)
income instruments. In instances where sufficient market activity exists, the Pricing Services may utilize a market-based approach through which trades or quotes from market makers are used to determine the valuation of these instruments. In instances where sufficient market activity may not exist, the Pricing Services also utilize proprietary valuation models which may consider market transactions in comparable securities and the various relationships between securities in determining fair value and/or market characteristics in order to estimate the relevant cash flows, which are then discounted to calculate the fair values.
Equities and other exchange-traded instruments are valued at the last sale price or official market closing price on the primary exchange on which the instrument is traded before the net asset values (“NAV”) of the Fund are calculated on a valuation date.
Certain foreign equity instruments are valued by applying international fair value factors provided by approved Pricing Services. The factors seek to adjust the local closing price for movements of local markets post-closing, but prior to the time the NAVs are calculated.
Investments in open-end investment companies, excluding exchange-traded funds (“ETFs”) (“Underlying Funds”), are valued at each Underlying Fund’s NAV per share as of the report date.
Futures contracts are generally valued on the basis of available market quotations.
Valuations reflected in this report are as of the report date. As a result, changes in valuation due to market events and/or issuer-related events after the report date and prior to issuance of the report are not reflected herein.
The various inputs that are used in determining the valuation of the Fund’s investments are summarized into the three broad levels listed below.
| • | | Level 1 — Unadjusted inputs using quoted prices in active markets for identical investments. |
| • | | Level 2 — Other significant observable inputs including, but not limited to, quoted prices for similar investments, inputs other than quoted prices that are observable for investments (such as interest rates, prepayment speeds, credit risk, etc.) or other market corroborated inputs. |
| • | | Level 3 — Significant inputs based on the best information available in the circumstances, to the extent observable inputs are not available (including the Fund’s assumptions in determining the fair value of investments). |
A financial instrument’s level within the fair value hierarchy is based on the lowest level of any input, both individually and in the aggregate, that is significant to the fair value measurement. The inputs or methodology used for valuing instruments are not necessarily an indication of the risk associated with investing in those instruments.
The following tables represent each valuation input as presented on the Schedules of Portfolio Investments (“SOIs”):
April 30, 2023
| | | | | | | | | | | | | | | | |
| | | Level 1 Quoted Prices | | | Level 2 Other Significant
observable inputs | | | Level 3 Significant
unobservable inputs | | | Total | |
Total Investments in Securities (a) | | $ | 164, 946 | | | $ | — | | | $ | — | | | $ | 164,946 | |
| | | | | | | | | | | | | | | | |
Total Liabilities for Securities Sold Short (a) | | $ | (122,346 | ) | | $ | — | | | $ | — | | | $ | (122,346 | ) |
| | | | | | | | | | | | | | | | |
Depreciation in Other Financial Instruments | | | | | | | | | | | | | | | | |
Futures Contracts | | $ | (159 | ) | | $ | — | | | $ | — | | | $ | (159 | ) |
| | | | | | | | | | | | | | | | |
| (a) | Please refer to the SOI for specifics of portfolio holdings. |
April 30, 2022
| | | | | | | | | | | | | | | | |
| | | Level 1 Quoted Prices | | | Level 2 Other Significant
observable inputs | | | Level 3 Significant
unobservable inputs | | | Total | |
Total Investments in Securities (a) | | $ | 122,372 | | | $ | — | | | $ | — | | | $ | 122,372 | |
| | | | | | | | | | | | | | | | |
Total Liabilities for Securities Sold Short (a) | | $ | (78,963 | ) | | $ | — | | | $ | — | | | $ | (78,963 | ) |
| | | | | | | | | | | | | | | | |
| (a) | Please refer to the SOI for specifics of portfolio holdings. |
| | | | | | | | | | |
| | | | | |
| 64 | | | | | | | | J.P. MORGAN SPECIALTY FUNDS | | |
April 30, 2021
| | | | | | | | | | | | | | | | |
| | | Level 1 Quoted Prices | | | Level 2 Other Significant
observable inputs | | | Level 3 Significant
unobservable inputs | | | Total | |
Total Investments in Securities (a) | | $ | 94,330 | | | $ | — | | | $ | — | | | $ | 94,330 | |
| | | | | | | | | | | | | | | | |
Total Liabilities for Securities Sold Short (a) | | $ | (71,353 | ) | | $ | — | | | $ | — | | | $ | (71,353 | ) |
| | | | | | | | | | | | | | | | |
Depreciation in Other Financial Instruments | | | | | | | | | | | | | | | | |
Futures Contracts | | $ | 3 | | | $ | — | | | $ | — | | | $ | 3 | |
| | | | | | | | | | | | | | | | |
| (a) | Please refer to the SOI for specifics of portfolio holdings. |
April 30, 2020
| | | | | | | | | | | | | | | | |
| | | Level 1 Quoted Prices | | | Level 2 Other Significant
observable inputs | | | Level 3 Significant
unobservable inputs | | | Total | |
Total Investments in Securities (a) | | $ | 76,581 | | | $ | — | | | $ | — | | | $ | 76,581 | |
| | | | | | | | | | | | | | | | |
Total Liabilities for Securities Sold Short (a) | | $ | (58,647 | ) | | $ | — | | | $ | — | | | $ | (58,647 | ) |
| | | | | | | | | | | | | | | | |
Depreciation in Other Financial Instruments | | | | | | | | | | | | | | | | |
Futures Contracts | | $ | (25 | ) | | $ | — | | | $ | — | | | $ | (25 | ) |
| | | | | | | | | | | | | | | | |
| (a) | Please refer to the SOI for specifics of portfolio holdings. |
April 30, 2019
| | | | | | | | | | | | | | | | |
| | | Level 1 Quoted Prices | | | Level 2 Other Significant
observable inputs | | | Level 3 Significant
unobservable inputs | | | Total | |
Total Investments in Securities (a) | | $ | 72,902 | | | $ | — | | | $ | — | | | $ | 72,902 | |
| | | | | | | | | | | | | | | | |
Total Liabilities for Securities Sold Short (a) | | $ | (62,646 | ) | | $ | — | | | $ | — | | | $ | (62,646 | ) |
| | | | | | | | | | | | | | | | |
Depreciation in Other Financial Instruments | | | | | | | | | | | | | | | | |
Futures Contracts | | $ | (7 | ) | | $ | — | | | $ | — | | | $ | (7 | ) |
| | | | | | | | | | | | | | | | |
| (a) | Please refer to the SOI for specifics of portfolio holdings. |
There were no transfers into and out of level 3 for the six months ended April 30, 2023, April 30, 2022, April 30, 2021, April 30, 2020 and April 30, 2019.
B. Restricted Securities — Certain securities held by the Fund may be subject to legal or contractual restrictions on resale. Restricted securities generally are resold in transactions exempt from registration under the Securities Act of 1933, as amended (the “Securities Act”). Disposal of these securities may involve time-consuming negotiations and expense. Prompt sale at the current valuation may be difficult and could adversely affect the NAVs of the Fund.
As of April 30, 2023, April 30, 2022, April 30, 2021, April 30, 2020, and April 30, 2019, the Fund had no investments in restricted securities other than securities sold to the Fund under Rule 144A and/or Regulation S under the Securities Act.
C. Securities Lending — The Fund is authorized to engage in securities lending in order to generate additional income. The Fund is able to lend to approved borrowers. Citibank N.A. (“Citibank”) serves as lending agent for the Fund, pursuant to a Securities Lending Agency Agreement (the “Securities Lending Agency Agreement”). Securities loaned are collateralized by cash equal to at least 100% of the market value plus accrued interest on the securities lent, which is invested in an affiliated money market fund. The Fund retains the interest earned on cash collateral investments but is required to pay the borrower a rebate for the use of the cash collateral. In cases where the lent security is of high value to borrowers, there may be a negative rebate (i.e., a net payment from the borrower to the Fund). Upon termination of a loan, the Fund is required to return to the borrower an amount equal to the cash collateral, plus any rebate owed to the borrowers. The remaining maturities of the securities lending transactions are considered overnight and continuous. Loans are subject to termination by the Fund or the borrower at any time.
The net income earned on the securities lending (after payment of rebates and Citibank’s fee) is included on the Statements of Operations as Income from securities lending (net). The Fund also receives payments from the borrower during the period of the loan, equivalent to dividends and interest earned on the securities loaned, which are recorded as Dividend or Interest income, respectively, on the Statements of Operations.
| | | | | | | | | | |
| | | | | |
| | J.P. MORGAN SPECIALTY FUNDS | | | | | | | | 65 |
NOTES TO FINANCIAL STATEMENTS
AS OF APRIL 30, 2023, APRIL 30, 2022, APRIL 30, 2021, APRIL 30, 2020 and APRIL 30, 2019 (Unaudited) (continued)
(Dollar values in thousands)
Under the Securities Lending Agency Agreement, Citibank marks to market the loaned securities on a daily basis. In the event the cash received from the borrower is less than 102% of the value of the loaned securities (105% for loans of non-U.S. securities), Citibank requests additional cash from the borrower so as to maintain a collateralization level of at least 102% of the value of the loaned securities plus accrued interest (105% for loans of non-U.S. securities), subject to certain de minimis amounts.
The value of securities out on loan is recorded as an asset on the Statements of Assets and Liabilities. The value of the cash collateral received is recorded as a liability on the Statements of Assets and Liabilities and details of collateral investments are disclosed on the SOIs.
The Fund bears the risk of loss associated with the collateral investments and is not entitled to additional collateral from the borrower to cover any such losses. To the extent that the value of the collateral investments declines below the amount owed to a borrower, the Fund may incur losses that exceed the amount they earned on lending the security. Upon termination of a loan, the Fund may use leverage (borrow money) to repay the borrower for cash collateral posted if the Adviser does not believe that it is prudent to sell the collateral investments to fund the payment of this liability. Securities lending activity is subject to master netting arrangements.
Securities lending also involves counterparty risks, including the risk that the loaned securities may not be returned in a timely manner or at all. Subject to certain conditions, Citibank has agreed to indemnify the Fund from losses resulting from a borrower’s failure to return a loaned security.
The Fund did not lend out any securities during the six month periods ended April 30, 2023, April 30, 2022, April 30, 2021, April 30, 2021 and April 30, 2019.
D. Investment Transactions with Affiliates — The Fund invested in Underlying Funds, which are advised by the Adviser. An issuer which is under common control with the Fund may be considered an affiliate. For the purposes of the financial statements, the Fund assumed the issuers listed in the tables below to be affiliated issuers. The Underlying Funds’ distributions may be reinvested into such Underlying Funds. Reinvestment amounts are included in the purchases at cost amounts in the tables below.
April 30, 2023
| | | | | | | | | | | | | | | | | | | | | | | | | | | | | | | | | | | | |
| Security Description | | Value at
October 31,
2022 | | | Purchase
at Cost | | | Proceeds
from Sales | | | Net
Realized
Gain
(Loss) | | | Change in
Unrealized
Appreciation/
(Depreciation) | | | Value at
April 30,
2023 | | | Shares at
April 30,
2023 | | | Dividend
Income | | | Capital
Gain
Distribution | |
JPMorgan Prime Money Market Fund Class Institutional Shares, 4.88% (a) (b) | | $ | 30,961 | | | $ | 105,609 | | | $ | 100,780 | | | $ | 2 | | | $ | (— | )(c) | | $ | 35,792 | | | | 35,782 | | | $ | 716 | | | $ | — | |
| | | | | | | | | | | | | | | | | | | | | | | | | | | | | | | | | | | | |
| (a) | Investment in an affiliated fund, which is registered under the Investment Company Act of 1940, as amended, and is advised by J.P. Morgan Investment Management Inc. |
| (b) | The rate shown is the current yield as of April 30, 2023. |
| (c) | Amount rounds to less than one thousand. |
April 30, 2022
| | | | | | | | | | | | | | | | | | | | | | | | | | | | | | | | | | | | |
| Security Description | | Value at
October 31,
2021 | | | Purchase
at Cost | | | Proceeds
from
Sales | | | Net
Realized
Gain
(Loss) | | | Change in
Unrealized
Appreciation/
(Depreciation) | | | Value at
April 30,
2022 | | | Shares at
April 30,
2022 | | | Dividend
Income | | | Capital
Gain
Distribution | |
JPMorgan Prime Money Market Fund Class Institutional Shares, 0.36% (a) (b) | | $ | 9,752 | | | $ | 98,675 | | | $ | 69,953 | | | $ | (7 | ) | | $ | 1 | | | $ | 38,468 | | | | 38,460 | | | $ | 17 | | | $ | — | |
| | | | | | | | | | | | | | | | | | | | | | | | | | | | | | | | | | | | |
| (a) | Investment in an affiliated fund, which is registered under the Investment Company Act of 1940, as amended, and is advised by J.P. Morgan Investment Management Inc. |
| (b) | The rate shown is the current yield as of April 30, 2022. |
| | | | | | | | | | |
| | | | | |
| 66 | | | | | | | | J.P. MORGAN SPECIALTY FUNDS | | |
April 30, 2021
| | | | | | | | | | | | | | | | | | | | | | | | | | | | | | | | | | | | |
| Security Description | | Value at
October 31,
2020 | | | Purchase
at Cost | | | Proceeds
from
Sales | | | Net
Realized
Gain
(Loss) | | | Change in
Unrealized
Appreciation/
(Depreciation) | | | Value at
April 30,
2021 | | | Shares at
April 30,
2021 | | | Dividend
Income | | | Capital
Gain
Distribution | |
JPMorgan Prime Money Market Fund Class Institutional Shares, 0.07% (a) (b) | | $ | 23,773 | | | $ | 85,825 | | | $ | 97,002 | | | $ | 3 | | | $ | (3 | ) | | $ | 12,596 | | | | 12,590 | | | $ | 4 | | | $ | — | |
| | | | | | | | | | | | | | | | | | | | | | | | | | | | | | | | | | | | |
| (a) | Investment in an affiliated fund, which is registered under the Investment Company Act of 1940, as amended, and is advised by J.P. Morgan Investment Management Inc. |
| (b) | The rate shown is the current yield as of April 30, 2021. |
April 30, 2020
| | | | | | | | | | | | | | | | | | | | | | | | | | | | | | | | | | | | |
| Security Description | | Value at
October 31,
2019 | | | Purchase
at Cost | | | Proceeds
from Sales | | | Net
Realized
Gain
(Loss) | | | Change in
Unrealized
Appreciation/
(Depreciation) | | | Value at
April 30,
2020 | | | Shares at
April 30,
2020 | | | Dividend
Income | | | Capital
Gain
Distribution | |
JPMorgan Prime Money Market Fund Class Institutional Shares, 0.63% (a) (b) | | $ | 9,419 | | | $ | 113,756 | | | $ | 109,007 | | | $ | (3 | ) | | $ | 14 | | | $ | 14,179 | | | | 14,168 | | | $ | 69 | | | $ | — | |
| | | | | | | | | | | | | | | | | | | | | | | | | | | | | | | | | | | | |
| (a) | Investment in an affiliated fund, which is registered under the Investment Company Act of 1940, as amended, and is advised by J.P. Morgan Investment Management Inc. |
| (b) | The rate shown is the current yield as of April 30, 2020. |
April 30, 2019
| | | | | | | | | | | | | | | | | | | | | | | | | | | | | | | | | | | | |
| Security Description | | Value at
October 31,
2018 | | | Purchase
at Cost | | | Proceeds
from Sales | | | Net
Realized
Gain
(Loss) | | | Change in
Unrealized
Appreciation/
(Depreciation) | | | Value at
October 31,
2019 | | | Shares at
October 31,
2019 | | | Dividend
Income | | | Capital
Gain
Distribution | |
JPMorgan Prime Money Market Fund Class Institutional Shares, 2.48% (a) (b) | | $ | 22,866 | | | $ | 241,035 | | | $ | 254,731 | | | $ | 9 | | | $ | (1 | ) | | $ | 9,178 | | | | 9,175 | | | $ | 282 | | | $ | — | |
| | | | | | | | | | | | | | | | | | | | | | | | | | | | | | | | | | | | |
| (a) | Investment in an affiliated fund, which is registered under the Investment Company Act of 1940, as amended, and is advised by J.P. Morgan Investment Management Inc. |
| (b) | The rate shown is the current yield as of April 30, 2019. |
E. Foreign Currency Translation — The books and records of the Fund are maintained in U.S. dollars. Foreign currency amounts are translated into U.S. dollars at the prevailing exchange rates of such currencies against the U.S. dollar. The market value of investment securities and other assets and liabilities are translated at the exchange rate as of the valuation date. Purchases and sales of investment securities, income and expenses are translated at the exchange rate prevailing on the respective dates of such transactions.
The Fund does not isolate the effect of changes in foreign exchange rates from changes in market prices on securities held. Accordingly, such changes are included within Change in net unrealized appreciation/depreciation on investments in non-affiliates on the Statements of Operations.
Reported realized foreign currency gains and losses arise from the disposition of foreign currency, currency gains or losses realized between the trade and settlement dates on securities transactions, and the difference between the amounts of dividends, interest and foreign withholding taxes recorded on the Fund’s books on the transaction date and the U.S. dollar equivalent of the amounts actually received or paid. These reported realized foreign currency gains and losses are included in Net realized gain (loss) on foreign currency transactions on the Statements of Operations. Unrealized foreign currency gains and losses arise from changes (due to changes in exchange rates) in the value of foreign currency and other assets and liabilities denominated in foreign currencies, which are held at period end and are included in Change in net unrealized appreciation/depreciation on foreign currency translations on the Statements of Operations.
| | | | | | | | | | |
| | | | | |
| | J.P. MORGAN SPECIALTY FUNDS | | | | | | | | 67 |
NOTES TO FINANCIAL STATEMENTS
AS OF APRIL 30, 2023, APRIL 30, 2022, APRIL 30, 2021, APRIL 30, 2020 and APRIL 30, 2019 (Unaudited) (continued)
(Dollar values in thousands)
F. Derivatives — The Fund used derivative instruments including futures contracts in connection with its investment strategy. Derivative instruments may be used as substitutes for securities in which the Fund can invest, to hedge portfolio investments or to generate income or gain to the Fund. Derivatives may also be used to effectively manage the long and short equity exposures in the portfolio, manage duration, sector and yield curve exposures and credit and spread volatility.
The Fund may be subject to various risks from the use of derivatives, including the risk that changes in the value of a derivative may not correlate perfectly with the underlying asset, rate or index; counterparty credit risk related to derivatives counterparties’ failure to perform under contract terms; liquidity risk related to the potential lack of a liquid market for these contracts allowing the Fund to close out its position(s); and documentation risk relating to disagreement over contract terms. Investing in certain derivatives also results in a form of leverage and as such, the Fund’s risk of loss associated with these instruments may exceed their value, as recorded on the Statements of Assets and Liabilities.
Note F(1) below describes the derivatives used by the Fund.
(1) Futures Contracts — The Fund used index futures contracts to gain or reduce exposure to the stock market, or maintain liquidity or minimize transaction costs. The Fund also used index futures contracts to more effectively manage the long and short equity exposures in the portfolio. The Fund also purchased futures contracts to invest incoming cash in the market or sold futures in response to cash outflows, thereby simulating an invested position in the underlying index while maintaining a cash balance for liquidity.
Futures contracts provide for the delayed delivery of the underlying instrument at a fixed price or are settled for a cash amount based on the change in the value of the underlying instrument at a specific date in the future. Upon entering into a futures contract, the Fund is required to deposit with the broker, cash or securities in an amount equal to a certain percentage of the contract amount, which is referred to as the initial margin deposit. Subsequent payments, referred to as variation margin, are made or received by the Fund periodically and are based on changes in the market value of open futures contracts. Changes in the market value of open futures contracts are recorded as Change in net unrealized appreciation/depreciation on futures contracts on the Statements of Operations. Realized gains or losses, representing the difference between the value of the contract at the time it was opened and the value at the time it was closed, are reported on the Statements of Operations at the closing or expiration of the futures contract. Securities deposited as initial margin are designated on the SOIs, while cash deposited, which is considered restricted, is recorded on the Statements of Assets and Liabilities. A receivable from and/or a payable to brokers for the daily variation margin is also recorded on the Statements of Assets and Liabilities.
The use of futures contracts exposes the Fund to equity price risk. The Fund may be subject to the risk that the change in the value of the futures contract may not correlate perfectly with the underlying instrument. Use of long futures contracts subjects the Fund to risk of loss in excess of the amounts shown on the Statements of Assets and Liabilities, up to the notional amount of the futures contracts. Use of short futures contracts subjects the Fund to unlimited risk of loss. The Fund may enter into futures contracts only on exchanges or boards of trade. The exchange or board of trade acts as the counterparty to each futures transaction; therefore, the Fund’s credit risk is limited to failure of the exchange or board of trade. Under some circumstances, futures exchanges may establish daily limits on the amount that the price of a futures contract can vary from the previous day’s settlement price, which could effectively prevent liquidation of positions.
The Fund’s futures contracts are not subject to master netting arrangements (the right to close out all transactions traded with a counterparty and net amounts owed or due across transactions).
(2) Summary of Derivatives Information — The following table presents the value of derivatives held as of the six month periods ended April 30, 2023, April 30, 2022, April 30, 2021, April 30, 2020 and April 30, 2019, by their primary underlying risk exposure and respective location on the Statements of Assets and Liabilities:
| | | | | | | | | | | | | | | | | | | | |
| | | April 30,
2023 | | | April 30,
2022 | | | April 30,
2021 | | | April 30,
2020 | | | April 30,
2019 | |
Equity Risk Exposure: | | | | | | | | | | | | | | | | | | | | |
Unrealized Appreciation (Depreciation) on Futures Contracts* | | $ | (159 | ) | | $ | — | | | $ | 3 | | | $ | (25 | ) | | $ | (7 | ) |
| | | | | |
Net Fair Value of Derivatives Contracts: | | | | | | | | | | | | | | | | | | | | |
Unrealized Appreciation (Depreciation) on Futures Contracts* | | | (159 | ) | | | — | | | | 3 | | | | (25 | ) | | | (7 | ) |
| | | | | | | | | | |
| | | | | |
| 68 | | | | | | | | J.P. MORGAN SPECIALTY FUNDS | | |
The following tables present the effect of derivatives on the Statements of Operations the six month periods ended April 30, 2023, April 30, 2022, April 30, 2021, April 30, 2020 and April 30, 2019, by primary underlying risk exposure:
| | | | | | | | | | | | | | | | | | | | |
| | | April 30,
2022 | | | April 30,
2022 | | | April 30,
2021 | | | April 30,
2020 | | | April 30,
2019 | |
Realized Gain (Loss) on Derivatives Recognized as a Result From Operations | | | | | | | | | | | | | | | | | | | | |
Equity Risk Exposure: | | | | | | | | | | | | | | | | | | | | |
Futures Contracts | | $ | 18 | | | $ | (485 | ) | | $ | (555 | ) | | $ | 796 | | | $ | 228 | |
| | | | | |
Net Change in Unrealized Appreciation (Depreciation) on Derivatives Recognized as a Result From Operations | | | | | | | | | | | | | | | | | | | | |
Equity Risk Exposure: | | | | | | | | | | | | | | | | | | | | |
Futures Contracts | | | (158 | ) | | | 7 | | | | (82 | ) | | | (26 | ) | | | (22 | ) |
Derivatives Volume
The table below discloses the volume of the Fund’s options and futures contracts activity during the six month ended April 30, 2023, April 30, 2022, April 30, 2021, April 30, 2020 and April 30, 2019. Please refer to the tables in the Summary of Derivatives Information for derivative-related gains and losses associated with volume activity:
| | | | | | | | | | | | | | | | | | | | |
| | | April 30,
2023 | | | April 30,
2022 | | | April 30,
2021 | | | April 30,
2020 | | | April 30,
2019 | |
Futures Contracts: | | | | | | | | | | | | | | | | | | | | |
Average Notional Balance Long | | $ | — | | | $ | 4,574 | | | $ | — | | | $ | 900 | (a) | | $ | 949 | (b) |
Average Notional Balance Short | | | (3,755 | ) | | | (131 | ) | | | (2,077 | ) | | | (1,119 | ) | | | 1,148 | (c) |
Ending Notional Balance Long | | | — | | | | — | | | | — | | | | — | | | | 1,032 | |
Ending Notional Balance Short | | | (6,493 | ) | | | — | | | | (2,087 | ) | | | (1,161 | ) | | | — | |
| (a) | For the period March 1, 2020 through March 31, 2020. |
| (b) | For the period November 1, 2018 through November 30, 2018. |
| (c) | For the period November 1, 2018 through April 30, 2019. |
The Fund may be required to post or receive collateral based on the net value of the Fund’s outstanding OTC options with the counterparty in the form of cash or securities. Daily movement of cash collateral is subject to minimum threshold amounts. Collateral posted by the Fund is held in a segregated account at the Fund’s custodian bank. For certain counterparties cash collateral posted by the Fund is invested in an affiliated money market fund (See Note 3.F.), otherwise the cash collateral is included on the Statements of Assets and Liabilities as Restricted cash for OTC derivatives. Collateral received by the Fund is held in a separate segregated account maintained by JPMorgan Chase Bank, N.A. (“JPMCB”), an affiliate of the Fund.
The Fund’s derivatives contracts held at April 30, 2023, April 30, 2022, April 30, 2021, April 30, 2020 and April 30, 2019, are not accounted for as hedging instruments under GAAP.
G. Short Sales — The Fund engaged in short sales as part of their normal investment activities. In a short sale, the Fund sells securities it does not own in anticipation of a decline in the market value of those securities. In order to deliver securities to the purchaser, the Fund borrows securities from a broker. To close out a short position, the Fund delivers the same securities to the broker.
The Fund is required to pledge cash or securities to the broker as collateral for the securities sold short. Collateral requirements are calculated daily based on the current market value of the short positions. Cash collateral deposited with the broker is recorded as Deposits at broker for securities sold short, while cash collateral deposited at the Fund’s custodian for the benefit of the broker is recorded as Restricted cash for securities sold short on the Statements of Assets and Liabilities. Securities segregated as collateral are denoted on the SOIs. The Fund may receive or pay the net of the following amounts: (i) a portion of the income from the investment of cash collateral; (ii) the broker’s fee on the borrowed securities (calculated daily based upon the market value of each borrowed security and a variable rate that is dependent on availability of the security); and (iii) a financing charge for the difference between the market value of the short position and cash collateral deposited with the broker.
The net amounts of income or fees are included as interest income or interest expense on securities sold short on the Statements of Operations.
The Fund is obligated to pay the broker dividends declared on short positions when a position is open on the record date. Dividends on short positions are reported on ex-dividend date on the Statements of Operations as Dividend expense on securities sold short. The Fund is obligated to pay the broker interest accrued on short positions while the position is outstanding. Interest expense on short positions is reported as Interest expense to non-affiliates on securities sold short on the Statements of Operations. Liabilities for securities sold short are reported at market value on the Statements of Assets and Liabilities and the change in market value is recorded as Change in net unrealized appreciation/depreciation on the Statements of Operations. Short sale transactions may result in unlimited losses as the security’s price increases and the short position loses value. There is no upward limit on the price a borrowed security could attain. The Fund is also subject to risk of loss if the broker were to fail to perform its obligations under the contractual terms.
| | | | | | | | | | |
| | | | | |
| | J.P. MORGAN SPECIALTY FUNDS | | | | | | | | 69 |
NOTES TO FINANCIAL STATEMENTS
AS OF APRIL 30, 2023, APRIL 30, 2022, APRIL 30, 2021, APRIL 30, 2020 and APRIL 30, 2019 (Unaudited) (continued)
(Dollar values in thousands)
The Fund will record a realized loss if the price of the borrowed security increases between the date of the short sale and the date on which the Fund replaces the borrowed security. The Fund will record a realized gain if the price of the borrowed security declines between those dates.
As of April 30, 2023, April 30, 2022, April 30, 2021, April 30, 2020 and April 30, 2019, the Fund had outstanding short sales as listed on its respective SOIs.
H. Security Transactions and Investment Income — Investment transactions are accounted for on the trade date (the date the order to buy or sell is executed). Securities gains and losses are calculated on a specifically identified cost basis. Interest income and interest expense on securities sold short, if any, is determined on the basis of coupon interest accrued using the effective interest method, which adjusts for amortization of premiums and accretion of discounts. Dividend income, net of foreign taxes withheld, if any, and dividend expense on securities sold short are recorded on the ex-dividend date or when a Fund first learns of the dividend.
To the extent such information is publicly available, the Fund records distributions received in excess of income earned from underlying investments as a reduction of cost of investments and/or realized gain. Such amounts are based on estimates if actual amounts are not available and actual amounts of income, realized gain and return of capital may differ from the estimated amounts. The Fund adjusts the estimated amounts of the components of distributions (and consequently their net investment income) as necessary, once the issuers provide information about the actual composition of the distributions.
I. Allocation of Income and Expenses — Expenses directly attributable to the Fund are charged directly to the Fund, while the expenses attributable to more than one fund of the Trust are allocated among the applicable funds. Investment income, realized and unrealized gains and losses and expenses, other than class-specific expenses, are allocated daily to each class of shares based upon the proportion of net assets of each class at the beginning of each day.
Transfer agency fees are class-specific expenses. The amount of the transfer agency fees charged to each share class of the Fund for the periods indicated below are as follows:
| | | | | | | | | | | | | | | | | | | | |
| | | Class A | | | Class C | | | Class I | | | Class L | | | Total | |
Six months ended April 30, 2023 | | $ | 2 | | | $ | — | (a) | | $ | 1 | | | | n/a | | | $ | 3 | |
Six months ended April 30, 2022 | | | 1 | | | | — | (a) | | | 2 | | | | n/a | | | | 3 | |
Six months ended April 30, 2021 | | | 2 | | | | — | (a) | | | 1 | | | | n/a | | | | 3 | |
Six months ended April 30, 2020 | | | 3 | | | | — | (a) | | | 1 | | | | 1 | | | | 5 | |
Six months ended April 30, 2019 | | | 4 | | | | — | (a) | | | 1 | | | | 1 | | | | 6 | |
| (a) | Amount rounds to less than one thousand. |
J. Federal Income Taxes — The Fund is treated as a separate taxable entity for Federal income tax purposes. The Fund’s policy is to comply with the provisions of the Internal Revenue Code (the “Code”) applicable to regulated investment companies and to distribute to shareholders all of its distributable net investment income and net realized capital gains on investments. Accordingly, no provision for Federal income tax is necessary. Management has reviewed the Fund’s tax positions for all open tax years and has determined that as of April 30, 2023, no liability for Federal income tax is required in the Fund’s financial statements for net unrecognized tax benefits. However, management’s conclusions may be subject to future review based on changes in, or the interpretation of, the accounting standards or tax laws and regulations. The Fund’s Federal tax returns for the prior three fiscal years remain subject to examination by the Internal Revenue Service.
K. Foreign Taxes — The Fund may be subject to foreign taxes on income, gains on investments or currency purchases/repatriation, a portion of which may be recoverable. The Fund will accrue such taxes and recoveries as applicable, based upon their current interpretation of tax rules and regulations that exist in the markets in which they invest. When a capital gains tax is determined to apply, the Fund records an estimated deferred tax liability in an amount that would be payable if the securities were disposed of on the valuation date.
L. Distributions to Shareholders — Distributions from net investment income, if any, are generally declared and paid at least annually and are declared separately for each class. No class has preferential dividend rights; differences in per share rates are due to differences in separate class expenses. Net realized capital gains, if any, are distributed by each Fund at least annually. The amount of distributions from net investment income and net realized capital gains is determined in accordance with Federal income tax regulations, which may differ from GAAP. To the extent these “book/tax” differences are permanent in nature (i.e., that they result from other than timing of recognition — “temporary differences”), such amounts are reclassified within the capital accounts based on their Federal tax basis treatment.
K. New Accounting Pronouncement — In August 2018, the Financial Accounting Standard Board (“FASB”) issued Accounting Standard Update (“ASU”) 2018-13 (“ASU 2018-13”) Fair Value Measurement (Topic 820): Disclosure Framework — Changes to the Disclosure Requirements for Fair Value Measurement, which adds, removes, and modifies certain aspects of the fair value disclosure. ASU 2018-13 amendments are the result of a broader disclosure project, FASB Concepts Statement Conceptual Framework for Financial Reporting — Chapter 8: Notes to Financial Statements, to improve the effectiveness of the fair value disclosure requirements. ASU 2018-13 is effective for the fiscal years, and interim periods within those fiscal years, beginning after December 15, 2019; early adoption is permitted. Management has evaluated the implications of these changes and the amendments are included in the financial statements, which had no effect to the Funds’ net assets or results of operation.
| | | | | | | | | | |
| | | | | |
| 70 | | | | | | | | J.P. MORGAN SPECIALTY FUNDS | | |
3. Fees and Other Transactions with Affiliates
A. Investment Advisory Fee — Pursuant to an Investment Advisory Agreement, the Adviser manages the investments of the Fund and for such services is paid a fee. The investment advisory fee is accrued daily and paid monthly at an annual rate based on the Fund’s average daily net assets. The annual rate for the Fund for the periods indicated below is as follows:
| | | | |
Six months ended April 30, 2023 | | | 0.35 | % |
Six months ended April 30, 2022 | | | 0.35 | |
Six months ended April 30, 2021 | | | 0.35 | (1) |
Six months ended April 30, 2020 | | | 0.60 | |
Six months ended April 30, 2019 | | | 0.80 | |
| (1) | Prior to June 1, 2020, the investment advisory fee was accrued daily and paid monthly at an annual rate of 0.60% of the Fund’s average daily net assets. |
The Adviser waived investment advisory fees and/or reimbursed expenses as outlined in Note 3.F.
B. Administration Fee — Pursuant to an Administration Agreement, the Administrator provides certain administration services to the Fund. In consideration of these services, effective January 1, 2019, the Administrator receives a fee accrued daily and paid monthly at an annual rate of 0.075% of the first $10 billion of the Fund’s average daily net assets, plus 0.050% of the Fund’s average daily net assets between $10 billion and $20 billion, plus 0.025% of the Fund’s average daily net assets between $20 billion and $25 billion, plus 0.01% of the Fund’s average daily net assets in excess of $25 billion. Prior to January 1, 2019, the Administrator received a fee accrued daily and paid monthly at an annual rate of 0.15% of the first $25 billion of the average daily net assets of all funds in the J.P. Morgan Funds Complex covered by the Administration Agreement (excluding certain funds of funds and money market funds) and 0.075% of the average daily net assets in excess of $25 billion of all such funds. For the six month periods ended April 30, 2023, April 30, 2022, April 30, 2021, April 30, 2020 and April 30, 2019, the effective annualized rate for the Fund was 0.075%, 0.075%, 0.070%, 0.080% and 0.080% of the Fund’s average daily net assets, notwithstanding any fee waivers and/or expense reimbursements, respectively.
The Administrator waived administration fees as outlined in Note 3.F.
JPMCB, a wholly-owned subsidiary of JPMorgan, serves as the Fund’s sub-administrator (the “Sub-administrator”). For its services as Sub-administrator, JPMCB receives a portion of the fees payable to the Administrator.
C. Distribution Fees — Pursuant to a Distribution Agreement, JPMorgan Distribution Services, Inc. (“JPMDS”), an indirect, wholly-owned subsidiary of JPMorgan, serves as the Fund’s principal underwriter and promotes and arranges for the sale of each Fund’s shares.
The Board has adopted a Distribution Plan (the “Distribution Plan”) for Class A and Class C Shares of the Fund pursuant to Rule 12b-1 under the 1940 Act. Class I and Class L Shares of the Fund do not charge a distribution fee. The Distribution Plan provides that the Fund shall pay, with respect to the applicable share classes, distribution fees, including payments to JPMDS, at annual rates of the average daily net assets as shown in the table below:
| | | | | | | | |
| | | Class A | | | Class C | |
April 30, 2023 | | | 0.25 | % | | | 0.75 | % |
April 30, 2022 | | | 0.25 | | | | 0.75 | |
April 30, 2021 | | | 0.25 | | | | 0.75 | |
April 30, 2020 | | | 0.25 | | | | 0.75 | |
April 30, 2019 | | | | | | | | |
In addition, JPMDS is entitled to receive the front-end sales charges from purchases of Class A Shares and the CDSC from redemptions of Class C Shares and certain Class A Shares for which front-end sales charges have been waived. For the periods indicated below, JPMDS retained the following:
| | | | | | | | |
| | | Front-End Sales Charge | | | CDSC | |
Six months ended April 30, 2023 | | $ | 1 | | | | 1 | |
Six months ended April 30, 2022 | | | — | (a) | | | 1 | |
Six months ended April 30, 2021 | | | — | (a) | | | — | |
Six months ended April 30, 2020 | | | — | (a) | | | — | |
Six months ended April 30, 2019 | | | — | (a) | | | — | |
| | | | | | | | | | |
| | | | | |
| | J.P. MORGAN SPECIALTY FUNDS | | | | | | | | 71 |
NOTES TO FINANCIAL STATEMENTS
AS OF APRIL 30, 2023, APRIL 30, 2022, APRIL 30, 2021, APRIL 30, 2020 and APRIL 30, 2019 (Unaudited) (continued)
(Dollar values in thousands)
D. Service Fees — The Trust, on behalf of the Fund, has entered into a Shareholder Servicing Agreement with JPMDS under which JPMDS provides certain support services to fund shareholders. For performing these services, JPMDS receives a fee with respect to all share classes that is accrued daily and paid monthly equal to a percentage of the average daily net assets as shown in the table below:
| | | | | | | | | | | | | | | | |
| | | Class A | | | Class C | | | Class I | | | Class L | |
April 30, 2023 | | | 0.25 | % | | | 0.25 | % | | | 0.25 | % | | | n/a | |
April 30, 2022 | | | 0.25 | | | | 0.25 | | | | 0.25 | | | | n/a | |
April 30, 2021 | | | 0.25 | | | | 0.25 | | | | 0.25 | | | | n/a | |
April 30, 2020 | | | 0.25 | | | | 0.25 | | | | 0.25 | | | | 0.10 | % |
April 30, 2019 | | | 0.25 | | | | 0.25 | | | | 0.25 | | | | 0.10 | |
JPMDS has entered into shareholder services contracts with affiliated and unaffiliated financial intermediaries who provide shareholder services and other related services to their clients or customers who invest in the Fund. Pursuant to such contracts, JPMDS will pay all or a portion of such fees earned to financial intermediaries for performing such services.
JPMDS waived service fees as outlined in Note 3.F.
E. Custodian and Accounting Fees — JPMCB provides portfolio custody and accounting services to the Fund. For performing these services, the Fund pays JPMCB transaction and asset-based fees that vary according to the number of transactions and positions, plus out-of-pocket expenses. The amounts paid directly to JPMCB by the Fund for custody and accounting services are included in Custodian and accounting fees on the Statements of Operations
Interest income earned on cash balances at the custodian, if any, is included in Interest income from affiliates on the Statements of Operations.
Interest expense paid to the custodian related to cash overdrafts, if any, is included in Interest expense to affiliates on the Statements of Operations.
F. Waivers and Reimbursements — The Adviser, Administrator and/or JPMDS have contractually agreed to waive fees and/or reimburse the Fund to the extent that total annual operating expenses (excluding acquired fund fees and expenses other than certain money market fund fees as described below, dividend and interest expenses related to short sales, interest, taxes, expenses related to litigation and potential litigation, expenses related to trustee elections and extraordinary expenses) exceed the percentages of the Fund’s respective average daily net assets as shown in the table below:
| | | | | | | | | | | | |
| | | Class A | | | Class C | | | Class I | |
April 30, 2023 | | | 0.95 | % | | | 1.45 | % | | | 0.69 | % |
The expense limitation agreements were in effect for the six months ended April 30, 2023 and the contractual expense limitation percentages in the table above are in place until at least February 29, 2024.
| | | | | | | | | | | | |
| | | Class A | | | Class C | | | Class I | |
April 30, 2022 | | | 0.95 | % | | | 1.45 | % | | | 0.69 | % |
The expense limitation agreements were in effect for the six months ended April 30, 2022 and the contractual expense limitation percentages in the table above are in place until at least February 28, 2023
| | | | | | | | | | | | |
| | | Class A | | | Class C | | | Class I | |
April 30, 2021 | | | 0.95 | % | | | 1.45 | % | | | 0.69 | %(1) |
| (1) | The contractual expense percentage in the table above is in place until as t least May 31, 2022. |
Except as noted above, the expense limitation agreements were in effect for the six months ended April 30, 2021, and the contractual expense limitation percentages in the table above are in place until at least February 28, 2022.
| | | | | | | | | | | | | | | | |
| | | Class A | | | Class C | | | Class I | | | Class L | |
April 30, 2020(1) | | | 0.95 | % | | | 1.45 | % | | | 0.69 | % | | | 0.85 | % |
Prior to June 1, 2020, the contractual expense limitation were 1.25%, 1.75% and 0.99% for Class A Share, Class C Shares and Class I Shares, respectively. Effective June 1, 2020, the contractual expense percentages in the able above were extended and are in place until at least May 31, 2021 for Class A and Class C Shares, and May 31, 2022 for Class I Shares.
| | | | | | | | | | | | | | | | |
| | | Class A | | | Class C | | | Class I | | | Class L | |
April 30, 2019 | | | 1.25 | % | | | 1.75 | % | | | 0.99 | % | | | 0.85 | % |
The expense limitation agreements were in effect for the six months ended April 30, 2019, and are in place until at least February 29, 2020.
| | | | | | | | | | |
| | | | | |
| 72 | | | | | | | | J.P. MORGAN SPECIALTY FUNDS | | |
For the six month periods indicated below, the Fund’s service providers waived fees and/or reimbursed expenses for the Fund as follows. None of these parties expects the Fund to repay any such waived fees and/or reimbursed expenses in future years.
| | | | | | | | | | | | | | | | |
| | | Contractual Waivers | |
| | | Investment
Advisory Fees | | | Administration
Fees | | | Service
Fees | | | Total | |
April 30, 2023 | | $ | 60 | | | $ | 40 | | | $ | 4 | | | $ | 104 | |
April 30, 2022 | | | 63 | | | | 37 | | | | 3 | | | | 103 | |
April 30, 2021 | | | 56 | | | | 34 | | | | 1 | | | | 91 | |
April 30, 2020 | | | 62 | | | | 21 | | | | 4 | | | | 87 | |
April 30, 2019 | | | 150 | | | | 64 | | | | 7 | | | | 221 | |
Additionally, the Fund may invest in one or more money market funds advised by the Adviser (affiliated money market funds). The Adviser, Administrator and/or JPMDS, as shareholder servicing agent, have contractually agreed to waive fees and/or reimburse expenses in an amount sufficient to offset the respective net fees each collects from the affiliated money market fund on the Fund’s investment in such affiliated money market fund, except for investments of securities lending cash collateral. None of these parties expect the Fund to repay any such waived fees and/ or reimbursed expenses in future years.
The amounts of these waivers resulting from investments in these money market funds for the years indicated below were as follows:
| | | | |
April 30, 2023 | | $ | 39 | |
April 30, 2022 | | | 11 | |
April 30, 2021 | | | 10 | |
April 30, 2020 | | | 9 | |
April 30, 2019 | | | 23 | |
Effective January 1, 2022, JPMIM voluntarily agreed to reimburse the Fund for the Trustee Fees paid to one of the interested Trustees. For the periods January 1, 2022 through April 30, 2022 and November 1, 2022 through April 30, 2023, the amount of these waivers were as follows:
| | | | |
April 30, 2023 | | $ | 1 | |
April 30, 2022 | | | 1 | |
G. Other — Certain officers of the Trust are affiliated with the Adviser, the Administrator and JPMDS. Such officers, with the exception of the Chief Compliance Officer, receive no compensation from the Fund for serving in their respective roles. The Trust adopted a Trustee Deferred Compensation Plan (the “Plan”) which allows the independent Trustees to defer the receipt of all or a portion of compensation related to performance of their duties as Trustees. The deferred fees are invested in various J.P. Morgan Funds until distribution in accordance with the Plan.
During the six month periods ended April 30, 2023, April 30, 2022, April 30, 2021, and April 30, 2019, the Fund purchased securities from an underwriting syndicate in which the principal underwriter or members of the syndicate were affiliated with the Adviser.
The Securities and Exchange Commission (“SEC”) has granted an exemptive order permitting the Fund to engage in principal transactions with J.P. Morgan Securities LLC, an affiliated broker, involving taxable money market instruments, subject to certain conditions.
4. Investment Transactions
During the periods indicated below, purchases and sales of investments (excluding short-term investments) were as follows:
| | | | | | | | | | | | | | | | |
| | | Purchases (excluding U.S. Government) | | | Sales (excluding U.S. Government) | | | Securities Sold Short | | | Covers on Securities Sold Short | |
Six months ended April 30, 2023 | | $ | 66,517 | | | $ | 54,253 | | | $ | 83,583 | | | $ | 67,399 | |
Six months ended April 30, 2022 | | | 60,833 | | | | 50,642 | | | | 66,945 | | | | 53,812 | |
Six months ended April 30, 2021 | | | 67,552 | | | | 131,432 | | | | 65,257 | | | | 126,246 | |
Six months ended April 30, 2020 | | | 73,493 | | | | 67,345 | | | | 83,196 | | | | 75,548 | |
Six months ended April 30, 2019 | | | 94,978 | | | | 203,277 | | | | 83,833 | | | | 190,231 | |
During the six month periods ended April 30, 2023, April 30, 2022, April 30, 2021, April 30, 2020 and April 30, 2019, there were no purchases or sales of U.S. Government securities.
| | | | | | | | | | |
| | | | | |
| | J.P. MORGAN SPECIALTY FUNDS | | | | | | | | 73 |
NOTES TO FINANCIAL STATEMENTS
AS OF APRIL 30, 2023, APRIL 30, 2022, APRIL 30, 2021, APRIL 30, 2020 and APRIL 30, 2019 (Unaudited) (continued)
(Dollar values in thousands)
5. Federal Income Tax Matters
For Federal income tax purposes, the estimated cost and unrealized appreciation (depreciation) in value of investments held at the dates noted were as follows:
| | | | | | | | | | | | | | | | |
| | | Aggregate Cost* | | | Gross Unrealized Appreciation | | | Gross Unrealized Depreciation | | | Net Unrealized Appreciation (Depreciation) | |
April 30, 2023 | | $ | 18,235 | | | $ | 31,648 | | | $ | 7,442 | | | $ | 24,206 | |
April 30, 2022 | | | 27,353 | | | | 23,556 | | | | 7,500 | | | | 16,056 | |
April 30, 2021 | | | 1,585 | | | | 29,517 | | | | 8,122 | | | | 21,395 | |
April 30, 2020( | | | 1,037 | | | | 19,563 | | | | 2,691 | | | | 16,872 | |
April 30, 2019 | | | (12,527 | ) | | | 25,875 | | | | 3,099 | | | | 22,776 | |
| * | The tax cost includes the proceeds from short sales which may result in a net negative cost. |
The Fund had net capital loss carryforwards which are available to offset future realized gains as follows:
| | | | |
| | | Capital Loss
Carryforward
Character
Short-Term* | |
October 31, 2023 | | $ | 27,620 | |
October 31, 2022 | | | 29,216 | |
October 31, 2021 | | | 31,380 | |
October 31, 2020 | | | 33,682 | |
October 31, 2019 | | | 35,983 | |
| * | Amount includes capital loss carryforwards which are limited in future years under Internal Revenue Code sections 381-384. |
During the years ended October 31, 2022, October 31, 2021, October 31, 200, October 31, 2019 and October 31, 2018, the Fund utilized capital loss carryforwards as follows:
| | | | |
| | | Capital Loss Utilized Short-Term | |
October 31, 2022 | | $ | 1,595 | |
October 31, 2021 | | | 2,164 | |
October 31, 2020 | | | 2,302 | |
October 31, 2019 | | | 2,302 | |
October 31, 2018 | | | 2,302 | |
Late year ordinary losses incurred after December 31 and within the taxable year are deemed to arise on the first business day of the Fund’s next taxable year. For the year ended October 31, 2022, the Fund deferred to November 1, 2022 late year ordinary losses in the amount of $288. For the year ended October 31, 2021, the Fund deferred to November 1, 2021 late year ordinary losses in the amount of $1,186. For the year ended October 31, 2018, the Fund deferred to November 1, 2018 net capital losses and other late year ordinary losses in the amount of $570.
6. Borrowings
The Fund relies upon an exemptive order granted by the SEC (the “Order”) permitting the establishment and operation of an Interfund Lending Facility (the “Facility”). The Facility allows the Fund to directly lend and borrow money to or from any other fund relying upon the Order at rates beneficial to both the borrowing and lending funds. Advances under the Facility are taken primarily for temporary or emergency purposes, including the meeting of redemption requests that otherwise might require the untimely disposition of securities, and are subject to the Fund’s borrowing restrictions. The interfund loan rate is determined, as specified in the Order, by averaging the current repurchase agreement rate and the current bank loan rate. The Order was granted to JPMorgan Trust II (“JPM II”) and may be relied upon by the Fund because the Fund and the series of JPM
II are all investment companies in the same “group of investment companies” (as defined in Section 12(d)(1)(G) of the 1940 Act).
The Fund had no borrowings outstanding from another fund, or loans outstanding to another fund, during the six month periods ended April 30, 2023, April 30, 2022, April 30, 2021, April 30, 2020 and April 30, 2019.
The Trust and JPMCB have entered into a financing arrangement. Under this arrangement, JPMCB provides an unsecured, uncommitted credit facility in the aggregate amount of $100 million to certain of the J.P. Morgan Funds, including the Fund. Advances under the arrangement are taken primarily for temporary or emergency purposes, including the meeting of redemption requests that otherwise might require the untimely disposition
of securities, and are subject to the Fund’s borrowing restrictions. Interest on borrowings is payable at a rate determined by JPMCB at the time of borrowing. This agreement has been extended until October 30, 2023.
| | | | | | | | | | |
| | | | | |
| 74 | | | | | | | | J.P. MORGAN SPECIALTY FUNDS | | |
The Fund had no borrowings outstanding from the unsecured, uncommitted credit facility during the six month periods ended April 30, 2023, April 30, 2022, April 30, 2021, April 30, 2020 and April 30, 2019.
The Trust, along with certain other trusts for J.P. Morgan Funds (“Borrowers”), has entered into a joint syndicated senior unsecured revolving credit facility totaling $1.5 billion (“Credit Facility”) with various lenders and The Bank of New York Mellon, as administrative agent for the lenders. This Credit Facility provides a source of funds to the Borrowers for temporary and emergency purposes, including the meeting of redemption requests that otherwise might require the untimely disposition of securities. Under the terms of the Credit Facility, a borrowing fund must have a minimum of $25 million in adjusted net asset value and not exceed certain adjusted net asset coverage ratios prior to and during the time in which any borrowings are outstanding. If a fund does not comply with the aforementioned requirements, the fund must remediate within three business days with respect to the $25 million minimum adjusted net asset value or within one business day with respect to certain asset coverage ratios or the administrative agent at the request of, or with the consent of, the lenders may terminate the Credit Facility and declare any outstanding borrowings to be due and payable immediately.
Interest associated with any borrowing under the Credit Facility is charged to the borrowing fund at a rate of interest equal to 1.00% during the period November 1, 2018 through August 10, 2020, 1.25% during the period August 11, 2020 through August 9, 2021 and 1.00% during the period August 10, 2021 through August 8, 2022, (the “Applicable Margin”), plus the greater of the federal funds effective rate or one month LIBOR. The annual commitment fee to maintain the Credit Facility is 0.15% and is incurred on the unused portion of the Credit Facility and is allocated to all participating funds pro rata based on their respective net assets. Effective August 9, 2022, the Credit Facility has been amended and restated for a term of 364 days, unless extended, and to include a change in the interest associated with any borrowing to the higher, on the day of the borrowing, of (a) the federal funds effective rate, or (b) the one-month Adjusted SOFR Rate plus reduction of the Applicable Margin charged for borrowing under the Credit Facility from 1.25% to 1.00%.
The Fund did not utilize the Credit Facility during the six month periods ended April 30, 2023, April 30, 2022, April 30, 2021, April 30, 2020 and April 30, 2019.
7. Risks, Concentrations and Indemnifications
In the normal course of business, the Fund enters into contracts that contain a variety of representations which provide general indemnifications. The Fund’s maximum exposure under these arrangements is unknown. The amount of exposure would depend on future claims that may be brought against the Fund. However, based on experience, the Fund expects the risk of loss to be remote.
For the six month periods indicated below, the Fund had individual shareholder and/or omnibus accounts each owning more than 10% of the respective Fund’s outstanding shares as follows:
| | | | | | | | |
| | | Number of Individual
Shareholder and/or
Non-Affiliated Omnibus Accounts | | | % of the Fund | |
April 30, 2023 | | | 3 | | | | 58.8 | % |
April 30, 2022 | | | 2 | | | | 38.0 | |
April 30, 2021 | | | 3 | | | | 55.5 | |
April 30, 2020 | | | 3 | | | | 46.7 | |
April 30, 2019 | | | | | | | | |
Significant shareholder transactions by these shareholders may impact the Fund’s performance and liquidity.
Derivatives may be riskier than other types of investments because they may be more sensitive to changes in economic and market conditions and could result in losses that significantly exceed the Fund’s original investment. Many derivatives create leverage thereby causing the Fund to be more volatile than they would have been if they had not used derivatives. Derivatives also expose the Fund to counterparty risk (the risk that the derivative counterparty will not fulfill its contractual obligations), including credit risk of the derivative counterparty. The possible lack of a liquid secondary market for derivatives and the resulting inability of the Fund to sell or otherwise close a derivatives position could expose the Fund to losses.
The Fund is also subject to counterparty credit risk, which is the risk that a counterparty fails to perform on agreements with the Fund.
As of April 30, 2023, April 30, 2023, April 30, 2022, April 30, 2021, April 30, 2020 and April 30, 2019, the Fund pledged substantially all of its assets to Citigroup Global Markets, Inc. for securities sold short. For the Fund, deposits at broker for securities sold short, as noted on the Statements of Assets and Liabilities, are held at Citigroup Global Markets, Inc.
LIBOR is intended to represent the rate at which contributing banks may obtain short-term borrowings from each other in the London interbank market. On March 5, 2021, the U.K. Financial Conduct Authority (“FCA”) publicly announced that (i) immediately after December 31, 2021, publication of the 1-week and 2-month U.S. Dollar LIBOR settings will permanently cease; (ii) immediately after June 30, 2023, publication of the overnight and 12-month U.S. Dollar LIBOR settings will permanently cease; and (iii) immediately after June 30, 2023, the 1-month, 3-month and 6-month U.S. Dollar LIBOR settings will cease to be provided or, subject to the FCA’s consideration of the case, be provided on a synthetic basis and no longer be representative of the underlying market and economic reality they are intended to measure and that representativeness will not be restored. There is no
| | | | | | | | | | |
| | | | | |
| | J.P. MORGAN SPECIALTY FUNDS | | | | | | | | 75 |
NOTES TO FINANCIAL STATEMENTS
AS OF APRIL 30, 2023, APRIL 30, 2022, APRIL 30, 2021, APRIL 30, 2020 and APRIL 30, 2019 (Unaudited) (continued)
(Dollar values in thousands)
assurance that the dates announced by the FCA will not change or that the administrator of LIBOR and/or regulators will not take further action that could impact the availability, composition or characteristics of LIBOR or the currencies and/or tenors for which LIBOR is published. In addition, certain regulated entities ceased entering into most new LIBOR contracts in connection with regulatory guidance or prohibitions. Public and private sector industry initiatives are currently underway to implement new or alternative reference rates to be used in place of LIBOR. There is no assurance that any such alternative reference rate will be similar to or produce the same value or economic equivalence as LIBOR or that it will have the same volume or liquidity as did LIBOR prior to its discontinuance, unavailability or replacement, all of which may affect the value, volatility, liquidity or return on certain of a Fund’s loans, notes, derivatives and other instruments or investments comprising some or all of a Fund’s investments and result in costs incurred in connection with changing reference rates used for positions, closing out positions and entering into new trades. Certain of a Fund’s investments may transition from LIBOR prior to the dates announced by the FCA. The transition from LIBOR to alternative reference rates may result in operational issues for a Fund or its investments. No assurances can be given as to the impact of the LIBOR transition (and the timing of any such impact) on a Fund and its investments.
The Fund is subject to infectious disease epidemics/pandemics risk. The worldwide outbreak of COVID-19 negatively affected economies, markets and individual companies throughout the world. The effects of this, or any future, pandemic to public health and business and market conditions may have a significant negative impact on the performance of a Fund’s investments, increase the Fund’s volatility, exacerbate other pre-existing political, social and economic risks to the Fund and negatively impact broad segments of businesses and populations. In addition, governments, their regulatory agencies, or self-regulatory organizations have taken or may take actions in response to a pandemic that affect the instruments in which the Fund invests, or the issuers of such instruments, in ways that could also have a significant negative impact on the Fund’s investment performance. The ultimate impact of any pandemic and the extent to which the associated conditions and governmental responses impact a Fund will also depend on future developments, which are highly uncertain, difficult to accurately predict and subject to frequent changes.
8. Restatement
Subsequent to the issuance of the April 30, 2023 financial statements, management identified a material error in accounting for the receipt of class action litigation payments, which resulted in an understatement of the Fund’s net assets, realized gain and investment income beginning on March 12, 2015. The Adviser determined that the error became material as of April 29, 2019. In accordance with the Fund’s NAV error correction policy, the Fund has the unilateral right to reprocess shareholder transactions effected from April 29, 2019 through July 17, 2024, (the “Error Period”), which includes adjusting existing shareholder accounts to remove excess shares attributable to purchases made during the Error Period. The Fund’s Adviser will be responsible (through cash payment) for any shortfall to the Fund to the extent reprocessing is not completed for any applicable purchases during the Error Period. In addition, the Fund’s Adviser will reimburse the Fund for any additional expenses as a result of this reprocessing.
The accompanying financial statements of the Fund for the six months ended April 30, 2023, April 30, 2022, April 30, 2021, April 30, 2020 and April 30, 2019 have been restated from amounts previously reported to correct the error. The following information presents the previously reported and corrected information on each of the impacted financial statements. The schedule of portfolio investments was required to be restated to reflect the impact of the restatement in net assets; there was no impact on fair value or cost of investments as previously reported.
| | | | | | | | | | |
| | | | | |
| 76 | | | | | | | | J.P. MORGAN SPECIALTY FUNDS | | |
STATEMENT OF ASSETS AND LIABILITIES
AS OF APRIL 30, 2023
(Amounts in thousands, except per share amounts)
| | | | | | | | | | | | | | | | |
| | | Previously Reported | | | Adjustments | | | As Restated | | | | |
Assets: | | | | | | | | | | | | | | | | |
Interest from non-affiliates | | $ | 435 | | | $ | 80 | | | $ | 515 | | | | | |
Class action proceeds | | | — | | | | 1,154 | | | | 1,154 | | | | | |
| | | | | | | | | | | | | | | | |
Total Assets | | | 293,337 | | | | 1,234 | | | | 294,571 | | | | | |
| | | | | | | | | | | | | | | | |
Liabilities | | | | | | | | | | | | | | | | |
Due to shareholders upon reprocessing | | | — | | | | 5,671 | | | | 5,671 | | | | | |
| | | | | | | | | | | | | | | | |
Total Liabilities | | | 129,744 | | | | 5,671 | | | | 135,415 | | | | | |
| | | | | | | | | | | | | | | | |
Net Assets | | | 163,593 | | | | (4,437 | ) | | | 159,156 | | | | | |
| | | | | | | | | | | | | | | | |
Future share reacquisition adjustment | | | — | | | | 7,287 | | | | 7,287 | | | | | |
| | | | | | | | | | | | | | | | |
Net Assets after future share reacquisition adjustment | | $ | — | | | $ | 166,443 | | | $ | 166,443 | | | | | |
| | | | | | | | | | | | | | | | |
NET ASSETS: | | | | | | | | | | | | | | | | |
Paid-in-capital | | $ | 173,910 | | | $ | (5,671 | ) | | $ | 168,239 | | | | | |
Total distributable earnings (loss) | | | (10,317 | ) | | | 1,234 | | | | (9,083 | ) | | | | |
| | | | | | | | | | | | | | | | |
Net Assets | | | 163,593 | | | | (4,437 | ) | | | 159,156 | | | | | |
| | | | | | | | | | | | | | | | |
Future share reacquisition adjustment | | | — | | | | 7,287 | | | | 7,287 | | | | | |
| | | | | | | | | | | | | | | | |
Net Assets after future share reacquisition adjustment | | | — | | | $ | 166,443 | | | $ | 166,443 | | | | | |
| | | | | | | | | | | | | | | | |
Net Assets after future share reacquisition adjustment: | | | | | | | | | | | | | | | | |
Class A | | $ | 22,288 | | | $ | 389 | | | $ | 22,677 | | | | | |
Class C | | | 1,702 | | | | 32 | | | | 1,734 | | | | | |
Class I | | | 139,603 | | | | 2,429 | | | | 142,032 | | | | | |
| | | | | | | | | | | | | | | | |
Total | | $ | 163,593 | | | $ | 2,850 | | | $ | 166,443 | | | | | |
| | | | | | | | | | | | | | | | |
Net Asset Value (a) | | | | | | | | | | | | | | | | |
after future share reacquisition adjustment | | | | | | | | | | | | | | | | |
Class A — Redemption price per share | | $ | 12.74 | | | $ | 0.22 | | | $ | 12.96 | | | | | |
Class C — Offering price per share (b) | | | 11.29 | | | | 0.21 | | | | 11.50 | | | | | |
Class I — Offering and redemption per share | | | 13.68 | | | | 0.23 | | | | 13.91 | | | | | |
Class A maximum public offering price per share | | | | | | | | | | | | | | | | |
[net asset value per share/(100% - maximum sales charge] | | $ | 13.45 | | | $ | 0.23 | | | $ | 13.68 | | | | | |
| | | | | | | | | | | | | | | | |
| (a) | Per share amounts may not recalculate due to rounding of net assets and/or shares outstanding. |
| (b) | Redemption price for Class C Shares varies based upon length of time the shares are held. |
As presented above, in order to correct the Fund’s net assets under the Fund’s NAV correction policy, the Fund has recorded a future share reacquisition adjustment to net assets. This amount represents the value of shares the Fund has a unilateral right to reacquire through reprocessing for the Error Period and is determined by using the corrected NAV at each reprocessing date. The Fund’s Adviser will be responsible for any shortfall to the Fund to the extent reprocessing is not completed for any applicable purchases during the Error Period.
| | | | | | | | | | |
| | | | | |
| | J.P. MORGAN SPECIALTY FUNDS | | | | | | | | 77 |
NOTES TO FINANCIAL STATEMENTS
AS OF APRIL 30, 2023, APRIL 30, 2022, APRIL 30, 2021, APRIL 30, 2020 and APRIL 30, 2019 (Unaudited) (continued)
(Dollar values in thousands)
STATEMENT OF OPERATIONS
FOR THE SIX MONTHS ENDED APRIL 30, 2023
(Amounts in thousands)
| | | | | | | | | | | | | | | | |
| | | Previously Reported | | | Adjustments | | | As Restated | | | | |
INVESTMENT INCOME | | | | | | | | | | | | | | | | |
Interest income from non-affiliates | | $ | 5 | | | $ | 28 | | | $ | 33 | | | | | |
| | | | | | | | | | | | | | | | |
Total investment income | | | 3,977 | | | | 28 | | | | 4,005 | | | | | |
| | | | | | | | | | | | | | | | |
Net investment income (loss) | | | 1,915 | | | | 28 | | | | 1,943 | | | | | |
| | | | | | | | | | | | | | | | |
| | | | |
REALIZED/UNREALIZED GAINS (LOSSES) | | | | | | | | | | | | | | | | |
Net realized gain (loss) on transactions from: | | | | | | | | | | | | | | | | |
Investments in non-affiliates | | | (1,001 | ) | | | 3 | | | | (998 | ) | | | | |
| | | | | | | | | | | | | | | | |
Net realized gain (loss) | | | (1,628 | ) | | | 3 | | | | (1,625 | ) | | | | |
| | | | | | | | | | | | | | | | |
Net realized/unrealized gains (losses) | | | 6,631 | | | | 3 | | | | 6,634 | | | | | |
| | | | | | | | | | | | | | | | |
Change in net assets resulting from operations | | $ | 8,546 | | | $ | 31 | | | $ | 8,577 | | | | | |
| | | | | | | | | | | | | | | | |
STATEMENT OF CHANGES IN NET ASSETS
FOR THE SIX MONTHS ENDED APRIL 30, 2023
(Amounts in thousands)
| | | | | | | | | | | | | | | | |
| | | Previously Reported | | | Adjustments | | | As Restated | | | | |
CHANGE IN NET ASSETS RESULTING FROM OPERATIONS: | | | | | | | | | | | | | | | | |
Net investment income (loss) | | $ | 1,915 | | | $ | 28 | | | $ | 1,943 | | | | | |
Net realized gain (loss) | | | (1,628 | ) | | | 3 | | | | (1,625 | ) | | | | |
| | | | | | | | | | | | | | | | |
Change in net assets resulting from operations | | | 8,546 | | | | 31 | | | | 8,577 | | | | | |
| | | | | | | | | | | | | | | | |
| | | | |
CAPITAL TRANSACTIONS: | | | | | | | | | | | | | | | | |
Change in net assets resulting from capital transactions | | | (3,299 | ) | | | (918 | ) | | | (4,217 | ) | | | | |
| | | | |
NET ASSETS: | | | | | | | | | | | | | | | | |
Change in net assets | | | 5,247 | | | | (887 | ) | | | 4,360 | | | | | |
Beginning of period | | | 158,346 | | | | (3,550 | ) | | | 154,796 | | | | | |
| | | | | | | | | | | | | | | | |
End of Period | | | 163,593 | | | | (4,437 | ) | | | 159,156 | | | | | |
| | | | | | | | | | | | | | | | |
Future share reacquisition adjustment | | | — | | | | 7,287 | | | | 7,287 | | | | | |
| | | | | | | | | | | | | | | | |
End of period after future share reacquisition adjustment | | $ | — | | | $ | 166,443 | | | $ | 166,443 | | | | | |
| | | | | | | | | | | | | | | | |
| | | | |
CAPITAL TRANSACTIONS | | | | | | | | | | | | | | | | |
Class A | | | | | | | | | | | | | | | | |
Cost of shares redeemed | | $ | (3,439 | ) | | $ | (61 | ) | | $ | (3,500 | ) | | | | |
| | | | | | | | | | | | | | | | |
Change in net assets resulting from Class A capital transactions | | | 1,250 | | | | (61 | ) | | | 1,189 | | | | | |
| | | | | | | | | | | | | | | | |
| | | | |
Class C | | | | | | | | | | | | | | | | |
Cost of shares redeemed | | | (141 | ) | | | (2 | ) | | | (143 | ) | | | | |
| | | | | | | | | | | | | | | | |
Change in net assets resulting from Class C capital transactions | | | 144 | | | | (2 | ) | | | 142 | | | | | |
| | | | | | | | | | | | | | | | |
| | | | |
Class I | | | | | | | | | | | | | | | | |
Cost of shares redeemed | | | (47,897 | ) | | | (855 | ) | | | (48,752 | ) | | | | |
| | | | | | | | | | | | | | | | |
Change in net assets resulting from Class I capital transactions | | | (4,693 | ) | | | (855 | ) | | | (5,548 | ) | | | | |
| | | | | | | | | | | | | | | | |
Total change in net assets resulting from capital transactions | | $ | (3,299 | ) | | $ | (918 | ) | | $ | (4,217 | ) | | | | |
| | | | | | | | | | | | | | | | |
| | | | | | | | | | |
| | | | | |
| 78 | | | | | | | | J.P. MORGAN SPECIALTY FUNDS | | |
STATEMENT OF ASSETS AND LIABILITIES
AS OF APRIL 30, 2022
(Amounts in thousands)
| | | | | | | | | | | | | | | | |
| | | Previously Reported | | | Adjustments | | | As Restated | | | | |
Assets: | | | | | | | | | | | | | | | | |
Interest from non-affiliates | | $ | 5 | | | $ | 40 | | | $ | 45 | | | | | |
Class action proceeds | | | — | | | | 1,146 | | | | 1,146 | | | | | |
| | | | | | | | | | | | | | | | |
Total Assets | | | 207,229 | | | | 1,186 | | | | 208,415 | | | | | |
| | | | | | | | | | | | | | | | |
Liabilities | | | | | | | | | | | | | | | | |
Due to shareholders upon reprocessing | | | — | | | | 4,281 | | | | 4,281 | | | | | |
| | | | | | | | | | | | | | | | |
Total Liabilities | | | 82,882 | | | | 4,281 | | | | 87,163 | | | | | |
| | | | | | | | | | | | | | | | |
Net Assets | | | 124,347 | | | | (3,095 | ) | | | 121,252 | | | | | |
| | | | | | | | | | | | | | | | |
Future share reacquisition adjustment | | | — | | | | 5,335 | | | | 5,335 | | | | | |
| | | | | | | | | | | | | | | | |
Net Assets after future share reacquisition adjustment | | $ | — | | | $ | 126,587 | | | $ | 126,587 | | | | | |
| | | | | | | | | | | | | | | | |
NET ASSETS: | | | | | | | | | | | | | | | | |
Paid-in-capital | | $ | 144,805 | | | $ | (4,281 | ) | | $ | 140,524 | | | | | |
Total distributable earnings (loss) | | | (20,458 | ) | | | 1,186 | | | | (19,272 | ) | | | | |
| | | | | | | | | | | | | | | | |
Net Assets | | | 124,347 | | | | (3,095 | ) | | | 121,252 | | | | | |
| | | | | | | | | | | | | | | | |
Future share reacquisition adjustment | | | — | | | | 5,335 | | | | 5,335 | | | | | |
| | | | | | | | | | | | | | | | |
Net Assets after future share reacquisition adjustment | | $ | — | | | $ | 126,587 | | | $ | 126,587 | | | | | |
| | | | | | | | | | | | | | | | |
Net Assets after future share reacquisition adjustment: | | | | | | | | | | | | | | | | |
Class A | | $ | 19,566 | | | $ | 354 | | | $ | 19,920 | | | | | |
Class C | | | 1,128 | | | | 21 | | | | 1,149 | | | | | |
Class I | | | 103,653 | | | | 1,865 | | | | 105,518 | | | | | |
| | | | | | | | | | | | | | | | |
Total | | $ | 124,347 | | | $ | 2,240 | | | $ | 126,587 | | | | | |
| | | | | | | | | | | | | | | | |
Net Asset Value (a) | | | | | | | | | | | | | | | | |
after future share reacquisition adjustment | | | | | | | | | | | | | | | | |
Class A — Redemption price per share | | $ | 12.07 | | | $ | 0.22 | | | $ | 12.29 | | | | | |
Class C — Offering price per share (b) | | | 10.76 | | | | 0.20 | | | | 10.96 | | | | | |
Class I — Offering and redemption per share | | | 12.93 | | | | 0.23 | | | | 13.16 | | | | | |
Class A maximum public offering price per share | | | | | | | | | | | | | | | | |
[net asset value per share/(100% - maximum sales charge] | | $ | 12.74 | | | $ | 0.23 | | | $ | 12.97 | | | | | |
| | | | | | | | | | | | | | | | |
| (a) | Per share amounts may not recalculate due to rounding of net assets and/or shares outstanding. |
| (b) | Redemption price for Class C Shares varies based upon length of time the shares are held. |
As presented above, in order to correct the Fund’s net assets under the Fund’s NAV correction policy, the Fund has recorded a future share reacquisition adjustment to net assets. This amount represents the value of shares the Fund has a unilateral right to reacquire through reprocessing for the Error Period and is determined by using the corrected NAV at each reprocessing date. The Fund’s Adviser will be responsible for any shortfall to the Fund to the extent reprocessing is not completed for any applicable purchases during the Error Period.
| | | | | | | | | | |
| | | | | |
| | J.P. MORGAN SPECIALTY FUNDS | | | | | | | | 79 |
NOTES TO FINANCIAL STATEMENTS
AS OF APRIL 30, 2023, APRIL 30, 2022, APRIL 30, 2021, APRIL 30, 2020 and APRIL 30, 2019 (Unaudited) (continued)
(Dollar values in thousands)
STATEMENT OF OPERATIONS
FOR THE SIX MONTHS ENDED APRIL 30, 2022
(Amounts in thousands)
| | | | | | | | | | | | | | | | |
| | | Previously Reported | | | Adjustments | | | As Restated | | | | |
INVESTMENT INCOME | | | | | | | | | | | | | | | | |
Interest income from non-affiliates | | $ | — | | | $ | 2 | | | $ | 2 | | | | | |
| | | | | | | | | | | | | | | | |
Total investment income | | | 623 | | | | 2 | | | | 625 | | | | | |
| | | | | | | | | | | | | | | | |
Net investment income (loss) | | | (941 | ) | | | 2 | | | | (939 | ) | | | | |
| | | | | | | | | | | | | | | | |
| | | | |
REALIZED/UNREALIZED GAINS (LOSSES) | | | | | | | | | | | | | | | | |
Net realized gain (loss) on transactions from: | | | | | | | | | | | | | | | | |
Investments in non-affiliates | | | 5,115 | | | | 16 | | | | 5,131 | | | | | |
| | | | | | | | | | | | | | | | |
Net realized gain (loss) | | | 954 | | | | 16 | | | | 970 | | | | | |
| | | | | | | | | | | | | | | | |
Net realized/unrealized gains (losses) | | | (2,377 | ) | | | 16 | | | | (2,361 | ) | | | | |
| | | | | | | | | | | | | | | | |
Change in net assets resulting from operations | | $ | (3,318 | ) | | $ | 18 | | | $ | (3,300 | ) | | | | |
| | | | | | | | | | | | | | | | |
STATEMENT OF CHANGES IN NET ASSETS
FOR THE SIX MONTHS ENDED APRIL 30, 2022
(Amounts in thousands)
| | | | | | | | | | | | | | | | |
| | | Previously Reported | | | Adjustments | | | As Restated | | | | |
CHANGE IN NET ASSETS RESULTING FROM OPERATIONS: | | | | | | | | | | | | | | | | |
Net investment income (loss) | | $ | (941 | ) | | $ | 2 | | | $ | (939 | ) | | | | |
Net realized gain (loss) | | | 954 | | | | 16 | | | | 970 | | | | | |
| | | | | | | | | | | | | | | | |
Change in net assets resulting from operations | | | (3,318 | ) | | | 18 | | | | (3,300 | ) | | | | |
| | | | | | | | | | | | | | | | |
| | | | |
CAPITAL TRANSACTIONS: | | | | | | | | | | | | | | | | |
Change in net assets resulting from capital transactions | | | 35,475 | | | | (581 | ) | | | 34,894 | | | | | |
| | | | |
NET ASSETS: | | | | | | | | | | | | | | | | |
Change in net assets | | | 32,157 | | | | (563 | ) | | | 31,594 | | | | | |
Beginning of period | | | 92,190 | | | | (2,532 | ) | | | 89,658 | | | | | |
| | | | | | | | | | | | | | | | |
End of Period | | | 124,347 | | | | (3,095 | ) | | | 121,252 | | | | | |
| | | | | | | | | | | | | | | | |
Future share reacquisition adjustment | | | — | | | | 5,335 | | | | 5,335 | | | | | |
| | | | | | | | | | | | | | | | |
End of period after future share reacquisition adjustment | | $ | — | | | $ | 126,587 | | | $ | 126,587 | | | | | |
| | | | | | | | | | | | | | | | |
| | | | |
CAPITAL TRANSACTIONS | | | | | | | | | | | | | | | | |
Class A | | | | | | | | | | | | | | | | |
Cost of shares redeemed | | $ | (2,357 | ) | | $ | (41 | ) | | $ | (2,398 | ) | | | | |
| | | | | | | | | | | | | | | | |
Change in net assets resulting from Class A capital transactions | | | 3,266 | | | | (41 | ) | | | 3,225 | | | | | |
| | | | | | | | | | | | | | | | |
| | | | |
Class C | | | | | | | | | | | | | | | | |
Cost of shares redeemed | | | (180 | ) | | | (3 | ) | | | (183 | ) | | | | |
| | | | | | | | | | | | | | | | |
Change in net assets resulting from Class C capital transactions | | | (48 | ) | | | (3 | ) | | | (51 | ) | | | | |
| | | | | | | | | | | | | | | | |
| | | | |
Class I | | | | | | | | | | | | | | | | |
Cost of shares redeemed | | | (30,453 | ) | | | (537 | ) | | | (30,990 | ) | | | | |
| | | | | | | | | | | | | | | | |
Change in net assets resulting from Class I capital transactions | | | 32,257 | | | | (537 | ) | | | 31,720 | | | | | |
| | | | | | | | | | | | | | | | |
Total change in net assets resulting from capital transactions | | $ | 35,475 | | | $ | (581 | ) | | $ | 34,894 | | | | | |
| | | | | | | | | | | | | | | | |
| | | | | | | | | | |
| | | | | |
| 80 | | | | | | | | J.P. MORGAN SPECIALTY FUNDS | | |
STATEMENT OF ASSETS AND LIABILITIES
AS OF APRIL 30, 2021
(Amounts in thousands)
| | | | | | | | | | | | | | | | |
| | | Previously Reported | | | Adjustments | | | As Restated | | | | |
Assets: | | | | | | | | | | | | | | | | |
Interest from non-affiliates | | $ | — | | | $ | 37 | | | $ | 37 | | | | | |
Class action proceeds | | | — | | | | 1,117 | | | | 1,117 | | | | | |
| | | | | | | | | | | | | | | | |
Total Assets | | | 167,875 | | | | 1,154 | | | | 169,029 | | | | | |
| | | | | | | | | | | | | | | | |
Liabilities | | | | | | | | | | | | | | | | |
Due to shareholders upon reprocessing | | | — | | | | 3,324 | | | | 3,324 | | | | | |
| | | | | | | | | | | | | | | | |
Total Liabilities | | | 73,552 | | | | 3,324 | | | | 76,876 | | | | | |
| | | | | | | | | | | | | | | | |
Net Assets | | | 94,323 | | | | (2,170 | ) | | | 92,153 | | | | | |
| | | | | | | | | | | | | | | | |
Future share reacquisition adjustment | | | — | | | | 3,824 | | | | 3,824 | | | | | |
| | | | | | | | | | | | | | | | |
Net Assets after future share reacquisition adjustment | | $ | — | | | $ | 95,977 | | | $ | 95,977 | | | | | |
| | | | | | | | | | | | | | | | |
NET ASSETS: | | | | | | | | | | | | | | | | |
Paid-in-capital | | $ | 112,740 | | | $ | (3,324 | ) | | $ | 109,416 | | | | | |
Total distributable earnings (loss) | | | (18,417 | ) | | | 1,154 | | | | (17,263 | ) | | | | |
| | | | | | | | | | | | | | | | |
Net Assets | | | 94,323 | | | | (2,170 | ) | | | 92,153 | | | | | |
| | | | | | | | | | | | | | | | |
Future share reacquisition adjustment | | | — | | | | 3,824 | | | | 3,824 | | | | | |
| | | | | | | | | | | | | | | | |
Net Assets after future share reacquisition adjustment | | $ | — | | | $ | 95,977 | | | $ | 95,977 | | | | | |
| | | | | | | | | | | | | | | | |
Net Assets after future share reacquisition adjustment: | | | | | | | | | | | | | | | | |
Class A | | $ | 13,709 | | | $ | 241 | | | $ | 13,950 | | | | | |
Class C | | | 1,559 | | | | 28 | | | | 1,587 | | | | | |
Class I | | | 79,055 | | | | 1,385 | | | | 80,440 | | | | | |
| | | | | | | | | | | | | | | | |
Total | | $ | 94,323 | | | $ | 1,654 | | | $ | 95,977 | | | | | |
| | | | | | | | | | | | | | | | |
Net Asset Value (a) | | | | | | | | | | | | | | | | |
after future share reacquisition adjustment | | | | | | | | | | | | | | | | |
Class A — Redemption price per share | | $ | 12.29 | | | $ | 0.21 | | | $ | 12.50 | | | | | |
Class C — Offering price per share (b) | | | 11.00 | | | | 0.20 | | | | 11.20 | | | | | |
Class I — Offering and redemption per share | | | 13.13 | | | | 0.20 | | | | 13.33 | | | | | |
Class A maximum public offering price per share | | | | | | | | | | | | | | | | |
[net asset value per share/(100% - maximum sales charge] | | $ | 12.97 | | | $ | 0.22 | | | $ | 13.19 | | | | | |
| | | | | | | | | | | | | | | | |
| (a) | Per share amounts may not recalculate due to rounding of net assets and/or shares outstanding. |
| (b) | Redemption price for Class C Shares varies based upon length of time the shares are held. |
As presented above, in order to correct the Fund’s net assets under the Fund’s NAV correction policy, the Fund has recorded a future share reacquisition adjustment to net assets. This amount represents the value of shares the Fund has a unilateral right to reacquire through reprocessing for the Error Period and is determined by using the corrected NAV at each reprocessing date. The Fund’s Adviser will be responsible for any shortfall to the Fund to the extent reprocessing is not completed for any applicable purchases during the Error Period.
| | | | | | | | | | |
| | | | | |
| | J.P. MORGAN SPECIALTY FUNDS | | | | | | | | 81 |
NOTES TO FINANCIAL STATEMENTS
AS OF APRIL 30, 2023, APRIL 30, 2022, APRIL 30, 2021, APRIL 30, 2020 and APRIL 30, 2019 (Unaudited) (continued)
(Dollar values in thousands)
STATEMENT OF OPERATIONS
FOR THE SIX MONTHS ENDED APRIL 30, 2021
(Amounts in thousands)
| | | | | | | | | | | | | | | | |
| | | Previously Reported | | | Adjustments | | | As Restated | | | | |
INVESTMENT INCOME | | | | | | | | | | | | | | | | |
Interest income from non-affiliates | | $ | — | | | $ | 1 | | | $ | 1 | | | | | |
| | | | | | | | | | | | | | | | |
Total investment income | | | 706 | | | | 1 | | | | 707 | | | | | |
| | | | | | | | | | | | | | | | |
Net investment income (loss) | | | (826 | ) | | | 1 | | | | (825 | ) | | | | |
| | | | | | | | | | | | | | | | |
| | | | |
REALIZED/UNREALIZED GAINS (LOSSES) | | | | | | | | | | | | | | | | |
Net realized gain (loss) on transactions from: | | | | | | | | | | | | | | | | |
Investments in non-affiliates | | | 20,995 | | | | 2 | | | | 20,997 | | | | | |
| | | | | | | | | | | | | | | | |
Net realized gain (loss) | | | 2,072 | | | | 2 | | | | 2,074 | | | | | |
| | | | | | | | | | | | | | | | |
Net realized/unrealized gains (losses) | | | 2,047 | | | | 2 | | | | 2,049 | | | | | |
| | | | | | | | | | | | | | | | |
Change in net assets resulting from operations | | $ | 1,221 | | | $ | 3 | | | $ | 1,224 | | | | | |
| | | | | | | | | | | | | | | | |
STATEMENT OF CHANGES IN NET ASSETS
FOR THE SIX MONTHS ENDED APRIL 30, 2021
(Amounts in thousands)
| | | | | | | | | | | | | | | | |
| | | Previously Reported | | | Adjustments | | | As Restated | | | | |
CHANGE IN NET ASSETS RESULTING FROM OPERATIONS: | | | | | | | | | | | | | | | | |
Net investment income (loss) | | $ | (826 | ) | | $ | 1 | | | $ | (825 | ) | | | | |
Net realized gain (loss) | | | 2,072 | | | | 2 | | | | 2,074 | | | | | |
| | | | | | | | | | | | | | | | |
Change in net assets resulting from operations | | | 1,221 | | | | 3 | | | | 1,224 | | | | | |
| | | | | | | | | | | | | | | | |
| | | | |
CAPITAL TRANSACTIONS: | | | | | | | | | | | | | | | | |
Change in net assets resulting from capital transactions | | | (40,153 | ) | | | (1,389 | ) | | | (41,542 | ) | | | | |
| | | | |
NET ASSETS: | | | | | | | | | | | | | | | | |
Change in net assets | | | (47,116 | ) | | | (1,386 | ) | | | (48,502 | ) | | | | |
Beginning of period | | | 141,439 | | | | (784 | ) | | | 140,655 | | | | | |
| | | | | | | | | | | | | | | | |
End of Period | | | 94,323 | | | | (2,170 | ) | | | 92,153 | | | | | |
| | | | | | | | | | | | | | | | |
Future share reacquisition adjustment | | | — | | | | 3,824 | | | | 3,824 | | | | | |
| | | | | | | | | | | | | | | | |
End of period after future share reacquisition adjustment | | $ | — | | | $ | 95,977 | | | $ | 95,977 | | | | | |
| | | | | | | | | | | | | | | | |
| | | | |
CAPITAL TRANSACTIONS | | | | | | | | | | | | | | | | |
Class A | | | | | | | | | | | | | | | | |
Cost of shares redeemed | | $ | (6,857 | ) | | $ | (120 | ) | | $ | (6,977 | ) | | | | |
| | | | | | | | | | | | | | | | |
Change in net assets resulting from Class A capital transactions | | | (3,582 | ) | | | (120 | ) | | | (3,702 | ) | | | | |
| | | | | | | | | | | | | | | | |
| | | | |
Class C | | | | | | | | | | | | | | | | |
Cost of shares redeemed | | | (721 | ) | | | (13 | ) | | | (734 | ) | | | | |
| | | | | | | | | | | | | | | | |
Change in net assets resulting from Class C capital transactions | | | (249 | ) | | | (13 | ) | | | (262 | ) | | | | |
| | | | | | | | | | | | | | | | |
| | | | |
Class I | | | | | | | | | | | | | | | | |
Cost of shares redeemed | | | (71,214 | ) | | | (1,256 | ) | | | (72,470 | ) | | | | |
| | | | | | | | | | | | | | | | |
Change in net assets resulting from Class I capital transactions | | | (36,322 | ) | | | (1,256 | ) | | | (37,578 | ) | | | | |
| | | | | | | | | | | | | | | | |
Total change in net assets resulting from capital transactions | | $ | (40,153 | ) | | $ | (1,389 | ) | | $ | (41,542 | ) | | | | |
| | | | | | | | | | | | | | | | |
| | | | | | | | | | |
| | | | | |
| 82 | | | | | | | | J.P. MORGAN SPECIALTY FUNDS | | |
STATEMENT OF ASSETS AND LIABILITIES
AS OF APRIL 30, 2020
(Amounts in thousands)
| | | | | | | | | | | | | | | | |
| | | Previously Reported | | | Adjustments | | | As Restated | | | | |
Assets: | | | | | | | | | | | | | | | | |
Interest from non-affiliates | | $ | — | | | $ | 85 | | | $ | 85 | | | | | |
Interest an dividends from non-affiliates | | | 52 | | | | (52 | ) | | | — | | | | | |
Class action proceeds | | | — | | | | 1,077 | | | | 1,077 | | | | | |
| | | | | | | | | | | | | | | | |
Total Assets | | | 148,434 | | | | 1,110 | | | | 149,544 | | | | | |
| | | | | | | | | | | | | | | | |
Liabilities | | | | | | | | | | | | | | | | |
Due to shareholders upon reprocessing | | | — | | | | 780 | | | | 780 | | | | | |
| | | | | | | | | | | | | | | | |
Total Liabilities | | | 66,489 | | | | 780 | | | | 67,269 | | | | | |
| | | | | | | | | | | | | | | | |
Net Assets | | | 81,945 | | | | 330 | | | | 82,275 | | | | | |
| | | | | | | | | | | | | | | | |
Future share reacquisition adjustment | | | — | | | | 1,023 | | | | 1,023 | | | | | |
| | | | | | | | | | | | | | | | |
Net Assets after future share reacquisition adjustment | | $ | — | | | $ | 83,298 | | | $ | 83,298 | | | | | |
| | | | | | | | | | | | | | | | |
NET ASSETS: | | | | | | | | | | | | | | | | |
Paid-in-capital | | $ | 96,086 | | | $ | (780 | ) | | $ | 95,306 | | | | | |
Total distributable earnings (loss) | | | (14,141 | ) | | | 1,110 | | | | (13,031 | ) | | | | |
| | | | | | | | | | | | | | | | |
Net Assets | | | 81,945 | | | | 330 | | | | 82,275 | | | | | |
| | | | | | | | | | | | | | | | |
Future share reacquisition adjustment | | | — | | | | 1,023 | | | | 1,023 | | | | | |
| | | | | | | | | | | | | | | | |
Net Assets after future share reacquisition adjustment | | $ | — | | | $ | 83,298 | | | $ | 83,298 | | | | | |
| | | | | | | | | | | | | | | | |
Net Assets after future share reacquisition adjustment: | | | | | | | | | | | | | | | | |
Class A | | $ | 15,849 | | | $ | 268 | | | $ | 16,117 | | | | | |
Class C | | | 2,703 | | | | 46 | | | | 2,749 | | | | | |
Class I | | | 43,590 | | | | 727 | | | | 44,317 | | | | | |
Class L | | | 19,803 | | | | 312 | | | | 20,115 | | | | | |
| | | | | | | | | | | | | | | | |
Total | | $ | 81,945 | | | $ | 1,353 | | | $ | 83,298 | | | | | |
| | | | | | | | | | | | | | | | |
Net Asset Value (a) | | | | | | | | | | | | | | | | |
after future share reacquisition adjustment | | | | | | | | | | | | | | | | |
Class A — Redemption price per share | | $ | 12.65 | | | $ | 0.21 | | | $ | 12.86 | | | | | |
Class C — Offering price per share (b) | | | 11.48 | | | | 0.19 | | | | 11.67 | | | | | |
Class I — Offering and redemption per share | | | 13.42 | | | | 0.22 | | | | 13.64 | | | | | |
Class L — Offering and redemption per share | | | 13.79 | | | | 0.22 | | | | 14.01 | | | | | |
Class A maximum public offering price per share | | | | | | | | | | | | | | | | |
[net asset value per share/(100% - maximum sales charge] | | $ | 13.35 | | | $ | 0.22 | | | $ | 13.57 | | | | | |
| | | | | | | | | | | | | | | | |
| (a) | Per share amounts may not recalculate due to rounding of net assets and/or shares outstanding. |
| (b) | Redemption price for Class C Shares varies based upon length of time the shares are held. |
As presented above, in order to correct the Fund’s net assets under the Fund’s NAV correction policy, the Fund has recorded a future share reacquisition adjustment to net assets. This amount represents the value of shares the Fund has a unilateral right to reacquire through reprocessing for the Error Period and is determined by using the corrected NAV at each reprocessing date. The Fund’s Adviser will be responsible for any shortfall to the Fund to the extent reprocessing is not completed for any applicable purchases during the Error Period.
| | | | | | | | | | |
| | | | | |
| | J.P. MORGAN SPECIALTY FUNDS | | | | | | | | 83 |
NOTES TO FINANCIAL STATEMENTS
AS OF APRIL 30, 2023, APRIL 30, 2022, APRIL 30, 2021, APRIL 30, 2020 and APRIL 30, 2019 (Unaudited) (continued)
(Dollar values in thousands)
STATEMENT OF OPERATIONS
FOR THE SIX MONTHS ENDED APRIL 30, 2021
(Amounts in thousands)
| | | | | | | | | | | | | | | | |
| | | Previously Reported | | | Adjustments | | | As Restated | | | | |
INVESTMENT INCOME | | | | | | | | | | | | | | | | |
Interest income from non-affiliates | | $ | — | | | $ | 7 | | | $ | 7 | | | | | |
| | | | | | | | | | | | | | | | |
Total investment income | | | 633 | | | | 7 | | | | 640 | | | | | |
| | | | | | | | | | | | | | | | |
Net investment income (loss) | | | (348 | ) | | | 7 | | | | (341 | ) | | | | |
| | | | | | | | | | | | | | | | |
| | | | |
REALIZED/UNREALIZED GAINS (LOSSES) | | | | | | | | | | | | | | | | |
Net realized gain (loss) on transactions from: | | | | | | | | | | | | | | | | |
Investments in non-affiliates | | | 3,847 | | | | 283 | | | | 4,130 | | | | | |
| | | | | | | | | | | | | | | | |
Net realized gain (loss) | | | 5,432 | | | | 283 | | | | 5,715 | | | | | |
| | | | | | | | | | | | | | | | |
Net realized/unrealized gains (losses) | | | 5,147 | | | | 283 | | | | 5,430 | | | | | |
| | | | | | | | | | | | | | | | |
Change in net assets resulting from operations | | $ | 4,799 | | | $ | 290 | | | $ | 5,089 | | | | | |
| | | | | | | | | | | | | | | | |
STATEMENT OF CHANGES IN NET ASSETS
FOR THE SIX MONTHS ENDED APRIL 30, 2020
(Amounts in thousands)
| | | | | | | | | | | | | | | | |
| | | Previously Reported | | | Adjustments | | | As Restated | | | | |
CHANGE IN NET ASSETS RESULTING FROM OPERATIONS: | | | | | | | | | | | | | | | | |
Net investment income (loss) | | $ | (348 | ) | | $ | 7 | | | $ | (341 | ) | | | | |
Net realized gain (loss) | | | 5,432 | | | | 283 | | | | 5,715 | | | | | |
| | | | | | | | | | | | | | | | |
Change in net assets resulting from operations | | | 4,799 | | | | 290 | | | | 5,089 | | | | | |
| | | | | | | | | | | | | | | | |
| | | | |
CAPITAL TRANSACTIONS: | | | | | | | | | | | | | | | | |
Change in net assets resulting from capital transactions | | | 20,959 | | | | (605 | ) | | | 20,354 | | | | | |
| | | | |
NET ASSETS: | | | | | | | | | | | | | | | | |
Change in net assets | | | 19,548 | | | | (315 | ) | | | 19,233 | | | | | |
Beginning of period | | | 62,397 | | | | 645 | | | | 63,042 | | | | | |
| | | | | | | | | | | | | | | | |
End of Period | | | 81,945 | | | | 330 | | | | 82,275 | | | | | |
| | | | | | | | | | | | | | | | |
Future share reacquisition adjustment | | | — | | | | 1,023 | | | | 1,023 | | | | | |
| | | | | | | | | | | | | | | | |
End of period after future share reacquisition adjustment | | $ | — | | | $ | 83,298 | | | $ | 83,298 | | | | | |
| | | | | | | | | | | | | | | | |
| | | | |
CAPITAL TRANSACTIONS | | | | | | | | | | | | | | | | |
Class A | | | | | | | | | | | | | | | | |
Cost of shares redeemed | | $ | (3,379 | ) | | $ | (48 | ) | | $ | (3,427 | ) | | | | |
| | | | | | | | | | | | | | | | |
Change in net assets resulting from Class A capital transactions | | | 1,966 | | | | (48 | ) | | | 1,918 | | | | | |
| | | | | | | | | | | | | | | | |
| | | | |
Class C | | | | | | | | | | | | | | | | |
Cost of shares redeemed | | | (1,901 | ) | | | (28 | ) | | | (1,929 | ) | | | | |
| | | | | | | | | | | | | | | | |
Change in net assets resulting from Class C capital transactions | | | (817 | ) | | | (28 | ) | | | (845 | ) | | | | |
| | | | | | | | | | | | | | | | |
| | | | |
Class I | | | | | | | | | | | | | | | | |
Cost of shares redeemed | | | (28,498 | ) | | | (417 | ) | | | (28,915 | ) | | | | |
| | | | | | | | | | | | | | | | |
Change in net assets resulting from Class I capital transactions | | | 16,289 | ) | | | (417 | ) | | | 15,872 | | | | | |
| | | | | | | | | | | | | | | | |
| | | | |
Class L | | | | | | | | | | | | | | | | |
Cost of shares redeemed | | | (8,224 | ) | | | (112 | ) | | | (8,336 | ) | | | | |
| | | | | | | | | | | | | | | | |
Change in net assets resulting from Class L capital transactions | | | 3,521 | | | | (112 | ) | | | 3,409 | | | | | |
| | | | | | | | | | | | | | | | |
Total change in net assets resulting from capital transactions | | $ | 20,959 | | | $ | (605 | ) | | $ | 20,354 | | | | | |
| | | | | | | | | | | | | | | | |
| | | | | | | | | | |
| | | | | |
| 84 | | | | | | | | J.P. MORGAN SPECIALTY FUNDS | | |
STATEMENT OF ASSETS AND LIABILITIES
AS OF APRIL 30, 2019
(Amounts in thousands)
| | | | | | | | | | | | | | | | |
| | | Previously Reported | | | Adjustments | | | As Restated | | | | |
Assets: | | | | | | | | | | | | | | | | |
Interest from non-affiliates | | $ | — | | | $ | 17 | | | $ | 17 | | | | | |
Class action proceeds | | | — | | | | 656 | | | | 656 | | | | | |
| | | | | | | | | | | | | | | | |
Total Assets | | | 137,284 | | | | 673 | | | | 137,957 | | | | | |
| | | | | | | | | | | | | | | | |
Liabilities | | | | | | | | | | | | | | | | |
Due to shareholders upon reprocessing | | | — | | | | 5 | | | | 5 | | | | | |
Total Liabilities | | | 64,488 | | | | 5 | | | | 64,493 | | | | | |
| | | | | | | | | | | | | | | | |
Net Assets | | | 72,796 | | | | 668 | | | | 73,464 | | | | | |
| | | | | | | | | | | | | | | | |
Future share reacquisition adjustment | | | — | | | | 2 | | | | 2 | | | | | |
| | | | | | | | | | | | | | | | |
Net Assets after future share reacquisition adjustment | | $ | — | | | $ | 73,466 | | | $ | 73,466 | | | | | |
| | | | | | | | | | | | | | | | |
NET ASSETS: | | | | | | | | | | | | | | | | |
Paid-in-capital | | $ | 86,609 | | | $ | (5 | ) | | $ | 86,604 | | | | | |
Total distributable earnings (loss) | | | (13,813 | ) | | | 673 | | | | (13,140 | ) | | | | |
| | | | | | | | | | | | | | | | |
Net Assets | | | 72,796 | | | | 668 | | | | 73,464 | | | | | |
| | | | | | | | | | | | | | | | |
Future share reacquisition adjustment | | | — | | | | 2 | | | | 2 | | | | | |
| | | | | | | | | | | | | | | | |
Net Assets after future share reacquisition adjustment | | $ | — | | | $ | 73,466 | | | $ | 73,466 | | | | | |
| | | | | | | | | | | | | | | | |
Net Assets after future share reacquisition adjustment: | | | | | | | | | | | | | | | | |
Class A | | $ | 14,397 | | | $ | 137 | | | $ | 14,534 | | | | | |
Class C | | | 4,825 | | | | 46 | | | | 4,871 | | | | | |
Class I | | | 32,353 | | | | 306 | | | | 32,659 | | | | | |
Class L | | | 21,221 | | | | 181 | | | | 21,402 | | | | | |
| | | | | | | | | | | | | | | | |
Total | | $ | 72,796 | | | $ | 670 | | | $ | 73,466 | | | | | |
| | | | | | | | | | | | | | | | |
Net Asset Value (a) | | | | | | | | | | | | | | | | |
after future share reacquisition adjustment | | | | | | | | | | | | | | | | |
Class A — Redemption price per share | | $ | 13.01 | | | $ | 0.12 | | | $ | 13.13 | | | | | |
Class C — Offering price per share (b) | | | 12.00 | | | | 0.11 | | | | 12.11 | | | | | |
Class I — Offering and redemption per share | | | 13.68 | | | | 0.13 | | | | 13.81 | | | | | |
Class L — Offering and redemption per share | | | 14.00 | | | | 0.12 | | | | 14.12 | | | | | |
Class A maximum public offering price per share | | | | | | | | | | | | | | | | |
[net asset value per share/(100% - maximum sales charge] | | $ | 13.73 | | | $ | 0.13 | | | $ | 13.86 | | | | | |
| | | | | | | | | | | | | | | | |
| (a) | Per share amounts may not recalculate due to rounding of net assets and/or shares outstanding. |
| (b) | Redemption price for Class C Shares varies based upon length of time the shares are held. |
As presented above, in order to correct the Fund’s net assets under the Fund’s NAV correction policy, the Fund has recorded a future share reacquisition adjustment to net assets. This amount represents the value of shares the Fund has a unilateral right to reacquire through reprocessing for the Error Period and is determined by using the corrected NAV at each reprocessing date. The Fund’s Adviser will be responsible for any shortfall to the Fund to the extent reprocessing is not completed for any applicable purchases during the Error Period.
| | | | | | | | | | |
| | | | | |
| | J.P. MORGAN SPECIALTY FUNDS | | | | | | | | 85 |
NOTES TO FINANCIAL STATEMENTS
AS OF APRIL 30, 2023, APRIL 30, 2022, APRIL 30, 2021, APRIL 30, 2020 and APRIL 30, 2019 (Unaudited) (continued)
(Dollar values in thousands)
STATEMENT OF OPERATIONS
FOR THE SIX MONTHS ENDED APRIL 30, 2019
(Amounts in thousands)
| | | | | | | | | | | | | | | | |
| | | Previously Reported | | | Adjustments | | | As Restated | | | | |
INVESTMENT INCOME | | | | | | | | | | | | | | | | |
Interest income from non-affiliates | | $ | 2 | | | $ | 8 | | | $ | 10 | | | | | |
| | | | | | | | | | | | | | | | |
Total investment income | | | 2,989 | | | | 8 | | | | 2,997 | | | | | |
| | | | | | | | | | | | | | | | |
Net investment income (loss) | | | 211 | | | | 8 | | | | 219 | | | | | |
| | | | | | | | | | | | | | | | |
| | | | |
REALIZED/UNREALIZED GAINS (LOSSES) | | | | | | | | | | | | | | | | |
Net realized gain (loss) on transactions from: | | | | | | | | | | | | | | | | |
Investments in non-affiliates | | | 22,806 | | | | 171 | | | | 22,977 | | | | | |
| | | | | | | | | | | | | | | | |
Net realized gain (loss) | | | 19,897 | | | | 171 | | | | 20,068 | | | | | |
| | | | | | | | | | | | | | | | |
Net realized/unrealized gains (losses) | | | 2,140 | | | | 171 | | | | 2,311 | | | | | |
| | | | | | | | | | | | | | | | |
Change in net assets resulting from operations | | $ | 2,351 | | | $ | 179 | | | $ | 2,530 | | | | | |
| | | | | | | | | | | | | | | | |
STATEMENT OF CHANGES IN NET ASSETS
FOR THE SIX MONTHS ENDED APRIL 30, 2019
(Amounts in thousands)
| | | | | | | | | | | | | | | | |
| | | Previously Reported | | | Adjustments | | | As Restated | | | | |
CHANGE IN NET ASSETS RESULTING FROM OPERATIONS: | | | | | | | | | | | | | | | | |
Net investment income (loss) | | $ | 211 | | | $ | 8 | | | $ | 219 | | | | | |
Net realized gain (loss) | | | 19,897 | | | | 171 | | | | 20,068 | | | | | |
| | | | | | | | | | | | | | | | |
Change in net assets resulting from operations | | | 2,351 | | | | 179 | | | | 2,530 | | | | | |
| | | | | | | | | | | | | | | | |
| | | | |
CAPITAL TRANSACTIONS: | | | | | | | | | | | | | | | | |
Change in net assets resulting from capital transactions | | | (100,941 | ) | | | (5 | ) | | | (100,946 | ) | | | | |
| | | | |
NET ASSETS: | | | | | | | | | | | | | | | | |
Change in net assets | | | (112,409 | ) | | | 174 | | | | (112,235 | ) | | | | |
Beginning of period | | | 185,205 | | | | 494 | | | | 185,699 | | | | | |
| | | | | | | | | | | | | | | | |
End of Period | | | 72,796 | | | | 668 | | | | 73,464 | | | | | |
| | | | | | | | | | | | | | | | |
Future share reacquisition adjustment | | | — | | | | 2 | | | | 2 | | | | | |
| | | | | | | | | | | | | | | | |
End of period after future share reacquisition adjustment | | $ | — | | | $ | 73,466 | | | $ | 73,466 | | | | | |
| | | | | | | | | | | | | | | | |
| | | | |
CAPITAL TRANSACTIONS | | | | | | | | | | | | | | | | |
Class I | | | | | | | | | | | | | | | | |
Cost of shares redeemed | | | (10,550 | ) | | | (3 | ) | | | (10,553 | ) | | | | |
| | | | | | | | | | | | | | | | |
Change in net assets resulting from Class I capital transactions | | | 229 | | | | (3 | ) | | | 226 | | | | | |
| | | | | | | | | | | | | | | | |
| | | | |
Class L | | | | | | | | | | | | | | | | |
Cost of shares redeemed | | | (111,434 | ) | | | (2 | ) | | | (111,436 | ) | | | | |
| | | | | | | | | | | | | | | | |
Change in net assets resulting from Class L capital transactions | | | (101,056 | ) | | | (2 | ) | | | (101,058 | ) | | | | |
| | | | | | | | | | | | | | | | |
Total change in net assets resulting from capital transactions | | $ | (100,941 | ) | | $ | (5 | ) | | $ | (100,946 | ) | | | | |
| | | | | | | | | | | | | | | | |
As of July 25, 2024, the Fund has received the full balance reflected as a receivable on the Statement of Assets and Liabilities for class action payments and related interest.
As of October 15, 2024, the Advisor reimbursed the Fund $2,848 in cash towards the settlement of the future share reacquisition adjustment and due to shareholders upon reprocessing payable, net.
| | | | | | | | | | |
| | | | | |
| 86 | | | | | | | | J.P. MORGAN SPECIALTY FUNDS | | |
THIS PAGE IS INTENTIONALLY LEFT BLANK
| | | | | | | | | | |
| | | | | |
| | J.P. MORGAN SPECIALTY FUNDS | | | | | | | | 87 |
FINANCIAL HIGHLIGHTS
FOR THE PERIODS INDICATED
| | | | | | | | | | | | | | | | | | | | | | | | |
| | | | | | Per Share operating performance | |
| | | | | | Investment operation | | | Distributions | | | | |
| | | Net Asset
value
beginning
of period * | | | NI
Income/
(loss) (b) | | | Net
realized/
unrealized
g/l | | | Total from
Investment
operations | | | Net realized gain | | | Future Share
Reacquisition
adjustment | |
Class A (As Previously Reported) | | | | | | | | | | | | | | | | | | | | | | | | |
Six Months Ended April 30, 2023 (Unaudited) | | | 12.08 | | | | 0.14 | | | | 0.52 | | | | 0.66 | | | | — | | | | — | |
Six Months Ended April 30, 2022 (Unaudited) | | | 12.41 | | | | (0.12 | ) | | | (0.22 | ) | | | (0.34 | ) | | | — | | | | — | |
Six Months Ended April 30, 2021 (Unaudited) | | | 13.01 | | | | (0.11 | ) | | | 0.30 | | | | 0.19 | | | | (0.91 | ) | | | — | |
Six Months Ended April 30, 2020 (Unaudited) | | | 13.11 | | | | (0.08 | ) | | | 1.10 | | | | 1.02 | | | | (1.48 | ) | | | — | |
Six Months Ended April 30, 2019 (Unaudited) | | | 14.29 | | | | — | | | | 0.17 | | | | 0.17 | | | | (1.45 | ) | | | — | |
| | | | | | |
Adjustment | | | | | | | | | | | | | | | | | | | | | | | | |
Six Months Ended April 30, 2023 (Unaudited) | | | 0.22 | | | | — | | | | (0.05 | ) | | | (0.05 | ) | | | — | | | | 0.05 | |
Six Months Ended April 30, 2022 (Unaudited) | | | 0.22 | | | | — | | | | (0.06 | ) | | | (0.06 | ) | | | — | | | | 0.06 | |
Six Months Ended April 30, 2021 (Unaudited) | | | 0.22 | | | | — | | | | (0.06 | ) | | | (0.06 | ) | | | — | | | | 0.05 | |
Six Months Ended April 30, 2020 (Unaudited) | | | 0.02 | | | | — | | | | 0.18 | | | | 0.18 | | | | — | | | | 0.01 | |
Six Months Ended April 30, 2019 (Unaudited) | | | 0.03 | | | | — | | | | 0.09 | | | | 0.09 | | | | — | | | | — | |
| | | | | | |
Class A (As Restated) | | | | | | | | | | | | | | | | | | | | | | | | |
Six Months Ended April 30, 2023 (Unaudited) | | | 12.30 | | | | 0.14 | | | | 0.47 | | | | 0.61 | | | | — | | | | 0.05 | |
Six Months Ended April 30, 2022 (Unaudited) | | | 12.63 | | | | (0.12 | ) | | | (0.28 | ) | | | (0.40 | ) | | | — | | | | 0.06 | |
Six Months Ended April 30, 2021 (Unaudited) | | | 13.23 | | | | (0.11 | ) | | | 0.24 | | | | 0.13 | | | | (0.91 | ) | | | 0.05 | |
Six Months Ended April 30, 2020 (Unaudited) | | | 13.13 | | | | (0.08 | ) | | | 1.28 | | | | 1.20 | | | | (1.48 | ) | | | 0.01 | |
Six Months Ended April 30, 2019 (Unaudited) | | | 14.32 | | | | — | (i) | | | 0.26 | | | | 0.26 | | | | (1.45 | ) | | | — | |
| * | Net asset value per share has been calculated after future share reacquisition adjustment for the impacted periods |
| ** | Amount presented after future share reacquisition adjustment |
| (a) | Annualized for periods less than one year, unless otherwise noted. |
| (b) | Calculated based upon average shares outstanding |
| (c) | Includes adjustments in accordance with accounting principles generally accepted in the United States of America and as such, the net asset values for financial reporting purposes and the returns based upon those net asset values may differ from the net asset values and returns for shareholder transactions. |
| (d) | Not annualized for periods less than one year. |
| (e) | Includes interest expense, if applicable, each of which is less than 0.005% unless otherwise noted. |
| (f) | Interest expense on securities sold short is 0.09%. |
| (g) | Certain non-recurring expenses incurred by the Fund were not annualized for the period indicated. |
| (h) | Interest expense on securities sold short is 0.16%. |
| (i) | Amounts rounds to less than $0.005. |
SEE NOTES TO FINANCIAL STATEMENTS.
| | | | | | | | | | |
| | | | | |
| 88 | | | | | | | | J.P. MORGAN SPECIALTY FUNDS | | |
| | | | | | | | | | | | | | | | | | | | | | | | | | | | | | |
| | | | | | | Ratios to average net assets (a) | |
| | | | | |
| | | | | | | | | | | | | | | | | |
Net Asset
value end
of period* | | | total return
(excludes
sales charge) (c) (d) | | | net assets
end of
period
(000’s) ** | | | Net expenses
(including dividend
expense for
securities sold
short) (e) | | | Net expenses
(excluding
dividend
expense for
securities sold
short) | | | Expenses without
waivers and reimb
(Net expenses
(including dividend
expense for securities
sold short) | | |
Expenses without
waivers and reimb
(Net expenses
(excluding dividend
expense for
securities sold
short) | | | NII | |
| | | | | | | | | | | | | | | | | | | | | | | | | | | | | | |
| | 12.74 | | | | 5.46 | % | | | 22,288 | | | | 2.85 | % | | | 0.89 | % | | | 3.04 | % | | | 1.08 | % | | | 2.24 | % |
| | 12.07 | | | | (2.74 | ) | | | 19,566 | | | | 3.01 | (f) (g) | | | 0.93 | (g) | | | 3.22 | | | | 1.14 | | | | (1.89 | )(g) |
| | 12.29 | | | | 1.73 | | | | 13,709 | | | | 3.04 | (h) | | | 0.94 | | | | 3.23 | | | | 1.13 | | | | (1.76 | ) |
| | 12.65 | | | | 8.85 | | | | 15,849 | | | | 3.59 | | | | 1.22 | | | | 3.95 | | | | 1.58 | | | | (1.32 | ) |
| | 13.01 | | | | 1.21 | | | | 14,397 | | | | 3.66 | | | | 1.23 | | | | 3.99 | | | | 1.56 | | | | (0.07 | ) |
| | | | | | | |
| | | | | | | | | | | | | | | | | | | | | | | | | | | | | | |
| | 0.22 | | | | (0.09 | ) | | | 389 | | | | (0.03 | ) | | | 0.00 | | | | (0.04 | ) | | | (0.01 | ) | | | (0.02 | ) |
| | 0.22 | | | | 0.05 | | | | 354 | | | | (0.03 | ) | | | 0.07 | | | | (0.04 | ) | | | 0.07 | | | | 0.03 | |
| | 0.21 | | | | (0.12 | ) | | | 241 | | | | (0.07 | ) | | | 0.14 | | | | (0.06 | ) | | | 0.14 | | | | 0.07 | |
| | 0.21 | | | | 0.38 | | | | 268 | | | | 0.02 | | | | (0.02 | ) | | | 0.02 | | | | (0.01 | ) | | | (0.01 | ) |
| | 0.12 | | | | 0.68 | | | | 137 | | | | (0.05 | ) | | | (0.01 | ) | | | (0.05 | ) | | | (0.01 | ) | | | 0.04 | |
| | | | | | | |
| | | | | | | | | | | | | | | | | | | | | | | | | | | | | | |
| | 12.96 | | | | 5.37 | | | | 22,677 | | | | 2.82 | | | | 0.89 | | | | 3.00 | | | | 1.07 | | | | 2.22 | |
| | 12.29 | | | | (2.69 | ) | | | 19,920 | | | | 2.98 | (f) (g) | | | 1.00 | (g) | | | 3.18 | | | | 1.21 | | | | (1.86 | )(g) |
| | 12.50 | | | | 1.61 | | | | 13,950 | | | | 2.97 | (h) | | | 1.08 | | | | 3.17 | | | | 1.27 | | | | (1.69 | ) |
| | 12.86 | | | | 9.23 | | | | 16,117 | | | | 3.61 | | | | 1.20 | | | | 3.97 | | | | 1.57 | | | | (1.33 | ) |
| | 13.13 | | | | 1.89 | | | | 14,534 | | | | 3.61 | | | | 1.22 | | | | 3.94 | | | | 1.55 | | | | (0.03 | ) |
SEE NOTES TO FINANCIAL STATEMENTS.
| | | | | | | | | | |
| | | | | |
| | J.P. MORGAN SPECIALTY FUNDS | | | | | | | | 89 |
FINANCIAL HIGHLIGHTS
FOR THE PERIODS INDICATED (continued)
| | | | | | | | | | | | | | | | | | | | | | | | |
| | | | | | Per Share operating performance | |
| | | | | | Investment operation | | | Distributions | | | | |
| | | Net Asset
value
beginning
of period * | | | NI
Income/
(loss) (b) | | |
Net
realized/
unrealized
g/l | | | Total from
Investment
operations | | | Net realized gain | | | Future Share
Reacquisition
adjustment | |
Class C (As Previously Reported) | | | | | | | | | | | | | | | | | | | | | | | | |
Six Months Ended April 30, 2023 (Unaudited) | | | 10.74 | | | | 0.10 | | | | 0.45 | | | | 0.55 | | | | — | | | | — | |
Six Months Ended April 30, 2022 (Unaudited) | | | 11.09 | | | | (0.13 | ) | | | (0.20 | ) | | | (0.33 | ) | | | — | | | | — | |
Six Months Ended April 30, 2021 (Unaudited) | | | 11.77 | | | | (0.12 | ) | | | 0.26 | | | | 0.14 | | | | (0.91 | ) | | | — | |
Six Months Ended April 30, 2020 (Unaudited) | | | 12.06 | | | | (0.10 | ) | | | 1.00 | | | | 0.90 | | | | (1.48 | ) | | | — | |
Six Months Ended April 30, 2019 (Unaudited) | | | 13.32 | | | | (0.04 | ) | | | 0.17 | | | | 0.13 | | | | (1.45 | ) | | | — | |
| | | | | | |
Adjustment | | | | | | | | | | | | | | | | | | | | | | | | |
Six Months Ended April 30, 2023 (Unaudited) | | | 0.20 | | | | — | | | | (0.03 | ) | | | (0.03 | ) | | | — | | | | 0.04 | |
Six Months Ended April 30, 2022 (Unaudited) | | | 0.20 | | | | — | | | | (0.02 | ) | | | (0.02 | ) | | | — | | | | 0.02 | |
Six Months Ended April 30, 2021 (Unaudited) | | | 0.20 | | | | — | | | | (0.05 | ) | | | (0.05 | ) | | | — | | | | 0.05 | |
Six Months Ended April 30, 2020 (Unaudited) | | | 0.14 | | | | — | | | | 0.03 | | | | 0.03 | | | | — | | | | 0.02 | |
Six Months Ended April 30, 2019 (Unaudited) | | | 0.03 | | | | — | | | | 0.08 | | | | 0.08 | | | | — | | | | — | |
| | | | | | |
Class C (As Restated) | | | | | | | | | | | | | | | | | | | | | | | | |
Six Months Ended April 30, 2023 (Unaudited) | | | 10.94 | | | | 0.10 | | | | 0.42 | | | | 0.52 | | | | — | | | | 0.04 | |
Six Months Ended April 30, 2022 (Unaudited) | | | 11.29 | | | | (0.13 | ) | | | (0.22 | ) | | | (0.35 | ) | | | — | | | | 0.02 | |
Six Months Ended April 30, 2021 (Unaudited) | | | 11.97 | | | | (0.12 | ) | | | 0.21 | | | | 0.09 | | | | (0.91 | ) | | | 0.05 | |
Six Months Ended April 30, 2020 (Unaudited) | | | 12.20 | | | | (0.10 | ) | | | 1.03 | | | | 0.93 | | | | (1.48 | ) | | | 0.02 | |
Six Months Ended April 30, 2019 (Unaudited) | | | 13.35 | | | | (0.04 | ) | | | 0.25 | | | | 0.21 | | | | (1.45 | ) | | | — | |
| * | Net asset value per share has been calculated after future share reacquisition adjustment for the impacted periods |
| ** | Amount presented after future share reacquisition adjustment |
| (a) | Annualized for periods less than one year, unless otherwise noted. |
| (b) | Calculated based upon average shares outstanding |
| (c) | Includes adjustments in accordance with accounting principles generally accepted in the United States of America and as such, the net asset values for financial reporting purposes and the returns based upon those net asset values may differ from the net asset values and returns for shareholder transactions. |
| (d) | Not annualized for periods less than one year. |
| (e) | Includes interest expense, if applicable, each of which is less than 0.005% unless otherwise noted. |
| (f) | Interest expense on securities sold short is 0.09%. |
| (g) | Certain non-recurring expenses incurred by the Fund were not annualized for the period indicated. |
| (h) | Interest expense on securities sold short is 0.16%. |
SEE NOTES TO FINANCIAL STATEMENTS.
| | | | | | | | | | |
| | | | | |
| 90 | | | | | | | | J.P. MORGAN SPECIALTY FUNDS | | |
| | | | | | | | | | | | | | | | | | | | | | | | | | | | | | |
| | | | | | | Ratios to average net assets (a) | |
| | | | | |
| | | | | | | | | | | | | | | | | |
Net Asset
value end
of period* | | | total return
(excludes
sales charge) (c) (d) | | | net assets
end of
period
(000’s) ** | | | Net expenses
(including dividend
expense for
securities sold
short) (e) | | | Net expenses
(excluding
dividend
expense for
securities sold
short) | | | Expenses without
waivers and reimb
(Net expenses
(including dividend
expense for securities
sold short) | | | Expenses without
waivers and reimb
(Net expenses
(excluding dividend
expense for
securities sold
short) | | | NII | |
| | | | | | | | | | | | | | | | | | | | | | | | | | | | | | |
| | 11.29 | | | | 5.12 | % | | | 1,702 | | | | 3.36 | % | | | 1.40 | % | | | 3.54 | % | | | 1.58 | % | | | 1.75 | % |
| | 10.76 | | | | (2.98 | ) | | | 1,128 | | | | 3.55 | (f) (g) | | | 1.44 | (g) | | | 3.76 | | | | 1.65 | | | | (2.42 | )(g) |
| | 11.00 | | | | 1.46 | | | | 1,559 | | | | 3.54 | (h) | | | 1.44 | | | | 3.73 | | | | 1.63 | | | | (2.25 | ) |
| | 11.48 | | | | 8.60 | | | | 2,703 | | | | 4.09 | | | | 1.72 | | | | 4.44 | | | | 2.07 | | | | (1.70 | ) |
| | 12.00 | | | | 1.00 | | | | 4,825 | | | | 4.15 | | | | 1.72 | | | | 4.46 | | | | 2.03 | | | | (0.55 | ) |
| | | | | | | |
| | | | | | | | | | | | | | | | | | | | | | | | | | | | | | |
| | 0.21 | | | | 0.00 | | | | 32 | | | | (0.06 | ) | | | (0.03 | ) | | | (0.07 | ) | | | (0.03 | ) | | | 0.07 | |
| | 0.20 | | | | 0.06 | | | | 21 | | | | (0.07 | ) | | | 0.06 | | | | (0.07 | ) | | | 0.06 | | | | 0.09 | |
| | 0.20 | | | | (0.03 | ) | | | 28 | | | | (0.08 | ) | | | 0.12 | | | | (0.06 | ) | | | 0.12 | | | | 0.07 | |
| | 0.19 | | | | 0.34 | | | | 46 | | | | 0.02 | | | | (0.02 | ) | | | 0.02 | | | | (0.03 | ) | | | (0.03 | ) |
| | 0.11 | | | | 0.65 | | | | 2 | | | | (0.02 | ) | | | 0.00 | | | | (0.03 | ) | | | (0.01 | ) | | | 0.01 | |
| | | | | | | |
| | | | | | | | | | | | | | | | | | | | | | | | | | | | | | |
| | 11.50 | | | | 5.12 | | | | 1,734 | | | | 3.30 | | | | 1.37 | | | | 3.47 | | | | 1.55 | | | | 1.82 | |
| | 10.96 | | | | (2.92 | ) | | | 1,149 | | | | 3.48 | (f) (g) | | | 1.50 | (g) | | | 3.69 | | | | 1.71 | | | | (2.33 | )(g) |
| | 11.20 | | | | 1.43 | | | | 1,587 | | | | 3.46 | (h) | | | 1.56 | | | | 3.67 | | | | 1.75 | | | | (2.18 | ) |
| | 11.67 | | | | 8.94 | | | | 2,749 | | | | 4.11 | | | | 1.70 | | | | 4.46 | | | | 2.04 | | | | (1.73 | ) |
| | 12.11 | | | | 1.65 | | | | 4,827 | | | | 4.13 | | | | 1.72 | | | | 4.43 | | | | 2.02 | | | | (0.54 | ) |
SEE NOTES TO FINANCIAL STATEMENTS.
| | | | | | | | | | |
| | | | | |
| | J.P. MORGAN SPECIALTY FUNDS | | | | | | | | 91 |
FINANCIAL HIGHLIGHTS
FOR THE PERIODS INDICATED (continued)
| | | | | | | | | | | | | | | | | | | | | | | | |
| | | | | | Per Share operating performance | |
| | | | | | Investment operation | | | Distributions | | | | |
| | | Net Asset
value
beginning
of period * | | | NI
Income/
(loss) (b) | | |
Net
realized/
unrealized
g/l | | | Total from
Investment
operations | | | Net realized gain | | | Future Share
Reacquisition
adjustment | |
Class I (As Previously Reported) | | | | | | | | | | | | | | | | | | | | | | | | |
Six Months Ended April 30, 2023 (Unaudited) | | | 12.96 | | | | 0.16 | | | | 0.56 | | | | 0.72 | | | | — | | | | — | |
Six Months Ended April 30, 2022 (Unaudited) | | | 13.28 | | | | (0.11 | ) | | | (0.24 | ) | | | (0.35 | ) | | | — | | | | — | |
Six Months Ended April 30, 2021 (Unaudited) | | | 13.82 | | | | (0.10 | ) | | | 0.32 | | | | 0.22 | | | | (0.91 | ) | | | — | |
Six Months Ended April 30, 2020 (Unaudited) | | | 13.80 | | | | (0.08 | ) | | | 1.18 | | | | 1.10 | | | | (1.48 | ) | | | — | |
Six Months Ended April 30, 2019 (Unaudited) | | | 14.93 | | | | 0.02 | | | | 0.18 | | | | 0.20 | | | | (1.45 | ) | | | — | |
| | | | | | |
Adjustment | | | | | | | | | | | | | | | | | | | | | | | | |
Six Months Ended April 30, 2023 (Unaudited) | | | 0.23 | | | | — | | | | (0.08 | ) | | | (0.08 | ) | | | — | | | | 0.08 | |
Six Months Ended April 30, 2022 (Unaudited) | | | 0.23 | | | | — | | | | (0.16 | ) | | | (0.16 | ) | | | — | | | | 0.16 | |
Six Months Ended April 30, 2021 (Unaudited) | | | 0.21 | | | | — | | | | (0.07 | ) | | | (0.07 | ) | | | — | | | | 0.09 | |
Six Months Ended April 30, 2020 (Unaudited) | | | 0.16 | | | | — | | | | 0.04 | | | | 0.04 | | | | — | | | | 0.02 | |
Six Months Ended April 30, 2019 (Unaudited) | | | 0.03 | | | | — | | | | 0.10 | | | | 0.10 | | | | — | | | | — | |
| | | | | | |
Class I (As Restated) | | | | | | | | | | | | | | | | | | | | | | | | |
Six Months Ended April 30, 2023 (Unaudited) | | | 13.19 | | | | 0.16 | | | | 0.48 | | | | 0.64 | | | | — | | | | 0.08 | |
Six Months Ended April 30, 2022 (Unaudited) | | | 13.51 | | | | (0.11 | ) | | | (0.40 | ) | | | (0.51 | ) | | | — | | | | 0.16 | |
Six Months Ended April 30, 2021 (Unaudited) | | | 14.03 | | | | (0.10 | ) | | | 0.25 | | | | 0.15 | | | | (0.91 | ) | | | 0.09 | |
Six Months Ended April 30, 2020 (Unaudited) | | | 13.96 | | | | (0.08 | ) | | | 1.22 | | | | 1.14 | | | | (1.48 | ) | | | 0.02 | |
Six Months Ended April 30, 2019 (Unaudited) | | | 14.96 | | | | 0.02 | | | | 0.28 | | | | 0.30 | | | | (1.45 | ) | | | — | |
| * | Net asset value per share has been calculated after future share reacquisition adjustment for the impacted periods |
| ** | Amount presented after future share reacquisition adjustment |
| (a) | Annualized for periods less than one year, unless otherwise noted. |
| (b) | Calculated based upon average shares outstanding |
| (c) | Includes adjustments in accordance with accounting principles generally accepted in the United States of America and as such, the net asset values for financial reporting purposes and the returns based upon those net asset values may differ from the net asset values and returns for shareholder transactions. |
| (d) | Not annualized for periods less than one year. |
| (e) | Includes interest expense, if applicable, each of which is less than 0.005% unless otherwise noted. |
| (f) | Interest expense on securities sold short is 0.09%. |
| (g) | Certain non-recurring expenses incurred by the Fund were not annualized for the period indicated. |
| (h) | Interest expense on securities sold short is 0.16%. |
SEE NOTES TO FINANCIAL STATEMENTS.
| | | | | | | | | | |
| | | | | |
| 92 | | | | | | | | J.P. MORGAN SPECIALTY FUNDS | | |
| | | | | | | | | | | | | | | | | | | | | | | | | | | | | | |
| | | | | | | Ratios to average net assets (a) | |
| | | | | |
| | | | | | | | | | | | | | | | | |
Net Asset
value end
of period* | | | total return
(excludes
sales charge) (c) (d) | | | net assets
end of
period
(000’s) ** | | | Net expenses
(including dividend
expense for
securities sold
short) (e) | | | Net expenses
(excluding
dividend
expense for
securities sold
short) | | | Expenses without
waivers and reimb
(Net expenses
(including dividend
expense for securities
sold short) | | | Expenses without
waivers and reimb
(Net expenses
(excluding dividend
expense for
securities sold
short) | | | NII | |
| | | | | | | | | | | | | | | | | | | | | | | | | | | | | | |
| | 13.68 | | | | 5.56 | % | | | 139,603 | | | | 2.57 | % | | | 0.64 | % | | | 2.76 | % | | | 0.83 | % | | | 2.47 | % |
| | 12.93 | | | | (2.64 | ) | | | 103,653 | | | | 2.75 | (f) (g) | | | 0.67 | (g) | | | 2.95 | | | | 0.87 | | | | (1.63 | )(g) |
| | 13.13 | | | | 1.85 | | | | 79,055 | | | | 2.78 | (h) | | | 0.68 | | | | 2.96 | | | | 0.86 | | | | (1.48 | ) |
| | 13.42 | | | | 8.99 | | | | 43,590 | | | | 3.33 | | | | 0.96 | | | | 3.65 | | | | 1.28 | | | | (1.23 | ) |
| | 13.68 | | | | 1.36 | | | | 32,353 | | | | 3.39 | | | | 0.96 | | | | 3.69 | | | | 1.26 | | | | 0.20 | |
| | | | | | | |
| | | | | | | | | | | | | | | | | | | | | | | | | | | | | | |
| | 0.23 | | | | (0.10 | ) | | | 3,429 | | | | (0.04 | ) | | | (0.01 | ) | | | (0.05 | ) | | | (0.02 | ) | | | (0.05 | ) |
| | 0.23 | | | | 0.05 | | | | 1,865 | | | | (0.05 | ) | | | 0.07 | | | | (0.05 | ) | | | 0.08 | | | | 0.04 | |
| | 0.23 | | | | (0.04 | ) | | | 1,385 | | | | (0.05 | ) | | | 0.14 | | | | (0.05 | ) | | | 0.14 | | | | 0.04 | |
| | 0.22 | | | | 0.36 | | | | 727 | | | | (0.10 | ) | | | (0.01 | ) | | | (0.11 | ) | | | (0.02 | ) | | | 0.10 | |
| | 0.13 | | | | 0.73 | | | | 306 | | | | (0.06 | ) | | | 0.00 | | | | (0.06 | ) | | | 0.00 | | | | 0.04 | |
| | | | | | | |
| | | | | | | | | | | | | | | | | | | | | | | | | | | | | | |
| | 13.91 | | | | 5.46 | | | | 143,032 | | | | 2.53 | | | | 0.63 | | | | 2.71 | | | | 0.81 | | | | 2.42 | |
| | 13.16 | | | | (2.59 | ) | | | 105,518 | | | | 2.70 | (f) (g) | | | 0.74 | (g) | | | 2.90 | | | | 0.95 | | | | (1.59 | )(g) |
| | 13.36 | | | | 1.81 | | | | 80,440 | | | | 2.73 | (h) | | | 0.82 | | | | 2.91 | | | | 1.00 | | | | (1.44 | ) |
| | 13.64 | | | | 9.35 | | | | 44,317 | | | | 3.23 | | | | 0.95 | | | | 3.54 | | | | 1.26 | | | | (1.13 | ) |
| | 13.81 | | | | 2.09 | | | | 32,659 | | | | 3.33 | | | | 0.96 | | | | 3.63 | | | | 1.26 | | | | 0.24 | |
SEE NOTES TO FINANCIAL STATEMENTS.
| | | | | | | | | | |
| | | | | |
| | J.P. MORGAN SPECIALTY FUNDS | | | | | | | | 93 |
FINANCIAL HIGHLIGHTS
FOR THE PERIODS INDICATED (continued)
| | | | | | | | | | | | | | | | | | | | | | | | |
| | | Per Share operating performance | | | | |
| | | | | | Investment operation | | | Distributions | | | | |
| | | Net Asset value beginning of period * | | | NI
Income/
(loss) (b) | | | Net realized/
unrealized g/l | | | Total from Investment operations | | | Net realized gain | | | Future Share Reacquisition adjustment | |
Class L (As Previously Reported) | | | | | | | | | | | | | | | | | | | | | | | | |
Six Months Ended April 30, 2020 (Unaudited) | | | 14.13 | | | | (0.07 | ) | | | 1.21 | | | | 1.14 | | | | (1.48 | ) | | | - | |
Six Months Ended April 30, 2019 (Unaudited) | | | 15.24 | | | | 0.03 | | | | 0.18 | | | | 0.21 | | | | (1.45 | ) | | | - | |
| | | | | | |
Adjustment | | | | | | | | | | | | | | | | | | | | | | | | |
Six Months Ended April 30, 2020 (Unaudited) | | | 0.15 | | | | - | | | | 0.05 | | | | 0.05 | | | | - | | | | 0.02 | |
Six Months Ended April 30, 2019 (Unaudited) | | | 0.03 | | | | - | | | | 0.09 | | | | 0.09 | | | | - | | | | - | |
| | | | | | |
Class L (As Restated) | | | | | | | | | | | | | | | | | | | | | | | | |
Six Months Ended April 30, 2020 (Unaudited) | | | 14.28 | | | | (0.07 | ) | | | 1.26 | | | | 1.19 | | | | (1.48 | ) | | | 0.02 | |
Six Months Ended April 30, 2019 (Unaudited) | | | 15.27 | | | | 0.03 | | | | 0.27 | | | | 0.30 | | | | (1.45 | ) | | | - | |
| * | Net asset value per share has been calculated after future share reacquisition adjustment for the impacted periods |
| ** | Amount presented after future share reacquisition adjustment |
| (a) | Annualized for periods less than one year, unless otherwise noted. |
| (b) | Calculated based upon average shares outstanding |
| (c) | Includes adjustments in accordance with accounting principles generally accepted in the United States of America and as such, the net asset values for financial reporting purposes and the returns based upon those net asset values may differ from the net asset values and returns for shareholder transactions. |
| (d) | Not annualized for periods less than one year. |
| (e) | Includes interest expense, if applicable, each of which is less than 0.005% unless otherwise noted. |
SEE NOTES TO FINANCIAL STATEMENTS.
| | | | | | | | | | |
| | | | | |
| 94 | | | | | | | | J.P. MORGAN SPECIALTY FUNDS | | |
| | | | | | | | | | | | | | | | | | | | | | | | | | | | | | |
| | | | |
| | | | | | | | | | Ratios to average net assets (a) | |
Net Asset value end of period* | | | total return (excludes sales charge) (c)(d) | | | net assets end of period (000’s) ** | | | Net expenses (including dividend expense for securities sold short) (e) | | | Net expenses (excluding dividend expense for securities sold short) | | | Expenses without waivers and reimb (Net expenses (including dividend expense for securities sold short) | | | Expenses without waivers and reimb (Net expenses (excluding dividend expense for securities sold short) | | | NII | |
| | | | | | | | | | | | | | | | | | | | | | | | | | | | | | |
| | 13.79 | | | | 9.07 | % | | | 19,803 | | | | 3.19 | % | | | 0.82 | % | | | 3.51 | % | | | 1.14 | % | | | (0.94 | )% |
| | 14.00 | | | | 1.40 | | | | 21,221 | | | | 3.26 | | | | 0.83 | | | | 3.54 | | | | 1.11 | | | | 0.36 | |
| | | | | | | |
| | | | | | | | | | | | | | | | | | | | | | | | | | | | | | |
| | 0.22 | | | | 0.43 | | | | 312 | | | | 0.00 | | | | (0.01 | ) | | | 0.00 | | | | (0.01 | ) | | | (0.01 | ) |
| | 0.12 | | | | 0.64 | | | | 181 | | | | 0.00 | | | | (0.01 | ) | | | 0.00 | | | | (0.01 | ) | | | (0.02 | ) |
| | | | | | | |
| | | | | | | | | | | | | | | | | | | | | | | | | | | | | | |
| | 14.01 | | | | 9.50 | | | | 20,115 | | | | 3.19 | | | | 0.81 | | | | 3.51 | | | | 1.13 | | | | (0.95 | ) |
| | 14.12 | | | | 2.04 | | | | 21,402 | | | | 3.26 | | | | 0.82 | | | | 3.54 | | | | 1.10 | | | | 0.34 | |
SEE NOTES TO FINANCIAL STATEMENTS.
| | | | | | | | | | |
| | | | | |
| | J.P. MORGAN SPECIALTY FUNDS | | | | | | | | 95 |
SCHEDULE OF SHAREHOLDER EXPENSES
(Unaudited)
Hypothetical $1,000 Investment
As a shareholder of the Fund, you incur two types of costs: (1) transaction costs, including sales charges (loads) on purchase payments and (2) ongoing costs, including investment advisory fees, administration fees, distribution fees and other Fund expenses. The examples below are intended to help you understand your ongoing costs (in dollars) of investing in the Fund (not including expenses of the Underlying Funds) and to compare these ongoing costs with the ongoing costs of investing in other mutual funds. The examples assume that you had a $1,000 investment in each Class at the beginning of the reporting period, November 1, 2022, and continued to hold your shares at the end of the reporting period, April 30, 2023.
Actual Expenses
For each Class of the Fund in the table below, the first line provides information about actual account values and actual expenses. You may use the information in this line, together with the amount you invested, to estimate the expenses that you paid over the period. Simply divide your account value by $1,000 (for example, an $8,600 account value divided by $1,000 = 8.6), then multiply the result by the number in the first line of each Class under the heading titled “Expenses Paid During the Period” to estimate the expenses you paid on your account during this period.
Hypothetical Example for Comparison Purposes
The second line of each Class in the table below provides information about hypothetical account values and hypothetical expenses based on the Class’ actual expense ratio and an assumed rate of return of 5% per year before expenses, which is not the Class’ actual return. The hypothetical account values and expenses may not be used to estimate the actual ending account balance or expenses you paid for the period. You may use this information to compare the ongoing costs of investing in the Class of the Funds and other funds. To do so, compare this 5% hypothetical example with the 5% hypothetical examples that appear in the shareholder reports of the other funds. Please note that the expenses shown in the table are meant to highlight your ongoing costs only and do not reflect any transaction costs, such as sales charges (loads) or redemption fees, and expenses of the Underlying Funds. Therefore, the second line for each Class in the table is useful in comparing ongoing costs only, and will not help you determine the relative total costs of owning different funds. In addition, if these transaction costs were included, your costs would have been higher. The examples also assume all dividends and distributions have been reinvested.
| | | | | | | | | | | | | | | | |
| | | Beginning
Account Value
November 1, 2022 | | | Ending
Account Value
April 30, 2023 | | | Expenses
Paid During
the Period* | | | Annualized
Expense
Ratio | |
JPMorgan Research Market Neutral Fund | | | | | | | | | | | | | | | | |
Class A | | | | | | | | | | | | | | | | |
Actual | | $ | 1,000.00 | | | $ | 1,053.70 | | | $ | 14.36 | | | | 2.82 | % |
Hypothetical | | | 1,000.00 | | | | 1,010.81 | | | | 14.06 | | | | 2.82 | |
Class C | | | | | | | | | | | | | | | | |
Actual | | | 1,000.00 | | | | 1,051.20 | | | | 16.78 | | | | 3.30 | |
Hypothetical | | | 1,000.00 | | | | 1,008.43 | | | | 16.43 | | | | 3.30 | |
Class I | | | | | | | | | | | | | | | | |
Actual | | | 1,000.00 | | | | 1,054.60 | | | | 12.89 | | | | 2.53 | |
Hypothetical | | | 1,000.00 | | | | 1,012.25 | | | | 12.62 | | | | 2.53 | |
| * | Expenses are equal to each Class’ respective annualized expense ratio, multiplied by the average account value over the period, multiplied by 181/365 (to reflect the one-half year period). |
| | | | | | | | | | |
| | | | | |
| 96 | | | | | | | | J.P. MORGAN SPECIALTY FUNDS | | |
SCHEDULE OF SHAREHOLDER EXPENSES
(Unaudited)
Hypothetical $1,000 Investment
As a shareholder of the Fund, you incur two types of costs: (1) transaction costs, including sales charges (loads) on purchase payments and (2) ongoing costs, including investment advisory fees, administration fees, distribution fees and other Fund expenses. The examples below are intended to help you understand your ongoing costs (in dollars) of investing in the Fund (not including expenses of the Underlying Funds and ETFs) and to compare these ongoing costs with the ongoing costs of investing in other mutual funds. The examples assume that you had a $1,000 investment in each Class at the beginning of the reporting period, November 1, 2021, and continued to hold your shares at the end of the reporting period, April 30, 2022.
Actual Expenses
For each Class of the Fund in the table below, the first line provides information about actual account values and actual expenses. You may use the information in this line, together with the amount you invested, to estimate the expenses that you paid over the period. Simply divide your account value by $1,000 (for example, an $8,600 account value divided by $1,000 = 8.6), then multiply the result by the number in the first line of each Class under the heading titled “Expenses Paid During the Period” to estimate the expenses you paid on your account during this period.
Hypothetical Example for Comparison Purposes
The second line of each Class in the table below provides information about hypothetical account values and hypothetical expenses based on the Class’ actual expense ratio and an assumed rate of return of 5% per year before expenses, which is not the Class’ actual return. The hypothetical account values and expenses may not be used to estimate the actual ending account balance or expenses you paid for the period. You may use this information to compare the ongoing costs of investing in the Class of the Funds and other funds. To do so, compare this 5% hypothetical example with the 5% hypothetical examples that appear in the shareholder reports of the other funds. Please note that the expenses shown in the table are meant to highlight your ongoing costs only and do not reflect any transaction costs, such as sales charges (loads), or redemption fees, and expenses of the Underlying Funds and ETFs. Therefore, the second line for each Class in the table is useful in comparing ongoing costs only, and will not help you determine the relative total costs of owning different funds. In addition, if these transaction costs were included, your costs would have been higher. The examples also assume all dividends and distributions have been reinvested.
| | | | | | | | | | | | | | | | |
| | | Beginning
Account Value
November 1, 2021 | | | Ending
Account Value
April 30, 2022 | | | Expenses
Paid During
the Period* | | | Annualized
Expense
Ratio | |
JPMorgan Research Market Neutral Fund | | | | | | | | | | | | | | | | |
Class A | | | | | | | | | | | | | | | | |
Actual | | $ | 1,000.00 | | | $ | 973.10 | | | $ | 14.58 | | | | 2.98 | % |
Hypothetical | | | 1,000.00 | | | | 1,010.02 | | | | 14.85 | | | | 2.98 | |
Class C | | | | | | | | | | | | | | | | |
Actual | | | 1,000.00 | | | | 970.80 | | | | 17.01 | | | | 3.48 | |
Hypothetical | | | 1,000.00 | | | | 1,007.54 | | | | 17.32 | | | | 3.48 | |
Class I | | | | | | | | | | | | | | | | |
Actual | | | 1,000.00 | | | | 974.10 | | | | 13.22 | | | | 2.70 | |
Hypothetical | | | 1,000.00 | | | | 1,011.41 | | | | 13.47 | | | | 2.70 | |
| * | Expenses are equal to each Class’ respective annualized expense ratio, multiplied by the average account value over the period, multiplied by 181/365 (to reflect the one-half year period). |
| | | | | | | | | | |
| | | | | |
| | J.P. MORGAN SPECIALTY FUNDS | | | | | | | | 97 |
SCHEDULE OF SHAREHOLDER EXPENSES
(Unaudited)
Hypothetical $1,000 Investment
As a shareholder of the Fund, you incur two types of costs: (1) transaction costs, including sales charges (loads) on purchase payments and (2) ongoing costs, including investment advisory fees, administration fees, distribution fees and other Fund expenses. The examples below are intended to help you understand your ongoing costs (in dollars) of investing in the Fund and to compare these ongoing costs with the ongoing costs of investing in other mutual funds. The examples assume that you had a $1,000 investment in each Class at the beginning of the reporting period, November 1, 2020, and continued to hold your shares at the end of the reporting period, April 30, 2021.
Actual Expenses
For each Class of the Fund in the table below, the first line provides information about actual account values and actual expenses. You may use the information in this line, together with the amount you invested, to estimate the expenses that you paid over the period. Simply divide your account value by $1,000 (for example, an $8,600 account value divided by $1,000 = 8.6), then multiply the result by the number in the first line of each Class under the heading titled “Expenses Paid During the Period” to estimate the expenses you paid on your account during this period.
Hypothetical Example for Comparison Purposes
The second line of each Class in the table below provides information about hypothetical account values and hypothetical expenses based on the Class’ actual expense ratio and an assumed rate of return of 5% per year before expenses, which is not the Class’ actual return. The hypothetical account values and expenses may not be used to estimate the actual ending account balance or expenses you paid for the period. You may use this information to compare the ongoing costs of investing in the Class of the Fund and other funds. To do so, compare this 5% hypothetical example with the 5% hypothetical examples that appear in the shareholder reports of the other funds. Please note that the expenses shown in the table are meant to highlight your ongoing costs only and do not reflect any transaction costs, such as sales charges (loads) or redemption fees. Therefore, the second line for each Class in the table is useful in comparing ongoing costs only, and will not help you determine the relative total costs of owning different funds. In addition, if these transaction costs were included, your costs would have been higher. The examples also assume all dividends and distributions have been reinvested.
| | | | | | | | | | | | | | | | |
| | | Beginning
Account Value
November 1, 2020 | | | Ending
Account Value
April 30, 2021 | | | Expenses
Paid During
the Period* | | | Annualized
Expense
Ratio | |
| | | | |
JPMorgan Research Market Neutral Fund | | | | | | | | | | | | | | | | |
Class A | | | | | | | | | | | | | | | | |
Actual | | $ | 1,000.00 | | | $ | 1,016.10 | | | $ | 14.85 | | | | 2.97 | % |
Hypothetical | | | 1,000.00 | | | | 1,010.07 | | | | 14.80 | | | | 2.97 | |
Class C | | | | | | | | | | | | | | | | |
Actual | | | 1,000.00 | | | | 1,014.30 | | | | 17.28 | | | | 3.46 | |
Hypothetical | | | 1,000.00 | | | | 1,007.64 | | | | 17.22 | | | | 3.46 | |
Class I | | | | | | | | | | | | | | | | |
Actual | | | 1,000.00 | | | | 1,018.10 | | | | 13.66 | | | | 2.73 | |
Hypothetical | | | 1,000.00 | | | | 1,011.26 | | | | 13.61 | | | | 2.73 | |
| * | Expenses are equal to each Class’ respective annualized expense ratio, multiplied by the average account value over the period, multiplied by 181/365 (to reflect the one-half year period). |
| | | | | | | | | | |
| | | | | |
| 98 | | | | | | | | J.P. MORGAN SPECIALTY FUNDS | | |
SCHEDULE OF SHAREHOLDER EXPENSES
(Unaudited)
Hypothetical $1,000 Investment
As a shareholder of the Fund, you incur two types of costs: (1) transaction costs, including sales charges (loads) on purchase payments and (2) ongoing costs, including investment advisory fees, administration fees, distribution fees and other Fund expenses. The examples below are intended to help you understand your ongoing costs (in dollars) of investing in the Fund and to compare these ongoing costs with the ongoing costs of investing in other mutual funds. The examples assume that you had a $1,000 investment in each Class at the beginning of the reporting period, November 1, 2019, and continued to hold your shares at the end of the reporting period, April 30, 2020.
Actual Expenses
For each Class of the Fund in the table below, the first line provides information about actual account values and actual expenses. You may use the information in this line, together with the amount you invested, to estimate the expenses that you paid over the period. Simply divide your account value by $1,000 (for example, an $8,600 account value divided by $1,000 = 8.6), then multiply the result by the number in the first line of each Class under the heading titled “Expenses Paid During the Period” to estimate the expenses you paid on your account during this period.
Hypothetical Example for Comparison Purposes
The second line of each Class in the table below provides information about hypothetical account values and hypothetical expenses based on the Class’ actual expense ratio and an assumed rate of return of 5% per year before expenses, which is not the Class’ actual return. The hypothetical account values and expenses may not be used to estimate the actual ending account balance or expenses you paid for the period. You may use this information to compare the ongoing costs of investing in the Class of the Fund and other funds. To do so, compare this 5% hypothetical example with the 5% hypothetical examples that appear in the shareholder reports of the other funds. Please note that the expenses shown in the table are meant to highlight your ongoing costs only and do not reflect any transaction costs, such as sales charges (loads) or redemption fees. Therefore, the second line for each Class in the table is useful in comparing ongoing costs only, and will not help you determine the relative total costs of owning different funds. In addition, if these transaction costs were included, your costs would have been higher. The examples also assume all dividends and distributions have been reinvested.
| | | | | | | | | | | | | | | | |
| | | Beginning
Account Value
November 1, 2019 | | | Ending
Account Value
April 30, 2020 | | | Expenses
Paid During
the Period* | | | Annualized
Expense
Ratio | |
| | | | |
JPMorgan Research Market Neutral Fund | | | | | | | | | | | | | | | | |
Class A | | | | | | | | | | | | | | | | |
Actual | | | 1,000.00 | | | | 1,092.30 | | | | 18.78 | | | | 3.61 | |
Hypothetical | | | 1,000.00 | | | | 1,006.91 | | | | 18.01 | | | | 3.61 | |
Class C | | | | | | | | | | | | | | | | |
Actual | | | 1,000.00 | | | | 1,089.40 | | | | 21.40 | | | | 4.12 | |
Hypothetical | | | 1,000.00 | | | | 1,004.38 | | | | 20.53 | | | | 4.12 | |
Class I | | | | | | | | | | | | | | | | |
Actual | | | 1,000.00 | | | | 1,093.50 | | | | 16.81 | | | | 3.23 | |
Hypothetical | | | 1,000.00 | | | | 1,008.80 | | | | 16.13 | | | | 3.23 | |
Class L | | | | | | | | | | | | | | | | |
Actual | | | 1,000.00 | | | | 1,095.00 | | | | 16.62 | | | | 3.19 | |
Hypothetical | | | 1,000.00 | | | | 1,009.00 | | | | 15.93 | | | | 3.19 | |
| * | Expenses are equal to each Class’ respective annualized expense ratio, multiplied by the average account value over the period, multiplied by 182/366 (to reflect the one-half year period). |
| | | | | | | | | | |
| | | | | |
| | J.P. MORGAN SPECIALTY FUNDS | | | | | | | | 99 |
SCHEDULE OF SHAREHOLDER EXPENSES
(Unaudited)
Hypothetical $1,000 Investment
As a shareholder of the Fund, you incur two types of costs: (1) transaction costs, including sales charges (loads) on purchase payments and (2) ongoing costs, including investment advisory fees, administration fees, distribution fees and other Fund expenses. The examples below are intended to help you understand your ongoing costs (in dollars) of investing in the Fund and to compare these ongoing costs with the ongoing costs of investing in other mutual funds. The examples assume that you had a $1,000 investment in each Class at the beginning of the reporting period, November 1, 2018, and continued to hold your shares at the end of the reporting period, April 30, 2019.
Actual Expenses
For each Class of the Fund in the table below, the first line provides information about actual account values and actual expenses. You may use the information in this line, together with the amount you invested, to estimate the expenses that you paid over the period. Simply divide your account value by $1,000 (for example, an $8,600 account value divided by $1,000 = 8.6), then multiply the result by the number in the first line of each Class under the heading entitled “Expenses Paid During the Period” to estimate the expenses you paid on your account during this period.
Hypothetical Example for Comparison Purposes
The second line of each Class in the table below provides information about hypothetical account values and hypothetical expenses based on the Class’ actual expense ratio and an assumed rate of return of 5% per year before expenses, which is not the Class’ actual return. The hypothetical account values and expenses may not be used to estimate the actual ending account balance or expenses you paid for the period. You may use this information to compare the ongoing costs of investing in the Class of the Fund and other funds. To do so, compare this 5% hypothetical example with the 5% hypothetical examples that appear in the shareholder reports of the other funds. Please note that the expenses shown in the table are meant to highlight your ongoing costs only and do not reflect any transaction costs, such as sales charges (loads) or redemption fees. Therefore, the second line for each Class in the table is useful in comparing ongoing costs only, and will not help you determine the relative total costs of owning different funds. In addition, if these transaction costs were included, your costs would have been higher. The examples also assume all dividends and distributions have been reinvested.
| | | | | | | | | | | | | | | | |
| | | Beginning
Account Value
November 1, 2018 | | | Ending
Account Value
April 30, 2019 | | | Expenses
Paid During
the Period* | | | Annualized
Expense
Ratio | |
JPMorgan Research Market Neutral Fund | | | | | | | | | | | | | | | | |
Class A | | | | | | | | | | | | | | | | |
Actual | | $ | 1,000.00 | | | $ | 1,018.90 | | | $ | 18.07 | | | | 3.61 | % |
Hypothetical | | | 1,000.00 | | | | 1,006.89 | | | | 17.96 | | | | 3.61 | |
Class C | | | | | | | | | | | | | | | | |
Actual | | | 1,000.00 | | | | 1,016.50 | | | | 20.65 | | | | 4.13 | |
Hypothetical | | | 1,000.00 | | | | 1,004.31 | | | | 20.52 | | | | 4.13 | |
Class I | | | | | | | | | | | | | | | | |
Actual | | | 1,000.00 | | | | 1,020.90 | | | | 16.69 | | | | 3.33 | |
Hypothetical | | | 1,000.00 | | | | 1,008.28 | | | | 16.58 | | | | 3.33 | |
Class L | | | | | | | | | | | | | | | | |
Actual | | | 1,000.00 | | | | 1,020.40 | | | | 16.33 | | | | 3.26 | |
Hypothetical | | | 1,000.00 | | | | 1,008.63 | | | | 16.24 | | | | 3.26 | |
| * | Expenses are equal to each Class’ respective annualized expense ratio, multiplied by the average account value over the period, multiplied by 181/365 (to reflect the one-half year period). |
| | | | | | | | | | |
| | | | | |
| 100 | | | | | | | | J.P. MORGAN SPECIALTY FUNDS | | |
LIQUIDITY RISK MANAGEMENT PROGRAM
(Unaudited)
The Fund has adopted the J.P. Morgan Funds and J.P. Morgan Exchange-Traded Funds Amended and Restated Liquidity Risk Management Program (the “Program”) under Rule 22e-4 under the Investment Company Act of 1940, as amended (the “Liquidity Rule”). The Program seeks to assess, manage and review each Fund’s Liquidity Risk. “Liquidity Risk” is defined as the risk that a fund could not meet requests to redeem shares issued by the fund without significant dilution of remaining investors’ interests in the fund. Pursuant to an exemptive order (the “Exemptive Order”) from the Securities and Exchange Commission, the Program permits the Funds to use liquidity definitions and classification methodologies that differ from the requirements under the Liquidity Rule in some respects. Among other things, the Liquidity Rule requires that a written report be provided to the Board of Trustees (the “Board”) on an annual basis that addresses the operation of the Program and assesses the adequacy and effectiveness of its implementation, including the operation of any Highly Liquid Investment Minimum (“HLIM”), where applicable, and any material changes to the Program.
The Board has appointed J.P. Morgan Asset Management’s Liquidity Risk Forum to be the program administrator for the Program (the “Program Administrator”). In addition to regular reporting at each of its quarterly meetings, on February 7, 2023, the Board reviewed the Program Administrator’s annual written report (the “Report”) concerning the operation of the Program for the period from January 1, 2022 through December 31, 2022 (the “Program Reporting Period”). The Report addressed the operation of the Program and assessed its adequacy and effectiveness of implementation, including, where applicable, the operation of a Fund’s HLIM. There were no material changes to the Program during the Program Reporting Period.
The Report summarized the operation of the Program and the information and factors considered by the Program Administrator in assessing whether the Program has been adequately and effectively implemented with respect to the Fund. Such information and factors included, among other things: (1) the liquidity risk framework used to assess, manage, and periodically review the Fund’s Liquidity Risk and the results of this assessment; (2) the methodology and inputs for classifying the investments of the Fund into one of the required liquidity categories that reflect an estimate of the liquidity of those investments under current market conditions; (3) whether the Fund invested primarily in “Highly Liquid Investments” (as defined or modified under the Program), as well as whether an HLIM should be established for the Fund (and, for Funds that have adopted an HLIM, whether the HLIM continues to be appropriate or whether the Fund has invested below its HLIM) and the procedures for monitoring for any HLIM; (4) whether the Fund invested more than 15% of its assets in “Illiquid Investments” (as defined or modified under the Program) and the procedures for monitoring for this limit; and (5) specific liquidity events arising during the Program Reporting Period. The Report further summarized the conditions of the Exemptive Order and whether all applicable Funds were in compliance with the terms of the Exemptive Order.
Based on this review, the Report concluded that: (1) the Program continues to be reasonably designed to effectively assess and manage the Fund’s Liquidity Risk; and (2) the Program has been adequately and effectively implemented with respect to the Fund during the Program Reporting Period.
| | | | | | | | | | |
| | | | | |
| | J.P. MORGAN SPECIALTY FUNDS | | | | | | | | 101 |
J.P. Morgan Funds are distributed by JPMorgan Distribution Services, Inc., which is an affiliate of JPMorgan Chase & Co. Affiliates of JPMorgan Chase & Co. receive fees for providing various services to the funds.
Contact JPMorgan Distribution Services, Inc. at 1-800-480-4111 for a fund prospectus. You can also visit us at www.jpmorganfunds.com. Investors should carefully consider the investment objectives and risk as well as charges and expenses of the mutual fund before investing. The prospectus contains this and other information about the mutual fund. Read the prospectus carefully before investing.
Investors may obtain information about the Securities Investor Protection Corporation (SIPC), including the SIPC brochure, by visiting www.sipc.org or by calling SIPC at 202-371-8300.
The Fund files a complete schedule of its fund holdings for the first and third quarters of its fiscal year with the SEC as an exhibit to its report on Form N-PORT. The Fund’s Form N-PORT reports are available on the SEC’s website at http://www.sec.gov. The Fund's quarterly holdings can be found by visiting the J.P. Morgan Funds’ website at www.jpmorganfunds.com.
A description of the Fund's policies and procedures with respect to the disclosure of the Fund's holdings is available in the prospectuses and Statement of Additional Information.
A copy of proxy policies and procedures is available without charge upon request by calling 1-800-480-4111 and on the Fund’s website at www.jpmorganfunds.com. A description of such policies and procedures is on the SEC’s website at www.sec.gov. The Trustees have delegated the authority to vote proxies for securities owned by the Fund to the Adviser. A copy of the Fund’s voting record for the most recent 12-month period ended June 30 is available on the SEC’s website at www.sec.gov or at the Fund’s website at www.jpmorganfunds.com no later than August 31 of each year. The Fund’s proxy voting record will include, among other things, a brief description of the matter voted on for each fund security, and will state how each vote was cast, for example, for or against the proposal.

J.P. Morgan Asset Management is the brand name for the asset management business of JPMorgan Chase & Co. and its affiliates worldwide.
| | | | |
| | © JPMorgan Chase & Co., 2023. All rights reserved. April 2023. | | |
ITEM 2. CODE OF ETHICS.
Not applicable to a semi-annual report.
ITEM 3. AUDIT COMMITTEE FINANCIAL EXPERT.
Not applicable to a semi-annual report.
ITEM 4. PRINCIPAL ACCOUNTANT FEES AND SERVICES.
Not applicable to a semi-annual report.
ITEM 5. AUDIT COMMITTEE OF LISTED REGISTRANTS.
Not applicable to a semi-annual report.
ITEM 6. INVESTMENTS.
File Schedule I – Investments in securities of unaffiliated issuers as of the close of the reporting period as set forth in Section 210.12-12 of Regulation S-X, unless the schedule is included as part of the report to shareholders filed under Item 1 of this Form.
Included in Item 1.
ITEM 7. DISCLOSURE OF PROXY VOTING POLICIES AND PROCEDURES FOR CLOSED-END MANAGEMENT INVESTMENT COMPANIES.
Not applicable.
ITEM 8. PORTFOLIO MANAGERS OF CLOSED-END MANAGEMENT INVESTMENT COMPANIES.
Not applicable.
ITEM 9. PURCHASE OF EQUITY SECURITIES BY CLOSED-END MANAGEMENT INVESTMENT COMPANY AND AFFILIATED PURCHASERS.
Not applicable.
ITEM 10. SUBMISSION OF MATTERS TO A VOTE OF SECURITY HOLDERS.
Describe any material changes to the procedures by which shareholders may recommend nominees to the registrant’s board of directors, where those changes were implemented after the registrant last provided disclosure in response to the requirements of Item 7(d)(2)(ii)(G) of Schedule 14A (17 CFR 240.14a-101), or this Item.
No material changes to report.
ITEM 11. CONTROLS AND PROCEDURES.
(a) Disclose the conclusions of the registrant’s principal executive and principal financial officers, or persons performing similar functions, regarding the effectiveness of the registrant’s disclosure controls and procedures (as defined in Rule 30a-3(c) under the Act (17 CFR 270.30a-3(c))) as of a date within 90 days of the filing date of the report that includes the disclosure required by this paragraph, based on the evaluation of these controls and procedures required by Rule 30a-3(b) under the Act (17 CFR 270.30a-3(b)) and Rules 13a-15(b) or 15d-15(b) under the Exchange Act (17 CFR 240.13a-15(b) or 240.15d-15(b)).
The Registrant’s principal executive and principal financial officers have concluded, based on their evaluation of the Registrant’s disclosure controls and procedures as of a date within 90 days of the original filing date of this report, that the Registrant’s disclosure controls and procedures were reasonably designed to ensure that information required to be disclosed by the Registrant on Form N-CSR is recorded, processed, summarized and reported within the required time periods and that information required to be disclosed by the Registrant in the reports that it files or submits on Form N-CSR is accumulated and communicated to the Registrant’s management, including its principal executive and principal financial officers, as appropriate, to allow timely decisions regarding required disclosure. Subsequent to the period covered by this report, an error was identified regarding the untimely recognition of certain class action proceeds that resulted in a restatement of the financial statements for JPMorgan Research Market Neutral Fund (the “Fund”) to correct the impacts of the error for the six months ended April 30, 2023, April 30, 2022, April 30, 2021, April 30, 2020 and April 30, 2019. Due to the error, a material weakness exists in the design of internal controls relating to the Fund’s monitoring of class action claims filed by the class action administrator (on behalf of the Fund) and reconciliation of class action claim disbursements from the class action administrator to ensure complete, accurate and timely receipt of class action claims by the Fund.
(b) Disclose any change in the registrant’s internal control over financial reporting (as defined in Rule 30a-3(d) under the Act (17 CFR 270.30a-3(d)) that occurred during the period covered by this report that has materially affected, or is reasonably likely to materially affect, the registrant’s internal control over financial reporting.
Subsequent to the identification of the error described above, management has remediated the material weakness described herein. A reconciliation has been implemented to ensure class action claims are monitored by the class action administrator and class action claims are recorded completely, accurately, and timely by the Fund. Other than this item, there were no other changes in the Registrant’s internal control over financial reporting that occurred during period covered by this report that have materially affected, or are reasonably likely to materially affect, the Registrant’s internal control over financial reporting.
ITEM 12. DISCLOSURE OF SECURITIES LENDING ACTIVITIES FOR CLOSED-END MANAGEMENT INVESTMENT COMPANIES.
Not applicable.
ITEM 13. EXHIBITS.
| | (a) | File the exhibits listed below as part of this Form. Letter or number the exhibits in the sequence indicated. |
(1) Any code of ethics, or amendment thereto, that is the subject of the disclosure required by Item 2, to the extent that the registrant intends to satisfy the Item 2 requirements through filing of an exhibit.
Not applicable.
(2) A separate certification for each principal executive officer and principal financial officer of the registrant as required by Rule 30a-2(a) under the Act (17 CFR 270.30a-2), exactly as set forth below:
Certifications pursuant to Rule 30a-2(a) under the Investment Company Act of 1940 are attached hereto.
(1) Any written solicitation to purchase securities under Rule 23c-1 under the Act (17 CFR 270.23c-1) sent or given during the period covered by the report by or on behalf of the registrant to 10 or more persons.
Not applicable.
(2) Change in the registrant’s independent public accountant. Provide the information called for by Item 4 of Form 8-K under the Exchange Act (17 CFR 249.308). Unless otherwise specified by Item 4, or related to and necessary for a complete understanding of information not previously disclosed, the information should relate to events occurring during the reporting period.
Not applicable.
| | (b) | A separate or combined certification for each principal executive officer and principal officer of the registrant as required by Rule 30a-2(b) under the Act of 1940. |
Certifications pursuant to Rule 30a-2(b) under the Investment Company Act of 1940 are attached hereto.
SIGNATURES
Pursuant to the requirements of the Securities Exchange Act of 1934 and the Investment Company Act of 1940, the registrant has duly caused this report to be signed on its behalf by the undersigned, thereunto duly authorized.
JPMorgan Trust I
| | |
| By: | | /s/ Brian S. Shlissel |
| | Brian S. Shlissel |
| | President and Principal Executive Officer |
| | December 26, 2024 |
Pursuant to the requirements of the Securities Exchange Act of 1934 and the Investment Company Act of 1940, this report has been signed below by the following persons on behalf of the registrant and in the capacities and on the dates indicated.
| | |
| By: | | /s/ Brian S. Shlissel |
| | Brian S. Shlissel |
| | President and Principal Executive Officer |
| | December 26, 2024 |
| | |
| By: | | /s/ Timothy J. Clemens |
| | Timothy J. Clemens |
| | Treasurer and Principal Financial Officer |
| | December 26, 2024 |