

Franklin Mutual Recovery Fund
Your Fund’s Goal and Main Investments: Franklin Mutual Recovery Fund’s goal is capital appreciation. The Fund seeks to achieve superior risk-adjusted returns with a moderate correlation to U.S. equity markets by investing in distressed companies, merger arbitrage securities and special situation/undervalued securities. The Fund may take long and short positions, with the latter typically utilized in connection with the merger arbitrage strategy.

This annual report for Franklin Mutual Recovery Fund covers the fiscal year ended March 31, 2011.
Performance Overview
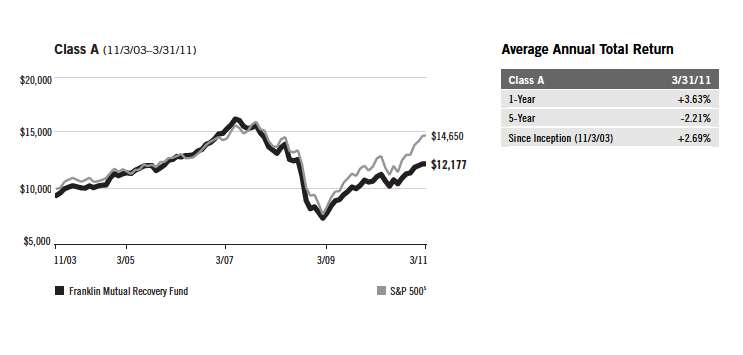
For the 12 months under review, Franklin Mutual Recovery Fund – Class A delivered a +9.95% cumulative total return. The Fund underperformed U.S. stocks as measured by its benchmark, the Standard & Poor’s 500 Index (S&P 500), which produced a +15.65% total return for the same period.1 The Fund outperformed the +4.32% price-only return of the Bloomberg/EFFAS U.S.
1. Source: © 2011 Morningstar. All Rights Reserved. The information contained herein: (1) is proprietary to Morningstar and/or its content providers; (2) may not be copied or distributed; and (3) is not warranted to be accurate, complete or timely. Neither Morningstar nor its content providers are responsible for any damages or losses arising from any use of this information. The S&P 500 includes reinvested dividends. The index is unmanaged. One cannot invest directly in an index, and an index is not representative of the Fund’s portfolio.
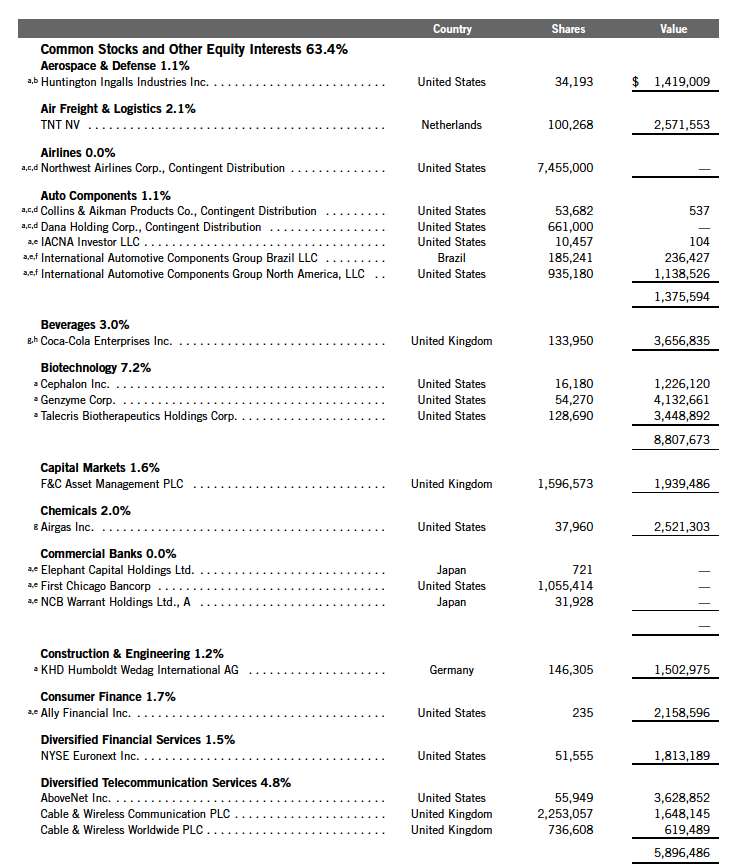
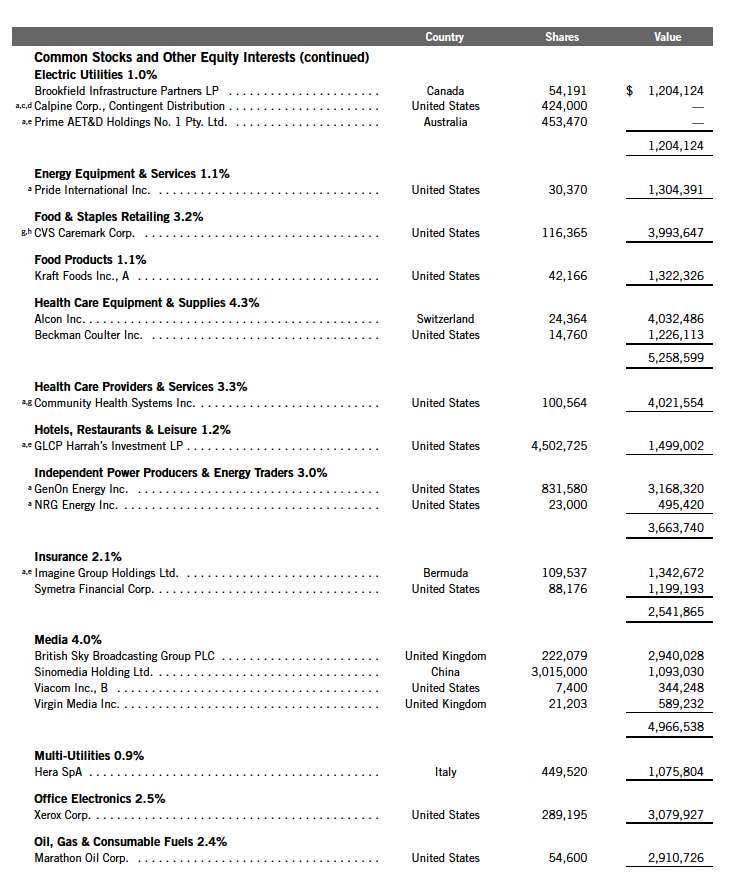
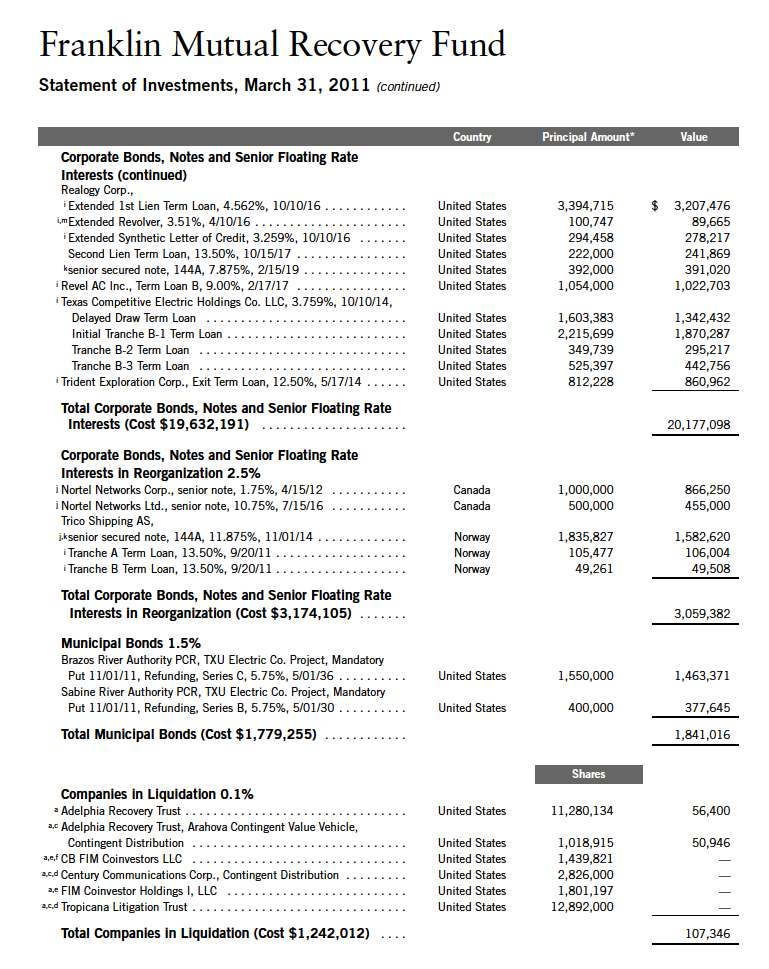
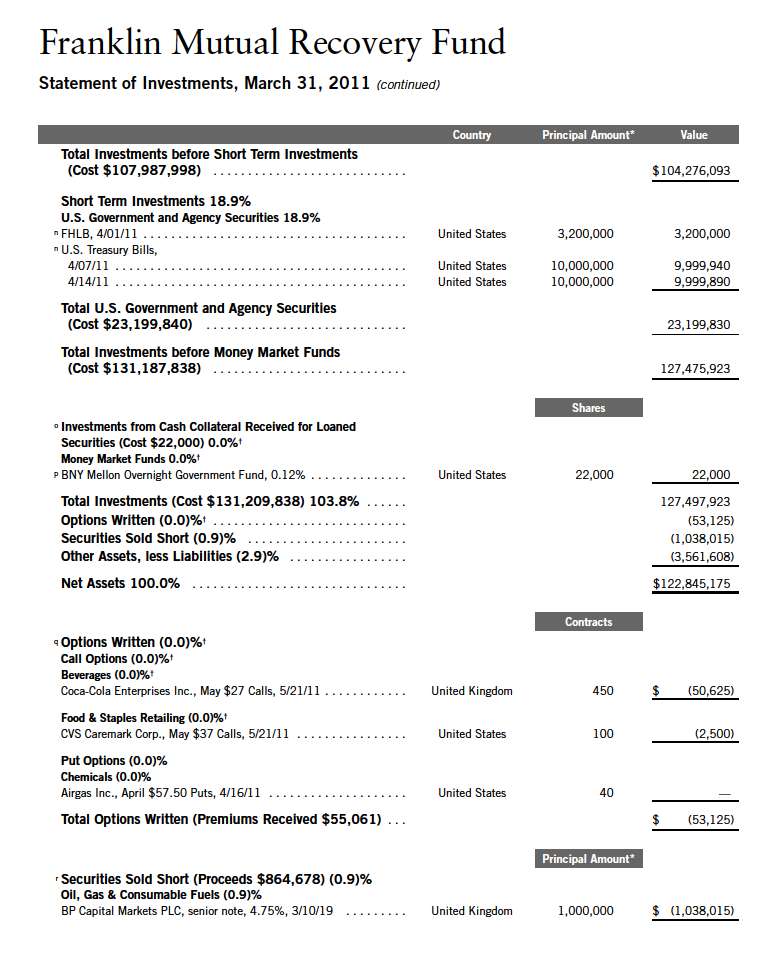
The dollar value, number of shares or principal amount, and names of all portfolio holdings are listed in the Fund’s Statement of Investments (SOI). The SOI begins on page 23.
4 | Annual Report
Government 3-5 Years Total Return Index, which serves as a transparent benchmark for the U.S. government bond market.2 The performance of the Fund relative to the Bloomberg index is used as the basis for calculating the performance adjustment to the base management fee paid to the Fund’s adviser. You can find the Fund’s long-term performance data in the Performance Summary beginning on page 11.
Economic and Market Overview
The U.S. economy expanded during the 12-month reporting period as consumer spending improved. The job market recovered slowly, and the unemployment rate fell from 9.7% in March 2010 to 8.8% in March 2011.3 Remaining challenges to sustained economic recovery included elevated debt concerns and a struggling housing sector.
Early in the fiscal year, economic improvement and benign inflation trends prompted Federal Reserve Board (Fed) policymakers to maintain record-low interest rates and discontinue certain stimulus plans. In June, the Fed offered a more restrained view of the economy largely because of developments in Europe and signs the U.S. economic expansion lacked momentum. In November, to promote a stronger recovery and help maintain inflation levels the Fed believed consistent with its dual mandate to foster maximum employment and price stability, it announced its intention to buy $600 billion of longer term Treasury securities by the end of the second quarter of 2011.
Crude oil prices began the reporting period at $84 per barrel. The falling U.S. dollar, positive economic data and geopolitical instability in North Africa and the Middle East drove oil prices to a 12-month high of $107 at period-end. As oil and food prices rose, the pace of inflation accelerated during the period.
Investor concerns about a slow economic recovery, the potential spillover effects of the European debt crisis, geopolitical instability in North Africa and the Middle East, and the multiple crises triggered by Japan’s earthquake, tsunami and nuclear disaster led to market volatility. At times of uncertainty, wary investors favored short-term Treasuries, and Treasury yields dipped to even lower levels. The two-year Treasury bill yield began the period at 1.02% and ended at 0.80%, while the 10-year Treasury note yield fell from 3.84% to 3.47%.
2. Source: Bloomberg LP. Please see Notes to Financial Statements for more information about the performance-based management fee. The index is unmanaged. One cannot invest directly in an index, and an index is not representative of the Fund’s portfolio.
3. Source: Bureau of Labor Statistics.
Annual Report | 5
During the period, the mergers and acquisitions market continued to recover and accelerate from its recessionary lows, as the global value and volume of announced deals rose throughout 2010. Although both the number and value of announced deals in the first quarter of 2011 fell slightly compared with the fourth quarter of 2010, they still remained much higher than the activity that occurred earlier in 2010. On a month-over-month basis, March 2011 had a sizable increase in the transaction value of deals announced and ultimately had the highest monthly transaction value of the entire 12 months under review. The U.S. posted the largest volume of deals, constituting more than 35% of the world’s total deal value and 26% of the world’s total number of deals.4 Companies based in the U.K. and Canada also announced a significant number of deals. On a sector basis, the greatest number of transactions came from financials and energy. Globally, announced deals from AT&T (for T-Mobile USA), Duke Energy (for Progress Energy) and Deutsche Boerse (for NYSE Euronext) were among the 10 largest in terms of transaction value during the period under review.
Within the distressed debt arena, new investment opportunities remained scarce throughout the fiscal year, as economic activity improved, corporate profits were widely positive, and to the extent that capital was needed, many companies were able to obtain financing by normal means. In this environment, a significant volume of new bonds came to market and were well absorbed by ongoing investor demand, which ultimately assisted companies in refinancing their debt and helped them avoid liquidity concerns. High yield spreads over Treasuries narrowed throughout the reporting period, reaching 5.05 percentage points at the end of March 2011, down from 5.91 percentage points one year earlier, making it easier for companies with the worst credit to obtain inexpensive financing.5 Thus, U.S. corporate default rates continued their significant decline during the year, hitting 2.88% at the end of March, down from 11.0% at the beginning of this reporting period, according to Moody’s Investors Service. Moody’s also stated this rate was well below the 25-year average of 4.8% and the lowest since July 2008. Toward period-end, S&P, a major credit rating agency, announced it expected an ongoing drop in default rates throughout 2011; however, it did warn it expects the rate of decline to slow somewhat as the year progresses.
Investment Strategy
We follow a distinctive investment approach and can seek investments in distressed companies, merger arbitrage and special situations/undervalued stocks.
4. Source: FactSet MergerStat.
5. Source: Credit Suisse. |
6 | Annual Report
The availability of investments at attractive prices in each of these categories varies with market cycles. Therefore, the percentage of the Fund’s assets invested in each of these areas will fluctuate as we attempt to take advantage of opportunities afforded by cyclical changes. We employ rigorous, fundamental analysis to find investment opportunities. In choosing investments, we look at the market price of an individual company’s securities relative to our evaluation of its asset value based on such factors as book value, cash flow potential, long-term earnings and earnings multiples. We may invest in distressed companies if we believe the market overreacted to adverse developments or failed to appreciate positive changes.
Manager’s Discussion
The Fund benefited from the strong performances of a number of key holdings during the fiscal year. Among the top contributors were our private equity position in U.S. lender Chrysler Financial (via Cerberus Capital Management) as well as common stock holdings of U.K. soft drink bottler Coca-Cola Enterprises (CCE) and U.S. tobacco company Lorillard.
Our private equity investment in Chrysler Financial was originally an investment in the consolidated business of Chrysler, which included both the automotive and finance operations. However, following the company’s 2009 restructuring, which included transfer of control of the automotive manufacturing business to Fiat, we were left with an equity stake in Chrysler Financial. Although initially illiquid, in early 2010 we began to see renewed investor interest in Chrysler Financial. Cash flows from the company’s asset portfolio grew, the securities became increasingly liquid, and the position began to rise in value. In December 2010, the position’s value further increased after the announcement that Canada’s TD Bank Group intended to purchase Chrysler Financial’s U.S. and Canadian businesses for approximately $6.3 billion, in a transaction expected to close in mid-2011. Although this deal would have represented what we assessed as approximately 78%-80% of the value of Chrysler Financial, due to the increased investor interest around the opportunity, we were able to find a buyer for the entire position at what we thought was a very good price, and the holding became a key contributor to performance for the Fund’s fiscal year. At period-end, the Fund no longer held a position in Chrysler Financial.
The Fund’s investment in CCE also appreciated for the year. CCE is the exclusive distributor of Coca-Cola products in the U.K., Belgium, France, Luxembourg, Monaco, the Netherlands, Norway and Sweden, and it is the world’s third-largest independent Coca-Cola bottler. In early 2010, CCE reached an agreement to sell its North American bottling operations to The Coca-Cola Company and, in turn, acquire bottling assets in Norway and
Annual Report | 7
Sweden from The Coca-Cola Company. CCE’s share price rose throughout the year under review after the company shed the North American bottling assets and investors were increasingly drawn to the attractiveness of its European bottling assets. This value-creating deal closed in late 2010, at which time CCE issued a $10-per-share special dividend and initiated a $1 billion share buyback program. After the deal closed, CCE shares continued to appreciate as the company bought back stock and revenues grew more than many expected.
Lorillard, another key contributor for the year, is the third-largest U.S. cigarette manufacturer and the country’s oldest continuously operating tobacco company. Its flagship premium brand, Newport, is the country’s top selling menthol brand and generates approximately 90% of the company’s revenues. Lorillard shares appreciated for most of the year, with the biggest gains coming in March 2011. The shares were under pressure during a portion of the year under review, as many investors were concerned that a report being produced by the Tobacco Products Scientific Advisory Committee (TPSAC) would recommend that the Food and Drug Administration (FDA) ban menthol cigarettes. However, the findings and recommendations of the report regarding the effects of menthol cigarettes were less harsh than many anticipated. A sharp relief rally in Lorillard shares followed TPSAC’s release of the final report.
Positions that detracted from overall portfolio performance for the period included Hong Kong-based information technology company RCG Holdings; U.K. telecommunications provider Cable & Wireless Worldwide (CWW); and TNT, a Netherlands-based international express and mail delivery services company.
RCG Holdings’ share price declined during the year. As a leading player in the biometric and radio frequency identification (RFID) arenas in Asia, the company increased sales growth as these technologies proliferated. RCG’s growth came primarily from its consumer division, which benefited from the roll-out of Windows-based facial recognition software, and with its solution-based offerings as it moved into the government sector. In 2010, the company announced a restructuring plan to add efficiencies to its business model, potentially acting as a catalyst for future growth. However, RCG’s sales have yet to be fully accompanied by receipts as the company has extended credit to its customers. Concerns over this policy pressured its stock price. We continued to hold RCG in the Fund’s portfolio at period-end, as it was trading at what we believed was a discount to its net receivables alone and should benefit if collections improve.
8 | Annual Report
Although specialty telecommunications company CWW’s leaders reiterated a positive business outlook, its free cash flow generation remained weak and continued to generate lower margins than expected by management and the market. The company also has higher working capital and more exceptional or one-time costs than its industry peers, which further pressured its stock valuation. In our analysis, CWW appeared poised for a turnaround, with a focus on margin improvement as customers migrate from legacy, commodi-tized voice services to modern, higher margin data services. This transition faced headwinds, though, as general U.K. economic weakness caused a number of British companies to postpone non-critical spending. In addition, the U.K. government’s continued focus on austerity measures could further reduce public spending on telecommunications services. However, we identified potential catalysts that may drive future growth, including a reduction in exceptional costs and an upturn in the economy, which we believe could lead to renewed consumer and government spending as well as margin improvement for the company. Therefore, we continued to hold CWW in the Fund’s portfolio at period-end.
TNT is the Netherlands’ primary postal operator and Europe’s largest express package carrier. During the year under review, our TNT investment lost value due to several periods of disappointing operating results. The company’s earnings were pressured most by its higher-than-anticipated pension charges in the mail division, execution issues in its Brazil operations, and weak prices in its express package delivery division. The company announced a plan to separate the mail and express divisions, a split we believe should enable management to focus more effectively on each business.
Annual Report | 9
Performance Summary as of 3/31/11
Your dividend income will vary depending on dividends or interest paid by securities in the Fund’s portfolio, adjusted for operating expenses of each class. Capital gain distributions are net profits realized from the sale of portfolio securities. The performance table and graphs do not reflect any taxes that a shareholder would pay on Fund dividends, capital gain distributions, if any, or any realized gains on the sale of Fund shares. Total return reflects reinvestment of the Fund’s dividends and capital gain distributions, if any, and any unrealized gains or losses.

Annual Report | 11
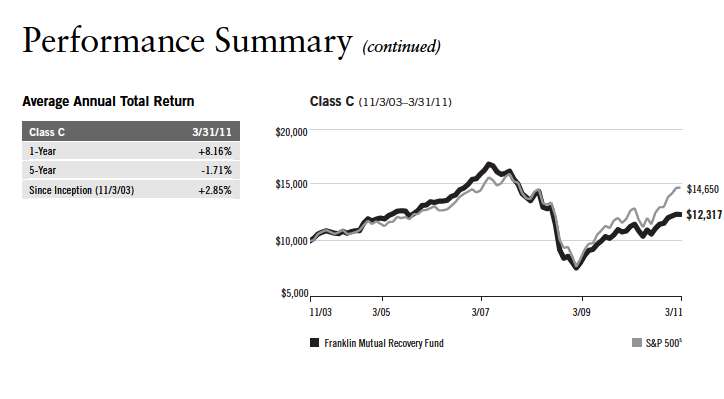
Performance Summary (continued)
Performance
Cumulative total return excludes sales charges. Average annual total return and value of $10,000 investment include maximum sales charges. Class A: 5.75% maximum initial sales charge; Class B: contingent deferred sales charge (CDSC) declining from 4% to 1% over six years, and eliminated thereafter; Class C: 1% CDSC in first year only; Advisor Class: no sales charges.
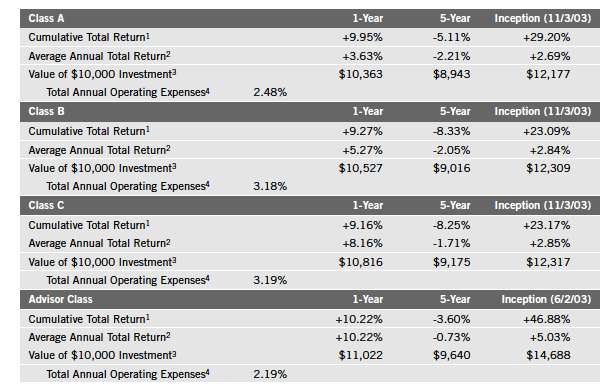
Performance data represent past performance, which does not guarantee future results. Investment return and principal value will fluctuate, and you may have a gain or loss when you sell your shares. Current performance may differ from figures shown. For most recent month-end performance, go to franklintempleton.com or call (800) 342-5236.
12 | Annual Report
Performance Summary (continued)
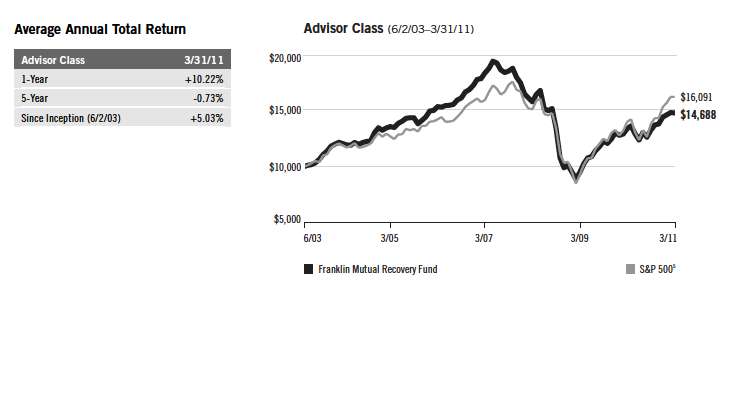
Total Return Index Comparison for a Hypothetical $10,000 Investment
Total return represents the change in value of an investment over the periods shown. It includes any current, applicable, maximum sales charge, Fund expenses, account fees and reinvested distributions. The unmanaged index includes reinvestment of any income or distributions. It differs from the Fund in composition and does not pay management fees or expenses. One cannot invest directly in an index.

Annual Report | 13
14 | Annual Report
Performance Summary (continued)
Endnotes
The Fund may invest in companies engaged in mergers, reorganizations or liquidations, which involve special risks, as pending deals may not be completed on time or on favorable terms, as well as lower rated bonds, which entail higher credit risk. The Fund is a nondiversified Fund and may experience increased susceptibility to adverse economic or regulatory developments affecting similar issuers or securities. The Fund may invest in foreign securities whose risks include currency fluctuations, and economic and political uncertainties. The manager applies various techniques and analyses in making investment decisions for the Fund, but there can be no guarantee that these decisions will produce the desired results. The Fund’s prospectus also includes a description of the main investment risks.
| | |
Class B: Class C: | | These shares have higher annual fees and expenses than Class A shares. Prior to 1/1/04, these shares were offered with an initial sales charge; thus actual total returns would have differed. These shares have higher annual fees and expenses than Class A shares. |
Advisor Class: | | Shares are available to certain eligible investors as described in the prospectus. |
1. Cumulative total return represents the change in value of an investment over the periods indicated.
2. Average annual total return represents the average annual change in value of an investment over the periods indicated. 3. These figures represent the value of a hypothetical $10,000 investment in the Fund over the periods indicated.
4. Figures are as stated in the Fund’s prospectus current as of the date of this report. In periods of market volatility, assets may decline significantly, causing total annual Fund operating expenses to become higher than the figures shown.
5. Source: © 2011 Morningstar. The S&P 500 is a market capitalization-weighted index of 500 stocks designed to measure total U.S. equity market performance.
Annual Report | 15
Your Fund’s Expenses
As a Fund shareholder, you can incur two types of costs:
Transaction costs, including sales charges (loads) on Fund purchases; and
Ongoing Fund costs, including management fees, distribution and service (12b-1) fees, and other Fund expenses. All mutual funds have ongoing costs, sometimes referred to as operating expenses.
The following table shows ongoing costs of investing in the Fund and can help you understand these costs and compare them with those of other mutual funds. The table assumes a $1,000 investment held for the six months indicated.
Actual Fund Expenses
The first line (Actual) for each share class listed in the table provides actual account values and expenses. The “Ending Account Value” is derived from the Fund’s actual return, which includes the effect of Fund expenses.
You can estimate the expenses you paid during the period by following these steps. Of course, your account value and expenses will differ from those in this illustration:
| 1. | Divide your account value by $1,000. |
| | If an account had an $8,600 value, then $8,600 ÷ $1,000 = 8.6. |
| 2. | Multiply the result by the number under the heading “Expenses Paid During Period.” |
| | If Expenses Paid During Period were $7.50, then 8.6 x $7.50 = $64.50. |
In this illustration, the estimated expenses paid this period are $64.50.
Hypothetical Example for Comparison with Other Funds
Information in the second line (Hypothetical) for each class in the table can help you compare ongoing costs of investing in the Fund with those of other mutual funds. This information may not be used to estimate the actual ending account balance or expenses you paid during the period. The hypothetical “Ending Account Value” is based on the actual expense ratio for each class and an assumed 5% annual rate of return before expenses, which does not represent the Fund’s actual return. The figure under the heading “Expenses Paid During Period” shows the hypothetical expenses your account would have incurred under this scenario. You can compare this figure with the 5% hypothetical examples that appear in shareholder reports of other funds.
16 | Annual Report
Your Fund’s Expenses (continued)
Please note that expenses shown in the table are meant to highlight ongoing costs and do not reflect any transaction costs, such as sales charges. Therefore, the second line for each class is useful in comparing ongoing costs only, and will not help you compare total costs of owning different funds. In addition, if transaction costs were included, your total costs would have been higher. Please refer to the Fund prospectus for additional information on operating expenses.
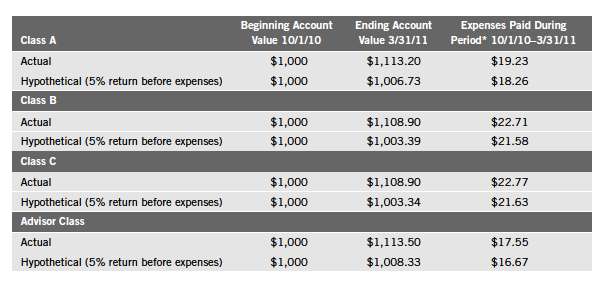
*Expenses are calculated using the most recent six-month expense ratio, annualized for each class (A: 3.65%; B: 4.32%; C: 4.33%; and Advisor: 3.33%), multiplied by the average account value over the period, multiplied by 182/365 to reflect the one-half year period.
Annual Report | 17
The Fund’s Repurchase Offers
The Fund will make quarterly repurchase offers for a portion of its shares. With any repurchase offer, shareholders may elect to tender (have the Fund repurchase) all, a portion or none of their shares. With each repurchase offer, shareholders will be notified in writing about the offer, how to request that the Fund repurchase their shares and the deadline for submitting repurchase requests.
Each quarter the Board of Trustees will set the amount of the repurchase offer, as a percentage of outstanding shares. This amount is known as the repurchase offer amount and will generally be between 5% and 25% of the Fund’s outstanding shares. If repurchase requests exceed the repurchase offer amount, the Fund will prorate requests. The Fund may, however, first accept any requests to repurchase all of a shareholder’s shares if the shareholder owns less than 100 shares. The Board will also determine the date by which the Fund must receive shareholders’ repurchase requests, which is known as the repurchase request deadline. The Board will base these decisions on investment management considerations, market conditions, liquidity of the Fund’s assets, shareholder servicing and administrative considerations and other factors it deems appropriate. Each repurchase request deadline will occur within the period that begins 21 days before, and ends 21 days after, the end of the quarterly interval. The repurchase price of the shares will be the net asset value as of the close of the NYSE on the date the Board sets as the repurchase pricing date. The maximum number of days between the repurchase request deadline and the repurchase pricing date is 14 days.

18 | Annual Report
Annual Report | The accompanying notes are an integral part of these financial statements. | 19
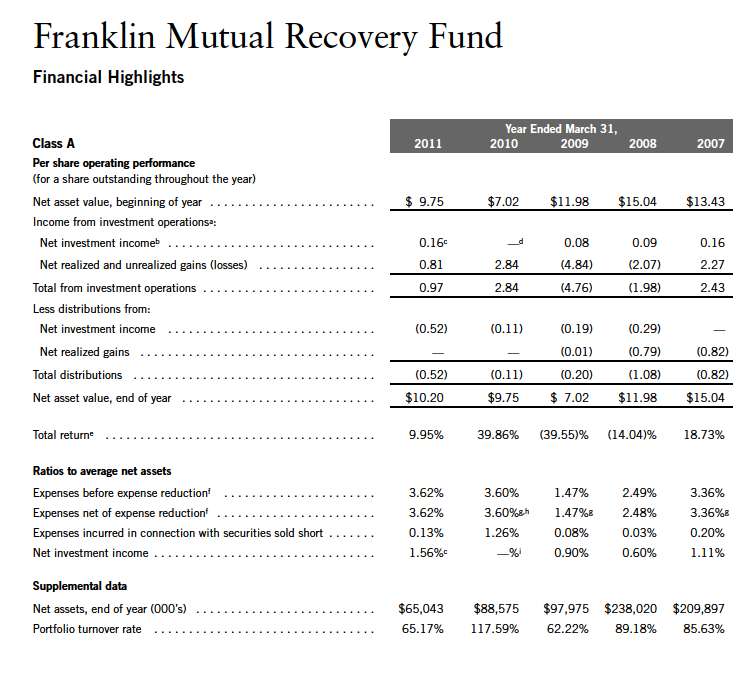
| | aThe amount shown for a share outstanding throughout the period may not correlate with the Statement of Operations for the period due to the timing of sales and repurchases of
the Fund shares in relation to income earned and/or fluctuating market value of the investments of the Fund.
bBased on average daily shares outstanding.
cNet investment income per share includes approximately $0.14 per share received in the form of a special dividend paid in connection with a corporate REIT conversion. Excluding
this non-recurring amount, the ratio of net investment income to average net assets would have been 0.09%.
dAmount rounds to less than $0.01 per share.
eTotal return does not reflect sales commissions or contingent deferred sales charges, if applicable.
fIncludes dividend and interest expense on securities sold short and borrowing fees, if any. See below for the ratios of such expenses to average net assets for the periods
presented. See Note 1(e).
gBenefit of expense reduction rounds to less than 0.01%.
hNet of a 0.26% affiliated fee waiver and a one-time 0.25% unaffiliated fee reimbursement, the ratio of expenses net of expense reduction to average net assets was 3.09%.
iRounds to less than 0.01%. |
20 | The accompanying notes are an integral part of these financial statements. | Annual Report

Annual Report | The accompanying notes are an integral part of these financial statements. | 21

22 | The accompanying notes are an integral part of these financial statements. | Annual Report
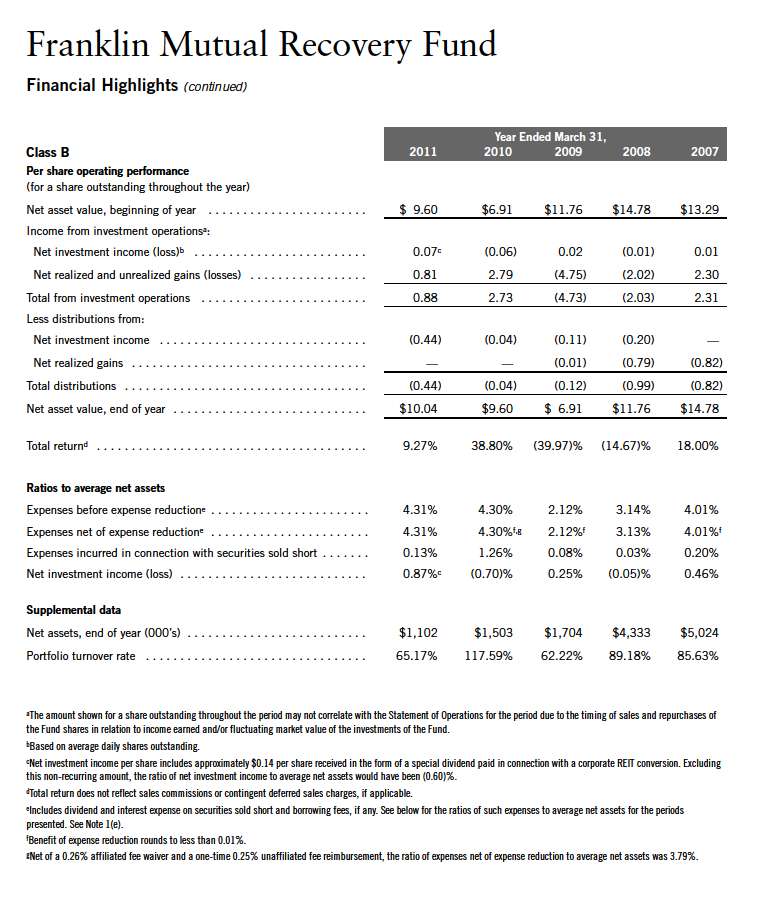
aThe amount shown for a share outstanding throughout the period may not correlate with the Statement of Operations for the period due to the timing of sales and repurchases of
the Fund shares in relation to income earned and/or fluctuating market value of the investments of the Fund.
bBased on average daily shares outstanding.
cNet investment income per share includes approximately $0.14 per share received in the form of a special dividend paid in connection with a corparate REIT conversion. Excluding
this non-recurring amount, the ratio of net investment income to average net assets would have been 0.39%.
dIncludes dividend and interest expense on securities sold short and borrowing fees, if any. See below for the ratios of such expenses to average net assets for the periods
presented. See Note 1(e).
eBenefit of expense reduction rounds to less than 0.01%.
fNet of a 0.26% affiliated fee waiver and a one-time 0.25% unaffiliated fee reimbursement, the ratio of expenses net of expense reduction to average net assets was 2.80%. |
Franklin Mutual Recovery Fund
Statement of Investments, March 31, 2011
Annual Report | 23
Franklin Mutual Recovery Fund
Statement of Investments, March 31, 2011 (continued)
24 | Annual Report
Franklin Mutual Recovery Fund
Statement of Investments, March 31, 2011 (continued)

Annual Report | 25
26 | Annual Report
Annual Report | 27
Annual Report | The accompanying notes are an integral part of these financial statements. | 29

30 | The accompanying notes are an integral part of these financial statements. | Annual Report

Annual Report | The accompanying notes are an integral part of these financial statements. | 31
32 | The accompanying notes are an integral part of these financial statements. | Annual Report
Annual Report | The accompanying notes are an integral part of these financial statements. | 33
Franklin Mutual Recovery Fund
Notes to Financial Statements
1. ORGANIZATION AND SIGNIFICANT ACCOUNTING POLICIES
The Franklin Mutual Recovery Fund (Fund) is registered under the Investment Company Act of 1940, as amended, (1940 Act) as a closed-end, continuously offered investment company. The Fund offers four classes of shares: Class A, Class B, Class C, and Advisor Class. Each class of shares differs by its initial sales load, contingent deferred sales charges, distribution fees, voting rights on matters affecting a single class and its exchange privilege.
The following summarizes the Fund’s significant accounting policies.
a. Financial Instrument Valuation
The Fund’s investments in securities and other financial instruments are carried at fair value daily. Fair value is the price that would be received to sell an asset or paid to transfer a liability in an orderly transaction between market participants on the measurement date. Under procedures approved by the Fund’s Board of Trustees, the Fund may utilize independent pricing services, quotations from securities and financial instrument dealers, and other market sources to determine fair value.
Equity securities and derivative financial instruments (derivatives) listed on an exchange or on the NASDAQ National Market System are valued at the last quoted sale price or the official closing price of the day, respectively. Foreign equity securities are valued as of the close of trading on the foreign stock exchange on which the security is primarily traded, or the NYSE, whichever is earlier. The value is then converted into its U.S. dollar equivalent at the foreign exchange rate in effect at the close of the NYSE on the day that the value of the security is determined. Over-the-counter securities are valued within the range of the most recent quoted bid and ask prices. Securities that trade in multiple markets or on multiple exchanges are valued according to the broadest and most representative market. Certain equity securities are valued based upon fundamental characteristics or relationships to similar securities. Investments in non-registered money market funds are valued at the closing net asset value.
Debt securities generally trade in the over-the-counter market rather than on a securities exchange. The Fund’s pricing services use multiple valuation techniques to determine fair value. In instances where sufficient market activity exists, the pricing services may utilize a market-based approach through which quotes from market makers are used to determine fair value. In instances where sufficient market activity may not exist or is limited, the pricing services also utilize proprietary valuation models which may consider market characteristics such as benchmark yield curves, option-adjusted spreads, credit spreads, estimated default rates, coupon rates, anticipated timing of principal repayments, underlying collateral, and other unique security features in order to estimate the relevant cash flows, which are then discounted to calculate the fair value. Securities denominated in a foreign currency are converted into their U.S. dollar equivalent at the foreign exchange rate in effect at the close of the NYSE on the date that the values of the foreign debt securities are determined.
34 | Annual Report
Franklin Mutual Recovery Fund
Notes to Financial Statements (continued)
| 1. | ORGANIZATION AND SIGNIFICANT ACCOUNTING POLICIES (continued) |
| a. | Financial Instrument Valuation (continued) |
Certain derivatives trade in the over-the-counter market. The Fund’s pricing services use various techniques including industry standard option pricing models and proprietary discounted cash flow models to determine the fair value of those instruments. The Fund’s net benefit or obligation under the derivative contract, as measured by the fair market value of the contract, is included in net assets.
The Fund has procedures to determine the fair value of securities and other financial instruments for which market prices are not readily available or which may not be reliably priced. Under these procedures, the Fund primarily employs a market-based approach which may use related or comparable assets or liabilities, recent transactions, market multiples, book values, and other relevant information for the investment to determine the fair value of the investment. The Fund may also use an income-based valuation approach in which the anticipated future cash flows of the investment are discounted to calculate fair value. Discounts may also be applied due to the nature or duration of any restrictions on the disposition of the investments. Due to the inherent uncertainty of valuations of such investments, the fair values may differ significantly from the values that would have been used had an active market existed.
Trading in securities on foreign securities stock exchanges and over-the-counter markets may be completed before the daily close of business on the NYSE. Occasionally, events occur between the time at which trading in a foreign security is completed and the close of the NYSE that might call into question the reliability of the value of a portfolio security held by the Fund. As a result, differences may arise between the value of the Fund’s portfolio securities as determined at the foreign market close and the latest indications of value at the close of the NYSE. In order to minimize the potential for these differences, the investment manager monitors price movements following the close of trading in foreign stock markets through a series of country specific market proxies (such as baskets of American Depository Receipts, futures contracts and exchange traded funds). These price movements are measured against established trigger thresholds for each specific market proxy to assist in determining if an event has occurred that may call into question the reliability of the values of the foreign securities held by the Fund. If such an event occurs, the securities may be valued using fair value procedures, which may include the use of independent pricing services.
b. Foreign Currency Translation
Portfolio securities and other assets and liabilities denominated in foreign currencies are translated into U.S. dollars based on the exchange rate of such currencies against U.S. dollars on the date of valuation. The Fund may enter into foreign currency exchange contracts to facilitate transactions denominated in a foreign currency. Purchases and sales of securities, income and expense items denominated in foreign currencies are translated into U.S. dollars at the exchange rate in effect on the transaction date. Portfolio securities and assets and liabilities denominated
Annual Report | 35
Franklin Mutual Recovery Fund
Notes to Financial Statements (continued)
| 1. | ORGANIZATION AND SIGNIFICANT ACCOUNTING POLICIES (continued) |
| b. | Foreign Currency Translation (continued) |
in foreign currencies contain risks that those currencies will decline in value relative to the U.S. dollar. Occasionally, events may impact the availability or reliability of foreign exchange rates used to convert the U.S. dollar equivalent value. If such an event occurs, the foreign exchange rate will be valued at fair value using procedures established and approved by the Fund’s Board of Trustees.
The Fund does not separately report the effect of changes in foreign exchange rates from changes in market prices on securities held. Such changes are included in net realized and unrealized gain or loss from investments on the Statement of Operations.
Realized foreign exchange gains or losses arise from sales of foreign currencies, currency gains or losses realized between the trade and settlement dates on securities transactions and the difference between the recorded amounts of dividends, interest, and foreign withholding taxes and the U.S. dollar equivalent of the amounts actually received or paid. Net unrealized foreign exchange gains and losses arise from changes in foreign exchange rates on foreign denominated assets and liabilities other than investments in securities held at the end of the reporting period.
c. Securities Purchased on a When-Issued and Delayed Delivery Basis
The Fund may purchase securities on a when-issued and delayed delivery basis, with payment and delivery scheduled for a future date. These transactions are subject to market fluctuations and are subject to the risk that the value at delivery may be more or less than the trade date purchase price. Although the Fund will generally purchase these securities with the intention of holding the securities, it may sell the securities before the settlement date. Sufficient assets have been segregated for these securities.
d. Derivative Financial Instruments
The Fund invested in derivatives in order to manage risk or gain exposure to various other investments or markets. Derivatives are financial contracts based on an underlying or notional amount, require no initial investment or an initial net investment that is smaller than would normally be required to have a similar response to changes in market factors, and require or permit net settlement. Derivatives contain various risks including the potential inability of the counterparty to fulfill their obligations under the terms of the contract, the potential for an illiquid secondary market, and/or the potential for market movements which expose the Fund to gains or losses in excess of the amounts shown on the Statement of Assets and Liabilities. Realized gain and loss and unrealized appreciation and depreciation on these contracts for the period are included in the Statement of Operations.
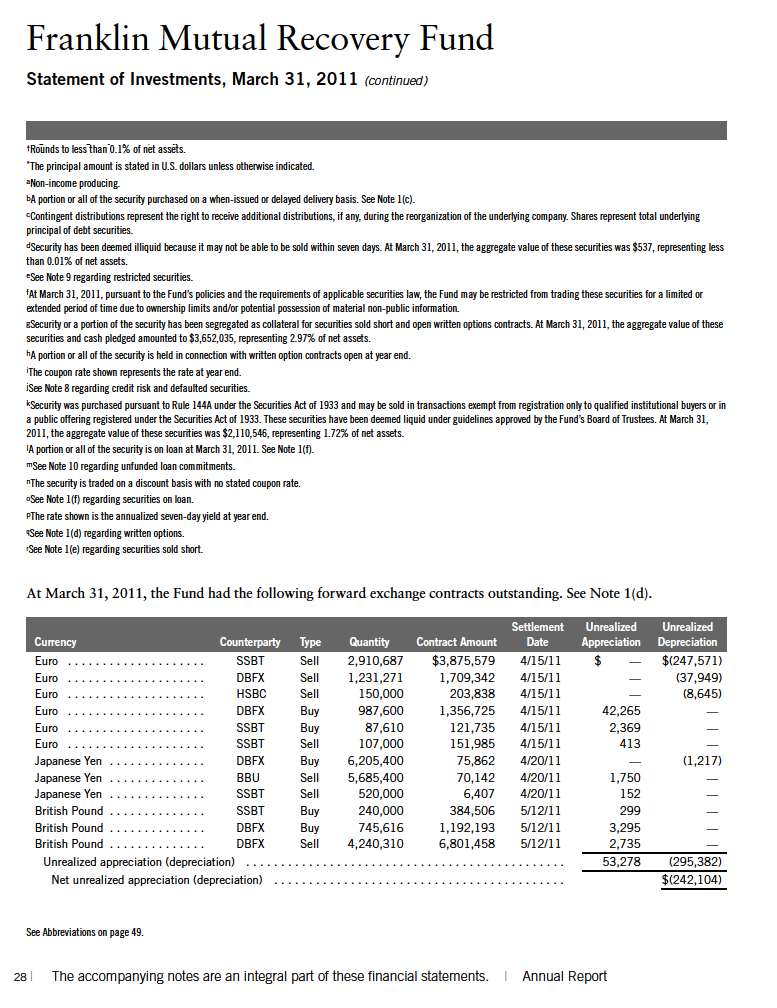
The Fund entered into forward exchange contracts primarily to manage exposure to certain foreign currencies. A forward exchange contract is an agreement between the Fund and a counterparty to buy or sell a foreign currency for a specific exchange rate on a future date.
36 | Annual Report
Franklin Mutual Recovery Fund
Notes to Financial Statements (continued)
| 1. | ORGANIZATION AND SIGNIFICANT ACCOUNTING POLICIES (continued) |
| d. | Derivative Financial Instruments (continued) |
Pursuant to the terms of the forward exchange contracts, cash or securities may be required to be deposited as collateral. Unrestricted cash may be invested according to the Fund’s investment objectives.
The Fund entered into total return swap contracts primarily to gain exposure to equity price risk of an underlying asset. A total return swap is an agreement between the Fund and a counterparty to exchange a market linked return for a floating rate payment, both based upon a notional principal amount. Over the term of the contract, contractually required payments to be paid or received are accrued daily and recorded as unrealized depreciation or appreciation until the payments are made, at which time they are realized. Payments received or paid to recognize changes in the value of the underlying asset are recorded as realized gain or loss. Pursuant to the terms of the total return swap contract, cash or securities may be required to be deposited as collateral. Unrestricted cash may be invested according to the Fund’s investment objectives.
The Fund purchased or wrote option contracts primarily to manage exposure to equity price risk. An option is a contract entitling the holder to purchase or sell a specific amount of shares or units of a particular security, currency or index, or notional amount of a swap (swaption), at a specified price. Options purchased are recorded as an asset while options written are recorded as a liability. Upon exercise of an option, the acquisition cost or sales proceeds of the security is adjusted by any premium paid or received. Upon expiration of an option, any premium paid or received is recorded as a realized loss or gain. Upon closing an option other than through expiration or exercise, the difference between the premium and the cost to close the position is recorded as a realized gain or loss.
See Note 11 regarding other derivative information.
e. Securities Sold Short
The Fund is engaged in selling securities short, which obligates the Fund to replace a borrowed security with the same security at current market value. The Fund incurs a loss if the price of the security increases between the date of the short sale and the date on which the Fund replaces the borrowed security. The Fund realizes a gain if the price of the security declines between those dates. Gains are limited to the price at which the Fund sold the security short, while losses are potentially unlimited in size.
The Fund is required to establish a margin account with the broker lending the security sold short. While the short sale is outstanding, the broker retains the proceeds of the short sale and the Fund must maintain a deposit with broker consisting of cash and/or securities having a value equal to a specified percentage of the value of the securities sold short. The Fund is obligated to pay fees for borrowing the securities sold short and is required to pay the counterparty any dividends or interest due on securities sold short. Such dividends or interest and any borrowing fees are recorded as an expense to the Fund.
Annual Report | 37
Franklin Mutual Recovery Fund
Notes to Financial Statements (continued)
| 1. | ORGANIZATION AND SIGNIFICANT ACCOUNTING POLICIES (continued) |
| f. | Securities Lending |
The Fund participates in an agency based security lending program. The Fund receives cash collateral against the loaned securities in an amount equal to at least 102% of the market value of the loaned securities. Collateral is maintained over the life of the loan in an amount not less than 100% of the market value of loaned securities, as determined at the close of Fund business each day; any additional collateral required due to changes in security values is delivered to the Fund on the next business day. The collateral is invested in a non-registered money fund managed by the Fund’s custodian on the Fund’s behalf. The Fund receives income from the investment of cash collateral, in addition to lending fees and rebates paid by the borrower. The Fund bears the market risk with respect to the collateral investment, securities loaned, and the risk that the agent may default on its obligations to the Fund. The securities lending agent has agreed to indemnify the Fund in the event of default by a third party borrower.
g. Senior Floating Rate Interests
The Fund invests in senior secured corporate loans that pay interest at rates which are periodically reset by reference to a base lending rate plus a spread. These base lending rates are generally the prime rate offered by a designated U.S. bank or the London InterBank Offered Rate (LIBOR). Senior secured corporate loans often require prepayment of principal from excess cash flows or at the discretion of the borrower. As a result, actual maturity may be substantially less than the stated maturity.
Senior secured corporate loans in which the Fund invests are generally readily marketable, but may be subject to some restrictions on resale.
h. Income Taxes
It is the Fund’s policy to qualify as a regulated investment company under the Internal Revenue Code. The Fund intends to distribute to shareholders substantially all of its taxable income and net realized gains to relieve it from federal income and excise taxes. As a result, no provision for U.S. federal income taxes is required. The Fund files U.S. income tax returns as well as tax returns in certain other jurisdictions. The Fund records a provision for taxes in its financial statements including penalties and interest, if any, for a tax position taken on a tax return (or expected to be taken) when it fails to meet the more likely than not (a greater than 50% probability) threshold and based on the technical merits, the tax position may not be sustained upon examination by the tax authorities. As of March 31, 2011, and for all open tax years, the Fund has determined that no provision for income tax is required in the Fund’s financial statements. Open tax years are those that remain subject to examination and are based on each tax jurisdiction statute of limitation. The Fund is not aware of any tax position for which it is reasonably possible that the total amounts of unrecognized tax effects will significantly change in the next twelve months.
The Fund may be subject to foreign taxation related to income received, capital gains on the sale of securities and certain foreign currency transactions in the foreign jurisdictions in which it invests. Foreign taxes, if any, are recorded based on the tax regulations and rates that exist in the foreign
38 | Annual Report
Franklin Mutual Recovery Fund
Notes to Financial Statements (continued)
| 1. | ORGANIZATION AND SIGNIFICANT ACCOUNTING POLICIES (continued) |
| h. | Income Taxes (continued) |
markets in which the Fund invests. When a capital gain tax is determined to apply the Fund records an estimated deferred tax liability for unrealized gains on these securities in an amount that would be payable if the securities were disposed of on the valuation date.
i. Security Transactions, Investment Income, Expenses and Distributions
Security transactions are accounted for on trade date. Realized gains and losses on security transactions are determined on a specific identification basis. Interest income and estimated expenses are accrued daily. Amortization of premium and accretion of discount on debt securities are included in interest income. Dividend income and dividends declared on securities sold short are recorded on the ex-dividend date except that certain dividends from foreign securities are recognized as soon as the Fund is notified of the ex-dividend date. Distributions to shareholders are recorded on the ex-dividend date and are determined according to income tax regulations (tax basis). Distributable earnings determined on a tax basis may differ from earnings recorded in accordance with accounting principles generally accepted in the United States of America. These differences may be permanent or temporary. Permanent differences are reclassified among capital accounts to reflect their tax character. These reclassifications have no impact on net assets or the results of operations. Temporary differences are not reclassified, as they may reverse in subsequent periods.
Realized and unrealized gains and losses and net investment income, not including class specific expenses, are allocated daily to each class of shares based upon the relative proportion of net assets of each class. Differences in per share distributions, by class, are generally due to differences in class specific expenses.
j. Accounting Estimates
The preparation of financial statements in accordance with accounting principles generally accepted in the United States of America requires management to make estimates and assumptions that affect the reported amounts of assets and liabilities at the date of the financial statements and the amounts of income and expenses during the reporting period. Actual results could differ from those estimates.
k. Guarantees and Indemnifications
Under the Fund’s organizational documents, its officers and trustees are indemnified by the Fund against certain liabilities arising out of the performance of their duties to the Fund. Additionally, in the normal course of business, the Fund enters into contracts with service providers that contain general indemnification clauses. The Fund’s maximum exposure under these arrangements is unknown as this would involve future claims that may be made against the Fund that have not yet occurred. Currently, the Fund expects the risk of loss to be remote.
Annual Report | 39
Franklin Mutual Recovery Fund
Notes to Financial Statements (continued)
2. SHARES OF BENEFICIAL INTEREST
At March 31, 2011, there were an unlimited number of shares authorized ($0.01 par value).
Transactions in the Fund’s shares were as follows:

3. TENDER SHARES
On a quarterly basis, the Fund may make tender offers, the amount of which is determined by the Board of Trustees, for the repurchase of at least 5% but not more than 25% of the shares outstanding. The repurchase price is the net asset value on the repurchase pricing date.
40 | Annual Report
Franklin Mutual Recovery Fund
Notes to Financial Statements (continued)
4. TRANSACTIONS WITH AFFILIATES
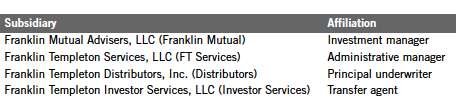
Franklin Resources, Inc. is the holding company for various subsidiaries that together are referred to as Franklin Templeton Investments. Certain officers and trustees of the Fund are also officers, and/or directors of the following subsidiaries:
a. Management Fees
The Fund pays Franklin Mutual an investment management fee comprised of a “base fee” and a “performance adjustment”. The base fee is calculated at the beginning of each month using an annual rate of 1.50% of the prior month’s average daily net assets. The performance adjustment is calculated at the beginning of each month based on how much the Fund’s total return exceeded or lagged its performance fee index, the Bloomberg/EFFAS U.S. Government 3-5 Years Total Return Index (Fund performance differential), over the preceding twelve-month period (performance period). A performance adjustment is applicable if the Fund performance differential exceeds 1.00%, either upwards (an increase to the base fee) or downwards (a decrease to the base fee). The performance adjustment rate is equal to 0.01% for each additional 0.05% that the Fund performance differential exceeds 1.00%. The performance adjustment amount is determined by multiplying the performance adjustment rate by the average daily net assets of the performance period. The performance adjustment rate may not exceed 1.00% annualized, either upwards or downwards. At the end of each month, an annualized investment management fee ratio is calculated (total investment management fees divided by fiscal year to date average daily net assets). In accordance with the Investment Management Agreement, the investment management fee ratio may not exceed 2.50% or fall below 0.50% for the fiscal year. For the period, the total annualized management fee rate, including the performance adjustment, was 2.38% of the average daily net assets of the Fund.
b. Administrative Fees
The Fund pays an administrative fee to FT Services of 0.20% per year of the average daily net assets of the Fund.
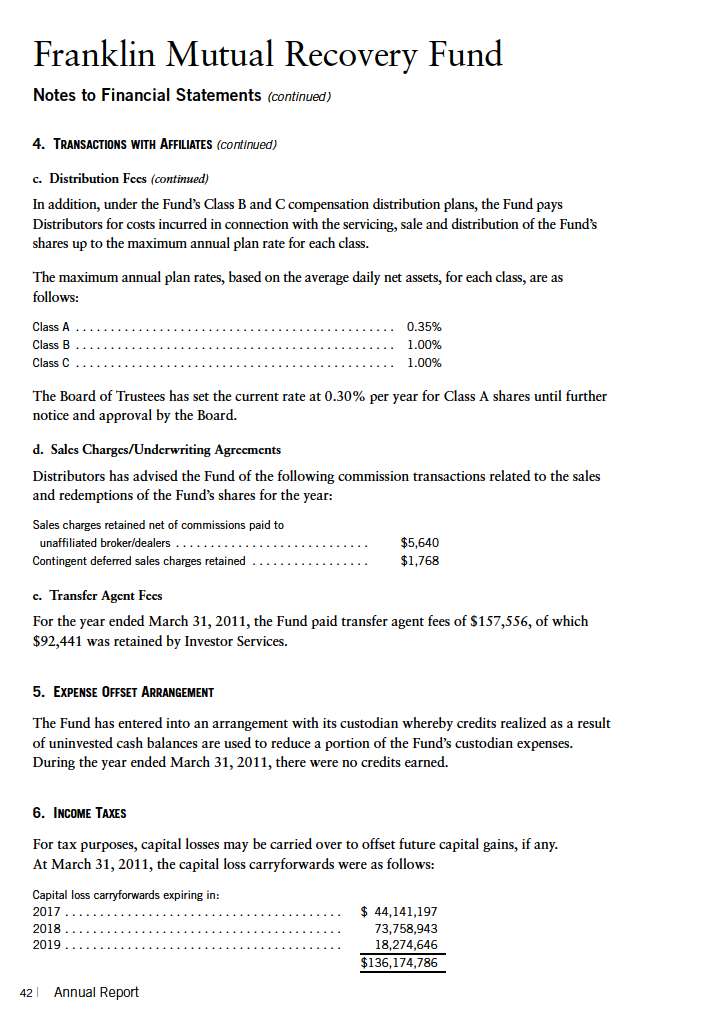
c. Distribution Fees
The Fund’s Board of Trustees has adopted distribution plans for each share class, with the exception of Advisor Class shares, pursuant to Rule 12b-1 under the 1940 Act. Under the Fund’s Class A reimbursement distribution plan, the Fund reimburses Distributors for costs incurred in connection with the servicing, sale and distribution of the Fund’s shares up to the maximum annual plan rate. Under the Class A reimbursement distribution plan, costs exceeding the maximum for the current plan year cannot be reimbursed in subsequent periods.
Annual Report | 41
Franklin Mutual Recovery Fund
Notes to Financial Statements (continued)
6. INCOME TAXES (continued)
For tax purposes, realized capital losses occurring subsequent to October 31 may be deferred and treated as occurring on the first day of the following fiscal year. At March 31, 2011, the Fund deferred realized capital losses of $3,171,508.
The tax character of distributions paid during the years ended March 31, 2011 and 2010, was as follows:

At March 31, 2011, the cost of investments, net unrealized appreciation (depreciation) and undistributed ordinary income for income tax purposes were as follows:
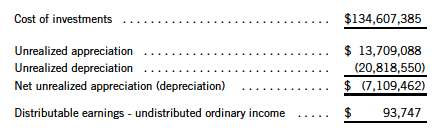
Net investment income (loss) differs for financial statement and tax purposes primarily due to differing treatments of defaulted securities, foreign currency transactions, passive foreign investment company shares, payments-in-kind, bond discounts and premiums, non-deductible expenses and pass-through entity income.
Net realized gains (losses) differ for financial statement and tax purposes primarily due to differing treatments of wash sales, foreign currency transactions, passive foreign investment company shares, bond discounts and premiums, tax straddles, corporate actions, pass-through entity income, and defaulted securities.
7. INVESTMENT TRANSACTIONS
Purchases and sales of investments (excluding short term securities and securities sold short) for the year ended March 31, 2011, aggregated $81,690,744 and $146,412,927, respectively.
Annual Report | 43
Franklin Mutual Recovery Fund
Notes to Financial Statements (continued)
7. INVESTMENT TRANSACTIONS (continued)
Transactions in options written during the year ended March 31, 2011, were as follows:
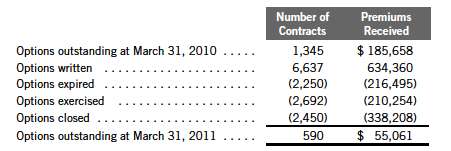
See Notes 1(d) and 11 regarding derivative financial instruments and other derivative information, respectively.
8. CREDIT RISK AND DEFAULTED SECURITIES
The Fund may purchase the pre-default or defaulted debt of distressed companies. Distressed companies are financially troubled and are about to be or are already involved in financial restructuring or bankruptcy. Risks associated with purchasing these securities include the possibility that the bankruptcy or other restructuring process takes longer than expected, or that distributions in restructuring are less than anticipated, either or both of which may result in unfavorable consequences to the Fund. If it becomes probable that the income on debt securities, including those of distressed companies, will not be collected, the Fund discontinues accruing income and recognizes an adjustment for uncollectible interest.
At March 31, 2011, the aggregate value of distressed company securities for which interest recognition has been discontinued was $2,903,870, representing 2.36% of the Fund’s net assets. For information as to specific securities, see the accompanying Statement of Investments.
9. RESTRICTED SECURITIES
The Fund may invest in securities that are restricted under the Securities Act of 1933 (1933 Act) or which are subject to legal, contractual, or other agreed upon restrictions on resale. Restricted securities are often purchased in private placement transactions, and cannot be sold without prior registration unless the sale is pursuant to an exemption under the 1933 Act. Disposal of these securities may require greater effort and expense, and prompt sale at an acceptable price may be difficult. The Fund may have registration rights for restricted securities. The issuer generally incurs all registration costs.
44 | Annual Report
Franklin Mutual Recovery Fund
Notes to Financial Statements (continued)

10. UNFUNDED LOAN COMMITMENTS
The Fund may enter into certain credit agreements, all or a portion of which may be unfunded. The Fund is obligated to fund these loan commitments at the borrowers’ discretion. Funded portions of credit agreements are presented on the Statement of Investments.
At March 31, 2011, unfunded commitments were as follows:
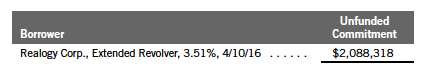
Unfunded loan commitments and funded portions of credit agreements are marked to market daily and any unrealized appreciation or depreciation is included in the Statement of Assets and Liabilities and Statement of Operations.
Annual Report | 45
Franklin Mutual Recovery Fund
Notes to Financial Statements (continued)
11. OTHER DERIVATIVE INFORMATION
At March 31, 2011, the Fund has invested in derivative contracts which are reflected on the Statement of Assets and Liabilities as follows:

For the year ended March 31, 2011, the effect of derivative contracts on the Fund’s Statement of Operations was as follows:

aRepresents the average number of option contracts or notional amount for other derivative contracts outstanding during the year. For derivative contracts denominated in foreign currencies, notional amounts are converted into U.S. dollars.
See Note 1(d) regarding derivative financial instruments.
12. CREDIT FACILITY
The Fund participates in a $20 million senior unsecured revolving credit facility to fund shareholder redemptions or meet unfunded loan commitments. Under the terms of the current credit facility, which expires on May 27, 2011, and may or may not be extended for subsequent periods on the same or different terms, the Fund shall, in addition to interest charged on any borrowings made by the Fund, pay an annual commitment fee based upon the unused portion of the credit facility. During the period, the Fund incurred commitment fees of $40,667, which is reflected in other expenses on the Statement of Operations.
During the year ended March 31, 2011, the Fund did not utilize the facility.
46 | Annual Report
Franklin Mutual Recovery Fund
Notes to Financial Statements (continued)
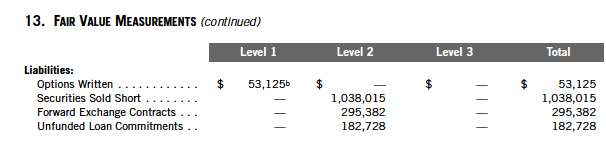
13. FAIR VALUE MEASUREMENTS
The Fund follows a fair value hierarchy that distinguishes between market data obtained from independent sources (observable inputs) and the Fund’s own market assumptions (unobservable inputs). These inputs are used in determining the value of the Fund’s investments and are summarized in the following fair value hierarchy:
Level 1 – quoted prices in active markets for identical securities
Level 2 – other significant observable inputs (including quoted prices for similar securities, interest rates, prepayment speed, credit risk, etc.)
Level 3 – significant unobservable inputs (including the Fund’s own assumptions in determining the fair value of investments)
The inputs or methodology used for valuing securities are not an indication of the risk associated with investing in those securities
For movements between the levels within the fair value hierarchy, the Fund has adopted a policy of recognizing the transfers as of the date of the underlying event which caused the movement.
The following is a summary of the inputs used as of March 31, 2011, in valuing the Fund’s assets and liabilities carried at fair value:

Annual Report | 47
Franklin Mutual Recovery Fund
Notes to Financial Statements (continued)
aIncludes common and preferred stocks as well as other equity investments. bIncludes securities determined to have no value at March 31, 2011. cFor detailed industry descriptions, see the accompanying Statement of Investments.
At March 31, 2011, the reconciliation of assets in which significant unobservable inputs (Level 3) were used in determining fair value, is as follows:

14. SUBSEQUENT EVENTS
The Fund has evaluated subsequent events through the issuance of the financial statements and determined that no events have occurred that require disclosure.
48 | Annual Report
Franklin Mutual Recovery Fund
Notes to Financial Statements (continued)

Annual Report | 49
Franklin Mutual Recovery Fund
Report of Independent Registered Public Accounting Firm
To the Board of Trustees and Shareholders of the Franklin Mutual Recovery Fund:
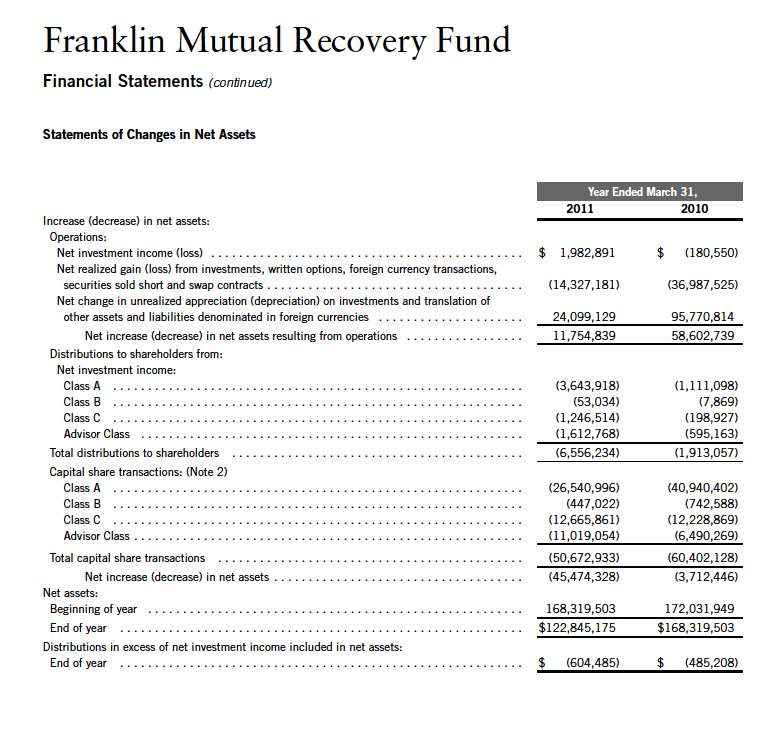
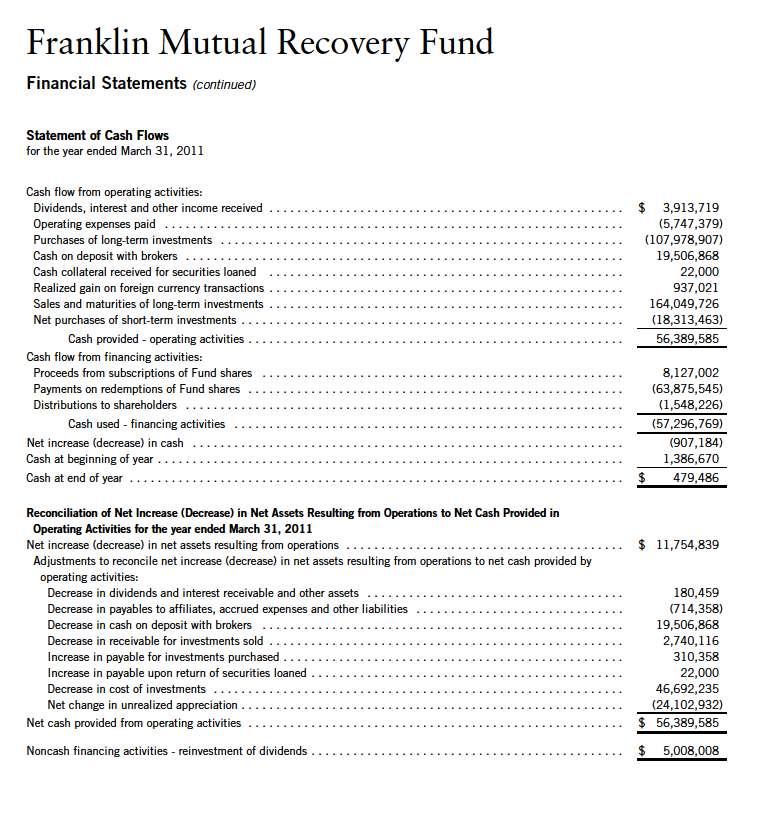
We have audited the accompanying statement of assets and liabilities of Franklin Mutual Recovery Fund (the “Fund”), including the statement of investments, as of March 31, 2011, and the related statements of operations and cash flows for the year then ended, the statements of changes in net assets for each of the two years in the period then ended, and the financial highlights for each of the five years in the period ended. These financial statements and financial highlights are the responsibility of the Fund’s management. Our responsibility is to express an opinion on these financial statements and financial highlights based on our audits.
We conducted our audits in accordance with the standards of the Public Company Accounting Oversight Board (United States). Those standards require that we plan and perform the audit to obtain reasonable assurance about whether the financial statements and financial highlights are free of material misstatement. We were not engaged to perform an audit of the Fund’s internal control over financial reporting. Our audits included consideration of internal control over financial reporting as a basis for designing audit procedures that are appropriate in the circumstances, but not for the purpose of expressing an opinion on the effectiveness of the Fund’s internal control over financial reporting. Accordingly, we express no such opinion. An audit also includes examining, on a test basis, evidence supporting the amounts and disclosures in the financial statements and financial highlights, assessing the accounting principles used and significant estimates made by management, and evaluating the overall financial statement presentation. Our procedures included confirmation of securities owned as of March 31, 2011, by correspondence with the custodian and brokers, or by other appropriate auditing procedures where replies from the brokers were not received. We believe that our audits provide a reasonable basis for our opinion.
In our opinion, the financial statements and financial highlights referred to above present fairly, in all material respects, the financial position of Franklin Mutual Recovery Fund at March 31, 2011, the results of its operations and cash flows for the year then ended, the changes in its net assets for each of the two years in the period then ended, and the financial highlights for each of the five years in the period ended, in conformity with U.S. generally accepted accounting principles.

50 | Annual Report
Franklin Mutual Recovery Fund
Tax Designation (unaudited)
Under Section 854(b)(2) of the Internal Revenue Code (Code), the Fund designates 45.13% of the ordinary income dividends as income qualifying for the dividends received deduction for the fiscal year ended March 31, 2011.
Under Section 854(b)(2) of the Code, the Fund designates the maximum amount allowable but no less than $3,654,143 as qualified dividends for purposes of the maximum rate under Section 1(h)(11) of the Code for the fiscal year ended March 31, 2011. Distributions, including qualified dividend income, paid during calendar year 2011 will be reported to shareholders on Form 1099-DIV in January 2012. Shareholders are advised to check with their tax advisors for information on the treatment of these amounts on their individual income tax returns.
Annual Report | 51


Franklin Mutual Recovery Fund
Shareholder Information
Proxy Voting Policies and Procedures
The Fund’s investment manager has established Proxy Voting Policies and Procedures (Policies) that the Fund uses to determine how to vote proxies relating to portfolio securities. Shareholders may view the Fund’s complete Policies online at franklintempleton.com. Alternatively, shareholders may request copies of the Policies free of charge by calling the Proxy Group collect at (954) 527-7678 or by sending a written request to: Franklin Templeton Companies, LLC, 500 East Broward Boulevard, Suite 1500, Fort Lauderdale, FL 33394, Attention: Proxy Group. Copies of the Fund’s proxy voting records are also made available online at franklintempleton.com and posted on the U.S. Securities and Exchange Commission’s website at sec.gov and reflect the most recent 12-month period ended June 30.
Quarterly Statement of Investments
The Fund files a complete statement of investments with the U.S. Securities and Exchange Commission for the first and third quarters for each fiscal year on Form N-Q. Shareholders may view the filed Form N-Q by visiting the Commission’s website at sec.gov. The filed form may also be viewed and copied at the Commission’s Public Reference Room in Washington, DC. Information regarding the operations of the Public Reference Room may be obtained by calling (800) SEC-0330.
Householding of Reports and Prospectuses
You will receive the Fund’s financial reports every six months as well as an annual updated summary prospectus (prospectus available upon request). To reduce Fund expenses, we try to identify related shareholders in a household and send only one copy of the financial reports and summary prospectus. This process, called “householding,” will continue indefinitely unless you instruct us otherwise. If you prefer not to have these documents householded, please call us at (800) 632-2301. At any time you may view current prospectuses/summary prospectuses and financial reports on our website. If you choose, you may receive these documents through electronic delivery.
Annual Report | 57
This page intentionally left blank.
This page intentionally left blank.
This page intentionally left blank.
Item 2. Code of Ethics.
(a) The Registrant has adopted a code of ethics that applies to its principal executive officers and principal financial and accounting officer.
| (c) | N/A |
| (d) | N/A |
| (f) | Pursuant to Item 12(a)(1), the Registrant is attaching as an exhibit a |
copy of its code of ethics that applies to its principal executive officers and principal financial and accounting officer.
Item 3. Audit Committee Financial Expert.
(a)(1) The Registrant has an audit committee financial expert serving on its audit committee.
(2) The audit committee financial expert is Ann Torre Bates and she is "independent" as defined under the relevant Securities and Exchange Commission Rules and Releases.
Item 4. Principal Accountant Fees and Services.
(a) Audit Fees
The aggregate fees paid to the principal accountant for professional services rendered by the principal accountant for the audit of the registrant’s annual financial statements or for services that are normally provided by the principal accountant in connection with statutory and regulatory filings or engagements were $75,304 for the fiscal year ended March 31, 2011 and $75,616 for the fiscal year ended March 31, 2010.
(b) Audit-Related Fees
There were no fees paid to the principal accountant for assurance and related services rendered by the principal accountant to the registrant that are reasonably related to the performance of the audit of the registrant's financial statements and are not reported under paragraph (a) of Item 4.
There were no fees paid to the principal accountant for assurance and related services rendered by the principal accountant to the registrant's investment adviser and any entity controlling, controlled by or under common control with the investment adviser that provides ongoing services to the registrant that are reasonably related to the performance of the audit of their financial statements.
(c) Tax Fees
There were no fees paid to the principal accountant for professional services rendered by the principal accountant to the registrant for tax compliance, tax advice and tax planning.
There were no fees paid to the principal accountant for professional services rendered by the principal accountant to the registrant’s investment adviser and any entity controlling, controlled by or under common control with the
investment adviser that provides ongoing services to the registrant for tax compliance, tax advice and tax planning.
(d) All Other Fees
The were no fees paid to the principal accountant for products and services rendered by the principal accountant to the registrant not reported in paragraphs (a)-(c) of Item 4.
There were no paid to the principal accountant for products and services rendered by the principal accountant to the registrant’s investment adviser and any entity controlling, controlled by or under common control with the investment adviser that provides ongoing services to the registrant other than services reported in paragraphs (a)-(c) of Item 4.
(e) (1) The registrant’s audit committee is directly responsible for approving the services to be provided by the auditors, including:
| (i) | pre-approval of all audit and audit related services; |
| (ii) | pre-approval of all non-audit related services to be provided to |
the Fund by the auditors;
(iii) pre-approval of all non-audit related services to be provided to the registrant by the auditors to the registrant’s investment adviser or to any entity that controls, is controlled by or is under common control with the registrant’s investment adviser and that provides ongoing services to the registrant where the non-audit services relate directly to the operations or financial reporting of the registrant; and
(iv) establishment by the audit committee, if deemed necessary or appropriate, as an alternative to committee pre-approval of services to be provided by the auditors, as required by paragraphs (ii) and (iii) above, of policies and procedures to permit such services to be pre-approved by other means, such as through establishment of guidelines or by action of a designated member or members of the committee; provided the policies and procedures are detailed as to the particular service and the committee is informed of each service and such policies and procedures do not include delegation of audit committee responsibilities, as contemplated under the Securities Exchange Act of 1934, to management; subject, in the case of (ii) through (iv), to any waivers, exceptions or exemptions that may be available under applicable law or rules.
(e) (2) None of the services provided to the registrant described in paragraphs (b)-(d) of Item 4 were approved by the audit committee pursuant to paragraph (c)(7)(i)(C) of Rule 2-01 of regulation S-X.
| (f) | No disclosures are required by this Item 4(f). |
| (g) | There were no non-audit fees paid to the principal accountant for |
services rendered by the principal accountant to the registrant and the registrant’s investment adviser and any entity controlling, controlled by or under common control with the investment adviser that provides ongoing services to the registrant.
(h) The registrant’s audit committee of the board has considered whether the provision of non-audit services that were rendered to the registrant’s investment adviser (not including any sub-adviser whose role is primarily
portfolio management and is subcontracted with or overseen by another investment adviser), and any entity controlling, controlled by, or under common control with the investment adviser that provides ongoing services to the registrant that were not pre-approved pursuant to paragraph (c)(7)(ii) of Rule 2-01 of Regulation S-X is compatible with maintaining the principal accountant’s independence.
Item 5. Audit Committee of Listed Registrants.
Members of the Audit Committee are: Edward I. Altman, Ann Torre Bates and Robert E. Wade.
| Item 6. Schedule of Investments. |
Item 7. Disclosure of Proxy Voting Policies and Procedures for Closed-End Management Investment Companies.
The board of trustees of the Fund has delegated the authority to vote proxies related to the portfolio securities held by the Fund to the Fund’s Investment manager Franklin Mutual Advisers LLC (FMAL) in accordance with the Proxy Voting Policies and Procedures (Policies) adopted by the investment manager.
The investment manager has delegated its administrative duties with respect to the voting of proxies to the Proxy Group within Franklin Templeton Companies, LLC (Proxy Group), an affiliate and wholly owned subsidiary of Franklin Resources, Inc. All proxies received by the Proxy Group will be voted based upon the investment manager’s instructions and/or policies. The investment manager votes proxies solely in the interests of the Fund and its shareholders.
To assist it in analyzing proxies, the investment manager subscribes to RiskMetrics Group (RiskMetrics), an unaffiliated third-party corporate governance research service that provides in-depth analyses of shareholder meeting agendas, vote recommendations, recordkeeping and vote disclosure services. In addition, the investment manager subscribes to Glass, Lewis & Co., LLC (Glass Lewis), an unaffiliated third-party analytical research firm, to receive analyses and vote recommendations on the shareholder meetings of publicly held U.S. companies. Although RiskMetrics’ and/or Glass Lewis’ analyses are thoroughly reviewed and considered in making a final voting decision, the investment manager does not consider recommendations from RiskMetrics, Glass Lewis or any other third party to be determinative of the investment manager’s ultimate decision. As a matter of policy, the officers, directors/trustees and employees of the investment manager and the Proxy Group will not be influenced by outside sources whose interests conflict with the interests of the Fund and its shareholders. Efforts are made to resolve all conflicts in the interests of the investment manager’s clients. Material conflicts of interest are identified by the Proxy Group based upon analyses of client, distributor, broker dealer and vendor lists, information periodically gathered from directors and officers, and information derived from other sources, including public filings. In situations where a material conflict of interest is identified, the Proxy Group may defer to the voting recommendation of RiskMetrics, Glass Lewis or those of another independent third-party provider of proxy services; or send the proxy directly to the Fund with the investment manager’s recommendation regarding the vote for
approval. If the conflict is not resolved by the Fund, the Proxy Group may refer the matter, along with the recommended course of action by the investment manager, if any, to an interdepartmental Proxy Review Committee (which may include portfolio managers and/or research analysts employed by the investment manager), for evaluation and voting instructions. The Proxy Review Committee may defer to the voting recommendation of RiskMetrics, Glass Lewis or those of another independent third-party provider of proxy services; or send the proxy directly to the Fund. Where the Proxy Group or the Proxy Review Committee refers a matter to the Fund, it may rely upon the instructions of a representative of the Fund, such as the board or a committee of the board.
Where a material conflict of interest has been identified, but the items on which the investment manager’s vote recommendations differ from Glass Lewis, RiskMetrics, or another independent third-party provider of proxy services relate specifically to (1) shareholder proposals regarding social or environmental issues or political contributions, (2) “Other Business” without describing the matters that might be considered, or (3) items the investment manager wishes to vote in opposition to the recommendations of an issuer’s management, the Proxy Group may defer to the vote recommendations of the investment manager rather than sending the proxy directly to the Fund for approval.
To avoid certain potential conflicts of interest, the investment manager will employ echo voting, if possible, in the following instances: (1) when the Fund invests in an underlying fund in reliance on any one of Sections 12(d)(1)(E), (F), or (G) of the 1940 Act, the rules thereunder or pursuant to any SEC exemptive orders thereunder; (2) when the Fund invests uninvested cash in affiliated money market funds pursuant to the rules under the 1940 Act or any exemptive orders thereunder (“cash sweep arrangement”); or (3) when required pursuant to the Fund’s governing documents or applicable law. Echo voting means that the investment manager will vote the shares in the same proportion as the vote of all of the other holders of the Fund’s shares.
The recommendation of management on any issue is a factor that the investment manager considers in determining how proxies should be voted. However, the investment manager does not consider recommendations from management to be determinative of the investment manager’s ultimate decision. As a matter of practice, the votes with respect to most issues are cast in accordance with the position of the company's management. Each issue, however, is considered on its own merits, and the investment manager will not support the position of the company's management in any situation where it deems that the ratification of management’s position would adversely affect the investment merits of owning that company’s shares.
Investment Manager’s proxy voting policies and principles The investment manager has adopted general proxy voting guidelines, which are summarized below. These guidelines are not an exhaustive list of all the issues that may arise and the investment manager cannot anticipate all future situations. In all cases, each proxy will be considered based on the relevant facts and circumstances.
Board of directors. The investment manager supports an independent board of directors, and prefers that key committees such as audit, nominating, and compensation committees be comprised of independent directors. The investment manager will generally vote against management efforts to classify a board and will generally support proposals to declassify the board of directors. The
investment manager may withhold votes from directors who have attended less than 75% of meetings without a valid reason. While generally in favor of separating Chairman and CEO positions, the investment manager will review this issue as well as proposals to restore or provide for cumulative voting on a case-by-case basis, taking into consideration factors such as the company’s corporate governance guidelines or provisions and performance.
Ratification of auditors of portfolio companies. The investment manager will closely scrutinize the role and performance of auditors. On a case-by-case basis, the investment manager will examine proposals relating to non-audit relationships and non-audit fees. The investment manager will also consider, on a case-by-case basis, proposals to rotate auditors, and will vote against the ratification of auditors when there is clear and compelling evidence of accounting irregularities or negligence.
Management and director compensation. A company’s equity-based compensation plan should be in alignment with the shareholders’ long-term interests. The investment manager believes that executive compensation should be directly linked to the performance of the company. The investment manager evaluates plans on a case-by-case basis by considering several factors to determine whether the plan is fair and reasonable, including the RiskMetrics quantitative model utilized to assess such plans and/or the Glass Lewis evaluation of the plans. The investment manager will generally oppose plans that have the potential to be excessively dilutive, and will almost always oppose plans that are structured to allow the repricing of underwater options, or plans that have an automatic share replenishment “evergreen” feature. The investment manager will generally support employee stock option plans in which the purchase price is at least 85% of fair market value, and when potential dilution is 10% or less.
Severance compensation arrangements will be reviewed on a case-by-case basis, although the investment manager will generally oppose “golden parachutes” that are considered to be excessive. The investment manager will normally support proposals that require a percentage of directors’ compensation to be in the form of common stock, as it aligns their interests with those of shareholders.
Anti-takeover mechanisms and related issues. The investment manager generally opposes anti-takeover measures since they tend to reduce shareholder rights. However, as with all proxy issues, the investment manager conducts an independent review of each anti-takeover proposal. On occasion, the investment manager may vote with management when the research analyst has concluded that the proposal is not onerous and would not harm the Fund or its shareholders’ interests. The investment manager generally supports proposals that require shareholder rights’ plans (“poison pills”) to be subject to a shareholder vote and will closely evaluate such plans on a case-by-case basis to determine whether or not they warrant support. In addition, the investment manager will generally vote against any proposal to issue stock that has unequal or subordinate voting rights. The investment manager generally opposes any supermajority voting requirements as well as the payment of “greenmail.” The investment manager generally supports “fair price” provisions and confidential voting.
Changes to capital structure. The investment manager realizes that a company's financing decisions have a significant impact on its shareholders, particularly when they involve the issuance of additional shares of common or preferred stock or the assumption of additional debt. The investment manager will review, on a case-by-case basis, proposals by companies to increase
authorized shares and the purpose for the increase. The investment manager will generally not vote in favor of dual-class capital structures to increase the number of authorized shares where that class of stock would have superior voting rights. The investment manager will generally vote in favor of the issuance of preferred stock in cases where the company specifies the voting, dividend, conversion and other rights of such stock and the terms of the preferred stock issuance are deemed reasonable.
Mergers and corporate restructuring. Mergers and acquisitions will be subject to careful review by the research analyst to determine whether they would be beneficial to shareholders. The investment manager will analyze various economic and strategic factors in making the final decision on a merger or acquisition. Corporate restructuring proposals are also subject to a thorough examination on a case-by-case basis.
Social and corporate policy issues. The investment manager will generally give management discretion with regard to social, environmental and ethical issues, although the investment manager may vote in favor of those that are believed to have significant economic benefits or implications for the Fund and its shareholders.
Global corporate governance. Many of the tenets discussed above are applied to the investment manager’s proxy voting decisions for international investments. However, the investment manager must be flexible in these instances and must be mindful of the varied market practices of each region.
The investment manager will attempt to process every proxy it receives for all domestic and foreign issuers. However, there may be situations in which the investment manager cannot process proxies, for example, where a meeting notice was received too late, or sell orders preclude the ability to vote. If a security is on loan, the investment manager may determine that it is not in the best interests of the Fund to recall the security for voting purposes. Also, the investment manager may abstain from voting under certain circumstances or vote against items such as “Other Business” when the investment manager is not given adequate information from the company.
Shareholders may view the complete Policies online at franklintempleton.com. Alternatively, shareholders may request copies of the Policies free of charge by calling the Proxy Group collect at (954)527-7678 or by sending a written request to: Franklin Templeton Companies, LLC, 500 East Broward Boulevard, Suite 1500, Fort Lauderdale, FL 33394, Attention: Proxy Group. Copies of the Fund’s proxy voting records are available online at franklintempleton.com and posted on the SEC website at www.sec.gov. The proxy voting records are updated each year by August 31 to reflect the most recent 12-month period ended June 30.
Item 8. Portfolio Managers of Closed-End Management Investment Companies.
(a)(1) As of May 26, 2011, the portfolio managers of the Fund are as follows:
SHAWN TUMULTY, Vice President of FMAL.
Mr. Tumulty has been a manager of the Fund since 2005. He joined Franklin Templeton Investments in 2000.
CHRISTIAN CORREA, Portfolio Manager of FMAL
Mr. Correa has been manager of the Fund since 2004. He joined Franklin Templeton Investments in 2003.
KEITH LUH, Assistant Portfolio Manager of FMAL
Mr. Luh has been a portfolio manager of the Fund since 2009, providing research and advice on purchases and sales of individual securities, and portfolio risk assessment. He joined Franklin Templeton Investments in 2005.
Shawn Tumulty and Christian Correa are jointly responsible for the day-to-day management of the Fund. The co-portfolio managers have equal authority over all aspects of the Fund's investment portfolio, including but not limited to, purchases and sales of individual securities, portfolio risk assessment, and the management of daily cash balances in accordance with anticipated management requirements. The degree to which each manager may perform these functions, and the nature of these functions, may change from time to time.
(a)(2) This section reflects information about the portfolio managers as of the fiscal year ended March 31, 2011.
The following table shows the number of other accounts managed by each portfolio manager and the total assets in the accounts managed within each category:

Portfolio managers that provide investment services to the Fund may also provide services to a variety of other investment products, including other funds, institutional accounts and private accounts. The advisory fees for some of such other products and accounts may be different than that charged to the Fund and may include performance based compensation. This may result in fees that are higher (or lower) than the advisory fees paid by the Fund. As a matter of policy, each fund or account is managed solely for the benefit of the beneficial owners thereof. As discussed below, the separation of the trading execution function from the portfolio management function and the application of objectively based trade allocation procedures helps to mitigate potential conflicts of interest that may arise as a result of the portfolio managers managing accounts with different advisory fees.
Conflicts. The management of multiple funds, including the Fund, and accounts may also give rise to potential conflicts of interest if the funds and other accounts have different objectives, benchmarks, time horizons, and fees as the portfolio manager must allocate his or her time and investment ideas across multiple funds and accounts. The manager seeks to manage such competing interests for the time and attention of portfolio managers by having portfolio managers focus on a particular investment discipline. Most other accounts managed by a portfolio manager are managed using the same investment strategies that are used in connection with the management of the Fund. Accordingly, portfolio holdings, position sizes, and industry and sector exposures tend to be similar across similar portfolios, which may minimize the potential for conflicts of interest. As noted above, the separate management of the trade execution and valuation functions from the portfolio management process also helps to reduce potential conflicts of interest. However, securities selected for funds or accounts other than the Fund may outperform the securities selected for the Fund. Moreover, if a portfolio manager identifies a limited investment opportunity that may be suitable for more than one fund or other account, the Fund may not be able to take full advantage of that opportunity due to an allocation of that opportunity across all eligible funds and other accounts. The manager seeks to manage such potential conflicts by using procedures intended to provide a fair allocation of buy and sell opportunities among funds and other accounts.
The structure of a portfolio manager’s compensation may give rise to potential conflicts of interest. A portfolio manager’s base pay and bonus tend to increase with additional and more complex responsibilities that include increased assets under management. As such, there may be an indirect relationship between a portfolio manager’s marketing or sales efforts and his or her bonus.
Finally, the management of personal accounts by a portfolio manager may give rise to potential conflicts of interest. While the funds and the manager have adopted a code of ethics which they believe contains provisions reasonably necessary to prevent a wide range of prohibited activities by portfolio managers and others with respect to their personal trading activities, there can be no assurance that the code of ethics addresses all individual conduct that could result in conflicts of interest.
The manager and the Fund have adopted certain compliance procedures that are designed to address these, and other, types of conflicts. However, there is no guarantee that such procedures will detect each and every situation where a conflict arises.
Compensation. The manager seeks to maintain a compensation program that is competitively positioned to attract, retain and motivate top-quality investment professionals. Portfolio managers receive a base salary, a cash incentive bonus opportunity, an equity compensation opportunity, and a benefits package. Portfolio manager compensation is reviewed annually and the level of compensation is based on individual performance, the salary range for a portfolio manager’s level of responsibility and Franklin Templeton guidelines. Portfolio managers are provided no financial incentive to favor one fund or account over another. Each portfolio manager’s compensation consists of the following three elements:
Base salary Each portfolio manager is paid a base salary.
Annual bonus Annual bonuses are structured to align the interests of the portfolio manager with those of the Fund’s shareholders. Each portfolio manager is eligible to receive an annual bonus. Bonuses generally are split between cash (50% to 65%) and restricted shares of Resources stock (17.5% to 25%) and mutual fund shares (17.5% to 25%). The deferred equity-based compensation is intended to build a vested interest of the portfolio manager in the financial performance of both Resources and mutual funds advised by the manager. The bonus plan is intended to provide a competitive level of annual bonus compensation that is tied to the portfolio manager achieving consistently strong investment performance, which aligns the financial incentives of the portfolio manager and Fund shareholders. The Chief Investment Officer of the manager and/or other officers of the manager, with responsibility for the Fund, have discretion in the granting of annual bonuses to portfolio managers in accordance with Franklin Templeton guidelines. The following factors are generally used in determining bonuses under the plan:
Investment performance. Primary consideration is given to the historic investment performance over the 1, 3 and 5 preceding years of all accounts managed by the portfolio manager. The pre-tax performance of each fund managed is measured relative to a relevant peer group and/or applicable benchmark as appropriate.
Non-investment performance. The more qualitative contributions of a portfolio manager to the manager’s business and the investment management team, including business knowledge, contribution to team efforts, mentoring of junior staff, and contribution to the marketing of the Funds, are evaluated in determining the amount of any bonus award.
Research. Where the portfolio management team also has research responsibilities, each portfolio manager is evaluated on the number and performance of recommendations over time.Responsibilities. The characteristics and complexity of funds managed by the portfolio manager are factored in the manager’s appraisal.
Additional long-term equity-based compensation
also be awarded restricted shares or units of Resources stock or restricted shares or units of one or more mutual funds, and options to purchase common shares of Resources stock. Awards of such deferred equity-based compensation typically vest over time, so as to create incentives to retain key talent.
Portfolio managers also participate in benefit plans and programs available generally to all employees of the manager.
Ownership of Fund shares. The manager has a policy of encouraging portfolio managers to invest in the funds they manage. Exceptions arise when, for example, a fund is closed to new investors or when tax considerations or jurisdictional constraints cause such an investment to be inappropriate for the portfolio manager. The following is the dollar range of Fund shares beneficially owned by each portfolio manager (such amounts may change from time to time):

Item 9. Purchases of Equity Securities by Closed-End Management Investment Company and Affiliated Purchasers. N/A
Item 10. Submission of Matters to a Vote of Security Holders.
There have been no changes to the procedures by which shareholders may recommend nominees to the Registrant's Board of Trustees that would require disclosure herein.
Item 11. Controls and Procedures.
(a) Evaluation of Disclosure Controls and Procedures. The Registrant maintains disclosure controls and procedures that are designed to ensure that information required to be disclosed in the Registrant’s filings under the Securities Exchange Act of 1934 and the Investment Company Act of 1940 is recorded, processed, summarized and reported within the periods specified in the rules and forms of the Securities and Exchange Commission. Such information is accumulated and communicated to the Registrant’s management, including its principal executive officer and principal financial officer, as appropriate, to allow timely decisions regarding required disclosure. The Registrant’s management, including the principal executive officer and the principal financial officer, recognizes that any set of controls and procedures, no matter how well designed and operated, can provide only reasonable assurance of achieving the desired control objectives.
Within 90 days prior to the filing date of this Shareholder Report on Form N-CSR, the Registrant had carried out an evaluation, under the supervision and with the participation of the Registrant’s management, including the Registrant’s principal executive officer and the Registrant’s principal financial officer, of the effectiveness of the design and operation of the Registrant’s disclosure controls and procedures. Based on such evaluation, the Registrant’s principal executive officer and principal financial officer concluded that the Registrant’s disclosure controls and procedures are effective.
| (b) Changes in Internal Controls. |
| There have been no significant changes |
in the Registrant’s internal controls or in other factors that could significantly affect the internal controls subsequent to the date of their evaluation in connection with the preparation of this Shareholder Report on Form N-CSR.