
Annual Report
Franklin Mutual Recovery Fund
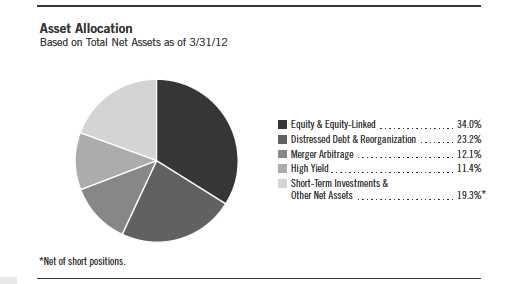
Your Fund’s Goal and Main Investments: Franklin Mutual Recovery Fund’s goal is
capital appreciation. The Fund seeks to achieve superior risk-adjusted returns with a moderate
correlation to U.S. equity markets by investing in distressed companies, merger arbitrage securities and
special situation/undervalued securities. The Fund may take long and short positions, with the latter
typically utilized in connection with the merger arbitrage strategy.
This annual report for Franklin Mutual Recovery Fund covers the fiscal year
ended March 31, 2012.
Performance Overview
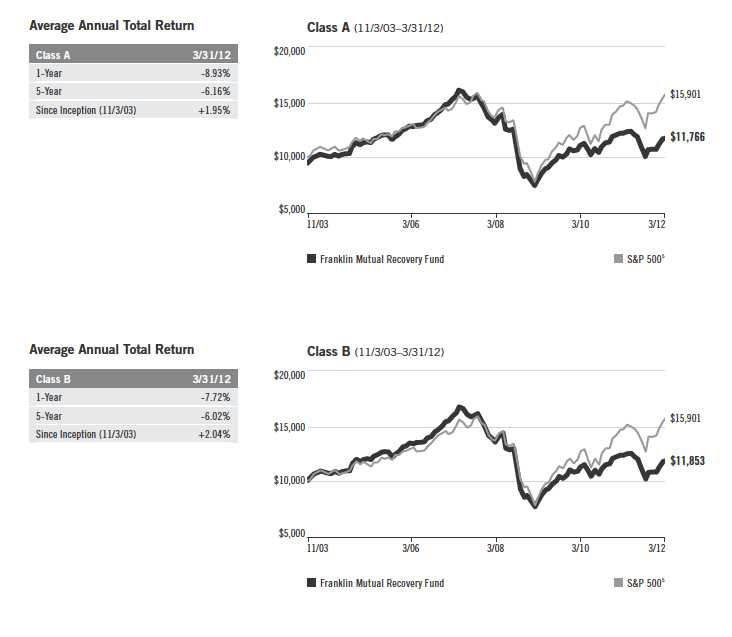
For the 12 months under review, Franklin Mutual Recovery Fund – Class A
had a -3.38% cumulative total return. The Fund underperformed U.S. stocks
as measured by its benchmark, the Standard & Poor’s 500 Index (S&P 500),
which produced a total return of +8.54% for the same period.1 The Fund
1. Source: © 2012 Morningstar. All Rights Reserved. The information contained herein: (1) is proprietary to Morningstar
and/or its content providers; (2) may not be copied or distributed; and (3) is not warranted to be accurate, complete or
timely. Neither Morningstar nor its content providers are responsible for any damages or losses arising from any use of
this information. The index is unmanaged and includes reinvested dividends. One cannot invest directly in an index, and
an index is not representative of the Fund’s portfolio.
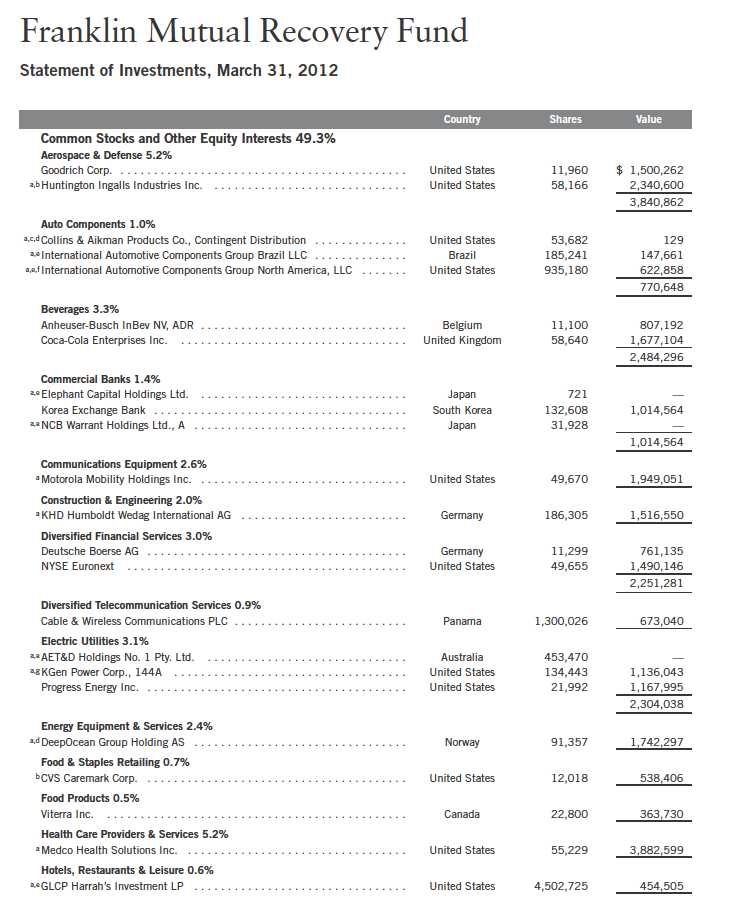
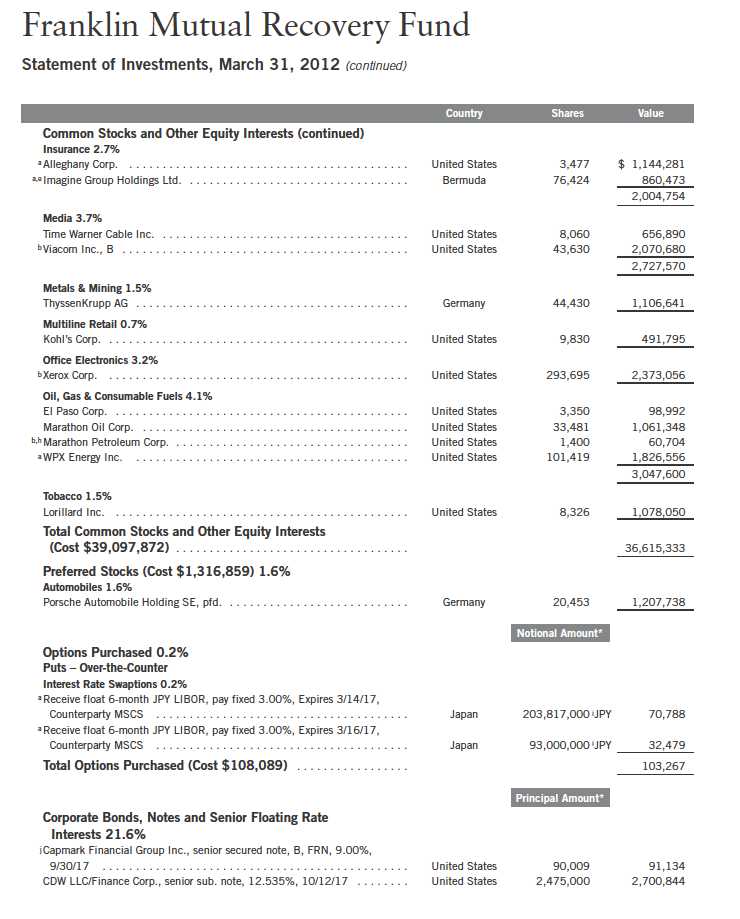
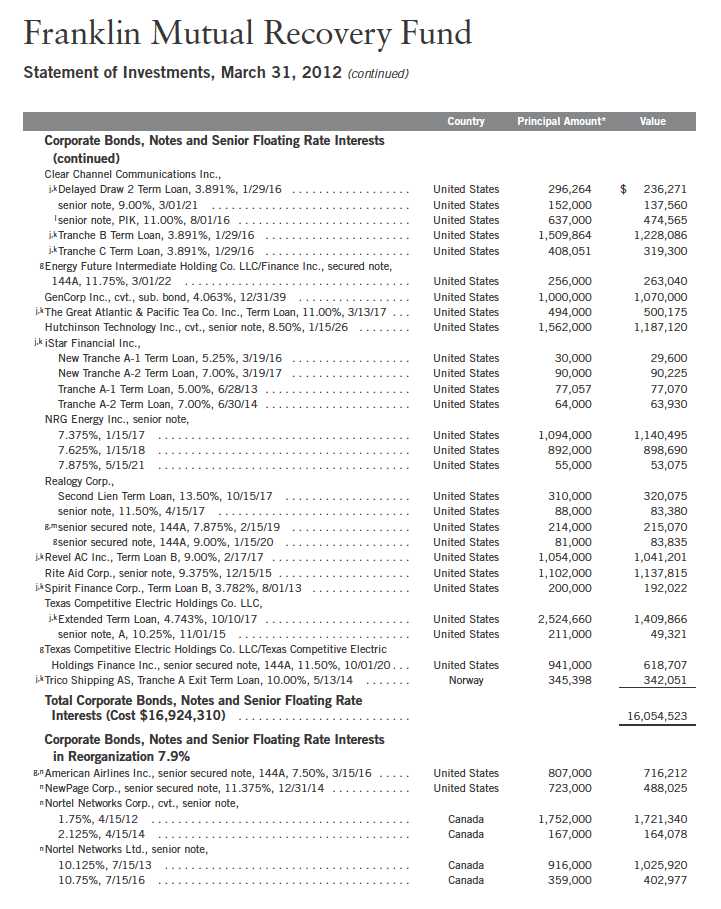
The dollar value, number of shares or principal amount, and names of all portfolio holdings are listed in the Fund’s
Statement of Investments (SOI). The SOI begins on page 24.
Annual Report | 5
underperformed the +6.24% price-only return of the Bloomberg/EFFAS U.S.
Government 3-5 Years Total Return Index, which serves as a transparent
benchmark for the U.S. government bond market.2
The performance of the Fund relative to the Bloomberg index is used as the
basis for calculating the performance adjustment to the base management fee
paid to the Fund’s adviser. (Please refer to Note 4a in the Notes to Financial
Statements for additional information related to the performance adjustment
and the base management fee.) You can find more of the Fund’s performance
data in the Performance Summary beginning on page 12.
Economic and Market Overview
The U.S. economy, as measured by gross domestic product growth, notably
improved during the 12-month period ended March 31, 2012. The national
unemployment rate for March 2012 stood at 8.2%, compared with 9.0% at
the start of the period.3 Jobless claims touched a four-year low in February,
and job creation was fairly robust. Consistent with employment trends, indus-
trial production and manufacturing activity increased toward the end of the
period. Automobile sales rose to their highest levels since February 2008, and
consumer confidence climbed to pre-recession levels. Outside of the U.S.,
Greece secured bailout financing as bondholders agreed to concessions and the
country enacted austerity measures. Although the long-term resolution of the
European debt situation remained unclear, the European Central Bank’s plan
to increase liquidity through loans was well received and seemed to improve
investor sentiment in the short term.
At the end of the reporting period, however, significant challenges to the
economy remained, including uncertainty surrounding deeply indebted
European countries, soaring gas prices amid political turmoil in the Middle
East, indications of reduced economic stimulus from the federal government,
and continued malaise in the U.S. housing market. Signs of China’s economic
growth slowdown contributed to pessimism as, despite a higher overall level
of U.S. exports, the U.S. trade deficit widened following decreases in exports
to China and the eurozone.
Amid improved economic reports, U.S. stock markets responded well and
reached multi-year highs in the first quarter of 2012. The Dow Jones
Industrial Average exceeded the 13,000 level for the first time since 2008,
and the NASDAQ Composite Index hit an 11-year high. Large cap stocks
2. Source: Bloomberg LP. Please see Notes to Financial Statements for more information about the performance-based
management fee.
3. Source: Bureau of Labor Statistics.
6 | Annual Report
led gains, while small cap stocks had a slight loss, as measured by Russell
capitalization-weighted indexes. Overall, growth stocks outperformed value,
and sectors leading the market included information technology, consumer
discretionary and consumer staples. There was wide dispersion among sector
performance, with energy, materials and financials lagging the broader mar-
ket and posting the largest negative returns.
For the one-year period ended March 31, 2012, global merger and acquisition
(M&A) activity decreased from the prior year. The decreases in the value and
number of deals were arguably due to the ongoing European sovereign debt
crisis and persistent U.S. unemployment and regulatory challenges, which
likely caused executives to exercise caution for much of the period. Although
important conditions for an increase in M&A were present during the year —
high levels of corporate cash, slow growth, and lean, efficient operating
processes — the headwinds facing the global economy appeared to stifle activ-
ity. However, we believe improving fundamentals in 2012 may counteract the
prior year’s pessimism, moving forward.
U.S. merger activity was especially robust in the health care sector during the
period, and the merger of pharmacy benefit managers Express Scripts and
Medco Health Solutions was one of the largest deals to occur during the year.
The U.S. financials sector also had significant activity, as did energy-related
industries. On a global scale, companies based in the U.K. announced a signifi-
cant number and value of deals, making their activity levels second to the U.S.
Within the distressed debt arena, new restructuring and reorganization oppor-
tunities generally remained scarce; to the extent capital was needed, many
companies were able to finance it by normal capital market activity. Into 2012,
a number of improving economic factors and a rising stock market led to a
significant volume of new, lower interest rate bond issuances, as corporate
leaders appeared wary of future rate increases. High yield spreads over
Treasuries narrowed to nearly 6% late in the period after reaching a high of
8.1% in the third quarter of 2011, making it somewhat easier for companies
with poor credit fundamentals to obtain relatively inexpensive financing.4 In
addition, U.S. corporate default rates remained well below the 25-year
average of 4.8%, making it unlikely for a high frequency of liquidations or
restructurings in the near future.4 However, we believe a case can be made that
any time there are high levels of new bonds issued — high yield or otherwise —
the potential for future distressed opportunities increases.
4. Source: Credit Suisse.
Annual Report | 7
Investment Strategy
We follow a distinctive investment approach and can seek investments in dis-
tressed companies, merger arbitrage and special situations/undervalued stocks.
The availability of investments at attractive prices in each of these categories
varies with market cycles. Therefore, the percentage of the Fund’s assets
invested in each of these areas will fluctuate as we attempt to take advantage
of opportunities afforded by cyclical changes. We employ rigorous, fundamen-
tal analysis to find investment opportunities. In choosing investments, we look
at the market price of an individual company’s securities relative to our evalua-
tion of its asset value based on such factors as book value, cash flow potential,
long-term earnings and earnings multiples. We may invest in distressed compa-
nies if we believe the market overreacted to adverse developments or failed to
appreciate positive changes.
Manager’s Discussion
During a difficult fiscal year for the Fund, several of our holdings declined in
value. Positions that detracted notably from the Fund’s performance included
common stock holdings of U.S. for-profit hospital operator Community Health
Systems and Dutch mail and logistics service provider PostNL, as well as debt of
Texas Competitive Electric, a U.S.-based integrated power company.
In April 2011, Tenet Healthcare alleged that Community Health Systems had
engaged in inappropriate patient-admissions practices and had therefore made
false statements in proxy documents related to its proposed offer to acquire
Tenet Healthcare. The lawsuit and subsequent government investigations led to
a decline in Community Health’s share price. Community Health eventually
withdrew its proposal to acquire Tenet Healthcare, but its stock price remained
under pressure in August, when Congress passed the Budget Control Act of
2011. The Act created the Joint Select Committee on Deficit Reduction (also
known as the Supercommittee) tasked with finding $1.5 trillion in deficit reduc-
tion measures. If the Supercommittee failed to agree on a package or if Congress
failed to approve the Committee’s recommendation, a so-called “trigger mecha-
nism” would result in broad cuts to federal spending, including Medicare. The
increased uncertainty regarding future reimbursement rates for hospitals
weighed on the sector’s performance. We no longer held Community Health at
period-end.
Although PostNL reported better-than-expected operating results during the
period, its stock price remained under pressure as the company’s pension fund-
ing gap widened and its stake in express delivery company TNT Express fell in
8 | Annual Report
value. Despite the stock price decline, PostNL successfully managed aspects of
financial performance that were within its control, such as the performance of
its core postal operations and cost reduction program. In February, disclosure of
United Parcel Service’s indicative offer to acquire TNT Express at a significant
premium to market value boosted TNT shares. PostNL’s shares subsequently
appreciated reflecting the increased value of its TNT stake, strong operating per-
formance and an increase in the funding of the pension scheme, and we took
advantage of this opportunity to unwind our position.
The Fund’s holding of Texas Competitive Electric debt declined during the year
as depressed natural gas prices and uncertainty over the potential impact of the
Cross-State Air Pollution Rule resulted in a challenging operating environment.
Weak volumes and pricing continued to hinder performance, while depressed
forward power curves diminished prospects for business to improve. Should
fundamentals remain weak, company management will likely need to address
the company’s highly leveraged balance sheet.
Despite these difficulties, the Fund benefited from several positions that
increased in value during the Fund’s fiscal year. Among the top performers
were our common stock holdings of tobacco company Lorillard, our merger
arbitrage position in pharmacy benefits management (PBM) companies Medco
Health Solutions (MHS) and Express Scripts, and our senior subordinated debt
interest in CDW Corporation, a leading provider of information technology (IT)
solutions and services for clients in the business, government, health care and
education industries.
During the Fund’s fiscal year, several positive developments helped boost shares
of Lorillard, the third-largest U.S. cigarette manufacturer and the country’s
oldest continuously operating tobacco company. At the company’s investor day
in May, management provided details regarding plans to grow the Newport
cigarette brand. In the same month, the board expanded the company’s share
buyback program from $1 billion to $1.4 billion. Lorillard’s stock price con-
tinued to appreciate in 2012, after reporting positive fourth quarter results
that were well above consensus estimates on many metrics. Impressive rev-
enue results were driven by increased volumes and prices, which in turn led
to improved margins. Lorillard’s board of directors approved a dividend
increase, reflecting the company’s strong 2011 performance and management’s
confidence in its ability to deliver industry-leading fundamentals in 2012.
In July, Express Scripts announced the acquisition of MHS for a mix of cash
and stock. The companies announced their expectation that the combined firm
would be materially more efficient and able to lower costs for their customers.
Annual Report | 9
The acquisition was the latest in a long line of deals in the PBM industry. Like
all large deals, the companies required regulatory approval to merge under
antitrust laws. Community pharmacy trade associations protested vigorously,
worried that further industry concentration would give PBM companies the
power to lower the compensation for filling a prescription at a pharmacy.
Skeptics of the deal included some members of Congress, who expressed con-
cerns about the deal’s potentially negative consequences. During the antitrust
review, market prices of Express Scripts and MHS shares implied a strong prob-
ability that the deal would be blocked.
However, there were also strong arguments in favor of the transaction.
Proponents cited the attractive potential benefits, and one economic study esti-
mated that the deal could potentially save employers, the federal government,
labor unions and consumers up to $87 billion annually on the cost of prescrip-
tion medications. Based on our analysis, we were confident the deal would
eventually gain Federal Trade Commission (FTC) approval, which would lead
the Fund to benefit from the significant discount in the MHS shares. The Fund
bought shares in MHS and hedged its exposure to Express Scripts by shorting
Express Scripts shares, creating a position that would realize an over 15% gain
if the deal were completed. In March, news stories indicated the FTC was
leaning toward approving the deal, leading to a significant narrowing of the
spread. On the last day of the period, the FTC approved the deal, and on the
subsequent business day the deal closed, making the merger arbitrage position
one of the Fund’s top contributors for the year.
During the year, the Fund’s investment in CDW’s 12.535% coupon bonds
maturing in 2017 positively contributed to performance. In 2007, CDW was
taken private for over $7 billion, implying an earnings before interest, taxes,
depreciation and amortization (EBITDA) multiple of approximately 11.5
times. Overall IT spending has gradually recovered to pre-crisis levels, and
through these bonds we were able to invest in CDW’s capital structure at a
compelling valuation.
10 | Annual Report
Thank you for your interest and participation in Franklin Mutual Recovery
Fund. We are Fund owners as well as the portfolio managers, and we remain
steadfast in our commitment to deliver the kind of performance we all expect
from the Fund.

Portfolio Management Team
Franklin Mutual Recovery Fund
CFA® is a trademark owned by CFA Institute.
The foregoing information reflects our analysis, opinions and portfolio holdings as of March 31, 2012, the end of the
reporting period. The way we implement our main investment strategies and the resulting portfolio holdings may
change depending on factors such as market and economic conditions. These opinions may not be relied upon as
investment advice or an offer for a particular security. The information is not a complete analysis of every aspect of
any market, country, industry, security or the Fund. Statements of fact are from sources considered reliable, but the
investment manager makes no representation or warranty as to their completeness or accuracy. Although historical
performance is no guarantee of future results, these insights may help you understand our investment management
philosophy.
Annual Report | 11
Performance Summary as of 3/31/12
Your dividend income will vary depending on dividends or interest paid by securities in the Fund’s
portfolio, adjusted for operating expenses of each class. Capital gain distributions are net profits
realized from the sale of portfolio securities. The performance table and graphs do not reflect any
taxes that a shareholder would pay on Fund dividends, capital gain distributions, if any, or any
realized gains on the sale of Fund shares. Total return reflects reinvestment of the Fund’s dividends
and capital gain distributions, if any, and any unrealized gains or losses.

12 | Annual Report
Performance Summary (continued)
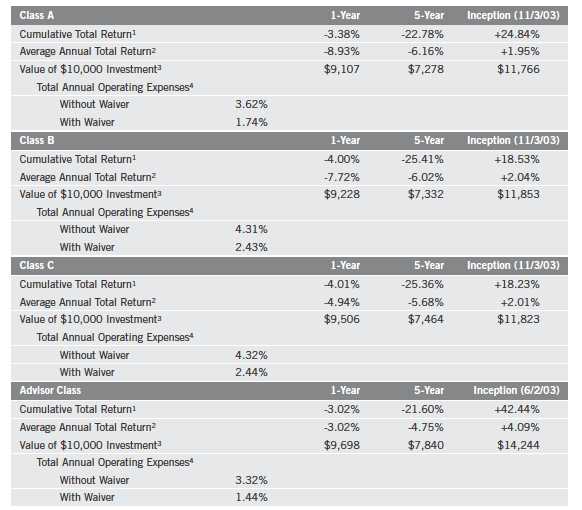
Performance
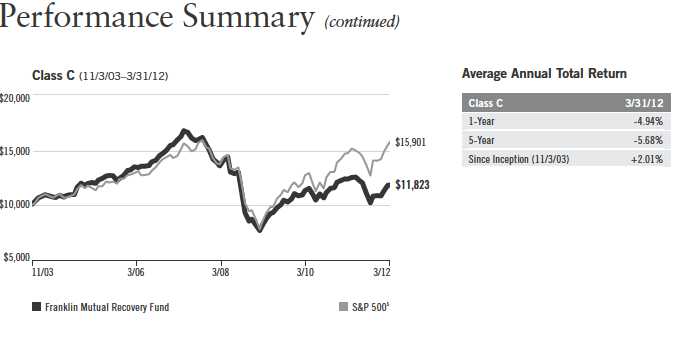
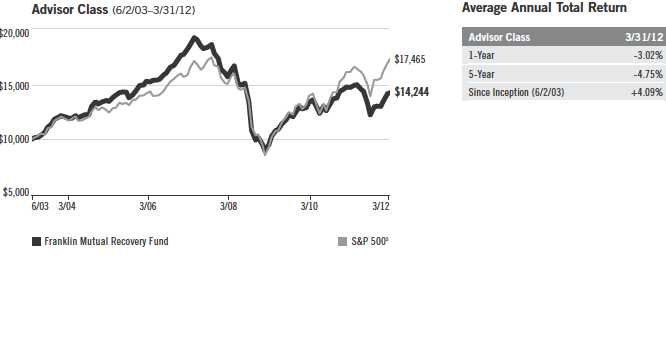
Cumulative total return excludes sales charges. Average annual total return and value of $10,000 investment include
maximum sales charges. Class A: 5.75% maximum initial sales charge; Class B: contingent deferred sales charge (CDSC)
declining from 4% to 1% over six years, and eliminated thereafter; Class C: 1% CDSC in first year only; Advisor Class: no
sales charges.
Performance data represent past performance, which does not guarantee future results. Investment return and principal
value will fluctuate, and you may have a gain or loss when you sell your shares. Current performance may differ from
figures shown. For most recent month-end performance, go to franklintempleton.com or call (800) 342-5236.
Effective 6/1/11, the investment manager contractually agreed to waive or limit its management fees so that the
management fees paid by the Fund do not exceed an annual rate of 0.50% of the Fund’s average daily net assets
through 7/31/12.
Annual Report | 13
Performance Summary (continued)
Total Return Index Comparison for a Hypothetical $10,000 Investment
Total return represents the change in value of an investment over the periods shown. It includes
any current, applicable, maximum sales charge, Fund expenses, account fees and reinvested distri-
butions. The unmanaged index includes reinvestment of any income or distributions. It differs
from the Fund in composition and does not pay management fees or expenses. One cannot invest
directly in an index.
14 | Annual Report
Annual Report | 15
Performance Summary (continued)
Endnotes
All investments involve risks, including possible loss of principal. The Fund may invest in companies engaged in mergers, reorganizations or
liquidations, which involve special risks, as pending deals may not be completed on time or on favorable terms, as well as lower rated bonds,
which entail higher credit risk. The Fund is a nondiversified fund and may experience increased susceptibility to adverse economic or regula-
tory developments affecting similar issuers or securities. The Fund may invest in foreign securities whose risks include currency fluctuations,
and economic and political uncertainties. The Fund is actively managed but there is no guarantee that the manager’s investment decisions will
produce the desired results. The Fund’s prospectus also includes a description of the main investment risks.

1. Cumulative total return represents the change in value of an investment over the periods indicated.
2. Average annual total return represents the average annual change in value of an investment over the periods indicated.
3. These figures represent the value of a hypothetical $10,000 investment in the Fund over the periods indicated.
4. Figures are as stated in the Fund’s prospectus current as of the date of this report. In periods of market volatility, assets may decline significantly,
causing total annual Fund operating expenses to become higher than the figures shown.
5. Source: © 2012 Morningstar. The S&P 500 is a market capitalization-weighted index of 500 stocks designed to measure total U.S. equity market
performance.
16 | Annual Report
Your Fund’s Expenses
As a Fund shareholder, you can incur two types of costs:
- Transaction costs, including sales charges (loads) on Fund purchases; and
- Ongoing Fund costs, including management fees, distribution and service (12b-1) fees, and other Fund expenses. All mutual funds have ongoing costs, sometimes referred to as operating expenses.
The following table shows ongoing costs of investing in the Fund and can help you understand these costs and compare them with those of other mutual funds. The table assumes a $1,000 investment held for the six months indicated.
Actual Fund Expenses
The first line (Actual) for each share class listed in the table provides actual account values and expenses. The “Ending Account Value” is derived from the Fund’s actual return, which includes the effect of Fund expenses.
You can estimate the expenses you paid during the period by following these steps. Of course, your account value and expenses will differ from those in this illustration:
| 1. | Divide your account value by $1,000. |
| | If an account had an $8,600 value, then $8,600 ÷ $1,000 = 8.6. |
| 2. | Multiply the result by the number under the heading “Expenses Paid During Period.” |
| | If Expenses Paid During Period were $7.50, then 8.6 x $7.50 = $64.50. |
In this illustration, the estimated expenses paid this period are $64.50.
Hypothetical Example for Comparison with Other Funds
Information in the second line (Hypothetical) for each class in the table can help you compare ongoing costs of investing in the Fund with those of other mutual funds. This information may not be used to estimate the actual ending account balance or expenses you paid during the period. The hypothetical “Ending Account Value” is based on the actual expense ratio for each class and an assumed 5% annual rate of return before expenses, which does not represent the Fund’s actual return. The figure under the heading “Expenses Paid During Period” shows the hypothetical expenses your account would have incurred under this scenario. You can compare this figure with the 5% hypothetical examples that appear in shareholder reports of other funds.
Annual Report | 17
Your Fund’s Expenses (continued)
Please note that expenses shown in the table are meant to highlight ongoing costs and do not reflect
any transaction costs, such as sales charges. Therefore, the second line for each class is useful in
comparing ongoing costs only, and will not help you compare total costs of owning different funds.
In addition, if transaction costs were included, your total costs would have been higher. Please refer
to the Fund prospectus for additional information on operating expenses.
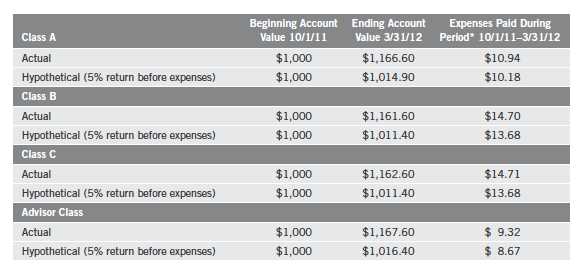
*Expenses are calculated using the most recent six-month expense ratio, net of expense waivers, annualized for each class (A: 2.02%; B: 2.72%;
C: 2.72%; and Advisor: 1.72%), multiplied by the average account value over the period, multiplied by 183/366 to reflect the one-half year period.
18 | Annual Report
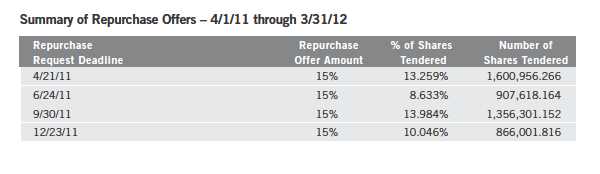
The Fund’s Repurchase Offers
The Fund will make quarterly repurchase offers for a portion of its shares. With any repurchase
offer, shareholders may elect to tender (have the Fund repurchase) all, a portion or none of their
shares. With each repurchase offer, shareholders will be notified in writing about the offer, how to
request that the Fund repurchase their shares and the deadline for submitting repurchase requests.
Each quarter the Board of Trustees will set the amount of the repurchase offer, as a percentage of
outstanding shares. This amount is known as the repurchase offer amount and will generally be
between 5% and 25% of the Fund’s outstanding shares. If repurchase requests exceed the repur-
chase offer amount, the Fund will prorate requests. The Fund may, however, first accept any
requests to repurchase all of a shareholder’s shares if the shareholder owns less than 100 shares.
The Board will also determine the date by which the Fund must receive shareholders’ repurchase
requests, which is known as the repurchase request deadline. The Board will base these decisions
on investment management considerations, market conditions, liquidity of the Fund’s assets, share-
holder servicing and administrative considerations and other factors it deems appropriate. Each
repurchase request deadline will occur within the period that begins 21 days before, and ends 21
days after, the end of the quarterly interval. The repurchase price of the shares will be the net asset
value as of the close of the NYSE on the date the Board sets as the repurchase pricing date. The
maximum number of days between the repurchase request deadline and the repurchase pricing
date is 14 days.
Annual Report | 19
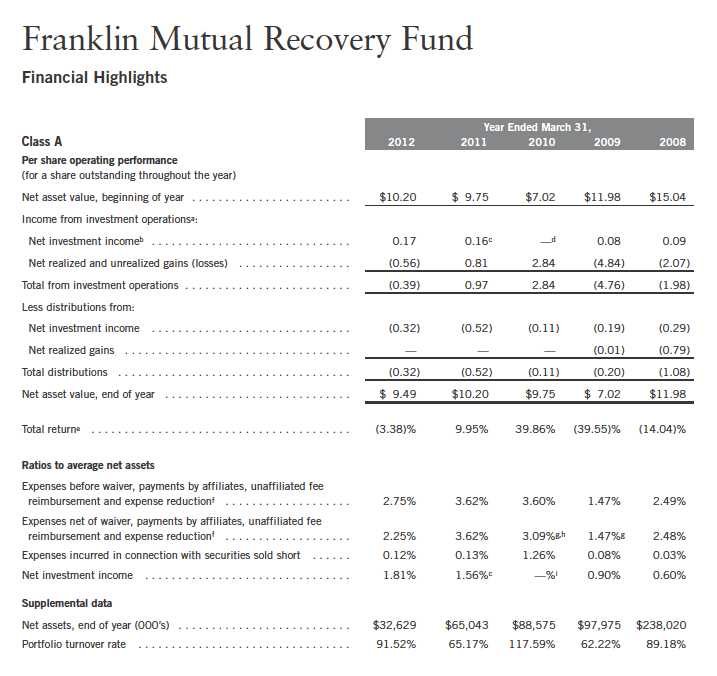
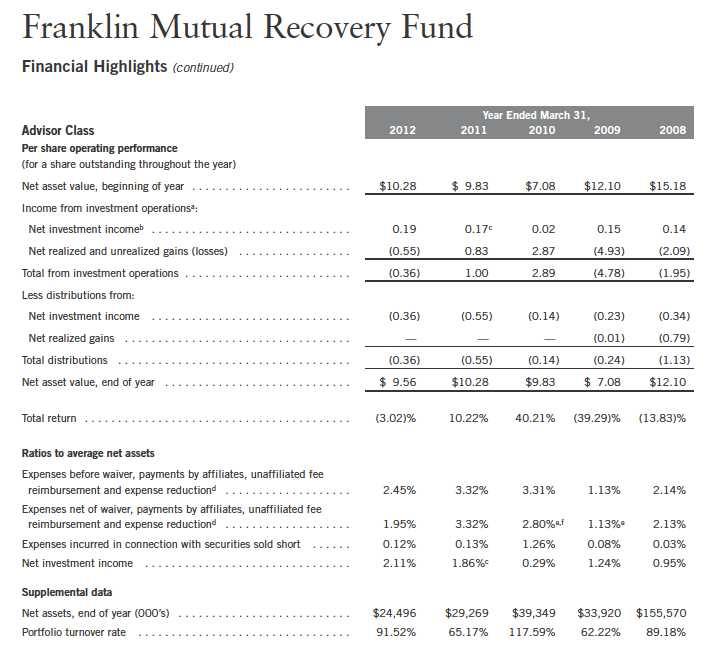
aThe amount shown for a share outstanding throughout the period may not correlate with the Statement of Operations for the period due to the timing of sales and repurchases of
the Fund shares in relation to income earned and/or fluctuating market value of the investments of the Fund.
bBased on average daily shares outstanding.
cNet investment income per share includes approximately $0.14 per share received in the form of a special dividend paid in connection with a corporate real estate investment trust
(REIT) conversion. Excluding this non-recurring amount, the ratio of net investment income to average net assets would have been 0.09%.
dAmount rounds to less than $0.01 per share.
eTotal return does not reflect sales commissions or contingent deferred sales charges, if applicable.
fIncludes dividend and interest expense on securities sold short and borrowing fees, if any. See below for the ratios of such expenses to average net assets for the periods presented.
See Note 1(e).
gBenefit of expense reduction rounds to less than 0.01%.
hIncludes a one-time unaffiliated fee reimbursement of 0.25% associated with borrowing fees.
iRounds to less than 0.01%.
20 | The accompanying notes are an integral part of these financial statements. | Annual Report
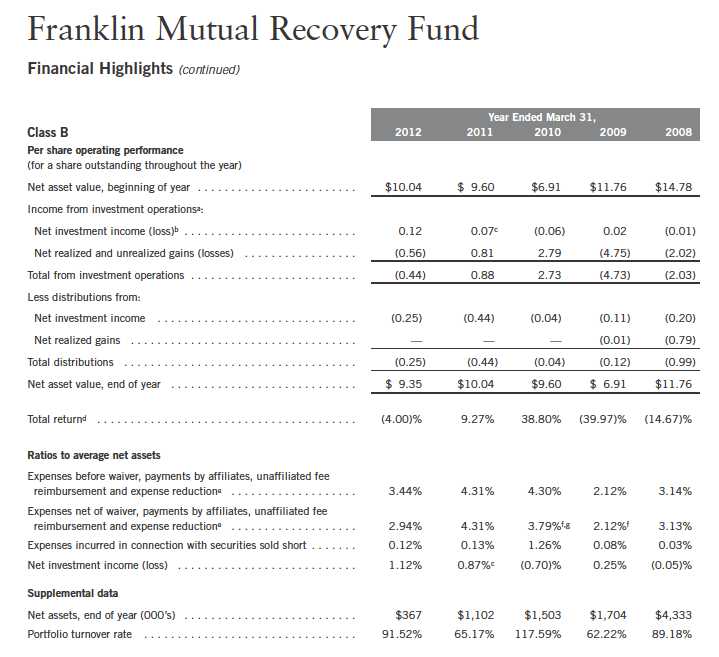
aThe amount shown for a share outstanding throughout the period may not correlate with the Statement of Operations for the period due to the timing of sales and repurchases of
the Fund shares in relation to income earned and/or fluctuating market value of the investments of the Fund.
bBased on average daily shares outstanding.
cNet investment income per share includes approximately $0.14 per share received in the form of a special dividend paid in connection with a corporate REIT conversion. Excluding
this non-recurring amount, the ratio of net investment income to average net assets would have been (0.60)%.
dTotal return does not reflect sales commissions or contingent deferred sales charges, if applicable.
eIncludes dividend and interest expense on securities sold short and borrowing fees, if any. See below for the ratios of such expenses to average net assets for the periods presented.
See Note 1(e).
fBenefit of expense reduction rounds to less than 0.01%.
gIncludes a one-time unaffiliated fee reimbursement of 0.25% associated with borrowing fees.
Annual Report | The accompanying notes are an integral part of these financial statements. | 21
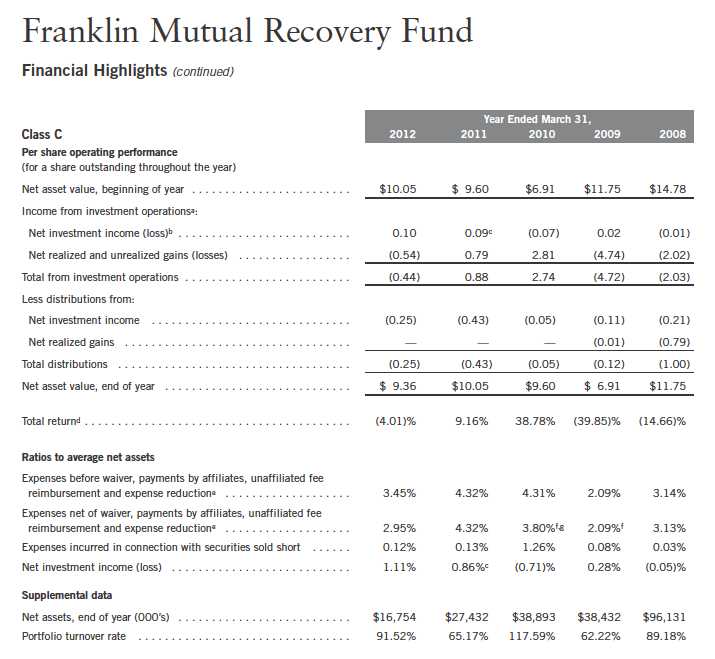
aThe amount shown for a share outstanding throughout the period may not correlate with the Statement of Operations for the period due to the timing of sales and repurchases of
the Fund shares in relation to income earned and/or fluctuating market value of the investments of the Fund.
bBased on average daily shares outstanding.
cNet investment income per share includes approximately $0.14 per share received in the form of a special dividend paid in connection with a corporate REIT conversion. Excluding
this non-recurring amount, the ratio of net investment income to average net assets would have been (0.61)%.
dTotal return does not reflect sales commissions or contingent deferred sales charges, if applicable.
eIncludes dividend and interest expense on securities sold short and borrowing fees, if any. See below for the ratios of such expenses to average net assets for the periods presented.
See Note 1(e).
fBenefit of expense reduction rounds to less than 0.01%.
gIncludes a one-time unaffiliated fee reimbursement of 0.25% associated with borrowing fees.
22 | The accompanying notes are an integral part of these financial statements. | Annual Report
aThe amount shown for a share outstanding throughout the period may not correlate with the Statement of Operations for the period due to the timing of sales and repurchases of
the Fund shares in relation to income earned and/or fluctuating market value of the investments of the Fund.
bBased on average daily shares outstanding.
cNet investment income per share includes approximately $0.14 per share received in the form of a special dividend paid in connection with a corporate REIT conversion. Excluding
this non-recurring amount, the ratio of net investment income to average net assets would have been 0.39%.
dIncludes dividend and interest expense on securities sold short and borrowing fees, if any. See below for the ratios of such expenses to average net assets for the periods presented.
See Note 1(e).
eBenefit of expense reduction rounds to less than 0.01%.
fIncludes a one-time unaffiliated fee reimbursement of 0.25% associated with borrowing fees.
Annual Report | The accompanying notes are an integral part of these financial statements. | 23
24 | Annual Report
Annual Report | 25
26 | Annual Report
Annual Report | 27
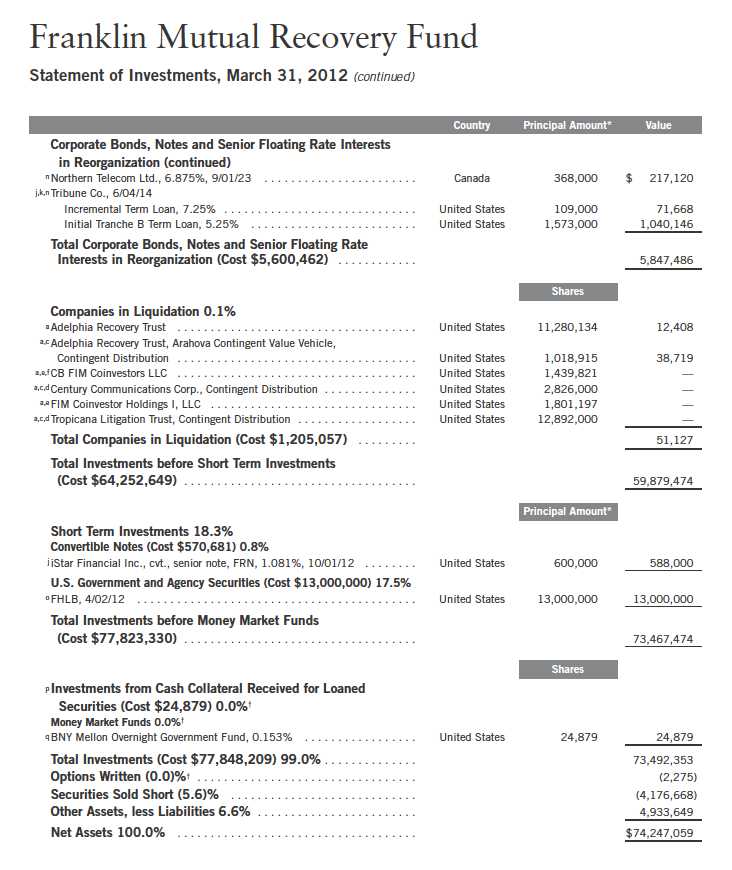
Franklin Mutual Recovery Fund
Statement of Investments, March 31, 2012 (continued)
†Rounds to less than 0.1% of net assets.
*The principal/notional amount is stated in U.S. dollars unless otherwise indicated.
aNon-income producing.
bSecurity or a portion of the security has been pledged as collateral for securities sold short and written options contracts. At March 31, 2012, the aggregate value of these
securities and/or cash pledged as collateral was $8,850,950, representing 11.92% of net assets.
cContingent distributions represent the right to receive additional distributions, if any, during the reorganization of the underlying company. Shares represent total underlying
principal of debt securities.
dSecurity has been deemed illiquid because it may not be able to be sold within seven days. At March 31, 2012, the aggregate value of these securities was $1,742,426,
representing 2.35% of net assets.
eSee Note 9 regarding restricted securities.
fAt March 31, 2012, pursuant to the Fund’s policies and the requirements of applicable securities law, the Fund may be restricted from trading these securities for a limited or
extended period of time due to ownership limits and/or potential possession of material non-public information.
gSecurity was purchased pursuant to Rule 144A under the Securities Act of 1933 and may be sold in transactions exempt from registration only to qualified institutional buyers or in
a public offering registered under the Securities Act of 1933. These securities have been deemed liquid under guidelines approved by the Fund’s Board of Trustees. At March 31,
2012, the aggregate value of these securities was $3,032,907, representing 4.08% of net assets.
hA portion or all of the security is held in connection with written option contracts open at year end.
iAmount represents notional amount under the terms of the option.
jThe coupon rate shown represents the rate at period end.
kSee Note 1(g) regarding senior floating rate interests.
lIncome may be received in additional securities and/or cash.
mA portion or all of the security is on loan at March 31, 2012. See Note 1(f).
nSee Note 8 regarding credit risk and defaulted securities.
oThe security is traded on a discount basis with no stated coupon rate.
pSee Note 1(f) regarding securities on loan.
qThe rate shown is the annualized seven-day yield at period end.
rSee Note 1(c) regarding written options.
sSee Note 1(e) regarding securities sold short.
28 | Annual Report
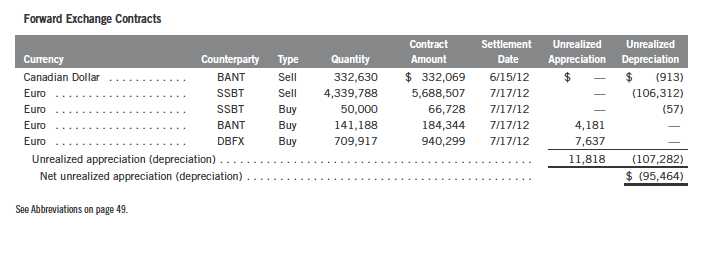
Franklin Mutual Recovery Fund
Statement of Investments, March 31, 2012 (continued)
At March 31, 2012, the Fund had the following forward exchange contracts outstanding. See Note 1(c).
Annual Report | The accompanying notes are an integral part of these financial statements. | 29
30 | The accompanying notes are an integral part of these financial statements. | Annual Report
Annual Report | The accompanying notes are an integral part of these financial statements. | 31

32 | The accompanying notes are an integral part of these financial statements. | Annual Report
Annual Report | The accompanying notes are an integral part of these financial statements. | 33
Franklin Mutual Recovery Fund
Notes to Financial Statements
1. ORGANIZATION AND SIGNIFICANT ACCOUNTING POLICIES
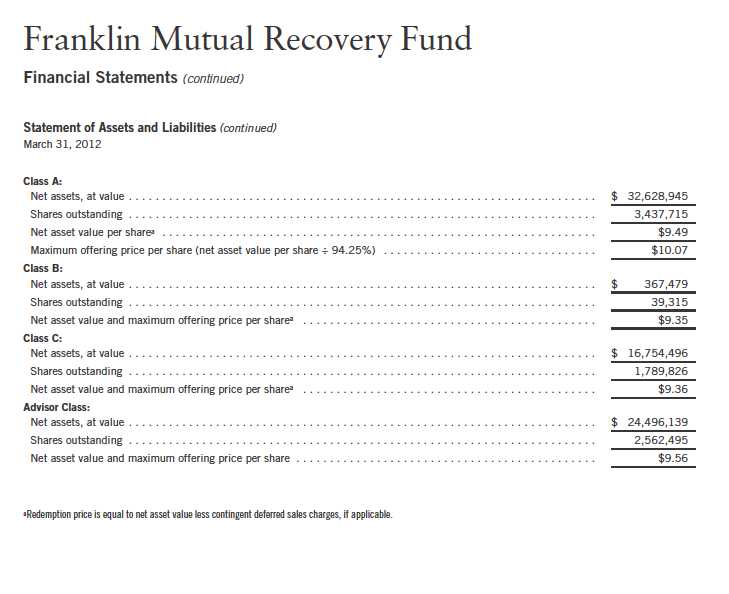
The Franklin Mutual Recovery Fund (Fund) is registered under the Investment Company Act of 1940, as amended, (1940 Act) as a closed-end, continuously offered investment company. The Fund offers four classes of shares: Class A, Class B, Class C, and Advisor Class. Each class of shares differs by its initial sales load, contingent deferred sales charges, distribution fees, voting rights on matters affecting a single class and its exchange privilege.
The following summarizes the Fund’s significant accounting policies.
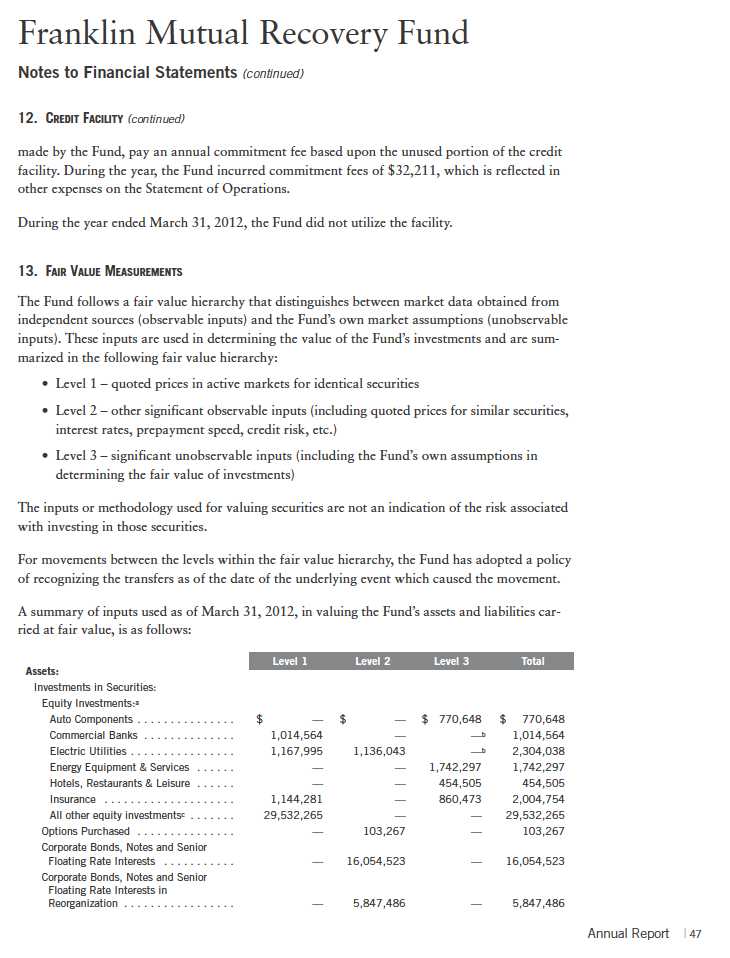
a. Financial Instrument Valuation
The Fund’s investments in securities and other financial instruments are carried at fair value daily. Fair value is the price that would be received to sell an asset or paid to transfer a liability in an orderly transaction between market participants on the measurement date. Under procedures approved by the Fund’s Board of Trustees (the Board), the Fund’s administrator, investment manager and other affiliates have formed the Valuation and Liquidity Oversight Committee (VLOC). The VLOC provides administration and oversight of the Fund’s valuation policies and procedures, which are approved annually by the Board. Among other things, these procedures allow the Fund to utilize independent pricing services, quotations from securities and financial instrument dealers, and other market sources to determine fair value.
Equity securities and derivative financial instruments (derivatives) listed on an exchange or on the NASDAQ National Market System are valued at the last quoted sale price or the official closing price of the day, respectively. Foreign equity securities are valued as of the close of trading on the foreign stock exchange on which the security is primarily traded, or the NYSE, whichever is earlier. The value is then converted into its U.S. dollar equivalent at the foreign exchange rate in effect at the close of the NYSE on the day that the value of the security is determined. Over-the-counter securities are valued within the range of the most recent quoted bid and ask prices. Securities that trade in multiple markets or on multiple exchanges are valued according to the broadest and most representative market. Certain equity securities are valued based upon fundamental characteristics or relationships to similar securities. Investments in non-registered money market funds are valued at the closing net asset value.
Debt securities generally trade in the over-the-counter market rather than on a securities exchange. The Fund’s pricing services use multiple valuation techniques to determine fair value. In instances where sufficient market activity exists, the pricing services may utilize a market-based approach through which quotes from market makers are used to determine fair value. In instances where sufficient market activity may not exist or is limited, the pricing services also utilize proprietary valuation models which may consider market characteristics such as benchmark yield curves, credit spreads, estimated default rates, anticipated market interest rate volatility, coupon rates, anticipated timing of principal repayments, underlying collateral, and other unique security features in order to estimate the relevant cash flows, which are then discounted to calculate the fair value.
34 | Annual Report
Franklin Mutual Recovery Fund
Notes to Financial Statements (continued)
| 1. | ORGANIZATION AND SIGNIFICANT ACCOUNTING POLICIES (continued) |
| a. | Financial Instrument Valuation (continued) |
Securities denominated in a foreign currency are converted into their U.S. dollar equivalent at the foreign exchange rate in effect at the close of the NYSE on the date that the values of the foreign debt securities are determined.
Certain derivatives trade in the over-the-counter market. The Fund’s pricing services use various techniques including industry standard option pricing models and proprietary discounted cash flow models to determine the fair value of those instruments. The Fund’s net benefit or obligation under the derivative contract, as measured by the fair market value of the contract, is included in net assets.
The Fund has procedures to determine the fair value of securities and other financial instruments for which market prices are not reliable or readily available. Under these procedures, the VLOC convenes on a regular basis to review such securities and considers a number of factors, including significant unobservable valuation inputs when arriving at fair value. The VLOC primarily employs a market-based approach which may use related or comparable assets or liabilities, recent transactions, market multiples, book values, and other relevant information for the investment to determine the fair value of the investment. An income-based valuation approach may also be used in which the anticipated future cash flows of the investment are discounted to calculate fair value. Discounts may also be applied due to the nature or duration of any restrictions on the disposition of the investments. Due to the inherent uncertainty of valuations of such investments, the fair values may differ significantly from the values that would have been used had an active market existed. The VLOC employs various methods for calibrating these valuation approaches including a regular review of key inputs and assumptions, transactional back-testing or disposition analysis, and reviews of any related market activity.
Trading in securities on foreign securities stock exchanges and over-the-counter markets may be completed before the daily close of business on the NYSE. Occasionally, events occur between the time at which trading in a foreign security is completed and the close of the NYSE that might call into question the reliability of the value of a portfolio security held by the Fund. As a result, differences may arise between the value of the Fund’s portfolio securities as determined at the foreign market close and the latest indications of value at the close of the NYSE. In order to minimize the potential for these differences, the VLOC monitors price movements following the close of trading in foreign stock markets through a series of country specific market proxies (such as baskets of American Depositary Receipts, futures contracts and exchange traded funds). These price movements are measured against established trigger thresholds for each specific market proxy to assist in determining if an event has occurred that may call into question the reliability of the values of the foreign securities held by the Fund. If such an event occurs, the securities may be valued using fair value procedures, which may include the use of independent pricing services.
Annual Report | 35
Franklin Mutual Recovery Fund
Notes to Financial Statements (continued)
| 1. | ORGANIZATION AND SIGNIFICANT ACCOUNTING POLICIES (continued) |
| b. | Foreign Currency Translation |
Portfolio securities and other assets and liabilities denominated in foreign currencies are translated into U.S. dollars based on the exchange rate of such currencies against U.S. dollars on the date of valuation. The Fund may enter into foreign currency exchange contracts to facilitate transactions denominated in a foreign currency. Purchases and sales of securities, income and expense items denominated in foreign currencies are translated into U.S. dollars at the exchange rate in effect on the transaction date. Portfolio securities and assets and liabilities denominated in foreign currencies contain risks that those currencies will decline in value relative to the U.S. dollar. Occasionally, events may impact the availability or reliability of foreign exchange rates used to convert the U.S. dollar equivalent value. If such an event occurs, the foreign exchange rate will be valued at fair value using procedures established and approved by the Board.
The Fund does not separately report the effect of changes in foreign exchange rates from changes in market prices on securities held. Such changes are included in net realized and unrealized gain or loss from investments on the Statement of Operations.
Realized foreign exchange gains or losses arise from sales of foreign currencies, currency gains or losses realized between the trade and settlement dates on securities transactions and the difference between the recorded amounts of dividends, interest, and foreign withholding taxes and the U.S. dollar equivalent of the amounts actually received or paid. Net unrealized foreign exchange gains and losses arise from changes in foreign exchange rates on foreign denominated assets and liabilities other than investments in securities held at the end of the reporting period.
c. Derivative Financial Instruments
The Fund invested in derivatives in order to manage risk or gain exposure to various other investments or markets. Derivatives are financial contracts based on an underlying or notional amount, require no initial investment or an initial net investment that is smaller than would normally be required to have a similar response to changes in market factors, and require or permit net settlement. Derivatives contain various risks including the potential inability of the counterparty to fulfill their obligations under the terms of the contract, the potential for an illiquid secondary market, and/or the potential for market movements which expose the Fund to gains or losses in excess of the amounts shown on the Statement of Assets and Liabilities. Realized gain and loss and unrealized appreciation and depreciation on these contracts for the period are included in the Statement of Operations.
The Fund entered into forward exchange contracts primarily to manage exposure to certain foreign currencies. A forward exchange contract is an agreement between the Fund and a counterparty to buy or sell a foreign currency for a specific exchange rate on a future date. Pursuant to the terms of the forward exchange contracts, cash or securities may be required to be deposited as collateral. Unrestricted cash may be invested according to the Fund’s investment objectives.
36 | Annual Report
Franklin Mutual Recovery Fund
Notes to Financial Statements (continued)
| 1. | ORGANIZATION AND SIGNIFICANT ACCOUNTING POLICIES (continued) |
| c. | Derivative Financial Instruments (continued) |
The Fund purchased or wrote option contracts primarily to manage and/or gain exposure to equity price and interest rate risk. An option is a contract entitling the holder to purchase or sell a specific amount of shares or units of an asset or notional amount of a swap (swaption), at a specified price. Options purchased are recorded as an asset while options written are recorded as a liability. Upon exercise of an option, the acquisition cost or sales proceeds of the underlying investment is adjusted by any premium received or paid. Upon expiration of an option, any premium received or paid is recorded as a realized gain or loss. Upon closing an option other than through expiration or exercise, the difference between the premium and the cost to close the position is recorded as a realized gain or loss. Pursuant to the terms of the written option contract, cash or securities may be required to be deposited as collateral.
See Notes 7 and 11 regarding investment transactions and other derivative information, respectively.
d. Restricted Cash
At March 31, 2012, the Fund held restricted cash in connection with investments in certain derivative securities. Restricted cash is held in a segregated account with the Fund’s custodian/ counterparty broker and is reflected in the Statement of Assets and Liabilities.
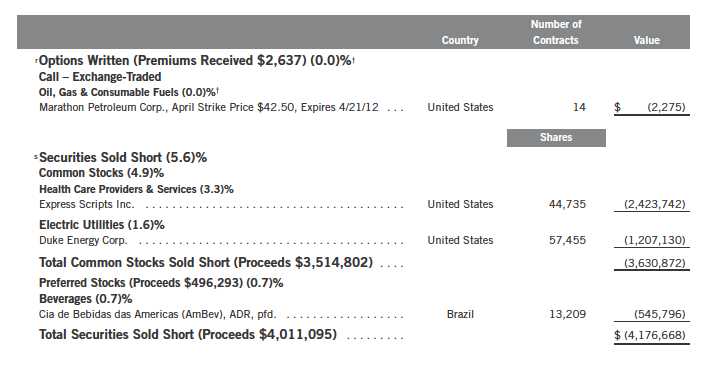
e. Securities Sold Short
The Fund is engaged in selling securities short, which obligates the Fund to replace a borrowed security with the same security at current market value. The Fund incurs a loss if the price of the security increases between the date of the short sale and the date on which the Fund replaces the borrowed security. The Fund realizes a gain if the price of the security declines between those dates. Gains are limited to the price at which the Fund sold the security short, while losses are potentially unlimited in size.
The Fund is required to establish a margin account with the broker lending the security sold short. While the short sale is outstanding, the broker retains the proceeds of the short sale and the Fund must maintain a deposit with the broker consisting of cash and/or securities having a value equal to a specified percentage of the value of the securities sold short. The Fund is obligated to pay fees for borrowing the securities sold short and is required to pay the counterparty any dividends or interest due on securities sold short. Such dividends or interest and any security borrowing fees are recorded as an expense to the Fund.
f. Securities Lending
The Fund participates in an agency based securities lending program. The Fund receives cash collateral against the loaned securities in an amount equal to at least 102% of the market value of the loaned securities. Collateral is maintained over the life of the loan in an amount not less than 100% of the market value of loaned securities, as determined at the close of Fund business
Annual Report | 37
Franklin Mutual Recovery Fund
Notes to Financial Statements (continued)
| 1. | ORGANIZATION AND SIGNIFICANT ACCOUNTING POLICIES (continued) |
| f. | Securities Lending (continued) |
each day; any additional collateral required due to changes in security values is delivered to the Fund on the next business day. The collateral is invested in a non-registered money fund as indicated on the Statement of Investments. The Fund receives income from the investment of cash collateral, in addition to lending fees and rebates paid by the borrower. The Fund bears the market risk with respect to the collateral investment, securities loaned, and the risk that the agent may default on its obligations to the Fund. The securities lending agent has agreed to indemnify the Fund in the event of default by a third party borrower.
g. Senior Floating Rate Interests
The Fund invests in senior secured corporate loans that pay interest at rates which are periodically reset by reference to a base lending rate plus a spread. These base lending rates are generally the prime rate offered by a designated U.S. bank or the London InterBank Offered Rate (LIBOR). Senior secured corporate loans often require prepayment of principal from excess cash flows or at the discretion of the borrower. As a result, actual maturity may be substantially less than the stated maturity.
Senior secured corporate loans in which the Fund invests are generally readily marketable, but may be subject to some restrictions on resale.
h. Income and Deferred Taxes
It is the Fund’s policy to qualify as a regulated investment company under the Internal Revenue Code. The Fund intends to distribute to shareholders substantially all of its taxable income and net realized gains to relieve it from federal income and excise taxes. As a result, no provision for U.S. federal income taxes is required.
The Fund may be subject to foreign taxation related to income received, capital gains on the sale of securities and certain foreign currency transactions in the foreign jurisdictions in which it invests. Foreign taxes, if any, are recorded based on the tax regulations and rates that exist in the foreign markets in which the Fund invests. When a capital gain tax is determined to apply the Fund records an estimated deferred tax liability in an amount that would be payable if the securities were disposed of on the valuation date.
The Fund recognizes the tax benefits of uncertain tax positions only when the position is “more likely than not” to be sustained upon examination by the tax authorities based on the technical merits of the tax position. As of March 31, 2012, and for all open tax years, the Fund has determined that no liability for unrecognized tax benefits is required in the Fund’s financial statements related to uncertain tax positions taken on a tax return (or expected to be taken on future tax returns). Open tax years are those that remain subject to examination and are based on each tax jurisdiction statute of limitation.
38 | Annual Report
Franklin Mutual Recovery Fund
Notes to Financial Statements (continued)
| 1. | ORGANIZATION AND SIGNIFICANT ACCOUNTING POLICIES (continued) |
| i. | Security Transactions, Investment Income, Expenses and Distributions |
Security transactions are accounted for on trade date. Realized gains and losses on security transactions are determined on a specific identification basis. Interest income and estimated expenses are accrued daily. Amortization of premium and accretion of discount on debt securities are included in interest income. Dividend income and dividends declared on securities sold short are recorded on the ex-dividend date except that certain dividends from foreign securities are recognized as soon as the Fund is notified of the ex-dividend date. Distributions to shareholders are recorded on the ex-dividend date and are determined according to income tax regulations (tax basis). Distributable earnings determined on a tax basis may differ from earnings recorded in accordance with accounting principles generally accepted in the United States of America. These differences may be permanent or temporary. Permanent differences are reclassified among capital accounts to reflect their tax character. These reclassifications have no impact on net assets or the results of operations. Temporary differences are not reclassified, as they may reverse in subsequent periods.
Realized and unrealized gains and losses and net investment income, not including class specific expenses, are allocated daily to each class of shares based upon the relative proportion of net assets of each class. Differences in per share distributions, by class, are generally due to differences in class specific expenses.
j. Accounting Estimates
The preparation of financial statements in accordance with accounting principles generally accepted in the United States of America requires management to make estimates and assumptions that affect the reported amounts of assets and liabilities at the date of the financial statements and the amounts of income and expenses during the reporting period. Actual results could differ from those estimates.
k. Guarantees and Indemnifications
Under the Fund’s organizational documents, its officers and trustees are indemnified by the Fund against certain liabilities arising out of the performance of their duties to the Fund. Additionally, in the normal course of business, the Fund enters into contracts with service providers that contain general indemnification clauses. The Fund’s maximum exposure under these arrangements is unknown as this would involve future claims that may be made against the Fund that have not yet occurred. Currently, the Fund expects the risk of loss to be remote.
Annual Report | 39
Franklin Mutual Recovery Fund
Notes to Financial Statements (continued)
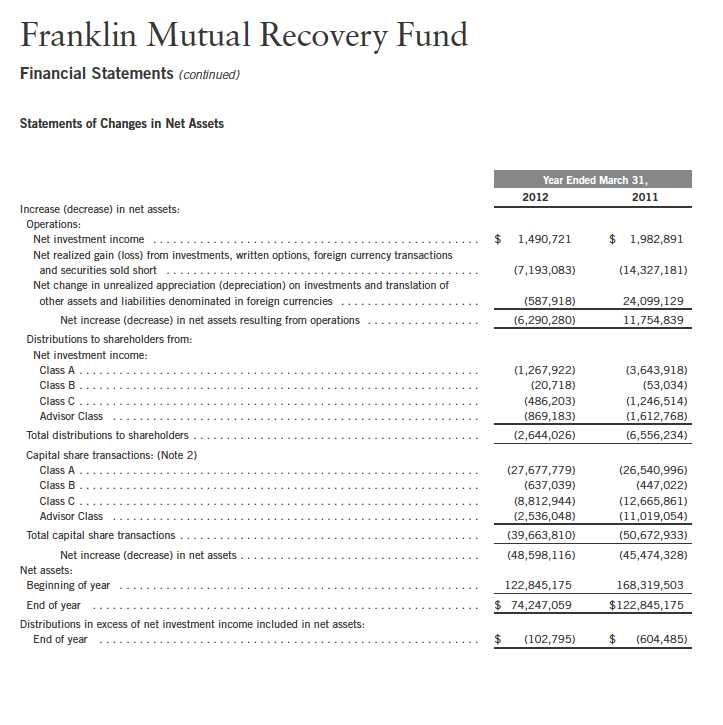
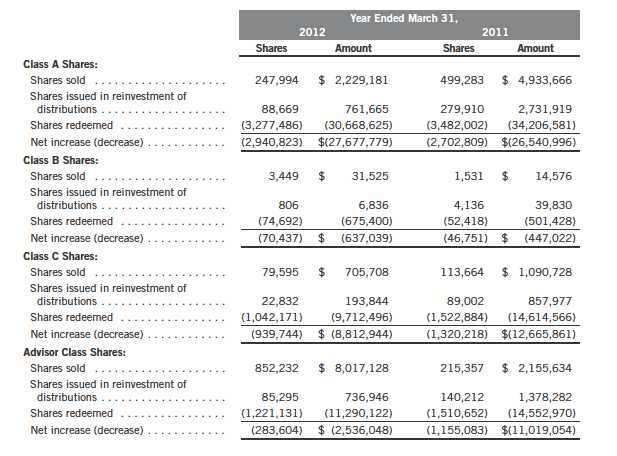
2. SHARES OF BENEFICIAL INTEREST
At March 31, 2012, there were an unlimited number of shares authorized ($0.01 par value).
Transactions in the Fund’s shares were as follows:
3. TENDER SHARES
On a quarterly basis, the Fund may make tender offers, the amount of which is determined by
the Board, for the repurchase of at least 5% but not more than 25% of the shares outstanding.
The repurchase price is the net asset value on the repurchase pricing date.
40 | Annual Report
Franklin Mutual Recovery Fund
Notes to Financial Statements (continued)
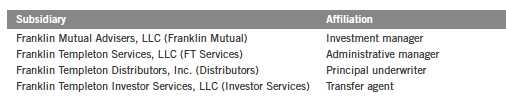
4. TRANSACTIONS WITH AFFILIATES
Franklin Resources, Inc. is the holding company for various subsidiaries that together are referred
to as Franklin Templeton Investments. Certain officers and trustees of the Fund are also officers,
and/or directors of the following subsidiaries:
a. Management Fees
The Fund pays Franklin Mutual an investment management fee comprised of a “base fee” and a
“performance adjustment”. The base fee is calculated at the beginning of each month using an
annual rate of 1.50% of the prior month’s average daily net assets. The performance adjustment
is calculated at the beginning of each month based on how much the Fund’s total return exceeded
or lagged its performance fee index, the Bloomberg/EFFAS U.S. Government 3-5 Years Total Return
Index (Fund performance differential), over the preceding twelve-month period (performance
period). A performance adjustment is applicable if the Fund performance differential exceeds
1.00%, either upwards (an increase to the base fee) or downwards (a decrease to the base fee).
The performance adjustment rate is equal to 0.01% for each additional 0.05% that the Fund
performance differential exceeds 1.00%. The performance adjustment amount is determined by
multiplying the performance adjustment rate by the average daily net assets of the performance
period. The performance adjustment rate may not exceed 1.00% annualized, either upwards or
downwards. At the end of each month, an annualized investment management fee ratio is calcu-
lated (total investment management fees divided by fiscal year to date average daily net assets).
In accordance with the Investment Management Agreement, the investment management fee
ratio may not exceed 2.50% or fall below 0.50% for the fiscal year. For the period, the total
annualized management fee rate, including the performance adjustment, and prior to any
expense waiver, was 1.43% of the average daily net assets of the Fund.
Effective June 1, 2011, Franklin Mutual has contractually agreed to waive or limit its fees so that
the management fees paid by the Fund do not exceed an annual rate of 0.50% of the Fund’s
average daily net assets through July 31, 2012.
Annual Report | 41
Franklin Mutual Recovery Fund
Notes to Financial Statements (continued)
| 4. | TRANSACTIONS WITH AFFILIATES (continued) |
| b. | Administrative Fees |
The Fund pays an administrative fee to FT Services of 0.20% per year of the average daily net
assets of the Fund.
c. Distribution Fees
The Board has adopted distribution plans for each share class, with the exception of Advisor
Class shares, pursuant to Rule 12b-1 under the 1940 Act. Under the Fund’s Class A reimburse-
ment distribution plan, the Fund reimburses Distributors for costs incurred in connection with
the servicing, sale and distribution of the Fund’s shares up to the maximum annual plan rate. Under
the Class A reimbursement distribution plan, costs exceeding the maximum for the current plan
year cannot be reimbursed in subsequent periods.
In addition, under the Fund’s Class B and C compensation distribution plans, the Fund pays
Distributors for costs incurred in connection with the servicing, sale and distribution of the Fund’s
shares up to the maximum annual plan rate for each class.
The maximum annual plan rates, based on the average daily net assets, for each class, are as follows:
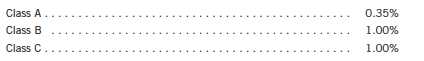
The Board has set the current rate at 0.30% per year for Class A shares until further notice and
approval by the Board.
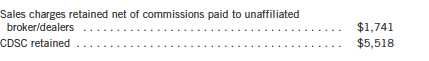
d. Sales Charges/Underwriting Agreements
Front-end sales charges and contingent deferred sales charges (CDSC) do not represent expenses
of the Fund. These charges are deducted from the proceeds of sales of Fund shares prior to
investment or from redemption proceeds prior to remittance, as applicable. Distributors has
advised the Fund of the following commission transactions related to the sales and redemptions
of the Fund’s shares for the year:
e. Transfer Agent Fees
For the year ended March 31, 2012, the Fund paid transfer agent fees of $115,777, of which
$58,477 was retained by Investor Services.
42 | Annual Report
Franklin Mutual Recovery Fund
Notes to Financial Statements (continued)
5. EXPENSE OFFSET ARRANGEMENT
The Fund has entered into an arrangement with its custodian whereby credits realized as a result
of uninvested cash balances are used to reduce a portion of the Fund’s custodian expenses. During
the year ended March 31, 2012, there were no credits earned.
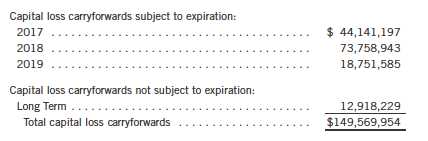
6. INCOME TAXES
For tax purposes, capital losses may be carried over to offset future capital gains, if any. Under
the Regulated Investment Company Modernization Act of 2010, capital losses incurred by the
Fund in taxable years beginning after December 22, 2010 are not subject to expiration and such
losses retain their character as either short-term or long-term, rather than being considered
short-term as under previous law. Post-enactment capital losses must be fully utilized prior to
utilizing any losses incurred in pre-enactment tax years.
At March 31, 2012, capital loss carryforwards were as follows:
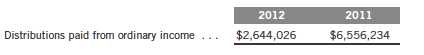
The tax character of distributions paid during the years ended March 31, 2012 and 2011, was
as follows:
At March 31, 2012, the cost of investments, net unrealized appreciation (depreciation), and
undistributed ordinary income for income tax purposes were as follows:
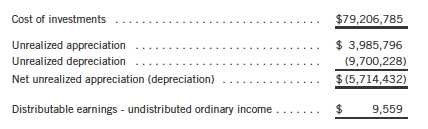
Differences between income and/or capital gains as determined on a book basis and a tax basis
are primarily due to differing treatments of passive foreign investment company shares, recogni-
tion of partnership income, corporate actions, and defaulted securities.
Annual Report | 43
Franklin Mutual Recovery Fund
Notes to Financial Statements (continued)
7. INVESTMENT TRANSACTIONS
Purchases and sales of investments (excluding short term securities and securities sold short) for
the year ended March 31, 2012, aggregated $72,655,443 and $110,490,336, respectively.
Transactions in options written during the year ended March 31, 2012, were as follows:
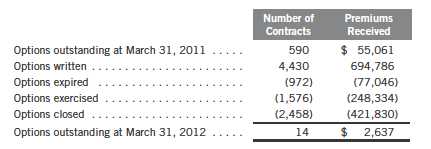
See Notes 1(c) and 11 regarding derivative financial instruments and other derivative informa-
tion, respectively.
8. CREDIT RISK AND DEFAULTED SECURITIES
The Fund may purchase the pre-default or defaulted debt of distressed companies. Distressed com-
panies are financially troubled and are about to be or are already involved in financial restructuring
or bankruptcy. Risks associated with purchasing these securities include the possibility that the
bankruptcy or other restructuring process takes longer than expected, or that distributions in
restructuring are less than anticipated, either or both of which may result in unfavorable conse-
quences to the Fund. If it becomes probable that the income on debt securities, including those
of distressed companies, will not be collected, the Fund discontinues accruing income and recog-
nizes an adjustment for uncollectible interest.
At March 31, 2012, the aggregate value of distressed company securities for which interest recog-
nition has been discontinued was $5,847,486, representing 7.88% of the Fund’s net assets. For
information as to specific securities, see the accompanying Statement of Investments.
9. RESTRICTED SECURITIES
The Fund invests in securities that are restricted under the Securities Act of 1933 (1933 Act) or
which are subject to legal, contractual, or other agreed upon restrictions on resale. Restricted
securities are often purchased in private placement transactions, and cannot be sold without prior
registration unless the sale is pursuant to an exemption under the 1933 Act. Disposal of these
securities may require greater effort and expense, and prompt sale at an acceptable price may
be difficult. The Fund may have registration rights for restricted securities. The issuer generally
incurs all registration costs.
44 | Annual Report
Franklin Mutual Recovery Fund
Notes to Financial Statements (continued)
9. RESTRICTED SECURITIES (continued)
At March 31, 2012, the Fund held investments in restricted securities, excluding certain securities
exempt from registration under the 1933 Act deemed to be liquid, as follows:

10. UNFUNDED LOAN COMMITMENTS
The Fund enters into certain credit agreements, all or a portion of which may be unfunded. The
Fund is obligated to fund these loan commitments at the borrowers’ discretion. Funded portions
of credit agreements are presented on the Statement of Investments.
At March 31, 2012, unfunded commitments were as follows:
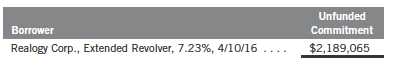
Unfunded loan commitments and funded portions of credit agreements are marked to market
daily and any unrealized appreciation or depreciation is included in the Statement of Assets and
Liabilities and the Statement of Operations.
Annual Report | 45

Franklin Mutual Recovery Fund
Notes to Financial Statements (continued)
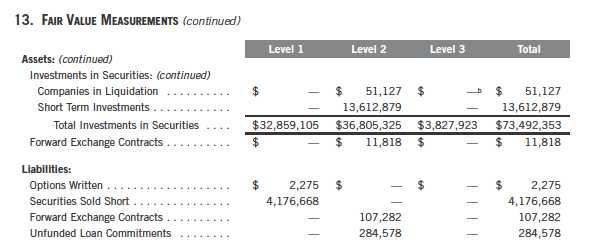
aIncludes common and preferred stocks as well as other equity investments.
bIncludes securities determined to have no value at March 31, 2012.
cFor detailed categories, see the accompanying Statement of Investments.
At March 31, 2012, the reconciliation of assets in which significant unobservable inputs (Level 3) were used in determining fair value, is as follows:
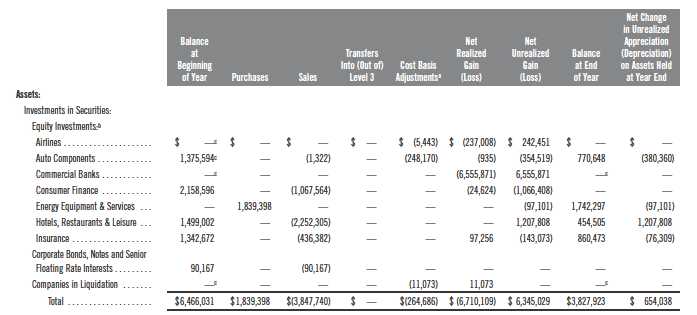
aMay include accretion, amortization, partnership adjustments, and/or other cost basis adjustments.
bIncludes common stocks as well as other equity investments.
cIncludes securities determined to have no value.
48 | Annual Report
Franklin Mutual Recovery Fund
Notes to Financial Statements (continued)
14. NEW ACCOUNTING PRONOUNCEMENTS
In May 2011, the Financial Accounting Standards Board (FASB) issued Accounting Standards
Update (ASU) No. 2011-04, Fair Value Measurement (Topic 820): Amendments to Achieve
Common Fair Value Measurement and Disclosure Requirements in U.S. GAAP and IFRSs. The
amendments in the ASU will improve the comparability of fair value measurements presented and
disclosed in financial statements prepared in accordance with U.S. GAAP (Generally Accepted
Accounting Principles) and IFRS (International Financial Reporting Standards) and include new
guidance for certain fair value measurement principles and disclosure requirements. The ASU is
effective for interim and annual periods beginning after December 15, 2011. The Fund believes
the adoption of this ASU will not have a material impact on its financial statements.
In December 2011, FASB issued ASU No. 2011-11, Balance Sheet (Topic 210): Disclosures
about Offsetting Assets and Liabilities. The amendments in the ASU enhance disclosures about
offsetting of financial assets and liabilities to enable investors to understand the effect of these
arrangements on a Fund’s financial position. The ASU is effective for interim and annual report-
ing periods beginning on or after January 1, 2013. The Fund believes the adoption of this ASU
will not have a material impact on its financial statements.
15. SUBSEQUENT EVENTS
The Fund has evaluated subsequent events through the issuance of the financial statements and
determined that no events have occurred that require disclosure.
Annual Report | 49
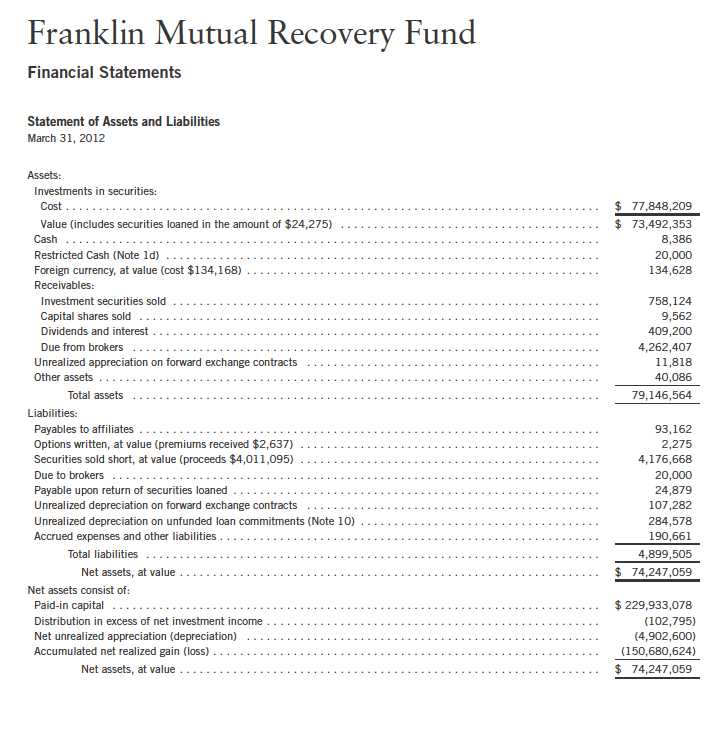
Franklin Mutual Recovery Fund
Report of Independent Registered Public Accounting Firm
To the Board of Trustees and Shareholders of Franklin Mutual Recovery Fund:
We have audited the accompanying statement of assets and liabilities of the Franklin Mutual
Recovery Fund (the “Fund”), including the statement of investments, as of March 31, 2012,
and the related statement of operations for the year then ended, the statements of changes in net
assets for each of the two years in the period then ended, and the financial highlights for each of
the five years in the period then ended. These financial statements and financial highlights are the
responsibility of the Fund’s management. Our responsibility is to express an opinion on these
financial statements and financial highlights based on our audits.
We conducted our audit in accordance with the standards of the Public Company Accounting
Oversight Board (United States). Those standards require that we plan and perform the audit to
obtain reasonable assurance about whether the financial statements and financial highlights are
free of material misstatement. We were not engaged to perform an audit of the Fund’s internal
control over financial reporting. Our audit included consideration of internal control over financial
reporting as a basis for designing audit procedures that are appropriate in the circumstances, but
not for the purpose of expressing an opinion on the effectiveness of the Fund’s internal control
over financial reporting. Accordingly, we express no such opinion. An audit also includes
examining, on a test basis, evidence supporting the amounts and disclosures in the financial
statements and financial highlights, assessing the accounting principles used and significant
estimates made by management, and evaluating the overall financial statement presentation. Our
procedures included confirmation of securities owned as of March 31, 2012, by correspondence
with the custodian and brokers. We believe that our audit provides a reasonable basis for our
opinion.
In our opinion, the financial statements and financial highlights referred to above present fairly,
in all material respects, the financial position of Franklin Mutual Recovery Fund at March 31,
2012, the results of its operations for the year then ended, the changes in its net assets for each of
the two years in the period then ended, and the financial highlights for each of the five years in
the period then ended, in conformity with U.S. generally accepted accounting principles.

Boston, Massachusetts
May 18, 2012
50 | Annual Report
Franklin Mutual Recovery Fund
Tax Information (unaudited)
Under Section 854(b)(1)(A) of the Internal Revenue Code (Code), the Fund hereby reports 17.82% of the ordinary income dividends as income qualifying for the dividends received deduction for the fiscal year ended March 31, 2012.
Under Section 854(b)(1)(B) of the Code, the Fund hereby reports the maximum amount allowable but no less than $2,593,542 as qualified dividends for purposes of the maximum rate under Section 1(h)(11) of the Code for the fiscal year ended March 31, 2012. Distributions, including qualified dividend income, paid during calendar year 2012 will be reported to shareholders on Form 1099-DIV by mid-February 2013. Shareholders are advised to check with their tax advisors for information on the treatment of these amounts on their individual income tax returns.
Annual Report | 51
Franklin Mutual Recovery Fund
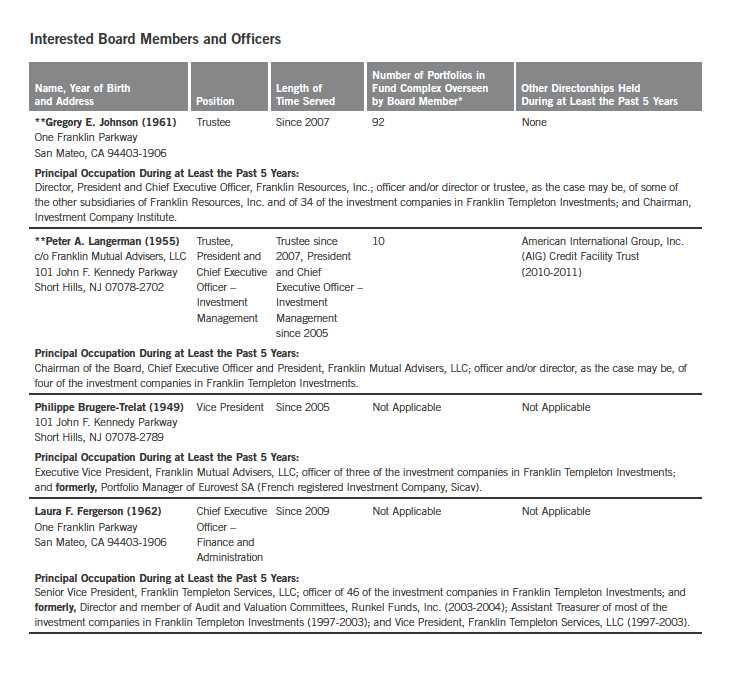
Board Members and Officers
The name, year of birth and address of the officers and board members, as well as their affiliations, positions held with
the Fund, principal occupations during at least the past five years and number of portfolios overseen in the Franklin
Templeton Investments fund complex are shown below. Generally, each board member serves until that person’s
successor is elected and qualified.

52 | Annual Report

Annual Report | 53
54 | Annual Report

Annual Report | 55
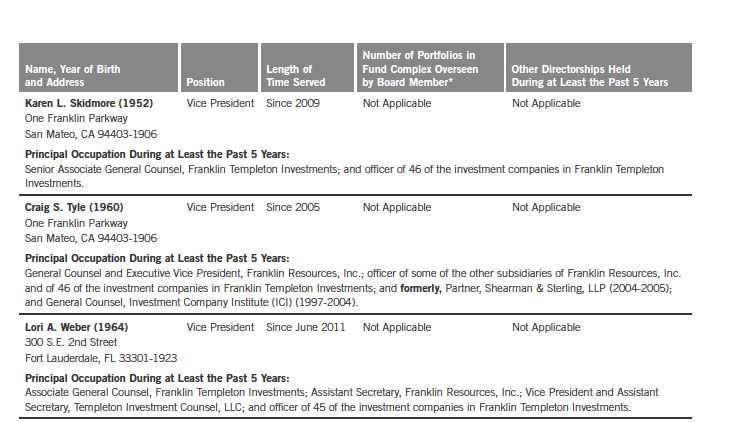
*We base the number of portfolios on each separate series of the U.S. registered investment companies within the Franklin Templeton Investments fund complex. These portfolios
have a common investment manager or affiliated investment managers.
**Gregory E. Johnson is considered to be an interested person of the Trust under the federal securities laws due to his position as an officer and director of Franklin Resources, Inc.,
which is the parent company of the Fund's investment manager and distributor. Peter A. Langerman is considered to be an interested person of the Fund under the federal securi-
ties laws due to his position as an officer of Mutual Advisers, LLC, which is the Fund’s investment manager.
Note: Officer information is current as of the date of this report. It is possible that after this date, information about officers may change.
The Fund’s Board has determined that certain of the members of the Audit Committee, including Ann Torre Bates, are audit committee financial experts, and “independent,”
under those provisions of the Sarbanes-Oxley Act of 2002, and the rules and form amendments adopted by the Securities and Exchange Commission, relating to audit com-
mittee financial experts.
The Statement of Additional Information (SAI) includes additional information about the board members and is available, without charge, upon request. Shareholders may
call (800) DIAL BEN/ 342-5236 to request the SAI.
56 | Annual Report
Franklin Mutual Recovery Fund
Shareholder Information
Proxy Voting Policies and Procedures
The Fund’s investment manager has established Proxy Voting Policies and Procedures (Policies) that the Fund uses to determine how to vote proxies relating to portfolio securities. Shareholders may view the Fund’s complete Policies online at franklintempleton.com. Alternatively, shareholders may request copies of the Policies free of charge by calling the Proxy Group collect at (954) 527-7678 or by sending a written request to: Franklin Templeton Companies, LLC, 300 S.E. 2nd Street, Fort Lauderdale, FL 33301, Attention: Proxy Group. Copies of the Fund’s proxy voting records are also made available online at franklintempleton.com and posted on the U.S. Securities and Exchange Commission’s website at sec.gov and reflect the most recent 12-month period ended June 30.
Quarterly Statement of Investments
The Fund files a complete statement of investments with the U.S. Securities and Exchange Commission for the first and third quarters for each fiscal year on Form N-Q. Shareholders may view the filed Form N-Q by visiting the Commission’s website at sec.gov. The filed form may also be viewed and copied at the Commission’s Public Reference Room in Washington, DC. Information regarding the operations of the Public Reference Room may be obtained by calling (800) SEC-0330.
Householding of Reports and Prospectuses
You will receive the Fund’s financial reports every six months as well as an annual updated summary prospectus (prospectus available upon request). To reduce Fund expenses, we try to identify related shareholders in a household and send only one copy of the financial reports and summary prospectus. This process, called “householding,” will continue indefinitely unless you instruct us otherwise. If you prefer not to have these documents householded, please call us at (800) 632-2301. At any time you may view current prospectuses/summary prospectuses and financial reports on our website. If you choose, you may receive these documents through electronic delivery.
Annual Report | 57
This page intentionally left blank.

Item 2. Code of Ethics.
(a) The Registrant has adopted a code of ethics that applies to its principal executive officers and principal financial and accounting officer.
| (c) | N/A |
| (d) | N/A |
| (f) | Pursuant to Item 12(a)(1), the Registrant is attaching as an exhibit a |
copy of its code of ethics that applies to its principal executive officers and principal financial and accounting officer.
Item 3. Audit Committee Financial Expert.
(a)(1) The Registrant has an audit committee financial expert serving on its audit committee.
(2) The audit committee financial expert is Ann Torre Bates and she is "independent" as defined under the relevant Securities and Exchange Commission Rules and Releases.
Item 4. Principal Accountant Fees and Services.
(a) Audit Fees
The aggregate fees paid to the principal accountant for professional services rendered by the principal accountant for the audit of the registrant’s annual financial statements or for services that are normally provided by the principal accountant in connection with statutory and regulatory filings or engagements were $75,070 for the fiscal year ended March 31, 2012 and $75,304 for the fiscal year ended March 31, 2011.
(b) Audit-Related Fees
There were no fees paid to the principal accountant for assurance and related services rendered by the principal accountant to the registrant that are reasonably related to the performance of the audit of the registrant's financial statements and are not reported under paragraph (a) of Item 4.
There were no fees paid to the principal accountant for assurance and related services rendered by the principal accountant to the registrant's investment adviser and any entity controlling, controlled by or under common control with the investment adviser that provides ongoing services to the registrant that are reasonably related to the performance of the audit of their financial statements.
(c) Tax Fees
The aggregate fees paid to the principal accountant for professional services rendered by the principal accountant to the registrant for tax compliance, tax advice and tax planning were $497 the fiscal year ended March 31, 2012 and $0 for the fiscal year ended March 31, 2011. The services for which these fees were paid included identifying passive foreign investment company to manage exposure to tax liabilities.
There were no fees paid to the principal accountant for professional services
rendered by the principal accountant to the registrant’s investment adviser
and any entity controlling, controlled by or under common control with the
investment adviser that provides ongoing services to the registrant for tax
compliance, tax advice and tax planning.
(d) All Other Fees
The were no fees paid to the principal accountant for products and services
rendered by the principal accountant to the registrant not reported in
paragraphs (a)-(c) of Item 4.
There were no paid to the principal accountant for products and services
rendered by the principal accountant to the registrant’s investment adviser
and any entity controlling, controlled by or under common control with the
investment adviser that provides ongoing services to the registrant other
than services reported in paragraphs (a)-(c) of Item 4.
(e) (1) The registrant’s audit committee is directly responsible for
approving the services to be provided by the auditors, including:
(i) pre-approval of all audit and audit related services;
(ii) pre-approval of all non-audit related services to be provided to
the Fund by the auditors;
(iii) pre-approval of all non-audit related services to be provided to
the registrant by the auditors to the registrant’s investment adviser or to
any entity that controls, is controlled by or is under common control with
the registrant’s investment adviser and that provides ongoing services to the
registrant where the non-audit services relate directly to the operations or
financial reporting of the registrant; and
(iv) establishment by the audit committee, if deemed necessary or
appropriate, as an alternative to committee pre-approval of services to be
provided by the auditors, as required by paragraphs (ii) and (iii) above, of
policies and procedures to permit such services to be pre-approved by other
means, such as through establishment of guidelines or by action of a
designated member or members of the committee; provided the policies and
procedures are detailed as to the particular service and the committee is
informed of each service and such policies and procedures do not include
delegation of audit committee responsibilities, as contemplated under the
Securities Exchange Act of 1934, to management; subject, in the case of (ii)
through (iv), to any waivers, exceptions or exemptions that may be available
under applicable law or rules.
(e) (2) None of the services provided to the registrant described in
paragraphs (b)-(d) of Item 4 were approved by the audit committee pursuant to
paragraph (c)(7)(i)(C) of Rule 2-01 of regulation S-X.
(f) No disclosures are required by this Item 4(f).
(g) The aggregate non-audit fees paid to the principal accountant for
services rendered by the principal accountant to the registrant and the
registrant’s investment adviser and any entity controlling, controlled by or
under common control with the investment adviser that provides ongoing
services to the registrant were $497 for the fiscal year ended March 31, 2012
and $0 for the fiscal year ended March 31, 2011.
(h) The registrant’s audit committee of the board has considered whether the provision of non-audit services that were rendered to the registrant’s investment adviser (not including any sub-adviser whose role is primarily portfolio management and is subcontracted with or overseen by another investment adviser), and any entity controlling, controlled by, or under common control with the investment adviser that provides ongoing services to the registrant that were not pre-approved pursuant to paragraph (c)(7)(ii) of Rule 2-01 of Regulation S-X is compatible with maintaining the principal accountant’s independence.
Item 5. Audit Committee of Listed Registrants.
Members of the Audit Committee are: Edward I. Altman, Ann Torre Bates and Robert E. Wade.
Item 6. Schedule of Investments.
N/A
Item 7. Disclosure of Proxy Voting Policies and Procedures for Closed-End Management Investment Companies.
The board of trustees of the Fund has delegated the authority to vote proxies related to the portfolio securities held by the Fund to the Fund’s Investment manager Franklin Mutual Advisers LLC (FMAL) in accordance with the Proxy Voting Policies and Procedures (Policies) adopted by the investment manager.
The investment manager has delegated its administrative duties with respect to the voting of proxies to the Proxy Group within Franklin Templeton Companies, LLC (Proxy Group), an affiliate and wholly owned subsidiary of Franklin Resources, Inc. All proxies received by the Proxy Group will be voted based upon the investment manager’s instructions and/or policies. The investment manager votes proxies solely in the interests of the Fund and its shareholders.
To assist it in analyzing proxies, the investment manager subscribes to Institutional Shareholder Services Inc. (ISS), an unaffiliated third-party corporate governance research service that provides in-depth analyses of shareholder meeting agendas, vote recommendations, recordkeeping and vote disclosure services. In addition, the investment manager subscribes to Glass, Lewis & Co., LLC (Glass Lewis), an unaffiliated third-party analytical research firm, to receive analyses and vote recommendations on the shareholder meetings of publicly held U.S. companies, as well as a limited subscription to its international research. Although ISS’ and/or Glass Lewis’ analyses are thoroughly reviewed and considered in making a final voting decision, the investment manager does not consider recommendations from ISS, Glass Lewis or any other third party to be determinative of the investment manager’s ultimate decision. As a matter of policy, the officers, directors/trustees and employees of the investment manager and the Proxy Group will not be influenced by outside sources whose interests conflict with the interests of the Fund and its shareholders. Efforts are made to resolve all conflicts in the interests of the investment manager’s clients. Material conflicts of interest are identified by the Proxy Group based upon analyses of client, distributor, broker-dealer and vendor lists, information periodically gathered from directors and officers, and information derived
from other sources, including public filings. In situations where a material conflict of interest is identified, the Proxy Group may defer to the voting recommendation of ISS, Glass Lewis or those of another independent third-party provider of proxy services; or send the proxy directly to the Fund's board or a committee of the board with the investment manager's recommendation regarding the vote for approval.
Where a material conflict of interest has been identified, but the items on which the investment manager’s vote recommendations differ from Glass Lewis, ISS, or another independent third-party provider of proxy services relate specifically to (1) shareholder proposals regarding social or environmental issues, (2) “Other Business” without describing the matters that might be considered, or (3) items the investment manager wishes to vote in opposition to the recommendations of an issuer’s management, the Proxy Group may defer to the vote recommendations of the investment manager rather than sending the proxy directly to the Fund's board or a board committee for approval.
To avoid certain potential conflicts of interest, the investment manager will employ echo voting, if possible, in the following instances: (1) when the Fund invests in an underlying fund in reliance on any one of Sections 12(d) (1) (E), (F), or (G) of the 1940 Act, the rules thereunder, or pursuant to any SEC exemptive orders thereunder; (2) when the Fund invests uninvested cash in affiliated money market funds pursuant to the rules under the 1940 Act or any exemptive orders thereunder (“cash sweep arrangement”); or (3) when required pursuant to the Fund’s governing documents or applicable law. Echo voting means that the investment manager will vote the shares in the same proportion as the vote of all of the other holders of the Fund’s shares.
The recommendation of management on any issue is a factor that the investment manager considers in determining how proxies should be voted. However, the investment manager does not consider recommendations from management to be determinative of the investment manager’s ultimate decision. As a matter of practice, the votes with respect to most issues are cast in accordance with the position of the company's management. Each issue, however, is considered on its own merits, and the investment manager will not support the position of the company's management in any situation where it deems that the ratification of management’s position would adversely affect the investment merits of owning that company’s shares.
Investment manager’s proxy voting policies and principles The investment manager has adopted general proxy voting guidelines, which are summarized below. These guidelines are not an exhaustive list of all the issues that may arise and the investment manager cannot anticipate all future situations. In all cases, each proxy will be considered based on the relevant facts and circumstances.
Board of directors. The investment manager supports an independent board of directors, and prefers that key committees such as audit, nominating, and compensation committees be comprised of independent directors. The investment manager will generally vote against management efforts to classify a board and will generally support proposals to declassify the board of directors. The investment manager will consider withholding votes from directors who have attended less than 75% of meetings without a valid reason. While generally in favor of separating Chairman and CEO positions, the investment manager will review this issue as well as proposals to restore or provide for cumulative voting on a case-by-case basis, taking into consideration factors such as the company’s corporate governance guidelines or provisions and
performance. The investment manager generally will support non-binding shareholder proposals to require a majority vote standard for the election of directors; however, if these proposals are binding, the investment manager will give careful review on a case-by-case basis of the potential ramifications of such implementation.
Ratification of auditors of portfolio companies. The investment manager will closely scrutinize the independence, role and performance of auditors. On a case-by-case basis, the investment manager will examine proposals relating to non-audit relationships and non-audit fees. The investment manager will also consider, on a case-by-case basis, proposals to rotate auditors, and will vote against the ratification of auditors when there is clear and compelling evidence of a lack of independence, accounting irregularities or negligence.
Management and director compensation. A company’s equity-based compensation plan should be in alignment with the shareholders’ long-term interests. The investment manager believes that executive compensation should be directly linked to the performance of the company. The investment manager evaluates plans on a case-by-case basis by considering several factors to determine whether the plan is fair and reasonable, including the ISS quantitative model utilized to assess such plans and/or the Glass Lewis evaluation of the plans. The investment manager will generally oppose plans that have the potential to be excessively dilutive, and will almost always oppose plans that are structured to allow the repricing of underwater options, or plans that have an automatic share replenishment “evergreen” feature. The investment manager will generally support employee stock option plans in which the purchase price is at least 85% of fair market value, and when potential dilution is 10% or less.
Severance compensation arrangements will be reviewed on a case-by-case basis, although the investment manager will generally oppose “golden parachutes” that are considered to be excessive. The investment manager will normally support proposals that require a percentage of directors’ compensation to be in the form of common stock, as it aligns their interests with those of shareholders.
The investment manager will review non-binding say-on-pay proposals on a case-by-case basis, and will generally vote in favor of such proposals unless compensation is misaligned with performance and/or shareholders’ interests, the company has not provided reasonably clear disclosure regarding its compensation practices, or there are concerns with the company’s remuneration practices.
Anti-takeover mechanisms and related issues. The investment manager generally opposes anti-takeover measures since they tend to reduce shareholder rights. However, as with all proxy issues, the investment manager conducts an independent review of each anti-takeover proposal. On occasion, the investment manager may vote with management when the research analyst has concluded that the proposal is not onerous and would not harm the Fund or its shareholders’ interests. The investment manager generally supports proposals that require shareholder rights’ plans (“poison pills”) to be subject to a shareholder vote and will closely evaluate such plans on a case-by-case basis to determine whether or not they warrant support. In addition, the investment manager will generally vote against any proposal to issue stock that has unequal or subordinate voting rights. The investment manager generally opposes any supermajority voting requirements as well as the payment of
“greenmail.” The investment manager generally supports “fair price” provisions and confidential voting.
Changes to capital structure. The investment manager realizes that a company's financing decisions have a significant impact on its shareholders, particularly when they involve the issuance of additional shares of common or preferred stock or the assumption of additional debt. The investment manager will review, on a case-by-case basis, proposals by companies to increase authorized shares and the purpose for the increase. The investment manager will generally not vote in favor of dual-class capital structures to increase the number of authorized shares where that class of stock would have superior voting rights. The investment manager will generally vote in favor of the issuance of preferred stock in cases where the company specifies the voting, dividend, conversion and other rights of such stock and the terms of the preferred stock issuance are deemed reasonable. The investment manager will review proposals seeking preemptive rights on a case-by-case basis.
Mergers and corporate restructuring. Mergers and acquisitions will be subject to careful review by the research analyst to determine whether they would be beneficial to shareholders. The investment manager will analyze various economic and strategic factors in making the final decision on a merger or acquisition. Corporate restructuring proposals are also subject to a thorough examination on a case-by-case basis.
Environment, social and governance issues. The investment manager will generally give management discretion with regard to social, environmental and ethical issues, although the investment manager may vote in favor of those that are believed to have significant economic benefits or implications for the Fund and its shareholders. The investment manager generally supports the right of shareholders to call special meetings and act by written consent. However, the investment manager will review such shareholder proposals on a case-by-case basis in an effort to ensure that such proposals do not disrupt the course of business or waste company resources for the benefit of a small minority of shareholders.
Global corporate governance. Many of the tenets discussed above are applied to the investment manager's proxy voting decisions for international investments. However, the investment manager must be flexible in these worldwide markets. Principles of good corporate governance may vary by country, given the constraints of a country’s laws and acceptable practices in the markets. As a result, it is on occasion difficult to apply a consistent set of governance practices to all issuers. As experienced money managers, The investment manager's analysts are skilled in understanding the complexities of the regions in which they specialize and are trained to analyze proxy issues germane to their regions.
The investment manager will generally attempt to process every proxy it receives for all domestic and foreign securities. However, there may be situations in which the investment manager may be unable to vote a proxy, or may chose not to vote a proxy, such as where: (i) proxy ballot was not received from the custodian; (ii) a meeting notice was received too late; (iii) there are fees imposed upon the exercise of a vote and it is determined that such fees outweigh the benefit of voting; (iv) there are legal encumbrances to voting, including blocking restrictions in certain markets that preclude the ability to dispose of a security if the investment manager votes a proxy or where the investment manager is prohibited from voting by applicable law or other regulatory or market requirements, including but not
limited to, effective Powers of Attorney; (v) the investment manager held shares on the record date but has sold them prior to the meeting date; (vi) proxy voting service is not offered by the custodian in the market; (vii) the investment manager believes it is not in the best interest of the Fund or its shareholders to vote the proxy for any other reason not enumerated herein; or (viii) a security is subject to a securities lending or similar program that has transferred legal title to the security to another person. The investment manager or its affiliates may, on behalf of one or more of the proprietary registered investment companies advised by the investment manager or its affiliates, determine to use its best efforts to recall any security on loan where the investment manager or its affiliates (a) learn of a vote on a material event that may affect a security on loan and (b) determine that it is in the best interests of such proprietary registered investment companies to recall the security for voting purposes.
Shareholders may view the complete Policies online at franklintempleton.com. Alternatively, shareholders may request copies of the Policies free of charge by calling the Proxy Group collect at (954) 527-7678 or by sending a written request to: Franklin Templeton Companies, LLC, 300 S.E. 2nd Street, Fort Lauderdale, FL 33301-1923, Attention: Proxy Group. Copies of the Fund’s proxy voting records are available online at franklintempleton.com and posted on the SEC website at www.sec.gov. The proxy voting records are updated each year by August 31 to reflect the most recent 12-month period ended June 30.
Item 8. Portfolio Managers of Closed-End Management Investment Companies.
(a)(1) As of May 25, 2012, the portfolio managers of the Fund are as follows:
SHAWN TUMULTY, Vice President of FMAL.
Mr. Tumulty has been a manager of the Fund since 2005. He joined Franklin Templeton Investments in 2000.
CHRISTIAN CORREA, Portfolio Manager of FMAL
Mr. Correa has been manager of the Fund since 2004. He joined Franklin Templeton Investments in 2003.
KEITH LUH, Assistant Portfolio Manager of FMAL
Mr. Luh has been a portfolio manager of the Fund since 2009, providing research and advice on purchases and sales of individual securities, and portfolio risk assessment. He joined Franklin Templeton Investments in 2005.
Shawn Tumulty and Christian Correa are jointly responsible for the day-to-day management of the Fund. The co-portfolio managers have equal authority over all aspects of the Fund's investment portfolio, including but not limited to, purchases and sales of individual securities, portfolio risk assessment, and the management of daily cash balances in accordance with anticipated management requirements. The degree to which each manager may perform these functions, and the nature of these functions, may change from time to time.
(a)(2) This section reflects information about the portfolio managers as of the fiscal year ended March 31, 2012.
The following table shows the number of other accounts managed by each portfolio manager and the total assets in the accounts managed within each category:
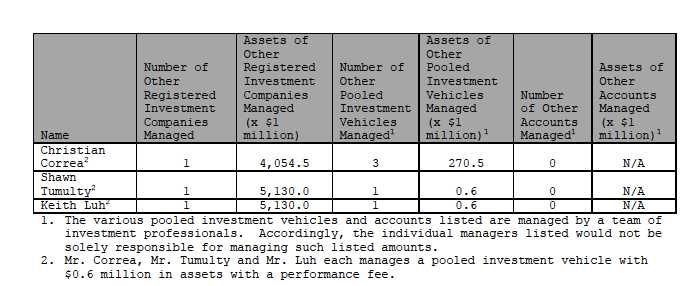
Portfolio managers that provide investment services to the Fund may also
provide services to a variety of other investment products, including other
funds, institutional accounts and private accounts. The advisory fees for
some of such other products and accounts may be different than that charged
to the Fund and may include performance based compensation. This may result
in fees that are higher (or lower) than the advisory fees paid by the Fund.
As a matter of policy, each fund or account is managed solely for the benefit
of the beneficial owners thereof. As discussed below, the separation of the
trading execution function from the portfolio management function and the
application of objectively based trade allocation procedures helps to
mitigate potential conflicts of interest that may arise as a result of the
portfolio managers managing accounts with different advisory fees.
Conflicts. The management of multiple funds, including the Fund, and
accounts may also give rise to potential conflicts of interest if the funds
and other accounts have different objectives, benchmarks, time horizons, and
fees as the portfolio manager must allocate his or her time and investment
ideas across multiple funds and accounts. The investment manager seeks to
manage such competing interests for the time and attention of portfolio
managers by having portfolio managers focus on a particular investment
discipline. Most other accounts managed by a portfolio manager are managed
using the same investment strategies that are used in connection with the
management of the Fund. Accordingly, portfolio holdings, position sizes, and
industry and sector exposures tend to be similar across similar portfolios,
which may minimize the potential for conflicts of interest. As noted above,
the separate management of the trade execution and valuation functions from
the portfolio management process also helps to reduce potential conflicts of
interest. However, securities selected for funds or accounts other than the
Fund may outperform the securities selected for the Fund. Moreover, if a
portfolio manager identifies a limited investment opportunity that may be
suitable for more than one fund or other account, the Fund may not be able to
take full advantage of that opportunity due to an allocation of that
opportunity across all eligible funds and other accounts. The investment
manager seeks to manage such potential conflicts by using procedures intended
to provide a fair allocation of buy and sell opportunities among funds and
other accounts.
The structure of a portfolio manager’s compensation may give rise to
potential conflicts of interest. A portfolio manager’s base pay and bonus
tend to increase with additional and more complex responsibilities that include increased assets under management. As such, there may be an indirect relationship between a portfolio manager’s marketing or sales efforts and his or her bonus.
Finally, the management of personal accounts by a portfolio manager may give rise to potential conflicts of interest. While the funds and the investment manager have adopted a code of ethics which they believe contains provisions reasonably necessary to prevent a wide range of prohibited activities by portfolio managers and others with respect to their personal trading activities, there can be no assurance that the code of ethics addresses all individual conduct that could result in conflicts of interest.
The investment manager and the Fund have adopted certain compliance procedures that are designed to address these, and other, types of conflicts. However, there is no guarantee that such procedures will detect each and every situation where a conflict arises.
Compensation. The investment manager seeks to maintain a compensation program that is competitively positioned to attract, retain and motivate top-quality investment professionals. Portfolio managers receive a base salary, a cash incentive bonus opportunity, an equity compensation opportunity, and a benefits package. Portfolio manager compensation is reviewed annually and the level of compensation is based on individual performance, the salary range for a portfolio manager’s level of responsibility and Franklin Templeton guidelines. Portfolio managers are provided no financial incentive to favor one fund or account over another. Each portfolio manager’s compensation consists of the following three elements:
Base salary Each portfolio manager is paid a base salary.
Annual bonus Annual bonuses are structured to align the interests of the portfolio manager with those of the Fund’s shareholders. Each portfolio manager is eligible to receive an annual bonus. Bonuses generally are split between cash (50% to 65%) and restricted shares of Resources stock (17.5% to 25%) and mutual fund shares (17.5% to 25%). The deferred equity-based compensation is intended to build a vested interest of the portfolio manager in the financial performance of both Resources and mutual funds advised by the investment manager. The bonus plan is intended to provide a competitive level of annual bonus compensation that is tied to the portfolio manager achieving consistently strong investment performance, which aligns the financial incentives of the portfolio manager and Fund shareholders. The Chief Investment Officer of the investment manager and/or other officers of the investment manager, with responsibility for the Fund, have discretion in the granting of annual bonuses to portfolio managers in accordance with Franklin Templeton guidelines. The following factors are generally used in determining bonuses under the plan:
- Investment performance. Primary consideration is given to the historic investment performance over the 1, 3 and 5 preceding years of all accounts managed by the portfolio manager. The pre-tax performance of each fund managed is measured relative to a relevant peer group and/or applicable benchmark as appropriate.
- Non-investment performance. The more qualitative contributions of the portfolio manager to the investment manager’s business and the
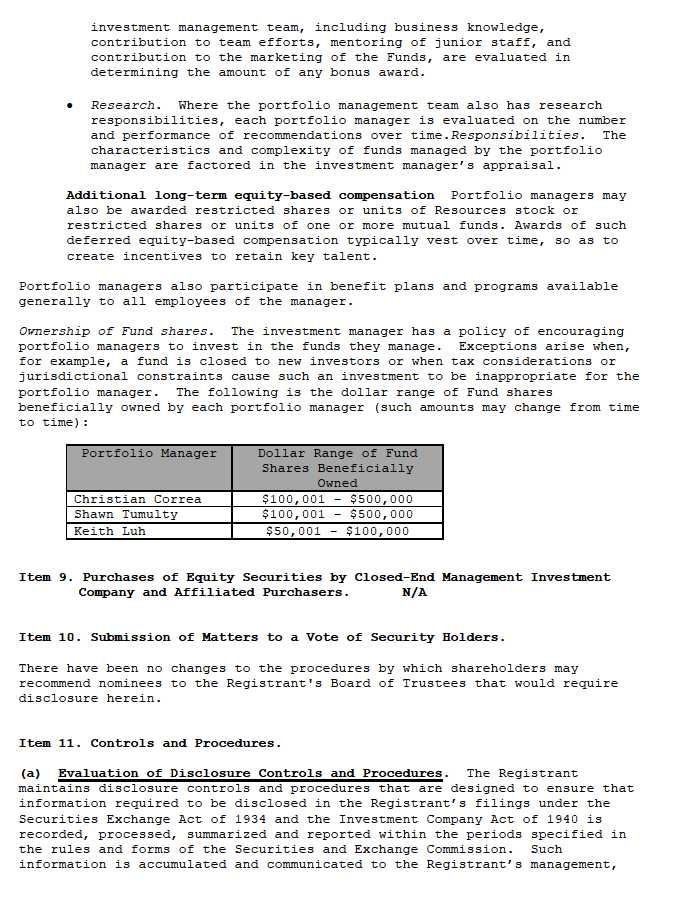
including its principal executive officer and principal financial officer, as
appropriate, to allow timely decisions regarding required disclosure. The
Registrant’s management, including the principal executive officer and the
principal financial officer, recognizes that any set of controls and
procedures, no matter how well designed and operated, can provide only
reasonable assurance of achieving the desired control objectives.
Within 90 days prior to the filing date of this Shareholder Report on Form N-
CSR, the Registrant had carried out an evaluation, under the supervision and
with the participation of the Registrant’s management, including the
Registrant’s principal executive officer and the Registrant’s principal
financial officer, of the effectiveness of the design and operation of the
Registrant’s disclosure controls and procedures. Based on such evaluation,
the Registrant’s principal executive officer and principal financial officer
concluded that the Registrant’s disclosure controls and procedures are
effective.
(b) Changes in Internal Controls. There have been no significant changes
in the Registrant’s internal controls or in other factors that could
significantly affect the internal controls subsequent to the date of their
evaluation in connection with the preparation of this Shareholder Report on
Form N-CSR.
Item 12. Exhibits.
(a) (1) Code of Ethics
(a) (2) Certifications pursuant to Section 302 of the Sarbanes-Oxley Act of
2002 of Laura F. Fergerson, Chief Executive Officer - Finance and
Administration, and Matthew T. Hinkle, Chief Financial Officer and Chief
Accounting Officer
(b) Certifications pursuant to Section 906 of the Sarbanes-Oxley Act of 2002
of Laura F. Fergerson, Chief Executive Officer - Finance and Administration,
and Matthew T. Hinkle, Chief Financial Officer and Chief Accounting Officer