UNITED STATES
SECURITIES AND EXCHANGE COMMISSION
Washington, DC 20549
FORM N-CSR
CERTIFIED SHAREHOLDER REPORT OF REGISTERED MANAGEMENT INVESTMENT COMPANIES
Investment Company Act file number 811-21306
Franklin Mutual Recovery Fund
(Exact name of registrant as specified in charter)
101 John F. Kennedy Parkway, Short Hills, NJ 07078-2705
Address of principal executive offices) (Zip code)
Craig S. Tyle, One Franklin Parkway, San Mateo, CA 94403-1906
(Name and address of agent for service)
Registrant's telephone number, including area code: (210) 912-2100
Date of fiscal year end: 03/31
Date of reporting period: 03/31/15
Item 1. Reports to Stockholders.
Franklin Templeton Investments
Gain From Our Perspective®
At Franklin Templeton Investments, we’re dedicated to one goal: delivering exceptional asset management for our clients. By bringing together multiple, world-class investment teams in a single firm, we’re able to offer specialized expertise across styles and asset classes, all supported by the strength and resources of one of the world’s largest asset managers. This has helped us to become a trusted partner to individual and institutional investors across the globe.
Focus on Investment Excellence
At the core of our firm, you’ll find multiple independent investment teams—each with a focused area of expertise—from traditional to alternative strategies and multi-asset solutions. And because our portfolio groups operate autonomously, their strategies can be combined to deliver true style and asset class diversification.
All of our investment teams share a common commitment to excellence grounded in rigorous, fundamental research and robust, disciplined risk management. Decade after decade, our consistent, research-driven processes have helped Franklin Templeton earn an impressive record of strong, long-term results.
Global Perspective Shaped by Local Expertise
In today’s complex and interconnected world, smart investing demands a global perspective. Franklin Templeton pioneered international investing over 60 years ago, and our expertise in emerging markets spans more than a quarter of a century. Today, our investment professionals are on the ground across the globe, spotting investment ideas and potential risks firsthand. These locally based teams bring in-depth understanding of local companies, economies and cultural nuances, and share their best thinking across our global research network.
Strength and Experience
Franklin Templeton is a global leader in asset management serving clients in over 150 countries.1 We run our business with the same prudence we apply to asset management, staying focused on delivering relevant investment solutions, strong long-term results and reliable, personal service. This approach, focused on putting clients first, has helped us to become one of the most trusted names in financial services.
1. As of 12/31/14. Clients are represented by the total number of shareholder accounts.
Not FDIC Insured | May Lose Value | No Bank Guarantee
| | |
| Contents | |
| |
| Shareholder Letter | 1 |
| Annual Report | |
| Franklin Mutual Recovery Fund | 4 |
| Performance Summary | 8 |
| Your Fund’s Expenses | 11 |
| The Fund’s Repurchase Offers | 12 |
| Financial Highlights and | |
| Statement of Investments | 13 |
| Financial Statements | 22 |
| Notes to Financial Statements | 26 |
| Report of Independent Registered | |
| Public Accounting Firm | 39 |
| Tax Information | 40 |
| Board Members and Officers | 41 |
| Shareholder Information | 46 |
| 1
Annual Report
Franklin Mutual Recovery Fund
This annual report for Franklin Mutual Recovery Fund covers the fiscal year ended March 31, 2015.
Your Fund’s Goal and Main Investments
The Fund’s goal is capital appreciation. The Fund seeks to achieve superior risk-adjusted returns with a moderate correlation to U.S. equity markets by investing in distressed companies, merger arbitrage securities and special situation/undervalued securities. The Fund may take long and short positions, with the latter typically utilized in connection with the merger arbitrage strategy.
Performance Overview
For the 12 months under review, the Fund’s Class A shares had a -1.66% cumulative total return. In comparison, U.S. stocks, as measured by the Fund’s benchmark, the Standard & Poor’s 500 Index (S&P 500®), produced a +12.73% total return for the same period.1
The Bloomberg/EFFAS U.S. Government 3-5 Years Total Return Index, which serves as a transparent benchmark for the U.S. government bond market, had a 12-month total return of +1.49%.2
The performance of the Fund relative to the Bloomberg index is used as the basis for calculating the performance adjustment to the base management fee paid to the Fund’s adviser. (Please refer to Notes 4a and 4b on pages 31 and 32 in the Notes to Financial Statements for additional information related to the performance adjustment, base management fee and related fee waivers or limits.) You can find the Fund’s long-term performance data in the Performance Summary beginning on page 8.
Performance data represent past performance, which does not guarantee future results. Investment return and principal value will fluctuate, and you may have a gain or loss when you sell your shares. Current performance may differ from figures shown. Please visit franklintempleton.com or call (800) 342-5236 for most recent month-end performance.

Economic and Market Overview
U.S. economic growth trends were generally encouraging during the 12-month period ended March 31, 2015, although economic expansion slowed in 2015’s first quarter. The economy grew for most of 2014, as greater spending by consumers, businesses, and state and local governments, partially offset the negative impacts of a wider trade deficit and lower federal defense spending. In the first quarter of 2015, factors including low energy prices, harsh weather, labor disruptions and U.S. dollar strength led export levels to fall and businesses and consumers to reduce spending. Manufacturing and non-manufacturing activities increased, and the unemployment rate declined to 5.5% at period-end from 6.6% in March 2014.3 Housing market data were largely positive for most of the period as new and existing home sales rose and mortgage rates declined. Home prices stayed higher than a year earlier. Retail sales moderated toward period-end despite job growth and generally lower gasoline prices. Inflation, as measured by the Consumer Price Index, remained subdued during the 12 months and fell sharply toward period-end amid lower energy and import prices.
1. Source: Morningstar.
2. Source: Bloomberg. Please see Notes to Financial Statements for more information about the performance-based management fee.
The indexes are unmanaged and include reinvested dividends. One cannot invest directly in an index, and an index is not representative of the Fund’s portfolio.
3. Source: Bureau of Labor Statistics.
See www.franklintempletondatasources.com for additional data provider information.
The dollar value, number of shares or principal amount, and names of all portfolio holdings are listed in the Fund’s Statement of Investments (SOI). The SOI
begins on page 16.
4 | Annual Report franklintempleton.com
FRANKLIN MUTUAL RECOVERY FUND
In October 2014, the U.S. Federal Reserve Board (Fed) ended its expansion of the bond buying program, based on its view that underlying economic strength could support ongoing progress in labor market conditions. The Fed maintained its existing policy of holding longer term securities at sizable levels. Although the Fed had repeatedly stated that it could be patient with regard to raising interest rates, toward period-end, the Fed removed the word “patient” from its monetary policy guidance. It added, however, that it might keep interest rates lower than what it viewed as normal.
Investor confidence grew as corporate profits remained healthy, the U.S. economy continued to grow and the Fed maintained its cautious tone on raising interest rates. The market endured sell-offs when many investors reacted to political instability in certain emerging markets, Greece’s debt negotiations and signs of relatively weak economic growth in Europe and Japan, as well as less robust growth in China. U.S. stocks rose overall for the 12 months under review as the S&P 500 and the Dow Jones Industrial Average reached all-time highs.
Global merger and acquisition (M&A) activity continued to increase during the 12 months under review. Based on announced, pending and completed deals at the end of the period, the total number of deals and total deal value increased compared to the prior year’s period. The notable increase in total value and activity was driven by a number of themes, including the increased popularity of tax inversion deals among U.S. corporations, in which they sought to move their headquarters abroad to reduce taxes, as well as consolidation within the telecommunications, pharmaceuticals and oil and gas industries.
North America continued to account for the largest percentage of global deal value and frequency overall. The region’s deal count and total deal value increased. Regionally, western Europe followed North America based on both measures, and its total deal count and total value grew. Many corporations being labeled as targets for U.S. tax inversion deals, along with positive developments throughout the peripheral European economies, helped drive the notable increase over prior year totals. Regionally, eastern Europe experienced the only declines in terms of total deal count and volume due to geopolitical tensions and uncertainties there throughout the period.
Of the global industry groups, pharmaceuticals was a top contributor to merger activity, driven by the influx of deals in Europe and the U.S., spawned from increased demand for specialty drugs and the rising costs associated with bringing new drugs to market. The telecommunications and media industries also contributed significantly to overall volumes, in large part due to AT&T’s announcement of a cash and stock offer to acquire DIRECTV amid the industry’s ongoing battle to provide more customers with bundled services. Compared with the prior year’s period, total values also showed meaningful increases in the oil and gas and real estate industries.
Opportunities in distressed debt investing remained limited. Highly leveraged institutions have benefited from the continued low interest rate environment, and the ease with which these companies have been able to borrow funds or refinance existing debt has resulted in a relatively low number of corporate bankruptcies. Most of our recent investments were in the higher end of the capital structure, with secured and senior securities, as well as refinancing deals. Our ability to invest anywhere in the capital structure allowed us to approach the space opportunistically, and we will continue to seek new investments that, in our opinion, provide favorable risk-reward profiles.
Investment Strategy
We follow a distinctive investment approach and can seek investments in distressed companies, merger arbitrage and special situations/undervalued securities. The availability of investments at attractive prices in each of these categories varies with market cycles. Therefore, the percentage of the Fund’s assets invested in each of these areas will fluctuate as we attempt to take advantage of opportunities afforded by cyclical changes. We employ rigorous, fundamental analysis to find investment opportunities. In choosing investments, we look at the market price of an individual company’s securities relative to our evaluation of its asset value based on such factors as book value, cash flow potential, long-term earnings and earnings multiples. We may invest in distressed companies if we believe the market overreacted to adverse developments or failed to appreciate positive changes.
| | | |
| Top 10 Sectors/Industries | | |
| Based on Equity Securities as of 3/31/15 | | |
| | % of Total | |
| | Net Assets | |
| Media | 7.4 | % |
| Oil, Gas & Consumable Fuels | 4.6 | % |
| Energy Equipment & Services | 4.1 | % |
| Insurance | 4.1 | % |
| Software | 2.8 | % |
| Tobacco | 2.4 | % |
| Wireless Telecommunication Services | 2.3 | % |
| Auto Components | 2.3 | % |
| Hotels, Restaurants & Leisure | 2.2 | % |
| Banks | 2.1 | % |
franklintempleton.com Annual Report | 5
FRANKLIN MUTUAL RECOVERY FUND
Manager’s Discussion
During the 12 months under review, top contributors to absolute performance included investments in pharmaceutical and medical device company Hospira, casino operator Pinnacle Entertainment and medical device firm Covidien.
Hospira specializes in injectable generic drugs and biosimilars, which are officially approved versions of products that are highly similar to other licensed biologic drugs. Hospira’s performance was driven by the early February 2014 announcement that Pfizer4 reached an agreement to acquire Hospira. Hospira offered Pfizer a strong leadership position in sterile injectables and an attractive high growth market in the generic segment, and positioned Pfizer as a top-tier biosimilars company with a strong pipeline and substantial room for cost synergies. Each of these factors played a part in our investment thesis and initially attracted us to making an investment in Hospira.
Pinnacle Entertainment owns and operates casinos and other entertainment properties across the U.S. The stock surged in mid-March 2014 after Gaming and Leisure Properties,4 a real estate investment trust previously spun off from Penn National Gaming,4 made an unsolicited bid to acquire Pinnacle’s real estate assets.
Ireland-based Covidien was acquired by its U.S.-based rival Medtronic during the period. Covidien shares began to rally in mid-October after Medtronic reaffirmed its commitment to the deal. Investors had been cautious about the deal after the U.S. Treasury issued a new set of rules in late September 2014 intended to limit cross-border M&A deals that could enable U.S.-based companies to lower tax expenses by re-domiciling in countries with lower corporate tax rates. In November, the U.S. Federal Trade Commission approved the company’s acquisition of Covidien with minimal conditions and the deal officially closed in late January 2015. The combination created one of the world’s largest and most diversified medical device companies. We exited our position before period-end.
During the period under review, detractors from Fund performance included offshore engineering firm DeepOcean Group Holding, cosmetics company Avon Products and offshore drilling company Transocean.
DeepOcean operates in the offshore energy industry and provides seabed mapping and subsea services, including installation, inspection, maintenance, repair and decommission-ing. The recent decline in energy prices led oil companies to reassess more expensive projects, such as deepwater drilling,
| | | |
| Top 10 Equity Holdings | | |
| 3/31/15 | | |
| Company | % of Total | |
| Sector/Industry, Country | Net Assets | |
| DIRECTV | 3.1 | % |
| Media, U.S. | | |
| Symantec Corp. | 2.8 | % |
| Software, U.S. | | |
| DeepOcean Group Holding BV | 2.7 | % |
| Energy Equipment & Services, Netherlands | | |
| Lorillard Inc. | 2.4 | % |
| Tobacco, U.S. | | |
| Vodafone Group PLC | 2.3 | % |
| Wireless Telecommunication Services, U.K. | | |
| International Automotive Components Group | | |
| North America LLC | 2.3 | % |
| Auto Components, U.S. | | |
| Pinnacle Entertainment Inc. | 2.2 | % |
| Hotels, Restaurants & Leisure, U.S. | | |
| CIT Group Inc. | 2.1 | % |
| Banks, U.S. | | |
| Talisman Energy Inc. | 2.1 | % |
| Oil, Gas & Consumable Fuels, Canada | | |
| Tokyo Electron Ltd., ADR | 1.8 | % |
| Semiconductors & Semiconductor Equipment, Japan | | |
and capital spending plans. In response to weaker demand for its services, the company announced a reorganization in January with the intention of reducing direct and indirect costs.
Avon Products is a direct seller of beauty products. Approximately 80% of its sales are generated from emerging markets including Brazil, Mexico, Russia, Venezuela, Turkey, Argentina and the Philippines. Avon shares came under pressure during the period as unfavorable currency movements and weak economic growth in several of the company’s key markets hurt revenues and profits. In October, the stock declined further as the company reported a difficult third quarter and the chief executive officer indicated that 2016 revenue and margin goals might not be met. On a positive note, the company in December settled a U.S. government investigation under the Foreign Corrupt Practices Act. The settlement with the Department of Justice and the Securities and Exchange Commission, which included a $135 million fine, was in line with market expectations and eliminated a source of longstanding uncertainty.
Transocean is a Switzerland-headquartered company providing offshore contract drilling services. The company and industry have been contending with a glut of new deepwater rigs coinciding with declining demand from oil producers. Drastically
4. Not a Fund holding.
6 | Annual Report franklintempleton.com
FRANKLIN MUTUAL RECOVERY FUND
lower oil prices led companies to push back projects and slash capital spending, leaving a number of new rigs without contracts and increasing potential downtime between jobs for existing rigs. The growing fleet of uncontracted rigs at period-end portended, in our view, weak second-half results and a challenging start to 2015. On a positive note, the company started a Master Limited Partnership (MLP), Transocean Partners, which went public in September 2014. The MLP may provide Transocean with a way to generate cash by selling (dropping down) assets into Transocean Partners while still controlling the operations of those assets.
As fellow shareholders, we found recent relative performance disappointing, but it is not uncommon for our strategy to lag amid a strong equity market. Thank you for your interest and participation in Franklin Mutual Recovery Fund. We look forward to continuing to serve your investment needs.
The foregoing information reflects our analysis, opinions and portfolio holdings as of March 31, 2015, the end of the reporting period. The way we implement our main investment strategies and the resulting portfolio holdings may change depending on factors such as market and economic conditions. These opinions may not be relied upon as investment advice or an offer for a particular security. The information is not a complete analysis of every aspect of any market, country, industry, security or the Fund. Statements of fact are from sources considered reliable, but the investment manager makes no representation or warranty as to their completeness or accuracy. Although historical performance is no guarantee of future results, these insights may help you understand our investment management philosophy.

Christian Correa has been a portfolio manager for Franklin Mutual Recovery Fund since 2004. He joined Franklin Mutual Series in 2003 and serves as Director of Research for Franklin Mutual Advisers. Previously, he covered merger arbitrage and special situations at Lehman Brothers Holdings Inc.
Shawn Tumulty has been a portfolio manager for Franklin Mutual Recovery Fund since 2005. He is the head of Franklin Mutual Series’ distressed securities team. Prior to joining Franklin Mutual Series, Mr. Tumulty was an analyst and portfolio manager at Kidder Peabody, Bankers Trust and Hamilton Partners Limited, where he focused on distressed debt investing.
Keith Luh has been a portfolio manager for Franklin Mutual Recovery Fund since 2009. He is also a research analyst specializing in distressed securities, merger and capital structure arbitrage, and event-driven situations. Prior to joining Franklin Mutual Series in 2005, Mr. Luh was an analyst in global investment research at Putnam Investments, where he also helped manage a best ideas research fund. Previously, he worked in the investment banking group at Volpe Brown Whelan and Co., LLC, and the derivative products trading group at BNP. Mr. Luh is also Adjunct Professor in Finance and Economics at the Graduate School of Business, Columbia University and the Gabelli School of Business, Fordham University.
CFA® is a trademark owned by CFA Institute.
franklintempleton.com Annual Report | 7
FRANKLIN MUTUAL RECOVERY FUND
Performance Summary as of March 31, 2015
Your dividend income will vary depending on dividends or interest paid by securities in the Fund’s portfolio, adjusted for operating expenses of each class. Capital gain distributions are net profits realized from the sale of portfolio securities. The performance table and graphs do not reflect any taxes that a shareholder would pay on Fund dividends, capital gain distributions, if any, or any realized gains on the sale of Fund shares. Total return reflects reinvestment of the Fund’s dividends and capital gain distributions, if any, and any unrealized gains or losses.
| | | | | | | |
| Net Asset Value | | | | | | |
| Share Class (Symbol) | | 3/31/15 | | 3/31/14 | | Change |
| A (FMRAX) | $ | 11.56 | $ | 12.25 | -$ | 0.69 |
| C (FCMRX) | $ | 11.42 | $ | 12.09 | -$ | 0.67 |
| Advisor (FMRVX) | $ | 11.64 | $ | 12.34 | -$ | 0.70 |
| | | |
| | | Dividend |
| Share Class | | Income |
| A | $ | 0.4774 |
| C | $ | 0.3781 |
| Advisor | $ | 0.5180 |
Performance as of 3/31/151
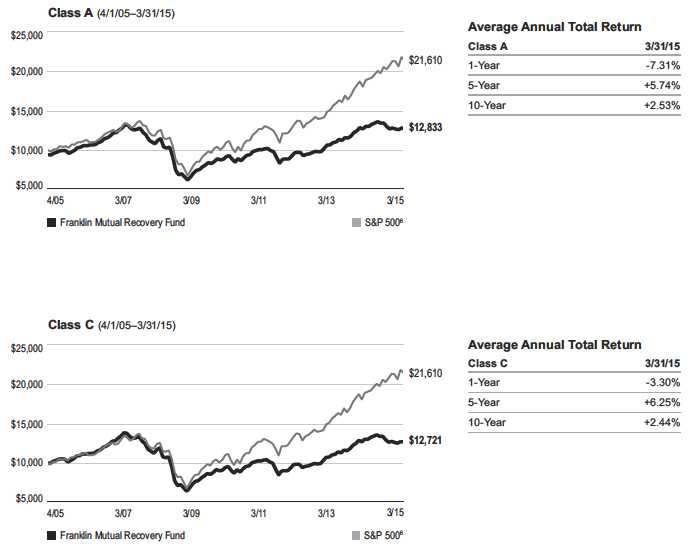
Cumulative total return excludes sales charges. Average annual total return and value of $10,000 investment include maximum sales charges. Class A: 5.75% maximum initial sales charge; Class C: 1% contingent deferred sales charge in first year only; Advisor Class: no sales charges.
| | | | | | | | | | | | | |
| | | Cumulative | | | Average Annual | | | Value of | Total Annual Operating Expenses5 | |
| Share Class | | Total Return2 | | | Total Return3 | | $ | 10,000 Investment4 | (with waiver) | | (without waiver) | |
| A | | | | | | | | | 1.53 | % | 3.72 | % |
| 1-Year | | -1.66 | % | | -7.31 | % | $ | 9,269 | | | | |
| 5-Year | + | 40.24 | % | + | 5.74 | % | $ | 13,217 | | | | |
| 10-Year | + | 36.16 | % | + | 2.53 | % | $ | 12,833 | | | | |
| C | | | | | | | | | 2.25 | % | 4.44 | % |
| 1-Year | | -2.36 | % | | -3.30 | % | $ | 9,670 | | | | |
| 5-Year | + | 35.40 | % | + | 6.25 | % | $ | 13,540 | | | | |
| 10-Year | + | 27.21 | % | + | 2.44 | % | $ | 12,721 | | | | |
| Advisor | | | | | | | | | 1.25 | % | 3.44 | % |
| 1-Year | | -1.39 | % | | -1.39 | % | $ | 9,861 | | | | |
| 5-Year | + | 42.30 | % | + | 7.31 | % | $ | 14,230 | | | | |
| 10-Year | + | 40.49 | % | + | 3.46 | % | $ | 14,049 | | | | |
Performance data represent past performance, which does not guarantee future results. Investment return and principal value will fluctuate, and you may have a gain or loss when you sell your shares. Current performance may differ from figures shown. For most recent month-end performance, go to franklintempleton.com or call (800) 342-5236.
8 | Annual Report franklintempleton.com
FRANKLIN MUTUAL RECOVERY FUND
PERFORMANCE SUMMARY
Total Return Index Comparison for a Hypothetical $10,000 Investment1
Total return represents the change in value of an investment over the periods shown. It includes any applicable maximum sales charge, Fund expenses, account fees and reinvested distributions. The unmanaged index includes reinvestment of any income or distributions. It differs from the Fund in composition and does not pay management fees or expenses. One cannot invest directly in an index.
franklintempleton.com Annual Report | 9
FRANKLIN MUTUAL RECOVERY FUND
PERFORMANCE SUMMARY
Total Return Index Comparison for a Hypothetical $10,000 Investment1 (continued)
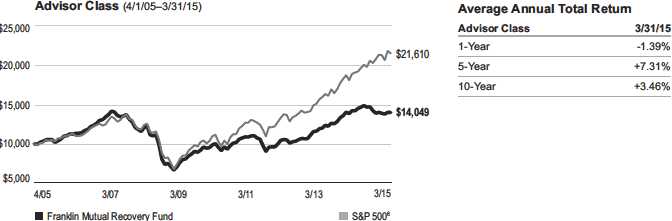
All investments involve risks, including possible loss of principal. The Fund may invest in companies engaged in mergers, reorganizations or liquidations, which involve special risks, as pending deals may not be completed on time or on favorable terms, as well as lower rated bonds, which entail higher credit risk. The Fund is a nondiversified fund and may experience increased susceptibility to adverse economic or regulatory developments affecting similar issuers or securities.
The Fund may invest in foreign securities whose risks include currency fluctuations, and economic and political uncertainties. The Fund is actively managed but there is no guarantee that the manager’s investment decisions will produce the desired results. The Fund’s prospectus also includes a description of the main investment risks.
| | |
| Class C: | These shares have higher annual fees and expenses than Class A shares. |
| Advisor Class: | Shares are available to certain eligible investors as described in the prospectus. |
1. The Fund has expense reductions contractually guaranteed through at least 7/31/15. Fund investment results reflect the expense reductions, to the extent applicable;
without these reductions, the results would have been lower.
2. Cumulative total return represents the change in value of an investment over the periods indicated.
3. Average annual total return represents the average annual change in value of an investment over the periods indicated.
4. These figures represent the value of a hypothetical $10,000 investment in the Fund over the periods indicated.
5. Figures are as stated in the Fund’s current prospectus. In periods of market volatility, assets may decline significantly, causing total annual Fund operating expenses to
become higher than the figures shown.
6. Source: Morningstar. The S&P 500 is a market capitalization-weighted index of 500 stocks designed to measure total U.S. equity market performance.
See www.franklintempletondatasources.com for additional data provider information.
10 | Annual Report franklintempleton.com
FRANKLIN MUTUAL RECOVERY FUND
Your Fund’s Expenses
As a Fund shareholder, you can incur two types of costs:
- Transaction costs, including sales charges (loads) on Fund purchases; and
- Ongoing Fund costs, including management fees, distribu- tion and service (12b-1) fees, and other Fund expenses. All mutual funds have ongoing costs, sometimes referred to as operating expenses.
The following table shows ongoing costs of investing in the Fund and can help you understand these costs and compare them with those of other mutual funds. The table assumes a $1,000 investment held for the six months indicated.
Actual Fund Expenses
The first line (Actual) for each share class listed in the table provides actual account values and expenses. The “Ending Account Value” is derived from the Fund’s actual return, which includes the effect of Fund expenses.
You can estimate the expenses you paid during the period by following these steps. Of course, your account value and expenses will differ from those in this illustration:
| 1. | Divide your account value by $1,000. |
| | If an account had an $8,600 value, then $8,600 ÷ $1,000 = 8.6. |
| 2. | Multiply the result by the number under the heading “Expenses Paid During Period.” |
| | If Expenses Paid During Period were $7.50, then 8.6 x $7.50 = $64.50. |
In this illustration, the estimated expenses paid this period are $64.50.
Hypothetical Example for Comparison with Other Funds
Information in the second line (Hypothetical) for each class in the table can help you compare ongoing costs of investing in the Fund with those of other mutual funds. This information may not be used to estimate the actual ending account balance or expenses you paid during the period. The hypothetical “Ending Account Value” is based on the actual expense ratio for each class and an assumed 5% annual rate of return before expenses, which does not represent the Fund’s actual return. The figure under the heading “Expenses Paid During Period” shows the hypothetical expenses your account would have incurred under this scenario. You can compare this figure with the 5% hypothetical examples that appear in shareholder reports of other funds.
Please note that expenses shown in the table are meant to highlight ongoing costs and do not reflect any transaction costs, such as sales charges. Therefore, the second line for each class is useful in comparing ongoing costs only, and will not help you compare total costs of owning different funds. In addition, if transaction costs were included, your total costs would have been higher. Please refer to the Fund prospectus for additional information on operating expenses.
| | | | | | | |
| | | Beginning Account | | Ending Account | | Expenses Paid During |
| Share Class | | Value 10/1/14 | | Value 3/31/15 | | Period* 10/1/14–3/31/15 |
| A | | | | | | |
| Actual | $ | 1,000 | $ | 982.60 | $ | 8.35 |
| Hypothetical (5% return before expenses) | $ | 1,000 | $ | 1,016.50 | $ | 8.50 |
| C | | | | | | |
| Actual | $ | 1,000 | $ | 978.80 | $ | 11.84 |
| Hypothetical (5% return before expenses) | $ | 1,000 | $ | 1,012.96 | $ | 12.04 |
| Advisor | | | | | | |
| Actual | $ | 1,000 | $ | 983.70 | $ | 6.92 |
| Hypothetical (5% return before expenses) | $ | 1,000 | $ | 1,017.95 | $ | 7.04 |
*Expenses are calculated using the most recent six-month expense ratio, net of expense waivers, annualized for each class (A: 1.69%; C: 2.40%;
and Advisor: 1.40%), multiplied by the average account value over the period, multiplied by 182/365 to reflect the one-half year period.
franklintempleton.com Annual Report | 11
FRANKLIN MUTUAL RECOVERY FUND
The Fund’s Repurchase Offers
The Fund will make quarterly repurchase offers for a portion of its shares. With any repurchase offer, shareholders may elect to tender (have the Fund repurchase) all, a portion or none of their shares. With each repurchase offer, shareholders will be notified in writing about the offer, how to request that the Fund repurchase their shares and the deadline for submitting repurchase requests.
Each quarter the Board of Trustees will set the amount of the repurchase offer, as a percentage of outstanding shares. This amount is known as the repurchase offer amount and will generally be between 5% and 25% of the Fund’s outstanding shares. If repurchase requests exceed the repurchase offer amount, the Fund will prorate requests. The Fund may, however, first accept any requests to repurchase all of a shareholder’s shares if the shareholder owns less than 100 shares. The Board will also determine the date by which the Fund must receive shareholders’ repurchase requests, which is known as the repurchase request deadline. The Board will base these decisions on investment management considerations, market conditions, liquidity of the Fund’s assets, shareholder servicing and administrative considerations and other factors it deems appropriate. Each repurchase request deadline will occur within the period that begins 21 days before, and ends 21 days after, the end of the quarterly interval. The repurchase price of the shares will be the net asset value as of the close of the NYSE on the date the Board sets as the repurchase pricing date. The maximum number of days between the repurchase request deadline and the repurchase pricing date is 14 days.
| | | | | | |
| Summary of Repurchase Offers – 4/1/14 through 3/31/15 | | |
| Repurchase Request | Repurchase Offer | | % of Shares | | Number of Shares |
| Deadline | Amount | | Tendered | | Tendered |
| 4/11/14 | 15 | % | 5.266 | % | 264,133.053 |
| 6/27/14 | 15 | % | 2.746 | % | 131,633.084 |
| 10/3/14 | 15 | % | 4.204 | % | 195,975.702 |
| 12/23/14 | 15 | % | 5.771 | % | 268,496.280 |
12 | Annual Report
franklintempleton.com
| | | | | | | | | | | | | | | | |
| | | | | | FRANKLIN MUTUAL RECOVERY FUND | |
| |
| |
| |
| |
| Financial Highlights | | | | | | | | | | | | | | | |
| | | | | | Year Ended March 31, | | | | |
| | | 2015 | | | 2014 | | | 2013 | | | 2012 | | | 2011 | |
| Class A | | | | | | | | | | | | | | | |
| Per share operating performance | | | | | | | | | | | | | | | |
| (for a share outstanding throughout the year) | | | | | | | | | | | | | | | |
| Net asset value, beginning of year | $ | 12.25 | | $ | 10.54 | | $ | 9.49 | | $ | 10.20 | | $ | 9.75 | |
| Income from investment operationsa: | | | | | | | | | | | | | | | |
| Net investment incomeb | | 0.22 | | | 0.47 | c | | 0.23 | | | 0.17 | | | 0.16 | d |
| Net realized and unrealized gains (losses) | | (0.43 | ) | | 1.53 | | | 0.96 | | | (0.56 | ) | | 0.81 | |
| Total from investment operations | | (0.21 | ) | | 2.00 | | | 1.19 | | | (0.39 | ) | | 0.97 | |
| Less distributions from net investment income | | (0.48 | ) | | (0.29 | ) | | (0.14 | ) | | (0.32 | ) | | (0.52 | ) |
| Net asset value, end of year | $ | 11.56 | | $ | 12.25 | | $ | 10.54 | | $ | 9.49 | | $ | 10.20 | |
| |
| Total returne | | (1.66 | )% | | 19.09 | % | | 12.71 | % | | (3.38 | )% | | 9.95 | % |
| |
| Ratios to average net assets | | | | | | | | | | | | | | | |
| Expenses before waiver, payments by affiliates and | | | | | | | | | | | | | | | |
| expense reductionf | | 3.41 | % | | 3.72 | % | | 2.83 | % | | 2.75 | % | | 3.62 | % |
| Expenses net of waiver, payments by affiliates and | | | | | | | | | | | | | | | |
| expense reductionf | | 1.63 | %g | | 1.53 | %g | | 1.62 | % | | 2.25 | % | | 3.62 | % |
| Expenses incurred in connection with securities sold short | | 0.14 | % | | 0.05 | % | | 0.04 | % | | 0.12 | % | | 0.13 | % |
| Net investment income | | 1.81 | % | | 4.14 | %c | | 1.87 | % | | 1.81 | % | | 1.56 | %d |
| |
| Supplemental data | | | | | | | | | | | | | | | |
| Net assets, end of year (000’s) | $ | 20,884 | | $ | 24,329 | | $ | 23,480 | | $ | 32,629 | | $ | 65,043 | |
| Portfolio turnover rate | | 31.50 | % | | 58.30 | % | | 60.11 | % | | 91.52 | % | | 65.17 | % |
aThe amount shown for a share outstanding throughout the period may not correlate with the Statement of Operations for the period due to the timing of sales and
repurchases of the Fund shares in relation to income earned and/or fluctuating fair value of the investments of the Fund.
bBased on average daily shares outstanding.
cNet investment income per share includes approximately $0.23 per share received in the form of a special dividend paid in connection with certain Fund’s holdings.
Excluding this amount, the ratio of net investment income to average net assets would have been 2.10%.
dNet investment income per share includes approximately $0.14 per share received in the form of a special dividend paid in connection with a corporate real estate
investment trust (REIT) conversion. Excluding this non-recurring amount, the ratio of net investment income to average net assets would have been 0.09%.
eTotal return does not reflect sales commissions or contingent deferred sales charges, if applicable.
fIncludes dividend and interest expense on securities sold short and security borrowing fees, if any. See below for the ratios of such expenses to average net assets for the
periods presented. See Note 1(g).
gBenefit of expense reduction rounds to less than 0.01%.
franklintempleton.com The accompanying notes are an integral part of these financial statements. | Annual Report | 13
FRANKLIN MUTUAL RECOVERY FUND
FINANCIAL HIGHLIGHTS
| | | | | | | | | | | | | | | | |
| | | | | | Year Ended March 31, | | | | |
| | | 2015 | | | 2014 | | | 2013 | | | 2012 | | | 2011 | |
| Class C | | | | | | | | | | | | | | | |
| Per share operating performance | | | | | | | | | | | | | | | |
| (for a share outstanding throughout the year) | | | | | | | | | | | | | | | |
| Net asset value, beginning of year | $ | 12.09 | | $ | 10.41 | | $ | 9.36 | | $ | 10.05 | | $ | 9.60 | |
| Income from investment operationsa: | | | | | | | | | | | | | | | |
| Net investment incomeb | | 0.13 | | | 0.38 | c | | 0.11 | | | 0.10 | | | 0.09 | d |
| Net realized and unrealized gains (losses) | | (0.42 | ) | | 1.51 | | | 1.00 | | | (0.54 | ) | | 0.79 | |
| Total from investment operations | | (0.29 | ) | | 1.89 | | | 1.11 | | | (0.44 | ) | | 0.88 | |
| Less distributions from net investment income | | (0.38 | ) | | (0.21 | ) | | (0.06 | ) | | (0.25 | ) | | (0.43 | ) |
| Net asset value, end of year | $ | 11.42 | | $ | 12.09 | | $ | 10.41 | | $ | 9.36 | | $ | 10.05 | |
| |
| Total returne | | (2.36 | )% | | 18.23 | % | | 11.93 | % | | (4.01 | )% | | 9.16 | % |
| |
| Ratios to average net assets | | | | | | | | | | | | | | | |
| Expenses before waiver, payments by affiliates and | | | | | | | | | | | | | | | |
| expense reductionf | | 4.12 | % | | 4.44 | % | | 3.54 | % | | 3.45 | % | | 4.32 | % |
| Expenses net of waiver, payments by affiliates and | | | | | | | | | | | | | | | |
| expense reductionf | | 2.34 | %g | | 2.25 | %g | | 2.33 | % | | 2.95 | % | | 4.32 | % |
| Expenses incurred in connection with securities sold short | | 0.14 | % | | 0.05 | % | | 0.04 | % | | 0.12 | % | | 0.13 | % |
| Net investment income | | 1.10 | % | | 3.42 | %c | | 1.16 | % | | 1.11 | % | | 0.86 | %d |
| |
| Supplemental data | | | | | | | | | | | | | | | |
| Net assets, end of year (000’s) | $ | 8,357 | | $ | 10,573 | | $ | 11,615 | | $ | 16,754 | | $ | 27,432 | |
| Portfolio turnover rate | | 31.50 | % | | 58.30 | % | | 60.11 | % | | 91.52 | % | | 65.17 | % |
aThe amount shown for a share outstanding throughout the period may not correlate with the Statement of Operations for the period due to the timing of sales and
repurchases of the Fund shares in relation to income earned and/or fluctuating fair value of the investments of the Fund.
bBased on average daily shares outstanding.
cNet investment income per share includes approximately $0.23 per share received in the form of a special dividend paid in connection with certain Fund’s holdings.
Excluding this amount, the ratio of net investment income to average net assets would have been 1.38%.
dNet investment income per share includes approximately $0.14 per share received in the form of a special dividend paid in connection with a corporate REIT conversion.
Excluding this non-recurring amount, the ratio of net investment income to average net assets would have been (0.61%).
eTotal return does not reflect sales commissions or contingent deferred sales charges, if applicable.
fIncludes dividend and interest expense on securities sold short and security borrowing fees, if any. See below for the ratios of such expenses to average net assets for the
periods presented. See Note 1(g).
gBenefit of expense reduction rounds to less than 0.01%.
14 | Annual Report | The accompanying notes are an integral part of these financial statements. franklintempleton.com
| | | | | | | | | | | | | | | | |
| | | | | | FRANKLIN MUTUAL RECOVERY FUND | |
| | | | | | | | | FINANCIAL HIGHLIGHTS | |
| |
| |
| |
| |
| | | | | | Year Ended March 31, | | | | |
| | | 2015 | | | 2014 | | | 2013 | | | 2012 | | | 2011 | |
| Advisor Class | | | | | | | | | | | | | | | |
| Per share operating performance | | | | | | | | | | | | | | | |
| (for a share outstanding throughout the year) | | | | | | | | | | | | | | | |
| Net asset value, beginning of year | $ | 12.34 | | $ | 10.61 | | $ | 9.56 | | $ | 10.28 | | $ | 9.83 | |
| Income from investment operationsa: | | | | | | | | | | | | | | | |
| Net investment incomeb | | 0.26 | | | 0.51 | c | | 0.15 | | | 0.19 | | | 0.17 | d |
| Net realized and unrealized gains (losses) | | (0.44 | ) | | 1.54 | | | 1.08 | | | (0.55 | ) | | 0.83 | |
| Total from investment operations | | (0.18 | ) | | 2.05 | | | 1.23 | | | (0.36 | ) | | 1.00 | |
| Less distributions from net investment income | | (0.52 | ) | | (0.32 | ) | | (0.18 | ) | | (0.36 | ) | | (0.55 | ) |
| Net asset value, end of year | $ | 11.64 | | $ | 12.34 | | $ | 10.61 | | $ | 9.56 | | $ | 10.28 | |
| |
| Total return | | (1.39 | )% | | 19.46 | % | | 13.01 | % | | (3.02 | )% | | 10.22 | % |
| |
| Ratios to average net assets | | | | | | | | | | | | | | | |
| Expenses before waiver, payments by affiliates and | | | | | | | | | | | | | | | |
| expense reductione | | 3.12 | % | | 3.44 | % | | 2.54 | % | | 2.45 | % | | 3.32 | % |
| Expenses net of waiver, payments by affiliates and | | | | | | | | | | | | | | | |
| expense reductione | | 1.34 | %f | | 1.25 | %f | | 1.33 | % | | 1.95 | % | | 3.32 | % |
| Expenses incurred in connection with securities sold short | | 0.14 | % | | 0.05 | % | | 0.04 | % | | 0.12 | % | | 0.13 | % |
| Net investment income | | 2.10 | % | | 4.42 | %c | | 2.16 | % | | 2.11 | % | | 1.86 | %d |
| |
| Supplemental data | | | | | | | | | | | | | | | |
| Net assets, end of year (000’s) | $ | 21,719 | | $ | 26,529 | | $ | 25,707 | | $ | 24,496 | | $ | 29,269 | |
| Portfolio turnover rate | | 31.50 | % | | 58.30 | % | | 60.11 | % | | 91.52 | % | | 65.17 | % |
aThe amount shown for a share outstanding throughout the period may not correlate with the Statement of Operations for the period due to the timing of sales and
repurchases of the Fund shares in relation to income earned and/or fluctuating fair value of the investments of the Fund.
bBased on average daily shares outstanding.
cNet investment income per share includes approximately $0.23 per share received in the form of a special dividend paid in connection with certain Fund’s holdings.
Excluding this amount, the ratio of net investment income to average net assets would have been 2.38%.
dNet investment income per share includes approximately $0.14 per share received in the form of a special dividend paid in connection with a corporate REIT conversion.
Excluding this non-recurring amount, the ratio of net investment income to average net assets would have been 0.39%.
eIncludes dividend and interest expense on securities sold short and security borrowing fees, if any. See below for the ratios of such expenses to average net assets for the
periods presented. See Note 1(g).
fBenefit of expense reduction rounds to less than 0.01%.
franklintempleton.com The accompanying notes are an integral part of these financial statements. | Annual Report | 15
| | | | | |
| FRANKLIN MUTUAL RECOVERY FUND | | | | |
| |
| |
| |
| |
| Statement of Investments, March 31, 2015 | | | | |
| | | Shares/ | | |
| | Country | Warrants | | Value |
| |
| Common Stocks and Other Equity Interests 45.8% | | | | |
| Aerospace & Defense 1.4% | | | | |
| B/E Aerospace Inc. | United States | 8,606 | $ | 547,514 |
| aKLX Inc. | United States | 4,303 | | 165,837 |
| | | | | 713,351 |
| Auto Components 2.3% | | | | |
| a,bInternational Automotive Components Group Brazil LLC | Brazil | 185,241 | | 10,499 |
| a,b,cInternational Automotive Components Group North America LLC | United States | 1,263,310 | | 1,158,116 |
| | | | | 1,168,615 |
| Banks 2.1% | | | | |
| dCIT Group Inc. | United States | 23,470 | | 1,058,966 |
| Chemicals 0.8% | | | | |
| Tronox Ltd., A | United States | 20,435 | | 415,444 |
| Communications Equipment 0.4% | | | | |
| a,c,eSorenson Communications Inc., Membership Interests | United States | 1,508 | | 196,040 |
| Consumer Finance 0.3% | | | | |
| aAlly Financial Inc. | United States | 6,588 | | 138,216 |
| Diversified Consumer Services 0.3% | | | | |
| Cengage Learning Holdings II LP | United States | 7,048 | | 158,580 |
| Diversified Financial Services 1.1% | | | | |
| aCapmark Financial Group Inc. | United States | 114,464 | | 574,609 |
| Diversified Telecommunication Services 1.1% | | | | |
| Koninklijke KPN NV | Netherlands | 167,450 | | 568,833 |
| Energy Equipment & Services 4.1% | | | | |
| Baker Hughes Inc. | United States | 8,160 | | 518,813 |
| aDeepOcean Group Holding BV | Netherlands | 91,357 | | 1,370,355 |
| f Transocean Ltd. | United States | 13,932 | | 204,382 |
| | | | | 2,093,550 |
| Hotels, Restaurants & Leisure 2.2% | | | | |
| aPinnacle Entertainment Inc. | United States | 31,360 | | 1,131,782 |
| Insurance 4.1% | | | | |
| Ageas | Belgium | 12,180 | | 437,531 |
| Direct Line Insurance Group PLC | United Kingdom | 92,432 | | 437,333 |
| RSA Insurance Group PLC | United Kingdom | 111,550 | | 696,383 |
| UNIQA Insurance Group AG | Austria | 55,868 | | 505,914 |
| | | | | 2,077,161 |
| Machinery 1.1% | | | | |
| CNH Industrial NV, special voting (EUR Traded) | United Kingdom | 2,890 | | 23,681 |
| CNH Industrial NV, special voting (USD Traded) | United Kingdom | 53,898 | | 439,808 |
| Vossloh AG | Germany | 1,910 | | 117,238 |
| | | | | 580,727 |
| Media 7.4% | | | | |
| CBS Corp., B | United States | 7,480 | | 453,513 |
| aDIRECTV | United States | 18,560 | | 1,579,456 |
| Nine Entertainment Co. Holdings Ltd. | Australia | 177,936 | | 286,052 |
| Time Warner Cable Inc. | United States | 5,122 | | 767,685 |
16 | Annual Report franklintempleton.com
FRANKLIN MUTUAL RECOVERY FUND
STATEMENT OF INVESTMENTS
| | | | | |
| | | Shares/ | | |
| | Country | Warrants | | Value |
| Common Stocks and Other Equity Interests (continued) | | | | |
| Media (continued) | | | | |
| Tribune Media Co., B | United States | 9,499 | $ | 580,911 |
| Tribune Publishing Co. | United States | 6,247 | | 121,192 |
| | | | | 3,788,809 |
| Metals & Mining 0.5% | | | | |
| dFreeport-McMoRan Inc., B | United States | 15,252 | | 289,025 |
| Oil, Gas & Consumable Fuels 4.6% | | | | |
| BP PLC | United Kingdom | 122,500 | | 793,449 |
| aCairn Energy PLC | United Kingdom | 216,300 | | 504,002 |
| Talisman Energy Inc. (CAD Traded) | Canada | 4,602 | | 35,285 |
| Talisman Energy Inc. (USD Traded) | Canada | 131,483 | | 1,009,790 |
| | | | | 2,342,526 |
| Paper & Forest Products 0.0%† | | | | |
| aVerso Corp. | United States | 5,455 | | 9,819 |
| Personal Products 0.9% | | | | |
| Avon Products Inc. | United States | 54,716 | | 437,181 |
| Pharmaceuticals 1.0% | | | | |
| aHospira Inc. | United States | 5,673 | | 498,316 |
| Semiconductors & Semiconductor Equipment 1.8% | | | | |
| Tokyo Electron Ltd., ADR | Japan | 51,500 | | 894,555 |
| Software 2.8% | | | | |
| dSymantec Corp. | United States | 60,060 | | 1,403,302 |
| Technology Hardware, Storage & Peripherals 0.8% | | | | |
| aEastman Kodak Co. | United States | 10,185 | | 193,413 |
| aEastman Kodak Co., wts., 9/03/18 | United States | 507 | | 2,738 |
| aEastman Kodak Co., wts., 9/03/18 | United States | 507 | | 2,180 |
| Samsung Electronics Co. Ltd. | South Korea | 149 | | 193,629 |
| | | | | 391,960 |
| Tobacco 2.4% | | | | |
| Lorillard Inc. | United States | 18,602 | | 1,215,641 |
| Wireless Telecommunication Services 2.3% | | | | |
| Vodafone Group PLC | United Kingdom | 359,050 | | 1,173,991 |
| Total Common Stocks and Other Equity Interests | | | | |
| (Cost $24,159,502) | | | | 23,320,999 |
| Preferred Stocks 2.6% | | | | |
| Automobiles 1.5% | | | | |
| Porsche Automobil Holding SE, pfd. | Germany | 6,053 | | 595,387 |
| Volkswagen AG, pfd. | Germany | 600 | | 159,915 |
| | | | | 755,302 |
| Technology Hardware, Storage & Peripherals 1.1% | | | | |
| Samsung Electronics Co. Ltd., pfd. | South Korea | 568 | | 565,505 |
| Total Preferred Stocks (Cost $1,001,188) | | | | 1,320,807 |
franklintempleton.com Annual Report | 17
FRANKLIN MUTUAL RECOVERY FUND
STATEMENT OF INVESTMENTS
| | | | | | |
| | | | Principal | | |
| | | Country | Amount* | | Value |
| Corporate Bonds, Notes and Senior Floating Rate | | | | | |
| Interests 19.0% | | | | | |
| Avaya Inc., | | | | | |
| gsenior note, 144A, 10.50%, 3/01/21 | | United States | 687,000 | $ | 589,103 |
| h,iTranche B-3 Term Loan, 4.676%, 10/26/17 | | United States | 222,902 | | 219,934 |
| h,iTranche B-6 Term Loan, 6.50%, 3/31/18 | | United States | 53,727 | | 53,679 |
| h,iBluestem Brands Inc., First Lien Term Loan, 8.50%, 11/07/20 | | United States | 1,080,000 | | 1,082,700 |
| h,iCengage Learning Acquisitions Inc., First Lien Exit Term Loan, 7.00%, 3/31/20 | | United States | 44,550 | | 44,789 |
| h,iEastman Kodak Co., | | | | | |
| First Lien Term Loan, 7.25%, 9/03/19 | | United States | 151,305 | | 151,966 |
| Second Lien Term Loan, 10.75%, 9/03/20 | | United States | 514,000 | | 513,460 |
| GenOn Americas Generation LLC, senior bond, 9.125%, 5/01/31 | | United States | 1,159,000 | | 1,077,146 |
| h,iiHeartCommunications Inc., | | | | | |
| Tranche D Term Loan, 6.928%, 1/30/19 | | United States | 1,272,694 | | 1,213,514 |
| Tranche E Term Loan, 7.678%, 7/30/19 | | United States | 408,909 | | 395,313 |
| h,iKIK Custom Products Inc., Second Lien Term Loan, 9.50%, 10/29/19 | | United States | 660,000 | | 661,857 |
| gLee Enterprises Inc., senior secured note, first lien, 144A, 9.50%, 3/15/22 | | United States | 745,000 | | 772,937 |
| h,iMoxie Liberty LLC, Construction B-1 Term Loan, 7.50%, 8/21/20 | | United States | 448,000 | | 450,097 |
| h,iMoxie Patriot LLC, Construction B-1 Term Loan, 6.75%, 12/18/20 | | United States | 252,000 | | 253,260 |
| h,iNGPL PipeCo LLC, Term Loan B, 6.75%, 9/15/17 | | United States | 19,126 | | 18,332 |
| c,g,jSorenson Communications Inc., secured note, second lien, 144A, PIK, 9.00%, | | | | | |
| 10/31/20 | | United States | 649,999 | | 610,999 |
| c,g,jSorenson Holdings LLC/Finance Corp., senior note, 144A, PIK, 13.00%, | | | | | |
| 10/31/21 | | United States | 493,999 | | 493,999 |
| h,iToys R US-Delaware Inc., | | | | | |
| Filo Term Loan, 8.25%, 10/24/19 | | United States | 89,000 | | 87,954 |
| kTerm Loan B4, 9.75%, 4/24/20 | | United States | 691,562 | | 644,190 |
| Verso Paper Holdings LLC/Inc., senior secured note, first lien, 11.75%, | | | | | |
| 1/15/19 | | United States | 261,000 | | 245,340 |
| Walter Energy Inc., | | | | | |
| h,iB,Term Loan, 7.25%, 4/01/18 | | United States | 121,250 | | 74,092 |
| gfirst lien, 144A, 9.50%, 10/15/19 | | United States | 71,000 | | 42,955 |
| g,jsecond lien, 144A, PIK, 11.50%, 4/01/20 | | United States | 57,000 | | 5,534 |
| Total Corporate Bonds, Notes and Senior Floating | | | | | |
| Rate Interests (Cost $9,697,543) | | | | | 9,703,150 |
| Corporate Bonds, Notes and Senior Floating Rate | | | | | |
| Interests in Reorganization 11.3% | | | | | |
| h,i,l Caesars Entertainment Operating Co. Inc., Senior Tranche, first lien, 3/01/17, | | | | | |
| B5B, 6.005% | | United States | 155,025 | | 141,944 |
| B6B, 7.005% | | United States | 741,097 | | 681,346 |
| B7, 13.00% | | United States | 177,110 | | 162,056 |
| lNortel Networks Corp., cvt., senior note, | | | | | |
| 1.75%, 4/15/12 | | Canada | 1,752,000 | | 1,688,490 |
| 2.125%, 4/15/14 | | Canada | 171,000 | | 164,609 |
| lNortel Networks Ltd., senior note, | | | | | |
| 10.125%, 7/15/13 | | Canada | 600,000 | | 666,750 |
| 10.75%, 7/15/16 | | Canada | 25,000 | | 28,219 |
| lNorthern Telecom Ltd., 6.875%, 9/01/23 | | Canada | 368,000 | | 136,160 |
| h,i,lTexas Competitive Electric Holdings Co. LLC, Extended Term Loan, | | | | | |
| 4.662%, 10/10/17 | | United States | 2,524,660 | | 1,516,374 |
| g,lTexas Competitive Electric Holdings Co. LLC/Texas Competitive Electric | | | | | |
| Holdings Finance Inc., senior secured note, first lien, 144A, 11.50%, 10/01/20 | | United States | 941,000 | | 592,830 |
18 | Annual Report franklintempleton.com
FRANKLIN MUTUAL RECOVERY FUND
STATEMENT OF INVESTMENTS
| | | | | |
| | | Principal | | |
| | Country | Amount* | | Value |
| Total Corporate Bonds, Notes and Senior Floating Rate | | | | |
| Interests in Reorganization (Cost $6,650,541) | | | $ | 5,778,778 |
| | | Shares | | |
| Companies in Liquidation 2.0% | | | | |
| aAdelphia Recovery Trust | United States | 11,280,134 | | 32,712 |
| a,mAdelphia Recovery Trust, Arahova Contingent Value Vehicle, Contingent | | | | |
| Distribution | United States | 1,018,915 | | 11,310 |
| a,b,cCB FIM Coinvestors LLC | United States | 1,439,821 | | — |
| a,e,mCentury Communications Corp., Contingent Distribution | United States | 2,826,000 | | — |
| EME Reorganization Trust | United States | 3,653,879 | | 146,155 |
| a,bFIM Coinvestor Holdings I, LLC | United States | 1,801,197 | | — |
| a,gKGen Power Corp., 144A | United States | 141,643 | | 43,788 |
| a,nLehman Brothers Holdings Inc., Bankruptcy Claim | United States | 5,404,577 | | 763,397 |
| a,e,mNewPage Corp., Litigation Trust, Contingent Distribution | United States | 723,000 | | — |
| a,e,mTribune Media Litigation Trust, Contingent Distribution | United States | 20,126 | | — |
| a,e,mTropicana Litigation Trust, Contingent Distribution | United States | 12,892,000 | | — |
| Total Companies in Liquidation (Cost $2,200,605) | | | | 997,362 |
| | | | | |
| | | | Principal | |
| | | | Amount* | |
| Municipal Bonds (Cost $187,114) 0.3% | | | | |
| Puerto Rico Commonwealth GO, Refunding, Series A, 8.00%, 7/01/35 | | United States | 200,000 | 164,500 |
| Total Investments before Short Term Investments | | | | |
| (Cost $43,896,493) | | | | 41,285,596 |
| |
| Short Term Investments 2.0% | | | | |
| U.S. Government and Agency Securities (Cost $800,000) 1.6% | | | | |
| oFHLB, 4/01/15 | | United States | 800,000 | 800,000 |
| Total Investments before Repurchase Agreements | | | | |
| (Cost $44,696,493) | | | | 42,085,596 |
| pInvestments from Cash Collateral Received for Loaned | | | | |
| Securities 0.4% | | | | |
| qJoint Repurchase Agreements 0.4% | | | | |
| BNP Paribas Securities Corp., 0.11%, 4/01/15 (Maturity Value $113,325) | | | | |
| Collateralized by U.S. Treasury Notes, 0.375% - 2.75%, 4/15/15 - 4/30/19; | | | | |
| U.S. Treasury Strips, 8/15/15 - 11/15/23 (valued at $115,592) | | United States | 113,325 | 113,325 |
| BNP Paribas Securities Corp., 0.12%, 4/01/15 (Maturity Value $51,266) | | | | |
| Collateralized by U.S. Government and Agency Securities, 0.12% - 6.09%, | | | | |
| 4/17/15 - 7/15/37; U.S. Government and Agency Securities, zero cpn., | | | | |
| 6/01/17; oU.S. Government Agency Discount Notes, 5/01/15; and U.S. | | | | |
| Government Agency Strips, 5/15/27 (valued at $52,291) | | United States | 51,266 | 51,266 |
| HSBC Securities (USA) Inc., 0.11%, 4/01/15 (Maturity Value $51,266) | | | | |
| Collateralized by U.S. Government and Agency Securities, 0.30% - 7.25%, | | | | |
| 7/02/15 - 7/15/32; U.S. Government and Agency Securities, zero cpn., | | | | |
| 12/01/15 - 3/17/31; and U.S. Government Agency Strips, 4/15/15 - 4/15/30 | | | | |
| (valued at $52,291) | | United States | 51,266 | 51,266 |
| Total Investments from Cash Collateral Received for Loaned | | | | |
| Securities (Cost $215,857) | | | | 215,857 |
franklintempleton.com
Annual Report
| 19
FRANKLIN MUTUAL RECOVERY FUND
STATEMENT OF INVESTMENTS
| | | | | | |
| | Country | Shares | | Value | |
| Total Investments (Cost $44,912,350) 83.0% | | | $ | 42,301,453 | |
| Securities Sold Short (3.4)% | | | | (1,731,780 | ) |
| Other Assets, less Liabilities 20.4% | | | | 10,390,662 | |
| Net Assets 100.0% | | | $ | 50,960,335 | |
| rSecurities Sold Short (3.4)% | | | | | |
| Common Stocks (3.4)% | | | | | |
| Diversified Telecommunication Services (1.5)% | | | | | |
| AT&T Inc. | United States | 24,128 | $ | (787,779 | ) |
| Semiconductors & Semiconductor Equipment (1.9)% | | | | | |
| Applied Materials Inc. | United States | 41,844 | | (944,001 | ) |
| Total Securities Sold Short (Proceeds $1,677,175) | | | $ | (1,731,780 | ) |
†Rounds to less than 0.1% of net assets.
*The principal amount is stated in U.S. dollars unless otherwise indicated.
aNon-income producing.
bSee Note 9 regarding restricted securities.
cAt March 31, 2015, pursuant to the Fund’s policies and the requirements of applicable securities law, the Fund may be restricted from trading these securities for a limited or
extended period of time.
dSecurity or a portion of the security has been pledged as collateral for securities sold short. At March 31, 2015, the aggregate value of these securities and/or cash pledged
as collateral was $4,010,174, representing 7.87% of net assets.
eSecurity has been deemed illiquid because it may not be able to be sold within seven days. At March 31, 2015, the aggregate value of these securities was $196,040,
representing 0.38% of net assets.
fA portion or all of the security is on loan at March 31, 2015. See Note 1(h).
gSecurity was purchased pursuant to Rule 144A under the Securities Act of 1933 and may be sold in transactions exempt from registration only to qualified institutional buyers
or in a public offering registered under the Securities Act of 1933. These securities have been deemed liquid under guidelines approved by the Fund’s Board of Trustees. At
March 31, 2015, the aggregate value of these securities was $3,152,145, representing 6.19% of net assets.
hSee Note 1(i) regarding senior floating rate interests.
iThe coupon rate shown represents the rate at period end.
jIncome may be received in additional securities and/or cash.
kA portion or all of the security purchased on a delayed delivery basis. See Note 1(d).
lSee Note 8 regarding credit risk and defaulted securities.
mContingent distributions represent the right to receive additional distributions, if any, during the reorganization of the underlying company. Shares represent total underlying
principal of debt securities.
nBankruptcy claims represent the right to receive distributions, if any, during the liquidation of the underlying pool of assets. Shares represent amount of allowed unsecured
claims.
oThe security is traded on a discount basis with no stated coupon rate.
pSee Note 1(h) regarding securities on loan.
qSee Note 1(c) regarding joint repurchase agreements.
rSee Note 1(g) regarding securities sold short.
20 | Annual Report
franklintempleton.com
FRANKLIN MUTUAL RECOVERY FUND
STATEMENT OF INVESTMENTS
At March 31, 2015, the Fund had the following forward exchange contracts outstanding. See Note 1(e).
| | | | | | | | | | | | |
| Forward Exchange Contracts | | | | | | | | | | | |
| | | | | | Contract | Settlement | | Unrealized | | Unrealized | |
| Currency | Counterpartya Type | Quantity | | Amount | Date Appreciation Depreciation | |
| Australian Dollar | HSBC | Sell | 373,577 | $ | 290,121 | 4/23/15 | $ | 5,893 | $ | — | |
| Euro | BANT | Sell | 97,660 | | 121,948 | 5/18/15 | | 16,861 | | — | |
| Euro | DBFX | Sell | 103,492 | | 129,206 | 5/18/15 | | 17,844 | | — | |
| Euro | FBCO | Sell | 123,254 | | 153,558 | 5/18/15 | | 20,931 | | — | |
| Euro | HSBC | Sell | 10,224 | | 12,705 | 5/18/15 | | 1,703 | | — | |
| Euro | SSBT | Buy | 17,200 | | 19,461 | 5/18/15 | | — | | (953 | ) |
| Euro | SSBT | Sell | 14,813 | | 18,541 | 5/18/15 | | 2,601 | | — | |
| Norwegian Krone | BANT | Buy | 180,920 | | 25,070 | 5/21/15 | | — | | (2,630 | ) |
| Norwegian Krone | BONY | Buy | 47,950 | | 6,649 | 5/21/15 | | — | | (702 | ) |
| Norwegian Krone | DBFX | Buy | 1,509,045 | | 200,580 | 5/21/15 | | — | | (13,410 | ) |
| Norwegian Krone | DBFX | Sell | 1,737,915 | | 254,200 | 5/21/15 | | 38,642 | | — | |
| Euro | BANT | Sell | 71,598 | | 79,864 | 7/20/15 | | 2,941 | | (195 | ) |
| Euro | BBU | Sell | 6,586 | | 7,412 | 7/20/15 | | 318 | | — | |
| Euro | DBFX | Sell | 822,131 | | 950,415 | 7/20/15 | | 65,214 | | (314 | ) |
| Euro | FBCO | Sell | 79,485 | | 88,273 | 7/20/15 | | 3,076 | | (416 | ) |
| Euro | HSBC | Sell | 79,706 | | 88,761 | 7/20/15 | | 3,184 | | (274 | ) |
| Euro | SSBT | Sell | 809,794 | | 938,124 | 7/20/15 | | 66,044 | | (147 | ) |
| South Korean Won | BANT | Buy | 11,013,995 | | 9,929 | 8/12/15 | | — | | (35 | ) |
| South Korean Won | BANT | Sell | 252,652,186 | | 227,473 | 8/12/15 | | 694 | | (183 | ) |
| South Korean Won | FBCO | Sell | 262,319,195 | | 235,891 | 8/12/15 | | 501 | | (256 | ) |
| South Korean Won | HSBC | Sell | 329,568,674 | | 296,097 | 8/12/15 | | 504 | | (464 | ) |
| British Pound | BANT | Buy | 162,318 | | 243,601 | 8/19/15 | | 641 | | (3,707 | ) |
| British Pound | BANT | Sell | 855,553 | | 1,309,253 | 8/19/15 | | 41,430 | | — | |
| British Pound | DBFX | Buy | 2,612 | | 3,878 | 8/19/15 | | — | | (8 | ) |
| British Pound | FBCO | Sell | 596,835 | | 913,157 | 8/19/15 | | 28,723 | | — | |
| British Pound | HSBC | Sell | 598,887 | | 916,297 | 8/19/15 | | 28,821 | | — | |
| British Pound | SSBT | Buy | 8,318 | | 12,387 | 8/19/15 | | — | | (61 | ) |
| Unrealized appreciation (depreciation) | | | | | | | 346,566 | | (23,755 | ) |
| Net unrealized appreciation (depreciation) | | | | | | $ | 322,811 | | | |
| |
| See Abbreviations on page 38. | | | | | | | | | | | |
| aMay be comprised of multiple contracts with the same counterparty, currency and settlement date. | | | | | | | | |
franklintempleton.com
The accompanying notes are an integral part of these financial statements. | Annual Report | 21
FRANKLIN MUTUAL RECOVERY FUND
Financial Statements
Statement of Assets and Liabilities
March 31, 2015
| | | | |
| Assets: | | | |
| Investments in securities: | | | |
| Cost - Unaffiliated issuers | $ | 44,696,493 | |
| Cost - Repurchase agreements | | 215,857 | |
| Total cost of investments | $ | 44,912,350 | |
| Value - Unaffiliated issuers | $ | 42,085,596 | |
| Value - Repurchase agreements | | 215,857 | |
| Total value of investments (includes securities loaned in the amount of $201,448) | | 42,301,453 | |
| Cash | | 8,058,559 | |
| Restricted Cash (Note 1f) | | 110,000 | |
| Foreign currency, at value (cost $71,617) | | 71,799 | |
| Receivables: | | | |
| Investment securities sold | | 39,042 | |
| Capital shares sold | | 13,508 | |
| Dividends and interest | | 258,503 | |
| Due from brokers | | 1,980,408 | |
| Unrealized appreciation on forward exchange contracts | | 346,566 | |
| Total assets | | 53,179,838 | |
| Liabilities: | | | |
| Payables: | | | |
| Investment securities purchased | | 24,838 | |
| Capital shares redeemed | | 12,350 | |
| Management fees | | 21,580 | |
| Administrative fees | | 4,724 | |
| Distribution fees | | 22,822 | |
| Transfer agent fees | | 13,456 | |
| Securities sold short, at value (proceeds $1,677,175) | | 1,731,780 | |
| Payable upon return of securities loaned | | 215,857 | |
| Due to brokers | | 110,000 | |
| Unrealized depreciation on forward exchange contracts | | 23,755 | |
| Accrued expenses and other liabilities | | 38,341 | |
| Total liabilities | | 2,219,503 | |
| Net assets, at value | $ | 50,960,335 | |
| Net assets consist of: | | | |
| Paid-in capital | $ | 194,721,945 | |
| Undistributed net investment income | | 4,702 | |
| Net unrealized appreciation (depreciation) | | (2,349,627 | ) |
| Accumulated net realized gain (loss) | | (141,416,685 | ) |
| Net assets, at value | $ | 50,960,335 | |
22 | Annual Report | The accompanying notes are an integral part of these financial statements.
franklintempleton.com
| | | |
| | | FRANKLIN MUTUAL RECOVERY FUND |
| | | FINANCIAL STATEMENTS |
| |
| |
| Statement of Assets and Liabilities (continued) | | |
| March 31, 2015 | | |
| |
| Class A: | | |
| Net assets, at value | $ | 20,884,488 |
| Shares outstanding | | 1,806,877 |
| Net asset value per sharea | $ | 11.56 |
| Maximum offering price per share (net asset value per share ÷ 94.25%) | $ | 12.27 |
| Class C: | | |
| Net assets, at value | $ | 8,356,670 |
| Shares outstanding | | 731,633 |
| Net asset value and maximum offering price per sharea | $ | 11.42 |
| Advisor Class: | | |
| Net assets, at value | $ | 21,719,177 |
| Shares outstanding | | 1,865,354 |
| Net asset value and maximum offering price per share | $ | 11.64 |
aRedemption price is equal to net asset value less contingent deferred sales charges, if applicable.
franklintempleton.com The accompanying notes are an integral part of these financial statements. | Annual Report | 23
| | | | |
| FRANKLIN MUTUAL RECOVERY FUND | | | |
| FINANCIAL STATEMENTS | | | |
| |
| |
| Statement of Operations | | | |
| for the year ended March 31, 2015 | | | |
| |
| Investment income: | | | |
| Dividends | $ | 852,718 | |
| Interest | | 1,057,599 | |
| Income from securities loaned | | 8,715 | |
| Total investment income | | 1,919,032 | |
| Expenses: | | | |
| Management fees (Note 4a) | | 1,143,510 | |
| Administrative fees (Note 4b) | | 111,828 | |
| Distribution fees: (Note 4c) | | | |
| Class A | | 66,411 | |
| Class C | | 95,648 | |
| Transfer agent fees: (Note 4e) | | | |
| Class A | | 27,399 | |
| Class C | | 11,603 | |
| Advisor Class | | 28,714 | |
| Custodian fees (Note 5) | | 2,319 | |
| Reports to shareholders | | 29,166 | |
| Registration and filing fees | | 59,135 | |
| Professional fees | | 203,937 | |
| Trustees’ fees and expenses | | 22,218 | |
| Dividends and interest on securities sold short | | 75,646 | |
| Other | | 29,508 | |
| Total expenses | | 1,907,042 | |
| Expense reductions (Note 5) | | (68 | ) |
| Expenses waived/paid by affiliates (Notes 4a and 4f) | | (997,781 | ) |
| Net expenses | | 909,193 | |
| Net investment income | | 1,009,839 | |
| Realized and unrealized gains (losses): | | | |
| Net realized gain (loss) from: | | | |
| Investments | | 3,533,853 | |
| Written options | | 53,973 | |
| Foreign currency transactions | | 834,424 | |
| Securities sold short | | (332,029 | ) |
| Net realized gain (loss) | | 4,090,221 | |
| Net change in unrealized appreciation (depreciation) on: | | | |
| Investments | | (6,403,165 | ) |
| Translation of other assets and liabilities denominated in foreign currencies | | 395,445 | |
| Net change in unrealized appreciation (depreciation) | | (6,007,720 | ) |
| Net realized and unrealized gain (loss) | | (1,917,499 | ) |
| Net increase (decrease) in net assets resulting from operations | $ | (907,660 | ) |
24 | Annual Report | The accompanying notes are an integral part of these financial statements.
franklintempleton.com
| | | | | | | |
| | | FRANKLIN MUTUAL RECOVERY FUND | |
| | | FINANCIAL STATEMENTS | |
| |
| |
| Statements of Changes in Net Assets | | | | | | |
| |
| | | Year Ended March 31, | |
| | | 2015 | | | 2014 | |
| Increase (decrease) in net assets: | | | | | | |
| Operations: | | | | | | |
| Net investment income | $ | 1,009,839 | | $ | 2,468,139 | |
| Net realized gain (loss) from investments, written options, foreign currency transactions | | | | | | |
| and securities sold short | | 4,090,221 | | | 6,519,494 | |
| Net change in unrealized appreciation (depreciation) on investments and translation of other | | | | |
| assets and liabilities denominated in foreign currencies | | (6,007,720 | ) | | 1,377,950 | |
| Net increase (decrease) in net assets resulting from operations | | (907,660 | ) | | 10,365,583 | |
| Distributions to shareholders from: | | | | | | |
| Net investment income: | | | | | | |
| Class A | | (869,157 | ) | | (572,001 | ) |
| Class C | | (292,797 | ) | | (190,812 | ) |
| Advisor Class | | (984,157 | ) | | (689,555 | ) |
| Total distributions to shareholders | | (2,146,111 | ) | | (1,452,368 | ) |
| Capital share transactions: (Note 2) | | | | | | |
| Class A | | (2,219,406 | ) | | (2,640,048 | ) |
| Class C | | (1,697,021 | ) | | (2,620,197 | ) |
| Advisor Class | | (3,500,799 | ) | | (3,024,036 | ) |
| Total capital share transactions | | (7,417,226 | ) | | (8,284,281 | ) |
| Net increase (decrease) in net assets | | (10,470,997 | ) | | 628,934 | |
| Net assets: | | | | | | |
| Beginning of year | | 61,431,332 | | | 60,802,398 | |
| End of year | $ | 50,960,335 | | $ | 61,431,332 | |
| Undistributed net investment income included in net assets: | | | | | | |
| End of year | $ | 4,702 | | $ | 1,092,096 | |
franklintempleton.com The accompanying notes are an integral part of these financial statements. | Annual Report | 25
FRANKLIN MUTUAL RECOVERY FUND
Notes to Financial Statements
1. Organization and Significant Accounting Policies
Franklin Mutual Recovery Fund (Fund) is registered under the Investment Company Act of 1940, as amended, (1940 Act) as a closed-end, continuously offered management investment company and applies the specialized accounting and reporting guidance in U.S. Generally Accepted Accounting Principles (U.S. GAAP). The Fund offers three classes of shares: Class A, Class C and Advisor Class. Each class of shares differs by its initial sales load, contingent deferred sales charges, voting rights on matters affecting a single class, its exchange privilege and fees primarily due to differing arrangements for distributions and transfer agent fees.
The following summarizes the Fund’s significant accounting policies.
a. Financial Instrument Valuation
The Fund’s investments in financial instruments are carried at fair value daily. Fair value is the price that would be received to sell an asset or paid to transfer a liability in an orderly transaction between market participants on the measurement date. The Fund calculates the net asset value (NAV) per share at the close of the New York Stock Exchange (NYSE), generally at 4 p.m. Eastern time (NYSE close) on each day the NYSE is open for trading. Under compliance policies and procedures approved by the Fund’s Board of Trustees (the Board), the Fund’s administrator has responsibility for oversight of valuation, including leading the cross-functional Valuation and Liquidity Oversight Committee (VLOC). The VLOC provides administration and oversight of the Fund’s valuation policies and procedures, which are approved annually by the Board. Among other things, these procedures allow the Fund to utilize independent pricing services, quotations from securities and financial instrument dealers, and other market sources to determine fair value.
Equity securities and derivative financial instruments (derivatives) listed on an exchange or on the NASDAQ National Market System are valued at the last quoted sale price or the official closing price of the day, respectively. Foreign equity securities are valued as of the close of trading on the foreign stock exchange on which the security is primarily traded or as of the NYSE close, whichever is earlier. The value is then converted into its U.S. dollar equivalent at the foreign exchange rate in effect at the NYSE close on the day that the value of the security is determined. Over-the-counter (OTC) securities are valued within the range of the most recent quoted bid and ask prices. Securities that trade in multiple markets or on multiple exchanges are valued according to the broadest and most representative market. Certain equity securities are valued based upon fundamental characteristics or relationships to similar securities.
Debt securities generally trade in the OTC market rather than on a securities exchange. The Fund’s pricing services use multiple valuation techniques to determine fair value. In instances where sufficient market activity exists, the pricing services may utilize a market-based approach through which quotes from market makers are used to determine fair value. In instances where sufficient market activity may not exist or is limited, the pricing services also utilize proprietary valuation models which may consider market characteristics such as benchmark yield curves, credit spreads, estimated default rates, anticipated market interest rate volatility, coupon rates, anticipated timing of principal repayments, underlying collateral, and other unique security features in order to estimate the relevant cash flows, which are then discounted to calculate the fair value. Securities denominated in a foreign currency are converted into their U.S. dollar equivalent at the foreign exchange rate in effect at the NYSE close on the date that the values of the foreign debt securities are determined. Repurchase agreements are valued at cost, which approximates fair value.
Certain derivatives trade in the OTC market. The Fund’s pricing services use various techniques including industry standard option pricing models and proprietary discounted cash flow models to determine the fair value of those instruments. The Fund’s net benefit or obligation under the derivative contract, as measured by the fair value of the contract, is included in net assets.
The Fund has procedures to determine the fair value of financial instruments for which market prices are not reliable or readily available. Under these procedures, the VLOC convenes on a regular basis to review such financial instruments and considers a number of factors, including significant unobservable valuation inputs, when arriving at fair value. The VLOC primarily employs a market-based approach which may use related or comparable assets or liabilities, recent transactions, market multiples, book values, and other relevant information for the investment to determine the fair value of the investment. An income-based valuation approach may also be used in which the anticipated future cash flows of the investment are discounted to calculate fair value. Discounts may also be applied due to the nature or duration of any restrictions on the disposition of the investments. Due to the inherent uncertainty of valuations of such investments, the fair values may differ significantly from the values that would have been used had an active market existed. The VLOC employs various methods for calibrating
26 | Annual Report
franklintempleton.com
FRANKLIN MUTUAL RECOVERY FUND
NOTES TO FINANCIAL STATEMENTS
these valuation approaches including a regular review of key inputs and assumptions, transactional back-testing or disposition analysis, and reviews of any related market activity. Trading in securities on foreign securities stock exchanges and OTC markets may be completed before the daily NYSE close. In addition, trading in certain foreign markets may not take place on every NYSE business day. Occasionally, events occur between the time at which trading in a foreign security is completed and the close of the NYSE that might call into question the reliability of the value of a portfolio security held by the Fund. As a result, differences may arise between the value of the Fund’s portfolio securities as determined at the foreign market close and the latest indications of value at the close of the NYSE. In order to minimize the potential for these differences, the VLOC monitors price movements following the close of trading in foreign stock markets through a series of country specific market proxies (such as baskets of American Depositary Receipts, futures contracts and exchange traded funds). These price movements are measured against established trigger thresholds for each specific market proxy to assist in determining if an event has occurred that may call into question the reliability of the values of the foreign securities held by the Fund. If such an event occurs, the securities may be valued using fair value procedures, which may include the use of independent pricing services.
When the last day of the reporting period is a non-business day, certain foreign markets may be open on those days that the NYSE is closed, which could result in differences between the value of the Fund’s portfolio securities on the last business day and the last calendar day of the reporting period. Any significant security valuation changes due to an open foreign market are adjusted and reflected by the Fund for financial reporting purposes.
b. Foreign Currency Translation
Portfolio securities and other assets and liabilities denominated in foreign currencies are translated into U.S. dollars based on the exchange rate of such currencies against U.S. dollars on the date of valuation. The Fund may enter into foreign currency exchange contracts to facilitate transactions denominated in a foreign currency. Purchases and sales of securities, income and expense items denominated in foreign currencies are translated into U.S. dollars at the exchange rate in effect on the transaction date. Portfolio securities and assets and liabilities denominated in foreign currencies contain risks that those currencies will decline in value relative to the U.S. dollar. Occasionally, events may impact the availability or reliability of foreign exchange rates used to convert the U.S. dollar equivalent value. If such an event occurs, the foreign exchange rate will be valued at fair value using procedures established and approved by the Board.
The Fund does not separately report the effect of changes in foreign exchange rates from changes in market prices on securities held. Such changes are included in net realized and unrealized gain or loss from investments in the Statement of Operations.
Realized foreign exchange gains or losses arise from sales of foreign currencies, currency gains or losses realized between the trade and settlement dates on securities transactions and the difference between the recorded amounts of dividends, interest, and foreign withholding taxes and the U.S. dollar equivalent of the amounts actually received or paid. Net unrealized foreign exchange gains and losses arise from changes in foreign exchange rates on foreign denominated assets and liabilities other than investments in securities held at the end of the reporting period.
c. Joint Repurchase Agreement
The Fund enters into a joint repurchase agreement whereby its uninvested cash balance is deposited into a joint cash account with other funds managed by the investment manager or an affiliate of the investment manager and is used to invest in one or more repurchase agreements. The value and face amount of the joint repurchase agreement are allocated to the funds based on their pro-rata interest. A repurchase agreement is accounted for as a loan by the Fund to the seller, collateralized by securities which are delivered to the Fund’s custodian. The fair value, including accrued interest, of the initial collateralization is required to be at least 102% of the dollar amount invested by the funds, with the value of the underlying securities marked to market daily to maintain coverage of at least 100%. Repurchase agreements are subject to the terms of Master Repurchase Agreements (MRAs) with approved counterparties (sellers). The MRAs contain various provisions, including but not limited to events of default and maintenance of collateral for repurchase agreements. In the event of default by either the seller or the Fund, certain MRAs may permit the non-defaulting party to net and close-out all transactions, if any, traded under such agreements. The Fund may sell securities it holds as collateral and apply the proceeds towards the repurchase price and any other amounts owed by the seller to the Fund in the event of default by the seller. This could involve costs or delays in addition to a loss on the securities if their value falls below the repurchase price owed by the seller. The joint repurchase agreement held by the Fund at year end, as indicated in the Statement of Investments, had been entered into on March 31, 2015.
franklintempleton.com
Annual Report
| 27
FRANKLIN MUTUAL RECOVERY FUND
NOTES TO FINANCIAL STATEMENTS
1. Organization and Significant Accounting
Policies (continued)
d. Securities Purchased on a Delayed Delivery Basis
The Fund purchases securities on a delayed delivery basis, with payment and delivery scheduled for a future date. These transactions are subject to market fluctuations and are subject to the risk that the value at delivery may be more or less than the trade date purchase price. Although the Fund will generally purchase these securities with the intention of holding the securities, it may sell the securities before the settlement date. Sufficient assets have been segregated for these securities.
e. Derivative Financial Instruments
The Fund invested in derivatives in order to manage risk or gain exposure to various other investments or markets. Derivatives are financial contracts based on an underlying or notional amount, require no initial investment or an initial net investment that is smaller than would normally be required to have a similar response to changes in market factors, and require or permit net settlement. Derivatives contain various risks including the potential inability of the counterparty to fulfill their obligations under the terms of the contract, the potential for an illiquid secondary market, and/or the potential for market movements which expose the Fund to gains or losses in excess of the amounts shown in the Statement of Assets and Liabilities. Realized gain and loss and unrealized appreciation and depreciation on these contracts for the period are included in the Statement of Operations.
Derivative counterparty credit risk is managed through a formal evaluation of the creditworthiness of all potential counterparties. The Fund attempts to reduce its exposure to counterparty credit risk on OTC derivatives, whenever possible, by entering into International Swaps and Derivatives Association (ISDA) master agreements with certain counterparties. These agreements contain various provisions, including but not limited to collateral requirements, events of default, or early termination. Termination events applicable to the counterparty include certain deteriorations in the credit quality of the counterparty. Termination events applicable to the Fund include failure of the Fund to maintain certain net asset levels and/or limit the decline in net assets over various periods of time. In the event of default or early termination, the ISDA master agreement gives the non-defaulting party the right to net and close-out all transactions traded, whether or not arising under the ISDA agreement, to one net amount payable by one counterparty to the other. However, absent an event of default or early termination, OTC derivative assets and liabilities are presented gross and not offset in the Statement of Assets and Liabilities. Early termination by the counterparty may result in an immediate payment by the Fund of any net liability owed to that counterparty under the ISDA agreement. At March 31, 2015, the Fund had OTC derivatives in a net liability position of $702.
Collateral requirements differ by type of derivative. Collateral or initial margin requirements are set by the broker or exchange clearing house for exchange traded and centrally cleared derivatives. Initial margin deposited is held at the exchange and can be in the form of cash and/or securities. For OTC derivatives traded under an ISDA master agreement, posting of collateral is required by either the Fund or the applicable counterparty if the total net exposure of all OTC derivatives with the applicable counterparty exceeds the minimum transfer amount, which typically ranges from $100,000 to $250,000, and can vary depending on the counterparty and the type of the agreement. Generally, collateral is determined at the close of fund business each day and any additional collateral required due to changes in derivative values may be delivered by the Fund or the counterparty within a few business days. Collateral pledged and/or received by the Fund for OTC derivatives, if any, is held in segregated accounts with the Fund’s custodian/counterparty broker and can be in the form of cash and/or securities. Unrestricted cash may be invested according to the Fund’s investment objectives.
The Fund entered into OTC forward exchange contracts primarily to manage exposure to certain foreign currencies. A forward exchange contract is an agreement between the Fund and a coun-terparty to buy or sell a foreign currency at a specific exchange rate on a future date.
The Fund purchased or wrote exchange traded and/or OTC option contracts primarily to manage and/or gain exposure to equity price, interest rate and foreign exchange rate risk. An option is a contract entitling the holder to purchase or sell a specific amount of shares or units of an asset or notional amount of a swap (swaption), at a specified price. Options purchased are recorded as an asset while options written are recorded as a liability. Upon exercise of an option, the acquisition cost or sales proceeds of the underlying investment is adjusted by any premium received or paid. Upon expiration of an option, any premium received or paid is recorded as a realized gain or loss. Upon closing an option other than through expiration or exercise, the difference between the premium and the cost to close the position is recorded as a realized gain or loss.
See Notes 7 and 10 regarding investment transactions and other derivative information, respectively.
28 | Annual Report
franklintempleton.com
FRANKLIN MUTUAL RECOVERY FUND
NOTES TO FINANCIAL STATEMENTS
f. Restricted Cash
At March 31, 2015, the Fund held restricted cash in connection with investments in certain derivative securities. Restricted cash is held in a segregated account with the Fund’s custodian/counterparty broker and is reflected in the Statement of Assets and Liabilities.
g. Securities Sold Short
The Fund is engaged in selling securities short, which obligates the Fund to replace a borrowed security with the same security at current fair value. The Fund incurs a loss if the price of the security increases between the date of the short sale and the date on which the Fund replaces the borrowed security. The Fund realizes a gain if the price of the security declines between those dates. Gains are limited to the price at which the Fund sold the security short, while losses are potentially unlimited in size.
The Fund is required to establish a margin account with the broker lending the security sold short. While the short sale is outstanding, the broker retains the proceeds of the short sale to the extent necessary to meet margin requirements until the short position is closed out. A deposit must also be maintained with the Fund’s custodian/counterparty broker consisting of cash and/or securities having a value equal to a specified percentage of the value of the securities sold short. The Fund is obligated to pay fees for borrowing the securities sold short and is required to pay the counterparty any dividends and/or interest due on securities sold short. Such dividends and/or interest and any security borrowing fees are recorded as an expense to the Fund.
h. Securities Lending
The Fund participates in an agency based securities lending program to earn additional income. The Fund receives cash collateral against the loaned securities in an amount equal to at least 102% of the fair value of the loaned securities. Collateral is maintained over the life of the loan in an amount not less than 100% of the fair value of loaned securities, as determined at the close of fund business each day; any additional collateral required due to changes in security values is delivered to the Fund on the next business day. The collateral is deposited into a joint cash account with other funds and is used to invest in a money market fund managed by Franklin Advisers, Inc., an affiliate of the Fund and/or a joint repurchase agreement. The total cash collateral received at year end was $215,857. The Fund may receive income from the investment of cash collateral, in addition to lending fees and rebates paid by the borrower. Income from securities loaned is reported separately in the Statement of Operations. The Fund bears the market risk with respect to the collateral investment, securities loaned, and the risk that the agent may default on its obligations to the Fund. If the borrower defaults on its obligation to return the securities loaned, the Fund has the right to repurchase the securities in the open market using the collateral received. The securities lending agent has agreed to indemnify the Fund in the event of default by a third party borrower.
i. Senior Floating Rate Interests
The Fund invests in senior secured corporate loans that pay interest at rates which are periodically reset by reference to a base lending rate plus a spread. These base lending rates are generally the prime rate offered by a designated U.S. bank or the London InterBank Offered Rate (LIBOR). Senior secured corporate loans often require prepayment of principal from excess cash flows or at the discretion of the borrower. As a result, actual maturity may be substantially less than the stated maturity. Senior secured corporate loans in which the Fund invests are generally readily marketable, but may be subject to certain restrictions on resale.
j. Income and Deferred Taxes
It is the Fund’s policy to qualify as a regulated investment company under the Internal Revenue Code. The Fund intends to distribute to shareholders substantially all of its taxable income and net realized gains to relieve it from federal income and excise taxes. As a result, no provision for U.S. federal income taxes is required.
The Fund may be subject to foreign taxation related to income received, capital gains on the sale of securities and certain foreign currency transactions in the foreign jurisdictions in which it invests. Foreign taxes, if any, are recorded based on the tax regulations and rates that exist in the foreign markets in which the Fund invests. When a capital gain tax is determined to apply, the Fund records an estimated deferred tax liability in an amount that would be payable if the securities were disposed of on the valuation date. As a result of several court cases, in certain countries across the European Union, the Fund has filed additional tax reclaims for previously withheld taxes on dividends earned in those countries. These additional filings are subject to various administrative proceedings by the local jurisdictions’ tax authorities within the European Union, as well as a number of related judicial proceedings. At this time, uncertainty exists as to the ultimate resolution of these proceedings, the likelihood of receipt of these reclaims, and the potential timing of payment, and accordingly, no amounts are reflected in the financial statements.
franklintempleton.com
Annual Report
| 29
FRANKLIN MUTUAL RECOVERY FUND
NOTES TO FINANCIAL STATEMENTS
1. Organization and Significant Accounting
Policies (continued)
j. Income and Deferred Taxes (continued)
The Fund recognizes the tax benefits of uncertain tax positions only when the position is “more likely than not” to be sustained upon examination by the tax authorities based on the technical merits of the tax position. As of March 31, 2015, and for all open tax years, the Fund has determined that no liability for unrecognized tax benefits is required in the Fund’s financial statements related to uncertain tax positions taken on a tax return (or expected to be taken on future tax returns). Open tax years are those that remain subject to examination and are based on each tax jurisdiction’s statute of limitation.
k. Security Transactions, Investment Income, Expenses and Distributions
Security transactions are accounted for on trade date. Realized gains and losses on security transactions are determined on a specific identification basis. Interest income and estimated expenses are accrued daily. Amortization of premium and accretion of discount on debt securities are included in interest income. Dividend income and dividends declared on securities sold short are recorded on the ex-dividend date except for certain dividends from foreign securities where the dividend rate is not available. In such cases, the dividend is recorded as soon as the information is received by the Fund. Distributions to shareholders are recorded on the ex-dividend date and are determined according to income tax regulations (tax basis). Distributable earnings determined on a tax basis may differ from earnings recorded in accordance with U.S. GAAP. These differences may be permanent or temporary. Permanent differences are reclassified among capital accounts to reflect their tax character. These reclassifications have no impact on net assets or the results of operations. Temporary differences are not reclassified, as they may reverse in subsequent periods.
Realized and unrealized gains and losses and net investment income, not including class specific expenses, are allocated daily to each class of shares based upon the relative proportion of net assets of each class. Differences in per share distributions, by class, are generally due to differences in class specific expenses.
Distributions received by the Fund from certain securities may be a return of capital (ROC). Such distributions reduce the cost basis of the securities, and any distributions in excess of the cost basis are recognized as capital gains.
l. Accounting Estimates
The preparation of financial statements in accordance with U.S. GAAP requires management to make estimates and assumptions that affect the reported amounts of assets and liabilities at the date of the financial statements and the amounts of income and expenses during the reporting period. Actual results could differ from those estimates.
m. Guarantees and Indemnifications
Under the Fund’s organizational documents, its officers and trustees are indemnified by the Fund against certain liabilities arising out of the performance of their duties to the Fund. Additionally, in the normal course of business, the Fund enters into contracts with service providers that contain general indemnification clauses. The Fund’s maximum exposure under these arrangements is unknown as this would involve future claims that may be made against the Fund that have not yet occurred. Currently, the Fund expects the risk of loss to be remote.
2. Shares of Beneficial Interest
At March 31, 2015, there were an unlimited number of shares authorized ($0.01 par value). Transactions in the Fund’s shares were as follows:
| | | | | | | | | | | |
| | | | | Year Ended March 31, | | | | |
| | 2015 | | | | | | | | 2014 | |
| | Shares | | | Amount | | Shares | | | Amount | |
| Class A Shares: | | | | | | | | | | |
| Shares sold | 113,200 | | $ | 1,366,473 | | 237,257 | | $ | 2,706,828 | |
| Shares issued in reinvestment of distributions | 46,582 | | | 527,779 | | 29,347 | | | 342,770 | |
| Shares redeemed | (338,794 | ) | | (4,113,658 | ) | (508,115 | ) | | (5,689,646 | ) |
| Net increase (decrease) | (179,012 | ) | $ | (2,219,406 | ) | (241,511 | ) | $ | (2,640,048 | ) |
| |
| |
| 30 | Annual Report | | | | | | | | | franklintempleton.com | |
FRANKLIN MUTUAL RECOVERY FUND
NOTES TO FINANCIAL STATEMENTS
| | | | | | | | | | | | |
| | | | | Year Ended March 31, | | | | | |
| | 2015 | | | | | | | 2014 | | | |
| | Shares | | | Amount | | Shares | | | | Amount | |
| Class C Shares: | | | | | | | | | | | |
| Shares sold | 20,473 | | $ | 236,645 | | 72,520 | | | $ | 831,055 | |
| Shares issued in reinvestment of distributions | 11,686 | | | 131,117 | | 7,535 | | | | 87,101 | |
| Shares redeemed | (174,775 | ) | | (2,064,783 | ) | (321,451 | ) | | | (3,538,353 | ) |
| Net increase (decrease) | (142,616 | ) | $ | (1,697,021 | ) | (241,396 | ) | | $ | (2,620,197 | ) |
| Advisor Class Shares: | | | | | | | | | | | |
| Shares sold | 26,550 | | $ | 324,312 | | 78,426 | | | $ | 899,162 | |
| Shares issued in reinvestment of distributions | 77,383 | | | 882,162 | | 51,380 | | | | 604,225 | |
| Shares redeemed | (387,817 | ) | | (4,707,273 | ) | (402,482 | ) | | | (4,527,423 | ) |
| Net increase (decrease) | (283,884 | ) | $ | (3,500,799 | ) | (272,676 | ) | | $ | (3,024,036 | ) |
3. Tender Shares
On a quarterly basis, the Fund may make tender offers, the amount of which is determined by the Board, for the repurchase of at least 5% but not more than 25% of the shares outstanding. The repurchase price is the NAV on the repurchase pricing date.
4. Transactions with Affiliates
Franklin Resources, Inc. is the holding company for various subsidiaries that together are referred to as Franklin Templeton Investments. Certain officers and trustees of the Fund are also officers and/or directors of the following subsidiaries:
| | |
| Subsidiary | Affiliation |
| Franklin Mutual Advisers, LLC (Franklin Mutual) | Investment manager |
| Franklin Templeton Investment Management Limited (FTIML) | Investment manager |
| Franklin Templeton Services, LLC (FT Services) | Administrative manager |
| Franklin Templeton Distributors, Inc. (Distributors) | Principal underwriter |
| Franklin Templeton Investor Services, LLC (Investor Services) | Transfer agent |
a. Management Fees
The Fund pays Franklin Mutual an investment management fee comprised of a “base fee” and a “performance adjustment”. The base fee is calculated at the beginning of each month using an annual rate of 1.50% of the prior month’s average daily net assets. The performance adjustment is calculated at the beginning of each month based on how much the Fund’s total return exceeded or lagged its performance fee index, the Bloomberg/EFFAS U.S. Government 3-5 Years Total Return Index, (Fund performance differential), over the preceding twelve-month period (performance period). A performance adjustment is applicable if the Fund performance differential exceeds 1.00%, either upwards (an increase to the base fee) or downwards (a decrease to the base fee). The performance adjustment rate is equal to 0.01% for each additional 0.05% that the Fund performance differential exceeds 1.00%. The performance adjustment amount is determined by multiplying the performance adjustment rate by the average daily net assets of the performance period. The performance adjustment rate may not exceed 1.00% annualized, either upwards or downwards. At the end of each month, an annualized investment management fee ratio is calculated (total investment management fees divided by fiscal year to date average daily net assets). In accordance with the Investment Management Agreement, the investment management fee ratio may not exceed 2.50% or fall below 0.50% for the fiscal year. For the year, the total annualized management fee rate, including the performance adjustment, was 2.05% of the average daily net assets of the Fund.
Franklin Mutual has contractually agreed to waive or limit its fees so that the management fees paid by the Fund do not exceed an annual rate of 0.50% of the Fund’s average daily net assets through July 31, 2015.
franklintempleton.com
Annual Report
| 31
FRANKLIN MUTUAL RECOVERY FUND
NOTES TO FINANCIAL STATEMENTS
4. Transactions with Affiliates (continued)
a. Management Fees (continued)
Effective August, 1, 2014, under a subadvisory agreement, FTIML, an affiliate of Franklin Mutual, provides subadvisory services to the Fund. The Subadvisory fee is paid by Franklin Mutual based on the Fund’s average daily net assets, and is not an additional expense of the Fund.
b. Administrative Fees
The Fund pays an administrative fee to FT Services of 0.20% per year of the average daily net assets of the Fund.
c. Distribution Fees
The Board has adopted distribution plans for each share class, with the exception of Advisor Class shares, pursuant to Rule 12b-1 under the 1940 Act. Distribution fees are not charged on shares held by affiliates. Under the Fund’s Class A reimbursement distribution plan, the Fund reimburses Distributors for costs incurred in connection with the servicing, sale and distribution of the Fund’s shares up to the maximum annual plan rate. Under the Class A reimbursement distribution plan, costs exceeding the maximum for the current plan year cannot be reimbursed in subsequent periods. In addition, under the Fund’s Class C compensation distribution plan, the Fund pays Distributors for costs incurred in connection with the servicing, sale and distribution of the Fund’s shares up to the maximum annual plan rate. The plan year, for purposes of monitoring compliance with the maximum annual plan rates, is February 1 through January 31.
The maximum annual plan rates, based on the average daily net assets, for each class, are as follows:
The Board has set the current rate at 0.30% per year for Class A shares until further notice and approval by the Board.
d. Sales Charges/Underwriting Agreements
Front-end sales charges and contingent deferred sales charges (CDSC) do not represent expenses of the Fund. These charges are deducted from the proceeds of sales of Fund shares prior to investment or from redemption proceeds prior to remittance, as applicable. Distributors has advised the Fund of the following commission transactions related to the sales and redemptions of the Fund’s shares for the year:
| | | |
| Sales charges retained net of commissions paid to unaffiliated | | |
| broker/dealers | $ | 3,909 |
| CDSC retained | $ | 210 |
e. Transfer Agent Fees
Each class of shares pays transfer agent fees to Investor Services for its performance of shareholder servicing obligations and reimburses Investor Services for out of pocket expenses incurred, including shareholding servicing fees paid to third parties. These fees are allocated daily based upon their relative proportion of such classes’ aggregate net assets.
For the year ended March 31, 2015, the Fund paid transfer agent fees of $67,716, of which $27,234 was retained by Investor Services.
f. Waiver and Expense Reimbursements
Franklin Mutual and FT Services have contractually agreed in advance to waive or limit their respective fees and to assume as their own expense certain expenses otherwise payable by the Fund so that the expenses (excluding distribution fees, acquired fund fees and expenses, and expense on securities sold short) for each class of the Fund do not exceed 1.20% based on the average net assets of each class (other than certain non-routine expenses or costs, including those relating to litigation, indemnification, reorganizations and liquidations) until July 31, 2015.
32 | Annual Report
franklintempleton.com
FRANKLIN MUTUAL RECOVERY FUND
NOTES TO FINANCIAL STATEMENTS
5. Expense Offset Arrangement
The Fund has entered into an arrangement with its custodian whereby credits realized as a result of uninvested cash balances are used to reduce a portion of the Fund’s custodian expenses. During the year ended March 31, 2015, the custodian fees were reduced as noted in the Statement of Operations.
6. Income Taxes
For tax purposes, capital losses may be carried over to offset future capital gains. Capital loss carryforwards with no expiration, if any, must be fully utilized before those losses with expiration dates.
| | | |
| At March 31, 2015, capital loss carryforwards were as follows: | | |
| Capital loss carryforwards subject to expiration: | | |
| 2017 | $ | 44,141,197 |
| 2018 | | 73,758,943 |
| 2019 | | 18,751,585 |
| Capital loss carryforwards not subject to expiration: | | |
| Long term | | 4,240,417 |
| Total capital loss carryforwards | $ | 140,892,142 |
During the year ended March 31, 2015, the Fund utilized $4,522,672 of capital loss carryforwards.
The tax character of distributions paid during the years ended March 31, 2015 and 2014, was as follows:
| | | | | |
| | | 2015 | | 2014 |
| Distributions paid from ordinary income | $ | 2,146,111 | $ | 1,452,368 |
At March 31, 2015, the cost of investments, net unrealized appreciation (depreciation) and undistributed ordinary income for income tax purposes were as follows:
| | | | |
| Cost of investments | $ | 45,324,010 | |
| |
| Unrealized appreciation | $ | 3,873,509 | |
| Unrealized depreciation | | (6,896,066 | ) |
| Net unrealized appreciation (depreciation) | $ | (3,022,557 | ) |
| |
| Distributable earnings – undistributed ordinary income | $ | 294,442 | |
Differences between income and/or capital gains as determined on a book basis and a tax basis are primarily due to differing treatments of foreign currency transactions.
7. Investment Transactions
Purchases and sales of investments (excluding short term securities and securities sold short) for the year ended March 31, 2015, aggregated $16,932,642 and $30,985,558, respectively.
franklintempleton.com
Annual Report
| 33
FRANKLIN MUTUAL RECOVERY FUND
NOTES TO FINANCIAL STATEMENTS
7. Investment Transactions (continued)
Transactions in options written during the year ended March 31, 2015, were as follows:
| | | | | | |
| | Number of | | | | |
| | Contracts | | | Premiums | |
| Options outstanding at March 31, 2014 | 38 | | $ | 9,479 | |
| Options written | 173 | | | 69,323 | |
| Options expired | (138 | ) | | (20,738 | ) |
| Options exercised | (15 | ) | | (6,351 | ) |
| Options closed | (58 | ) | | (51,713 | ) |
| Options outstanding at March 31, 2015 | — | | $ | — | |
See Notes 1(e) and 10 regarding derivative financial instruments and other derivative information, respectively.
8. Credit Risk and Defaulted Securities
The Fund may purchase the pre-default or defaulted debt of distressed companies. Distressed companies are financially troubled and are about to be or are already involved in financial restructuring or bankruptcy. Risks associated with purchasing these securities include the possibility that the bankruptcy or other restructuring process takes longer than expected, or that distributions in restructuring are less than anticipated, either or both of which may result in unfavorable consequences to the Fund. If it becomes probable that the income on debt securities, including those of distressed companies, will not be collected, the Fund discontinues accruing income and recognizes an adjustment for uncollectible interest.
At March 31, 2015, the aggregate long value of distressed company securities for which interest recognition has been discontinued was $5,778,778, representing 11.34% of the Fund’s net assets. For information as to specific securities, see the accompanying Statement of Investments.
9. Restricted Securities
The Fund invests in securities that are restricted under the Securities Act of 1933 (1933 Act) or which are subject to legal, contractual, or other agreed upon restrictions on resale. Restricted securities are often purchased in private placement transactions, and cannot be sold without prior registration unless the sale is pursuant to an exemption under the 1933 Act. Disposal of these securities may require greater effort and expense, and prompt sale at an acceptable price may be difficult. The Fund may have registration rights for restricted securities. The issuer generally incurs all registration costs.
At March 31, 2015, the Fund held investments in restricted securities, excluding certain securities exempt from registration under the 1933 Act deemed to be liquid, as follows:
| | | | | | | |
| | | Acquisition | | | | |
| Shares | Issuer | Dates | | Cost | | Value |
| 1,439,821 | CB FIM Coinvestors LLC | 1/15/09 – 6/02/09 | $ | — | $ | — |
| 1,801,197 | FIM Coinvestor Holdings I, LLC | 11/20/06 – 6/02/09 | | — | | — |
| 185,241 | International Automotive Components Group Brazil LLC | 4/13/06 – 12/26/08 | | 123,016 | | 10,499 |
| 1,263,310 | International Automotive Components Group North America LLC | 3/15/06 – 3/18/13 | | 1,026,600 | | 1,158,116 |
| | Total Restricted Securities (Value is 2.29% of Net Assets) | | $ | 1,149,616 | $ | 1,168,615 |
34 | Annual Report franklintempleton.com
FRANKLIN MUTUAL RECOVERY FUND
NOTES TO FINANCIAL STATEMENTS
10. Other Derivative Information
At March 31, 2015, the Fund’s investments in derivative contracts are reflected in the Statement of Assets and Liabilities as follows:
| | | | | | | |
| | Asset Derivatives | | | Liability Derivatives | | |
| Derivative Contracts | | | | | | |
| Not Accounted for as | Statement of Assets and | | | Statement of Assets and | | |
| Hedging Instruments | Liabilities Location | | Fair Value | Liabilities Location | | Fair Value |
| Foreign exchange contracts | Unrealized appreciation on forward | $ | 346,566 | Unrealized depreciation on | $ | 23,755 |
| | exchange contracts | | | forward exchange contracts | | |
For the year ended March 31, 2015, the effect of derivative contracts in the Fund’s Statement of Operations was as follows:
| | | | | | | | |
| | | | | | | Change in | |
| | | | | | | Unrealized | |
| Derivative Contracts | Realized Gain | | | Appreciation | |
| Not Accounted for as | | | (Loss) for | | | (Depreciation) | |
| Hedging Instruments | Statement of Operations Locations | | the Year | | | for the Year | |
| Interest rate contracts | Net realized gain (loss) from investments / Net change in unrealized | $ | (129,093 | ) | $ | 121,051 | |
| | appreciation (depreciation) on investments | | | | | | |
| Foreign exchange contracts | Net realized gain (loss) from investments and foreign currency | | 1,019,617 | | | 323,322 | |
| | transactions / Net change in unrealized appreciation (depreciation) on | | | | | | |
| | investments and translation of other assets and liabilities | | | | | | |
| | denominated in foreign currencies | | | | | | |
| Equity contracts | Net realized gain (loss) from written options / Net change in unrealized | | 53,973 | | | (3,969 | ) |
| | appreciation (depreciation) on investments | | | | | | |
For the year ended March 31, 2015, the average month end fair value of derivatives represented 1.14% of average month end net assets. The average month end number of open derivative contracts for the year was 153.
See Notes 1(e) and 7 regarding derivative financial instruments and investment transactions, respectively.
11. Upcoming Acquisitions/Reorganization
On February 25, 2015, the Board for the Fund approved a proposal to reorganize the Fund with and into Franklin Mutual Quest Fund, subject to approval by the shareholders of the Fund.
12. Credit Facility
The Fund participated in a $5 million senior unsecured revolving credit facility to fund shareholder redemptions or meet unfunded loan commitments. Under the terms of the credit facility, which expired on May 23, 2014, and will not be extended for subsequent periods on the same or different terms, the Fund shall, in addition to interest charged on any borrowings made by the Fund, pay an annual commitment fee based upon the unused portion of the credit facility. During the year ended March 31, 2015, the Fund did not utilize the credit facility.
franklintempleton.com
Annual Report
| 35
FRANKLIN MUTUAL RECOVERY FUND
NOTES TO FINANCIAL STATEMENTS
13. Fair Value Measurements
The Fund follows a fair value hierarchy that distinguishes between market data obtained from independent sources (observable inputs) and the Fund’s own market assumptions (unobservable inputs). These inputs are used in determining the value of the Fund’s financial instruments and are summarized in the following fair value hierarchy:
- Level 1 – quoted prices in active markets for identical financial instruments
- Level 2 – other significant observable inputs (including quoted prices for similar financial instruments, interest rates, prepay- ment speed, credit risk, etc.)
- Level 3 – significant unobservable inputs (including the Fund’s own assumptions in determining the fair value of financial instruments)
The input levels are not necessarily an indication of the risk or liquidity associated with financial instruments at that level.
For movements between the levels within the fair value hierarchy, the Fund has adopted a policy of recognizing the transfers as of the date of the underlying event which caused the movement.
A summary of inputs used as of March 31, 2015, in valuing the Fund’s assets and liabilities carried at fair value, is as follows:
| | | | | | | | | | |
| | | Level 1 | | Level 2 | | Level 3 | | | Total |
| Assets: | | | | | | | | | |
| Investments in Securities: | | | | | | | | | |
| Equity Investments:a | | | | | | | | | |
| Auto Components | $ | — | $ | — | $ | 1,168,615 | | $ | 1,168,615 |
| Communications Equipment | | — | | — | | 196,040 | | | 196,040 |
| Energy Equipment & Services | | 723,195 | | — | | 1,370,355 | | | 2,093,550 |
| All Other Equity Investmentsb | | 21,183,601 | | — | | —c | | | 21,183,601 |
| Corporate Bonds, Notes and Senior Floating Rate Interests | | — | | 9,703,150 | | — | | | 9,703,150 |
| Corporate Bonds, Notes and Senior Floating Rate Interests | | | | | | | | | |
| in Reorganization | | — | | 5,778,778 | | — | | | 5,778,778 |
| Companies in Liquidation | | 178,867 | | 774,707 | | 43,788 | c | | 997,362 |
| Municipal Bonds | | — | | 164,500 | | — | | | 164,500 |
| Short Term Investments | | — | | 1,015,857 | | — | | | 1,015,857 |
| Total Investments in Securities | $ | 22,085,663 | $ | 17,436,992 | $ | 2,778,798 | | $ | 42,301,453 |
| Other Financial Instruments | | | | | | | | | |
| Forward Exchange Contracts | $ | — | $ | 346,566 | $ | — | | $ | 346,566 |
| Liabilities: | | | | | | | | | |
| Other Financial Instruments | | | | | | | | | |
| Securities Sold Short | $ | 1,731,780 | $ | — | $ | — | | $ | 1,731,780 |
| Forward Exchange Contracts | | — | | 23,755 | | — | | | 23,755 |
| Total Other Financial Instruments | $ | 1,731,780 | $ | 23,755 | $ | — | | $ | 1,755,535 |
aIncludes common and preferred stocks as well as other equity investments.
bFor detailed categories, see the accompanying Statement of Investments.
cIncludes securities determined to have no value at March 31, 2015.
36 | Annual Report
franklintempleton.com
FRANKLIN MUTUAL RECOVERY FUND
NOTES TO FINANCIAL STATEMENTS
A reconciliation of assets in which Level 3 inputs are used in determining fair value is presented when there are significant Level 3 financial instruments at the end of the year. At March 31, 2015, the reconciliation of assets, are as follows:
| | | | | | | | | | | | | | | | | | | | | | |
| | | | | | | | | | | | | | | | | | | | | Net Change | |
| | | | | | | | | | | | | | | | | | | | | in Unrealized | |
| | | | | | | | | | | | | Net | | Net | | | | | | Appreciation | |
| | | Balance at | | | | Transfers | | Transfers | | | | Realized | | Unrealized | | | Balance | | | (Depreciation) | |
| | | Beginning | | Purchases | | Into | | Out of | | Cost Basis | | Gain | | Appreciation | | | at End | | | on Assets Held | |
| | | of Year | | (Sales) | | Level 3a | | Level 3 | | Adjustments | | (Loss) (Depreciation) | | | of Year | | | at Year End | |
| Assets: | | | | | | | | | | | | | | | | | | | | | |
| Investments in Securities: | | | | | | | | | | | | | | | | | | | | | |
| Equity Investments:b | | | | | | | | | | | | | | | | | | | | | |
| Auto Components | $ | 1,143,570 | $ | — | $ | — | $ | — | $ | — | $ | — | $ | 25,045 | | $ | 1,168,615 | | $ | 25,045 | |
| Communications Equipment | | — | | — | | — | | — | | — | | — | | 196,040 | | | 196,040 | | | 196,040 | |
| Energy Equipment & Services | | 2,466,639 | | — | | — | | — | | — | | — | | (1,096,284 | ) | | 1,370,355 | | | (1,096,284 | ) |
| Companies in Liquidation | | —c | | — | | 35,411 | | — | | — | | — | | 8,377 | | | 43,788 | c | | 8,377 | |
| Total | $ | 3,610,209 | $ | — | $ | 35,411 | $ | — | $ | — | $ | — | $ | (866,822 | ) | $ | 2,778,798 | | $ | (866,822 | ) |
aThe investment was transferred into Level 3 as a result of its value being determined using a significant unobservable input.
bIncludes common stocks as well as other equity investments.
cIncludes securities determined to have no value.
Significant unobservable valuation inputs developed by the VLOC for material Level 3 financial instruments and impact to fair value as a result of changes in unobservable valuation inputs as of March 31, 2015, are as follows:
| | | | | | | | |
| | | | | | | | Impact to Fair |
| | | Fair Value at | Valuation | | | | Value if Input |
| Description | | End of Year | Technique | Unobservable Inputs | Amount | | Increasesa |
| Assets: | | | | | | | |
| Investments in Securities: | | | | | | | |
| Equity Investments: | | | | | | | |
| Auto Components | $ | 1,158,116 | Market | Discount for lack of marketability | 10 | % | Decreaseb |
| | | | comparables | EV / EBITDA multiple | 4.3 | x | Increaseb |
| All Other Investmentsc | | 1,620,682 | | | | | |
| Total | $ | 2,778,798 | | | | | |
aRepresents the directional change in the fair value of the Level 3 financial instruments that would result from a significant and reasonable increase in the corresponding
input. A significant and reasonable decrease in the input would have the opposite effect. Significant impacts, if any, to fair value and/or net assets have been indicated.
bRepresents a significant impact to fair value and net assets.
cIncludes fair value of immaterial financial instruments developed using various valuation techniques and unobservable inputs. May also include financial instruments with
values derived using prior transaction prices or third party pricing information without adjustment for which such inputs are also unobservable.
| | |
| Abbreviations List |
| |
| EBITDA | Earnings before interest, taxes, depreciation and amortization |
| EV | Enterprise value |
franklintempleton.com
Annual Report
| 37
FRANKLIN MUTUAL RECOVERY FUND
NOTES TO FINANCIAL STATEMENTS
14. New Accounting Pronouncements
In June 2014, the Financial Accounting Standards Board issued Accounting Standards Update (ASU) No. 2014-11, Transfers and Servicing (Topic 860), Repurchase-to-Maturity Transactions, Repurchase Financings, and Disclosures. The ASU changes the accounting for certain repurchase agreements and expands disclosure requirements related to repurchase agreements, securities lending, repurchase-to-maturity and similar transactions. The ASU is effective for interim and annual reporting periods beginning after December 15, 2014. Management has reviewed the requirements and believes the adoption of this ASU will not have a material impact on the financial statements.
15. Subsequent Events
The Fund has evaluated subsequent events through the issuance of the financial statements and determined that no events have occurred that require disclosure.
| | | | | | |
| Abbreviations | | | | |
| Counterparty | Currency | Selected Portfolio |
| BANT | Bank of America N.A. | CAD | Canadian Dollar | ADR | American Depositary Receipt |
| BBU | Barclays Bank PLC | EUR | Euro | FHLB | Federal Home Loan Bank |
| BONY | Bank of New York Mellon | USD | United States Dollar | GO | General Obligation |
| DBFX | Deutsche Bank AG | | | PIK | Payment-In-Kind |
| FBCO | Credit Suisse Group AG | | | | |
| HSBC | HSBC Bank USA, N.A. | | | | |
| SSBT | State Street Bank and Trust Co., N.A. | | | | |
38 | Annual Report
franklintempleton.com
FRANKLIN MUTUAL RECOVERY FUND
Report of Independent Registered Public Accounting Firm
To the Board of Trustees and Shareholders of Franklin Mutual Recovery Fund:
We have audited the accompanying statement of assets and liabilities, including the statement of investments, of Franklin Mutual Recovery Fund (the “Fund”), as of March 31, 2015, and the related statement of operations for the year then ended, the statements of changes in net assets for each of the two years in the period then ended, and the financial highlights for each of the five years in the period then ended. These financial statements and financial highlights are the responsibility of the Fund’s management. Our responsibility is to express an opinion on these financial statements and financial highlights based on our audits.
We conducted our audits in accordance with the standards of the Public Company Accounting Oversight Board (United States). Those standards require that we plan and perform the audit to obtain reasonable assurance about whether the financial statements and financial highlights are free of material misstatement. We were not engaged to perform an audit of the Fund’s internal control over financial reporting. Our audits included consideration of internal control over financial reporting as a basis for designing audit procedures that are appropriate in the circumstances, but not for the purpose of expressing an opinion on the effectiveness of the Fund’s internal control over financial reporting. Accordingly, we express no such opinion. An audit also includes examining, on a test basis, evidence supporting the amounts and disclosures in the financial statements and financial highlights, assessing the accounting principles used and significant estimates made by management, and evaluating the overall financial statement presentation. Our procedures included confirmation of securities owned as of March 31, 2015, by correspondence with the custodian and brokers or by other appropriate auditing procedures where replies from the brokers were not received. We believe that our audits provide a reasonable basis for our opinion.
In our opinion, the financial statements and financial highlights referred to above present fairly, in all material respects, the financial position of Franklin Mutual Recovery Fund at March 31, 2015, the results of its operations for the year then ended, the changes in its net assets for each of the two years in the period then ended, and the financial highlights for each of the five years in the period then ended, in conformity with U.S. generally accepted accounting principles.

Boston, Massachusetts
May 19, 2015
franklintempleton.com
Annual Report
| 39
FRANKLIN MUTUAL RECOVERY FUND
Tax Information (unaudited)
Under Section 854(b)(1)(A) of the Internal Revenue Code (Code), the Fund hereby reports 10.97% of the ordinary income dividends as income qualifying for the dividends received deduction for the fiscal year ended March 31, 2015.
Under Section 854(b)(1)(B) of the Code, the Fund hereby reports the maximum amount allowable but no less than $576,374 as qualified dividends for purposes of the maximum rate under Section 1(h)(11) of the Code for the fiscal year ended March 31, 2015. Distributions, including qualified dividend income, paid during calendar year 2015 will be reported to shareholders on Form 1099-DIV by mid-February 2016. Shareholders are advised to check with their tax advisors for information on the treatment of these amounts on their individual income tax returns.
40 | Annual Report
franklintempleton.com
FRANKLIN MUTUAL RECOVERY FUND
Board Members and Officers
The name, year of birth and address of the officers and board members, as well as their affiliations, positions held with the Trust, principal occupations during at least the past five years and number of portfolios overseen in the Franklin Templeton Investments fund complex are shown below. Generally, each board member serves until that person’s successor is elected and qualified.
| | | | | |
| Independent Board Members | | | |
| |
| | | | Number of Portfolios in | |
| Name, Year of Birth | | Length of | Fund Complex Overseen | Other Directorships Held |
| and Address | Position | Time Served | by Board Member* | During at Least the Past 5 Years |
| |
| Edward I. Altman, Ph.D. (1941) | Trustee | Since 2003 | 17 | None |
| c/o Franklin Mutual Advisers, LLC | | | | |
| 101 John F. Kennedy Parkway | | | | |
| Short Hills, NJ 07078-2789 | | | | |
| |
| Principal Occupation During at Least the Past 5 Years: | | |
| Max L. Heine Professor of Finance and Director of The Credit and Debt Markets Research Program, Salomon Center, Stern School of |
| Business, New York University; editor and author of numerous financial publications; financial consultant; an adviser to numerous financial and |
| publishing organizations; and formerly, Vice Director, Salomon Center, Stern School of Business, New York University. |
| |
| Ann Torre Bates (1958) | Trustee | Since 2003 | 43 | Navient Corporation (loan manage- |
| c/o Franklin Mutual Advisers, LLC | | | | ment, servicing and asset recovery) |
| 101 John F. Kennedy Parkway | | | | (2014-present), Ares Capital |
| Short Hills, NJ 07078-2789 | | | | Corporation (specialty finance |
| | | | | company) (2010-present), United |
| | | | | Natural Foods, Inc. (distributor of |
| | | | | natural, organic and specialty foods) |
| | | | | (2013-present), Allied Capital |
| | | | | Corporation (financial services) |
| | | | | (2003-2010) and SLM Corporation |
| | | | | (Sallie Mae) (1997-2014). |
| |
| Principal Occupation During at Least the Past 5 Years: | | |
| Director of various companies; and formerly, Executive Vice President and Chief Financial Officer, NHP Incorporated (manager of multifamily |
| housing) (1995-1997); and Vice President and Treasurer, US Airways, Inc. (until 1995). | |
| |
| Burton J. Greenwald (1929) | Trustee | Since 2003 | 17 | Franklin Templeton Emerging Markets |
| c/o Franklin Mutual Advisers, LLC | | | | Debt Opportunities Fund PLC and |
| 101 John F. Kennedy Parkway | | | | Fiduciary International Ireland Limited. |
| Short Hills, NJ 07078-2789 | | | | |
| |
| Principal Occupation During at Least the Past 5 Years: | | |
| Managing Director, B.J. Greenwald Associates (management consultants to the financial services industry); and formerly, Chairman, |
| Fiduciary Trust International Funds; Executive Vice President, L.F Rothschild Fund Management, Inc.; President and Director, Merit Mutual |
| Funds; President, Underwriting Division and Director, National Securities & Research Corporation; Governor, Investment Company Institute; |
| and Chairman, ICI Public Information Committee. | | | |
| |
| Keith E. Mitchell (1954) | Trustee | Since 2009 | 17 | None |
| c/o Franklin Mutual Advisers, LLC | | | | |
| 101 John F. Kennedy Parkway | | | | |
| Short Hills, NJ 07078-2789 | | | | |
| |
| Principal Occupation During at Least the Past 5 Years: | | |
| Director of various boards of asset management firms; and formerly, Managing Member, Mitchell, Hartley & Bechtel Advisers, LLC (formerly, |
| Mitchell Advisers, LLC) (advisory firm) (2003-2015); and Managing Director, Putnam Lovell NBF. | |
franklintempleton.com
Annual Report
| 41
| | | | | | |
| FRANKLIN MUTUAL RECOVERY FUND | | | | |
| |
| |
| |
| |
| Independent Board Members (continued) | | | |
| |
| | | | | Number of Portfolios in | |
| Name, Year of Birth | | Length of | | Fund Complex Overseen | Other Directorships Held |
| and Address | Position | Time Served | | by Board Member* | During at Least the Past 5 Years |
| |
| Charles Rubens II (1930) | Trustee | Since 2003 | | 17 | None |
| c/o Franklin Mutual Advisers, LLC | | | | | |
| 101 John F. Kennedy Parkway | | | | | |
| Short Hills, NJ 07078-2789 | | | | | |
| |
| Principal Occupation During at Least the Past 5 Years: | | | |
| Private investor and president of non-profit organizations; and formerly, an executive of Time, Inc.; and Trustee of Colorado College. |
| |
| Jan Hopkins Trachtman (1947) | Trustee | Since 2009 | | 17 | None |
| c/o Franklin Mutual Advisers, LLC | | | | | |
| 101 John F. Kennedy Parkway | | | | | |
| Short Hills, NJ 07078-2789 | | | | | |
| |
| Principal Occupation During at Least the Past 5 Years: | | | |
| President and Founder, The Jan Hopkins Group (communications consulting firm); President, Economic Club of New York; serves on Advisory |
| Board of Knight Bagehot Fellowship; and formerly, Anchor/Correspondent, CNN Financial News (until 2003); Managing Director and Head of |
| Client Communications, Citigroup Private Bank (until 2005); Off-Air Reporter, ABC News’ World News Tonight; and Editor, CBS Network News. |
| |
| Robert E. Wade (1946) | Trustee and | Trustee since | | 43 | El Oro Ltd (investments) |
| c/o Franklin Mutual Advisers, LLC Chairman of | 2003 and | | | (2003-present). |
| 101 John F. Kennedy Parkway | the Board | Chairman of the | | | |
| Short Hills, NJ 07078-2789 | | Board since 2005 | | | |
| |
| Principal Occupation During at Least the Past 5 Years: | | | |
| Attorney at law engaged in private practice (1972-2008) and member of various boards. | |
| |
| |
| |
| Interested Board Members and Officers | | | |
| |
| | | | | Number of Portfolios in | |
| Name, Year of Birth | | Length of | | Fund Complex Overseen | Other Directorships Held |
| and Address | Position | Time Served | | by Board Member* | During at Least the Past 5 Years |
| |
| **Gregory E. Johnson (1961) | Trustee | Since 2007 | | 155 | None |
| One Franklin Parkway | | | | | |
| San Mateo, CA 94403-1906 | | | | | |
| |
| |
| Principal Occupation During at Least the Past 5 Years: | | | |
| Chairman of the Board, Member – Office of the Chairman, Director, President and Chief Executive Officer, Franklin Resources, Inc.; officer |
| and/or director or trustee, as the case may be, of some of the other subsidiaries of Franklin Resources, Inc. and of 46 of the investment |
| companies in Franklin Templeton Investments; and Vice Chairman, Investment Company Institute. | |
| |
| **Peter A. Langerman (1955) | Trustee, | Trustee since | | 8 | American International Group, Inc. |
| c/o Franklin Mutual Advisers, LLC President, and | 2007, President, | | | (AIG) Credit Facility Trust (2010-2011). |
| 101 John F. Kennedy Parkway | Chief Executive and Chief | | | |
| Short Hills, NJ 07078-2702 | Officer – | Executive Officer – | | | |
| | Investment | Investment | | | |
| | Management | Management | | | |
| | | since 2005 | | | |
| |
| Principal Occupation During at Least the Past 5 Years: | | | |
| Chairman of the Board, Chief Executive Officer and President, Franklin Mutual Advisers, LLC; officer and/or director, as the case may be, |
| of four of the investment companies in Franklin Templeton Investments. | | | |
42 | Annual Report
franklintempleton.com
FRANKLIN MUTUAL RECOVERY FUND
| | | | | |
| Interested Board Members and Officers (continued) | |
| |
| | | | Number of Portfolios in | |
| Name, Year of Birth | | Length of | Fund Complex Overseen | Other Directorships Held |
| and Address | Position | Time Served | by Board Member* | During at Least the Past 5 Years |
| |
| Alison E. Baur (1964) | Vice President | Since 2012 | Not Applicable | Not Applicable |
| One Franklin Parkway | | | | |
| San Mateo, CA 94403-1906 | | | | |
| |
| Principal Occupation During at Least the Past 5 Years: | | |
| Deputy General Counsel, Franklin Templeton Investments; and officer of some of the other subsidiaries of Franklin Resources, Inc. and of 46 |
| of the investment companies in Franklin Templeton Investments. | | |
| |
| Philippe Brugere-Trelat (1949) | Vice President | Since 2005 | Not Applicable | Not Applicable |
| 101 John F. Kennedy Parkway | | | | |
| Short Hills NJ 07078-2789 | | | | |
| |
| Principal Occupation During at Least the Past 5 Years: | | |
| Executive Vice President, Franklin Mutual Advisers, LLC; officer of three of the investment companies in Franklin Templeton Investments; and |
| formerly, Portfolio Manager of Eurovest SA (French registered Investment Company, Sicav). | |
| |
| Laura F. Fergerson (1962) | Chief | Since 2009 | Not Applicable | Not Applicable |
| One Franklin Parkway | Executive | | | |
| San Mateo, CA 94403-1906 | Officer – | | | |
| | Finance and | | | |
| | Administration | | | |
| Principal Occupation During at Least the Past 5 Years: | | |
| Senior Vice President, Franklin Templeton Services, LLC; and officer of 46 of the investment companies in Franklin Templeton Investments. |
| |
| Aliya S. Gordon (1973) | Vice President | Since 2009 | Not Applicable | Not Applicable |
| One Franklin Parkway | | | | |
| San Mateo, CA 94403-1906 | | | | |
| Principal Occupation During at Least the Past 5 Years: | | |
| Senior Associate General Counsel, Franklin Templeton Investments; officer of 46 of the investment companies in Franklin Templeton |
| Investments; and formerly, Litigation Associate, Steefel, Levitt & Weiss, LLP (2000-2004). | |
| |
| Steven J. Gray (1955) | Secretary and | Secretary since | Not Applicable | Not Applicable |
| One Franklin Parkway | Vice President | 2005 and Vice | | |
| San Mateo, CA 94403-1906 | | President since | | |
| | | 2009 | | |
| |
| Principal Occupation During at Least the Past 5 Years: | | |
| Senior Associate General Counsel, Franklin Templeton Investments; Vice President, Franklin Templeton Distributors, Inc. and Franklin |
| Alternative Strategies Advisers, LLC; and officer of 46 of the investment companies in Franklin Templeton Investments. |
| |
| Selena L. Holmes (1965) | Vice President | Since 2012 | Not Applicable | Not Applicable |
| 100 Fountain Parkway | – AML | | | |
| St. Petersburg, FL 33716-1205 | Compliance | | | |
| |
| Principal Occupation During at Least the Past 5 Years: | | |
| Director, Global Compliance Monitoring; Chief Compliance Officer, Franklin Alternative Strategies Advisers, LLC; Vice President, Franklin |
| Templeton Companies, LLC; and officer of 46 of the investment companies in Franklin Templeton Investments. |
franklintempleton.com
Annual Report
| 43
| | | | | |
| FRANKLIN MUTUAL RECOVERY FUND | | | |
| |
| |
| |
| |
| Interested Board Members and Officers (continued) | |
| |
| | | | Number of Portfolios in | |
| Name, Year of Birth | | Length of | Fund Complex Overseen | Other Directorships Held |
| and Address | Position | Time Served | by Board Member* | During at Least the Past 5 Years |
| |
| Robert G. Kubilis (1973) | Treasurer, | Since 2012 | Not Applicable | Not Applicable |
| 300 S.E. 2nd Street | Chief Financial | | | |
| Fort Lauderdale, FL 33301-1923 | Officer and | | | |
| | Chief | | | |
| | Accounting | | | |
| | Officer | | | |
| Principal Occupation During at Least the Past 5 Years: | | |
| Treasurer, U.S. Products and Client Services, Franklin Templeton Investments; and officer of five of the investment companies in Franklin |
| Templeton Investments. | | | | |
| |
| Kimberly H. Novotny (1972) | Vice President | Since 2013 | Not Applicable | Not Applicable |
| 300 S.E. 2nd Street | | | | |
| Fort Lauderdale, FL 33301-1923 | | | | |
| |
| Principal Occupation During at Least the Past 5 Years: | | |
| Associate General Counsel, Franklin Templeton Investments; Vice President and Secretary, Fiduciary Trust International of the South; Vice |
| President, Templeton Investment Counsel, LLC; Assistant Secretary, Franklin Resources, Inc.; and officer of 46 of the investment companies |
| in Franklin Templeton Investments. | | | |
| |
| Robert C. Rosselot (1960) | Chief | Since 2013 | Not Applicable | Not Applicable |
| 300 S.E. 2nd Street | Compliance | | | |
| Fort Lauderdale, FL 33301-1923 | Officer | | | |
| |
| Principal Occupation During at Least the Past 5 Years: | | |
| Director, Global Compliance, Franklin Templeton Investments; Vice President, Franklin Templeton Companies, LLC; officer of 46 of the |
| investment companies in Franklin Templeton Investments; and formerly, Senior Associate General Counsel, Franklin Templeton Investments |
| (2007-2013); and Secretary and Vice President, Templeton Group of Funds (2004-2013). | |
| |
| Karen L. Skidmore (1952) | Vice President | Since 2009 | Not Applicable | Not Applicable |
| One Franklin Parkway | | | | |
| San Mateo, CA 94403-1906 | | | | |
| |
| Principal Occupation During at Least the Past 5 Years: | | |
| Senior Associate General Counsel, Franklin Templeton Investments; and officer of 46 of the investment companies in Franklin Templeton |
| Investments. | | | | |
| |
| Craig S. Tyle (1960) | Vice President | Since 2005 | Not Applicable | Not Applicable |
| One Franklin Parkway | | | | |
| San Mateo, CA 94403-1906 | | | | |
| |
| Principal Occupation During at Least the Past 5 Years: | | |
| General Counsel and Executive Vice President, Franklin Resources, Inc.; and officer of some of the other subsidiaries of Franklin Resources, |
| Inc. and of 46 of the investment companies in Franklin Templeton Investments. | |
44 | Annual Report
franklintempleton.com
FRANKLIN MUTUAL RECOVERY FUND
| | | | | |
| Interested Board Members and Officers (continued) | |
| |
| | | | Number of Portfolios in | |
| Name, Year of Birth | | Length of | Fund Complex Overseen | Other Directorships Held |
| and Address | Position | Time Served | by Board Member* | During at Least the Past 5 Years |
| |
| Lori A. Weber (1964) | Vice President | Since 2011 | Not Applicable | Not Applicable |
| 300 S.E. 2nd Street | | | | |
| Fort Lauderdale, FL 33301-1923 | | | | |
Principal Occupation During at Least the Past 5 Years:
Senior Associate General Counsel, Franklin Templeton Investments; Assistant Secretary, Franklin Resources, Inc.; Vice President and
Secretary, Templeton Investment Counsel, LLC; Vice President, Fiduciary Trust International of the South; and officer of 46 of the investment
companies in Franklin Templeton Investments.
*We base the number of portfolios on each separate series of the U.S. registered investment companies within the Franklin Templeton Investments fund complex.
These portfolios have a common investment manager or affiliated investment managers.
**Gregory E. Johnson is considered to be an interested person of the Fund under the federal securities laws due to his position as an officer and director of Franklin
Resources, Inc., which is the parent company of the Fund’s investment manager and distributor. Peter A. Langerman is considered to be an interested person of the
Fund under the federal securities laws due to his position as an officer of Mutual Advisers, LLC, which is the Fund’s investment manager.
Note: Officer information is current as of the date of this report. It is possible that after this date, information about officers may change.
The Fund’s Board has determined that certain of the members of the Audit Committee, including Ann Torre Bates, are audit committee financial experts, and
“independent,” under those provisions of the Sarbanes-Oxley Act of 2002, and the rules and form amendments adopted by the Securities and Exchange
Commission, relating to audit committee financial experts.
The Statement of Additional Information (SAI) includes additional information about the board members and is available, without charge, upon request.
Shareholders may call (800) DIAL BEN/342-5236 to request the SAI.
franklintempleton.com
Annual Report
| 45
FRANKLIN MUTUAL RECOVERY FUND
Shareholder Information
Proxy Voting Policies and Procedures
The Fund’s investment manager has established Proxy Voting Policies and Procedures (Policies) that the Fund uses to determine how to vote proxies relating to portfolio securities. Shareholders may view the Fund’s complete Policies online at franklintempleton.com. Alternatively, shareholders may request copies of the Policies free of charge by calling the Proxy Group collect at (954) 527-7678 or by sending a written request to: Franklin Templeton Companies, LLC, 300 S.E. 2nd Street, Fort Lauderdale, FL 33301, Attention: Proxy Group. Copies of the Fund’s proxy voting records are also made available online at franklintempleton.com and posted on the U.S. Securities and Exchange Commission’s website at sec.gov and reflect the most recent 12-month period ended June 30.
Quarterly Statement of Investments
The Fund files a complete statement of investments with the U.S. Securities and Exchange Commission for the first and third quarters for each fiscal year on Form N-Q. Shareholders may view the filed Form N-Q by visiting the Commission’s website at sec.gov. The filed form may also be viewed and copied at the Commission’s Public Reference Room in Washington, DC. Information regarding the operations of the Public Reference Room may be obtained by calling (800) SEC-0330.
Householding of Reports and Prospectuses
You will receive the Fund’s financial reports every six months as well as an annual updated summary prospectus (prospectus available upon request). To reduce Fund expenses, we try to identify related shareholders in a household and send only one copy of the financial reports and summary prospectus. This process, called “householding,” will continue indefinitely unless you instruct us otherwise. If you prefer not to have these documents householded, please call us at (800) 632-2301. At any time you may view current prospectuses/summary prospectuses and financial reports on our website. If you choose, you may receive these documents through electronic delivery.
46 | Annual Report
franklintempleton.com
This page intentionally left blank.
This page intentionally left blank.
Item 2. Code of Ethics.
(a) The Registrant has adopted a code of ethics that applies to its principal executive officers and principal financial and accounting officer.
(c) N/A
(d) N/A
(f) Pursuant to Item 12(a)(1), the Registrant is attaching as an exhibit a copy of its code of ethics that applies to its principal executive officers and principal financial and accounting officer.
Item 3. Audit Committee Financial Expert.
(a)(1) The Registrant has an audit committee financial expert serving on its audit committee.
(2) The audit committee financial experts are Edward I Altman and Ann Torre Bates and they are "independent" as defined under the relevant Securities and Exchange Commission Rules and Releases.
Item 4. Principal Accountant Fees and Services.
(a)Audit Fees
The aggregate fees paid to the principal accountant for professional services rendered by the principal accountant for the audit of the registrant’s annual financial statements or for services that are normally provided by the principal accountant in connection with statutory and regulatory filings or engagements were $72,540 for the fiscal year ended March 31, 2015 and $70,060 for the fiscal year ended March 31, 2014.
(b)Audit-Related Fees
There were no fees paid to the principal accountant for assurance and related services rendered by the principal accountant to the registrant that are reasonably related to the performance of the audit of the registrant's financial statements and are not reported under paragraph (a) of Item 4.
There were no fees paid to the principal accountant for assurance and related services rendered by the principal accountant to the registrant's investment adviser and any entity controlling, controlled by or under common control with the investment adviser that provides ongoing services to the registrant that are reasonably related to the performance of the audit of their financial statements.
(c)Tax Fees
The aggregate fees paid to the principal accountant for professional services rendered by the principal accountant to the registrant for tax compliance, tax advice and tax planning were $420 the fiscal year ended March 31, 2015 and $202 for the fiscal year ended March 31, 2014. The services for which these fees were paid include identifying passive foreign investment company to manage exposure to tax liabilities.
The aggregate fees paid to the principal accountant for professional services rendered by the principal accountant to the registrant’s investment adviser and any entity controlling, controlled by or under common control with the investment adviser that provides ongoing services to the registrant for tax compliance, tax advice and tax planning were $77,000 for the fiscal year ended March 31, 2015 and $77,000 for the fiscal year ended March 31, 2014. The services for which these fees were paid included technical tax consultation for withholding tax report to foreign governments, application of local country tax laws and tax advice.
(d) All Other Fees
There were no fees paid to the principal accountant for products and services rendered by the principal accountant to the registrant not reported in paragraphs (a)-(c) of Item 4.
There were no paid to the principal accountant for products and services rendered by the principal accountant to the registrant’s investment adviser and any entity controlling, controlled by or under common control with the investment adviser that provides ongoing services to the registrant other than services reported in paragraphs (a)-(c) of Item 4.
(e) (1) The registrant’s audit committee is directly responsible for approving the services to be provided by the auditors, including:
(i) pre-approval of all audit and audit related services;
(ii) pre-approval of all non-audit related services to be provided to the Fund by the auditors;
(iii) pre-approval of all non-audit related services to be provided to the registrant by the auditors to the registrant’s investment adviser or to any entity that controls, is controlled by or is under common control with the registrant’s investment adviser and that provides ongoing services to the registrant where the non-audit services relate directly to the operations or financial reporting of the registrant; and
(iv) establishment by the audit committee, if deemed necessary or appropriate, as an alternative to committee pre-approval of services to be provided by the auditors, as required by paragraphs (ii) and (iii) above, of policies and procedures to permit such services to be pre-approved by other means, such as through establishment of guidelines or by action of a designated member or members of the committee; provided the policies and procedures are detailed as to the particular service and the committee is informed of each service and such policies and procedures do not include delegation of audit committee responsibilities, as contemplated under the Securities Exchange Act of 1934, to management; subject, in the case of (ii) through (iv), to any waivers, exceptions or exemptions that may be available under applicable law or rules.
(e) (2) None of the services provided to the registrant described in paragraphs (b)-(d) of Item 4 were approved by the audit committee pursuant to paragraph (c)(7)(i)(C) of Rule 2-01 of regulation S-X.
(f) No disclosures are required by this Item 4(f).
(g) The aggregate non-audit fees paid to the principal accountant for services rendered by the principal accountant to the registrant and the registrant’s investment adviser and any entity controlling, controlled by or under common control with the investment adviser that provides ongoing services to the registrant were $77,420 for the fiscal year ended March 31, 2015 and $77,202 for the fiscal year ended March 31, 2014.
(h) The registrant’s audit committee of the board has considered whether the provision of non-audit services that were rendered to the registrant’s investment adviser (not including any sub-adviser whose role is primarily portfolio management and is subcontracted with or overseen by another investment adviser), and any entity controlling, controlled by, or under common control with the investment adviser that provides ongoing services to the registrant that were not pre-approved pursuant to paragraph (c)(7)(ii) of Rule 2-01 of Regulation S-X is compatible with maintaining the principal accountant’s independence.
Item 5. Audit Committee of Listed Registrants.
Members of the Audit Committee are: Edward I. Altman, Ann Torre Bates, Burton J. Greenwald and Robert E. Wade.
Item 6. Schedule of Investments. N/A
Item 7. Disclosure of Proxy Voting Policies and Procedures for Closed-End Management Investment Companies.
The board of trustees of the Fund has delegated the authority to vote proxies related to the portfolio securities held by the Fund to the Fund’s investment manager Franklin Mutual Advisers LLC (FMAL) in accordance with the Proxy Voting Policies and Procedures (Policies) adopted by the investment manager.
The investment manager has delegated its administrative duties with respect to the voting of proxies for equity securities to the Proxy Group within Franklin Templeton Companies, LLC (Proxy Group), an affiliate and wholly owned subsidiary of Franklin Resources, Inc. All proxies received by the Proxy Group will be voted based upon the investment manager’s instructions and/or policies. The investment manager votes proxies solely in the best interests of the Fund and its shareholders.
To assist it in analyzing proxies, the investment manager subscribes to Institutional Shareholder Services, Inc. (ISS), an unaffiliated third-party corporate governance research service that provides in-depth analyses of shareholder meeting agendas, vote recommendations, vote execution services, ballot reconciliation services, recordkeeping and vote disclosure services. In addition, the investment manager subscribes to Glass, Lewis & Co., LLC (Glass Lewis), an unaffiliated third-party analytical research firm, to receive analyses and vote recommendations on the shareholder meetings of publicly held U.S. companies, as well as a limited subscription to its international research. Also, the investment manager has a supplemental subscription to Egan Jones Proxy Services (Egan Jones), an unaffiliated third party proxy advisory firm, to receive analyses and vote recommendations. Although analyses provided by ISS, Glass Lewis, Egan Jones, or another independent third party proxy service provider (each a “Proxy Service”) are thoroughly reviewed and considered in making a final voting decision, the investment manager does not consider recommendations from a Proxy Service or any third party to be determinative of the investment manager's ultimate decision. Rather, the investment manager exercises its independent judgment in making voting decisions. As a matter of policy, the officers, directors/trustees and employees of the investment manager and the Proxy Group will not be influenced by outside sources whose interests conflict with the interests of the Fund and its shareholders. Efforts are made to resolve all conflicts in the best interests of the investment manager’s clients. Material conflicts of interest are identified by the Proxy Group based upon analyses of client, distributor, broker-dealer and vendor lists, information periodically gathered from directors and officers, and information derived from other sources, including public filings. In situations where a material conflict of interest is identified, the Proxy Group may vote consistent with the voting recommendation of a Proxy Service; or send the proxy directly to the Fund's board or a committee of the board with the investment manager's recommendation regarding the vote for approval.
Where a material conflict of interest has been identified, but the items on which the investment manager’s vote recommendations differ from a Proxy Service relate specifically to (1) shareholder proposals regarding social or environmental issues, (2) “Other Business” without describing the matters that might be considered, or (3) items the investment manager wishes to vote in opposition to the recommendations of an issuer’s management, the Proxy Group may defer to the vote recommendations of the investment manager rather than sending the proxy directly to the Fund's board or a board committee for approval.
To avoid certain potential conflicts of interest, the investment manager will employ echo voting, if possible, in the following instances: (1) when the Fund invests in an underlying fund in reliance on any one of Sections 12(d) (1) (E), (F), or (G) of the 1940 Act, the rules thereunder, or pursuant to a SEC exemptive order thereunder; (2) when the Fund invests uninvested cash in affiliated money market funds pursuant to the rules under the 1940 Act or any exemptive orders thereunder (“cash sweep arrangement”); or (3) when required pursuant to the Fund’s governing documents or applicable law. Echo voting means that the investment manager will vote the shares in the same proportion as the vote of all of the other holders of the underlying fund’s shares.
The recommendation of management on any issue is a factor that the investment manager considers in determining how proxies should be voted. However, the investment manager does not consider recommendations from management to be determinative of the investment manager’s ultimate decision. As a matter of practice, the votes with respect to most issues are cast in accordance with the position of the company's management. Each issue, however, is considered on its own merits, and the investment manager will not support the position of the company's management in any situation where it deems that the ratification of management’s position would adversely affect the investment merits of owning that company’s shares.
Investment manager’s proxy voting policies and principles The investment manager has adopted general proxy voting guidelines, which are summarized below. These guidelines are not an exhaustive list of all the issues that may arise and the investment manager cannot anticipate all future situations. In all cases, each proxy and proposal will be considered based on the relevant facts and circumstances on a case-by-case basis.
Board of directors. The investment manager supports an independent, diverse board of directors, and prefers that key committees such as audit, nominating, and compensation committees be comprised of independent directors. The investment manager will generally vote against management efforts to classify a board and will generally support proposals to declassify the board of directors. The investment manager will consider withholding votes from directors who have attended less than 75% of meetings without a valid reason. While generally in favor of separating Chairman and CEO positions, the investment manager will review this issue as well as proposals to restore or provide for cumulative voting on a case-by-case basis, taking into consideration factors such as the company’s corporate governance guidelines or provisions and performance. The investment manager generally will support non-binding shareholder proposals to require a majority vote standard for the election of directors; however, if these proposals are binding, the investment manager will give careful review on a case-by-case basis of the potential ramifications of such implementation.
In the event of a contested election, the investment manager will review a number of factors in making a decision including management’s track record, the company’s financial performance, qualifications of candidates on both slates, and the strategic plan of the dissidents.
Ratification of auditors of portfolio companies. The investment manager will closely scrutinize the independence, role and performance of auditors. On a case-by-case basis, the investment manager will examine proposals relating to non-audit relationships and non-audit fees. The investment manager will also consider, on a case-by-case basis, proposals to rotate auditors, and will vote against the ratification of auditors when there is clear and compelling evidence of a lack of independence, accounting irregularities or negligence. The investment manager may also consider whether the ratification of auditors has been approved by an appropriate audit committee that meets applicable composition and independence requirements.
Management and director compensation. A company’s equity-based compensation plan should be in alignment with the shareholders’ long-term interests. The investment manager believes that executive compensation should be directly linked to the performance of the company. The investment manager evaluates plans on a case-by-case basis by considering several factors to determine whether the plan is fair and reasonable, including the ISS quantitative model utilized to assess such plans and/or the Glass Lewis evaluation of the plans. The investment manager will generally oppose plans that have the potential to be excessively dilutive, and will almost always oppose plans that are structured to allow the repricing of underwater options, or plans that have an automatic share replenishment “evergreen” feature. The investment manager will generally support employee stock option plans in which the purchase price is at least 85% of fair market value, and when potential dilution is 10% or less.
Severance compensation arrangements will be reviewed on a case-by-case basis, although the investment manager will generally oppose “golden parachutes” that are considered to be excessive. The investment manager will normally support proposals that require a percentage of directors’ compensation to be in the form of common stock, as it aligns their interests with those of shareholders.
The investment manager will review non-binding say-on-pay proposals on a case-by-case basis, and will generally vote in favor of such proposals unless compensation is misaligned with performance and/or shareholders’ interests, the company has not provided reasonably clear disclosure regarding its compensation practices, or there are concerns with the company’s remuneration practices.
Anti-takeover mechanisms and related issues. The investment manager generally opposes anti-takeover measures since they tend to reduce shareholder rights. However, as with all proxy issues, the investment manager conducts an independent review of each anti-takeover proposal. On occasion, the investment manager may vote with management when the research analyst has concluded that the proposal is not onerous and would not harm the Fund or its shareholders’ interests. The investment manager generally supports proposals that require shareholder rights’ plans (“poison pills”) to be subject to a shareholder vote and will closely evaluate such plans on a case-by-case basis to determine whether or not they warrant support. In addition, the investment manager will generally vote against any proposal to issue stock that has unequal or subordinate voting rights. The investment manager generally opposes any supermajority voting requirements as well as the payment of “greenmail.” The investment manager generally supports “fair price” provisions and confidential voting. The investment manager will review a company’s proposal to reincorporate to a different state or country on a case-by-case basis taking into consideration financial benefits such as tax treatment as well as comparing corporate governance provisions and general business laws that may result from the change in domicile.
Changes to capital structure. The investment manager realizes that a company's financing decisions have a significant impact on its shareholders, particularly when they involve the issuance of additional shares of common or preferred stock or the assumption of additional debt. The investment manager will review, on a case-by-case basis, proposals by companies to increase authorized shares and the purpose for the increase. The investment manager will generally not vote in favor of dual-class capital structures to increase the number of authorized shares where that class of stock would have superior voting rights. The investment manager will generally vote in favor of the issuance of preferred stock in cases where the company specifies the voting, dividend, conversion and other rights of such stock and the terms of the preferred stock issuance are deemed reasonable. The investment manager will review proposals seeking preemptive rights on a case-by-case basis.
Mergers and corporate restructuring. Mergers and acquisitions will be subject to careful review by the research analyst to determine whether they would be beneficial to shareholders. The investment manager will analyze various economic and strategic factors in making the final decision on a merger or acquisition. Corporate restructuring proposals are also subject to a thorough examination on a case-by-case basis.
Environmental and social issues. The investment manager considers environmental and social issues alongside traditional financial measures to provide a more comprehensive view of the value, risk and return potential of an investment. Companies may face significant financial, legal and reputational risks resulting from poor environmental and social practices, or negligent oversight of environmental or social issues. Franklin Templeton’s “Responsible Investment Principles and Policies” describes the investment manager’s approach to consideration of environmental, social and governance issues within the investment manager’s processes and ownership practices.
In the investment manager’s experience, those companies that are managed well are often effective in dealing with the relevant environmental and social issues that pertain to their business. As such, the investment manager will generally give management discretion with regard to environmental and social issues. However, in cases where management and the board have not demonstrated adequate efforts to mitigate material environmental or social risks, have engaged in inappropriate or illegal conduct, or have failed to adequately address current or emergent risks that threaten shareholder value, the investment manager may choose to support well-crafted shareholder proposals that serve to promote or protect shareholder value. This may include seeking appropriate disclosure regarding material environmental and social issues. The investment manager will review shareholder proposals on a case-by-case basis and may support those that serve to enhance value or mitigate risk, are drafted appropriately, and do not disrupt the course of business or require a disproportionate or inappropriate use of company resources.
The investment manager will consider supporting a shareholder proposal seeking disclosure and greater board oversight of lobbying and corporate political contributions if the investment manager believes that there is evidence of inadequate oversight by the company’s board, if the company’s current disclosure is significantly deficient, or if the disclosure is notably lacking in comparison to the company’s peers.
Governance matters. The investment manager generally supports the right of shareholders to call special meetings and act by written consent. However, the investment manager will review such shareholder proposals on a case-by-case basis in an effort to ensure that such proposals do not disrupt the course of business or require a disproportionate or inappropriate use of company resources. The investment manager will consider on a case-by-case basis any well-drafted and reasonable proposals for proxy access considering such factors as the size of the company, ownership thresholds and holding periods, responsiveness of management, intentions of the shareholder proponent, company performance, and shareholder base.
Global corporate governance. Many of the tenets discussed above are applied to the investment manager's proxy voting decisions for international investments. However, the investment manager must be flexible in these worldwide markets. Principles of good corporate governance may vary by country, given the constraints of a country’s laws and acceptable practices in the markets. As a result, it is on occasion difficult to apply a consistent set of governance practices to all issuers. As experienced money managers, the investment manager's analysts are skilled in understanding the complexities of the regions in which they specialize and are trained to analyze proxy issues germane to their regions.
The investment manager will generally attempt to process every proxy it receives for all domestic and foreign securities. However, there may be situations in which the investment manager may be unable to vote a proxy, or may choose not to vote a proxy, such as where: (i) a proxy ballot was not received from the custodian bank; (ii) a meeting notice was received too late; (iii) there are fees imposed upon the exercise of a vote and it is determined that such fees outweigh the benefit of voting; (iv) there are legal encumbrances to voting, including blocking restrictions in certain markets that preclude the ability to dispose of a security if the investment manager votes a proxy or where the investment manager is prohibited from voting by applicable law or other regulatory or market requirements, including but not limited to, effective Powers of Attorney; (v) the investment manager held shares on the record date but has sold them prior to the meeting date; (vi) a proxy voting service is not offered by the custodian in the market; (vii) the investment manager believes it is not in the best interest of the Fund or its shareholders to vote the proxy for any other reason not enumerated herein; or (viii) a security is subject to a securities lending or similar program that has transferred legal title to the security to another person.
In some foreign jurisdictions, even if the investment manager uses reasonable efforts to vote a proxy on behalf of the Fund, such vote or proxy may be rejected because of (a) operational or procedural issues experienced by one or more third parties involved in voting proxies in such jurisdictions; (b) changes in the process or agenda for the meeting by the issuer for which the investment manager does not have sufficient notice; or (c) the exercise by the issuer of its discretion to reject the vote of the investment manager. In addition, despite the best efforts of the Proxy Group and its agents, there may be situations where the investment manager’s votes are not received, or properly tabulated, by an issuer or the issuer’s agent.
The investment manager or its affiliates may, on behalf of one or more of the proprietary registered investment companies advised by the investment manager or its affiliates, determine to use its best efforts to recall any security on loan where the investment manager or its affiliates (a) learn of a vote on a material event that may affect a security on loan and (b) determine that it is in the best interests of such proprietary registered investment companies to recall the security for voting purposes.
Shareholders may view the complete Policies online at franklintempleton.com. Alternatively, shareholders may request copies of the Policies free of charge by calling the Proxy Group collect at (954)527-7678 or by sending a written request to: Franklin Templeton Companies, LLC, 300 S.E. 2nd Street, Fort Lauderdale, FL 33301-1923, Attention: Proxy Group. Copies of the Fund’s proxy voting records are available online at franklintempleton.com and posted on the SEC website at www.sec.gov. The proxy voting records are updated each year by August 31 to reflect the most recent 12-month period ended June 30.
Item 8. Portfolio Managers of Closed-End Management Investment Companies.
(a)(1) As of May 27, 2015, the portfolio managers of the Fund are as follows:
Shawn M. Tumulty, Vice President of FMAL.
Mr. Tumulty has been a manager of the Fund since 2005. He joined Franklin Templeton Investments in 2000.
CHRISTIAN CORREA, CFA Portfolio Manager of FMAL
Mr. Correa has been manager of the Fund since 2004. He joined Franklin Templeton Investments in 2003.
KEITH LUH, CFA, Assistant Portfolio Manager of FMAL
Mr. Luh has been a portfolio manager of the Fund since 2009. He joined Franklin Templeton Investments in 2005.
Shawn M. Tumulty, Christian Correa and Keith Luh are jointly responsible for the day-to-day management of the Fund. The co-portfolio managers have equal authority over all aspects of the Fund's investment portfolio, including but not limited to, purchases and sales of individual securities, portfolio risk assessment, and the management of daily cash balances in accordance with anticipated management requirements. The degree to which each manager may perform these functions, and the nature of these functions, may change from time to time.
CFA and Chartered Financial Analyst® are trademarks owned by CFA Institute.
(a)(2) This section reflects information about the portfolio managers as of the fiscal year ended March 31, 2015.
The following table shows the number of other accounts managed by each portfolio manager and the total assets in the accounts managed within each category
Name | Number of Other Registered Investment Companies Managed | Assets of Other Registered Investment Companies Managed (x $1 million) | Number of Other Pooled Investment Vehicles Managed1 | Assets of Other Pooled Investment Vehicles Managed (x $1 million)1 | Number of Other Accounts Managed1 | Assets of Other Accounts Managed (x $1 million)1 |
Christian Correa | 1 | 4,335.4 | 0 | N/A | 0 | N/A |
Keith Luh | 1 | 5,983.0 | 0 | N/A | 0 | N/A |
Shawn M. Tumulty | 1 | 5,983.0 | 0 | N/A | 0 | N/A |
| | | | | | |
1. The various pooled investment vehicles and accounts listed are managed by a team of investment professionals. Accordingly, the individual managers listed would not be solely responsible for managing such listed amounts.
Portfolio managers that provide investment services to the Fund may also provide services to a variety of other investment products, including other funds, institutional accounts and private accounts. The advisory fees for some of such other products and accounts may be different than that charged to the Fund but does not include performance based compensation. This may result in fees that are higher (or lower) than the advisory fees paid by the Fund. As a matter of policy, each fund or account is managed solely for the benefit of the beneficial owners thereof. As discussed below, the separation of the trading execution function from the portfolio management function and the application of objectively based trade allocation procedures help to mitigate potential conflicts of interest that may arise as a result of the portfolio managers managing accounts with different advisory fees.
Conflicts. The management of multiple funds, including the Fund, and accounts may also give rise to potential conflicts of interest if the funds and other accounts have different objectives, benchmarks, time horizons, and fees as the portfolio manager must allocate his or her time and investment ideas across multiple funds and accounts. The investment manager seeks to manage such competing interests for the time and attention of portfolio managers by having portfolio managers focus on a particular investment discipline. Most other accounts managed by a portfolio manager are managed using the same investment strategies that are used in connection with the management of the Fund. Accordingly, portfolio holdings, position sizes, and industry and sector exposures tend to be similar across similar portfolios, which may minimize the potential for conflicts of interest. As noted above, the separate management of the trade execution and valuation functions from the portfolio management process also helps to reduce potential conflicts of interest. However, securities selected for funds or accounts other than the Fund may outperform the securities selected for the Fund. Moreover, if a portfolio manager identifies a limited investment opportunity that may be suitable for more than one fund or other account, the Fund may not be able to take full advantage of that opportunity due to an allocation of that opportunity across all eligible funds and other accounts. The investment manager seeks to manage such potential conflicts by using procedures intended to provide a fair allocation of buy and sell opportunities among funds and other accounts.
The structure of a portfolio manager’s compensation may give rise to potential conflicts of interest. A portfolio manager’s base pay and bonus tend to increase with additional and more complex responsibilities that include increased assets under management. As such, there may be an indirect relationship between a portfolio manager’s marketing or sales efforts and his or her bonus.
Finally, the management of personal accounts by a portfolio manager may give rise to potential conflicts of interest. While the funds and the investment manager have adopted a code of ethics which they believe contains provisions reasonably necessary to prevent a wide range of prohibited activities by portfolio managers and others with respect to their personal trading activities, there can be no assurance that the code of ethics addresses all individual conduct that could result in conflicts of interest.
The investment manager and the Fund have adopted certain compliance procedures that are designed to address these, and other, types of conflicts. However, there is no guarantee that such procedures will detect each and every situation where a conflict arises.
Compensation. The investment manager seeks to maintain a compensation program that is competitively positioned to attract, retain and motivate top-quality investment professionals. Portfolio managers receive a base salary, a cash incentive bonus opportunity, an equity compensation opportunity, and a benefits package. Portfolio manager compensation is reviewed annually and the level of compensation is based on individual performance, the salary range for a portfolio manager's level of responsibility and Franklin Templeton guidelines. Portfolio managers are provided no financial incentive to favor one fund or account over another. Each portfolio manager's compensation consists of the following three elements:
Base salary Each portfolio manager is paid a base salary.
Annual bonus Annual bonuses are structured to align the interests of the portfolio manager with those of the Fund’s shareholders. Each portfolio manager is eligible to receive an annual bonus. Bonuses generally are split between cash (50% to 65%) and restricted shares of Resources stock (17.5% to 25%) and mutual fund shares (17.5% to 25%). The deferred equity-based compensation is intended to build a vested interest of the portfolio manager in the financial performance of both Resources and mutual funds advised by the investment manager. The bonus plan is intended to provide a competitive level of annual bonus compensation that is tied to the portfolio manager achieving consistently strong investment performance, which aligns the financial incentives of the portfolio manager and Fund shareholders. The Chief Investment Officer of the investment manager and/or other officers of the investment manager, with responsibility for the Fund, have discretion in the granting of annual bonuses to portfolio managers in accordance with Franklin Templeton guidelines. The following factors are generally used in determining bonuses under the plan:
§ Investment performance. Primary consideration is given to the historic investment performance over the 1, 3 and 5 preceding years of all accounts managed by the portfolio manager. The pre-tax performance of each fund managed is measured relative to a relevant peer group and/or applicable benchmark as appropriate.
§ Non-investment performance. The more qualitative contributions of the portfolio manager to the investment manager's business and the investment management team, including business knowledge, contribution to team efforts, mentoring of junior staff, and contribution to the marketing of the Fund, are evaluated in determining the amount of any bonus award.
§ Research. Where the portfolio management team also has research responsibilities, each portfolio manager is evaluated on the number and performance of recommendations over time.
§ Responsibilities. The characteristics and complexity of funds managed by the portfolio manager are factored in the investment manager's appraisal.
Additional long-term equity-based compensation Portfolio managers may also be awarded restricted shares or units of Resources stock or restricted shares or units of one or more mutual funds. Awards of such deferred equity-based compensation typically vest over time, so as to create incentives to retain key talent.
Portfolio managers also participate in benefit plans and programs available generally to all employees of the investment manager.
Ownership of Fund shares. The investment manager has a policy of encouraging portfolio managers to invest in the funds they manage. Exceptions arise when, for example, a fund is closed to new investors or when tax considerations or jurisdictional constraints cause such an investment to be inappropriate for the portfolio manager. The following is the dollar range of Fund shares beneficially owned by each portfolio manager (such amounts may change from time to time):
Portfolio Manager | Dollar Range of Fund Shares Beneficially Owned |
Christian Correa | $100,001 - $500,000 |
Keith Luh | $50,001 - $100,000 |
Shawn M. Tumulty | $100,001 - $500,000 |
Item 9. Purchases of Equity Securities by Closed-End Management Investment Company and Affiliated Purchasers. N/A
Item 10. Submission of Matters to a Vote of Security Holders.
There have been no changes to the procedures by which shareholders may recommend nominees to the Registrant's Board of Trustees that would require disclosure herein.
Item 11. Controls and Procedures.
(a) Evaluation of Disclosure Controls and Procedures. The Registrant maintains disclosure controls and procedures that are designed to ensure that information required to be disclosed in the Registrant’s filings under the Securities Exchange Act of 1934 and the Investment Company Act of 1940, is recorded, processed, summarized and reported within the periods specified in the rules and forms of the Securities and Exchange Commission. Such information is accumulated and communicated to the Registrant’s management, including its principal executive officer and principal financial officer, as appropriate, to allow timely decisions regarding required disclosure. The Registrant’s management, including the principal executive officer and the principal financial officer, recognizes that any set of controls and procedures, no matter how well designed and operated, can provide only reasonable assurance of achieving the desired control objectives.
Within 90 days prior to the filing date of this Shareholder Report on Form N-CSR, the Registrant had carried out an evaluation, under the supervision and with the participation of the Registrant’s management, including the Registrant’s principal executive officer and the Registrant’s principal financial officer, of the effectiveness of the design and operation of the Registrant’s disclosure controls and procedures. Based on such evaluation, the Registrant’s principal executive officer and principal financial officer concluded that the Registrant’s disclosure controls and procedures are effective.
(b) Changes in Internal Controls. There have been no changes in the Registrant’s internal controls or in other factors that could materially affect the internal controls over financial reporting subsequent to the date of their evaluation in connection with the preparation of this Shareholder Report on Form N-CSR.
Item 12. Exhibits.
(a) (1) Code of Ethics
(a) (2) Certifications pursuant to Section 302 of the Sarbanes-Oxley Act of 2002 of Laura F. Fergerson, Chief Executive Officer - Finance and Administration, and Robert G. Kubilis, Chief Financial Officer and Chief Accounting Officer
(b) Certifications pursuant to Section 906 of the Sarbanes-Oxley Act of 2002 of Laura F. Fergerson, Chief Executive Officer - Finance and Administration, and Robert G. Kubilis, Chief Financial Officer and Chief Accounting Officer
SIGNATURES
Pursuant to the requirements of the Securities Exchange Act of 1934 and the Investment Company Act of 1940, the registrant has duly caused this report to be signed on its behalf by the undersigned, thereunto duly authorized.
FRANKLIN MUTUAL RECOVERY FUND
By /s/Laura F. Fergerson
Laura F. Fergerson
Chief Executive Officer - Finance and
Administration
Date May 27, 2015
Pursuant to the requirements of the Securities Exchange Act of 1934 and the Investment Company Act of 1940, this report has been signed below by the following persons on behalf of the registrant and in the capacities and on the dates indicated.
By /s/Laura F. Fergerson
Laura F. Fergerson
Chief Executive Officer - Finance and
Administration
Date May 27, 2015
By /s/Robert G. Kubilis
Robert G. Kubilis
Chief Financial Officer and
Chief Accounting Officer
Date May 27, 2015