| | OMB APPROVAL |
| | OMB Number: | 3235-0570 |
| | Expires: | August 31, 2011 |
| UNITED STATES | Estimated average burden hours per response. . . . . . . . . . . . . . . . .18.9 |
| SECURITIES AND EXCHANGE COMMISSION | |
| Washington, D.C. 20549 | |
| | | | |
FORM N-CSR
CERTIFIED SHAREHOLDER REPORT OF REGISTERED
MANAGEMENT INVESTMENT COMPANIES
Investment Company Act file number | 811-21308 |
|
Alger China-U.S. Growth Fund |
(Exact name of registrant as specified in charter) |
|
111 Fifth Avenue New York, New York | | 10003 |
(Address of principal executive offices) | | (Zip code) |
|
Mr. Hal Liebes Fred Alger Management, Inc. 111 Fifth Avenue New York, New York 10003 |
(Name and address of agent for service) |
|
Registrant’s telephone number, including area code: | 212-806-8800 | |
|
Date of fiscal year end: | October 31 | |
|
Date of reporting period: | October 31, 2008 | |
| | | | | | | |
ITEM 1. REPORTS TO STOCKHOLDERS.
Alger China-U.S.
Growth Fund
(formerly The China-U.S. Growth Fund)
ANNUAL REPORT
October 31, 2008

Dear Shareholders, November 25, 2008
The last year in the markets has been as unreal and fantastic as something out of Lewis Carroll's Alice's Adventures in Wonderland. Much like our world today, Wonderland was a sometimes frightening and dangerous place, where nothing made sense and rules changed frequently. It's far too true these days that, as Lewis' protagonist would say, things have gotten curiouser and curiouser. And there are no signs that conditions will become less curious anytime soon. Although investors remain steeped in uncertainty, the situation has already achieved a level of historical significance in that online encyclopedia Wikipedia has an entry for it: "Global Financial Crisis of 2008."
Wikipedia marks the week of September 7, 2008, as the beginning, but we can trace the tumult back to late 2007, when the unraveling of the housing market appeared, at first, to be the bottom. Like a tumble down the rabbit hole, however, there was yet more room to fall. Alice's descent relates to our own. The hole, Lewis writes, "went straight on like a tunnel for some way, and then dipped suddenly down, so suddenly that Alice had not a moment to think about stopping herself before she found herself falling down what seemed to be a very deep well."
Indications that the subprime disaster was not the deepest part of the well appeared in the spring with the collapse of Bear Stearns. A deceptively quiet few months followed, and then in August, perhaps in an early sign of what broad distress was to come, consumer credit dropped for the first time since 1998, declining by $7.9 billion. According to the Federal Reserve, it was the biggest monthly drop in more than half a century.
The Queen's Croquet Ground
By summer's end, the country's major financial institutions appeared as though they had been playing croquet with the Queen of Hearts, successful in her infamous demand, "Off with their heads!" Lehman Brothers was bankrupt, Bank of America had taken over embattled Merrill Lynch, the FDIC seized Washington Mutual — the U.S.'s largest savings and loan — and the Fed approved the multibillion dollar bailouts of Fannie Mae, Freddie Mac, and AIG.
In an effort to put some kind of bandage on the U.S.'s worsening economic wound, Congress passed the controversial $700 billion Emergency Economic Stabilization Act of 2008 in early October. As the month pushed forward, however, we saw more evidence of just how low the markets were capable of going. With investors fixating on the threat of a recession, the markets reflected the uncertainty over whether or not we had hit a bottom; record-breaking drops and rises littered the month. In one five-day period in early October, the Dow Jones Industrial Averagei lost 1,400 points. The period was topped the very next week during which the Dow traversed 1,600 points, from a high of 9,794 to a low of about 8,197. The S&P 500 Indexii, swung considerably, too, posting its biggest gain since the 1930s on October 13 before plunging
-1-
two days later as retailers reported their sharpest sales drop in three years. Our fiscal year may have finished at the end of the month, but the tumult didn't.
In early November, the U.S. underwent an executive regime change with the election of Barack Obama to the presidency. As we foretold, the election itself had a minimal impact on the economy. Instead, the U.S. — and global — markets for the rest of the month succumbed to their own mayhem. The economies of Germany and Japan were officially in recession (with the U.S. following in early December), an automotive industry rescue was in debate, controversy surrounded the way in which the funds from the financial bailout plan were to be dispersed, and stocks continued to plunge. On November 20, the S&P 500, down 49% for the year, had its lowest close since 1997, and the Dow and NASDAQiii were at 5 1/2–year closing lows. The Dow itself was down 50% from its all-time high set in October 2007. The very next week, the bailout of Citigroup, Inc. joined the lengthening agenda.
Who Stole the Tarts?
Taking a magnifying glass to the third quarter, U.S. GDP declined 0.3% in its worst showing since 2001, when it declined 1.4% in the third quarter. Though little consolation, the current decline, which followed a 2.8% increase posted in the second quarter, was less than the -0.5% analysts were predicting.
The primary contributor to GDP decline was the squeezing of the American consumer. Although the Consumer Staples sector within the S&P 500 was the only sector to produce positive returns during the quarter, Americans reigned in their spending after the impact of the government's tax rebates wore off, cutting back on purchases of cars, furniture, household appliances, clothes, and other items. Personal consumption expenditures were 3.1% lower than in the second quarter, following a 1.2% increase in the first quarter. Compounding matters, disposable income fell at an annual rate of 8.7% in the third quarter, the largest quarterly drop since 1947. And the Price Index for Gross Domestic Purchases increased 4.8% from the 4.2% increase posted in the second quarter. The unemployment rate rose from 6.1% to 6.5% in October and then to 6.7% in November, a 15-year high; analysts said it could hit 8% or higher in 2009.
Businesses also cut back sharply in the third quarter, slashing spending on equipment and software at a 5.5% pace — the most since the first quarter of 2002 when the economy was struggling to recover from the 2001 recession. In addition to cuts in equipment and software, other negative contributions came from residential fixed investment. Home builders, too, cut spending at a 19.1% pace, indicating the 11th straight quarterly cutback.
However, there were some brighter spots: federal government spending, exports, private inventory investment, nonresidential structures, and state and local government spending were all positive contributors while imports, which are negative for the GDP, decreased in the quarter.
Although they grew at a 5.9% pace, U.S. exports did slow from the second quarter's 12.3% growth rate, reflecting less demand from overseas buyers who were now dealing with their own economic troubles. One year ago, we could say that the global economy was functioning separately from the U.S. economy: still healthy, still
-2-
humming. But international markets are now also under pressure. With European recession official and U.S. exports weaker, it has become clear that any stability beyond the U.S. has been seriously diluted. China, however, holds more sway than it has in a long time; it is the largest holder of U.S. Treasuries and its huge trade surplus has helped it accumulate more foreign-currency reserves than any other country.
A Mad Tea Party
Like the Mad Hatter's watch that told only the day of the month and not the time, watching the nearly hour-by-hour destruction of the financial services sector became far too painful. Although the tea party borne from the overconfidence in the credit and housing markets has now become significantly smaller, we may not have seen the end of the chaos in financial services. It has been and continues to be massively reshaped and while some have not survived and others have had opportunities radically altered, there are some that will likely emerge better companies; our analysts are actively searching for those companies — across all sectors.
Through the Looking Glass
Carroll's follow up to Alice's Adventures in Wonderland — Through the Looking-Glass, and What Alice Found There — contains one of the greatest nonsensical poems ever written: Jabberwocky, which contains lines such as, "All mimsy were the borogoves,/And the mome raths outgrabe."
Similarly, these are mimsy, nonsensical times. However, we still do not believe that the global financial system is in dire jeopardy. In fact, we could be nearing the bottom in the equity market. And with a bottom comes opportunity. At the moment, stocks are at their lowest valuations since the 1980s; comparatively, Treasury valuations are at an all-time high and home values are still above where they were in the 1990s.
The vast concern over when — and how hard — we will hit the bottom certainly falls in the category of "curiouser." Growth may continue to be depressed in the near future, but we believe there is hope for a gradual recovery in 2009. Historically, the market has found the bottom and begun to rebound six to nine months ahead of an official recovery. Surveys of economists suggest the current recession will last throughout 2009, which, if the stock market follows a historical looking glass, would suggest it would bottom out in mid-2009. This estimate also — and perhaps too nicely — matches the 20-month average duration of bear markets since 1937, putting a similar stake in the ground for the bottom of this bear market at June of 2009. Unfortunately, these are only averages, meant, like records, to be broken. We have already, for example, fallen well below the average bear market decline (again since 1937) of roughly 34% with a n S&P 500 decline of more than 44% as of this writing.
This year, high-quality companies with higher expected growth rates — the kinds of companies in which Alger invests — were punished by the market. Next year, our investment firm enters its 45th year in business. We have weathered many times of frightening uncertainty often coupled with deep bear markets. In each of those periods, Alger investment professionals have remained true, focused, and disciplined in executing upon our investment philosophy and process and on seeking out stock opportunities where others "fold" or "flee." We are confident now that, as in past
-3-
bear markets, our discipline will allow us to fully participate in the upside of growth stocks when the markets once again reward high-quality, high-growth companies.
Why? At Alger, we think these difficult times favor our style of investing, which seeks out high-growth, high-quality companies. Specifically, by analyzing companies' financials and looking for "high quality," we are looking for companies with strong balance sheets, strong market positions, strong management teams — the ingredients that help any company prosper in good times and endure difficult ones. Further, to focus on "high-growth" companies might seem odd in a period when most companies are finding it difficult to even hold course. But, to this end, our sector analysts focus on identifying companies that — after this recession and over the longer term — we believe will be the market-share gainers, the shareholder-value generators, and the creators of new products and services in their sectors despite the recession. While, at present, all companies are focused on cost-cutting and tiptoeing through the madness of this recession, it is never more true than during times of recession that the strongest companies plant the seeds for higher future growth and, we believe, production of superior investment results for their shareholders.
Alice's Adventures in Wonderland was a knowing children's tale, an allegory meant to entertain the youngest generations and help them navigate the absurdities of an adult world. In the end, Alice woke up — a luxury that we, unfortunately, do not have. What we do have are defining principles and processes, expertise, and experience that have carried us through and will continue to enable us to guide our investors to a successful tomorrow. Like Alice in Wonderland, we've been thrust into a bizarre world. But Carroll also wrote Through the Looking-Glass, an almost equally as successful sequel to his famous story; now, we are eagerly awaiting the sequel to ours.
Respectfully submitted,
 | |
|
| Daniel C. Chung | |
|
| Chief Investment Officer | |
|
i The Dow Jones Industrial Average is an index of common stocks comprised of major industrial companies and assumes reinvestment of dividends. It is frequently used as a general measure of stock market performance.
ii Standard & Poor's 500 Index is an index of the 500 largest and most profitable companies in the United States.
iii The Nasdaq Composite Index is a market value-weighted index that measures all domestic and non-U.S.-based securities listed on the Nasdaq stock market.
Investors cannot invest directly in an index. Index performance does not reflect the deduction for fees, expenses, or taxes.
-4-
This report and the financial statements contained herein are submitted for the general information of shareholders of the Fund. This report is not authorized for distribution to prospective investors in the Fund unless proceeded or accompanied by an effective prospectus for the Fund.
Standard performance results can be found on the following pages. The investment return and principal value of an investment in a fund will fluctuate so that an investor's shares, when redeemed, may be worth more or less than their original cost. Current performance may be lower or higher than the performance quoted. For performance data current to the most recent month-end, visit us at www.alger.com, or call us at (800) 992-3863.
The views and opinions of the Fund's management in this report are as of the date of the Shareholders letter and are subject to change at any time subsequent to this date. There is no guarantee that any of the assumptions that formed the basis for the opinions stated herein are accurate or that they will materialize. Moreover, the information forming the basis for such assumptions is from sources believed to be reliable; however, there is no guarantee that such information is accurate. Any securities mentioned, whether owned in a fund or otherwise, are considered in the context of the construction of an overall portfolio of securities and therefore reference to them should not be construed as a recommendation or offer to purchase or sell any such security. Inclusion of such securities in a fund and transactions in such securities, if any, may be for a variety of reasons, including without limitation, in response to cash flows, inclusion in a benchmark, and risk control. The reference to a specific security should also be understood in such context and not viewed as a statement that the security is a significant holding in a portfolio. Please refer to the Schedule of Investments for each fund which is included in this report for a complete list of fund holdings as of October 31, 2008. Securities mentioned in the Shareholders letter, if not found in the Schedule of Investments, may have been held by the Funds during the Funds' fiscal year.
A Word About Risk
Growth stocks tend to be more volatile than other stocks as the price of growth stocks tends to be higher in relation to their companies' earnings and may be more sensitive to market, political, and economic developments. Investing in the stock market involves gains and losses and may not be suitable for all investors. Stocks of small- and mid-sized companies are subject to greater risk than stocks of larger, more established companies owing to such factors as limited liquidity, inexperienced management, and limited financial resources. Investing in foreign securities involves additional risk (including currency risk, risks related to political, social, or economic conditions, and risks associated with the Chinese markets, such as increased volatility, limited liquidity, less stringent regulatory and legal system, and lack of industry and country diversification), and may not be suitable for all investors. For a more detailed discussion of the risks associated with the Fund, please see the Fund's Prospectus.
-5-
Before investing, carefully consider a fund's investment objective, risks, charges, and expenses. For a prospectus containing this and other information about The Alger China-U.S. Growth Fund, call us at (800) 992-3863 or visit us at www.alger.com. Read it carefully before investing. Fred Alger & Company, Incorporated, Distributor. Member NYSE, SIPC.
NOT FDIC INSURED. NOT BANK GUARANTEED. MAY LOSE VALUE.
-6-
ALGER CHINA-U.S. GROWTH FUND
Fund Highlights Through October 31, 2008 (Unaudited)
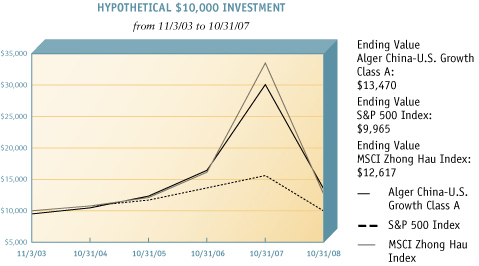
The chart above illustrates the change in value of a hypothetical $10,000 investment made in the Alger China-U.S. Growth Fund Class A, with an initial 5.25% maximum sales charge, the S&P 500 Index and the MSCI Zhong Hau Index (unmanaged indices of common stocks) on November 3, 2003, the inception date of the Alger China-U.S. Growth Fund Class A, through October 31, 2008. Figures for the Alger China-U.S. Growth Fund Class A, the S&P 500 Index and the MSCI Zhong Hau Index include reinvestment of dividends.
Investors cannot invest directly in any index. Index performance does not reflect deduction for fees, expenses, or taxes.
PERFORMANCE COMPARISON
AVERAGE ANNUAL TOTAL RETURNS
| | 1
YEAR | | SINCE
INCEPTION (11/3/03) | |
| AS OF 10/31/08† | |
| Alger China-U.S. Growth Fund | |
| Class A | | | (57.59 | %) | | | 6.12 | % | |
| Class C* | | | (56.02 | %) | | | 6.74 | % | |
| S&P 500 Index | | | (36.10 | %) | | | (0.07 | %) | |
| MSCI Zhong Hau Index | | | (62.32 | %) | | | 4.76 | % | |
| AS OF 9/30/08† | |
| Alger China-U.S. Growth Fund | |
| Class A | | | (39.10 | %) | | | 12.03 | % | |
| Class C* | | | (36.89 | %) | | | 12.66 | % | |
| S&P 500 Index | | | (21.98 | %) | | | 3.74 | % | |
| MSCI Zhong Hau Index | | | (44.49 | %) | | | 10.41 | % | |
† Returns reflect maximum sales charges on Class A shares and applicable contingent deferred sales charges on Class C shares.
* Performance figures prior to 3/1/08, inception of Class C shares, are those of the Fund's Class A shares. Performance has been adjusted to remove the front-end sales charge imposed by Class A shares. Class C shares do not impose a front-end sales charge but do impose a contingent deferred sales charge of 1% on shares redeemed. If Class A sales charges were reflected, annual returns for the Class C shares would be lower. The performance figures prior to 3/1/08 have also been adjusted to reflect the higher operating expenses and applicable contingent sales charge of Class C shares.
The performance data quoted represents past performance, which is not an indication or a guarantee of future results. The fund's total returns include changes in share price and reinvestment of dividends and capital gains. The graph and table above do not reflect the deduction of taxes that a shareholder would have paid on fund distributions or on the redemption of fund shares. Investment return and principal will fluctuate and the fund's shares, when redeemed, may be worth more or less than their original cost. Current performance may be higher or lower than the performance quoted. For performance current to the most recent month end, visit us at ww.alger.com or call us at (800) 992-3863.
-7-
PORTFOLIO SUMMARY†
October 31, 2008 (Unaudited)
| | | VALUE (%) | |
| Australia | | | 0.9 | % | |
| Brazil | | | 5.8 | % | |
| Britain | | | 0.8 | % | |
| Canada | | | 1.3 | % | |
| Cayman Islands | | | 0.6 | % | |
| China | | | 29.7 | % | |
| Finland | | | 0.9 | % | |
| Hong Kong | | | 14.3 | % | |
| Japan | | | 2.7 | % | |
| Taiwan | | | 7.0 | % | |
| United States | | | 36.0 | % | |
| Cash and Net Other Assets | | | 0.0 | % | |
| | | | 100.0 | % | |
† Based on net assets.
-8-
ALGER CHINA U.S. GROWTH FUND
Schedule of Investments October 31, 2008
| COMMON STOCKS—100.0% | | SHARES | | VALUE | |
| UNITED STATES—36.0% | |
| AEROSPACE & DEFENSE—1.9% | |
| BE Aerospace Inc.* | | | 66,900 | | | $ | 861,003 | | |
| Boeing Co. | | | 7,400 | | | | 386,798 | | |
| | | | 1,247,801 | | |
| AIR FREIGHT & LOGISTICS—3.4% | |
| Expeditors International of Washington Inc. | | | 19,100 | | | | 623,615 | | |
| United Parcel Service Inc. | | | 30,100 | | | | 1,588,678 | | |
| | | | 2,212,293 | | |
| APPLICATION SOFTWARE—1.9% | |
| Autodesk Inc.* | | | 59,400 | | | | 1,265,814 | | |
| ASSET MANAGEMENT & CUSTODY BANKS—1.7% | |
| Blackstone Group LP/The | | | 121,300 | | | | 1,108,682 | | |
| COAL & CONSUMABLE FUELS—2.1% | |
| Peabody Energy Corp. | | | 39,900 | | | | 1,376,949 | | |
| COMMUNICATIONS EQUIPMENT—3.6% | |
| Cisco Systems Inc.* | | | 90,400 | | | | 1,606,408 | | |
| QUALCOMM Inc. | | | 19,300 | | | | 738,418 | | |
| | | | 2,344,826 | | |
| CONSTRUCTION & FARM MACHINERY & HEAVY TRUCKS—3.7% | |
| Cummins Inc. | | | 10,200 | | | | 263,670 | | |
| Deere & Co. | | | 55,250 | | | | 2,130,440 | | |
| | | | 2,394,110 | | |
| DIVERSIFIED METALS & MINING—1.8% | |
| Freeport-McMoRan Copper & Gold Inc. | | | 41,272 | | | | 1,201,015 | | |
| FERTILIZERS & AGRICULTURAL CHEMICALS—1.4% | |
| Mosaic Co.,/The | | | 23,950 | | | | 943,870 | | |
| HOUSEHOLD PRODUCTS—1.2% | |
| Procter & Gamble Co. | | | 11,650 | | | | 751,891 | | |
| HYPERMARKETS & SUPER CENTERS—2.3% | |
| Wal-Mart Stores Inc. | | | 26,700 | | | | 1,490,127 | | |
| INDUSTRIAL MACHINERY—.7% | |
| SPX Corp. | | | 11,100 | | | | 430,014 | | |
| OIL & GAS EQUIPMENT & SERVICES—1.5% | |
| National Oilwell Varco Inc.* | | | 20,050 | | | | 599,295 | | |
| Schlumberger Ltd. | | | 7,100 | | | | 366,715 | | |
| | | | 966,010 | | |
-9-
ALGER CHINA U.S. GROWTH FUND
Schedule of Investments (Continued) October 31, 2008
| COMMON STOCKS—(CONT.) | | SHARES | | VALUE | |
| OTHER DIVERSIFIED FINANCIAL SERVICES—.5% | |
| ProShares UltraShort FTSE/Xinhua China 25 | | | 3,984 | | | $ | 354,576 | | |
| PERSONAL PRODUCTS—1.0% | |
| Avon Products Inc. | | | 27,050 | | | | 671,652 | | |
| PHARMACEUTICALS—.6% | |
| Johnson & Johnson | | | 5,950 | | | | 364,973 | | |
| RESTAURANTS—2.2% | |
| Burger King Holdings Inc. | | | 9,550 | | | | 189,854 | | |
| Yum! Brands Inc. | | | 43,500 | | | | 1,261,935 | | |
| | | | 1,451,789 | | |
| SEMICONDUCTOR EQUIPMENT—.8% | |
| MEMC Electronic Materials Inc.* | | | 29,200 | | | | 536,696 | | |
| SOFT DRINKS—.6% | |
| PepsiCo Inc. | | | 6,500 | | | | 370,565 | | |
| SPECIALIZED FINANCE—.9% | |
| CME Group Inc. | | | 2,050 | | | | 578,408 | | |
| SYSTEMS SOFTWARE—2.2% | |
| Microsoft Corp. | | | 63,800 | | | | 1,424,654 | | |
TOTAL UNITED STATES
(Cost $33,863,708) | | | | | | | 23,486,715 | | |
| AUSTRALIA—.9% | |
| OIL & GAS EXPLORATION & PRODUCTION—.9% | |
Linc Energy Ltd.*
(Cost $1,093,569) | | | 289,750 | | | | 563,295 | | |
| BRAZIL—5.8% | |
| DIVERSIFIED METALS & MINING—2.8% | |
| Cia Vale do Rio Doce# | | | 139,650 | | | | 1,832,208 | | |
| INTEGRATED OIL & GAS—3.0% | |
| Petroleo Brasileiro SA# | | | 72,850 | | | | 1,958,937 | | |
TOTAL BRAZIL
(Cost $4,357,002) | | | | | | | 3,791,145 | | |
| BRITAIN—.8% | |
| OIL & GAS EQUIPMENT & SERVICES—.8% | |
Acergy SA#
(Cost $1,419,982) | | | 70,300 | | | | 492,100 | | |
-10-
ALGER CHINA U.S. GROWTH FUND
Schedule of Investments (Continued) October 31, 2008
| COMMON STOCKS—(CONT.) | | SHARES | | VALUE | |
| CANADA—1.3% | |
| FERTILIZERS & AGRICULTURAL CHEMICALS—1.3% | |
Potash Corp., of Saskatchewan
(Cost $1,248,638) | | | 10,100 | | | $ | 861,126 | | |
| CAYMAN ISLANDS—.6% | |
| OIL & GAS DRILLING—.6% | |
Transocean Inc.*
(Cost $595,933) | | | 4,950 | | | | 407,534 | | |
| CHINA—29.7% | |
| AUTOMOBILE MANUFACTURERS—.1% | |
| AviChina Industry & Technology Co.* | | | 1,154,078 | | | | 77,625 | | |
| COMMUNICATIONS EQUIPMENT—.8% | |
| ZTE Corp. | | | 222,760 | | | | 503,679 | | |
| CONSTRUCTION & ENGINEERING—1.5% | |
| China Railway Construction Corp.* | | | 337,500 | | | | 416,905 | | |
| China Railway Group Ltd.* | | | 814,066 | | | | 475,305 | | |
| | | | 892,210 | | |
| CONSTRUCTION & FARM MACHINERY & HEAVY TRUCKS—2.4% | |
| China High Speed Transmission Equipment Group Co., Ltd. | | | 444,000 | | | | 352,699 | | |
| China South Locomotive and Rolling Stock Corp.* | | | 262,000 | | | | 92,624 | | |
| China South Locomotive and Rolling Stock Corp. - H* | | | 2,472,822 | | | | 874,211 | | |
| Shanghai Zhenhua Port Machinery Co.* | | | 483,700 | | | | 300,861 | | |
| | | | 1,620,395 | | |
| DIVERSIFIED BANKS—3.4% | |
| China Construction Bank Corp. | | | 1,618,000 | | | | 802,615 | | |
| China Merchants Bank Co., Ltd. | | | 361,000 | | | | 553,041 | | |
| Industrial & Commercial Bank of China | | | 1,976,000 | | | | 929,701 | | |
| | | | 2,285,357 | | |
| ELECTRICAL COMPONENTS & EQUIPMENT—3.9% | |
| Byd Co., Ltd. | | | 290,500 | | | | 493,717 | | |
| JA Solar Holdings Co., Ltd.*# | | | 356,850 | | | | 1,712,880 | | |
| Yingli Green Energy Holding Co., Ltd.*# | | | 65,200 | | | | 343,604 | | |
| | | | 2,550,201 | | |
| INTEGRATED OIL & GAS—1.0% | |
| China Petroleum & Chemical Corp. | | | 978,000 | | | | 642,186 | | |
| INTERNET SOFTWARE & SERVICES—12.0% | |
| Baidu.com*# | | | 3,500 | | | | 721,000 | | |
| Netease.com*# | | | 150,950 | | | | 3,396,375 | | |
| Sina Corp.* | | | 59,200 | | | | 1,918,080 | | |
| Sohu.com Inc.* | | | 22,370 | | | | 1,229,008 | | |
| Tencent Holdings Ltd. | | | 78,400 | | | | 570,719 | | |
| | | | 7,835,182 | | |
-11-
ALGER CHINA U.S. GROWTH FUND
Schedule of Investments (Continued) October 31, 2008
| COMMON STOCKS—(CONT.) | | SHARES | | VALUE | |
| LIFE & HEALTH INSURANCE—1.7% | |
| China Life Insurance Co., Ltd. | | | 411,000 | | | $ | 1,098,297 | | |
| PACKAGED FOODS & MEATS—2.9% | |
| Tingyi Cayman Islands Holding Corp. | | | 926,000 | | | | 980,827 | | |
| Want Want China Holdings Ltd. | | | 2,352,000 | | | | 885,503 | | |
| | | | 1,866,330 | | |
TOTAL CHINA
(Cost $25,237,072) | | | | | | | 19,371,462 | | |
| FINLAND—.9% | |
| COMMUNICATIONS EQUIPMENT—.9% | |
Nokia OYJ#
(Cost $736,310) | | | 40,650 | | | | 617,067 | | |
| HONG KONG—14.3% | |
| AUTO PARTS & EQUIPMENT—.2% | |
| Minth Group Ltd.* | | | 436,000 | | | | 152,355 | | |
| COMMUNICATIONS EQUIPMENT—.8% | |
| VTech Holdings Ltd.* | | | 146,000 | | | | 543,779 | | |
| ELECTRONIC MANUFACTURING SERVICES—1.6% | |
| Ju Teng International Holdings Ltd.* | | | 3,482,000 | | | | 1,054,553 | | |
| GAS UTILITIES—1.5% | |
| Hong Kong & China Gas Co., Ltd. | | | 552,960 | | | | 974,146 | | |
| INDEPENDENT POWER PRODUCERS & ENERGY TRADERS—1.3% | |
| China Resources Power Holdings Co., Ltd. | | | 436,095 | | | | 852,241 | | |
| MULTI-LINE INSURANCE—2.0% | |
| China Insurance International Holdings Co., Ltd. | | | 566,000 | | | | 1,319,468 | | |
| OIL & GAS EXPLORATION & PRODUCTION—.5% | |
| CNOOC Ltd. | | | 339,000 | | | | 278,332 | | |
| OTHER DIVERSIFIED FINANCIAL SERVICES—1.6% | |
| iShares Asia Trust - iShares FTSE/Xinhua A50 China Tracker* | | | 1,011,200 | | | | 1,028,102 | | |
| REAL ESTATE MANAGEMENT & DEVELOPMENT—1.3% | |
| Cheung Kong Infrastructure Holdings Ltd. | | | 235,964 | | | | 864,277 | | |
| SPECIALIZED FINANCE—2.0% | |
| Hong Kong Exchanges and Clearing Ltd. | | | 128,900 | | | | 1,307,084 | | |
| WIRELESS TELECOMMUNICATION SERVICES—1.5% | |
| China Mobile Ltd. | | | 111,500 | | | | 981,519 | | |
TOTAL HONG KONG
(Cost $11,415,069) | | | | | | | 9,355,856 | | |
-12-
ALGER CHINA U.S. GROWTH FUND
Schedule of Investments (Continued) October 31, 2008
| COMMON STOCKS—(CONT.) | | SHARES | | VALUE | |
| JAPAN—2.7% | |
| HOME ENTERTAINMENT SOFTWARE—2.7% | |
Nintendo Co., Ltd.#
(Cost $2,052,914) | | | 45,550 | | | $ | 1,771,517 | | |
| TAIWAN—7.0% | |
| COMPUTER HARDWARE—.7% | |
| Acer Inc. | | | 333,495 | | | | 430,157 | | |
| COMPUTER STORAGE & PERIPHERALS—.7% | |
| Chicony Electronics Co., Ltd.* | | | 382,000 | | | | 474,362 | | |
| DIVERSIFIED BANKS—.4% | |
| First Financial Holding Co., Ltd.* | | | 604,000 | | | | 284,856 | | |
| ELECTRICAL COMPONENTS & EQUIPMENT—.5% | |
| Simplo Technology Co., Ltd.* | | | 110,480 | | | | 343,534 | | |
| ELECTRONIC EQUIPMENT MANUFACTURERS—.5% | |
| Chroma ATE Inc.* | | | 350,752 | | | | 312,763 | | |
| ELECTRONIC MANUFACTURING SERVICES | |
| HON HAI Precision Industry Co., Ltd.* | | | 1,050 | | | | 2,534 | | |
| INTEGRATED TELECOMMUNICATION SERVICES—.9% | |
| Chunghwa Telecom Co., Ltd.* | | | 348,450 | | | | 576,522 | | |
| LEISURE PRODUCTS—1.0% | |
| Giant Manufacturing Co., Ltd.* | | | 261,000 | | | | 631,159 | | |
| OTHER DIVERSIFIED FINANCIAL SERVICES—.6% | |
| Fubon Financial Holding Co., Ltd.* | | | 637,000 | | | | 386,361 | | |
| SEMICONDUCTORS—1.7% | |
| Macronix International* | | | 1,609,000 | | | | 448,961 | | |
| Taiwan Semiconductor Manufacturing Co., Ltd. | | | 426,137 | | | | 620,054 | | |
| | | | 1,069,015 | | |
TOTAL TAIWAN
(Cost $6,198,278) | | | | | | | 4,511,262 | | |
TOTAL COMMON STOCKS
(Cost $88,218,475) | | | | | | | 65,229,080 | | |
-13-
ALGER CHINA U.S. GROWTH FUND
Schedule of Investments (Continued) October 31, 2008
| SHORT-TERM INVESTMENTS—1.5% | | PRINCIPAL
AMOUNT | | VALUE | |
| TIME DEPOSITS | |
HSBC bank, .96%, 11/3/08
(Cost $976,369) | | $ | 976,369 | | | $ | 976,369 | | |
Total Investments
(Cost $89,194,844)(a) | | | 101.5 | % | | | 66,205,449 | | |
| Liabilities in Excess of Other Assets | | | (1.5 | ) | | | (1,001,832 | ) | |
| NET ASSETS | | | 100.0 | % | | $ | 65,203,617 | | |
* Non-income producing security.
# American Depositary Receipts.
(a) At October 31, 2008, the net unrealized depreciation on investments, based on cost for federal income tax purposes of $92,088,195 amounted to $25,882,746 which consisted of aggregate gross unrealized appreciation of $1,183,612 and aggregate gross unrealized depreciation of $27,066,358.
See Notes to Financial Statements.
-14-
ALGER CHINA-U.S. GROWTH FUND
Statement of Assets and Liabilities October 31,2008
| ASSETS: | |
Investments in securities, at value (cost $89,194,844)
see accompanying schedule of investments | | $ | 66,205,449 | | |
| Cash foreign (cost $539) | | | 523 | | |
| Receivable for investment securities sold | | | 6,344,366 | | |
| Receivable for shares of beneficial interest sold | | | 130,344 | | |
| Dividends and interest receivable | | | 115,882 | | |
| Prepaid Expenses | | | 56,665 | | |
| Total Assets | | | 72,853,229 | | |
| LIABILITIES: | |
| Payable for investment securities purchased | | | 7,107,922 | | |
| Payable for shares of beneficial interest redeemed | | | 189,826 | | |
| Payable foreign currency contracts | | | 89 | | |
| Due to custodian | | | 119,402 | | |
| Accrued advisory fees | | | 97,816 | | |
| Accrued Administrative fees | | | 3,861 | | |
| Accrued Distribution fees | | | 14,071 | | |
| Accrued expenses | | | 116,625 | | |
| Total Liabilities | | | 7,649,612 | | |
| NET ASSETS | | $ | 65,203,617 | | |
| Net Assets Consist of: | |
| Paid in capital | | $ | 103,447,063 | | |
| Undistributed net investment income (accumulated loss) | | | — | | |
| Undistributed net realized gain (accumulated loss) | | | (15,253,341 | ) | |
| Net unrealized appreciation (depreciation) of investments | | | (22,990,105 | ) | |
| NET ASSETS | | $ | 65,203,617 | | |
| Class A — Net Asset Value Per Share | | $ | 10.18 | | |
| Class A — Offering Price Per Share | | $ | 10.75 | | |
| Class C — Net Asset Value and Offering Price Per Share | | $ | 10.16 | | |
| SHARES OF BENEFICIAL INTEREST OUTSTANDING—NOTE 6 | |
| Class A | | | 6,369,142 | | |
| Class C | | | 33,318 | | |
See Notes to Financial Statements.
-15-
ALGER CHINA-U.S. GROWTH FUND
Statement of Operations for the year ended October 31, 2008
| INVESTMENT INCOME: | |
| Dividends (net of $136,083 of foreign withholding taxes) | | $ | 2,053,287 | | |
| Interest and other | | | 89,644 | | |
| Total Income | | | 2,142,931 | | |
| EXPENSES: | |
| Investment advisory fees—Note 3(a) | | | 2,114,304 | | |
| Distribution fees—Note 3(f) | | | 367,344 | | |
| Administrative fees—Note 2(a) | | | 48,350 | | |
| Interest expense | | | 601 | | |
| Custodian fees | | | 154,050 | | |
| Transfer agent fees—Note 3(b) | | | 204,815 | | |
| Professional fees | | | 65,395 | | |
| Trustees fees | | | 13,037 | | |
| Registration fees | | | 37,876 | | |
| Miscellaneous | | | 133,031 | | |
| Total Expenses | | | 3,138,803 | | |
| Less fees waiver—Note 3(a) | | | (359,709 | ) | |
| Net Expenses | | | 2,779,094 | | |
| NET INVESTMENT LOSS | | | (636,163 | ) | |
REALIZED AND UNREALIZED GAIN (LOSS) ON INVESTMENTS
AND FOREIGN CURRENCY TRANSACTIONS: | |
| Net realized loss on investments | | | (15,052,855 | ) | |
| Net realized gain on foreign currency transactions | | | 46,487 | | |
Net change in unrealized appreciation (depreciation)
on investments and foreign currency translations | | | (86,405,116 | ) | |
| Net realized and unrealized loss on investments and foreign currency | | | (101,411,484 | ) | |
| NET DECREASE IN NET ASSETS RESULTING FROM OPERATIONS | | $ | (102,047,647 | ) | |
See Notes to Financial Statements.
-16-
THE ALGER CHINA-U.S. GROWTH FUND
Statements of Changes in Net Assets
| | | For the
Year Ended
October 31, 2008 | | For the
Year Ended
October 31, 2007 | |
| Net investment loss | | $ | (636,163 | ) | | $ | (805,857 | ) | |
Net realized gain (loss) on investments
and foreign currency transactions | | | (15,006,368 | ) | | | 17,946,126 | | |
Net change in unrealized appreciation (depreciation)
on investments and foreign currency translations | | | (86,405,116 | ) | | | 58,287,728 | | |
| Net increase (decrease) in net assets resulting from operations | | | (102,047,647 | ) | | | 75,427,997 | | |
| Distributions to shareholders from: | |
Net realized gains
Class A | | | (17,061,054 | ) | | | (10,078,310 | ) | |
| Increase (decrease) from shares of beneficial interest transaction: | |
| Class A | | | (17,917,679 | ) | | | 63,126,536 | | |
| Class C* | | | 606,622 | | | | — | | |
Net increase (decrease) from shares of benefical
interest transaction—Note 5 | | | (17,311,057 | ) | | | 63,126,536 | | |
| Total increase (decrease) in net assets | | | (136,419,758 | ) | | | 128,476,223 | | |
| Net Assets: | |
| Beginning of year | | | 201,623,375 | | | | 73,147,152 | | |
| END OF YEAR | | $ | 65,203,617 | | | $ | 201,623,375 | | |
*Commenced operations March 3, 2008.
See Notes to Financial Statements.
-17-
ALGER CHINA-U.S. GROWTH FUND
Financial Highlights for a share outstanding throughout the period
| | | CLASS A | |
| | | For the
Year ended
10/31/08 | | For the
Year ended
10/31/07 | | For the
Year ended
10/31/06 | | For the
Year ended
10/31/05 | | 11/3/03 (i) to
10/31/04 (ii) | |
Net asset value, beginning
of period | | $ | 25.09 | | | $ | 15.57 | | | $ | 12.99 | | | $ | 11.05 | | | $ | 10.00 | | |
| Net investment loss (iii) | | | (0.08 | ) | | | (0.13 | ) | | | (0.04 | ) | | | (0.07 | ) | | | (0.08 | ) | |
Net realized and unrealized
gain (loss) on investments
and foreign currency | | | (12.79 | ) | | | 11.67 | | | | 4.03 | | | | 2.01 | | | | 1.13 | | |
Total from investment
operations | | | (12.87 | ) | | | 11.54 | | | | 3.99 | | | | 1.94 | | | | 1.05 | | |
Distributions from net
realized gains | | | (2.04 | ) | | | (2.02 | ) | | | (1.41 | ) | | | — | | | | — | | |
Net asset value,
end of period | | $ | 10.18 | | | $ | 25.09 | | | $ | 15.57 | | | $ | 12.99 | | | $ | 11.05 | | |
| Total return (iv) | | | (55.24 | )% | | | 83.01 | % | | | 33.48 | % | | | 17.56 | % | | | 10.50 | % | |
RATIOS AND
SUPPLEMENTAL DATA: | |
Net assets, end of period
(000's omitted) | | $ | 64,865 | | | $ | 201,623 | | | $ | 73,147 | | | $ | 36,630 | | | $ | 26,290 | | |
Ratio of expenses to
average net assets | | | 1.90 | %(viii) | | | 1.92 | %(viii) | | | 2.20 | %(vii) | | | 2.26 | %(v) | | | 2.44 | %(vi) | |
Ratio of net investment
loss to average net assets | | | (0.43 | )% | | | (0.71 | )% | | | (0.30 | )% | | | (0.56 | )% | | | (0.81 | )% | |
| Portfolio turnover rate | | | 190.60 | % | | | 107.57 | % | | | 192.21 | % | | | 288.53 | % | | | 267.42 | % | |
(i) Commencement of operations.
(ii) Ratios have been annualized; total return and portfolio turnover rate have not been annualized.
(iii) Amount was computed based on average shares outstanding during the period.
(iv) Does not reflect the effect of any sales charges.
(v) Amount has been reduced by 0.51% due to expense reimbursements.
(vi) Amount has been reduced by 0.43% due to expense reimbursements.
(vii) Amount has been reduced by 0.16% due to expense reimbursements.
(viii) Amount has been reduced by 0.25% due to expense reimbursements.
(ix) Amount has been reduced by 0.21% due to expense reimbursements.
See Notes to Financial Statements.
-18-
| | | CLASS C | |
| | | 3/3/08 (i) to
10/31/08 (ii) | |
Net asset value, beginning
of period | | $ | 18.20 | | |
| Net investment loss (iii) | | | (0.05 | ) | |
Net realized and unrealized
gain (loss) on investments
and foreign currency | | | (7.99 | ) | |
Total from investment
operations | | | 8.04 | | |
Distributions from net
realized gains | | | — | | |
Net asset value,
end of period | | $ | 10.16 | | |
| Total return (iv) | | | (44.18 | )% | |
RATIOS AND
SUPPLEMENTAL DATA: | |
Net assets, end of period
(000's omitted) | | $ | 339 | | |
Ratio of expenses to
average net assets | | | 2.81 | %(ix) | |
Ratio of net investment
loss to average net assets | | | (0.52 | )% | |
| Portfolio turnover rate | | | 190.60 | % | |
-19-
ALGER CHINA-U.S. GROWTH FUND |
NOTES TO FINANCIAL STATEMENTS
NOTE 1 — General:
Alger China-U.S. Growth Fund (the "Fund") (formerly known as The China-U.S. Growth Fund) is a diversified open-end registered investment company organized as a business trust under the laws of the Commonwealth of Massachusetts. The Fund's investment objective is long-term capital appreciation. It seeks to achieve its objective by normally investing in equity securities which are publicly traded in the United States, China, Hong Kong and Taiwan markets. The Fund commenced operations on November 3, 2003 with the issuance of 10,000 shares at $10.00 per share to Fred Alger Management, Inc. ("Alger Management"), the Fund's investment manager. The Fund's single share class was re-designated as Class A shares effective January 24, 2005, and are generally subject to an initial sales charge. Class C shares were first offered March 3, 2008, and are generally subject to a deferred sales charge.
NOTE 2 — Significant Accounting Policies:
(a) Investment Valuation: Investments of the Fund are valued on each day the New York Stock Exchange (the "NYSE") is open as of the close of the NYSE (normally 4:00 p.m. Eastern time). Securities for which such information is readily available are valued at the last reported sales price or official closing price as reported by an independent pricing service on the primary market or exchange on which they are traded. In the absence of reported sales, securities are valued at a price within the bid and asked price or, in the absence of a recent bid or asked price, the equivalent as obtained from one or more of the major market makers for the securities to be valued.
Securities for which market quotations are not readily available are valued at fair value, as determined in good faith pursuant to procedures established by the Board of Trustees.
Securities in which the Fund invests may be traded in markets that close before the close of the NYSE. Developments that occur between the close of the foreign markets and the close of the NYSE (normally 4:00 p.m. Eastern time) may result in adjustments to the closing prices to reflect what the investment adviser, pursuant to policies established by the Board of Trustees, believes to be the fair value of these securities as of the close of the NYSE. The Fund may also fair value securities in other situations, for example, when a particular foreign market is closed but the Fund is open.
Short-term securities having a remaining maturity of sixty days or less are valued at amortized cost which approximates market value. Shares of mutual funds are valued at the net asset value of the underlying mutual fund.
-20-
ALGER CHINA-U.S. GROWTH FUND |
NOTES TO FINANCIAL STATEMENTS (Continued)
Recent Accounting Pronouncements
Statement on Financial Accounting Standards No. 157, "Fair Value Measurements" (FAS 157) defines fair value for financial reporting, establishes a framework for measuring fair value and requires additional disclosures about the use of fair value measurements. FAS 157 is effective for financial statements issued for fiscal years beginning after November 15, 2007 and interim periods within those fiscal years. The Fund does not believe the adoption of FAS 157 will impact the amounts reported in the financial statements, however, additional disclosures will be required about the inputs used to develop the measurements of fair value and the effect of certain of the measurements reported in the statement of operations for a fiscal period. These inputs are summarized in the three broad levels listed below:
• Level 1 – quoted prices in active markets for identical securities
• Level 2 – other significant observable inputs (including quoted prices for similar securities, interest rates, credit risk, etc.)
• Level 3 – significant unobservable inputs (including the Fund's own assumptions in determining the fair value of investments)
The inputs or methodology used for valuing securities are not necessarily an indication of the risk associated with investing in those securities.
In March 2008, the Financial Accounting Standards Board issued the Statement of Financial Accounting Standards No. 161, Disclosures about Derivative Instruments and Hedging Activities ("FAS 161"). FAS 161 is effective for fiscal years and interim periods beginning after November 15, 2008. FAS 161 requires enhanced disclosures about the Fund's derivative and hedging activities, including how such activities are accounted for and their effect on the Fund's financial position, performance and cash flows. Management is currently evaluating the impact the adoption of FAS 161 will have on the Fund's financial statements and related disclosures.
(b) Securities Transactions and Investment Income: Securities transactions are recorded on a trade date basis. Realized gains and losses from securities transactions are recorded on the basis of identified cost. Dividend income is recognized on the ex-dividend date and interest income is recognized on the accrual basis. Occasionally, dividends are recorded as soon after the ex-dividend date as the Fund, using reasonable diligence, becomes aware of such dividends.
(c) Foreign Currency Translations: The books and records of the Fund are maintained in U.S. dollars. Foreign currencies, investments and other assets and liabilities are translated into U.S. dollars at the prevailing rates of exchange on the valuation date. Purchases and sales of investment securities and income and expenses are translated into U.S. dollars at the prevailing exchange rates on the respective dates of such transactions.
Net realized gains and losses on foreign currency transactions represent net gains and losses from the disposition of foreign currencies, currency gains and losses realized
-21-
ALGER CHINA-U.S. GROWTH FUND |
NOTES TO FINANCIAL STATEMENTS (Continued)
between the trade dates and settlement dates of security transactions, and the difference between the amount of net investment income accrued and the U.S. dollar amount actually received. The effects of changes in foreign currency exchange rates on investments in securities are included in realized and unrealized gain or loss on investments in the Statement of Operations.
(d) Dividends to Shareholders: Dividends and distributions payable to shareholders are recorded by the Fund on the ex-dividend date. Dividends from net investment income and distributions from net realized gains are declared and paid annually after the end of the fiscal year in which earned.
The characterization of distributions to shareholders for financial statement purposes is determined in accordance with federal income tax rules. Therefore, the source of the Fund's distributions may be shown in the accompanying financial statements as either from, or in excess of net investment income, net realized gain on investment transactions or return of capital, depending on the type of book/tax differences that may exist. Capital accounts within the financial statements are adjusted for permanent book/tax differences. Reclassifications result primarily from the differences in tax treatment of net operating losses and foreign currency transactions. The reclassifications have no impact on the net asset value of the Fund and are designed to present the Fund's capital accounts on a tax basis.
(e) Federal Income Taxes: It is the Fund's policy to comply with the requirements of the Internal Revenue Code applicable to regulated investment companies and to distribute all of its investment company taxable income to its shareholders. Provided the Fund maintains such compliance, no federal income tax provision is required.
(f) Indemnification: The Fund enters into contracts that contain a variety of indemnification provisions. The Fund's maximum exposure under these arrangements is unknown. The Fund does not anticipate recognizing any loss related to these arrangements.
(g) Other: These financial statements have been prepared using estimates and assumptions that affect the reported amounts therein. Actual results may differ from those estimates.
NOTE 3 — Investment Advisory Fees and Other Transactions with Affiliates:
(a) Investment Advisory and Administration Fees: Fees incurred by the Fund, pursuant to the provisions of its Investment Advisory Agreement and its Administration Agreement with Fred Alger Management Inc. ("Alger Management") are payable monthly and computed based on the value of the average daily net assets of the Fund, at the following rates:
| Advisory fee through September 23, 2008 | | | 1.4600 | % | |
| Advisory fee effective September 24, 2008 | | | 1.2000 | | |
| Administration fee through March 16, 2008 | | | 0.0400 | | |
| Administration fee effective March 17, 2008 | | | 0.0275 | | |
-22-
ALGER CHINA-U.S. GROWTH FUND |
NOTES TO FINANCIAL STATEMENTS (Continued)
Martin Currie, Inc., a registered investment adviser, acted as sub-advisor to the Fund under a written sub-advisory agreement with Alger Management effective September 20, 2006.
As part of the settlement with the New York State Attorney General (see Note 8—Litigation) Alger Management has agreed to reduce its advisory fee to 1.20% for the period from December 1, 2006 through November 30, 2011. For the year ended October 31, 2008, Alger Management reimbursed/waived fees of the Fund totaling $359,709.
(b) Shareholder Administrative Servicing Fees: The Fund has entered into a shareholder administrative services agreement with Alger Management to compensate Alger Management on a per account basis for its liaison and administrative oversight of Boston Financial Data Services, Inc., the transfer agent for the Fund ("BFDS") and other related services. During the year ended October 31, 2008, the Fund incurred fees of $28,541 for these services provided by Alger Management.
(c) Sales Charges: Purchases of shares of the Fund may be subject to initial sales charges or contingent deferred sales charges. For the year ended October 31, 2008, the initial sales charges and contingent deferred sales charges retained by Fred Alger & Company (the "Distributor"), were approximately $9,429 and $81, respectively. The contingent deferred sales charges are used by the Distributor to offset distribution expenses previously incurred. Sales charges do not represent expenses of the Fund.
(d) Brokerage Commissions: During the year ended October 31, 2008, the Fund paid Fred Alger & Company, Incorporated ("Alger Inc."), an affiliate of Alger Management, $79,742 in connection with securities transactions.
(e) Trustees' Fees: The Fund pays each trustee who is not affiliated with Alger Management or its affiliates $500 for each meeting attended, to a maximum of $2,000 per annum. The chairman of the Board of Trustees receives an additional annual fee of $10,000 which is paid, pro rata, by all funds managed by Alger Management. Additionally, each member of the audit committee receives an additional $50 for each audit committee meeting attended, to a maximum of $200 per annum.
(f) Distribution Fees: The Trust has adopted a distribution plan pursuant to which the Fund pays Alger Inc. a fee at the annual rate of .25% of the average daily net assets of the Class A shares and 1.00% of the daily net assets of the Class C shares to compensate Alger Inc. for its activities and expenses incurred in distributing the Fund's shares. Fees charged may be more or less than the expenses incurred by Alger Inc.
(g) Other Transactions with Affiliates: Certain trustees and officers of the Fund are directors and officers of Alger Management, the Distributor and Alger Services.
-23-
ALGER CHINA-U.S. GROWTH FUND |
NOTES TO FINANCIAL STATEMENTS (Continued)
NOTE 4 — Securities Transactions:
During the year ended October 31, 2008, purchases and sales of investment securities, excluding short-term securities, aggregated $275,136,241 and $299,927,478, respectively.
Transactions in foreign securities may involve certain considerations and risks not typically associated with those of U.S. companies because of, among other factors, the level of governmental supervision and regulation of foreign security markets, and the possibility of political or economic instability.
NOTE 5 — Line of Credit:
The Fund participated in a $50 million committed line of credit with other mutual funds managed by Alger Management through March 14, 2008. All borrowings had variable interest rates and were payable on demand. The Fund may borrow under such line of credit exclusively for temporary or emergency purposes. Effective March 17, 2008, the Fund borrows from its custodian on an uncommitted basis.
For the year ended October 31, 2008, the Fund had average borrowings of $13,350, with a weighted average interest rate of 4.43%.
NOTE 6 — Share Capital:
The Fund has an unlimited number of authorized shares of beneficial interest of $.001 par value. Transactions of shares of beneficial interest were as follows:
| | | FOR THE YEAR ENDED
OCTOBER 31, 2008 | | FOR THE YEAR ENDED
OCTOBER 31, 2007 | |
| | | SHARES | | AMOUNT | | SHARES | | AMOUNT | |
| Class A: | |
| Shares sold | | | 2,119,855 | | | $ | 41,320,905 | | | | 4,685,600 | | | $ | 87,914,296 | | |
| Dividends reinvested | | | 692,401 | | | | 13,695,683 | | | | 551,695 | | | | 8,192,670 | | |
| Shares redeemed | | | (4,480,405 | ) | | | (72,934,267 | ) | | | (1,899,217 | ) | | | (32,980,430 | ) | |
| Net increase (decrease) | | | (1,668,149 | ) | | $ | (17,917,679 | ) | | | 3,338,078 | | | $ | 63,126,536 | | |
| Class C:* | |
| Shares sold | | | 38,183 | | | $ | 662,404 | | | | — | | | $ | — | | |
| Shares redeemed | | | (4,865 | ) | | | (55,782 | ) | | | — | | | | — | | |
| Net increase | | | 33,318 | | | $ | 606,622 | | | | — | | | $ | — | | |
* Initially offered March 3, 2008
The Fund may impose a 2.00% redemption fee on Fund shares redeemed (including shares redeemed by exchange) less than 30 days after such shares were acquired. The fees retained by the Fund are included as paid-in capital on the Statement of Assets
-24-
ALGER CHINA-U.S. GROWTH FUND |
NOTES TO FINANCIAL STATEMENTS (Continued)
and Liabilities. During the year ended October 31, 2008 and October 31, 2007, redemption fees were $443,981 and $98,891, respectively.
NOTE 7 — Tax Character of Distributions to Shareholders:
The tax character of distributions paid during the year ended October 31, 2008 and the year ended October 31, 2007 were as follows:
| | | YEAR ENDED
OCTOBER 31, 2008 | | YEAR ENDED
OCTOBER 31, 2007 | |
| Distributions paid from: | |
| Ordinary Income | | $ | 13,376,314 | | | $ | 8,336,911 | | |
| Long-term capital gain | | | 3,684,739 | | | | 1,741,399 | | |
| Total distributions paid | | $ | 17,061,053 | | | $ | 10,078,310 | | |
As of October 31, 2008, the components of distributable earnings on a tax basis were as follows:
| Undistributed ordinary income | | $ | — | | |
| Undistributed long-term gain | | $ | — | | |
| Unrealized appreciation | | $ | (25,883,456 | ) | |
The difference between book basis and tax basis unrealized appreciation is determined annually and is attributable primarily to the tax deferral of losses on wash sales.
At October 31, 2008, the Fund, for federal income tax purposes, had a capital loss carryforward of $12,359,990 which expires in 2016. This amount may be applied against future net realized gains until the earlier of its utilization or expiration.
NOTE 8 — Litigation:
Alger Management has responded to inquiries, document requests and/or subpoenas from various regulatory authorities, in connection with their investigations of practices in the mutual fund industry identified as "market timing" and "late trading." On October 11, 2006, Alger Management, Alger Inc. and Alger Shareholder Services, Inc. executed an Assurance of Discontinuance with the Office of the New York State Attorney General ("NYAG"). On January 18, 2007 the Securities and Exchange Commission issued an order implementing settlements reached with Alger Management and Alger Inc. As part of the settlements with the Commission and the NYAG, without admitting or denying liability, the firms paid $30 million to reimburse fund shareholders and a fine of $10 million; and agreed to certain other remedial measures including a reduction in management fees of $1 million per year for five years. The entire $40 million and fee reduction will be available for the benefit of investors. Alger Management has advised the Funds that the settlement has not adversely affected the operations of Alger Management, Alger Inc. or their affiliates, or adversely affected their ability to continue to provide services to the Funds.
-25-
ALGER CHINA-U.S. GROWTH FUND |
NOTES TO FINANCIAL STATEMENTS (Continued)
On August 31, 2005, the West Virginia Securities Commissioner (the "WVSC") in an ex parte Summary Order to Cease and Desist and Notice of Right to Hearing concluded that Alger Management and Alger Inc. had violated the West Virginia Uniform Securities Act (the "WVUSA"), and ordered Alger Management and Alger Inc. to cease and desist from further violations of the WVUSA by engaging in the market-timing related conduct described in the order. The ex parte order provided notice of their right to a hearing with respect to the violations of law asserted by the WVSC. Other firms unaffiliated with Alger Management were served with similar orders. Alger Management and Alger Inc. intend to request a hearing for the purpose of seeking to vacate or modify the order.
In addition, in 2003 and 2004 several purported class actions and shareholder derivative suits were filed against various parties in the mutual fund industry, including Alger Management, certain mutual funds managed by Alger Management (the "Alger Mutual Funds"), and certain current and former Alger Mutual Fund trustees and officers, alleging wrongful conduct related to market-timing and late-trading by mutual fund shareholders. These cases were transferred to the U.S. District Court of Maryland by the Judicial Panel on Multidistrict Litigation for consolidated pre-trial proceedings. In September 2004, consolidated amended complaints involving these cases—a Consolidated Amended Fund Derivative Complaint (the "Derivative Complaint") and two substantially identical Consolidated Amended Class Action Complaints (together, the "Class Action Complaint")—were filed in the Maryland federal district court under the caption number 1:04-MD-15 863 (JFM). In April 2005, a civil lawsuit involving similar allegations was filed by the West Virginia Attorney General and also transferred to the Maryland District Court, but such lawsuit has since been withdrawn.
The Derivative Complaint (which was later amended a second time) alleged (i) violations, by Alger Management and, depending on the specific offense alleged, by Alger Inc. and/or the fund trustee defendants, of Sections 36(a), 36(b), 47, and 48 of the Investment Company Act of 1940, as amended, (the "1940 Act") and of Sections 206 and 215 of the Investment Advisers Act of 1940, as amended, breach of fiduciary duty, and breach of contract, (ii) various offenses by other third-party defendants, and (iii) unjust enrichment by all the named defendants. The Class Action Complaint alleged, in addition to the offenses listed above, (i) violations, by Alger Management, Alger Inc., their affiliates, the funds named as defendants, including the Funds, and the current and former fund trustees and officers, of Sections 11, 12(a)(2), and 15 of the Securities Act of 1933, as amended, Sections 10(b) (and Rule 10b-5 thereunder) and 20(a) of the Securities Exchange Act of 1934, as amended, (the "1934 Act"), and Section 34(b) of the Investment Company Act, (ii) breach of contract by the funds named as defendants, and (iii) unjust enrichment of the defendants.
-26-
ALGER CHINA-U.S. GROWTH FUND |
NOTES TO FINANCIAL STATEMENTS (Continued)
Motions to dismiss the Class Action Complaint and the Derivative Complaint were subsequently filed.
As a result of a series of court orders, all claims in the Class Action Complaint and the Derivative Complaint have been dismissed, other than claims under the 1934 Act against Alger Management, Alger Inc., Alger Associates, Inc. and Alger Shareholder Services, Inc., and certain present and former members of the senior management of Alger Management and/or Alger Inc., and claims under Section 36(b) of the Investment Company Act against Alger Management, Alger Inc., Alger Associates, Inc. and Alger Shareholder Services, Inc.
The class and derivative suits have been settled in principle, but such settlement is subject to court approval.
-27-
REPORT OF INDEPENDENT REGISTERED PUBLIC ACCOUNTING FIRM
To the Shareholders and Board of Trustees of
Alger China-U.S. Growth Fund:
We have audited the accompanying statement of assets and liabilities of the Alger China-U.S. Growth Fund (the "Fund"), including the schedule of investments, as of October 31, 2008, and the related statement of operations for the year then ended, the statement of changes in net assets for each of the two years in the period then ended and the financial highlights for each of the periods indicated therein. These financial statements and financial highlights are the responsibility of the Fund's management. Our responsibility is to express an opinion on these financial statements and financial highlights based on our audits.
We conducted our audits in accordance with the standards of the Public Company Accounting Oversight Board (United States). Those standards require that we plan and perform the audit to obtain reasonable assurance about whether the financial statements and financial highlights are free of material misstatement. We were not engaged to perform an audit of the Fund's internal control over financial reporting. Our audits included consideration of internal control over financial reporting as a basis for designing audit procedures that are appropriate in the circumstances, but not for the purpose of expressing an opinion on the effectiveness of the Fund's internal control over financial reporting. Accordingly, we express no such opinion. An audit also includes examining, on a test basis, evidence supporting the amounts and disclosures in the financial statements and financial highlights, assessing the accounting principles used and significant esti mates made by management, and evaluating the overall financial statement presentation. Our procedures included confirmation of securities owned as of October 31, 2008, by correspondence with the custodian and brokers or by other appropriate auditing procedures where replies from brokers were not received. We believe that our audits provide a reasonable basis for our opinion.
In our opinion, the financial statements and financial highlights referred to above present fairly, in all material respects, the financial position of the Alger China-U.S. Growth Fund at October 31, 2008, the results of its operations for the year then ended, the changes in its net assets for each of the two years in the period then ended, and the financial highlights for each of the indicated periods, in conformity with U.S. generally accepted accounting principles.
December 16, 2008
New York, N.Y.
-28-
ALGER CHINA-U.S. GROWTH FUND
ADDITIONAL INFORMATION (Unaudited)
Shareholder Expense Example (Unaudited)
As a shareholder of the Fund, you incur two types of costs: transaction costs, if applicable, including sales charges (loads) and redemption fees; and ongoing costs, including management fees and other fund expenses. This example is intended to help you understand your ongoing costs (in dollars) of investing in the Fund and to compare these costs with the ongoing costs of investing in other mutual funds.
The example below is based on an investment of $1,000 invested at the beginning of the six-month period starting May 1, 2008 and ending October 31, 2008.
Actual Expenses
The first line in the table below provides information about actual account values and actual expenses. You may use the information in this line, together with the amount you invested, to estimate the expenses that you would have paid over the period. Simply divide your account value by $1,000 (for example, an $8,600 account value divided by $1,000 = 8.6), then multiply the result by the number in the first line under the heading entitled "Expenses Paid During the Period" to estimate the expenses you paid on your account during this period.
Hypothetical Example For Comparison Purposes
The second line in the table below provides information about hypothetical account values and hypothetical expenses based on the Fund's actual expense ratios and an assumed rate of return of 5% per year before expenses, which is not the Fund's actual return. The hypothetical account values and expenses may not be used to estimate the actual ending account balance or expenses you paid for the period. You may use this information to compare the ongoing costs of investing in the Fund and other funds. To do so, compare this 5% hypothetical example with the 5% hypothetical examples that appear in the shareholder reports of other funds.
Please note that the expenses shown in the table are meant to highlight your ongoing costs only and do not reflect any transaction costs, such as sales charges (loads) and redemption fees. Therefore, the second line in the table is useful in comparing ongoing costs only, and will not help you determine the relative total costs of owning different funds. In addition, if these transactional costs were included, your costs would have been higher.
-29-
ALGER CHINA-U.S. GROWTH FUND
ADDITIONAL INFORMATION (Unaudited) (Continued)
| | | |
Beginning
Account Value
May 1, 2008 | |
Ending
Account Value
October 31, 2008 | |
Expenses Paid
During the Period
May 1, 2008 to
October 31, 2008(b) | | Ratio of Expenses to
Average Net Assets
For the Period
May 1, 2008 to
October 31, 2008(c) | |
| Class A | | Actual | | $ | 1,000.00 | | | $ | 541.20 | | | $ | 7.36 | | | | 1.90 | % | |
| | | Hypothetical(a) | | | 1,000.00 | | | | 1,015.58 | | | | 9.63 | | | | 1.90 | | |
| Class C* | | Actual | | | 1,000.00 | | | | 539.30 | | | | 10.87 | | | | 2.81 | | |
| | | Hypothetical(a) | | | 1,000.00 | | | | 1,011.01 | | | | 14.20 | | | | 2.81 | | |
* From March 3, 2008 — Commencement of operations.
(a) 5% annual return before expenses.
(b) Expenses are equal to the fund's annualized expense ratio of the respective share class, multiplied by the average account value over the period, multiplied by 184/366 (to reflect the one-half year period).
(c) Annualized.
Tax Information (Unaudited)
In accordance with subchapter M of the Internal Revenue Code of 1986, as amended, for the year ended October 31, 2008, 2.79% of the Funds ordinary dividend qualified for the dividends received deduction for corporations. For the year ended October 31, 2008, certain dividends paid by the Funds may be subject to a maximum rate of 15%, as provided by the Jobs and Growth Tax Relief Reconciliation Act of 2003. Of the distributions paid during the fiscal year, the following represents the maximum amount that may be considered qualified dividend income $2,189,370.
Shareholders should not use the above information to prepare their tax returns. Since the Fund's fiscal year is not the calendar year, another notification will be sent with respect to calendar year 2008. Such notification, which will reflect the amount to be used by taxpayers on their federal income tax returns, will be made in conjunction with Form 1099 DIV and will be mailed in January 2009. Shareholders are advised to consult their own tax advisers with respect to the tax consequences of their investment in the Fund.
Under Section 853(c)(2), The Alger China U.S. Growth Fund intends to pass through a foreign tax credit of $136,083, with associated gross foreign source income of $2,168,807.
Trustees and Officers of the Fund (Unaudited)
Information about the Trustees and officers of the Fund is set forth below. In the table the term "Alger Fund Complex" refers to the Fund, The Alger Funds, The Alger American Fund, The Alger Institutional Funds, The Alger Funds II and Castle Convertible Fund, Inc., each of which is a registered investment company managed by Fred Alger Management, Inc. ("Alger Management"). Each Trustee serves until an event of termination, such as death or resignation, or until his successor is duly elected; each officer's term of office is one year. Unless otherwise noted, the address of each person named below is 111 Fifth Avenue, New York, NY 10003.
-30-
ALGER CHINA-U.S. GROWTH FUND
ADDITIONAL INFORMATION (Unaudited) (Continued)
Name, Age,
Position with the Fund | | Principal Occupations | | Trustee
and/or
Officer Since | | Number of
Funds in the
Alger Fund
Complex which
are Overseen
by Trustee | |
| INTERESTED TRUSTEE | | | | | | | | | | | |
|
| Hilary M. Alger, CFA (47) | | Director of Development, Pennsylvania Ballet since 2004; Associate Director of Development, College of Arts and Sciences and Graduate School, University of Virginia 1999–2003. | | | 2003 | | | | 27 | | |
|
| NON-INTERESTED TRUSTEES | | | | | | | | | | | |
|
| Charles F. Baird, Jr. (55) | | Managing Partner of North Castle Partners, a private equity securities group; Chairman of Leiner Health Products, Enzymatic Therapy and Caleel & Hayden (skincare business); former Chairman of Elizabeth Arden Day Spas, Naked Juice, Equinox (fitness company) and EAS (manufacturer of nutritional products). Formerly Managing Director of AEA Investors, Inc. | | | 2000 | | | | 27 | | |
|
| Roger P. Cheever (63) | | Senior Associate Dean of Development, Harvard University. Formerly Deputy Director of the Harvard College Fund. | | | 2000 | | | | 27 | | |
|
| Lester L. Colbert, Jr. (74) | | Private investor since 1988. Formerly, Chairman of the Board, President and Chief Executive Officer of Xidex Corporation (manufacturer of computer information media). | | | 2000 | | | | 27 | | |
|
| Stephen E. O'Neil (76) | | Attorney; Private investor since 1981. Formerly of Counsel to the law firm of Kohler & Barnes. | | | 1986 | | | | 27 | | |
|
| David Rosenberg (46) | | Associate Professor of Law since January 2006 (Assistant Professor 2000-2005), Zicklin School of Business, Baruch College, City University of New York | | | 2007 | | | | 27 | | |
|
| Nathan E. Saint-Amand M.D. (70) | | Medical doctor in private practice; Member of the Board of the Manhattan Institute (non-profit policy research) since 1998. Formerly Co-Chairman, Special Projects Committee, Memorial Sloan Kettering. | | | 1986 | | | | 27 | | |
|
-31-
ALGER CHINA-U.S. GROWTH FUND
ADDITIONAL INFORMATION (Unaudited) (Continued)
Name, Age,
Position with the Fund | | Principal Occupations | | Trustee
and/or
Officer Since | | Number of
Funds in the
Alger Fund
Complex which
are Overseen
by Trustee | |
| OFFICERS | | | | | | | | | |
|
Dan C. Chung (46)
President | | President since September 2003 and Chief Investment Officer and Director since 2001 of Alger Management; President since 2003 and Director since 2001 of Alger Associates, Fred Alger International Advisory S.A. (Director since 2003) and Analysts Resources, Inc. ("ARI"). Formerly, Director of the Fund from 2001-2006. | | | 2003 | | | N/A | |
|
Hal Liebes (44)
Secretary | | Executive Vice President, Director, Chief Legal Officer, Chief Operating Officer, and Secretary of Fred Alger & Company, Incorporated and Alger Management; Director since 2006 of Alger Associates, and ARI. Formerly Chief Compliance Officer of AMVESCAP PLC from 2004-2005; U.S. General Counsel from 1994-2002 and Global General Counsel from 2002-2004 of Credit Suisse Asset Management. | | | 2005 | | | N/A | |
|
| Michael D. Martins (43) Treasurer | | Senior Vice President of Alger Management; Assistant Treasurer from 2005 to 2006 of the Fund. Formerly Vice President, Brown Brothers Harriman & Co. from 1997-2004. | | | 2005 | | | N/A | |
|
| Lisa A. Moss (43) Assistant Secretary | | Vice President and Assistant General Counsel of Alger Management since June 2006. Formerly Director of Merrill Lynch Investment Managers, L.P. from 2005-2006; Assistant General Counsel of AIM Management, Inc. from 1995-2005. | | | 2006 | | | N/A | |
|
| Barry J. Mullen (55) Chief Compliance Officer | | Senior Vice President and Director of Compliance of Alger Management since May 2006. Formerly, Director of BlackRock, Inc. from 2004-2006; Vice President of J.P. Morgan Investment Management from 1996-2004. | | | 2006 | | | N/A | |
|
| Anthony S. Caputo (53) Assistant Treasurer | | Employed by Alger Management since 1986, currently serving as Vice President. | | | 2007 | | | N/A | |
|
-32-
ALGER CHINA-U.S. GROWTH FUND
ADDITIONAL INFORMATION (Unaudited) (Continued)
Name, Age,
Position with the Fund | | Principal Occupations | | Trustee
and/or
Officer Since | | Number of
Funds in the
Alger Fund
Complex which
are Overseen
by Trustee | |
| OFFICERS (Continued) | | | | | | | | | |
|
| Sergio M. Pavone (47) Assistant Treasurer | | Employed by Alger Management since 2002, currently serving as Vice President. | | | 2007 | | | N/A | |
|
Ms. Alger and Mr. Chung are an "interested person" (as defined in the Investment Company Act) of the Fund because of his affiliations with Alger Management. No Trustee is a director of any public company except as may be indicated under "Principal Occupations."
The Statement of Additional Information contains additional information about the Fund's Trustees and is available without charge upon request by calling (800) 992-3863.
Investment Management Agreement Renewal (Unaudited)
At an in-person meeting held on September 9, 2008, the Trustees, including the Independent Trustees, unanimously approved renewal of the Investment Advisory Agreement between the Fund and Alger Management (the "Agreement"). The Independent Trustees were assisted in their review by independent legal counsel and met with counsel in executive session separate from representatives of Alger Management.
In evaluating the Agreement, the Trustees drew on materials that they had requested and which were provided to them in advance of the meeting by Alger Management and by counsel. The materials covered, among other matters, (i) the nature, extent and quality of the services provided by Alger Management under the Agreement, (ii) the investment performance of the Fund, (iii) the costs to Alger Management of its services and the profits realized by Alger Management and Alger Inc. from their relationship with the Fund, and (iv) the extent to which economies of scale would be realized if and as the Fund grows and whether the fee levels in the Agreement reflect these economies of scale. These materials included an analysis of the Fund and Alger Management's services by Callan Associates Inc. ("Callan"), an independent consulting firm whose specialties include assistance to fund trustees and directors in their review of advisory contracts pursuant to section 15(c) of the 1940 Act. At the meeting, senior Callan personnel provided a presentation to the Trustees based on the Callan materials.
In deciding whether to approve renewal of the Agreement, the Trustees considered various factors, including those enumerated above. They also considered other direct and indirect benefits to Alger Management and its affiliates from their relationship with the Fund.
NATURE, EXTENT AND QUALITY OF SERVICES
In considering the nature, extent and quality of the services provided by Alger Management pursuant to the Agreement, the Trustees relied on their prior experience
-33-
ALGER CHINA-U.S. GROWTH FUND
ADDITIONAL INFORMATION (Unaudited) (Continued)
as Trustees of the Fund, their familiarity with the personnel and resources of Alger Management and its affiliates, and the materials provided at the meeting. They noted that under the Agreement Alger Management is responsible for managing the investment operations of the Fund, with the Fund's sub-adviser providing portfolio management advice with respect to China securities. They also noted that administrative, compliance, reporting and accounting services necessary for the conduct of the Fund's affairs are provided under the separate Administration Agreement. The Trustees reviewed the background and experience of Alger Management's senior investment management personnel, including the individuals currently responsible for the investment operations of the Fund. They also considered the resources, operational structures and practices of Alger Management in managing the Fund, as well as Alger Management's overall investment management busines s. They noted especially Alger Management's established expertise in managing portfolios of "growth" stocks and that, according to an analysis provided by Callan, the characteristics of the Fund's portfolio had, since inception, been typical of a fund that holds itself out to investors as growth-oriented. The Trustees concluded that Alger Management's experience, resources and strength in the areas of importance to the Fund are considerable. The Trustees considered the level and depth of Alger Management's ability to execute portfolio transactions to effect investment decisions, including those through Alger Inc. The Trustees also considered the ongoing enhancements to the control and compliance environment at Alger Management and within the Fund.
INVESTMENT PERFORMANCE OF THE FUNDS
Drawing upon information provided at the meeting by Alger Management as well as Callan and upon reports provided to the Trustees by Alger Management throughout the preceding year, the Trustees determined that the overall performance of the Fund had been excellent in prior years but had fallen short of that of most of its peers in 2008. Noting that the 2008 market environment for stocks in general and for "growth" stocks in particular had thus far been challenging in 2008, the Trustees discussed the Funds' recent performance with Alger Management and the performance prospects for the remainder of the year and beyond. They also took note of Callan's observation that the distinctive nature of the Fund made selection of a true peer group very difficult. The Fund had continued to outperform its Callan benchmark.
FUND FEE AND EXPENSE RATIO; PROFITABILITY TO ALGER MANAGEMENT AND ITS AFFILIATES
The Trustees considered the profitability of the Investment Advisory Agreement to Alger Management and its affiliates, and the methodology used by Alger Management in determining such profitability. The Trustees reviewed previously-provided data on the Fund's profitability to Alger Management and its affiliates for the year ended June 30, 2008. In addition, the Trustees reviewed the Fund's management fee and expense ratio and compared them with a group of comparable funds. In order to assist the Trustees in this comparison, Callan had provided the Trustees with comparative information with respect to fees paid, and expense ratios incurred, by similar funds. That information indicated that the fee and expense ratio for the Fund were
-34-
ALGER CHINA-U.S. GROWTH FUND
ADDITIONAL INFORMATION (Unaudited) (Continued)
higher than most of the fees and expense ratios in the Callan reference group. However, at the meeting Alger Management agreed to lower the advisory fee for the Fund, which could be expected to bring the Fund's fee and expense ratio down to more satisfactory levels. After analysis and discussion, they concluded that, to the extent that Alger Management's and its affiliates' relationships with the Fund had been profitable to those entities, the profit margins were not unacceptable.
ECONOMIES OF SCALE
On the basis of their discussions with management and their analysis of information provided at the meeting, the Trustees determined that the nature of the Fund and its operations is such that Alger Management is likely to realize economies of scale in the management of the Fund at some point as it grows in size, but that adoption of breakpoints in the advisory fee, while possibly appropriate at a later date, could await further analysis of the sources and potential scale of the economies and the fee structure that would best reflect them. Accordingly, the Trustees requested that Alger Management address this topic with the Trustees at future meetings.
OTHER BENEFITS TO ALGER MANAGEMENT
The Trustees considered whether Alger Management benefits in other ways from its relationship with the Fund. They noted that Alger Management maintains soft-dollar arrangements in connection with the Fund's brokerage transactions, reports on which are regularly supplied to the Trustees at their quarterly meetings and summaries of which, listing soft-dollar commissions through June 30, 2008 and December 31, 2007, had been included in the materials supplied prior to the meeting. The Trustees also noted that Alger, Inc. provides a substantial portion of the Fund's equity brokerage and receives shareholder servicing fees from the Fund as well, and that Alger Management receives fees from the Fund under a shareholder administrative services agreement. The Trustees had been provided with information regarding, and had considered, the brokerage and shareholder servicing fee benefits in connection with their review of the profitability to Alger Man agement and its affiliates of their relationships with the Fund. As to other benefits received, the Trustees decided that none were so significant as to render Alger Management's fees excessive.
CONCLUSIONS AND DETERMINATIONS
At the conclusion of these discussions, each of the Independent Trustees expressed the opinion that he had been furnished with sufficient information to make an informed business decision with respect to renewal of the Fund's Investment Advisory Agreement. Based on its discussions and considerations as described above, the Board made the following conclusions and determinations:
• The Board concluded that the nature, extent and quality of the services provided by Alger Management are adequate and appropriate.
• The Board determined that the Fund's overall performance was satisfactory but determined to monitor the progress of Alger Management's steps to improve the performance of the Fund by comparison with that of the first half of 2008.
-35-
ALGER CHINA-U.S. GROWTH FUND
ADDITIONAL INFORMATION (Unaudited) (Continued)
• The Board concluded that the Fund's advisory fee to be paid to Alger Management was reasonable in light of comparative performance and expense and advisory fee information, costs of the services provided and profits to be realized and benefits derived or to be derived by Alger Management from the relationship with the Fund.
• The Board determined that there were not at this time significant economies of scale to be realized by Alger Management in managing the Fund's assets but that, to the extent that material economies of scale should be realized in the future, the Board would seek to ensure that they were shared with the Fund.
The Board considered these conclusions and determinations and, without any one factor being dispositive, determined that renewal of the Investment Advisory Agreement was in the best interests of the Fund and its shareholders.
Renewal of the Sub-Advisory Agreement
At the same meeting, the Trustees, including the Independent Trustees, unanimously approved renewal of the Sub-Advisory Agreement for the Fund between Martin Currie Inc. and Alger Management. The Independent Trustees were assisted in their review by independent legal counsel and met with counsel in executive session.
In evaluating the Sub-Advisory Agreement, the Trustees drew on materials from Martin Currie that had been provided to them in advance of the meeting as well as their knowledge of Martin Currie gained at the prior year's meeting and over the course of the intervening year. The Trustees were also furnished with a copy of Martin Currie's registration statement on Form ADV as filed with the SEC, a memorandum from counsel discussing the Trustees' legal responsibilities in considering renewal of the Sub-Advisory Agreement, and a copy of the Sub-Advisory Agreement itself.
NATURE, EXTENT AND QUALITY OF SERVICES; INVESTMENT PERFORMANCE
In considering the nature, extent and quality of the services provided by Martin Currie pursuant to the Sub-Advisory Agreement, the Trustees relied on the foregoing materials and discussions with Alger Management personnel. They noted Martin Currie's extensive background and resources as an investment management company in general and with respect to Greater China investments in particular and the experience and qualifications of the Martin Currie personnel who would be supplying portfolio management services to the Fund. As to performance history, they noted that the performance of the Fund during Martin Currie's tenure had generally been good. The Trustees concluded that Martin Currie's experience, resources and strength in areas of importance to the Fund are considerable.
PROFITABILITY; ECONOMIES OF SCALE; SUB-ADVISORY FEE
In evaluating the sub-advisory fee paid to Martin Currie, the Trustees did not consider the profitability of the Sub-Advisory Agreement to Martin Currie and its affiliates or the topic of economies of scale, having determined that these topic would be more appropriately addressed in the course of a review of the Fund's Investment Management
-36-
ALGER CHINA-U.S. GROWTH FUND
ADDITIONAL INFORMATION (Unaudited) (Continued)
Agreement with Alger Management. As to the sub-advisory fee itself, the Trustees noted that the fee would be paid not by the Fund but by Alger Management out of its own resources. After discussion with Alger Management, they concluded that, in light of the services that Martin Currie was providing to the Fund and of the fee to be paid by the Fund to Alger Management, there was no reason not to conclude that the fee to Martin Currie was fair and reasonable. Nor did they consider that such foreseeable additional benefits as might accrue to that firm by virtue of its relationship with the Fund would render the sub-advisory fee excessive.
At the conclusion of these discussions, each of the Independent Trustees expressed the opinion that he had been furnished with sufficient information to make an informed business decision with respect to renewal of the Sub-Advisory Agreement. Based on its discussions and considerations as described above, the Board made the following conclusions and determinations:
• The Board concluded that the nature, extent and quality of the services provided by Martin Currie were adequate and appropriate.
• The Board concluded that the fee to be paid to Martin Currie by Alger Management was fair and reasonable.
• The Board determined that attention to economies of scale was more appropriately paid in the context of a review of the Investment Advisory Agreement with Alger Management.
The Board considered these conclusions and determinations and, without any one factor being dispositive, determined that renewal of the Fund's Sub-Advisory Agreement was in the best interests of the Fund and its shareholders.
Proxy Voting Policies
A description of the policies and procedures the Fund uses to determine how to vote proxies relating to portfolio securities and the proxy voting record is available, without charge, by calling (800) 254-3796 or online on the Fund's website at http://www.alger.com or on the EDGAR Database on the SEC's website (http://www.sec.gov).
Fund Holdings
The Fund's most recent month end portfolio holdings are available approximately sixty days after month end on the Fund's website at www.alger.com. The Fund also files its complete schedule of portfolio holdings with the SEC for the first and third quarter of each fiscal year on Form N-Q. The Fund's Forms N-Q is available online on the SEC's website at www.sec.gov or may be reviewed and copied at the SEC's Public Reference Room in Washington, D.C. Information regarding the operation of the SEC's Public Reference Room may be obtained by calling 1-800-SEC-0330. A copy of the most recent quarterly holdings may also be obtained from the Fund by calling (800) 254-3796.
-37-
(This page has been intentionally left blank.)
(This page has been intentionally left blank.)
(This page has been intentionally left blank.)
(This page has been intentionally left blank.)
(This page has been intentionally left blank.)
(This page has been intentionally left blank.)
(This page has been intentionally left blank.)
ALGER CHINA-U.S. GROWTH FUND
111 Fifth Avenue
New York, NY 10003
(800) 254-3796
www.alger.com
Investment Manager
Fred Alger Management, Inc.
111 Fifth Avenue
New York, NY 10003
Transfer Agent and Dividend Disbursing Agent
Boston Financial Data Services, Inc.
P.O. Box 8480
Boston, MA 02266
This report is submitted for the general information of the shareholders of the Alger China-U.S. Growth Fund. It is not authorized for distribution to prospective investors unless accompanied by an effective Prospectus for the Fund, which contains information concerning the Fund's investment policies, fees and expenses as well as other pertinent information.
Go Paperless with Alger Electronic Delivery Service
Alger is pleased to provide you with the ability to access regulatory materials online. When documents such as prospectuses and annual and semi-annual reports are available, we'll send you an e-mail notification with a convenient link that will take you directly to the fund information on our website. To sign up for this free service, simply enroll at www.icsdelivery.com/alger.

SAC 103108


ITEM 2. CODE OF ETHICS.
(a) The Registrant has adopted a code of ethics (the “Code of Ethics”) that applies to its principal executive officer, principal financial officer, principal accounting officer or controller, or persons performing similar functions.
(b) Not applicable.
(c) The Registrant has amended its Code of Ethics during the period covered by the shareholder report presented in Item 1 hereto whereby the code applies to officers of the registrant rather than officers of the investment advisor and other related entities.
(d) The Registrant has not granted a waiver or an implicit waiver from a provision of its Code of Ethics during the period covered by the shareholder report presented in Item 1 hereto.
(e) Not applicable.
(f) The Registrant’s Code of Ethics is attached as an Exhibit hereto.
ITEM 3. AUDIT COMMITTEE FINANCIAL EXPERT.
The Board of Trustees of the Registrant determined that Stephen E. O’Neil is an audit committee financial expert (within the meaning of that phrase specified in the instru ctions to Form N-CSR) on the Registrant’s audit committee. Mr. O’Neil is an “independent” trustee – i.e., he is not an interested person of the Registrant as defined in the Investment Company Act of 1940, nor has he accepted directly or indirectly any consulting, advisory or other compensatory fee from the Registrant, other than in his capacity as Trustee.
ITEM 4. PRINCIPAL ACCOUNTANT FEES AND SERVICES.
a) Audit Fees:
October 31, 2008 | | $ | 33,600 | |
October 31, 2007 | | $ | 32,000 | |
b) Audit-Related Fees: NONE
c) Tax Fees for tax advice, tax compliance and tax planning:
October 31, 2008 | | $ | 4,500 | |
October 31, 2007 | | $ | 4,260 | |
d) All Other Fees:
October 31, 2008 | | $ | 12,100 | |
October 31, 2007 | | $ | 6,200 | |
Other fees include a review and consent for Registrants registration statement filing and a review of the semi-annual financial statements.
e) 1) Audit Committee Pre-Approval Policies And Procedures:
Audit and non-audit services provided by the Registrant’s independent registered public accounting firm (the “Auditors”) on behalf the Registrant must be pre-approved by the Audit Committee. Non-audit services provided by the Auditors on behalf of the Registrant’s Investment Adviser or any entity controlling, controlled by, or under common control with the Investment Adviser must be pre-approved by the Audit Committee if such non-audit services directly relate to the operations or financial reporting of the Registrant.
2) All fees in item 4(b) through 4(d) above were approved by the Registrants’ Audit Committee.
f) Not Applicable
g) Non-Audit Fees:
October 31, 2008 | | $ | 282,950 and 15,068 Euros | |
October 31, 2007 | | $ | 282,811 and 70,773 Euros | |
h) The audit committee of the board of trustees has considered whether the provision of the non-audit services that were rendered to the registrant’s investment adviser and any entity controlling, controlled by, or under common control, with the adviser that provides ongoing services to the registrant that were not approved pursuant to (c)(7)(ii) of Rule 2-01 of Regulation S-X is compatible with maintaining the principle accountant’s independence.
ITEM 5. AUDIT COMMITTEE OF LISTED REGISTRANTS.
Not applicable
ITEM 6. INVESTMENTS.
Not applicable
ITEM 7. DISCLOSURE OF PROXY VOTING POLICIES AND PROCEDURES FOR CLOSED END MANAGEMENT INVESTMENT COMPANIES.
Not applicable
ITEM 8. PORTFOLIO MANAGERS OF CLOSED-END MANAGEMENT INVESTMENT COMPANIES.
Not applicable
ITEM 9. PURCHASES OF EQUITY SECURITIES BY CLOSED-END MANAGEMENT INVESTMENT COMPANY AND AFFILIATED PURCHASERS.
Not applicable
ITEM 10. SUBMISSION OF MATTERS TO A VOTE OF SECURITY HOLDERS.
&nb sp;
None
ITEM 11. CONTROLS AND PROCEDURES.
(a) The Registrant’s principal executive officer and principal financial officer have concluded that the Registrant’s disclosure controls and procedures (as defined in Rule 30a-3(c) under the Investment Company Act of 1940, as amended) are effective based on their evaluation of the disclosure controls and procedures as of a date within 90 days of the filing date of this document.
(b) No changes in the Registrant’s internal control over financial reporting occurred during the Registrant’s second fiscal half-year that materially affected, or are
reasonably likely to materially affect, the Registrant’s internal control over financial reporting.
ITEM 12. EXHIBITS.
(a) (1) Code of Ethics as Exhibit 99.CODE ETH
(a) (2) Certifications of principal executive officer and principal financial officer as required by rule 30a-2(a) under the Investment Company Act of 1940 are attached as Exhibit 99.CERT
(b) Certifications of principal executive officer and principal financial officer as required by rule 30a-2(b) under the Investment Company Act of 1940 are attached as Exhibit 99.906CERT
SIGNATURES
Pursuant to the requirements of the Securities Exchange Act of 1934 and the Investment Company Act of 1940, the registrant has duly caused this report to be signed on its behalf by the undersigned, thereunto duly authorized.
Alger China-U.S Growth Fund
By: | /s/Dan C. Chung | |
| |
| Dan C. Chung |
| |
| President |
| |
Date: December 15, 2008 |
Pursuant to the requirements of the Securities Exchange Act of 1934 and the Investment Company Act of 1940, this report has been signed below by the following persons on behalf of the registrant and in the capacities and on the dates indicated.
By: | /s/Dan C. Chung | |
| |
| Dan C. Chung |
| |
| President |
| |
Date: December 15, 2008 |
By: | /s/Michael D. Martins | |
| |
| Michael D. Martins |
| |
| Treasurer |
| |
Date: December 15, 2008 |