| | OMB APPROVAL |
| | OMB Number: | 3235-0570 |
| | Expires: | January 31, 2014 |
| UNITED STATES | Estimated average burden hours per response. . . . . . . . . . . . . . . . .20.6 |
| SECURITIES AND EXCHANGE COMMISSION | |
| Washington, D.C. 20549 | |
| | | | |
FORM N-CSR
CERTIFIED SHAREHOLDER REPORT OF REGISTERED
MANAGEMENT INVESTMENT COMPANIES
Investment Company Act file number | 811-21308 |
|
Alger China-U.S. Growth Fund |
(Exact name of registrant as specified in charter) |
|
360 Park Avenue South New York, New York | | 10010 |
(Address of principal executive offices) | | (Zip code) |
|
Mr. Hal Liebes Fred Alger Management, Inc. 360 Park Avenue South New York, New York 10010 |
(Name and address of agent for service) |
|
Registrant’s telephone number, including area code: | 212-806-8800 | |
|
Date of fiscal year end: | October 31 | |
|
Date of reporting period: | October 31, 2012 | |
| | | | | | | | |
ITEM 1. REPORTS TO STOCKHOLDERS.
Alger China-U.S. Growth Fund |
|
ANNUAL REPORT | |
October 31, 2012 | |
Table of Contents
ALGER CHINA-U.S. GROWTH FUND
Shareholders’ Letter (Unaudited) | 1 |
| |
Fund Highlights (Unaudited) | 8 |
| |
Portfolio Summary (Unaudited) | 9 |
| |
Schedule of Investments | 10 |
| |
Statement of Assets and Liabilities | 17 |
| |
Statement of Operations | 18 |
| |
Statements of Changes in Net Assets | 19 |
| |
Financial Highlights | 20 |
| |
Notes to Financial Statements | 22 |
| |
Report of Independent Registered Public Accounting Firm | 31 |
| |
Additional Information (Unaudited) | 32 |
Go Paperless With Alger Electronic Delivery Service
Alger is pleased to provide you with the ability to access regulatory materials online. When documents such as prospectuses and annual and semi-annual reports are available, we’ll send you an e-mail notification with a convenient link that will take you directly to the fund information on our website. To sign up for this free service, simply enroll at www.icsdelivery.com/alger.
Shareholders’ Letter | | November 29, 2012 |
Dear Shareholders,
Thomas Edison accumulated over 1,000 patents during his lifetime, a result, in large part, of his legendary work ethic. He exhibited a skill for identifying and pursuing rewarding opportunities and possessed the following keen insight into why many individuals fail to capitalize on opportunities: “Opportunity is missed by most people because it is dressed in overalls and looks like work.” His insight is highly relevant to investors because equity markets, we believe, are providing attractive opportunities. Yet, many investors continue to reduce their U.S. equity exposure and by holding cash and bond investments with zero real return potential, sit on the sidelines. We aren’t surprised as these are indeed difficult economic times and the equity market is challenging.
In our Spring 2012 Market Update commentary(1), we said that markets were due for yet another pullback after a 12% rally earlier in the year brought the S&P 500 Index above 1400 for the first time since the 2008 Financial Crisis. We believed that markets would focus on macroeconomic concerns in China and Europe, deceleration of the U.S. economy, and uncertainty over political elections. In the commentary, we also advised our readers that, in our opinion, such volatility could provide yet another buying opportunity in U.S. equities. In the days following the publication of our commentary, investors apparently became focused on China, the euro zone, and other concerns, causing the S&P 500 to drop 9.58% from May 3 to June 1. For the near term, the selloff in May and June was shorter lived than many investors, including our firm, expected. Low trading volumes and, more importantly, hope for significant stimulus from the U.S. Federal Reserve, the European Central Bank, and other authorities allowed equity markets to recover, with the S&P 500 again climbing above 1400 and gaining 14.29% for the year-to-date period ended October 31, 2012. For the one-year reporting period ended on that date, the S&P climbed 15.21%.
Corporate Fundamentals and Second Quarter Results
Alger believes corporate fundamentals ultimately drive market performance. Companies, of course, operate within the broader economic environment of the U.S. and the global marketplace. 2012 is, in fact, a key point in this market cycle following the Financial Crisis. While corporate America continues to “outperform” the broader economy, the slowing economy and uncertainty among consumers and businesses regarding the economy are having a negative influence. In the second quarter, we saw a continuation of challenges to revenue growth across many industries. Economic concerns caused consumers and businesses to act in a predictable fashion: Individuals became apprehensive about spending and businesses became cautious over hiring employees and making capital outlays. Corporate revenues reflect that trend—on a year-over-year basis, total second-quarter 2012 revenue for S&P 500 companies declined 3.71%, according to J.P. Morgan. It was the first quarterly decline since the depths of the subprime mortgage crisis. For the quarter, 274 companies issued negative revenue surprises, the highest level since the first quarter of 2009, according to FactSet. During the second quarter of 2012, 52% of S&P 500 companies revised revenue guidance downward, while 48% revised guidance upward. This was a continuation, slightly moderated, from the first quarter of 2012, when 60% revised downward. However, the easy growth in revenues and earnings is clearly gone, especially when comparing recent results to the second quarter of 2011, when only 35%
1
of S&P 500 companies revised downward. Unlike quarterly earnings and revenues during the post-2008 Financial Crisis recession, more recent results reflect stronger economic conditions. As a result, corporations now have harder comparables to beat when evaluating results on a year-over-year basis. Moderating GDP growth is also expected to make it harder for corporations to generate substantial revenue and earnings growth.
This backdrop of a slow growth economy, however, is one in which we believe our investment philosophy is well equipped to thrive. Our fundamental investment strategy keeps us focused on finding compelling investment opportunities among companies that are best suited to excel in these challenging times of slow economic growth and increasing concerns over fiscal policy. By conducting in-depth research, we believe that we have potential to find companies that can grow earnings and revenues by gaining market share. As dedicated, long-term growth investors, furthermore, we are attuned to the investment opportunities that challenging economies offer to companies capitalizing on innovation and change.
A Closer Look at Certain Sectors
A closer look at the results announced by companies in a couple of sectors highlights many of the points we’ve made over the years in Alger market commentaries. No broad “average” or single statement, of course, can summarize the results of a sector as broad as Consumer Discretionary, so we will instead give an overview of typical earnings reports for the quarter. Warnaco Group, Coach Inc., and Starbucks Corporation were among companies that announced softness in customer spending. Warnaco has brands such as Speedo and Calvin Klein and it reported weak second-quarter results for Europe and the U.S. Even with positive performance in Asia and Latin America, its net revenues declined 5% on a year-over-year basis, which was in line with Warnaco’s expectations. Warnaco management warned that it is balancing its expectations for new product launches with its outlook for a muted consumer environment in North America and a softening global macroeconomic environment. Fashion accessory leader Coach, Inc. also reported disappointing same-store sales in the U.S., where traffic to its factory outlet stores declined and discounts were required to entice customers to spend. Coach’s strong Asia results, fortunately, helped the company increase year-over-year sales 12%. Starbucks, meanwhile, said it is bracing for a decline in consumer spending and it lowered its earnings-per-share guidance to $0.44 to $0.45 from prior guidance of $0.46 to $0.47. For the fiscal quarter ended July 1, Starbucks said it generated a 13% net revenue increase and noted that same-store sales in China grew only 12%, compared to 18% in the prior quarter. Economic softness in Europe, meanwhile, pressured results of many companies such as PVH Corp., which offers Calvin Klein and Tommy Hilfiger merchandise, and Ralph Lauren Corporation, which offers clothing and home decorating accessories. Ralph Lauren management noted that “the outlook for consumer spending and global economic growth remains challenging and we are planning our business accordingly.” After a multiyear run of double-digit growth in revenues and earnings, Ralph Lauren’s growth may be in the mid-single digits for this year.
Encouragingly, many companies generated strong bottom-line results, or at least results better than many feared. We have commented before that this economic recovery is marked by strong corporate cost controls, resulting in an excellent level of profitability and cash flow in well-managed companies. That’s continued even as top-line revenue growth moderates (overall revenue growth for the consumer sector was 5% in the second quarter). For example, discount clothing retailer TJX Companies generated a 24% increase
2
in net income, even though net sales increased only 9%, and restaurant operator Brinker International, Inc. grew net revenues only 1.5%, but managed to increase net income approximately 12%. For the overall sector, bottom-line results, as measured by net income, increased less than 1% on a year-over-year basis, which makes the strong earnings of companies such as Brinker International and TJX even more noteworthy.
One bright spot has been the U.S. housing industry. In our Summer 2011 Commentary, we reasoned that the real estate market was close to bottoming. At the time, we believed that increasing affordability of homes would eventually support a recovery in housing. Since then, homebuilder stock prices, broadly speaking, have increased. Looking ahead, we believe that the U.S. housing recovery will be a multiyear trend. Just as the downturn took four to five years to finally bottom, so will the recovery, we believe, take time to unfold. Approximately 750,000 residential units, including multifamily properties, are being constructed on an annualized basis, which is a very depressed level compared to the typical levels of about 1.5 million new homes built prior to 2008. In some of the most depressed locations, new home building has been down 70% or 80% from peak, and even with a potential 20% to 30% increase over the next few years, would still be well below peak levels. With extraordinarily low mortgage rates and improving, but still poor, availability of bank financing, we see a long runway for recovery. Second-quarter earnings among publicly traded homebuilders were excellent. We continue to like this area of the U.S. economy, though we believe that the stocks are due for a pause with many trading at five-year highs as of the publication of this letter.
Reasons for Optimism
In addition to the Consumer Discretionary examples discussed above, many companies have preserved profitability by cutting costs as revenues moderate. Even with the year-over-year second-quarter revenue decline of the S&P 500, earnings grew, granted the increase was less than 1%. Also during the second quarter, only 38% of S&P 500 companies had earnings misses, even though 52% of companies reported revenue misses. In comparison, the highest number of earnings misses since the first quarter of 2009 was 39%, which occurred in the last quarter of 2011. For that quarter, however, an impressive 64% of companies missed revenue targets.
In our assessment, corporate fundamentals remain surprisingly strong, amidst a truly difficult global environment. The caution instilled in corporate management means that earnings and margins, while trimmed in many cases, have remained surprisingly healthy when considering the economic background in the U.S. and around the world. With no wage pressures, moderating input costs, and sufficient production capacity, slowing revenue growth is simply not having a devastating impact on corporate earnings or cash flow, which is contrary to the previous forecasts of many pundits. At Alger, we continue to maintain—and we believe the second quarter illustrates this point—that strong corporate earnings are a durable, not cyclical, aspect of the post-2008 Financial Crisis period. The economy and corporate revenues, granted, are struggling against a headwind of weak employment growth in the U.S., but we remind readers that unemployment is highly bifurcated between college- and non-college educated individuals.
In April, we reported that we were anticipating a weak job market and noted that significant uncertainty would linger over how equity markets may react to decelerating corporate earnings. Here, the market has been, in our view, exceedingly resilient in the face of slowing growth and lack of any real progress on Europe and U.S. fiscal policy. In particular, despite the media’s and equity markets’ fixation on every word, movement, or
3
meeting by European regulators and politicians, and the lack of any substantive action by such actors to address the worsening economic issues in Greece, Spain, Italy, and other troubled countries in Europe, the markets have responded quite favorably.
It’s clear to us that we have an unusual combination of factors driving a reasonable, though not broad-based or high-volume, rally off of market lows of June. First, in July, European Central Bank President Mario Draghi raised global market expectations that the organization may engage in extensive bond buying, or in other words, European style quantitative easing. Second, fear of a collapse of the euro and the euro-zone economic fallout has created yet another flight to safety that has caused U.S. Treasury yields to fall to impressively low levels. The low rates are widely recognized as likely being negative after factoring inflation. As a result, we think U.S. equities have benefitted, albeit ever so slightly, from investors shunning additional Treasury buys while fleeing European and emerging markets exposure.
Going Forward
We are pleased by equities’ resiliency, though guessing stocks’ direction based on the actions of regulatory and political leaders in Europe leaves us, as we were in April, uneasy. While we would like to think that June represented a short-term bottom for U.S. equities, we continue to think that investors will retest those lows sometime because of macroeconomic issues and a lack of clarity over government fiscal policies. However, the data we have gathered and the fundamentals that we have observed in the second quarter are, in our view, an extremely helpful guide to current conditions and conditions in 2013.
We now have even greater conviction that any dip, in particular any occurring in the next few months, should be aggressively bought. The current resiliency of the markets shows not, as some would suggest, that markets purely move with macro factors or with the statements of politicians in Europe, but with corporate fundamentals, which we believe are solid in the U.S. Corporate and, increasingly, consumer balance sheets in the U.S. have healthy levels of cash and are underinvested. But that cash hoard, in our view, is increasingly being used in a most sensible way at a time when some investors, including noted bond manager Bill Gross of PIMCO, say equities are losing their appeal. In his August investment outlook, Gross claimed, “The cult of equity is dying” and “investors’ impressions of stocks for the long run or any run have mellowed as well.” The statement is an about-face for Gross, who two years ago said equities were likely to outperform bonds.
We are encouraged to see companies either starting to pay dividends or increasing dividends. Many companies are also buying back stock at an aggressive rate. The result, we believe, may be to put a fundamental floor on the U.S. stock market. We are highly encouraged by what we’ve seen in corporate fundamentals and market reactions. Regulators across the world are raising the rhetoric about slowing economic growth and in many parts of the world, such as China and Brazil, policies are clearly moving to a simulative stance. In other parts, like Europe, it’s mostly rhetoric that is supporting equity market gains, but we think stimulus from policymakers is likely. We maintain that it is not time to sell equities as some suggest. Rather, it is time to buy if you have a time horizon that goes beyond a year, and buy more on market dips if you already own equities. Clearly, we believe that it is time to embrace equities and the rigorous work of conducting in-depth, fundamental research that potentially can uncover attractive opportunities. And it’s time to diversify away from a likely losing asset class that is offering historically low yields: U.S. Treasuries.
4
Portfolio Matters
The Alger China-U.S. Growth Fund returned 1.99% for the 12-month period ended October 31, 2012, compared to the 10.78% return of the MSCI Zhong Hua Index and the 15.21% return of the S&P 500 Index.
During the one-year period, the largest sector weightings in the Fund were Information Technology and Financials. The largest sector overweight for the period was in Information Technology and the largest sector underweight was Health Care. Relative outperformance in the Utilities and Financials sectors was the most important contributor to performance, while Materials and Industrials detracted from results. Among the most important relative contributors were Tencent Holdings Ltd.; The Link Real Estate Investment Trust; AIA Group Ltd.; Chailease Holding Co., Ltd.; and TXC Corp.
Tencent is China’s largest Internet company. It offers online gaming, instant messaging, advertising, and other services. It has generated more than 40% revenue growth, a result of strong performance of its core business, which includes online gaming and advertising. Its entrance to ecommerce has also boosted revenue. The company’s investment cycle, meanwhile, has reached a point where it can potentially increase margins next year.
Conversely, detracting from relative performance were Molycorp, Inc.; Spreadtrum Communications, Inc.; ExxonMobil Corp.; Wistron NeWeb Corp.; and Dongyue Group Ltd. Weakening oil and gas fundamentals during the reporting period caused investors to favor defensive positions such as ExxonMobil, so the stock, which is an S&P 500 constituent, outperformed the benchmark. The Fund was underweight the holding relative to the index, so the position detracted from relative performance.
As always, we strive to deliver consistently superior investment results for you, our shareholders, and we thank you for your business and your continued confidence in Alger.
Respectfully submitted, | |

| |
Daniel C. Chung, CFA | |
Chief Investment Officer | |
(1) For more details, see Alger commentary titled “Spring 2012 Market Update.”
J.P. Morgan is a bank that provides research and market data to investors. PIMCO is an asset management firm. FactSet provides financial data and analytics to the global investment community.
As of October 31, 2012, the following holdings represented the noted percentages of firm wide assets under management: The Warnaco Group, 0.00%; Coach Inc., 0.00%; Starbucks Corporation, 0.14%; PVH Corp., 0.77%; Ralph Lauren Corporation, 0.41%; TJX Companies, 0.05%; and Brinker International, Inc., 0.00%. Positions in those companies may or may not have been held by the Alger China-U.S. Growth Fund.
Investors cannot invest directly in an index. Index performance does not reflect the deduction for fees, expenses, or taxes.
5
This report and the financial statements contained herein are submitted for the general information of shareholders of the Fund. This report is not authorized for distribution to prospective investors in the Fund unless proceeded or accompanied by an effective prospectus for the Fund. Fund performance returns represent the fiscal 12-month period return of Class A shares prior to the deduction of any sales charges and include the reinvestment of any dividends or distributions.
The performance information quoted represents past performance, which is not an indication or guarantee of future results.
Standardized performance results can be found on the following pages. The investment return and principal value of an investment in the Fund will fluctuate so that an investor’s shares when redeemed may be worth more or less than their original cost. Current performance may be lower or higher than the performance quoted. For performance data current to the most recent month-end, visit us at www.alger.com, or call us at (800) 992-3863.
The views and opinions of the Fund’s management in this report are as of the date of the Shareholders letter and are subject to change at any time subsequent to this date. There is no guarantee that any of the assumptions that formed the basis for the opinions stated herein are accurate or that they will materialize. Moreover, the information forming the basis for such assumptions is from sources believed to be reliable, however, there is no guarantee that such information is accurate. Any securities mentioned, whether owned in the Fund or otherwise, are considered in the context of the construction of an overall portfolio of securities and therefore reference to them should not be construed as a recommendation or offer to purchase or sell any such security. Inclusion of such securities in the Fund and transactions in such securities, if any, may be for a variety of reasons, including without limitation, in response to cash flows, inclusion in a benchmark, and risk control. The reference to a specific security should also be understood in such context and not viewed as a statement that the security is a significant holding in the Fund. Please refer to the Schedule of Investments for the Fund which is included in this report for a complete list of Fund holdings as of October 31, 2012.
A Word about Risk
Growth stocks tend to be more volatile than other stocks as the price of growth stocks tends to be higher in relation to their companies’ earnings and may be more sensitive to market, political, and economic developments. Investing in the stock market involves gains and losses and may not be suitable for all investors. Stocks of small- and mid-sized companies are subject to greater risk than stocks of larger, more established companies owing to such factors as limited liquidity, inexperienced management, and limited financial resources. Investing in foreign securities involves additional risk (including currency risk, risks related to political, social, or economic conditions, and risks associated with the Chinese markets, such as increased volatility, limited liquidity, less stringent regulatory and legal system, and lack of industry and country diversification), and may not be suitable for all investors. Funds that can participate in leveraging, such as the Alger China-U.S. Growth Fund, are subject to the risk that borrowing money to leverage will exceed the returns for securities purchased or that the securities purchased may actually go down in value; thus, the Fund’s net asset value can decrease more quickly than if the Fund had not borrowed. For a more detailed discussion of the risks associated with the Fund, please see the Fund’s Prospectus.
6
Before investing, carefully consider the Fund’s investment objective, risks, charges, and expenses. For a prospectus or a summary prospectus containing this and other information about the Fund call us at (800) 992-3863 or visit us at www.alger.com. Read it carefully before investing.
Fred Alger & Company, Incorporated, Distributor. Member NYSE Euronext, SIPC.
NOT FDIC INSURED. NOT BANK GUARANTEED. MAY LOSE VALUE.
Definitions:
· Standard & Poor’s is a credit rating agency and provider of financial data.
· Standard & Poor’s 500 Index (S&P 500 Index) is an index of 500 leading companies in leading industries in the United States.
· The MSCI Zhong Hua Index is an aggregate of the MSCI Hong Kong Index (a capitalization-weighted index that monitors the performance of stocks from Hong Kong) and the MSCI China Free Index (an unmanaged market capitalization-weighted index of Chinese companies available to non-domestic investors).
FUND PERFORMANCE AS OF 9/30/12 (Unaudited) †
AVERAGE ANNUAL TOTAL RETURNS
| | 1 YEAR | | 5 YEARS | | Since
11/3/2003 | |
Alger China-U.S. Growth Class A (Inception 11/3/03) | | 10.79 | % | (6.36 | )% | 8.49 | % |
Alger China-U.S. Growth Class C (Inception 3/3/08)* | | 15.07 | % | (5.97 | )% | 8.39 | % |
The performance data quoted represents past performance, which is not an indication or a guarantee of future results. The Fund’s average annual total returns include changes in share price and reinvestment of dividends and capital gains.
† | Returns reflect maximum sales charges on Class A shares and applicable contingent deferred sales charges on Class C shares. |
| |
* | Performance figures prior to 3/3/08, inception of Class C shares, are those of the Fund’s Class A shares. Performance has been adjusted to remove the front-end sales charge imposed by Class A shares. Class C shares do not impose a front-end sales charge but do impose a contingent deferred sales charge of 1% on shares redeemed. If Class A sales charges were reflected, annual returns for the Class C shares would be lower. The performance figures prior to 3/3/08 have also been adjusted to reflect the higher operating expenses and applicable contingent deferred sales charge of Class C shares. |
7
ALGER CHINA-U.S. GROWTH FUND
Fund Highlights Through October 31, 2012 (Unaudited)
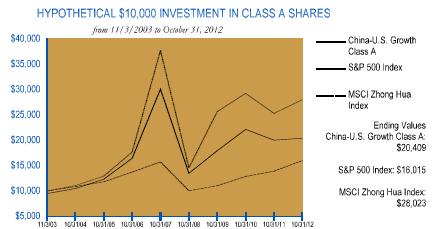
The chart above illustrates the growth in value of a hypothetical $10,000 investment made in the Alger China-U.S. Growth Fund Class A shares, with an initial maximum sales charge of 5.25%, and the S&P 500 Index and the MSCI Zhong Hau Index (unmanaged indices of common stocks) from November 3, 2003, the inception date of the Alger China-U.S. Growth Fund Class A shares, through October 31, 2012. The figures for the Alger China-U.S. Growth Fund Class A shares, the S&P 500 Index, and the MSCI Zhong Hau Index include reinvestment of dividends. Performance for the Alger China-U.S. Growth Fund Class C shares will vary from the results shown above due to differences in expenses and sales charges that class bears. Investors cannot invest directly in any index. Index performance does not reflect deduction for fees, expenses, or taxes.
PERFORMANCE COMPARISON AS OF 10/31/12 †
AVERAGE ANNUAL TOTAL RETURNS
| | 1 YEAR | | 5 YEARS | | Since
11/3/2003 | |
Class A (Inception 11/3/03) | | (3.39 | )% | (8.46 | )% | 8.25 | % |
Class C (Inception 3/3/08)* | | 0.22 | % | (8.07 | )% | 8.15 | % |
S&P 500 Index | | 15.21 | % | 0.36 | % | 5.38 | % |
MSCI Zhong Hua Index | | 10.78 | % | (5.76 | )% | 12.14 | % |
The performance data quoted represents past performance, which is not an indication or a guarantee of future results. The Fund’s average annual total returns include changes in share price and reinvestment of dividends and capital gains. The chart and table above do not reflect the deduction of taxes that a shareholder would have paid on Fund distributions or on the redemption of Fund shares. Investment return and principal will fluctuate and the Fund’s shares, when redeemed, may be worth more or less than their original cost. Current performance may be higher or lower than the performance quoted. For updated performance, visit us at www.alger.com or call us at (800) 992-3863.
† | Returns reflect maximum sales charges on Class A shares and applicable contingent deferred sales charges on Class C shares. |
| |
* | Performance figures prior to 3/3/08, inception of Class C shares, are those of the Fund’s Class A shares. Performance has been adjusted to remove the front-end sales charge imposed by Class A shares. Class C shares do not impose a front-end sales charge but do impose a contingent deferred sales charge of 1% on shares redeemed. If Class A sales charges were reflected, annual returns for the Class C shares would be lower. The performance figures prior to 3/3/08 have also been adjusted to reflect the higher operating expenses and applicable contingent deferred sales charge of Class C shares. |
8
PORTFOLIO SUMMARY†
October 31, 2012 (Unaudited)
COUNTRY | | Alger China-
U.S. Growth
Fund | |
Bermuda | | 0.4 | % |
Cayman Islands | | 4.3 | |
China | | 13.0 | |
Germany | | 1.0 | |
Hong Kong | | 19.6 | |
India | | 0.8 | |
Israel | | 0.6 | |
Italy | | 0.7 | |
Japan | | 1.2 | |
Malaysia | | 0.9 | |
Mongolia | | 0.6 | |
Netherlands | | 3.0 | |
Spain | | 0.3 | |
Sweden | | 0.6 | |
Taiwan | | 4.6 | |
United States | | 44.9 | |
Cash and Net Other Assets | | 3.5 | |
| | 100.0 | % |
† Based on net assets.
9
ALGER CHINA-U.S. GROWTH FUND
Schedule of Investments‡ October 31, 2012
| | SHARES | | VALUE | |
COMMON STOCKS—92.6% | | | | | |
BERMUDA—0.4% | | | | | |
PACKAGED FOODS & MEATS—0.4% | | | | | |
China Foods Ltd.
(Cost $165,820) | | 183,619 | | $ | 185,987 | |
| | | | | |
CAYMAN ISLANDS—4.3% | | | | | |
CONSUMER FINANCE—1.0% | | | | | |
Chailease Holding Co., Ltd. | | 250,174 | | 445,363 | |
| | | | | |
INTERNET SOFTWARE & SERVICES—3.3% | | | | | |
Sina Corp. * | | 6,800 | | 371,484 | |
Tencent Holdings Ltd. | | 31,224 | | 1,106,329 | |
| | | | 1,477,813 | |
TOTAL CAYMAN ISLANDS
(Cost $1,092,548) | | | | 1,923,176 | |
| | | | | |
CHINA—13.0% | | | | | |
ADVERTISING—0.3% | | | | | |
Focus Media Holding Ltd.# | | 6,400 | | 150,912 | |
| | | | | |
APPAREL RETAIL—0.8% | | | | | |
Belle International Holdings Ltd. | | 184,300 | | 342,438 | |
| | | | | |
AUTOMOBILE MANUFACTURERS—0.7% | | | | | |
Great Wall Motor Co., Ltd. | | 115,854 | | 319,157 | |
| | | | | |
COAL & CONSUMABLE FUELS—0.9% | | | | | |
China Shenhua Energy Co. | | 90,523 | | 385,450 | |
| | | | | |
CONSTRUCTION & ENGINEERING—0.3% | | | | | |
China Singyes Solar Technologies Holdings Ltd. | | 197,518 | | 116,981 | |
| | | | | |
DIVERSIFIED BANKS—2.4% | | | | | |
China Construction Bank Corp. | | 659,657 | | 497,931 | |
Industrial & Commercial Bank of China Ltd. | | 828,646 | | 548,507 | |
| | | | 1,046,438 | |
DIVERSIFIED METALS & MINING—2.6% | | | | | |
Jiangxi Copper Co. | | 154,096 | | 398,659 | |
Tiangong International Co., Ltd. | | 3,064,043 | | 739,318 | |
| | | | 1,137,977 | |
ELECTRONIC EQUIPMENT MANUFACTURERS—0.2% | | | | | |
AAC Technologies Holdings, Inc. | | 26,198 | | 94,143 | |
| | | | | |
INDEPENDENT POWER PRODUCERS & ENERGY TRADERS—0.7% | | | | | |
Huaneng Power International, Inc. | | 408,000 | | 326,398 | |
| | | | | |
INTEGRATED OIL & GAS—1.2% | | | | | |
PetroChina Co., Ltd. | | 403,010 | | 549,130 | |
| | | | | |
INTERNET SOFTWARE & SERVICES—1.2% | | | | | |
Baidu, Inc.#* | | 5,000 | | 533,099 | |
| | | | | |
LIFE & HEALTH INSURANCE—0.5% | | | | | |
Ping An Insurance Group Co., of China Ltd. | | 30,733 | | 243,483 | |
| | | | | | |
10
| | SHARES | | VALUE | |
COMMON STOCKS—(CONT.) | | | | | |
CHINA—(CONT.) | | | | | |
OIL & GAS EXPLORATION & PRODUCTION—1.2% | | | | | |
CNOOC Ltd. | | 289,020 | | $ | 599,666 | |
| | | | | |
TOTAL CHINA
(Cost $4,671,701) | | | | 5,845,272 | |
| | | | | |
GERMANY—1.0% | | | | | |
APPLICATION SOFTWARE—1.0% | | | | | |
SAP AG#
(Cost $396,321) | | 6,400 | | 466,560 | |
| | | | | |
HONG KONG—18.0% | | | | | |
APPAREL RETAIL—0.6% | | | | | |
Sitoy Group Holdings Ltd.* | | 492,115 | | 283,837 | |
| | | | | |
COMPUTER HARDWARE—0.4% | | | | | |
Lenovo Group Ltd. | | 260,000 | | 209,341 | |
| | | | | |
CONSTRUCTION & ENGINEERING—1.0% | | | | | |
China State Construction International Holdings Ltd. | | 384,341 | | 457,239 | |
| | | | | |
CONSUMER ELECTRONICS—0.5% | | | | | |
Haier Electronics Group Co., Ltd.* | | 178,944 | | 228,816 | |
| | | | | |
DIVERSIFIED BANKS—0.7% | | | | | |
BOC Hong Kong Holdings Ltd. | | 108,075 | | 333,287 | |
| | | | | |
DIVERSIFIED CAPITAL MARKETS—0.9% | | | | | |
Digital China Holdings Ltd. | | 251,189 | | 421,995 | |
| | | | | |
ELECTRIC UTILITIES—1.0% | | | | | |
Power Assets Holdings Ltd. | | 50,283 | | 427,565 | |
| | | | | |
FOOD RETAIL—0.7% | | | | | |
China Resources Enterprise Ltd. | | 103,400 | | 338,216 | |
| | | | | |
INDUSTRIAL CONGLOMERATES—1.1% | | | | | |
Hutchison Whampoa Ltd. | | 48,639 | | 479,170 | |
| | | | | |
INTEGRATED TELECOMMUNICATION SERVICES—0.9% | | | | | |
China Unicom Hong Kong Ltd. | | 259,368 | | 425,026 | |
| | | | | |
LIFE & HEALTH INSURANCE—1.9% | | | | | |
AIA Group Ltd. | | 208,311 | | 823,831 | |
| | | | | |
OIL & GAS EXPLORATION & PRODUCTION—1.0% | | | | | |
Kunlun Energy Co., Ltd. | | 238,704 | | 443,525 | |
| | | | | |
PACKAGED FOODS & MEATS—0.7% | | | | | |
China Mengniu Dairy Co., Ltd. | | 104,494 | | 316,851 | |
| | | | | |
REAL ESTATE MANAGEMENT & DEVELOPMENT—4.2% | | | | | |
Cheung Kong Holdings Ltd. | | 36,812 | | 543,864 | |
Cheung Kong Infrastructure Holdings Ltd. | | 75,510 | | 442,827 | |
China Overseas Grand Oceans Group Ltd. | | 369,797 | | 386,972 | |
China Resources Land Ltd. | | 129,135 | | 295,259 | |
Wharf Holdings Ltd. | | 39,943 | | 274,188 | |
| | | | 1,943,110 | |
SPECIALIZED FINANCE—0.8% | | | | | |
Hong Kong Exchanges and Clearing Ltd. | | 21,600 | | 355,631 | |
| | | | | | |
11
| | SHARES | | VALUE | |
COMMON STOCKS—(CONT.) | | | | | |
HONG KONG—(CONT.) | | | | | |
WIRELESS TELECOMMUNICATION SERVICES—1.6% | | | | | |
China Mobile Ltd. | | 63,841 | | $ | 707,601 | |
| | | | | |
TOTAL HONG KONG
(Cost $6,995,182) | | | | 8,195,041 | |
| | | | | |
INDIA—0.8% | | | | | |
CONSTRUCTION & FARM MACHINERY & HEAVY TRUCKS—0.8% | | | | | |
Tata Motors Ltd.#
(Cost $398,183) | | 15,652 | | 377,995 | |
| | | | | |
ISRAEL—0.6% | | | | | |
SEMICONDUCTORS—0.6% | | | | | |
EZchip Semiconductor Ltd.*
(Cost $274,810) | | 8,550 | | 265,050 | |
| | | | | |
ITALY—0.7% | | | | | |
APPAREL RETAIL—0.7% | | | | | |
Prada SpA
(Cost $271,369) | | 40,646 | | 331,722 | |
| | | | | |
JAPAN—1.2% | | | | | |
APPAREL RETAIL—1.2% | | | | | |
Fast Retailing Co., Ltd.
(Cost $300,524) | | 2,300 | | 512,295 | |
| | | | | |
MALAYSIA—0.9% | | | | | |
HEALTH CARE PROVIDERS & SERVICE—0.9% | | | | | |
IHH Healthcare Bhd*
(Cost $390,917) | | 386,428 | | 405,483 | |
| | | | | |
MONGOLIA—0.6% | | | | | |
DIVERSIFIED METALS & MINING—0.6% | | | | | |
Mongolian Mining Corp.*
(Cost $290,752) | | 561,500 | | 274,590 | |
| | | | | |
NETHERLANDS—3.0% | | | | | |
INTEGRATED OIL & GAS—1.8% | | | | | |
Royal Dutch Shell PLC# | | 11,850 | | 811,488 | |
| | | | | |
SEMICONDUCTOR EQUIPMENT—1.2% | | | | | |
ASML Holding NV# | | 9,450 | | 519,467 | |
| | | | | |
TOTAL NETHERLANDS
(Cost $1,264,751) | | | | 1,330,955 | |
| | | | | |
SPAIN—0.3% | | | | | |
APPAREL RETAIL—0.3% | | | | | |
Inditex SA
(Cost $101,406) | | 1,050 | | 133,973 | |
| | | | | | |
12
| | SHARES | | VALUE | |
COMMON STOCKS—(CONT.) | | | | | |
SWEDEN—0.6% | | | | | |
CONSTRUCTION & FARM MACHINERY & HEAVY TRUCKS—0.6% | | | | | |
Volvo AB#
(Cost $286,138) | | 20,900 | | $ | 282,150 | |
| | | | | |
TAIWAN—4.6% | | | | | |
ELECTRONIC EQUIPMENT & INSTRUMENTS—0.8% | | | | | |
TPK Holding Co., Ltd. | | 30,000 | | 376,926 | |
| | | | | |
ELECTRONIC EQUIPMENT MANUFACTURERS—0.8% | | | | | |
TXC Corp. | | 214,553 | | 373,136 | |
| | | | | |
OTHER DIVERSIFIED FINANCIAL SERVICES—0.5% | | | | | |
Fubon Financial Holding Co., Ltd. | | 216,000 | | 221,842 | |
| | | | | |
PERSONAL PRODUCTS—0.5% | | | | | |
Ginko International Co., Ltd. | | 17,000 | | 208,644 | |
| | | | | |
SEMICONDUCTORS—2.0% | | | | | |
Career Technology MFG. Co., Ltd. | | 211,000 | | 273,773 | |
Epistar Corp. | | 139,544 | | 222,143 | |
Novatek Microelectronics Corp. | | 111,000 | | 418,007 | |
| | | | 913,923 | |
| | | | | |
TOTAL TAIWAN
(Cost $2,158,466) | | | | 2,094,471 | |
| | | | | |
UNITED STATES—42.6% | | | | | |
AEROSPACE & DEFENSE—0.8% | | | | | |
Spirit Aerosystems Holdings, Inc., Cl. A* | | 24,150 | | 377,465 | |
| | | | | |
AIR FREIGHT & LOGISTICS—1.2% | | | | | |
United Parcel Service, Inc., Cl. B | | 7,650 | | 560,363 | |
| | | | | |
AIRLINES—0.6% | | | | | |
United Continental Holdings, Inc.* | | 14,800 | | 284,308 | |
| | | | | |
APPAREL ACCESSORIES & LUXURY GOODS—1.1% | | | | | |
PVH Corp. | | 3,450 | | 379,466 | |
Ralph Lauren Corp. | | 900 | | 138,321 | |
| | | | 517,787 | |
AUTOMOBILE MANUFACTURERS—0.4% | | | | | |
Ford Motor Co. | | 14,600 | | 162,936 | |
| | | | | |
CASINOS & GAMING—0.7% | | | | | |
Las Vegas Sands Corp. | | 6,350 | | 294,894 | |
| | | | | |
COMMUNICATIONS EQUIPMENT—3.8% | | | | | |
Acme Packet, Inc. * | | 15,300 | | 253,062 | |
Cisco Systems, Inc. | | 41,350 | | 708,739 | |
QUALCOMM, Inc. | | 12,750 | | 746,831 | |
| | | | 1,708,632 | |
COMPUTER HARDWARE—5.4% | | | | | |
Apple, Inc. | | 4,150 | | 2,469,664 | |
| | | | | |
COMPUTER STORAGE & PERIPHERALS—1.2% | | | | | |
NetApp, Inc.* | | 19,550 | | 525,895 | |
| | | | | | |
13
| | SHARES | | VALUE | |
COMMON STOCKS—(CONT.) | | | | | |
UNITED STATES—(CONT.) | | | | | |
CONSTRUCTION & FARM MACHINERY & HEAVY TRUCKS—1.7% | | | | | |
Caterpillar, Inc. | | 3,150 | | $ | 267,152 | |
Cummins, Inc. | | 4,750 | | 444,504 | |
| | | | 711,656 | |
DATA PROCESSING & OUTSOURCED SERVICES—1.4% | | | | | |
Mastercard, Inc. | | 1,350 | | 622,256 | |
| | | | | |
DISTILLERS & VINTNERS—0.7% | | | | | |
Beam, Inc. | | 5,400 | | 300,024 | |
| | | | | |
DIVERSIFIED METALS & MINING—0.9% | | | | | |
Cliffs Natural Resources, Inc. | | 11,100 | | 402,597 | |
| | | | | |
FERTILIZERS & AGRICULTURAL CHEMICALS—0.4% | | | | | |
Monsanto Co. | | 2,250 | | 193,658 | |
| | | | | |
FOOTWEAR—1.0% | | | | | |
NIKE, Inc., Cl. B | | 4,800 | | 438,624 | |
| | | | | |
HOUSEHOLD PRODUCTS—0.5% | | | | | |
Procter & Gamble Co., /The | | 3,550 | | 245,802 | |
| | | | | |
INDUSTRIAL MACHINERY—1.6% | | | | | |
SPX Corp. | | 10,300 | | 706,477 | |
| | | | | |
INTERNET SOFTWARE & SERVICES—0.1% | | | | | |
Facebook, Inc.* | | 3,100 | | 65,457 | |
| | | | | |
IT CONSULTING & OTHER SERVICES—2.5% | | | | | |
International Business Machines Corp. | | 5,800 | | 1,128,274 | |
| | | | | |
MOTORCYCLE MANUFACTURERS—1.0% | | | | | |
Harley-Davidson, Inc. | | 9,450 | | 441,882 | |
| | | | | |
MOVIES & ENTERTAINMENT—1.2% | | | | | |
News Corp., Cl. A | | 23,500 | | 562,120 | |
| | | | | |
OIL & GAS EQUIPMENT & SERVICES—0.6% | | | | | |
Baker Hughes, Inc. | | 6,300 | | 264,411 | |
| | | | | |
OIL & GAS EXPLORATION & PRODUCTION—1.2% | | | | | |
Anadarko Petroleum Corp. | | 7,600 | | 522,956 | |
| | | | | |
PHARMACEUTICALS—4.5% | | | | | |
Johnson & Johnson | | 17,950 | | 1,271,219 | |
Mylan, Inc. * | | 12,950 | | 328,153 | |
Watson Pharmaceuticals, Inc. * | | 5,200 | | 446,940 | |
| | | | 2,046,312 | |
REAL ESTATE SERVICES—0.7% | | | | | |
CBRE Group, Inc.* | | 17,600 | | 317,152 | |
| | | | | |
RESTAURANTS—2.1% | | | | | |
McDonald’s Corp. | | 4,600 | | 399,280 | |
Yum! Brands, Inc. | | 7,850 | | 550,364 | |
| | | | 949,644 | |
SEMICONDUCTORS—2.4% | | | | | |
Altera Corp. | | 11,750 | | 358,140 | |
| | | | | | |
14
| | SHARES | | VALUE | |
COMMON STOCKS—(CONT.) | | | | | |
UNITED STATES—(CONT.) | | | | | |
Inphi Corp. * | | 37,050 | | $ | 310,109 | |
Skyworks Solutions, Inc. * | | 16,750 | | 391,949 | |
| | | | 1,060,198 | |
SOFT DRINKS—1.3% | | | | | |
PepsiCo, Inc. | | 8,150 | | 564,306 | |
| | | | | |
SPECIALTY CHEMICALS—1.6% | | | | | |
Celanese Corp. | | 3,550 | | 134,865 | |
Rockwood Holdings, Inc. | | 12,900 | | 592,110 | |
| | | | 726,975 | |
TOTAL UNITED STATES
(Cost $15,642,294) | | | | 19,172,725 | |
| | | | | |
TOTAL COMMON STOCKS
(Cost $34,701,182) | | | | 41,797,445 | |
| | | | | |
Master Limited Partnership—2.3% | | | | | |
UNITED STATES—2.3% | | | | | |
ASSET MANAGEMENT & CUSTODY BANKS—2.3% | | | | | |
Blackstone Group LP | | 20,350 | | 312,576 | |
KKR & Co., LP | | 46,900 | | 705,845 | |
| | | | 1,018,421 | |
TOTAL Master Limited Partnership
(Cost $978,751) | | | | 1,018,421 | |
| | | | | |
REAL ESTATE INVESTMENT TRUST—1.6% | | | | | |
HONG KONG—1.6% | | | | | |
RETAIL—1.6% | | | | | |
Link REIT, /The
(Cost $454,829) | | 141,505 | | 702,956 | |
| | | | | |
Total Investments
(Cost $36,134,762)(a) | | 96.5 | % | 43,518,822 | |
Other Assets in Excess of Liabilities | | 3.5 | | 1,580,354 | |
NET ASSETS | | 100.0 | % | $ | 45,099,176 | |
‡ | Securities classified as Level 1 for ASC 820 disclosure purposes based on valuation inputs unless otherwise noted. |
15
* | Non-income producing security. |
# | American Depositary Receipts. |
(a) | At October 31, 2012, the net unrealized appreciation on investments, based on cost for federal income tax purposes of $36,910,080, amounted to $6,608,742 which consisted of aggregate gross unrealized appreciation of $9,061,497 and aggregate gross unrealized depreciation of $2,452,755. |
Industry classifications are unaudited.
See Notes to Financial Statements.
16
ALGER CHINA-U.S. GROWTH FUND
Statement of Assets and Liabilities October 31, 2012
ASSETS: | | | |
Investments in securities, at value (identified cost*)
see accompanying schedules of investments | | $ | 43,518,822 | |
Cash and cash equivalents | | 1,226,701 | |
Foreign cash** | | 305,923 | |
Receivable for investment securities sold | | 429,089 | |
Receivable for shares of beneficial interest sold | | 7,860 | |
Dividends and interest receivable | | 13,764 | |
Prepaid expenses | | 25,646 | |
Total Assets | | 45,527,805 | |
LIABILITIES: | | | |
Payable for investment securities purchased | | 195,413 | |
Payable for shares of beneficial interest redeemed | | 70,191 | |
Accrued investment advisory fees | | 49,770 | |
Accrued transfer agent fees | | 23,791 | |
Accrued distribution fees | | 13,126 | |
Accrued administrative fees | | 1,141 | |
Accrued shareholder servicing fees | | 684 | |
Accrued other expenses | | 74,513 | |
Total Liabilities | | 428,629 | |
NET ASSETS | | $ | 45,099,176 | |
Net Assets Consist of: | | | |
Paid in capital (par value of $.001 per share) | | 58,514,304 | |
Undistributed net investment income (accumulated loss) | | (483,812 | ) |
Undistributed net realized gain (accumulated realized loss) | | (20,316,276 | ) |
Net unrealized appreciation on investments | | 7,384,960 | |
NET ASSETS | | $ | 45,099,176 | |
Net Assets By Class | | | |
Class A | | $ | 41,051,391 | |
Class C | | $ | 4,047,785 | |
Shares Of Beneficial Interest Outstanding—Note 6 | | | |
Class A | | 2,663,014 | |
Class C | | 270,379 | |
Net Asset Value Per Share | | | |
Class A | | $ | 15.42 | |
Class C | | $ | 14.97 | |
Offering Price Per Share(a) | | | |
Class A | | $ | 16.27 | |
Class C | | $ | 14.97 | |
*Identified cost | | $ | 36,134,762 | |
**Cost of foreign cash | | $ | 304,975 | |
(a) Class A Offering Price includes a 5.25% sales charge.
See Notes to Financial Statements.
17
ALGER CHINA-U.S. GROWTH FUND
Statement of Operations
For the year ended October 31, 2012
INCOME | | | |
Dividends (net of foreign withholding taxes*) | | $ | 992,430 | |
Interest | | 628 | |
Total Income | | 993,058 | |
EXPENSES | | | |
Advisory fees—Note 3(a) | | 621,472 | |
Distribution fees—Note 3(f): | | | |
Class A | | 119,609 | |
Class C | | 39,455 | |
Administrative fees—Note 3(a) | | 14,242 | |
Custodian fees | | 71,730 | |
Interest expenses | | 335 | |
Transfer agent fees and expenses—Note 3(b) | | 96,140 | |
Printing fees | | 33,750 | |
Professional fees | | 83,007 | |
Registration fees | | 48,228 | |
Trustee fees—Note 3(e) | | 19,032 | |
Miscellaneous | | 69,602 | |
Total Expenses | | 1,216,602 | |
NET INVESTMENT LOSS | | (223,544 | ) |
REALIZED AND UNREALIZED GAIN (LOSS) ON INVESTMENTS AND FOREIGN CURRENCY | | | |
Net realized gain on investments | | 393,921 | |
Net realized gain on foreign currency transactions | | 6,015 | |
Net change in unrealized appreciation (depreciation) on investments and foreign currency | | 797,124 | |
Net realized and unrealized gain on investments and foreign currency | | 1,197,060 | |
NET INCREASE IN NET ASSETS RESULTING FROM OPERATIONS | | $ | 973,516 | |
*Foreign withholding taxes | | $ | 46,664 | |
See Notes to Financial Statements.
18
ALGER CHINA-U.S. GROWTH FUND
Statements of Changes in Net Assets
| | For the
Year Ended
October 31, 2012 | | For the
Year Ended
October 31, 2011 | |
Net investment loss | | $ | (223,544 | ) | $ | (387,902 | ) |
Net realized gain on investments and foreign currency | | 399,936 | | 7,002,976 | |
Net change in unrealized appreciation (depreciation) on investments and foreign currency | | 797,124 | | (13,015,405 | ) |
Net increase (decrease) in net assets resulting from operations | | 973,516 | | (6,400,331 | ) |
Increase (decrease) from shares of beneficial interest transactions: | | | | | |
Class A | | (13,196,900 | ) | (12,573,097 | ) |
Class C | | 332,305 | | (94,748 | ) |
Net decrease from shares of beneficial interest transactions—Note 6(a) | | (12,864,595 | ) | (12,667,845 | ) |
Redemption Fees: | | | | | |
Class A | | 1,229 | | 11,076 | |
Class C | | — | | 2,661 | |
Total Redemption Fees - Note 6(b) | | 1,229 | | 13,737 | |
Total decrease | | (11,889,850 | ) | (19,054,439 | ) |
Net Assets: | | | | | |
Beginning of period | | 56,989,026 | | 76,043,465 | |
END OF PERIOD | | $ | 45,099,176 | | $ | 56,989,026 | |
Undistributed net investment income (accumulated loss) | | $ | (483,812 | ) | $ | (467,084 | ) |
See Notes to Financial Statements.
19
ALGER CHINA-U.S. GROWTH FUND
Financial Highlights for a share outstanding throughout the period
| | Class A | |
| | Year ended
10/31/2012 | | Year ended
10/31/2011 | | Year ended
10/31/2010 | | Year ended
10/31/2009 | | Year ended
10/31/2008 | |
Net asset value, beginning of period | | $ | 15.11 | | $ | 16.74 | | $ | 13.55 | | $ | 10.18 | | $ | 25.09 | |
INCOME FROM INVESTMENT OPERATIONS: | | | | | | | | | | | |
Net investment loss (i) | | (0.06 | ) | (0.08 | ) | (0.08 | ) | (0.05 | ) | (0.08 | ) |
Net realized and unrealized gain (loss) on investments | | 0.37 | | (1.55 | ) | 3.29 | | 3.42 | | (12.79 | ) |
Total from investment operations | | 0.31 | | (1.63 | ) | 3.21 | | 3.37 | | (12.87 | ) |
Dividends from net investment income | | — | | — | | (0.02 | ) | — | | — | |
Distributions from net realized gains | | — | | — | | — | | — | | (2.04 | ) |
Net asset value, end of period | | $ | 15.42 | | $ | 15.11 | | $ | 16.74 | | $ | 13.55 | | $ | 10.18 | |
Total return (ii) | | 2.0 | % | (9.6 | )% | 23.5 | % | 33.1 | % | (55.2 | )% |
RATIOS/SUPPLEMENTAL DATA: | | | | | | | | | | | |
Net assets, end of period (000’s omitted) | | $ | 41,051 | | $ | 53,311 | | $ | 71,835 | | $ | 67,989 | | $ | 64,865 | |
Ratio of gross expenses to average net assets | | 2.29 | % | 2.15 | % | 2.12 | % | 2.31 | % | 2.15 | % |
Ratio of expense reimbursements to average net assets | | 0.00 | % | 0.00 | % | 0.00 | % | 0.00 | % | (0.25 | )% |
Ratio of net expenses to average net assets | | 2.29 | % | 2.15 | % | 2.12 | % | 2.31 | % | 1.90 | % |
Ratio of net investment income (loss) to average net assets | | (0.38 | )% | (0.49 | )% | (0.56 | )% | (0.48 | )% | (0.43 | )% |
Portfolio turnover rate | | 84.55 | % | 82.13 | % | 89.15 | % | 149.17 | % | 190.60 | % |
(i) Amount was computed based on average shares outstanding during the period.
(ii) Does not reflect the effect of sales charges, if applicable.
See Notes to Financial Statements.
20
| | Class C | |
| | Year ended
10/31/2012 | | Year ended
10/31/2011 | | Year ended
10/31/2010 | | Year ended
10/31/2009 | | From
3/3/2008
(commencement
of
operations) to
10/31/2008(i) | |
Net asset value, beginning of period | | $ | 14.79 | | $ | 16.50 | | $ | 13.43 | | $ | 10.16 | | $ | 18.20 | |
INCOME FROM INVESTMENT OPERATIONS: | | | | | | | | | | | |
Net investment loss (ii) | | (0.16 | ) | (0.21 | ) | (0.18 | ) | (0.14 | ) | (0.05 | ) |
Net realized and unrealized gain (loss) on investments | | 0.34 | | (1.50 | ) | 3.25 | | 3.41 | | (7.99 | ) |
Total from investment operations | | 0.18 | | (1.71 | ) | 3.07 | | 3.27 | | (8.04 | ) |
Net asset value, end of period | | $ | 14.97 | | $ | 14.79 | | $ | 16.50 | | $ | 13.43 | | $ | 10.16 | |
Total return (iii) | | 1.2 | % | (10.3 | )% | 22.7 | % | 32.2 | % | (44.2 | )% |
RATIOS/SUPPLEMENTAL DATA: | | | | | | | | | | | |
Net assets, end of period (000’s omitted) | | $ | 4,048 | | $ | 3,678 | | $ | 4,208 | | $ | 1,595 | | $ | 339 | |
Ratio of gross expenses to average net assets | | 3.06 | % | 2.95 | % | 2.91 | % | 3.03 | % | 3.02 | % |
Ratio of expense reimbursements to average net assets | | 0.00 | % | 0.00 | % | 0.00 | % | 0.00 | % | (0.21 | )% |
Ratio of net expenses to average net assets | | 3.06 | % | 2.95 | % | 2.91 | % | 3.03 | % | 2.81 | % |
Ratio of net investment income (loss) to average net assets | | (1.08 | )% | (1.26 | )% | (1.25 | )% | 1.19 | % | (0.52 | )% |
Portfolio turnover rate | | 84.55 | % | 82.13 | % | 89.15 | % | 149.17 | % | 190.60 | % |
(i) Ratios have been annualized; total return and portfolio turnover rate have not been annualized.
(ii) Amount was computed based on average shares outstanding during the period.
(iii) Does not reflect the effect of sales charges, if applicable.
See Notes to Financial Statements.
21
ALGER CHINA-U.S. GROWTH FUND
NOTES TO FINANCIAL STATEMENTS
NOTE 1 — General:
Alger China-U.S. Growth Fund (the “Fund”) is a diversified, open-end registered investment company organized as a business trust under the laws of the Commonwealth of Massachusetts. The Fund’s investment objective is long-term capital appreciation. It seeks to achieve its objective by investing in equity securities that are economically tied to China (including Hong Kong and Taiwan) or the United States. The Fund offers Class A shares and Class C shares. Class A shares are generally subject to an initial sales charge while Class C shares are generally subject to a deferred sales charge. Each class has identical rights to assets and earnings except that each share class bears the cost of its plan of distribution and transfer agency and sub-transfer agency services.
NOTE 2 — Significant Accounting Policies:
(a) Investment Valuation: The Fund values its financial instruments at fair value using independent dealers or pricing services under policies approved by the Board of Trustees. Investments are valued on each day the New York Stock Exchange (the “NYSE”) is open, as of the close of the NYSE (normally 4:00 p.m. Eastern time).
Equity securities for which valuation information is readily available are valued at the last reported sales price or official closing price as reported by an independent pricing service on the primary market or exchange on which they are traded. In the absence of reported sales, such securities are valued at a price within the bid and ask price or, in the absence of a recent bid or ask price, the equivalent as obtained from one or more of the major market makers for the securities to be valued.
Securities for which market quotations are not readily available are valued at fair value, as determined in good faith pursuant to procedures established by the Board of Trustees.
Securities in which the Fund invests may be traded in foreign markets that close before the close of the NYSE. Developments that occur between the close of the foreign markets and the close of the NYSE may result in adjustments to the foreign closing prices to reflect what the investment adviser, pursuant to policies established by the Board of Trustees, believes to be the fair value of these securities as of the close of the NYSE. The Fund may also fair value securities in other situations, for example, when a particular foreign market is closed but the Fund is open.
Financial Accounting Standards Board Accounting Standards Codification 820 — Fair Value Measurements and Disclosures (“ASC 820”) defines fair value as the price that the Fund would receive upon selling an investment in a timely transaction to an independent buyer in the principal or most advantageous market of the investment. ASC 820 established a three-tier hierarchy to maximize the use of observable market data and minimize the use of unobservable inputs and to establish classification of fair value measurements for disclosure purposes. Inputs refer broadly to the assumptions that market participants would use in pricing the asset or liability and may be observable or unobservable. Observable inputs are based on market data obtained from sources independent of the Fund. Unobservable inputs are inputs that reflect the Fund’s own
22
ALGER CHINA-U.S. GROWTH FUND
NOTES TO FINANCIAL STATEMENTS (Continued)
assumptions based on the best information available in the circumstances. The three-tier hierarchy of inputs is summarized in the three broad Levels listed below.
· Level 1 — quoted prices in active markets for identical investments
· Level 2 — significant other observable inputs (including quoted prices for similar investments, interest rates, prepayment speeds, credit risk, etc.)
· Level 3 — significant unobservable inputs (including the Fund’s own assumptions in determining the fair value of investments)
The Fund’s valuation techniques are generally consistent with the market approach whereby prices and other relevant information generated by market transactions involving identical or comparable assets are used to measure fair value. Inputs for Level 1 include exchange-listed prices and broker quotes in an active market. Inputs for Level 2 include the last trade price in the case of a halted security, an exchange-listed price which has been adjusted for fair value factors, and prices of closely related securities. Additional Level 2 inputs include an evaluated price which is based upon on a compilation of observable market information such as spreads for fixed income and preferred securities. Valuation techniques for Level 3 securities include using the income approach whereby future amounts are converted, or discounted, to a current single amount. These fair value measurements are determined on the basis of the value indicated by current market expectations about such future events. Inputs for Level 3 include unobservable market information which can include cash flows, income and expenses, and other information obtained from a company’s financial statements, or from market indicators such as benchmarks and indices.
Valuation processes are determined by a Valuation Committee (“Committee”) established by the Fund’s Board of Trustees (“Board”) and comprised of representatives of the Fund’s investment advisor. The Committee reports its valuation determinations to the Board which is responsible for approving valuation policy and procedures.
The Committee meets quarterly to review and evaluate the effectiveness of the procedures for making fair value determinations. The Committee considers, among other things, the results of quarterly back testing of the fair value model for foreign securities, pricing comparisons between primary and secondary price sources, the outcome of price challenges put to the Fund’s pricing vendor, and variances between transactional prices and previous mark-to-markets.
The Fund will record a change to a security’s fair value level if new inputs are available or it becomes evident that inputs previously considered for leveling have changed or are no longer relevant. Transfers between Levels 1 and 2 are recognized at the end of the reporting period, and transfers into and out of Level 3 are recognized during the reporting period.
(b) Cash and Cash Equivalents: Cash and cash equivalents include U.S. dollars and overnight time deposits.
23
ALGER CHINA-U.S. GROWTH FUND
NOTES TO FINANCIAL STATEMENTS (Continued)
(c) Securities Transactions and Investment Income: Securities transactions are recorded on a trade date basis. Realized gains and losses from securities transactions are recorded on the identified cost basis. Dividend income is recognized on the ex-dividend date and interest income is recognized on the accrual basis.
(d) Foreign Currency Translations: The books and records of the Fund are maintained in U.S. dollars. Foreign currencies, investments and other assets and liabilities are translated into U.S. dollars at the prevailing rates of exchange on the valuation date. Purchases and sales of investment securities and income and expenses are translated into U.S. dollars at the prevailing exchange rates on the respective dates of such transactions.
Net realized gains and losses on foreign currency transactions represent net gains and losses from the disposition of foreign currencies, currency gains and losses realized between the trade dates and settlement dates of security transactions, and the difference between the amount of net investment income accrued and the U.S. dollar amount actually received. The effects of changes in foreign currency exchange rates on investments in securities are included in realized and unrealized gain or loss on investments in the Statement of Operations.
(e) Dividends to Shareholders: Dividends and distributions payable to shareholders are recorded by the Fund on the ex-dividend date. Dividends from net investment income and distributions from net realized gains are declared and paid annually after the end of the fiscal year in which earned.
Each class is treated separately in determining the amounts of dividends from net investment income payable to holders of its shares.
The characterization of distributions to shareholders for financial reporting purposes is determined in accordance with federal income tax rules. Therefore, the source of the Fund’s distributions may be shown in the accompanying financial statements as either from, or in excess of net investment income, net realized gain on investment transactions or return of capital, depending on the type of book/tax differences that may exist. Capital accounts within the financial statements are adjusted for permanent book/tax differences. Reclassifications result primarily from the difference in tax treatment of net operating losses, passive foreign investment companies, and foreign currency transactions. The reclassifications are done annually at fiscal year end and have no impact on the net asset value of the Fund and are designed to present the Fund’s capital accounts on a tax basis.
(f) Federal Income Taxes: It is the Fund’s policy to comply with the requirements of the Internal Revenue Code Subchapter M applicable to regulated investment companies and to distribute all of its taxable income to its shareholders. Provided that the Fund maintains such compliance, no federal income tax provision is required.
Financial Accounting Standards Board Accounting Standards Codification 740 — Income Taxes (“ASC 740”) requires the Fund to measure and recognize in its financial statements the benefit of a tax position taken (or expected to be taken) on an income tax return if such position will more likely than not be sustained upon examination based on the technical merits of the position. No tax years are currently under investigation. The Fund files income tax returns in the U.S. Federal jurisdiction, as well as the New York State and
24
ALGER CHINA-U.S. GROWTH FUND
NOTES TO FINANCIAL STATEMENTS (Continued)
New York City jurisdictions. The statute of limitations on the Fund’s tax returns remains open for the tax years 2009-2012. Management does not believe there are any uncertain tax positions that require recognition of a tax liability.
(g) Estimates: These financial statements have been prepared in accordance with accounting principles generally accepted in the United States of America, which require using estimates and assumptions that affect the reported amounts therein. Actual results may differ from those estimates.
NOTE 3 — Investment Advisory Fees and Other Transactions with Affiliates:
(a) Investment Advisory and Administration Fees: Fees incurred by the Fund, pursuant to the provisions of its Investment Advisory Agreement and its Administration Agreement with Fred Alger Management, Inc. (“Alger Management” or the “Manager”), are payable monthly and computed based on the value of the average daily net assets of the Fund, at the following rates:
ADVISORY
FEE | | ADMINISTRATION
FEE | |
1.20 | % | 0.0275 | % |
(b) Shareholder Administrative Fees: The Fund has entered into a shareholder administrative services agreement with Alger Management to compensate Alger Management for its liaison and administrative oversight of Boston Financial Data Services, Inc. the transfer agent, and other related services. The Fund compensates Alger Management at the annual rate of 0.0165% of the Fund’s average daily net assets for these services. For the year ended October 31, 2012, the Fund incurred fees of $8,545 for these services provided by Alger Management, which are included in the transfer agent fees and expenses in the Statement of Operations.
Alger Management makes payments to intermediaries that provide sub-accounting services to omnibus accounts, held by the Fund. A portion of the fees paid by Alger Management to intermediaries that provide sub-accounting services are charged back to the Fund, subject to certain limitations, as approved by the Fund’s Board of Trustees. For the year ended October 31, 2012, Alger Management charged back $11,880 to the Fund for these services, which are included in the transfer agent fees and expenses in the Statement of Operations.
(c) Sales Charges: Purchases of shares of the Fund may be subject to initial sales charges or contingent deferred sales charges. For the year ended October 31, 2012, the initial sales charges and contingent deferred sales charges imposed, all of which were retained by Fred Alger & Company, Incorporated, the Fund’s distributor (the “Distributor” or “Alger Inc.”), were approximately $1,885 and $2,522 respectively. The contingent deferred sales charges are used by Alger Inc. to offset distribution expenses previously incurred. Sales charges do not represent expenses of the Fund.
(d) Brokerage Commissions: During the year ended October 31, 2012, the Fund paid Alger Inc. $12,465 in connection with securities transactions.
25
ALGER CHINA-U.S. GROWTH FUND
NOTES TO FINANCIAL STATEMENTS (Continued)
(e) Trustees’ Fees: The Fund pays each trustee who is not affiliated with Alger Management or its affiliates $750 for each meeting attended, to a maximum of $3,000 per annum, plus travel expenses incurred for attending the meeting. The chairman of the Board of Trustees receives an additional annual fee of $15,000 which is paid, pro rata, by all funds managed by Alger Management. Additionally, each member of the audit committee receives $75 for each audit committee meeting attended, to a maximum of $300 per annum.
(f) Distribution/Shareholder Servicing Fees: The Fund has adopted a distribution plan pursuant to which the Fund pays Alger Inc. a fee at the annual rate of 0.25% of the average daily net assets of the Class A shares and 1.00% of the average daily net assets of the Class C shares to compensate Alger Inc. for its activities and expenses incurred in distributing the Fund’s shares and shareholder servicing. Fees charged may be more or less than the expenses incurred by Alger Inc.
(g) Interfund Loans: The Fund, along with other funds advised by Alger Management, may borrow money from and lend money to each other for temporary or emergency purposes. To the extent permitted under its investment restrictions, each fund may lend uninvested cash in an amount up to 15% of its net assets to other funds. If a fund has borrowed from other funds and has aggregate borrowings from all sources that exceed 10% of the fund’s total assets, such fund will secure all of its loans from other funds. The interest rate charged on interfund loans is equal to the average of the overnight time deposit rate and bank loan rate available to the funds. There were no interfund loans outstanding during the year ended October 31, 2012.
(h) Other Transactions with Affiliates: Certain officers of the Fund are directors and officers of Alger Management and Alger Inc.
NOTE 4 — Securities Transactions:
The following summarizes the securities transactions by the Fund, other than U.S. Government and short-term securities, for the year ended October 31, 2012:
| | PURCHASES | | SALES | |
Alger China-U.S. Growth Fund | | $ | 41,812,829 | | $ | 54,572,633 | |
| | | | | | | |
Transactions in foreign securities may involve certain considerations and risks not typically associated with those of U.S. companies because of, among other factors, the level of governmental supervision and regulation of foreign security markets, and the possibility of political or economic instability. Additional risks associated with investing in the Chinese markets include increased volatility, limited liquidity, less stringent regulatory and legal system, and lack of industry and country diversification.
NOTE 5 — Borrowings:
The Fund may borrow from its custodian on an uncommitted basis. The Fund pays the custodian a market rate of interest, generally based upon the London Interbank Offered Rate. The Fund may also borrow from other funds advised by Alger Management, as
26
ALGER CHINA-U.S. GROWTH FUND
NOTES TO FINANCIAL STATEMENTS (Continued)
discussed in Note 3(g). For the year ended October 31, 2012, the Fund had the following borrowings:
| | AVERAGE DAILY
BORROWING | | WEIGHTED AVERAGE
INTEREST RATE | |
Alger China-U.S. Growth Fund | | $ | 6,409 | | 2.22 | % |
| | | | | | |
The highest amount borrowed during the year ended October 31, 2012 was $385,215.
NOTE 6 — Share Capital:
(a) The Fund has an unlimited number of authorized shares of beneficial interest of $.001 par value. Transactions of shares of beneficial interest were as follows:
| | FOR THE YEAR ENDED
OCTOBER 31, 2012 | | FOR THE YEAR ENDED
OCTOBER 31, 2011 | |
| | SHARES | | AMOUNT | | SHARES | | AMOUNT | |
Alger China-U.S. Growth Fund | | | | | | | | | |
Class A: | | | | | | | | | |
Shares sold | | 198,989 | | $ | 3,070,369 | | 455,227 | | $ | 7,814,836 | |
Shares redeemed | | (1,063,346 | ) | (16,267,269 | ) | (1,219,701 | ) | (20,387,933 | ) |
Net decrease | | (864,357 | ) | $ | (13,196,900 | ) | (764,474 | ) | $ | (12,573,097 | ) |
Class C: | | | | | | | | | |
Shares sold | | 94,186 | | $ | 1,399,246 | | 87,116 | | $ | 1,471,616 | |
Shares redeemed | | (72,460 | ) | (1,066,941 | ) | (93,440 | ) | (1,566,364 | ) |
Net increase (decrease) | | 21,726 | | $ | 332,305 | | (6,324 | ) | $ | (94,748 | ) |
(b) Redemption Fee: The Fund may impose a 2.00% redemption fee on Fund shares redeemed (including shares redeemed by exchange) less than 30 days after such shares were acquired. The fees retained by the Fund are included as paid-in capital on the Statement of Assets and Liabilities.
NOTE 7 — Income Tax Information:
The tax character of distributions paid during the year ended October 31, 2012 and the year ended October 31, 2011 was as follows:
| | FOR THE YEAR ENDED
OCTOBER 31, 2012 | | FOR THE YEAR ENDED
OCTOBER 31, 2011 | |
| | | | | |
Distributions paid from: | | | | | |
Ordinary Income | | — | | — | |
Long-term capital gain | | — | | — | |
Total distributions paid | | — | | — | |
27
ALGER CHINA-U.S. GROWTH FUND
NOTES TO FINANCIAL STATEMENTS (Continued)
As of October 31, 2012, the components of accumulated gains (losses) on a tax basis were as follows:
Alger China-U.S. Growth Fund | | | |
Undistributed ordinary income | | — | |
Undistributed long-term gains | | — | |
Net accumulated earnings | | — | |
Capital loss carryforwards | | $ | (20,024,770 | ) |
Temporary differences | | (775,318 | ) |
Net unrealized appreciation | | 7,384,960 | |
Total accumulated losses | | $ | (13,415,128 | ) |
At October 31, 2012, the Fund, for federal income tax purposes, had a capital loss carryforward of $20,024,770, of which $217,612 does not expire and $19,807,158 expires in 2017. The amounts may be applied against future net realized gains until the earlier of their utilization or expiration.
Under the Regulated Investment Company Modernization Act of 2010, capital losses incurred by the Fund after October 31, 2011 will not be subject to expiration. In addition, losses incurred after October 31, 2011 must be utilized prior to the utilization of capital loss carryforwards above.
The difference between book-basis and tax-basis unrealized appreciation (depreciation) is determined annually and is attributable primarily to the tax deferral of losses on wash sales, 988 currency transactions, the realization of unrealized appreciation of Passive Foreign Investment Companies, and partnership basis adjustments.
Permanent differences, primarily from net operating losses and real estate investment trusts and partnership investments sold by the Fund, resulted in the following reclassifications among the Funds’s components of net assets at October 31, 2012:
Alger China-U.S. Growth Fund | | | |
Accumulated undistributed net investment income (accumulated loss) | | $ | 206,816 | |
Accumulated net realized gain (accumulated realized loss) | | $ | (185,715 | ) |
Paid-in Capital | | $ | (21,101 | ) |
NOTE 8 — Fair Value Measurements:
The major categories of securities and their respective fair value inputs are detailed in the Fund’s Schedule of Investments. The following is a summary of the inputs used as of October 31, 2012 in valuing the Fund’s investments carried at fair value on a recurring basis. Based upon the nature, characteristics, and risks associated with its investments, the Fund has determined that presenting them by security type and sector is appropriate.
28
ALGER CHINA-U.S. GROWTH FUND
NOTES TO FINANCIAL STATEMENTS (Continued)
Alger China-U.S. Growth Fund | | TOTAL FUND | | LEVEL 1 | | LEVEL 2 | | LEVEL 3 | |
COMMON STOCKS | | | | | | | | | |
Consumer Discretionary | | $ | 5,671,037 | | $ | 5,671,037 | | — | | — | |
Consumer Staples | | 2,159,830 | | 2,159,830 | | — | | — | |
Energy | | 3,576,626 | | 3,576,626 | | — | | — | |
Financials | | 6,152,132 | | 6,152,132 | | — | | — | |
Health Care | | 2,451,795 | | 2,451,795 | | — | | — | |
Industrials | | 4,353,804 | | 4,353,804 | | — | | — | |
Information Technology | | 12,809,834 | | 12,809,834 | | — | | — | |
Materials | | 2,735,797 | | 2,735,797 | | — | | — | |
Telecommunication Services | | 1,132,627 | | 1,132,627 | | — | | — | |
Utilities | | 753,963 | | 753,963 | | — | | — | |
TOTAL COMMON STOCKS | | $ | 41,797,445 | | $ | 41,797,445 | | — | | — | |
MASTER LIMITED PARTNERSHIP | | | | | | | | | |
Financials | | $ | 1,018,421 | | $ | 1,018,421 | | — | | — | |
REAL ESTATE INVESTMENT TRUST | | | | | | | | | |
Financials | | $ | 702,956 | | $ | 702,956 | | — | | — | |
TOTAL INVESTMENTS IN SECURITIES | | $ | 43,518,822 | | $ | 43,518,822 | | — | | — | |
On October 31, 2012, the Fund transferred securities totaling $10,095,006 from Level 2 to Level 1, utilizing exchange listed prices rather than model based evaluated prices.
NOTE 9 — Derivatives:
Financial Accounting Standards Board Accounting Standards Codification 815 — Derivatives and Hedging (“ASC 815”) requires qualitative disclosures about objectives and strategies for using derivatives, quantitative disclosures about fair value amounts of and gains and losses on derivative instruments, and disclosures about credit-risk-related contingent features in derivative agreements.
Forward currency contracts—In connection with portfolio purchases and sales of securities denominated in foreign currencies, the Fund may enter into forward currency contracts. Additionally, the Fund may enter into such contracts to economically hedge certain other foreign currency denominated investments. These contracts are valued at the current cost of covering or offsetting such contracts, and the related realized and unrealized foreign exchange gains and losses are included in the Statement of Operations. In the event that counterparties fail to settle these currency contracts or the related foreign security trades, the Fund could be exposed to foreign currency fluctuations.
Options—The Fund seeks to capture the majority of the returns associated with equity market investments. To meet this investment goal, the Fund invests in a broadly diversified portfolio of common stocks, while also buying and selling call and put options on equities and equity indices. The Fund purchases call options to increase its exposure to stock market risk and also provide diversification of risk. The Fund purchases put options in order to protect from significant market declines that may occur over a short period of time. The Fund can write covered call and cash secured put options to generate cash flows while reducing the volatility of the Fund’s portfolio. The cash flows may be an important source of the Fund’s return, although written call options may reduce the Fund’s ability to profit from increases in the value of the underlying security or equity
29
ALGER CHINA-U.S. GROWTH FUND
NOTES TO FINANCIAL STATEMENTS (Continued)
portfolio. The value of a call option generally increases as the price of the underlying stock increases and decreases as the stock decreases in price. Conversely, the value of a put option generally increases as the price of the underlying stock decreases and decreases as the stock increases in price. The combination of the diversified stock portfolio and the purchase and sale of options is intended to provide the Fund with the majority of the returns associated with equity market investments but with reduced volatility and returns that are augmented with the cash flows from the sale of options.
There were no derivative transactions for the year ended October 31, 2012.
NOTE 10 — Litigation:
On August 31, 2005, the West Virginia Securities Commissioner (the “WVSC”), in an ex parte Summary Order to Cease and Desist and Notice of Right to Hearing, concluded that the Manager and the Distributor had violated the West Virginia Uniform Securities Act (the “WVUSA”), and ordered the Manager and the Distributor to cease and desist from further violations of the WVUSA by engaging in the market-timing-related conduct described in the order. The ex parte order provided notice of their right to a hearing with respect to the violations of law asserted by the WVSC. Other firms unaffiliated with the Manager were served with similar orders. The Manager and the Distributor intend to request a hearing for the purpose of seeking to vacate or modify the order.
NOTE 11 — Recent Accounting Pronouncements:
In December 2011, the Financial Accounting Standard Board issued ASU 2011-11, Balance Sheet (Topic 210): Disclosures about Offsetting Assets and Liabilities (“ASU 2011-11”), which provides guidance regarding balance sheet offsetting disclosures. The amendments in ASU 2011-11 require an entity to disclose information about offsetting and related arrangements to enable users of its financial statements to understand the effects of those arrangements on its financial position. Entities are required to disclose gross information and net information about both instruments and transactions eligible for offset in the statement of assets and liabilities and transactions subject to an agreement similar to a master netting arrangement. The objective of ASU 2011-11 is to facilitate comparison between those entities that prepare their financial statements on the basis of GAAP and those entities that prepare their financial statements on the basis of IFRS. The new guidance is effective for annual reporting periods beginning on or after January 1, 2013. The Fund does not believe that this will have a material impact on the financial statements.
NOTE 12 — Subsequent Events:
Management of the Fund has evaluated events that have occurred subsequent to October 31, 2012 through the issuance date of the Financial Statements. No such events have been identified which require recognition and disclosure.
30
REPORT OF INDEPENDENT REGISTERED PUBLIC ACCOUNTING FIRM
To the Shareholders and Board of Trustees of
The Alger China-U.S. Growth Fund:
We have audited the accompanying statement of assets and liabilities of Alger China — U.S. Growth Fund (the “Fund”), including the schedule of investments as of October 31, 2012, and the related statement of operations for the year then ended, the statements of changes in net assets for each of the two years in the period then ended, and the financial highlights for each of the four years in the period then ended. These financial statements and financial highlights are the responsibility of the Fund’s management. Our responsibility is to express an opinion on these financial statements and financial highlights based on our audits. The Funds’ financial highlights for the respective periods ended October 31, 2008 were audited by other auditors, whose report dated December 16, 2008, expressed an unqualified opinion on such financial highlights.
We conducted our audits in accordance with the standards of the Public Company Accounting Oversight Board (United States). Those standards require that we plan and perform the audit to obtain reasonable assurance about whether the financial statements and financial highlights are free of material misstatement. The Fund is not required to have, nor were we engaged to perform, an audit of their internal control over financial reporting. Our audits included consideration of internal control over financial reporting as a basis for designing audit procedures that are appropriate in the circumstances, but not for the purpose of expressing an opinion on the effectiveness of the Fund’s internal control over financial reporting. Accordingly, we express no such opinion. An audit also includes examining, on a test basis, evidence supporting the amounts and disclosures in the financial statements, assessing the accounting principles used and significant estimates made by management, as well as evaluating the overall financial statement presentation. Our procedures included confirmation of securities owned as of October 31, 2012, by correspondence with the custodian and brokers; where replies were not received from brokers, we performed other auditing procedures. We believe that our audits provide a reasonable basis for our opinion.
In our opinion, the financial statements and financial highlights referred to above, present fairly, in all material respects, the financial position of Alger China — U.S. Growth Fund as of October 31, 2012, the results of its operations for the year then ended, the changes in its net assets for each of the two years in the period then ended, and the financial highlights for each of the four years in the period then ended, in conformity with accounting principles generally accepted in the United States of America.
Deloitte & Touche LLP
New York, New York
December 21, 2012
31
��
ALGER CHINA-U.S. GROWTH FUND
ADDITIONAL INFORMATION (Unaudited)
Shareholder Expense Example
As a shareholder of the Fund, you incur two types of costs: transaction costs, if applicable, including sales charges (loads) and redemption fees; and ongoing costs, including management fees, distribution (12b-1) fees, if applicable, and other fund expenses. This example is intended to help you understand your ongoing costs (in dollars) of investing in the Fund and to compare these costs with the ongoing costs of investing in other mutual funds.
The example below is based on an investment of $1,000 invested at the beginning of the six-month period starting May 1, 2012 and ending October 31, 2012.
Actual Expenses
The first line for each class of shares in the table below provides information about actual account values and actual expenses. You may use the information in this line, together with the amount you invested, to estimate the expenses that you would have paid over the period. Simply divide your account value by $1,000 (for example, an $8,600 account value divided by $1,000 = 8.6), then multiply the result by the number in the first line under the heading entitled “Expenses Paid During the Period” to estimate the expenses you paid on your account during this period.
Hypothetical Example for Comparison Purposes
The second line for each class of shares in the table below provides information about hypothetical account values and hypothetical expenses based on the Fund’s actual expense ratios for each class of shares and an assumed rate of return of 5% per year before expenses, which is not the Fund’s actual return. The hypothetical account values and expenses may not be used to estimate the actual ending account balance or expenses you paid for the period. You may use this information to compare the ongoing costs of investing in the Fund and other funds. To do so, compare this 5% hypothetical example with the 5% hypothetical examples that appear in the shareholder reports of other funds.
Please note that the expenses shown in the table are meant to highlight your ongoing costs only and do not reflect any transaction costs, such as sales charges (loads) and redemption fees. Therefore, the second line under each class of shares in the table is useful in comparing ongoing costs only, and will not help you determine the relative total costs of owning different funds. In addition, if these transactional costs were included, your costs would have been higher.
32
| | Beginning
Account
Value
May 1, 2012 | | Ending
Account
Value
October 31, 2012 | | Expenses
Paid During
the Six Months
Ended
October 31,
2012(a) | | Ratio of
Expenses to
Average
Net Assets
For the
Six Months
Ended
October 31,
2012(b) | |
| | | | | | | | | |
Class A | Actual | | $ | 1,000.00 | | $ | 957.74 | | $ | 11.27 | | 2.29 | % |
| Hypothetical(c) | | 1,000.00 | | 1,013.62 | | 11.59 | | 2.29 | |
Class C | Actual | | 1,000.00 | | 954.11 | | 15.05 | | 3.06 | % |
| Hypothetical(c) | | 1,000.00 | | 1,009.73 | | 15.48 | | 3.06 | |
| | | | | | | | | | | | | |
(a) | Expenses are equal to the annualized expense ratio of the respective share class, multiplied by the average account value over the period, multiplied by 184/366 (to reflect the one-half year period). |
(b) | Annualized. |
(c) | 5% annual return before expenses. |
Trustees and Officers of the Fund
Information about the trustees and officers of the Fund is set forth below. In the table the term “Alger Fund Complex” refers to the Fund, The Alger Funds, The Alger Portfolios, The Alger Institutional Funds and The Alger Funds II, each of which is a registered investment company managed by Alger Management. Each Trustee serves until an event of termination, such as death or resignation, or until his or her successor is duly elected; each officer’s term of office is one year. Unless otherwise noted, the address of each person named below is 360 Park Avenue South, New York, NY 10010.
33
Name, Age, Position with the
Fund | | Principal Occupations | | Trustee
and/or
Officer
Since | | Number of
Funds in
the Alger
Fund
Complex
which are
Overseen
by Trustee |
INTERESTED TRUSTEE | | | | | | |
| | | | | | |
Hilary M. Alger (51) | | Director of Development, Pennsylvania Ballet since 2004; Associate Director of Development, College of Arts and Sciences and Graduate School, University of Virginia 1999-2003. | | 2003 | | 27 |
| | | | | | |
NON-INTERESTED TRUSTEE | | | | | | |
| | | | | | |
Charles F. Baird, Jr. (59) | | Managing Partner of North Castle Partners, a private equity securities group; Chairman of Leiner Health Products, Enzymatic Therapy and Caleel & Hayden (skincare business); former Chairman of Elizabeth Arden Day Spas, Naked Juice, Equinox (fitness company) and EAS (manufacturer of nutritional products). Formerly Managing Director of AEA Investors, Inc. | | 2000 | | 27 |
| | | | | | |
Roger P. Cheever (67) | | Associate Vice President for Principal Gifts, and Senior Associate Dean for Development in the Faculty of Arts and Sciences at Harvard University; Formerly Deputy Director of the Harvard College Fund. | | 2000 | | 27 |
| | | | | | |
Lester L. Colbert Jr. (78) | | Private investor since 1988; Formerly Chairman of the Board, President and Chief Executive Officer of Xidex Corporation (manufacturer of computer information media). | | 2000 | | 27 |
| | | | | | |
Stephen E. O’Neil (80) | | Attorney. Private Investor since 1981. Formerly of Counsel to the law firm of Kohler & Barnes. | | 1986 | | 27 |
| | | | | | |
David Rosenberg (50) | | Associate Professor of Law since January 2006 (Assistant Professor 2000-2005), Zicklin School of Business, Baruch College, City University of New York. | | 2007 | | 27 |
| | | | | | |
Nathan E. Saint-Amand M.D. (75) | | Medical doctor in private practice; Member of the Board of the Manhattan Institute (non-profit policy research) since 1988; Formerly Co-Chairman, Special Projects Committee, Memorial Sloan Kettering. | | 1986 | | 27 |
34
Name, Age, Position with the
Fund | | Principal Occupations | | Trustee
and/or
Officer
Since | | Number of
Funds in
the Alger
Fund
Complex
which are
Overseen
by Trustee |
OFFICERS | | | | | | |
| | | | | | |
Dan C. Chung (50)
President | | Chief Investment Officer and Director since 2001, and Chief Executive Officer since 2006, of Alger Management; President and Chief Executive Officer since 2003 of Alger Associates, Inc. (“Associates”); Chairman of the Board of Directors since 2006 of Alger Inc.; President since 2003 and Director since 2003 of Analysts Resources, Inc. (“Resources”); Formerly Trustee of the Trust from 2001 to 2007. | | 2003 | | N/A |
| | | | | | |
Hal Liebes (48)
Secretary | | Executive Vice President, Chief Legal Officer, Chief Operating Officer and Secretary of Alger Management and Alger Inc.; Director since 2006 of Alger Management, Alger Inc. and Resources. | | 2005 | | N/A |
| | | | | | |
Lisa A. Moss (47)
Assistant Secretary | | Senior Vice President since 2009, and Vice President and Assistant General Counsel of Alger Management since June 2006. | | 2006 | | N/A |
| | | | | | |
Michael D. Martins (47)
Treasurer | | Senior Vice President of Alger Management; Assistant Treasurer since 2004. | | 2005 | | N/A |
| | | | | | |
Anthony S. Caputo (57)
Assistant Treasurer | | Employed by Alger Management since 1986, currently serving as Vice President. | | 2007 | | N/A |
| | | | | | |
Sergio M. Pavone (51)
Assistant Treasurer | | Employed by Alger Management since 2002, currently serving as Vice President. | | 2007 | | N/A |
| | | | | | |
Barry J. Mullen (59)
Chief Compliance Officer | | Senior Vice President and Director of Compliance of Alger Management since May 2006. | | 2006 | | N/A |
Ms. Alger is an “interested person” (as defined in the Investment Company Act) of the Fund because of her affiliations with Alger Management. No Trustee is a director of any public company except as indicated under “Principal Occupations”.
The Statement of Additional Information contains additional information about the Fund’s Trustees and is available without charge upon request by calling (800) 992-3863.
35
Investment Management Agreement Renewal
At an in-person meeting held on September 13, 2012, the Trustees, including the Independent Trustees, unanimously approved renewal of the Investment Advisory Agreement (the “Agreement”) between the Fund and Fred Alger Management, Inc. (“Alger Management”). The Independent Trustees were assisted in their review by independent legal counsel and met with such counsel in executive session separate from representatives of Alger Management. In evaluating the Agreement, the Trustees drew on materials that they had requested and which were provided to them in advance of the meeting by Alger Management and by counsel. The materials covered, among other matters, (i) the nature, extent and quality of the services provided by Alger Management under the Agreement, (ii) the investment performance of the Fund, (iii) the costs to Alger Management of its services and the profits realized by Alger Management and Alger Inc. from their relationship with the Fund, and (iv) the extent to which economies of scale would be realized if and as the Fund grows and whether the fee levels in the Agreement reflect these economies of scale. These materials included an analysis of the Fund and Alger Management’s services by FUSE Research Network LLC (“FUSE”), an independent consulting firm selected by the Fund’s Chief Compliance Officer having no other relationship with Alger Management, whose specialties include, among other things, assistance to fund trustees and directors in their review of advisory contracts pursuant to section 15(c) of the Investment Company Act of 1940, as amended. At the meeting, senior FUSE personnel reviewed with the Trustees a presentation covering the Fund, which was provided prior to the meeting.
In deciding whether to approve renewal of the Agreement, the Trustees considered various factors, including those enumerated above. They also considered other direct and indirect benefits to Alger Management and its affiliates from their relationship with the Fund.
Nature, Extent and Quality of Services. In considering the nature, extent and quality of the services provided by Alger Management pursuant to the Agreement, the Trustees relied on their prior experience as Trustees of the Fund, their familiarity with the personnel and resources of Alger Management and its affiliates, and the materials provided at the meeting. They noted that under the Agreement Alger Management is responsible for managing the investment operations of the Fund. They also noted that administrative, compliance, reporting and accounting services necessary for the conduct of the Fund’s affairs are provided under a separate Administration Agreement with Alger Management. The Trustees reviewed the background and experience of Alger Management’s senior investment management personnel, including the individuals responsible for the investment operations of the Fund. They also considered the resources, operational structures and practices of Alger Management in managing the Fund’s portfolio, as well as Alger Management’s overall investment management business. They noted especially Alger Management’s established expertise in managing portfolios of “growth” stocks and that, according to an analysis provided by FUSE, the characteristics of the Fund’s portfolio had, since inception, been consistent with those of a fund that holds itself out to investors as growth-oriented. The Trustees concluded that Alger Management’s experience, resources and strength in the areas of importance to the Fund are considerable. The Trustees considered the level and depth of Alger Management’s
36
ability to execute portfolio transactions to effect investment decisions, including those through Alger Inc. The Trustees also considered the control and compliance environment at Alger Management and within the Fund.
Investment Performance of the Fund. Drawing upon information provided at the meeting by Alger Management as well as FUSE and upon reports provided to the Trustees by Alger Management throughout the preceding year, the Trustees reviewed the Fund’s returns for the year-to-date (at 6/30/12), second-quarter, 1-, 3-, and 5- year, and since-inception periods (and its year-by-year returns), together with supplemental data through 8/31/12, and compared them with benchmark and peer-group data for the same periods. They determined that the overall performance of the Fund against its peers for the year ended 6/30/12 had generally been acceptable but noted that the Fund had fallen short of both of its benchmarks during that period. They noted that the Fund’s performance measured across three years was good while its five-year record was subpar, while also noting that this performance reflected the management of a portion of the Fund’s portfolio by the Fund’s former sub-adviser. They took note of FUSE’s observation that the distinctive nature of the Fund made selection of a true peer group very difficult. On the basis of their review and discussions with representatives of FUSE and Alger Management, the Trustees determined that the performance of the Fund was acceptable.
Fund Fee and Expense Ratio; Profitability to Alger Management and its Affiliates. The Trustees reviewed the Fund’s management fee and expense ratio and compared them with a group of comparable funds. In order to assist the Trustees in this comparison, FUSE had provided the Trustees with comparative information with respect to the advisory fees and expense ratios of similar funds. That information indicated that the fee for the Fund was above the median for the fees in the FUSE reference group and that the expense ratios for the Fund’s two classes of shares were well above the medians for the FUSE reference group. The Trustees also considered fees paid to Alger Management by three other types of clients, specifically mutual funds for which Alger Management was sub-adviser, separately managed institutional accounts, and wrap programs. The Trustees determined that in all three cases the fees were of doubtful relevance for purposes of comparison with those of the Fund because of the significant differences in services provided by Alger Management to those types of clients as opposed to the Fund, but that to the extent that meaningful comparison was practicable, the differences in services adequately explained the differences in the fees. The Trustees then considered the profitability of the Agreement to Alger Management and its affiliates, and the methodology used by Alger Management in determining such profitability. The Trustees reviewed previously-provided data on the Fund’s profitability to Alger Management and its affiliates for the year ended June 30, 2012. After discussing with representatives of the Adviser and FUSE the methodologies used in computing the costs that formed the bases of the profitability calculations, the Trustees turned to the profitability data provided. After analysis and discussion, they concluded that, to the extent that Alger Management’s and its affiliates’ relationships with the Fund had been profitable to those entities, the profit margins were not unacceptable.
37
Economies of Scale. On the basis of their discussions with management and their analysis of information provided at the meeting, the Trustees determined that the nature of the Fund and its operations is such that Alger Management is likely to realize economies of scale in the management of the Fund at some point as (and if) it grows in size, but that, in view of the fact that the Fund’s current assets were less than $49 million, adoption of breakpoints in the advisory fee, while possibly appropriate at a later date, could await further analysis of the sources and potential scale of the economies and the fee structure that would best reflect them. Accordingly, the Trustees requested that Alger Management address this topic with the Trustees at future meetings.
Other Benefits to Alger Management. The Trustees considered whether Alger Management benefits in other ways from its relationship with the Fund. They noted that Alger Management maintains soft-dollar arrangements in connection with the Fund’s brokerage transactions, reports on which are regularly supplied to the Trustees at their quarterly meetings and summaries of which, listing soft-dollar commissions for the twelve months through June 30, 2012, had been included in the materials supplied prior to the meeting. The Trustees also noted that Alger Management receives fees from the Fund under the Administration Agreement and the Shareholder Administrative Services Agreement and that Alger Inc. provides a significant portion of the Fund’s equity brokerage and receives shareholder servicing fees from the Fund as well. The Trustees had been provided with information regarding, and had considered, the administration fee, shareholder administrative services fee, brokerage and shareholder servicing fee benefits in connection with their review of the profitability to Alger Management and its affiliates from their relationships with the Fund. As to other benefits received, the Trustees decided that none were so significant as to render Alger Management’s fees excessive.
Conclusions and Determinations. At the conclusion of these discussions, each of the Independent Trustees expressed the opinion that he had been furnished with sufficient information to make an informed business decision with respect to renewal of the Agreement. Based on its discussions and considerations as described above, the Board made the following conclusions and determinations:
· The Board concluded that the nature, extent and quality of the services provided by Alger Management are adequate and appropriate.
· The Board determined that the Fund’s overall performance was acceptable.
· The Board concluded that the Fund’s advisory fee paid to Alger Management was reasonable in light of comparative performance and expense and advisory fee information, costs of the services provided and profits to be realized and benefits derived or to be derived by Alger Management and its affiliates from the relationship with the Fund.
38
· The Board determined that there were not at this time significant economies of scale to be realized by Alger Management in managing the Fund’s assets but that, to the extent that material economies of scale should be realized in the future, the Board would seek to ensure that they were shared with the Fund.
The Board considered these conclusions and determinations and, without any one factor being dispositive, determined that renewal of the Agreement was in the best interests of the Fund and its shareholders.
39
Privacy Policy
U.S. Consumer Privacy Notice Rev. 01/2011 | | 3/31/11 |
FACTS | | WHAT DOES ALGER DO WITH YOUR PERSONAL INFORMATION? |
| | |
Why? | | Financial companies choose how they share your personal information, which, under Federal law, means personally identifiable information. Federal law gives consumers the right to limit some but not all sharing. Federal law also requires us to tell you how we collect, share, and protect your personal information. Please read this notice carefully to understand what we do. |
| | |
What? | | The types of personal information we collect and share depend on the product or service you have with us. This information can include: · Social Security number · account balances, transaction history and credit information |
| | |
How? | | All financial companies need to share customers’ personal information to run their everyday business. In the section below, we list the reasons financial companies can share their customers’ personal information; the reasons Alger chooses to share; and whether you can limit this sharing. |
Reasons we can share your personal
information | | Does
Alger share? | | Can you limit
this sharing? |
| | | | |
For our everyday business purposes — such as to process your transactions, maintain your account(s), respond to court orders and legal investigations, or report to credit bureaus | | Yes | | No |
| | | | |
For our marketing purposes — with service providers we use to offer our products and services to you | | Yes | | No |
| | | | |
For joint marketing with other financial companies | | No | | We don’t share |
| | | | |
For our affiliates’ everyday business purposes—information about your transactions and experiences | | Yes | | No |
| | | | |
For our affiliates’ everyday business purposes—information about your creditworthiness | | No | | We don’t share |
| | | | |
For nonaffiliates to market to you — for all credit card accounts | | No | | We don’t share |
| | | | |
For nonaffiliates to market to you — for accounts and services endorsed by another organization | | No | | We don’t share |
| | | | |
For nonaffiliates to market to you — for accounts other than credit card accounts and Sponsored Accounts, such as insurance, investments, deposit and lending | | No | | We don’t share |
40
Who we are | | |
| | |
Who is providing this notice? | | Alger includes Fred Alger Management, Inc. and Fred Alger & Company, Incorporated as well as the following funds: The Alger Funds, The Alger Funds II, The Alger Institutional Funds, The Alger Portfolios, and Alger China-U.S. Growth Fund. |
| | |
What we do | | |
| | |
How does Alger protect my personal information? | | To protect your personal information from unauthorized access and use, we use security measures that comply with federal law. These measures include computer safeguards and secured files and buildings. For more information visit alger.com. |
| | |
How does Alger collect my personal information? | | We collect your personal information, for example, when you: · open an account or perform transactions · seek advice about your investments We also collect your personal information from others, such as credit bureaus, affiliates, or other companies. |
| | |
Why can’t I limit all sharing? | | Federal law gives you the right to limit some but not all sharing related to: · sharing for affiliates’ everyday business purposes — information about your creditworthiness · affiliates from using your information to market to you · sharing for nonaffiliates to market to you State laws and individual companies may give you additional rights to limit sharing. |
| | |
Definitions | | |
| | |
Affiliates | | Companies related by common ownership or control. They can be financial and nonfinancial companies. · Our affiliates include Fred Alger Management, Inc. and Fred Alger & Company, Incorporated as well as the following funds: The Alger Funds, The Alger Funds II, The Alger Institutional Funds, The Alger Portfolios, and Alger China-U.S. Growth Fund. |
| | |
Nonaffiliates | | Companies not related by common ownership or control. They can be financial and nonfinancial companies |
| | |
Joint marketing | | A formal agreement between nonaffiliated financial companies that together market financial products or services to you. |
41
Proxy Voting Policies
A description of the policies and procedures the Fund uses to determine how to vote proxies relating to portfolio securities and information regarding how the Fund voted proxies relating to portfolio securities during the most recent 12-month period ended June 30 are available, without charge, by calling (800) 992-3863 or online on the Fund’s website at www.alger.com or on the SEC’s website at www.sec.gov.
Fund Holdings
The Fund’s most recent month end portfolio holdings are available approximately sixty days after month end on the Fund’s website at www.alger.com. The Fund also files its complete schedule of portfolio holdings with the SEC for the first and third quarter of each fiscal year on Form N-Q. The Fund’s Forms N-Q are available online on the SEC’s website at www.sec.gov or may be reviewed and copied at the SEC’s Public Reference Room in Washington, D.C. Information regarding the operation of the SEC’s Public Reference Room may be obtained by calling 1-800-SEC-0330. A copy of the most recent quarterly holdings may also be obtained from the Fund by calling (800) 992-3863.
42
ALGER CHINA-U.S. GROWTH FUND
360 Park Avenue South
New York, NY 10010
(800) 992-3863
www.alger.com
Investment Manager
Fred Alger Management, Inc.
360 Park Avenue South
New York, NY 10010
Distributor
Fred Alger & Company, Incorporated
360 Park Avenue South
New York, NY 10010
Transfer Agent and Dividend Disbursing Agent
Boston Financial Data Services, Inc.
P.O. Box 8480
Boston, MA 02266
This report is submitted for the general information of the shareholders of Alger China-U.S. Growth Fund. It is not authorized for distribution to prospective investors unless accompanied by an effective prospectus for the Fund, which contains information concerning the Fund’s investment policies, fees and expenses as well as other pertinent information.
(This page has been intentionally left blank.)
(This page has been intentionally left blank.)

ACAR
ITEM 2. CODE OF ETHICS.
(a) The Registrant has adopted a code of ethics (the “Code of Ethics”) that applies to its principal executive officer, principal financial officer, principal accounting officer or controller, or persons performing similar functions.
(b) Not applicable.
(c) The Registrant has not amended its Code of Ethics during the period covered by the shareholder report presented in Item 1 hereto.
(d) The Registrant has not granted a waiver or an implicit waiver from a provision of its Code of Ethics during the period covered by the shareholder report presented in Item 1 hereto.
(e) Not applicable.
(f) The Registrant’s Code of Ethics is attached as an Exhibit hereto.
ITEM 3. AUDIT COMMITTEE FINANCIAL EXPERT.
The Board of Trustees of the Registrant determined that Stephen E. O’Neil is an audit committee financial expert (within the meaning of that phrase specified in the instructions to Form N-CSR) on the Registrant’s audit committee. Mr. O’Neil is an “independent” trustee – i.e., he is not an interested person of the Registrant as defined in the Investment Company Act of 1940, nor has he accepted directly or indirectly any consulting, advisory or other compensatory fee from the Registrant, other than in his capacity as Trustee.
ITEM 4. PRINCIPAL ACCOUNTANT FEES AND SERVICES.
a) Audit Fees:
October 31, 2012 | | $ | 31,200 | |
October 31, 2011 | | $ | 31,000 | |
b) Audit-Related Fees: NONE
c) Tax Fees for tax advice, tax compliance and tax planning:
October 31, 2012 | | $ | 4,100 | |
October 31, 2011 | | $ | 3,800 | |
d) All Other Fees:
October 31, 2012 | | $ | 8,920 | |
October 31, 2011 | | $ | 9,200 | |
Other fees include a review and consent for Registrants registration statement filing and a review of the semi-annual financial statements.
e) 1) Audit Committee Pre-Approval Policies And Procedures:
Audit and non-audit services provided by the Registrant’s independent registered public accounting firm (the “Auditors”) on behalf the Registrant must be pre-approved by the Audit Committee. Non-audit services provided by the Auditors on behalf of the Registrant’s Investment Adviser or any entity controlling, controlled by, or under common control with the Investment Adviser must be pre-approved by the Audit Committee if such non-audit services directly relate to the operations or financial reporting of the Registrant.
2) All fees in item 4(b) through 4(d) above were approved by the Registrants’ Audit Committee.
f) Not Applicable
g) Non-Audit Fees:
October 31, 2012 | | $221,557 and €42,600 | |
October 31, 2011 | | $183,344 and €70,575 | |
h) The audit committee of the board of trustees has considered whether the provision of the non-audit services that were rendered to the registrant’s investment adviser and any entity controlling, controlled by, or under common control, with the adviser that provides ongoing services to the registrant that were not approved pursuant to (c)(7)(ii) of Rule 2-01 of Regulation S-X is compatible with maintaining the principle accountant’s independence.
ITEM 5. AUDIT COMMITTEE OF LISTED REGISTRANTS.
Not applicable
ITEM 6. INVESTMENTS.
Not applicable
ITEM 7. DISCLOSURE OF PROXY VOTING POLICIES AND PROCEDURES FOR CLOSED-END MANAGEMENT INVESTMENT COMPANIES.
Not applicable
ITEM 8. PORTFOLIO MANAGERS OF CLOSED-END MANAGEMENT INVESTMENT COMPANIES.
Not applicable
ITEM 9. PURCHASES OF EQUITY SECURITIES BY CLOSED-END MANAGEMENT INVESTMENT COMPANY AND AFFILIATED PURCHASERS.
Not applicable
ITEM 10. SUBMISSION OF MATTERS TO A VOTE OF SECURITY HOLDERS.
None
ITEM 11. CONTROLS AND PROCEDURES.
(a) The Registrant’s principal executive officer and principal financial officer have concluded that the Registrant’s disclosure controls and procedures (as defined in Rule 30a-3(c) under the Investment Company Act of 1940, as amended) are effective based on their evaluation of the disclosure controls and procedures as of a date within 90 days of the filing date of this document.
(b) No changes in the Registrant’s internal control over financial reporting occurred during the Registrant’s second fiscal half-year that materially affected, or are reasonably likely to materially affect, the Registrant’s internal control over financial
reporting.
ITEM 12. EXHIBITS.
(a) (1) Code of Ethics as Exhibit 99.CODE ETH
(a) (2) Certifications of principal executive officer and principal financial officer as required by rule 30a-2(a) under the Investment Company Act of 1940 are attached as Exhibit 99.CERT
(b) Certifications of principal executive officer and principal financial officer as required by rule 30a-2(b) under the Investment Company Act of 1940 are attached as Exhibit 99.906CERT
SIGNATURES
Pursuant to the requirements of the Securities Exchange Act of 1934 and the Investment Company Act of 1940, the registrant has duly caused this report to be signed on its behalf by the undersigned, thereunto duly authorized.
Alger China-U.S Growth Fund | | |
| | | |
By: | /s/Daniel C. Chung | | |
| | | |
| Daniel C. Chung | | |
| | | |
| President | | |
| | | |
Date: December 17, 2012 | | |
Pursuant to the requirements of the Securities Exchange Act of 1934 and the Investment Company Act of 1940, this report has been signed below by the following persons on behalf of the registrant and in the capacities and on the dates indicated.
By: | /s/Daniel C. Chung | | |
| | | |
| Daniel C. Chung | | |
| | | |
| President | | |
| | | |
Date: December 17, 2012 | | |
| | |
By: | /s/Michael D. Martins | | |
| | | |
| Michael D. Martins | | |
| | | |
| Treasurer | | |
| | | |
Date: December 17, 2012 | | |