| | | OMB APPROVAL |
| | | OMB Number: 3235-0570 |
| | | Expires: July 31, 2022 |
| | | Estimated average burden |
| | | hours per response……20.6 |
UNITED STATES
SECURITIES AND EXCHANGE COMMISSION
Washington, D.C. 20549
FORM N-CSR
CERTIFIED SHAREHOLDER REPORT OF REGISTERED MANAGEMENT INVESTMENT COMPANIES
Investment Company Act file number 811-21308
Alger Global Focus Fund
(Exact name of registrant as specified in charter)
360 Park Avenue South New York, New York 10010
(Address of principal executive offices) (Zip code)
Mr. Hal Liebes
Fred Alger Management, LLC.
360 Park Avenue South
New York, New York 10010
(Name and address of agent for service)
Registrant's telephone number, including area code: 212-806-8800
Date of fiscal year end: October 31
Date of reporting period: April 30, 2020
Form N-CSR is to be used by management investment companies to file reports with the Commission, not later than 10 days after the transmission to Stockholders of any report to be transmitted to Stockholders under Rule 30e-1 under the Investment Company Act of 1940 (17 CFR 270.30e1). The Commission may use the information provided on Form N-CSR in its regulatory, disclosure review, inspection, and policymaking roles.
A registrant is required to disclose the information specified by Form N-CSR, and the Commission will make this information public. A registrant is not required to respond to the collection of information contained in Form N-CSR unless the Form displays a currently valid Office of Management and Budget ("OMB") control number. Please direct comments concerning the accuracy of the information collection burden estimate and any suggestions for reducing the burden to the Secretary, Securities and Exchange Commission, 450 Fifth Street, NW, Washington, DC 20549-0609. The OMB has reviewed this collection of information under the clearance requirements of 44 U.S.C. § 3507.
ITEM 1. REPORT(S) TO STOCKHOLDERS.

Table of Contents
ALGER GLOBAL FOCUS FUND
| Shareholders’ Letter | | 1 | |
| | | | |
| Fund Highlights | | 8 | |
| | | | |
| Portfolio Summary | | 10 | |
| | | | |
| Schedule of Investments | | 11 | |
| | | | |
| Statement of Assets and Liabilities | | 15 | |
| | | | |
| Statement of Operations | | 17 | |
| | | | |
| Statements of Changes in Net Assets | | 18 | |
| | | | |
| Financial Highlights | | 19 | |
| | | | |
| Notes to Financial Statements | | 23 | |
| | | | |
| Additional Information | | 36 | |
Optional Internet Availability of Alger Shareholder Reports
Beginning on January 1, 2021, as permitted by regulations adopted by the Securities and Exchange Commission, paper copies of the Funds’ shareholder reports will no longer be sent by mail, unless you specifically request paper copies of the reports from the Fund or from your financial intermediary. Instead, the reports will be made available on a website, and you will be notified by mail each time a report is posted and provided with a website link to access the report.
If you already elected to receive shareholder reports electronically, you will not be affected by this change and you need not take any action. You may elect to receive shareholder reports and other communications from the Fund electronically by signing up for paperless delivery at www.icsdelivery.com/alger. If you own these shares through a financial intermediary, contact your financial intermediary.
You may elect to receive all future reports in paper free of charge. If you invest directly with the Fund you can inform the Fund that you wish to continue receiving paper copies of your shareholder reports by contacting us at 1-866-345-5954 or fundreports.com. If you own these shares through a financial intermediary, contact your financial intermediary to elect to continue to receive paper copies of your shareholder reports. Your election to receive reports in paper will apply to all funds held within the Alger Fund Complex or your financial intermediary.
| Shareholders’ Letter (Unaudited) | April 30, 2020 |
Dear Shareholders,
Reasons for Optimism Surface as Pandemic Drives Market Volatility
At Alger, we see plenty of reasons for optimism regarding equity investing and the well-being of society as governments seek to curtail the spread of the coronavirus, but we acknowledge that the pandemic will continue to create both personal and economic hardships in the foreseeable future. During the recent months of uncertainty and fear, we have strived to support our shareholders by drawing upon our 55 years of investing experience to seek companies that are best positioned to potentially generate durable earnings growth, and we have shared our insights on managing equities during challenging times to help our clients manage their apprehensions.
In this letter, which discusses the six-month reporting period ended April 30, 2020, I provide additional perspectives on navigating markets during the pandemic and I explain why I believe equities, while continuing to be volatile, may produce additional gains.
A Challenging Time
From the start of the reporting period until February 19 of this year, the S&P 500 Index climbed 12.18%. The spread of the novel coronavirus worldwide, however, caused investor sentiment to plummet and from the February 19 historical market peak to March 23 the index dropped 33.79%. As countries issued stay-at-home orders and shut down businesses to contain the pandemic, economic data weakened considerably. In the U.S., the Congressional Budget Office eventually predicted that gross domestic product (GDP) will contract at nearly a 40% annual rate in the second quarter of this year and unemployment will climb from a 50-year low to a peak of 16% later this year. With 24% of S&P 500 companies reporting during the last week of the reporting period, FactSet Research estimated that first quarter 2020 earnings would decline 15.8%, the largest drop since the second quarter of 2009.
In March, the Federal Reserve (“the Fed”) responded aggressively to the pandemic by implementing two rate cuts that totaled 150 basis points, bringing the fed funds target rate to .0% - .25%. The Fed also unveiled a round of quantitative easing that could dwarf prior easing programs while U.S. legislators began creating programs initially valued at more than $2 trillion to support businesses, increase unemployment benefits and provide one-time payments to certain individuals. Hope that the stimulus plans could help mitigate the economic impact of the pandemic caused equities to bounce back and from March 24 until April 30, the S&P 500 Index recorded a 30.8% gain.
As the reporting period drew to a close, various U.S. states and certain countries began to re-open their economies as the rates of new coronavirus cases either stabilized or declined. For the six-month reporting period, the S&P 500 recorded a 3.16% loss. Volatility extended beyond the U.S. with the MSCI Emerging Markets Index declining 10.39% and the MSCI ACWI ex USA Index declining 13.02%. Broadly speaking, companies with strong balance sheets and innovative products that are experiencing growing demand as a result of the pandemic outperformed while “old economy” industries such as energy, manufacturing, brick and mortar retailers and certain travel companies including airlines, cruise ship operators and hotels performed worst.
Keeping Change in Perspective
At Alger, we believe history illustrates that companies with innovative products and services can dominate their industries by disrupting their respective industries and capturing market share. These types of companies can potentially reward investors by growing their earnings despite economic headwinds.
Consider the following examples:
| · | The “Spanish Flu” pandemic and recession, which lasted from 1918 to 1919 and claimed 50 million lives. During this period, automobile ownership grew at a double-digit rate. |
| | | |
| · | The Great Depression, which lasted from 1929 through 1939. In 1937 DuPont introduced neoprene, which is a synthetic rubber. By 1939, every automobile and airplane manufactured in the U.S. included products made with the material. Hewlett-Packard and Polaroid were also born during the Great Depression. |
| | | |
| · | The “Asian Flu” pandemic and recession, which occurred in the late 1950s. During this event television ownership increased 12% after the introduction of color TV. |
| | | |
| · | The recession of the early 1990s. During this event, personal computer penetration grew. |
| | | |
| · | The Global Financial Crisis and Great Recession of 2008. During this event, smartphone subscribers, digital advertising and online retail sales all increased. |
Pandemic Hastens Change
Today, internet connected devices, cloud computing, artificial intelligence, the Internet of Things, genetic sciences, medtech and healthcare advances, and other technologies are fostering innovation that is occurring at unprecedented levels. In many instances, the coronavirus pandemic is accelerating the already rapid pace at which new products and services disrupt their industries and capture market share. During the early months of the pandemic, credit card data showed that overall consumer spending declined substantially as shopping malls closed, but consumers’ online shopping has seen near exponential acceleration while people have been under stay-at-homeorders.1The increased adoption of ecommerce by consumers is comparable to the total growth in adoption that we believe would have occurred over the coming two years without the pandemic. This acceleration is occurring after decades of growth in online retailing, which increased 14.9% last year while overall retail sales increased only 3.8%. This strong growth trend of course benefits large online retailers such as Amazon.com, Inc. but it is also helping smaller retailers who have had the foresight to adopt and even primarily build their businesses online, rather than in physical stores, often using ecommerce software platforms from companies such as Shopify, Square and Hubspot.
The structure and rhythm of the American workplace (and indeed across the globe) may be forever changed as a result of the response to Covid-19. With offices shut down, many businesses have had to immediately expand remote working to the majority, if not all, of their employees. Many lessons will be learned from this mass shift to telecommuting. However, we believe that even after this healthcare crisis passes and offices re-open, there will be a shift in the perception and therefore the use of telecommuting. In particular, for many businesses and for many job roles, we believe both workers and employers are seeing efficiency gains while “working from home” and will adopt more flexible policies in the future to not only allow working from home but perhaps encourage it more broadly and frequently within their future workforce. The use of many of the new technologies that support online collaboration, videoconferencing, and business process management, even as workers are remote, is being tested now on an emergency and broad basis, and the technologies are proving themselves to be largely exceptional in their potential for changing how we work in the future. To support this massive shift, technology needs to not only provide collaborative workstations for employees, but also increased network capacity and security. Nearly every provider of internet bandwidth or data center computing power is reporting significant increases in demand. Additionally, security firms such as CrowdStrike that provide end-point protection against viruses, malware and other digital threats are experiencing increased demand for cloud-based security systems. In both government and commercial firms, the need for real-time communication with the public or their employees has driven the adoption of new communications platforms to manage the dialogue. Software company Everbridge, for example, announced during the first quarter of this year that it had processed more than 13 million messages related to the pandemic.
We have long been investors in the healthcare sector, which we view as one of the most dynamic and innovative sectors in the U.S., and indeed, the world. Today, we are seeing the valor of doctors and nurses in New York in particular, Alger’s home for over 55 years, and across the U.S. and the globe. We believe this crisis will bring benefits to healthcare systems worldwide as lessons learned from this pandemic will result in new investment in public health, strengthening our hospitals’ and service providers’ capacity to respond rapidly and flexibly to future crises, and by accelerating investment in innovations from the research lab, to testing and clinical treatments and processes, and finally to the delivery of healthcare services by our doctors and nurses on the frontline of patient care. Early growth trends like telemedicine have already proven critical in this crisis, and after it ends, we believe will have become the new way of delivering healthcare to people in the U.S. – that is a technology trend whose adoption “curve,” we believe, has the potential to go from birth to mainstream potentially faster than any we have seen before.
Going Forward
We believe market volatility will continue in the coming months due to declining earnings and heightened uncertainty. As the quarterly reporting season progressed in April, companies increasingly withdrew their guidance for fiscal year 2020 due to uncertainty regarding the future impacts of the pandemic. Analysts are projecting a substantial decline in earnings for calendar year 2020 but expect earnings growth to resume next year.
We are optimistic that an eventual recovery in earnings growth, low interest rates and a return to more normal conditions resulting from a potential coronavirus vaccine or new treatments for Covid-19 could support equity markets. Unlike most recessions, the current economic slowdown is being driven by a public health crisis rather than structural issues, such as toxic debt built upon a housing bubble that triggered the Global Financial Crisis. Regardless of the timing, we believe investors should take a long-term approach rather than try to time markets. We also think investors will be best served by using in-depth fundamental research to find companies that are gaining market share and producing durable earnings growth with innovative products and services and, more specifically, are able to benefit from the global economic dislocation occurring from the pandemic. Additionally, we believe innovative companies with strong balance sheets that can finance their own growth initiatives rather than rely on leverage may be best positioned to outperform. At Alger, we continue to seek companies that are benefiting from change as we seek to help our valued clients meet their financial needs.
Portfolio Matters
Alger Global Focus Fund
The Alger Global Focus Fund returned 0.59% for the fiscal six-month period ended April 30, 2020, compared to the -7.43% return of the MSCI ACWI Index.
Contributors to Performance
During the reporting period, the largest sector weightings were Information Technology and Consumer Discretionary. The largest sector overweight was Information Technology and the largest sector underweight was Communication Services. The Financials and Information Technology sectors provided the greatest contributions to relative performance.
From a country perspective, Italy, Brazil, New Zealand, Australia, the United Kingdom and the United States were among the top contributors to relative performance. Regarding individual positions, Amazon.com, Inc.; Microsoft Corp.; Kirkland Lake Gold Ltd.; Adobe, Inc.; and Nexi S.p.A. were among the top contributors to performance. Amazon.com continues to generate strong high unit volume growth by taking market share from brick and mortar retailing and by growing its cloud computing service. During the reporting period, consumer uptake of one-day shipping supported the acceleration of the company’s online retailing. Later in the reporting period, investors became excited about the significant revenue gains associated with coronavirus quarantining and social distancing that are accelerating the pace at which ecommerce is capturing market share from traditional retailers. Additionally, investors reacted favorably to the pandemic creating increased demand for Amazon.com’s cloud service, AWS.
Detractors from Performance
The Healthcare and Industrials sectors were among the sectors that detracted from results. From a country perspective, Switzerland, India, China, Germany, Ireland and Hong Kong were among the top detractors from performance. Regarding individual positions, Techtronic Industries Co., Ltd.; Varta AG; American Express Company; Sands China Ltd.; and Burberry Group plc. were among the top detractors from performance. Burberry Group is a British luxury fashion house headquartered in London. It focuses on the manufacturing and distribution of trench coats, ready-to-wear outerwear, fashion accessories, fragrances, sunglasses and cosmetics. The company was undergoing a successful and significant transformation under the leadership of a new management team and a new creative designer. However, the Covid-19 outbreak and the lockdown announcements that began in Asia and later spread to other major parts of the world created uncertainty about the company’s short-term outlook. Concerns over the impact from store closures and travel restrictions around the globe weighed on the share price.
I thank you for putting your trust in Alger.
Sincerely,
Daniel C. Chung, CFA
Chief Investment Officer
Fred Alger Management, LLC
1Source: Bank of America.
Investors cannot invest directly in an index. Index performance does not reflect the deduction for fees, expenses, or taxes.
This report and the financial statements contained herein are submitted for the general information of shareholders of the Fund. This report is not authorized for distribution to prospective investors in the Fund unless preceded or accompanied by an effective prospectus for the Fund. Fund performance returns represent the six-month period return of Class A shares prior to the deduction of any sales charges and include the reinvestment of any dividends or distributions.
The performance data quoted represents past performance, which is not an indication or guarantee of future results.
Standardized performance results can be found on the following pages. The investment return and principal value of an investment in the Fund will fluctuate so that an investor’s shares, when redeemed, may be worth more or less than their original cost. Current performance may be lower or higher than the performance quoted. For performance data current to the most recent month-end, visit us at www.alger.com or call us at (800) 992-3863.
The views and opinions of the Fund’s management in this report are as of the date of the Shareholders’ Letter and are subject to change at any time subsequent to this date. There is no guarantee that any of the assumptions that formed the basis for the opinions stated herein are accurate or that they will materialize. Moreover, the information forming the basis for such assumptions is from sources believed to be reliable; however, there is no guarantee that such information is accurate. Any securities mentioned, whether owned in the Fund or otherwise, are considered in the context of the construction of an overall portfolio of securities and therefore reference to them should not be construed as a recommendation or offer to purchase or sell any such security. Inclusion of such securities in the Fund and transactions in such securities, if any, may be for a variety of reasons, including, without limitation, in response to cash flows, inclusion in a benchmark, and risk control. The reference to a specific security should also be understood in such context and not viewed as a statement that the security is a significant holding in the Fund. Please refer to the Schedule of Investments for the Fund which is included in this report for a complete list of Fund holdings as of April 30, 2020. Securities mentioned in the Shareholders’ Letter, if not found in the Schedule of Investments, may have been held by the Fund during the fiscal period ended April 30, 2020.
Risk Disclosures
Investing in the stock market involves certain risks, including the potential loss of principal. Growth stocks tend to be more volatile than other stocks as their prices tend to be higher in relation to their companies’ earnings and may be more sensitive to market, political, and economic developments. Assets may be focused in a small number of holdings, making them susceptible to risks associated with a single economic, political or regulatory event than a more diversified portfolio. Foreign and emerging markets securities involves special risks including currency fluctuations, less liquidity, inefficient trading, political instability, and increased volatility. Investing in companies of small capitalizations involve the risk that such issuers may have limited product lines or financial resources, lack management depth, or have limited liquidity. Active trading may increase transaction costs, brokerage commissions, and taxes, which can lower the return on investment.
For a more detailed discussion of the risks associated with the Fund, please see the prospectus.
Before investing, carefully consider the Fund’s investment objective, risks, charges, and expenses.
For a prospectus or a summary prospectus containing this and other information about the Alger Global Focus Fund call us at (800) 992-3863 or visit us at www.alger.com. Read it carefully before investing.
Fred Alger & Company, LLC, Distributor. Member NYSE Euronext, SIPC.
NOT FDIC INSURED. NOT BANK GUARANTEED. MAY LOSE VALUE.
Definitions:
| · | The S&P 500 Index: An index of large company stocks considered to be representative of the U.S. stock market. |
| | | |
| · | The MSCI ACWI ex USA Index (gross) captures large and mid cap representation across 22 of 23 Developed Markets (DM) countries (excluding the US) and 26 Emerging Markets (EM) countries. The index covers approximately 85% of the global equity opportunity set outside the US. |
| | | |
| · | The Morgan Stanley Capital International (MSCI) Emerging Markets Index (gross) is a free float-adjusted market capitalization index that is designed to measure equity market performance in the global emerging markets. |
| | | |
| · | The MSCI ACWI Index (gross) is a free float-adjusted market capitalization weighted index that is designed to measure the equity market performance of developed and emerging markets. The MSCI ACWI captures large and mid cap representation across 23 Developed Markets (DM) and 26 Emerging Markets (EM) countries. |
| | | |
| · | FactSet Research provides integrated software and data solutions for investment professionals. |
FUND PERFORMANCE AS OF 3/31/20(Unaudited)
AVERAGE ANNUAL TOTAL RETURNS
| | | 1
YEAR | | | 5
YEARS | | | 10
YEARS | | | SINCE
INCEPTION | |
| Alger Global Focus Class A (Inception 11/3/03) | | | (12.29 | )% | | | (0.73 | )% | | | 3.27 | % | | | 6.79 | % |
| Alger Global Focus Class C (Inception 3/3/08)* | | | (9.05 | )% | | | (0.40 | )% | | | 3.04 | % | | | 6.37 | % |
| Alger Global Focus Class I (Inception 5/31/13) | | | (7.11 | )% | | | 0.60 | % | | | n/a | | | | 4.36 | % |
| Alger Global Focus Class Z (Inception 5/31/13) | | | (6.92 | )% | | | 0.80 | % | | | n/a | | | | 4.58 | % |
The performance data quoted represents past performance, which is not an indication or a guarantee of future results. The Fund’s average annual total returns include changes in share price and reinvestment of dividends and capital gains. Class A returns reflect the maximum initial sales charge and Class C returns reflect the applicable contingent deferred sales charge. Alger Global Focus Fund prior to March 28, 2018, followed different investment strategies and was managed by different portfolio managers and before August 15, 2018 was named “Alger Global Growth Fund”. Prior to May 31, 2013, the Fund was named “Alger China-U.S. Growth Fund” and followed different investment strategies. Performance prior to March 28, 2018, reflects these prior management styles and does not reflect the Fund’s current investment strategies and investment personnel.
| * | Since inception performance is calculated since the inception of the Class A shares. Historical performance prior to March 3, 2008, inception of the class, is that of the Fund's Class A shares, reduced to reflect the current maximum sales charge and the higher operating expenses of Class C shares. |
ALGER GLOBAL FOCUS FUND
Fund Highlights Through April 30, 2020 (Unaudited)
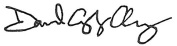
HYPOTHETICAL $10,000 INVESTMENT IN CLASS A SHARES
— 10 years ended 4/30/20
The chart above illustrates the change in value of a hypothetical $10,000 investment made in the Alger Global Focus Fund Class A shares, with an initial maximum sales charge of 5.25%, and the MSCI ACWI Index (an unmanaged index of common stocks) for the ten years ended April 30, 2020. Alger Global Focus Fund prior to March 28, 2018, followed different investment strategies and was managed by different portfolio managers and before August 15, 2018 was named “Alger Global Growth Fund”. Prior to May 31, 2013, the Fund was named “Alger China-U.S. Growth Fund” and followed different investment strategies. Performance prior to March 28, 2018, reflects these prior management styles and does not reflect the Fund’s current investment strategies and investment personnel. Figures for the Alger Global Focus Fund Class A shares and the MSCI ACWI Index include reinvestment of dividends. Figures for the Alger Global Focus Fund Class A shares also include reinvestment of capital gains. Performance for the Alger Global Focus Fund Class C, Class I and Class Z shares will vary from the results shown above due to differences in expenses and sales charges that each class bears. Investors cannot invest directly in any index. Index performance does not reflect deduction for fees, expenses, or taxes.
ALGER GLOBAL FOCUS FUND
Fund Highlights Through April 30, 2020 (Unaudited) (Continued)
PERFORMANCE COMPARISON AS OF 4/30/20
AVERAGE ANNUAL TOTAL RETURNS
| | | 1 YEAR | | | 5 YEARS | | | 10 YEARS | | | Since
11/3/2003 | |
| Class A (Inception 11/3/03) | | | (6.22 | )% | | | 1.44 | % | | | 4.38 | % | | | 7.48 | % |
| Class C (Inception 3/3/08)* | | | (2.73 | )% | | | 1.78 | % | | | 4.16 | % | | | 7.05 | % |
| MSCI ACWI Index | | | (4.43 | )% | | | 4.94 | % | | | 7.52 | % | | | 7.26 | % |
| | | 1 YEAR | | | 5 YEARS | | | 10 YEARS | | | Since
5/31/2013 | |
| Class I (Inception 5/31/13) | | | (0.66 | )% | | | 2.82 | % | | | n/a | | | | 6.00 | % |
| Class Z (Inception 5/31/13) | | | (0.49 | )% | | | 3.01 | % | | | n/a | | | | 6.22 | % |
| MSCI ACWI Index | | | (4.43 | )% | | | 4.94 | % | | | n/a | | | | 6.88 | % |
The performance data quoted represents past performance, which is not an indication or a guarantee of future results. The Fund’s average annual total returns include changes in share price and reinvestment of dividends and capital gains. Class A returns reflect the maximum initial sales charge and Class C returns reflect the applicable contingent deferred sales charge. Alger Global Focus Fund prior to March 28, 2018, followed different investment strategies and was managed by different portfolio managers and before August 15, 2018 was named “Alger Global Growth Fund.” Prior to May 31, 2013, the Fund was named “Alger China-U.S. Growth Fund” and followed different investment strategies. Performance prior to March 28, 2018, reflects these prior management styles and does not reflect the Fund’s current investment strategies and investment personnel. The chart and table above do not reflect the deduction of taxes that a shareholder would have paid on Fund distributions or on the redemption of Fund shares. Investment return and principal will fluctuate and the Fund’s shares, when redeemed, may be worth more or less than their original cost. Current performance may be higher or lower than the performance quoted. For updated performance, visit us at www.alger.com or call us at (800) 992-3863.
| * | Since inception performance is calculated since the inception of Class A shares. Historical performance prior to March 3, 2008, inception of the class, is that of the Fund's Class A shares, reduced to reflect the current maximum sales charge and the higher operating expenses of Class C shares. |
PORTFOLIO SUMMARY†
April 30, 2020 (Unaudited)
| COUNTRY | | | Alger Global Focus
Fund | |
| Canada | | | 3.9 | % |
| China | | | 5.7 | |
| Denmark | | | 2.2 | |
| France | | | 8.4 | |
| Germany | | | 3.6 | |
| Hong Kong | | | 2.6 | |
| Ireland | | | 2.9 | |
| Italy | | | 5.0 | |
| Japan | | | 6.3 | |
| Netherlands | | | 4.4 | |
| New Zealand | | | 4.5 | |
| South Korea | | | 1.9 | |
| Spain | | | 2.8 | |
| Switzerland | | | 5.2 | |
| United States | | | 38.3 | |
| Cash and Net Other Assets | | | 2.3 | |
| | | | 100.0 | % |
| † | Based on net assets for the Fund. |
ALGER GLOBAL FOCUS FUND
Schedule of Investments April 30, 2020 (Unaudited)
| COMMON STOCKS—97.1% | | SHARES | | | VALUE | |
| CANADA—3.9% | | | | | | | | |
| ASSET MANAGEMENT & CUSTODY BANKS—1.2% | | | | | | | | |
| Brookfield Asset Management, Inc., Cl. A | | | 6,300 | | | $ | 213,066 | |
| | | | | | | | | |
| GOLD—2.7% | | | | | | | | |
| Kirkland Lake Gold Ltd. | | | 12,300 | | | | 509,466 | |
| | | | | | | | | |
| TOTAL CANADA | | | | | | | | |
| (Cost $593,388) | | | | | | | 722,532 | |
| | | | | | | | | |
| CHINA—5.7% | | | | | | | | |
| INTERACTIVE MEDIA & SERVICES—3.3% | | | | | | | | |
| Tencent Holdings Ltd. | | | 11,750 | | | | 617,703 | |
| | | | | | | | | |
| INTERNET & DIRECT MARKETING RETAIL—2.4% | | | | | | | | |
| Alibaba Group Holding Ltd.#,* | | | 2,150 | | | | 435,740 | |
| | | | | | | | | |
| TOTAL CHINA | | | | | | | | |
| (Cost $963,234) | | | | | | | 1,053,443 | |
| | | | | | | | | |
| DENMARK—2.2% | | | | | | | | |
| BIOTECHNOLOGY—2.2% | | | | | | | | |
| Genmab AS* | | | 1,700 | | | | 408,579 | |
| (Cost $344,195) | | | | | | | | |
| | | | | | | | | |
| FRANCE—8.4% | | | | | | | | |
| APPAREL ACCESSORIES & LUXURY GOODS—3.0% | | | | | | | | |
| LVMH Moet Hennessy Louis Vuitton SE | | | 1,430 | | | | 552,752 | |
| | | | | | | | | |
| LIFE SCIENCES TOOLS & SERVICES—3.1% | | | | | | | | |
| Eurofins Scientific SE | | | 1,033 | | | | 571,348 | |
| | | | | | | | | |
| RESEARCH & CONSULTING SERVICES—2.3% | | | | | | | | |
| Teleperformance | | | 1,950 | | | | 436,758 | |
| | | | | | | | | |
| TOTAL FRANCE | | | | | | | | |
| (Cost $1,460,418) | | | | | | | 1,560,858 | |
| | | | | | | | | |
| GERMANY—3.6% | | | | | | | | |
| AUTOMOBILE MANUFACTURERS—1.3% | | | | | | | | |
| Bayerische Motoren Werke AG | | | 4,200 | | | | 247,032 | |
| | | | | | | | | |
| ELECTRICAL COMPONENTS & EQUIPMENT—2.3% | | | | | | | | |
| Varta AG* | | | 5,117 | | | | 423,993 | |
| | | | | | | | | |
| TOTAL GERMANY | | | | | | | | |
| (Cost $798,169) | | | | | | | 671,025 | |
| | | | | | | | | |
| HONG KONG—2.6% | | | | | | | | |
| APPAREL ACCESSORIES & LUXURY GOODS—1.4% | | | | | | | | |
| Samsonite International SA(a) | | | 292,740 | | | | 249,017 | |
| | | | | | | | | |
| INDUSTRIAL MACHINERY—1.2% | | | | | | | | |
| Techtronic Industries Co., Ltd. | | | 30,000 | | | | 227,479 | |
| | | | | | | | | |
| TOTAL HONG KONG | | | | | | | | |
| (Cost $502,829) | | | | | | | 476,496 | |
| | | | | | | | | |
| IRELAND—2.9% | | | | | | | | |
| PACKAGED FOODS & MEATS—2.9% | | | | | | | | |
| Kerry Group PLC, Cl. A | | | 4,700 | | | | 539,183 | |
| (Cost $524,919) | | | | | | | | |
ALGER GLOBAL FOCUS FUND
Schedule of Investments April 30, 2020 (Unaudited) (Continued)
| COMMON STOCKS—97.1% (CONT.) | | SHARES | | | VALUE | |
| ITALY—5.0% | | | | | | | | |
| APPAREL ACCESSORIES & LUXURY GOODS—2.4% | | | | | | | | |
| Moncler SpA | | | 11,953 | | | $ | 449,454 | |
| | | | | | | | | |
| AUTOMOBILE MANUFACTURERS—2.6% | | | | | | | | |
| Ferrari NV | | | 3,100 | | | | 482,422 | |
| | | | | | | | | |
| TOTAL ITALY | | | | | | | | |
| (Cost $936,347) | | | | | | | 931,876 | |
| | | | | | | | | |
| JAPAN—6.3% | | | | | | | | |
| CONSTRUCTION & ENGINEERING—1.8% | | | | | | | | |
| JTOWER, Inc.* | | | 9,700 | | | | 342,320 | |
| | | | | | | | | |
| ELECTRONIC COMPONENTS—2.1% | | | | | | | | |
| Murata Manufacturing Co., Ltd. | | | 6,900 | | | | 388,794 | |
| | | | | | | | | |
| HEALTHCARE SUPPLIES—2.4% | | | | | | | | |
| Hoya Corp. | | | 4,900 | | | | 446,848 | |
| | | | | | | | | |
| TOTAL JAPAN | | | | | | | | |
| (Cost $1,179,921) | | | | | | | 1,177,962 | |
| | | | | | | | | |
| NETHERLANDS—4.4% | | | | | | | | |
| DATA PROCESSING & OUTSOURCED SERVICES—2.2% |
| Adyen NV*,(a) | | | 415 | | | | 409,790 | |
| | | | | | | | | |
| SEMICONDUCTORS—2.2% | | | | | | | | |
| NXP Semiconductors NV | | | 4,050 | | | | 403,258 | |
| | | | | | | | | |
| TOTAL NETHERLANDS | | | | | | | | |
| (Cost $741,253) | | | | | | | 813,048 | |
| | | | | | | | | |
| NEW ZEALAND—4.5% | | | | | | | | |
| APPLICATION SOFTWARE—1.8% | | | | | | | | |
| Xero Ltd.* | | | 6,700 | | | | 342,597 | |
| | | | | | | | | |
| PACKAGED FOODS & MEATS—2.7% | | | | | | | | |
| a2 Milk Co., Ltd.* | | | 41,700 | | | | 491,867 | |
| | | | | | | | | |
| TOTAL NEW ZEALAND | | | | | | | | |
| (Cost $715,446) | | | | | | | 834,464 | |
| | | | | | | | | |
| SOUTH KOREA—1.9% | | | | | | | | |
| TECHNOLOGY HARDWARE STORAGE & PERIPHERALS—1.9% |
| Samsung Electronics Co., Ltd. | | | 8,800 | | | | 362,913 | |
| (Cost $387,029) | | | | | | | | |
| | | | | | | | | |
| SPAIN—2.8% | | | | | | | | |
| BIOTECHNOLOGY—2.8% | | | | | | | | |
| Grifols SA# | | | 25,397 | | | | 515,559 | |
| (Cost $528,861) | | | | | | | | |
| | | | | | | | | |
| SWITZERLAND—5.2% | | | | | | | | |
| ASSET MANAGEMENT & CUSTODY BANKS—2.7% | | | | | | | | |
| Partners Group Holding AG | | | 628 | | | | 494,761 | |
| | | | | | | | | |
| SPECIALTY CHEMICALS—2.5% | | | | | | | | |
| Sika AG | | | 2,800 | | | | 463,026 | |
| | | | | | | | | |
| TOTAL SWITZERLAND | | | | | | | | |
| (Cost $980,256) | | | | | | | 957,787 | |
ALGER GLOBAL FOCUS FUND
Schedule of Investments April 30, 2020 (Unaudited) (Continued)
| COMMON STOCKS—97.1% (CONT.) | | SHARES | | | VALUE | |
| UNITED STATES—37.7% | | | | | | | | |
| APPAREL ACCESSORIES & LUXURY GOODS—2.6% | | | | | | | | |
| Lululemon Athletica, Inc.* | | | 2,150 | | | $ | 480,482 | |
| | | | | | | | | |
| APPLICATION SOFTWARE—8.9% | | | | | | | | |
| Adobe, Inc.* | | | 1,943 | | | | 687,123 | |
| Autodesk, Inc.* | | | 2,325 | | | | 435,077 | |
| Intuit, Inc. | | | 1,900 | | | | 512,639 | |
| Palantir Technologies, Inc., Cl. A*,@,(b) | | | 3,176 | | | | 18,262 | |
| | | | | | | 1,653,101 | |
| FINANCIAL EXCHANGES & DATA—2.5% |
| MSCI, Inc., Cl. A | | | 1,400 | | | | 457,800 | |
| | | | | | | | | |
| HEALTHCARE EQUIPMENT—2.0% | | | | | | | | |
| Insulet Corp.* | | | 1,900 | | | | 379,468 | |
| | | | | | | | | |
| INTERNET & DIRECT MARKETING RETAIL—5.2% | | | | | | | | |
| Amazon.com, Inc.* | | | 390 | | | | 964,860 | |
| | | | | | | | | |
| OIL & GAS EXPLORATION & PRODUCTION—1.8% | | | | | | | | |
| Diamondback Energy, Inc. | | | 7,800 | | | | 339,612 | |
| | | | | | | | | |
| PHARMACEUTICALS—2.1% | | | | | | | | |
| Zoetis, Inc., Cl. A | | | 3,050 | | | | 394,396 | |
| | | | | | | | | |
| RESTAURANTS—2.1% | | | | | | | | |
| Starbucks Corp. | | | 5,041 | | | | 386,795 | |
| | | | | | | | | |
| SEMICONDUCTOR EQUIPMENT—2.8% | | | | | | | | |
| Applied Materials, Inc. | | | 10,400 | | | | 516,672 | |
| | | | | | | | | |
| SEMICONDUCTORS—2.8% | | | | | | | | |
| NVIDIA Corp. | | | 1,800 | | | | 526,104 | |
| | | | | | | | | |
| SYSTEMS SOFTWARE—4.9% | | | | | | | | |
| Microsoft Corp. | | | 5,050 | | | | 905,010 | |
| | | | | | | | | |
| TOTAL UNITED STATES | | | | | | | | |
| (Cost $5,700,625) | | | | | | | 7,004,300 | |
| | | | | | | | | |
| TOTAL COMMON STOCKS | | | | | | | | |
| (Cost $16,356,890) | | | | | | | 18,030,025 | |
| PREFERRED STOCKS—0.6% | | | SHARES | | | | VALUE | |
| UNITED STATES—0.6% | | | | | | | | |
| APPLICATION SOFTWARE—0.4% | | | | | | | | |
| Palantir Technologies, Inc., Cl. B*,@,(b) | | | 12,951 | | | | 74,469 | |
| | | | | | | | | |
| BIOTECHNOLOGY—0.2% | | | | | | | | |
| Prosetta Biosciences, Inc., Series D*,@,(b),(c) | | | 33,858 | | | | 26,748 | |
| | | | | | | | | |
| TOTAL UNITED STATES | | | | | | | | |
| (Cost $237,882) | | | | | | | 101,217 | |
| | | | | | | | | |
| TOTAL PREFERRED STOCKS | | | | | | | | |
| (Cost $237,882) | | | | | | | 101,217 | |
ALGER GLOBAL FOCUS FUND
Schedule of Investments April 30, 2020 (Unaudited) (Continued)
| | | | | | VALUE | |
| Total Investments | | | | | | | | |
| (Cost $16,594,772) | | | 97.7 | % | | $ | 18,131,242 | |
| Affiliated Securities (Cost $152,361) | | | | | | | 26,748 | |
| Unaffiliated Securities (Cost $16,442,411) | | | | | | | 18,104,494 | |
| Other Assets in Excess of Liabilities | | | 2.3 | % | | | 436,085 | |
| NET ASSETS | | | 100.0 | % | | $ | 18,567,327 | |
| # | American Depositary Receipts. |
| (a) | Pursuant to Securities and Exchange Commission Rule 144A, these securities may be sold prior to their maturity only to qualified institutional buyers. These securities represent 3.6% of the net assets of the Fund. |
| (b) | Security is valued in good faith at fair value determined using significant unobservable inputs pursuant to procedures established by the Board. |
| (c) | Deemed an affiliate of the Fund in accordance with Section 2(a)(3) of the Investment Company Act of 1940. See Note 11 - Affiliated Securities. |
| * | Non-income producing security. |
| @ | Restricted security - Investment in security not registered under the Securities Act of 1933. Sales or transfers of the investment may be restricted only to qualified buyers. |
| | | | | | | % of net assets | | | | | % of net assets | |
| | | Acquisition | | Acquisition | | (Acquisition | | | Market | | as of | |
| Security | | Date(s) | | Cost | | Date) | | | Value | | 4/30/2020 | |
| Palantir Technologies, Inc., Cl. A | | 10/7/14 | | $ | 20,666 | | 0.05 | % | | $ | 18,262 | | 0.09 | % |
| Palantir Technologies, Inc., Cl. B | | 10/7/14 | | | 85,521 | | 0.22 | % | | | 74,469 | | 0.40 | % |
| Prosetta Biosciences, Inc., Series D | | 2/6/15 | | | 152,361 | | 0.40 | % | | | 26,748 | | 0.15 | % |
| Total | | | | | | | | | | $ | 119,479 | | 0.64 | % |
See Notes to Financial Statements.
ALGER GLOBAL FOCUS FUND
Statement of Assets and Liabilities April 30, 2020 (Unaudited)
| | | | Alger Global Focus
Fund | |
| ASSETS: | | | | |
| Investments in unaffiliated securities, at value (Identified cost below)* see accompanying schedule of investments | | $ | 18,104,494 | |
| Investments in affiliated securities, at value (Identified cost below)** see accompanying schedule of investments | | | 26,748 | |
| Cash and cash equivalents | | | 467,642 | |
| Foreign cash † | | | 453 | |
| Receivable for investment securities sold | | | 210,257 | |
| Receivable for shares of beneficial interest sold | | | 15 | |
| Dividends and interest receivable | | | 31,155 | |
| Receivable from Investment Manager | | | 15,675 | |
| Prepaid expenses | | | 74,549 | |
| Total Assets | | | 18,930,988 | |
| LIABILITIES: | | | | |
| Payable for investment securities purchased | | | 255,550 | |
| Accrued printing fees | | | 26,686 | |
| Accrued audit fees | | | 24,003 | |
| Accrued investment advisory fees | | | 11,581 | |
| Accrued transfer agent fees | | | 10,217 | |
| Accrued distribution fees | | | 4,298 | |
| Accrued administrative fees | | | 398 | |
| Accrued shareholder administrative fees | | | 224 | |
| Accrued trustee fees | | | 57 | |
| Accrued other expenses | | | 30,647 | |
| Total Liabilities | | | 363,661 | |
| NET ASSETS | | $ | 18,567,327 | |
| NET ASSETS CONSIST OF: | | | | |
| Paid in capital (par value of $.001 per share) | | | 18,651,042 | |
| Distributions in excess of earnings | | | (83,715 | ) |
| NET ASSETS | | $ | 18,567,327 | |
| * Identified cost | | $ | 16,442,411 | (a) |
| ** Identified cost | | $ | 152,361 | (a) |
| † Cost of foreign cash | | $ | 448 | |
See Notes to Financial Statements.
ALGER GLOBAL FOCUS FUND
Statement of Assets and Liabilities April 30, 2020 (Unaudited) (Continued)
| | | | Alger Global Focus
Fund | |
| NET ASSETS BY CLASS: | | | | |
| Class A | | $ | 13,685,661 | |
| Class C | | $ | 1,968,024 | |
| Class I | | $ | 419,365 | |
| Class Z | | $ | 2,494,277 | |
| | | | | |
| SHARES OF BENEFICIAL INTEREST OUTSTANDING — NOTE 6: | | | | |
| Class A | | | 654,349 | |
| Class C | | | 100,113 | |
| Class I | | | 20,710 | |
| Class Z | | | 117,001 | |
| | | | | |
| NET ASSET VALUE PER SHARE: | | | | |
| Class A — Net Asset Value Per Share Class A | | $ | 20.91 | |
| Class A — Offering Price Per Share (includes a 5.25% sales charge) | | $ | 22.07 | |
| Class C — Net Asset Value Per Share Class C | | $ | 19.66 | |
| Class I — Net Asset Value Per Share Class I | | $ | 20.25 | |
| Class Z — Net Asset Value Per Share Class Z | | $ | 21.32 | |
See Notes to Financial Statements.
| (a) | At April 30, 2020, the net unrealized depreciation on investments, based on cost for federal income tax purposes of $16,808,780, amounted to $1,322,462 which consisted of aggregate gross unrealized appreciation of $2,169,737 and aggregate gross unrealized depreciation of $847,275. |
ALGER GLOBAL FOCUS FUND
Statement of Operations for the six months ended April 30, 2020 (Unaudited)
| | | Alger Global Focus
Fund |
| INCOME: | | | | |
| Dividends (net of foreign withholding taxes*) | | $ | 76,943 | |
| Interest | | | 1,887 | |
| Total Income | | | 78,830 | |
| EXPENSES: | | | | |
| Investment advisory fees — Note 3(a) | | | 79,126 | |
| Distribution fees — Note 3(c) | | | | |
| Class A | | | 18,255 | |
| Class C | | | 10,575 | |
| Class I | | | 586 | |
| Shareholder administrative fees — Note 3(f) | | | 1,533 | |
| Administration fees — Note 3(b) | | | 2,720 | |
| Custodian fees | | | 29,527 | |
| Transfer agent fees — Note 3(f) | | | 6,212 | |
| Printing fees | | | 1,435 | |
| Professional fees | | | 24,130 | |
| Registration fees | | | 33,306 | |
| Trustee fees — Note 3(g) | | | 354 | |
| Other expenses | | | 16,579 | |
| Total Expenses | | | 224,338 | |
| Less, expense reimbursements/waivers — Note 3(a) | | | (75,488 | ) |
| Net Expenses | | | 148,850 | |
| NET INVESTMENT LOSS | | | (70,020 | ) |
| REALIZED AND UNREALIZED GAIN (LOSS) ON INVESTMENTS AND FOREIGN CURRENCY: |
| Net realized (loss) on unaffiliated investments | | | (49,491 | ) |
| Net realized (loss) on foreign currency transactions | | | (9,659 | ) |
| Net change in unrealized appreciation on unaffiliated investments | | | 248,992 | |
| Net change in unrealized (depreciation) on affiliated investments | | | (9,141 | ) |
| Net change in unrealized appreciation on foreign currency | | | 221 | |
| Net realized and unrealized gain on investments and foreign currency | | | 180,922 | |
| NET INCREASE IN NET ASSETS RESULTING FROM OPERATIONS | | $ | 110,902 | |
| * Foreign withholding taxes | | $ | 8,369 | |
See Notes to Financial Statements.
ALGER GLOBAL FOCUS FUND
Statements of Changes in Net Assets (Unaudited)
| | | Alger Global Focus Fund | |
| | | For the
Six Months Ended
April 30, 2020 | | | For the
Year Ended
October 31, 2019 | |
| Net investment loss | | $ | (70,020 | ) | | $ | (132,586 | ) |
| Net realized loss on investments, forward foreign currency contracts and foreign currency | | | (59,150 | ) | | | (639,717 | ) |
| Net change in unrealized appreciation on investments and foreign currency | | | 240,072 | | | | 2,195,875 | |
| Net increase in net assets resulting from operations | | | 110,902 | | | | 1,423,572 | |
| | | | | | | | | |
| Dividends and distributions to shareholders: | | | | | | | | |
| Class A | | | (431,711 | ) | | | (1,231,732 | ) |
| Class C | | | (49,694 | ) | | | (218,988 | ) |
| Class I | | | (16,795 | ) | | | (62,552 | ) |
| Class Z | | | (96,643 | ) | | | (376,514 | ) |
| Total dividends and distributions to shareholders | | | (594,843 | ) | | | (1,889,786 | ) |
| | | | | | | | | |
| Decrease from shares of beneficial interest transactions: | | | | | | | | |
| Class A | | | (921,116 | ) | | | (455,650 | ) |
| Class C | | | (232,406 | ) | | | (529,659 | ) |
| Class I | | | (30,207 | ) | | | (234,158 | ) |
| Class Z | | | (156,954 | ) | | | (2,017,044 | ) |
| Net decrease from shares of beneficial interest transactions — Note 6 | | | (1,340,683 | ) | | | (3,236,511 | ) |
| Total decrease | | | (1,824,624 | ) | | | (3,702,725 | ) |
| | | | | | | | | |
| Net Assets: | | | | | | | | |
| Beginning of period | | | 20,391,951 | | | | 24,094,676 | |
| END OF PERIOD | | $ | 18,567,327 | | | $ | 20,391,951 | |
See Notes to Financial Statements.
ALGER GLOBAL FOCUS FUND
Financial Highlights for a share outstanding throughout the period (Unaudited)
| | | Class A | |
| Alger Global Focus Fund | | Six months
ended
4/30/2020(i) | | | Year ended
10/31/2019 | | | Year ended
10/31/2018 | | | Year ended
10/31/2017 | | | Year ended
10/31/2016 | | | Year ended
10/31/2015 | |
| Net asset value, beginning of period | | $ | 21.37 | | | $ | 21.88 | | | $ | 24.76 | | | $ | 20.20 | | | $ | 20.65 | | | $ | 20.79 | |
| INCOME FROM INVESTMENT OPERATIONS: | | | | | | | | | | | | | | | | | | | | | | | | |
| Net investment income (loss)(ii) | | | (0.07 | ) | | | (0.12 | ) | | | (0.04 | ) | | | 0.03 | | | | 0.10 | | | | (0.01 | ) |
| Net realized and unrealized gain (loss) on investments | | | 0.23 | | | | 1.36 | | | | (1.86 | ) | | | 4.74 | | | | (0.55 | ) | | | (0.13 | ) |
| Total from investment operations | | | 0.16 | | | | 1.24 | | | | (1.90 | ) | | | 4.77 | | | | (0.45 | ) | | | (0.14 | ) |
| Dividends from net investment income | | | (0.62 | ) | | | (0.14 | ) | | | (0.98 | ) | | | (0.21 | ) | | | – | | | | – | |
| Distributions from net realized gains | | | – | | | | (1.61 | ) | | | – | | | | – | | | | – | | | | – | |
| Net asset value, end of period | | $ | 20.91 | | | $ | 21.37 | | | $ | 21.88 | | | $ | 24.76 | | | $ | 20.20 | | | $ | 20.65 | |
| Total return(iii) | | | 0.59 | % | | | 6.84 | % | | | (8.03 | )% | | | 23.80 | % | | | (2.18 | )% | | | (0.67 | )% |
| RATIOS/SUPPLEMENTAL DATA: | | | | | | | | | | | | | | | | | | | | | | | | |
| Net assets, end of period (000's omitted) | | $ | 13,686 | | | $ | 14,967 | | | $ | 15,679 | | | $ | 19,962 | | | $ | 19,805 | | | $ | 24,269 | |
| Ratio of gross expenses to average net assets | | | 2.22 | % | | | 2.50 | % | | | 2.19 | % | | | 2.48 | % | | | 2.37 | % | | | 2.03 | % |
| Ratio of expense reimbursements to average net assets | | | (0.72 | )% | | | (1.08 | )% | | | (0.69 | )% | | | (0.98 | )% | | | (0.87 | )% | | | (0.53 | )% |
| Ratio of net expenses to average net assets | | | 1.50 | % | | | 1.42 | % | | | 1.50 | % | | | 1.50 | % | | | 1.50 | % | | | 1.50 | % |
| Ratio of net investment income (loss) to average net assets | | | (0.70 | )% | | | (0.60 | )% | | | (0.18 | )% | | | 0.14 | % | | | 0.52 | % | | | (0.07 | )% |
| Portfolio turnover rate | | | 70.46 | % | | | 224.06 | % | | | 217.51 | % | | | 134.76 | % | | | 138.05 | % | | | 143.87 | % |
See Notes to Financial Statements.
| (i) | Ratios have been annualized; total return and portfolio turnover rate have not been annualized. |
| (ii) | Amount was computed based on average shares outstanding during the period. |
| (iii) | Does not reflect the effect of sales charges, if applicable. |
ALGER GLOBAL FOCUS FUND
Financial Highlights for a share outstanding throughout the period (Unaudited)
| | Class C | |
| Alger Global Focus Fund | | Six months
ended
4/30/2020(i) | | | Year ended
10/31/2019 | | | Year ended
10/31/2018 | | | Year ended
10/31/2017 | | | Year ended
10/31/2016 | | | Year ended
10/31/2015 | |
| Net asset value, beginning of period | | $ | 20.05 | | | $ | 20.65 | | | $ | 23.41 | | | $ | 19.11 | | | $ | 19.69 | | | $ | 19.97 | |
| INCOME FROM INVESTMENT OPERATIONS: | | | | | | | | | | | | | | | | | | | | | | | | |
| Net investment loss(ii) | | | (0.14 | ) | | | (0.26 | ) | | | (0.22 | ) | | | (0.12 | ) | | | (0.04 | ) | | | (0.17 | ) |
| Net realized and unrealized gain (loss) on investments | | | 0.22 | | | | 1.27 | | | | (1.74 | ) | | | 4.48 | | | | (0.54 | ) | | | (0.11 | ) |
| Total from investment operations | | | 0.08 | | | | 1.01 | | | | (1.96 | ) | | | 4.36 | | | | (0.58 | ) | | | (0.28 | ) |
| Dividends from net investment income | | | (0.47 | ) | | | – | | | | (0.80 | ) | | | (0.06 | ) | | | – | | | | – | |
| Distributions from net realized gains | | | – | | | | (1.61 | ) | | | – | | | | – | | | | – | | | | – | |
| Net asset value, end of period | | $ | 19.66 | | | $ | 20.05 | | | $ | 20.65 | | | $ | 23.41 | | | $ | 19.11 | | | $ | 19.69 | |
| Total return(iii) | | | 0.24 | % | | | 6.00 | % | | | (8.70 | )% | | | 22.88 | % | | | (2.95 | )% | | | (1.40 | )% |
| RATIOS/SUPPLEMENTAL DATA: | | | | | | | | | | | | | | | | | | | | | | | | |
| Net assets, end of period (000's omitted) | | $ | 1,968 | | | $ | 2,241 | | | $ | 2,844 | | | $ | 3,673 | | | $ | 4,720 | | | $ | 4,730 | |
| Ratio of gross expenses to average net assets | | | 3.00 | % | | | 3.30 | % | | | 2.94 | % | | | 3.24 | % | | | 3.13 | % | | | 2.80 | % |
| Ratio of expense reimbursements to average net assets | | | (0.75 | )% | | | (1.13 | )% | | | (0.69 | )% | | | (0.99 | )% | | | (0.88 | )% | | | (0.55 | )% |
| Ratio of net expenses to average net assets | | | 2.25 | % | | | 2.17 | % | | | 2.25 | % | | | 2.25 | % | | | 2.25 | % | | | 2.25 | % |
| Ratio of net investment loss to average net assets | | | (1.45 | )% | | | (1.35 | )% | | | (0.94 | )% | | | (0.59 | )% | | | (0.23 | )% | | | (0.82 | )% |
| Portfolio turnover rate | | | 70.46 | % | | | 224.06 | % | | | 217.51 | % | | | 134.76 | % | | | 138.05 | % | | | 143.87 | % |
See Notes to Financial Statements.
| (i) | Ratios have been annualized; total return and portfolio turnover rate have not been annualized. |
| (ii) | Amount was computed based on average shares outstanding during the period. |
| (iii) | Does not reflect the effect of sales charges, if applicable. |
ALGER GLOBAL FOCUS FUND
Financial Highlights for a share outstanding throughout the period (Unaudited)
| | Class I | |
| Alger Global Focus Fund | | Six months
ended
4/30/2020(i) | | | Year ended
10/31/2019 | | | Year ended
10/31/2018 | | | Year ended
10/31/2017 | | | Year ended
10/31/2016 | | | Year ended
10/31/2015 | |
| Net asset value, beginning of period | | $ | 20.79 | | | $ | 21.27 | | | $ | 24.05 | | | $ | 20.36 | | | $ | 20.78 | | | $ | 20.87 | |
| INCOME FROM INVESTMENT OPERATIONS: | | | | | | | | | | | | | | | | | | | | | | | | |
| Net investment income (loss)(ii) | | | (0.04 | ) | | | (0.06 | ) | | | (0.01 | ) | | | 0.08 | | | | 0.17 | | | | 0.04 | |
| Net realized and unrealized gain (loss) on investments | | | 0.24 | | | | 1.32 | | | | (1.77 | ) | | | 4.64 | | | | (0.59 | ) | | | (0.13 | ) |
| Total from investment operations | | | 0.20 | | | | 1.26 | | | | (1.78 | ) | | | 4.72 | | | | (0.42 | ) | | | (0.09 | ) |
| Dividends from net investment income | | | (0.74 | ) | | | (0.13 | ) | | | (1.00 | ) | | | (1.03 | ) | | | – | | | | – | |
| Distributions from net realized gains | | | – | | | | (1.61 | ) | | | – | | | | – | | | | – | | | | – | |
| Net asset value, end of period | | $ | 20.25 | | | $ | 20.79 | | | $ | 21.27 | | | $ | 24.05 | | | $ | 20.36 | | | $ | 20.78 | |
| Total return(iii) | | | 0.77 | % | | | 7.18 | % | | | (7.77 | )% | | | 24.15 | % | | | (2.02 | )% | | | (0.43 | )% |
| RATIOS/SUPPLEMENTAL DATA: | | | | | | | | | | | | | | | | | | | | | | | | |
| Net assets, end of period (000's omitted) | | $ | 419 | | | $ | 466 | | | $ | 714 | | | $ | 286 | | | $ | 384 | | | $ | 1,914 | |
| Ratio of gross expenses to average net assets | | | 2.25 | % | | | 2.63 | % | | | 2.19 | % | | | 2.63 | % | | | 2.33 | % | | | 2.02 | % |
| Ratio of expense reimbursements to average net assets | | | (1.10 | )% | | | (1.51 | )% | | | (0.94 | )% | | | (1.38 | )% | | | (1.08 | )% | | | (0.77 | )% |
| Ratio of net expenses to average net assets | | | 1.15 | % | | | 1.12 | % | | | 1.25 | % | | | 1.25 | % | | | 1.25 | % | | | 1.25 | % |
| Ratio of net investment income (loss) to average net assets | | | (0.36 | )% | | | (0.28 | )% | | | (0.04 | )% | | | 0.37 | % | | | 0.86 | % | | | 0.17 | % |
| Portfolio turnover rate | | | 70.46 | % | | | 224.06 | % | | | 217.51 | % | | | 134.76 | % | | | 138.05 | % | | | 143.87 | % |
See Notes to Financial Statements.
| (i) | Ratios have been annualized; total return and portfolio turnover rate have not been annualized. |
| (ii) | Amount was computed based on average shares outstanding during the period. |
| (iii) | Does not reflect the effect of sales charges, if applicable. |
ALGER GLOBAL FOCUS FUND
Financial Highlights for a share outstanding throughout the period (Unaudited)
| | Class Z | |
| Alger Global Focus Fund | | Six months
ended
4/30/2020(i) | | | Year ended
10/31/2019 | | | Year ended
10/31/2018 | | | Year ended
10/31/2017 | | | Year ended
10/31/2016 | | | Year ended
10/31/2015 | |
| Net asset value, beginning of period | | $ | 21.89 | | | $ | 22.37 | | | $ | 25.26 | | | $ | 20.55 | | | $ | 20.92 | | | $ | 20.95 | |
| INCOME FROM INVESTMENT OPERATIONS: | | | | | | | | | | | | | | | | | | | | | | | | |
| Net investment income (loss)(ii) | | | (0.02 | ) | | | (0.03 | ) | | | 0.05 | | | | 0.12 | | | | 0.19 | | | | 0.09 | |
| Net realized and unrealized gain (loss) on investments | | | 0.26 | | | | 1.39 | | | | (1.90 | ) | | | 4.83 | | | | (0.56 | ) | | | (0.12 | ) |
| Total from investment operations | | | 0.24 | | | | 1.36 | | | | (1.85 | ) | | | 4.95 | | | | (0.37 | ) | | | (0.03 | ) |
| Dividends from net investment income | | | (0.81 | ) | | | (0.23 | ) | | | (1.04 | ) | | | (0.24 | ) | | | – | | | | – | |
| Distributions from net realized gains | | | – | | | | (1.61 | ) | | | – | | | | – | | | | – | | | | – | |
| Net asset value, end of period | | $ | 21.32 | | | $ | 21.89 | | | $ | 22.37 | | | $ | 25.26 | | | $ | 20.55 | | | $ | 20.92 | |
| Total return(iii) | | | 0.88 | % | | | 7.33 | % | | | (7.67 | )% | | | 24.33 | % | | | 1.77 | % | | | (0.14 | )% |
| RATIOS/SUPPLEMENTAL DATA: | | | | | | | | | | | | | | | | | | | | | | | | |
| Net assets, end of period (000's omitted) | | $ | 2,494 | | | $ | 2,718 | | | $ | 4,857 | | | $ | 4,946 | | | $ | 3,563 | | | $ | 2,243 | |
| Ratio of gross expenses to average net assets | | | 1.91 | % | | | 2.35 | % | | | 2.01 | % | | | 2.35 | % | | | 2.36 | % | | | 2.20 | % |
| Ratio of expense reimbursements to average net assets | | | (0.92 | )% | | | (1.38 | )% | | | (0.92 | )% | | | (1.26 | )% | | | (1.31 | )% | | | (1.21 | )% |
| Ratio of net expenses to average net assets | | | 0.99 | % | | | 0.97 | % | | | 1.09 | % | | | 1.09 | % | | | 1.05 | % | | | 0.99 | % |
| Ratio of net investment income (loss) to average net assets | | | (0.19 | )% | | | (0.12 | )% | | | 0.21 | % | | | 0.53 | % | | | 0.92 | % | | | 0.44 | % |
| Portfolio turnover rate | | | 70.46 | % | | | 224.06 | % | | | 217.51 | % | | | 134.76 | % | | | 138.05 | % | | | 143.87 | % |
See Notes to Financial Statements.
| (i) | Ratios have been annualized; total return and portfolio turnover rate have not been annualized. |
| (ii) | Amount was computed based on average shares outstanding during the period. |
| (iii) | Does not reflect the effect of sales charges, if applicable. |
ALGER GLOBAL FOCUS FUND
NOTES TO FINANCIAL STATEMENTS (Unaudited)
NOTE 1 — General:
Alger Global Focus Fund (the “Fund”) is an open-end registered investment company organized as a business trust under the laws of the Commonwealth of Massachusetts. The Fund qualifies as an investment company as defined in Financial Accounting Standards Board (“FASB”) Accounting Standards Codification 946-Financial Services – Investment Companies. The Fund’s investment objective is long-term capital appreciation. It seeks to achieve its objective by investing in equity securities in the United States and foreign countries. The Fund’s foreign investments will include securities of companies in both developed and emerging market countries. The Fund offers Class A, C, I and Z shares. Class A shares are generally subject to an initial sales charge while Class C shares are generally subject to a deferred sales charge. Class C shares will automatically convert to Class A shares on the fifth business day of the month following the tenth anniversary of the purchase date of a shareholder’s Class C shares, without the imposition of any sales load, fee or other charge. Class C shares held at certain dealers may not convert to Class A shares or may be converted on a different schedule. At conversion, a proportionate amount of shares representing reinvested dividends and distributions will also be converted into Class A shares. Effective August 27, 2109, Class C shares were closed to direct shareholders and are only available for purchase through certain financial intermediaries and group retirement plan recordkeeping platforms. Class I and Z shares are sold to institutional investors without an initial or deferred sales charge. Each class has identical rights to assets and earnings except that each share class bears the pro rata allocation of the Fund’s expenses other than a class expense (not including advisory or custodial fees or other expenses related to the management of the Fund’s assets).
NOTE 2 — Significant Accounting Policies:
(a) Investment Valuation:The Fund values its financial instruments at fair value using independent dealers or pricing services under policies approved by the Fund’s Board of Trustees (the “Board”). Investments held by the Fund are valued on each day the New York Stock Exchange (the “NYSE”) is open, as of the close of the NYSE (normally 4:00 p.m. Eastern Standard Time).
Investments in money market funds and short-term securities held by the Fund having a remaining maturity of sixty days or less are valued at amortized cost which approximates market value.
Equity securities, including traded rights, warrants and option contracts for which valuation information is readily available are valued at the last quoted sales price or official closing price on the primary market or exchange on which they are traded as reported by an independent pricing service. In the absence of quoted sales, such securities are valued at the bid price or, in the absence of a recent bid price, the equivalent as obtained from one or more of the major market makers for the securities to be valued.
ALGER GLOBAL FOCUS FUND
NOTES TO FINANCIAL STATEMENTS (Unaudited) (Continued)
Debt securities generally trade in the over-the-counter market. Debt securities with remaining maturities of more than sixty days at the time of acquisition are valued on the basis of the last available bid prices or current market quotations provided by dealers or pricing services. In determining the value of a particular investment, pricing services may use certain information with respect to transactions in such investments, quotations from dealers, pricing matrixes, market transactions in comparable investments, various relationships observed in the market between investments and calculated yield measures based on valuation technology commonly employed in the market for such investments. Asset-backed and mortgage-backed securities are valued by independent pricing services using models that consider estimated cash flows of each tranche of the security, establish a benchmark yield and develop an estimated tranche-specific spread to the benchmark yield based on the unique attributes of the tranche. Debt securities with a remaining maturity of sixty days or less are valued at amortized cost which approximates market value.
Securities for which market quotations are not readily available are valued at fair value, as determined in good faith pursuant to procedures established by the Board and described further herein.
Securities in which the Fund invests may be traded in foreign markets that close before the close of the NYSE. Developments that occur between the close of the foreign markets and the close of the NYSE may result in adjustments to the closing foreign prices to reflect what the Fund’s investment adviser, pursuant to policies established by the Board, believes to be the fair value of these securities as of the close of the NYSE. The Fund may also fair value securities in other situations, for example, when a particular foreign market is closed but the Fund is open.
FASB Accounting Standards Codification 820 – Fair Value Measurements and Disclosures (“ASC 820”) defines fair value as the price that the Fund would receive upon selling an investment in a timely transaction to an independent buyer in the principal or most advantageous market of the investment. ASC 820 established a three-tier hierarchy to maximize the use of observable market data and minimize the use of unobservable inputs and to establish classification of fair value measurements for disclosure purposes. Inputs refer broadly to the assumptions that market participants would use in pricing the asset or liability and may be observable or unobservable. Observable inputs are based on market data obtained from sources independent of the Fund. Unobservable inputs are inputs that reflect the Fund’s own assumptions based on the best information available in the circumstances. The three-tier hierarchy of inputs is summarized in the three broad Levels listed below.
| • | Level 1 – quoted prices in active markets for identical investments |
| • | Level 2 – significant other observable inputs (including quoted prices for similar investments, interest rates, prepayment speeds, credit risk, etc.) |
| • | Level 3 – significant unobservable inputs (including the Fund’s own assumptions in determining the fair value of investments) |
ALGER GLOBAL FOCUS FUND
NOTES TO FINANCIAL STATEMENTS (Unaudited) (Continued)
The Fund’s valuation techniques are generally consistent with either the market or the income approach to fair value. The market approach considers prices and other relevant information generated by market transactions involving identical or comparable assets to measure fair value. The income approach converts future amounts to a current, or discounted, single amount. These fair value measurements are determined on the basis of the value indicated by current market expectations about such future events. Inputs for Level 1 include exchange-listed prices and broker quotes in an active market. Inputs for Level 2 include the last trade price in the case of a halted security, an exchange-listed price which has been adjusted for fair value factors, and prices of closely related securities. Additional Level 2 inputs include an evaluated price which is based upon a compilation of observable market information such as spreads for fixed income and preferred securities. Inputs for Level 3 include, but are not limited to, revenue multiples, earnings before interest, taxes, depreciation and amortization (“EBITDA”) multiples, discount rates, time to exit and the probabilities of success of certain outcomes. Such unobservable market information may be obtained from a company’s financial statements and from industry studies, market data, and market indicators such as benchmarks and indexes. Because of the inherent uncertainty and often limited markets for restricted securities, the values may significantly differ from values if there was an active market.
Valuation processes are determined by a Valuation Committee (“Committee”) authorized by the Board and comprised of representatives of the Fund’s investment adviser and officers of the Fund. The Committee reports its fair valuation determinations and related valuation information to the Board. The Board is responsible for approving valuation policy and procedures.
While the Committee meets on an as-needed basis, the Committee generally meets quarterly to review and evaluate the effectiveness of the procedures for making fair value determinations. The Committee considers, among other things, the results of quarterly back testing of the fair value model for foreign securities, pricing comparisons between primary and secondary price sources, the outcome of price challenges put to the Fund’s pricing vendor, and variances between transactional prices and the previous day’s price.
(b) Cash and Cash Equivalents:Cash and cash equivalents include U.S. dollars, foreign cash and overnight time deposits.
(c) Securities Transactions and Investment Income:Securities transactions are recorded on a trade date basis. Realized gains and losses from securities transactions are recorded on the identified cost basis. Dividend income is recognized on the ex-dividend date and interest income is recognized on the accrual basis.
Premiums and discounts on debt securities purchased are amortized or accreted over the lives of the respective securities.
(d) Foreign Currency Transactions: The books and records of the Fund are maintained in U.S. dollars. Foreign currencies, investments and other assets and liabilities are translated into U.S. dollars at the prevailing rates of exchange on the valuation date. Purchases and sales of investment securities and income and expenses are translated into U.S. dollars at the prevailing exchange rates on the respective dates of such transactions.
Net realized gains and losses on foreign currency transactions represent net gains and losses from the disposition of foreign currencies, currency gains and losses realized between the trade dates and settlement dates of security transactions, and the difference between the amount of net investment income accrued and the U.S. dollar amount actually received. The effects of changes in foreign currency exchange rates on investments in securities are included in realized and unrealized gain or loss on investments in the accompanying Statement of Operations.
ALGER GLOBAL FOCUS FUND
NOTES TO FINANCIAL STATEMENTS (Unaudited) (Continued)
(e) Forward Foreign Exchange Contracts: The Fund may enter into forward foreign currency contracts to hedge against foreign currency exchange rate risk on its non-U.S. dollar denominated securities or to facilitate settlement of foreign currency denominated portfolio transactions. A forward foreign currency contract is an agreement between two parties to buy and sell a currency at a set price on a future date. The contract is marked-to-market daily and the change in value is recorded by the Fund as an unrealized gain or loss. Realized gains or losses equal to the difference between the value of the contract at the time it was opened and the value at the time it was closed are recorded upon delivery or receipt of the currency.
These contracts may involve market risk in excess of the unrealized gain or loss reflected on the Statement of Assets and Liabilities. In addition, the Fund could be exposed to risk if the counterparties are unable to meet the terms of the contracts or if the value of the currency changes unfavorably to the base currency.
(f) Dividends to Shareholders: Dividends and distributions payable to shareholders are recorded on the ex-dividend date. The Fund declares and pays dividends from net investment income, if available, annually. Dividends from net realized gains, offset by any loss carryforward, are declared and paid annually after the end of the fiscal year in which earned.
Each class is treated separately in determining the amounts of dividends from net investment income payable to holders of its shares.
The characterization of distributions to shareholders for financial reporting purposes is determined in accordance with federal income tax rules. Therefore, the source of the Fund’s distributions may be shown in the accompanying financial statements as either from, or in excess of, net investment income, net realized gain on investment transactions, or return of capital, depending on the type of book/tax differences that may exist. Capital accounts within the financial statements are adjusted for permanent book/tax differences. Reclassifications result primarily from the differences in tax treatment of net operating losses, passive foreign investment companies, and foreign currency transactions. The reclassifications are done annually at fiscal year-end and have no impact on the net asset value of the Fund and are designed to present the Fund’s capital accounts on a tax basis.
(g) Federal Income Taxes: It is the Fund’s policy to comply with the requirements of the Internal Revenue Code Subchapter M applicable to regulated investment companies and to distribute all of its taxable income to its shareholders. Provided that the Fund maintains such compliance, no federal income tax provision is required.
Financial Accounting Standards Board Accounting Standards Codification 740 – Income Taxes (“ASC 740”) requires the Fund to measure and recognize in its financial statements the benefit of a tax position taken (or expected to be taken) on an income tax return if such position will more likely than not be sustained upon examination based on the technical merits of the position. No tax years are currently under investigation. The Fund files income tax returns in the U.S., as well as New York State and New York City. The statute of limitations on the Fund’s tax returns remains open for the tax years 2016-2019. Management does not believe there are any uncertain tax positions that require recognition of a tax liability.
ALGER GLOBAL FOCUS FUND
NOTES TO FINANCIAL STATEMENTS (Unaudited) (Continued)
(h) Allocation Methods: Income, realized and unrealized gains and losses, and expenses of the Fund are allocated among the Fund’s classes based on relative net assets, with the exception of distribution fees, transfer agency fees, and shareholder servicing and related fees.
(i) Estimates:These financial statements have been prepared in accordance with accounting principles generally accepted in the United States of America, which require using estimates and assumptions that affect the reported amounts therein. These unaudited interim financial statements reflect all adjustments which are, in the opinion of management, necessary to present a fair statement of results for the interim period. Actual results may differ from those estimates. All such estimates are of a normal recurring nature.
(j) Recent Accounting Pronouncements: In August 2018, the Financial Accounting Standards Board (“FASB”) issued Accounting Standards Update 2018-13 “Disclosure Framework - Changes to the Disclosure Requirements for Fair Value Measurement” (“ASU 2018-13”) which modifies disclosure requirements for fair value measurements, principally for Level 3 securities and transfers between levels of the fair value hierarchy. ASU 2018-13 is effective for fiscal years beginning after December 15, 2019 and for interim periods within those fiscal years. This standard was adopted by the Fund, resulting in new disclosures for the total gain or loss attributable to fair value changes in level 3 securities, and the elimination of the disclosure of the reasons for and amounts of transfers between Level 1 and Level 2, and the Fund’s valuation processes.
NOTE 3 — Investment Advisory Fees and Other Transactions with Affiliates:
(a) Investment Advisory Fees:Fees incurred by the Fund, pursuant to the provisions of the Fund’s Investment Advisory Agreement with Fred Alger Management, LLC (“Alger Management” or the “Investment Manager”), are payable monthly and computed based on the following rates. The actual rate paid as a percentage of average daily net assets, for the six months ended April 30, 2020, is set forth below under the heading “Actual Rate”:
| | | Tier 1 | | | Tier 2 | | | Actual Rate | |
| Alger Global Focus Fund(a) | | | 0.80 | % | | | 0.70 | % | | | 0.80 | % |
(a)Tier 1 rate is paid on assets up to $500 million, Tier 2 rate is paid on assets in excess of $500 million.
Alger Management has agreed to limit the expenses of the share classes, through February 28, 2021, whereby it reimburses the share classes if annualized operating expenses (excluding acquired fund fees and expenses, interest, taxes, dividend expenses on short sales, borrowing costs, brokerage and extraordinary expenses) exceed the rates, based on average daily net assets, listed below.
ALGER GLOBAL FOCUS FUND
NOTES TO FINANCIAL STATEMENTS (Unaudited) (Continued)
| | | CLASS | | | FEES WAIVED /
REIMBURSED FOR
THE SIX MONTHS
ENDED | |
| | | A | | | C | | | I | | | Z | | | APRIL 30, 2020 | |
| Alger Global Focus Fund | | | 1.50 | % | | | 2.25 | % | | | 1.15 | % | | | 0.99 | % | | $ | 75,488 | |
Alger Management may, during the first year of the two-year term of the expense limitation contract, recoup any fees waived or expenses reimbursed pursuant to the expense limitation contract to the extent that such recoupment would not cause the expense ratio to exceed the lesser of the stated limitation in effect at the time of (i) the waiver or reimbursement and (ii) the recoupment after the repayment of the recoupment is taken into account. For the period ended February 28, 2020, when the recoupment provision ended, there were no recoupments made by the Fund to the Investment Manager.
(b) Administration Fees: Fees incurred by the Fund, pursuant to the provisions of the Fund’s Administration Agreement with Alger Management, are payable monthly and computed based on the average daily net assets of the Fund at the annual rate of 0.0275%.
(c) Distribution/Shareholder Servicing Fees: The Fund has adopted a distribution plan pursuant to which the Fund pays Fred Alger & Company, LLC, the Fund’s distributor and an affiliate of the Investment Manager (“Alger LLC”), a fee at the annual rate of 0.25% of the average daily net assets of the Class A and Class I shares and 1.00% of the average daily net assets of the Class C shares to compensate Alger LLC for its activities and expenses incurred in distributing the Fund’s shares and/or shareholder servicing. Fees paid may be more or less than the expenses incurred by Alger LLC.
(d) Sales Charges: Purchases and sales of shares of the Fund may be subject to initial sales charges or contingent deferred sales charges. For the six months ended April 30, 2020, there were no initial sales charges imposed. For the six months ended April 30, 2020, contingent deferred sales charges of approximately $4 for the Class A Shares were imposed, all of which was retained by Alger LLC. The initial sales charges and contingent deferred sales charges are used by Alger LLC to offset distribution expenses previously incurred. Sales charges do not represent expenses of the Fund. Effective July 24, 2020, Alger LLC will not collect any sales charges on assets held by direct shareholders.
(e) Brokerage Commissions: During the six months ended April 30, 2020, the Fund paid Alger LLC $261 in connection with securities transactions.
(f) Shareholder Administrative Fees: The Fund has entered into a shareholder administrative services agreement with Alger Management to compensate Alger Management for its liaison and administrative oversight of the transfer agent, and for other related services. The Fund compensates Alger Management at the annual rate of 0.0165% of the respective average daily net assets of Class A and Class C shares and 0.01% of the respective average daily net assets of the Class I and Class Z shares for these services.
ALGER GLOBAL FOCUS FUND
NOTES TO FINANCIAL STATEMENTS (Unaudited) (Continued)
Alger Management makes payments to intermediaries that provide sub-accounting services to omnibus accounts invested in the Fund. A portion of the fees paid by Alger Management to intermediaries that provide sub-accounting services are charged back to the Fund, subject to certain limitations, as approved by the Board. For the six months ended April 30, 2020, Alger Management charged back $4,053 to the Fund for these services, which are included in transfer agent fees in the accompanying Statement of Operations.
(g) Trustee Fees: For 2019, each trustee who is not an “interested person” of the Trust, as defined in the Investment Company Act of 1940, as amended (“Independent Trustee”) received a fee of $122,000 per annum, paid pro rata based on net assets by each fund in the Alger Fund Complex, plus travel expenses incurred for attending board meetings. The term “Alger Fund Complex” refers to the Fund, The Alger Institutional Funds, The Alger Funds, The Alger Funds II and The Alger Portfolios, each of which is a registered investment company managed by Alger Management. The Independent Trustee appointed as Chairman of the Board of Trustees received additional compensation of $30,000 per annum paid pro rata based on net assets by each fund in the Alger Fund Complex. Additionally, each member of the Audit Committee received a fee of $11,000 per annum, paid pro rata based on net assets by each fund in the Alger Fund Complex.
On December 17, 2019, the Board of Trustees approved the following changes in Trustee compensation. Effective January 1, 2020, each Independent Trustee receives a fee of $134,000 per annum, paid pro rata based on net assets by each fund in the Alger Fund Complex, plus travel expenses incurred for attending board meetings. The Independent Trustee appointed as Chairman of the Board of Trustees receives additional compensation of $20,000 per annum paid pro rata based on net assets by each fund in the Alger Fund Complex. Additionally, each member of the Audit Committee receives a fee of $13,000 per annum, paid pro rata based on net assets by each fund in the Alger Fund Complex.
(h) Interfund Trades: The Fund may engage in purchase and sale transactions with other funds advised by Alger Management. There were no intrfund trades during the six months ended April 30, 2020.
(i) Interfund Loans: The Fund, along with other funds in the Alger Fund Complex, may borrow money from and lend money to each other for temporary or emergency purposes. To the extent permitted under its investment restrictions, each fund may lend uninvested cash in an amount up to 15% of its net assets to other funds. If a fund has borrowed from other funds and has aggregate borrowings from all sources that exceed 10% of the fund’s total assets, such fund will secure all of its loans from other funds. The interest rate charged on interfund loans is equal to the average of the overnight time deposit rate and bank loan rate available to the funds. There were no interfund loans outstanding as of April 30, 2020.
During the six months ended April 30, 2020, the Fund did not incur interfund loan interest expense.
(j) Other Transactions with Affiliates: Certain officers of the Fund are directors and/or officers of Alger Management and the Distributor. At April 30, 2020, Alger Management and its affiliated entities owned the following shares of the Fund:
ALGER GLOBAL FOCUS FUND
NOTES TO FINANCIAL STATEMENTS (Unaudited) (Continued)
| | | SHARE CLASS | |
| | | A | | | C | | | I | | | Z | |
| Alger Global Focus Fund | | | — | | | | — | | | | — | | | | 16,199 | |
NOTE 4 — Securities Transactions:
The following summarizes the securities transactions by the Fund, other than U.S. Government securities and short term securities, for the six months ended April 30, 2020:
| | | PURCHASES | | | SALES | |
| Alger Global Focus Fund | | $ | 13,553,540 | | | $ | 15,253,413 | |
Transactions in foreign securities may involve certain considerations and risks not typically associated with those of U.S. companies because of, among other factors, the level of governmental supervision and regulation of foreign security markets, and the possibility of political or economic instability. Additional risks associated with investing in emerging markets include increased volatility, limited liquidity, and less stringent regulatory and legal systems.
NOTE 5 — Borrowings:
The Fund may borrow from the Custodian on an uncommitted basis. The Fund pays the Custodian a market rate of interest, generally based upon a rate of return with respect to each respective currency borrowed taking into consideration relevant overnight and short- term reference rates, the range of distribution between and among the interest rates paid on deposits to other institutions, less applicable commissions, if any. The Fund may also borrow from other funds in the Alger Fund Complex, as discussed in Note 3(h). For the six months ended April 30, 2020, the Fund had the following borrowings:
| | | AVERAGE DAILY
BORROWING | | | WEIGHTED AVERAGE
INTEREST RATE | |
| Alger Global Focus Fund | | $ | 32 | | | | 3.80 | % |
The highest amount borrowed by the Fund from the Custodian during the six months ended April 30, 2020 was as follows:
| | | HIGHEST BORROWING | |
| Alger Global Focus Fund | | $ | 5,882 | |
ALGER GLOBAL FOCUS FUND
NOTES TO FINANCIAL STATEMENTS (Unaudited) (Continued)
NOTE 6 — Share Capital:
The Fund has an unlimited number of authorized shares of beneficial interest of $.001 par value. The transactions of shares of beneficial interest were as follows:
| | | FOR THE SIX MONTHS ENDED
APRIL 30, 2020 | | | FOR THE YEAR ENDED
OCTOBER 31, 2019 | |
| | | SHARES | | | AMOUNT | | | SHARES | | | AMOUNT | |
| Alger Global Focus Fund | | | | | | | | | | | | | | | | |
| Class A: | | | | | | | | | | | | | | | | |
| Shares sold | | | 14,665 | | | $ | 311,750 | | | | 34,925 | | | $ | 726,516 | |
| Shares converted from Class C | | | 289 | | | | 6,489 | | | | 2,154 | | | | 44,938 | |
| Dividends reinvested | | | 18,058 | | | | 401,259 | | | | 61,753 | | | | 1,145,555 | |
| Shares redeemed | | | (78,962 | ) | | | (1,640,614 | ) | | | (115,003 | ) | | | (2,372,659 | ) |
| Net decrease | | | (45,950 | ) | | $ | (921,116 | ) | | | (16,171 | ) | | $ | (455,650 | ) |
| Class C: | | | | | | | | | | | | | | | | |
| Shares sold | | | 2,392 | | | $ | 49,634 | | | | 5,825 | | | $ | 112,650 | |
| Shares converted to Class A | | | (306 | ) | | | (6,489 | ) | | | (2,291 | ) | | | (44,938 | ) |
| Dividends reinvested | | | 2,269 | | | | 47,531 | | | | 11,702 | | | | 205,020 | |
| Shares redeemed | | | (15,980 | ) | | | (323,082 | ) | | | (41,230 | ) | | | (802,391 | ) |
| Net decrease | | | (11,625 | ) | | $ | (232,406 | ) | | | (25,994 | ) | | $ | (529,659 | ) |
| Class I: | | | | | | | | | | | | | | | | |
| Shares sold | | | 1,943 | | | $ | 39,134 | | | | 4,796 | | | $ | 99,995 | |
| Dividends reinvested | | | 782 | | | | 16,795 | | | | 3,477 | | | | 62,552 | |
| Shares redeemed | | | (4,432 | ) | | | (86,136 | ) | | | (19,411 | ) | | | (396,705 | ) |
| Net decrease | | | (1,707 | ) | | $ | (30,207 | ) | | | (11,138 | ) | | $ | (234,158 | ) |
| Class Z: | | | | | | | | | | | | | | | | |
| Shares sold | | | 8,439 | | | $ | 174,649 | | | | 31,118 | | | $ | 652,797 | |
| Dividends reinvested | | | 3,638 | | | | 82,250 | | | | 14,319 | | | | 270,896 | |
| Shares redeemed | | | (19,220 | ) | | | (413,853 | ) | | | (138,384 | ) | | | (2,940,737 | ) |
| Net decrease | | | (7,143 | ) | | $ | (156,954 | ) | | | (92,947 | ) | | $ | (2,017,044 | ) |
NOTE 7 — Income Tax Information:
At October 31, 2019, the Fund, for federal income tax purposes, had capital loss carryforwards of $1,221,652.
Under the Regulated Investment Company Modernization Act of 2010, capital losses incurred by the Fund will not be subject to expiration.
The difference between book-basis and tax-basis unrealized appreciation (depreciation) is determined annually and is attributable primarily to the tax deferral of losses on wash sales, U.S. Internal Revenue Code Section 988 currency transactions, the tax treatment of partnership investments, the realization of unrealized appreciation of passive foreign investment companies, and the return of capital from real estate investment trust investments.
No reclassification has been made among the Fund’s components of net assets at April 30, 2020.
ALGER GLOBAL FOCUS FUND
NOTES TO FINANCIAL STATEMENTS (Unaudited) (Continued)
NOTE 8 — Fair Value Measurements:
The following is a summary of the inputs used as of April 30, 2020in valuing the Fund’s investments carried at fair value on a recurring basis. Based upon the nature, characteristics, and risks associated with its investments, the Fund has determined that presenting them by security type and sector is appropriate.
| Alger Global Focus Fund | | TOTAL | | LEVEL 1 | | LEVEL 2 | | LEVEL 3 | |
| COMMON STOCKS | | | | | | | | | | | | | |
| Communication Services | | $ | 617,703 | | $ | — | | $ | 617,703 | | $ | — | |
| Consumer Discretionary | | | 4,248,554 | | | 2,750,299 | | | 1,498,255 | | | — | |
| Consumer Staples | | | 1,031,050 | | | 539,183 | | | 491,867 | | | — | |
| Energy | | | 339,612 | | | 339,612 | | | — | | | — | |
| Financials | | | 1,165,627 | | | 670,866 | | | 494,761 | | | — | |
| Healthcare | | | 2,716,198 | | | 1,289,423 | | | 1,426,775 | | | — | |
| Industrials | | | 1,430,550 | | | — | | | 1,430,550 | | | — | |
| Information Technology | | | 5,508,239 | | | 4,395,673 | | | 1,094,304 | | | 18,262 | |
| Materials | | | 972,492 | | | 509,466 | | | 463,026 | | | — | |
| TOTAL COMMON STOCKS | | $ | 18,030,025 | | $ | 10,494,522 | | $ | 7,517,241 | | $ | 18,262 | |
| PREFERRED STOCKS |
| Healthcare | | | 26,748 | | | — | | | — | | | 26,748 | |
| Information Technology | | | 74,469 | | | — | | | — | | | 74,469 | |
| TOTAL PREFERRED STOCKS | | $ | 101,217 | | $ | — | | $ | — | | $ | 101,217 | |
| TOTAL INVESTMENTS IN SECURITIES | | $ | 18,131,242 | | $ | 10,494,522 | | $ | 7,517,241 | | $ | 119,479 | |
| | | FAIR VALUE
MEASUREMENTS
USING SIGNIFICANT
UNOBSERVABLE
INPUTS (LEVEL 3) | |
| Alger Global Focus Fund | | Common Stocks | |
| Opening balance at November 1, 2019 | | $ | 18,262 | |
| Transfers into Level 3 | | | — | |
| Transfers out of Level 3 | | | — | |
| Total gains or losses | | | | |
| Included in net realized gain (loss) on investments | | | — | |
| Included in net change in unrealized appreciation (depreciation) on investments | | | — | |
| Purchases and sales | | | | |
| Purchases | | | — | |
| Sales | | | — | |
| Closing balance at April 30, 2020 | | | 18,262 | |
Net change in unrealized appreciation (depreciation) attributable to investments still held at April 30, 2020* | | $ | — | |
ALGER GLOBAL FOCUS FUND
NOTES TO FINANCIAL STATEMENTS (Unaudited) (Continued)
| Alger Global Focus Fund | | Preferred Stocks | |
| Opening balance at November 1, 2019 | | $ | 110,358 | |
| Transfers into Level 3 | | | — | |
| Transfers out of Level 3 | | | — | |
| Total gains or losses | | | | |
| Included in net realized gain (loss) on investments | | | — | |
| Included in net change in unrealized appreciation (depreciation) on investments | | | (9,141 | ) |
| Purchases and sales | | | | |
| Purchases | | | — | |
| Sales | | | — | |
| Closing balance at April 30, 2020 | | | 101,217 | |
Net change in unrealized appreciation (depreciation) attributable to investments still held at April 30, 2020* | | $ | (9,141 | ) |
* Net change in unrealized appreciation (depreciation) is included in net change in unrealized appreciation (depreciation) on investments in the accompanying statement of operations.
The following table provides quantitative information about the Fund’s Level 3 fair value measurements of the Fund’s investments as ofApril 30, 2020. The table below is not intended to be all-inclusive, but rather provides information on the Level 3 inputs as they relate to the Fund’s fair value measurements.
| | | Fair Value
April 30,
2020 | | Valuation
Methodology | | Unobservable
Input | | Range/Input | | Weighted
Average
Inputs | |
| Alger Global Focus Fund | | | | | | | | | | | | |
| Common Stock | | $ | 18,262 | | Market Approach | | Transaction Price | | N/A | | N/A | |
| Preferred Stocks | | | 74,469 | | Market Approach | | Transaction Price | | N/A | | N/A | |
| Preferred Stocks | | | 26,748 | | Income Approach | | Discount Rate | | 55.00%-60.00% | | N/A | |
The significant unobservable inputs used in the fair value measurement of the Fund’s securities are revenue and EBITDA multiples, discount rates, and the probabilities of success of certain outcomes. Significant increases and decreases in these inputs in isolation and interrelationships between those inputs could result in significantly higher or lower fair value measurements than those noted in the table above. Generally, increases in revenue and EBITDA multiples, decreases in discount rates, and increases in the probabilities of success result in higher fair value measurements, whereas decreases in revenues and EBITDA multiples, increases in discount rates, and decreases in the probabilities of success result in lower fair value measurements.
Certain of the Fund’s assets and liabilities are held at carrying amount or face value, which approximates fair value for financial statements purposes. As of April 30, 2020, such assets were categorized within the ASC 820 disclosure hierarchy as follows:
| | | TOTAL | | LEVEL 1 | | LEVEL 2 | | LEVEL 3 | |
| Cash, foreign cash and cash equivalents | | $ | 468,095 | | $ | 453 | | $ | 467,642 | | $ | – | |
ALGER GLOBAL FOCUS FUND
NOTES TO FINANCIAL STATEMENTS (Unaudited) (Continued)
NOTE 9 — Derivatives:
Financial Accounting Standards Board Accounting Standards Codification 815 – Derivatives and Hedging (“ASC 815”) requires qualitative disclosures about objectives and strategies for using derivatives, quantitative disclosures about fair value amounts of and gains and losses on derivative instruments, and disclosures about credit-risk-related contingent features in derivative agreements.
Forward foreign currency contracts - In connection with portfolio purchases and sales of securities denominated in foreign currencies, the Fund may enter into forward foreign currency contracts. Additionally, the Fund may enter into such contracts to economically hedge certain other foreign currency denominated investments. These contracts are valued at the current cost of covering or offsetting such contracts and the related realized and unrealized foreign exchange gains and losses are included in the Statement of Operations. In the event that counterparties fail to settle these currency contracts or the related foreign security trades, the Fund could be exposed to foreign currency fluctuation.
There were no derivative instruments held by the Fund throughout the period or as of April 30, 2020.
NOTE 10 — Principal Risks:
Investing in the stock market involves certain risks, including the potential loss of principal. Your investment in Fund shares represents an indirect investment in the securities owned by the Fund. The value of these securities, like other investments, may move up or down, sometimes rapidly and unpredictably. Your Fund shares at any point in time may be worth less than what you invested, even after taking into account the reinvestment of Fund dividends and distributions. Local, regional or global events such as war, acts of terrorism, the spread of infectious illness or other public health issues, recessions, or other events could have a significant impact on the Fund and its investments. Growth stocks tend to be more volatile than other stocks as their prices tend to be higher in relation to their companies’ earnings and may be more sensitive to market, political, and economic developments. Assets may be focused in a small number of holdings, making them susceptible to risks associated with a single economic, political or regulatory event than a more diversified portfolio. Foreign and emerging markets securities involves special risks including currency fluctuations, less liquidity, inefficient trading, political instability, and increased volatility. Investing in companies of small capitalizations involves the risk that such issuers may have limited product lines or financial resources, lack management depth, or have limited liquidity. Active trading may increase transaction costs, brokerage commissions, and taxes, which can lower the return on investment.
ALGER GLOBAL FOCUS FUND
NOTES TO FINANCIAL STATEMENTS (Unaudited) (Continued)
NOTE 11 — Affiliated Securities:
The issuers of the securities listed below are deemed to be affiliates of the Fund because the Fund or its affiliates owned 5% or more of the issuer’s voting securities during all or part of the six months ended April 30, 2020. Purchase and sale transactions, interest income and dividend income earned during the period were as follows:
| | | | | | | | | | | | | | | Net Increase | | | |
| | | Shares/ Par at | | | | | | Shares/
Par at | | Dividend/ | | | | (Decrease)
in | | Value at | |
| Security | | October 31,
2019 | | Purchases/
Conversion | | Sales/
Conversion | | April 30,
2020 | | Interest Income | | Realized
Gain (Loss) | | Unrealized
App(Dep) | | April 30,
2020 | |
| Alger Global Focus Fund | | | | | | | | | | | | | | | | | | |
| Preferred Stocks | | | | | | | | | | | | | | | | | | |
| Prosetta Biosciences, Inc., Series D | | 33,858 | | — | | — | | 33,858 | | — | | — | | $ | (9,141 | ) | $ | 26,748 | |
| Total | | | | | | | | | | — | | — | | $ | (9,141 | ) | $ | 26,748 | |
NOTE 12 — Subsequent Events:
Management of the Fund has evaluated events that have occurred subsequent to April 30, 2020 through the issuance date of the Financial Statements. No such events have been identified which require recognition and/or disclosure.
ALGER GLOBAL FOCUS FUND
ADDITIONAL INFORMATION (Unaudited)
Shareholder Expense Example
As a shareholder of the Fund, you incur two types of costs: transaction costs, if applicable, including sales charges (loads) and redemption fees; and ongoing costs, including management fees, distribution (12b-1) fees, if applicable, and other fund expenses. This example is intended to help you understand your ongoing costs (in dollars) of investing in the Fund and to compare these costs with the ongoing costs of investing in other mutual funds.
The example below is based on an investment of $1,000 invested at the beginning of the six-month period starting November 1, 2019 and ending April 30, 2020.
Actual Expenses
The first line for each class of shares in the table below provides information about actual account values and actual expenses. You may use the information in this line, together with the amount you invested, to estimate the expenses that you would have paid over the period. Simply divide your account value by $1,000 (for example, an $8,600 account value divided by $1,000 = 8.6), then multiply the result by the number in the first line under the heading entitled “Expenses Paid During the Six Months Ended April 30, 2020” to estimate the expenses you paid on your account during this period.
Hypothetical Example for Comparison Purposes
The second line for each class of shares in the table below provides information about hypothetical account values and hypothetical expenses based on the Fund’s actual expense ratios for each class of shares and an assumed rate of return of 5% per year before expenses, which is not the Fund’s actual return. The hypothetical account values and expenses may not be used to estimate the actual ending account balance or expenses you paid for the period. You may use this information to compare the ongoing costs of investing in the Fund and other funds. To do so, compare this 5% hypothetical example with the 5% hypothetical examples that appear in the shareholder reports of other funds.
Please note that the expenses shown in the table are meant to highlight your ongoing costs only and do not reflect any transaction costs, such as sales charges (loads) and redemption fees. Therefore, the second line under each class of shares in the table is useful in comparing ongoing costs only, and will not help you determine the relative total costs of owning different funds. In addition, if these transactional costs were included, your costs would have been higher.
ALGER GLOBAL FOCUS FUND
ADDITIONAL INFORMATION (Unaudited) (Continued)
| | | | Beginning
Account Value November 1, 2019 | | Ending
Account Value April 30, 2020 | | Expenses
Paid During the Six Months
Ended April 30, 2020(a) | | Annualized
Expense Ratio
For the Six Months
Ended April 30, 2020(b) | |
| Alger Global Focus Fund | | | | | | | | | | | | |
| Class A | Actual | | $ | 1,000.00 | | $ | 953.20 | | $ | 7.28 | | 1.50 | % |
| | Hypothetical(c) | | | 1,000.00 | | | 1,017.40 | | | 7.52 | | 1.50 | |
| Class C | Actual | | | 1,000.00 | | | 992.60 | | | 11.15 | | 2.25 | |
| | Hypothetical(c) | | | 1,000.00 | | | 1,013.67 | | | 11.27 | | 2.25 | |
| Class I | Actual | | | 1,000.00 | | | 1,007.70 | | | 5.74 | | 1.15 | |
| | Hypothetical(c) | | | 1,000.00 | | | 1,019.14 | | | 5.77 | | 1.15 | |
| Class Z | Actual | | | 1,000.00 | | | 1,008.80 | | | 4.94 | | 0.99 | |
| | Hypothetical(c) | | | 1,000.00 | | | 1,019.94 | | | 4.97 | | 0.99 | |
| (a) | Expenses are equal to the annualized expense ratio of the respective share class, multiplied by the average account value over the period, multiplied by 182/366 (to reflect the one-half year period). |
| (b) | Annualized. |
| (c) | 5% annual return before expenses. |
ALGER GLOBAL FOCUS FUND
ADDITIONAL INFORMATION (Unaudited) (Continued)
Privacy Policy
| U.S. Consumer Privacy Notice | Rev. 12/20/16 |
| FACTS | | WHAT DOES ALGER DO WITH YOUR PERSONAL INFORMATION? |
| Why? | | Financial companies choose how they share your personal information. Federal law gives consumers the right to limit some but not all sharing. Federal law also requires us to tell you how we collect, share, and protect your personal information. Please read this notice carefully to understand what we do. |
| What? | | The types of personal information we collect and share depend on the product or service you have with us. This information can include:
• Social Security number and
• Account balances and
• Transaction history and
• Purchase history and
• Assets
When you are no longer our customer, we continue to share your information as described in this notice. |
| How? | | All financial companies need to share personal information to run their everyday business. In the section below, we list the reasons financial companies can share personal information; the reasons Alger chooses to share; and whether you can limit this sharing. |
Reasons we can share your personal
information | | Does
Alger share? | | Can you limit
this sharing? |
| For our everyday business purposes — such as to process your transactions, maintain your account(s), respond to court orders and legal investigations, or report to credit bureaus | | Yes | | No |
| For our marketing purposes —to offer our products and services to you | | Yes | | No |
| For joint marketing with other financial companies | | No | | We don’t share |
| For our affiliates’ everyday business purposes — information about your transactions and experiences | | Yes | | No |
| For our affiliates’ everyday business purposes — information about your creditworthiness | | No | | We don’t share |
| For nonaffiliates to market to you | | No | | We don’t share |
| Questions? Call 1-800-342-2186 | | | | |
ALGER GLOBAL FOCUS FUND
ADDITIONAL INFORMATION (Unaudited) (Continued)
| Who we are | | |
| | | |
| Who is providing this notice? | | Alger includes Fred Alger Management, LLC and Fred Alger & Company, LLC as well as the following funds: The Alger Funds, The Alger Funds II, The Alger Institutional Funds, The Alger Portfolios, and Alger Global Focus Fund. |
| | | |
| What we do | | |
| | | |
| How does Alger protect my personal information? | | To protect your personal information from unauthorized access and use, we use security measures that comply with federal law. These measures include computer safeguards and secured files and buildings. |
| | | |
| How does Alger collect my personal information? | | We collect your personal information, for example, when you:
• Open an account or
• Make deposits or withdrawals from your account or
• Give us your contact information or
• Provide account information or
• Pay us by check. |
| | | |
| Why can’t I limit all sharing? | | Federal law gives you the right to limit some but not all sharing related to:
• sharing for affiliates’ everyday business purposes ─ information about your credit worthiness
• affiliates from using your information to market to you
• sharing for nonaffiliates to market to you
State laws and individual companies may give you additional rights to limit sharing. |
| | | |
| Definitions | | |
| | | |
| Affiliates | | Companies related by common ownership or control.
They can be financial and nonfinancial companies.
• Our affiliates include Fred Alger Management, LLC, Weatherbie Capital, LLC and Fred Alger & Company, LLC as well as the following funds: The Alger Funds, The Alger Funds II, The Alger Institutional Funds, The Alger Portfolios, and Alger Global Focus Fund. |
| | | |
| Nonaffiliates | | Companies not related by common ownership or control. They can be financial and nonfinancial companies. |
| | | |
| Joint marketing | | A formal agreement between nonaffiliated financial companies that together market financial products or services to you. |
ALGER GLOBAL FOCUS FUND
ADDITIONAL INFORMATION (Unaudited) (Continued)
Proxy Voting Policies
A description of the policies and procedures the Fund uses to determine how to vote proxies relating to portfolio securities and the proxy voting record is available, without charge, by calling (800) 992-3863 or online on the Fund’s website at http://www.alger.com or on the SEC’s website at http://www.sec.gov.
Fund Holdings
The Board of Trustees has adopted policies and procedures relating to disclosure of the Fund’s portfolio securities. These policies and procedures recognize that there may be legitimate business reasons for holdings to be disclosed and seek to balance those interests to protect the proprietary nature of the trading strategies and implementation thereof by the Fund.
Generally, the policies prohibit the release of information concerning portfolio holdings, which have not previously been made public to individual investors, institutional investors, intermediaries that distribute the Fund’s shares and other parties which are not employed by the Investment Manager or its affiliates except when the legitimate business purposes for selective disclosure and other conditions (designed to protect the Fund) are acceptable.
The Fund makes its complete schedule of portfolio holdings available semi-annually in shareholder reports filed on Form N-CSR and after the first and third fiscal quarters as an exhibit to its reports on Form N-PORT. Previously, the Fund made its complete schedule of portfolio holdings available after the first and third fiscal quarters in regulatory filings on Form N-Q. The Fund’s Forms N-CSR, N-PORT and N-Q are available online on the SEC’s website at www.sec.gov.
In addition, the Fund makes publicly available its month-end top 10 holdings with a 10 day lag and its month-end full portfolio with a 60 day lag on its website www.alger.com and through other marketing communications (including printed advertising/sales literature and/or shareholder telephone customer service centers). No compensation or other consideration is received for the non-public disclosure of portfolio holdings information.
In accordance with the foregoing, the Fund provides portfolio holdings information to third parties including financial intermediaries and service providers who need access to this information in the performance of their services and are subject to duties of confidentiality (1) imposed by law, including a duty not to trade on non-public information, and/or (2) pursuant to an agreement that confidential information is not to be disclosed or used (including trading on such information) other than as required by law. From time to time, the Fund will communicate with these third parties to confirm that they understand the Fund’s policies and procedures regarding such disclosure. This agreement must be approved by the Fund’s Chief Compliance Officer.
The Board of Trustees periodically reviews a report disclosing the third parties to whom the Fund’s holdings information has been disclosed and the purpose for such disclosure, and it considers whether or not the release of information to such third parties is in the best interest of the Fund and its shareholders.
ALGER GLOBAL FOCUS FUND
ADDITIONAL INFORMATION (Unaudited) (Continued)
In addition to material the Fund routinely provides to shareholders, the Investment Manager may make additional statistical information available regarding the Fund. Such information may include, but not be limited to, relative weightings and characteristics of the Fund versus an index (such as P/E ratio, alpha, beta, capture ratio, maximum drawdown, standard deviation, EPS forecasts, Sharpe ratio, information ratio, R-squared and market cap analysis), security specific impact on overall portfolio performance, month-end top ten contributors to and detractors from performance, portfolio turnover, and other similar information. Shareholders should visit www.alger.com or may also contact the Fund at (800) 992-3863 to obtain such information.
Liquidity Risk Management Program
In accordance with Rule 22e-4 under the Investment Company Act of 1940, as amended, the Funds established a liquidity risk management program (the “LRMP”) in December 2018 and the Board, including a majority of the Independent Trustees, appointed the Investment Manager as the administrator of the LRMP. The Board, including a majority of the Independent Trustees, formally approved the LRMP in May of 2019. The Investment Manager administers the LRMP through a Liquidity Risk Committee (the “Committee”) that is chaired by the Investment Manager’s Chief Compliance Officer, who also serves as the Trust’s Chief Compliance Officer. The Board also approved an agreement with Intercontinental Exchange (“ICE”), a third-party vendor that assists the Funds with liquidity classifications required by Rule 22e-4. The Committee is responsible for assessing the liquidity risk of the Funds, subject to the oversight of the Investment Manager. The Committee reviews daily investment classification reports, continuously monitors the Funds’ liquidity risk, and meets at least quarterly.
The Board met to review the LRMP pursuant to Rule 22e-4 and at such meeting the Trust’s Chief Compliance Officer, on behalf of the Investment Manager as the administrator of the LRMP, provided the Board with a report that addressed the operation of the LRMP and assessed its adequacy and effectiveness of implementation and any material changes to the LRMP (the “Report”). The Report covered the period from December 1, 2018 through November 30, 2019 (the “Review Period”).
The Report stated that the Committee assessed each Fund’s liquidity risk by considering qualitative factors such as the Fund’s investment strategy, holdings, diversification of investments, redemption policies, cash flows, cash levels, shareholder concentration, and access to borrowings, among others, in conjunction with the quantitative classifications generated by ICE. In addition, in connection with the review of the Funds’ liquidity risks and the operation of the LRMP and the adequacy and effectiveness of its implementation, the Committee also evaluated the levels at which to set the reasonably anticipated trade size and market price impact. The Report described the process for determining that each Fund primarily holds investments that are highly liquid.
The Report concluded during the Review Period that the Trust’s LRMP is operating effectively, and is adequate and effectively implemented.
ALGER GLOBAL FOCUS FUND
360 Park Avenue South
New York, NY 10010
(800) 992-3863
www.alger.com
Investment Manager
Fred Alger Management, LLC
360 Park Avenue South
New York, NY 10010
Distributor
Fred Alger & Company, LLC
360 Park Avenue South
New York, NY 10010
Transfer Agent and Dividend Disbursing Agent
UMB Fund Services, Inc.
235 W. Galena Street
Milwaukee, WI 53212
Custodian
Brown Brothers Harriman & Company
50 Post Office Square
Boston, MA 02110
Independent Registered Public Accounting Firm
Deloitte & Touche LLP
30 Rockefeller Plaza
New York, NY 10112
This report is submitted for the general information of the shareholders of Alger Global Focus Fund. It is not authorized for distribution to prospective investors unless accompanied by an effective prospectus for the Fund, which contains information concerning the Fund’s investment policies, fees and expenses as well as other pertinent information.
(This page has been intentionally left blank.)
(This page has been intentionally left blank.)
(This page has been intentionally left blank.)
ITEM 2. CODE OF ETHICS.
Not applicable.
ITEM 3. AUDIT COMMITTEE FINANCIAL EXPERT.
Not applicable.
ITEM 4. PRINCIPAL ACCOUNTANT FEES AND SERVICES.
Not applicable.
ITEM 5. AUDIT COMMITTEE OF LISTED REGISTRANTS.
Not applicable.
ITEM 6. INVESTMENTS.
Not applicable.
ITEM 7. DISCLOSURE OF PROXY VOTING POLICIES AND PROCEDURES FOR CLOSED-END MANAGEMENT INVESTMENT COMPANIES.
Not applicable.
ITEM 8. PORTFOLIO MANAGERS OF CLOSED-END MANAGEMENT INVESTMENT COMPANIES.
Not applicable.
ITEM 9. PURCHASES OF EQUITY SECURITIES BY CLOSED-END MANAGEMENT INVESTMENT COMPANY AND AFFILIATED PURCHASERS.
Not applicable.
ITEM 10. SUBMISSION OF MATTERS TO A VOTE OF SECURITY HOLDERS.
Not applicable.
ITEM 11. CONTROLS AND PROCEDURES.
(a) The Registrant’s principal executive officer and principal financial officer have concluded that the Registrant’s disclosure controls and procedures (as defined in Rule 30a-3(c) under the Investment Company Act of 1940, as amended) are effective based on their evaluation of the disclosure controls and procedures as of a date within 90 days of the filing date of this document.
(b) No changes in the Registrant’s internal control over financial reporting occurred during the Registrant’s second fiscal quarter of the period covered by this report that materially affected, or are reasonably likely to materially affect, the Registrant’s internal control over financial reporting.
ITEM 12. Disclosure of Securities Lending Activities for Closed-End Management Investment Companies.
Not applicable.
ITEM 13. EXHIBITS.
(a) (1) Not applicable
(a) (2) Certifications of principal executive officer and principal financial officer as required by rule 30a-2(a) under the Investment Company Act of 1940 are attached as Exhibit 99.CERT
(a) (3) Not applicable
(a) (4) Not applicable
(b) (b) Certifications of principal executive officer and principal financial officer as required by rule 30a-2(b) under the Investment Company Act of 1940 are attached as Exhibit 99.906CERT
SIGNATURES
Pursuant to the requirements of the Securities Exchange Act of 1934 and the Investment Company Act of 1940, the registrant has duly caused this report to be signed on its behalf by the undersigned, thereunto duly authorized.
| Alger Global Focus Fund | |
| | |
| | |
| By: | /s/ Hal Liebes | |
| | Hal Liebes | |
| | President | |
| | |
| Date: | June 22, 2020 | |
Pursuant to the requirements of the Securities Exchange Act of 1934 and the Investment Company Act of 1940, this report has been signed below by the following persons on behalf of the registrant and in the capacities and on the dates indicated.
| By: | /s/ Hal Liebes | |
| | Hal Liebes | |
| | President | |
| | |
| Date: | June 22, 2020 | |
| | | |
| | | |
| By: | /s/ Michael D. Martins | |
| | Michael D. Martins | |
| | Treasurer | |
| | | |
| Date: | June 22, 2020 | |