UNITED STATES
SECURITIES AND EXCHANGE COMMISSION
Washington, D.C. 20549
FORM N-CSR
CERTIFIED SHAREHOLDER REPORT OF REGISTERED MANAGEMENT INVESTMENT COMPANIES
Investment Company Act file number 811-21308
Alger Global Focus Fund
(Exact name of registrant as specified in charter)
100 Pearl Street, New York, New York 10004
(Address of principal executive offices) (Zip code)
Mr. Hal Liebes
Fred Alger Management, LLC
100 Pearl Street
New York, New York 10004
(Name and address of agent for service)
Registrant’s telephone number, including area code: 212-806-8800
Date of fiscal year end: October 31
Date of reporting period: April 30, 2022
Form N-CSR is to be used by management investment companies to file reports with the Commission, not later than 10 days after the transmission to Stockholders of any report to be transmitted to Stockholders under Rule 30e-1 under the Investment Company Act of 1940 (17 CFR 270.30e1). The Commission may use the information provided on Form N-CSR in its regulatory, disclosure review, inspection, and policymaking roles.
A registrant is required to disclose the information specified by Form N-CSR, and the Commission will make this information public. A registrant is not required to respond to the collection of information contained in Form N-CSR unless the Form displays a currently valid Office of Management and Budget (“OMB”) control number. Please direct comments concerning the accuracy of the information collection burden estimate and any suggestions for reducing the burden to the Secretary, Securities and Exchange Commission, 450 Fifth Street, NW, Washington, DC 20549-0609. The OMB has reviewed this collection of information under the clearance requirements of 44 U.S.C. § 3507.
| ITEM 1. | REPORT(S) TO STOCKHOLDERS. |
| (a) | The following is a copy of the report transmitted to shareholders pursuant to Rule 30e-1 under the Investment Company Act of 1940 (17 CFR 270.30e-1). |
ALGER GLOBAL FOCUS FUND
| 1 |
| | |
| 9 |
| | |
| 11 |
| | |
| 12 |
| | |
| 15 |
| | |
| 17 |
| | |
| 18 |
| | |
| 19 |
| | |
| 23 |
| | |
| 35 |
Shareholders’ Letter (Unaudited) | April 30, 2022 |
Dear Shareholders,
Many Investors Shun Powerful Wealth Creator
In 1924, economist John Maynard Keynes wrote that companies that reinvest profits can create “an element of compound interest operating in favour of a sound industrial investment.” At Alger, we believe reinvesting profits and producing compounding earnings growth is a powerful wealth creator. To that end, we seek companies that we believe have strong potential for compounding earnings growth, and we seek to avoid cyclical companies, including “short-duration” companies, or businesses with high current earnings that return most of their profits to shareholders. In most instances, these cyclical companies, in our view, have little or no potential for future long-term earnings growth.
As Warren Buffett has observed, investors “occasionally do crazy things,” which creates opportunities for investors who can “disregard mob fears or enthusiasms….and focus on a few simple fundamentals.” We believe recent concerns about interest rates, inflation and valuations have caused many investors to act irrationally by focusing on cyclical short-duration companies while shunning the “sound industrial investment” identified by Keynes.
Setting the Stage for a Difficult Six-Month Period
The strong trend of investors rejecting the appeal of long-term earnings growth, in our view, played a major role in our disappointing fund performance during the fiscal six-month period ended April 30, 2022. The fiscal period included the continuation of a dramatic rotation by many investors seeking instant gratification by favoring companies with high current earnings. This rotation was initially fueled prior to the reporting period by optimism that scaling back or eliminating measures to curtail the COVID-19 pandemic combined with unprecedented levels of fiscal stimulus would drive strong economic growth. More recently, however, optimism gave way to concerns that equities may be overvalued at a time when the economy could overheat and require the U.S. Federal Reserve (the “Fed”) to continue to raise interest rates to fight inflation.
These concerns were supported by the following developments:
| • | U.S. gross domestic product (“GDP”), which declined 3.4% in 2020 due to the economy shutting down to contain the pandemic, jumped 5.7% in 2021. |
| • | After climbing to 6.3% at the end of 2020, the seasonally adjusted unemployment rate declined to 4.2% as of the November 2021 start of the fiscal six-month reporting period. It eventually reached 3.6% as of the end of the six-month period, during which concerns about inflation grew, a result of a tight labor market, among other things. |
| • | Data appeared to validate inflation concerns. After hitting a 6.8% year-over-year increase (or increase during the past 12-month period) in November 2021 and increasing each subsequent month, the Consumer Price Index hit 8.5% as of March 2022. |
In response, the Fed shifted its outlook-it no longer maintained that inflation was a transitory result of supply chain issues and the economy reopening, and in March, the Fed raised the federal funds rate by 25 basis points (“BPS”), its first hike since cutting the rate to zero in 2020. Furthermore, Fed statements in March led many investors to anticipate a 50BPS rate hike in May and 200BPS in aggregate hikes by the end of 2022. Fears that rate hikes could eventually spark a recession also weighed upon investor sentiment.
Interest Rates Support Rotation Away from Quality
The rotation to short-duration companies was also partially supported by investors reacting to higher interest rates in a fairly typical fashion-they adjusted their cash flow modeling by increasing the rate at which they discount future cash flows back to the present, thereby lowering the value of long-duration companies. This process is similar to how long-term bonds are impacted more by rising rates than short-term bonds.
Not Just Growth, But High-Quality Small Cap Growth, Underperforms
Many small cap growth companies tend to have little or no current earnings, but strong potential for significant sales and earnings growth. Within the Russell 2000 Growth Index, for example, we believe many Health Care companies are high-quality businesses even though they may not generate profits due to their investments in new initiatives, their products or potential products can have high gross margins and potential for capturing market share. As a result of investors dismissing the appeal of potential earnings growth, the Health Care sector was one of the worst performing sectors within the small cap growth category. From a broader perspective, sectors that generally consist of companies that provide dividends and appear to be less susceptible to inflation, such as Energy and Consumer Staples, led.
Also during the fiscal six-month period, growth underperformed value across the market cap spectrum, with the -26.77% return of the Russell 2000 Growth Index being a noteworthy laggard when compared to the -9.5% return of the Russell 2000 Value Index. The broad market, as measured by the S&P 500 Index, dropped 8.17%.
International Markets Also Struggle
Concerns about interest rates, inflation and the Russian invasion of Ukraine also extended beyond the U.S. Investors also assessed the spread of COVID-19 in China. Among non-U.S. equities, emerging markets significantly underperformed with the MSCI Emerging Markets Index declining 14.04% during the fiscal six-month reporting period. Within the index, the Utilities sector was the only sector to generate positive performance, as investors focused on companies that they perceived as having recession resistant fundamentals that provide a relatively high return of cash to shareholders. Consumer Discretionary, Health Care and Energy were among the worst performing sectors. The selloff also included developed markets with the MSCI EAFE Index declining 11.58%. From a broader perspective, the MSCI ACWI Index declined 11.45%.
Irrational Behavior Creates Opportunity
As a result of investors’ rotation out of quality companies, growth equities, we believe, are trading at attractive valuations. Notably, the Russell 2000 Growth Index price-to-earnings (P/E) ratio based on the next 12-months’ earnings, declined from 50.2x to approximately 33.5x during the six-month fiscal reporting period while the Russell 1000 Growth Index declined from 30.7x to 23.8x.
Navigating Fed Rate Hikes
Investors who are concerned about monetary policy may want to consider two points:
First, Fed rate increases don’t always lead to recessions. In fact, since 1965 there have been three instances in which the Fed increased the federal funds rate 300 BPS or more that resulted in continued real economic growth and slowing inflation rather than recessions. Additionally, during the 12-months following the end of Fed tightening in 1985 and 1995, as well as after the Fed relented in 2018, equities generated double-digit returns.
Second, the later phases of monetary tightening have been accompanied by growth stocks outperforming value equities. The six-month periods starting approximately three months after the beginning of Fed tightening cycles initiated in 1994, 1999, 2004 and 2015 illustrate this point. Based on the returns of the Russell 3000 Growth and Russell 3000 Value indices, the median outperformance of growth during those periods was 400BPS. During later phases of rate hikes, economic growth slows, so investors may be more willing to pay a premium for companies that can increase their earnings.
Going Forward
We continue to believe that unprecedented levels of innovation, such as health care advancements in genetic science, and digital technologies including artificial intelligence, e-commerce, the metaverse, streaming entertainment, and cloud computing are providing opportunities for leading companies to reward investors by generating long-term earnings growth. We will continue to focus on conducting in-depth fundamental research as we seek leaders of innovation rather than take short-term bets on the fickle nature of investor sentiment. We believe doing so is the best strategy for helping our valued shareholders reach their investment goals.
Portfolio Matters
Alger Global Focus Fund
The Alger Global Focus Fund returned -25.82% for the fiscal six-month period ended April 30, 2022, compared to the -11.45% return of its benchmark, the MSCI ACWI Index.
During the reporting period, the largest sector weightings were Information Technology and Consumer Discretionary. The largest sector overweight was Information Technology and the largest underweight was Financials.
Contributors to Performance
The Communication Services and Real Estate sectors provided the greatest contributions to relative performance during the reporting period. From a country perspective, Germany, Russia, South Korea, and Sweden were among the top contributors to relative performance.
Regarding individual positions, Schlumberger NV; Freeport-McMoRan, Inc.; Samsonite International S.A.; East Money Information Co., Ltd., Cl. A; and Hensoldt AG were the top contributors to absolute performance. Schlumberger NV engages in the provision of technology and services for reservoir characterization, drilling, production and processing to the oil and gas industry. Industry dynamics began to improve in 2021 following a multi-year recessionary cycle in the oil and gas industry that had resulted from oversupply, macroeconomic pressures and the COVID-19 pandemic leading to a 50% reduction in rig counts in 2020. Exploration and production companies benefitted from the rationalization of industry capacity, as well as a refined focus on free cash flow generation, supported by stable and improving oil prices. As a result, the oilfield services segment witnessed an improved backdrop for activity in 2021, with rig counts growing throughout the year and 44% year-over-year in the fourth quarter. This momentum continued into the first quarter of 2022 with 35% year-over-year growth. Geopolitical conflicts between Russia and Ukraine have increased pressure on the supply/demand dynamics, driving oil prices even higher and pushing political pressure on increased energy production activity.
Detractors from Performance
The Information Technology and Health Care sectors were among the sectors that detracted from relative performance during the reporting period. From a country perspective, the United States, Norway, the Netherlands, Australia and Italy were among the top detractors from relative performance.
Regarding individual positions, Amazon.com, Inc.; MSCI Inc., Cl. A; Intuit, Inc.; Adobe, Inc.; and EPAM Systems, Inc. were among the top detractors from absolute performance. EPAM Systems provides software product development and digital platform engineering services. The company continues to benefit from secular growth in corporate digital initiatives, delivering 2021 earnings that beat consensus expectations. It also provided guidance of 38% year-over-year revenue growth for 2022. However, geopolitical conflict in Russia and Ukraine forced the company to pull guidance and focus on business continuity plans in the first quarter of 2022. While less than 5% of revenues are exposed to Russia, Ukraine and Belarus, the company has operating exposure to those countries as its software engineers are located within the region. Demand remains strong and management has focused on relocating talent outside of conflict zones, along with recruitment across non-conflict regions, to maintain project delivery timelines. The stock de-rated significantly during the early part of 2022 as investors weighed uncertainties related to EPAM’s business operations.
I thank you for putting your trust in Alger.
Sincerely,
Daniel C. Chung, CFA
Chief Executive Officer
Fred Alger Management, LLC
Investors cannot invest directly in an index. Index performance does not reflect the deduction for fees, expenses, or taxes.
This report and the financial statements contained herein are submitted for the general information of shareholders of the Fund. This report is not authorized for distribution to prospective investors in the Fund unless preceded or accompanied by an effective prospectus for the Fund. Fund performance returns represent the six-month period return of Class A shares prior to the deduction of any sales charges and include the reinvestment of any dividends or distributions.
The performance data quoted represents past performance, which is not an indication or guarantee of future results.
Standardized performance results can be found on the following pages. The investment return and principal value of an investment in the Fund will fluctuate so that an investor’s shares, when redeemed, may be worth more or less than their original cost. Current performance may be lower or higher than the performance quoted. For performance data current to the most recent month-end, visit us at www.alger.com or call us at (800) 992-3863.
The views and opinions of the Fund’s management in this report are as of the date of the Shareholders’ Letter and are subject to change at any time subsequent to this date. There is no guarantee that any of the assumptions that formed the basis for the opinions stated herein are accurate or that they will materialize. Moreover, the information forming the basis for such assumptions is from sources believed to be reliable; however, there is no guarantee that such information is accurate. Any securities mentioned, whether owned in the Fund or otherwise, are considered in the context of the construction of an overall portfolio of securities and therefore reference to them should not be construed as a recommendation or offer to purchase or sell any such security. Inclusion of such securities in the Fund and transactions in such securities, if any, may be for a variety of reasons, including, without limitation, in response to cash flows, inclusion in a benchmark, and risk control. The reference to a specific security should also be understood in such context and not viewed as a statement that the security is a significant holding in the Fund. Please refer to the Schedule of Investments for the Fund which is included in this report for a complete list of Fund holdings as of April 30, 2022. Securities mentioned in the Shareholders’ Letter, if not found in the Schedule of Investments, may have been held by the Fund during the fiscal six-month period ended April 30, 2022.
Risk Disclosures
Investing in the stock market involves risks, including the potential loss of principal. Growth stocks may be more volatile than other stocks as their prices tend to be higher in relation to their companies’ earnings and may be more sensitive to market, political, and economic developments. Local, regional or global events such as environmental or natural disasters, war, terrorism, pandemics, outbreaks of infectious diseases and similar public health threats, recessions, or other events could have a significant impact on investments. A significant portion of assets may be invested in securities of companies in related sectors, and may be similarly affected by economic, political, or market events and conditions and may be more vulnerable to unfavorable sector developments. Assets may be focused in a small number of holdings, making them susceptible to risks associated with a single economic, political or regulatory event than a more diversified portfolio. Foreign securities and emerging markets involve special risks including currency fluctuations, inefficient trading, political and economic instability, and increased volatility. Investing in companies of small capitalizations involves the risk that such issuers may have limited product lines or financial resources, lack management depth, or have limited liquidity. Active trading may increase transaction costs, brokerage commissions, and taxes, which can lower the return on investment.
Before investing, carefully consider a fund’s investment objective, risks, charges, and expenses. For a prospectus and summary prospectus containing this and other information or for the Alger Global Focus Fund’s most recent month-end performance data, visit www.alger.com, call (800) 992-3863 or consult your financial advisor. Read the prospectus and summary prospectus carefully before investing.
Distributor: Fred Alger & Company, LLC.
NOT FDIC INSURED. NOT BANK GUARANTEED. MAY LOSE VALUE.
Definitions:
| • | The Consumer Price Index (CPI) is a measure of the average change over time in the prices paid by urban consumers for a market basket of consumer goods and services. |
| • | Price-to-earnings is the ratio for valuing a company that measures its current share price relative to its earnings per share (EPS). |
| • | The Russell 3000 Growth Index combines the large-cap Russell 1000 Growth, the small-cap Russell 2000 Growth and the Russell Microcap Growth Index. It includes companies that are considered more growth oriented relative to the overall market as defined by Russell’s leading style methodology. The Russell 3000 Growth Index is constructed to provide a comprehensive, unbiased, and stable barometer of the growth opportunities within the broad market. |
| • | The Russell 3000 Value Index measures the performance of the broad value segment of the US equity value universe. It includes those Russell 3000 companies with lower price-to-book ratios and lower forecasted growth values. The Russell 3000 Value Index is constructed to provide a comprehensive, unbiased and stable barometer of the broad value market. |
| • | The MSCI ACWI Index (gross) is a free float-adjusted market capitalization weighted index that is designed to measure the equity market performance of developed and emerging markets. The MSCI ACWI captures large and mid cap representation across developed markets and 26 emerging markets countries. |
| • | The MSCI Emerging Markets Index (gross) is a free float-adjusted market capitalization index that is designed to measure equity market performance in the global emerging markets. |
| • | The MSCI EAFE Index is designed to represent the performance of large and mid-cap securities across developed markets, including countries in Europe, Australasia and the Far East, excluding the U.S. and Canada. |
| • | The Russell 2000 Growth Index measures the performance of the small-cap growth segment of the U.S. equity universe. It includes those Russell 2000 companies with higher growth earning potential as defined by Russell’s leading style methodology. The Russell 2000 Growth Index is constructed to provide a comprehensive and unbiased barometer for the small-cap growth segment. |
| • | The Russell 2000 Value Index measures the performance of the small cap value segment of the U.S. equity universe. It includes those Russell 2000 companies with lower price-to-book ratios and lower forecasted growth values. The Russell 2000 Value Index is constructed to provide a comprehensive and unbiased barometer for the large-cap growth segment. |
| • | The S&P 500 Index is an index of large company stocks considered to be representative of the U.S. stock market. |
| • | The Russell 1000 Growth Index measures the performance of the large-cap growth segment of the U.S. equity universe. It includes those Russell 1000 companies with higher growth earning potential as defined by Russell’s leading style methodology. The Russell 1000 Growth Index is constructed to provide a comprehensive and unbiased barometer for the large-cap growth segment. |
FUND PERFORMANCE AS OF 3/31/22 (Unaudited) | |
| AVERAGE ANNUAL TOTAL RETURNS | |
| | | 1 YEAR | | | 5 YEARS | | | 10 YEARS | | | SINCE INCEPTION | |
Alger Global Focus Class A (Inception 11/3/03) | | | (4.31 | )% | | | 9.45 | % | | | 7.84 | % | | | 8.94 | % |
Alger Global Focus Class C (Inception 3/3/08)* | | | (0.71 | )% | | | 9.81 | % | | | 7.62 | % | | | 8.47 | % |
Alger Global Focus Class I (Inception 5/31/13) | | | 1.23 | % | | | 10.96 | % | | | n/a | | | | 9.42 | % |
Alger Global Focus Class Z (Inception 5/31/13) | | | 1.46 | % | | | 11.14 | % | | | n/a | | | | 9.64 | % |
The performance data quoted represents past performance, which is not an indication or a guarantee of future results. The Fund’s average annual total returns include changes in share price and reinvestment of dividends and capital gains. Class A returns reflect the maximum initial sales charge and Class C returns reflect the applicable contingent deferred sales charge. Before March 28, 2018, the Fund followed different investment strategies and was managed by different portfolio managers, and before August 15, 2018 was named “Alger Global Growth Fund”. Prior to May 31, 2013, the Fund was named “Alger China-U.S. Growth Fund” and followed different investment strategies. Performance prior to March 28, 2018, reflects these prior management styles and does not reflect the Fund’s current investment strategies and investment personnel.
| * | Since inception performance is calculated since the inception of Class A shares. Historical performance prior to March 3, 2008, inception of the class, is that of the Fund’s Class A shares, reduced to reflect the current maximum sales charge and the higher operating expenses of Class C shares. |
ALGER GLOBAL FOCUS FUND
Fund Highlights Through April 30, 2022 (Unaudited)
HYPOTHETICAL $10,000 INVESTMENT IN CLASS A SHARES
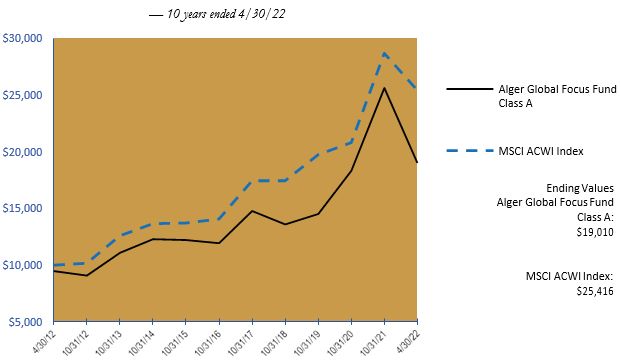
The chart above illustrates the change in value of a hypothetical $10,000 investment made in the Alger Global Focus Fund Class A shares, with an initial maximum sales charge of 5.25%, and the MSCI ACWI Index (an unmanaged index of common stocks) for the ten years ended April 30, 2022. Before March 28, 2018, the Fund followed different investment strategies and was managed by different portfolio managers, and before August 15, 2018 was named “Alger Global Growth Fund”. Prior to May 31, 2013, the Fund was named “Alger China-U.S. Growth Fund” and followed different investment strategies. Figures for the Alger Global Focus Fund Class A shares and the MSCI ACWI Index include reinvestment of dividends. Figures for the Alger Global Focus Fund Class A shares also include reinvestment of capital gains. Performance for the Alger Global Focus Fund Class C, Class I and Class Z shares will vary from the results shown above due to differences in expenses and sales charges that each class bears. Investors cannot invest directly in any index. Index performance does not reflect deduction for fees, expenses, or taxes.
ALGER GLOBAL FOCUS FUND
Fund Highlights Through April 30, 2022 (Unaudited) (Continued)
PERFORMANCE COMPARISON AS OF 4/30/22
AVERAGE ANNUAL TOTAL RETURNS
| | | 1 YEAR | | | 5 YEARS | | | 10 YEARS | | | Since 11/3/2003 | |
| Class A (Inception 11/3/03) | | | (19.97 | )% | | | 6.44 | % | | | 6.63 | % | | | 8.17 | % |
| Class C (Inception 3/3/08)* | | | (16.90 | )% | | | 6.80 | % | | | 6.41 | % | | | 7.71 | % |
| MSCI ACWI Index | | | (5.04 | )% | | | 10.00 | % | | | 9.78 | % | | | 8.36 | % |
| | | 1 YEAR | | | 5 YEARS | | | 10 YEARS | | | Since 5/31/2013 | |
| Class I (Inception 5/31/13) | | | (15.32 | )% | | | 7.92 | % | | | n/a | | | | 7.83 | % |
| Class Z (Inception 5/31/13) | | | (15.10 | )% | | | 8.10 | % | | | n/a | | | | 8.05 | % |
| MSCI ACWI Index | | | (5.04 | )% | | | 10.00 | % | | | n/a | | | | 9.26 | % |
The performance data quoted represents past performance, which is not an indication or a guarantee of future results. The Fund’s average annual total returns include changes in share price and reinvestment of dividends and capital gains. Class A returns reflect the maximum initial sales charge and Class C returns reflect the applicable contingent deferred sales charge. Before March 28, 2018, the Fund followed different investment strategies and was managed by different portfolio managers, and before August 15, 2018 was named ‘Alger Global Growth Fund”. Prior to May 31, 2013, the Fund was named ‘Alger China-U.S. Growth Fund” and followed different investment strategies. Performance prior to March 28, 2018, reflects these prior management styles and does not reflect the Fund’s current investment strategies and investment personnel. The chart and table above do not reflect the deduction of taxes that a shareholder would have paid on Fund distributions or on the redemption of Fund shares. Investment return and principal will fluctuate and the Fund’s shares, when redeemed, may be worth more or less than their original cost. Current performance may be higher or lower than the performance quoted. For updated performance, visit us at www.alger.com or call us at (800) 992-3863.
| * | Since inception performance is calculated since the inception of Class A shares. Historical performance prior to March 3, 2008, inception of the class, is that of the Fund’s Class A shares, reduced to reflect the current maximum sales charge and the higher operating expenses of Class C shares. |
April 30, 2022 (Unaudited)
| COUNTRY | | Alger Global Focus Fund | |
| Australia | | | 4.0 | % |
| China | | | 4.2 | |
| France | | | 9.5 | |
| Germany | | | 4.2 | |
| Hong Kong | | | 2.9 | |
| India | | | 2.6 | |
| Ireland | | | 2.8 | |
| Italy | | | 6.7 | |
| Netherlands | | | 8.7 | |
| Norway | | | 4.1 | |
| Spain | | | 2.2 | |
| Switzerland | | | 5.0 | |
| Taiwan | | | 1.5 | |
| United States | | | 39.9 | |
| Cash and Net Other Assets | | | 1.7 | |
| | | | 100.0 | % |
| † | Based on net assets for the Fund. |
ALGER GLOBAL FOCUS FUND
Schedule of Investments April 30, 2022 (Unaudited)
| COMMON STOCKS—98.3% | | SHARES | | | VALUE | |
| AUSTRALIA—4.0% | | | | | | |
| APPLICATION SOFTWARE—2.3% | | | | | | |
| Xero Ltd.* | | | 7,450 | | | $ | 491,304 | |
| HEALTHCARE TECHNOLOGY—1.7% | | | | | | | | |
| Pro Medicus Ltd. | | | 11,700 | | | | 382,660 | |
| TOTAL AUSTRALIA | | | | | | | | |
| (Cost $751,453) | | | | | | | 873,964 | |
| CHINA—4.2% | | | | | | | | |
| AUTOMOBILE MANUFACTURERS—2.4% | | | | | | | | |
| BYD Co., Ltd., Cl. H | | | 18,114 | | | | 527,152 | |
| FINANCIAL EXCHANGES & DATA—1.8% | | | | | | | | |
| East Money Information Co., Ltd., Cl. A | | | 112,800 | | | | 381,243 | |
| TOTAL CHINA | | | | | | | | |
| (Cost $799,831) | | | | | | | 908,395 | |
| FRANCE—9.5% | | | | | | | | |
| APPAREL ACCESSORIES & LUXURY GOODS—2.5% | | | | | | | | |
| LVMH Moet Hennessy Louis Vuitton SE | | | 825 | | | | 533,811 | |
| LIFE SCIENCES TOOLS & SERVICES—3.1% | | | | | | | | |
| Eurofins Scientific SE | | | 7,300 | | | | 678,349 | |
| RESEARCH & CONSULTING SERVICES—3.9% | | | | | | | | |
| Teleperformance | | | 2,350 | | | | 843,321 | |
| TOTAL FRANCE | | | | | | | | |
| (Cost $1,258,880) | | | | | | | 2,055,481 | |
| GERMANY—4.2% | | | | | | | | |
| AEROSPACE & DEFENSE—1.4% | | | | | | | | |
| Hensoldt AG | | | 11,000 | | | | 306,295 | |
| OIL & GAS REFINING & MARKETING—2.8% | | | | | | | | |
| VERBIO Vereinigte BioEnergie AG | | | 8,628 | | | | 611,331 | |
| TOTAL GERMANY | | | | | | | | |
| (Cost $718,294) | | | | | | | 917,626 | |
| HONG KONG—2.9% | | | | | | | | |
| APPAREL ACCESSORIES & LUXURY GOODS—2.9% | | | | | | | | |
| Samsonite International SA* | | | 290,483 | | | | 636,617 | |
| | | | | | | | |
| INDIA—2.6% | | | | | | | | |
| DIVERSIFIED BANKS—2.6% |
| | |
| |
| | |
| HDFC Bank Ltd.# | | | 10,000 | | | | 552,100 | |
| (Cost $675,716) | | | | | | | | |
| IRELAND—2.8% | | | | | | | | |
| PACKAGED FOODS & MEATS—2.8% | | | | | | | | |
| Kerry Group PLC, Cl. A | | | 5,450 | | | | 601,402 | |
| (Cost $642,123) | | | | | | | | |
| ITALY—6.7% | | | | | | | | |
| APPAREL ACCESSORIES & LUXURY GOODS—3.4% | | | | | | | | |
| Moncler SpA | | | 14,053 | | | | 731,969 | |
ALGER GLOBAL FOCUS FUND
Schedule of Investments April 30, 2022 (Unaudited) (Continued)
| COMMON STOCKS—98.3% (CONT.) | | SHARES | | | VALUE | |
| ITALY—6.7% (CONT.) | | | | | | |
| AUTOMOBILE MANUFACTURERS—3.3% | | | | | | | | |
| Ferrari NV |
|
| 3,450 | | | $ | 723,603 |
|
| TOTAL ITALY | | | | | | | | |
| (Cost $1,205,315) | | | | | | | 1,455,572 | |
| NETHERLANDS—8.7% | | | | | | | | |
| DATA PROCESSING & OUTSOURCED SERVICES—2.3% | | | | | | | | |
| Adyen NV* | | | 290 | | | | 486,346 | |
| HEAVY ELECTRICAL EQUIPMENT—3.0% | | | | | | | | |
| Alfen Beheer BV* | | | 7,300 | | | | 656,421 | |
| SEMICONDUCTOR EQUIPMENT—3.4% | | | | | | | | |
| ASML Holding NV | | | 1,291 | | | | 732,588 | |
| TOTAL NETHERLANDS | | | | | | | | |
| (Cost $1,926,269) | | | | | | | 1,875,355 | |
| NORWAY—4.1% | | | | | | | | |
| ENVIRONMENTAL & FACILITIES SERVICES—2.2% | | | | | | | | |
| Aker Carbon Capture ASA* | | | 235,219 | | | | 475,118 | |
| INDUSTRIAL MACHINERY—1.9% | | | | | | | | |
AutoStore Holdings Ltd.*,(a) | | | 180,771 | | | | 180,771 | |
| TOTAL NORWAY | | | | | | | | |
| (Cost $1,208,021) | | | | | | | 878,225 | |
| SPAIN—2.2% | | | | | | | | |
| BIOTECHNOLOGY—2.2% | | | | | | | | |
| Grifols SA# | | | 44,000 | | | | 472,120 | |
| (Cost $502,296) | | | | | | | | |
| SWITZERLAND—5.0% | | | | | | | | |
| LIFE SCIENCES TOOLS & SERVICES—2.1% | | | | | | | | |
| PolyPeptide Group AG | | | 5,244 | | | | 458,925 | |
| SPECIALTY CHEMICALS—2.9% | | | | | | | | |
| Sika AG | | | 2,000 | | | | 610,948 | |
| TOTAL SWITZERLAND | | | | | | | | |
| (Cost $853,165) | | | | | | | 1,069,873 | |
| TAIWAN—1.5% | | | | | | | | |
| SEMICONDUCTORS—1.5% | | | | | | | | |
| Taiwan Semiconductor Manufacturing Co., Ltd.# | | | 3,400 | | | | 315,962 | |
| (Cost $480,507) | | | | | | | | |
| UNITED STATES—39.9% | | | | | | | | |
| APPLICATION SOFTWARE—6.9% | | | | | | | | |
| Adobe, Inc.* | | | 1,743 | | | | 690,141 | |
| Intuit, Inc. | | | 1,900 | | | | 795,625 | |
| | | | | | | | 1,485,766 | |
| CONSUMER FINANCE—1.8% | | | | | | | | |
| American Express Co. | | | 2,200 | | | | 384,362 | |
| COPPER—2.9% | | | | | | | | |
| Freeport-McMoRan, Inc. | | | 15,700 | | | | 636,635 | |
ALGER GLOBAL FOCUS FUND
Schedule of Investments April 30, 2022 (Unaudited) (Continued)
| COMMON STOCKS—98.3% (CONT.) | | SHARES | | | VALUE | |
| UNITED STATES—39.9% (CONT.) | | | | | | |
| FINANCIAL EXCHANGES & DATA—3.7% | | | | | | | | |
| MSCI, Inc., Cl. A | | | 1,900 | | | $ | 800,375 | |
| HEALTHCARE EQUIPMENT—3.5% | | | | | | | | |
| Insulet Corp.* | | | 3,150 | | | | 752,819 | |
| INTERNET & DIRECT MARKETING RETAIL—5.2% | | | | | | | | |
| Amazon.com, Inc.* | | | 450 | | | | 1,118,533 | |
| IT CONSULTING & OTHER SERVICES—2.1% | | | | | | | | |
| EPAM Systems, Inc.* | | | 1,700 | | | | 450,483 | |
| OIL & GAS EQUIPMENT & SERVICES—2.7% | | | | | | | | |
| Schlumberger NV | | | 15,200 | | | | 592,952 | |
| SEMICONDUCTORS—3.0% | | | | | | | | |
| NVIDIA Corp. | | | 3,500 | | | | 649,145 | |
| SYSTEMS SOFTWARE—8.1% | | | | | | | | |
| Microsoft Corp. | | | 6,300 | | | | 1,748,376 | |
| TOTAL UNITED STATES | | | | | | |
| |
| (Cost $6,559,917) | | | | | | | 8,619,446
| |
| TOTAL COMMON STOCKS | | | | | | | | |
| (Cost $17,905,852) | | | | | | | 21,232,138 | |
| PREFERRED STOCKS—0.0% | | SHARES | | | VALUE | |
| UNITED STATES—0.0% | | | | | | |
| BIOTECHNOLOGY—0.0% | | | | | | | | |
Prosetta Biosciences, Inc., Series D*,@,(b),(c) | | | 33,858 | | | | – | |
| (Cost $152,361) | | | | | | | | |
| Total Investments | | | | | | | | |
| (Cost $18,058,213) | | | 98.3 | % | | $ | 21,232,138 | |
| Affiliated Securities (Cost $152,361) | | | | | | | – | |
Unaffiliated Securities (Cost $17,905,852) | | | | | | | 21,232,138
| |
| Other Assets in Excess of Liabilities | | | 1.7 | % | | | 371,370 | |
| NET ASSETS | | | 100.0 | % | | $ | 21,603,508 | |
| # | American Depositary Receipts. |
| (a) | Pursuant to Securities and Exchange Commission Rule 144A, this security may be sold prior to its maturity only to qualified institutional buyers. This security represents 1.9% of the net assets of the Fund. |
| (b) | Security is valued in good faith at fair value determined using significant unobservable inputs pursuant to procedures established by the Board. |
| (c) | deemed an affiliate of the Fund in accordance with Section 2(a)(3) of the Investment Company Act of 1940. See Note 11 - Affiliated Securities. |
| * | Non-income producing security. |
| @ | Restricted security - Investment in security not registered under the Securities Act of 1933. Sales or transfers of the investment may be restricted only to qualified buyers. |
Security | | Acquisition
Date(s) | | Acquisition Cost | | | % of net assets (Acquisition Date) | | | Market Value | | | % of net assets
as of 4/30/2022 | |
| Prosetta Biosciences, Inc., Series D | | 2/6/15 | | $ | 152,361 | | | | 0.40 | % | | $ | 0 | | | | 0.00 | % |
| Total | | | | | | | | | | | | $ | 0 | | | | 0.00 | % |
See Notes to Financial Statements.
ALGER GLOBAL FOCUS FUND
Statement of Assets and Liabilities April 30, 2022 (Unaudited)
| | | Alger Global Focus Fund | |
| | | | |
| ASSETS: | | | |
| Investments in unaffiliated securities at value (Identified cost below)* see accompanying schedule of investments | | $ | 21,232,138 | |
| Investments in affiliated securities at value (Identified cost below)** see accompanying | | | | |
| schedule of investments | | | – | |
| Cash and cash equivalents | | | 316,439 | |
| Foreign cash † | | | 12,560 | |
| Receivable for shares of beneficial interest sold | | | 679 | |
| Dividends and interest receivable | | | 37,202 | |
| Receivable from Investment Manager | | | 10,582 | |
| Prepaid expenses | | | 101,369 | |
| Total Assets | | | 21,710,969 | |
| LIABILITIES: | | | |
| Payable for shares of beneficial interest redeemed | | | 10,012 | |
| Accrued investment advisory fees | | | 15,610 | |
| Accrued distribution fees | | | 4,805 | |
| Accrued shareholder administrative fees | | | 297 | |
| Accrued administrative fees | | | 537 | |
| Accrued professional fees | | | 33,148 | |
| Accrued fund accounting fees | | | 13,759 | |
| Accrued tax payable | | | 12,052 | |
| Accrued transfer agent fees | | | 11,669 | |
| Accrued custodian fees | | | 2,776 | |
| Accrued printing fees | | | 1,075 | |
| Accrued registration fees | | | 395 | |
| Accrued trustee fees | | | 67 | |
| Accrued other expenses | | | 1,259 | |
| Total Liabilities | | | 107,461 | |
| NET ASSETS | | $ | 21,603,508 | |
NET ASSETS CONSIST OF:
| Paid in capital (par value of $.001 per share) | | | 18,909,779 | |
| Distributable earnings | | | 2,693,729 | |
| NET ASSETS | | $ | 21,603,508 | |
* Identified cost | | $ | 17,905,852 | (a) |
** Identified cost | | $ | 152,361 | (a) |
† Cost of foreign cash | | $ | 12,521 | |
See Notes to Financial Statements.
Alger Global Focus Fund
Statement of Assets and Liabilities April 30, 2022 (Unaudited) (Continued)
| | | Alger Global Focus Fund | |
| | | | |
| NET ASSETS BY CLASS: | | | |
| Class A | | $ | 16,131,552 | |
| Class C | | $ | 1,219,074 | |
| Class I | | $ | 302,895 | |
| Class Z | | $ | 3,949,987 | |
SHARES OF BENEFICIAL INTEREST OUTSTANDING — NOTE 6:
| Class A | | | 651,448 | |
| Class C | | | 53,549 | |
| Class I | | | 12,596 | |
| Class Z | | | 154,546 | |
| NET ASSET VALUE PER SHARE: | | | |
| Class A — Net Asset Value Per Share Class A | | $ | 24.76 | |
Class A — Offering Price Per Share (includes a 5.25% sales charge) | | $ | 26.13 | |
| Class C — Net Asset Value Per Share Class C | | $ | 22.77 | |
| Class I — Net Asset Value Per Share Class I | | $ | 24.05 | |
| Class Z — Net Asset Value Per Share Class Z | | $ | 25.56 | |
See Notes to Financial Statements.
(a) At April 30, 2022, the net unrealized appreciation on investments, based on cost for federal income tax purposes of $18,091,117, amounted to $3,141,021 which consisted of aggregate gross unrealized appreciation of $5,238,384 and aggregate gross unrealized depreciation of $2,097,363.
ALGER GLOBAL FOCUS FUND
Statement of Operations for the six months ended April 30, 2022 (Unaudited)
| | | Alger Global Focus Fund | |
| | | | |
| INCOME: | | | |
| Dividends (net of foreign withholding taxes*) | | $ | 66,777 | |
| Interest | | | 64 | |
| Total Income | | | 66,841 | |
| | | | |
| EXPENSES: | | | | |
Investment advisory fees — Note 3(a)
| | | 116,792 | |
| Distribution fees — Note 3(c) | | | | |
| Class A | | | 24,435 | |
| Class C | | | 7,587 | |
| Class I | | | 425 | |
| Shareholder administrative fees — Note 3(f) | | | 2,145 | |
| Administration fees — Note 3(b) | | | 4,015 | |
| Fund accounting fees | | | 29,546 | |
| Professional fees | | | 25,647 | |
| Registration fees | | | 20,498 | |
| Printing fees | | | 8,068 | |
| Transfer agent fees — Note 3(f) | | | 7,556 | |
| Custodian fees | | | 5,473 | |
| Accrued taxes | | | 4,163 | |
| Trustee fees — Note 3(g) | | | 444 | |
| Interest expenses | | | 227 | |
| Other expenses | | | 6,903 | |
| Total Expenses | | | 263,924 | |
| Less, expense reimbursements/waivers — Note 3(a) | | | (58,879 | ) |
| Net Expenses | | | 205,045 | |
| NET INVESTMENT LOSS | | | (138,204 | ) |
| | | | | |
| REALIZED AND UNREALIZED GAIN (LOSS) ON INVESTMENTS AND FOREIGN CURRENCY: | | |
|
|
| Net realized (loss) on unaffiliated investments | | | (307,809 | )
|
| Net realized gain on foreign currency transactions | | | 55 | |
| Net change in unrealized (depreciation) on unaffiliated investments | | | (8,097,636 | ) |
| Net change in unrealized (depreciation) on foreign currency | | | (1,768 | ) |
| Net realized and unrealized (loss) on investments and foreign currency | | | (8,407,158 | ) |
| NET DECREASE IN NET ASSETS RESULTING FROM OPERATIONS | | $
| (8,545,362)
| |
| * Foreign withholding taxes | | $
| 5,601
| |
See Notes to Financial Statements.
ALGER GLOBAL FOCUS FUND
Statements of Changes in Net Assets (Unaudited)
| | | Alger Global Focus Fund | |
| | | | |
| | For the Six Months Ended April 30, 2022 | | | For the Year Ended October 31, 2021 | |
| | | | | | | |
| Net investment loss | | $ | (138,204 | ) | | $ | (268,690 | ) |
Net realized gain (loss) on investments, forward foreign currency contracts and foreign currency | | | (307,754 | ) | | | 3,835,656 | |
Net change in unrealized appreciation (depreciation) on investments and foreign currency | | | (8,099,404 | ) | | | 6,025,100 | |
| Net increase (decrease) in net assets resulting from operations | | | (8,545,362 | ) | | | 9,592,066 | |
| Dividends and distributions to shareholders: | | | | | | | | |
| Class A | | | (1,963,744 | ) | | | — | |
| Class C | | | (161,011 | ) | | | — | |
| Class I | | | (33,673 | ) | | | — | |
| Class Z | | | (884,100 | ) | | | — | |
| Total dividends and distributions to shareholders | | | (3,042,528 | ) | | | — | |
| Increase (decrease) from shares of beneficial interest transactions: | | | | | | | | |
| Class A | | | 1,418,676 | | | | (887,406 | ) |
| Class C | | | (93,868 | ) | | | (632,800 | ) |
| Class I | | | 58,347 | | | | (305,088 | ) |
| Class Z | | | (3,756,471 | ) | | | 5,293,665 | |
| Net increase (decrease) from shares of beneficial interest transactions — Note 6 | | | (2,373,316 | ) | | | 3,468,371 | |
| Total increase (decrease) | | | (13,961,206 | ) | | | 13,060,437 | |
| Net Assets: | | | | | | | | |
| Beginning of period | | | 35,564,714 | | | | 22,504,277 | |
| END OF PERIOD | | $ | 21,603,508 | | | $ | 35,564,714 | |
See Notes to Financial Statements.
ALGER GLOBAL FOCUS FUND
Financial Highlights for a share outstanding throughout the period (Unaudited)
| Alger Global Focus Fund | | Class A | |
| | | Six months ended 4/30/2022(i) | | | Year ended 10/31/2021 | | | Year ended 10/31/2020 | | | Year ended 10/31/2019 | | | Year ended 10/31/2018 | | | Year ended
10/31/2017 | |
Net asset value, beginning of period
| | $ | 36.67 | | | $ | 26.21 | | | $ | 21.37 | | | $ | 21.88 | | | $ | 24.76 | | | $ | 20.20 | |
| INCOME FROM INVESTMENT OPERATIONS: | | | | | | | | | | | | | | | | | | | | | | | | |
Net investment income (loss)(ii) | | | (0.15 | ) | | | (0.31 | ) | | | (0.16 | ) | | | (0.12 | ) | | | (0.04 | ) | | | 0.03 | |
| Net realized and unrealized gain (loss) on investments | | | (8.57 | ) | | | 10.77 | | | | 5.62 | | | | 1.36 | | | | (1.86 | ) | | | 4.74 | |
| Total from investment operations | | | (8.72 | ) | | | 10.46 | | | | 5.46 | | | | 1.24 | | | | (1.90 | ) | | | 4.77 | |
| Dividends from net investment income | | | – | | | | – | | | | (0.62 | ) | | | (0.14 | ) | | | (0.98 | ) | | | (0.21 | ) |
| Distributions from net realized gains | | | (3.19 | ) | | | – | | | | – | | | | (1.61 | ) | | | – | | | | – | |
| Net asset value, end of period | | $ | 24.76 | | | $ | 36.67 | | | $ | 26.21 | | | $ | 21.37 | | | $ | 21.88 | | | $ | 24.76 | |
Total return(iii) | | | (25.82 | )% | | | 39.91 | % | | | 26.08 | % | | | 6.84 | % | | | (8.03 | )% | | | 23.80 | % |
| RATIOS/SUPPLEMENTAL DATA: | | | | | | | | | | | | | | | | | | | | | | | | |
| Net assets, end of period (000‘s omitted) | | $ | 16,132 | | | $ | 22,407 | | | $ | 16,703 | | | $ | 14,967 | | | $ | 15,679 | | | $ | 19,962 | |
| Ratio of gross expenses to average net assets | | | 1.87 | % | | | 1.73 | % | | | 2.19 | % | | | 2.50 | % | | | 2.19 | % | | | 2.48 | % |
| Ratio of expense reimbursements to average net assets | | | (0.37 | )% | | | (0.23 | )% | | | (0.69 | )% | | | (1.08 | )% | | | (0.69 | )% | | | (0.98 | )% |
| Ratio of net expenses to average net assets | | | 1.50 | % | | | 1.50 | % | | | 1.50 | % | | | 1.42 | % | | | 1.50 | % | | | 1.50 | % |
Ratio of net investment income (loss) to average net assets
| | | (1.03 | )% | | | (0.97 | )% | | | (0.69 | )% | | | (0.60 | )% | | | (0.18 | )% | | | 0.14 | % |
| Portfolio turnover rate | | | 16.91 | % | | | 64.10 | % | | | 102.71 | % | | | 224.06 | % | | | 217.51 | % | | | 134.76 | % |
See Notes to Financial Statements.
(i) | Ratios have been annualized; total return and portfolio turnover rate have not been annualized. |
(ii) | Amount was computed based on average shares outstanding during the period. |
(iii) | Does not reflect the effect of sales charges, if applicable. |
ALGER GLOBAL FOCUS FUND
Financial Highlights for a share outstanding throughout the period (Unaudited)
| Alger Global Focus Fund | | Class C
| |
| | Six months ended 4/30/2022(i) | | | Year ended 10/31/2021 | | | Year ended 10/31/2020 | | | Year ended 10/31/2019 | | | Year ended 10/31/2018 | | | Year ended 10/31/2017 | |
| Net asset value, beginning of period | | $ | 34.09 | | | $ | 24.54 | | | $ | 20.05 | | | $ | 20.65 | | | $ | 23.41 | | | $ | 19.11 | |
| INCOME FROM INVESTMENT OPERATIONS: | | | | | | | | | | | | | | | | | | | | | | | | |
| Net investment loss(ii) | | | (0.25 | ) | | | (0.50 | ) | | | (0.31 | ) | | | (0.26 | ) | | | (0.22 | ) | | | (0.12 | ) |
| Net realized and unrealized gain (loss) on investments | | | (7.88 | ) | | | 10.05 | | | | 5.27 | | | | 1.27 | | | | (1.74 | ) | | | 4.48 | |
| Total from investment operations | | | (8.13 | ) | | | 9.55 | | | | 4.96 | | | | 1.01 | | | | (1.96 | ) | | | 4.36 | |
| Dividends from net investment income | | | – | | | | – | | | | (0.47 | ) | | | – | | | | (0.80 | ) | | | (0.06 | ) |
| Distributions from net realized gains | | | (3.19 | ) | | | – | | | | – | | | | (1.61 | ) | | | – | | | | – | |
| Net asset value, end of period | | $ | 22.77 | | | $ | 34.09 | | | $ | 24.54 | | | $ | 20.05 | | | $ | 20.65 | | | $ | 23.41 | |
| Total return(iii) | | | (26.06 | )% | | | 38.86 | % | | | 25.17 | % | | | 6.00 | % | | | (8.70 | )% | | | 22.88 | % |
| RATIOS/SUPPLEMENTAL DATA: | | | | | | | | | | | | | | | | | | | | | | | | |
| Net assets, end of period (000‘s omitted) | | $ | 1,219 | | | $ | 1,922 | | | $ | 1,910 | | | $ | 2,241 | | | $ | 2,844 | | | $ | 3,673 | |
| Ratio of gross expenses to average net assets | | | 2.59 | % | | | 2.43 | % | | | 2.96 | % | | | 3.30 | % | | | 2.94 | % | | | 3.24 | % |
| Ratio of expense reimbursements to average net assets | | | (0.34 | )% | | | (0.24 | )% | | | (0.71 | )% | | | (1.13 | )% | | | (0.69 | )% | | | (0.99 | )% |
| Ratio of net expenses to average net assets | | | 2.25 | % | | | 2.19 | % | | | 2.25 | % | | | 2.17 | % | | | 2.25 | % | | | 2.25 | % |
| Ratio of net investment loss to average net assets | | | (1.78 | )% | | | (1.66 | )% | | | (1.42 | )% | | | (1.35 | )% | | | (0.94 | )% | | | (0.59 | )% |
| Portfolio turnover rate | | | 16.91 | % | | | 64.10 | % | | | 102.71 | % | | | 224.06 | % | | | 217.51 | % | | | 134.76 | % |
See Notes to Financial Statements.
(i) | Ratios have been annualized; total return and portfolio turnover rate have not been annualized. |
(ii) | Amount was computed based on average shares outstanding during the period. |
(iii) | Does not reflect the effect of sales charges, if applicable. |
ALGER GLOBAL FOCUS FUND
Financial Highlights for a share outstanding throughout the period (Unaudited)
| Alger Global Focus Fund | | Class I | |
| | Six months ended 4/30/2022(i) | | | Year ended 10/31/2021 | | | Year ended 10/31/2020 | | | Year ended 10/31/2019 | | | Year ended 10/31/2018 | | | Year ended 10/31/2017 | |
Net asset value, beginning of period
| | $ | 35.66 | | | $ | 25.42 | | | $ | 20.79 | | | $ | 21.27 | | | $ | 24.05 | | | $ | 20.36 | |
| INCOME FROM INVESTMENT OPERATIONS: | | | | | | | | | | | | | | | | | | | | | | | | |
Net investment income (loss)(ii) | | | (0.11 | ) | | | (0.21 | ) | | | (0.08 | ) | | | (0.06 | ) | | | (0.01 | ) | | | 0.08 | |
| Net realized and unrealized gain (loss) on investments | | | (8.31 | ) | | | 10.45 | | | | 5.45 | | | | 1.32 | | | | (1.77 | ) | | | 4.64 | |
| Total from investment operations | | | (8.42 | ) | | | 10.24 | | | | 5.37 | | | | 1.26 | | | | (1.78 | ) | | | 4.72 | |
| Dividends from net investment income | | | – | | | | – | | | | (0.74 | ) | | | (0.13 | ) | | | (1.00 | ) | | | (1.03 | ) |
| Distributions from net realized gains | | | (3.19 | ) | | | – | | | | – | | | | (1.61 | ) | | | – | | | | – | |
| Net asset value, end of period | | $ | 24.05 | | | $ | 35.66 | | | $ | 25.42 | | | $ | 20.79 | | | $ | 21.27 | | | $ | 24.05 | |
Total return(iii) | | | (25.70 | )% | | | 40.23 | % | | | 26.55 | % | | | 7.18 | % | | | (7.77 | )% | | | 24.15 | % |
| RATIOS/SUPPLEMENTAL DATA: | | | | | | | | | | | | | | | | | | | | | | | | |
| Net assets, end of period (000���s omitted) | | $ | 303 $ | | | $ | 376 | | | $ | 546 | | | $ | 466 | | | $ | 714 | | | $ | 286 | |
| Ratio of gross expenses to average net assets | | | 1.78 | % | | | 1.70 | % | | | 2.18 | % | | | 2.63 | % | | | 2.19 | % | | | 2.63 | % |
| Ratio of expense reimbursements to average net assets | | | (0.53 | )% | | | (0.49 | )% | | | (1.03 | )% | | | (1.51 | )% | | | (0.94 | )% | | | (1.38 | )% |
| Ratio of net expenses to average net assets | | | 1.25 | % | | | 1.21 | % | | | 1.15 | % | | | 1.12 | % | | | 1.25 | % | | | 1.25 | % |
| Ratio of net investment income (loss) to average net assets | | | (0.76 | )% | | | (0.68 | )% | | | (0.35 | )% | | | (0.28 | )% | | | (0.04 | )% | | | 0.37 | % |
| Portfolio turnover rate | | | 16.91 | % | | | 64.10 | % | | | 102.71 | % | | | 224.06 | % | | | 217.51 | % | | | 134.76 | % |
See Notes to Financial Statements.
| (i) | Ratios have been annualized; total return and portfolio turnover rate have not been annualized. |
| (ii) | Amount was computed based on average shares outstanding during the period. |
| (iii) | Does not reflect the effect of sales charges, if applicable. |
ALGER GLOBAL FOCUS FUND
Financial Highlights for a share outstanding throughout the period (Unaudited)
| Alger Global Focus Fund | | Class Z | |
| | Six months ended
4/30/2022(i) | | | Year ended 10/31/2021 | | | Year ended 10/31/2020 | | | Year ended 10/31/2019 | | | Year ended 10/31/2018 | | | Year ended 10/31/2017 | |
Net asset value, beginning of period
| | $ | 37.65 | | | $ | 26.78 | | | $ | 21.89 | | | $ | 22.37 | | | $ | 25.26 | | | $ | 20.55 | |
| INCOME FROM INVESTMENT OPERATIONS: | | | | | | | | | | | | | | | | | | | | | | | | |
Net investment income (loss)(ii) | | | (0.09 | ) | | | (0.15 | ) | | | (0.04 | ) | | | (0.03 | ) | | | 0.05 | | | | 0.12 | |
| Net realized and unrealized gain (loss) on investments | | | (8.81 | ) | | | 11.02 | | | | 5.74 | | | | 1.39 | | | | (1.90 | ) | | | 4.83 | |
| Total from investment operations | | | (8.90 | ) | | | 10.87 | | | | 5.70 | | | | 1.36 | | | | (1.85 | ) | | | 4.95 | |
| Dividends from net investment income | | | – | | | | – | | | | (0.81 | ) | | | (0.23 | ) | | | (1.04 | ) | | | (0.24 | ) |
| Distributions from net realized gains | | | (3.19 | ) | | | – | | | | – | | | | (1.61 | ) | | | – | | | | – | |
| Net asset value, end of period | | $ | 25.56 | | | $ | 37.65 | | | $ | 26.78 | | | $ | 21.89 | | | $ | 22.37 | | | $ | 25.26 | |
Total return(iii) | | | (25.61 | )% | | | 40.54 | % | | | 26.76 | % | | | 7.33 | % | | | (7.67 | )% | | | 24.33 | % |
| RATIOS/SUPPLEMENTAL DATA: | | | | | | | | | | | | | | | | | | | | | | | | |
| Net assets, end of period (000‘s omitted) | | $ | 3,950 | | | $ | 10,860 | | | $ | 3,346 | | | $ | 2,718 | | | $ | 4,857 | | | $ | 4,946 | |
| Ratio of gross expenses to average net assets | | | 1.51 | % | | | 1.42 | % | | | 1.86 | % | | | 2.35 | % | | | 2.01 | % | | | 2.35 | % |
| Ratio of expense reimbursements to average net assets | | | (0.52 | )% | | | (0.43 | )% | | | (0.87 | )% | | | (1.38 | )% | | | (0.92 | )% | | | (1.26 | )% |
| Ratio of net expenses to average net assets | | | 0.99 | % | | | 0.99 | % | | | 0.99 | % | | | 0.97 | % | | | 1.09 | % | | | 1.09 | % |
| Ratio of net investment income (loss) to average net assets | | | (0.59 | )% | | | (0.44 | )% | | | (0.19 | )% | | | (0.12 | )% | | | 0.21 | % | | | 0.53 | % |
| Portfolio turnover rate | | | 16.91 | % | | | 64.10 | % | | | 102.71 | % | | | 224.06 | % | | | 217.51 | % | | | 134.76 | % |
See Notes to Financial Statements.
| (i) | Ratios have been annualized; total return and portfolio turnover rate have not been annualized. |
| (ii) | Amount was computed based on average shares outstanding during the period. |
| (iii) | Does not reflect the effect of sales charges, if applicable. |
ALGER GLOBAL FOCUS FUND
NOTES TO FINANCIAL STATEMENTS (Unaudited)
NOTE 1 — General:
Alger Global Focus Fund (the “Fund”) is an open-end registered investment company organized as a business trust under the laws of the Commonwealth of Massachusetts. The Fund qualifies as an investment company as defined in Financial Accounting Standards Board (“FASB”) Accounting Standards Codification 946 - Financial Services - Investment Companies. The Fund’s investment objective is long-term capital appreciation. It seeks to achieve its objective by investing in equity securities in the United States and foreign countries. The Fund’s foreign investments will include securities of companies in both developed and emerging market countries.
The Fund offers Class A, C, I and Z shares. Class A shares are generally subject to an initial sales charge while Class C shares are generally subject to a deferred sales charge. Class C shares will automatically convert to Class A shares on the fifth business day of the month following the eighth anniversary of the purchase date of a shareholder’s Class C shares, without the imposition of any sales load, fee or other charge. Class C shares held at certain dealers may not convert to Class A shares or may be converted on a different schedule. At conversion, a proportionate amount of shares representing reinvested dividends and distributions will also be converted into Class A shares. Effective August 27, 2019, Class C shares were closed to direct shareholders and are only available for purchase through certain financial intermediaries and group retirement plan recordkeeping platforms. Class I shares are sold to institutional investors without an initial or deferred sales charge and Class Z shares are generally subject to a minimum initial investment of $500,000. Each class has identical rights to assets and earnings, except that each share class bears the pro rata allocation of the Fund’s expenses other than a class expense (not including advisory or custodial fees or other expenses related to the management of the Fund’s assets).
NOTE 2 - Significant Accounting Policies:
(a) Investment Valuation: The Fund values its financial instruments at fair value using independent dealers or pricing services under policies approved by the Fund’s Board of Trustees (the “Board”). Investments held by the Fund are valued on each day the New York Stock Exchange (the “NYSE”) is open, as of the close of the NYSE (normally 4:00 p.m. Eastern Time).
Investments in money market funds and short-term securities held by the Fund having a remaining maturity of sixty days or less are valued at amortized cost which approximates market value.
Equity securities, including traded rights, warrants and option contracts for which valuation information is readily available, are valued at the last quoted sales price or official closing price on the primary market or exchange on which they are traded as reported by an independent pricing service. In the absence of quoted sales, such securities are valued at the bid price or, in the absence of a recent bid price, the equivalent as obtained from one or more of the major market makers for the securities to be valued.
ALGER GLOBAL FOCUS FUND
NOTES TO FINANCIAL STATEMENTS (Unaudited)
Debt securities generally trade in the over-the-counter market. Debt securities with remaining maturities of more than sixty days at the time of acquisition are valued on the basis of the last available bid prices or current market quotations provided by dealers or pricing services. In determining the value of a particular investment, pricing services may use certain information with respect to transactions in such investments, quotations from dealers, pricing matrixes, market transactions in comparable investments, various relationships observed in the market between investments and calculated yield measures based on valuation technology commonly employed in the market for such investments. Asset-backed and mortgage-backed securities are valued by independent pricing services using models that consider estimated cash flows of each tranche of the security, establish a benchmark yield and develop an estimated tranche-specific spread to the benchmark yield based on the unique attributes of the tranche. Debt securities with a remaining maturity of sixty days or less are valued at amortized cost which approximates market value.
Securities for which market quotations are not readily available are valued at fair value, as determined in good faith pursuant to procedures established by the Board and described further herein.
Securities in which the Fund invests may be traded in foreign markets that close before the close of the NYSE. Developments that occur between the close of the foreign markets and the close of the NYSE may result in adjustments to the closing foreign prices to reflect what the Fund’s investment adviser, pursuant to policies established by the Board, believes to be the fair value of these securities as of the close of the NYSE. The Fund may also fair value securities in other situations, for example, when a particular foreign market is closed but the Fund is open.
FASB Accounting Standards Codification 820 - Fair Value Measurements and Disclosures (“ASC 820”) defines fair value as the price that the Fund would receive upon selling an investment in a timely transaction to an independent buyer in the principal or most advantageous market of the investment. ASC 820 established a three-tier hierarchy to maximize the use of observable market data and minimize the use of unobservable inputs and to establish classification of fair value measurements for disclosure purposes. Inputs refer broadly to the assumptions that market participants would use in pricing the asset or liability and may be observable or unobservable. Observable inputs are based on market data obtained from sources independent of the Fund. Unobservable inputs are inputs that reflect the Fund’s own assumptions based on the best information available in the circumstances. The three-tier hierarchy of inputs is summarized in the three broad Levels listed below.
| • | Level 1 - quoted prices in active markets for identical investments |
| • | Level 2 - significant other observable inputs (including quoted prices for similar investments, interest rates, prepayment speeds, credit risk, etc.) |
| • | Level 3 - significant unobservable inputs (including the Fund’s own assumptions in determining the fair value of investments) |
ALGER GLOBAL FOCUS FUND
NOTES TO FINANCIAL STATEMENTS (Unaudited)
The Fund’s valuation techniques are generally consistent with either the market or the income approach to fair value. The market approach considers prices and other relevant information generated by market transactions involving identical or comparable assets to measure fair value. The income approach converts future amounts to a current, or discounted, single amount. These fair value measurements are determined on the basis of the value indicated by current market expectations about such future events. Inputs for Level 1 include exchange-listed prices and broker quotes in an active market. Inputs for Level 2 include the last trade price in the case of a halted security, an exchange-listed price which has been adjusted for fair value factors, and prices of closely related securities. Additional Level 2 inputs include an evaluated price which is based upon a compilation of observable market information such as spreads for fixed income and preferred securities. Inputs for Level 3 include, but are not limited to, revenue multiples, earnings before interest, taxes, depreciation and amortization (“EBITDA”) multiples, discount rates, time to exit and the probabilities of success of certain outcomes. Such unobservable market information may be obtained from a company’s financial statements and from industry studies, market data, and market indicators such as benchmarks and indexes. Because of the inherent uncertainty and often limited markets for restricted securities, the valuations assigned to such securities by the Fund may significantly differ from the valuations that would have been assigned by the Fund had there been an active market for such securities.
Valuation processes are determined by a Valuation Committee (“Committee”) authorized by the Board and comprised of representatives of the Fund’s investment adviser and officers of the Fund. The Committee reports its fair value determinations and related valuation information to the Board. The Board is responsible for approving the valuation policy and procedures.
While committee meetings are held on an as-needed basis, the Committee generally meets quarterly to review and evaluate the effectiveness of the procedures for making fair value determinations. The Committee considers, among other things, the results of quarterly back testing of the fair value model for foreign securities, pricing comparisons between primary and secondary price sources, the outcome of price challenges put to the Fund’s pricing vendor, and variances between transactional prices and the previous day’s prices.
In December 2020, the Securities and Exchange Commission adopted Rule 2a-5 under the Investment Company Act of 1940, as amended (the “1940 Act”), which is intended to address valuation practices and the role of the board of directors with respect to the fair value of the investments of a registered investment company. Among other things, Rule 2a-5 will permit Board to designate the Fund’s investment adviser, Fred Alger Management, LLC (“Alger Management” or the “Investment Manager”), to perform the Fund’s fair value determinations, which will be subject to the Board’s oversight and certain reporting and other requirements intended to ensure that the Board receives the information it needs to oversee the Investment Manager’s fair value determinations. Compliance with Rule 2a-5 will not be required until September 2022. The Funds, the Board, and the Investment Manager are currently in the process of implementing the requirements of Rule 2a-5 for compliance with these requirements by the September 2022 compliance deadline.
(b) Cash and Cash Equivalents: Cash and cash equivalents include U.S. dollars, foreign cash and overnight time deposits.
(c) Securities Transactions and Investment Income: Securities transactions are recorded on a trade date basis. Realized gains and losses from securities transactions are recorded on the identified cost basis. Dividend income is recognized on the ex-dividend date and interest income is recognized on the accrual basis.
ALGER GLOBAL FOCUS FUND
NOTES TO FINANCIAL STATEMENTS (Unaudited)
Premiums and discounts on debt securities purchased are amortized or accreted over the lives of the respective securities.
(d) Foreign Currency Transactions: The books and records of the Fund are maintained in U.S. dollars. Foreign currencies, investments and other assets and liabilities are translated into U.S. dollars at the prevailing rates of exchange on the valuation date. Purchases and sales of investment securities and income and expenses are translated into U.S. dollars at the prevailing exchange rates on the respective dates of such transactions.
Net realized gains and losses on foreign currency transactions represent net gains and losses from the disposition of foreign currencies, currency gains and losses realized between the trade dates and settlement dates of security transactions, and the difference between the amount of net investment income accrued and the U.S. dollar amount actually received. The effects of changes in foreign currency exchange rates on investments in securities are included in realized and unrealized gain or loss on investments in the accompanying Statement of Operations.
(e) Forward Foreign Exchange Contracts: The Fund may enter into forward foreign currency contracts to hedge against foreign currency exchange rate risk on its non-U.S. dollar denominated securities or to facilitate settlement of foreign currency denominated portfolio transactions. A forward foreign currency contract is an agreement between two parties to buy and sell a currency at a set price on a future date. The contract is marked-to-market daily and the change in value is recorded by the Fund as an unrealized gain or loss. Realized gains or losses equal to the difference between the value of the contract at the time it was opened and the value at the time it was closed are recorded upon delivery or receipt of the currency.
These contracts may involve market risk in excess of the unrealized gain or loss reflected on the Statement of Assets and Liabilities. In addition, the Fund could be exposed to risk if the counterparties are unable to meet the terms of the contracts or if the value of the currency changes unfavorably to the base currency.
(f) Dividends to Shareholders: Dividends and distributions payable to shareholders are recorded by the Fund on the ex-dividend date. The Fund declares and pays dividends from net investment income, if available, annually. Dividends from net realized gains, offset by any loss carryforward, are declared and paid annually after the end of the fiscal year in which they were earned.
Each share class is treated separately in determining the amount of dividends from net investment income payable to holders of its shares.
The characterization of distributions to shareholders for financial reporting purposes is determined in accordance with federal income tax rules. Therefore, the source of the Fund’s distributions may be shown in the accompanying financial statements as either from, or in excess of, net investment income, net realized gain on investment transactions, or return of capital, depending on the type of book/tax differences that may exist. Capital accounts within the financial statements are adjusted for permanent book/tax differences. Reclassifications result primarily from the differences in tax treatment of net operating losses, passive foreign investment companies, and foreign currency transactions. The reclassifications are done annually at year-end and have no impact on the net asset value of the Fund and are designed to present the Fund’s capital accounts on a tax basis.
ALGER GLOBAL FOCUS FUND
NOTES TO FINANCIAL STATEMENTS (Unaudited)
(g) Federal Income Taxes: It is the Fund’s policy to comply with the requirements of the Internal Revenue Code Subchapter M applicable to regulated investment companies and to distribute all of its taxable income to its shareholders. Provided that the Fund maintains such compliance, no federal income tax is required.
FASB Accounting Standards Codification 740 - Income Taxes (“ASC 740”) requires the Fund to measure and recognize in its financial statements the benefit of a tax position taken (or expected to be taken) on an income tax return if such position will more likely than not be sustained upon examination based on the technical merits of the position. No tax years are currently under investigation. The Fund files income tax returns in the U.S. Federal jurisdiction, as well as the New York State and New York City jurisdictions. The statute of limitations on the Fund’s tax returns remains open for the tax years 2018-2021. Management does not believe there are any uncertain tax positions that require recognition of a tax liability.
(h) Allocation Methods: Income, realized and unrealized gains and losses, and expenses of the Fund are allocated among the Fund’s classes based on relative net assets, with the exception of distribution fees, transfer agency fees, and shareholder servicing and related fees.
(i) Estimates: These financial statements have been prepared in accordance with accounting principles generally accepted in the United States of America, which require using estimates and assumptions that affect the reported amounts therein. These unaudited interim financial statements reflect all adjustments that are, in the opinion of management, necessary to present a fair statement of results for the interim period. Actual results may differ from those estimates. All such estimates are of a normal recurring nature.
NOTE 3 - Investment Advisory Fees and Other Transactions with Affiliates:
(a) Investment Advisory Fees: Fees incurred by the Fund, pursuant to the provisions of the Fund’s Investment Advisory Agreement with the Investment Manager, are payable monthly and computed based on the following rates. The actual rate paid as a percentage of average daily net assets, for the six months ended April 30, 2022, is set forth below under the heading “Actual Rate”:
| | | Tier 1 | | | Tier 2 | | | Actual Rate | |
Alger Global Focus Fund(a) | | | 0.80 | %
| | | 0.70 | %
| | | 0.80 | %
|
(a) Tier 1 rate is paid on assets up to $500 million, Tier 2 rate is paid on assets in excess of $500 million.
ALGER GLOBAL FOCUS FUND
NOTES TO FINANCIAL STATEMENTS (Unaudited) (Continued)
Alger Management has contractually agreed to waive fees or to reimburse Fund expenses (excluding acquired fund fees and expenses, dividend expense on short sales, borrowing costs, interest, taxes, brokerage and extraordinary expenses) through February 29, 2024 to the extent necessary to limit the total annual fund operating expenses exceed the rates, based on average daily net assets, as listed in the table below:
| | | CLASS | | | FEES WAIVED / REIMBURSED FOR THE SIX MONTHS ENDED | |
|
|
| A |
|
|
| C |
|
| | I |
|
| | Z |
| | APRIL 30, 2022 | |
Alger Global Focus Fund | | | 1.50 | % | | | 2.25 | % | | | 1.25 | % | | | 0.99 | % | | $ | 58,879
| |
Alger Management may, during the term of the contract, recoup any fees waived or expenses reimbursed pursuant to the contract; however, the Fund will only make repayments to the Investment Manager if such repayment does not cause the Fund’s expense ratio after the repayment is taken into account, to exceed both (i) the expense cap in place at the time such amounts were waived or reimbursed, and (ii) the Fund’s current expense cap. Such recoupment is limited to two years from the date the amount is initially waived or reimbursed. For the six months ended April 30, 2022 there were no recoupments made to the Investment Manager.
(b) Administration Fees: Fees incurred by the Fund, pursuant to the provisions of the Fund’s Fund Administration Agreement with Alger Management, are payable monthly and computed based on the average daily net assets of the Fund at the annual rate of 0.0275%.
(c) Distribution Shareholder Servicing Fees: The Fund has adopted distribution plans for its Class A, Class C and Class I shares pursuant to which the Fund pays Fred Alger & Company, LLC, the Fund’s distributor and an affiliate of the Investment Manager (the “Distributor” or “Alger LLC”) a fee at the annual rate of 0.25% of the average daily net assets of the Class A and Class I shares and 1.00% of the average daily net assets of the Class C shares to compensate Alger LLC for its activities and expenses incurred in distributing and/or administering the Fund’s shares and/or shareholder servicing. The fees paid may be more or less than the expenses incurred by Alger LLC.
(d) Sales Charges: Sales of shares of the Fund may be subject to contingent deferred sales charges. The contingent deferred sales charges are used by Alger LLC to offset distribution expenses previously incurred. Sales charges do not represent expenses of the Fund. For the six months ended April 30, 2022, contingent deferred sales charges imposed, all of which were retained by Alger LLC, were as follows:
| | | CONTINGENT DEFERRED SALES CHARGES | |
| Alger Global Focus Fund | | $ | 77 | |
(e) Brokerage Commissions: During the six months ended April 30, 2022, the Fund paid Alger LLC $138 in connection with securities transactions.
ALGER GLOBAL FOCUS FUND
NOTES TO FINANCIAL STATEMENTS (Unaudited) (Continued)
(f) Shareholder Administrative Fees: The Fund has entered into a Shareholder Administrative Services Agreement with Alger Management to compensate Alger Management for liaising with, and providing administrative oversight of, the Fund’s transfer agent, and for other related services. The Fund compensates Alger Management at the annual rate of 0.0165% of the respective average daily net assets of Class A and Class C shares and 0.01% of the respective average daily net assets for the Class I and Class Z shares for these services.
Alger Management makes payments to intermediaries that provide sub-accounting services to omnibus accounts invested in the Fund. A portion of the fees paid by Alger Management to intermediaries that provide sub-accounting services are charged back to the Fund, subject to certain limitations, as approved by the Board. For the six months ended April 30, 2022, Alger Management charged back $4,111 to the Fund for these services, which are included in transfer agent fees in the accompanying Statement of Operations.
(g) Trustee Fees: Each trustee who is not an “interested person” of the Fund, as defined in the 1940 Act (“Independent Trustee”), receives a fee of $156,000 per annum, paid pro rata based on net assets by each fund in the Alger Fund Complex, plus travel expenses incurred for attending board meetings. The term “Alger Fund Complex” refers to the Fund, The Alger Institutional Funds, The Alger Funds II, The Alger Funds, The Alger Portfolios and The Alger ETF Trust, each of which is a registered investment company managed by Alger Management. The Independent Trustee appointed as Chairman of the Board receives additional compensation of $22,000 per annum paid pro rata based on net assets by each fund in the Alger Fund Complex. Additionally, each member of the Audit Committee receives a fee of $13,000 per annum, paid pro rata based on net assets by each fund in the Alger Fund Complex.
Effective January 1, 2022, the Board adopted a policy requiring Trustees to receive a minimum of 10% of their annual compensation in shares of one or more of the funds in the Alger Fund Complex.
Prior to January 1, 2022, each Independent Trustee received a fee of $142,000 per annum, paid pro rata based on net assets by each fund in the Alger Fund Complex, plus travel expenses incurred for attending board meetings. The Independent Trustee appointed as Chairman of the Board received additional compensation of $20,000 per annum paid pro rata based on net assets by each fund in the Alger Fund Complex. Additionally, each member of the Audit Committee received a fee of $13,000 per annum, paid pro rata based on net assets by each fund in the Alger Fund Complex.
(h) Interfund Trades: The Fund may engage in purchase and sale transactions with other funds advised by Alger Management or Weatherbie Capital, LLC, an affiliate of Alger Management. There were no interfund trades during the six months ended April 30, 2022.
(i) Interfund Loans: The Fund, along with other funds in the Alger Fund Complex, may borrow money from and lend money to each other for temporary or emergency purposes. To the extent permitted under its investment restrictions, the Fund may lend uninvested cash in an amount up to 15% of its net assets to other funds in the Alger Fund Complex. If the Fund has borrowed from other funds in the Alger Fund Complex and has aggregate borrowings from all sources that exceed 10% of the Fund’s total assets, the Fund will secure all of its loans from other funds in the Alger Fund Complex. The interest rate charged on interfund loans is equal to the average of the overnight time deposit rate and bank loan rate available to the Fund. There were no interfund loans outstanding as of April 30, 2022.
ALGER GLOBAL FOCUS FUND
NOTES TO FINANCIAL STATEMENTS (Unaudited) (Continued)
During the six months ended April 30, 2022, the Fund incurred interfund loan interest expenses of $217, which are included as interest expenses in the accompanying Statements of Operations.
(j) Other Transactions with Affiliates: Certain officers and one Trustee of the Fund are directors and/or officers of Alger Management, the Distributor, or their affiliates. At April 30, 2022, Alger Management and its affiliated entities owned the following shares:
| | | SHARE CLASS | |
|
|
| A
|
| | | C
|
|
| | I
|
|
|
| Z
|
|
| | | | | | | | | | | | | | | | |
Alger Global Focus Fund | | | — | | | | — | | | | — | | | | 16,199 | |
NOTE 4 — Securities Transactions:
The following summarizes the securities transactions by the Fund, other than U.S. Government securities and short-term securities for the six months ended April 30, 2022:
| | | PURCHASES | | | SALES | |
| | | | | | |
Alger Global Focus Fund | | $ | 4,916,752 | | | | 10,129,666 | |
NOTE 5 — Borrowings:
The Fund may borrow from Brown Brothers Harriman & Co., the Fund’s custodian (the “Custodian” or “BBH”), on an uncommitted basis. The Fund pays the Custodian a market rate of interest, generally based upon a rate of return with respect to each respective currency borrowed, taking into consideration relevant overnight and short-term reference rates, and the range of distribution between and among the interest rates paid on deposits to other institutions, less applicable commissions, if any. The Fund may also borrow from other funds in the Alger Fund Complex, as discussed in Note 3(i). For the six months ended April 30, 2022, the Fund had the following borrowings from the Custodian and other funds in the Alger Fund Complex:
| | | | | WEIGHTED AVERAGE INTEREST RATE | |
| | | | | | | | |
The highest amount borrowed from the Custodian and other funds in the Alger Fund
Complex during the six months ended April 30, 2022 by the Fund was as follows:
| | | HIGHEST BORROWING | |
Alger Global Focus Fund | | $ | 1,905,000 | |
ALGER GLOBAL FOCUS FUND
NOTES TO FINANCIAL STATEMENTS (Unaudited) (Continued)
On September 7, 2021, BBH, the Fund’s custodian, announced that it had entered into an agreement with State Street Bank and Trust Company (“State Street”) to sell BBH’s Investor Services business to State Street (the “Transaction”). The completion of the Transaction is subject to customary closing conditions and regulatory approvals. As a result of the Transaction, it is expected that State Street will replace BBH as the Fund’s custodian effective as of the completion of the Transaction, the timing of which is not currently finalized.
NOTE 6 — Share Capital:
The Fund has an unlimited number of authorized shares of beneficial interest of $.001 par value. During the period ended April 30, 2022, and the year ended October 30, 2021, transactions of shares of beneficial interest were as follows:

| | | FOR THE SIX MONTHS ENDED APRIL 30, 2022 | | | FOR THE YEAR ENDED OCTOBER 31, 2021 | |
| | | SHARES | | | AMOUNT | | | SHARES | | | AMOUNT | |
| Alger Global Focus Fund | | | | | | | | | | | | |
| Class A: | | | | | | | | | | | | |
| Shares sold | | 13,354 | | $ | 453,041 | | | 25,347 | | $ | 805,581 | |
| Shares converted from Class C | | 18 | | | 545 | | | 295 | |
| 9,527 | |
| Dividends reinvested | | 57,047 | | | 1,844,318 | | | — | |
| — | |
| Shares redeemed | | (30,018) | | | (879,228) | | | (51,837) | |
| (1,702,514) | |
Net increase (decrease) | | 40,401
| | $ | 1,418,676 | | | (26,195)
| | $ | (887,406) | |
| Class C: | | | | | | | | | | | | |
Shares sold
| | 239 | | $ | 6,785 | | | 383
| | $ | 12,690 | |
| Shares converted to Class A | | (19) | | | (545) | | | (316) | |
| (9,527) | |
| Dividends reinvested | | 5,401 | | | 161,011 | | | — | |
| — | |
| Shares redeemed | | (8,447) | | | (261,119) | | | (21,505) | |
| (635,963) | |
Net decrease
| | (2,826) | | $ | (93,868) | | | (21,438)
| | $ | (632,800) | |
| Class I: | | | | | | | | | | | | |
Shares sold
| | 1,584 | | $ | 43,399 | | | 751
| | $ | 23,197 | |
| Dividends reinvested | | 1,073 | | | 33,673 | | | — | | | — | |
| Shares redeemed | | (610) | | | (18,725) | | | (11,694) | | | (328,285) | |
| Net increase (decrease) | | 2,047 | | $ | 58,347 | | | (10,943)
| | $ | (305,088) | |
| Class Z: | | | | | | | | | | | | |
| Shares sold | | 14,746 $ | | | 552,729 | | | 188,197
| | $ | 6,112,681 | |
| Dividends reinvested | | 24,862 | | | 828,146 | | | — | | | — | |
| Shares redeemed | | (173,480) | | | (5,137,346) | | | (24,688) | | | (819,016) | |
| Net increase (decrease) | | (133,872)
| | $ | (3,756,471) | | | 163,509
| | $ | 5,293,665 | |
NOTE 7 — Income Tax Information:
At October 31, 2021, the Fund had no capital loss carryforwards utilized for federal income tax purposes.
The difference between book-basis and tax-basis unrealized appreciation (depreciation) is determined annually and is attributable primarily to the tax deferral of losses on wash sales, U.S. Internal Revenue Code Section 988 currency transactions, tax treatment of partnership investments, the realization of unrealized appreciation of passive foreign investment companies, and the return of capital from real estate investment trust investments.
The Fund accrues tax on unrealized gains in foreign jurisdictions that impose a foreign capital tax.
ALGER GLOBAL FOCUS FUND
NOTES TO FINANCIAL STATEMENTS (Unaudited) (Continued)
NOTE 8 — Fair Value Measurements:
The following is a summary of the inputs used as of April 30, 2022, in valuing the Fund’s investments carried at fair value on a recurring basis. Based upon the nature, characteristics, and risks associated with its investments, the Fund has determined that presenting them by security type and sector is appropriate.
| Alger Global Focus Fund | | TOTAL | | | LEVEL 1 | | | LEVEL 2 | | | LEVEL 3 | |
| COMMON STOCKS | | | | | | | | | | | | |
| Consumer Discretionary | | $ | 4,271,685 | | | $ | 1,842,136 | | | $ | 2,429,549 | | | $ | — | |
| Consumer Staples | | | 601,402 | | | | — | | | | 601,402 | | | | — | |
| Energy | | | 1,204,283 | | | | 592,952 | | | | 611,331 | | | | — | |
| Financials | | | 2,118,080 | | | | 1,736,837 | | | | 381,243 | | | | — | |
| Healthcare | | | 2,744,873 | | | | 1,224,939 | | | | 1,519,934 | | | | — | |
| Industrials | | | 2,684,262 | | | | — | | | | 2,684,262 | | | | — | |
| Information Technology | | | 6,359,970 | | | | 4,649,732 | | | | 1,710,238 | | | | — | |
| Materials | | | 1,247,583 | | | | 636,635 | | | | 610,948 | | | | — | |
| TOTAL COMMON STOCKS | | $ | 21,232,138 | | | $ | 10,683,231 | | | $ | 10,548,907 | | | $ | — | |
| PREFERRED STOCKS | | | | | | | | | | | | | | | | |
| Healthcare | | | — | * | | | — | | | | — | | | | — | * |
| TOTAL INVESTMENTS IN SECURITIES | | $ | 21,232,138 | | | $ | 10,683,231 | | | $ | 10,548,907 | | | $ | — | |
* Prosetta Biosciences, Inc., Series shares are classified as a Level 3 investment and are fair valued at zero as of April 30, 2022.
| | | FAIR VALUE MEASUREMENTS USING SIGNIFICANT UNOBSERVABLE INPUTS (LEVEL 3) | |
| Alger Global Focus Fund | | Preferred Stocks | |
| Opening balance at November 1, 2021 | | $ | 0 | * |
| Transfers into Level 3 | | | — | |
| Transfers out of Level 3 | | | — | |
| Total gains or losses | | | | |
| Included in net realized gain (loss) on investments | | | — | |
| Included in net change in unrealized appreciation (depreciation) on investments | | | — | |
| Purchases and sales | | | | |
| Purchases | | | — | |
| Sales | | | — | |
| Closing balance at April 30, 2022 | | | 0 | * |
| Net change in unrealized appreciation (depreciation) attributable to investments still held at April 30, 2022** | | | — | |
* Includes securities that are valued zero.
** Net change in unrealized appreciation (depreciation) is included in net change in unrealized appreciation (depreciation) on investments in the accompanying statement of operations.
ALGER GLOBAL FOCUS FUNDNOTES TO FINANCIAL STATEMENTS (Unaudited) (Continued)
The following table provides quantitative information about the Fund’s Level 3 fair value measurements of the Fund’s investments as of April 30, 2022. The table below is not intended to be all-inclusive, but rather provides information on the Level 3 inputs as they relate to the Fund’s fair value measurements.
| | Fair Value April 30, 2022 | | Valuation Methodology | Unobservable Input | | Range/Input | | | Weighted Average Inputs | |
| Alger Global Focus Fund | | | | | | | | | | | |
| Preferred Stocks | | $ | – | * | Income Approach | Discount Rate | | | 100.00 | % | | | N/A | |
* Prosetta Biosciences, Inc., Series shares are classified as a Level 3 investment and are fair valued at zero as of April 30, 2022.
The significant unobservable inputs used in the fair value measurement of the Fund’s securities are revenue and EBITDA multiples, discount rates, and the probability of success of certain outcomes. Significant increases and decreases in these inputs in isolation and interrelationships between these inputs would have resulted in significantly higher or lower fair value measurements than those noted in the table above. Generally, all other things being equal, increases in revenue and EBITDA multiples, decreases in discount rates, and increases in the probability of success result in higher fair value measurements, whereas decreases in revenues and EBITDA multiples, increases in discount rates, and decreases in the probability of success result in lower fair value measurements.
Certain of the Fund’s assets and liabilities are held at carrying amount or face value, which approximates fair value for financial statements purposes. As of April 30, 2022, such assets were categorized within the ASC 820 disclosure hierarchy as follows:
| | | TOTAL | | | LEVEL 1 | | | LEVEL 2 | | | LEVEL 3 | |
| Cash, foreign cash and cash equivalents | | $ | 328,999 | | | $ | 12,560 | | | $ | 316,439 | | | $ | – | |
NOTE 9 — Derivatives:
FASB Accounting Standards Codification 815 - Derivatives and Hedging (“ASC 815”) requires qualitative disclosures about objectives and strategies for using derivatives, quantitative disclosures about fair value amounts of and gains and losses on derivative instruments, and disclosures about credit-risk-related contingent features in derivative agreements.
There were no derivative instruments held by the Fund throughout the period or as of April 30, 2022.
ALGER GLOBAL FOCUS FUNDNOTES TO FINANCIAL STATEMENTS (Unaudited) (Continued)
NOTE 10 — Principal Risks:
Investing in the stock market involves risks, including the potential loss of principal. The value of these securities, like other investments, may move up or down, sometimes rapidly and unpredictably. Your Fund shares at any point in time may be worth less than what you invested, even after taking into account the reinvestment of Fund dividends and distributions. Local, regional or global events such as environmental or natural disasters, war, terrorism, pandemics, outbreaks of infectious diseases and similar public health threats, recessions, or other events could have a significant impact on investments. Growth stocks may be more volatile than other stocks as their prices tend to be higher in relation to their companies’ earnings and may be more sensitive to market, political, and economic developments. A significant portion of assets may be invested in securities of companies in related sectors, and may be similarly affected by economic, political, or market events and conditions and may be more vulnerable to unfavorable sector developments. Assets may be focused in a small number of holdings, making them susceptible to risks associated with a single economic, political or regulatory event than a more diversified portfolio. Foreign securities and Emerging Markets involve special risks including currency fluctuations, inefficient trading, political and economic instability, and increased volatility. Investing in companies of small capitalizations involves the risk that such issuers may have limited product lines or financial resources, lack management depth, or have limited liquidity. Active trading may increase transaction costs, brokerage commissions, and taxes, which can lower the return on investment.
Transactions in foreign securities may involve certain considerations and risks not typically associated with those of U.S. companies because of, among other factors, the level of governmental supervision and regulation of foreign security markets, and the possibility of political or economic instability. Additional risks associated with investing in emerging markets include increased volatility, limited liquidity, and less stringent regulatory and legal systems.
NOTE 11 - Affiliated Securities:
The issuers of the securities listed below are deemed to be affiliates of the Fund because the Fund and its affiliates owned, collectively, 5% or more of the issuer’s voting securities during all or part of the six months ended April 30, 2022. Information regarding the Fund’s holdings of such securities is set forth in the following table:
| Security | | Value at October 31, 2021 | | | Purchases/ Conversion | | | Sales/ Conversion | | | Dividend/ Interest Income | | | Realized Gain (Loss) | | | Net Change in Unrealized App(Dep) | | | Value at April 30, 2022 | |
| Alger Global Focus Fund | | | | | | | | | | | | | | | | | | | | | |
| Preferred Stocks | | | | | | | | | | | | | | | | | | | | | |
| Prosetta Biosciences, Inc., Series D | | | | * | | $ | – | | | $ | – | | | $ | – | | | $ | – | | | $ | – | | | $ | – | * |
| Total | | | | | | $ | – | | | $ | – | | | $ | – | | | $ | – | | | $ | – | | | $ | – | |
* Prosetta Biosciences, Inc., Series shares are classified as a Level 3 investment and are fair valued at zero as of April 30, 2022.
NOTE 12 — Subsequent Events:
Management of the Fund has evaluated events that have occurred subsequent to April 30, 2022, through the issuance date of the Financial Statements. No such events have been identified which require recognition and/or disclosure.
ALGER GLOBAL FOCUS FUND
ADDITIONAL INFORMATION (Unaudited)
Shareholder Expense Example
As a shareholder of the Fund, you incur two types of costs: transaction costs, if applicable, including sales charges (loads) and redemption fees; and ongoing costs, including management fees, distribution (12b-1) fees, if applicable, and other Fund expenses. This example is intended to help you understand your ongoing costs (in dollars) of investing in the Fund and to compare these costs with the ongoing costs of investing in other mutual funds.
The example below is based on an investment of $1,000 invested at the beginning of the six-month period starting November 1, 2021 and ending April 30, 2022 and held for the entire period.
Actual Expenses
The first line for each class of shares in the table below provides information about actual account values and actual expenses. You may use the information in this line, together with the amount you invested, to estimate the expenses that you paid over the period. Simply divide your account value by $1,000 (for example, an $8,600 account value divided by $1,000 = 8.6), then multiply the result by the number in the first line under the heading entitled “Expenses Paid During the Six Months Ended April 30, 2022” to estimate the expenses you paid on your account during this period.
Hypothetical Example for Comparison Purposes
The second line for each class of shares in the table below provides information about hypothetical account values and hypothetical expenses based on the actual expense ratio for each class of the Fund’s shares and an assumed rate of return of 5% per year before expenses, which is not the Fund’s actual return. The hypothetical account values and expenses may not be used to estimate the actual ending account balance or expenses you paid for the period. You may use this information to compare the ongoing costs of investing in the Fund and other funds. To do so, compare this 5% hypothetical example with the 5% hypothetical examples that appear in the shareholder reports of other funds.
Please note that the expenses shown in the table are meant to highlight your ongoing costs only and do not reflect any transaction costs, such as sales charges (loads) and redemption fees. Therefore, the second line under each class of shares in the table is useful in comparing ongoing costs only, and will not help you determine the relative total costs of owning different funds. In addition, if these transactional costs were included, your costs would have been higher.
ALGER GLOBAL FOCUS FUND
ADDITIONAL INFORMATION (Unaudited) (Continued)
| | | | Beginning Account Value November 1, 2021 | | | Ending Account Value April 30, 2022 | | | Expenses Paid During the Six Months Ended April 30, 2022(a) | | | Annualized Expense Ratio For the Six Months Ended April 30, 2022(b) | |
| Alger Global Focus Fund | | | | | | | | | | | | |
| Class A | Actual | | $ | 1,000.00 | | | $ | 702.90 | | | $ | 6.33 | | | | 1.50 | % |
| Hypothetical(c) | | | 1,000.00 | | | | 1,017.36 | | | | 7.50 | | | | 1.50 | |
| Class C | Actual | | | 1,000.00 | | | | 732.70 | | | | 9.67 | | | | 2.25 | |
| Hypothetical(c) | | | 1,000.00 |
|
|
| 1,013.64 | | | | 11.23 | | | | 2.25 | |
| Class I | Actual | | | 1,000.00 |
| | | 743.00 | | | | 5.40 | | | | 1.25 | |
| Hypothetical(c) | | | 1,000.00 |
| | | 1,018.60 | | | | 6.26 | | | | 1.25 | |
| Class Z | Actual | | | 1,000.00 | | | | 743.90 | | | | 4.28 | | | | 0.99 | |
| Hypothetical(c) | | | 1,000.00 | | | | 1,019.89 | | | | 4.96 | | | | 0.99 | |
(a)
| Expenses are equal to the annualized expense ratio of the respective share class, multiplied by the average account value over the period, multiplied by 181 365 (to reflect the one-half year period). |
(c)
| 5% annual return before expenses. |
ALGER GLOBAL FOCUS FUND
ADDITIONAL INFORMATION (Unaudited) (Continued)
Privacy Policy
U.S. Consumer Privacy Notice
| | Rev. 6/22/21 |
| | FACTS | | WHAT DOES ALGER DO WITH YOUR PERSONAL INFORMATION? |
| | Why? | | Financial companies choose how they share your personal information. Federal law gives consumers the right to limit some but not all sharing. Federal law also requires us to tell you how we collect, share, and protect your personal information. Please read this notice carefully to understand what we do. |
| | What? | | The types of personal information we collect and share depend on the product or service you have with us. This information can include: • Social Security number and • Account balances and • Transaction history and • Purchase history and • Assets When you are no longer our customer, we continue to share your information as described in this notice. |
| | How? | | All financial companies need to share personal information to run their everyday business. In the section below we list the reasons financial companies can share personal information; the reasons Alger chooses to share; and whether you can limit this sharing. |
| | Reasons we can share your personal information | | Does Alger share? | | Can you limit this sharing? |
| | For our everyday business purposes — such as to process your transactions, maintain your account(s), respond to court orders and legal investigations, or report to credit bureaus | | Yes | | No |
| | For our marketing purposes — to offer our products and services to you | | Yes | | No |
| | For joint marketing with other financial companies | | No | | We don’t share |
| | For our affiliates’ everyday business purposes — information about your transactions and experiences | | Yes | | No |
| | For our affiliates’ everyday business purposes — information about your creditworthiness | | No | | We don’t share |
| | For nonaffiliates to market to you | | No | | We don’t share |
| | Questions? Call 1-800-223-3810 | | | | |
ALGER GLOBAL FOCUS FUND
ADDITIONAL INFORMATION (Unaudited) (Continued)
| | Who we are | | |
| | Who is providing this notice? | | Alger includes Fred Alger Management, LLC and Fred Alger & Company, LLC as well as the following funds: The Alger Funds, The Alger Funds II, The Alger Institutional Funds, The Alger Portfolios, Alger Global Focus Fund, and The Alger ETF Trust. |
| | What we do | | |
| | How does Alger protect my personal information? | | To protect your personal information from unauthorized access and use, we use security measures that comply with federal law. These measures include computer safeguards and secured files and buildings. |
| | How does Alger collect my personal information? | | We collect your personal information, for example, when you: • Open an account or • Make deposits or withdrawals from your account or • Give us your contact information or • Provide account information or • Pay us by check. |
| | Why can’t I limit all sharing? | | Federal law gives you the right to limit some but not all sharing related to: • sharing for affiliates’ everyday business purposes - information about your credit worthiness • affiliates from using your information to market to you • sharing for nonaffiliates to market to you State laws and individual companies may give you additional rights to limit sharing. |
| | Definitions | | |
| | Affiliates | | Companies related by common ownership or control. They can be financial and nonfinancial companies. • Our affiliates include Fred Alger Management LLC Weatherbie Capital, LLC and Fred Alger & Company, LLC as well as the following funds: The Alger Funds, The Alger Funds II, The Alger Institutional Funds, The Alger Portfolios, Alger Global Focus Fund, and The Alger ETF Trust. |
| | Nonaffiliates | | Companies not related by common ownership or control. They can be financial and nonfinancial companies. |
| | Joint marketing | | A formal agreement between nonaffiliated financial companies that together market financial products or services to you. |
ALGER GLOBAL FOCUS FUNDADDITIONAL INFORMATION (Unaudited) (Continued)
Proxy Voting Policies
A description of the policies and procedures the Fund uses to determine how to vote proxies relating to portfolio securities and the proxy voting record is available, without charge, by calling (800) 992-3863 or online on the Fund’s website at http://www.alger.com or on the SEC’s website at http://www.sec.gov.
Fund Holdings
The Board has adopted policies and procedures relating to disclosure of the Fund’s portfolio securities. These policies and procedures recognize that there may be legitimate business reasons for holdings to be disclosed and seek to balance those interests to protect the proprietary nature of the trading strategies and implementation thereof by the Fund.
Generally, the policies prohibit the release of information concerning portfolio holdings, which have not previously been made public, to individual investors, institutional investors, intermediaries that distribute the Fund’s shares and other parties which are not employed by the Investment Manager or its affiliates except when the legitimate business purposes for selective disclosure and other conditions (designed to protect the Fund) are acceptable.
The Fund files its complete schedule of portfolio holdings with the SEC semi-annually in shareholder reports on Form N-CSR and after the first and third fiscal quarters as an exhibit to its reports on Form N-PORT. The Fund’s Forms N-CSR and N-PORT are available online on the SEC’s website at www.sec.gov.
In addition, the Fund makes publicly available its month-end top 10 holdings with a 10 day lag and its month-end full portfolio with a 60 day lag on its website www.alger.com and through other marketing communications (including printed advertising/sales literature and/or shareholder telephone customer service centers). No compensation or other consideration is directly received for the non-public disclosure of portfolio holdings information.
In accordance with the foregoing, the Fund provides portfolio holdings information to third parties including financial intermediaries and service providers who need access to this information in the performance of their services and are subject to duties of confidentiality (1) imposed by law, including a duty not to trade on non-public information, and/or (2) pursuant to an agreement that confidential information is not to be disclosed or used (including trading on such information) other than as required by law. From time to time, the Fund will communicate with these third parties to confirm that they understand the Fund’s policies and procedures regarding such disclosure. These agreements must be approved by the Fund’s Chief Compliance Officer.
The Board periodically reviews a report disclosing the third parties to whom the Fund’s holdings information has been disclosed and the purpose for such disclosure, and it considers whether or not the release of information to such third parties is in the best interest of the Fund and its shareholders.
ALGER GLOBAL FOCUS FUND
ADDITIONAL INFORMATION (Unaudited) (Continued)
In addition to material the Fund routinely provides to shareholders, the Investment Manager may make additional statistical information available regarding the Alger Family of Funds. Such information may include, but not be limited to, relative weightings and characteristics of the Fund versus an index (such as P/E ratio, alpha, beta, capture ratio, maximum drawdown, standard deviation, EPS forecasts, Sharpe ratio, information ratio, R-squared, and market cap analysis), security specific impact on overall portfolio performance, month-end top ten contributors to and detractors from performance, portfolio turnover, and other similar information. Shareholders should visit www.alger.com or may also contact the Fund at (800) 992-3863 to obtain such information.
Liquidity Risk Management Program
In accordance with Rule 22e-4 under the 1940 Act (the “Liquidity Rule”), the Fund has adopted and implemented a liquidity risk management program (the “LRMP”), which is reasonably designed to assess and manage the Fund’s liquidity risk.
The Board met on December 15, 2021 (the “Meeting”) to review the LRMP. The Board previously appointed Alger Management as the program administrator for the LRMP and approved an agreement with Ice Data Services (“ICE”), a third party vendor that assists the Fund with liquidity classifications required by the Liquidity Rule. Alger Management also previously delegated oversight of the LRMP to the Liquidity Risk Committee. At the Meeting, the Liquidity Risk Committee, on behalf of Alger Management, provided the Board with a report that addressed the operation of the LRMP and assessed its adequacy and effectiveness of implementation, and any material changes to the LRMP (the “Report”). The Report covered the period from December 1, 2020 through November 30, 2021 (the “Review Period”).
The Report stated that the Liquidity Risk Committee assessed the Fund’s liquidity risk by considering qualitative factors such as the Fund’s investment strategy, holdings, diversification of investments, redemption policies, cash flows, cash levels, shareholder concentration, and access to borrowings, among others, in conjunction with the quantitative classifications generated by ICE. In addition, in connection with the review of the Fund’s liquidity risks and the operation of the LRMP and the adequacy and effectiveness of its implementation, the Liquidity Risk Committee also evaluated the levels at which to set the reasonably anticipated trade size and market price impact. The Report described the process for determining that the Fund primarily holds investments that are highly liquid. The Report noted that the Liquidity Risk Committee also performed stress tests on certain funds in the Alger Family of Funds in light of the market volatility caused by the COVID-19 pandemic, and it was concluded that the Fund remained primarily highly liquid.
There were no material changes to the LRMP during the Review Period, except that certain changes were made to the LRMP to add liquidity considerations for certain exchange-traded funds managed by Alger Management. The Report provided to the Board stated that the Committee concluded that, based on the operation of the functions, as described in the Report, during the Review Period, the Fund’s LRMP was operating effectively and adequately with respect to the Fund and has been effectively implemented during the Review Period.
ALGER GLOBAL FOCUS FUND
100 Pearl Street, 27th Floor
New York, NY 10004
(800) 992-3863
www.alger.com
Investment Manager
Fred Alger Management, LLC
100 Pearl Street, 27th Floor
New York, NY 10004
Distributor
Fred Alger & Company, LLC
100 Pearl Street, 27th Floor
New York, NY 10004
Transfer Agent and Dividend Disbursing Agent
UMB Fund Services, Inc.
235 W. Galena Street
Milwaukee, WI 53212
Custodian
Brown Brothers Harriman & Company
50 Post Office Square
Boston, MA 02110
Independent Registered Public Accounting Firm
Deloitte & Touche LLP
30 Rockefeller Plaza
New York, NY 10112
This report is submitted for the general information of the shareholders of Alger Global Focus Fund. It is not authorized for distribution to prospective investors unless accompanied by an effective prospectus for the Fund, which contains information concerning the Fund’s investment policies, fees and expenses as well as other pertinent information.
(This page has been intentionally left blank)
(This page has been intentionally left blank)
(This page has been intentionally left blank)
(This page has been intentionally left blank)
| (b) | Include a copy of each notice transmitted to stockholders in reliance on Rule 30e-3 under the Act (17 CFR 270.30e-3) that contains disclosures specified by paragraph (c)(3) of that rule. |
Not applicable.
Not applicable.
| ITEM 3. | AUDIT COMMITTEE FINANCIAL EXPERT. |
Not applicable.
| ITEM 4. | PRINCIPAL ACCOUNTANT FEES AND SERVICES. |
Not applicable.
| ITEM 5. | AUDIT COMMITTEE OF LISTED REGISTRANTS. |
Not applicable.
(a) A Schedule of Investments in securities of unaffiliated issuers as of the close of the Reporting Period is included as part of the report to shareholders filed under Item 1 of this Form N-CSR.
(b) Not Applicable.
| ITEM 7. | DISCLOSURE OF PROXY VOTING POLICIES AND PROCEDURES FOR CLOSED-END MANAGEMENT INVESTMENT COMPANIES. |
Not applicable.
| ITEM 8. | PORTFOLIO MANAGERS OF CLOSED-END MANAGEMENT INVESTMENT COMPANIES. |
Not applicable.
| ITEM 9. | PURCHASES OF EQUITY SECURITIES BY CLOSED-END MANAGEMENT INVESTMENT COMPANY AND AFFILIATED PURCHASERS. |
Not applicable.
| ITEM 10. | SUBMISSION OF MATTERS TO A VOTE OF SECURITY HOLDERS. |
Not applicable.
| ITEM 11. | CONTROLS AND PROCEDURES. |
(a) The Registrant’s principal executive officer and principal financial officer have concluded that the Registrant’s disclosure controls and procedures (as defined in Rule 30a-3(c) under the Investment Company Act of 1940, as amended) are effective based on their evaluation of the disclosure controls and procedures as of a date within 90 days of the filing date of this document.
(b) No changes in the Registrant’s internal control over financial reporting occurred during the Registrant’s second fiscal quarter of the period covered by this report that materially affected, or are reasonably likely to materially affect, the Registrant’s internal control over financial reporting.
| ITEM 12. | Disclosure of Securities Lending Activities for Closed-End Management Investment Companies. |
Not applicable.
(a) (1) Not applicable
(a) (3) Not applicable
(a) (4) Not applicable
SIGNATURES
Pursuant to the requirements of the Securities Exchange Act of 1934 and the Investment Company Act of 1940, the registrant has duly caused this report to be signed on its behalf by the undersigned, thereunto duly authorized.
| Alger Global Focus Fund | |
| | | |
By: | /s/ Hal Liebes | |
| | Hal Liebes | |
| | President | |
| | | |
| Date: June 22, 2022 | |
Pursuant to the requirements of the Securities Exchange Act of 1934 and the Investment Company Act of 1940, this report has been signed below by the following persons on behalf of the registrant and in the capacities and on the dates indicated.
By: | /s/ Hal Liebes | |
| | Hal Liebes | |
| | President | |
| | | |
| Date: June 22, 2022 | |
By: | /s/ Michael D. Martins | |
| | Michael D. Martins | |
| | Treasurer | |
| | | |
| Date: June 22, 2022 | |