UNITED STATES
SECURITIES AND EXCHANGE COMMISSION
Washington, D.C. 20549
FORM N-CSR
CERTIFIED SHAREHOLDER REPORT OF REGISTERED
MANAGEMENT INVESTMENT COMPANIES
Investment Company Act file number 811-21317
Stadion Investment Trust
(Exact name of registrant as specified in charter)
1061 Cliff Dawson Road, Watkinsville, Georgia 30677
(Address of principal executive offices)(Zip code)
Jennifer T. Welsh, Esq.
ALPS Fund Services, Inc., 1290 Broadway, Suite 1100, Denver, CO 80203
(Name and address of agent for service)
Registrant’s telephone number, including area code: (706) 583-5207
Date of fiscal year end: May 31, 2015
Date of reporting period: June 1, 2014 through May 31, 2015
Form N-CSR is to be used by management investment companies to file reports with the Commission not later than 10 days after the transmission to stockholders of any report that is required to be transmitted to stockholders under Rule 30e-1 under the Investment Company Act of 1940 (17 CFR 270.30e-1). The Commission may use the information provided on Form N-CSR in its regulatory, disclosure review, inspection, and policymaking roles.
A registrant is required to disclose the information specified by Form N-CSR, and the Commission will make this information public. A registrant is not required to respond to the collection of information contained in Form N-CSR unless the Form displays a currently valid Office of Management and Budget (“OMB”) control number. Please direct comments concerning the accuracy of the information collection burden estimate and any suggestions for reducing the burden to Secretary, Securities and Exchange Commission, 450 Fifth Street, NW, Washington, DC 20549-0609. The OMB has reviewed this collection of information under the clearance requirements of 44 U.S.C. § 3507.
Item 1. Reports to Stockholders.
ANNUAL REPORT
May 31, 2015
STADION TACTICAL GROWTH FUND
STADION TACTICAL DEFENSIVE FUND
STADION DEFENSIVE INTERNATIONAL FUND
STADION TRILOGY ALTERNATIVE RETURN FUND
STADION ALTERNATIVE INCOME FUND
STADION MANAGED RISK 100 FUND
| Letter to Shareholders | | 1 |
| Performance Information | | 6 |
| Disclosure of Fund Expenses | | 18 |
| Schedules of Investments | | 20 |
| Statements of Assets and Liabilities | | 33 |
| Statements of Operations | | 35 |
| Statements of Changes in Net Assets | | 37 |
| Financial Highlights | | 40 |
| Notes to Financial Statements | | 57 |
| Report of Independent Registered Public Accounting Firm | | 70 |
| Additional Information | | 71 |
| Board of Trustees and Executive Officers | | 72 |
| Approval of Investment Advisory Agreements | | 74 |
| Stadion Investment Trust | Letter to Shareholders |
| | May 31, 2015 (Unaudited) |
Dear Stadion Shareholder,
We are pleased to present the annual report for the fiscal year ended May 31, 2015 for the Stadion family of funds. In this letter, we will include an overview of the market and the prevailing market conditions during the past year, and briefly highlight the purpose and approach of each of our funds during the past 12 months. Also occurring during this time period, and following a successful shareholder proxy, the Stadion Tactical Income Fund was repurposed into the Stadion Alternative Income Fund effective April 30, 2015. The details of this change will be described below. Now, let us take a short look at financial market conditions over the past year.
12 Month Market Overview
Equity Markets
The last twelve months have experienced some interesting market moves. During the previous fiscal year (June 1, 2014 to May 31, 2015), the S&P 500 Index was up 11.81%. However, the path taken to this return was nowhere near smooth.
The first six months (through November 30, 2014) had the S&P 500 Index return 8.58%, but during this period the market also experienced two sizable selloffs. The first occurred in late July and early August in which the S&P 500 Index sold off approximately 4%. The second, and more severe, selloff occurred in late September and early October. A rapid selloff in oil prices and slight reversal in what had been a steadily appreciating U.S. Dollar had the S&P 500 Index selloff over 7%.
During this 6-month period, the U.S. markets benefitted from a flight-to-quality trade out of international markets. The MSCI EAFE Index traded nearly 12% lower by mid-October but rallied to trade about 5% lower by the end of November.
During the latter six months of the fiscal year, the S&P 500 Index experienced two choppy sideways trading environments, both in the December to mid-February period and the March to May period, separated by a strong late February return that helped buoy performance.
The December and January period saw rampant oscillation in the S&P 500 Index between the 2000-2080 levels. In mid-February when the S&P 500 Index broke through the top side of the range and continued to cross the 2100 level, it appeared as if the uptrend was back in place. However, this late February blip was only a temporary respite from sideways range-bound trading. The S&P 500 Index managed to eke out only minimal returns over the last three months.
Some of this activity coincided with a leveling off in what had been very weak performance in other asset classes. The Euro experienced rampant depreciation from the beginning of the fiscal year through March 2015, seeing its level drop from $1.36/Euro to $1.05/Euro. Another headline item was weakness in oil prices, which traded from a peak of nearly $97/barrel at the end of June 2014 down to $50/barrel in March 2015.
On a more general theme, risk assets across the globe benefitted from Central Bank intervention. Like the Federal Reserve’s Quantitative Easing program, the European Central Bank (ECB) and the Bank of Japan (BOJ) deployed similar asset purchase programs. Whether or not strength in risk assets is true market strength or just an unnatural buoying effect by these central bank policies will come to play out soon enough.
Bond Markets
The fiscal year started with the 10-year U.S. treasury trading near the 2.6% level. For the first three months, rates trended steadily lower and closed near the 2.4% level by the end of August. In early September, the markets ramped up very quickly, erasing the aforementioned move by September 12. This inevitably brought out the ‘bond bull market is over’ talk. However, what followed was a rapid and sizable move lower, wherein the 10-year treasury moved nearly 1% lower by the end of January. Eventually this strength in rates faded, and over the last four month of the fiscal year, the 10-year treasury retraced nearly half this move lower, eventually closing at 2.12% on May 31.
For almost the entire period, European interest rates experienced a very steady and sizable move lower. The benchmark German 10-year rate moved from 1.4% to almost trading at 0% by mid-April. During this time, many shorter-dated European rates did trade in negative territory, essentially penalizing investors looking to put money in these assets. However, in mid-April, the same benchmark rate moved furiously higher, climbing nearly 0.6% in a manner of days.
Stadion’s Tactical Equity Portfolio Line-up
The tactical equity funds within our line-up provide various levels of risk management and the ability to diversify across markets. If you are looking for a more growth oriented strategy that still has a defensive element, then the Tactical Growth Fund might be a logical choice. If you are looking to play a little more defense, Stadion’s Tactical Defensive Fund provides a level of persistent market exposure with an eye always on risk management. The Stadion Managed Risk 100 Fund is our most defensive and most conservative equity strategy offering our most conservative exposure to equity markets. The Stadion Defensive International Fund provides measured access to international and emerging markets while attempting to manage risk and volatility.
| | |
| Annual Report | May 31, 2015 | 1 |
| Stadion Investment Trust | Letter to Shareholders |
| | May 31, 2015 (Unaudited) |
Stadion Tactical Growth Fund
The Stadion Tactical Growth Fund follows a rules based, disciplined, proprietary model. The model quantitatively ranks all actively traded Exchange Traded Funds (“ETFs”) that have first passed a fundamental review. The ranking is based upon risk-adjusted return. The holdings of the Tactical Growth Fund are adjusted so that the ETFs showing strength in the model are purchased and held. Those showing weakness in the model are sold or not considered for purchase. The goal of the Tactical Growth Fund’s investment process is to produce market-like returns while assuming below-market risk. What differentiates Tactical Growth Fund from Stadion’s trend following strategies is that instead of going to cash, the model will attempt to allocate among a mix of defensive and non-correlated assets during turbulent times.
For the year ending May 31, 2015, the Stadion Tactical Growth Fund – Class A returned 8.78%. These numbers exclude the impact of the 5.75% sales load. The two main contributors to the Tactical Growth Fund’s performance were allocation decisions and market performance. Its benchmark, the S&P 500 Index, gained 11.81% for the same period while the Morningstar Tactical Allocation Category returned 1.67%. In general, the security selection ranking process for the Tactical Growth Fund is used to allocate approximately three-quarters of the portfolio into U.S. equities. Our allocations to sectors such as small caps and health care were identified by our model and were strong performers in the portfolio during the past year. The remaining allocation of the Tactical Growth Fund is generally allocated to ETFs that are showing strength in our rankings, but are non-correlated to U.S. equities. The purpose of this allocation is to help achieve the fund’s goal of market-like returns while assuming below-market risk. While we were happy with the diversification and risk reduction this segment of the portfolio achieved last year, it did not perform as strongly as the U.S. equity market and was the main cause of our underperformance versus its benchmark. Much of this dispersion occurred late in the year when previous long-term trends paused or reversed course. However, given these market conditions, we have been happy with the performance of the Tactical Growth Fund.
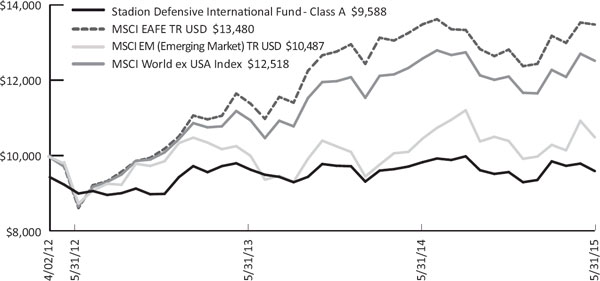
Stadion Defensive International Fund
Similar to Stadion’s other trend following strategies, the Stadion Defensive International Fund uses a model to help assess market conditions to identify when to be invested. With a security ranking measure to identify leading asset classes, it can move to fully defensive positions when risk levels are deemed high. The Defensive International Fund borrows from Stadion’s domestic model by leveraging cyclical price measures for long-term trend exposure, intermediate term price measures for more reactive and adaptive allocations, and a risk management overlay incorporating speculative Emerging Market trends and volatility to help guide shorter-term allocations within the intermediate and longer-term mandates. When fully defensive, the Defensive International Fund has the ability to invest in cash and non-U.S. short duration fixed income. Due to including both Emerging and Developed market indications into the investment process, analyzing the Defensive International Fund’s returns relative to both of its benchmarks, a developed market benchmark, MSCI EAFE, and an emerging market benchmark, MSCI EM, is prudent.
For the year ending May 31, 2015, the Stadion Defensive International Fund – Class A was down 2.40%, which does not include a deduction for the 5.75% sales load. The MSCI EM Index was up 0.33% and the MSCI EAFE Index was down 0.06% for the same period.
As mentioned previously, a major theme over the past year was the appreciation of the U.S. Dollar or, conversely, weakness in foreign currencies, particularly the Euro. This caused major dispersion between international exposure that takes in the currency effect and the local market returns, which is now easily accessed via the proliferation of currency-hedged ETFs. An example is the local currency EAFE Index return which was up 17.66% versus the aforementioned 0.06% loss in the MSCI EAFE Index. This hedged/unhedged decision adds another layer of decision making when determining an international allocation.
For a majority of the period, the Defensive International Fund was able to balance between Developed and Emerging Market performance. However, a massive spike in the Chinese markets in early April (with some markets trading over 20% in a matter of days) had the fund lag Emerging Markets, as the models could not react to such a quick move higher. Additionally, once our models did catch up to the move higher, the rally faded and we experienced a small drawdown towards the end of the period.
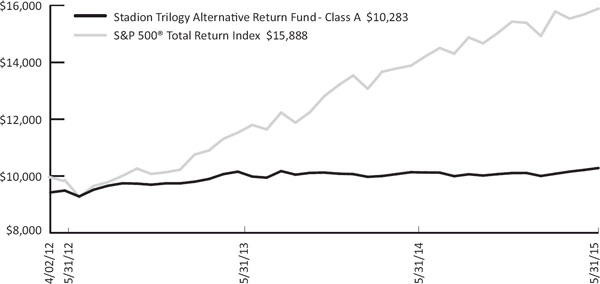
Stadion Trilogy Alternative Return Fund
The Stadion Trilogy Alternative Return Fund is a multi-strategy portfolio designed to generate positive returns regardless of market direction, with an emphasis on lower risk and volatility than the U.S. Equity markets. The portfolio is designed to be uncorrelated to traditional asset classes and maintains risk management positions at all times. The portfolio consists of an equity component, an option income component and a market movement component. The allocation to each component varies based on Trilogy’s investment model. While Trilogy’s goal is to produce positive returns annually, monthly returns within the components may be asymmetrical according to the periodic valuations of positions.
| Stadion Investment Trust | Letter to Shareholders |
| | May 31, 2015 (Unaudited) |
For the year ended May 31, 2015, the Stadion Trilogy Alternative Return Fund – Class A returned 1.54%. This number excludes the impact of the 5.75% sales load. For the same period, its benchmark, the S&P 500 Index, was up 11.81%. The Morningstar Multi-alternative category was up 2.77%. During this period, the fund maintained a 45-50% allocation to equities that participated in the upward equity trend. These gains were partially offset by an S&P 500 Index option collar overlaid on the equities designed to minimize volatility. The strategy also continued to hold 45%-50% in low duration fixed income ETFs, which contributed to performance as rates declined. The VIX Index, a measure of implied volatility for the S&P 500, saw some spike during the year but generally remained near historic low levels. Although this volatility remained low, which hampers the ability to collect ample premium for the risk taken in the option income strategy, the fund still maintained a positive return for the year and is positioned well if volatility returns to the markets.
Stadion Alternative Income Fund
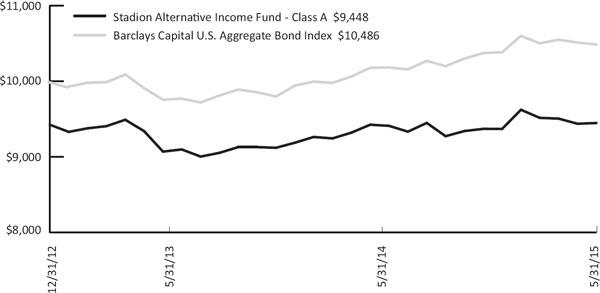
For the fiscal year, the Stadion Alternative Income Fund - Class A returned 0.24% as compared a 3.03% gain for its benchmark, the Barclays U.S. Aggregate Bond Index.
Prior to April 30, 2015 dispersion relative to the benchmark occurred during the August through December rally in interest rates and duration differentials between the fund and the benchmark. Additionally, a quick selloff in high yield due to a shock in oil prices caused some dispersion in late July.
On April 30, the Stadion Tactical Income Fund was repurposed into the Stadion Alternative Income Fund. The Alternative Income Fund looks to generate income outside of traditional sources, i.e. fixed income. The fund looks to capture income from two main sources. First, the fund looks to capture income from dividend paying equities, while utilizing an option hedging strategy to protect against large selloffs. Second, the fund looks to capture income by selling volatility on a rolling basis through the use of options, while also hedging against large absolute moves in volatility.
Stadion Managed Risk 100 and Stadion Tactical Defensive Funds
We incorporate Stadion Managed Risk 100 Fund and Stadion Tactical Defensive Fund together since both are guided by Stadion’s proprietary, long-term, technically based trend following model. The difference is that the Managed Risk 100 Fund is ‘fully unconstrained,’ ranging from 100% equity exposure to 100% cash or cash equivalents, while the Tactical Defensive Fund employs a core-satellite structure, with 50% (satellite) actively managed using our tactical model, and 50% (core) tactically managed and fully invested at all times. Both employ broad-based market index ETFs, major sector-based, international and, at times, specialty ETFs. Percentages of holdings are determined by the relative strength of employed asset classes as determined by our proprietary model. Our process for entering newly up-trending markets is to generally stick with large liquid market-based ETFs, and then as a trend fully develops, broaden exposure according to where our model identifies the best opportunities. During favorable conditions, we also utilize an active trade-up process, which means we constantly evaluate holdings, using our technical ranking and screening system to replace under-performers with what we believe will be better performing holdings.
During the 12 months ending May 31, 2015, major U.S. equity indices were positive, albeit with some dispersion. The S&P 500 Index was up 11.81% for the period and the Dow Jones Industrial Average Index was up 10.28%, while the Nasdaq Composite Index was up 21.07%. During the same period, the Managed Risk 100 Fund – Class A was down 4.75% and the Tactical Defensive Fund – Class A was up 2.67%. These numbers exclude the impact of the 5.75% sales load.
As noted previously, it was a bit of a tale of two halves for the markets this fiscal year. The price appreciation during the latter six months in the markets was choppier in nature with periods of declines followed by sharp increases or sideways choppy price action. This type of price action typically provides challenges for trend following strategies, and is especially difficult for the fully tactical strategy employed by the Managed Risk 100 Fund. It also provided challenges for the Tactical Defensive Fund, but the more persistent exposure in that strategy allowed the portfolio to achieve positive returns over the last 12 months. With the longer-term market trend remaining positive, Tactical Defensive’s Long-Term indicator remained on for the entirety of the period. As such, the Tactical Defensive Fund maintained a minimum 50% equity exposure from the core position throughout the period. As the prevailing market trend favored large-cap securities for the period, our core holdings remained allocated towards these broad large cap indices.
Entering June 2014, both funds were fully invested with both broad and top-performing sector exposure. Given the relatively smooth uptrend in the market during June and July, both funds maintained equity exposure through the end of July and traded in line with the market. However, the quick selloff in late July and early August had the Managed Risk 100 Fund move to a fully defensive position. The market continued to selloff but eventually rebounded off the early August lows, and the Managed Risk 100 Fund was fully invested towards the end of the month, avoiding volatility in the process. During this period, the Tactical Defensive Fund maintained exposure due to its wider sell criteria.
| | |
| Annual Report | May 31, 2015 | 3 |
| Stadion Investment Trust | Letter to Shareholders |
| | May 31, 2015 (Unaudited) |
During the latter part of September, the market once again sold off, this time to a much larger degree. The Managed Risk 100 Fund was again defensively positioned and, soon after, the Tactical Defensive Fund hit its minimum 50% exposure. As was the case with the earlier selloff, the funds were able to sidestep market volatility as the selloff continued.
This time around, the recovery was just as rampant as the selloff, as the S&P 500 Index traded over 8% higher from the mid-October lows through the end of the month. Given the depth of the selloff, our models needed a bit more time to confirm the trend, eventually having us fully invested by the end of the month. A smooth up-move in the markets in November kept both funds fully invested through the end of that month. As mentioned above, both strategies were able to produce solid returns (just under 6% while the S&P 500 was up 8.58%) and avoiding volatility.
From the end of November through the end of January, the bear market for tactical strategies - which is a choppy, sideways, range bound market - took full effect. The magnitude and length of the up-moves proved just enough to get the strategies invested, which often coincided with a selloff and subsequent reduction in equity exposure. These months saw a few different 0% to 100% moves in equity exposure in the Managed Risk 100 Fund and 50% to 100% moves in the Tactical Defensive Fund.
The March through May period saw similar choppy moves, just with smaller oscillations. As such, both strategies were able to maintain equity exposure to a larger degree and traded in line with the market for a majority of the period, outside of a small dispersion period in early May.
Stadion Observations and Market Outlook
Although the market continues to trade near all-time highs, some of the sideways markets experienced this year can add a bit of trepidation to the increasingly extending cyclical bull market. All markets move in cycles and we believe that the need for risk management within a portfolio is as important now as ever. It is precisely why we have a full suite of investment strategies offering a defensive bias.
At Stadion, we emphasize lasting results. Our defensive fund strategies incorporate a disciplined, long-term approach to investing over full market cycles (FMC). FMC’s are not specified durations but rather the time it takes for the market to experience the full range of market conditions. The risk-averse methodology applied in many of the Stadion Funds may result in underperformance during up-markets because our defensive focus may cause us to miss some upswings. However, when the market experiences major declines (there have been two bear markets since 2000), we hope to avoid most of the downside. In the last 113 years, there have been 33 bear markets (declines greater than 20% as measured by the Dow Jones Industrial Average). Thus, for our trend following strategies, we believe there are times when the best approach to the equity markets is to exit them. Further, we do not forecast the market; in fact, we strongly believe no one can accurately do so consistently. Rather than predict, we react with discipline, using our rules-based processes designed to measure market conditions and inform and direct our trades. We are quite comfortable with the defensive nature of all of our products, particularly with many equity markets at or very near all-time highs, bond yields at or near all-time lows and showing signs of instability, and the Federal Reserve contemplating raising rates. Coupled with much of the remaining global fiscal uncertainty yet to be resolved and continued global unrest, we believe that prudence favors measured market participation with
solid defense.
Thank you for your continued support and allowing us to serve you and the Funds. Please feel free to contact us with any questions or concerns.
Sincerely,
Stadion Money Management
Brad Thompson, CFA
Chief Investment Officer
The views in this report were those of the Funds’ investment adviser as of the date of this Report and may not reflect their views on the date this report is first published or anytime thereafter. These views are intended to assist shareholders in understanding their investment in the Funds and do not constitute investment advice.
Investment in the Funds are subject to investment risks, including, without limitation, market risk, management style risk, risks related to “fund of funds” structure, sector risk, fixed income risk, tracking risk, risks related to ETF net asset value and market price, foreign securities risk, risks related to portfolio turnover and small capitalization companies risk. Since the Funds are a “fund of funds,” an investor will indirectly bear fees and expenses charged by the underlying ETFs and investment companies in which the Funds invest in addition to the Funds’ direct fees and expenses.
| Stadion Investment Trust | Letter to Shareholders |
| | May 31, 2015 (Unaudited) |
Derivative instruments can be volatile and the potential loss to the Funds may exceed the Funds’ initial investment. Derivative instruments may be difficult to value and may be subject to wide swings in valuations caused by changes in the value of the underlying instrument. The use of these instruments requires special skills and knowledge of investment techniques that are different than those normally required for purchasing and selling securities. The Funds could also experience losses if they are unable to close out a position because the market for an instrument or position is or becomes illiquid.
Options are financial derivatives that represent a contract sold by one party (option writer) to another party (option holder). The contract offers the buyer the right, but not the obligation, to buy (call) or sell (put) a security or other financial asset at an agreed-upon price (the strike price) during a certain period of time or on a specific date (exercise date).
An Option Collar is a protective options strategy that is implemented after a long position in a stock has experienced substantial gains. It is created by purchasing an out of the money put option while simultaneously writing an out of the money call option.
The Funds’ foreign investments generally carry more risks than funds that invest strictly in U.S. assets, including currency risk, geographic risk, and emerging market risk. Risks can also result from varying stages of economic and political development; differing regulatory environments, trading days, and accounting standards; and higher transaction costs of non-U.S. markets. More information about these risks and other risks can be found in the Funds’ prospectus.
Barclays Capital U.S. Aggregate Bond Index is an unmanaged index of prices of U.S. dollar-denominated investment-grade fixed income securities with remaining maturities of one year and longer.
Dow Jones Industrial Average is a stock market index that shows how 30 large publicly owned companies based in the U.S. have traded during a standard trading session.
Local currency MSCI EAFE Index (Europe, Australasia, Far East) is an unmanaged free float-adjusted market capitalization index that is designed to measure the equity market performance of developed markets, excluding the US & Canada, that uses the respective currency of each country.
MSCI EM Index is an unmanaged free float-adjusted market capitalization index that is designed to measure equity market performance of emerging markets.
MSCI EAFE Index (Europe, Australasia, Far East) is an unmanaged free float-adjusted market capitalization index that is designed to measure the equity market performance of developed markets, excluding the US & Canada.
The Morningstar Multi-alternative Category is a benchmark created and published by Morningstar and defines Alternative as “Alternative funds may take short positions or invest in currencies, derivatives, or other instruments.”
The Morningstar Tactical Allocation Category is a benchmark created and published by Morningstar and is defined as “Portfolios seek to provide capital appreciation and income by actively shifting allocations between asset classes.”
Nasdaq Composite Index is a stock market index of common stocks and similar securities listed on the Nasdaq stock market. It is highly followed in the U.S. as an indicator of the performance of technology and growth company stocks.
The S&P 500® Total Return Index is an unmanaged index of 500 common stocks chosen for market size, liquidity and industry group representation. It is a market-value weighted index.
The VIX Index measures annualized implied volatility as conveyed by S&P 500 stock option prices and is quoted in percentage points per annum.
The United States Dollar is the official currency of the United States and its overseas territories.
The euro is the official currency of the Eurozone, which consists of 19 of the 28 member states of the European Union.
One may not invest directly in indexes, which are unmanaged and do not incur fees, expenses or taxes.
Correlation is a measure of how investments move in relation to one another. A correlation of 1 means the two asset classes move exactly in line with each other, while a correlation of -1 means they move in the exact opposite direction.
| | |
| Annual Report | May 31, 2015 | 5 |
| Stadion Tactical Growth Fund | Performance Information |
| | May 31, 2015 (Unaudited) |
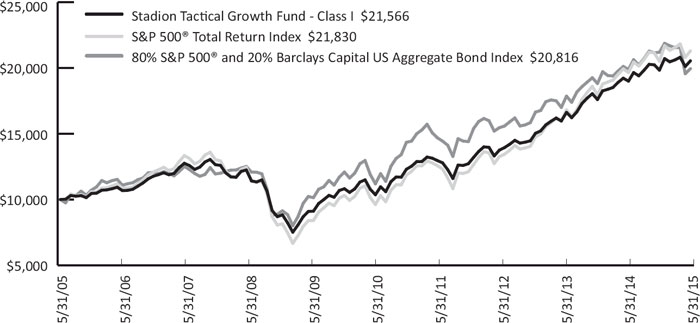
Comparison of the Change in Value of a $10,000 Investment in Stadion Tactical Growth Fund(a), the S&P 500® Total Return Index and 80% S&P 500® and 20% Barclays Capital U.S. Aggregate Bond Index
Average Annual Total Returns(b) (for periods ended May 31, 2015)
| | 1 Year | 5 Year | 10 Year | Since Inception(d) |
Stadion Tactical Growth Fund - A – NAV(C) | 8.78% | 12.35% | 7.72% | 7.00% |
Stadion Tactical Growth Fund - A - POP(C) | 2.54% | 11.02% | 7.08% | 6.43% |
Stadion Tactical Growth Fund - C - NAV(C) | 7.96% | 11.51% | 6.91% | 6.20% |
Stadion Tactical Growth Fund - C - CDSC(C) | 6.96% | 11.51% | 6.91% | 6.20% |
| Stadion Tactical Growth Fund - I - NAV | 9.07% | 12.63% | 7.99% | 7.26% |
S&P 500® Total Return Index | 11.81% | 16.54% | 8.12% | 8.14%(e) |
80% S&P 500® and 20% Barclays Capital US Aggregate Bond Index | 10.08% | 14.06% | 7.61% | 7.64%(e) |
(a) The line graph above represents performance of Class I shares only, which will vary from the performance of Class A and Class C shares based on the difference in loads and fees paid by shareholders in different classes.
(b) Total return is a measure of the change in value of an investment in the Fund over the periods covered, which assumes any dividends or capital gains distributions are reinvested in shares of the Fund. Returns do not reflect the deduction of taxes a shareholder would pay on Fund distributions or the redemption of Fund shares. Total returns shown do include the effect of applicable sales loads.
(c) The performance shown includes that of the predecessor Fund, the ETF Market Opportunity Fund, a series of Aviemore Trust, which was reorganized into the Fund, as of the close of business on March 29, 2013. Performance information for Class A and Class C shares prior to April 1, 2013, reflects the performance of Class I shares adjusted for the higher expenses paid by Class A and Class C shares.
(d) Class I, Class A and C shares of the Fund commenced operations on May 3, 2004, April 1, 2013 and April 1, 2013, respectively. The performance shown for Class A and C shares for periods pre-dating the commencement of operations of those classes reflects the performance of the Fund’s Class I shares, the initial share class, calculated using the fees and expenses of Class A and C shares respectively and without the effect of any fee and expense limitations or waivers. If Class A and C shares of the Fund had been available during periods prior to April 1, 2013, the performance shown may have been different.
(e) Represents the period from May 3, 2004 (date of original public offering of Class I shares) through May 31, 2015.
The performance information quoted above represents past performance and past performance does not guarantee future results. Investment return and principal value of an investment will fluctuate so that an investor’s shares, when redeemed, may be worth more or less than their original cost. Current performance may be lower or higher than the performance data quoted. Performance data, current to the most recent month end, may be obtained by calling 1-800-222-7636. An investor should consider a Fund’s investment objectives, risks, and charges and expenses carefully before investing. The Fund’s prospectus contains this and other important information. For information on the Fund’s expense ratios, please see the Financial Highlights tables found within this Report.
| Stadion Tactical Growth Fund | Performance Information |
| | May 31, 2015 (Unaudited) |
The Total Annual Fund Operating Expenses for Class A, Class C and Class I are 2.10%, 2.89% and 1.84%, respectively. The Fund’s investment adviser, Stadion Money Management, LLC (the “Adviser”) has entered into an Expense Limitation Agreement with the Fund under which it has contractually agreed to waive Management Fees and to assume other expenses of the Fund, if necessary, in an amount that limits annual operating expenses (exclusive of interest expense on any borrowings, taxes, brokerage commissions, extraordinary expenses, Acquired Fund Fees and Expenses and payments, if any, under a Rule 12b-1 Distribution Plan) of Class A, Class C and Class I shares to not more than 1.30% of the average daily net assets allocable to each Class of the Fund. The Expense Limitation Agreement is currently in effect until October 1, 2016.
POP, the “Public Offering Price”, and NAV, the “Net Asset Value” price, are terms used to describe what share price was applied to Class A and/or Class C shares at the time of purchase. A CDSC (“Contingent Deferred Sales Charge”) is a redemption fee that can be applied if purchased share are redeemed prior to a specified holding period. For additional information please consult the Fund’s Prospectus.
The S&P 500® Total Return Index is an unmanaged index of 500 common stocks chosen for market size, liquidity and industry group representation. It is a market-value weighted index. The index is not actively managed and does not reflect any deduction for fees, expenses or taxes.
The Barclays Capital U.S. Aggregate Bond Index is a market value-weighted index of investment grade fixed-rated debt issues, including government, corporate, asset-backed and mortgage-backed securities with a maturity of one year or more.
An investor may not invest directly in an index.
Diversification does not eliminate the risk of experiencing investment losses.
Information included or referred to on, or otherwise accessible through, our website is not intended to form part of or be incorporated into this report or the Fund’s prospectus.
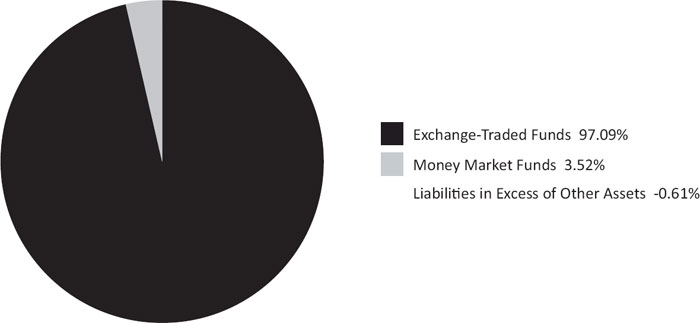
Portfolio Composition (as a % of net assets)
| | |
| Annual Report | May 31, 2015 | 7 |
| Stadion Tactical Defensive Fund | Performance Information |
| | May 31, 2015 (Unaudited) |
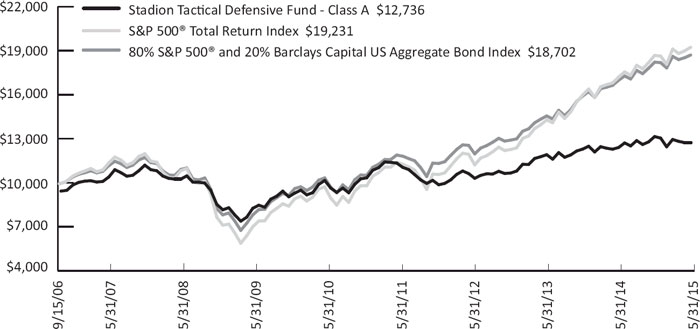
Comparison of the Change in Value of a $10,000 Investment in Stadion Tactical Defensive Fund(a), the S&P 500® Total Return Index and 80% S&P 500® and 20% Barclays Capital U.S. Aggregate Bond Index
Average Annual Total Returns(b) (for periods ended May 31, 2015)
| | | 1 Year | | 5 Year | | Since Inception(c) |
| Stadion Tactical Defensive Fund - A - NAV | | 2.67% | | 5.74% | | 3.51% |
| Stadion Tactical Defensive Fund - A - POP | | -3.20% | | 4.50% | | 2.82% |
| Stadion Tactical Defensive Fund - C - NAV | | 1.80% | | 4.92% | | 2.71% |
| Stadion Tactical Defensive Fund - C - CDSC | | 0.80% | | 4.92% | | 2.71% |
| Stadion Tactical Defensive Fund - I - NAV | | 2.82% | | 5.96% | | 3.72% |
S&P 500® Total Return Index | | 11.81% | | 16.54% | | 7.80%(d) |
80% S&P 500® and 20% Barclays Capital US Aggregate Bond Index | | 10.08% | | 14.06% | | 7.46%(d) |
(a) The line graph above represents performance of Class A shares only, which will vary from the performance of Class C and Class I shares based on the difference in loads and fees paid by shareholders in different classes. The change in value of the initial $10,000 investment shown for Class A shares in the line graph reflects the maximum front-end sales load of 5.75%.
(b) Total return is a measure of the change in value of an investment in the Fund over the periods covered, which assumes any dividends or capital gains distributions are reinvested in shares of the Fund. Returns do not reflect the deduction of taxes a shareholder would pay on Fund distributions or the redemption of Fund shares. Total returns shown do include the effect of applicable sales loads.
(c) Class A, Class C and I shares of the Fund commenced operations on September 15, 2006, October 1, 2009 and May 28, 2010, respectively. The performance shown for Class C and I shares for periods pre-dating the commencement of operations of those classes reflects the performance of the Fund’s Class A shares, the initial share class, calculated using the fees and expenses of Class C and I shares respectively and without the effect of any fee and expense limitations or waivers. If Class C and I shares of the Fund had been available during periods prior to October 1, 2009 and May 28, 2010, respectively, the performance shown may have been different.
(d) Represents the period from September 15, 2006 (date of original public offering of Class A shares) through May 31, 2015.
The performance information quoted above represents past performance and past performance does not guarantee future results. Investment return and principal value of an investment will fluctuate so that an investor’s shares, when redeemed, may be worth more or less than their original cost. Current performance may be lower or higher than the performance data quoted. Performance data, current to the most recent month end, may be obtained by calling 1-800-222-7636. An investor should consider a Fund’s investment objectives, risks, and charges and expenses carefully before investing. The Fund’s prospectus contains this and other important information. For information on the Fund’s expense ratios, please see the Financial Highlights tables found within this Report.
| Stadion Tactical Defensive Fund | Performance Information |
May 31, 2015 (Unaudited)
The Total Annual Fund Operating Expenses for Class A, Class C and Class I are 2.17%, 2.95%and 2.01%, respectively. The Fund’s investment advisor, Stadion Money Management, LLC (the “Advisor”) has agreed to waive fees and reimburse for other operating expenses (exclusive of interest expense on any borrowings, taxes, brokerage commissions, extraordinary expenses, acquired fund fees and expenses and payments, if any, under a Rule 12b-1 Distribution Plan) in excess of 1.70% of the average daily net assets for Class A, Class C, and Class I, until at least October 1, 2016.
POP, the “Public Offering Price”, and NAV, the “Net Asset Value” price, are terms used to describe what share price was applied to Class A and/or Class C shares at the time of purchase. A CDSC (“Contingent Deferred Sales Charge”) is a redemption fee that can be applied if purchased shares are redeemed prior to a specified holding period. For additional information please consult the Fund’s Prospectus.
The S&P 500® Total Return Index is an unmanaged index of 500 common stocks chosen for market size, liquidity and industry group representation. It is a market-value weighted index. The index is not actively managed and does not reflect any deduction for fees, expenses or taxes.
The Barclays Capital U.S. Aggregate Bond Index is a market value-weighted index of investment grade fixed-rated debt issues, including government, corporate, asset-backed and mortgage-backed securities with a maturity of one year or more.
An investor may not invest directly in an index.
Diversification does not eliminate the risk of experiencing investment losses.
Information included or referred to on, or otherwise accessible through, our website is not intended to form part of or be incorporated into this report or the Fund's prospectus.
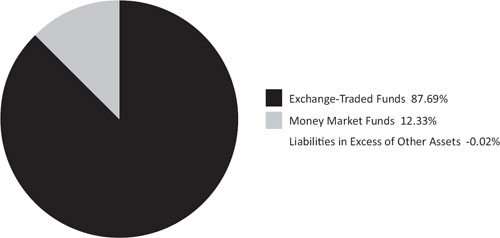
Portfolio Composition (as a % of net assets)
| Annual Report | May 31, 2015 | 9 |
Stadion Defensive International Fund | Performance Information |
May 31, 2015 (Unaudited)
Comparison of the Change in Value of a $10,000 Investment in Stadion Defensive International Fund(a), MSCI EAFE TR USD, MSCI EM (Emerging Market) TR USD and the MSCI World ex USA Index
Average Annual Total Returns(b) (for periods ended May 31, 2015)
| | 1 Year | Since Inception(c) |
| Stadion Defensive International Fund - A - NAV | -2.40% | 0.54% |
| Stadion Defensive International Fund - A - POP | -8.04% | -1.32% |
| Stadion Defensive International Fund - C - NAV | -3.06% | -0.19% |
| Stadion Defensive International Fund - C - CDSC | -4.02% | -0.19% |
| Stadion Defensive International Fund - I - NAV | -2.15% | 0.80% |
| MSCI EAFE TR USD | -0.06% | 9.90%(d) |
| MSCI EM (Emerging Markets) TR USD | 0.33% | 1.51%(d) |
| MSCI World ex USA Index | -0.47% | 7.36%(d) |
(a) The line graph above represents performance of Class A shares only, which will vary from the performance of Class C and Class I shares based on the difference in loads and fees paid by shareholders in different classes. The change in value of the initial $10,000 investment shown for Class A shares in the line graph reflects the maximum front-end sales load of 5.75%.
(b) Total return is a measure of the change in value of an investment in the Fund over the periods covered, which assumes any dividends or capital gains distributions are reinvested in shares of the Fund. Returns do not reflect the deduction of taxes a shareholder would pay on Fund distributions or the redemption of Fund shares. Total returns shown do include the effect of applicable sales loads.
(c) Class A inception: 04/02/12; Class C inception: 04/02/12; Class I inception: 04/02/12.
(d) Represents the period from April 2, 2012 (date of original public offering of Class A shares) through May 31, 2015.
The performance information quoted above represents past performance and past performance does not guarantee future results. Investment return and principal value of an investment will fluctuate so that an investor’s shares, when redeemed, may be worth more or less than their original cost. Current performance may be lower or higher than the performance data quoted. Performance data, current to the most recent month end, may be obtained by calling 1-800-222-7636. An investor should consider a Fund’s investment objectives, risks, and charges and expenses carefully before investing. The Fund’s prospectus contains this and other important information. For information on the Fund’s expense ratios, please see the Financial Highlights tables found within this Report.
The Total Annual Fund Operating Expenses for Class A, Class C and Class I are 2.47%, 3.20% and 2.29%, respectively. The Fund’s investment advisor, Stadion Money Management, LLC (the “Advisor”) has agreed to waive fees and reimburse for other operating expenses (exclusive of interest expense on any borrowings, taxes, brokerage commissions, extraordinary expenses, acquired fund fees and expenses and payments, if any, under a Rule 12b-1 Distribution Plan) in excess of 1.70% of the average daily net assets for Class A, Class C, and Class I, until at least October 1, 2016.
| Stadion Defensive International Fund | Performance Information |
May 31, 2015 (Unaudited)
POP, the “Public Offering Price”, and NAV, the “Net Asset Value” price, are terms used to describe what share price was applied to Class A and/or Class C shares at the time of purchase. A CDSC (“Contingent Deferred Sales Charge”) is a redemption fee that can be applied if purchased shares are redeemed prior to a specified holding period. For additional information please consult the Fund’s Prospectus.
MSCI EAFE TR USD Index (is an unmanaged free float-adjusted market capitalization index that is designed to measure the equity market performance of developed markets, excluding the US & Canada.
MSCI EM (Emerging Market) TR USD Index is an unmanaged free float-adjusted market capitalization index that is designed to measure equity market performance of emerging markets.
The MSCI World ex USA Index is a free float-adjusted market capitalization weighted index that is designed to measure the equity market performance of developed markets excluding the United States.
An investor may not invest directly in an index.
Diversification does not eliminate the risk of experiencing investment losses.
Information included or referred to on, or otherwise accessible through, our website is not intended to form part of or be incorporated into this report or the Fund's prospectus.
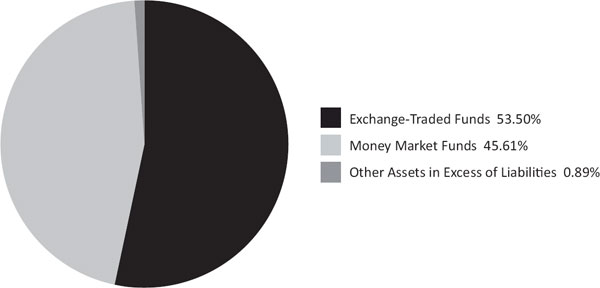
Portfolio Composition (as a % of net assets)
| Annual Report | May 31, 2015 | 11 |
| Stadion Trilogy Alternative Return Fund | Performance Information |
May 31, 2015 (Unaudited)
Comparison of the Change in Value of a $10,000 Investment in Stadion Trilogy Alternative Return Fund(a) and the S&P 500® Total
Return Index
Average Annual Total Returns(b) (for periods ended May 31, 2015)
| | 1 Year | Since Inception(c) |
| Stadion Trilogy Alternative Return Fund - A - NAV | 1.54% | 2.80% |
| Stadion Trilogy Alternative Return Fund - A - POP | -4.28% | 0.89% |
| Stadion Trilogy Alternative Return Fund - C - NAV | 0.75% | 2.05% |
| Stadion Trilogy Alternative Return Fund - C - CDSC | -0.25% | 2.05% |
| Stadion Trilogy Alternative Return Fund - I - NAV | 1.78% | 3.03% |
S&P 500® Total Return Index | 11.81% | 15.77%(d) |
(a) | The line graph above represents performance of Class A shares only, which will vary from the performance of Class C and Class I shares based on the difference in loads and fees paid by shareholders in different classes. The change in value of the initial $10,000 investment shown for Class A shares in the line graph reflects the maximum front-end sales load of 5.75%. |
(b) | Total return is a measure of the change in value of an investment in the Fund over the periods covered, which assumes any dividends or capital gains distributions are reinvested in shares of the Fund. Returns do not reflect the deduction of taxes a shareholder would pay on Fund distributions or the redemption of Fund shares. Total returns shown do include the effect of applicable sales loads. |
(c) | Class A inception: 04/02/12; Class C inception: 04/02/12; Class I inception: 04/02/12. |
(d) | Represents the period from April 2, 2012 (date of original public offering of Class A shares) through May 31, 2015. |
The performance information quoted above represents past performance and past performance does not guarantee future results. Investment return and principal value of an investment will fluctuate so that an investor’s shares, when redeemed, may be worth more or less than their original cost. Current performance may be lower or higher than the performance data quoted. Performance data, current to the most recent month end, may be obtained by calling 1-800-222-7636. An investor should consider a Fund’s investment objectives, risks, and charges and expenses carefully before investing. The Fund’s prospectus contains this and other important information. For information on the Fund’s expense ratios, please see the Financial Highlights tables found within this Report.
The Total Annual Fund Operating Expenses for Class A, Class C and Class I are 1.91%, 2.67% and 1.72%, respectively. The Fund’s investment advisor, Stadion Money Management, LLC (the “Advisor”) has agreed to waive fees and reimburse for other operating expenses (exclusive of interest expense on any borrowings, taxes, brokerage commissions, extraordinary expenses, acquired fund fees and expenses and payments, if any, under a Rule 12b-1 Distribution Plan) in excess of 1.70% of the average daily net assets for Class A, Class C, and Class I, until at least October 1, 2016.
| Stadion Trilogy Alternative Return Fund | Performance Information |
May 31, 2015 (Unaudited)
POP, the “Public Offering Price”, and NAV, the “Net Asset Value” price, are terms used to describe what share price was applied to Class A and/or Class C shares at the time of purchase. A CDSC (“Contingent Deferred Sales Charge”) is a redemption fee that can be applied if purchased shares are redeemed prior to a specified holding period. For additional information please consult the Fund’s Prospectus.
The S&P 500® Total Return Index is an unmanaged index of 500 common stocks chosen for market size, liquidity and industry group representation. It is a market-value weighted index. The index is not actively managed and does not reflect any deduction for fees, expenses or taxes.
An investor may not invest directly in an index.
Diversification does not eliminate the risk of experiencing investment losses.
Information included or referred to on, or otherwise accessible through, our website is not intended to form part of or be incorporated into this report or the Fund's prospectus.
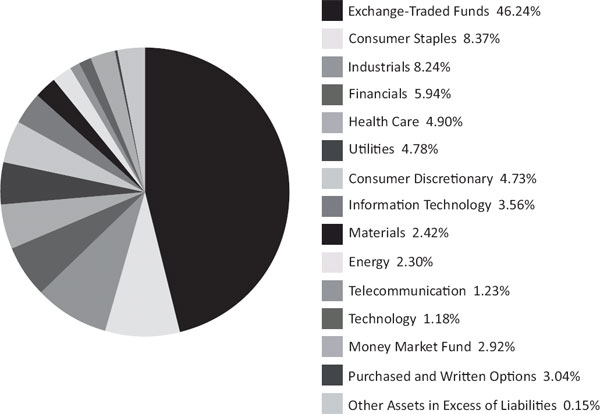
Portfolio Composition (as a % of net assets)
| Annual Report | May 31, 2015 | 13 |
| Stadion Alternative Income Fund | Performance Information |
| May 31, 2015 (Unaudited) |
Comparison of the Change in Value of a $10,000 Investment in Stadion Alternative Income Fund(a) and Barclays Capital U.S. Aggregate Bond Index
Average Annual Total Returns(b) (for periods ended May 31, 2015)
| | 1 Year | Since Inception(c) |
| Stadion Alternative Income Fund - A - NAV | 0.24% | 0.10% |
| Stadion Alternative Income Fund - A - POP | -5.50% | -2.33% |
| Stadion Alternative Income Fund - I - NAV | 0.58% | 0.33% |
| Barclays Capital U.S. Aggregate Bond Index | 3.03% | 1.98%(d) |
(a) | The line graph above represents performance of Class A shares only, which will vary from the performance of Class I shares based on the difference in loads and fees paid by shareholders in different classes. The change in value of the initial $10,000 investment shown for Class A shares in the line graph reflects the maximum front-end sales load of 5.75%. |
(b) | Total return is a measure of the change in value of an investment in the Fund over the periods covered, which assumes any dividends or capital gains distributions are reinvested in shares of the Fund. Returns do not reflect the deduction of taxes a shareholder would pay on Fund distributions or the redemption of Fund shares. Total returns shown do include the effect of applicable sales loads. |
(c) | Class A inception: 12/31/12; Class I inception: 2/14/13. The performance shown for Class I shares for periods pre-dating the commencement of operations of Class I shares reflects the performance of the Fund’s Class A shares, the initial share class, calculated using the fees and expenses of Class I and without the effect of any fee and expense limitations or waivers. If Class I shares of the Fund had been available prior to February 14, 2013, the performance shown may have been different. |
(d) | Represents the period from December 31, 2012 (date of original public offering of Class A shares) through May 31, 2015. |
The performance information quoted above represents past performance and past performance does not guarantee future results. Investment return and principal value of an investment will fluctuate so that an investor’s shares, when redeemed, may be worth more or less than their original cost. Current performance may be lower or higher than the performance data quoted. Performance data, current to the most recent month end, may be obtained by calling 1-800-222-7636. An investor should consider a Fund’s investment objectives, risks, and charges and expenses carefully before investing. The Fund’s prospectus contains this and other important information. For information on the Fund’s expense ratios, please see the Financial Highlights tables found within this Report.
The Total Annual Fund Operating Expenses for Class A and Class I are 3.03% and 2.77%, respectively. The Fund’s investment advisor, Stadion Money Management, LLC (the “Advisor”) has agreed to waive fees and reimburse for other operating expenses (exclusive of interest expense on any borrowings, taxes, brokerage commissions, extraordinary expenses, acquired fund fees and expenses and payments, if any, under a Rule 12b-1 Distribution Plan) in excess of 1.15% of the average daily net assets for Class A and Class I, until at least October 1, 2016.
POP, the “Public Offering Price”, and NAV, the “Net Asset Value” price, are terms used to describe what share price was applied to Class A shares at the time of purchase. For additional information please consult the Fund’s Prospectus.
| Stadion Alternative Income Fund | Performance Information |
| May 31, 2015 (Unaudited) |
The Barclays Capital U.S. Aggregate Bond Index is a market value-weighted index of investment grade fixed-rated debt issues, including government, corporate, asset-backed and mortgage-backed securities with a maturity of one year or more.
An investor may not invest directly in an index.
Diversification does not eliminate the risk of experiencing investment losses.
Information included or referred to on, or otherwise accessible through, our website is not intended to form part of or be incorporated into this report or the Fund's prospectus.
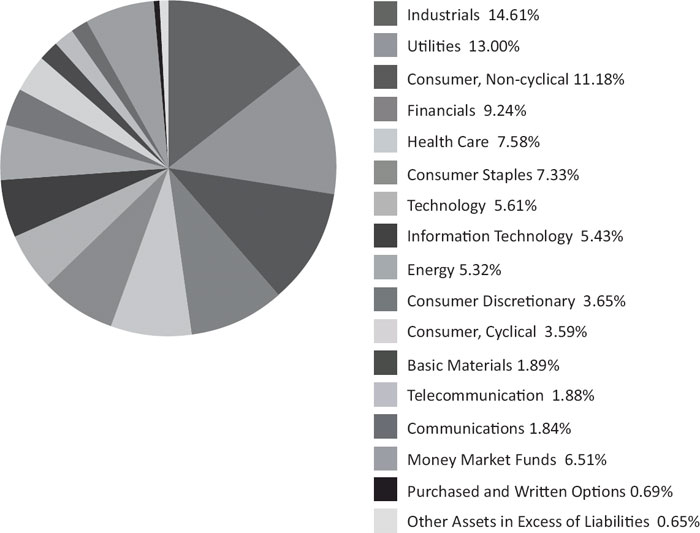
Portfolio Composition (as a % of net assets)
| Annual Report | May 31, 2015 | 15 |
| Stadion Managed Risk 100 Fund | Performance Information |
| May 31, 2015 (Unaudited) |
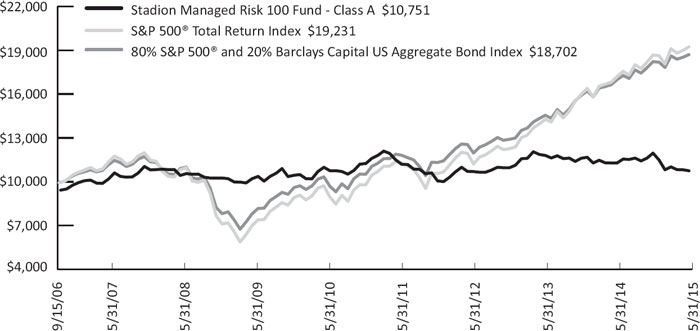
Comparison of the Change in Value of a $10,000 Investment in Stadion Managed Risk 100 Fund(a), the S&P 500® Total Return Index and 80% S&P 500® and 20% Barclays Capital U.S. Aggregate Bond Index
Average Annual Total Returns(b) (for periods ended May 31, 2015)
| | 1 Year | 5 Year | Since Inception(c) |
| Stadion Managed Risk 100 Fund - A - NAV | -4.75% | -0.01% | 1.53% |
| Stadion Managed Risk 100 Fund - A - POP | -10.19% | -1.19% | 0.84% |
| Stadion Managed Risk 100 Fund - C - NAV | -5.45% | -0.78% | 0.73% |
| Stadion Managed Risk 100 Fund - C - CDSC | -6.40% | -0.78% | 0.73% |
| Stadion Managed Risk 100 Fund - I - NAV | -4.50% | 0.22% | 1.76% |
S&P 500® Total Return Index | 11.81% | 16.54% | 7.80%(d) |
80% S&P 500® and 20% Barclays Capital US Aggregate Bond Index | 10.08% | 14.06% | 7.46%(d) |
(a) | The line graph above represents performance of Class A shares only, which will vary from the performance of Class C and Class I shares based on the difference in loads and fees paid by shareholders in different classes. The change in value of the initial $10,000 investment shown for Class A shares in the line graph reflects the maximum front-end sales load of 5.75%. |
(b) | Total return is a measure of the change in value of an investment in the Fund over the periods covered, which assumes any dividends or capital gains distributions are reinvested in shares of the Fund. Returns do not reflect the deduction of taxes a shareholder would pay on Fund distributions or the redemption of Fund shares. Total returns shown do include the effect of applicable sales loads. |
(c) | Class A, Class C and I shares of the Fund commenced operations on September 15, 2006, October 1, 2009 and May 28, 2010, respectively. The performance shown for Class C and I shares for periods pre-dating the commencement of operations of those classes reflects the performance of the Fund’s Class A shares, the initial share class, calculated using the fees and expenses of Class C and I shares respectively and without the effect of any fee and expense limitations or waivers. If Class C and I shares of the Fund had been available during periods prior to October 1, 2009 and May 28, 2010, respectively, the performance shown may have been different. |
(d) | Represents the period from September 15, 2006 (date of original public offering of Class A shares) through May 31, 2015. |
The performance information quoted above represents past performance and past performance does not guarantee future results. Investment return and principal value of an investment will fluctuate so that an investor’s shares, when redeemed, may be worth more or less than their original cost. Current performance may be lower or higher than the performance data quoted. Performance data, current to the most recent month end, may be obtained by calling 1-800-222-7636. An investor should consider a Fund’s investment objectives, risks, and charges and expenses carefully before investing. The Fund’s prospectus contains this and other important information. For information on the Fund’s expense ratios, please see the Financial Highlights tables found within this Report.
The Total Annual Fund Operating Expenses for Class A, Class C and Class I are 1.70%, 2.46% and 1.48%, respectively.
| Stadion Managed Risk 100 Fund | Performance Information |
| May 31, 2015 (Unaudited) |
POP, the “Public Offering Price”, and NAV, the “Net Asset Value” price, are terms used to describe what share price was applied to Class A and/or Class C shares at the time of purchase. A CDSC (“Contingent Deferred Sales Charge”) is a redemption fee that can be applied if purchased shares are redeemed prior to a specified holding period. For additional information please consult the Fund’s Prospectus.
The S&P 500® Total Return Index is an unmanaged index of 500 common stocks chosen for market size, liquidity and industry group representation. It is a market-value weighted index. The index is not actively managed and does not reflect any deduction for fees, expenses or taxes.
The Barclays Capital U.S. Aggregate Bond Index is a market value-weighted index of investment grade fixed-rated debt issues, including government, corporate, asset-backed and mortgage-backed securities with a maturity of one year or more.
An investor may not invest directly in an index.
Diversification does not eliminate the risk of experiencing investment losses.
Information included or referred to on, or otherwise accessible through, our website is not intended to form part of or be incorporated into this report or the Fund's prospectus.
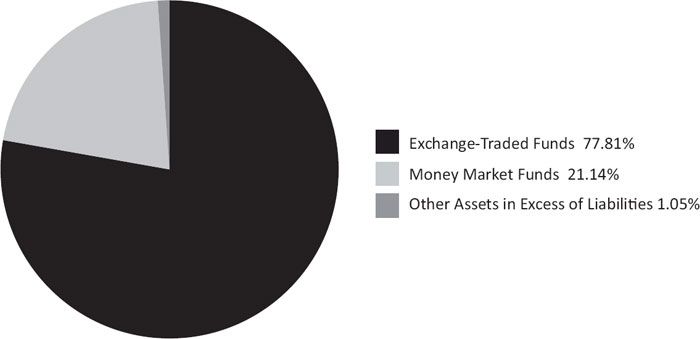
Portfolio Composition (as a % of net assets)
| Annual Report | May 31, 2015 | 17 |
| Stadion Investment Trust | Disclosure of Fund Expenses |
| | May 31, 2015 (Unaudited) |
We believe it is important for you to understand the impact of costs on your investment. As a shareholder of the Funds, you may incur two types of costs: (1) transaction costs, possibly including front-end and contingent deferred sales loads; and (2) ongoing costs, including management fees, distribution (12b-1) fees and other Fund expenses. The following examples are intended to help you understand your ongoing costs (in dollars) of investing in the Funds and to compare these costs with the ongoing costs of investing in other mutual funds.
A mutual funds’ ongoing costs are expressed as a percentage of its average net assets. This figure is known as the expense ratio. The expenses in the tables that follow are based on an investment of $1,000 made at the beginning of the most recent semi-annual period (December 1, 2014) and held until the end of the period (May 31, 2015).
The tables that follow illustrate the Funds’ costs in two ways:
Actual fund return – This section helps you to estimate the actual expenses that you paid over the period. The “Ending Account Value” shown is derived from the Funds’ actual returns, and the third column shows the dollar amount of operating expenses that would have been paid by an investor who started with $1,000 in the Funds. You may use the information here, together with the amount you invested, to estimate the expenses that you paid over the period.
To do so, simply divide your account value by $1,000 (for example, an $8,600 account value divided by $1,000 = 8.6), then multiply the result by the number given for the Fund under the heading “Expenses Paid During Period.”
Hypothetical 5% return – This section is intended to help you compare the Funds’ ongoing costs with those of other mutual funds. It assumes that each Fund had an annual return of 5% before expenses during the period shown, but that the expense ratio is unchanged. In this case, because the returns used are not the Funds’ actual returns, the results do not apply to your investment. The example is useful in making comparisons because the SEC requires all mutual funds to calculate expenses based on a 5% return. You can assess the Funds’ ongoing costs by comparing this hypothetical example with the hypothetical examples that appear in shareholder reports of other funds.
Note that expenses shown in the tables are meant to highlight and help you compare ongoing costs only and do not reflect any transaction costs, such as sales charges (loads). The calculations assume no shares were bought or sold during the period. Your actual costs may have been higher or lower, depending on the amount of your investment and the timing of any purchases or redemptions.
More information about the Funds’ expenses, including historical annual expense ratios, can be found in this report. For additional information on operating expenses and other shareholder costs, please refer to the Funds’ prospectus.
| | | Beginning
Account Value
12/1/14 | | Ending
Account Value
5/31/15 | | Expense Ratio(a) | | Expenses Paid
During period
12/1/14 - 5/31/15(b) |
| | | | | | | | | | | | | | |
Stadion Tactical Growth Fund - Class A | | | | | | | | | | | | | |
| Based on Actual Fund Return | | | $ 1,000.00 | | | $ | 1,012.50 | | | 1.58 | % | | | $ | 7.93 | |
| Based on Hypothetical 5% Return (before expenses) | | | $ 1,000.00 | | | $ | 1,017.05 | | | 1.58 | % | | | $ | 7.95 | |
Stadion Tactical Growth Fund - Class C | | | | | | | | | | | | | | | | |
| Based on Actual Fund Return | | | $ 1,000.00 | | | $ | 1,008.80 | | | 2.32 | % | | | $ | 11.62 | |
| Based on Hypothetical 5% Return (before expenses) | | | $ 1,000.00 | | | $ | 1,013.36 | | | 2.32 | % | | | $ | 11.65 | |
Stadion Tactical Growth Fund - Class I | | | | | | | | | | | | | | | | |
| Based on Actual Fund Return | | | $ 1,000.00 | | | $ | 1,013.60 | | | 1.33 | % | | | $ | 6.68 | |
| Based on Hypothetical 5% Return (before expenses) | | | $ 1,000.00 | | | $ | 1,018.30 | | | 1.33 | % | | | $ | 6.69 | |
| | | | | | | | | | | | | | | | | |
Stadion Tactical Defensive Fund - Class A | | | | | | | | | | | | | | | | |
| Based on Actual Fund Return | | | $ 1,000.00 | | | $ | 968.70 | | | 1.91 | % | | | $ | 9.37 | |
| Based on Hypothetical 5% Return (before expenses) | | | $ 1,000.00 | | | $ | 1,015.41 | | | 1.91 | % | | | $ | 9.60 | |
Stadion Tactical Defensive Fund - Class C | | | | | | | | | | | | | | | | |
| Based on Actual Fund Return | | | $ 1,000.00 | | | $ | 964.90 | | | 2.69 | % | | | $ | 13.18 | |
| Based on Hypothetical 5% Return (before expenses) | | | $ 1,000.00 | | | $ | 1,011.52 | | | 2.69 | % | | | $ | 13.49 | |
Stadion Tactical Defensive Fund - Class I | | | | | | | | | | | | | | | | |
| Based on Actual Fund Return | | | $ 1,000.00 | | | $ | 969.80 | | | 1.73 | % | | | $ | 8.50 | |
| Based on Hypothetical 5% Return (before expenses) | | | $ 1,000.00 | | | $ | 1,016.31 | | | 1.73 | % | | | $ | 8.70 | |
| | | | | | | | | | | | | | | | | |
| Stadion Investment Trust | Disclosure of Fund Expenses |
| | May 31, 2015 (Unaudited) |
| | | Beginning
Account Value
12/1/14 | | Ending
Account Value
5/31/15 | | Expense Ratio(a) | | Expenses Paid
During period
12/1/14 - 5/31/15(b) |
Stadion Defensive International Fund - Class A | | | | | | | | | | | | | | | | |
| Based on Actual Fund Return | | | $ 1,000.00 | | | $ | 1,002.80 | | | 1.95 | % | | | $ | 9.74 | |
| Based on Hypothetical 5% Return (before expenses) | | | $ 1,000.00 | | | $ | 1,015.21 | | | 1.95 | % | | | $ | 9.80 | |
Stadion Defensive International Fund - Class C | | | | | | | | | | | | | | | | |
| Based on Actual Fund Return | | | $ 1,000.00 | | | $ | 999.50 | | | 2.70 | % | | | $ | 13.46 | |
| Based on Hypothetical 5% Return (before expenses) | | | $ 1,000.00 | | | $ | 1,011.47 | | | 2.70 | % | | | $ | 13.54 | |
Stadion Defensive International Fund - Class I | | | | | | | | | | | | | | | | |
| Based on Actual Fund Return | | | $ 1,000.00 | | | $ | 1,004.20 | | | 1.70 | % | | | $ | 8.49 | |
| Based on Hypothetical 5% Return (before expenses) | | | $ 1,000.00 | | | $ | 1,016.45 | | | 1.70 | % | | | $ | 8.55 | |
| | | | | | | | | | | | | | | | | |
Stadion Trilogy Alternative Return Fund - Class A | | | | | | | | | | | | | | | | |
| Based on Actual Fund Return | | | $ 1,000.00 | | | $ | 1,017.50 | | | 1.85 | % | | | $ | 9.31 | |
| Based on Hypothetical 5% Return (before expenses) | | | $ 1,000.00 | | | $ | 1,015.71 | | | 1.85 | % | | | $ | 9.30 | |
Stadion Trilogy Alternative Return Fund - Class C | | | | | | | | | | | | | | | | |
| Based on Actual Fund Return | | | $ 1,000.00 | | | $ | 1,013.50 | | | 2.63 | % | | | $ | 13.20 | |
| Based on Hypothetical 5% Return (before expenses) | | | $ 1,000.00 | | | $ | 1,011.82 | | | 2.63 | % | | | $ | 13.19 | |
Stadion Trilogy Alternative Return Fund - Class I | | | | | | | | | | | | | | | | |
| Based on Actual Fund Return | | | $ 1,000.00 | | | $ | 1,017.90 | | | 1.65 | % | | | $ | 8.30 | |
| Based on Hypothetical 5% Return (before expenses) | | | $ 1,000.00 | | | $ | 1,016.70 | | | 1.65 | % | | | $ | 8.30 | |
| | | | | | | | | | | | | | | | | |
Stadion Alternative Income Fund - Class A | | | | | | | | | | | | | | | | |
| Based on Actual Fund Return | | | $ 1,000.00 | | | $ | 1,008.20 | | | 1.40 | % | | | $ | 7.01 | |
| Based on Hypothetical 5% Return (before expenses) | | | $ 1,000.00 | | | $ | 1,017.95 | | | 1.40 | % | | | $ | 7.04 | |
Stadion Alternative Income Fund - Class I | | | | | | | | | | | | | | | | |
| Based on Actual Fund Return | | | $ 1,000.00 | | | $ | 1,009.80 | | | 1.15 | % | | | $ | 5.76 | |
| Based on Hypothetical 5% Return (before expenses) | | | $ 1,000.00 | | | $ | 1,019.20 | | | 1.15 | % | | | $ | 5.79 | |
| | | | | | | | | | | | | | | | | |
Stadion Managed Risk 100 Fund - Class A | | | | | | | | | | | | | | | | |
| Based on Actual Fund Return | | | $ 1,000.00 | | | $ | 899.00 | | | 1.69 | % | | | $ | 8.00 | |
| Based on Hypothetical 5% Return (before expenses) | | | $ 1,000.00 | | | $ | 1,016.50 | | | 1.69 | % | | | $ | 8.50 | |
Stadion Managed Risk 100 Fund - Class C | | | | | | | | | | | | | | | | |
| Based on Actual Fund Return | | | $ 1,000.00 | | | $ | 895.70 | | | 2.49 | % | | | $ | 11.77 | |
| Based on Hypothetical 5% Return (before expenses) | | | $ 1,000.00 | | | $ | 1,012.52 | | | 2.49 | % | | | $ | 12.49 | |
Stadion Managed Risk 100 Fund - Class I | | | | | | | | | | | | | | | | |
| Based on Actual Fund Return | | | $ 1,000.00 | | | $ | 900.00 | | | 1.53 | % | | | $ | 7.25 | |
| Based on Hypothetical 5% Return (before expenses) | | | $ 1,000.00 | | | $ | 1,017.30 | | | 1.53 | % | | | $ | 7.70 | |
| | | | | | | | | | | | | | | | | |
(a) | The Fund’s expense ratios have been based on the Fund's most recent fiscal half-year expenses. |
(b) | Expenses are equal to the Fund's annualized expense ratio, multiplied by the average account value over the period, multiplied by the number of days in the most recent fiscal half-year (182/365). |
| Annual Report | May 31, 2015 | 19 |
| Stadion Tactical Growth Fund | Schedule of Investments |
| | May 31, 2015 |
| EXCHANGE-TRADED FUNDS - 97.09% | Shares | | Value | |
Consumer Staples Select Sector SPDR® Fund | | | 195,169 | | | $ | 9,522,295 | |
| Global X Silver Miners ETF | | | 818,190 | | | | 7,363,710 | |
iShares® Core S&P 500® ETF | | | 134,430 | | | | 28,577,129 | |
iShares® Core S&P® Mid-Cap ETF | | | 187,382 | | | | 28,528,909 | |
iShares® MSCI Austria Capped ETF | | | 328,470 | | | | 5,508,442 | |
iShares® MSCI Europe Financial Sector Index Fund | | | 396,710 | | | | 9,469,468 | |
iShares® Russell 2000® Growth ETF | | | 62,384 | | | | 9,507,322 | |
Powershares® QQQ Trust Series 1 | | | 172,817 | | | | 19,018,511 | |
ProShares® Short 20+ Year Treasury(a) | | | 379,460 | | | | 9,592,749 | |
SPDR® S&P China ETF | | | 59,100 | | | | 5,586,723 | |
SPDR® S&P International Small Cap ETF(a) | | | 185,620 | | | | 5,713,384 | |
Vanguard® Growth ETF | | | 261,101 | | | | 28,496,563 | |
Vanguard® Health Care ETF | | | 136,740 | | | | 19,118,987 | |
| | | | | | | | | |
| TOTAL EXCHANGE-TRADED FUNDS | | | | | |
| (Cost $179,721,972) | | | | | | | 186,004,192 | |
| | | | | | | | | |
| | | | | | | | | |
| MONEY MARKET FUNDS - 3.52% | Shares | | Value | |
| Morgan Stanley Institutional Liquidity Fund - Government Portfolio, 0.040%, 7-day effective yield | | | 6,735,809 | | | $ | 6,735,809 | |
| | | | | | | | | |
| TOTAL MONEY MARKET FUNDS | | | | | | | | |
| (Cost $6,735,809) | | | | | | | 6,735,809 | |
| | | | | | | | | |
| Total Investments, at Value - 100.61% | | | | | |
| (Cost $186,457,781) | | | | | | | 192,740,001 | |
| | | | | | | | | |
| Liabilities in Excess of Other Assets - (0.61)% | | | | | | | (1,168,064 | ) |
| | | | | | | | | |
| | | | | | | | | |
| Net Assets - 100.00% | | | | | | $ | 191,571,937 | |
(a) | Non-income producing security. |
See Notes to Financial Statements.
| Stadion Tactical Defensive Fund | Schedule of Investments |
| | May 31, 2015 |
| EXCHANGE-TRADED FUNDS - 87.69% | Shares | | Value | |
First Trust NASDAQ-100® Equal Weighted Index Fund | | | 149,830 | | | $ | 6,748,343 | |
Guggenheim® S&P 500® Equal Weight ETF | | | 181,932 | | | | 14,912,966 | |
iShares® MSCI EAFE Index Fund | | | 24,590 | | | | 1,638,678 | |
iShares® MSCI Emerging Markets ETF | | | 32,400 | | | | 1,618,380 | |
iShares® Russell® 1000 Value Index Fund | | | 63,580 | | | | 6,693,702 | |
iShares® Russell® 2000 Growth ETF | | | 22,160 | | | | 3,377,184 | |
iShares® S&P 100® Index Fund | | | 71,750 | | | | 6,670,598 | |
iShares® US Technology ETF | | | 61,260 | | | | 6,724,510 | |
SPDR® Dow Jones® Industrial Average ETF Trust | | | 55,120 | | | | 9,927,663 | |
| | | | | | | | | |
| TOTAL EXCHANGE-TRADED FUNDS | | | | | |
| (Cost $54,873,274) | | | | | | | 58,312,024 | |
| | | | | | | | | |
| MONEY MARKET FUNDS - 12.33% | Shares | | Value | |
| Morgan Stanley Institutional Liquidity Fund - Government Portfolio, 0.040%, 7-day effective yield | | | 8,198,656 | | | $ | 8,198,656 | |
| | | | | | | | | |
| TOTAL MONEY MARKET FUNDS | | | | | | | | |
| (Cost $8,198,656) | | | | | | | 8,198,656 | |
| | | | | | | | | |
| Total Investments, at Value - 100.02% | | | | | |
| (Cost $63,071,930) | | | | | | | 66,510,680 | |
| | | | | | | | | |
| Liabilities in Excess of Other Assets - (0.02)% | | | | | | | (11,895 | ) |
| | | | | | | | | |
| Net Assets - 100.00% | | | | | | $ | 66,498,785 | |
See Notes to Financial Statements.
| Annual Report | May 31, 2015 | 21 |
| Stadion Defensive International Fund | Schedule of Investments |
| | May 31, 2015 |
| EXCHANGE-TRADED FUNDS - 53.50% | Shares | | Value | |
iShares® MSCI China ETF | | | 14,420 | | | $ | 863,037 | |
iShares® MSCI EAFE Index Fund | | | 18,390 | | | | 1,225,510 | |
iShares® MSCI Emerging Markets ETF | | | 54,310 | | | | 2,233,227 | |
iShares® MSCI Japan ETF | | | 59,610 | | | | 777,910 | |
iShares® MSCI United Kingdom Index Fund | | | 39,760 | | | | 768,561 | |
WisdomTree® Europe Hedged Equity Fund | | | 22,840 | | | | 1,487,112 | |
WisdomTree® Japan Hedged Equity Fund | | | 13,570 | | | | 811,215 | |
| | | | | | | | | |
| TOTAL EXCHANGE-TRADED FUNDS | | | | | |
| (Cost $8,284,260) | | | | | | | 8,166,572 | |
| | | | | | | | | |
| MONEY MARKET FUNDS - 45.61% | Shares | | Value | |
| Morgan Stanley Institutional Liquidity Fund - Government Portfolio, 0.040%, 7-day effective yield | | | 6,961,172 | | | $ | 6,961,172 | |
| | | | | | | | | |
| TOTAL MONEY MARKET FUNDS | | | | | | | | |
| (Cost $6,961,172) | | | | | | | 6,961,172 | |
| | | | | | | | | |
| Total Investments, at Value - 99.11% | | | | | |
| (Cost $15,245,432) | | | | | | | 15,127,744 | |
| | | | | | | | | |
| Other Assets in Excess of Liabilities - 0.89% | | | | | | | 136,599 | |
| | | | | | | | | |
| | | | | | | | | |
| Net Assets - 100.00% | | | | | | $ | 15,264,343 | |
See Notes to Financial Statements.
| Stadion Trilogy Alternative Return Fund | Schedule of Investments |
| | May 31, 2015 |
| COMMON STOCKS - 47.65% | | Shares | | | Value | |
| Consumer Discretionary - 4.73% | | | | |
| Distributors - 1.15% | | | | | | |
Genuine Parts Co.(a) | | | 13,310 | | | $ | 1,204,156 | |
| | | | | | | | | |
| Hotels, Restaurants & Leisure - 1.18% | | | | | | | | |
McDonald’s Corp.(a) | | | 12,864 | | | | 1,234,044 | |
| | | | | | | | | |
| Leisure Equipment & Products - 1.20% | | | | | | | | |
Polaris Industries, Inc.(a) | | | 8,769 | | | | 1,254,405 | |
| | | | | | | | | |
| Media - 1.20% | | | | | | | | |
Time Warner, Inc.(a) | | | 14,886 | | | | 1,257,569 | |
| | | | | | | | | |
| Consumer Staples - 8.37% | | | | | |
| Food & Staples Retailing - 2.40% | | | | | | | | |
Costco Wholesale Corp.(a) | | | 8,620 | | | | 1,229,126 | |
Sysco Corp.(a) | | | 34,392 | | | | 1,278,007 | |
| | | | | | | | 2,507,133 | |
| | | | | | | | | |
| Food Products - 3.60% | | | | | | | | |
General Mills, Inc.(a) | | | 22,283 | | | | 1,251,190 | |
Kellogg Co.(a) | | | 19,672 | | | | 1,234,811 | |
McCormick & Co., Inc. - Non-Voting Shares(a) | | | 16,307 | | | | 1,280,100 | |
| | | | | | | | 3,766,101 | |
| | | | | | | | | |
| Household Products - 1.16% | | | | | | | | |
Procter & Gamble Co.(a) | | | 15,521 | | | | 1,216,691 | |
| | | | | | | | | |
| Tobacco - 1.21% | | | | | | | | |
Reynolds American, Inc.(a) | | | 16,423 | | | | 1,260,465 | |
| | | | | | | | | |
| Energy - 2.30% | | | | | |
| Oil, Gas & Consumable Fuels - 2.30% | | | | | | | | |
Chevron Corp.(a) | | | 11,644 | | | | 1,199,332 | |
ConocoPhillips(a) | | | 18,975 | | | | 1,208,328 | |
| | | | | | | | 2,407,660 | |
| | | | | | | | | |
| Financials - 5.94% | | | | | |
| Banks - 2.38% | | | | | | | | |
US Bancorp(a) | | | 28,620 | | | | 1,233,808 | |
| Wells Fargo & Co. | | | 22,502 | | | | 1,259,212 | |
| | | | | | | | 2,493,020 | |
| | | | | | | | | |
| Capital Markets - 1.18% | | | | | | | | |
Eaton Vance Corp.(a) | | | 30,518 | | | | 1,239,031 | |
| | | | | | | | | |
| Insurance - 2.38% | | | | | | | | |
Aflac, Inc.(a) | | | 19,523 | | | | 1,214,721 | |
Brown & Brown, Inc.(a) | | | 39,192 | | | | 1,269,429 | |
| | | | | | | | 2,484,150 | |
| | | | | | | | | |
| Health Care - 4.90% | | | | | |
| Health Care Equipment & Supplies - 1.22% | | | | | | | | |
Abbott Laboratories(a) | | | 26,349 | | | | 1,280,561 | |
| Annual Report | May 31, 2015 | 23 |
| Stadion Trilogy Alternative Return Fund | Schedule of Investments |
| | May 31, 2015 |
| COMMON STOCKS - 47.65% (continued) | | Shares | | | Value | |
| Health Care - 4.90% (continued) | | | | |
| Pharmaceuticals - 3.68% | | | | | | |
Eli Lilly & Co.(a) | | | 17,030 | | | $ | 1,343,667 | |
Johnson & Johnson(a) | | | 12,380 | | | | 1,239,733 | |
Merck & Co., Inc.(a) | | | 20,749 | | | | 1,263,407 | |
| | | | | | | | 3,846,807 | |
| | | | | | | | | |
| Industrials - 8.24% | | | | | |
| Aerospace & Defense - 2.38% | | | | | | | | |
Lockheed Martin Corp.(a) | | | 6,579 | | | | 1,238,168 | |
United Technologies Corp.(a) | | | 10,640 | | | | 1,246,689 | |
| | | | | | | | 2,484,857 | |
| | | | | | | | | |
| Commercial Services & Supplies - 1.21% | | | | | | | | |
| Waste Management, Inc. | | | 25,407 | | | | 1,261,458 | |
| | | | | | | | | |
| Electrical Equipment - 1.23% | | | | | | | | |
Emerson Electric Co.(a) | | | 21,337 | | | | 1,286,834 | |
| | | | | | | | | |
| Machinery - 1.17% | | | | | | | | |
Illinois Tool Works, Inc.(a) | | | 13,033 | | | | 1,222,886 | |
| | | | | | | | | |
| Road & Rail - 1.09% | | | | | | | | |
Norfolk Southern Corp.(a) | | | 12,431 | | | | 1,143,652 | |
| | | | | | | | | |
| Trading Companies & Distributors - 1.16% | | | | | | | | |
WW Grainger, Inc.(a) | | | 5,048 | | | | 1,213,186 | |
| | | | | | | | | |
| Information Technology - 3.56% | | | | | |
| Communications Equipment - 1.21% | | | | | | | | |
Harris Corp.(a) | | | 15,912 | | | | 1,260,549 | |
| | | | | | | | | |
| IT Services - 1.17% | | | | | | | | |
Automatic Data Processing, Inc.(a) | | | 14,351 | | | | 1,227,154 | |
| | | | | | | | | |
| Software - 1.18% | | | | | | | | |
Microsoft Corp.(a) | | | 26,326 | | | | 1,233,636 | |
| | | | | | | | | |
| Materials - 2.42% | | | | | |
| Chemicals - 1.20% | | | | | | | | |
Ecolab, Inc.(a) | | | 10,989 | | | | 1,259,889 | |
| | | | | | | | | |
| Containers & Packaging - 1.22% | | | | | | | | |
AptarGroup, Inc.(a) | | | 19,941 | | | | 1,271,637 | |
| | | | | | | | | |
| Technology - 1.18% | | | | | |
| Computers - 1.18% | | | | | | | | |
International Business Machines Corp.(a) | | | 7,280 | | | | 1,235,052 | |
| | | | | | | | | |
| Telecommunication - 1.23% | | | | | |
| Diversified Telecommunication Services - 1.23% | | | | | | | | |
AT&T, Inc.(a) | | | 37,365 | | | | 1,290,587 | |
| Stadion Trilogy Alternative Return Fund | Schedule of Investments |
| | May 31, 2015 |
| COMMON STOCKS - 47.65% (continued) | | | | | | Shares | | | Value | |
| Utilities - 4.78% | | | | |
| Electric Utilities - 2.40% | | | | | | | | | |
Eversource Energy(a) | | | | | | 25,685 | | | $ | 1,264,986 | |
Southern Co.(a) | | | | | | 28,441 | | | | 1,242,588 | |
| | | | | | | | | | | | 2,507,574 | |
| | | | | | | | | | | | | |
| Gas Utilities - 1.20% | | | | | | | | | | | |
National Fuel Gas Co.(a) | | | | | | 19,572 | | | | 1,257,501 | |
| | | | | | | | | | | | | |
| Multi-Utilities - 1.18% | | | | | | | | | | | |
Dominion Resources, Inc.(a) | | | | | | 17,429 | | | | 1,229,093 | |
| | | | | | | | | | | | | |
| TOTAL COMMON STOCKS | | | | | |
| (Cost $38,269,194) | | | | | | | | | | | 49,837,338 | |
| | | | | | | | | | | | | |
| EXCHANGE-TRADED FUNDS - 46.24% | | | | | | Shares | | | Value | |
iShares® Baa - Ba Rated Corporate Bond ETF | | | | | | 99,942 | | | $ | 5,266,943 | |
iShares® Barclays® 1-3 Year Credit Bond Fund(a) | | | | | | 102,615 | | | | 10,826,909 | |
iShares® Barclays® Intermediate Credit Bond Fund | | | | | | 95,717 | | | | 10,525,999 | |
iShares® Barclays® MBS Bond Fund(a) | | | | | | 100,370 | | | | 11,023,637 | |
iShares® iBoxx® $ Investment Grade Corporate Bond ETF | | | | | | 45,290 | | | | 5,356,448 | |
PIMCO® 0-5 Year High Yield Corporate Bond Index Exchange-Traded Fund | | | | 52,620 | | | | 5,358,295 | |
| | | | | | | | | | | | | |
| TOTAL EXCHANGE-TRADED FUNDS | | | | | |
| (Cost $48,004,098) | | | | | | | | | | | 48,358,231 | |
| | | | | | | | | | | | | |
| PURCHASED OPTION CONTRACTS - 6.36% | Expiration Date | | Strike Price | | | Contracts | | | Value | |
| Call Option Contracts - 1.51% | | | | | | | | | | | |
S&P 500® Index: | | | | | |
| 06/05/2015 | | $ | 2,225 | | | | 60 | | | $ | 150 | |
| 06/12/2015 | | | 2,200 | | | | 60 | | | | 600 | |
| 06/19/2015 | | | 2,250 | | | | 55 | | | | 550 | |
| 06/26/2015 | | | 2,250 | | | | 55 | | | | 825 | |
| 07/02/2015 | | | 2,250 | | | | 55 | | | | 1,100 | |
| 07/10/2015 | | | 2,250 | | | | 55 | | | | 825 | |
| 12/19/2015 | | | 1,950 | | | | 20 | | | | 385,000 | |
| 12/19/2015 | | | 2,000 | | | | 40 | | | | 617,400 | |
| 06/17/2016 | | | 2,000 | | | | 30 | | | | 569,850 | |
| | | | | | | | | | | | | 1,576,300 | |
| Put Option Contracts - 4.85% | | | | | | | | | | | | |
CBOE S&P 500® Index | 06/19/2015 | | $ | 1,675 | | | | 200 | | | $ | 3,500 | |
| iPATH S&P 500 VIX Short-Term Futures ETN | 12/18/2015 | | | 20 | | | | 3,500 | | | | 1,478,750 | |
S&P 500® Index: | | | | | |
| 06/05/2015 | | | 2,000 | | | | 60 | | | | 4,950 | |
| 06/12/2015 | | | 1,950 | | | | 30 | | | | 2,850 | |
| 06/19/2015 | | | 1,975 | | | | 55 | | | | 17,325 | |
| 06/26/2015 | | | 2,000 | | | | 55 | | | | 35,750 | |
| 07/02/2015 | | | 2,025 | | | | 55 | | | | 63,800 | |
| 07/10/2015 | | | 2,000 | | | | 55 | | | | 61,600 | |
| 09/18/2015 | | | 1,850 | | | | 300 | | | | 432,000 | |
| 12/19/2015 | | | 1,800 | | | | 200 | | | | 535,000 | |
| 03/18/2016 | | | 1,900 | | | | 100 | | | | 614,500 | |
| 06/17/2016 | | | 1,900 | | | | 100 | | | | 819,500 | |
| Annual Report | May 31, 2015 | 25 |
| Stadion Trilogy Alternative Return Fund | Schedule of Investments |
| | May 31, 2015 |
| PURCHASED OPTION CONTRACTS - 6.36% (continued) | Expiration Date | | Strike Price | | | Contracts | | | Value | |
| Put Option Contracts - 4.85% (continued) | | | | | | | | | |
SPDR® S&P 500® ETF Trust: | | | | |
| 06/19/2015 | | $ | 160 | | | | 800 | | | $ | 1,200 | |
| 06/19/2015 | | | 170 | | | | 500 | | | | 1,250 | |
| 12/19/2015 | | | 180 | | | | 100 | | | | 27,400 | |
| 03/18/2016 | | | 175 | | | | 300 | | | | 112,500 | |
| 03/18/2016 | | | 180 | | | | 500 | | | | 223,750 | |
| 06/17/2016 | | | 175 | | | | 1,200 | | | | 639,600 | |
| | | | | | | | | | | | | 5,075,225 | |
| TOTAL PURCHASED OPTION CONTRACTS | | | | | | | | | | | | |
| (Cost $13,100,577) | | | | | | | | | | | | 6,651,525 | |
| | | | | | | | | |
| MONEY MARKET FUNDS - 2.92% | | | Shares | | | Value | |
Morgan Stanley Institutional Liquidity Fund - Government Portfolio, 0.040%, 7-day effective yield(a) | | | | 3,052,793 | | | $ | 3,052,793 | |
| | | | | | | | | | | | | | |
| TOTAL MONEY MARKET FUNDS | | | | | | | | | |
| (Cost $3,052,793) | | | | | | | | 3,052,793 | |
| | | | | |
| Total Investments, at Value - 103.17% | | | | | |
| (Cost $102,426,662) | | | | | | | | | | | | 107,899,887 | |
| | | | | | | | | | | | | | |
| Written Option Contracts - (3.32)% | | | | (3,474,125 | ) |
| | | | | | | | | | | | | | |
| Other Assets in Excess of Liabilities - 0.15% | | | | | | | | 156,006 | |
| | | | | | | | | |
| Net Assets - 100.00% | | | | | | | | | | $ | 104,581,768 | |
(a) | All or portion of this security is held as collateral for written options. |
| WRITTEN OPTION CONTRACTS - 3.32% | Expiration
Date | | Strike Price | | | Contracts | | | Premiums
Received | | | Value | |
| Call Option Contracts - 1.42% | | | | | | | |
S&P 500® Index: | | | | | | | |
| 06/12/2015 | | $ | 2,100 | | | | 30 | | | $ | 91,748 | | | $ | 72,900 | |
| 06/12/2015 | | | 2,130 | | | | 20 | | | | 32,769 | | | | 15,900 | |
| 06/19/2015 | | | 2,110 | | | | 55 | | | | 191,590 | | | | 125,400 | |
| 06/26/2015 | | | 2,120 | | | | 55 | | | | 166,045 | | | | 113,850 | |
| 06/26/2015 | | | 2,125 | | | | 40 | | | | 77,139 | | | | 70,400 | |
| 07/02/2015 | | | 2,120 | | | | 55 | | | | 186,629 | | | | 129,250 | |
| 07/10/2015 | | | 2,110 | | | | 55 | | | | 189,195 | | | | 173,525 | |
| 03/18/2016 | | | 2,250 | | | | 80 | | | | 350,877 | | | | 293,600 | |
| 06/17/2016 | | | 2,200 | | | | 40 | | | | 243,939 | | | | 299,200 | |
| 06/17/2016 | | | 2,300 | | | | 50 | | | | 226,923 | | | | 187,500 | |
| | | | 1,756,854 | | | | 1,481,525 | |
| Put Option Contracts - 1.90% | | | | | | | | | |
CBOE S&P 500® Index | 06/19/2015 | | $ | 1,500 | | | | 200 | | | $ | 827,650 | | | $ | 1,000 | |
| Stadion Trilogy Alternative Return Fund | Schedule of Investments |
| | May 31, 2015 |
| WRITTEN OPTION CONTRACTS - 3.32%(continued) | Expiration
Date | | Strike Price | | | Contracts | | | Premiums
Received | | | Value | |
| Put Option Contracts - 1.90% (continued) | | | | | | | |
S&P 500® Index: | | | | | | | |
| 06/12/2015 | | $ | 2,100 | | | | 30 | | | $ | 112,712 | | | $ | 49,500 | |
| 06/19/2015 | | | 2,110 | | | | 55 | | | | 183,945 | | | | 138,600 | |
| 06/26/2015 | | | 2,120 | | | | 55 | | | | 194,095 | | | | 184,525 | |
| 07/02/2015 | | | 2,120 | | | | 55 | | | | 162,506 | | | | 201,850 | |
| 07/10/2015 | | | 2,110 | | | | 55 | | | | 185,306 | | | | 202,125 | |
| 09/18/2015 | | | 1,750 | | | | 300 | | | | 1,891,200 | | | | 243,000 | |
| 12/19/2015 | | | 1,600 | | | | 200 | | | | 1,089,693 | | | | 221,000 | |
| 03/18/2016 | | | 1,700 | | | | 100 | | | | 349,846 | | | | 306,000 | |
| 06/17/2016 | | | 1,700 | | | | 100 | | | | 499,846 | | | | 445,000 | |
| | | | 5,496,799 | | | | 1,992,600 | |
| | | | | | | | | | | | | | | | | |
| Total Written Option Contracts | | | | | | | | | | $ | 7,253,653 | | | $ | 3,474,125 | |
See Notes to Financial Statements.
| Annual Report | May 31, 2015 | 27 |
| Stadion Alternative Income Fund | Schedule of Investments |
| | May 31, 2015 |
| COMMON STOCKS - 92.15% | | Shares | | | Value | |
| Basic Materials - 1.89% | | | | |
| Chemicals - 1.89% | | | | | | |
Air Products & Chemicals, Inc.(a) | | | 730 | | | $ | 107,135 | |
| | | | | | | | | |
| Communications - 1.84% | | | | | |
| Telecommunications - 1.84% | | | | | | | | |
Verizon Communications, Inc.(a) | | | 2,110 | | | | 104,318 | |
| | | | | | | | | |
| Consumer Discretionary - 3.65% | | | | | |
| Distributors - 1.80% | | | | | | | | |
Genuine Parts Co.(a) | | | 1,130 | | | | 102,231 | |
| | | | | | | | | |
| Hotels, Restaurants & Leisure - 1.85% | | | | | | | | |
McDonald’s Corp.(a) | | | 1,090 | | | | 104,564 | |
| | | | | | | | | |
| Consumer Staples - 7.33% | | | | | |
| Food & Staples Retailing - 1.80% | | | | | | | | |
Sysco Corp.(a) | | | 2,740 | | | | 101,818 | |
| | | | | | | | | |
| Food Products - 3.69% | | | | | | | | |
General Mills, Inc.(a) | | | 1,860 | | | | 104,439 | |
Kellogg Co.(a) | | | 1,670 | | | | 104,826 | |
| | | | | | | | 209,265 | |
| | | | | | | | | |
| Household Products - 1.84% | | | | | | | | |
Procter & Gamble Co.(a) | | | 1,330 | | | | 104,259 | |
| | | | | | | | | |
| Consumer, Cyclical - 3.59% | | | | | |
| Retail - 1.87% | | | | | | | | |
Target Corp.(a) | | | 1,340 | | | | 106,289 | |
| | | | | | | | | |
| Toys/Games/Hobbies - 1.72% | | | | | | | | |
Mattel, Inc.(a) | | | 3,770 | | | | 97,304 | |
| | | | | | | | | |
| Consumer, Non-cyclical - 11.18% | | | | | |
| Agriculture - 1.83% | | | | | | | | |
Altria Group, Inc.(a) | | | 2,030 | | | | 103,936 | |
| | | | | | | | | |
| Beverages - 3.72% | | | | | | | | |
PepsiCo, Inc.(a) | | | 1,080 | | | | 104,144 | |
The Coca-Cola Co.(a) | | | 2,600 | | | | 106,496 | |
| | | | | | | | 210,640 | |
| | | | | | | | | |
| Food - 1.90% | | | | | | | | |
The JM Smucker Co.(a) | | | 910 | | | | 107,881 | |
| | | | | | | | | |
| Household Products/Wares - 3.73% | | | | | | | | |
Kimberly-Clark Corp.(a) | | | 960 | | | | 104,506 | |
The Clorox Co.(a) | | | 990 | | | | 106,583 | |
| | | | | | | | 211,089 | |
| Stadion Alternative Income Fund | Schedule of Investments |
| | May 31, 2015 |
| COMMON STOCKS - 92.15% (continued) | | Shares | | | Value | |
| Energy - 5.32% | | | | |
| Oil, Gas & Consumable Fuels - 5.32% | | | | | | |
Chevron Corp.(a) | | | 970 | | | $ | 99,910 | |
ConocoPhillips(a) | | | 1,560 | | | | 99,341 | |
Exxon Mobil Corp.(a) | | | 1,200 | | | | 102,240 | |
| | | | | | | | 301,491 | |
| | | | | | | | | |
| Financials - 9.24% | | | | | |
| Banks - 3.73% | | | | | | | | |
JPMorgan Chase & Co.(a) | | | 1,580 | | | | 103,933 | |
Wells Fargo & Co.(a) | | | 1,920 | | | | 107,443 | |
| | | | | | | | 211,376 | |
| | | | | | | | | |
| Capital Markets - 1.84% | | | | | | | | |
Eaton Vance Corp.(a) | | | 2,570 | | | | 104,342 | |
| | | | | | | | | |
| Diversified Financial Services - 1.83% | | | | | | | | |
CME Group, Inc./IL(a) | | | 1,100 | | | | 103,620 | |
| | | | | | | | | |
| Insurance - 1.84% | | | | | | | | |
Aflac, Inc.(a) | | | 1,680 | | | | 104,529 | |
| | | | | | | | | |
| Health Care - 7.58% | | | | | |
| Health Care Equipment & Supplies - 1.85% | | | | | | | | |
Abbott Laboratories(a) | | | 2,160 | | | | 104,976 | |
| | | | | | | | | |
| Pharmaceuticals - 5.73% | | | | | | | | |
Eli Lilly & Co.(a) | | | 1,450 | | | | 114,405 | |
Johnson & Johnson(a) | | | 1,020 | | | | 102,143 | |
Merck & Co., Inc.(a) | | | 1,780 | | | | 108,384 | |
| | | | | | | | 324,932 | |
| | | | | | | | | |
| Industrials - 14.61% | | | | | |
| Aerospace & Defense - 5.54% | | | | | | | | |
General Dynamics Corp.(a) | | | 760 | | | | 106,522 | |
Lockheed Martin Corp.(a) | | | 550 | | | | 103,510 | |
United Technologies Corp.(a) | | | 890 | | | | 104,281 | |
| | | | | | | | 314,313 | |
| | | | | | | | | |
| Commercial Services & Supplies - 1.86% | | | | | | | | |
Waste Management, Inc.(a) | | | 2,120 | | | | 105,258 | |
| | | | | | | | | |
| Electrical Equipment - 1.91% | | | | | | | | |
Emerson Electric Co.(a) | | | 1,800 | | | | 108,558 | |
| | | | | | | | | |
| Machinery - 1.79% | | | | | | | | |
Illinois Tool Works, Inc.(a) | | | 1,080 | | | | 101,336 | |
| | | | | | | | | |
| Miscellaneous Manufacturing - 1.82% | | | | | | | | |
3M Co.(a) | | | 650 | | | | 103,402 | |
| | | | | | | | | |
| Road & Rail - 1.69% | | | | | | | | |
Norfolk Southern Corp.(a) | | | 1,040 | | | | 95,680 | |
| Annual Report | May 31, 2015 | 29 |
| Stadion Alternative Income Fund | Schedule of Investments |
| | May 31, 2015 |
| COMMON STOCKS - 92.15% (continued) | | | | Shares | | | Value | |
| Information Technology - 5.43% | | | | |
| Communications Equipment - 1.83% | | | | | | | |
Harris Corp.(a) | | | | 1,310 | | | $ | 103,778 | |
| | | | | | | | | | | |
| IT Services - 1.81% | | | | | | | | | |
Automatic Data Processing, Inc.(a) | | | | 1,200 | | | | 102,612 | |
| | | | | | | | | | | |
| Software - 1.79% | | | | | | | | | |
Microsoft Corp.(a) | | | | 2,170 | | | | 101,686 | |
| | | | | | | | | | | |
| Technology - 5.61% | | | | | |
| Computers - 1.83% | | | | | | | | | |
International Business Machines Corp.(a) | | | | 610 | | | | 103,487 | |
| | | | | | | | | | | |
| Semiconductors - 1.94% | | | | | | | | | |
Intel Corp.(a) | | | | 3,200 | | | | 110,272 | |
| | | | | | | | | | | |
| Software - 1.84% | | | | | | | | | |
Paychex, Inc.(a) | | | | 2,110 | | | | 104,255 | |
| | | | | | | | | | | |
| Telecommunication - 1.88% | | | | | |
| Diversified Telecommunication Services - 1.88% | | | | | | | | | |
AT&T, Inc.(a) | | | | 3,080 | | | | 106,383 | |
| | | | | | | | | | | |
| Utilities - 13.00% | | | | | |
| Electric - 5.54% | | | | | | | | | |
MDU Resources Group, Inc.(a) | | | | 4,790 | | | | 100,303 | |
NextEra Energy, Inc.(a) | | | | 1,050 | | | | 107,457 | |
SCANA Corp.(a) | | | | 2,000 | | | | 106,320 | |
| | | | | | | | | | 314,080 | |
| | | | | | | | | | | |
| Electric Utilities - 5.58% | | | | | | | | | |
Entergy Corp.(a) | | | | 1,380 | | | | 105,529 | |
Eversource Energy(a) | | | | 2,180 | | | | 107,365 | |
Southern Co.(a) | | | | 2,370 | | | | 103,545 | |
| | | | | | | | | | 316,439 | |
| | | | | | | | | | | |
| Gas - 1.88% | | | | | | | | | |
Piedmont Natural Gas Co. Inc(a) | | | | 2,860 | | | | 106,649 | |
| | | | | | | | | | | |
| TOTAL COMMON STOCKS | | | | | |
| (Cost $5,214,801) | | | | | | | | | 5,224,183 | |
| PURCHASED OPTION CONTRACTS - 4.04% | Expiration Date | | Strike Price | | | Contracts | | | Value | |
| Call Option Contracts - 0.04% | | | | | | | | | |
S&P 500® Index: | | | | |
| 06/19/2015 | | $ | 2,250 | | | | 24 | | | $ | 240 | |
| 07/17/2015 | | | 2,250 | | | | 23 | | | | 805 | |
| 06/17/2016 | | | 2,800 | | | | 26 | | | | 1,170 | |
S&P 500® Mini Index | 06/19/2015 | | | 225 | | | | 7 | | | | 88 | |
| | | | | | | | | | | | | 2,303 | |
| Stadion Alternative Income Fund | Schedule of Investments |
| | May 31, 2015 |
| PURCHASED OPTION CONTRACTS - 4.04% (continued) | Expiration Date | | Strike Price | | | Contracts | | | Value | |
| Put Option Contracts - 4.00% | | | | | | | | | |
S&P 500® Index: | | | | |
| 06/19/2015 | | $ | 1,950 | | | | 8 | | | $ | 1,760 | |
| 07/17/2015 | | | 1,970 | | | | 8 | | | | 8,080 | |
S&P 500® Mini Index | 06/19/2015 | | | 195 | | | | 9 | | | | 202 | |
SPDR® S&P 500® ETF Trust | 06/17/2016 | | | 190 | | | | 260 | | | | 217,360 | |
| | | | | | | | | | | | | 227,402 | |
| TOTAL PURCHASED OPTION CONTRACTS | | | | | | | | | | | | |
| (Cost $294,639) | | | | | | | | | | | | 229,705 | |
| | | | | | | | | |
| MONEY MARKET FUNDS - 6.51% | | | Shares | | | Value | |
| Morgan Stanley Institutional Liquidity Fund - Government Portfolio, 0.040%, 7-day effective yield | | | | 368,848 | | | $ | 368,848 | |
| | | | | | | | | | | | | | |
| TOTAL MONEY MARKET FUNDS | | | | | | | | | |
| (Cost $368,848) | | | | | | | | 368,848 | |
| | | | | |
| Total Investments, at Value - 102.70% | | | | | |
| (Cost $5,878,288) | | | | | | | | | | | | 5,822,736 | |
| | | | | | | | | | | | | | |
| Written Option Contracts - (3.35)% | | | | (189,865 | ) |
| | | | | | | | | | | | | | |
| Other Assets in Excess of Liabilities - 0.65% | | | | | | | | 36,582 | |
| | | | | | | | | |
| Net Assets - 100.00% | | | | | | | | | | $ | 5,669,453 | |
(a) | All or portion of this security is held as collateral for written options. |
| WRITTEN OPTION CONTRACTS - 3.35% | Expiration Date | | Strike Price | | | Contracts | | | Premiums
Received | | | Value | |
| Call Option Contracts - 2.66% | | | | | | | |
S&P 500® Index: | | | | | | | |
| 07/17/2015 | | $ | 2,130 | | | | 23 | | | $ | 54,014 | | | $ | 53,935 | |
| 06/17/2016 | | | 2,300 | | | | 26 | | | | 102,140 | | | | 96,850 | |
| | | | 156,154 | | | | 150,785 | |
| Put Option Contracts - 0.69% | | | | | | | | | |
S&P 500® Index | 07/17/2015 | | $ | 2,130 | | | | 8 | | | $ | 39,665 | | | $ | 39,080 | |
| | | | 39,665 | | | | 39,080 | |
| | | | | | | | | | | | | | | | | |
| Total Written Option Contracts | | | | | | | | | | $ | 195,819 | | | $ | 189,865 | |
See Notes to Financial Statements.
| Annual Report | May 31, 2015 | 31 |
| Stadion Managed Risk 100 Fund | Schedule of Investments |
| | May 31, 2015 |
| EXCHANGE-TRADED FUNDS - 77.81% | Shares | | Value | |
First Trust NASDAQ-100® Equal Weighted Index Fund | | | 459,360 | | | $ | 20,689,574 | |
Guggenheim® S&P 500® Equal Weight ETF | | | 378,250 | | | | 31,005,153 | |
iShares® US Technology ETF | | | 471,080 | | | | 51,710,452 | |
SPDR® Dow Jones® Industrial Average ETF Trust | | | 287,320 | | | | 51,749,205 | |
| | | | | | | | | |
| TOTAL EXCHANGE-TRADED FUNDS | | | | | |
| (Cost $156,047,818) | | | | | | | 155,154,384 | |
| | | | | | | | | |
| MONEY MARKET FUNDS - 21.14% | Shares | | Value | |
| Morgan Stanley Institutional Liquidity Fund - Government Portfolio, 0.040%, 7-day effective yield | | | 42,144,451 | | | $ | 42,144,451 | |
| | | | | | | | | |
| TOTAL MONEY MARKET FUNDS | | | | | | | | |
| (Cost $42,144,451) | | | | | | | 42,144,451 | |
| | | | | | | | | |
| Total Investments, at Value - 98.95% | | | | | |
| (Cost $198,192,269) | | | | | | | 197,298,835 | |
| | | | | | | | | |
| Other Assets in Excess of Liabilities - 1.05% | | | | | | | 2,095,467 | |
| | | | | | | | | |
| Net Assets - 100.00% | | | | | | $ | 199,394,302 | |
See Notes to Financial Statements.
| Stadion Investment Trust | Statements of Assets and Liabilities |
| | | Stadion Tactical
Growth Fund | | | Stadion Tactical Defensive Fund | | | Stadion Defensive
International Fund | |
| ASSETS | | | | | | | | | |
| Investments in securities: | | | | | | | | | |
| At acquisition cost | | $ | 186,457,781 | | | $ | 63,071,930 | | | $ | 15,245,432 | |
| At value (Note 2) | | $ | 192,740,001 | | | $ | 66,510,680 | | | $ | 15,127,744 | |
| Deposit with broker for futures contracts | | | – | | | | – | | | | 154,840 | |
| Dividends receivable | | | – | | | | 22,197 | | | | – | |
| Receivable for capital shares sold | | | 608,413 | | | | 144,550 | | | | 494 | |
| Interest receivable | | | 344 | | | | 459 | | | | 158 | |
| Other assets | | | 53,316 | | | | 20,556 | | | | 22,693 | |
| TOTAL ASSETS | | | 193,402,074 | | | | 66,698,442 | | | | 15,305,929 | |
| |
| LIABILITIES | |
| Payable for capital shares redeemed | | | 92,922 | | | | 73,085 | | | | 5,287 | |
| Payable for investment securities purchased | | | 1,525,118 | | | | – | | | | – | |
| Payable to Advisor (Note 5) | | | 124,456 | | | | 72,749 | | | | 9,240 | |
| Accrued distribution fees (Note 5) | | | 38,078 | | | | 16,928 | | | | 2,535 | |
| Accrued compliance fees (Note 5) | | | 2,650 | | | | 1,187 | | | | 262 | |
| Payable to administrator (Note 5) | | | 12,292 | | | | 4,710 | | | | 1,139 | |
| Other accrued expenses | | | 34,621 | | | | 30,998 | | | | 23,123 | |
| TOTAL LIABILITIES | | | 1,830,137 | | | | 199,657 | | | | 41,586 | |
| | | | | | | | | | | | | |
| NET ASSETS | | $ | 191,571,937 | | | $ | 66,498,785 | | | $ | 15,264,343 | |
| | | | | | | | | | | | | |
| Net assets consist of: | |
| Paid-in capital | | $ | 185,259,075 | | | $ | 61,969,229 | | | $ | 15,477,159 | |
| Accumulated net investment loss | | | (387,815 | ) | | | (310,655 | ) | | | (111,097 | ) |
| Accumulated net realized gains from investments and futures contracts | | | 418,457 | | | | 1,401,461 | | | | 15,969 | |
| Net unrealized appreciation (depreciation) on investments | | | 6,282,220 | | | | 3,438,750 | | | | (117,688 | ) |
| NET ASSETS | | $ | 191,571,937 | | | $ | 66,498,785 | | | $ | 15,264,343 | |
| |
| PRICING OF CLASS A SHARES | | | | | | | | | | | | |
| Net assets applicable to Class A shares | | $ | 59,365,620 | | | $ | 29,073,457 | | | $ | 11,283,551 | |
| Class A shares of beneficial interest outstanding (unlimited number of shares authorized, $0.001 par value) | | | 5,702,253 | | | | 2,424,697 | | | | 1,165,739 | |
| Net asset value, offering price and redemption price per share (Note 1) | | $ | 10.41 | | | $ | 11.99 | | | $ | 9.68 | |
| Maximum offering price per share (Note 1) | | $ | 11.05 | | | $ | 12.72 | | | $ | 10.27 | |
| PRICING OF CLASS C SHARES | | | | | | | | | | | | |
| Net assets applicable to Class C shares | | $ | 34,402,443 | | | $ | 12,145,126 | | | $ | 153,042 | |
| Class C shares of beneficial interest outstanding (unlimited number of shares authorized, $0.001 par value) | | | 3,357,032 | | | | 1,060,406 | | | | 16,079 | |
| Net asset value, offering price and redemption price per share (Note 1) | | $ | 10.25 | | | $ | 11.45 | | | $ | 9.52 | |
| PRICING OF CLASS I SHARES | | | | | | | | | | | | |
| Net assets applicable to Class I shares | | $ | 97,803,874 | | | $ | 25,280,202 | | | $ | 3,827,750 | |
| Class I shares of beneficial interest outstanding (unlimited number of shares authorized, $0.001 par value) | | | 9,347,653 | | | | 2,085,445 | | | | 393,407 | |
| Net asset value, offering price and redemption price per share (Note 1) | | $ | 10.46 | | | $ | 12.12 | | | $ | 9.73 | |
See Notes to Financial Statements.| | |
| Annual Report | May 31, 2015 | 33 |
| Stadion Investment Trust | Statements of Assets and Liabilities |
May 31, 2015
| | | Stadion Trilogy
Alternative Return
Fund | | | Stadion Alternative
Income Fund | | | Stadion Managed Risk 100 Fund | |
| ASSETS | | | | | | | | | |
| Investments in securities: | | | | | | | | | |
| At acquisition cost | | $ | 102,426,662 | | | $ | 5,878,288 | | | $ | 198,192,269 | |
| At value (Note 2) | | $ | 107,899,887 | | | $ | 5,822,736 | | | $ | 197,298,835 | |
| Deposits with broker for written options contracts | | | 48,111 | | | | – | | | | – | |
| Dividends receivable | | | 216,699 | | | | 20,913 | | | | 122,429 | |
| Receivable for capital shares sold | | | 27,567 | | | | 543 | | | | 57,306 | |
| Receivable for investment securities sold | | | 454,114 | | | | 93,680 | | | | 9,730,050 | |
| Interest receivable | | | 67 | | | | 9 | | | | 3,183 | |
| Receivable from advisor (Note 5) | | | – | | | | 19,067 | | | | – | |
| Other assets | | | 38,023 | | | | 18,714 | | | | 51,999 | |
| TOTAL ASSETS | | | 108,684,468 | | | | 5,975,662 | | | | 207,263,802 | |
| |
| LIABILITIES | |
Written Options at value (Notes 2 and 6)
(premiums received $7,253,653, $195,819 and $–, respectively) | | | 3,474,125 | | | | 189,865 | | | | – | |
| Payable for capital shares redeemed | | | 173,654 | | | | 5,029 | | | | 7,467,558 | |
| Payable for investment securities purchased | | | 270,205 | | | | 88,427 | | | | – | |
| Payable to Advisor (Note 5) | | | 112,792 | | | | – | | | | 220,790 | |
| Accrued distribution fees (Note 5) | | | 18,800 | | | | 1,110 | | | | 68,559 | |
| Accrued compliance fees (Note 5) | | | 1,834 | | | | 92 | | | | 3,975 | |
| Payable to administrator (Note 5) | | | 8,258 | | | | 481 | | | | 14,972 | |
| Other accrued expenses | | | 43,032 | | | | 21,205 | | | | 93,646 | |
| TOTAL LIABILITIES | | | 4,102,700 | | | | 306,209 | | | | 7,869,500 | |
| | | | | | | | | | | | | |
| NET ASSETS | | $ | 104,581,768 | | | $ | 5,669,453 | | | $ | 199,394,302 | |
| | | | | | | | | | | | | |
| Net assets consist of: | |
| Paid-in capital | | $ | 100,116,774 | | | $ | 5,664,128 | | | $ | 234,126,115 | |
| Accumulated net investment income (loss) | | | 205,619 | | | | 25,518 | | | | (807,144 | ) |
| Accumulated net realized gains (losses) from investments , written option contracts and securities sold short | | | (4,993,378 | ) | | | 29,405 | | | | (33,031,235 | ) |
| Net unrealized appreciation (depreciation) on investments , written option contracts and securities sold short | | | 9,252,753 | | | | (49,598 | ) | | | (893,434 | ) |
| NET ASSETS | | $ | 104,581,768 | | | $ | 5,669,453 | | | $ | 199,394,302 | |
| |
| PRICING OF CLASS A SHARES | | | | | | | | | | | | |
| Net assets applicable to Class A shares | | $ | 39,896,188 | | | $ | 5,225,677 | | | $ | 100,049,217 | |
| Class A shares of beneficial interest outstanding (unlimited number of shares authorized, $0.001 par value) | | | 3,742,841 | | | | 537,818 | | | | 10,606,777 | |
| Net asset value, offering price and redemption price per share (Note 1) | | $ | 10.66 | | | $ | 9.72 | | | $ | 9.43 | |
| Maximum offering price per share (Note 1) | | $ | 11.31 | | | $ | 10.31 | | | $ | 10.01 | |
| PRICING OF CLASS C SHARES | | | | | | | | | | | | |
| Net assets applicable to Class C shares | | $ | 11,654,430 | | | | N/A | | | $ | 49,007,927 | |
| Class C shares of beneficial interest outstanding (unlimited number of shares authorized, $0.001 par value) | | | 1,110,945 | | | | N/A | | | | 5,436,250 | |
| Net asset value, offering price and redemption price per share (Note 1) | | $ | 10.49 | | | | N/A | | | $ | 9.02 | |
| PRICING OF CLASS I SHARES | | | | | | | | | | | | |
| Net assets applicable to Class I shares | | $ | 53,031,150 | | | $ | 443,776 | | | $ | 50,337,158 | |
| Class I shares of beneficial interest outstanding (unlimited number of shares authorized, $0.001 par value) | | | 4,960,249 | | | | 46,235 | | | | 5,278,777 | |
| Net asset value, offering price and redemption price per share (Note 1) | | $ | 10.69 | | | $ | 9.60 | | | $ | 9.54 | |
See Notes to Financial Statements.
| Stadion Investment Trust | Statements of Operations |
For the Year Ended May 31, 2015
| | | Stadion Tactical
Growth Fund | | | Stadion Tactical Defensive Fund | | | Stadion Defensive
International Fund | |
| INVESTMENT INCOME | | | | | | | | | |
| Dividends | | $ | 1,156,780 | | | $ | 993,487 | | | $ | 548,428 | |
| TOTAL INVESTMENT INCOME | | | 1,156,780 | | | | 993,487 | | | | 548,428 | |
| | | | | | | | | | | | | |
| EXPENSES | | | | | | | | | | | | |
| Investment advisory fees (Note 5) | | | 996,499 | | | | 824,634 | | | | 230,759 | |
| Distribution fees, Class A (Note 5) | | | 74,893 | | | | 105,168 | | | | 39,845 | |
| Distribution fees, Class C (Note 5) | | | 88,974 | | | | 98,772 | | | | 1,640 | |
| Transfer agent fees, Common (Note 5) | | | 57,511 | | | | 63,105 | | | | 42,576 | |
| Transfer agent fees, Class A (Note 5) | | | 4,148 | | | | 5,361 | | | | 2,395 | |
| Transfer agent fees, Class C (Note 5) | | | 1,324 | | | | 3,437 | | | | 20 | |
| Transfer agent fees, Class I (Note 5) | | | 17,850 | | | | 8,911 | | | | 3,151 | |
| Administrative fees (Note 5) | | | 61,792 | | | | 49,187 | | | | 14,361 | |
| Registration and filing fees | | | 59,752 | | | | 43,862 | | | | 48,957 | |
| Professional fees | | | 32,501 | | | | 29,363 | | | | 18,732 | |
| Custodian fees | | | 7,929 | | | | 5,178 | | | | 4,946 | |
| Compliance fees (Note 5) | | | 14,317 | | | | 10,687 | | | | 3,108 | |
| Trustees' fees | | | 8,028 | | | | 7,342 | | | | 2,088 | |
| Printing of shareholder reports | | | 13,694 | | | | 16,410 | | | | 7,497 | |
| Other expenses | | | 17,345 | | | | 21,024 | | | | 9,023 | |
| TOTAL EXPENSES | | | 1,456,557 | | | | 1,292,441 | | | | 429,098 | |
| | | | | | | | | | | | | |
| Expenses waived/reimbursed by the Advisor (Note 5) | | | (144,690 | ) | | | – | | | | (73,781 | ) |
| NET EXPENSES | | | 1,311,867 | | | | 1,292,441 | | | | 355,317 | |
| | | | | | | | | | | | | |
| NET INVESTMENT INCOME (LOSS) | | | (155,087 | ) | | | (298,954 | ) | | | 193,111 | |
| | | | | | | | | | | | | |
| REALIZED AND UNREALIZED GAINS (LOSSES) ON INVESTMENTS | | | | | | | | | | | | |
| Net realized gains from investments | | | 3,301,405 | | | | 2,475,438 | | | | 387,897 | |
| Net realized loss on futures contracts | | | – | | | | – | | | | (317,362 | ) |
| Net realized capital gain distributions from other investment companies | | | 2,815 | | | | – | | | | 60,901 | |
| Net change in unrealized appreciation (depreciation) on investments | | | 955,351 | | | | (741,147 | ) | | | (759,587 | ) |
| NET REALIZED AND UNREALIZED GAINS (LOSSES) ON INVESTMENTS | | | 4,259,571 | | | | 1,734,291 | | | | (628,151 | ) |
| | | | | | | | | | | | | |
| NET INCREASE (DECREASE) IN NET ASSETS RESULTING FROM OPERATIONS | | $ | 4,104,484 | | | $ | 1,435,337 | | | $ | (435,040 | ) |
See Notes to Financial Statements.
| | |
| Annual Report | May 31, 2015 | 35 |
Stadion Investment Trust | Statements of Operations |
For the Year Ended May 31, 2015
| | | Stadion Trilogy Alternative Return
Fund | | | Stadion Alternative Income Fund | | | Stadion Managed Risk 100 Fund | |
| INVESTMENT INCOME | | | | | | | | | |
| Dividends | | $ | 2,929,441 | | | $ | 126,227 | | | $ | 5,194,711 | |
| TOTAL INVESTMENT INCOME | | | 2,929,441 | | | | 126,227 | | | | 5,194,711 | |
| | | | | | | | | | | | | |
| EXPENSES | | | | | | | | | | | | |
| Investment advisory fees (Note 5) | | | 1,630,765 | | | | 27,933 | | | | 3,755,714 | |
| Distribution fees, Class A (Note 5) | | | 176,125 | | | | 9,346 | | | | 481,803 | |
| Distribution fees, Class C (Note 5) | | | 158,359 | | | | – | | | | 730,023 | |
| Transfer agent fees, Common (Note 5) | | | 63,064 | | | | 32,808 | | | | 185,518 | |
| Transfer agent fees, Class A (Note 5) | | | 16,775 | | | | 967 | | | | 47,081 | |
| Transfer agent fees, Class C (Note 5) | | | 5,921 | | | | – | | | | 34,556 | |
| Transfer agent fees, Class I (Note 5) | | | 28,198 | | | | 488 | | | | 60,511 | |
| Administrative fees (Note 5) | | | 99,735 | | | | 4,198 | | | | 243,498 | |
| Registration and filing fees | | | 58,567 | | | | 35,934 | | | | 58,693 | |
| Professional fees | | | 46,160 | | | | 18,659 | | | | 96,267 | |
| Custodian fees | | | 13,105 | | | | 4,821 | | | | 22,607 | |
| Compliance fees (Note 5) | | | 21,229 | | | | 837 | | | | 55,507 | |
| Trustees' fees | | | 14,845 | | | | 502 | | | | 39,696 | |
| Printing of shareholder reports | | | 24,611 | | | | 3,024 | | | | 67,776 | |
| Other expenses | | | 50,016 | | | | 16,957 | | | | 143,416 | |
| TOTAL EXPENSES | | | 2,407,475 | | | | 156,474 | | | | 6,022,666 | |
| | | | | | | | | | | | | |
| Expenses waived/reimbursed by the Advisor (Note 5) | | | – | | | | (99,416 | ) | | | – | |
| NET EXPENSES | | | 2,407,475 | | | | 57,058 | | | | 6,022,666 | |
| | | | | | | | | | | | | |
| NET INVESTMENT INCOME (LOSS) | | | 521,966 | | | | 69,169 | | | | (827,955 | ) |
| | | | | | | | | | | | | |
| REALIZED AND UNREALIZED GAINS (LOSSES) ON INVESTMENTS | | | | | | | | | | | | |
| Net realized gains (losses) from investments | | | 2,220,196 | | | | 116,402 | | | | (9,375,169 | ) |
| Net realized gains (losses) from written option contracts | | | (98,070 | ) | | | 29,988 | | | | – | |
| Net realized losses from securities sold short | | | (275,386 | ) | | | – | | | | – | |
| Net realized capital gain distributions from other investment companies | | | – | | | | – | | | | 379,315 | |
| Net change in unrealized depreciation on investments | | | (3,827,734 | ) | | | (188,480 | ) | | | (1,445,827 | ) |
| Net change in unrealized appreciation on written option contracts | | | 2,901,041 | | | | 5,954 | | | | – | |
| NET REALIZED AND UNREALIZED GAINS (LOSSES) ON INVESTMENTS | | | 920,047 | | | | (36,136 | ) | | | (10,441,681 | ) |
| | | | | | | | | | | | | |
| NET INCREASE (DECREASE) IN NET ASSETS RESULTING FROM OPERATIONS | | $ | 1,442,013 | | | $ | 33,033 | | | $ | (11,269,636 | ) |
See Notes to Financial Statements.
| Stadion Investment Trust | Statements of Changes in Net Assets |
| | | Stadion Tactical Growth Fund | | | Stadion Tactical Defensive Fund | |
| | | For the
Year Ended
May 31, 2015 | | | For the
Year Ended
May 31, 2014 | | | For the
Year Ended
May 31, 2015 | | | For the
Year Ended
May 31, 2014 | |
| FROM OPERATIONS | |
| Net investment loss | | $ | (155,087 | ) | | $ | (126,277 | ) | | $ | (298,954 | ) | | $ | (214,308 | ) |
| Net realized gains from investments | | | 3,301,405 | | | | 2,896,921 | | | | 2,475,438 | | | | 1,123,409 | |
| Net realized capital gain distributions from other investment companies | | | 2,815 | | | | – | | | | – | | | | – | |
| Net change in unrealized appreciation (depreciation) on investments | | | 955,351 | | | | 2,215,639 | | | | (741,147 | ) | | | 1,099,478 | |
| Net increase in net assets resulting from operations | | | 4,104,484 | | | | 4,986,283 | | | | 1,435,337 | | | | 2,008,579 | |
| | | | | | | | | | | | | | | | | |
| DISTRIBUTIONS TO SHAREHOLDERS | |
| Distributions from net investment income, Class A | | | (80,455 | ) | | | – | | | | – | | | | (32,956 | ) |
| Distributions from net investment income, Class C | | | (7,596 | ) | | | – | | | | – | | | | (1,615 | ) |
| Distributions from net investment income, Class I | | | (149,054 | ) | | | – | | | | – | | | | (8,361 | ) |
| Distributions from net realized gains, Class A | | | (1,715,528 | ) | | | (1,708,646 | ) | | | (47,991 | ) | | | (2,696,380 | ) |
| Distributions from net realized gains, Class C | | | (377,442 | ) | | | (5,172 | ) | | | (11,066 | ) | | | (432,594 | ) |
| Distributions from net realized gains, Class I | | | (2,398,952 | ) | | | (2,987,531 | ) | | | (12,701 | ) | | | (439,979 | ) |
| Decrease in net assets from distributions to shareholders | | | (4,729,027 | ) | | | (4,701,349 | ) | | | (71,758 | ) | | | (3,611,885 | ) |
| | | | | | | | | | | | | | | | | |
| FROM CAPITAL SHARE TRANSACTIONS (Note 7) | | | | | | | | | | | | | | | | |
| Class A | | | | | | | | | | | | | | | | |
| Proceeds from sales of shares | | | 60,307,357 | | | | 20,175,496 | | | | 21,706,342 | | | | 17,739,841 | |
| Net asset value of shares issued in reinvestment of distributions | | | 1,709,989 | | | | 1,646,975 | | | | 47,348 | | | | 2,670,208 | |
| Payments for shares redeemed | | | (20,134,628 | ) | | | (7,963,084 | ) | | | (36,938,218 | ) | | | (9,892,098 | ) |
| Net increase (decrease) in net assets from Class A share transactions | | | 41,882,718 | | | | 13,859,387 | | | | (15,184,528 | ) | | | 10,517,951 | |
| | | | | | | | | | | | | | | | | |
| Class C | | | | | | | | | | | | | | | | |
| Proceeds from sales of shares | | | 33,420,312 | | | | 1,250,702 | | | | 8,018,453 | | | | 4,569,460 | |
| Net asset value of shares issued in reinvestment of distributions | | | 374,920 | | | | 5,172 | | | | 10,598 | | | | 411,746 | |
| Payments for shares redeemed | | | (308,361 | ) | | | (25,991 | ) | | | (3,762,858 | ) | | | (1,990,510 | ) |
| Net increase in net assets from Class C share transactions | | | 33,486,871 | | | | 1,229,883 | | | | 4,266,193 | | | | 2,990,696 | |
| | | | | | | | | | | | | | | | | |
| Class I | | | | | | | | | | | | | | | | |
| Proceeds from sales of shares | | | 87,755,561 | | | | 13,121,871 | | | | 24,351,708 | | | | 6,035,739 | |
| Net asset value of shares issued in reinvestment of distributions | | | 2,518,872 | | | | 2,965,091 | | | | 9,602 | | | | 434,085 | |
| Payments for shares redeemed | | | (20,715,122 | ) | | | (11,649,367 | ) | | | (6,583,502 | ) | | | (3,917,746 | ) |
| Net increase in net assets from Class I share transactions | | | 69,559,311 | | | | 4,437,595 | | | | 17,777,808 | | | | 2,552,078 | |
| | | | | | | | | | | | | | | | | |
| TOTAL NET INCREASE IN NET ASSETS | | | 144,304,357 | | | | 19,811,799 | | | | 8,223,052 | | | | 14,457,419 | |
| | | | | | | | | | | | | | | | | |
| NET ASSETS: | | | | | | | | | | | | | | | | |
| Beginning of year | | | 47,267,580 | | | | 27,455,781 | | | | 58,275,733 | | | | 43,818,314 | |
| End of year | | $ | 191,571,937 | | | $ | 47,267,580 | | | $ | 66,498,785 | | | $ | 58,275,733 | |
| | | | | | | | | | | | | | | | | |
| ACCUMULATED NET INVESTMENT LOSS | | $ | (387,815 | ) | | $ | – | | | $ | (310,655 | ) | | $ | (171,222 | ) |
See Notes to Financial Statements.
| Annual Report | May 31, 2015 | 37 |
| Stadion Investment Trust | Statements of Changes in Net Assets |
| | | Stadion Defensive International Fund | | | Stadion Trilogy Alternative Return Fund | |
| | | For the
Year Ended
May 31, 2015 | | | For the
Year Ended
May 31, 2014 | | | For the
Year Ended
May 31, 2015 | | | For the
Year Ended
May 31, 2014 | |
| FROM OPERATIONS | |
| Net investment income (loss) | | $ | 193,111 | | | $ | (223,163 | ) | | $ | 521,966 | | | $ | 423,872 | |
| Net realized gains (losses) from investments | | | 387,897 | | | | 81,015 | | | | 2,220,196 | | | | (4,343,257 | ) |
| Net realized losses from written option contracts | | | – | | | | – | | | | (98,070 | ) | | | (1,381,068 | ) |
| Net realized losses from securities sold short | | | – | | | | – | | | | (275,386 | ) | | | – | |
| Net realized losses from futures contracts | | | (317,362 | ) | | | – | | | | – | | | | – | |
| Net realized capital gain distributions from other investment companies | | | 60,901 | | | | 34,410 | | | | – | | | | – | |
| Net change in unrealized appreciation (depreciation) on investments | | | (759,587 | ) | | | 698,350 | | | | (3,827,734 | ) | | | 5,987,990 | |
| Net change in unrealized appreciation on written option contracts | | | – | | | | – | | | | 2,901,041 | | | | 1,114,564 | |
| Net increase (decrease) in net assets resulting from operations | | | (435,040 | ) | | | 590,612 | | | | 1,442,013 | | | | 1,802,101 | |
| | | | | | | | | | | | | | | | | |
| DISTRIBUTIONS TO SHAREHOLDERS | |
| Distributions from net investment income, Class A | | | (131,852 | ) | | | – | | | | (240,535 | ) | | | (239,648 | ) |
| Distributions from net investment income, Class C | | | (570 | ) | | | – | | | | (15,223 | ) | | | – | |
| Distributions from net investment income, Class I | | | (11,350 | ) | | | – | | | | (170,616 | ) | | | (159,866 | ) |
| Distributions from net realized gains, Class A | | | (176,753 | ) | | | (434,253 | ) | | | – | | | | – | |
| Distributions from net realized gains, Class C | | | (1,732 | ) | | | (4,581 | ) | | | – | | | | – | |
| Distributions from net realized gains, Class I | | | (12,988 | ) | | | (250,490 | ) | | | – | | | | – | |
| Decrease in net assets from distributions to shareholders | | | (335,245 | ) | | | (689,324 | ) | | | (426,374 | ) | | | (399,514 | ) |
| | | | | | | | | | | | | | | | | |
| FROM CAPITAL SHARE TRANSACTIONS (Note 7) | | | | | | | | | | | | | |
| Class A | | | | | | | | | | | | | | | | |
| Proceeds from sales of shares | | | 7,553,273 | | | | 8,368,597 | | | | 12,361,169 | | | | 48,753,388 | |
| Net asset value of shares issued in reinvestment of distributions | | | 284,579 | | | | 418,063 | | | | 228,788 | | | | 215,700 | |
| Payments for shares redeemed | | | (11,555,818 | ) | | | (6,574,181 | ) | | | (61,103,243 | ) | | | (30,582,452 | ) |
| Net increase (decrease) in net assets from Class A share transactions | | | (3,717,966 | ) | | | 2,212,479 | | | | (48,513,286 | ) | | | 18,386,636 | |
| | | | | | | | | | | | | | | | | |
| Class C | | | | | | | | | | | | | | | | |
| Proceeds from sales of shares | | | 71,306 | | | | 148,681 | | | | 2,574,903 | | | | 12,956,598 | |
| Net asset value of shares issued in reinvestment of distributions | | | 2,302 | | | | 4,580 | | | | 13,911 | | | | – | |
| Payments for shares redeemed | | | (64,571 | ) | | | (63,513 | ) | | | (12,731,878 | ) | | | (2,825,179 | ) |
| Net increase (decrease) in net assets from Class C share transactions | | | 9,037 | | | | 89,748 | | | | (10,143,064 | ) | | | 10,131,419 | |
| | | | | | | | | | | | | | | | | |
| Class I | | | | | | | | | | | | | | | | |
| Proceeds from sales of shares | | | 4,249,391 | | | | 8,872,199 | | | | 44,284,719 | | | | 53,858,928 | |
| Net asset value of shares issued in reinvestment of distributions | | | 24,338 | | | | 241,518 | | | | 167,513 | | | | 130,201 | |
| Payments for shares redeemed | | | (10,210,901 | ) | | | (5,358,595 | ) | | | (38,874,539 | ) | | | (26,757,281 | ) |
| Net increase (decrease) in net assets from Class I share transactions | | | (5,937,172 | ) | | | 3,755,122 | | | | 5,577,693 | | | | 27,231,848 | |
| | | | | | | | | | | | | | | | | |
| TOTAL NET INCREASE (DECREASE) IN NET ASSETS | | | (10,416,386 | ) | | | 5,958,637 | | | | (52,063,018 | ) | | | 57,152,490 | |
| | | | | | | | | | | | | | | | | |
| NET ASSETS: | | | | | | | | | | | | | | | | |
| Beginning of year | | | 25,680,729 | | | | 19,722,092 | | | | 156,644,786 | | | | 99,492,296 | |
| End of year | | $ | 15,264,343 | | | $ | 25,680,729 | | | $ | 104,581,768 | | | $ | 156,644,786 | |
| | | | | | | | | | | | | | | | | |
| ACCUMULATED NET INVESTMENT INCOME (LOSS) | | $ | (111,097 | ) | | $ | (160,436 | ) | | $ | 205,619 | | | $ | 115,932 | |
See Notes to Financial Statements.
| Stadion Investment Trust | Statements of Changes in Net Assets |
| | | Stadion Alternative Income Fund | | | Stadion Managed Risk 100 Fund | |
| | | For the
Year Ended
May 31, 2015 | | | For the
Year Ended
May 31, 2014 | | | For the
Year Ended
May 31, 2015 | | | For the
Year Ended
May 31, 2014 | |
| FROM OPERATIONS | |
| Net investment income (loss) | | $ | 69,169 | | | $ | 93,100 | | | $ | (827,955 | ) | | $ | (4,534,531 | ) |
| Net realized gains (losses) from investments | | | 116,402 | | | | (117,407 | ) | | | (9,375,169 | ) | | | (23,464,495 | ) |
| Net realized gains from written option contracts | | | 29,988 | | | | – | | | | – | | | | – | |
| Net realized capital gain distributions from other investment companies | | | – | | | | 2,821 | | | | 379,315 | | | | – | |
| Net change in unrealized appreciation (depreciation) on investments | | | (188,480 | ) | | | 165,886 | | | | (1,445,827 | ) | | | 284,410 | |
| Net change in unrealized appreciation on written option contracts | | | 5,954 | | | | – | | | | – | | | | – | |
| Net increase (decrease) in net assets resulting from operations | | | 33,033 | | | | 144,400 | | | | (11,269,636 | ) | | | (27,714,616 | ) |
| | | | | | | | | | | | | | | | | |
| DISTRIBUTIONS TO SHAREHOLDERS | |
| Distributions from net investment income, Class A | | | (61,449 | ) | | | (28,534 | ) | | | – | | | | – | |
| Distributions from net investment income, Class I | | | (11,697 | ) | | | (42,627 | ) | | | – | | | | – | |
| Decrease in net assets from distributions to shareholders | | | (73,146 | ) | | | (71,161 | ) | | | – | | | | – | |
| | | | | | | | | | | | | | | | | |
| FROM CAPITAL SHARE TRANSACTIONS (Note 7) | | | | | | | | | | | | | | | | |
| Class A | | | | | | | | | | | | | | | | |
| Proceeds from sales of shares | | | 5,642,411 | | | | 2,738,931 | | | | 14,797,138 | | | | 93,018,255 | |
| Net asset value of shares issued in reinvestment of distributions | | | 32,824 | | | | 1,291 | | | | – | | | | – | |
| Payments for shares redeemed | | | (2,504,258 | ) | | | (2,350,955 | ) | | | (175,593,508 | ) | | | (182,331,672 | ) |
| Net increase (decrease) in net assets from Class A share transactions | | | 3,170,977 | | | | 389,267 | | | | (160,796,370 | ) | | | (89,313,417 | ) |
| | | | | | | | | | | | | | | | | |
| Class C | | | | | | | | | | | | | | | | |
| Proceeds from sales of shares | | | – | | | | – | | | | 2,361,785 | | | | 11,894,524 | |
| Payments for shares redeemed | | | – | | | | – | | | | (42,698,261 | ) | | | (54,792,884 | ) |
| Net decrease in net assets from Class C share transactions | | | – | | | | – | | | | (40,336,476 | ) | | | (42,898,360 | ) |
| | | | | | | | | | | | | | | | | |
| Class I | | | | | | | | | | | | | | | | |
| Proceeds from sales of shares | | | 301,287 | | | | 3,553,791 | | | | 44,079,429 | | | | 52,932,479 | |
| Net asset value of shares issued in reinvestment of distributions | | | 10,736 | | | | 147 | | | | – | | | | – | |
| Payments for shares redeemed | | | (3,915,552 | ) | | | (1,060,776 | ) | | | (90,243,154 | ) | | | (76,356,715 | ) |
| Net increase (decrease) in net assets from Class I share transactions | | | (3,603,529 | ) | | | 2,493,162 | | | | (46,163,725 | ) | | | (23,424,236 | ) |
| | | | | | | | | | | | | | | | | |
| TOTAL NET INCREASE (DECREASE) IN NET ASSETS | | | (472,665 | ) | | | 2,955,668 | | | | (258,566,207 | ) | | | (183,350,629 | ) |
| | | | | | | | | | | | | | | | | |
| NET ASSETS: | | | | | | | | | | | | | | | | |
| Beginning of year | | | 6,142,118 | | | | 3,186,450 | | | | 457,960,509 | | | | 641,311,138 | |
| End of year | | $ | 5,669,453 | | | $ | 6,142,118 | | | $ | 199,394,302 | | | $ | 457,960,509 | |
| | | | | | | | | | | | | | | | | |
| ACCUMULATED NET INVESTMENT INCOME (LOSS) | | $ | 25,518 | | | $ | 29,495 | | | $ | (807,144 | ) | | $ | (2,117,514 | ) |
See Notes to Financial Statements.
| Annual Report | May 31, 2015 | 39 |
| Stadion Tactical Growth Fund – Class A | Financial Highlights |
For a Share Outstanding Throughout each of the Periods Presented
| | | Year Ended
May 31, 2015 | | Year Ended
May 31, 2014(a) | | For the Period
May 1, 2013 to
May 31, 2013(b) | | For the Period
April 1, 2013
(Commencement of
operations) to
April 30, 2013 |
| NET ASSET VALUE, BEGINNING OF PERIOD | | $ | 10.35 | | | $ | 10.22 | | | $ | 10.27 | | | $ | 10.10 | |
| | | | | | | | | | | | | | | | | |
| INCOME (LOSS) FROM OPERATIONS: | | | | | | | | | | | | | | | | |
Net investment loss(c)(d) | | | (0.02 | ) | | | (0.05 | ) | | | (0.01 | ) | | | (0.02 | ) |
| Net realized and unrealized gain (loss) on investments | | | 0.92 | | | | 1.32 | | | | (0.04 | ) | | | 0.19 | |
| Total from investment operations | | | 0.90 | | | | 1.27 | | | | (0.05 | ) | | | 0.17 | |
| LESS DISTRIBUTIONS: | | | | | | | | | | | | | | | | |
| Dividends from net investment income | | | (0.03 | ) | | | – | | | | – | | | | – | |
| Distributions from net realized gains | | | (0.81 | ) | | | (1.14 | ) | | | – | | | | – | |
| Total distributions | | | (0.84 | ) | | | (1.14 | ) | | | – | | | | – | |
| | | | | | | | | | | | | | | | | |
| NET ASSET VALUE, END OF PERIOD | | $ | 10.41 | | | $ | 10.35 | | | $ | 10.22 | | | $ | 10.27 | |
| | | | | | | | | | | | | | | | | |
TOTAL RETURN(e) | | | 8.78 | % | | | 12.75 | % | | | (0.49% | )(f) | | | 1.68 | %(f) |
| | | | | | | | | | | | | | | | | |
| RATIOS AND SUPPLEMENTAL DATA: | | | | | | | | | | | | | | | | |
| Net assets, end of Period (000’s) | | $ | 59,366 | | | $ | 17,305 | | | $ | 3,430 | | | $ | 1 | |
| | | | | | | | | | | | | | | | | |
Ratio of total expenses to average net assets(g) | | | 1.84 | %(h) | | | 1.85 | % | | | 5.21 | %(h)(i) | | | 2.83 | %(h)(i) |
| | | | | | | | | | | | | | | | | |
Ratio of net expenses to average net assets(g) | | | 1.69 | % | | | 1.85 | % | | | 1.95 | %(i) | | | 1.95 | %(i) |
| | | | | | | | | | | | | | | | | |
Ratio of net investment loss to average net assets(c)(g) | | | (0.21 | %) | | | (0.47 | %) | | | (1.95% | )(i) | | | (1.95% | )(i) |
| | | | | | | | | | | | | | | | | |
| PORTFOLIO TURNOVER RATE | | | 333 | % | | | 324 | % | | | 50 | %(f) | | | 294 | %(f)(j) |
(a) | Prior to March 28, 2014, the Stadion Tactical Growth Fund was known as the Stadion Market Opportunity Fund™. |
(b) | Effective May 31, 2013, the Tactical Growth Fund changed its fiscal year from April 30 to May 31. |
(c) | Recognition of net investment income/(loss) by the Fund is affected by the timing of the declaration of dividends by the underlying investment companies in which the Fund invested. |
(d) | Per share amounts were calculated using average shares method. |
(e) | Total return is a measure of the change in value of an investment in the Fund over the periods covered, which assumes any dividends or capital gains distributions are reinvested in shares of the Fund. The returns shown do not reflect the deduction of taxes a shareholder would pay on Fund distributions or the redemption of Fund shares. |
(f) | Not annualized. |
(g) | The ratios of expenses and net investment loss to average net assets do not reflect the Fund's proportionate share of expense of the underlying investment companies in which the Fund invested. |
(h) | Reflects total expenses prior to fee waivers and expense reimbursements by the advisor (Note 5). |
(i) | Annualized. |
(j) | Portfolio turnover rate is calculated at the Fund Level and represents the year ended April 30, 2013. |
See Notes to Financial Statements.
| Stadion Tactical Growth Fund – Class C | Financial Highlights |
For a Share Outstanding Throughout each of the Periods Presented
| | | Year Ended
May 31, 2015 | | Year Ended
May 31, 2014(a) | | For the Period
May 1, 2013 to
May 31, 2013(b) | | For the Period
April 1, 2013
(Commencement of
operations) to
April 30, 2013 |
| NET ASSET VALUE, BEGINNING OF PERIOD | | $ | 10.26 | | | $ | 10.21 | | | $ | 10.26 | | | $ | 10.10 | |
| | | | | | | | | | | | | | | | | |
| INCOME (LOSS) FROM OPERATIONS: | | | | | | | | | | | | | | | | |
Net investment loss(c)(d) | | | (0.12 | ) | | | (0.15 | ) | | | (0.02 | ) | | | (0.02 | ) |
| Net realized and unrealized gain (loss) on investments | | | 0.93 | | | | 1.33 | | | | (0.03 | ) | | | 0.18 | |
| Total from investment operations | | | 0.81 | | | | 1.18 | | | | (0.05 | ) | | | 0.16 | |
| LESS DISTRIBUTIONS: | | | | | | | | | | | | | | | | |
| Dividends from net investment income | | | (0.01 | ) | | | – | | | | – | | | | – | |
| Distributions from net realized gains | | | (0.81 | ) | | | (1.13 | ) | | | – | | | | – | |
| Total distributions | | | (0.82 | ) | | | (1.13 | ) | | | – | | | | – | |
| | | | | | | | | | | | | | | | | |
| NET ASSET VALUE, END OF PERIOD | | $ | 10.25 | | | $ | 10.26 | | | $ | 10.21 | | | $ | 10.26 | |
| | | | | | | | | | | | | | | | | |
TOTAL RETURN(e) | | | 7.96 | % | | | 11.87 | % | | | (0.49% | )(f) | | | 1.58 | %(f) |
| | | | | | | | | | | | | | | | | |
| RATIOS AND SUPPLEMENTAL DATA: | | | | | | | | | | | | | | | | |
| Net assets, end of Period (000’s) | | $ | 34,402 | | | $ | 1,242 | | | $ | 1 | | | $ | 1 | |
| | | | | | | | | | | | | | | | | |
Ratio of total expenses to average net assets(g) | | | 2.59 | %(h) | | | 2.64 | % | | | 3.01 | %(h)(i) | | | 3.51 | %(h)(i) |
| | | | | | | | | | | | | | | | | |
Ratio of net expenses to average net assets(g) | | | 2.37 | % | | | 2.64 | % | | | 2.70 | %(i) | | | 2.70 | %(i) |
| | | | | | | | | | | | | | | | | |
Ratio of net investment loss to average net assets(c)(g) | | | (1.16 | %) | | | (1.49 | %) | | | (2.70% | )(i) | | | (2.70% | )(i) |
| | | | | | | | | | | | | | | | | |
| PORTFOLIO TURNOVER RATE | | | 333 | % | | | 324 | % | | | 50 | %(f) | | | 294 | %(f)(j) |
(a) | Prior to March 28, 2014, the Stadion Tactical Growth Fund was known as the Stadion Market Opportunity Fund™. |
(b) | Effective May 31, 2013, the Tactical Growth Fund changed its fiscal year from April 30 to May 31. |
(c) | Recognition of net investment income/(loss) by the Fund is affected by the timing of the declaration of dividends by the underlying investment companies in which the Fund invested. |
(d) | Per share amounts were calculated using average shares method. |
(e) | Total return is a measure of the change in value of an investment in the Fund over the periods covered, which assumes any dividends or capital gains distributions are reinvested in shares of the Fund. The returns shown do not reflect the deduction of taxes a shareholder would pay on Fund distributions or the redemption of Fund shares. |
(f) | Not annualized. |
(g) | The ratios of expenses and net investment loss to average net assets do not reflect the Fund's proportionate share of expense of the underlying investment companies in which the Fund invested. |
(h) | Reflects total expenses prior to fee waivers and expense reimbursements by the advisor (Note 5). |
(i) | Annualized. |
(j) | Portfolio turnover rate is calculated at the Fund Level and represents the year ended April 30, 2013. |
See Notes to Financial Statements.
| Annual Report | May 31, 2015 | 41 |
| Stadion Tactical Growth Fund – Class I | Financial Highlights |
For a Share Outstanding Throughout each of the Periods Presented
| | | Year Ended
May 31, 2015 | | Year Ended
May 31, 2014(a) | | For the Period
May 1, 2013 to
May 31, 2013(b) | | Year Ended April 30, 2013 | | Year Ended
April 30, 2012 | | Year Ended
April 30, 2011 |
| NET ASSET VALUE, BEGINNING OF PERIOD | | $ | 10.38 | | | $ | 10.23 | | | $ | 10.27 | | | $ | 11.20 | | | $ | 13.13 | | | $ | 11.79 | |
| | | | | | | | | | | | | | | | | | | | | | | | | |
| INCOME (LOSS) FROM OPERATIONS: | | | | | | | | | | | | | | | | | | | | | | | | |
Net investment loss(c)(d) | | | 0.00 | (e) | | | (0.02 | ) | | | (0.01 | ) | | | (0.02 | ) | | | (0.08 | ) | | | (0.10 | ) |
| Net realized and unrealized gain (loss) on investments | | | 0.94 | | | | 1.31 | | | | (0.03 | ) | | | 0.90 | | | | 0.11 | | | | 2.50 | |
| Total from investment operations | | | 0.94 | | | | 1.29 | | | | (0.04 | ) | | | 0.88 | | | | 0.03 | | | | 2.40 | |
| LESS DISTRIBUTIONS: | | | | | | | | | | | | | | | | | | | | | | | | |
| Dividends from net investment income | | | (0.05 | ) | | | – | | | | – | | | | – | | | | – | | | | – | |
| Distributions from net realized gains | | | (0.81 | ) | | | (1.14 | ) | | | – | | | | (1.81 | ) | | | (1.96 | ) | | | (1.06 | ) |
| Total distributions | | | (0.86 | ) | | | (1.14 | ) | | | – | | | | (1.81 | ) | | | (1.96 | ) | | | (1.06 | ) |
| | | | | | | | | | | | | | | | | | | | | | | | | |
| NET ASSET VALUE, END OF PERIOD | | $ | 10.46 | | | $ | 10.38 | | | $ | 10.23 | | | $ | 10.27 | | | $ | 11.20 | | | $ | 13.13 | |
| | | | | | | | | | | | | | | | | | | | | | | | | |
TOTAL RETURN(f) | | | 9.07 | % | | | 12.96 | % | | | (0.39% | )(g) | | | 9.90 | % | | | 1.70 | % | | | 21.26 | % |
| | | | | | | | | | | | | | | | | | | | | | | | | |
| RATIOS AND SUPPLEMENTAL DATA: | | | | | | | | | | | | | | | | | | | | | | | | |
| Net assets, end of Period (000's) | | $ | 97,804 | | | $ | 28,721 | | | $ | 24,024 | | | $ | 22,169 | | | $ | 29,546 | | | $ | 81,248 | |
| | | | | | | | | | | | | | | | | | | | | | | | | |
Ratio of total expenses to average net assets(h) | | | 1.62 | %(i) | | | 1.59 | % | | | 1.98 | %(i)(j) | | | 1.81 | %(i) | | | 1.75 | % | | | 1.75 | % |
| | | | | | | | | | | | | | | | | | | | | | | | | |
Ratio of net expenses to average net assets(h) | | | 1.43 | % | | | 1.59 | % | | | 1.70 | %(j) | | | 1.75 | % | | | N/ | A | | | N/ | A |
| | | | | | | | | | | | | | | | | | | | | | | | | |
Ratio of net investment income (loss) to average net assets(c)(h) | | | 0.02 | % | | | (0.22 | %) | | | (1.70% | )(j) | | | (0.21 | %) | | | (0.66 | %) | | | (0.86 | %) |
| | | | | | | | | | | | | | | | | | | | | | | | | |
| PORTFOLIO TURNOVER RATE | | | 333 | % | | | 324 | % | | | 50 | %(g) | | | 294 | % | | | 262 | % | | | 201 | % |
(a) | Prior to March 28, 2014, the Stadion Tactical Growth Fund was known as the Stadion Market Opportunity Fund™. |
(b) | Effective May 31, 2013, the Tactical Growth Fund changed its fiscal year from April 30 to May 31. |
(c) | Recognition of net investment income/(loss) by the Fund is affected by the timing of the declaration of dividends by the underlying investment companies in which the Fund invested. |
(d) | Per share amounts were calculated using average shares method. |
(e) | Amount rounds to less than $0.01 per share or less than 1% |
(f) | Total return is a measure of the change in value of an investment in the Fund over the periods covered, which assumes any dividends or capital gains distributions are reinvested in shares of the Fund. The returns shown do not reflect the deduction of taxes a shareholder would pay on Fund distributions or the redemption of Fund shares. |
(g) | Not annualized. |
(h) | The ratios of expenses and net investment loss to average net assets do not reflect the Fund's proportionate share of expense of the underlying investment companies in which the Fund invested. |
(i) | Reflects total expenses prior to fee waivers and expense reimbursements by the advisor (Note 5). |
(j) | Annualized. |
See Notes to Financial Statements.
| Stadion Tactical Defensive Fund – Class A | Financial Highlights |
| | For a Share Outstanding Throughout each of the Periods Presented |
| | | Year Ended
May 31, 2015 | | | Year Ended
May 31, 2014(a) | | | Year Ended
May 31, 2013 | | | Year Ended
May 31, 2012 | | | Year Ended
May 31, 2011 | |
| NET ASSET VALUE, BEGINNING OF PERIOD | | $ | 11.69 | | | $ | 11.99 | | | $ | 10.37 | | | $ | 11.72 | | | $ | 10.22 | |
| | | | | | | | | | | | | | | | | | | | | |
| INCOME (LOSS) FROM OPERATIONS: | | | | | | | | | | | | | | | | | |
Net investment income (loss)(b) | | | (0.04 | )(c) | | | (0.04 | )(c) | | | 0.02 | (c) | | | (0.09 | ) | | | (0.10 | ) |
| Net realized and unrealized gain (loss) on investments | | | 0.35 | | | | 0.53 | | | | 1.60 | | | | (0.72 | ) | | | 1.60 | |
| Total from investment operations | | | 0.31 | | | | 0.49 | | | | 1.62 | | | | (0.81 | ) | | | 1.50 | |
| LESS DISTRIBUTIONS: | | | | | | | | | | | | | | | | | | | | |
| Dividends from net investment income | | | – | | | | (0.01 | ) | | | – | | | | – | | | | – | |
| Distributions from net realized gains | | | (0.01 | ) | | | (0.78 | ) | | | – | | | | (0.54 | ) | | | – | |
| Total distributions | | | (0.01 | ) | | | (0.79 | ) | | | – | | | | (0.54 | ) | | | – | |
| | | | | | | | | | | | | | | | | | | | | |
| NET ASSET VALUE, END OF PERIOD | | $ | 11.99 | | | $ | 11.69 | | | $ | 11.99 | | | $ | 10.37 | | | $ | 11.72 | |
| | | | | | | | | | | | | | | | | | | | | |
TOTAL RETURN(d) | | | 2.67 | % | | | 4.12 | % | | | 15.62 | % | | | (6.75 | %) | | | 14.68 | % |
| | | | | | | | | | | | | | | | | | | | | |
| RATIOS AND SUPPLEMENTAL DATA: | | | | | | | | | | | | | | | | | | | | |
| Net assets, end of Period (000's) | | $ | 29,073 | | | $ | 43,136 | | | $ | 33,813 | | | $ | 33,892 | | | $ | 50,470 | |
| | | | | | | | | | | | | | | | | | | | | |
Ratio of total expenses to average net assets(e) | | | 1.88 | %(f) | | | 1.89 | % | | | 2.00 | %(f) | | | 1.91 | %(f) | | | 1.97 | %(f) |
| | | | | | | | | | | | | | | | | | | | | |
Ratio of net expenses to average net assets(e) | | | 1.88 | % | | | 1.89 | % | | | 1.95 | % | | | 1.89 | % | | | 1.95 | % |
| | | | | | | | | | | | | | | | | | | | | |
Ratio of net investment income (loss) to average net assets(b)(e) | | | (0.33 | %) | | | (0.34 | %) | | | 0.14 | % | | | (0.67 | %) | | | (0.94 | %) |
| | | | | | | | | | | | | | | | | | | | | |
| PORTFOLIO TURNOVER RATE | | | 482 | % | | | 529 | % | | | 455 | % | | | 826 | % | | | 476 | % |
(a) | Prior to March 28, 2014, the Stadion Tactical Defensive Fund was known as the Stadion Core Advantage Fund. |
(b) | Recognition of net investment income/(loss) by the Fund is affected by the timing of the declaration of dividends by the underlying investment companies in which the Fund invested. |
(c) | Per share amounts were calculated using average shares method. |
(d) | Total return is a measure of the change in value of an investment in the Fund over the periods covered, which assumes any dividends or capital gains distributions are reinvested in shares of the Fund. The returns shown do not reflect the deduction of taxes a shareholder would pay on Fund distributions or the redemption of Fund shares. |
(e) | The ratios of expenses and net investment income (loss) to average net assets do not reflect the Fund's proportionate share of expense of the underlying investment companies in which the Fund invested. |
(f) | Reflects total expenses prior to fee waivers and expense reimbursements by the advisor (Note 5). |
See Notes to Financial Statements.
| | |
| Annual Report | May 31, 2015 | 43 |
| Stadion Tactical Defensive Fund – Class C | Financial Highlights |
| | For a Share Outstanding Throughout each of the Periods Presented |
| | | Year Ended
May 31, 2015 | | | Year Ended
May 31, 2014(a) | | | Year Ended
May 31, 2013 | | | Year Ended
May 31, 2012 | | | Year Ended
May 31, 2011 | |
| NET ASSET VALUE, BEGINNING OF PERIOD | | $ | 11.26 | | | $ | 11.64 | | | $ | 10.16 | | | $ | 11.59 | | | $ | 10.17 | |
| | | | | | | | | | | | | | | | | | | | | |
| INCOME (LOSS) FROM OPERATIONS: | | | | | | | | | | | | | | | | | |
Net investment loss(b) | | | (0.13 | )(c) | | | (0.13 | )(c) | | | (0.07 | )(c) | | | (0.18 | ) | | | (0.14 | ) |
| Net realized and unrealized gain (loss) on investments | | | 0.33 | | | | 0.53 | | | | 1.55 | | | | (0.71 | ) | | | 1.56 | |
| Total from investment operations | | | 0.20 | | | | 0.40 | | | | 1.48 | | | | (0.89 | ) | | | 1.42 | |
| LESS DISTRIBUTIONS: | | | | | | | | | | | | | | | | | | | | |
| Dividends from net investment income | | | – | | | | (0.00 | )(d) | | | – | | | | – | | | | – | |
| Distributions from net realized gains | | | (0.01 | ) | | | (0.78 | ) | | | – | | | | (0.54 | ) | | | – | |
| Total distributions | | | (0.01 | ) | | | (0.78 | ) | | | – | | | | (0.54 | ) | | | – | |
| | | | | | | | | | | | | | | | | | | | | |
| NET ASSET VALUE, END OF PERIOD | | $ | 11.45 | | | $ | 11.26 | | | $ | 11.64 | | | $ | 10.16 | | | $ | 11.59 | |
| | | | | | | | | | | | | | | | | | | | | |
TOTAL RETURN(e) | | | 1.80 | % | | | 3.47 | % | | | 14.57 | % | | | (7.54 | %) | | | 13.96 | % |
| | | | | | | | | | | | | | | | | | | | | |
| RATIOS AND SUPPLEMENTAL DATA: | | | | | | | | | | | | | | | | | | | | |
| Net assets, end of Period (000’s) | | $ | 12,145 | | | $ | 7,807 | | | $ | 5,060 | | | $ | 5,253 | | | $ | 6,028 | |
| | | | | | | | | | | | | | | | | | | | | |
Ratio of total expenses to average net assets(f) | | | 2.66 | % | | | 2.67 | % | | | 3.20 | %(g) | | | 3.12 | %(g) | | | 3.45 | %(g) |
| | | | | | | | | | | | | | | | | | | | | |
Ratio of net expenses to average net assets(f) | | | 2.66 | % | | | 2.67 | % | | | 2.70 | % | | | 2.70 | % | | | 2.70 | % |
| | | | | | | | | | | | | | | | | | | | | |
Ratio of net investment loss to average net assets(b)(f) | | | (1.16 | %) | | | (1.13 | %) | | | (0.61 | %) | | | (1.48 | %) | | | (1.79 | %) |
| | | | | | | | | | | | | | | | | | | | | |
| PORTFOLIO TURNOVER RATE | | | 482 | % | | | 529 | % | | | 455 | % | | | 826 | % | | | 476 | % |
(a) | Prior to March 28, 2014, the Stadion Tactical Defensive Fund was known as the Stadion Core Advantage Fund. |
(b) | Recognition of net investment income/(loss) by the Fund is affected by the timing of the declaration of dividends by the underlying investment companies in which the Fund invested. |
(c) | Per share amounts were calculated using average shares method. |
(d) | Amount rounds to less than $0.01 per share or less than 1% |
(e) | Total return is a measure of the change in value of an investment in the Fund over the periods covered, which assumes any dividends or capital gains distributions are reinvested in shares of the Fund. The returns shown do not reflect the deduction of taxes a shareholder would pay on Fund distributions or the redemption of Fund shares. |
(f) | The ratios of expenses and net investment loss to average net assets do not reflect the Fund's proportionate share of expense of the underlying investment companies in which the Fund invested. |
(g) | Reflects total expenses prior to fee waivers and expense reimbursements by the advisor (Note 5). |
See Notes to Financial Statements.
| Stadion Tactical Defensive Fund – Class I | Financial Highlights |
| | For a Share Outstanding Throughout each of the Periods Presented |
| | | Year Ended
May 31, 2015 | | | Year Ended
May 31, 2014(a) | | | Year Ended
May 31, 2013 | | | Year Ended
May 31, 2012 | | | Year Ended
May 31, 2011 | |
| NET ASSET VALUE, BEGINNING OF PERIOD | | $ | 11.80 | | | $ | 12.07 | | | $ | 10.42 | | | $ | 11.76 | | | $ | 10.22 | |
| | | | | | | | | | | | | | | | | | | | | |
| INCOME (LOSS) FROM OPERATIONS: | | | | | | | | | | | | | | | | | |
Net investment income (loss)(b) | | | (0.03 | )(c) | | | (0.02 | )(c) | | | 0.02 | (c) | | | (0.05 | ) | | | (0.04 | ) |
| Net realized and unrealized gain (loss) on investments | | | 0.36 | | | | 0.55 | | | | 1.63 | | | | (0.75 | ) | | | 1.58 | |
| Total from investment operations | | | 0.33 | | | | 0.53 | | | | 1.65 | | | | (0.80 | ) | | | 1.54 | |
| LESS DISTRIBUTIONS: | | | | | | | | | | | | | | | | | | | | |
| Dividends from net investment income | | | – | | | | (0.02 | ) | | | – | | | | – | | | | – | |
| Distributions from net realized gains | | | (0.01 | ) | | | (0.78 | ) | | | – | | | | (0.54 | ) | | | – | |
| Total distributions | | | (0.01 | ) | | | (0.80 | ) | | | – | | | | (0.54 | ) | | | – | |
| | | | | | | | | | | | | | | | | | | | | |
| NET ASSET VALUE, END OF PERIOD | | $ | 12.12 | | | $ | 11.80 | | | $ | 12.07 | | | $ | 10.42 | | | $ | 11.76 | |
| | | | | | | | | | | | | | | | | | | | | |
TOTAL RETURN(d) | | | 2.82 | % | | | 4.42 | % | | | 15.83 | % | | | (6.65 | %) | | | 15.07 | % |
| | | | | | | | | | | | | | | | | | | | | |
| RATIOS AND SUPPLEMENTAL DATA: | | | | | | | | | | | | | | | | | | | | |
| Net assets, end of Period (000's) | | $ | 25,280 | | | $ | 7,333 | | | $ | 4,945 | | | $ | 2,636 | | | $ | 1,433 | |
| | | | | | | | | | | | | | | | | | | | | |
Ratio of total expenses to average net assets(e) | | | 1.70 | % | | | 1.73 | %(f) | | | 2.38 | %(f) | | | 3.05 | %(f) | | | 7.98 | %(f) |
| | | | | | | | | | | | | | | | | | | | | |
Ratio of net expenses to average net assets(e) | | | 1.70 | % | | | 1.70 | % | | | 1.70 | % | | | 1.70 | % | | | 1.70 | % |
| | | | | | | | | | | | | | | | | | | | | |
Ratio of net investment income (loss) to average net assets(b)(e) | | | (0.28 | %) | | | (0.19 | %) | | | 0.20 | % | | | (0.53 | %) | | | (1.03 | %) |
| | | | | | | | | | | | | | | | | | | | | |
| PORTFOLIO TURNOVER RATE | | | 482 | % | | | 529 | % | | | 455 | % | | | 826 | % | | | 476 | % |
(a) | Prior to March 28, 2014, the Stadion Tactical Defensive Fund was known as the Stadion Core Advantage Fund. |
(b) | Recognition of net investment income/(loss) by the Fund is affected by the timing of the declaration of dividends by the underlying investment companies in which the Fund invested. |
(c) | Per share amounts were calculated using average shares method. |
(d) | Total return is a measure of the change in value of an investment in the Fund over the periods covered, which assumes any dividends or capital gains distributions are reinvested in shares of the Fund. The returns shown do not reflect the deduction of taxes a shareholder would pay on Fund distributions or the redemption of Fund shares. |
(e) | The ratios of expenses and net investment income (loss) to average net assets do not reflect the Fund's proportionate share of expense of the underlying investment companies in which the Fund invested. |
(f) | Reflects total expenses prior to fee waivers and expense reimbursements by the advisor (Note 5). |
See Notes to Financial Statements.
| | |
| Annual Report | May 31, 2015 | 45 |
| Stadion Defensive International Fund – Class A | Financial Highlights |
| | For a Share Outstanding Throughout each of the Periods Presented |
| | | Year Ended
May 31, 2015 | | | Year Ended
May 31, 2014(a) | | | Year Ended
May 31, 2013 | | | For the Period
April 2, 2012
(Commencement of
operations) to
May 31, 2012 | |
| NET ASSET VALUE, BEGINNING OF PERIOD | | $ | 10.10 | | | $ | 10.16 | | | $ | 9.54 | | | $ | 10.00 | |
| | | | | | | | | | | | | | | | | |
| INCOME (LOSS) FROM OPERATIONS: | | | | | | | | | | | | | | | | |
Net investment income (loss)(b) | | | 0.12 | (c) | | | (0.10 | )(c) | | | (0.01 | )(c) | | | (0.01 | ) |
| Net realized and unrealized gain (loss) on investments | | | (0.37 | ) | | | 0.31 | | | | 0.68 | | | | (0.45 | ) |
| Total from investment operations | | | (0.25 | ) | | | 0.21 | | | | 0.67 | | | | (0.46 | ) |
| LESS DISTRIBUTIONS: | | | | | | | | | | | | | | | | |
| Dividends from net investment income | | | (0.07 | ) | | | – | | | | (0.05 | ) | | | – | |
| Distributions from net realized gains | | | (0.10 | ) | | | (0.27 | ) | | | – | | | | – | |
| Total distributions | | | (0.17 | ) | | | (0.27 | ) | | | (0.05 | ) | | | – | |
| | | | | | | | | | | | | | | | | |
| NET ASSET VALUE, END OF PERIOD | | $ | 9.68 | | | $ | 10.10 | | | $ | 10.16 | | | $ | 9.54 | |
| | | | | | | | | | | | | | | | | |
TOTAL RETURN(d) | | | (2.40 | %) | | | 2.07 | % | | | 7.04 | % | | | (4.60 | %)(e) |
| | | | | | | | | | | | | | | | | |
| RATIOS AND SUPPLEMENTAL DATA: | | | | | | | | | | | | | | | | |
| Net assets, end of Period (000's) | | $ | 11,284 | | | $ | 15,853 | | | $ | 13,723 | | | $ | 8,721 | |
| | | | | | | | | | | | | | | | | |
Ratio of total expenses to average net assets(f) | | | 2.33 | %(g) | | | 2.09 | %(g) | | | 2.82 | %(g) | | | 5.31 | %(g)(h) |
| | | | | | | | | | | | | | | | | |
Ratio of net expenses to average net assets(f) | | | 1.95 | % | | | 1.95 | % | | | 1.95 | % | | | 1.95 | %(h) |
| | | | | | | | | | | | | | | | | |
Ratio of net investment income (loss) to average net assets(b)(f) | | | 1.22 | % | | | (0.97 | %) | | | (0.15 | %) | | | (1.94% | )(h) |
| | | | | | | | | | | | | | | | | |
| PORTFOLIO TURNOVER RATE | | | 450 | % | | | 627 | % | | | 804 | % | | | 21 | %(e) |
(a) | Prior to March 28, 2014, the Stadion Defensive International Fund was known as the Stadion Olympus Fund™. |
(b) | Recognition of net investment income/(loss) by the Fund is affected by the timing of the declaration of dividends by the underlying investment companies in which the Fund invested. |
(c) | Per share amounts were calculated using average shares method. |
(d) | Total return is a measure of the change in value of an investment in the Fund over the periods covered, which assumes any dividends or capital gains distributions are reinvested in shares of the Fund. The returns shown do not reflect the deduction of taxes a shareholder would pay on Fund distributions or the redemption of Fund shares. |
(e) | Not annualized. |
(f) | The ratios of expenses and net investment income (loss) to average net assets do not reflect the Fund's proportionate share of expense of the underlying investment companies in which the Fund invested. |
(g) | Reflects total expenses prior to fee waivers and expense reimbursements by the advisor (Note 5). |
(h) | Annualized. |
See Notes to Financial Statements.
| Stadion Defensive International Fund – Class C | Financial Highlights |
| | For a Share Outstanding Throughout each of the Periods Presented |
| | | Year Ended
May 31, 2015 | | | Year Ended
May 31, 2014(a) | | | Year Ended
May 31, 2013 | | | For the Period
April 2, 2012
(Commencement of
operations) to
May 31, 2012 | |
| NET ASSET VALUE, BEGINNING OF PERIOD | | $ | 9.96 | | | $ | 10.09 | | | $ | 9.53 | | | $ | 10.00 | |
| | | | | | | | | | | | | | | | | |
| INCOME (LOSS) FROM OPERATIONS: | | | | | | | | | | | | | | | | |
Net investment loss(b) | | | (0.00 | )(c)(d) | | | (0.17 | )(c) | | | (0.15 | )(c) | | | (0.04 | ) |
| Net realized and unrealized gain (loss) on investments | | | (0.31 | ) | | | 0.30 | | | | 0.74 | | | | (0.43 | ) |
| Total from investment operations | | | (0.31 | ) | | | 0.13 | | | | 0.59 | | | | (0.47 | ) |
| LESS DISTRIBUTIONS: | | | | | | | | | | | | | | | | |
| Dividends from net investment income | | | (0.03 | ) | | | – | | | | (0.03 | ) | | | – | |
| Distributions from net realized gains | | | (0.10 | ) | | | (0.26 | ) | | | – | | | | – | |
| Total distributions | | | (0.13 | ) | | | (0.26 | ) | | | (0.03 | ) | | | – | |
| | | | | | | | | | | | | | | | | |
| NET ASSET VALUE, END OF PERIOD | | $ | 9.52 | | | $ | 9.96 | | | $ | 10.09 | | | $ | 9.53 | |
| | | | | | | | | | | | | | | | | |
TOTAL RETURN(e) | | | (3.06 | %) | | | 1.32 | % | | | 6.19 | % | | | (4.70 | %)(f) |
| | | | | | | | | | | | | | | | | |
| RATIOS AND SUPPLEMENTAL DATA: | | | | | | | | | | | | | | | | |
| Net assets, end of Period (000's) | | $ | 153 | | | $ | 151 | | | $ | 64 | | | $ | 1 | |
| | | | | | | | | | | | | | | | | |
Ratio of total expenses to average net assets(g) | | | 3.10 | %(h) | | | 2.82 | %(h) | | | 73.16 | %(h) | | | 1,345.00 | %(h)(i) |
| | | | | | | | | | | | | | | | | |
Ratio of net expenses to average net assets(g) | | | 2.70 | % | | | 2.70 | % | | | 2.70 | % | | | 2.70 | %(i) |
| | | | | | | | | | | | | | | | | |
Ratio of net investment loss to average net assets(b)(g) | | | (0.03 | %) | | | (1.71 | %) | | | (1.49 | %) | | | (2.70 | %)(i) |
| | | | | | | | | | | | | | | | | |
| PORTFOLIO TURNOVER RATE | | | 450 | % | | | 627 | % | | | 804 | % | | | 21 | %(f) |
(a) | Prior to March 28, 2014, the Stadion Defensive International Fund was known as the Stadion Olympus Fund™. |
(b) | Recognition of net investment income/(loss) by the Fund is affected by the timing of the declaration of dividends by the underlying investment companies in which the Fund invested. |
(c) | Per share amounts were calculated using average shares method. |
(d) | Amount rounds to less than $0.01 per share or less than 1% |
(e) | Total return is a measure of the change in value of an investment in the Fund over the periods covered, which assumes any dividends or capital gains distributions are reinvested in shares of the Fund. The returns shown do not reflect the deduction of taxes a shareholder would pay on Fund distributions or the redemption of Fund shares. |
(f) | Not annualized. |
(g) | The ratios of expenses and net investment loss to average net assets do not reflect the Fund's proportionate share of expense of the underlying investment companies in which the Fund invested. |
(h) | Reflects total expenses prior to fee waivers and expense reimbursements by the advisor (Note 5). |
(i) | Annualized. |
See Notes to Financial Statements.
| | |
| Annual Report | May 31, 2015 | 47 |
| Stadion Defensive International Fund – Class I | Financial Highlights |
| | For a Share Outstanding Throughout each of the Periods Presented |
| | | Year Ended
May 31, 2015 | | | Year Ended
May 31, 2014(a) | | | Year Ended
May 31, 2013 | | | For the Period
April 2, 2012
(Commencement of
operations) to
May 31, 2012 | |
| NET ASSET VALUE, BEGINNING OF PERIOD | | $ | 10.14 | | | $ | 10.18 | | | $ | 9.55 | | | $ | 10.00 | |
| | | | | | | | | | | | | | | | | |
| INCOME (LOSS) FROM OPERATIONS: | | | | | | | | | | | | | | | | |
Net investment income (loss)(b) | | | (0.01 | )(c) | | | (0.08 | )(c) | | | (0.09 | )(c) | | | (0.03 | ) |
| Net realized and unrealized gain (loss) on investments | | | (0.23 | ) | | | 0.31 | | | | 0.79 | | | | (0.42 | ) |
| Total from investment operations | | | (0.22 | ) | | | 0.23 | | | | 0.70 | | | | (0.45 | ) |
| LESS DISTRIBUTIONS: | | | | | | | | | | | | | | | | |
| Dividends from net investment income | | | (0.09 | ) | | | – | | | | (0.07 | ) | | | – | |
| Distributions from net realized gains | | | (0.10 | ) | | | (0.27 | ) | | | – | | | | – | |
| Total distributions | | | (0.19 | ) | | | (0.27 | ) | | | (0.07 | ) | | | – | |
| | | | | | | | | | | | | | | | | |
| NET ASSET VALUE, END OF PERIOD | | $ | 9.73 | | | $ | 10.14 | | | $ | 10.18 | | | $ | 9.55 | |
| | | | | | | | | | | | | | | | | |
TOTAL RETURN(d) | | | (2.15 | %) | | | 2.29 | % | | | 7.31 | % | | | (4.50 | %)(f) |
| | | | | | | | | | | | | | | | | |
| RATIOS AND SUPPLEMENTAL DATA: | | | | | | | | | | | | | | | | |
| Net assets, end of Period (000's) | | $ | 3,828 | | | $ | 9,677 | | | $ | 5,935 | | | $ | 1 | |
| | | | | | | | | | | | | | | | | |
Ratio of total expenses to average net assets(f) | | | 2.21 | %(g) | | | 1.91 | %(g) | | | 3.63 | %(g) | | | 1,342.77 | %(g)(h) |
| | | | | | | | | | | | | | | | | |
Ratio of net expenses to average net assets(f) | | | 1.70 | % | | | 1.70 | % | | | 1.70 | % | | | 1.70 | %(h) |
| | | | | | | | | | | | | | | | | |
Ratio of net investment income (loss) to average net assets(b)(f) | | | (0.11 | %) | | | (0.77 | %) | | | (0.90 | %) | | | (1.70 | %)(h) |
| | | | | | | | | | | | | | | | | |
| PORTFOLIO TURNOVER RATE | | | 450 | % | | | 627 | % | | | 804 | % | | | 21 | %(e) |
(a) | Prior to March 28, 2014, the Stadion Defensive International Fund was known as the Stadion Olympus Fund™. |
(b) | Recognition of net investment income (loss) by the Fund is affected by the timing of the declaration of dividends by the underlying investment companies in which the Fund invested. |
(c) | Per share amounts were calculated using average shares method. |
(d) | Total return is a measure of the change in value of an investment in the Fund over the periods covered, which assumes any dividends or capital gains distributions are reinvested in shares of the Fund. The returns shown do not reflect the deduction of taxes a shareholder would pay on Fund distributions or the redemption of Fund shares. |
(e) | Not annualized. |
(f) | The ratios of expenses and net investment income (loss) to average net assets do not reflect the Fund's proportionate share of expense of the underlying investment companies in which the Fund invested. |
(g) | Reflects total expenses prior to fee waivers and expense reimbursements by the advisor (Note 5). |
(h) | Annualized. |
See Notes to Financial Statements.
| Stadion Trilogy Alternative Return Fund – Class A | Financial Highlights |
| | For a Share Outstanding Throughout each of the Periods Presented |
| | | Year Ended
May 31, 2015 | | | Year Ended
May 31, 2014(a) | | | Year Ended
May 31, 2013 | | | For the Period
April 2, 2012
(Commencement of
operations) to
May 31, 2012 | |
| NET ASSET VALUE, BEGINNING OF PERIOD | | $ | 10.53 | | | $ | 10.41 | | | $ | 9.85 | | | $ | 10.00 | |
| | | | | | | | | | | | | | | | | |
| INCOME (LOSS) FROM OPERATIONS: | | | | | | | | | | | | | | | | |
Net investment income(b) | | | 0.04 | (c) | | | 0.04 | (c) | | | 0.07 | (c) | | | 0.00 | (d) |
| Net realized and unrealized gain (loss) on investments | | | 0.12 | | | | 0.11 | | | | 0.67 | | | | (0.15 | ) |
| Total from investment operations | | | 0.16 | | | | 0.15 | | | | 0.74 | | | | (0.15 | ) |
| LESS DISTRIBUTIONS: | | | | | | | | | | | | | | | | |
| Dividends from net investment income | | | (0.03 | ) | | | (0.03 | ) | | | (0.05 | ) | | | – | |
| Distributions from net realized gains | | | – | | | | – | | | | (0.13 | ) | | | – | |
| Total distributions | | | (0.03 | ) | | | (0.03 | ) | | | (0.18 | ) | | | – | |
| | | | | | | | | | | | | | | | | |
| NET ASSET VALUE, END OF PERIOD | | $ | 10.66 | | | $ | 10.53 | | | $ | 10.41 | | | $ | 9.85 | |
| | | | | | | | | | | | | | | | | |
TOTAL RETURN(e) | | | 1.54 | % | | | 1.45 | % | | | 7.53 | % | | | (1.50 | %)(f) |
| | | | | | | | | | | | | | | | | |
| RATIOS AND SUPPLEMENTAL DATA: | | | | | | | | | | | | | | | | |
| Net assets, end of Period (000's) | | $ | 39,896 | | | $ | 88,261 | | | $ | 68,967 | | | $ | 49,507 | |
| | | | | | | | | | | | | | | | | |
Ratio of total expenses to average net assets(g) | | | 1.82 | % | | | 1.76 | % | | | 1.93 | % | | | 2.21 | %(h)(i) |
| | | | | | | | | | | | | | | | | |
Ratio of net expenses to average net assets(g) | | | 1.82 | % | | | 1.76 | % | | | 1.93 | % | | | 1.95 | %(h) |
| | | | | | | | | | | | | | | | | |
Ratio of net investment income to average net assets(b)(g) | | | 0.38 | % | | | 0.34 | % | | | 0.66 | % | | | 0.34 | %(h) |
| | | | | | | | | | | | | | | | | |
| PORTFOLIO TURNOVER RATE | | | 37 | % | | | 15 | % | | | 42 | % | | | 0 | %(d)(f) |
(a) | Prior to March 28, 2014, the Stadion Trilogy Alternative Return Fund was known as the Stadion Trilogy Fund™. |
(b) | Recognition of net investment income/(loss) by the Fund is affected by the timing of the declaration of dividends by the underlying investment companies in which the Fund invested. |
(c) | Per share amounts were calculated using average shares method. |
(d) | Amount rounds to less than $0.01 per share or less than 1% |
(e) | Total return is a measure of the change in value of an investment in the Fund over the periods covered, which assumes any dividends or capital gains distributions are reinvested in shares of the Fund. The returns shown do not reflect the deduction of taxes a shareholder would pay on Fund distributions or the redemption of Fund shares. |
(f) | Not annualized. |
(g) | The ratios of expenses and net investment income to average net assets do not reflect the Fund's proportionate share of expense of the underlying investment companies in which the Fund invested. |
(h) | Annualized. |
(i) | Reflects total expenses prior to fee waivers and expense reimbursements by the advisor (Note 5). |
See Notes to Financial Statements.
| | |
| Annual Report | May 31, 2015 | 49 |
| Stadion Trilogy Alternative Return Fund – Class C | Financial Highlights |
| | For a Share Outstanding Throughout each of the Periods Presented |
| | | Year Ended
May 31, 2015 | | | Year Ended
May 31, 2014(a) | | | Year Ended
May 31, 2013 | | | For the Period
April 2, 2012
(Commencement of
operations) to
May 31, 2012 | |
| NET ASSET VALUE, BEGINNING OF PERIOD | | $ | 10.42 | | | $ | 10.35 | | | $ | 9.85 | | | $ | 10.00 | |
| | | | | | | | | | | | | | | | | |
| INCOME (LOSS) FROM OPERATIONS: | | | | | | | | | | | | | | | | |
Net investment loss(b) | | | (0.04 | )(c) | | | (0.04 | )(c) | | | (0.01 | )(c) | | | (0.00 | )(d) |
| Net realized and unrealized gain (loss) on investments | | | 0.12 | | | | 0.11 | | | | 0.67 | | | | (0.15 | ) |
| Total from investment operations | | | 0.08 | | | | 0.07 | | | | 0.66 | | | | (0.15 | ) |
| LESS DISTRIBUTIONS: | | | | | | | | | | | | | | | | |
| Dividends from net investment income | | | (0.01 | ) | | | – | | | | (0.03 | ) | | | – | |
| Distributions from net realized gains | | | – | | | | – | | | | (0.13 | ) | | | – | |
| Total distributions | | | (0.01 | ) | | | – | | | | (0.16 | ) | | | – | |
| | | | | | | | | | | | | | | | | |
| NET ASSET VALUE, END OF PERIOD | | $ | 10.49 | | | $ | 10.42 | | | $ | 10.35 | | | $ | 9.85 | |
| | | | | | | | | | | | | | | | | |
TOTAL RETURN(e) | | | 0.75 | % | | | 0.68 | % | | | 6.72 | % | | | (1.50 | %)(f) |
| | | | | | | | | | | | | | | | | |
| RATIOS AND SUPPLEMENTAL DATA: | | | | | | | | | | | | | | | | |
| Net assets, end of Period (000's) | | $ | 11,654 | | | $ | 21,805 | | | $ | 11,570 | | | $ | 50 | |
| | | | | | | | | | | | | | | | | |
Ratio of total expenses to average net assets(g) | | | 2.58 | % | | | 2.52 | % | | | 3.36 | %(h) | | | 61.13 | %(h)(i) |
| | | | | | | | | | | | | | | | | |
Ratio of net expenses to average net assets(g) | | | 2.58 | % | | | 2.52 | % | | | 2.70 | % | | | 2.70 | %(i) |
| | | | | | | | | | | | | | | | | |
Ratio of net investment loss to average net assets(b)(g) | | | (0.36 | %) | | | (0.41 | %) | | | (0.10 | %) | | | (0.11 | %)(i) |
| | | | | | | | | | | | | | | | | |
| PORTFOLIO TURNOVER RATE | | | 37 | % | | | 15 | % | | | 42 | % | | | 0 | %(d)(f) |
(a) | Prior to March 28, 2014, the Stadion Trilogy Alternative Return Fund was known as the Stadion Trilogy Fund™. |
(b) | Recognition of net investment income/(loss) by the Fund is affected by the timing of the declaration of dividends by the underlying investment companies in which the Fund invested. |
(c) | Per share amounts were calculated using average shares method. |
(d) | Amount rounds to less than $0.01 per share or less than 1% |
(e) | Total return is a measure of the change in value of an investment in the Fund over the periods covered, which assumes any dividends or capital gains distributions are reinvested in shares of the Fund. The returns shown do not reflect the deduction of taxes a shareholder would pay on Fund distributions or the redemption of Fund shares. |
(f) | Not annualized. |
(g) | The ratios of expenses and net investment loss to average net assets do not reflect the Fund's proportionate share of expense of the underlying investment companies in which the Fund invested. |
(h) | Reflects total expenses prior to fee waivers and expense reimbursements by the advisor (Note 5). |
(i) | Annualized. |
See Notes to Financial Statements.
| Stadion Trilogy Alternative Return Fund – Class I | Financial Highlights |
| | For a Share Outstanding Throughout each of the Periods Presented |
| | | Year Ended
May 31, 2015 | | | Year Ended
May 31, 2014(a) | | | Year Ended
May 31, 2013 | | | For the Period
April 2, 2012
(Commencement of
operations) to
May 31, 2012 | |
| NET ASSET VALUE, BEGINNING OF PERIOD | | $ | 10.55 | | | $ | 10.42 | | | $ | 9.86 | | | $ | 10.00 | |
| | | | | | | | | | | | | | | | | |
| INCOME (LOSS) FROM OPERATIONS: | | | | | | | | | | | | | | | | |
Net investment income(b) | | | 0.07 | (c) | | | 0.06 | (c) | | | 0.10 | (c) | | | 0.01 | |
| Net realized and unrealized gain (loss) on investments | | | 0.12 | | | | 0.11 | | | | 0.66 | | | | (0.15 | ) |
| Total from investment operations | | | 0.19 | | | | 0.17 | | | | 0.76 | | | | (0.14 | ) |
| LESS DISTRIBUTIONS: | | | | | | | | | | | | | | | | |
| Dividends from net investment income | | | (0.05 | ) | | | (0.04 | ) | | | (0.07 | ) | | | – | |
| Distributions from net realized gains | | | – | | | | – | | | | (0.13 | ) | | | – | |
| Total distributions | | | (0.05 | ) | | | (0.04 | ) | | | (0.20 | ) | | | – | |
| | | | | | | | | | | | | | | | | |
| NET ASSET VALUE, END OF PERIOD | | $ | 10.69 | | | $ | 10.55 | | | $ | 10.42 | | | $ | 9.86 | |
| | | | | | | | | | | | | | | | | |
TOTAL RETURN(d) | | | 1.78 | % | | | 1.64 | % | | | 7.75 | % | | | (1.40 | %)(e) |
| | | | | | | | | | | | | | | | | |
| RATIOS AND SUPPLEMENTAL DATA: | | | | | | | | | | | | | | | | |
| Net assets, end of Period (000's) | | $ | 53,031 | | | $ | 46,578 | | | $ | 18,956 | | | $ | 1 | |
| | | | | | | | | | | | | | | | | |
Ratio of total expenses to average net assets(f) | | | 1.62 | % | | | 1.57 | % | | | 2.01 | %(g) | | | 1,259.15 | %(g)(h) |
| | | | | | | | | | | | | | | | | |
Ratio of net expenses to average net assets(f) | | | 1.62 | % | | | 1.57 | % | | | 1.70 | % | | | 1.70 | %(h) |
| | | | | | | | | | | | | | | | | |
Ratio of net investment income to average net assets(b)(f) | | | 0.70 | % | | | 0.54 | % | | | 0.94 | % | | | 0.51 | %(h) |
| | | | | | | | | | | | | | | | | |
| PORTFOLIO TURNOVER RATE | | | 37 | % | | | 15 | % | | | 42 | % | | | 0 | %(e)(i) |
(a) | Prior to March 28, 2014, the Stadion Trilogy Alternative Return Fund was known as the Stadion Trilogy Fund™. |
(b) | Recognition of net investment income/(loss) by the Fund is affected by the timing of the declaration of dividends by the underlying investment companies in which the Fund invested. |
(c) | Per share amounts were calculated using average shares method. |
(d) | Total return is a measure of the change in value of an investment in the Fund over the periods covered, which assumes any dividends or capital gains distributions are reinvested in shares of the Fund. The returns shown do not reflect the deduction of taxes a shareholder would pay on Fund distributions or the redemption of Fund shares. |
(e) | Not annualized. |
(f) | The ratios of expenses and net investment income to average net assets do not reflect the Fund's proportionate share of expense of the underlying investment companies in which the Fund invested. |
(g) | Reflects total expenses prior to fee waivers and expense reimbursements by the advisor (Note 5). |
(h) | Annualized. |
(i) | Amount rounds to less than $0.01 per share or less than 1% |
See Notes to Financial Statements.
| | |
| Annual Report | May 31, 2015 | 51 |
| Stadion Alternative Income Fund – Class A | Financial Highlights |
| | For a Share Outstanding Throughout each of the Periods Presented |
| | | Year Ended
May 31, 2015 | | | Year Ended
May 31, 2014 | | | For the Period
December 31, 2012
(Commencement of
operations) to
May 31, 2013 | |
| NET ASSET VALUE, BEGINNING OF PERIOD | | $ | 9.89 | | | $ | 9.91 | | | $ | 10.00 | |
| | | | | | | | | | | | | |
| INCOME (LOSS) FROM OPERATIONS: | | | | | | | | | | | | |
Net investment income(a)(b) | | | 0.15 | | | | 0.15 | | | | 0.06 | |
| Net realized and unrealized loss on investments | | | (0.13 | ) | | | (0.06 | )(c) | | | (0.15 | ) |
| Total from investment operations | | | 0.02 | | | | 0.09 | | | | (0.09 | ) |
| LESS DISTRIBUTIONS: | | | | | | | | | | | | |
| Dividends from net investment income | | | (0.19 | ) | | | (0.11 | ) | | | – | |
| Total distributions | | | (0.19 | ) | | | (0.11 | ) | | | – | |
| | | | | | | | | | | | | |
| NET ASSET VALUE, END OF PERIOD | | $ | 9.72 | | | $ | 9.89 | | | $ | 9.91 | |
| | | | | | | | | | | | | |
TOTAL RETURN(d) | | | 0.24 | % | | | 0.91 | % | | | (0.90% | )(e) |
| | | | | | | | | | | | | |
| RATIOS AND SUPPLEMENTAL DATA: | | | | | | | | | | | | |
| Net assets, end of Period (000's) | | $ | 5,226 | | | $ | 2,065 | | | $ | 1,667 | |
| | | | | | | | | | | | | |
Ratio of total expenses to average net assets(f) | | | 3.77 | %(g) | | | 2.55 | %(g) | | | 10.69 | %(g)(h) |
| | | | | | | | | | | | | |
Ratio of net expenses to average net assets(f) | | | 1.40 | % | | | 1.40 | % | | | 1.40 | %(h) |
| | | | | | | | | | | | | |
Ratio of net investment income to average net assets(b)(f) | | | 1.52 | % | | | 1.53 | % | | | 1.52 | %(h) |
| | | | | | | | | | | | | |
| PORTFOLIO TURNOVER RATE | | | 485 | % | | | 294 | % | | | 84 | %(e) |
(a) | Per share amounts were calculated using average shares method. |
(b) | Recognition of net investment income/(loss) by the Fund is affected by the timing of the declaration of dividends by the underlying investment companies in which the Fund invested. |
(c) | Net realized and unrealized loss on investments per share does not correlate to aggregate of the net realized and unrealized gain in the Statements of Operations for the year ended May 31, 2014, primarily due to the timing of the sales and repurchases of the Fund's shares in relation to the fluctuating market values for the Fund's portfolio. |
(d) | Total return is a measure of the change in value of an investment in the Fund over the periods covered, which assumes any dividends or capital gains distributions are reinvested in shares of the Fund. The returns shown do not reflect the deduction of taxes a shareholder would pay on Fund distributions or the redemption of Fund shares. |
(e) | Not annualized. |
(f) | The ratios of expenses and net investment income to average net assets do not reflect the Fund's proportionate share of expense of the underlying investment companies in which the Fund invested. |
(g) | Reflects total expenses prior to fee waivers and expense reimbursements by the advisor (Note 5). |
(h) | Annualized. |
See Notes to Financial Statements.
| Stadion Alternative Income Fund – Class I | Financial Highlights |
| | For a Share Outstanding Throughout each of the Periods Presented |
| | | Year Ended
May 31, 2015 | | | Year Ended
May 31, 2014 | | | For the Period
February 14, 2013
(Commencement of
operations) to
May 31, 2013 | |
| NET ASSET VALUE, BEGINNING OF PERIOD | | $ | 9.89 | | | $ | 9.91 | | | $ | 9.91 | |
| | | | | | | | | | | | | |
| INCOME (LOSS) FROM OPERATIONS: | | | | | | | | | | | | |
Net investment income(a)(b) | | | 0.30 | | | | 0.17 | | | | 0.04 | |
| Net realized and unrealized loss on investments | | | (0.25 | ) | | | (0.07 | )(c) | | | (0.04 | ) |
| Total from investment operations | | | 0.05 | | | | 0.10 | | | | 0.00 | |
| LESS DISTRIBUTIONS: | | | | | | | | | | | | |
| Dividends from net investment income | | | (0.34 | ) | | | (0.12 | ) | | | – | |
| Total distributions | | | (0.34 | ) | | | (0.12 | ) | | | – | |
| | | | | | | | | | | | | |
| NET ASSET VALUE, END OF PERIOD | | $ | 9.60 | | | $ | 9.89 | | | $ | 9.91 | |
| | | | | | | | | | | | | |
TOTAL RETURN(d) | | | 0.58 | % | | | 1.09 | % | | | 0.00 | %(e) |
| | | | | | | | | | | | | |
| RATIOS AND SUPPLEMENTAL DATA: | | | | | | | | | | | | |
| Net assets, end of Period (000's) | | $ | 444 | | | $ | 4,077 | | | $ | 1,519 | |
| | | | | | | | | | | | | |
Ratio of total expenses to average net assets(f) | | | 3.75 | %(g) | | | 2.29 | %(g) | | | 14.50 | %(g)(h) |
| | | | | | | | | | | | | |
Ratio of net expenses to average net assets(f) | | | 1.15 | % | | | 1.15 | % | | | 1.15 | %(h) |
| | | | | | | | | | | | | |
Ratio of net investment income to average net assets(b)(f) | | | 2.96 | % | | | 1.72 | % | | | 1.42 | %(h) |
| | | | | | | | | | | | | |
| PORTFOLIO TURNOVER RATE | | | 485 | % | | | 294 | % | | | 84 | %(e)(i) |
(a) | Per share amounts were calculated using average shares method. |
(b) | Recognition of net investment income/(loss) by the Fund is affected by the timing of the declaration of dividends by the underlying investment companies in which the Fund invested. |
(c) | Net realized and unrealized loss on investments per share does not correlate to aggregate of the net realized and unrealized gain in the Statements of Operations for the year ended May 31, 2014, primarily due to the timing of the sales and repurchases of the Fund's shares in relation to the fluctuating market values for the Fund's portfolio. |
(d) | Total return is a measure of the change in value of an investment in the Fund over the periods covered, which assumes any dividends or capital gains distributions are reinvested in shares of the Fund. The returns shown do not reflect the deduction of taxes a shareholder would pay on Fund distributions or the redemption of Fund shares. |
(e) | Not annualized. |
(f) | The ratios of expenses and net investment income to average net assets do not reflect the Fund's proportionate share of expense of the underlying investment companies in which the Fund invested. |
(g) | Reflects total expenses prior to fee waivers and expense reimbursements by the advisor (Note 5). |
(h) | Annualized. |
(i) | Represents the period December 31, 2012 (commencement of operations of the Fund) to May 31, 2013. |
See Notes to Financial Statements.
| | |
| Annual Report | May 31, 2015 | 53 |
| Stadion Managed Risk 100 Fund – Class A | Financial Highlights |
| | For a Share Outstanding Throughout each of the Periods Presented |
| | | Year Ended
May 31, 2015 | | | Year Ended
May 31, 2014(a) | | | Year Ended
May 31, 2013 | | | Year Ended
May 31, 2012 | | | Year Ended
May 31, 2011 | |
| NET ASSET VALUE, BEGINNING OF PERIOD | | $ | 9.90 | | | $ | 10.35 | | | $ | 9.38 | | | $ | 9.93 | | | $ | 9.64 | |
| | | | | | | | | | | | | | | | | | | | | |
| INCOME (LOSS) FROM OPERATIONS: | | | | | | | | | | | | | | | | | | | | |
Net investment loss(b) | | | (0.01 | )(c) | | | (0.07 | )(c) | | | (0.00 | )(c)(d) | | | (0.17 | ) | | | (0.06 | ) |
| Net realized and unrealized gain (loss) on investments | | | (0.46 | ) | | | (0.38 | ) | | | 0.97 | | | | (0.28 | ) | | | 0.46 | |
| Total from investment operations | | | (0.47 | ) | | | (0.45 | ) | | | 0.97 | | | | (0.45 | ) | | | 0.40 | |
| LESS DISTRIBUTIONS: | | | | | | | | | | | | | | | | | | | | |
| Distributions from net realized gains | | | – | | | | – | | | | – | | | | (0.10 | ) | | | (0.11 | ) |
| Total distributions | | | – | | | | – | | | | – | | | | (0.10 | ) | | | (0.11 | ) |
| | | | | | | | | | | | | | | | | | | | | |
| NET ASSET VALUE, END OF PERIOD | | $ | 9.43 | | | $ | 9.90 | | | $ | 10.35 | | | $ | 9.38 | | | $ | 9.93 | |
| | | | | | | | | | | | | | | | | | | | | |
TOTAL RETURN(e) | | | (4.75 | %) | | | (4.35 | %) | | | 10.34 | % | | | (4.45 | %) | | | 4.07 | % |
| | | | | | | | | | | | | | | | | | | | | |
| RATIOS AND SUPPLEMENTAL DATA: | | | | | | | | | | | | | | | | | | | | |
| Net assets, end of Period (000's) | | $ | 100,049 | | | $ | 266,853 | | | $ | 371,779 | | | $ | 407,202 | | | $ | 981,387 | |
| | | | | | | | | | | | | | | | | | | | | |
Ratio of total expenses to average net assets(f) | | | 1.65 | % | | | 1.53 | % | | | 1.59 | % | | | 1.51 | % | | | 1.50 | % |
| | | | | | | | | | | | | | | | | | | | | |
Ratio of net investment loss to average net assets(b)(f) | | | (0.12 | %) | | | (0.66 | %) | | | (0.01 | %) | | | (1.03 | %) | | | (0.82 | %) |
| | | | | | | | | | | | | | | | | | | | | |
| PORTFOLIO TURNOVER RATE | | | 1,046 | % | | | 1,079 | % | | | 737 | % | | | 1,967 | % | | | 1,018 | % |
(a) | Prior to March 28, 2014, the Stadion Managed Risk 100 Fund was known as the Stadion Managed Fund. |
(b) | Recognition of net investment income/(loss) by the Fund is affected by the timing of the declaration of dividends by the underlying investment companies in which the Fund invested. |
(c) | Per share amounts were calculated using average shares method. |
(d) | Amount rounds to less than $0.01 per share or less than 1% |
(e) | Total return is a measure of the change in value of an investment in the Fund over the periods covered, which assumes any dividends or capital gains distributions are reinvested in shares of the Fund. The returns shown do not reflect the deduction of taxes a shareholder would pay on Fund distributions or the redemption of Fund shares. |
(f) | The ratios of expenses and net investment loss to average net assets do not reflect the Fund's proportionate share of expense of the underlying investment companies in which the Fund invested. |
See Notes to Financial Statements.
| Stadion Managed Risk 100 Fund – Class C | Financial Highlights |
| | For a Share Outstanding Throughout each of the Periods Presented |
| | | Year Ended
May 31, 2015 | | | Year Ended
May 31, 2014(a) | | | Year Ended
May 31, 2013 | | | Year Ended
May 31, 2012 | | | Year Ended
May 31, 2011 | |
| NET ASSET VALUE, BEGINNING OF PERIOD | | $ | 9.54 | | | $ | 10.05 | | | $ | 9.18 | | | $ | 9.79 | | | $ | 9.59 | |
| | | | | | | | | | | | | | | | | | | | | |
| INCOME (LOSS) FROM OPERATIONS: | | | | | | | | | | | | | | | | | | | | |
Net investment loss(b) | | | (0.09 | )(c) | | | (0.14 | )(c) | | | (0.07 | )(c) | | | (0.21 | ) | | | (0.10 | ) |
| Net realized and unrealized gain (loss) on investments | | | (0.43 | ) | | | (0.37 | ) | | | 0.94 | | | | (0.30 | ) | | | 0.41 | |
| Total from investment operations | | | (0.52 | ) | | | (0.51 | ) | | | 0.87 | | | | (0.51 | ) | | | 0.31 | |
| LESS DISTRIBUTIONS: | | | | | | | | | | | | | | | | | | | | |
| Distributions from net realized gains | | | – | | | | – | | | | – | | | | (0.10 | ) | | | (0.11 | ) |
| Total distributions | | | – | | | | – | | | | – | | | | (0.10 | ) | | | (0.11 | ) |
| | | | | | | | | | | | | | | | | | | | | |
| NET ASSET VALUE, END OF PERIOD | | $ | 9.02 | | | $ | 9.54 | | | $ | 10.05 | | | $ | 9.18 | | | $ | 9.79 | |
| | | | | | | | | | | | | | | | | | | | | |
TOTAL RETURN(d) | | | (5.45 | %) | | | (5.07 | %) | | | 9.48 | % | | | (5.13 | %) | | | 3.15 | % |
| | | | | | | | | | | | | | | | | | | | | |
| RATIOS AND SUPPLEMENTAL DATA: | | | | | | | | | | | | | | | | | | | | |
| Net assets, end of Period (000's) | | $ | 49,008 | | | $ | 92,384 | | | $ | 141,797 | | | $ | 159,112 | | | $ | 228,541 | |
| | | | | | | | | | | | | | | | | | | | | |
Ratio of total expenses to average net assets(e) | | | 2.43 | % | | | 2.29 | % | | | 2.35 | % | | | 2.30 | % | | | 2.28 | % |
| | | | | | | | | | | | | | | | | | | | | |
Ratio of net investment loss to average net assets(b)(e) | | | (0.91 | %) | | | (1.43 | %) | | | (0.77 | %) | | | (1.80 | %) | | | (1.65 | %) |
| | | | | | | | | | | | | | | | | | | | | |
| PORTFOLIO TURNOVER RATE | | | 1,046 | % | | | 1,079 | % | | | 737 | % | | | 1,967 | % | | | 1,018 | % |
(a) | Prior to March 28, 2014, the Stadion Managed Risk 100 Fund was known as the Stadion Managed Fund. |
(b) | Recognition of net investment income/(loss) by the Fund is affected by the timing of the declaration of dividends by the underlying investment companies in which the Fund invested. |
(c) | Per share amounts were calculated using average shares method. |
(d) | Total return is a measure of the change in value of an investment in the Fund over the periods covered, which assumes any dividends or capital gains distributions are reinvested in shares of the Fund. The returns shown do not reflect the deduction of taxes a shareholder would pay on Fund distributions or the redemption of Fund shares. |
(e) | The ratios of expenses and net investment loss to average net assets do not reflect the Fund's proportionate share of expense of the underlying investment companies in which the Fund invested. |
See Notes to Financial Statements.
| | |
| Annual Report | May 31, 2015 | 55 |
| Stadion Managed Risk 100 Fund – Class I | Financial Highlights |
| | For a Share Outstanding Throughout each of the Periods Presented |
| | | Year Ended
May 31, 2015 | | | Year Ended
May 31, 2014(a) | | | Year Ended
May 31, 2013 | | | Year Ended
May 31, 2012 | | | Year Ended
May 31, 2011 | |
| NET ASSET VALUE, BEGINNING OF PERIOD | | $ | 9.99 | | | $ | 10.43 | | | $ | 9.43 | | | $ | 9.96 | | | $ | 9.64 | |
| | | | | | | | | | | | | | | | | | | | | |
| INCOME (LOSS) FROM OPERATIONS: | | | | | | | | | | | | | | | | | | | | |
Net investment income (loss)(b) | | | 0.01 | (c) | | | (0.04 | )(c) | | | 0.02 | (c) | | | (0.06 | ) | | | (0.05 | ) |
| Net realized and unrealized gain (loss) on investments | | | (0.46 | ) | | | (0.40 | ) | | | 0.98 | | | | (0.37 | ) | | | 0.48 | |
| Total from investment operations | | | (0.45 | ) | | | (0.44 | ) | | | 1.00 | | | | (0.43 | ) | | | 0.43 | |
| LESS DISTRIBUTIONS: | | | | | | | | | | | | | | | | | | | | |
| Distributions from net realized gains | | | – | | | | – | | | | – | | | | (0.10 | ) | | | (0.11 | ) |
| Total distributions | | | – | | | | – | | | | – | | | | (0.10 | ) | | | (0.11 | ) |
| | | | | | | | | | | | | | | | | | | | | |
| NET ASSET VALUE, END OF PERIOD | | $ | 9.54 | | | $ | 9.99 | | | $ | 10.43 | | | $ | 9.43 | | | $ | 9.96 | |
| | | | | | | | | | | | | | | | | | | | | |
TOTAL RETURN(d) | | | (4.50 | %) | | | (4.22 | %) | | | 10.60 | % | | | (4.24 | %) | | | 4.38 | % |
| | | | | | | | | | | | | | | | | | | | | |
| RATIOS AND SUPPLEMENTAL DATA: | | | | | | | | | | | | | | | | | | | | |
| Net assets, end of Period (000's) | | $ | 50,337 | | | $ | 98,724 | | | $ | 127,735 | | | $ | 117,986 | | | $ | 83,614 | |
| | | | | | | | | | | | | | | | | | | | | |
Ratio of total expenses to average net assets(e) | | | 1.47 | % | | | 1.31 | % | | | 1.39 | % | | | 1.28 | % | | | 1.24 | % |
| | | | | | | | | | | | | | | | | | | | | |
Ratio of net investment income (loss) to average net assets(b)(e) | | | 0.10 | % | | | (0.43 | %) | | | 0.18 | % | | | (0.77 | %) | | | (0.48 | %) |
| | | | | | | | | | | | | | | | | | | | | |
| PORTFOLIO TURNOVER RATE | | | 1,046 | % | | | 1,079 | % | | | 737 | % | | | 1,967 | % | | | 1,018 | % |
(a) | Prior to March 28, 2014, the Stadion Managed Risk 100 Fund was known as the Stadion Managed Fund. |
(b) | Recognition of net investment income/(loss) by the Fund is affected by the timing of the declaration of dividends by the underlying investment companies in which the Fund invested. |
(c) | Per share amounts were calculated using average shares method. |
(d) | Total return is a measure of the change in value of an investment in the Fund over the periods covered, which assumes any dividends or capital gains distributions are reinvested in shares of the Fund. The returns shown do not reflect the deduction of taxes a shareholder would pay on Fund distributions or the redemption of Fund shares. |
(e) | The ratios of expenses and net investment income (loss) to average net assets do not reflect the Fund's proportionate share of expense of the underlying investment companies in which the Fund invested. |
See Notes to Financial Statements.
| Stadion Investment Trust | Notes to Financial Statements |
| | May 31, 2015 |
Stadion Tactical Growth Fund (“Tactical Growth Fund”) (formerly known as the Stadion Market Opportunity Fund prior to March 28, 2014), Stadion Tactical Defensive Fund (“Tactical Defensive Fund”) (formerly known as the Stadion Core Advantage Fund prior to March 28, 2014), Stadion Defensive International Fund (“Defensive International Fund”) (formerly known as the Stadion Olympus FundTM prior to March 28, 2014), Stadion Trilogy Alternative Return Fund (“Trilogy Alternative Return Fund”) (formerly known as the Stadion Trilogy FundTM prior to March 28, 2014), Stadion Alternative Income Fund (“Alternative Income Fund”) (formerly known as the Stadion Tactical Income Fund prior to April 30, 2015) and Stadion Managed Risk 100 Fund (“Managed Risk 100 Fund”) (formerly known as the Stadion Managed Fund prior to March 28, 2014), (each, a “Fund,” and collectively, the “Funds”) are each a diversified series of Stadion Investment Trust (the “Trust”), a Delaware Statutory Trust registered under the Investment Company Act of 1940 (the “1940 Act”) as an open-end management investment company.
Tactical Growth Fund is a successor to a previously operational fund, the ETF Growth Fund (the “Predecessor Fund”), which was a series of the Aviemore Funds, an Ohio business trust. The Predecessor Fund was organized into a series, Class I Shares of the Tactical Growth Fund effective as of the close of business on March 29, 2013. The Predecessor Fund commenced operations on May 3, 2004 and was the only series authorized by the Aviemore Funds. Class A and Class C shares were launched from the Tactical Growth Fund effective April 1, 2013. The Fund seeks long‐term capital appreciation.
Tactical Defensive Fund commenced operations on January 27, 2004. The public offering of Class A shares, Class C shares and Class I shares commenced on September 15, 2006, October 1, 2009 and May 28, 2010, respectively. The investment objective of the Fund is to seek capital appreciation.
Defensive International Fund commenced operations on April 2, 2012. The public offering of Class A shares, Class C shares and Class I shares commenced on April 2, 2012. The investment objective of the Fund is to seek long-term capital appreciation, while maintaining a secondary emphasis on capital preservation.
Trilogy Alternative Return Fund commenced operations on April 2, 2012. The public offering of Class A shares, Class C shares and Class I shares commenced on April 2, 2012. The investment objective of the Fund is total return, with an emphasis on lower risk and volatility than the U.S. equity markets.
Alternative Income Fund commenced operations on December 31, 2012. The public offering of Class A shares and Class I shares commenced on December 31, 2012 and February 14, 2013 respectively. The investment objective of the Fund is to seek to provide income and absolute portfolio returns, with a secondary emphasis on lower risk and volatility than the U.S. equity markets.
Managed Risk 100 Fund commenced operations on June 30, 2003. The public offering of Class A shares, Class C shares and Class I shares commenced on September 15, 2006, October 1, 2009 and May 28, 2010, respectively. The investment objective of the Fund is to seek long-term capital appreciation, while maintaining a secondary emphasis on capital preservation.
Each Fund, excluding the Alternative Income Fund, currently offers three classes of shares, Class A, Class C, and Class I. The Alternative Income Fund offers Class A and Class I shares. Class A shares are sold subject to a maximum front-end sales load equal to 5.75% of the offering price and a distribution and/or service fee of up to 0.25% of the average net assets attributable to Class A shares, are also sold subject to a 1% contingent deferred sales load on purchases at or above $1 million if redeemed within 12 months of purchase. Class C shares are sold subject to a distribution and/or service fee of up to 1.00% of the average daily net assets attributable to Class C shares and, effective October 1, 2012, sold subject to a 1% contingent deferred sales load if redeemed within one year of purchase. Class I shares are sold without any sales loads and distribution and/ or service fees. Each class of shares represents an interest in the same assets of the Funds, has the same rights and is identical in all material respects except that (1) the classes bear differing levels of sales loads and distribution fees; (2) certain other class specific expenses will be borne solely by the class to which such expenses are attributable; (3) each class has exclusive voting rights with respect to matters relating to its arrangements; and (4) Class I shares require a higher minimum initial investment.
| 2. SIGNIFICANT ACCOUNTING POLICIES |
The following is a summary of the Funds’ significant accounting policies used in the preparation of their financial statements. The policies are in conformity with accounting principles generally accepted in the United States of America (“GAAP”). The Funds are considered investment companies for financial reporting purposes under GAAP.
Security Valuation: The Funds’ investments in securities are carried at market value. Securities listed on an exchange or quoted on a national market system are valued at the last sales price as of the time regular trading closes on the New York Stock Exchange (normally, 4:00 p.m. Eastern Time). Securities traded in the NASDAQ market are valued at the NASDAQ Official Closing Price. Other securities, including listed securities for which no sale was reported on that date, are valued at the most recent bid price. Options are valued at the mean of the last quoted bid and ask prices at the time of valuation, as reported on the option’s primary exchange. If no bid quotation is readily available at the time of valuation, the option shall be valued at the mean of the last quoted ask price and $0.00. Securities and assets for which representative market quotations are not readily available or which cannot be accurately valued using the Funds’ normal pricing procedures are valued at fair value as determined in good faith under policies approved by the Board of Trustees (the “Trustees”) and will be classified as Level 2 or 3 within the fair value hierarchy (see below), depending on the inputs used. Fair value pricing may be used, for example, in situations where (i) a portfolio security is so thinly traded that there have been no transactions for that security over an extended period of time; (ii) an event occurs after the close of the exchange on which a portfolio security is principally traded that is likely to have changed the value of the portfolio security prior to the Funds’ net asset value calculations; (iii) the exchange on which the portfolio security is principally traded closes early; or (iv) trading of the portfolio security is halted during the day and does not resume prior to the Funds’ net asset value calculations. A portfolio security’s “fair value” price may differ from the price next available for that portfolio security using the Funds’ normal pricing procedures. Open-end investment companies, including money market funds, are valued at the net asset value reported by such registered open-end investment companies. Instruments with maturities of 60 days or less are valued at amortized cost, which approximates market value.
Annual Report | May 31, 2015 | 57 |
| Stadion Investment Trust | Notes to Financial Statements |
| | May 31, 2015 |
GAAP establishes a single authoritative definition of fair value, sets out a framework for measuring fair value and requires certain disclosures about fair value measurements.
Various inputs are used in determining the value of the Funds’ investments. These inputs are summarized in the three broad levels listed below:
Level 1 – quoted prices in active markets for identical securities
Level 2 – other significant observable inputs
Level 3 – significant unobservable inputs
The inputs or methodology used for valuing securities are not necessarily an indication of the risks associated with investing in those securities. The inputs used to measure fair value may fall into different levels of the fair value hierarchy. In such cases, for disclosure purposes, the level in the fair value hierarchy within which the fair value measurement falls in its entirety is determined based on the lowest level input that is significant to the fair value measurement.
The following is a summary of the inputs used to value each Fund’s investments as of May 31, 2015 by security type:
| | | Valuation Inputs | | | | |
| | | Level 1 | | | Level 2 | | | Level 3 | | | Total | |
| Investments in Securities at Value | |
| Exchange-Traded Funds | | $ | 186,004,192 | | | $ | – | | | $ | – | | | $ | 186,004,192 | |
| Money Market Funds | | | 6,735,809 | | | | – | | | | – | | | | 6,735,809 | |
| Total Investments in Securities | | $ | 192,740,001 | | | $ | – | | | $ | – | | | $ | 192,740,001 | |
Tactical Defensive Fund
| | | Valuation Inputs | | | | |
| | | Level 1 | | | Level 2 | | | Level 3 | | | Total | |
| Investments in Securities at Value | |
| Exchange-Traded Funds | | $ | 58,312,024 | | | $ | – | | | $ | – | | | $ | 58,312,024 | |
| Money Market Funds | | | 8,198,656 | | | | – | | | | – | | | | 8,198,656 | |
| Total Investments in Securities | | $ | 66,510,680 | | | $ | – | | | $ | – | | | $ | 66,510,680 | |
Defensive International Fund
| | | Valuation Inputs | | | | |
| | | Level 1 | | | Level 2 | | | Level 3 | | | Total | |
| Investments in Securities at Value | |
| Exchange-Traded Funds | | $ | 8,166,572 | | | $ | – | | | $ | – | | | $ | 8,166,572 | |
| Money Market Funds | | | 6,961,172 | | | | – | | | | – | | | | 6,961,172 | |
| Total Investments in Securities | | $ | 15,127,744 | | | $ | – | | | $ | – | | | $ | 15,127,744 | |
Trilogy Alternative Return Fund
| | | Valuation Inputs | | | | |
| | | Level 1 | | | Level 2 | | | Level 3 | | | Total | |
| Investments in Securities at Value | |
| Common Stocks* | | $ | 49,837,338 | | | $ | – | | | $ | – | | | $ | 49,837,338 | |
| Exchange-Traded Funds | | | 48,358,231 | | | | – | | | | – | | | | 48,358,231 | |
| Purchased Option Contracts | | | – | | | | 6,651,525 | | | | – | | | | 6,651,525 | |
| Money Market Funds | | | 3,052,793 | | | | – | | | | – | | | | 3,052,793 | |
| Total Investments in Securities | | $ | 101,248,362 | | | $ | 6,651,525 | | | $ | – | | | $ | 107,899,887 | |
| Other Financial Instruments | | | | | | | | | | | | | |
| Liabilities | |
| Written Option Contracts | | $ | – | | | $ | (3,474,125 | ) | | $ | – | | | $ | (3,474,125 | ) |
| Total | | $ | – | | | $ | (3,474,125 | ) | | $ | – | | | $ | (3,474,125 | ) |
* See Schedule of Investments for Common Stocks determined by industry.
| Stadion Investment Trust | Notes to Financial Statements |
| | May 31, 2015 |
| | | Valuation Inputs | | | | |
| | | Level 1 | | | Level 2 | | | Level 3 | | | Total | |
| Investments in Securities at Value | |
| Common Stocks* | | $ | 5,224,183 | | | $ | – | | | $ | – | | | $ | 5,224,183 | |
| Purchased Option Contracts | | | – | | | | 229,705 | | | | – | | | | 229,705 | |
| Money Market Funds | | | 368,848 | | | | – | | | | – | | | | 368,848 | |
| Total Investments in Securities | | $ | 5,593,031 | | | $ | 229,705 | | | $ | – | | | $ | 5,822,736 | |
| Other Financial Instruments | | | | | | | | | | | | | |
| Liabilities | |
| Written Option Contracts | | $ | – | | | $ | (189,865 | ) | | $ | – | | | $ | (189,865 | ) |
| Total | | $ | – | | | $ | (189,865 | ) | | $ | – | | | $ | (189,865 | ) |
* See Schedule of Investments for Common Stocks determined by industry.
Managed Risk 100 Fund
| | | Valuation Inputs | | | | |
| | | Level 1 | | | Level 2 | | | Level 3 | | | Total | |
| Investments in Securities at Value | |
| Exchange-Traded Funds | | $ | 155,154,384 | | | $ | – | | | $ | – | | | $ | 155,154,384 | |
| Money Market Funds | | | 42,144,451 | | | | – | | | | – | | | | 42,144,451 | |
| Total Investments in Securities | | $ | 197,298,835 | | | $ | – | | | $ | – | | | $ | 197,298,835 | |
As of May 31, 2015, the Funds did not have any transfers in and/or out of any Level. The Funds did not have any assets or liabilities that were measured at fair value on a recurring basis using significant unobservable inputs (Level 3) as of May 31, 2015. It is the Funds’ policy to recognize transfers into and out of any Level at the end of the reporting period.
Share Valuation: The net asset value per share of each class of shares of each Fund is calculated daily by dividing the total value of the assets attributable to that class, less liabilities attributable to that class, by the number of shares of that class outstanding.
Securities Transactions and Investment Income: Security transactions are accounted for on trade date. Gains and losses on securities sold are determined on a specific identification basis. Dividend income is recorded on the ex-dividend date. Interest income is accrued as earned.
Option Transactions: Alternative Income Fund, Defensive International Fund, and Trilogy Alternative Return Fund may purchase and write put and call options on broad-based U.S. and International stock indices or ETFs that replicate the performance of broad-based U.S. and International stock indices as well as short term futures ETFs and bond ETFs. The Fund uses option contracts on broad-based U.S. and International stock indices for the purpose of seeking to generate return and manage risk exposure among varying market conditions.
Exchange-Traded Funds (“ETFs”): The Funds may invest in ETFs, which are funds whose shares are traded on a national exchange. ETFs may be based on underlying equity or fixed income securities, as well as commodities or currencies. ETFs do not sell individual shares directly to investors and only issue their shares in large blocks known as “creation units.” The investor purchasing a creation unit then sells the individual shares on a secondary market. Although similar diversification benefits may be achieved through an investment in another investment company, ETFs generally offer greater liquidity and lower expenses. Because an ETF incurs its own fees and expenses, shareholders of a fund investing in an ETF will indirectly bear those costs. Such funds will also incur brokerage commissions and related charges when purchasing or selling shares of an ETF. Unlike typical investment company shares, which are valued once daily, shares in an ETF may be purchased or sold on a securities exchange throughout the trading day at market prices.
Allocation Between Classes: Investment income earned, realized capital gains and losses, and unrealized appreciation and depreciation are allocated daily to each class of shares based upon its proportionate share of total net assets of the respective Fund. Class specific expenses are charged directly to the class incurring the expense. Common expenses which are not attributable to a specific class are allocated daily to each class of shares based upon its proportionate share of total net assets of the respective Fund.
Distributions to Shareholders: Each of the Funds may distribute its net investment income to its shareholders quarterly, but, in any event, expects to distribute substantially all of its net investment income to its shareholders at least annually. Net realized gains, if any, are distributed at least once each year. The amount of distributions from net investment income and net realized gains are determined in accordance with federal income tax regulations, which may differ from GAAP. These “book/tax” differences are either temporary or permanent in nature and are primarily due to losses deferred due to wash sales and tax treatment of short term capital gains. Dividends and distributions are recorded on the ex-dividend date.
Use of Estimates: The preparation of financial statements in conformity with GAAP requires management to make estimates and assumptions that affect the reported amount of assets and liabilities, the disclosure of contingent assets and liabilities, and revenues and expenses during the reporting period. Actual results could differ from those estimates.
Federal Income Taxes: It is each Fund’s policy to comply with the special provisions of Subchapter M of the Internal Revenue Code of 1986, as amended, applicable to regulated investment companies. As provided therein, in any fiscal year in which a Fund so qualifies and distributes at least 90% of its taxable net income, the Fund (but not the shareholders) will be relieved of federal income tax on the income distributed. Accordingly, no provision for income taxes has been made.
Annual Report | May 31, 2015 | 59 |
| Stadion Investment Trust | Notes to Financial Statements |
| | May 31, 2015 |
In order to avoid imposition of the excise tax applicable to regulated investment companies, it is also each Fund’s intention to declare as dividends in each calendar year at least 98% of its net investment income (earned during the calendar year) and 98.2% of its net realized capital gains (earned during the twelve months ended October 31) plus undistributed amounts from prior years.
During the year ended May 31, 2015, cost of purchases and proceeds from sales and maturities of investment securities, other than short-term investments and U.S. government securities, amounted to:
| | | Tactical Growth Fund | | | Tactical Defensive Fund | |
| Purchases | | $ | 406,399,523 | | | $ | 289,303,294 | |
| Sales | | $ | 270,468,552 | | | $ | 289,296,408 | |
| | | Defensive International Fund | | | Trilogy Alternative Return Fund | |
| Purchases | | $ | 70,858,497 | | | $ | 46,793,792 | |
| Sales | | $ | 87,756,184 | | | $ | 99,211,363 | |
| | | Alternative Income Fund | | | Managed Risk 100 Fund | |
| Purchases | | $ | 19,500,274 | | | $ | 2,578,760,334 | |
| Sales | | $ | 19,838,514 | | | $ | 2,758,492,900 | |
During the year ended May 31, 2015, cost of purchases and proceeds from sales and maturities of U.S. government securities, amounted to:
| | | Alternative Income Fund | |
| Purchases | | $ | 53,823 | |
| Sales | | $ | 353,633 | |
The tax character of distributions made during the periods ended May 31, 2015 and May 31, 2014 was as follows:
| | | Ordinary Income | | | Long-term Capital Gains | | | Total Distributions | |
| Tactical Growth Fund | | | | | | | | | |
| 5/31/2015 | | $ | 3,049,629 | | | $ | 1,679,398 | | | $ | 4,729,027 | |
| 5/31/2014 | | | 2,420,633 | | | | 2,280,716 | | | | 4,701,349 | |
| Tactical Defensive Fund | | | | | | | | | | | | |
| 5/31/2015 | | $ | – | | | $ | 71,758 | | | $ | 71,758 | |
| 5/31/2014 | | | 1,809,332 | | | | 1,802,553 | | | | 3,611,885 | |
| Defensive International Fund | | | | | | | | | | | | |
| 5/31/2015 | | $ | 259,239 | | | $ | 76,006 | | | $ | 335,245 | |
| 5/31/2014 | | | 649,905 | | | | 39,419 | | | | 689,324 | |
| Trilogy Alternative Return Fund | | | | | | | | | | | | |
| 5/31/2015 | | $ | 426,374 | | | $ | – | | | $ | 426,374 | |
| 5/31/2014 | | | 399,514 | | | | – | | | | 399,514 | |
| Alternative Income Fund | | | | | | | | | | | | |
| 5/31/2015 | | $ | 73,146 | | | $ | – | | | $ | 73,146 | |
| 5/31/2014 | | | 71,161 | | | | – | | | | 71,161 | |
| Managed Risk 100 Fund | | | | | | | | | | | | |
| 5/31/2015 | | $ | – | | | $ | – | | | $ | – | |
| 5/31/2014 | | | – | | | | – | | | | – | |
Reclassifications:
At May 31, 2015, permanent differences in book and tax accounting were reclassified. These differences had no effect on net assets and were primarily attributed to differences in the treatment of certain investments and treatment of net investment loss. These reclassifications were as follows:
| | | Accumulated
net
investment
income (loss) | | | Accumulated
net realized
gains (losses) | | | Paid-in
capital | |
| Tactical Growth Fund | | $ | 4,377 | | | $ | (4,377 | ) | | $ | – | |
| Tactical Defensive Fund | | | 159,521 | | | | – | | | | (159,521 | ) |
| Defensive International Fund | | | – | | | | – | | | | – | |
| Trilogy Alternative Return Fund | | | (5,905 | ) | | | 5,905 | | | | – | |
| Alternative Income Fund | | | – | | | | – | | | | – | |
| Managed Risk 100 Fund | | | 2,138,325 | | | | – | | | | (2,138,325 | ) |
Included in the amounts reclassified above was a net operating loss offset to paid-in capital in the amounts of:
| Fund | | Amount | |
| Tactical Defensive Fund | | $ | 159,521 | |
| Managed Risk 100 Fund | | | 2,138,325 | |
| Stadion Investment Trust | Notes to Financial Statements |
| | May 31, 2015 |
Tax Basis of Investments:
As of May 31, 2015, the aggregate cost of investments, gross unrealized appreciation/(depreciation) and net unrealized appreciation for Federal tax purposes was as follows:
| | | Tactical Growth
Fund | | | Tactical Defensive Fund | | | Defensive International Fund | |
| Tax cost of portfolio investments | | $ | 186,479,866 | | | $ | 63,133,557 | | | $ | 15,290,289 | |
| Gross unrealized appreciation | | $ | 7,507,052 | | | $ | 3,714,151 | | | $ | 74,364 | |
| Gross unrealized depreciation | | | (1,246,917 | ) | | | (337,028 | ) | | | (236,909 | ) |
| Net unrealized appreciation (depreciation) | | $ | 6,260,135 | | | $ | 3,377,123 | | | $ | (162,545 | ) |
| | | Trilogy Alternative Return Fund | | | Alternative Income Fund | | | Managed Risk 100 Fund | |
| Tax cost of portfolio investments | | $ | 102,527,573 | | | $ | 5,878,288 | | | $ | 198,192,269 | |
| Gross unrealized appreciation | | $ | 12,219,381 | | | $ | 68,339 | | | $ | 123,340 | |
| Gross unrealized depreciation | | | (6,847,067 | ) | | | (123,891 | ) | | | (1,016,774 | ) |
| Net appreciation written option contracts | | | 3,779,528 | | | | 5,954 | | | | – | |
| Net unrealized appreciation (depreciation) | | $ | 9,151,842 | | | $ | (49,598 | ) | | $ | (893,434 | ) |
As of May 31, 2015, the tax cost of written option contracts for Trilogy Alternative Return Fund and Alternative Income Fund were $7,253,653 and $195,819 respectively.
The difference between the federal income tax cost of portfolio investments and the financial statement cost for Tactical Growth Fund, Tactical Defensive Fund and Trilogy Alternative Return Fund is due to certain timing differences in the recognition of capital gains or losses under income tax regulations and GAAP. These “book/tax” differences are temporary in nature and are due to the tax deferral of losses on wash sales.
Components of Earnings:
At May 31, 2015, components of distributable earnings on a tax basis were as follows:
| | | Tactical Growth Fund | | | Tactical Defensive Fund | | | Defensive International Fund | |
| Undistributed ordinary income | | $ | 34,064 | | | $ | – | | | $ | 60,826 | |
| Accumulated capital gains on investments | | | 406,478 | | | | 1,463,088 | | | | – | |
| Net unrealized appreciation (depreciation) on investments | | | 6,260,135 | | | | 3,377,123 | | | | (162,545 | ) |
| Other cumulative effect of timing differences | | | (387,815 | ) | | | (310,655 | ) | | | (111,097 | ) |
| Total | | $ | 6,312,862 | | | $ | 4,529,556 | | | $ | (212,816 | ) |
| | | Trilogy Alternative Return Fund | | | Alternative Income Fund | | | Managed Risk 100 Fund | |
| Undistributed ordinary income | | $ | 205,619 | | | $ | 30,766 | | | $ | – | |
| Accumulated capital gains (losses) on investments | | | (6,150,373 | ) | | | 18,617 | | | | (33,031,235 | ) |
| Net unrealized appreciation (depreciation) on investments | | | 9,151,842 | | | | (49,598 | ) | | | (893,434 | ) |
| Other cumulative effect of timing differences | | | 1,257,906 | | | | 5,540 | | | | (807,144 | ) |
| Total | | $ | 4,464,994 | | | $ | 5,325 | | | $ | (34,731,813 | ) |
Capital Loss Carryforward:
As of May 31, 2015, the Funds have the following capital loss carryforwards. These capital loss carryforwards may be utilized in future years to offset net realized capital gains, if any, prior to distributing such gains to shareholders.
During the year ended May 31, 2015, the Fund utilized capital loss carryforwards as follows:
| Fund | | Amount | |
| Trilogy Alternative Return Fund | | $ | (2,550,535 | ) |
| Alternative Income Fund | | | (89,705 | ) |
| Managed Risk 100 Fund | | | (5,006,264 | ) |
Capital losses (no expiration) carried to the next tax year were as follows:
| Fund | | Short-Term | | | Long-Term | |
| Trilogy Alternative Return Fund | | $ | 6,150,373 | | | $ | – | |
| Managed Risk 100 Fund | | | 17,432,497 | | | | – | |
The Funds elect to defer to the tax year ending May 31, 2016, capital losses recognized during the period November 1, 2014 to May 31, 2015 in the amount of:
| Fund | | Amount | |
| Managed Risk 100 Fund | | $ | 15,598,738 | |
| Annual Report | May 31, 2015 | 61 |
| Stadion Investment Trust | Notes to Financial Statements |
| | May 31, 2015 |
The Funds elect to defer to the tax year ending May 31, 2016, late year ordinary losses recognized in the amount of:
| Fund | | Amount | |
| Tactical Growth Fund | | $ | 387,815 | |
| Tactical Defensive Fund | | | 310,655 | |
| Defensive International Fund | | | 111,097 | |
| Managed Risk 100 Fund | | | 807,144 | |
| | | | | |
As of and during the year ended May 31, 2015, the Funds did not have a liability for any unrecognized tax benefits. The Funds file U.S. federal, state, and local tax returns as required. The Funds’ tax returns are subject to examination by the relevant tax authorities until expiration of the applicable statute of limitations which is generally three years after the filing of the tax return. Tax returns for open years have incorporated no uncertain tax positions that require a provision for income taxes.
| 5. TRANSACTIONS WITH AFFILIATES |
Investment Advisory Agreements
Each Fund’s investments are managed by the Advisor under the terms of an Investment Advisory Agreement (the “Advisory Agreements”). Under the Advisory Agreements, each Fund excluding the Alternative Income Fund has agreed to pay the Advisor an investment advisory fee at an annual rate of 1.25% of its average daily net assets up to $150 million and 1.00% of such assets over $150 million. Effective April 30, 2015, The Alternative Income Fund has agreed to pay the Advisor an investment advisory fee at an annual rate of 0.85% of its average daily net assets. Prior to April 30, 2015, the Alternative Income Fund paid the Advisor an investment advisory fee at the annual rate of 0.65% of its average daily net assets.
The Advisor has entered into an Expense Limitation Agreement with respect to each Fund, excluding the Tactical Growth Fund and the Alternative Income Fund, under which it has agreed to waive its fees and to assume other expenses of the Funds, if necessary, in an amount that limits the annual operating expenses of Class A shares, Class C shares and Class I shares of the Funds (exclusive of interest, taxes, brokerage commissions, extraordinary expenses, Acquired Fund Fees and Expenses and payments, if any, under the Rule 12b‐1 Plan) to not more than 1.70% of the average daily net assets allocable to each Class until October 1, 2016. Effective January 1, 2015, the Advisor has entered into an Expense Limitation Agreement with the Tactical Growth Fund under which it has agreed to waive its fees and to assume other expenses of the Fund, if necessary, in an amount that limits the annual operating expenses of Class A shares, Class C and Class I shares of the Fund (exclusive of interest, taxes, brokerage commissions, extraordinary expenses, Acquired Fund Fees and Expenses and payments, if any, under the Rule 12b‐1 Plan) to not more than 1.30% of the average daily net assets allocable to each Class until October 1, 2016. Prior to January 1, 2015, the Advisor had entered into an Expense Limitation Agreement with the Tactical Growth Fund under which it had agreed to waive its fees and to assume other expenses of the Fund, if necessary, in an amount that limited the annual operating expenses of Class A shares, Class C and Class I shares of the Fund (exclusive of interest, taxes, brokerage commissions, extraordinary expenses, Acquired Fund Fees and Expenses and payments, if any, under the Rule 12b‐1 Plan) to not more than 1.70% of the average daily net assets allocable to each Class. The Advisor has entered into an Expense Limitation Agreement with the Alternative Income Fund under which it has agreed to waive its fees and to assume other expenses of the Fund, if necessary, in an amount that limits the annual operating expenses of Class A shares and Class I shares of the Fund (exclusive of interest, taxes, brokerage commissions, extraordinary expenses, Acquired Fund Fees and Expenses and payments, if any, under the Rule 12b‐1 Plan) to not more than 1.15% of the average daily net assets allocable to each Class until October 1, 2016. Accordingly, during the year ended May 31, 2015, the Advisor waived fees and reimbursed expenses as follows:
| | | Tactical Growth Fund | | | Defensive
International
Fund | | | Alternative
Income Fund | |
| Total waivers and reimbursements | | $ | 144,690 | | | $ | 73,781 | | | $ | 99,416 | |
During the year ended May 31, 2015, there were no advisory fees waived or expenses reimbursed by the Advisor for Tactical Defensive Fund, Trilogy Alternative Return Fund, and Managed Risk 100 Fund and It is expected that the Expense Limitation Agreements will continue from year-to-year, provided such continuance is approved by the Trustees.
If the Adviser so requests, any Tactical Growth Fund operating expenses waived or reimbursed by the Adviser pursuant to the Agreement that had the effect of reducing Fund Operating Expenses from 1.70% (or lower) to 1.30% within the most recent three fiscal years prior to the request shall be repaid to the Adviser by the Fund; provided, however, that the total annual Fund Operating Expenses for the applicable following year, after giving effect to the repayment, shall not exceed 1.30% of the average daily net assets of the Fund (or any lower expense limitation or limitations to which the parties may otherwise agree).
If the Advisor so requests, any Alternative Income Fund operating expense waived or reimbursed by the Advisor pursuant to the Advisory Agreement shall be repaid to the Advisor by the Fund in the first, second, and third fiscal years following the fiscal year in which any such reimbursement or waiver occurs.
As of May 31, 2015, the balance of recoupable expenses for the Tactical Growth Fund and the Alternative Income Fund was as follows:
| Fund | | 2016 | | | 2017 | | | 2018 | | | Total | |
| Tactical Growth Fund | | $ | – | | | $ | – | | | $ | 144,690 | | | $ | 144,690 | |
| Alternative Income Fund | | $ | 53,994 | | | $ | 64,957 | | | $ | 99,416 | | | $ | 218,367 | |
| Stadion Investment Trust | Notes to Financial Statements |
| | May 31, 2015 |
The Chief Compliance Officer of the Trust is an employee of the Advisor. Effective July 15, 2013, the Trust reimburses the Advisor 50% of the employee’s annual base salary for the services provided by the Chief Compliance Officer of the Trust. Prior to July 15, 2013, the Trust reimbursed the Advisor $82,500 annually for services provided by the Chief Compliance Officer of the Trust. Each Fund bears a proportionate share of this fee based on an allocation approved by the Trustees.
Certain Trustees and officers of the Trust are also officers of the Advisor.
Fund Accounting and Administration Agreement
ALPS Fund Services, Inc. (“ALPS” and the “Administrator”) provides administrative, fund accounting and other services to the Funds under the Administration, Bookkeeping and Pricing Services Agreement with the Trust.
Transfer Agent and Shareholder Services Agreement
ALPS serves as transfer, dividend paying and shareholder servicing agent for the Funds (the “Transfer Agent”) under a Transfer Agency and Services Agreement with the Trust.
Distribution Plan
The Trust has adopted plans of distribution (the “Plans”) pursuant to Rule 12b-1 under the 1940 Act that permit Class A and Class C shares of each Fund to directly incur or reimburse the Funds’ principal underwriter for certain expenses related to the distribution of its shares. The annual limitation for payment of expenses pursuant to the Plans is 0.25% of each Fund’s average daily net assets attributable to Class A shares and 1.00% of each Fund’s average daily net assets attributable to Class C shares. The Trust has not adopted a plan of distribution with respect to Class I shares. The expenses of the Plans are reflected as distribution fees in the Statement of Operations of the Funds.
Distribution Agreement
ALPS Distributors, Inc. (“ADI” or the “Distributor”) acts as the distributor of the Funds’ shares pursuant to a Distribution Agreement with the Trust. Under the terms of a Distribution Agreement with the Trust, the Distributor provides distribution services to the Trust and serves as principal underwriter to the Funds. ADI receives no compensation from the Funds.
| 6. DERIVATIVE TRANSACTIONS |
Derivative Instruments and Hedging Activities: The following discloses the Funds' use of derivative instruments and hedging activities.
The Funds’ investment objectives not only permit the Funds to purchase investment securities, they also allow certain Funds to enter into various types of derivative contracts such as purchased and written options. In doing so, the Funds will employ strategies in differing combinations to permit them to increase, decrease, or change the level or types of exposure to market factors. Central to those strategies are features inherent to derivatives that make them more attractive for this purpose than equity or debt securities; they require little or no initial cash investment, they can focus exposure on only certain selected risk factors, and they may not require the ultimate receipt or delivery of the underlying security (or securities) to the contract. This may allow the Funds to pursue their objectives more quickly and efficiently than if they were to make direct purchases or sales of securities capable of effecting a similar response to market factors.
Market Risk Factors: In pursuit of their investment objectives, the Funds may seek to use derivatives to increase or decrease their exposure to the following market risk factors:
Equity Risk: Equity risk relates to the change in value of equity securities as they relate to increases or decreases in the general market.
Interest Rate Risk: Interest rate risk refers to the fluctuations in value of fixed-income securities resulting from the inverse relationship between price and yield. For example, an increase in general interest rates will tend to reduce market value of fixed income investments and a decline in general interest rates will tend to increase the value of such investments. In addition, debt securities with longer maturities, which tend to have higher yields, are subject to potentially greater fluctuations in value from changes in interest rates than obligations with shorter maturities.
Risk of Investing in Derivatives: The Funds’ use of derivatives can result in losses due to unanticipated changes in the market risk factors and the overall market.
Derivatives may have little or no initial cash investment relative to their market value exposure and therefore can produce significant gains or losses in excess of their cost. This use of embedded leverage allows the Funds to increase their market value exposure relative to their net assets and can substantially increase the volatility of the Funds’ performance.
Additional associated risks from investing in derivatives also exist and potentially could have significant effects on the valuation of the derivative and the Funds. Typically, the associated risks are not the risks that the Funds are attempting to increase or decrease exposure to, per their investment objectives, but are the additional risks from investing in derivatives.
Examples of these associated risks are liquidity risk, which is the risk that the Funds will not be able to sell the derivative in the open market in a timely manner, and counterparty credit risk, which is the risk that the counterparty will not fulfill its obligation to the Funds.
| | |
| Annual Report | May 31, 2015 | 63 |
| Stadion Investment Trust | Notes to Financial Statements |
| | May 31, 2015 |
Futures: Certain Funds may invest in futures contracts in accordance with their investment objectives. Each Fund does so for a variety of reasons, including for cash management, hedging or non-hedging purposes in an attempt to achieve investment returns consistent with the Fund’s investment objective. A futures contract provides for the future sale by one party and purchase by another party of a specified quantity of the security or other financial instrument at a specified price and time. A futures contract on an index is an agreement pursuant to which two parties agree to take or make delivery of an amount of cash equal to the difference between the value of the index at the close of the last trading day of the contract and the price at which the index contract was originally written. Futures transactions may result in losses in excess of the amount invested in the futures contract. There can be no guarantee that there will be a correlation between price movements in the hedging vehicle and in the portfolio securities being hedged. An incorrect correlation could result in a loss on both the hedged securities in a Fund and the hedging vehicle so that the portfolio return might have been greater had hedging not been attempted. There can be no assurance that a liquid market will exist at a time when a Fund seeks to close out a futures contract or a futures option position. Lack of a liquid market for any reason may prevent a Fund from liquidating an unfavorable position, and the Fund would remain obligated to meet margin requirements until the position is closed. In addition, a Fund could be exposed to risk if the counterparties to the contracts are unable to meet the terms of their contracts. With exchange-traded futures, there is minimal counterparty credit risk to the Funds since futures are exchange-traded and the exchange’s clearinghouse, as counterparty to all exchange-traded futures, guarantees the futures against default.
When a purchase or sale of a futures contract is made by a Fund, the Fund is required to deposit with its custodian (or broker, if legally permitted) a specified amount of liquid assets (“initial margin”). The margin required for a futures contract is set by the exchange on which the contract is traded and may be modified during the term of the contract. The initial margin is in the nature of a performance bond or good faith deposit on the futures contract that is returned to a Fund upon termination of the contract, assuming all contractual obligations have been satisfied. Each day a Fund may pay or receive cash, called “variation margin,” equal to the daily change in value of the futures contract. Such payments or receipts are recorded for financial statement purposes as unrealized gains or losses by a Fund. Variation margin does not represent a borrowing or loan by a Fund but is instead a settlement between a Fund and the broker of the amount one would owe the other if the futures contract expired. When the contract is closed, a Fund records a realized gain or loss equal to the difference between the value of the contract at the time it was opened and the value at the time it was closed.
Option Writing/Purchasing: Certain Funds may write or purchase option contracts to adjust risk and return of their overall investment positions. When a Fund writes or purchases an option, an amount equal to the premium received or paid by the Fund is recorded as a liability or an asset and is subsequently adjusted to the current market value of the option written or purchased. Premiums received or paid from writing or purchasing options that expire unexercised are treated by the Fund on the expiration date as realized gains or losses. The difference between the premium and the amount paid or received on effecting a closing purchase or sale transaction, including brokerage commissions, is also treated as a realized gain or loss. If an option is exercised, the premium paid or received is added to the cost of the purchase or proceeds from the sale in determining whether the Fund has realized a gain or loss on investment transactions. Risks from entering into option transactions arise from the potential inability of counterparties to meet the terms of the contracts, the potential inability to enter into closing transactions because of an illiquid secondary market and from unexpected movements in security values.
Transactions in option contracts written by Trilogy Alternative Return Fund and Alternative Income Fund during the year ended May 31, 2015, were as follows:
| | | Trilogy Alternative Return Fund | |
| | | Written Calls | |
| | | Contracts | | | Premiums | |
| Options outstanding at beginning of year | | | 3,330 | | | $ | 2,112,164 | |
| Options written | | | 7,770 | | | | 16,083,919 | |
| Options closed | | | (6,157 | ) | | | (13,954,801 | ) |
| Options exercised | | | (1,778 | ) | | | (2,205,923 | ) |
| Options expired | | | (2,685 | ) | | | (278,505 | ) |
| Options outstanding at end of year | | | 480 | | | $ | 1,756,854 | |
| | | | | | | | | |
| | | Written Puts | |
| | | Contracts | | | Premiums | |
| Options outstanding at beginning of year | | | 1,000 | | | $ | 3,727,498 | |
| Options written | | | 7,805 | | | | 15,495,588 | |
| Options closed | | | (4,655 | ) | | | (11,788,614 | ) |
| Options exercised | | | (100 | ) | | | (176,438 | ) |
| Options expired | | | (2,900 | ) | | | (1,761,235 | ) |
| Options outstanding at end of year | | | 1,150 | | | $ | 5,496,799 | |
| | | Alternative Income Fund | |
| | | Written Calls | |
| | | Contracts | | | Premiums | |
| Options outstanding at beginning of year | | – | | | $ | – | |
| Options written | | | 80 | | | | 212,198 | |
| Options closed | | | (31 | ) | | | (56,044 | ) |
| Options exercised | | – | | | | – | |
| Options expired | | – | | | | – | |
| Options outstanding at end of year | | | 49 | | | $ | 156,154 | |
| | | | | | | | | |
| | | Written Puts | |
| | | Contracts | | | Premiums | |
| Options outstanding at beginning of year | | | – | | | $ | – | |
| Options written | | | 25 | | | | 92,436 | |
| Options closed | | | (17 | ) | | | (52,771 | ) |
| Options exercised | | – | | | – | |
| Options expired | | – | | | – | |
| Options outstanding at end of year | | | 8 | | | $ | 39,665 | |
| Stadion Investment Trust | Notes to Financial Statements |
| | May 31, 2015 |
A portion of Trilogy Alternative Return Fund’s and Alternative Income Fund’s securities are pledged as collateral for open option contracts.
The locations in the Statements of Assets and Liabilities of Trilogy Alternative Return Fund’s and Alternative Income Fund’s derivative positions are as follows:
| Risk Exposure | | Statement
of Assets
and
Liabilities
Location | | Fair Value of
Asset
Derivatives | | Statement
of Assets
and
Liabilities
Location | | Fair Value of
Liability
Derivatives | |
| Trilogy Alternative Return Fund | |
| Equity Contracts (Purchased Options/ Written Options) | | Investments in securities: At value | | $ | 6,651,525 | | Written Options at value | | $ | 3,474,125 | |
| | | | | $ | 6,651,525 | | | | $ | 3,474,125 | |
| Risk Exposure | | Statement
of Assets
and
Liabilities
Location | | Fair Value
of Asset
Derivatives | | Statement
of Assets
and
Liabilities
Location | | Fair Value
of Liability
Derivatives | |
| Alternative Income Fund | |
| Equity Contracts (Purchased Options/ Written Options) | | Investments in securities: At value | | $ | 229,705 | | Written Options at value | | $ | 189,865 | |
| | | | | $ | 229,705 | | | | $ | 189,865 | |
| | | | | | | | | | | | |
For the Trilogy Alternative Return Fund the average option contracts purchased and written during the year ended May 31, 2015, were 9,405 contracts, and 2,621 contracts, respectively. For the Alternative Income Fund the average option contracts purchased and written during the year ended May 31, 2015, were 58 contracts, and 11 contracts, respectively.
For the Defensive International Fund the average notional value of futures contracts during the year ended May 31, 2015, was $303,606.
Defensive International Fund’s, Trilogy Alternative Return Fund’s and Alternative Income Fund’s transactions in derivative instruments during the year ended May 31, 2015, are recorded in the following locations in the Statements of Operations:
| | | |
| Risk Exposure | Statement of
Operations Location | | Realized
Gain/(Loss) on
Derivatives
Recognized
in Income | | | Change in
Unrealized
Gain/(Loss) on
Derivatives
Recognized in
Income | |
| Defensive International Fund | |
| Equity Contracts (Purchased Options) | Net realized gains (losses) from investments/Net change in unrealized depreciation on investments | | $ | (22,414 | ) | | $ | – | |
| Equity Contracts (futures contracts) | Net realized loss on futures contracts/Net change in unrealized appreciation (depreciation) on futures contracts | | | (317,362 | ) | | $ | – | |
| Total | | | $ | (339,776 | ) | | $ | – | |
| Risk Exposure | Statement of
Operations Location | | Realized Gain/(Loss) on
Derivatives Recognized
in Income | | | Change in Unrealized
Gain/(Loss) on Derivatives
Recognized in Income | |
| Trilogy Alternative Return Fund | |
| Equity Contracts (Purchased Options) | Net realized gains from investments/Net change in unrealized appreciation (depreciation) on investments | | $ | (3,469,342 | ) | | $ | (1,205,958 | ) |
| Equity Contracts (Written Options) | Net realized gains (losses) from written option contracts/Net change in unrealized appreciation on written option contracts | | | (98,070 | ) | | | 2,901,041 | |
| Total | | | $ | (3,567,412 | ) | | $ | 1,695,083 | |
| | |
| Annual Report | May 31, 2015 | 65 |
| Stadion Investment Trust | Notes to Financial Statements |
| | May 31, 2015 |
| | | |
| Risk Exposure | Statement of
Operations Location | | Realized Gain/(Loss) on
Derivatives Recognized
in Income | | | Change in Unrealized
Gain/(Loss) on Derivatives
Recognized in Income | |
| Alternative Income Fund | |
Equity Contracts
(Purchased Options) | Net realized gains from investments/Net change in unrealized appreciation (depreciation) on investments | | $ | – | | | $ | (64,934 | ) |
Equity Contracts
(Written Options) | Net realized gains (losses) from written option contracts/Net change in unrealized appreciation on written option contracts | | | 29,988 | | | | 5,954 | |
| Total | | | $ | 29,988 | | | $ | (58,980 | ) |
| | | | | | | | | | |
Tactical Growth Fund, Tactical Defensive Fund, and Managed Risk 100 Fund had no transactions in derivative instruments during the year ended May 31, 2015.
| 7. CAPITAL SHARE TRANSACTIONS |
Proceeds and payments on capital shares as shown in the Statements of Changes in Net Assets are the result of the following capital share transactions for the years shown:
| | | For the Year
Ended
May 31, 2015 | | | For the Year
Ended
May 31, 2014 | |
| Tactical Growth Fund - Class A | |
| Shares sold | | | 5,775,419 | | | | 1,933,808 | |
| Shares issued in reinvestment of distributions to shareholders | | | 164,990 | | | | 163,715 | |
| Shares redeemed | | | (1,910,571 | ) | | | (760,630 | ) |
| Net increase in shares outstanding | | | 4,029,838 | | | | 1,336,893 | |
| Shares outstanding beginning of year | | | 1,672,415 | | | | 335,522 | |
| Shares outstanding end of year | | | 5,702,253 | | | | 1,672,415 | |
| | | | | | | | | |
| Tactical Growth Fund - Class C | |
| Shares sold | | | 3,229,112 | | | | 123,069 | |
| Shares issued in reinvestment of distributions to shareholders | | | 36,694 | | | | 517 | |
| Shares redeemed | | | (29,898 | ) | | | (2,562 | ) |
| Net increase in shares outstanding | | | 3,235,908 | | | | 121,024 | |
| Shares outstanding beginning of year | | | 121,124 | | | | 100 | |
| Shares outstanding end of year | | | 3,357,032 | | | | 121,124 | |
| | | | | | | | | |
| Tactical Growth Fund - Class I | |
| Shares sold | | | 8,297,446 | | | | 1,252,917 | |
| Shares issued in reinvestment of distributions to shareholders | | | 241,954 | | | | 294,179 | |
| Shares redeemed | | | (1,957,626 | ) | | | (1,129,459 | ) |
| Net increase in shares outstanding | | | 6,581,774 | | | | 417,637 | |
| Shares outstanding beginning of year | | | 2,765,879 | | | | 2,348,242 | |
| Shares outstanding end of year | | | 9,347,653 | | | | 2,765,879 | |
| Stadion Investment Trust | Notes to Financial Statements |
| | May 31, 2015 |
| | | For the Year
Ended
May 31, 2015 | | | For the Year
Ended
May 31, 2014 | |
| Tactical Defensive Fund - Class A | |
| Shares sold | | | 1,809,445 | | | | 1,475,341 | |
| Shares issued in reinvestment of distributions to shareholders | | | 3,800 | | | | 228,032 | |
| Shares redeemed | | | (3,077,080 | ) | | | (835,689 | ) |
| Net increase/(decrease) in shares outstanding | | | (1,263,835 | ) | | | 867,684 | |
| Shares outstanding beginning of year | | | 3,688,532 | | | | 2,820,848 | |
| Shares outstanding end of year | | | 2,424,697 | | | | 3,688,532 | |
| | | | | | | | | |
| Tactical Defensive Fund - Class C | |
| Shares sold | | | 691,930 | | | | 397,174 | |
| Shares issued in reinvestment of distributions to shareholders | | | 888 | | | | 36,405 | |
| Shares redeemed | | | (326,022 | ) | | | (174,516 | ) |
| Net increase in shares outstanding | | | 366,796 | | | | 259,063 | |
| Shares outstanding beginning of year | | | 693,610 | | | | 434,547 | |
| Shares outstanding end of year | | | 1,060,406 | | | | 693,610 | |
| | | | | | | | | |
| Tactical Defensive Fund - Class I | |
| Shares sold | | | 2,004,694 | | | | 505,296 | |
| Shares issued in reinvestment of distributions to shareholders | | | 763 | | | | 36,753 | |
| Shares redeemed | | | (541,618 | ) | | | (330,108 | ) |
| Net increase in shares outstanding | | | 1,463,839 | | | | 211,941 | |
| Shares outstanding beginning of year | | | 621,606 | | | | 409,665 | |
| Shares outstanding end of year | | | 2,085,445 | | | | 621,606 | |
| | | For the Year
Ended
May 31, 2015 | | | For the Year
Ended
May 31, 2014 | |
| Defensive International Fund - Class A | |
| Shares sold | | | 748,106 | | | | 836,088 | |
| Shares issued in reinvestment of distributions to shareholders | | | 30,024 | | | | 42,129 | |
| Shares redeemed | | | (1,181,742 | ) | | | (659,260 | ) |
| Net increase/(decrease) in shares outstanding | | | (403,612 | ) | | | 218,957 | |
| Shares outstanding beginning of year | | | 1,569,351 | | | | 1,350,394 | |
| Shares outstanding end of year | | | 1,165,739 | | | | 1,569,351 | |
| | | | | | | | | |
| Defensive International Fund - Class C | |
| Shares sold | | | 7,373 | | | | 14,954 | |
| Shares issued in reinvestment of distributions to shareholders | | | 246 | | | | 466 | |
| Shares redeemed | | | (6,707 | ) | | | (6,600 | ) |
| Net increase in shares outstanding | | | 912 | | | | 8,820 | |
| Shares outstanding beginning of year | | | 15,167 | | | | 6,347 | |
| Shares outstanding end of year | | | 16,079 | | | | 15,167 | |
| | | | | | | | | |
| Defensive International Fund - Class I | |
| Shares sold | | | 441,850 | | | | 883,368 | |
| Shares issued in reinvestment of distributions to shareholders | | | 2,559 | | | | 24,268 | |
| Shares redeemed | | | (1,004,868 | ) | | | (536,678 | ) |
| Net increase/(decrease) in shares outstanding | | | (560,459 | ) | | | 370,958 | |
| Shares outstanding beginning of year | | | 953,866 | | | | 582,908 | |
| Shares outstanding end of year | | | 393,407 | | | | 953,866 | |
| | |
| Annual Report | May 31, 2015 | 67 |
| Stadion Investment Trust | Notes to Financial Statements |
| | May 31, 2015 |
| | | For the Year
Ended
May 31, 2015 | | | For the Year
Ended
May 31, 2014 | |
| Trilogy Alternative Return Fund - Class A | |
| Shares sold | | | 1,181,583 | | | | 4,647,749 | |
| Shares issued in reinvestment of distributions to shareholders | | | 21,841 | | | | 20,542 | |
| Shares redeemed | | | (5,841,258 | ) | | | (2,914,093 | ) |
| Net increase/(decrease) in shares outstanding | | | (4,637,834 | ) | | | 1,754,198 | |
| Shares outstanding beginning of year | | | 8,380,675 | | | | 6,626,477 | |
| Shares outstanding end of year | | | 3,742,841 | | | | 8,380,675 | |
| | | | | | | | | |
| Trilogy Alternative Return Fund - Class C | |
| Shares sold | | | 248,815 | | | | 1,246,459 | |
| Shares issued in reinvestment of distributions to shareholders | | | 1,345 | | | | – | |
| Shares redeemed | | | (1,231,760 | ) | | | (272,302 | ) |
| Net increase/(decrease) in shares outstanding | | | (981,600 | ) | | | 974,157 | |
| Shares outstanding beginning of year | | | 2,092,545 | | | | 1,118,388 | |
| Shares outstanding end of year | | | 1,110,945 | | | | 2,092,545 | |
| | | | | | | | | |
| Trilogy Alternative Return Fund - Class I | |
| Shares sold | | | 4,224,224 | | | | 5,132,139 | |
| Shares issued in reinvestment of distributions to shareholders | | | 15,956 | | | | 12,393 | |
| Shares redeemed | | | (3,693,673 | ) | | | (2,550,131 | ) |
| Net increase in shares outstanding | | | 546,507 | | | | 2,594,401 | |
| Shares outstanding beginning of year | | | 4,413,742 | | | | 1,819,341 | |
| Shares outstanding end of year | | | 4,960,249 | | | | 4,413,742 | |
| | | For the Year
Ended
May 31, 2015 | | | For the Year
Ended
May 31, 2014 | |
| Alternative Income Fund - Class A | |
| Shares sold | | | 582,020 | | | | 283,916 | |
| Shares issued in reinvestment of distributions to shareholders | | | 3,404 | | | | 135 | |
| Shares redeemed | | | (256,519 | ) | | | (243,456 | ) |
| Net increase in shares outstanding | | | 328,905 | | | | 40,595 | |
| Shares outstanding beginning of year | | | 208,913 | | | | 168,318 | |
| Shares outstanding end of year | | | 537,818 | | | | 208,913 | |
| | | | | | | | | |
| Alternative Income Fund - Class I | |
| Shares sold | | | 31,298 | | | | 368,291 | |
| Shares issued in reinvestment of distributions to shareholders | | | 1,122 | | | | 15 | |
| Shares redeemed | | | (398,242 | ) | | | (109,607 | ) |
| Net increase/(decrease) in shares outstanding | | | (365,822 | ) | | | 258,699 | |
| Shares outstanding beginning of year | | | 412,057 | | | | 153,358 | |
| Shares outstanding end of year | | | 46,235 | | | | 412,057 | |
| Stadion Investment Trust | Notes to Financial Statements |
| | May 31, 2015 |
| | | For the Year
Ended
May 31, 2015 | | | For the Year
Ended
May 31, 2014 | |
| Managed Risk 100 Fund - Class A | |
| Shares sold | | | 1,478,533 | | | | 9,163,944 | |
| Shares redeemed | | | (17,833,753 | ) | | | (18,110,186 | ) |
| Net decrease in shares outstanding | | | (16,355,220 | ) | | | (8,946,242 | ) |
| Shares outstanding beginning of year | | | 26,961,997 | | | | 35,908,239 | |
| Shares outstanding end of year | | | 10,606,777 | | | | 26,961,997 | |
| | | | | | | | | |
| Managed Risk 100 Fund - Class C | |
| Shares sold | | | 245,461 | | | | 1,211,126 | |
| Shares redeemed | | | (4,497,097 | ) | | | (5,629,938 | ) |
| Net decrease in shares outstanding | | | (4,251,636 | ) | | | (4,418,812 | ) |
| Shares outstanding beginning of year | | | 9,687,886 | | | | 14,106,698 | |
| Shares outstanding end of year | | | 5,436,250 | | | | 9,687,886 | |
| | | | | | | | | |
| Managed Risk 100 Fund - Class I | |
| Shares sold | | | 4,389,138 | | | | 5,167,590 | |
| Shares redeemed | | | (8,991,950 | ) | | | (7,535,192 | ) |
| Net decrease in shares outstanding | | | (4,602,812 | ) | | | (2,367,602 | ) |
| Shares outstanding beginning of year | | | 9,881,589 | | | | 12,249,191 | |
| Shares outstanding end of year | | | 5,278,777 | | | | 9,881,589 | |
| | | | | | | | | |
| 8. COMMITMENTS AND CONTINGENCIES |
The Funds indemnify the Trust’s officers and Trustees for certain liabilities that might arise from their performance of their duties to the Funds. Additionally, in the normal course of business, the Funds enter into contracts that contain a variety of representations and warranties and that provide general indemnifications. The Funds’ maximum exposure under these arrangements is unknown, as this would involve future claims that may be made against the Funds that have not yet occurred. However, based on experience, the Funds expect the risk of loss to be remote.
| 9. UNDERLYING INVESTMENT IN OTHER INVESTMENT COMPANIES |
The Funds currently seek to achieve their investment objectives by investing a portion of their assets in Morgan Stanley Institutional Liquidity Fund Government Portfolio (the “Portfolio”), a registered open-end management investment company organized as a Delaware statutory trust. The Funds may redeem their investments from the Portfolio at any time if the Advisor determines that it is in the best interest of the Funds and their shareholders to do so. The latest financial statements for the Portfolio can be found at www.sec.gov.
The performance of the Funds may be directly affected by the performance of the Portfolio. As of May 31, 2014, the percentage of net assets invested in the Portfolio was 3.52%, 12.33%, 45.61%, 2.92%, 6.51% and 21.14% for Tactical Growth Fund, Tactical Defensive Fund, Defensive International Fund, Trilogy Alternative Return Fund, Alternative Income Fund and Managed Risk 100 Fund, respectively.
The Managed Risk 100 Fund currently seeks to achieve its investment objectives by investing a portion of its assets in the iShares® US Technology ETF (the “iShares® ETF”), and the SPDR® Dow Jones® Industrial Average ETF Trust (the “SPDR® ETF”) (and collectively, the “ETFs”). The iShares® ETF is a registered open-end management investment company organized as a Delaware statutory trust and the SPDR® ETF is a unit investment trust created under the laws of the State of New York and registered under the Investment Company Act of 1940, as amended. The Managed Risk 100 Fund may redeem its investments from the ETFs at any time if the Advisor determines that it is in the best interest of the Managed Risk 100 Fund and its shareholders to do so. The latest financial statements for the ETFs can be found at www.sec.gov.
The performance of the Managed Risk 100 Fund may be directly affected by the performance of the ETFs. As of May 31, 2015, the percentage of net assets invested in the ETFs by the Managed Risk 100 Fund was 25.93% and 25.95% for the iShares® ETF and the SPDR® ETF, respectively.
The Funds are required to recognize in the financial statements the effects of all subsequent events that provide additional evidence about conditions that existed as of the date of the Statements of Assets and Liabilities. For non-recognized subsequent events that must be disclosed to keep the financial statements from being misleading, the Funds are required to disclose the nature of the event as well as an estimate of its financial effect, or a statement that such an estimate cannot be made. Management has evaluated subsequent events through the issuance of these financial statements and has noted no such events.
| | |
| Annual Report | May 31, 2015 | 69 |
Report of Independent
Stadion Investment Trust | Registered Public Accounting Firm |
To the Board of Trustees of Stadion Investment Trust
and the Shareholders of Stadion Tactical Growth Fund, Stadion Tactical Defensive Fund,
Stadion Defensive International Fund, Stadion Trilogy Alternative Return Fund,
Stadion Alternative Income Fund, and Stadion Managed Risk 100 Fund
We have audited the accompanying statements of assets and liabilities of the Stadion Tactical Growth Fund, Stadion Tactical Defensive Fund, Stadion Defensive International Fund, Stadion Trilogy Alternative Return Fund, Stadion Alternative Income Fund, and Stadion Managed Risk 100 Fund (the “Funds”), each a series of shares of beneficial interest in the Stadion Investment Trust, including the schedules of investments, as of May 31, 2015, and the related statements of operations for the year then ended, the statements of changes in net assets for each of the years in the two-year period then ended and the financial highlights for each of the years and periods in the five-year period then ended (except as noted below for the Stadion Tactical Growth Fund). These financial statements and financial highlights are the responsibility of the Funds’ management. Our responsibility is to express an opinion on these financial statements and financial highlights based on our audits. The financial highlights for the Stadion Tactical Growth Fund for each of the years in the two-year period ended April 30, 2012 were audited by other auditors whose report dated June 25, 2012, expressed an unqualified opinion on such financial highlights.
We conducted our audits in accordance with the standards of the Public Company Accounting Oversight Board (United States). Those standards require that we plan and perform the audits to obtain reasonable assurance about whether the financial statements and financial highlights are free of material misstatement. An audit includes examining, on a test basis, evidence supporting the amounts and disclosures in the financial statements. Our procedures included confirmation of securities owned as of May 31, 2015 by correspondence with the custodian and brokers. An audit also includes assessing the accounting principles used and significant estimates made by management, as well as evaluating the overall financial statement presentation. We believe that our audits provide a reasonable basis for our opinion.
In our opinion, the financial statements and financial highlights referred to above present fairly, in all material respects, the financial position of the Stadion Tactical Growth Fund, Stadion Tactical Defensive Fund, Stadion Defensive International Fund, Stadion Trilogy Alternative Return Fund, Stadion Alternative Income Fund, and Stadion Managed Risk 100 Fund as of May 31, 2015, and the results of their operations for the year then ended, the changes in their net assets for each of the years in the two-year period then ended and their financial highlights for each of the years and periods in the five-year period then ended, in conformity with accounting principles generally accepted in the United States of America.
BBD, LLP
Philadelphia, Pennsylvania
July 28, 2015
Stadion Investment Trust | Additional Information |
May 31, 2015 (Unaudited)
The Trust files a complete listing of portfolio holdings of the Funds with the SEC as of the end of the first and third quarters of each fiscal year on Form N-Q. The filings are available free of charge, upon request, by calling 1-866-383-7636. Furthermore, you may obtain a copy of these filings on the SEC’s website at http://www.sec.gov. The Trust’s Forms N-Q may also be reviewed and copied at the SEC’s Public Reference Room in Washington, DC, and information on the operation of the Public Reference Room may be obtained by calling (800) SEC-0330.
A description of the policies and procedures that the Funds use to determine how to vote proxies relating to portfolio securities is available without charge upon request by calling toll-free 1-866-383-7636, or on the SEC’s website at http://www.sec.gov. Information regarding how the Funds voted proxies relating to portfolio securities during the most recent 12-month period ended June 30 is also available without charge upon request by calling toll-free 1-866-383-7636, or on the SEC’s website at http://www.sec.gov.
FEDERAL TAX INFORMATION (UNAUDITED) |
Of the ordinary income (including short-term capital gain) distributions made by the Funds during the year ended December 31, 2014, the percentages qualifying for the dividend received deduction available to corporate shareholders are as follows:
| Fund Name | Percentage |
| Stadion Trilogy Alternative Return Fund | 100.00% |
For the year ended December 31, 2014, the following percentages of total ordinary dividends paid by the Funds are qualifying dividends which may be subject to a maximum tax rate of 15%, as provided for by the Jobs and Growth Tax Relief Act of 2003. The percentages were as follows:
| Fund Name | Percentage |
| Stadion Trilogy Alternative Return Fund | 100.00% |
In early 2015, if applicable, shareholders of record received this information for the distribution paid to them by the Funds during the calendar year 2014 via Form 1099. The Funds will notify shareholders in early 2016 of amounts paid to them by the Funds, if any, during the calendar year 2015.
Pursuant to Section 852(b)(3) of the Internal Revenue Code, Stadion Tactical Growth Fund, Stadion Tactical Defensive Fund and Stadion Defensive International Fund designated $1,679,398, $71,758 and $76,006, respectively, as long‐term capital gain dividends.
| | |
| Annual Report | May 31, 2015 | 71 |
Stadion Investment Trust | Board of Trustees and Executive Officers |
May 31, 2015 (Unaudited)
STADION INVESTMENT TRUST |
| BOARD OF TRUSTEES AND EXECUTIVE OFFICERS |
The Board of Trustees has overall responsibility for management of the Trust’s affairs. The Trustees serve during the lifetime of Trust and until its termination, or until death, resignation, retirement or removal. The Trustees, in turn, elect the officers of the Trust to actively supervise its day-to-day operations. The officers have been elected for an annual term. The Fund’s SAI includes additional information about the Trustees and is available without charge upon request by calling 1-866-383-7636 or on the Fund’s website, www.stadionfunds.com. The Independent Trustees of the Trust received aggregate compensation of $72,500 during the fiscal year ended May 31, 2015 for their services to the Funds and Trust. Interested Trustees and Officers did not receive compensation from the Funds for the services to the Funds and the Trust. The following are the Trustees and executive officers of the Trust:
| Name and Age | Position(s) held with Trust | Length of Time Served | Principal Occupation(s) During Past 5 Years | Number of Funds in Fund Complex* Overseen by Trustee | Other Directorships Held by Trustee During the Past 5 Years |
| INDEPENDENT TRUSTEES |
| James M. Baker (age 63) | Trustee | Since June 2003 | Mr. Baker has been the President of Baker & Lassiter, Inc. (real estate development and management) since 1994. | 6 | Mr. Baker serves as a director of Resurgens Bank, a closely held state chartered bank. |
| Norman A. McLean (age 60) | Trustee | Since June 2003 | Mr. McLean has been the Director of Marketing/Public Relations for St. Mary’s Health Care System (health care) since September 2005. | 6 | None |
| Ronald C. Baum (age 73) | Trustee | Since July 2011 | Mr. Baum was a Managing Partner for the Atlanta office of Grant Thornton LLP (public accounting firm) from 1987 through 2002. | 6 | None |
| INTERESTED TRUSTEE** |
| Gregory L. Morris (age 67) | Trustee and Chairman | Since June 2007 | Mr. Morris has been a portfolio manager of the Advisor and its predecessor firm (Stadion Money Management, Inc.) since November 2004 and is a member of the Advisor’s investment committee. | 6 | None |
| |
| OTHER EXECUTIVE OFFICERS |
| Judson P. Doherty (age 45) | Chief Executive Officer and President (Principal Executive Officer) | Since June 2006 | Mr. Doherty has been Chief Executive Officer since April 2015 and President of the Adviser and its predecessor firm (Stadion Money Management, Inc.) since 2007. He was Chief Financial Officer of Stadion Money Management, Inc. from 2001 until 2011 and Chief Compliance Officer of Stadion Money Management, Inc. and the Trust from 2004 to 2010. He is also a member of the Adviser’s investment committee. | n/a | None |
Stadion Investment Trust | Board of Trustees and Executive Officers |
May 31, 2015 (Unaudited)
| Name and Age | Position(s) held with Trust | Length of Time Served | Principal Occupation(s) During Past 5 Years | Number of Portfolios in Fund Complex* Overseen by Trustee | Other Directorships Held by Trustee During the Past 5 Years |
| Duane L. Bernt (age 45) | Treasurer (Principal Financial Officer) | Since October 2012 | Mr. Bernt has been the Chief Financial Officer of the Advisor since 2011. He is a member of the Advisor’s investment committee. Previously, he was a Senior Vice President of Lincoln Financial Group (a financial services firm) from 1998 to 2011. | n/a | n/a |
| Michael D. Isaac (age 39) | Chief Compliance Officer | Since April 2010 | Mr. Isaac has been the Chief Compliance Officer of the Advisor and its predecessor firm (Stadion Money Management, Inc.) since 2010. Previously, he was Chief Compliance Officer of J.P. Turner & Company LLC (a broker/dealer) from 2006 to 2010. | n/a | n/a |
Jennifer Welsh (age 38) 1290 Broadway, Suite 1100 Denver, Colorado 80203 | Secretary | Since April 2013 | Ms. Welsh, Vice President & Associate Counsel for ALPS Fund Services, Inc., joined ALPS in 2013. She is also Vice President and Associate Counsel of ALPS Distributors, Inc., ALPS Advisors, Inc. and ALPS Portfolio Solutions Distributors, Inc. Before joining ALPS, Ms. Welsh served as Associate General Counsel and Chief Compliance Officer of Boulder Investment Advisers LLC and Rocky Mountain Advisers, LLC, Chief Compliance Officer of Stewart Investment Advisers, Boulder Growth & Income Fund, Inc., Boulder Total Return Fund, Inc., The Denali Fund Inc. and First Opportunity Fund, Inc., and Associate General Counsel of Fund Administrative Services, LLC from 2010 to 2012. Ms. Welsh also was Associate Attorney at Davis, Graham & Stubbs, LLP from 2007 to 2010. | n/a | n/a |
Alan Gattis (age 35) 1290 Broadway, Suite 1100 Denver, Colorado 80203 | Assistant Treasurer | Since April 2013 | Mr. Gattis, Fund Controller for ALPS Fund Services, Inc., joined ALPS in 2011. Previously, he was an Audit Manager for Spicer Jeffries LLP (a public accounting firm) from 2009 until 2011. He was an auditor for PricewaterhouseCoopers LLP from 2004 until 2009. | n/a | n/a |
| * | The Fund Complex consists of the Stadion Tactical Growth Fund, Stadion Tactical Defensive Fund, Stadion Defensive International Fund, Stadion Trilogy Alternative Return Fund, Stadion Alternative Income Fund and Stadion Managed Risk 100 Fund. |
| ** | Gregory L. Morris is an Interested Trustee because he was an employee of the Adviser from November 2004 to December 2014. |
| | |
| Annual Report | May 31, 2015 | 73 |
Stadion Investment Trust | Approval of Investment Advisory Agreements |
May 31, 2015 (Unaudited)
APPROVAL OF CONTINUANCE OF INVESTMENT ADVISORY AGREEMENTS FOR STADION TACTICAL GROWTH FUND, STADION TACTICAL DEFENSIVE FUND, STADION DEFENSIVE INTERNATIONAL FUND, STADION TRILOGY ALTERNATIVE RETURN FUND, STADION TACTICAL INCOME FUND (now known as STADION ALTERNATIVE INCOME FUND) AND STADION MANAGED RISK 100 FUND
The Board of Trustees (the “Board”), including the Independent Trustees voting separately, has reviewed and approved the Investment Advisory Agreements (the “Advisory Agreements”) with the Advisor for the Stadion Tactical Growth Fund, Stadion Tactical Defensive Fund, Stadion Defensive International Fund, Stadion Trilogy Alternative Return Fund, Stadion Tactical Income Fund and Stadion Managed Risk 100 Fund (each a “Fund” and together, the “Funds”). Approval took place at an in‐person meeting held on February 2, 2015, at which all of the Trustees
were present.
In the course of their deliberations, the Board was advised by legal counsel and the Independent Trustees were advised by independent legal counsel. The Board received and reviewed a substantial amount of information provided by the Advisor in response to requests of the Board
and counsel.
In considering the approval of the Advisory Agreements and reaching their conclusions with respect thereto, the Board reviewed and analyzed various factors that they determined were relevant, including the factors described below:
| (i) | The nature, extent, and quality of the services provided by the Adviser. In this regard, the Board reviewed the services being provided by the Adviser to the Tactical Growth Fund, the Tactical Defensive Fund, the Defensive International Fund, the Trilogy Alternative Return Fund, the Tactical Income Fund and the Managed Risk 100 Fund, including, without limitation, its investment advisory services since each Fund’s inception, its coordination of services for the Funds by the Funds’ service providers, its compliance procedures and practices, and its efforts to promote the Funds and assist in their distribution. The Board noted that many of the Trust’s executive officers are employees of the Adviser, and (with the exception of the CCO) serve the Trust without additional compensation from the Funds. After reviewing the foregoing information and further information in the Adviser Memorandum (including descriptions of the Adviser’s business and the Adviser’s Form ADV), the Board concluded that the quality, extent, and nature of the services provided by the Adviser are satisfactory and adequate for the Funds. |
| (ii) | The investment performance of the Funds and Adviser. In this regard, the Board compared the performance of the Tactical Growth Fund, the Tactical Defensive Fund, the Defensive International Fund, the Trilogy Alternative Return Fund, the Tactical Income Fund and the Managed Risk 100 Fund with the performance of each Fund’s benchmark indices and comparable peer group averages. The Board also considered the consistency of the Adviser’s management of each Fund with the Fund’s investment objective and policies. The Board considered the performance of other funds in the Funds’ Morningstar category, and the Funds’ Morningstar ratings; however, the Board noted that comparisons with other funds in the Funds’ respective Morningstar categories were not necessarily appropriate considering the Funds’ unique investment approaches. Following discussion of the short and long-term investment performance of each Fund, the Adviser’s experience in managing the Funds and separate accounts, the Adviser’s historical investment performance and other factors, the Board concluded that the investment performance of the Funds and the Adviser has been satisfactory. |
| (iii) | The costs of the services to be provided and profits to be realized by the Adviser from its relationship with the Funds. In this regard, the Board considered the Adviser’s staffing, personnel, and methods of operating; the Adviser’s compliance policies and procedures; the financial condition of the Adviser and the level of commitment to the Funds and the Adviser by the principals of the Adviser; the asset levels of the Funds; the Adviser’s prior payment of startup costs for the Funds, the change in assets of the Funds; and the overall expenses of the Funds, including certain fee waivers and expense reimbursements by the Adviser on behalf of the Funds. The Board discussed each Fund’s Expense Limitation Agreement with the Adviser, and considered the Adviser’s past fee waivers with respect to
each Fund. |
The Board also considered potential benefits to the Adviser in managing the Funds, including promotion of the Adviser’s name and the ability for the Adviser to place small accounts into the Funds. The Board compared the fees and expenses of each Fund (including the management fee) to a peer group of other funds comparable to the Fund in terms of the type of fund, the style of investment management and the nature of the investment strategy and markets invested in, among other factors. It was noted that, while the management fee and net expense ratio of each of the Tactical Growth Fund, the Tactical Defensive Fund, the Defensive International Fund, the Trilogy Alternative Return Fund, the Tactical Income Fund and the Managed Risk 100 Fund were higher than the Morningstar category average, they were not the highest in their respective categories and each Fund has a relatively unique investment approach, and therefore comparisons of the Funds’ expenses with other funds in the Funds’ respective Morningstar category were not necessarily appropriate. The Board also considered that the Tactical Growth Fund, the Tactical Defensive Fund, the Defensive International Fund, the Trilogy Alternative Return Fund, the Tactical Income Fund and the Managed Risk 100 Fund’s size were smaller than many funds in their Morningstar category average. The Board also compared the fees paid by each Fund as compared to the fees paid by other clients of the Adviser, and considered the similarities and differences in the services received by such other clients as compared to the services received by the Funds. Following these comparisons and upon further consideration and discussion of the foregoing, the Board concluded that the fees to be paid to the Adviser by Tactical Growth Fund, the Tactical Defensive Fund, the Defensive International Fund, the Trilogy Alternative Return Fund, the Tactical Income Fund and the Managed Risk 100 Fund are appropriate and within the range of what would have been negotiated at arm’s length.
Stadion Investment Trust | Approval of Investment Advisory Agreements |
May 31, 2015 (Unaudited)
| (iv) | The extent to which economies of scale would be realized as the Tactical Growth Fund, the Tactical Defensive Fund, the Defensive International Fund, the Trilogy Alternative Return Fund, the Tactical Income Fund and the Managed Risk 100 Fund grow and whether management fee levels reflect these economies of scale for the benefit of each Fund’s investors. In this regard, the Board considered that each Fund’s fee arrangement with the Adviser involves both a management fee and an Expense Limitation Agreement. In connection with the Tactical Income Fund, the Board determined that the Fund currently experiences benefits from the Expense Limitation Agreement. In connection with the Tactical Growth Fund, the Tactical Defensive Fund, the Defensive International Fund, the Trilogy Alternative Return Fund, and the Managed Risk 100 Fund, the Board noted that, although the assets of each Fund had grown to a level where the Adviser is receiving its full fee, each Fund has experienced benefits from the Expense Limitation Agreement in prior years. The Board also considered the benefit to the Funds of the existing fee breakpoint. Going forward, the Board noted that each Fund has the potential to benefit from economies of scale under its agreements with the Adviser and other service providers, and acknowledged that, due to the Adviser’s unique investment approach, economies of scale are mitigated by the additional complexities faced by the Adviser as assets under management increase. Following further discussion of the Funds’ asset levels, expectations for growth and levels of fees, the Board determined that the Funds’ fee arrangements with the Adviser continue to provide benefits through the Expense Limitation Agreement and that, at the Funds’ current and projected asset levels for the next year, the Funds’ arrangements with the Adviser are fair and reasonable. |
After full consideration of the above factors as well as other factors, the Board unanimously concluded that approval of the Advisory Agreements was in the best interest of the Funds and its shareholders. No single factor was considered in isolation or to be determinative to the decision of the Trustees to approve the Advisory Agreements. Rather, the Trustees concluded, in light of their weighing and balancing all factors, that approval of the Advisory Agreements was in the best interest of the Funds and its shareholders.
APPROVAL OF AMENDMENT TO INVESTMENT ADVISORY AGREEMENT FOR STADION TACTICAL INCOME FUND (now known as STADION ALTERNATIVE INCOME FUND)
The Board of Trustees (the “Board”), including the Independent Trustees voting separately, has reviewed and approved the Amendment to the Investment Advisory Agreement (the “Amended Advisory Agreement”) with the Advisor for the Stadion Tactical Income Fund. Approval took place at an in‐person meeting held on February 2, 2015, at which all of the Trustees were present.
In the course of their deliberations, the Board was advised by legal counsel and the Independent Trustees were advised by independent legal counsel. The Board received and reviewed a substantial amount of information provided by the Advisor in response to requests of the Board
and counsel.
In considering the approval of the Amended Advisory Agreement and reaching their conclusions with respect thereto, the Board reviewed and analyzed various factors that they determined were relevant, including the factors described below:
| (i) | Changes in Investment Objective and Strategies. The Board considered the Adviser’s recommendation to the Board that substantial changes be made to the investment objective and strategies of the Fund, as reflected in the proposed Prospectus and Statement of Additional Information for the Fund presented to the Board in advance of the meeting. Specifically, the Board considered that the Adviser recommended: (i) revising the investment objective of the Fund to seek total return, with a secondary emphasis on lower risk and volatility than the U.S. equity markets, and (ii) revising the principal investment strategies to include: (A) investing in a portfolio of equities intended to generate dividend yield in equity markets; (B) moderating volatility through the use of options strategies; and (C) seeking to generate additional income through the sale and repurchase of options. |
| (ii) | Increased Management Complexity. The Board considered that the new objective and strategies for the Fund, once implemented, would involve greater portfolio management complexity due to, among other things, the application of multiple options strategies not currently employed by the Fund. As a result, the Adviser will need to devote more time and greater resources to the Adviser’s management of the Fund’s investments. |
| | |
| Annual Report | May 31, 2015 | 75 |
Stadion Investment Trust | Approval of Investment Advisory Agreements |
May 31, 2015 (Unaudited)
| (iii) | Increased Administration and Compliance Obligations. The Board considered that the new objective and strategies for the Fund, because they will involve multiple options strategies not currently employed by the Fund, will involve new administrative and compliance obligations to ensure proper implementation of Fund trades and compliance of those trades and resulting portfolio holdings with applicable requirements of the Investment Company Act of 1940, as amended. In this regard, the Board considered that the Adviser provides all of the Fund’s investment advisory services and pays a substantial portion of the Fund’s compliance costs, each of which will involve greater costs and the devotion of greater resources upon implementation of the new objective and strategies. |
| (iv) | Management Fees of Peer Group of Funds. The Board considered that, if implemented, the new objective and strategies would likely result in the Fund being placed in a different Morningstar category peer group of funds than the Fund’s current Morningstar category peer group. The Board compared the proposed increased fees and expenses of the Fund to the Fund’s expected new peer group of funds and found that: (i) the average fees paid by funds in the new peer group were higher than the average fees paid by funds in the Fund’s existing peer group, and (ii) the Fund’s management fee and net expense ratio would still be less than the average of the other funds included in its peer group. |
| (v) | Management Fees of Other Stadion Funds. The Board considered that the new strategy to be employed by the Fund was similar to a strategy employed by another series of the Trust managed by the Adviser and noted that this other series pays the Adviser a management fee equal to 1.25% of the Fund’s daily average net assets up to $150 million and 1.00% of such assets over $150 million, which is higher than the fee proposed in the Amended Advisory Agreement. |
After full consideration of the above factors as well as other factors, the Board unanimously concluded that approval of the Amended Advisory Agreement was in the best interest of the Fund and its shareholders. No single factor was considered in isolation or to be determinative to the decision of the Trustees to approve the Amended Advisory Agreement. Rather, the Trustees concluded, in light of their weighing and balancing all factors, that approval of the Amended Advisory Agreement was in the best interest of the Fund and its shareholders.
This report and the financial statements contained herein are submitted for the general information of the shareholders of the Stadion Funds (the “Funds”). This report is not authorized for distribution to prospective investors in the Funds unless preceded or accompanied by an effective prospectus. Mutual fund shares are not deposits or obligations of, or guaranteed by, any depository institution. Shares are not insured by the FDIC, Federal Reserve Board or any other agency, and are subject to investment risks, including possible loss of principal amount invested. Neither the Funds nor the Funds’ distributor is a bank.
The Stadion Funds are distributed by ALPS Distributors, Inc.
As of the end of the period covered by this report, the registrant has adopted a code of ethics that applies to the registrant’s principal executive officer, principal financial officer, principal accounting officer or controller, or persons performing similar functions, regardless of whether these individuals are employed by the registrant or a third party. Pursuant to Item 12(a)(1), a copy of registrant’s code of ethics has been filed with the Commission. During the period covered by this report, the code of ethics has not been amended, and the registrant has not granted any waivers, including implicit waivers, from the provisions of the code of ethics. Pursuant to Item 2(f) of Form N-CSR the registrant has posted such code of ethics on its Internet website.
| Item 3. | Audit Committee Financial Expert. |
The registrant’s board of trustees has determined that the registrant has at least one audit committee financial expert serving on its audit committee. The name of the audit committee financial expert is Ronald C. Baum. Mr. Baum is “independent” for purposes of this Item. Mr. Baum was a Managing Partner for the Atlanta office of Grant Thornton LLP from 1987 through 2002.
| Item 4. | Principal Accountant Fees and Services. |
(a) Audit Fees. The aggregate fees billed for professional services rendered by the principal accountant for the audit of the registrant’s annual financial statements or for services that are normally provided by the accountant in connection with statutory and regulatory filings or were $81,500 and $79,000 with respect to the registrant’s fiscal years ended May 31, 2015 and 2014, respectively.
(b) Audit-Related Fees. No fees were billed in either of the last two fiscal years for assurance and related services by the principal accountant that are reasonably related to the performance of the audit of the registrant’s financial statements and are not reported under paragraph (a) of this Item.
(c) Tax Fees. The aggregate fees billed for professional services rendered by the principal accountant for tax compliance, tax advice, and tax planning were $12,000 and $12,000 with respect to each of the registrant’s fiscal years ended May 31, 2015 and 2014, respectively. The services comprising these fees are the preparation of the registrant’s federal and state income and federal excise tax returns, and assistance with distribution calculations.
(d) All Other Fees.
(e)(1) The audit committee has not adopted pre-approval policies and procedures described in paragraph (c)(7) of Rule 2-01 of Regulation S-X.
(e)(2) None of the services described in paragraph (b) through (d) of this Item were approved by the audit committee pursuant to paragraph (c)(7)(i)(C) of Rule 2-01 of Regulation S-X.
(f) Less than 50% of hours expended on the principal accountant’s engagement to audit the registrant’s financial statements for the most recent fiscal year were attributed to work performed by persons other than the principal accountant’s full-time, permanent employees.
(g) During the fiscal years ended May 31, 2015 and 2014, aggregate non-audit fees of $12,000 and $12,000, respectively, were billed by the registrant’s accountant for services rendered to the registrant. No non-audit fees were billed in either of the last two fiscal years by the registrant’s accountant for services rendered to the registrant’s investment adviser (not including any sub-adviser whose role is primarily portfolio management and is subcontracted with or overseen by another investment adviser), and any entity controlling, controlled by, or under common control with the adviser that provides ongoing services to the registrant.
(h) The principal accountant has not provided any non-audit services to the registrant’s investment adviser (not including any sub-adviser whose role is primarily portfolio management and is subcontracted with or overseen by another investment adviser), and any entity controlling, controlled by, or under common control with the investment adviser that provides ongoing services to the registrant.
| Item 5. | Audit Committee of Listed Registrants. |
Not applicable
| Item 6. | Schedule of Investments. |
(a) Schedule filed with Item 1
(b) Not applicable
| Item 7. | Disclosure of Proxy Voting Policies and Procedures for Closed-End Management Investment Companies. |
Not applicable
| Item 8. | Portfolio Managers of Closed-End Management Investment Companies. |
Not applicable
| Item 9. | Purchases of Equity Securities by Closed-End Management Investment Company and Affiliated Purchasers. |
Not applicable
| Item 10. | Submission of Matters to a Vote of Security Holders. |
The registrant does not have procedures in place to consider nominees recommended by shareholders. The registrant’s nominating committee generally will not consider nominees recommended by shareholders.
| Item 11. | Controls and Procedures. |
(a) Based on their evaluation of the registrant’s disclosure controls and procedures (as defined in Rule 30a-3(c) under the Investment Company Act of 1940) as of a date within 90 days of the filing date of this report, the registrant’s principal executive officer and principal financial officer have concluded that such disclosure controls and procedures are reasonably designed and are operating effectively to ensure that material information relating to the registrant, including its consolidated subsidiaries, is made known to them by others within those entities, particularly during the period in which this report is being prepared, and that the information required in filings on Form N-CSR is recorded, processed, summarized, and reported on a timely basis.
(b) There were no changes in the registrant’s internal control over financial reporting (as defined in Rule 30a-3(d) under the Investment Company Act of 1940) that occurred during the second fiscal quarter of the period covered by this report that have materially affected, or are reasonably likely to materially affect, the registrant’s internal control over financial reporting.
File the exhibits listed below as part of this Form. Letter or number the exhibits in the sequence indicated.
(a)(1) Any code of ethics, or amendment thereto, that is the subject of the disclosure required by Item 2, to the extent that the registrant intends to satisfy the Item 2 requirements through filing of an exhibit: Attached hereto
(a)(2) A separate certification for each principal executive officer and principal financial officer of the registrant as required by Rule 30a-2(a) under the Act (17 CFR 270.30a-2(a)): Attached hereto
(a)(3) Any written solicitation to purchase securities under Rule 23c-1 under the Act (17 CFR 270.23c-1) sent or given during the period covered by the report by or on behalf of the registrant to 10 or more persons: Not applicable
(b) Certifications required by Rule 30a-2(b) under the Act (17 CFR 270.30a-2(b)): Attached hereto
EXHIBIT LIST
| Exhibit 99.CODE ETH | Code of Ethics |
| |
| Exhibit 99.CERT | Certifications required by Rule 30a-2(a) under the Act |
| | |
| Exhibit 99.906CERT | Certifications required by Rule 30a-2(b) under the Act |
SIGNATURES
Pursuant to the requirements of the Securities Exchange Act of 1934 and the Investment Company Act of 1940, the registrant has duly caused this report to be signed on its behalf by the undersigned, thereunto duly authorized.
| (Registrant) | Stadion Investment Trust | |
| By (Signature and Title)* | /s/ Judson P. Doherty | |
| Judson P. Doherty, President | |
Pursuant to the requirements of the Securities Exchange Act of 1934 and the Investment Company Act of 1940, this report has been signed below by the following persons on behalf of the registrant and in the capacities and on the dates indicated.
| By (Signature and Title)* | /s/ Judson P. Doherty | |
| | Judson P. Doherty, President and Principal Executive Officer |
| By (Signature and Title)* | /s/ Duane L. Bernt | |
| | Duane L. Bernt, Treasurer and Principal Financial Officer |
* Print the name and title of each signing officer under his or her signature.