UNITED STATES
SECURITIES AND EXCHANGE COMMISSION
Washington, D.C. 20549
FORM N-CSR
CERTIFIED SHAREHOLDER REPORT OF REGISTERED
MANAGEMENT INVESTMENT COMPANIES
Investment Company Act file number 811-21317
(Exact name of registrant as specified in charter)
1061 Cliff Dawson Road, Watkinsville, Georgia 30677
(Address of principal executive offices)(Zip code)
Jennifer T. Welsh, Esq.
ALPS Fund Services, Inc., 1290 Broadway, Suite 1100, Denver, CO 80203
(Name and address of agent for service)
Registrant's telephone number, including area code: (706) 583-5207
Date of fiscal year end: April 30, 2013
Date of reporting period: April 30, 2013
Form N-CSR is to be used by management investment companies to file reports with the Commission not later than 10 days after the transmission to stockholders of any report that is required to be transmitted to stockholders under Rule 30e-1 under the Investment Company Act of 1940 (17 CFR 270.30e-1). The Commission may use the information provided on Form N-CSR in its regulatory, disclosure review, inspection, and policymaking roles.
A registrant is required to disclose the information specified by Form N-CSR, and the Commission will make this information public. A registrant is not required to respond to the collection of information contained in Form N-CSR unless the Form displays a currently valid Office of Management and Budget ("OMB") control number. Please direct comments concerning the accuracy of the information collection burden estimate and any suggestions for reducing the burden to Secretary, Securities and Exchange Commission, 450 Fifth Street, NW, Washington, DC 20549-0609. The OMB has reviewed this collection of information under the clearance requirements of 44 U.S.C. § 3507.
| Item 1. | Reports to Stockholders. |

ANNUAL REPORT
April 30, 2013
STADION MARKET OPPORTUNITY FUND
| Letter to Shareholders | 1 |
| | |
| Performance Information | 2 |
| | |
| Disclosure of Fund Expenses | 4 |
| | |
| Schedule of Investments | 5 |
| | |
| Statement of Assets and Liabilities | 6 |
| | |
| Statement of Operations | 7 |
| | |
| Statements of Changes in Net Assets | 8 |
| | |
| Financial Highlights | 9 |
| | |
| Notes to Financial Statements | 12 |
| | |
| Report of Independent Registered Public Accounting Firm | 16 |
| | |
| Additional Information | 17 |
| | |
| Board of Trustees and Executive Officers | 18 |
| | |
| Approval of Investment Advisory Agreement | 20 |
| | |
| Shareholder Meeting Voting Results | 22 |
| Stadion Market Opportunity Fund | Letter to Shareholders |
| | May 31, 2013 |
Dear Shareholders:
Enclosed for your review is the Annual Report of the Market Opportunity Fund for its fiscal year ending April 30, 2013. The Fund commenced operation on May 3, 2004, thus this report covers the Fund’s ninth year of operation. Following unanimous approval in January by the trustees of the Aviemore Trust, a shareholder proxy vote was completed whereby on April 1, 2013, the ETF Market Opportunity Fund was reorganized into the Stadion Investment Trust and renamed the Stadion Market Opportunity Fund. Stadion Money Management, LLC (“Stadion”) of Watkinsville, Georgia became the adviser to the Fund. Having joined Stadion as Senior Portfolio Manager, I will manage the Fund together with Brad Thompson and Will McGough.
The proprietary model for the Fund quantitatively ranks all actively traded exchange-traded funds (“ETFs”) that first pass a fundamental review. The ranking is based upon risk adjusted return. The holdings of the Fund are adjusted so that the ETFs showing strength in the model are purchased and held. Those showing weakness in the model are sold or not considered for purchase. The goal of the Fund’s investment process is to produce above market returns while assuming below market risk.
Allocation selections and market performance were contributing factors to the Fund’s performance during the last fiscal year. The S&P 500 Index gained 16.89% for the 12 months ending April 30, 2013. The Fund gained 9.9% during the same one-year period. The Fund’s model had the portfolio invested in a conservative allocation during a volatile May 2012, causing the Fund to be fall behind the S&P 500’s advance. The S&P 500’s return during that period was disproportionately influenced by gains in its largest holding, Apple Inc. The Fund’s diversification is designed to mitigate outsized losses driven by any one company, and thus decrease the likelihood that it will benefit by any single company’s outsized gains. In the long run, our focus is fixed on continuing to follow the Fund’s proprietary model in order to attempt to achieve the Fund’s investment goals.
I invite you to visit the Fund’s web site at www.stadionfunds.com, where you will find contact information for any questions or comments you may have.
Very truly yours,
Paul M. Frank
| | |
| Annual Report | April 30, 2013 | 1 |
| Stadion Market Opportunity Fund | Performance Information |
| | April 30, 2013 (Unaudited) |
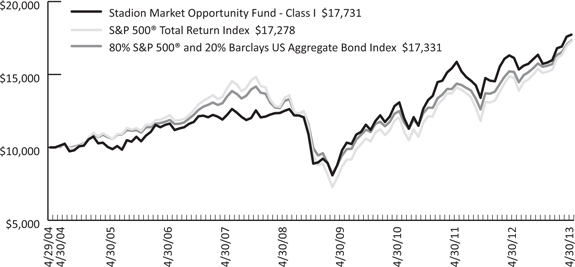
Comparison of the Change in Value of a $10,000 Investment in Stadion Market Opportunity Fund(a), the S&P 500® Index
and 80% S&P 500® Index/20% Barclays U.S. Aggregate Bond Index
Average Annual Total Returns(b) (for periods ended April 30, 2013)
| | 1 Year | 5 Year | Since Inception |
Stadion Market Opportunity Fund - A - NAV(c)(d) | 9.65% | 6.97% | 6.31% |
Stadion Market Opportunity Fund - A (POP) (c)(d) | 3.37% | 5.71% | 5.61% |
Stadion Market Opportunity Fund - C - NAV(c)(d) | 8.79% | 6.16% | 5.51% |
Stadion Market Opportunity Fund - C (CDSC) (c)(d) | 7.87% | 6.16% | 5.51% |
Stadion Market Opportunity Fund - I - NAV(c) | 9.90% | 7.23% | 6.57% |
| S&P 500® Total Return Index | 16.89% | 5.21% | 6.26% |
| 80% S&P 500® and 20% Barclays US Aggregate Bond Index | 14.24% | 5.62% | 6.30% |
| (a) | The line graph above represents performance of Class I shares only, which will vary from the performance of Class A and Class C shares based on the difference in loads and fees paid by shareholders in different classes. |
| (b) | Total return is a measure of the change in value of an investment in the Fund over the periods covered, which assumes any dividends or capital gains distributions are reinvested in shares of the Fund. Returns do not reflect the deduction of taxes a shareholder would pay on Fund distributions or the redemption of Fund shares. Total returns shown do include the effect of applicable sales loads. |
| (c) | The performance shown includes that of the predecessor Fund, the ETF Market Opportunity Fund, a series of Aviemore Trust, which was reorganized into the Trust as of the close of business on March 29, 2013. |
| (d) | Class A and C shares of the Fund commenced operations on April 1, 2013. The performance shown for Class A and C shares reflects the performance of the Fund’s Class I shares, the initial share class, calculated using the fees and expenses of Class A and C shares respectively and without the effect of any fee and expense limitations or waivers. If Class A and C shares of the Fund had been available during periods prior to April 1, 2013, the performance shown may have been different. |
The performance information quoted above represents past performance and past performance does not guarantee future results. Investment return and principal value of an investment will fluctuate so that an investor’s shares, when redeemed, may be worth more or less than their original cost. Current performance may be lower or higher than the performance data quoted. Performance data, current to the most recent month end, may be obtained by calling 1-800-222-7636. An investor should consider a Fund’s investment objectives, risks, and charges and expenses carefully before investing. The Fund’s prospectus contains this and other important information. For information on the Fund’s expense ratios, please see the Financial Highlights tables found within this Report.
The Total Annual Fund Operating Expenses for Class A, Class C and Class I are 2.16%, 2.91% and 1.91%, respectively. The Fund’s investment advisor, Stadion Money Management, LLC (the “Advisor”) has agreed to waive fees and reimburse for other operating expenses (exclusive of interest expense on any borrowings, taxes, brokerage commissions, extraordinary expenses, acquired fund fees and expenses and payments, if any, under a Rule 12b-1 Distribution Plan) in excess of 1.70% of the average daily net assets for Class A, Class C, and Class I, until at least June 30, 2014.
Information included or referred to on, or otherwise accessible through, our website is not intended to form part of or be incorporated into this report or the Fund's prospectus.
| Stadion Market Opportunity Fund | Performance Information |
| | April 30, 2013 (Unaudited) |
POP, the “Public Offering Price”, and NAV, the “Net Asset Value” price, are terms used to describe what share price was applied to Class A and/or Class C shares at the time of purchased. A CDSC (“Contingent Deferred Sales Charge”) is a redemption fee that can be applied if purchased share are redeemed prior to a specified holding period. For additional information please consult the Fund’s Prospectus.
S&P 500® Total Return Index is the Standard & Poor's composite index of 500 stocks, a widely recognized, unmanaged index of common stock prices.
The Barclays Capital U.S. Aggregate Bond Index is a market value-weighted index of investment grade fixed-rated debt issues, including government, corporate, asset-backed and mortgage-backed securities with a maturity of one year or more.
An investor may not invest directly in an index.
Diversification does not eliminate the risk of experiencing investment losses.
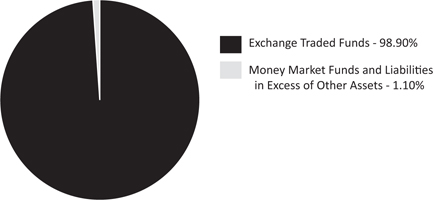
Portfolio Composition (as a % of net assets)
| | |
| Annual Report | April 30, 2013 | 3 |
| Stadion Market Opportunity Fund | Disclosure of Fund Expenses |
| | April 30, 2013 (Unaudited) |
We believe it is important for you to understand the impact of costs on your investment. As a shareholder of the Fund, you may incur two types of costs: (1) transaction costs, possibly including front-end and contingent deferred sales loads; and (2) ongoing costs, including management fees, distribution (12b-1) fees and other Fund expenses. The following examples are intended to help you understand your ongoing costs (in dollars) of investing in the Fund and to compare these costs with the ongoing costs of investing in other mutual funds.
A mutual fund’s ongoing costs are expressed as a percentage of its average net assets. This figure is known as the expense ratio. The expenses in the tables that follow are based on an investment of $1,000 made at the beginning of the most recent semi-annual period (November 1, 2012) and held until the end of the period (April 30, 2013).
The tables that follow illustrate the Fund’s costs in two ways:
Actual fund return – This section helps you to estimate the actual expenses that you paid over the period. The “Ending Account Value” shown is derived from the Fund’s actual return, and the third column shows the dollar amount of operating expenses that would have been paid by an investor who started with $1,000 in the Fund. You may use the information here, together with the amount you invested, to estimate the expenses that you paid over the period.
To do so, simply divide your account value by $1,000 (for example, an $8,600 account value divided by $1,000 = 8.6), then multiply the result by the number given for the Fund under the heading “Expenses Paid During Period.”
Hypothetical 5% return – This section is intended to help you compare the Fund’s ongoing costs with those of other mutual funds. It assumes that the Fund had an annual return of 5% before expenses during the period shown, but that the expense ratio is unchanged. In this case, because the returns used are not the Fund’s actual returns, the results do not apply to your investment. The example is useful in making comparisons because the SEC requires all mutual funds to calculate expenses based on a 5% return. You can assess the Fund’s ongoing costs by comparing this hypothetical example with the hypothetical examples that appear in shareholder reports of other funds.
Note that expenses shown in the tables are meant to highlight and help you compare ongoing costs only and do not reflect any transaction costs, such as sales charges (loads). The calculations assume no shares were bought or sold during the period. Your actual costs may have been higher or lower, depending on the amount of your investment and the timing of any purchases or redemptions.
More information about the Fund’s expenses, including historical annual expense ratios, can be found in this report. For additional information on operating expenses and other shareholder costs, please refer to the Fund’s prospectus.
| | | Beginning Account Value 11/1/12 | | | Ending Account Value 4/30/13 | | | Expense Ratio(a) | | Expenses Paid During period 11/1/12 - 4/30/13(b) | |
| | | | | | | | | | | | | |
| Stadion Market Opportunity Fund - Class A | | | | | | | | | | | | |
Based on Actual Fund Return(c) | | $ | 1,000.00 | | | $ | 1,126.00 | | | | 1.95 | % | | $ | 1.70 | |
| Based on Hypothetical 5% Return (before expenses) | | $ | 1,000.00 | | | $ | 1,015.12 | | | | 1.95 | % | | $ | 9.74 | |
| Stadion Market Opportunity Fund - Class C | | | | | | | | | | | | | | | | |
Based on Actual Fund Return(c) | | $ | 1,000.00 | | | $ | 1,121.40 | | | | 2.70 | % | | $ | 2.35 | |
| Based on Hypothetical 5% Return (before expenses) | | $ | 1,000.00 | | | $ | 1,011.41 | | | | 2.70 | % | | $ | 13.47 | |
| Stadion Market Opportunity Fund - Class I | | | | | | | | | | | | | | | | |
| Based on Actual Fund Return | | $ | 1,000.00 | | | $ | 1,127.20 | | | | 1.74 | % | | $ | 9.18 | |
| Based on Hypothetical 5% Return (before expenses) | | $ | 1,000.00 | | | $ | 1,016.17 | | | | 1.74 | % | | $ | 8.70 | |
| (a) | The Fund's expense ratios have been based on the Fund's most recent fiscal half-year expenses. |
| (b) | Expenses are equal to the Fund's annualized expense ratio, multiplied by the average account value over the period, multiplied by the number of days in the most recent fiscal half-year (181)/365. |
| (c) | The Stadion Market Opportunity Fund began offering this share class on April 1, 2013. |
| Stadion Market Opportunity Fund | Schedule of Investments |
| | April 30, 2013 |
| EXCHANGE-TRADED FUNDS - 98.90% | | Shares | | | Value | |
| iShares® Core S&P® 500 ETF | | | 9,710 | | | $ | 1,557,096 | |
| iShares® Dow Jones Transportation Average Index Fund | | | 12,430 | | | | 1,367,673 | |
| iShares® High Dividend Equity Fund | | | 19,450 | | | | 1,333,492 | |
| iShares® MSCI Emerging Markets Asia ETF | | | 19,570 | | | | 1,110,402 | |
| iShares® Russell Mid-Cap Value Fund | | | 38,640 | | | | 2,231,460 | |
| PowerShares® QQQ Trust, Series 1 | | | 20,000 | | | | 1,414,600 | |
United States Natural Gas Fund, LP(a) | | | 45,000 | | | | 1,056,150 | |
| Vanguard® Financials ETF | | | 28,570 | | | | 1,115,659 | |
| Vanguard® Growth ETF | | | 56,570 | | | | 4,455,453 | |
| Vanguard® Health Care ETF | | | 41,700 | | | | 3,554,091 | |
| Vanguard® Utilities ETF | | | 15,580 | | | | 1,394,877 | |
| WisdomTree Japan SmallCap Dividend Fund | | | 25,820 | | | | 1,336,701 | |
| | | | | | | | | |
| TOTAL EXCHANGE-TRADED FUNDS | | | | | |
| (Cost $18,284,771) | | | | | | | 21,927,654 | |
| MONEY MARKET FUNDS - 4.58% | | Shares | | | Value | |
Fidelity® Institutional Money Market Government Portfolio, Class I, 0.010%(b) | | | 1,014,583 | | | $ | 1,014,583 | |
First American Treasury Obligations Fund, Class Y Shares, 0.000%(a)(b) | | | 1,000 | | | | 1,000 | |
| | | | | | | | | |
| TOTAL MONEY MARKET FUNDS | | | | | | | | |
| (Cost $1,015,583) | | | | | | | 1,015,583 | |
| | | | | | |
| Total Investments, at Value - 103.48% | | | | | |
| (Cost $19,300,354) | | | | | | | 22,943,237 | |
| | | | | | | | | |
| Liabilities in Excess of Other Assets - (3.48)% | | | | | | | (771,685 | ) |
| | | | | | | | | |
| Net Assets - 100.00% | | | | | | $ | 22,171,552 | |
| (a) | Non-income producing security. |
| (b) | Variable rate Security. The rate shown is the 7-day effective yield as of April 30, 2013. |
See Notes to Financial Statements.
| | |
| Annual Report | April 30, 2013 | 5 |
| Stadion Market Opportunity Fund | Statement of Assets and Liabilities |
| | April 30, 2013 |
| ASSETS | | | |
| Investments in securities: | | | |
| At acquisition cost | | $ | 19,300,354 | |
| At Value (Note 2) | | $ | 22,943,237 | |
| Dividends receivable | | | 3,194 | |
| Receivable for investment securities sold | | | 3,089,022 | |
| TOTAL ASSETS | | | 26,035,453 | |
| | | | | |
| LIABILITIES | |
| Payable for capital shares redeemed | | | 60,966 | |
| Payable for investment securities purchased | | | 3,772,651 | |
| Payable to Advisor (Note 5) | | | 6,765 | |
| Accrued compliance fees (Note 5) | | | 694 | |
| Payable to administrator (Note 5) | | | 1,067 | |
| Payable for trustees' fees | | | 453 | |
| Other accrued expenses | | | 21,305 | |
| TOTAL LIABILITIES | | | 3,863,901 | |
| | | | | |
| NET ASSETS | | $ | 22,171,552 | |
| | | | | |
| Net assets consist of: | |
| Paid-in capital | | $ | 15,377,793 | |
| Accumulated net realized gains from security transactions | | | 3,150,876 | |
| Net unrealized appreciation on investments | | | 3,642,883 | |
| Net assets | | $ | 22,171,552 | |
| | | | | |
| PRICING OF CLASS A SHARES | | | | |
| Net assets applicable to Class A shares | | $ | 1,214 | |
| Class A shares of beneficial interest outstanding (unlimited number of shares authorized, $0.001 par value) | | | 118 | |
| Net asset value and redemption price per share (Note 2) | | $ | 10.27 | (a) |
| Maximum offering price per share (Note 2) | | $ | 10.90 | |
| | | | | |
| PRICING OF CLASS C SHARES | | | | |
| Net assets applicable to Class C shares | | $ | 1,021 | |
| Class C shares of beneficial interest outstanding (unlimited number of shares authorized, $0.001 par value) | | | 100 | |
| Net asset value, offering price and redemption price per share (Note 2) | | $ | 10.26 | (a) |
| | | | | |
| PRICING OF CLASS I SHARES | | | | |
| Net assets applicable to Class I shares | | $ | 22,169,317 | |
| Class I shares of beneficial interest outstanding (unlimited number of shares authorized, $0.001 par value) | | | 2,157,748 | |
| Net asset value, offering price and redemption price per share (Note 2) | | $ | 10.27 | |
| (a) | NAV’s do not recalculate due to fractional shares not presented and rounding. |
See Notes to Financial Statements.
| Stadion Market Opportunity Fund | Statement of Operations |
| | For the Year Ended April 30, 2013 |
| INVESTMENT INCOME | | | |
| Dividends | | $ | 407,703 | |
| Interest | | | 31 | |
| TOTAL INVESTMENT INCOME | | | 407,734 | |
| | | | | |
| EXPENSES | | | | |
| Investment advisory fees (Note 5) | | | 455,303 | |
| Distributions fees, Class C (Note 5) | | | 1 | |
| Transfer agency fees (Note 5) | | | 2,135 | |
| Fund accounting and administrative fees (Note 5) | | | 1,067 | |
| Professional fees | | | 15,748 | |
| Custodian fees | | | 411 | |
| Compliance fees (Note 5) | | | 694 | |
| Trustees' fees | | | 1,014 | |
| Printing of shareholder reports | | | 2,600 | |
| Other expenses | | | 410 | |
| TOTAL EXPENSES | | | 479,383 | |
| Expenses waived/reimbursed by the Advisor (Note 5) | | | (15,914 | ) |
| NET EXPENSES | | | 463,469 | |
| | | | | |
| NET INVESTMENT LOSS | | | (55,735 | ) |
| | | | | |
| REALIZED AND UNREALIZED GAINS (LOSSES) ON INVESTMENTS | | | | |
| Net realized gains from security transactions | | | 3,368,546 | |
| Net change in unrealized appreciation/(depreciation) on investments | | | (1,123,894 | ) |
| NET REALIZED AND UNREALIZED GAIN ON INVESTMENTS | | | 2,244,652 | |
| | | | | |
| NET INCREASE IN NET ASSETS RESULTING FROM OPERATIONS | | $ | 2,188,917 | |
See Notes to Financial Statements.
| | |
| Annual Report | April 30, 2013 | 7 |
| Stadion Market Opportunity Fund | Statements of Changes in Net Assets |
| | | For the Year Ended April 30, 2013 | | | For the Year Ended April 30, 2012 | |
| FROM OPERATIONS | |
| Net investment loss | | $ | (55,735 | ) | | $ | (283,777 | ) |
| Net realized gains from security transactions | | | 3,368,546 | | | | 10,266,743 | |
| Net change in unrealized appreciation/(depreciation) on investments | | | (1,123,894 | ) | | | (12,962,938 | ) |
| Net increase (decrease) in net assets resulting from operations | | | 2,188,917 | | | | (2,979,972 | ) |
| | | | | | | | | |
| DISTRIBUTIONS TO SHAREHOLDERS | |
| Distributions from net realized gains, Class I | | | (4,271,775 | ) | | | (5,774,301 | ) |
| Decrease in net assets from distributions to shareholders | | | (4,271,775 | ) | | | (5,774,301 | ) |
| | | | | | | | | |
| FROM CAPITAL SHARE TRANSACTIONS (Note 6) | | | | | | | | |
| Class A | | | | | | | | |
| Proceeds from sales of shares | | | 1,198 | | | | – | |
| Payments for shares redeemed | | | (5 | ) | | | – | |
| Net increase in net assets from Class A share transactions | | | 1,193 | | | | – | |
| | | | | | | | | |
| Class C | | | | | | | | |
| Proceeds from sales of shares | | | 1,005 | | | | – | |
| Net increase in net assets from Class C share transactions | | | 1,005 | | | | – | |
| | | | | | | | | |
| Class I | | | | | | | | |
| Proceeds from sales of shares | | | 4,771,198 | | | | 10,116,429 | |
| Net asset value of shares issued in reinvestment of distributions | | | 4,265,859 | | | | 5,765,899 | |
| Payments for shares redeemed | | | (14,331,245 | ) | | | (58,829,610 | ) |
| Net decrease in net assets from Class I share transactions | | | (5,294,188 | ) | | | (42,947,282 | ) |
| | | | | | | | | |
| TOTAL NET DECREASE IN NET ASSETS | | | (7,374,848 | ) | | | (51,701,555 | ) |
| | | | | | | | | |
| NET ASSETS: | | | | | | | | |
| Beginning of year | | | 29,546,400 | | | | 81,247,955 | |
| End of year | | $ | 22,171,552 | | | $ | 29,546,400 | |
| | | | | | | | | |
| ACCUMULATED NET INVESTMENT INCOME | | $ | – | | | $ | – | |
See Notes to Financial Statements.
| Stadion Market Opportunity Fund – Class A | Financial Highlights |
| | For a Share Outstanding Throughout the Period Presented |
| | | For the Period April 1, 2013 (Commencement of operations) to April 30, 2013 | |
| NET ASSET VALUE, BEGINNING OF PERIOD | | $ | 10.10 | |
| INCOME/(LOSS) FROM OPERATIONS: | | | | |
Net investment loss(a)(b) | | | (0.02 | ) |
Net realized and unrealized gain on investments (c) | | | 0.19 | |
| Total from investment operations | | | 0.17 | |
| NET ASSET VALUE, END OF PERIOD | | $ | 10.27 | |
| | | | | |
TOTAL RETURN(d) | | | 1.68 | %(e) |
| | | | | |
| RATIOS AND SUPPLEMENTAL DATA: | | | | |
| Net assets, end of Period (000's) | | $ | 1 | |
| | | | | |
Ratio of total expenses to average net assets(f) | | | 2.83 | %(g) |
| | | | | |
Ratio of net expenses to average net assets(f) | | | 1.95 | %(g) |
| | | | | |
Ratio of net investment loss to average net assets(f) | | | (1.95 | %)(g) |
| | | | | |
| PORTFOLIO TURNOVER RATE | | | 294 | %(h) |
| (a) | Per share amounts were calculated using the average shares method. |
| (b) | Recognition of net investment income (loss) by the Fund is affected by the timing of the declaration of dividends by the underlying investment companies in which the Fund invests. |
| (c) | Realized and unrealized gains and losses per share in this caption are balancing amounts necessary to reconcile the change in net asset value for the period, and may not reconcile with the aggregate gains and losses in the Statement of Operations due to share transactions for the period. |
| (d) | Total return is a measure of the change in value of an investment in the Fund over the period covered, which assumes any dividends or capital gains distributions are reinvested in shares of the Fund. The returns shown do not reflect the deduction of taxes a shareholder would pay on Fund distributions or the redemption of Fund shares. |
| (e) | Not annualized. |
| (f) | The ratios of expenses and net investment loss to average net assets do not reflect the Fund's proportionate share of expense of the underlying investment companies in which the Fund invested. |
| (g) | Annualized. |
| (h) | Portfolio turnover is calculated at the Fund level and represents the year ended April 30, 2013. |
See Notes to Financial Statements.
| | |
| Annual Report | April 30, 2013 | 9 |
| Stadion Market Opportunity Fund – Class C | Financial Highlights |
| | For a Share Outstanding Throughout the Period Presented |
| | | For the Period April 1, 2013 (Commencement of operations) to April 30, 2013 | |
| NET ASSET VALUE, BEGINNING OF PERIOD | | $ | 10.10 | |
| INCOME/(LOSS) FROM OPERATIONS: | | | | |
Net investment loss(a)(b) | | | (0.02 | ) |
Net realized and unrealized gain on investments (c) | | | 0.18 | |
| Total from investment operations | | | 0.16 | |
| NET ASSET VALUE, END OF PERIOD | | $ | 10.26 | |
| | | | | |
TOTAL RETURN(d) | | | 1.58 | %(e) |
| | | | | |
| RATIOS AND SUPPLEMENTAL DATA: | | | | |
| Net assets, end of Period (000's) | | $ | 1 | |
| | | | | |
Ratio of total expenses to average net assets(f) | | | 3.51 | %(g) |
| | | | | |
Ratio of net expenses to average net assets(f) | | | 2.70 | %(g) |
| | | | | |
Ratio of net investment loss to average net assets(f) | | | (2.70 | %)(g) |
| | | | | |
| PORTFOLIO TURNOVER RATE | | | 294 | %(h) |
| (a) | Per share amounts were calculated using the average shares method. |
| (b) | Recognition of net investment income (loss) by the Fund is affected by the timing of the declaration of dividends by the underlying investment companies in which the Fund invests. |
| (c) | Realized and unrealized gains and losses per share in this caption are balancing amounts necessary to reconcile the change in net asset value for the period, and may not reconcile with the aggregate gains and losses in the Statement of Operations due to share transactions for the period. |
| (d) | Total return is a measure of the change in value of an investment in the Fund over the period covered, which assumes any dividends or capital gains distributions are reinvested in shares of the Fund. The returns shown do not reflect the deduction of taxes a shareholder would pay on Fund distributions or the redemption of Fund shares. |
| (e) | Not annualized. |
| (f) | The ratios of expenses and net investment loss to average net assets do not reflect the Fund's proportionate share of expense of the underlying investment companies in which the Fund invested. |
| (g) | Annualized. |
| (h) | Portfolio turnover is calculated at the Fund level and represents the year ended April 30, 2013. |
See Notes to Financial Statements.
| Stadion Market Opportunity Fund – Class I | Financial Highlights |
| | For a Share Outstanding Throughout the Period Presented |
| | | Year Ended April 30,
2013 | | | Year Ended April 30,
2012 | | | Year Ended April 30,
2011 | | | Year Ended April 30,
2010 | | | Year Ended April 30,
2009 | |
| NET ASSET VALUE, BEGINNING OF YEAR | | $ | 11.20 | | | $ | 13.13 | | | $ | 11.79 | | | $ | 8.83 | | | $ | 11.65 | |
| | | | | | | | | | | | | | | | | | | | | |
| INCOME/(LOSS) FROM OPERATIONS: | | | | | | | | | | | | | | | | | | | | |
Net investment income (loss)(a)(b) | | | (0.02 | ) | | | (0.08 | ) | | | (0.10 | ) | | | (0.07 | ) | | | 0.03 | |
Net realized and unrealized gain (loss) on investments (c) | | | 0.90 | | | | 0.11 | | | | 2.50 | | | | 3.04 | | | | (2.59 | ) |
| Total from investment operations | | | 0.88 | | | | 0.03 | | | | 2.40 | | | | 2.97 | | | | (2.56 | ) |
| LESS DISTRIBUTIONS: | | | | | | | | | | | | | | | | | | | | |
| Dividends from net investment income | | | – | | | | – | | | | – | | | | (0.01 | ) | | | (0.08 | ) |
| Distributions from net realized gains | | | (1.81 | ) | | | (1.96 | ) | | | (1.06 | ) | | | – | | | | (0.18 | ) |
| Total distributions | | | (1.81 | ) | | | (1.96 | ) | | | (1.06 | ) | | | (0.01 | ) | | | (0.26 | ) |
| | | | | | | | | | | | | | | | | | | | | |
| NET ASSET VALUE, END OF YEAR | | $ | 10.27 | | | $ | 11.20 | | | $ | 13.13 | | | $ | 11.79 | | | $ | 8.83 | |
| | | | | | | | | | | | | | | | | | | | | |
TOTAL RETURN(d) | | | 9.90 | % | | | 1.70 | % | | | 21.26 | % | | | 33.63 | % | | | (21.72 | %) |
| | | | | | | | | | | | | | | | | | | | | |
| RATIOS AND SUPPLEMENTAL DATA: | | | | | | | | | | | | | | | | | | | | |
| Net assets, end of Year (000's) | | $ | 22,169 | | | $ | 29,546 | | | $ | 81,248 | | | $ | 60,537 | | | $ | 45,233 | |
| | | | | | | | | | | | | | | | | | | | | |
Ratio of total expenses to average net assets(e) | | | 1.81 | % | | | 1.75 | % | | | 1.75 | % | | | 1.75 | % | | | 1.75 | % |
| | | | | | | | | | | | | | | | | | | | | |
Ratio of net expenses to average net assets(e) | | | 1.75 | % | | | N/A | | | | N/A | | | | N/A | | | | N/A | |
| | | | | | | | | | | | | | | | | | | | | |
Ratio of net investment income (loss) to average net assets(e) | | | (0.21 | %) | | | (0.66 | %) | | | (0.86 | %) | | | (0.67 | %) | | | 0.34 | % |
| | | | | | | | | | | | | | | | | | | | | |
| PORTFOLIO TURNOVER RATE | | | 294 | % | | | 262 | % | | | 201 | % | | | 196 | % | | | 517 | % |
| | | | | | | | | | | | | | | | | | | | | |
| (a) | Per share amounts were calculated using the average shares method. |
| (b) | Recognition of net investment income (loss) by the Fund is affected by the timing of the declaration of dividends by the underlying investment companies in which the Fund invests. |
| (c) | Realized and unrealized gains and losses per share in this caption are balancing amounts necessary to reconcile the change in net asset value for the year, and may not reconcile with the aggregate gains and losses in the Statement of Operations due to share transactions for the year. |
| (d) | Total return is a measure of the change in value of an investment in the Fund over the periods covered, which assumes any dividends or capital gains distributions are reinvested in shares of the Fund. The returns shown do not reflect the deduction of taxes a shareholder would pay on Fund distributions or the redemption of Fund shares. |
| (e) | The ratios of expenses and net investment income (loss) to average net assets do not reflect the Fund's proportionate share of expense of the underlying investment companies in which the Fund invested. |
See Notes to Financial Statements.
| | |
| Annual Report | April 30, 2013 | 11 |
| Stadion Market Opportunity Fund | Notes to Financial Statements |
| | April 30, 2013 |
Stadion Investment Trust (the “Trust”), a Delaware Statutory Trust registered under the Investment Company Act of 1940, as amended, (the “1940 Act”) as an open-end management investment company. As of April 30, 2013, the Trust had 6 registered funds (the “Funds”); this annual report describes the Stadion Market Opportunity FundTM (“Market Opportunity Fund”) (the “Fund”). Prior to the close of business on March 29, 2013, the Fund was known as the ETF Market Opportunity Fund (the “Predecessor Fund”), which was a series of the Aviemore Funds, an Ohio business trust. The Predecessor Fund was organized into Class I Shares of the Fund, a newly formed series of the Trust, effective as of the close of business on March 29, 2013. The Predecessor Fund commenced operations on May 3, 2004 and was the only series authorized by the The Aviemore Funds. The Fund launched Class A and Class C shares effective April 1, 2013.
The Fund seeks long-term capital appreciation. Under normal circumstances, the Fund will invest at least 80% of the Fund’s total assets in actively or passively managed exchange-traded funds.
The Fund currently offers three classes of shares: Class A shares (sold subject to a maximum front-end sales load equal to 5.75% of the offering price and a distribution and/or service fee of up to 0.25% of the average net assets attributable to Class A shares and sold subject to a 1% contingent deferred sales load on purchases at or above $1 million if redeemed within 18 months of purchase), Class C shares (subject to a distribution and/or service fee of up to 1.00% of the average daily net assets attributable to Class C shares and sold subject to a 1% contingent deferred sales load if redeemed within one year of purchase) and Class I shares (sold without any sales loads and distribution and/ or service fees). Each class of shares represents an interest in the same assets of the Fund, has the same rights and is identical in all material respects except that (1) the classes bear differing levels of sales loads and distribution fees; (2) certain other class specific expenses will be borne solely by the class to which such expenses are attributable; (3) each class has exclusive voting rights with respect to matters relating to its own distribution arrangements; and (4) Class I shares require a higher minimum initial investment.
2. SIGNIFICANT ACCOUNTING POLICIES
The following is a summary of the Fund’s significant accounting policies used in the preparation of its financial statements. The policies are in conformity with accounting principles generally accepted in the United States of America (“GAAP”).
Security Valuation: The Fund’s investments in securities are carried at market value. Securities listed on an exchange or quoted on a national market system are valued at the last sales price as of the time regular trading closes on the New York Stock Exchange (normally, 4:00 p.m. Eastern Time). Securities traded in the NASDAQ market are valued at the NASDAQ Official Closing Price. Other securities, including listed securities for which no sale was reported on that date, are valued at the most recent bid price. Securities and assets for which representative market quotations are not readily available or which cannot be accurately valued using the Fund’s normal pricing procedures are valued at fair value as determined in good faith under policies approved by the Board of Trustees (the “Trustees”) and will be classified as Level 2 or 3 within the fair value hierarchy (see below), depending on the inputs used. Fair value pricing may be used, for example, in situations where (i) a portfolio security is so thinly traded that there have been no transactions for that security over an extended period of time; (ii) an event occurs after the close of the exchange on which a portfolio security is principally traded that is likely to have changed the value of the portfolio security prior to the Fund’s net asset value calculations; (iii) the exchange on which the portfolio security is principally traded closes early; or (iv) trading of the portfolio security is halted during the day and does not resume prior to the Fund’s net asset value calculations. A portfolio security’s “fair value” price may differ from the price next available for that portfolio security using the Funds’ normal pricing procedures. Open-end investment companies, including money market funds, are valued at the net asset value reported by such registered open-end investment companies. Instruments with maturities of 60 days or less are valued at amortized cost, which approximates market value. Options are valued at the mean of the last quoted bid and ask as reported on the option's primary exchange. If no bid is readily available than the option is valued at the mean of the last quoted ask and $0.00.
GAAP establishes a single authoritative definition of fair value, sets out a framework for measuring fair value and requires additional disclosures about fair value measurements.
Various inputs are used in determining the value of the Fund’s investments. These inputs are summarized in the three broad levels listed below:
Level 1 – quoted prices in active markets for identical securities
Level 2 – other significant observable inputs
Level 3 – significant unobservable inputs
The inputs or methodology used for valuing securities are not necessarily an indication of the risks associated with investing in those securities. The inputs used to measure fair value may fall into different levels of the fair value hierarchy. In such cases, for disclosure purposes, the level in the fair value hierarchy within which the fair value measurement falls in its entirety is determined based on the lowest level input that is significant to the fair value measurement.
The following is a summary of the inputs used to value the Fund’s investments as of April 30, 2013:
| Stadion Market Opportunity Fund | |
| | | Valuation Inputs | | | | |
| | | Level 1 | | | Level 2 | | | Level 3 | | | Total | |
| Investments in Securities at Value | |
| Exchange-Traded Funds | | $ | 21,927,654 | | | $ | – | | | $ | – | | | $ | 21,927,654 | |
| Money Market Funds | | | 1,015,583 | | | | – | | | | – | | | | 1,015,583 | |
| Total Investments in Securities | | $ | 22,943,237 | | | $ | – | | | $ | – | | | $ | 22,943,237 | |
| Stadion Market Opportunity Fund | Notes to Financial Statements |
| | April 30, 2013 |
As of April 30, 2013, the Fund did not have any transfers in and out of any Level. The Fund did not have any assets or liabilities that were measured at fair value on a recurring basis using significant unobservable inputs (Level 3) as of and during the year ended April 30, 2013. It is the Fund’s policy to recognize transfers into and out of any Level at the end of the reporting period.
Share Valuation: The net asset value per share of each class of shares of the Fund is calculated daily by dividing the total value of the assets attributable to that class, less liabilities attributable to that class, by the number of shares of that class outstanding.
The maximum offering price per share of Class A shares of the Fund is equal to the net asset value per share plus a sales load equal to 6.10% of the net asset value (or 5.75% of the offering price). The offering price of Class C shares and Class I shares is equal to the net asset value per share. The redemption price per share of each class of shares of the Fund is equal to the net asset value per share, except that certain purchases of $1 million or more of Class A shares are charged a contingent deferred sales charge of 1% if they are redeemed within 18 months of their purchase and Class C shares of each Fund are subject to a contingent deferred sales load of 1% on amounts redeemed within one year of purchase.
Exchange-Traded Funds (“ETFs”): The Fund may invest in ETFs, which are funds whose shares are traded on a national exchange. ETFs may be based on underlying equity or fixed income securities, as well as commodities or currencies. ETFs do not sell individual shares directly to investors and only issue their shares in large blocks known as “creation units.” The investor purchasing a creation unit then sells the individual shares on a secondary market. Although similar diversification benefits may be achieved through an investment in another investment company, ETFs generally offer greater liquidity and lower expenses. Because an ETF incurs its own fees and expenses, shareholders of a fund investing in an ETF will indirectly bear those costs. Such funds will also incur brokerage commissions and related charges when purchasing or selling shares of an ETF. Unlike typical investment company shares, which are valued once daily, shares in an ETF may be purchased or sold on a securities exchange throughout the trading day at market prices that are generally close to the Net Asset Value of the ETF.
Securities Transactions and Investment Income: Security transactions are accounted for on trade date. Gains and losses on securities sold are determined on a specific identification basis. Dividend income is recorded on the ex-dividend date. Interest income is recorded on the accrual basis.
Allocation Between Classes: Investment income earned, realized gains and losses, and unrealized appreciation and depreciation are allocated daily to each class of shares based upon its proportionate share of total net assets of the Fund. Class specific expenses are charged directly to the class incurring the expense. Common expenses which are not attributable to a specific class are allocated daily to each class of shares based upon its proportionate share of total net assets of the Fund.
Distributions to Shareholders: Dividends arising from net investment income, if any, are declared and paid at least annually to shareholders of the Fund. Net realized gains, if any, are distributed at least once each year. The amount of distributions from net investment income and net realized gains are determined in accordance with federal income tax regulations, which may differ from GAAP. These “book/tax” differences are either temporary or permanent in nature and are primarily due to losses deferred due to wash sales. Dividends and distributions are recorded on the ex-dividend date.
Use of Estimates: The preparation of financial statements in conformity with GAAP requires management to make estimates and assumptions that affect the reported amount of assets and liabilities, the disclosure of contingent assets and liabilities, and revenues and expenses during the reporting period. Actual results could differ from those estimates.
Federal Income Taxes: It is the Fund’s policy to comply with the special provisions of Subchapter M of the Internal Revenue Code of 1986, as amended, applicable to regulated investment companies. As provided therein, in any fiscal year in which a Fund so qualifies and distributes at least 90% of its taxable net income, the Fund (but not the shareholders) will be relieved of federal income tax on the income distributed. Accordingly, no provision for income taxes has been made.
In order to avoid imposition of the excise tax applicable to regulated investment companies, it is also the Fund’s intention to declare as dividends in each calendar year at least 98% of its net investment income (earned during the calendar year) and 98.2% of its net realized capital gains (earned during the twelve months ended October 31) plus undistributed amounts from prior years.
During the year ended April 30, 2013, cost of purchases and proceeds from sales and maturities of investment securities, other than short-term investments and U.S. government securities, were as follows:
| | | Stadion Market Opportunity Fund | |
| Purchases | | $ | 74,187,750 | |
| Sales | | $ | 83,542,938 | |
Reclassifications: As of April 30, 2013, permanent differences in book and tax accounting were reclassified. These differences had no effect on net assets and were primarily attributed to the tax treatment of net operating losses and small differences in the book and tax treatment of grantor trust income. The reclassifications were as follows:
| Accumulated Loss | | | Accumulated Capital Gain/(Loss) | | | Paid-in Capital | |
| $ | 55,735 | | | $ | (60,468 | ) | | $ | 4,733 | |
| | |
| Annual Report | April 30, 2013 | 13 |
| Stadion Market Opportunity Fund | Notes to Financial Statements |
| | April 30, 2013 |
The tax character of distributions made during the years ended April 30, 2013 and April 30, 2012 was as follows:
| Distributions Paid From: | | 2013 | | | 2012 | |
| Ordinary Income | | $ | 1,038,947 | | | $ | 2,025,299 | |
| Long-term capital gains | | | 3,232,828 | | | | 3,749,002 | |
| Total distributions | | $ | 4,271,775 | | | $ | 5,774,301 | |
Tax Basis of Investments: As of April 30, 2013, the aggregate cost of investments, gross unrealized appreciation/ (depreciation) and net unrealized appreciation for Federal tax purposes was as follows:
| | | Stadion Market Opportunity Fund | |
| Tax cost of portfolio investments | | $ | 19,300,448 | |
| Gross unrealized appreciation | | $ | 3,660,974 | |
| Gross unrealized depreciation | | | (18,185 | ) |
| Net unrealized appreciation on investments | | $ | 3,642,789 | |
The difference between the federal income tax cost of portfolio investments and the financial statement cost for the Fund is due to certain timing differences in the recognition of capital gains or losses under income tax regulations and GAAP. These “book/tax” differences are temporary in nature and are due to the tax deferral of losses on wash sales.
Components of Earnings: At April 30, 2013, components of distributable earnings were as follows:
| | | Stadion Market Opportunity Fund | |
| Undistributed ordinary income | | $ | 1,999,612 | |
| Accumulated capital gains | | | 1,151,358 | |
| Net unrealized appreciation on investments | | | 3,642,789 | |
| Total | | $ | 6,793,759 | |
Capital Losses: As of April 30, 2013, the Fund had no short-term capital loss carryforwards or long-term capital loss carryforwards for federal income tax purposes.
The Fund recognizes the tax benefits or expenses of uncertain tax positions only when the position is “more-likely-than-not” to be sustained assuming examination by tax authorities. Management has reviewed the tax positions taken on Federal income tax returns for all applicable open tax years (tax years ended April 30, 2010 through April 30, 2013) and has concluded that no provision for unrecognized tax benefits or expenses is required in these financial statements.
5. TRANSACTIONS WITH AFFILIATES
Investment Advisory Agreements
The Fund’s investments are managed by Stadion Money Management, LLC (the “Advisor”) under the terms of an Investment Advisory Agreement (the “Advisory Agreement”). Under the Advisory Agreement effective April 1, 2013, the Trust has agreed to pay the Advisor an investment advisory fee at an annual rate of 1.25% of its average daily net assets up to $150 million and 1.00% of such assets over $150 million. During the fiscal period April 1, 2013 to April 30, 2013 the Fund accrued investment advisory fees of $22,678.
The Advisor has entered into an Expense Limitation Agreement with respect to the Fund under which it has agreed to waive its fees and to assume other expenses of the Fund, if necessary, in an amount that limits the annual operating expenses of Class A shares, Class C shares and Class I shares of the Fund (exclusive of interest, taxes, brokerage commissions, extraordinary expenses, acquired fund fees and expenses and payments, if any, under the Rule 12b-1 Plan) to not more than 1.70% of the average daily net assets allocable to each Class until June 30, 2014. Accordingly, during the period from April 1, 2013 to April 30, 2013, the Advisor waived fees and reimbursed expenses of $15,914.
It is expected that the Expense Limitation Agreements will continue from year-to-year, provided such continuance is approved by the Trustees.
Effective April 1, 2013, the Chief Compliance Officer of the Trust is an employee of the Advisor. The Trust reimburses the Advisor $82,500 annually for the services provided by the Chief Compliance Officer of the Trust. Each Fund in the Trust bears a proportionate share of this fee based on an allocation approved by the Trustees.
Prior to the close of business on March 29, 2013, the Fund’s investment advisor was Aviemore Asset Management, LLC (the “Prior Adviser”). Under the Fund’s management agreement with the Prior Adviser, the Prior Adviser, at its own expense and without reimbursement from the Aviemore Funds, furnished office space and all necessary office facilities, equipment and executive personnel necessary for managing assets of the Predecessor Fund. The Prior Adviser paid all operating expenses of the Predecessor Fund, with the exception of taxes, borrowing expenses (such as (a) interest and (b) dividend expenses on securities sold short), brokerage commissions and extraordinary expenses. For its services, the Prior Adviser received an annual investment management fee of 1.75% of the average daily net assets of the Predecessor Fund up to and including $100 million and 1.50% of the average daily net assets in excess of $100 million. For the fiscal period May 1, 2012 to March 29, 2013 the Prior Adviser earned management fees totaling $432,625.
Prior to the close of business on March 29, 2013 Paul Michael Frank was the control person of the Prior Adviser and also served as a trustee and officer of the Predecessor Fund. This individual received benefits from the Prior Adviser resulting from management fees paid to the Prior Adviser by the Predecessor Fund.
Fund Accounting and Administration Agreement
Effective April 1, 2013, ALPS Fund Services, Inc. (“ALPS” and the “Administrator”) provides administrative, fund accounting and other services to the Funds under the Administration, Bookkeeping and Pricing Services Agreement with the Trust. Under the Agreement, ALPS is paid fees, accrued on a daily basis and paid on a monthly basis following the end of the month, based on the greater of (a) an
| Stadion Market Opportunity Fund | Notes to Financial Statements |
| | April 30, 2013 |
annual fee of $430,000 for the first year of the agreement and $460,000 thereafter, or (b) following basis point fee schedule:
| Average Total Net Assets | Contractual Fee |
| Between $0-$500M | 0.06% |
| $500M-$1B | 0.04% |
| Above $1B | 0.02% |
The Administrator is also reimbursed by the Funds for certain out-of-pocket expenses.
Transfer Agent And Shareholder Services Agreement
Effective April 1, 2013, ALPS serves as transfer, dividend paying and shareholder servicing agent for the Funds (the “Transfer Agent”) under a Transfer Agency and Services Agreement with the Trust. Under this Agreement, ALPS is paid an annual base fee of $25,000 per Fund plus fees for open accounts and is reimbursed for certain out-of-pocket expenses.
Distribution Plan
The Trust has adopted plans of distribution (the “Plans”) pursuant to Rule 12b-1 under the 1940 Act that permit Class A and Class C shares of each Fund to directly incur or reimburse the Fund’s principal underwriter for certain expenses related to the distribution of its shares. The annual limitation for payment of expenses pursuant to the Plans is 0.25% of average daily net assets attributable to Class A shares and 1.00% of average daily net assets attributable to Class C shares. The Trust has not adopted a plan of distribution with respect to Class I shares.
The expenses of the Plans are reflected as Distribution fees in the Statement of Operations of the Fund.
Distribution Agreement
Effective April 1, 2013, ALPS Distributors, Inc. (“ADI” or the “Distributor”) acts as the distributor of the Funds’ shares pursuant to a Distribution Agreement with the Trust. Under the terms of a Distribution Agreement with the Trust, the Distributor provides distribution services to the Trust and serves as principal underwriter to the Funds. ADI receives no compensation from the Fund.
Certain Trustees and Officers of the Trust are also Officers of the Advisor or of the Fund’s Administrator, Transfer Agent, or Distributor.
6. CAPITAL SHARE TRANSACTIONS
Proceeds and payments on capital shares as shown in the Statements of Changes in Net Assets are the result of the following capital share transactions for the periods shown:
| | For the Year Ended April 30, 2013 | For the Year Ended April 30, 2012 |
| Stadion Market Opportunity Fund - Class A | | |
| Shares sold | 119 | – |
| Shares redeemed | (1) | – |
| Net Increase in shares outstanding | 118 | – |
| Shares outstanding beginning of period | – | – |
| Shares outstanding end of period | 118 | – |
| | | |
| Stadion Market Opportunity Fund - Class C | | |
| Shares sold | 100 | – |
| Shares redeemed | – | – |
| Net Increase in shares outstanding | 100 | – |
| Shares outstanding beginning of period | – | – |
| Shares outstanding end of period | 100 | – |
| | | |
| Stadion Market Opportunity Fund - Class I | | |
| Shares sold | 446,757 | 883,321 |
| Shares issued in reinvestment of distributions to shareholders | 468,261 | 566,395 |
| Shares redeemed | (1,395,280) | (4,997,783) |
| Net Decrease in shares outstanding | (480,262) | (3,548,067) |
| Shares outstanding beginning of year | 2,638,010 | 6,186,077 |
| Shares outstanding end of year | 2,157,748 | 2,638,010 |
7. COMMITMENTS AND CONTINGENCIES
The Fund indemnifies the Trust’s officers and Trustees for certain liabilities that might arise from their performance of their duties to the Fund. Additionally, in the normal course of business, the Fund may enter into contracts that contain a variety of representations and warranties and that provide general indemnifications. The Fund’s maximum exposure under these arrangements is unknown, as this would involve future claims that may be made against the Fund that have not yet occurred. However, based on experience, the Fund expects the risk of loss to be remote.
The Fund has evaluated the need for disclosures and/or adjustments resulting from subsequent events through the date the financial statements were issued. Based on this evaluation, no adjustments were required to the financial statements as of April 30, 2013. However, the following are details relating to the subsequent events through the date the financial statements were issued. Effective May 31, 2013, the Fund changed it’s fiscal year from April 30 to May 31.
| | |
| Annual Report | April 30, 2013 | 15 |
| | Report of Independent Registered |
| Stadion Market Opportunity Fund | Public Accounting Firm |
To the Shareholders of Stadion Market Opportunity Fund and
The Board of Trustees of Stadion Investment Trust
We have audited the accompanying statement of assets and liabilities of Stadion Market Opportunity Fund (formerly known as ETF Market Opportunity Fund, a series of shares of beneficial interest of Aviemore Funds), a series of shares of beneficial interest of Stadion Investment Trust (the "Fund"), including the schedule of investments, as of April 30, 2013, and the related statements of operations and changes in net assets and the financial highlights for the year and period then ended. These financial statements and financial highlights are the responsibility of the Fund’s management. Our responsibility is to express an opinion on these financial statements and financial highlights based on our audit. The statement of changes in net assets for the year ended April 30, 2012 and the financial highlights for each of the years in the four-year period then ended were audited by other auditors whose report dated June 25, 2012, expressed an unqualified opinion on such financial statement and financial highlights.
We conducted our audit in accordance with the standards of the Public Company Accounting Oversight Board (United States). Those standards require that we plan and perform the audit to obtain reasonable assurance about whether the financial statements and financial highlights are free of material misstatement. An audit includes examining, on a test basis, evidence supporting the amounts and disclosures in the financial statements. Our procedures included confirmation of securities owned as of April 30, 2013 by correspondence with the custodian and brokers. An audit also includes assessing the accounting principles used and significant estimates made by management, as well as evaluating the overall financial statement presentation. We believe that our audit provides a reasonable basis for our opinion.
In our opinion, the financial statements and financial highlights referred to above present fairly, in all material respects, the financial position of Stadion Market Opportunity Fund as of April 30, 2013, and the results of its operations, the changes in its net assets and its financial highlights for the year and period then ended, in conformity with accounting principles generally accepted in the United States of America.
BBD, LLP
Philadelphia, Pennsylvania
June 26, 2013
| Stadion Market Opportunity Fund | Additional Information |
| | April 30, 2013 (Unaudited) |
The Trust files a complete listing of portfolio holdings of the Fund with the SEC as of the end of the first and third quarters of each fiscal year on Form N-Q. The filings are available free of charge, upon request, by calling 1-866-383-7636. Furthermore, you may obtain a copy of these filings on the SEC’s website at http://www.sec.gov. The Trust’s Forms N-Q may also be reviewed and copied at the SEC’s Public Reference Room in Washington, DC, and information on the operation of the Public Reference Room may be obtained by calling (800) SEC-0330.
A description of the policies and procedures that the Fund uses to determine how to vote proxies relating to portfolio securities is available without charge upon request by calling toll-free 1-866-383-7636, or on the SEC’s website at http://www.sec.gov. Information regarding how the Fund’s voted proxies relating to portfolio securities during the most recent 12-month period ended June 30 is also available without charge upon request by calling toll-free 1-866-383-7636, or on the SEC’s website at http://www.sec.gov.
Pursuant to Section 852(b)(3) of the Internal Revenue Code the Stadion Market Opportunity Fund designates $3,232,828 as long-term capital gain dividends.
CHANGE IN INDEPENDENT REGISTERED PUBLIC ACCOUNTING FIRM
On January 15, 2013, the Audit Committee of the Board of Trustees (the “Trustees”) of The Market Opportunity Fund (the “Fund”) recommended, and the Trustees appointed, BBD LLP as the Fund’s independent registered public accounting firm for the fiscal year ended April 30, 2013. The Predecessor Fund’s financial statements were audited by another independent registered public accounting firm. The previous reports issued by the other audit firm on the Fund’s financial statements for the fiscal years ended April 30, 2011 and April 30, 2012 contained no adverse opinion or disclaimer of opinion nor were they qualified or modified as to uncertainty, audit scope or accounting principles.
| | |
| Annual Report | April 30, 2013 | 17 |
| Stadion Market Opportunity Fund | Board of Trustees and Executive Officers |
| | April 30, 2013 (Unaudited) |
STADION INVESTMENT TRUST
BOARD OF TRUSTEES AND EXECUTIVE OFFICERS
The Board of Trustees has overall responsibility for management of the Trust’s affairs. The Trustees serve during the lifetime of Trust and until its termination, or until death, resignation, retirement or removal. The Trustees, in turn, elect the officers of the Trust to actively supervise its day-to-day operations. The officers have been elected for an annual term. The Fund’s SAI includes additional information about the Trustees and is available without charge upon request by calling 1-866-383-7636 or on the Fund’s website, www.stadionfunds.com. The Independent Trustees of the Fund and Predecessor Fund received aggregate compensation of $8,000 and $560, respectively, during the fiscal year ended April 30, 2013 for their services to the Fund and Predecessor Fund. Interested Trustees and Officers did not receive compensation from the Fund for the services to the Fund and the Trust. The following are the Trustees and executive officers of the Trust:
| Name and Age | Position(s) held with Trust | Length of Time Served | Principal Occupation(s) During Past 5 Years | Number of Funds in Fund Complex* Overseen by Trustee | Other Directorships Held by Trustee During the Past 5 Years |
| INDEPENDENT TRUSTEES |
| James M. Baker (age 61 ) | Trustee | Since June 2003 | Mr. Baker has been the President of Baker & Lassiter, Inc. (real estate development and management) since 1994. | 6 | Mr. Baker serves as a director of Resurgens Bank, a closely held state chartered bank. |
| Norman A. McLean (age 58) | Trustee | Since June 2003 | Mr. McLean has been the Director of Marketing/Public Relations for St. Mary’s Health Care System (health care) since September 2005. | 6 | None |
| Ronald C. Baum (age 71) | Trustee | Since July 2011 | Mr. Baum was a Managing Partner for the Atlanta office of Grant Thornton LLP (public accounting firm) from 1987 through 2002. | 6 | None |
| INTERESTED TRUSTEE** |
| Gregory L. Morris (age 65 ) | Trustee and Chairman | Since June 2007 | Mr. Morris has been a portfolio manager of the Advisor and its predecessor firm (Stadion Money Management, Inc.) since November 2004 and is a member of the Advisor’s investment committee. | 6 | None |
| |
| OTHER EXECUTIVE OFFICERS |
| Judson P. Doherty (age 44) | President (Principal Executive Officer) | Since June 2006 | Mr. Doherty has been President of the Advisor and its predecessor firm (Stadion Money Management, Inc.) since 2007. He was Chief Financial Officer of Stadion Money Management, Inc. from 2001 until 2011 and Chief Compliance Officer of Stadion Money Management, Inc. and the Trust from 2004 to 2010. He is also a member of the Advisor’s investment committee. | n/a | None |
| Stadion Market Opportunity Fund | Board of Trustees and Executive Officers |
| | April 30, 2013 (Unaudited) |
| Name and Age | Position(s) held with Trust | Length of Time Served | Principal Occupation(s) During Past 5 Years | Number of Portfolios in Fund Complex* Overseen by Trustee | Other Directorships Held by Trustee During the Past 5 Years |
| Duane A. Bernt (age 42) | Treasurer (Principal Financial Officer) | Since October 2012 | Mr. Bernt has been the Chief Financial Officer of the Advisor since 2011. Previously, he was a Senior Vice President of Lincoln Financial Group (a financial services firm) from 1998 to 2011. | n/a | None |
| Michael D. Isaac (age 37) | Chief Compliance Officer | Since April 2010 | Mr. Isaac has been the Chief Compliance Officer of the Advisor and its predecessor firm (Stadion Money Management, Inc.) since 2010. Previously, he was Chief Compliance Officer of J.P. Turner & Company LLC (a broker/dealer) from 2006 to 2010. | n/a | None |
Jennifer Welsh (age 35) 1290 Broadway, Suite 1100 Denver, Colorado 80203 | Secretary | Since April 2013 | Ms. Welsh, Vice President & Associate Counsel for ALPS Fund Services, Inc., joined ALPS in 2013. She is also Vice President and Associate Counsel of ALPS Distributors, Inc., ALPS Advisors, Inc. and ALPS Portfolio Solutions Distributors, Inc. Before joining ALPS, Ms. Welsh served as Associate General Counsel and Chief Compliance Officer of Boulder Investment Advisers LLC and Rocky Mountain Advisers, LLC, Chief Compliance Officer of Stewart Investment Advisers, Boulder Growth & Income Fund, Inc., Boulder Total Return Fund, Inc., The Denali Fund Inc. and First Opportunity Fund, Inc., and Associate General Counsel of Fund Administrative Services, LLC from 2010 to 2012. Ms. Welsh also was Associate Attorney at Davis, Graham & Stubbs, LLP from 2007 to 2010. | n/a | None |
Alan Gattis (age 33) 1290 Broadway, Suite 1100 Denver, Colorado 80203 | Assistant Treasurer | Since April 2013 | Mr. Gattis, Fund Controller for ALPS Fund Services, Inc., joined ALPS in 2011. Previously, he was an Audit Manager for Spicer Jeffries LLP (a public accounting firm) from 2009 until 2011. He was an auditor for PricewaterhouseCoopers LLP from 2004 until 2009. | n/a | None |
| * | The Fund Complex consists of the Stadion Managed Portfolio, Stadion Core Advantage Portfolio, Stadion Olympus Fund, Stadion Trilogy Fund, Stadion Tactical Income Fund and Market Opportunity Fund |
| ** | Gregory L. Morris is an Interested Trustee because he is an employee of the Advisor. |
| | |
| Annual Report | April 30, 2013 | 19 |
| | Approval of Investment |
| Stadion Market Opportunity Fund | Advisory Agreement |
| | April 30, 2013 (Unaudited) |
APPROVAL OF INVESTMENT ADVISORY AGREEMENT
The Board of Trustees (the “Board”), including the Independent Trustees voting separately, has reviewed and approved the Investment Advisory Agreement (the “Advisory Agreement”) with the Advisor for the Market Opportunity Fund. Approval took place at an in-person meeting held on January 15, 2013, at which all of the Trustees were present.
In the course of their deliberations, the Board was advised by legal counsel and the Independent Trustees were advised by independent legal counsel. The Board received and reviewed a substantial amount of information provided by the Advisor in response to requests of the Board and counsel.
In considering the approval of the Advisory Agreement and reaching their conclusions with respect thereto, the Board reviewed and analyzed various factors that they determined were relevant, including the factors described below:
| | i) | The nature, extent, and quality of the services to be provided by the Advisor. In this regard, the Board considered the responsibilities the Advisor would have under the Advisory Agreement. Accordingly, the Board considered the services that would be provided by the Advisor to the Market Opportunity Fund including, without limitation, its investment advisory services, its coordination of services for the Market Opportunity Fund by the Fund’s service providers, its compliance procedures and practices, and its efforts to promote the Market Opportunity Fund and assist in its distribution. The Board noted that many of the Trust’s executive officers are employees of the Advisor, and (with the exception of the CCO) serve the Trust without additional compensation from the Market Opportunity Fund. The Board was mindful that the investment process that will be used by the Advisor in managing the Market Opportunity Fund is substantially similar to that used to manage the Aviemore ETF Market Opportunity Fund, the predecessor to the Market Opportunity Fund (the “predecessor fund”). After reviewing the foregoing information and further information in the materials provided to the Board by the Advisor (including descriptions of the Advisor’s business and the Advisor’s Form ADV), the Board concluded that the quality, extent, and nature of the services provided by the Advisor are satisfactory and adequate for the Market Opportunity Fund. |
| | ii) | The investment management capabilities and experience of the Advisor. In this regard, the Board discussed with the Advisor the investment objective and strategies for the Market Opportunity Fund and noted that they are substantially similar to those of the predecessor fund. The Board evaluated the investment management experience of the Advisor and the management capabilities of Mr. Paul Frank as portfolio manager to the predecessor fund. The Board determined that continuity to the investment process should be achieved through the retention of Mr. Frank as a portfolio manager of the Market Opportunity Fund and took note that the predecessor fund has achieved a very good performance record. The Board noted that the Market Opportunity Fund may benefit from the research, compliance and other resources of the Advisor and the opportunity for Mr. Frank to devote full attention to the portfolio management of the Fund. After consideration of these factors, as well as the Advisor’s capabilities and experience in managing the existing series of the Trust, the Board determined that the Advisor would be an appropriate manager for the Market Opportunity Fund. |
| | iii) | The costs of the services to be provided and profits to be realized by the Advisor from its relationship with the Market Opportunity Fund. In this regard, the Board examined and evaluated the arrangements between the Advisor and the Market Opportunity Fund under the proposed Investment Advisory Agreement. The Board considered the Advisor’s staffing, personnel, and methods of operating; the Advisor’s compliance policies and procedures; the financial condition of the Advisor and the level of commitment to the Market Opportunity Fund and the Advisor by the principals of the Advisor; the projected asset levels of the Market Opportunity Fund; the Advisor’s commitment to pay the customary expenses related to the Reorganization of the predecessor fund into the Market Opportunity Fund and startup costs for the Market Opportunity Fund and the overall expenses of the Market Opportunity Fund. The Board reviewed the Market Opportunity Fund’s proposed Expense Limitation Agreement with the Advisor and noted the benefit that would result to the Market Opportunity Fund from the Advisor’s likely waiver of a portion of its management fees for a period of time based on the projected asset levels of the Market Opportunity Fund. |
The Board also considered potential benefits to the Advisor in managing the Market Opportunity Fund, including promotion of the Advisor’s name and the ability of the Market Opportunity Fund to retain the performance and accounting history of the predecessor fund. The Board compared the fees and expenses of the Market Opportunity Fund (including the management fee) to peer groups of other funds in the Morningstar category considered by the Advisor to have similar investment objectives and strategies as the Market Opportunity Fund. The Board determined that while the Market Opportunity Fund’s management fee and net expense ratio are higher than the average of the other funds included in its peer group, they are within the range of its peers. The Board also compared the fees to be paid by the Market Opportunity Fund to the fees paid by other clients of the Advisor, and considered the similarities and differences of services received by such other clients as compared to the services that will be received by the Market Opportunity Fund. Following these comparisons and upon further consideration and discussion of the foregoing, the Board concluded that the fees to be paid to the Advisor by the Market Opportunity Fund are appropriate and within the range of what would have been negotiated at arm’s length.
| | Approval of Investment |
| Stadion Market Opportunity Fund | Advisory Agreement |
| | April 30, 2013 (Unaudited) |
| | iv) | The extent to which economies of scale would be realized as the Market Opportunity Fund grows and whether management fee levels reflect these economies of scale for the benefit of the Fund’s investors. In this regard, the Board considered that the Market Opportunity Fund’s fee arrangements with the Advisor involve both a management fee breakpoint and a proposed Expense Limitation Agreement. The Board considered that the Market Opportunity Fund would likely experience benefits from the Expense Limitation Agreement and would continue to do so until the Market Opportunity Fund’s assets grow to a level where the Advisor begins to receive the full fee. Thereafter, the Board noted that the Market Opportunity Fund has the potential to benefit from economies of scale under its agreements with the Advisor (e.g., through the breakpoint) and other service providers. Following further discussion of the Market Opportunity Fund’s projected asset levels, expectations for growth and level of fees, the Board determined that the Market Opportunity Fund’s fee arrangements with the Advisor would provide benefits through the proposed Expense Limitation Agreement and that, at the Market Opportunity Fund’s projected asset levels, the Fund’s arrangements with the Advisor are fair and reasonable. |
| | v) | The Advisor’s practices regarding brokerage and portfolio transactions. In this regard, the Board considered the Advisor’s standards, and performance in utilizing those standards, to seek best execution for the Market Opportunity Fund’s portfolio transactions. The Board also considered the anticipated portfolio turnover rate for the Market Opportunity Fund; the process by which evaluations are made of the overall reasonableness of commissions paid; the method and basis for selecting and evaluating the broker-dealers used; any anticipated allocation of portfolio business to persons affiliated with the Advisor; the process by which the Advisor will aggregate the securities to be sold or purchased for the Market Opportunity Fund with those to be sold or purchased for other managed accounts; and the extent to which the Advisor expects to allocate the Market Opportunity Fund’s portfolio business to broker-dealers who provide research, statistical, or other services (“soft dollars”). After further review and discussion, the Board determined that the Advisor’s practices regarding brokerage and portfolio transactions are satisfactory. |
| | vi) | Possible conflicts of interest. In evaluating the possibility for conflicts of interest, the Board considered such matters as the experience and abilities of the advisory personnel assigned to the Market Opportunity Fund; the basis of decisions to buy or sell securities for the Market Opportunity Fund and/or the Advisor’s other accounts; the method for bunching of portfolio securities transactions; and the substance and administration of the Advisor’s code of ethics. Following further consideration and discussion, the Board found the Advisor’s standards and practices relating to the identification and mitigation of potential conflicts of interests to be satisfactory. |
Conclusion
After full consideration of the above factors as well as other factors, the Board unanimously concluded that approval of the Advisory Agreement was in the best interests of the Fund and its shareholders. No single factor was considered in isolation or to be determinative to the decision of the Trustees to approve the Advisory Agreement. Rather, the Trustees concluded, in light of their weighing and balancing all factors, that approval of the Advisory Agreement was in the best interests of the Fund and its shareholders.
| | |
| Annual Report | April 30, 2013 | 21 |
| Stadion Market Opportunity Fund | Shareholder Meeting Voting Results |
| | April 30, 2013 (Unaudited) |
On March 28, 2013, the Predecessor Fund held a Special Meeting of Shareholders to consider the proposal set forth below. The following votes were recorded:
Proposal 1: Approval of the Reorganization
| | # of Votes Cast | % of Votes Cast |
| For | 1,054,678 | 86.15% |
| Against | 46,572 | 3.80% |
| Abstain | 122,928 | 10.04% |
| TOTAL | 1,224,178 | 100.00% |
Page Intentionally Left Blank
Page Intentionally Left Blank
This report and the financial statements contained herein are submitted for the general information of the shareholders of the Stadion Market Opportunity Fund (the “Fund”). This report is not authorized for distribution to prospective investors in the Fund unless preceded or accompanied by an effective prospectus. Mutual fund shares are not deposits or obligations of, or guaranteed by, any depository institution. Shares are not insured by the FDIC, Federal Reserve Board or any other agency, and are subject to investment risks, including possible loss of principal amount invested. Neither the Fund nor the Fund’s distributor is a bank.
The Stadion Market Opportunity Fund is distributed by ALPS Distributors, Inc.
As of the end of the period covered by this report, the registrant has adopted a code of ethics that applies to the registrant’s principal executive officer, principal financial officer, principal accounting officer or controller, or persons performing similar functions, regardless of whether these individuals are employed by the registrant or a third party. Pursuant to Item 12(a)(1), a copy of registrant’s code of ethics has been filed with the Commission. During the period covered by this report, the code of ethics has not been amended, and the registrant has not granted any waivers, including implicit waivers, from the provisions of the code of ethics.
| Item 3. | Audit Committee Financial Expert. |
The registrant’s board of trustees has determined that the registrant has at least one audit committee financial expert serving on its audit committee. The name of the audit committee financial expert is Ronald C. Baum. Mr. Baum is “independent” for purposes of this Item.
| Item 4. | Principal Accountant Fees and Services. |
(a) Audit Fees. For the Registrant's fiscal years ended April 30, 2013 and April 30, 2012, the aggregate fees billed for professional services rendered by the principal accountant for the audit of the registrant’s annual financial statements or for services that are normally provided by the accountant in connection with statutory and regulatory filings or engagements were $12,500 and $15,000, respectively. For the registrant's fiscal year ended April 30, 2013, BBD LLP served as principal accountant and for the registrant's fiscal year ended April 30, 2012, another independent registered public accounting firm served as principal accountant. In 2013, the amount of $12,500 was paid to BBD LLP and in 2012, the amount of $15,000 was paid to the prior independent registered public accounting firm.
(b) Audit-Related Fees. No fees were billed in either of the last two fiscal years for assurance and related services by either principal accountant that are reasonably related to the performance of the audit of the registrant’s financial statements and are not reported under paragraph (a) of this Item.
(c) Tax Fees. For the registrant’s fiscal years ended April 30, 2013 and April 30, 2012, aggregate fees of $2,000, and $5,000, respectively, were billed for professional services rendered by the principal accountant for tax compliance, tax advice, and tax planning. The registrant’s fiscal year ended April 30, 2013, BBD LLP served as principal accountant and for registrant’s fiscal year ended April 30, 2012, another independent registered public accounting firm served as principal accountant. In 2013, the amount of $2,000 was paid to BBD LLP and in 2012; $5,000 was paid to the prior independent registered public accounting firm.
(d) All Other Fees.
(e)(1) The audit committee has not adopted pre-approval policies and procedures described in paragraph (c)(7) of Rule 2-01 of Regulation S-X.
(e)(2) None of the services described in paragraph (b) through (d) of this Item were approved by the audit committee pursuant to paragraph (c)(7)(i)(C) of Rule 2-01 of Regulation S-X.
(f) Less than 50% of hours expended on the principal accountant’s engagement to audit the registrant’s financial statements for the most recent fiscal year were attributed to work performed by persons other than the principal accountant’s full-time, permanent employees.
(g) During the fiscal years ended April 30, 2013 and 2012, aggregate non-audit fees of $0 and $0, respectively, were billed by the registrant’s accountant for services rendered to the registrant. No non-audit fees were billed in either of the last two fiscal years by the registrant’s accountant for services rendered to the registrant’s investment adviser (not including any sub-adviser whose role is primarily portfolio management and is subcontracted with or overseen by another investment adviser), and any entity controlling, controlled by, or under common control with the adviser that provides ongoing services to the registrant.
(h) The principal accountant has not provided any non-audit services to the registrant’s investment adviser (not including any sub-adviser whose role is primarily portfolio management and is subcontracted with or overseen by another investment adviser), and any entity controlling, controlled by, or under common control with the investment adviser that provides ongoing services to the registrant.
| Item 5. | Audit Committee of Listed Registrants. |
Not applicable
| Item 6. | Schedule of Investments. |
(a) Schedule filed with Item 1
(b) Not applicable
| Item 7. | Disclosure of Proxy Voting Policies and Procedures for Closed-End Management Investment Companies. |
Not applicable
| Item 8. | Portfolio Managers of Closed-End Management Investment Companies. |
Not applicable
| Item 9. | Purchases of Equity Securities by Closed-End Management Investment Company and Affiliated Purchasers. |
Not applicable
| Item 10. | Submission of Matters to a Vote of Security Holders. |
The registrant does not have procedures in place to consider nominees recommended by shareholders. The registrant’s nominating committee generally will not consider nominees recommended by shareholders.
| Item 11. | Controls and Procedures. |
(a) Based on their evaluation of the registrant’s disclosure controls and procedures (as defined in Rule 30a-3(c) under the Investment Company Act of 1940) as of a date within 90 days of the filing date of this report, the registrant’s principal executive officer and principal financial officer have concluded that such disclosure controls and procedures are reasonably designed and are operating effectively to ensure that material information relating to the registrant, including its consolidated subsidiaries, is made known to them by others within those entities, particularly during the period in which this report is being prepared, and that the information required in filings on Form N-CSR is recorded, processed, summarized, and reported on a timely basis.
(b) There were no changes in the registrant’s internal control over financial reporting (as defined in Rule 30a-3(d) under the Investment Company Act of 1940) that occurred during the second fiscal quarter of the period covered by this report that have materially affected, or are reasonably likely to materially affect, the registrant’s internal control over financial reporting.
File the exhibits listed below as part of this Form. Letter or number the exhibits in the sequence indicated.
(a)(1) Any code of ethics, or amendment thereto, that is the subject of the disclosure required by Item 2, to the extent that the registrant intends to satisfy the Item 2 requirements through filing of an exhibit: Attached hereto
(a)(2) A separate certification for each principal executive officer and principal financial officer of the registrant as required by Rule 30a-2(a) under the Act (17 CFR 270.30a-2(a)): Attached hereto
(a)(3) Any written solicitation to purchase securities under Rule 23c-1 under the Act (17 CFR 270.23c-1) sent or given during the period covered by the report by or on behalf of the registrant to 10 or more persons: Not applicable
(b) Certifications required by Rule 30a-2(b) under the Act (17 CFR 270.30a-2(b)): Attached hereto
EXHIBIT LIST
| Exhibit 99.CODE ETH | Code of Ethics |
| Exhibit 99.CERT | Certifications required by Rule 30a-2(a) under the Act |
| Exhibit 99.906CERT | Certifications required by Rule 30a-2(b) under the Act |
SIGNATURES
Pursuant to the requirements of the Securities Exchange Act of 1934 and the Investment Company Act of 1940, the registrant has duly caused this report to be signed on its behalf by the undersigned, thereunto duly authorized.
| (Registrant) | Stadion Investment Trust | |
| | | | |
| By (Signature and Title)* | /s/ Judson P. Doherty | |
| | | Judson P. Doherty, President and Principal Executive Officer |
| | | | |
| Date | July 8, 2013 | | |
Pursuant to the requirements of the Securities Exchange Act of 1934 and the Investment Company Act of 1940, this report has been signed below by the following persons on behalf of the registrant and in the capacities and on the dates indicated.
| By (Signature and Title)* | /s/ Judson P. Doherty | |
| | | Judson P. Doherty, President and Principal Executive Officer |
| | | | |
| Date | July 8, 2013 | | |
| | | | |
| By (Signature and Title)* | /s/ Duane L. Bernt | |
| | | Duane L. Bernt, Treasurer and Principal Financial Officer |
| | | | |
| Date | July 8, 2013 | | |
| * | Print the name and title of each signing officer under his or her signature. |