Form N-CSR is to be used by management investment companies to file reports with the Commission not later than 10 days after the transmission to stockholders of any report that is required to be transmitted to stockholders under Rule 30e-1 under the Investment Company Act of 1940 (17 CFR 270.30e-1). The Commission may use the information provided on Form N-CSR in its regulatory, disclosure review, inspection, and policymaking roles.
A registrant is required to disclose the information specified by Form N-CSR, and the Commission will make this information public. A registrant is not required to respond to the collection of information contained in Form N-CSR unless the Form displays a currently valid Office of Management and Budget ("OMB") control number. Please direct comments concerning the accuracy of the information collection burden estimate and any suggestions for reducing the burden to Secretary, Securities and Exchange Commission, 450 Fifth Street, NW, Washington, DC 20549-0609. The OMB has reviewed this collection of information under the clearance requirements of 44 U.S.C. § 3507.
Annual Report 2011
Stadion Managed Portfolio
Stadion Core Advantage Portfolio
May 31, 2011
This report and the financial statements contained herein are submitted for the general information of the shareholders of the Stadion Funds (the “Funds”). This report is not authorized for distribution to prospective investors in the Funds unless preceded or accompanied by an effective prospectus. Mutual fund shares are not deposits or obligations of, or guaranteed by, any depository institution. Shares are not insured by the FDIC, Federal Reserve Board or any other agency, and are subject to investment risks, including possible loss of principal amount invested. Neither the Funds nor the Funds’ distributor is a bank.
Distributor: Ultimus Fund Distributors, LLC, Phone 1-866-383-7636.
STADION INVESTMENT TRUST LETTER TO SHAREHOLDERS | |
Dear Stadion Shareholder,
Enclosed for your review is the annual report for the fiscal year ended May 31, 2011 for Stadion Managed Portfolio (formerly PMFM Managed Portfolio Trust) and Stadion Core Advantage Portfolio (formerly PMFM Core Advantage Portfolio Trust), each a series of Stadion Investment Trust. In managing each Fund, we use our proprietary technically driven rules-based model to assess the risk of being invested or not being invested in the market. As explained below, the first part of the fiscal year ended May 31, 2011 began during a market correction (decline > -10%) which began on April 23, 2010, a period of time in which we were defensively positioned. A substantial bull move began in late August which lasted until February, 2011. From February until the end of this reporting period, May 31, 2011, the market once again put us into our defensive mode. When we are defensive, Managed Portfolio is generally invested 100% in cash equivalents and Core Advantage is generally invested 50% in cash equivalents.
MARKET AND FUNDS PERFORMANCE OVERVIEW
During the 12 months ended May 31, 2011, the equity market averages experienced positive returns. The S&P 500 Index was up 25.95%, the Nasdaq Composite Index was up 26.78%, the Russell 2000 Index was up 26.75%, and the Dow Jones Industrial Average was up 27.30%. During this same period, Managed Portfolio – Class A was up 4.07% and Core Advantage Portfolio – Class A was up 14.68% (excluding the impact of sales charges – the maximum sales charge is 5.75%).
The fiscal year began with the market in a correction (decline > -10%) which carried through until late August. A small rally began in early July which caused our trend following model to become invested by late July, but it was short-lived and took us back to defensive status by early August. This brief period of being in the market caused a whipsaw (explained later). Finally a good up move in the market began in late August, and we became fully invested shortly thereafter. This rally continued until early November when there was a mild pullback (explained later) which caused a few of our holdings to hit their protective stops. This did not last long and the rally began again in mid-November and once again we quickly became fully invested. In February, 2011, the internal measures of the market began to deteriorate and we soon had most of our holdings hit their protective stops.
The decline from mid-February lasted until mid-March when, once again, a rally began. This got us into a fully invested position again but soon thereafter the rally failed and began to take us out of our positions as our protective stops were hit. This resulted in the first whipsaw we had seen in quite some time. The rally terminated in late April resulting in a fully defensive posture on May 23, 2011.
During this past fiscal year, our rules-based technical model experienced a few whipsaws. Recall, if the market experiences a downward trend, our stop-loss protection is designed to take us to a defensive position. The act of being invested in a market rally and soon thereafter being stopped out of the position(s) is called a whipsaw. While we do not like to experience whipsaws, we believe they are a small price to pay in order to preserve assets from potentially huge market declines. When we discuss a “defensive posture” or “defensive position” we generally mean a Fund is substantially invested in cash and cash equivalents. See the discussion below for a better understanding of each Fund’s investment strategy in the tactically managed portion of its portfolio.
The Funds experienced four significant periods during the fiscal year when they were in a defensive posture, with the last one continuing at the end of the fiscal year. These periods were from June to early August, again from early November through late November (only partially defensive), again in mid February until late March, and beginning in late
STADION INVESTMENT TRUST
LETTER TO SHAREHOLDERS (Continued)
April through the end of the fiscal year. During the periods when we were invested, we owned a large variety of ETFs across a broad spectrum of asset classes and sectors. Our process for entering the markets when our model identifies an uptrend is to stick with large liquid market-based ETFs, and then as the trend is more fully developed, exposure can become broader. During periods when our model is calling for a fully invested position, we also utilize an active “trade up” process, which means every day we evaluate all holdings, along with all available ETFs and will sell any holding that we believe can be replaced by a better performing holding.
MARKET OUTLOOK
We believe our money management style has to be observed over the full cycle of a bull/bear market to fully realize the value of this style of investing. Because of our risk adverse methodology, we will generally underperform during up markets because we may miss some of the initial upswing in the market and we will not remain invested when the market experiences a pull back or correction, and therefore we may drop behind. However, when the market experiences a major decline (there have been two bear markets in the last eleven years), we typically expect to outperform the major equity market indices. In our view, there will be more bear markets. In the last 110 years, there have been 33 bear markets (declines > -20%) using the Dow Jones Industrial Average for this measurement. We do not forecast the market; in fact, we strongly believe no one can. We react to the market using our rules-based, trend-following model which is designed to measure what the market is doing. We then utilize our model to tell us how to trade. Finally we have the discipline to adhere to our strategy. In our view, that keeps the subjectivity and human emotion out of the process. Our goal of preserving hard-earned capital is designed to make investing more enjoyable and certainly more comfortable. Hence, we will continue to follow our trend following model and let it separate us from the emotion-driven world of forecast and prediction.
STADION ACTIVE MANAGEMENT STRATEGY
Our Funds are managed using a tactical management strategy; however, Core Advantage Portfolio uses a core-satellite approach where the core position is strategically managed and is discussed below. Tactical management means that we assess the risks of the market by using a technically driven rules-based model. We determine the amount of assets to commit to the equity market using this model. We invest in the markets when, based on our model, we have a positive expectation of profit. As trend followers, when our model identifies an uptrend and we commit to it, we only have an expectation that the trend will continue. If it doesn’t, our stop loss protection will take us out. Our portfolios generally include Exchange Traded Funds (ETFs), cash, and cash equivalents. This strategy is designed to take us into defensive positions when our model identifies unfavorable trends in the market. To select investments, we utilize our proprietary technical ranking and screening system, which looks at the individual performance measures of each ETF, the ETF’s relative performance to the overall market, its performance relative to its associated market sector, and a number of other technical measures. Once we purchase an ETF, we manage it based upon its performance; due to stop-loss protections built into our model and aggressive trading up, we generally will not continue to hold an asset that is not performing well. This approach is designed to help limit losses during significant market declines and take advantage of market upswings. Our overall approach is defensive in nature and adheres to our overall philosophy that we can try to win by not losing. Our goal has always been the same; we try to participate in the good up trends and we try to avoid the down trends.
STADION INVESTMENT TRUST
LETTER TO SHAREHOLDERS (Continued)
STADION CORE ADVANTAGE PORTFOLIO
This Fund is our growth portfolio and is set up in a core-satellite structure. This means that approximately 50% of the Fund (satellite) is actively managed using our tactical model, while the remaining approximately 50% (core) is strategically managed and remains fully invested at all times. The core portion is invested in broad-based market index ETFs and major sector-based ETFs. The percentages of holdings of each are determined by the relative strength of these asset classes. The satellite portion is actively managed primarily using market sectors, broad-based indices, international, and at times, specialty ETFs. Historically, each year a few asset classes will outperform the general market and the goal for this portion of the Core Advantage Portfolio is to capitalize on that performance using our technical ranking and screening system, which is geared to not only individual ETF performance, but also relative performance. This Fund may be appropriate for those who want approximately half of their investment positioned in the market at all times, with the remainder being managed using our tactical models that are designed to take defensive positions during down markets.
STADION MANAGED PORTFOLIO
This Fund is our moderate portfolio, and is managed based upon our rules-based technical model. While this Fund takes a moderate approach in an effort to achieve equity-like returns, it differs from Stadion Core Advantage Portfolio in that it is more likely to take a fully defensive position (i.e., 100% invested in cash or cash equivalents) as determined by our technical model. This Fund is managed similarly to the satellite (tactically managed) portion of Stadion Core Advantage Portfolio. It is appropriate for those who prefer a fully active approach to managing their money.
Thank you for your continued support and allowing us to serve you and the Funds. Please feel free to contact us with any questions or concerns.
Sincerely,
Stadion Money Management
Greg Morris
Chairman, Investment Committee
The views in this report were those of the Funds’ investment adviser as of the date of this Report and may not reflect their views on the date this report is first published or anytime thereafter. These views are intended to assist shareholders in understanding their investment in the Funds and do not constitute investment advice.
The performance information quoted above represents past performance and past performance does not guarantee future results. Investment return and principal value of an investment will fluctuate so that an investor’s shares, when redeemed, may be worth more or less than their original cost. Current performance may be lower or higher than the performance data quoted. Performance data, current to the most recent month end, may be obtained by calling 1-800-222-7636. An investor should consider a Fund’s investment objectives, risks, and charges and expenses carefully before investing. The Funds’ prospectus contains this and other important information. For information on the Funds’ expense ratios, please see the Financial Highlights tables found within this Report.
STADION INVESTMENT TRUST
LETTER TO SHAREHOLDERS (Continued)
Investment in the Funds is subject to investment risks, including, without limitation, market risk, management style risk, risks related to “fund of funds” structure, sector risk, fixed income risk, tracking risk, risks related to ETF net asset value and market price, foreign securities risk, risks related to portfolio turnover and small capitalization companies risk. Since each Stadion Fund is a “fund of funds,” an investor will indirectly bear fees and expenses charged by the underlying ETFs and investment companies in which a Stadion fund invests in addition to a Stadion Fund’s direct fees and expenses. More information about these risks and other risks can be found in the Funds’ prospectus.
STADION MANAGED PORTFOLIO PERFORMANCE INFORMATION May 31, 2011 (Unaudited) |
Comparison of the Change in Value of a $10,000 Investment
in Stadion Managed Portfolio(a), the S&P 500 Index and
80% S&P 500 Index/20% Barclays Capital U.S. Aggregate Bond Index

Average Annual Total Returns(b)
(for periods ended May 31, 2011)
| | |
| Stadion Managed Portfolio - Class A | -1.94% | 2.42% |
| Stadion Managed Portfolio - Class C | 3.15% | 2.20% |
| Stadion Managed Portfolio - Class I | 4.38% | 4.34% |
| S&P 500 Index | 25.95% | 2.57%(d) |
| 80% S&P 500 Index/20% Barclays Capital U.S. Aggregate Index | 21.91% | 3.59%(d) |
| (a) | The line graph above represents performance of Class A shares only, which will vary from the performance of Class C and Class I shares based on the difference in loads and fees paid by shareholders in different classes. The change in value of the initial $10,000 investment shown for Class A shares in the line graph reflects the maximum front-end sales load of 5.75%. |
| (b) | Total return is a measure of the change in value of an investment in the Fund over the periods covered, which assumes any dividends or capital gains distributions are reinvested in shares of the Fund. Returns do not reflect the deduction of taxes a shareholder would pay on Fund distributions or the redemption of Fund shares. Total returns shown do include the effect of applicable sales loads. |
| (c) | The initial public offering of Class A shares commenced on September 15, 2006. The initial public offering of Class C shares commenced on October 1, 2009. The initial public offering of Class I shares commenced on May 28, 2010. |
| (d) | Represents the period from September 15, 2006 (date of original public offering of Class A shares) through May 31, 2011. |
STADION CORE ADVANTAGE PORTFOLIO PERFORMANCE INFORMATION May 31, 2011 (Unaudited) |
Comparison of the Change in Value of a $10,000 Investment
in Stadion Core Advantage Portfolio(a), the S&P 500 Index and
80% S&P 500 Index/20% Barclays Capital U.S. Aggregate Bond Index

Average Annual Total Returns(b)
(for periods ended May 31, 2011)
| | |
| Stadion Core Advantage Portfolio - Class A | 8.12% | 2.14% |
| Stadion Core Advantage Portfolio - Class C | 13.96% | 10.95% |
| Stadion Core Advantage Portfolio - Class I | 15.07% | 14.94% |
| S&P 500 Index | 25.95% | 2.57%(d) |
| 80% S&P 500 Index/20% Barclays Capital U.S. Aggregate Bond Index | 21.91% | 3.59%(d) |
| (a) | The line graph above represents performance of Class A shares only, which will vary from the performance of Class C and Class I shares based on the difference in loads and fees paid by shareholders in different classes. The change in value of the initial $10,000 investment shown for Class A shares in the line graph reflects the maximum front-end sales load of 5.75%. |
| (b) | Total return is a measure of the change in value of an investment in the Fund over the periods covered, which assumes any dividends or capital gains distributions are reinvested in shares of the Fund. Returns do not reflect the deduction of taxes a shareholder would pay on Fund distributions or the redemption of Fund shares. Total returns shown do include the effect of applicable sales loads. |
| (c) | The initial public offering of Class A shares commenced on September 15, 2006. The initial public offering of Class C shares commenced on October 1, 2009. The initial public offering of Class I shares commenced on May 28, 2010. |
| (d) | Represents the period from September 15, 2006 (date of initial public offering of Class A shares) through May 31, 2011. |
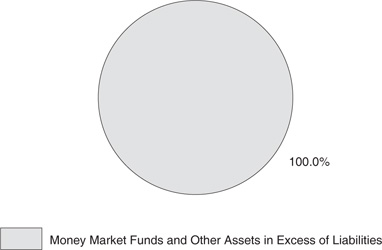
STADION MANAGED PORTFOLIO PORTFOLIO ALLOCATION (% OF NET ASSETS) May 31, 2011 (Unaudited) |
STADION CORE ADVANTAGE PORTFOLIO PORTFOLIO ALLOCATION (% OF NET ASSETS) May 31, 2011 (Unaudited) |
STADION MANAGED PORTFOLIO
SCHEDULE OF INVESTMENTS
May 31, 2011
| | MONEY MARKET FUNDS — 99.7% | | | |
| | 1,289,968,365 | | Fidelity Institutional Money Market Portfolio - Select Class, 0.11% (a) (Cost $1,289,968,365) | | $ | 1,289,968,365 | |
| | | | | | | | |
| | | | Total Investments at Value — 99.7% (Cost $1,289,968,365) | | $ | 1,289,968,365 | |
| | | | | | | | |
| | | | Other Assets in Excess of Liabilities — 0.3% | | | 3,573,108 | |
| | | | | | | | |
| | | | Net Assets — 100.0% | | $ | 1,293,541,473 | |
| (a) | Variable rate security. The rate shown is the 7-day effective yield as of May 31, 2011. |
STADION CORE ADVANTAGE PORTFOLIO
SCHEDULE OF INVESTMENTS
May 31, 2011
| | EXCHANGE-TRADED FUNDS — 50.4% | | | |
| | 34,740 | | iShares Russell 2000 Index Fund | | $ | 2,946,994 | |
| | 113,510 | | iShares Dow Jones U.S. Telecommunications Sector Index Fund | | | 2,911,532 | |
| | 71,720 | | iShares S&P U.S. Preferred Stock Index Fund | | | 2,875,255 | |
| | 142,830 | | PowerShares Dynamic Food & Beverage Portfolio | | | 2,913,732 | |
| | 86,650 | | SPDR S&P 500 ETF Trust | | | 11,688,219 | |
| | 32,071 | | SPDR S&P MidCap 400 ETF Trust | | | 5,855,523 | |
| | | | | | | | |
| | | | Total Exchange-Traded Funds (Cost $27,528,645) | | $ | 29,191,255 | |
| | MONEY MARKET FUNDS — 49.8% | | | |
| | 28,836,043 | | Fidelity Institutional Money Market Portfolio - Select Class, 0.11% (a) (Cost $28,836,043) | | $ | 28,836,043 | |
| | | | | | | | |
| | | | Total Investments at Value — 100.2% (Cost $56,364,688) | | $ | 58,027,298 | |
| | | | | | | | |
| | | | Liabilities in Excess of Other Assets — (0.2%) | | | (97,112 | ) |
| | | | | | | | |
| | | | Net Assets — 100.0% | | $ | 57,930,186 | |
| (a) | Variable rate security. The rate shown is the 7-day effective yield as of May 31, 2011. |
| | |
| See accompanying notes to financial statements. |
STADION INVESTMENT TRUST
STATEMENTS OF ASSETS AND LIABILITIES
May 31, 2011
| | | | | | |
| ASSETS | | | | | | |
| Investments in securities: | | | | | | |
| At acquisition cost | | $ | 1,289,968,365 | | | $ | 56,364,688 | |
| At value (Note 2) | | $ | 1,289,968,365 | | | $ | 58,027,298 | |
| Dividends receivable | | | 63,938 | | | | 1,400 | |
| Receivable for investment securities sold | | | — | | | | 11,418,826 | |
| Receivable for capital shares sold | | | 6,411,795 | | | | 232,935 | |
| Other assets | | | 131,755 | | | | 22,531 | |
| TOTAL ASSETS | | | 1,296,575,853 | | | | 69,702,990 | |
| | | | | | | | | |
| LIABILITIES | | | | | | | | |
| Payable for capital shares redeemed | | | 2,283,134 | | | | 134,846 | |
| Payable for investment securities purchased | | | — | | | | 11,576,655 | |
| Payable to Advisor (Note 5) | | | 135,477 | | | | 20,347 | |
| Accrued distribution fees (Note 5) | | | 339,059 | | | | 9,368 | |
| Accrued compliance fees (Note 5) | | | 6,600 | | | | 275 | |
| Payable to administrator (Note 5) | | | 139,680 | | | | 12,360 | |
| Other accrued expenses and liabilities | | | 130,430 | | | | 18,953 | |
| TOTAL LIABILITIES | | | 3,034,380 | | | | 11,772,804 | |
| | | | | | | | | |
| NET ASSETS | | $ | 1,293,541,473 | | | $ | 57,930,186 | |
| | | | | | | | | |
| Net assets consist of: | | | | | | | | |
| Paid-in capital | | $ | 1,283,189,988 | | | $ | 53,519,704 | |
| Accumulated net realized gains from security transactions | | | 10,351,485 | | | | 2,747,872 | |
| Net unrealized appreciation on investments | | | — | | | | 1,662,610 | |
| Net assets | | $ | 1,293,541,473 | | | $ | 57,930,186 | |
| See accompanying notes to financial statements. |
STADION INVESTMENT TRUST
STATEMENTS OF ASSETS AND LIABILITIES (Continued)
May 31, 2011
| | | | | | |
| PRICING OF CLASS A SHARES | | | | | | |
| Net assets applicable to Class A shares | | $ | 981,387,023 | | | $ | 50,469,772 | |
Class A shares of beneficial interest outstanding
(unlimited number of shares authorized, no par value) | | | 98,848,446 | | | | 4,304,658 | |
| Net asset value and redemption price per share (Note 2) | | $ | 9.93 | | | $ | 11.72 | |
| Maximum offering price per share (Note 2) | | $ | 10.54 | | | $ | 12.44 | |
| | | | | | | | | |
| PRICING OF CLASS C SHARES | | | | | | | | |
| Net assets applicable to Class C shares | | $ | 228,540,844 | | | $ | 6,027,837 | |
Class C shares of beneficial interest outstanding
(unlimited number of shares authorized, no par value) | | | 23,340,177 | | | | 520,305 | |
Net asset value, offering price and
redemption price per share (Note 2) | | $ | 9.79 | | | $ | 11.59 | |
| | | | | | | | | |
| PRICING OF CLASS I SHARES | | | | | | | | |
| Net assets applicable to Class I shares | | $ | 83,613,606 | | | $ | 1,432,577 | |
Class I shares of beneficial interest outstanding
(unlimited number of shares authorized, no par value) | | | 8,396,863 | | | | 121,858 | |
Net asset value, offering price and
redemption price per share (Note 2) | | $ | 9.96 | | | $ | 11.76 | |
| See accompanying notes to financial statements. |
STADION INVESTMENT TRUST
STATEMENTS OF OPERATIONS
For the Year Ended May 31, 2011
| | | | | | |
| INVESTMENT INCOME | | | | | | |
| Dividends | | $ | 6,769,776 | | | $ | 502,428 | |
| | | | | | | | | |
| EXPENSES | | | | | | | | |
| Investment advisory fees (Note 5) | | | 10,320,148 | | | | 631,681 | |
| Distribution fees, Class A (Note 5) | | | 1,942,793 | | | | 115,173 | |
| Distribution fees, Class C (Note 5) | | | 1,357,980 | | | | 40,000 | |
| Administration fees (Note 5) | | | 692,141 | | | | 63,223 | |
| Transfer agent fees, Class A (Note 5) | | | 397,620 | | | | 21,204 | |
| Transfer agent fees, Class C (Note 5) | | | 113,544 | | | | 18,000 | |
| Transfer agent fees, Class I (Note 5) | | | 30,013 | | | | 12,750 | |
| Registration fees, Common | | | 124,735 | | | | 5,903 | |
| Registration fees, Class A | | | 105,749 | | | | 12,631 | |
| Registration fees, Class C | | | 37,408 | | | | 15,148 | |
| Registration fees, Class I | | | 22,652 | | | | 13,768 | |
| Professional fees | | | 127,182 | | | | 29,694 | |
| Fund accounting fees (Note 5) | | | 116,945 | | | | 47,006 | |
| Postage and supplies | | | 79,371 | | | | 11,608 | |
| Compliance fees (Note 5) | | | 78,465 | | | | 4,035 | |
| Custodian and bank service fees | | | 81,073 | | | | 5,979 | |
| Insurance expense | | | 41,637 | | | | 4,629 | |
| Printing of shareholder reports | | | 21,549 | | | | 4,192 | |
| Trustees’ fees | | | 21,752 | | | | 1,048 | |
| Organization expenses, Class I | | | 3,500 | | | | 3,500 | |
| Other expenses | | | 51,494 | | | | 21,703 | |
| TOTAL EXPENSES | | | 15,767,751 | | | | 1,082,875 | |
| Class A expenses reimbursed by the Advisor (Note 5) | | | — | | | | (8,896 | ) |
| Class C expenses reimbursed by the Advisor (Note 5) | | | — | | | | (30,273 | ) |
| Class I expenses reimbursed by the Advisor (Note 5) | | | — | | | | (29,450 | ) |
| NET EXPENSES | | | 15,767,751 | | | | 1,014,256 | |
| | | | | | | | | |
| NET INVESTMENT LOSS | | | (8,997,975 | ) | | | (511,828 | ) |
| | | | | | | | | |
| REALIZED AND UNREALIZED GAINS ON INVESTMENTS | | | | | | | | |
| Net realized gains from security transactions | | | 19,349,263 | | | | 6,558,556 | |
Net change in unrealized appreciation/
depreciation on investments | | | 111,955 | | | | 574,153 | |
REALIZED AND UNREALIZED
GAINS ON INVESTMENTS | | | 19,461,218 | | | | 7,132,709 | |
| | | | | | | | | |
| NET INCREASE IN NET ASSETS FROM OPERATIONS | | $ | 10,463,243 | | | $ | 6,620,881 | |
| See accompanying notes to financial statements. |
STADION INVESTMENT TRUST
STATEMENTS OF CHANGES IN NET ASSETS
| | | | | | | |
| | | | | | | | | | | | |
| FROM OPERATIONS | | | | | | | | | | | | |
| Net investment loss | | $ | (8,997,975 | ) | | $ | (1,803,119 | ) | | $ | (511,828 | ) | | $ | (226,236 | ) |
| Net realized gains from security transactions | | | 19,349,263 | | | | 18,199,106 | | | | 6,558,556 | | | | 2,865,407 | |
Net change in unrealized appreciation/
depreciation on investments | | | 111,955 | | | | (5,575,186 | ) | | | 574,153 | | | | 1,453,934 | |
| Net increase in net assets from operations | | | 10,463,243 | | | | 10,820,801 | | | | 6,620,881 | | | | 4,093,105 | |
| | | | | | | | | | | | | | | | | |
| DISTRIBUTIONS TO SHAREHOLDERS | | | | | | | | | | | | | | | | |
| Distributions from net realized gains, Class A | | | (8,178,057 | ) | | | — | | | | — | | | | — | |
| Distributions from net realized gains, Class C | | | (1,428,352 | ) | | | — | | | | — | | | | — | |
| Distributions from net realized gains, Class I | | | (1,136,203 | ) | | | — | | | | — | | | | — | |
Decrease in net assets from
distributions to shareholders | | | (10,742,612 | ) | | | — | | | | — | | | | — | |
| | | | | | | | | | | | | | | | | |
| FROM CAPITAL SHARE TRANSACTIONS (Note 6) | | | | | | | | | | | | | | | | |
| CLASS A | | | | | | | | | | | | | | | | |
| Proceeds from shares sold | | | 729,284,115 | | | | 401,102,428 | | | | 11,521,857 | | | | 13,930,720 | |
Net asset value of shares issued in
reinvestment of distributions | | | 7,528,241 | | | | — | | | | — | | | | — | |
| Payments for shares redeemed | | | (254,506,697 | ) | | | (54,284,799 | ) | | | (8,408,980 | ) | | | (5,655,071 | ) |
Net increase in net assets from
Class A share transactions | | | 482,305,659 | | | | 346,817,629 | | | | 3,112,877 | | | | 8,275,649 | |
| | | | | | | | | | | | | | | | | |
| CLASS C | | | | | | | | | | | | | | | | |
| Proceeds from shares sold | | | 195,085,320 | | | | 56,583,502 | | | | 5,849,013 | | | | 1,553,213 | |
Net asset value of shares issued in
reinvestment of distributions | | | 1,358,781 | | | | — | | | | — | | | | — | |
| Payments for shares redeemed | | | (18,839,140 | ) | | | (1,928,444 | ) | | | (1,709,269 | ) | | | (90,259 | ) |
Net increase in net assets from
Class C share transactions | | | 177,604,961 | | | | 54,655,058 | | | | 4,139,744 | | | | 1,462,954 | |
| | | | | | | | | | | | | | | | | |
| CLASS I | | | | | | | | | | | | | | | | |
| Proceeds from shares sold | | | 165,081,421 | | | | 1,000 | | | | 1,477,586 | | | | 1,000 | |
Net asset value of shares issued in
reinvestment of distributions | | | 559,579 | | | | — | | | | — | | | | — | |
| Payments for shares redeemed | | | (83,425,256 | ) | | | — | | | | (59,087 | ) | | | — | |
Net increase in net assets from
Class I share transactions | | | 82,215,744 | | | | 1,000 | | | | 1,418,499 | | | | 1,000 | |
| | | | | | | | | | | | | | | | | |
| TOTAL INCREASE IN NET ASSETS | | | 741,846,995 | | | | 412,294,488 | | | | 15,292,001 | | | | 13,832,708 | |
| | | | | | | | | | | | | | | | | |
| NET ASSETS | | | | | | | | | | | | | | | | |
| Beginning of year | | | 551,694,478 | | | | 139,399,990 | | | | 42,638,185 | | | | 28,805,477 | |
| End of year | | $ | 1,293,541,473 | | | $ | 551,694,478 | | | $ | 57,930,186 | | | $ | 42,638,185 | |
| | | | | | | | | | | | | | | | | |
| ACCUMULATED NET INVESTMENT INCOME | | $ | — | | | $ | — | | | $ | — | | | $ | — | |
| See accompanying notes to financial statements. |
STADION MANAGED PORTFOLIO
CLASS A
FINANCIAL HIGHLIGHTS
FOR A CLASS A SHARE OUTSTANDING THROUGHOUT EACH PERIOD | |
| | | | | | | | | | | | | | Period Ended May 31, 2007(a) | |
| Net asset value, beginning of period | | $ | 9.64 | | | $ | 9.29 | | | $ | 9.47 | | | $ | 10.34 | | | $ | 9.47 | |
| | | | | | | | | | | | | | | | | | | | | |
Income (loss) from
investment operations: | | | | | | | | | | | | | | | | | | | | |
| Net investment income (loss) | | | (0.06 | ) | | | (0.03 | ) | | | (0.03 | ) | | | 0.14 | | | | 0.05 | |
Net realized and unrealized gains
(losses) on securities | | | 0.46 | | | | 0.38 | | | | (0.14 | ) | | | (0.17 | ) | | | 1.12 | |
Total from investment
operations | | | 0.40 | | | | 0.35 | | | | (0.17 | ) | | | (0.03 | ) | | | 1.17 | |
| | | | | | | | | | | | | | | | | | | | | |
| Less distributions: | | | | | | | | | | | | | | | | | | | | |
Dividends from net
investment income | | | — | | | | — | | | | (0.00 | )(b) | | | (0.19 | ) | | | (0.05 | ) |
In excess of net
investment income | | | — | | | | — | | | | (0.01 | ) | | | — | | | | — | |
Distributions from net
realized gains | | | (0.11 | ) | | | — | | | | (0.00 | )(b) | | | (0.65 | ) | | | (0.25 | ) |
| Total distributions | | | (0.11 | ) | | | — | | | | (0.01 | ) | | | (0.84 | ) | | | (0.30 | ) |
| | | | | | | | | | | | | | | | | | | | | |
| Net asset value, end of period | | $ | 9.93 | | | $ | 9.64 | | | $ | 9.29 | | | $ | 9.47 | | | $ | 10.34 | |
| | | | | | | | | | | | | | | | | | | | | |
Total return (c) | | | 4.07% | | | | 3.77% | | | | (1.80% | ) | | | (0.47% | ) | | | 12.53% | (d) |
| | | | | | | | | | | | | | | | | | | | | |
| Ratios/Supplemental data: | | | | | | | | | | | | | | | | | | | | |
| Net assets, end of period (000’s) | | $ | 981,387 | | | $ | 496,412 | | | $ | 139,400 | | | $ | 93,855 | | | $ | 536 | |
| | | | | | | | | | | | | | | | | | | | | |
Ratio of total expenses to
average net assets (e) | | | 1.50% | | | | 1.67% | | | | 1.83% | | | | 1.87% | | | | 2.06% | (f)(g) |
| | | | | | | | | | | | | | | | | | | | | |
Ratio of net expenses to
average net assets (e) | | | 1.50% | | | | 1.67% | | | | 1.83% | | | | 1.87% | | | | 1.95% | (f) |
| | | | | | | | | | | | | | | | | | | | | |
Ratio of net investment income
loss) to average net assets (e) | | | (0.82% | ) | | | (0.57% | ) | | | (0.48% | ) | | | 1.38% | | | | 0.71% | (f) |
| | | | | | | | | | | | | | | | | | | | | |
| Portfolio turnover rate | | | 1,018% | | | | 944% | | | | 449% | | | | 870% | | | | 346% | (d) |
| (a) | Represents the period from September 15, 2006 (date of initial public offering) through May 31, 2007. |
| | |
| (b) | Amount rounds to less than $0.01 per share. |
| | |
| (c) | Total return is a measure of the change in value of an investment in the Fund over the periods covered, which assumes any dividends or capital gains distributions are reinvested in shares of the Fund. The returns shown do not reflect the deduction of taxes a shareholder would pay on Fund distributions or the redemption of Fund shares. Total returns shown do not include the effect of applicable sales loads. |
| | |
| (d) | Not annualized. |
| | |
| (e) | The ratios of expenses and net investment income (loss) to average net assets do not reflect the Fund’s proportionate share of expenses of the underlying investment companies in which the Fund invested. |
| | |
| (f) | Annualized. |
| | |
| (g) | Reflects total expenses prior to fee waivers by the Advisor and the administrator. |
| | |
| See accompanying notes to financial statements. |
STADION MANAGED PORTFOLIO
CLASS C
FINANCIAL HIGHLIGHTS
FOR A CLASS C SHARE OUTSTANDING THROUGHOUT EACH PERIOD | |
| | | | | Period Ended May 31, 2010(a) | |
| Net asset value, beginning of period | | $ | 9.59 | | | $ | 9.54 | |
| | | | | | | | | |
| Income (loss) from investment operations: | | | | | | | | |
| Net investment loss | | | (0.10 | ) | | | (0.05 | ) |
| Net realized and unrealized gains on securities | | | 0.41 | | | | 0.10 | |
| Total from investment operations | | | 0.31 | | | | 0.05 | |
| | | | | | | | | |
| Less distributions: | | | | | | | | |
| Distributions from net realized gains | | | (0.11 | ) | | | — | |
| | | | | | | | | |
| Net asset value, end of period | | $ | 9.79 | | | $ | 9.59 | |
| | | | | | | | | |
Total return (b) | | | 3.15% | | | | 0.52% | (c) |
| | | | | | | | | |
| Ratios/Supplemental data: | | | | | | | | |
| Net assets, end of period (000’s) | | $ | 228,541 | | | $ | 55,281 | |
| | | | | | | | | |
Ratio of total expenses to average net assets (d) | | | 2.28% | | | | 2.51% | (e)(f) |
| | | | | | | | | |
Ratio of net expenses to average net assets (d) | | | 2.28% | | | | 2.48% | (e) |
| | | | | | | | | |
Ratio of net investment loss to average net assets (d) | | | (1.65% | ) | | | (1.60% | )(e) |
| | | | | | | | | |
| Portfolio turnover rate | | | 1,018% | | | | 944% | (c)(g) |
| (a) | Represents the period from October 1, 2009 (date of initial public offering) through May 31, 2010. |
| | |
| (b) | Total return is a measure of the change in value of an investment in the Fund over the periods covered, which assumes any dividends or capital gains distributions are reinvested in shares of the Fund. The returns shown do not reflect the deduction of taxes a shareholder would pay on Fund distributions or the redemption of Fund shares. |
| | |
| (c) | Not annualized. |
| | |
| (d) | The ratios of expenses and net investment loss to average net assets do not reflect the Fund’s proportionate share of expenses of the underlying investment companies in which the Fund invested. |
| | |
| (e) | Annualized. |
| | |
| (f) | Reflects total expenses prior to fee waivers by the Advisor and the administrator. |
| | |
| (g) | Represents the year ended May 31, 2010. |
| | |
| See accompanying notes to financial statements. |
STADION MANAGED PORTFOLIO
CLASS I
FINANCIAL HIGHLIGHTS
FOR A CLASS I SHARE OUTSTANDING THROUGHOUT EACH PERIOD | |
| | | | | Period Ended May 31, 2010(a) | |
| Net asset value, beginning of period | | $ | 9.64 | | | $ | 9.64 | |
| | | | | | | | | |
| Income (loss) from investment operations: | | | | | | | | |
| Net investment loss | | | (0.05 | ) | | | (0.00 | )(b) |
| Net realized and unrealized gains on securities | | | 0.48 | | | | — | |
| Total from investment operations | | | 0.43 | | | | (0.00 | )(b) |
| | | | | | | | | |
| Less distributions: | | | | | | | | |
| Distributions from net realized gains | | | (0.11 | ) | | | — | |
| | | | | | | | | |
| Net asset value, end of period | | $ | 9.96 | | | $ | 9.64 | |
| | | | | | | | | |
Total return (c) | | | 4.38% | | | | 0.00% | (d) |
| | | | | | | | | |
| Ratios/Supplemental data: | | | | | | | | |
| Net assets, end of period (000’s) | | $ | 83,614 | | | $ | 1 | |
| | | | | | | | | |
Ratio of total expenses to average net assets (e) | | | 1.24% | | | | 1.70% | (f) |
| | | | | | | | | |
Ratio of net expenses to average net assets (e) | | | 1.24% | | | | 1.70% | (f) |
| | | | | | | | | |
Ratio of net investment loss to average net assets (e) | | | (0.48% | ) | | | (1.70% | )(f) |
| | | | | | | | | |
| Portfolio turnover rate | | | 1,018% | | | | 944% | (d)(g) |
| (a) | Represents the period from May 28, 2010 (date of initial public offering) through May 31, 2010. |
| | |
| (b) | Amount rounds to less than $0.01 per share. |
| | |
| (c) | Total return is a measure of the change in value of an investment in the Fund over the periods covered, which assumes any dividends or capital gains distributions are reinvested in shares of the Fund. The returns shown do not reflect the deduction of taxes a shareholder would pay on Fund distributions or the redemption of Fund shares. |
| | |
| (d) | Not annualized. |
| | |
| (e) | The ratios of expenses and net investment loss to average net assets do not reflect the Fund’s proportionate share of expenses of the underlying investment companies in which the Fund invested. |
| | |
| (f) | Annualized. |
| | |
| (g) | Represents the year ended May 31, 2010. |
| | |
| See accompanying notes to financial statements. |
STADION CORE ADVANTAGE PORTFOLIO
CLASS A
FINANCIAL HIGHLIGHTS
FOR A CLASS A SHARE OUTSTANDING THROUGHOUT EACH PERIOD | |
| | | | | | | | | | | | | | Period Ended May 31, 2007(a) | |
| Net asset value, beginning of period | | $ | 10.22 | | | $ | 8.98 | | | $ | 11.11 | | | $ | 11.99 | | | $ | 10.38 | |
| | | | | | | | | | | | | | | | | | | | | |
Income (loss) from
investment operations: | | | | | | | | | | | | | | | | | | | | |
| Net investment income (loss) | | | (0.10 | ) | | | (0.05 | ) | | | (0.04 | ) | | | 0.03 | | | | (0.01 | ) |
Net realized and unrealized gains
(losses) on securities | | | 1.60 | | | | 1.29 | | | | (2.08 | ) | | | (0.48 | ) | | | 1.62 | |
| Total from investment operations | | | 1.50 | | | | 1.24 | | | | (2.12 | ) | | | (0.45 | ) | | | 1.61 | |
| | | | | | | | | | | | | | | | | | | | | |
| Less distributions: | | | | | | | | | | | | | | | | | | | | |
Dividends from net
investment income | | | — | | | | — | | | | — | | | | (0.03 | ) | | | — | |
In excess of net
investment income | | | — | | | | — | | | | (0.01 | ) | | | (0.01 | ) | | | — | |
Distributions from net
realized gains | | | — | | | | — | | | | — | | | | (0.39 | ) | | | — | |
| Total distributions | | | — | | | | — | | | | (0.01 | ) | | | (0.43 | ) | | | — | |
| | | | | | | | | | | | | | | | | | | | | |
| Net asset value, end of period | | $ | 11.72 | | | $ | 10.22 | | | $ | 8.98 | | | $ | 11.11 | | | $ | 11.99 | |
| | | | | | | | | | | | | | | | | | | | | |
Total return (b) | | | 14.68% | | | | 13.81% | | | | (19.11% | ) | | | (3.89% | ) | | | 15.51% | (c) |
| | | | | | | | | | | | | | | | | | | | | |
| Ratios/Supplemental data: | | | | | | | | | | | | | | | | | | | | |
| Net assets, end of period (000’s) | | $ | 50,470 | | | $ | 41,179 | | | $ | 28,805 | | | $ | 36,762 | | | $ | 41 | |
| | | | | | | | | | | | | | | | | | | | | |
Ratio of total expenses to
average net assets (d) | | | 1.97% | (e) | | | 2.11% | (e) | | | 2.23% | | | | 2.17% | | | | 2.39% | (e)(f) |
| | | | | | | | | | | | | | | | | | | | | |
Ratio of net expenses to
average net assets (d) | | | 1.95% | | | | 1.95% | | | | 2.23% | | | | 2.17% | | | | 2.37% | (f) |
| | | | | | | | | | | | | | | | | | | | | |
Ratio of net investment income
(loss) to average net assets (d) | | | (0.94% | ) | | | (0.62% | ) | | | (0.41% | ) | | | 0.25% | | | | (0.31% | )(f) |
| | | | | | | | | | | | | | | | | | | | | |
| Portfolio turnover rate | | | 476% | | | | 471% | | | | 346% | | | | 541% | | | | 291% | (c) |
| (a) | Represents the period from September 15, 2006 (date of initial public offering) through May 31, 2007. |
| | |
| (b) | Total return is a measure of the change in value of an investment in the Fund over the periods covered, which assumes any dividends or capital gains distributions are reinvested in shares of the Fund. The returns shown do not reflect the deduction of taxes a shareholder would pay on Fund distributions or the redemption of Fund shares. Total returns shown do not include the effect of applicable sales loads. |
| | |
| (c) | Not annualized. |
| | |
| (d) | The ratios of expenses and net investment income (loss) to average net assets do not reflect the Fund’s proportionate share of expenses of the underlying investment companies in which the Fund invested. |
| | |
| (e) | Reflects total expenses prior to fee waivers and expense reimbursements by the Advisor and/or the administrator. |
| | |
| (f) | Annualized. |
| | |
| See accompanying notes to financial statements. |
STADION CORE ADVANTAGE PORTFOLIO
CLASS C
FINANCIAL HIGHLIGHTS
FOR A CLASS C SHARE OUTSTANDING THROUGHOUT EACH PERIOD | |
| | | | | Period Ended May 31, 2010(a) | |
| Net asset value, beginning of period | | $ | 10.17 | | | $ | 9.75 | |
| | | | | | | | | |
| Income (loss) from investment operations: | | | | | | | | |
| Net investment loss | | | (0.14 | ) | | | (0.06 | ) |
| Net realized and unrealized gains on securities | | | 1.56 | | | | 0.48 | |
| Total from investment operations | | | 1.42 | | | | 0.42 | |
| | | | | | | | | |
| Net asset value, end of period | | $ | 11.59 | | | $ | 10.17 | |
| | | | | | | | | |
Total return (b) | | | 13.96% | | | | 4.31% | (c) |
| | | | | | | | | |
| Ratios/Supplemental data: | | | | | | | | |
| Net assets, end of period (000’s) | | $ | 6,028 | | | $ | 1,458 | |
| | | | | | | | | |
Ratio of total expenses to average net assets (d) | | | 3.45% | (e) | | | 7.53% | (e)(f) |
| | | | | | | | | |
Ratio of net expenses to average net assets (d) | | | 2.70% | | | | 2.70% | (f) |
| | | | | | | | | |
Ratio of net investment loss to average net assets (d) | | | (1.79% | ) | | | (1.82% | )(f) |
| | | | | | | | | |
| Portfolio turnover rate | | | 476% | | | | 471% | (c)(g) |
| (a) | Represents the period from October 1, 2009 (date of initial public offering) through May 31, 2010. |
| | |
| (b) | Total return is a measure of the change in value of an investment in the Fund over the periods covered, which assumes any dividends or capital gains distributions are reinvested in shares of the Fund. The returns shown do not reflect the deduction of taxes a shareholder would pay on Fund distributions or the redemption of Fund shares. |
| | |
| (c) | Not annualized. |
| | |
| (d) | The ratios of expenses and net investment loss to average net assets do not reflect the Fund’s proportionate share of expenses of the underlying investment companies in which the Fund invested. |
| | |
| (e) | Reflects total expenses prior to fee waivers and expense reimbursements by the Advisor (Note 5). |
| | |
| (f) | Annualized. |
| | |
| (g) | Represents the year ended May 31, 2010. |
| | |
| See accompanying notes to financial statements. |
STADION CORE ADVANTAGE PORTFOLIO
CLASS I
FINANCIAL HIGHLIGHTS
FOR A CLASS I SHARE OUTSTANDING THROUGHOUT EACH PERIOD | |
| | | | | Period Ended May 31, 2010(a) | |
| Net asset value, beginning of period | | $ | 10.22 | | | $ | 10.22 | |
| | | | | | | | | |
| Income (loss) from investment operations: | | | | | | | | |
| Net investment loss | | | (0.04 | ) | | | (0.00 | )(b) |
| Net realized and unrealized gains on securities | | | 1.58 | | | | — | |
| Total from investment operations | | | 1.54 | | | | (0.00 | )(b) |
| | | | | | | | | |
| Net asset value, end of period | | $ | 11.76 | | | $ | 10.22 | |
| | | | | | | | | |
Total return (c) | | | 15.07% | | | | 0.00% | (d) |
| | | | | | | | | |
| Ratios/Supplemental data: | | | | | | | | |
| Net assets, end of period (000’s) | | $ | 1,433 | | | $ | 1 | |
| | | | | | | | | |
Ratio of total expenses to average net assets (e) | | | 7.98% | (g) | | | 1.70% | (f) |
| | | | | | | | | |
Ratio of net expenses to average net assets (e) | | | 1.70% | | | | 1.70% | (f) |
| | | | | | | | | |
Ratio of net investment loss to average net assets (e) | | | (1.03% | ) | | | (1.70% | )(f) |
| | | | | | | | | |
| Portfolio turnover rate | | | 476% | | | | 471% | (d)(h) |
| (a) | Represents the period from May 28, 2010 (date of initial public offering) through May 31, 2010. |
| | |
| (b) | Amount rounds to less than $0.01 per share. |
| | |
| (c) | Total return is a measure of the change in value of an investment in the Fund over the periods covered, which assumes any dividends or capital gains distributions are reinvested in shares of the Fund. The returns shown do not reflect the deduction of taxes a shareholder would pay on Fund distributions or the redemption of Fund shares. |
| | |
| (d) | Not annualized. |
| | |
| (e) | The ratios of expenses and net investment loss to average net assets do not reflect the Fund’s proportionate share of expenses of the underlying investment companies in which the Fund invested. |
| | |
| (f) | Annualized. |
| | |
| (g) | Reflects total expenses prior to fee waivers and expense reimbursements by the Advisor (Note 5). |
| | |
| (h) | Represents the year ended May 31, 2010. |
| | |
| See accompanying notes to financial statements. |
STADION INVESTMENT TRUST
NOTES TO FINANCIAL STATEMENTS
May 31, 2011
1. ORGANIZATION
Stadion Managed Portfolio and Stadion Core Advantage Portfolio (each, a “Fund,” and, collectively, the “Funds”) are each a diversified series of the Stadion Investment Trust (the “Trust”), a Delaware Statutory Trust registered under the Investment Company Act of 1940 (the “1940 Act”) as an open-end management investment company.
Stadion Managed Portfolio commenced operations on June 30, 2003. The public offering of Class A shares, Class C shares and Class I shares commenced on September 15, 2006, October 1, 2009 and May 28, 2010, respectively. The investment objective of the Fund is to seek long-term capital appreciation, while maintaining a secondary emphasis on capital preservation.
Stadion Core Advantage Portfolio commenced operations on January 27, 2004. The public offering of Class A shares, Class C shares and Class I shares commenced on September 15, 2006, October 1, 2009 and May 28, 2010, respectively. The investment objective of the Fund is to seek capital appreciation.
To achieve their investment objectives, the Funds invest primarily in exchange-traded funds or ETFs (funds traded on securities exchanges that generally hold a portfolio of common stocks or bonds designed to track the performance of a securities index or sector of an index) and cash and short-term, highly liquid investments (such as money market mutual funds) that are generally convertible into cash.
Each Fund currently offers three classes of shares: Class A shares (sold subject to a maximum front-end sales load equal to 5.75% of the offering price and a distribution and/or service fee of up to 0.25% of the average net assets attributable to Class A shares), Class C shares (sold without any sales loads but subject to a distribution and/or service fee of up to 1.00% of the average daily net assets attributable to Class C shares) and Class I shares (sold without any sales loads and distribution and/or service fees). Each class of shares represents an interest in the same assets of the Funds, has the same rights and is identical in all material respects except that (1) the classes bear differing levels of sales loads and distribution fees; (2) certain other class specific expenses will be borne solely by the class to which such expenses are attributable; (3) each class has exclusive voting rights with respect to matters relating to its own distribution arrangements; and (4) Class I shares require a higher minimum initial investment.
2. ACCOUNTING POLICIES
The following is a summary of the Funds’ significant accounting policies used in the preparation of their financial statements. The policies are in conformity with accounting principles generally accepted in the United States of America (“GAAP”).
Security Valuation: The Funds’ investments in securities are carried at market value. Securities listed on an exchange or quoted on a national market system are valued at the last sales price as of the time regular trading closes on the New York Stock Exchange (normally, 4:00 p.m. Eastern Time). Securities traded in the NASDAQ market are valued at the NASDAQ Official Closing Price. Other securities, including listed securities for which no sale was reported on that date, are valued at the most recent bid price. Securities and assets for which representative market quotations are not readily available or which cannot be accurately valued using the Funds’ normal pricing procedures are valued at fair value as determined in good faith under policies approved by the Board of Trustees and will be classified as Level 2 or 3 within the fair value hierarchy, depending on the inputs used. Fair value pricing may be used, for example, in situations where (i) a portfolio security is so
STADION INVESTMENT TRUST NOTES TO FINANCIAL STATEMENTS (Continued) May 31, 2011 |
thinly traded that there have been no transactions for that security over an extended period of time; (ii) an event occurs after the close of the exchange on which a portfolio security is principally traded that is likely to have changed the value of the portfolio security prior to the Funds’ net asset value calculations; (iii) the exchange on which the portfolio security is principally traded closes early; or (iv) trading of the portfolio security is halted during the day and does not resume prior to the Funds’ net asset value calculations. A portfolio security’s “fair value” price may differ from the price next available for that portfolio security using the Funds’ normal pricing procedures. Instruments with maturities of 60 days or less are valued at amortized cost, which approximates market value.
GAAP establishes a single authoritative definition of fair value, sets out a framework for measuring fair value and requires additional disclosures about fair value measurements.
Various inputs are used in determining the value of the Funds’ investments. These inputs are summarized in the three broad levels listed below:
• Level 1 – quoted prices in active markets for identical securities
• Level 2 – other significant observable inputs
• Level 3 – significant unobservable inputs
The inputs or methodology used for valuing securities are not necessarily an indication of the risks associated with investing in those securities. The inputs used to measure fair value may fall into different levels of the fair value hierarchy. In such cases, for disclosure purposes, the level in the fair value hierarchy within which the fair value measurement falls in its entirety is determined based on the lowest level input that is significant to the fair value measurement.
The following is a summary of the inputs used to value each Fund’s investments as of May 31, 2011 by security type:
Stadion Managed Portfolio: | | | | | | | | | | | | |
Money Market Funds | | $ | 1,289,968,365 | | | $ | — | | | $ | — | | | $ | 1,289,968,365 | |
| | | | | | | | | | | | | | | | | |
Stadion Core Advantage Portfolio: | | | | | | | | | | | | |
Exchange-Traded Funds | | $ | 29,191,255 | | | $ | — | | | $ | — | | | $ | 29,191,255 | |
Money Market Funds | | | 28,836,043 | | | | — | | | | — | | | | 28,836,043 | |
Total | | $ | 58,027,298 | | | $ | — | | | $ | — | | | $ | 58,027,298 | |
During the year ended May 31, 2011, the Funds did not have any significant transfers in and out of Level 1 or Level 2.
The Funds did not have any assets or liabilities that were measured at fair value on a recurring basis using significant unobservable inputs (Level 3) during the year ended or as of May 31, 2011.
Share Valuation: The net asset value per share of each class of shares of each Fund is calculated daily by dividing the total value of the assets attributable to that class, less liabilities attributable to that class, by the number of shares of that class outstanding. The maximum offering price per share of Class A shares of each Fund is equal to the net asset value per share plus a sales load equal to 6.10% of the net asset value (or 5.75% of the offering price). The offering price of Class C shares and Class I shares is equal to the net asset value per share. The redemption price per share of each class of shares of each Fund is equal to the net asset value per share.
STADION INVESTMENT TRUST NOTES TO FINANCIAL STATEMENTS (Continued) May 31, 2011 |
Securities Transactions and Investment Income: Security transactions are accounted for on trade date. Gains and losses on securities sold are determined on a specific identification basis. Dividend income is recorded on the ex-dividend date. Interest income is accrued as earned.
Allocation Between Classes: Investment income earned, realized capital gains and losses, and unrealized appreciation and depreciation are allocated daily to each class of shares based upon its proportionate share of total net assets of each Fund. Class specific expenses are charged directly to the class incurring the expense. Common expenses which are not attributable to a specific class are allocated daily to each class of shares based upon its proportionate share of total net assets of each Fund.
Distributions to Shareholders: Dividends arising from net investment income, if any, are declared and paid quarterly to shareholders of each Fund. Net realized gains, if any, are distributed at least once each year. The amount of distributions from net investment income and net realized gains are determined in accordance with federal income tax regulations which may differ from GAAP. These “book/tax” differences are either temporary or permanent in nature and are primarily due to losses deferred due to wash sales. Dividends and distributions are recorded on the ex-dividend date.
Use of Estimates: The preparation of financial statements in conformity with GAAP requires management to make estimates and assumptions that affect the reported amount of assets and liabilities, the disclosure of contingent assets and liabilities, and revenues and expenses during the reporting period. Actual results could differ from those estimates.
Federal Income Taxes: It is each Fund’s policy to comply with the special provisions of Subchapter M of the Internal Revenue Code applicable to regulated investment companies. As provided therein, in any fiscal year in which a Fund so qualifies and distributes at least 90% of its taxable net income, the Fund (but not the shareholders) will be relieved of federal income tax on the income distributed. Accordingly, no provision for income taxes has been made.
In order to avoid imposition of the excise tax applicable to regulated investment companies, it is also each Fund’s intention to declare as dividends in each calendar year at least 98% of its net investment income (earned during the calendar year) and 98.2% of its net realized capital gains (earned during the twelve months ended October 31) plus undistributed amounts from prior years.
3. SECURITY TRANSACTIONS
During the year ended May 31, 2011, cost of purchases and proceeds from sales and maturities of investment securities, other than short-term investments and U.S. government securities, amounted to $6,156,774,081 and $6,360,263,856, respectively, for Stadion Managed Portfolio; and $182,435,035 and $190,362,085, respectively, for Stadion Core Advantage Portfolio.
4. TAX MATTERS
The tax character of distributions paid to shareholders by Stadion Managed Portfolio during the year ended May 31, 2011 was ordinary income. No distributions were paid by Stadion Core Advantage Portfolio during the year ended May 31, 2011. Additionally, there were no distributions paid by the Funds during the year ended May 31, 2010.
STADION INVESTMENT TRUST NOTES TO FINANCIAL STATEMENTS (Continued) May 31, 2011 |
The following information is computed on a tax basis for each item as of May 31, 2011:
| | | | | | |
Tax cost of portfolio investments | | $ | 1,289,968,365 | | | $ | 56,364,688 | |
Gross unrealized appreciation | | $ | — | | | $ | 1,665,178 | |
Gross unrealized depreciation | | | — | | | | (2,568 | ) |
Net unrealized appreciation | | | — | | | | 1,662,610 | |
Undistributed ordinary income | | | 10,351,485 | | | | 1,230,337 | |
Undistributed long-term gains | | | — | | | | 1,517,535 | |
Accumulated earnings | | $ | 10,351,485 | | | $ | 4,410,482 | |
During the year ended May 31, 2011, Stadion Core Advantage Portfolio utilized capital loss carryforwards of $1,706,605 to offset current year realized gains.
For the year ended May 31, 2011, Stadion Managed Portfolio and Stadion Core Advantage Portfolio reclassified $8,997,975 and $511,828, respectively, of net investment loss against accumulated net realized gains on the Statements of Assets and Liabilities. Such reclassifications, the result of permanent differences between the financial statement and income tax reporting requirements, have no effect on the Funds’ net assets or net asset value per share.
The Funds recognize the tax benefits or expenses of uncertain tax positions only when the position is “more-likely-than-not” to be sustained assuming examination by tax authorities. Management has reviewed the tax positions taken on Federal income tax returns for all open tax years (tax years ended May 31, 2008 through May 31, 2010) and has concluded that no provision for unrecognized tax benefits or expenses is required in these financial statements.
5. TRANSACTIONS WITH AFFILIATES
Certain Trustees and officers of the Trust are also officers of Stadion Money Management, LLC (the “Advisor”) or of Ultimus Fund Solutions, LLC (“Ultimus”), the Funds’ administrator, transfer agent and fund accounting services agent, or Ultimus Fund Distributors, LLC (the “Distributor”), the Funds’ principal underwriter.
INVESTMENT ADVISORY AGREEMENTS
Each Fund’s investments are managed by the Advisor under the terms of an Investment Advisory Agreement (the “Advisory Agreements”). Under the Advisory Agreements, each Fund has agreed to pay the Advisor an investment advisory fee at an annual rate of 1.25% of its average daily net assets up to $150 million and 1.00% of such assets over $150 million.
STADION INVESTMENT TRUST NOTES TO FINANCIAL STATEMENTS (Continued) May 31, 2011 |
The Advisor has entered into an Expense Limitation Agreement with respect to each Fund under which it has agreed to waive its fees and to assume other expenses of the Funds, if necessary, in an amount that limits the annual operating expenses of Class A shares, Class C shares and Class I shares of the Funds (exclusive of interest, taxes, brokerage commissions, extraordinary expenses, Acquired Fund Fees and Expenses and payments, if any, under the Rule 12b-1 Plan) to not more than 1.70% of the average daily net assets allocable to each Class until October 1, 2011. Accordingly, during the year ended May 31, 2011, with respect to Stadion Core Advantage Portfolio, the Advisor reimbursed the Fund for $8,896 of Class A expenses, $30,273 of Class C expenses and $29,450 of Class I expenses. During the year ended May 31, 2011, there were no advisory fees waived or expenses reimbursed by the Advisor for Stadion Managed Portfolio. It is expected that the Expense Limitation Agreements will continue from year-to-year, provided such continuance is approved by the Board of Trustees of the Trust.
The Chief Compliance Officer of the Trust is an employee of the Advisor. The Funds reimburse the Advisor $82,500 annually for the services provided by the Chief Compliance Officer of the Trust. Each Fund bears a proportionate share of this fee based on an allocation approved by the Trustees.
ADMINISTRATION AGREEMENT
Under the terms of an Administration Agreement, Ultimus supplies internal regulatory compliance services and executive and administrative services for the Funds. Ultimus supervises the preparation of tax returns, reports to shareholders of the Funds, reports to and filings with the Securities and Exchange Commission (the “SEC”) and state securities commissions and materials for meetings of the Board of Trustees. Effective April 1, 2011, each Fund pays Ultimus a monthly fee for these services at an annual rate of 0.075% of its average daily net assets up to $500 million; 0.05% of such assets from $500 million to $2 billion; 0.04% of such assets from $2 billion to $3 billion; 0.03% of such assets from $3 billion to $5 billion; and 0.025% of such assets in excess of $5 billion, subject to a minimum monthly fee of $3,000. Prior to April 1, 2011, each Fund paid Ultimus a monthly fee at an annual rate of 0.15% of its average daily net assets up to $25 million; 0.125% of such assets from $25 million to $50 million; 0.10% of such assets from $50 million to $250 million; 0.075% of such assets from $250 million to $500 million; and 0.05% of such assets in excess of $500 million, subject to a minimum monthly fee of $2,000.
FUND ACCOUNTING AGREEMENT
Under the terms of a Fund Accounting Agreement, Ultimus calculates the daily net asset value per share and maintains the financial books and records of each Fund. For these services, Ultimus receives from each Fund a base fee of $3,500 per month plus an asset-based fee of 0.01% of its average daily net assets up to $500 million; and 0.005% of such assets in excess of $500 million. In addition, each Fund reimburses certain out-of-pocket expenses incurred by Ultimus in obtaining valuations of the Funds’ portfolio securities.
TRANSFER AGENT AND SHAREHOLDER SERVICES AGREEMENT
Under the terms of a Transfer Agent and Shareholder Services Agreement, Ultimus maintains the records of each shareholder’s account, answers shareholders’ inquiries concerning their accounts, processes purchases and redemptions of each Fund’s shares, acts as dividend and distribution disbursing agent and performs other shareholder service functions. For these services, each Fund pays Ultimus a fee at an annual rate of $18 per shareholder account, provided, however, that the minimum monthly fee for
STADION INVESTMENT TRUST NOTES TO FINANCIAL STATEMENTS (Continued) May 31, 2011 |
a share class is $1,000 if such class has 25 accounts or less, $1,250 if such class has more than 25 accounts but less than 100 accounts and $1,500 per month if such class has 100 accounts or more. In addition, the Funds pay out-of-pocket expenses, including, but not limited to, postage and supplies.
DISTRIBUTION PLAN
The Trust has adopted plans of distribution (the “Plans”) pursuant to Rule 12b-1 under the 1940 Act, which permit Class A and Class C shares of each Fund to directly incur or reimburse the Funds’ principal underwriter for certain expenses related to the distribution of its shares. The annual limitation for payment of expenses pursuant to the Plans is 0.25% of each Fund’s average daily net assets attributable to Class A shares and 1.00% of each Fund’s average daily net assets attributable to Class C shares. The Trust has not adopted a plan of distribution with respect to Class I shares.
During the year ended May 31, 2011, Class A and Class C shares of Stadion Managed Portfolio incurred distribution expenses of $1,942,793 and $1,357,980, respectively, and Class A and Class C shares of Stadion Core Advantage Portfolio incurred distribution expenses of $115,173 and $40,000, respectively.
DISTRIBUTION AGREEMENT
Under the terms of a Distribution Agreement with the Trust, the Distributor provides distribution services to the Trust and serves as principal underwriter to the Funds. The Distributor receives $6,000 annually from the Funds for acting as principal underwriter. In addition, during the year ended May 31, 2011, the Distributor earned underwriter fees of $394,684 and $12,910 on the sale of Class A shares of Stadion Managed Portfolio and Stadion Core Advantage Portfolio, respectively.
6. CAPITAL SHARE TRANSACTIONS
Proceeds and payments on capital shares as shown in the Statements of Changes in Net Assets are the result of the following capital share transactions for the periods shown:
| | | | | | |
| Stadion Managed Portfolio - Class A | | | | | | |
Shares sold (Note 1) | | | 71,977,554 | | | | 42,231,985 | |
| Shares issued in reinvestment of distributions to shareholders | | | 731,608 | | | | — | |
Shares redeemed | | | (25,337,724 | ) | | | (5,761,577 | ) |
Net increase in shares outstanding | | | 47,371,438 | | | | 36,470,408 | |
Shares outstanding beginning of year | | | 51,477,008 | | | | 15,006,600 | |
Shares outstanding end of year | | | 98,848,446 | | | | 51,477,008 | |
| | | | | | | | | |
| Stadion Managed Portfolio - Class C | | | | | | | | |
Shares sold (Note 1) | | | 19,310,168 | | | | 5,969,884 | |
| Shares issued in reinvestment of distributions to shareholders | | | 133,474 | | | | — | |
Shares redeemed | | | (1,869,519 | ) | | | (203,830 | ) |
Net increase in shares outstanding | | | 17,574,123 | | | | 5,766,054 | |
Shares outstanding beginning of period | | | 5,766,054 | | | | — | |
Shares outstanding end of period | | | 23,340,177 | | | | 5,766,054 | |
STADION INVESTMENT TRUST NOTES TO FINANCIAL STATEMENTS (Continued) May 31, 2011 |
| Stadion Managed Portfolio - Class I | | | | | | | | |
Shares sold (Note 1) | | | 16,474,548 | | | | 104 | |
| Shares issued in reinvestment of distributions to shareholders | | | 54,276 | | | | — | |
Shares redeemed | | | (8,132,065 | ) | | | — | |
Net increase in shares outstanding | | | 8,396,759 | | | | 104 | |
Shares outstanding beginning of period | | | 104 | | | | — | |
Shares outstanding end of period | | | 8,396,863 | | | | 104 | |
| | | | | | | | | |
| Stadion Core Advantage Portfolio - Class A | | | | | | | | |
Shares sold (Note 1) | | | 1,024,191 | | | | 1,395,500 | |
Shares redeemed | | | (749,564 | ) | | | (574,560 | ) |
Net increase in shares outstanding | | | 274,627 | | | | 820,940 | |
Shares outstanding beginning of year | | | 4,030,031 | | | | 3,209,091 | |
Shares outstanding end of year | | | 4,304,658 | | | | 4,030,031 | |
| | | | | | | | | |
| Stadion Core Advantage Portfolio - Class C | | | | | | | | |
Shares sold (Note 1) | | | 526,283 | | | | 152,113 | |
Shares redeemed | | | (149,291 | ) | | | (8,800 | ) |
Net increase in shares outstanding | | | 376,992 | | | | 143,313 | |
Shares outstanding beginning of period | | | 143,313 | | | | — | |
Shares outstanding end of period | | | 520,305 | | | | 143,313 | |
| | | | | | | | | |
| Stadion Core Advantage Portfolio - Class I | | | | | | | | |
Shares sold (Note 1) | | | 126,736 | | | | 98 | |
Shares redeemed | | | (4,976 | ) | | | — | |
Net increase in shares outstanding | | | 121,760 | | | | 98 | |
Shares outstanding beginning of period | | | 98 | | | | — | |
Shares outstanding end of period | | | 121,858 | | | | 98 | |
7. COMMITMENTS AND CONTINGENCIES
The Funds indemnify the Trust’s officers and Trustees for certain liabilities that might arise from their performance of their duties to the Funds. Additionally, in the normal course of business, the Funds enter into contracts that contain a variety of representations and warranties and which provide general indemnifications. The Funds’ maximum exposure under these arrangements is unknown, as this would involve future claims that may be made against the Funds that have not yet occurred. However, based on experience, the Funds expect the risk of loss to be remote.
STADION INVESTMENT TRUST NOTES TO FINANCIAL STATEMENTS (Continued) May 31, 2011 |
8. UNDERLYING INVESTMENT IN OTHER INVESTMENT COMPANIES
The Funds currently seek to achieve their investment objectives by investing a portion of their assets in Fidelity Institutional Money Market Portfolio – Select Class (the “Portfolio”), a registered open-end management investment company organized as a Delaware statutory trust. The Funds may redeem their investments from the Portfolio at any time if the Advisor determines that it is in the best interest of the Funds and their shareholders to do so.
The performance of the Funds may be directly affected by the performance of the Portfolio. As of May 31, 2011, the percentage of net assets invested in the Portfolio was 99.7% and 49.8% for Stadion Managed Portfolio and Stadion Core Advantage Portfolio, respectively.
9. SUBSEQUENT EVENTS
The Funds are required to recognize in the financial statements the effects of all subsequent events that provide additional evidence about conditions that existed as of the date of the Statements of Assets and Liabilities. For non-recognized subsequent events that must be disclosed to keep the financial statements from being misleading, the Funds are required to disclose the nature of the event as well as an estimate of its financial effect, or a statement that such an estimate cannot be made. Management has evaluated subsequent events through the issuance of these financial statements and has noted no such events except as reflected in the following paragraph.
A change in control of the Advisor occurred on June 30, 2011 whereby certain investment entities controlled and managed by TA Associates, Inc. acquired in the aggregate a 54.4% interest in the Advisor. This transaction resulted in the termination of each Fund’s investment advisory agreement with the Advisor in effect prior to June 30, 2011. On April 22, 2011, the Trust’s Board of Trustees approved a new investment advisory agreement with the Advisor for each Fund (the “New Advisory Agreements”) and, at a special meeting held on June 27, 2011, shareholders of each Fund approved the New Advisory Agreements. Under the New Advisory Agreements, which became effective on June 30, 2011, the Advisor provides the same advisory services on the same terms and for the same advisory fees provided for under the previous advisory agreements.
10. RECENT ACCOUNTING PRONOUNCEMENT
In May 2011, the Financial Accounting Standards Board issued Accounting Standards Update (“ASU”) No. 2011-04 “Amendments to Achieve Common Fair Value Measurement and Disclosure Requirements in U.S. GAAP and IFRS.” ASU No. 2011-04 establishes common requirements for measuring fair value and for disclosing information about fair value measurements in accordance with GAAP and International Financial Reporting Standards. ASU No. 2011-04 is effective for interim and annual periods beginning after December 15, 2011 and is applied prospectively. Management is currently evaluating the impact ASU No. 2011-04 may have on financial statement disclosures.
STADION INVESTMENT TRUST REPORT OF INDEPENDENT REGISTERED PUBLIC ACCOUNTING FIRM |
To the Board of Trustees of Stadion Investment Trust
and the Shareholders of the Stadion Managed Portfolio
and the Stadion Core Advantage Portfolio
We have audited the accompanying statements of assets and liabilities of the Stadion Managed Portfolio and the Stadion Core Advantage Portfolio, each a series of the Stadion Investment Trust (the “Funds”), including the schedules of investments, as of May 31, 2011, and the related statements of operations for the year then ended, the statements of changes in net assets for each of the two years in the period then ended and the financial highlights for each of the years or periods in the four year period then ended and for the period from September 15, 2006 (date of initial public offering of Class A shares) to May 31, 2007. These financial statements and financial highlights are the responsibility of the Funds’ management. Our responsibility is to express an opinion on these financial statements and financial highlights based on our audits.
We conducted our audits in accordance with the standards of the Public Company Accounting Oversight Board (United States). Those standards require that we plan and perform the audits to obtain reasonable assurance about whether the financial statements and financial highlights are free of material misstatement. An audit includes examining, on a test basis, evidence supporting the amounts and disclosures in the financial statements. Our procedures included confirmation of securities owned as of May 31, 2011 by correspondence with the custodian and broker. An audit also includes assessing the accounting principles used and significant estimates made by management, as well as evaluating the overall financial statement presentation. We believe that our audits provide a reasonable basis for our opinion.
In our opinion, the financial statements and financial highlights referred to above present fairly, in all material respects, the financial position of the Stadion Managed Portfolio and the Stadion Core Advantage Portfolio as of May 31, 2011, the results of their operations for the year then ended, the changes in their net assets for each of the two years in the period then ended and their financial highlights for each of the four years in the period then ended and for the period from September 15, 2006 to May 31, 2007, in conformity with accounting principles generally accepted in the United States of America.
| | |  |
| | | |
| | | BBD, LLP |
| | | |
Philadelphia, Pennsylvania
July 15, 2011
STADION INVESTMENT TRUST ABOUT YOUR FUNDS’ EXPENSES (Unaudited) |
We believe it is important for you to understand the impact of costs on your investment. As a shareholder of the Funds, you may incur two types of costs: (1) transaction costs, possibly including front-end sales loads; and (2) ongoing costs, including management fees, distribution (12b-1) fees and other Fund expenses. The following examples are intended to help you understand your ongoing costs (in dollars) of investing in the Funds and to compare these costs with the ongoing costs of investing in other mutual funds.
A mutual fund’s ongoing costs are expressed as a percentage of its average net assets. This figure is known as the expense ratio. The expenses in the tables that follow are based on an investment of $1,000 made at the beginning of the most recent semi-annual period (December 1, 2010) and held until the end of the period (May 31, 2011).
The tables that follow illustrate the Funds’ costs in two ways:
Actual fund return – This section helps you to estimate the actual expenses that you paid over the period. The “Ending Account Value” shown is derived from each Fund’s actual return, and the third column shows the dollar amount of operating expenses that would have been paid by an investor who started with $1,000 in the Fund. You may use the information here, together with the amount you invested, to estimate the expenses that you paid over the period.
To do so, simply divide your account value by $1,000 (for example, an $8,600 account value divided by $1,000 = 8.6), then multiply the result by the number given for the Fund under the heading “Expenses Paid During Period.”
Hypothetical 5% return – This section is intended to help you compare the Funds’ ongoing costs with those of other mutual funds. It assumes that each Fund had an annual return of 5% before expenses during the period shown, but that the expense ratio is unchanged. In this case, because the returns used are not the Funds’ actual returns, the results do not apply to your investment. The example is useful in making comparisons because the SEC requires all mutual funds to calculate expenses based on a 5% return. You can assess each Fund’s ongoing costs by comparing this hypothetical example with the hypothetical examples that appear in shareholder reports of other funds.
Note that expenses shown in the table are meant to highlight and help you compare ongoing costs only. The calculations assume no shares were bought or sold during the period. Your actual costs may have been higher or lower, depending on the amount of your investment and the timing of any purchases or redemptions.
More information about each Fund’s expenses, including historical annual expense ratios, can be found in this report. For additional information on operating expenses and other shareholder costs, please refer to the Funds’ prospectus.
STADION INVESTMENT TRUST ABOUT YOUR FUNDS’ EXPENSES (Unaudited) (Continued) |
| Stadion Managed Portfolio – Class A |
| | Beginning Account Value Dec. 1, 2010 | Ending Account Value May 31, 2011 | Expenses Paid During Period* |
| Based on Actual Fund Return | $1,000.00 | $995.20 | $7.36 |
| Based on Hypothetical 5% Return (before expenses) | $1,000.00 | $1,017.55 | $7.44 |
| * | Expenses are equal to the annualized expense ratio of 1.48% for the period, multiplied by the average account value over the period, multiplied by 182/365 (to reflect the one-half year period). |
| Stadion Managed Portfolio – Class C |
| | Beginning Account Value Dec. 1, 2010 | Ending Account Value May 31, 2011 | Expenses Paid During Period* |
| Based on Actual Fund Return | $1,000.00 | $990.20 | $11.21 |
| Based on Hypothetical 5% Return (before expenses) | $1,000.00 | $1,013.66 | $11.35 |
| * | Expenses are equal to the annualized expense ratio of 2.26% for the period, multiplied by the average account value over the period, multiplied by 182/365 (to reflect the one-half year period). |
| Stadion Managed Portfolio – Class I |
| | Beginning Account Value Dec. 1, 2010 | Ending Account Value May 31, 2011 | Expenses Paid During Period* |
| Based on Actual Fund Return | $1,000.00 | $996.20 | $6.17 |
| Based on Hypothetical 5% Return (before expenses) | $1,000.00 | $1,018.75 | $6.24 |
| * | Expenses are equal to the annualized expense ratio of 1.24% for the period, multiplied by the average account value over the period, multiplied by 182/365 (to reflect the one-half year period). |
| Stadion Core Advantage Portfolio – Class A |
| | Beginning Account Value Dec. 1, 2010 | Ending Account Value May 31, 2011 | Expenses Paid During Period* |
| Based on Actual Fund Return | $1,000.00 | $1,069.30 | $10.06 |
| Based on Hypothetical 5% Return (before expenses) | $1,000.00 | $1,015.21 | $9.80 |
| * | Expenses are equal to the annualized expense ratio of 1.95% for the period, multiplied by the average account value over the period, multiplied by 182/365 (to reflect the one-half year period). |
STADION INVESTMENT TRUST ABOUT YOUR FUNDS’ EXPENSES (Unaudited) (Continued) |
| Stadion Core Advantage Portfolio – Class C |
| | Beginning Account Value Dec. 1, 2010 | Ending Account Value May 31, 2011 | Expenses Paid During Period* |
| Based on Actual Fund Return | $1,000.00 | $1,066.20 | $13.91 |
| Based on Hypothetical 5% Return (before expenses) | $1,000.00 | $1,011.47 | $13.54 |
| * | Expenses are equal to the annualized expense ratio of 2.70% for the period, multiplied by the average account value over the period, multiplied by 182/365 (to reflect the one-half year period). |
| Stadion Core Advantage Portfolio – Class I |
| | Beginning Account Value Dec. 1, 2010 | Ending Account Value May 31, 2011 | Expenses Paid During Period* |
| Based on Actual Fund Return | $1,000.00 | $1,071.00 | $8.78 |
| Based on Hypothetical 5% Return (before expenses) | $1,000.00 | $1,016.45 | $8.55 |
| * | Expenses are equal to the annualized expense ratio of 1.70% for the period, multiplied by the average account value over the period, multiplied by 182/365 (to reflect the one-half year period). |
OTHER INFORMATION (Unaudited) |
The Trust files a complete listing of portfolio holdings of the Funds with the SEC as of the end of the first and third quarters of each fiscal year on Form N-Q. The filings are available free of charge, upon request, by calling 1-866-383-7636. Furthermore, you may obtain a copy of these filings on the SEC’s website at http://www.sec.gov. The Trust’s Forms N-Q may also be reviewed and copied at the SEC’s Public Reference Room in Washington, DC, and information on the operation of the Public Reference Room may be obtained by calling (800) SEC-0330.
A description of the policies and procedures that the Funds use to determine how to vote proxies relating to portfolio securities is available without charge upon request by calling toll-free 1-866-383-7636, or on the SEC’s website at http://www.sec.gov. Information regarding how the Funds voted proxies relating to portfolio securities during the most recent 12-month period ended June 30 is also available without charge upon request by calling toll-free 1-866-383-7636, or on the SEC’s website at http://www.sec.gov.
SUPPLEMENTAL INFORMATION (Unaudited) |
As a supplement to Note 8 to the financial statements of Stadion Managed Portfolio and Stadion Core Advantage Portfolio (the “Funds”), the financial statements of the aforementioned underlying fund, the Fidelity Institutional Money Market Portfolio – Select Class (the “Portfolio”), can be found at http://www.sec.gov/Archives/edgar/data/356173/000088019511000095/main.htm. This link is the latest audited annual report published for the Portfolio, dated March 31, 2011. Only data presented for the Fidelity Institutional Money Market Portfolio – Select Class is pertinent to the overall review of the financial statements of the Funds.
STADION INVESTMENT TRUST
BOARD OF TRUSTEES AND EXECUTIVE OFFICERS (Unaudited)
The Board of Trustees has overall responsibility for management of the Trust’s affairs. The Trustees serve during the lifetime of Trust and until its termination, or until death, resignation, retirement or removal. The Trustees, in turn, elect the officers of the Trust to actively supervise its day-to-day operations. The officers have been elected for an annual term. The following are the Trustees and executive officers of the Trust:
| Interested Trustee |
Name, Age & Address | Position(s) Held with the Trust | Term of Office & Length of Time Served | Principal Occupation(s) During Past 5 Years | Number of Funds Overseen by Trustee | Directorships of Public Companies Held by Trustee |
Gregory L. Morris 1061 Cliff Dawson Road Watkinsville, GA 30677 Age: 63 | Trustee, Chairman | Indefinite Since June, 2007 | A Portfolio Manager of the Advisor since joining the Advisor in November 2004. | 2 | None |
| Disinterested (Independent) Trustees |
James M. Baker 1061 Cliff Dawson Road Watkinsville, GA 30677 Age: 59 | Trustee | Indefinite Since June, 2003 | President of Baker & Lassiter, Inc. (real estate development and management) since 1994. | 2 | Director of Community Capital Bank (closely held state charted bank). |
Norman A. McLean 1061 Cliff Dawson Road Watkinsville, GA 30677 Age: 56 | Trustee | Indefinite Since June, 2003 | Director of Marketing/Public Relations for St. Mary’s Health Care System (health care) since September, 2005. | 2 | None |
Ronald C. Baum 1061 Cliff Dawson Road Watkinsville, GA 30677 Age: 70 | Trustee | Indefinite Since June,
2011 | Retired. Managing Partner of Grant Thornton LLP (public accounting) from 1987 through 2002. | 2 | None |
STADION INVESTMENT TRUST BOARD OF TRUSTEES AND EXECUTIVE OFFICERS (Unaudited) (Continued) |
| Executive Officers |
Name, Age & Address | Position(s) Held with the Trust | Length of Time Served | Principal Occupation(s) During Past 5 Years |
Judson P. Doherty 1061 Cliff Dawson Road Watkinsville, GA 30677 Age: 42 | President (Principal Executive Officer) | Since June, 2006 | President of the Advisor since December, 2007 and Chief Financial Officer of the Advisor since December, 2000, and Chief Compliance Officer of the Advisor and the Trust from October, 2004 to April, 2010. He is also a member of the Funds’ portfolio management team. |
Timothy A. Chapman 1061 Cliff Dawson Road Watkinsville, GA 30677 Age: 50 | Treasurer (Principal Financial Officer) | Since June, 2006 | Chairman of the Board, Chief Executive Officer and portfolio manager of the Advisor since February, 1993. |
Michael Isaac 1061 Cliff Dawson Road Watkinsville, GA 30677 Age: 40 | Chief Compliance Officer | Since April, 2010 | Chief Compliance Officer of the Advisor. Previously, Chief Compliance Officer of J.P. Turner & Company LLC (an independent broker/dealer) from 2006 to 2010 and Compliance Specialist for National Association of Securities Dealers, Inc. (now the Financial Industry Regulatory Authority or FINRA) from 1999 to 2006. |
Tina H. Bloom 225 Pictoria Drive, Suite 450 Cincinnati, OH 45246 Age: 42 | Secretary | Since April, 2011 | Director of Fund Administration of Ultimus Fund Solutions, LLC, transfer agent, fund accountant and administrator to the Trust. |
Robert G. Dorsey 225 Pictoria Drive, Suite 450 Cincinnati, OH 45246 Age: 54 | Vice President | Since May, 2007 | Managing Director of Ultimus Fund Solutions, LLC, transfer agent, fund accountant and administrator to the Trust; Managing Director of Ultimus Fund Distributors, LLC, a registered broker dealer. |
Additional information about members of the Board of Trustees and executive officers is available in the Statement of Additional Information (“SAI”). To obtain a free copy of the SAI, please call 1-866-383-7636.
STADION INVESTMENT TRUST APPROVAL OF INVESTMENT ADVISORY AGREEMENTS (Unaudited) |
The Board of Trustees (the “Board”), including the Independent Trustees voting separately, has reviewed and approved each Fund’s Investment Advisory Agreement with the Advisor. Approval took place at an in-person meeting held on April 22, 2011, at which all of the Trustees were present. This meeting was called to approve the Investment Advisory Agreements, prior to the termination of the former investment advisory agreements (the “Former Advisory Agreements”) between the Trust and the Advisor. Certain investment entities controlled and managed by TA Associates, Inc. (“TA”) acquired a controlling interest in the Advisor effective June 30, 2011, resulting in a change of control at the Advisor, and the automatic termination of the former investment advisory agreements (the “Transaction”). Each Fund’s new Investment Advisory Agreement with the Advisor was approved by shareholders of the Fund at a Special Meeting of Shareholders held on June 27, 2011.
In the course of their deliberations, the Board was advised by legal counsel and the Independent Trustees were advised by independent legal counsel. The Board received and reviewed a substantial amount of information provided by the Advisor in response to requests of the Board and counsel.
In considering the Investment Advisory Agreements and reaching their conclusions with respect thereto, the Board reviewed and analyzed various factors that they determined were relevant, including the factors described below.
The nature, extent, and quality of the services provided by the Advisor. In this regard, the Board considered the responsibilities the Advisor would have under the Investment Advisory Agreements. The Board noted that the Advisor’s responsibilities would remain the same as under the Former Advisory Agreements. Accordingly, the Board reviewed the services being provided by the Advisor to the Funds including, without limitation, its investment advisory services since each Fund’s inception, its coordination of services for the Funds by the Funds’ service providers, its compliance procedures and practices, and its efforts to promote the Funds and assist in their distribution. The Board noted that many of the Trust’s executive officers are employees of the Advisor, and (with the exception of the Chief Compliance Officer) serve the Trust without additional compensation from the Funds. After reviewing the foregoing information and further information in the materials provided to the Board by the Advisor (including descriptions of the Advisor’s business and the Advisor’s Form ADV), the Board concluded that the quality, extent, and nature of the services provided by the Advisor are satisfactory and adequate for the Funds.
The investment performance of the Funds and Advisor. In this regard, the Board compared the performance of each Fund with the performance of benchmark indices, comparable peer group averages and mutual funds considered by the Advisor to be competitors of the Funds. The Board considered the performance of other funds in the Funds’ Morningstar categories, and the Funds’ Morningstar ratings; however, the Board noted that comparisons with other funds in the Funds’ Morningstar categories were not necessarily appropriate considering the Funds’ unique investment approach. The Board also considered the consistency of the Advisor’s management of each Fund with the Fund’s investment objective and policies. Following discussion of the short and long-term investment performance of each Fund, the Advisor’s experience in managing the Funds and separate accounts, the Advisor’s historical investment performance and other factors, the Board concluded that the investment performance of the Funds and the Advisor has been satisfactory.
STADION INVESTMENT TRUST APPROVAL OF INVESTMENT ADVISORY AGREEMENTS (Unaudited) (Continued) |
The costs of the services to be provided and profits to be realized by the Advisor from its relationship with the Funds. In this regard, the Board considered the Advisor’s staffing, personnel, and methods of operating; the Advisor’s compliance policies and procedures; the financial condition of the Advisor and the level of commitment to the Funds and the Advisor by the principals of the Advisor; the asset levels of the Funds; the Advisor’s prior payment of startup costs for the Funds, the rapid growth of the Managed Fund and the less rapid growth of the Core Advantage Fund; and the overall expenses of the Funds, including certain fee waivers and expense reimbursements by the Advisor on behalf of the Funds. The Board discussed each Fund’s Expense Limitation Agreement with the Advisor, and considered the Advisor’s past fee waivers with respect to each Fund.
The Board compared the fees and expenses of each Fund (including the management fee) to a peer group of other funds considered by the Advisor to be competitor funds. The Board also considered the fees and expenses of funds in the Funds’ Morningstar categories, although the Board noted that the Funds’ relatively unique investment strategies and approaches raised questions about the usefulness of these comparisons. The Board also compared the fees paid by each Fund as compared to the fees paid by other clients of the Advisor, and considered the similarities and differences of services received by such other clients as compared to the services received by the Funds.
The Board considered the Advisor’s profitability, including the Advisor’s recent growth and changes in the Advisor’s profitability over recent years, taking into account the extent to which the Funds generate revenue and profits for the Advisor. In this regard, the Board considered not only the Advisor’s profitability, but also the Advisor’s changes in expenses as the Advisor grows. Finally, the Board considered the impact, or potential impact, of the Transaction on the Advisor’s profitability and potential profitability.
The Board also considered potential benefits to the Advisor other than management fees from managing the Funds, including promotion of the Advisor’s name and the ability for the Advisor to place small accounts into the Funds.
Following these comparisons and upon further consideration and discussion of the foregoing, the Board concluded that the fees paid to the Advisor by each Fund are appropriate and within the range of what would have been negotiated at arm’s length.
The extent to which economies of scale would be realized as the Funds grow and whether management fee levels reflect these economies of scale for the benefit of each Fund’s investors. In this regard, the Board considered that each Fund’s fee arrangements with the Advisor involve both a management fee and an Expense Limitation Agreement. In connection with the Core Advantage Fund, the Board determined that the Fund has continued to experience benefits from the Expense Limitation Agreement. In connection with the Managed Fund, the Board noted that, although the assets of the Fund have grown to a level where the Advisor is receiving its full fee, the Managed Fund has experienced benefits from the Expense Limitation Agreement in prior years. The Board also considered the benefit to the Funds of the existing fee breakpoints for each Fund, and considered breakpoints applied by
STADION INVESTMENT TRUST APPROVAL OF INVESTMENT ADVISORY AGREEMENTS (Unaudited) (Continued) |
some of the Funds’ competitor funds. Going forward, the Board noted that each Fund has the potential to benefit from economies of scale under its agreements with the Advisor and other service providers. However, the Board also considered that, due to the Advisor’s size and unique investment approach, the Advisor’s potential to benefit from economies of scale is mitigated by the additional complexities faced by the Advisor as assets under management increase. The Board also considered the Advisor’s efforts on behalf of the Funds in recent years and whether the Funds’ recent growth could slow or be reversed in the near- or long-term. Following further discussion of the Funds’ asset levels, expectations for growth and levels of fees, the Board determined that the Funds’ fee arrangements with the Advisor continue to provide benefits through the Expense Limitation Agreement and that, at the Funds’ current and projected asset levels for the next two years, the Funds’ arrangements with the Advisor are fair and reasonable.
The likely effects of the Transaction with TA on the Funds and their shareholders. The Board considered the history, reputation, qualifications and background of the Advisor and TA and their respective financial conditions, as well as the qualifications of their personnel. The Board also considered the potential resources of TA that may be afforded the Advisor as a result of the Transaction. The Board noted that TA offers potential strategic guidance and a significant network of contacts to its portfolio of companies, and that the additional resources could expand the extent and quality of services provided to the Funds by the Advisor.
In making the determination to approve the Investment Advisory Agreements and to recommend approval to shareholders of the Trust, the Board considered the Advisor’s representations that (i) the Transaction should benefit the Advisor and the Funds by preserving the Advisor’s independent management structure and portfolio management style, while providing stability from a strengthening balance sheet and increased resources for the Advisor’s operations; (ii) the Transaction should not materially affect the advisory operations of the Advisor or the level or quality of advisory services provided to the Funds; (iii) the same personnel of the Advisor who currently provide services to the Trust will continue to do so after the Transaction; (iv) the commitment of the Advisor to pay or reimburse the Trust for the expenses incurred in connection with the Transaction; (v) the Advisor and TA’s agreement to indemnify the Funds with respect to certain aspects of the Transaction and the information provided for in the Trust’s proxy statement; and (vi) the Trust will not be subject to any undue burden as a result of the Transaction.
Conclusion
After full consideration of the above factors as well as other factors, the Board unanimously concluded that approval of the Investment Advisory Agreements was in the best interests of each Fund and its shareholders. No single factor was considered in isolation or to be determinative to the decision of the Trustees to approve the Investment Advisory Agreements. Rather, the Trustees concluded, in light of their weighing and balancing all factors, that approval of the Investment Advisory Agreements was in the best interests of each Fund and its shareholders.
This page intentionally left blank.
As of the end of the period covered by this report, the registrant has adopted a code of ethics that applies to the registrant’s principal executive officer, principal financial officer, principal accounting officer or controller, or persons performing similar functions, regardless of whether these individuals are employed by the registrant or a third party. Pursuant to Item 12(a)(1), a copy of registrant’s code of ethics has been filed with the Commission. During the period covered by this report, the code of ethics has not been amended, and the registrant has not granted any waivers, including implicit waivers, from the provisions of the code of ethics.
The registrant’s board of trustees has determined that the registrant has at least one audit committee financial expert serving on its audit committee. The name of the audit committee financial expert is Ronald C. Baum. Mr. Baum is “independent” for purposes of this Item.
The registrant does not have procedures in place to consider nominees recommended by shareholders. The registrant’s nominating committee generally will not consider nominees recommended by shareholders.
(a) Based on their evaluation of the registrant’s disclosure controls and procedures (as defined in Rule 30a-3(c) under the Investment Company Act of 1940) as of a date within 90 days of the filing date of this report, the registrant’s principal executive officer and principal financial officer have concluded that such disclosure controls and procedures are reasonably designed and are operating effectively to ensure that material information relating to the registrant, including its consolidated subsidiaries, is made known to them by others within those entities, particularly during the period in which this report is being prepared, and that the information required in filings on Form N-CSR is recorded, processed, summarized, and reported on a timely basis.
(b) There were no changes in the registrant’s internal control over financial reporting (as defined in Rule 30a-3(d) under the Investment Company Act of 1940) that occurred during the second fiscal quarter of the period covered by this report that have materially affected, or are reasonably likely to materially affect, the registrant’s internal control over financial reporting.
File the exhibits listed below as part of this Form. Letter or number the exhibits in the sequence indicated.
(a)(1) Any code of ethics, or amendment thereto, that is the subject of the disclosure required by Item 2, to the extent that the registrant intends to satisfy the Item 2 requirements through filing of an exhibit: Attached hereto
(a)(2) A separate certification for each principal executive officer and principal financial officer of the registrant as required by Rule 30a-2(a) under the Act (17 CFR 270.30a-2(a)): Attached hereto
(a)(3) Any written solicitation to purchase securities under Rule 23c-1 under the Act (17 CFR 270.23c-1) sent or given during the period covered by the report by or on behalf of the registrant to 10 or more persons: Not applicable
(b) Certifications required by Rule 30a-2(b) under the Act (17 CFR 270.30a-2(b)): Attached hereto
Pursuant to the requirements of the Securities Exchange Act of 1934 and the Investment Company Act of 1940, the registrant has duly caused this report to be signed on its behalf by the undersigned, thereunto duly authorized.
Pursuant to the requirements of the Securities Exchange Act of 1934 and the Investment Company Act of 1940, this report has been signed below by the following persons on behalf of the registrant and in the capacities and on the dates indicated.