Washington, D.C. 20549
Tina H. Bloom, Esq.
Form N-CSR is to be used by management investment companies to file reports with the Commission not later than 10 days after the transmission to stockholders of any report that is required to be transmitted to stockholders under Rule 30e-1 under the Investment Company Act of 1940 (17 CFR 270.30e-1). The Commission may use the information provided on Form N-CSR in its regulatory, disclosure review, inspection, and policymaking roles.
A registrant is required to disclose the information specified by Form N-CSR, and the Commission will make this information public. A registrant is not required to respond to the collection of information contained in Form N-CSR unless the Form displays a currently valid Office of Management and Budget ("OMB") control number. Please direct comments concerning the accuracy of the information collection burden estimate and any suggestions for reducing the burden to Secretary, Securities and Exchange Commission, 450 Fifth Street, NW, Washington, DC 20549-0609. The OMB has reviewed this collection of information under the clearance requirements of 44 U.S.C. § 3507.
Annual Report 2012
Stadion Managed Portfolio
Stadion Core Advantage Portfolio
Stadion Olympus FundTM
Stadion Trilogy FundTM
May 31, 2012
This report and the financial statements contained herein are submitted for the general information of the shareholders of the Stadion Funds (the “Funds”). This report is not authorized for distribution to prospective investors in the Funds unless preceded or accompanied by an effective prospectus. Mutual fund shares are not deposits or obligations of, or guaranteed by, any depository institution. Shares are not insured by the FDIC, Federal Reserve Board or any other agency, and are subject to investment risks, including possible loss of principal amount invested. Neither the Funds nor the Funds’ distributor is a bank.
Distributor: Ultimus Fund Distributors, LLC, Phone 1-866-383-7636.
STADION INVESTMENT TRUST
LETTER TO SHAREHOLDERS May 31, 2012
Dear Stadion Shareholder,
We are pleased to present the annual report for the fiscal year ended May 31, 2012 for Stadion Managed Portfolio, Stadion Core Advantage Portfolio, and our new Stadion Olympus Fund and Stadion Trilogy Fund, each a series of Stadion Investment Trust. In this letter we will include an overview of the market and the prevailing market conditions during the past year, further introduce you to our two new funds, Trilogy and Olympus, and briefly highlight the purpose and approach of each of our funds, including these two new offerings. First, let’s take a short look at financial market conditions over the past year.
12 Month Market Overview
If we divide the past fiscal year into halves, the first half was a corrective pullback that lasted until late September, with short-lived strength in early July that gave way by late July and most of August to a decline to near bear market levels, including—beginning in early September—a period of exceptional volatility quite unfavorable for trend followers like Stadion. The second half began just ahead of the New Year with a solid ‘up’ move in late December that continued until early April when the equity markets pulled back for the balance of the reporting period. The below discussion of each Fund will offer more on their respective investment strategy, market reaction, and performance during the past year.
Stadion Managed Portfolio and Stadion Core Advantage Portfolio
We incorporate Stadion Managed and Core Advantage portfolios together since both are guided by Stadion’s long-term proprietary technically-based, trend following model. The difference is that Managed is ‘fully unconstrained,’ ranging from 100% equity exposure to 100% cash or cash equivalents, while Core Advantage employs a core-satellite structure, with 50% (satellite) actively managed using our tactical model, and 50% (core) tactically managed and fully invested at all times. Both employ broad-based market index ETFs, major sector-based, international and, at times, specialty ETFs. Percentages of holdings are determined by the relative strength of employed asset classes as determined by our proprietary model. Our process for entering newly up trending markets is to generally stick with large liquid market-based ETFs, and then as the trend more fully develops, broaden exposure according to where our model identifies the best opportunities. During favorable conditions, we also utilize an active trade-up process, which means we constantly evaluate holdings, using our technical ranking and screening system to replace under-performers with what we believe will be better performing holdings.
Core Advantage may be appropriate for those who want approximately half of their investment positioned in the market at all times, and Managed for those seeking as much protection from declining markets as Stadion can offer.
Stadion Managed and Core Advantage Performance
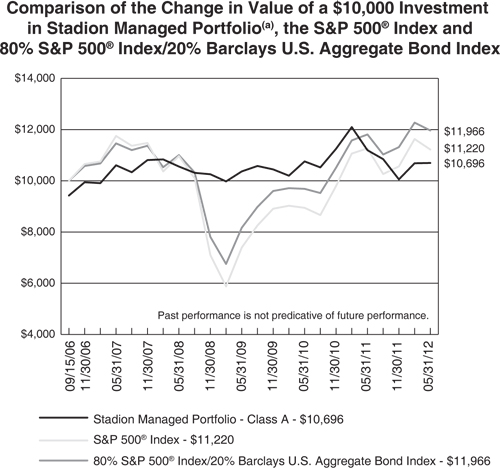
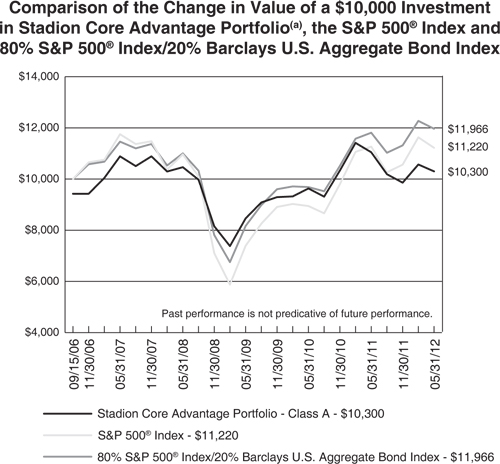
During the 12 months ended May 31, 2012, the equity markets, as reflected by key indexes, experienced mixed results. The S&P 500 Index was down -0.41%, the Nasdaq Composite Index rose +0.85%, the Russell 2000 Index fell -8.88%, and the Dow Jones Industrial Average was up +1.36%. During the same period, Managed Portfolio – Class A was down -4.45% and Core Advantage Portfolio – Class A was down -6.75%. These numbers exclude the impact of the 5.75% sales load.
Both Funds were defensive until the July rally last year, when they assumed fully invested positions. This rally was short lived and we were again fully defensive by late July, responding to deteriorating conditions. The volatility that began in September led to several ‘whipsaws’ (losses associated with sudden changes in market direction) into December. Whipsaws are not unexpected, occurring at Stadion a couple of times each
STADION INVESTMENT TRUST
LETTER TO SHAREHOLDERS (Continued)
year on average. But these successive whipsaws negatively impacted our Stadion Managed and Stadion Core Advantage portfolios causing the funds’ underperformance relative to their equities benchmarks shown above. Following this difficult period, the model, responding to a rally that began later in the year, again invested to gain during improving market conditions until the market’s April decline caused all holdings to hit their protective stops as our Core Advantage and Managed portfolios assumed defensive positions until the end of this reporting period.
Stadion Olympus Fund
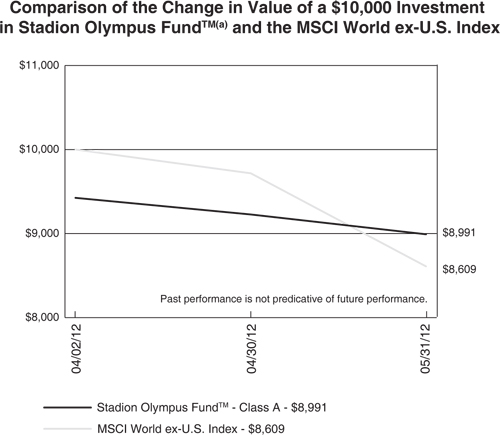
Stadion’s new international entry, the Stadion Olympus Fund, launched April 2, 2012. Although Olympus presents the highest risk/return characteristics among our lineup of defensive funds, like all Stadion portfolios, it is designed to mitigate risk. It is similar to Stadion Managed in using a trend-following model to help assess market conditions to identify when to be invested. With a security ranking measure to identify leading asset classes, it can move to fully defensive positions when risk levels are deemed high. Olympus borrows from Stadion’s domestic model by leveraging cyclical price measures for long term trend exposure, intermediate term price measures for more reactive and adaptive allocations, and a risk management overlay incorporating speculative Emerging Market trends and volatility to help guide shorter term allocations within the intermediate and longer term mandates. When fully defensive, the Fund has the ability to invest in cash or money market funds.
From inception on April 2, 2012 until the end of this reporting period, Stadion Olympus Fund declined -4.60%, which does not include a deduction for the 5.75% sales load. Though this is a very brief period, Olympus was relatively strong against key indexes. The benchmark for Olympus, the MSCI World ex-U.S. Index, was off dramatically more during the same period, falling -13.91%. The MSCI World Index dropped -10.39%, with other international barometers such as the MSCI EAFE down -13.98% and MSCI Emerging Market index down -12.75%.
Key to the relative performance of Olympus has been reduced equity exposure as the model has maintained an approximate 25% allocation to world markets via S&P Global 100 and ACWI Index tracking ETFs. This minimal exposure has been a result of the longer term trend stabilizing from its descent last fall, as picked up on by Olympus’s Cyclical Market Measure. With shorter and intermediate term trends being of higher risk, the Fund has weathered a smaller drawdown relative to various world benchmarks as a result of this minimal exposure over the last two months.
Stadion Trilogy Fund
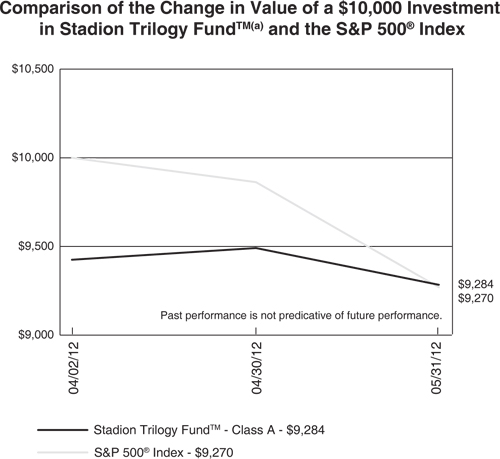
The Stadion Trilogy Fund is a multi-strategy portfolio designed to generate positive returns regardless of market direction, with an emphasis on lower risk and volatility than the U.S. Equity markets. The Trilogy portfolio is designed to be uncorrelated to traditional asset classes and maintains risk management positions at all times. The portfolio consists of an equity component, an income component and a trend component. The allocation to each component varies based on Trilogy’s investment model. While Trilogy’s goal is to produce positive returns annually, monthly returns within the components may be asymmetrical according to the periodic valuations of positions.
With an inception date of April 2, 2012, the Stadion Trilogy Fund returned -1.50% (excludes the impact of the 5.75% sales load) from inception through fiscal year ended May 31, 2012 with the S&P 500 Index losing -7.30% and the Barclay’s Aggregate Bond Index posting a 1.93% gain during the same period. Trilogy maintained roughly a 40% allocation to common stocks which produced market like returns which were
STADION INVESTMENT TRUST
LETTER TO SHAREHOLDERS (Continued)
successfully mitigated by the equity hedged SPX collar overwritten on the stocks. Trilogy also benefitted from a rise in the CBOE SPX Volatility Index on bearish option positions while having a slight setback on bullish option positions given the relatively quick 10% drawdown the S&P 500 experienced during this window. Overall, the components of Trilogy performed as expected as the Fund, on a relative basis, outperformed broad equities over the first two months of existence.
Stadion Model Observations and Market Outlook
While it is possible to assess results of some money managers in shorter periods, Stadion’s money management models are designed to accomplish results over full market cycles. The risk adverse methodology applied in managing the Stadion Managed, Stadion Core Advantage and Stadion Olympus Funds may result in underperformance during up markets because our defensive focus may cause us to miss some of the initial upswing as our indicators detect and confirm the new uptrend. However, when the market experiences major declines (there have been two bear markets in the last eleven years), we expect to avoid most of the downside. In the last 112 years, there have been 33 bear markets (declines > -20% as measured by the Dow Jones Industrial Average). Thus we believe there are times when the best approach to the equity markets is to exit them. Further, we do not forecast the market; in fact, we strongly believe no one can accurately do so consistently. Rather than predict, we react with discipline, using our rules-based, trend-following model which is designed to measure market conditions and utilize built-in rules that inform and direct our trades. Our fourth Fund, Stadion Trilogy, takes a slightly different but still defensive approach, employing a unique three part strategy designed to address all three primary market directions (up, down, sideways) within a single portfolio.
Thank you for your continued support and allowing us to serve you and the Funds. Please feel free to contact us with any questions or concerns.
Sincerely,
Stadion Money Management
Greg Morris
Chairman, Investment Committee
The views in this report were those of the Funds’ investment adviser as of the date of this Report and may not reflect their views on the date this report is first published or anytime thereafter. These views are intended to assist shareholders in understanding their investment in the Funds and do not constitute investment advice.
The performance information quoted above represents past performance and past performance does not guarantee future results. Investment return and principal value of an investment will fluctuate so that an investor’s shares, when redeemed, may be worth more or less than their original cost. Current performance may be lower or higher than the performance data quoted. Performance data, current to the most recent month end, may be obtained by calling 1-800-222-7636. An investor should consider a Fund’s investment objectives, risks, and charges and expenses carefully before investing. The Funds’ prospectus contains this and other important information. For information on the Funds’ expense ratios, please see the Financial Highlights tables found within this Report.
STADION INVESTMENT TRUST
LETTER TO SHAREHOLDERS (Continued)
Investment in the Funds is subject to investment risks, including, without limitation, market risk, management style risk, risks related to “fund of funds” structure, sector risk, fixed income risk, tracking risk, risks related to ETF net asset value and market price, foreign securities risk, risks related to portfolio turnover and small capitalization companies risk. Since each Stadion Fund is a “fund of funds,” an investor will indirectly bear fees and expenses charged by the underlying ETFs and investment companies in which a Stadion fund invests in addition to a Stadion Fund’s direct fees and expenses. Olympus Fund will have more exposure to foreign investment risk, including emerging market risk, than the other Stadion Funds. More information about these risks and other risks can be found in the Funds’ prospectus.
In addition to the risks set forth above, Trilogy Fund is subject to derivative investment risk. Derivatives may be difficult to value and may be subject to wide swings in valuations caused by changes in the value of the underlying instrument. The use of these instruments requires special skills and knowledge of investment techniques that are different than those normally required for purchasing and selling securities. The Fund could also experience losses if it is unable to close out a position because the market for an instrument or position is or becomes illiquid.
STADION MANAGED PORTFOLIO PERFORMANCE INFORMATION May 31, 2012 (Unaudited) |
Average Annual Total Returns(b)
(for periods ended May 31, 2012)
| | | |
| Stadion Managed Portfolio - Class A | -9.98% | -1.01% | 1.18% |
| Stadion Managed Portfolio - Class C | -5.13% | N/A | -0.62% |
| Stadion Managed Portfolio - Class I | -4.24% | N/A | -0.02% |
S&P 500® Index | -0.41% | -0.92% | 2.04%(d) |
80% S&P 500® Index/20% Barclays U.S. Aggregate Bond Index | 1.32% | 0.86% | 3.19%(d) |
| (a) | The line graph above represents performance of Class A shares only, which will vary from the performance of Class C and Class I shares based on the difference in loads and fees paid by shareholders in different classes. The change in value of the initial $10,000 investment shown for Class A shares in the line graph reflects the maximum front-end sales load of 5.75%. |
| | |
| (b) | Total return is a measure of the change in value of an investment in the Fund over the periods covered, which assumes any dividends or capital gains distributions are reinvested in shares of the Fund. Returns do not reflect the deduction of taxes a shareholder would pay on Fund distributions or the redemption of Fund shares. Total returns shown do include the effect of applicable sales loads. |
| | |
| (c) | The public offering of Class A shares commenced on September 15, 2006. The public offering of Class C shares commenced on October 1, 2009. The public offering of Class I shares commenced on May 28, 2010. |
| | |
| (d) | Represents the period from September 15, 2006 (date of original public offering of Class A shares) through May 31, 2012. |
STADION CORE ADVANTAGE PORTFOLIO
PERFORMANCE INFORMATION
May 31, 2012 (Unaudited)
Average Annual Total Returns(b)
(for periods ended May 31, 2012)
| | | |
| Stadion Core Advantage Portfolio - Class A | -12.15% | -2.26% | 0.52% |
| Stadion Core Advantage Portfolio - Class C | -7.54% | N/A | 3.61% |
| Stadion Core Advantage Portfolio - Class I | -6.65% | N/A | 3.63% |
S&P 500® Index | -0.41% | -0.92% | 2.04%(d) |
80% S&P 500® Index/20% Barclays U.S. Aggregate Bond Index | 1.32% | 0.86% | 3.19%(d) |
| (a) | The line graph above represents performance of Class A shares only, which will vary from the performance of Class C and Class I shares based on the difference in loads and fees paid by shareholders in different classes. The change in value of the initial $10,000 investment shown for Class A shares in the line graph reflects the maximum front-end sales load of 5.75%. |
| | |
| (b) | Total return is a measure of the change in value of an investment in the Fund over the periods covered, which assumes any dividends or capital gains distributions are reinvested in shares of the Fund. Returns do not reflect the deduction of taxes a shareholder would pay on Fund distributions or the redemption of Fund shares. Total returns shown do include the effect of applicable sales loads. |
| | |
| (c) | The public offering of Class A shares commenced on September 15, 2006. The public offering of Class C shares commenced on October 1, 2009. The public offering of Class I shares commenced on May 28, 2010. |
| | |
| (d) | Represents the period from September 15, 2006 (date of initial public offering of Class A shares) through May 31, 2012. |
STADION OLYMPUS FUNDTM
PERFORMANCE INFORMATION
May 31, 2012 (Unaudited)
Total Returns(b)
(for period ended May 31, 2012)
| |
Stadion Olympus FundTM - Class A | -10.08% |
Stadion Olympus FundTM - Class C | -4.70% |
Stadion Olympus FundTM - Class I | -4.50% |
| MSCI World ex-U.S. Index | -13.91% |
| (a) | The line graph above represents performance of Class A shares only, which will vary from the performance of Class C and Class I shares based on the difference in loads and fees paid by shareholders in different classes. The change in value of the initial $10,000 investment shown for Class A shares in the line graph reflects the maximum front-end sales load of 5.75%. |
| | |
| (b) | Total return is a measure of the change in value of an investment in the Fund over the periods covered, which assumes any dividends or capital gains distributions are reinvested in shares of the Fund. Returns do not reflect the deduction of taxes a shareholder would pay on Fund distributions or the redemption of Fund shares. Total returns shown do include the effect of applicable sales loads. |
| | |
| (c) | The public offering of all shares commenced on April 2, 2012. |
STADION TRILOGY FUNDTM
PERFORMANCE INFORMATION
May 31, 2012 (Unaudited)
Total Returns(b)
(for period ended May 31, 2012)
| |
Stadion Trilogy FundTM - Class A | -7.16% |
Stadion Trilogy FundTM - Class C | -1.50% |
Stadion Trilogy FundTM - Class I | -1.40% |
S&P 500® Index | -7.30% |
| (a) | The line graph above represents performance of Class A shares only, which will vary from the performance of Class C and Class I shares based on the difference in loads and fees paid by shareholders in different classes. The change in value of the initial $10,000 investment shown for Class A shares in the line graph reflects the maximum front-end sales load of 5.75%. |
| | |
| (b) | Total return is a measure of the change in value of an investment in the Fund over the periods covered, which assumes any dividends or capital gains distributions are reinvested in shares of the Fund. Returns do not reflect the deduction of taxes a shareholder would pay on Fund distributions or the redemption of Fund shares. Total returns shown do include the effect of applicable sales loads. |
| | |
| (c) | The public offering of all shares commenced on April 2, 2012. |
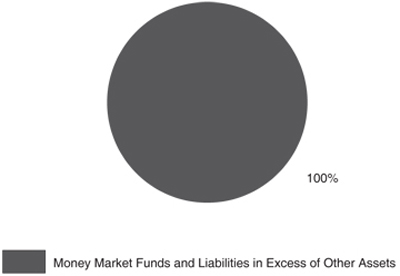
STADION MANAGED PORTFOLIO
PORTFOLIO ALLOCATION (% OF NET ASSETS)
May 31, 2012 (Unaudited)
STADION CORE ADVANTAGE PORTFOLIO
PORTFOLIO ALLOCATION (% OF NET ASSETS)
May 31, 2012 (Unaudited)
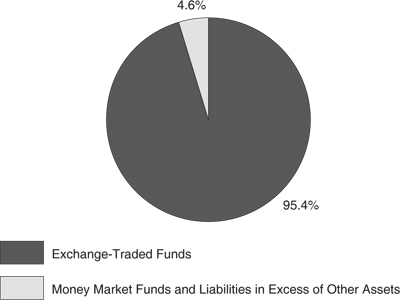
STADION OLYMPUS FUNDTM
PORTFOLIO ALLOCATION (% OF NET ASSETS)
May 31, 2012 (Unaudited)
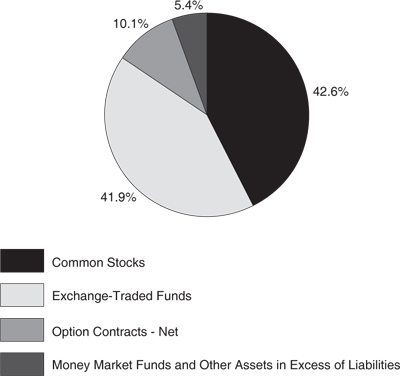
STADION TRILOGY FUNDTM
PORTFOLIO ALLOCATION (% OF NET ASSETS)
May 31, 2012 (Unaudited)
STADION MANAGED PORTFOLIO
SCHEDULE OF INVESTMENTS
May 31, 2012
MONEY MARKET FUNDS — 100.4% | | | | | | |
Federated Government Obligations Fund - Institutional Class, 0.01% (a) | | | 137,529,208 | | | $ | 137,529,208 | |
Fidelity Institutional Money Market Government Portfolio - Class I, 0.01% (a) | | | 137,155,932 | | | | 137,155,932 | |
First American Government Obligations Fund - Class Y, 0.02% (a) | | | 137,529,208 | | | | 137,529,208 | |
Goldman Sachs Financial Square Government Fund - Institutional Class, 0.04% (a) | | | 137,529,208 | | | | 137,529,208 | |
Invesco Short-Term Investments Trust Government & Agency Portfolio - Resource Class, 0.02% (a) | | | 137,529,208 | | | | 137,529,208 | |
Total Investments at Value (Cost $687,272,764) | | | | | | $ | 687,272,764 | |
| | | | | | | | | |
| Liabilities in Excess of Other Assets — (0.4%) | | | | | | | (2,973,257 | ) |
| | | | | | | | | |
| Net Assets — 100.0% | | | | | | $ | 684,299,507 | |
| (a) | Variable rate security. The rate shown is the 7-day effective yield as of May 31, 2012. |
See accompanying notes to financial statements. |
STADION CORE ADVANTAGE PORTFOLIO
SCHEDULE OF INVESTMENTS
May 31, 2012
EXCHANGE-TRADED FUNDS — 77.5% | | | | | | |
| iShares Barclays 1-3 Year Credit Bond Fund | | | 39,870 | | | $ | 4,177,579 | |
| iShares Barclays 1-3 Year Treasury Bond Fund | | | 49,350 | | | | 4,169,088 | |
| iShares Barclays 3-7 Year Treasury Bond Fund | | | 33,850 | | | | 4,175,397 | |
| iShares Barclays MBS Bond Fund | | | 19,190 | | | | 2,081,347 | |
| iShares Barclays U.S. Treasury Bond Fund | | | 82,610 | | | | 2,099,120 | |
| iShares High Dividend Equity Fund | | | 73,030 | | | | 4,180,237 | |
| iShares S&P 500 Index Fund | | | 30,950 | | | | 4,080,758 | |
| PowerShares 1-30 Laddered Treasury Portfolio | | | 37,880 | | | | 1,271,253 | |
| SPDR S&P 500 ETF Trust | | | 46,590 | | | | 6,126,119 | |
Total Exchange-Traded Funds (Cost $32,000,814) | | | | | | $ | 32,360,898 | |
MONEY MARKET FUNDS — 53.0% | | | | | | |
Fidelity Institutional Money Market Government Portfolio - Class I, 0.01% (a) (Cost $22,149,029) | | | 22,149,029 | | | $ | 22,149,029 | |
| | | | | | | | | |
Total Investments at Value — 130.5% (Cost $54,149,843) | | | | | | $ | 54,509,927 | |
| | | | | | | | | |
| Liabilities in Excess of Other Assets — (30.5%) | | | | | | | (12,728,551 | ) |
| | | | | | | | | |
| Net Assets — 100.0% | | | | | | $ | 41,781,376 | |
| (a) | Variable rate security. The rate shown is the 7-day effective yield as of May 31, 2012. |
| See accompanying notes to financial statements. |
STADION OLYMPUS FUNDTM
SCHEDULE OF INVESTMENTS
May 31, 2012
EXCHANGE-TRADED FUNDS — 95.4% | | | | | | |
| iShares MSCI ACWI Index Fund | | | 19,450 | | | $ | 823,318 | |
| iShares S&P Global 100 Index Fund | | | 21,790 | | | | 1,236,583 | |
| iShares S&P/Citigroup 1-3 International Treasury Bond Fund | | | 13,000 | | | | 1,220,830 | |
PowerShares DB US Dollar Index Bullish Fund (a) | | | 125,000 | | | | 2,873,750 | |
| SPDR Barclays Capital International Treasury Bond ETF | | | 37,000 | | | | 2,169,680 | |
Total Exchange-Traded Funds (Cost $8,479,181) | | | | | | $ | 8,324,161 | |
MONEY MARKET FUNDS — 76.2% | | | | | | |
Fidelity Institutional Money Market Government Portfolio - Class I, 0.01% (b) (Cost $6,644,662) | | | 6,644,662 | | | $ | 6,644,662 | |
| | | | | | | | | |
Total Investments at Value — 171.6% (Cost $15,123,843) | | | | | | $ | 14,968,823 | |
| | | | | | | | | |
| Liabilities in Excess of Other Assets — (71.6%) | | | | | | | (6,245,616 | ) |
| | | | | | | | | |
| Net Assets — 100.0% | | | | | | $ | 8,723,207 | |
| (a) | Non-income producing security. |
| (b) | Variable rate security. The rate shown is the 7-day effective yield as of May 31, 2012. |
| See accompanying notes to financial statements. |
STADION TRILOGY FUNDTM
SCHEDULE OF INVESTMENTS
May 31, 2012
| | | | | | |
| Consumer Discretionary — 4.1% | | | | | | |
| Distributors — 1.1% | | | | | | |
| Genuine Parts Company+ | | | 8,424 | | | $ | 530,712 | |
| | | | | | | | | |
| Hotels, Restaurants & Leisure — 1.0% | | | | | | | | |
| McDonald's Corporation+ | | | 5,699 | | | | 509,148 | |
| | | | | | | | | |
| Leisure Equipment & Products — 1.1% | | | | | | | | |
| Polaris Industries, Inc.+ | | | 6,766 | | | | 514,013 | |
| | | | | | | | | |
| Multiline Retail — 0.9% | | | | | | | | |
| Nordstrom, Inc.+ | | | 9,721 | | | | 460,484 | |
| | | | | | | | | |
| Consumer Staples — 6.6% | | | | | | | | |
| Food & Staples Retailing — 2.2% | | | | | | | | |
| Costco Wholesale Corporation+ | | | 6,527 | | | | 563,867 | |
| Sysco Corporation+ | | | 19,470 | | | | 543,408 | |
| | | | | | | | 1,107,275 | |
| Food Products — 3.3% | | | | | | | | |
| General Mills, Inc.+ | | | 14,279 | | | | 546,600 | |
| Kellogg Company+ | | | 10,854 | | | | 529,458 | |
| McCormick & Company, Inc. - Non-Voting Shares+ | | | 9,851 | | | | 555,203 | |
| | | | | | | | 1,631,261 | |
| Household Products — 1.1% | | | | | | | | |
| Procter & Gamble Company (The)+ | | | 8,523 | | | | 530,898 | |
| | | | | | | | | |
| Energy — 2.1% | | | | | | | | |
| Oil, Gas & Consumable Fuels — 2.1% | | | | | | | | |
| Chevron Corporation+ | | | 5,256 | | | | 516,718 | |
| ConocoPhillips+ | | | 10,245 | | | | 534,379 | |
| | | | | | | | 1,051,097 | |
| Financials — 4.3% | | | | | | | | |
| Capital Markets — 1.1% | | | | | | | | |
| Eaton Vance Corporation+ | | | 21,902 | | | | 533,095 | |
| | | | | | | | | |
| Commercial Banks — 1.1% | | | | | | | | |
| Commerce Bancshares, Inc.+ | | | 13,869 | | | | 537,285 | |
| | | | | | | | | |
| Insurance — 2.1% | | | | | | | | |
| Aflac, Inc.+ | | | 12,618 | | | | 505,729 | |
| Brown & Brown, Inc.+ | | | 20,728 | | | | 530,637 | |
| | | | | | | | 1,036,366 | |
STADION TRILOGY FUNDTM
SCHEDULE OF INVESTMENTS (Continued)
COMMON STOCKS — 42.6% (Continued) | | | | | | |
| Health Care — 3.2% | | | | | | |
| Health Care Equipment & Supplies — 1.0% | | | | | | |
| Baxter International, Inc.+ | | | 9,979 | | | $ | 505,137 | |
| | | | | | | | | |
| Pharmaceuticals — 2.2% | | | | | | | | |
| Abbott Laboratories+ | | | 8,818 | | | | 544,864 | |
| Johnson & Johnson+ | | | 8,437 | | | | 526,722 | |
| | | | | | | | 1,071,586 | |
| Industrials — 7.3% | | | | | | | | |
| Aerospace & Defense — 2.1% | | | | | | | | |
| Lockheed Martin Corporation+ | | | 6,193 | | | | 512,781 | |
| United Technologies Corporation+ | | | 6,866 | | | | 508,839 | |
| | | | | | | | 1,021,620 | |
| Electrical Equipment — 1.1% | | | | | | | | |
| Emerson Electric Company+ | | | 11,265 | | | | 526,864 | |
| | | | | | | | | |
| Machinery — 2.1% | | | | | | | | |
| Caterpillar, Inc.+ | | | 5,541 | | | | 485,503 | |
| Illinois Tool Works, Inc.+ | | | 9,676 | | | | 543,307 | |
| | | | | | | | 1,028,810 | |
| Road & Rail — 1.0% | | | | | | | | |
| Norfolk Southern Corporation+ | | | 7,637 | | | | 500,376 | |
| | | | | | | | | |
| Trading Companies & Distributors — 1.0% | | | | | | | | |
| Grainger (W.W.), Inc.+ | | | 2,704 | | | | 523,629 | |
| | | | | | | | | |
| Information Technology — 5.2% | | | | | | | | |
| Communications Equipment — 1.1% | | | | | | | | |
| Harris Corporation+ | | | 13,243 | | | | 526,807 | |
| | | | | | | | | |
| IT Services — 1.0% | | | | | | | | |
| Accenture plc - Class A+ | | | 8,677 | | | | 495,457 | |
| | | | | | | | | |
| Semiconductors & Semiconductor Equipment — 1.0% | | | | | | | | |
| Intel Corporation+ | | | 19,461 | | | | 502,872 | |
| | | | | | | | | |
| Software — 2.1% | | | | | | | | |
| FactSet Research Systems, Inc.+ | | | 5,321 | | | | 560,993 | |
| Microsoft Corporation+ | | | 17,502 | | | | 510,883 | |
| | | | | | | | 1,071,876 | |
| Materials — 3.2% | | | | | | | | |
| Chemicals — 2.2% | | | | | | | | |
| Ecolab, Inc.+ | | | 8,608 | | | | 544,112 | |
| Sigma-Aldrich Corporation+ | | | 7,939 | | | | 550,728 | |
| | | | | | | | 1,094,840 | |
STADION TRILOGY FUNDTM
SCHEDULE OF INVESTMENTS (Continued)
COMMON STOCKS — 42.6% (Continued) | | | | | | |
| Materials — 3.2% (Continued) | | | | | | |
| Containers & Packaging — 1.0% | | | | | | |
| AptarGroup, Inc.+ | | | 10,178 | | | $ | 515,719 | |
| | | | | | | | | |
| Telecommunication Services — 2.3% | | | | | | | | |
| Diversified Telecommunication Services — 2.3% | | | | | | | | |
| AT&T, Inc.+ | | | 16,687 | | | | 570,195 | |
| Verizon Communications, Inc.+ | | | 13,556 | | | | 564,472 | |
| | | | | | | | 1,134,667 | |
| Utilities — 4.3% | | | | | | | | |
| Electric Utilities — 3.3% | | | | | | | | |
| Entergy Corporation+ | | | 8,406 | | | | 542,439 | |
| Northeast Utilities+ | | | 15,236 | | | | 548,648 | |
| Southern Company (The)+ | | | 12,103 | | | | 555,649 | |
| | | | | | | | 1,646,736 | |
| Gas Utilities — 1.0% | | | | | | | | |
| National Fuel Gas Company+ | | | 11,594 | | | | 501,209 | |
| | | | | | | | | |
Total Common Stocks (Cost $21,981,864) | | | | | | $ | 21,109,839 | |
EXCHANGE-TRADED FUNDS — 41.9% | | | | | | |
| iShares Barclays 1-3 Year Credit Bond Fund | | | 19,979 | | | $ | 2,093,400 | |
| iShares Barclays 1-3 Year Treasury Bond Fund | | | 24,967 | | | | 2,109,212 | |
| iShares Barclays MBS Bond Fund | | | 77,019 | | | | 8,353,481 | |
| iShares Floating Rate Note Fund | | | 83,275 | | | | 4,147,928 | |
| iShares iBoxx $ High Yield Corporate Bond Fund | | | 22,898 | | | | 2,009,757 | |
| PIMCO 0-5 Year High Yield Corporate Bond Index Fund | | | 20,812 | | | | 2,047,068 | |
Total Exchange-Traded Funds (Cost $20,879,953) | | | | | | $ | 20,760,846 | |
STADION TRILOGY FUNDTM
SCHEDULE OF INVESTMENTS (Continued)
PURCHASED OPTION CONTRACTS — 18.1% | | | | | | | | | | |
| Call Option Contracts — 6.0% | | | | | | | | | | |
| S&P 500 Index | 06/16/2012 | | $ | 1,100 | | | | 30 | | | $ | 628,650 | |
| S&P 500 Index | 06/16/2012 | | | 1,150 | | | | 30 | | | | 480,150 | |
| S&P 500 Index | 06/16/2012 | | | 1,600 | | | | 127 | | | | 635 | |
| S&P 500 Index | 07/21/2012 | | | 1,550 | | | | 80 | | | | 1,400 | |
| S&P 500 Index | 09/22/2012 | | | 1,000 | | | | 30 | | | | 936,450 | |
| S&P 500 Index | 09/22/2012 | | | 1,050 | | | | 30 | | | | 797,550 | |
| S&P 500 Index | 12/22/2012 | | | 1,050 | | | | 5 | | | | 137,100 | |
| | | | | | | | | | | | | 2,981,935 | |
| Put Option Contracts — 12.1% | | | | | | | | | | | | | |
| iPath S&P 500 VIX | 09/22/2012 | | | 17 | | | | 500 | | | | 86,000 | |
| iPath S&P 500 VIX | 09/22/2012 | | | 18 | | | | 500 | | | | 112,500 | |
| iPath S&P 500 VIX | 09/22/2012 | | | 19 | | | | 500 | | | | 137,250 | |
| S&P 500 Index | 06/16/2012 | | | 1,200 | | | | 41 | | | | 8,918 | |
| S&P 500 Index | 06/16/2012 | | | 1,235 | | | | 79 | | | | 36,340 | |
| S&P 500 Index | 07/21/2012 | | | 1,175 | | | | 60 | | | | 66,600 | |
| S&P 500 Index | 03/16/2013 | | | 1,250 | | | | 175 | | | | 1,631,875 | |
| S&P 500 Index | 03/16/2013 | | | 1,275 | | | | 20 | | | | 204,800 | |
| S&P 500 Index | 06/22/2013 | | | 1,250 | | | | 170 | | | | 1,940,550 | |
| S&P 500 Index | 06/22/2013 | | | 1,275 | | | | 10 | | | | 123,750 | |
| SPDR S&P 500 Index | 03/16/2013 | | | 115 | | | | 50 | | | | 32,450 | |
| SPDR S&P 500 Index | 03/16/2013 | | | 120 | | | | 315 | | | | 247,433 | |
| SPDR S&P 500 Index | 12/21/2013 | | | 115 | | | | 50 | | | | 55,700 | |
| SPDR S&P 500 Index | 12/21/2013 | | | 120 | | | | 800 | | | | 1,026,400 | |
| SPDR S&P 500 Index | 12/21/2013 | | | 125 | | | | 185 | | | | 272,412 | |
| | | | | | | | | | | | | 5,982,978 | |
| | | | | | | | | | | | | | |
Total Purchased Option Contracts (Cost $8,525,532) | | | $ | 8,964,913 | |
STADION TRILOGY FUNDTM
SCHEDULE OF INVESTMENTS (Continued)
MONEY MARKET FUNDS — 5.0% | | | | | | |
Fidelity Institutional Money Market Government Portfolio - Class I, 0.01% (a) (Cost $2,498,310) | | | 2,498,310 | | | $ | 2,498,310 | |
| | | | | | | | | |
Total Investments at Value — 107.6% (Cost $53,885,659) | | | | | | $ | 53,333,908 | |
| | | | | | | | | |
| Written Option Contracts — (8.0%) | | | | | | | (3,979,995 | ) |
| | | | | | | | | |
| Other Assets in Excess of Liabilities — 0.4% | | | | | | | 204,241 | |
| | | | | | | | | |
| Net Assets — 100.0% | | | | | | $ | 49,558,154 | |
| + | All or a portion of the security is held as collateral for written options. |
| (a) | Variable rate security. The rate shown is the 7-day effective yield as of May 31, 2012. |
| See accompanying notes to financial statements. |
STADION TRILOGY FUNDTM
SCHEDULE OF OPEN WRITTEN OPTION CONTRACTS
May 31, 2012
| | | | | | | | | | | | | |
| Call Option Contracts | | | | | | | | | | | | | |
| S&P 500 Index | 06/16/2012 | | $ | 1,325 | | | | 90 | | | $ | 118,800 | | | $ | 179,710 | |
| S&P 500 Index | 06/16/2012 | | | 1,330 | | | | 50 | | | | 55,500 | | | | 99,950 | |
| S&P 500 Index | 06/16/2012 | | | 1,350 | | | | 12 | | | | 5,640 | | | | 48,288 | |
| S&P 500 Index | 07/21/2012 | | | 1,320 | | | | 30 | | | | 100,950 | | | | 131,970 | |
| S&P 500 Index | 07/21/2012 | | | 1,325 | | | | 20 | | | | 61,900 | | | | 60,180 | |
| S&P 500 Index | 07/21/2012 | | | 1,350 | | | | 60 | | | | 114,600 | | | | 145,740 | |
| S&P 500 Index | 06/22/2013 | | | 1,500 | | | | 25 | | | | 79,750 | | | | 80,225 | |
| S&P 500 Index | 12/21/2013 | | | 1,550 | | | | 29 | | | | 107,880 | | | | 127,191 | |
| S&P 500 Index | 12/21/2013 | | | 1,600 | | | | 102 | | | | 265,200 | | | | 339,398 | |
| | | | | | | | | | | | | 910,220 | | | | 1,212,652 | |
| Put Option Contracts | | | | | | | | | | | | | | | | | |
| S&P 500 Index | 06/16/2012 | | | 1,325 | | | | 95 | | | | 275,025 | | | | 209,655 | |
| S&P 500 Index | 06/16/2012 | | | 1,350 | | �� | | 25 | | | | 113,500 | | | | 87,475 | |
| S&P 500 Index | 07/21/2012 | | | 1,325 | | | | 60 | | | | 291,300 | | | | 230,940 | |
| S&P 500 Index | 03/16/2013 | | | 1,100 | | | | 90 | | | | 470,250 | | | | 325,360 | |
| S&P 500 Index | 03/16/2013 | | | 1,125 | | | | 110 | | | | 634,700 | | | | 434,570 | |
| S&P 500 Index | 06/22/2013 | | | 1,100 | | | | 50 | | | | 345,000 | | | | 244,990 | |
| S&P 500 Index | 06/22/2013 | | | 1,125 | | | | 125 | | | | 940,000 | | | | 677,375 | |
| | | | | | | | | | | | | 3,069,775 | | | | 2,210,365 | |
| | | | | | | | | | | | | | | | | | |
| Total Written Option Contracts | | | $ | 3,979,995 | | | $ | 3,423,017 | |
| See accompanying notes to financial statements. |
STADION INVESTMENT TRUST
STATEMENTS OF ASSETS AND LIABILITIES
May 31, 2012
| | | | | | |
| ASSETS | | | | | | |
| Investments in securities: | | | | | | |
| At acquisition cost | | $ | 687,272,764 | | | $ | 54,149,843 | |
| At value (Note 2) | | $ | 687,272,764 | | | $ | 54,509,927 | |
| Dividends receivable | | | 6,113 | | | | 177 | |
| Receivable for capital shares sold | | | 809,017 | | | | 5,770 | |
| Receivable for investment securities sold | | | — | | | | 5,363,666 | |
| Other assets | | | 98,961 | | | | 23,724 | |
| TOTAL ASSETS | | | 688,186,855 | | | | 59,903,264 | |
| | | | | | | | | |
| LIABILITIES | | | | | | | | |
| Payable for capital shares redeemed | | | 3,541,634 | | | | 163,878 | |
| Payable for investment securities purchased | | | — | | | | 17,920,119 | |
| Payable to Advisor (Note 5) | | | 19,750 | | | | 4,092 | |
| Accrued distribution fees (Note 5) | | | 195,773 | | | | 6,263 | |
| Accrued compliance fees (Note 5) | | | 6,058 | | | | 378 | |
| Payable to administrator (Note 5) | | | 92,250 | | | | 11,980 | |
| Other accrued expenses | | | 31,883 | | | | 15,178 | |
| TOTAL LIABILITIES | | | 3,887,348 | | | | 18,121,888 | |
| | | | | | | | | |
| NET ASSETS | | $ | 684,299,507 | | | $ | 41,781,376 | |
| | | | | | | | | |
| Net assets consist of: | | | | | | | | |
| Paid-in capital | | $ | 746,931,701 | | | $ | 43,628,845 | |
| Accumulated net realized losses from security transactions | | | (62,632,194 | ) | | | (2,207,553 | ) |
| Net unrealized appreciation on investments | | | — | | | | 360,084 | |
| Net assets | | $ | 684,299,507 | | | $ | 41,781,376 | |
| See accompanying notes to financial statements. |
STADION INVESTMENT TRUST
STATEMENTS OF ASSETS AND LIABILITIES (Continued)
May 31, 2012
| | | | | | |
| PRICING OF CLASS A SHARES | | | | | | |
| Net assets applicable to Class A shares | | $ | 407,201,935 | | | $ | 33,892,315 | |
Class A shares of beneficial interest outstanding (unlimited number of shares authorized, $0.001 par value) | | | 43,411,887 | | | | 3,267,712 | |
| Net asset value and redemption price per share (Note 2) | | $ | 9.38 | | | $ | 10.37 | |
| Maximum offering price per share (Note 2) | | $ | 9.95 | | | $ | 11.00 | |
| | | | | | | | | |
| PRICING OF CLASS C SHARES | | | | | | | | |
| Net assets applicable to Class C shares | | $ | 159,111,997 | | | $ | 5,252,939 | |
Class C shares of beneficial interest outstanding (unlimited number of shares authorized, $0.001 par value) | | | 17,339,967 | | | | 517,251 | |
Net asset value, offering price and redemption price per share (Note 2) | | $ | 9.18 | | | $ | 10.16 | |
| | | | | | | | | |
| PRICING OF CLASS I SHARES | | | | | | | | |
| Net assets applicable to Class I shares | | $ | 117,985,575 | | | $ | 2,636,122 | |
Class I shares of beneficial interest outstanding (unlimited number of shares authorized, $0.001 par value) | | | 12,513,268 | | | | 252,930 | |
Net asset value, offering price and redemption price per share (Note 2) | | $ | 9.43 | | | $ | 10.42 | |
| See accompanying notes to financial statements. |
STADION INVESTMENT TRUST
STATEMENTS OF ASSETS AND LIABILITIES
May 31, 2012
| | | | | | |
| ASSETS | | | | | | |
| Investments in securities: | | | | | | |
| At acquisition cost | | $ | 15,123,843 | | | $ | 53,885,659 | |
| At value (Note 2) | | $ | 14,968,823 | | | $ | 53,333,908 | |
| Cash | | | — | | | | 58,650 | |
| Dividends receivable | | | 52 | | | | 85,991 | |
| Receivable for capital shares sold | | | 240 | | | | 3,657 | |
| Receivable for investment securities sold | | | — | | | | 60,180 | |
| Receivable from Advisor (Note 5) | | | 18,022 | | | | 7,525 | |
| Other assets | | | 5,653 | | | | 11,057 | |
| TOTAL ASSETS | | | 14,992,790 | | | | 53,560,968 | |
| | | | | | | | | |
| LIABILITIES | | | | | | | | |
Written options, at value (Notes 2 and 6) (premiums received $– and $3,423,017, respectively) | | | — | | | | 3,979,995 | |
| Payable for capital shares redeemed | | | — | | | | 1,728 | |
| Payable for investment securities purchased | | | 6,256,893 | | | | 220 | |
| Accrued distribution fees (Note 5) | | | 1,635 | | | | 8,151 | |
| Accrued compliance fees (Note 5) | | | 65 | | | | 378 | |
| Payable to administrator (Note 5) | | | 10,100 | | | | 10,700 | |
| Other accrued expenses | | | 890 | | | | 1,642 | |
| TOTAL LIABILITIES | | | 6,269,583 | | | | 4,002,814 | |
| | | | | | | | | |
| NET ASSETS | | $ | 8,723,207 | | | $ | 49,558,154 | |
| | | | | | | | | |
| Net assets consist of: | | | | | | | | |
| Paid-in capital | | $ | 8,919,380 | | | $ | 50,499,322 | |
| Undistributed net investment income | | | — | | | | 13,240 | |
Accumulated net realized gains (losses) from security transactions | | | (41,153 | ) | | | 154,321 | |
Net unrealized depreciation on investments and option contracts | | | (155,020 | ) | | | (1,108,729 | ) |
| Net assets | | $ | 8,723,207 | | | $ | 49,558,154 | |
| See accompanying notes to financial statements. |
STADION INVESTMENT TRUST
STATEMENTS OF ASSETS AND LIABILITIES (Continued)
May 31, 2012
| | | | | | |
| PRICING OF CLASS A SHARES | | | | | | |
| Net assets applicable to Class A shares | | $ | 8,721,299 | | | $ | 49,507,361 | |
Class A shares of beneficial interest outstanding (unlimited number of shares authorized, $0.001 par value) | | | 913,950 | | | | 5,024,537 | |
| Net asset value and redemption price per share (Note 2) | | $ | 9.54 | | | $ | 9.85 | |
| Maximum offering price per share (Note 2) | | $ | 10.12 | | | $ | 10.45 | |
| | | | | | | | | |
| PRICING OF CLASS C SHARES | | | | | | | | |
| Net assets applicable to Class C shares | | $ | 953 | | | $ | 49,807 | |
Class C shares of beneficial interest outstanding (unlimited number of shares authorized, $0.001 par value) | | | 100 | | | | 5,059 | |
Net asset value, offering price and redemption price per share (Note 2) | | $ | 9.53 | | | $ | 9.85 | |
| | | | | | | | | |
| PRICING OF CLASS I SHARES | | | | | | | | |
| Net assets applicable to Class I shares | | $ | 955 | | | $ | 986 | |
Class I shares of beneficial interest outstanding (unlimited number of shares authorized, $0.001 par value) | | | 100 | | | | 100 | |
Net asset value, offering price and redemption price per share (Note 2) | | $ | 9.55 | | | $ | 9.86 | |
| See accompanying notes to financial statements. |
STADION INVESTMENT TRUST
STATEMENTS OF OPERATIONS
For the Year Ended May 31, 2012
| | | | | | |
| INVESTMENT INCOME | | | | | | |
| Dividends | | $ | 4,871,007 | | | $ | 661,734 | |
| | | | | | | | | |
| EXPENSES | | | | | | | | |
| Investment advisory fees (Note 5) | | | 10,575,486 | | | | 679,657 | |
| Distribution fees, Class A (Note 5) | | | 1,825,469 | | | | 115,010 | |
| Distribution fees, Class C (Note 5) | | | 1,996,529 | | | | 61,818 | |
| Transfer agent fees, Class A (Note 5) | | | 415,787 | | | | 23,841 | |
| Transfer agent fees, Class C (Note 5) | | | 176,781 | | | | 18,000 | |
| Transfer agent fees, Class I (Note 5) | | | 53,437 | | | | 15,500 | |
| Administration fees (Note 5) | | | 634,871 | | | | 40,799 | |
| Registration and filing fees, Common | | | 6,993 | | | | 5,024 | |
| Registration fees, Class A | | | 87,205 | | | | 17,997 | |
| Registration fees, Class C | | | 47,868 | | | | 15,975 | |
| Registration fees, Class I | | | 30,573 | | | | 17,386 | |
| Fund accounting fees (Note 5) | | | 118,011 | | | | 47,498 | |
| Professional fees | | | 142,623 | | | | 22,089 | |
| Insurance expense | | | 109,573 | | | | 5,969 | |
| Postage and supplies | | | 93,719 | | | | 11,146 | |
| Custodian and bank service fees | | | 76,838 | | | | 6,132 | |
| Compliance fees (Note 5) | | | 77,753 | | | | 4,296 | |
| Trustees’ fees | | | 56,871 | | | | 3,090 | |
| Printing of shareholder reports | | | 27,567 | | | | 5,991 | |
| Other expenses | | | 116,406 | | | | 19,916 | |
| TOTAL EXPENSES | | | 16,670,360 | | | | 1,137,134 | |
| Fees waived by the Advisor (Note 5) | | | — | | | | (13,167 | ) |
| Class C expenses reimbursed by the Advisor (Note 5) | | | — | | | | (23,904 | ) |
| Class I expenses reimbursed by the Advisor (Note 5) | | | — | | | | (28,930 | ) |
| NET EXPENSES | | | 16,670,360 | | | | 1,071,133 | |
| | | | | | | | | |
| NET INVESTMENT LOSS | | | (11,799,353 | ) | | | (409,399 | ) |
| | | | | | | | | |
| REALIZED AND UNREALIZED LOSSES ON INVESTMENTS | | | | | | | | |
| Net realized losses from security transactions | | | (62,632,194 | ) | | | (2,267,408 | ) |
Capital gain distributions from regulated investment companies | | | — | | | | 59,854 | |
Net change in unrealized appreciation/ depreciation on investments | | | — | | | | (1,302,526 | ) |
REALIZED AND UNREALIZED LOSSES ON INVESTMENTS | | | (62,632,194 | ) | | | (3,510,080 | ) |
| | | | | | | | | |
| NET DECREASE IN NET ASSETS FROM OPERATIONS | | $ | (74,431,547 | ) | | $ | (3,919,479 | ) |
| See accompanying notes to financial statements. |
STADION INVESTMENT TRUST
STATEMENTS OF OPERATIONS
For the Period Ended May 31, 2012(a)
| | | | | | |
| INVESTMENT INCOME | | | | | | |
| Dividends | | $ | 53 | | | $ | 88,291 | |
| | | | | | | | | |
| EXPENSES | | | | | | | | |
| Investment advisory fees (Note 5) | | | 8,177 | | | | 48,107 | |
| Fund accounting fees (Note 5) | | | 7,101 | | | | 7,411 | |
| Transfer agent fees, Class A (Note 5) | | | 2,500 | | | | 2,800 | |
| Transfer agent fees, Class C (Note 5) | | | 2,000 | | | | 2,000 | |
| Transfer agent fees, Class I (Note 5) | | | 2,000 | | | | 2,000 | |
| Administration fees (Note 5) | | | 6,000 | | | | 6,000 | |
| Distribution fees, Class A (Note 5) | | | 1,633 | | | | 9,589 | |
| Distribution fees, Class C (Note 5) | | | 2 | | | | 37 | |
| Printing of shareholder reports | | | 3,834 | | | | 3,834 | |
| Registration and filing fees, Common | | | 1,489 | | | | 2,895 | |
| Registration fees, Class A | | | 14 | | | | 14 | |
| Registration fees, Class C | | | 14 | | | | 14 | |
| Registration fees, Class I | | | 14 | | | | 14 | |
| Postage and supplies | | | 1,312 | | | | 1,312 | |
| Custodian and bank service fees | | | 890 | | | | 1,365 | |
| Professional fees | | | 609 | | | | 181 | |
| Compliance fees (Note 5) | | | 66 | | | | 389 | |
| Trustees’ fees | | | 2 | | | | 37 | |
| Other expenses | | | 1,300 | | | | 1,403 | |
| TOTAL EXPENSES | | | 38,957 | | | | 89,402 | |
| Fees waived and expenses reimbursed by the Advisor (Note 5) | | | (19,658 | ) | | | (9,331 | ) |
| Class A expenses reimbursed by the Advisor (Note 5) | | | (2,514 | ) | | | (994 | ) |
| Class C expenses reimbursed by the Advisor (Note 5) | | | (2,014 | ) | | | (2,012 | ) |
| Class I expenses reimbursed by the Advisor (Note 5) | | | (2,014 | ) | | | (2,014 | ) |
| NET EXPENSES | | | 12,757 | | | | 75,051 | |
| | | | | | | | | |
| NET INVESTMENT INCOME (LOSS) | | | (12,704 | ) | | | 13,240 | |
| | | | | | | | | |
REALIZED AND UNREALIZED GAINS (LOSSES) ON INVESTMENTS AND OPTION CONTRACTS | | | | | | | | |
| Net realized gains (losses) from: | | | | | | | | |
| Security transactions | | | (41,153 | ) | | | (247 | ) |
| Option transactions | | | — | | | | 154,568 | |
| Net change in unrealized appreciation/depreciation on: | | | | | | | | |
| Investments | | | (155,020 | ) | | | (991,132 | ) |
| Option contracts | | | — | | | | (117,597 | ) |
NET REALIZED AND UNREALIZED LOSSES ON INVESTMENTS AND OPTION CONTRACTS | | | (196,173 | ) | | | (954,408 | ) |
| | | | | | | | | |
| NET DECREASE IN NET ASSETS FROM OPERATIONS | | $ | (208,877 | ) | | $ | (941,168 | ) |
| (a) | Represents the period from commencement of operations (April 2, 2012) through May 31, 2012. |
| See accompanying notes to financial statements. |
STADION INVESTMENT TRUST
STATEMENTS OF CHANGES IN NET ASSETS
| | | | | | | |
| | | | | | | | | | | | |
| FROM OPERATIONS | | | | | | | | | | | | |
| Net investment loss | | $ | (11,799,353 | ) | | $ | (8,997,975 | ) | | $ | (409,399 | ) | | $ | (511,828 | ) |
Net realized gains (losses) from security transactions | | | (62,632,194 | ) | | | 19,349,263 | | | | (2,267,408 | ) | | | 6,558,556 | |
Capital gain distributions from regulated investment companies | | | — | | | | — | | | | 59,854 | | | | — | |
Net change in unrealized appreciation/ depreciation on investments | | | — | | | | 111,955 | | | | (1,302,526 | ) | | | 574,153 | |
Net increase (decrease) in net assets from operations | | | (74,431,547 | ) | | | 10,463,243 | | | | (3,919,479 | ) | | | 6,620,881 | |
| | | | | | | | | | | | | | | | | |
| DISTRIBUTIONS TO SHAREHOLDERS | | | | | | | | | | | | | | | | |
| Distributions from net realized gains, Class A | | | (7,380,598 | ) | | | (8,178,057 | ) | | | (2,305,182 | ) | | | — | |
| Distributions from net realized gains, Class C | | | (2,109,084 | ) | | | (1,428,352 | ) | | | (345,192 | ) | | | — | |
| Distributions from net realized gains, Class I | | | (863,167 | ) | | | (1,136,203 | ) | | | (97,851 | ) | | | — | |
Decrease in net assets from distributions to shareholders | | | (10,352,849 | ) | | | (10,742,612 | ) | | | (2,748,225 | ) | | | — | |
| | | | | | | | | | | | | | | | | |
| FROM CAPITAL SHARE TRANSACTIONS (Note 7) | | | | | | | | | | | | | | | | |
| CLASS A | | | | | | | | | | | | | | | | |
| Proceeds from shares sold | | | 209,130,958 | | | | 729,284,115 | | | | 17,693,749 | | | | 11,521,857 | |
Net asset value of shares issued in reinvestment of distributions | | | 6,844,037 | | | | 7,528,241 | | | | 2,250,734 | | | | — | |
| Payments for shares redeemed | | | (727,776,326 | ) | | | (254,506,697 | ) | | | (30,850,711 | ) | | | (8,408,980 | ) |
Net increase (decrease) in net assets from Class A share transactions | | | (511,801,331 | ) | | | 482,305,659 | | | | (10,906,228 | ) | | | 3,112,877 | |
| | | | | | | | | | | | | | | | | |
| CLASS C | | | | | | | | | | | | | | | | |
| Proceeds from shares sold | | | 39,567,252 | | | | 195,085,320 | | | | 3,177,341 | | | | 5,849,013 | |
Net asset value of shares issued in reinvestment of distributions | | | 1,987,556 | | | | 1,358,781 | | | | 331,555 | | | | — | |
| Payments for shares redeemed | | | (94,698,542 | ) | | | (18,839,140 | ) | | | (3,522,185 | ) | | | (1,709,269 | ) |
Net increase (decrease) in net assets from Class C share transactions | | | (53,143,734 | ) | | | 177,604,961 | | | | (13,289 | ) | | | 4,139,744 | |
| | | | | | | | | | | | | | | | | |
| CLASS I | | | | | | | | | | | | | | | | |
| Proceeds from shares sold | | | 146,651,991 | | | | 165,081,421 | | | | 3,808,276 | | | | 1,477,586 | |
Net asset value of shares issued in reinvestment of distributions | | | 805,894 | | | | 559,579 | | | | 97,255 | | | | — | |
| Payments for shares redeemed | | | (106,970,390 | ) | | | (83,425,256 | ) | | | (2,467,120 | ) | | | (59,087 | ) |
Net increase in net assets from Class I share transactions | | | 40,487,495 | | | | 82,215,744 | | | | 1,438,411 | | | | 1,418,499 | |
| | | | | | | | | | | | | | | | | |
| TOTAL INCREASE (DECREASE) IN NET ASSETS | | | (609,241,966 | ) | | | 741,846,995 | | | | (16,148,810 | ) | | | 15,292,001 | |
| | | | | | | | | | | | | | | | | |
| NET ASSETS | | | | | | | | | | | | | | | | |
| Beginning of year | | | 1,293,541,473 | | | | 551,694,478 | | | | 57,930,186 | | | | 42,638,185 | |
| End of year | | $ | 684,299,507 | | | $ | 1,293,541,473 | | | $ | 41,781,376 | | | $ | 57,930,186 | |
| | | | | | | | | | | | | | | | | |
| ACCUMULATED NET INVESTMENT INCOME | | $ | — | | | $ | — | | | $ | — | | | $ | — | |
| See accompanying notes to financial statements. |
STADION INVESTMENT TRUST
STATEMENTS OF CHANGES IN NET ASSETS
| | | | | | | |
| | Period Ended May 31, 2012(a) | | | Period Ended May 31, 2012(a) | |
| FROM OPERATIONS | | | | | | |
| Net investment income (loss) | | $ | (12,704 | ) | | $ | 13,240 | |
| Net realized gains (losses) from: | | | | | | | | |
| Security transactions | | | (41,153 | ) | | | (247 | ) |
| Option transactions | | | — | | | | 154,568 | |
| Net change in unrealized appreciation/depreciation on: | | | | | | | | |
| Investments | | | (155,020 | ) | | | (991,132 | ) |
| Option contracts | | | — | | | | (117,597 | ) |
| Net decrease in net assets from operations | | | (208,877 | ) | | | (941,168 | ) |
| | | | | | | | | |
| FROM CAPITAL SHARE TRANSACTIONS (Note 7) | | | | | | | | |
| CLASS A | | | | | | | | |
| Proceeds from shares sold | | | 8,996,241 | | | | 51,973,989 | |
| Payments for shares redeemed | | | (66,157 | ) | | | (1,525,771 | ) |
| Net increase in net assets from Class A share transactions | | | 8,930,084 | | | | 50,448,218 | |
| | | | | | | | | |
| CLASS C | | | | | | | | |
| Proceeds from shares sold | | | 1,000 | | | | 50,104 | |
| | | | | | | | | |
| CLASS I | | | | | | | | |
| Proceeds from shares sold | | | 1,000 | | | | 1,000 | |
| | | | | | | | | |
| TOTAL INCREASE IN NET ASSETS | | | 8,723,207 | | | | 49,558,154 | |
| | | | | | | | | |
| NET ASSETS | | | | | | | | |
| Beginning of period | | | — | | | | — | |
| End of period | | $ | 8,723,207 | | | $ | 49,558,154 | |
| | | | | | | | | |
| UNDISTRIBUTED NET INVESTMENT INCOME | | $ | — | | | $ | 13,240 | |
| (a) | Represents the period from commencement of operations (April 2, 2012) through May 31, 2012. |
| See accompanying notes to financial statements. |
STADION MANAGED PORTFOLIO — CLASS A
FINANCIAL HIGHLIGHTS
FOR A CLASS A SHARE OUTSTANDING THROUGHOUT EACH YEAR | |
| | | | | | | | | | | | | | | |
| Net asset value, beginning of year | | $ | 9.93 | | | $ | 9.64 | | | $ | 9.29 | | | $ | 9.47 | | | $ | 10.34 | |
| | | | | | | | | | | | | | | | | | | | | |
| Income (loss) from investment operations: | | | | | | | | | | | | | | | | | | | | |
| Net investment income (loss) | | | (0.17 | ) | | | (0.06 | ) | | | (0.03 | ) | | | (0.03 | ) | | | 0.14 | |
Net realized and unrealized gains (losses) on securities | | | (0.28 | ) | | | 0.46 | | | | 0.38 | | | | (0.14 | ) | | | (0.17 | ) |
| Total from investment operations | | | (0.45 | ) | | | 0.40 | | | | 0.35 | | | | (0.17 | ) | | | (0.03 | ) |
| | | | | | | | | | | | | | | | | | | | | |
| Less distributions: | | | | | | | | | | | | | | | | | | | | |
| Dividends from net investment income | | | — | | | | — | | | | — | | | | (0.00 | )(a) | | | (0.19 | ) |
| In excess of net investment income | | | — | | | | — | | | | — | | | | (0.01 | ) | | | — | |
| Distributions from net realized gains | | | (0.10 | ) | | | (0.11 | ) | | | — | | | | (0.00 | )(a) | | | (0.65 | ) |
| Total distributions | | | (0.10 | ) | | | (0.11 | ) | | | — | | | | (0.01 | ) | | | (0.84 | ) |
| | | | | | | | | | | | | | | | | | | | | |
| Net asset value, end of year | | $ | 9.38 | | | $ | 9.93 | | | $ | 9.64 | | | $ | 9.29 | | | $ | 9.47 | |
| | | | | | | | | | | | | | | | | | | | | |
Total return (b) | | | (4.45% | ) | | | 4.07% | | | | 3.77% | | | | (1.80% | ) | | | (0.47% | ) |
| | | | | | | | | | | | | | | | | | | | | |
| Ratios/Supplemental data: | | | | | | | | | | | | | | | | | | | | |
| Net assets, end of year (000’s) | | $ | 407,202 | | | $ | 981,387 | | | $ | 496,412 | | | $ | 139,400 | | | $ | 93,855 | |
| | | | | | | | | | | | | | | | | | | | | |
Ratio of net expenses to average net assets (c) | | | 1.51% | | | | 1.50% | | | | 1.67% | | | | 1.83% | | | | 1.87% | |
| | | | | | | | | | | | | | | | | | | | | |
Ratio of net investment income (loss) to average net assets (c) | | | (1.03% | ) | | | (0.82% | ) | | | (0.57% | ) | | | (0.48% | ) | | | 1.38% | |
| | | | | | | | | | | | | | | | | | | | | |
| Portfolio turnover rate | | | 1,967% | | | | 1,018% | | | | 944% | | | | 449% | | | | 870% | |
| (a) | Amount rounds to less than $0.01 per share. |
| (b) | Total return is a measure of the change in value of an investment in the Fund over the periods covered, which assumes any dividends or capital gains distributions are reinvested in shares of the Fund. The returns shown do not reflect the deduction of taxes a shareholder would pay on Fund distributions or the redemption of Fund shares. Total returns shown do not include the effect of applicable sales loads. |
| (c) | The ratios of expenses and net investment income (loss) to average net assets do not reflect the Fund’s proportionate share of expenses of the underlying investment companies in which the Fund invested. |
| See accompanying notes to financial statements. |
STADION MANAGED PORTFOLIO — CLASS C
FINANCIAL HIGHLIGHTS
FOR A CLASS C SHARE OUTSTANDING THROUGHOUT EACH PERIOD | |
| | | | | | | | Period Ended May 31, 2010(a) | |
| Net asset value, beginning of period | | $ | 9.79 | | | $ | 9.59 | | | $ | 9.54 | |
| | | | | | | | | | | | | |
| Income (loss) from investment operations: | | | | | | | | | | | | |
| Net investment loss | | | (0.21 | ) | | | (0.10 | ) | | | (0.05 | ) |
| Net realized and unrealized gains (losses) on securities | | | (0.30 | ) | | | 0.41 | | | | 0.10 | |
| Total from investment operations | | | (0.51 | ) | | | 0.31 | | | | 0.05 | |
| | | | | | | | | | | | | |
| Less distributions: | | | | | | | | | | | | |
| Distributions from net realized gains | | | (0.10 | ) | | | (0.11 | ) | | | — | |
| | | | | | | | | | | | | |
| Net asset value, end of period | | $ | 9.18 | | | $ | 9.79 | | | $ | 9.59 | |
| | | | | | | | | | | | | |
Total return (b) | | | (5.13% | ) | | | 3.15% | | | | 0.52% | (c) |
| | | | | | | | | | | | | |
| Ratios/Supplemental data: | | | | | | | | | | | | |
| Net assets, end of period (000’s) | | $ | 159,112 | | | $ | 228,541 | | | $ | 55,281 | |
| | | | | | | | | | | | | |
Ratio of total expenses to average net assets (d) | | | 2.30% | | | | 2.28% | | | | 2.51% | (e)(f) |
| | | | | | | | | | | | | |
Ratio of net expenses to average net assets (d) | | | 2.30% | | | | 2.28% | | | | 2.48% | (e) |
| | | | | | | | | | | | | |
Ratio of net investment loss to average net assets (d) | | | (1.80% | ) | | | (1.65% | ) | | | (1.60% | )(e) |
| | | | | | | | | | | | | |
| Portfolio turnover rate | | | 1,967% | | | | 1,018% | | | | 944% | (c)(g) |
| (a) | Represents the period from October 1, 2009 (date of initial public offering) through May 31, 2010. |
| (b) | Total return is a measure of the change in value of an investment in the Fund over the periods covered, which assumes any dividends or capital gains distributions are reinvested in shares of the Fund. The returns shown do not reflect the deduction of taxes a shareholder would pay on Fund distributions or the redemption of Fund shares. |
| (c) | Not annualized. |
| (d) | The ratios of expenses and net investment loss to average net assets do not reflect the Fund’s proportionate share of expenses of the underlying investment companies in which the Fund invested. |
| (e) | Annualized. |
| (f) | Reflects total expenses prior to fee waivers by the Advisor (Note 5). |
| (g) | Represents the year ended May 31, 2010. |
| See accompanying notes to financial statements. |
STADION MANAGED PORTFOLIO — CLASS I
FINANCIAL HIGHLIGHTS
FOR A CLASS I SHARE OUTSTANDING THROUGHOUT EACH PERIOD | |
| | | | | | | | Period Ended May 31, 2010(a) | |
| Net asset value, beginning of period | | $ | 9.96 | | | $ | 9.64 | | | $ | 9.64 | |
| | | | | | | | | | | | | |
| Income (loss) from investment operations: | | | | | | | | | | | | |
| Net investment loss | | | (0.06 | ) | | | (0.05 | ) | | | (0.00 | )(b) |
| Net realized and unrealized gains (losses) on securities | | | (0.37 | ) | | | 0.48 | | | | — | |
| Total from investment operations | | | (0.43 | ) | | | 0.43 | | | | (0.00 | )(b) |
| | | | | | | | | | | | | |
| Less distributions: | | | | | | | | | | | | |
| Distributions from net realized gains | | | (0.10 | ) | | | (0.11 | ) | | | — | |
| | | | | | | | | | | | | |
| Net asset value, end of period | | $ | 9.43 | | | $ | 9.96 | | | $ | 9.64 | |
| | | | | | | | | | | | | |
Total return (c) | | | (4.24% | ) | | | 4.38% | | | | 0.00% | (d) |
| | | | | | | | | | | | | |
| Ratios/Supplemental data: | | | | | | | | | | | | |
| Net assets, end of period (000’s) | | $ | 117,986 | | | $ | 83,614 | | | $ | 1 | |
| | | | | | | | | | | | | |
Ratio of net expenses to average net assets (e) | | | 1.28% | | | | 1.24% | | | | 1.70% | (f) |
| | | | | | | | | | | | | |
Ratio of net investment loss to average net assets (e) | | | (0.77% | ) | | | (0.48% | ) | | | (1.70% | )(f) |
| | | | | | | | | | | | | |
| Portfolio turnover rate | | | 1,967% | | | | 1,018% | | | | 944% | (d)(g) |
| (a) | Represents the period from May 28, 2010 (date of initial public offering) through May 31, 2010. |
| (b) | Amount rounds to less than $0.01 per share. |
| (c) | Total return is a measure of the change in value of an investment in the Fund over the periods covered, which assumes any dividends or capital gains distributions are reinvested in shares of the Fund. The returns shown do not reflect the deduction of taxes a shareholder would pay on Fund distributions or the redemption of Fund shares. |
| (d) | Not annualized. |
| (e) | The ratios of expenses and net investment loss to average net assets do not reflect the Fund’s proportionate share of expenses of the underlying investment companies in which the Fund invested. |
| (f) | Annualized. |
| (g) | Represents the year ended May 31, 2010. |
| See accompanying notes to financial statements. |
STADION CORE ADVANTAGE PORTFOLIO — CLASS A
FINANCIAL HIGHLIGHTS
FOR A CLASS A SHARE OUTSTANDING THROUGHOUT EACH YEAR | |
| | | | | | | | | | | | | | | |
| Net asset value, beginning of year | | $ | 11.72 | | | $ | 10.22 | | | $ | 8.98 | | | $ | 11.11 | | | $ | 11.99 | |
| | | | | | | | | | | | | | | | | | | | | |
| Income (loss) from investment operations: | | | | | | | | | | | | | | | | | | | | |
| Net investment income (loss) | | | (0.09 | ) | | | (0.10 | ) | | | (0.05 | ) | | | (0.04 | ) | | | 0.03 | |
Net realized and unrealized gains (losses) on securities | | | (0.72 | ) | | | 1.60 | | | | 1.29 | | | | (2.08 | ) | | | (0.48 | ) |
| Total from investment operations | | | (0.81 | ) | | | 1.50 | | | | 1.24 | | | | (2.12 | ) | | | (0.45 | ) |
| | | | | | | | | | | | | | | | | | | | | |
| Less distributions: | | | | | | | | | | | | | | | | | | | | |
| Dividends from net investment income | | | — | | | | — | | | | — | | | | — | | | | (0.03 | ) |
| In excess of net investment income | | | — | | | | — | | | | — | | | | (0.01 | ) | | | (0.01 | ) |
| Distributions from net realized gains | | | (0.54 | ) | | | — | | | | — | | | | — | | | | (0.39 | ) |
| Total distributions | | | (0.54 | ) | | | — | | | | — | | | | (0.01 | ) | | | (0.43 | ) |
| | | | | | | | | | | | | | | | | | | | | |
| Net asset value, end of year | | $ | 10.37 | | | $ | 11.72 | | | $ | 10.22 | | | $ | 8.98 | | | $ | 11.11 | |
| | | | | | | | | | | | | | | | | | | | | |
Total return (a) | | | (6.75% | ) | | | 14.68% | | | | 13.81% | | | | (19.11% | ) | | | (3.89% | ) |
| | | | | | | | | | | | | | | | | | | | | |
| Ratios/Supplemental data: | | | | | | | | | | | | | | | | | | | | |
| Net assets, end of year (000’s) | | $ | 33,892 | | | $ | 50,470 | | | $ | 41,179 | | | $ | 28,805 | | | $ | 36,762 | |
| | | | | | | | | | | | | | | | | | | | | |
Ratio of total expenses to average net assets (b) | | | 1.91% | (c) | | | 1.97% | (c) | | | 2.11% | (c) | | | 2.23% | | | | 2.17% | |
| | | | | | | | | | | | | | | | | | | | | |
Ratio of net expenses to average net assets (b) | | | 1.89% | | | | 1.95% | | | | 1.95% | | | | 2.23% | | | | 2.17% | |
| | | | | | | | | | | | | | | | | | | | | |
Ratio of net investment income (loss) to average net assets (b) | | | (0.67% | ) | | | (0.94% | ) | | | (0.62% | ) | | | (0.41% | ) | | | 0.25% | |
| | | | | | | | | | | | | | | | | | | | | |
| Portfolio turnover rate | | | 826% | | | | 476% | | | | 471% | | | | 346% | | | | 541% | |
| (a) | Total return is a measure of the change in value of an investment in the Fund over the periods covered, which assumes any dividends or capital gains distributions are reinvested in shares of the Fund. The returns shown do not reflect the deduction of taxes a shareholder would pay on Fund distributions or the redemption of Fund shares. Total returns shown do not include the effect of applicable sales loads. |
| (b) | The ratios of expenses and net investment income (loss) to average net assets do not reflect the Fund’s proportionate share of expenses of the underlying investment companies in which the Fund invested. |
| (c) | Reflects total expenses prior to fee waivers and expense reimbursements by the Advisor (Note 5). |
| See accompanying notes to financial statements. |
STADION CORE ADVANTAGE PORTFOLIO — CLASS C
FINANCIAL HIGHLIGHTS
FOR A CLASS C SHARE OUTSTANDING THROUGHOUT EACH PERIOD | |
| | | | | | | | Period Ended May 31, 2010(a) | |
| Net asset value, beginning of period | | $ | 11.59 | | | $ | 10.17 | | | $ | 9.75 | |
| | | | | | | | | | | | | |
| Income (loss) from investment operations: | | | | | | | | | | | | |
| Net investment loss | | | (0.18 | ) | | | (0.14 | ) | | | (0.06 | ) |
| Net realized and unrealized gains (losses) on securities | | | (0.71 | ) | | | 1.56 | | | | 0.48 | |
| Total from investment operations | | | (0.89 | ) | | | 1.42 | | | | 0.42 | |
| | | | | | | | | | | | | |
| Less distributions: | | | | | | | | | | | | |
| Distributions from net realized gains | | | (0.54 | ) | | | — | | | | — | |
| | | | | | | | | | | | | |
| Net asset value, end of period | | $ | 10.16 | | | $ | 11.59 | | | $ | 10.17 | |
| | | | | | | | | | | | | |
Total return (b) | | | (7.54% | ) | | | 13.96% | | | | 4.31% | (c) |
| | | | | | | | | | | | | |
| Ratios/Supplemental data: | | | | | | | | | | | | |
| Net assets, end of period (000’s) | | $ | 5,253 | | | $ | 6,028 | | | $ | 1,458 | |
| | | | | | | | | | | | | |
Ratio of total expenses to average net assets (d) | | | 3.12% | (e) | | | 3.45% | (e) | | | 7.53% | (e)(f) |
| | | | | | | | | | | | | |
Ratio of net expenses to average net assets (d) | | | 2.70% | | | | 2.70% | | | | 2.70% | (f) |
| | | | | | | | | | | | | |
Ratio of net investment loss to average net assets (d) | | | (1.48% | ) | | | (1.79% | ) | | | (1.82% | )(f) |
| | | | | | | | | | | | | |
| Portfolio turnover rate | | | 826% | | | | 476% | | | | 471% | (c)(g) |
| (a) | Represents the period from October 1, 2009 (date of initial public offering) through May 31, 2010. |
| (b) | Total return is a measure of the change in value of an investment in the Fund over the periods covered, which assumes any dividends or capital gains distributions are reinvested in shares of the Fund. The returns shown do not reflect the deduction of taxes a shareholder would pay on Fund distributions or the redemption of Fund shares. |
| (c) | Not annualized. |
| (d) | The ratios of expenses and net investment loss to average net assets do not reflect the Fund’s proportionate share of expenses of the underlying investment companies in which the Fund invested. |
| (e) | Reflects total expenses prior to fee waivers and expense reimbursements by the Advisor (Note 5). |
| (f) | Annualized. |
| (g) | Represents the year ended May 31, 2010. |
| See accompanying notes to financial statements. |
STADION CORE ADVANTAGE PORTFOLIO — CLASS I
FINANCIAL HIGHLIGHTS
FOR A CLASS I SHARE OUTSTANDING THROUGHOUT EACH PERIOD | |
| | | | | | | | Period Ended May 31, 2010(a) | |
| Net asset value, beginning of period | | $ | 11.76 | | | $ | 10.22 | | | $ | 10.22 | |
| | | | | | | | | | | | | |
| Income (loss) from investment operations: | | | | | | | | | | | | |
| Net investment loss | | | (0.05 | ) | | | (0.04 | ) | | | (0.00 | )(b) |
| Net realized and unrealized gains (losses) on securities | | | (0.75 | ) | | | 1.58 | | | | — | |
| Total from investment operations | | | (0.80 | ) | | | 1.54 | | | | (0.00 | )(b) |
| | | | | | | | | | | | | |
| Less distributions: | | | | | | | | | | | | |
| Distributions from net realized gains | | | (0.54 | ) | | | — | | | | — | |
| | | | | | | | | | | | | |
| Net asset value, end of period | | $ | 10.42 | | | $ | 11.76 | | | $ | 10.22 | |
| | | | | | | | | | | | | |
Total return (c) | | | (6.65% | ) | | | 15.07% | | | | 0.00% | (d) |
| | | | | | | | | | | | | |
| Ratios/Supplemental data: | | | | | | | | | | | | |
| Net assets, end of period (000’s) | | $ | 2,636 | | | $ | 1,433 | | | $ | 1 | |
| | | | | | | | | | | | | |
Ratio of total expenses to average net assets (e) | | | 3.05% | (f) | | | 7.98% | (f) | | | 1.70% | (g) |
| | | | | | | | | | | | | |
Ratio of net expenses to average net assets (e) | | | 1.70% | | | | 1.70% | | | | 1.70% | (g) |
| | | | | | | | | | | | | |
Ratio of net investment loss to average net assets (e) | | | (0.53% | ) | | | (1.03% | ) | | | (1.70% | )(g) |
| | | | | | | | | | | | | |
| Portfolio turnover rate | | | 826% | | | | 476% | | | | 471% | (d)(h) |
| (a) | Represents the period from May 28, 2010 (date of initial public offering) through May 31, 2010. |
| (b) | Amount rounds to less than $0.01 per share. |
| (c) | Total return is a measure of the change in value of an investment in the Fund over the periods covered, which assumes any dividends or capital gains distributions are reinvested in shares of the Fund. The returns shown do not reflect the deduction of taxes a shareholder would pay on Fund distributions or the redemption of Fund shares. |
| (d) | Not annualized. |
| (e) | The ratios of expenses and net investment loss to average net assets do not reflect the Fund’s proportionate share of expenses of the underlying investment companies in which the Fund invested. |
| (f) | Reflects total expenses prior to fee waivers and expense reimbursements by the Advisor (Note 5). |
| (g) | Annualized. |
| (h) | Represents the year ended May 31, 2010. |
| See accompanying notes to financial statements. |
STADION OLYMPUS FUNDTM — CLASS A
FINANCIAL HIGHLIGHTS
FOR A CLASS A SHARE OUTSTANDING THROUGHOUT THE PERIOD | |
| | Period Ended May 31, 2012(a) | |
| Net asset value, beginning of period | | $ | 10.00 | |
| | | | | |
| Loss from investment operations: | | | | |
| Net investment loss | | | (0.01 | ) |
| Net realized and unrealized losses on securities | | | (0.45 | ) |
| Total from investment operations | | | (0.46 | ) |
| | | | | |
| Net asset value, end of period | | $ | 9.54 | |
| | | | | |
Total return (b) | | | (4.60% | )(c) |
| | | | | |
| Ratios/Supplemental data: | | | | |
| Net assets, end of period (000’s) | | $ | 8,721 | |
| | | | | |
Ratio of total expenses to average net assets (d) | | | 5.31% | (e)(f) |
| | | | | |
Ratio of net expenses to average net assets (d) | | | 1.95% | (e) |
| | | | | |
Ratio of net investment loss to average net assets (d) | | | (1.94% | )(e) |
| | | | | |
| Portfolio turnover rate | | | 21% | (c) |
| (a) | Represents the period from April 2, 2012 (date of initial public offering) through May 31, 2012. |
| (b) | Total return is a measure of the change in value of an investment in the Fund over the period covered, which assumes any dividends or capital gains distributions are reinvested in shares of the Fund. The return shown does not reflect the deduction of taxes a shareholder would pay on Fund distributions or the redemption of Fund shares. Total return shown does not include the effect of applicable sales loads. |
| (c) | Not annualized. |
| (d) | The ratios of expenses and net investment loss to average net assets do not reflect the Fund’s proportionate share of expenses of the underlying investment companies in which the Fund invested. |
| (e) | Annualized. |
| (f) | Reflects total expenses prior to fee waivers and expense reimbursements by the Advisor (Note 5). |
| See accompanying notes to financial statements. |
STADION OLYMPUS FUNDTM — CLASS C
FINANCIAL HIGHLIGHTS
FOR A CLASS C SHARE OUTSTANDING THROUGHOUT THE PERIOD | |
| | Period Ended May 31, 2012(a) | |
| Net asset value, beginning of period | | $ | 10.00 | |
| | | | | |
| Loss from investment operations: | | | | |
| Net investment loss | | | (0.04 | ) |
| Net realized and unrealized losses on securities | | | (0.43 | ) |
| Total from investment operations | | | (0.47 | ) |
| | | | | |
| Net asset value, end of period | | $ | 9.53 | |
| | | | | |
Total return (b) | | | (4.70% | )(c) |
| | | | | |
| Ratios/Supplemental data: | | | | |
| Net assets, end of period | | $ | 953 | |
| | | | | |
Ratio of total expenses to average net assets (d) | | | 1,345.00% | (e)(f) |
| | | | | |
Ratio of net expenses to average net assets (d) | | | 2.70% | (e) |
| | | | | |
Ratio of net investment loss to average net assets (d) | | | (2.70% | )(e) |
| | | | | |
| Portfolio turnover rate | | | 21% | (c) |
| (a) | Represents the period from April 2, 2012 (date of initial public offering) through May 31, 2012. |
| (b) | Total return is a measure of the change in value of an investment in the Fund over the period covered, which assumes any dividends or capital gains distributions are reinvested in shares of the Fund. The return shown does not reflect the deduction of taxes a shareholder would pay on Fund distributions or the redemption of Fund shares. |
| (c) | Not annualized. |
| (d) | The ratios of expenses and net investment loss to average net assets do not reflect the Fund’s proportionate share of expenses of the underlying investment companies in which the Fund invested. |
| (e) | Annualized. |
| (f) | Reflects total expenses prior to fee waivers and expense reimbursements by the Advisor (Note 5). |
| See accompanying notes to financial statements. |
STADION OLYMPUS FUNDTM — CLASS I
FINANCIAL HIGHLIGHTS
FOR A CLASS I SHARE OUTSTANDING THROUGHOUT THE PERIOD | |
| | Period Ended May 31, 2012(a) | |
| Net asset value, beginning of period | | $ | 10.00 | |
| | | | | |
| Loss from investment operations: | | | | |
| Net investment loss | | | (0.03 | ) |
| Net realized and unrealized losses on securities | | | (0.42 | ) |
| Total from investment operations | | | (0.45 | ) |
| | | | | |
| Net asset value, end of period | | $ | 9.55 | |
| | | | | |
Total return (b) | | | (4.50% | )(c) |
| | | | | |
| Ratios/Supplemental data: | | | | |
| Net assets, end of period | | $ | 955 | |
| | | | | |
Ratio of total expenses to average net assets (d) | | | 1,342.77% | (e)(f) |
| | | | | |
Ratio of net expenses to average net assets (d) | | | 1.70% | (e) |
| | | | | |
Ratio of net investment loss to average net assets (d) | | | (1.70% | )(e) |
| | | | | |
| Portfolio turnover rate | | | 21% | (c) |
| (a) | Represents the period from April 2, 2012 (date of initial public offering) through May 31, 2012. |
| (b) | Total return is a measure of the change in value of an investment in the Fund over the period covered, which assumes any dividends or capital gains distributions are reinvested in shares of the Fund. The return shown does not reflect the deduction of taxes a shareholder would pay on Fund distributions or the redemption of Fund shares. |
| (c) | Not annualized. |
| (d) | The ratios of expenses and net investment loss to average net assets do not reflect the Fund’s proportionate share of expenses of the underlying investment companies in which the Fund invested. |
| (e) | Annualized. |
| (f) | Reflects total expenses prior to fee waivers and expense reimbursements by the Advisor (Note 5). |
| See accompanying notes to financial statements. |
STADION TRILOGY FUNDTM — CLASS A
FINANCIAL HIGHLIGHTS
FOR A CLASS A SHARE OUTSTANDING THROUGHOUT THE PERIOD | |
| | Period Ended May 31, 2012(a) | |
| Net asset value, beginning of period | | $ | 10.00 | |
| | | | | |
| Income (loss) from investment operations: | | | | |
| Net investment income | | | 0.00 | (b) |
| Net realized and unrealized losses on securities | | | (0.15 | ) |
| Total from investment operations | | | (0.15 | ) |
| | | | | |
| Net asset value, end of period | | $ | 9.85 | |
| | | | | |
Total return (c) | | | (1.50% | )(d) |
| | | | | |
| Ratios/Supplemental data: | | | | |
| Net assets, end of period (000’s) | | $ | 49,507 | |
| | | | | |
Ratio of total expenses to average net assets (e) | | | 2.21% | (f)(g) |
| | | | | |
Ratio of net expenses to average net assets (e) | | | 1.95% | (f) |
| | | | | |
Ratio of net investment income to average net assets (e) | | | 0.34% | (f) |
| | | | | |
| Portfolio turnover rate | | | 0% | (b)(d) |
| (a) | Represents the period from April 2, 2012 (date of initial public offering) through May 31, 2012. |
| (b) | Amount rounds to less than $0.01 per share or less than 1%. |
| (c) | Total return is a measure of the change in value of an investment in the Fund over the period covered, which assumes any dividends or capital gains distributions are reinvested in shares of the Fund. The return shown does not reflect the deduction of taxes a shareholder would pay on Fund distributions or the redemption of Fund shares. Total return shown does not include the effect of applicable sales loads. |
| (d) | Not annualized. |
| (e) | The ratios of expenses and net investment income to average net assets do not reflect the Fund’s proportionate share of expenses of the underlying investment companies in which the Fund invested. |
| (f) | Annualized. |
| (g) | Reflects total expenses prior to fee waivers and expense reimbursements by the Advisor (Note 5). |
| See accompanying notes to financial statements. |
STADION TRILOGY FUNDTM — CLASS C
FINANCIAL HIGHLIGHTS
FOR A CLASS C SHARE OUTSTANDING THROUGHOUT THE PERIOD | |
| | Period Ended May 31, 2012(a) | |
| Net asset value, beginning of period | | $ | 10.00 | |
| | | | | |
| Loss from investment operations: | | | | |
| Net investment loss | | | (0.00 | )(b) |
| Net realized and unrealized losses on securities | | | (0.15 | ) |
| Total from investment operations | | | (0.15 | ) |
| | | | | |
| Net asset value, end of period | | $ | 9.85 | |
| | | | | |
Total return (c) | | | (1.50% | )(d) |
| | | | | |
| Ratios/Supplemental data: | | | | |
| Net assets, end of period (000’s) | | $ | 50 | |
| | | | | |
Ratio of total expenses to average net assets (e) | | | 61.13% | (f)(g) |
| | | | | |
Ratio of net expenses to average net assets (e) | | | 2.70% | (f) |
| | | | | |
Ratio of net investment loss to average net assets (e) | | | (0.11% | )(f) |
| | | | | |
| Portfolio turnover rate | | | 0% | b)(d) |
| (a) | Represents the period from April 2, 2012 (date of initial public offering) through May 31, 2012. |
| (b) | Amount rounds to less than $0.01 per share or less than 1%. |
| (c) | Total return is a measure of the change in value of an investment in the Fund over the period covered, which assumes any dividends or capital gains distributions are reinvested in shares of the Fund. The return shown does not reflect the deduction of taxes a shareholder would pay on Fund distributions or the redemption of Fund shares. |
| (d) | Not annualized. |
| (e) | The ratios of expenses and net investment loss to average net assets do not reflect the Fund’s proportionate share of expenses of the underlying investment companies in which the Fund invested. |
| (f) | Annualized. |
| (g) | Reflects total expenses prior to fee waivers and expense reimbursements by the Advisor (Note 5). |
| See accompanying notes to financial statements. |
STADION TRILOGY FUNDTM — CLASS I
FINANCIAL HIGHLIGHTS
FOR A CLASS I SHARE OUTSTANDING THROUGHOUT THE PERIOD | |
| | Period Ended May 31, 2012(a) | |
| Net asset value, beginning of period | | $ | 10.00 | |
| | | | | |
| Income (loss) from investment operations: | | | | |
| Net investment income | | | 0.01 | |
| Net realized and unrealized losses on securities | | | (0.15 | ) |
| Total from investment operations | | | (0.14 | ) |
| | | | | |
| Net asset value, end of period | | $ | 9.86 | |
| | | | | |
Total return (b) | | | (1.40% | )(c) |
| | | | | |
| Ratios/Supplemental data: | | | | |
| Net assets, end of period | | $ | 986 | |
| | | | | |
Ratio of total expenses to average net assets (d) | | | 1,259.15% | (e)(f) |
| | | | | |
Ratio of net expenses to average net assets (d) | | | 1.70% | (e) |
| | | | | |
Ratio of net investment income to average net assets (d) | | | 0.51% | (e) |
| | | | | |
| Portfolio turnover rate | | | 0% | (c)(g) |
| (a) | Represents the period from April 2, 2012 (date of initial public offering) through May 31, 2012. |
| (b) | Total return is a measure of the change in value of an investment in the Fund over the period covered, which assumes any dividends or capital gains distributions are reinvested in shares of the Fund. The return shown does not reflect the deduction of taxes a shareholder would pay on Fund distributions or the redemption of Fund shares. |
| (c) | Not annualized. |
| (d) | The ratios of expenses and net investment income to average net assets do not reflect the Fund’s proportionate share of expenses of the underlying investment companies in which the Fund invested. |
| (e) | Annualized. |
| (f) | Reflects total expenses prior to fee waivers and expense reimbursements by the Advisor (Note 5). |
| (g) | Amount rounds to less than 1%. |
| See accompanying notes to financial statements. |
STADION INVESTMENT TRUST
NOTES TO FINANCIAL STATEMENTS
May 31, 2012
1. ORGANIZATION
Stadion Managed Portfolio (“Managed Portfolio”), Stadion Core Advantage Portfolio (“Core Advantage Portfolio”), Stadion Olympus FundTM (“Olympus Fund”) and Stadion Trilogy FundTM (“Trilogy Fund”) (each, a “Fund,” and collectively, the “Funds”) are each a diversified series of the Stadion Investment Trust (the “Trust”), a Delaware Statutory Trust registered under the Investment Company Act of 1940 (the “1940 Act”) as an open-end management investment company.
Managed Portfolio commenced operations on June 30, 2003. The public offering of Class A shares, Class C shares and Class I shares commenced on September 15, 2006, October 1, 2009 and May 28, 2010, respectively. The investment objective of the Fund is to seek long-term capital appreciation, while maintaining a secondary emphasis on capital preservation.
Core Advantage Portfolio commenced operations on January 27, 2004. The public offering of Class A shares, Class C shares and Class I shares commenced on September 15, 2006, October 1, 2009 and May 28, 2010, respectively. The investment objective of the Fund is to seek capital appreciation.
Olympus Fund commenced operations on April 2, 2012. The public offering of Class A shares, Class C shares and Class I shares commenced on April 2, 2012. The investment objective of the Fund is to seek long-term capital appreciation, while maintaining a secondary emphasis on capital preservation.
Trilogy Fund commenced operations on April 2, 2012. The public offering of Class A shares, Class C shares and Class I shares commenced on April 2, 2012. The investment objective of the Fund is total return, with an emphasis on lower risk and volatility than the U.S. equity markets.
Each Fund currently offers three classes of shares: Class A shares (sold subject to a maximum front-end sales load equal to 5.75% of the offering price and a distribution and/or service fee of up to 0.25% of the average net assets attributable to Class A shares), Class C shares (sold without any sales loads but subject to a distribution and/or service fee of up to 1.00% of the average daily net assets attributable to Class C shares) and Class I shares (sold without any sales loads and distribution and/or service fees). Each class of shares represents an interest in the same assets of the Funds, has the same rights and is identical in all material respects except that (1) the classes bear differing levels of sales loads and distribution fees; (2) certain other class specific expenses will be borne solely by the class to which such expenses are attributable; (3) each class has exclusive voting rights with respect to matters relating to its own distribution arrangements; and (4) Class I shares require a higher minimum initial investment.
2. SIGNIFICANT ACCOUNTING POLICIES
The following is a summary of the Funds’ significant accounting policies used in the preparation of their financial statements. The policies are in conformity with accounting principles generally accepted in the United States of America (“GAAP”).
STADION INVESTMENT TRUST
NOTES TO FINANCIAL STATEMENTS (Continued)
May 31, 2012
Security Valuation: The Funds’ investments in securities are carried at market value. Securities listed on an exchange or quoted on a national market system are valued at the last sales price as of the time regular trading closes on the New York Stock Exchange (normally, 4:00 p.m. Eastern Time). Securities traded in the NASDAQ market are valued at the NASDAQ Official Closing Price. Other securities, including listed securities for which no sale was reported on that date, are valued at the most recent bid price. Options are valued at the mean of the last quoted bid and ask prices at the time of valuation, as reported on the option’s primary exchange. If no bid quotation is readily available at the time of valuation, the option shall be valued at the mean of the last quoted ask price and $0.00. Securities and assets for which representative market quotations are not readily available or which cannot be accurately valued using the Funds’ normal pricing procedures are valued at fair value as determined in good faith under policies approved by the Board of Trustees and will be classified as Level 2 or 3 within the fair value hierarchy (see below), depending on the inputs used. Fair value pricing may be used, for example, in situations where (i) a portfolio security is so thinly traded that there have been no transactions for that security over an extended period of time; (ii) an event occurs after the close of the exchange on which a portfolio security is principally traded that is likely to have changed the value of the portfolio security prior to the Funds’ net asset value calculations; (iii) the exchange on which the portfolio security is principally traded closes early; or (iv) trading of the portfolio security is halted during the day and does not resume prior to the Funds’ net asset value calculations. A portfolio security’s “fair value” price may differ from the price next available for that portfolio security using the Funds’ normal pricing procedures. Open-end investment companies, including money market funds, are valued at the NAV reported by such registered open-end investment companies. Instruments with maturities of 60 days or less are valued at amortized cost, which approximates market value.
GAAP establishes a single authoritative definition of fair value, sets out a framework for measuring fair value and requires additional disclosures about fair value measurements.
Various inputs are used in determining the value of the Funds’ investments. These inputs are summarized in the three broad levels listed below:
• Level 1 – quoted prices in active markets for identical securities
• Level 2 – other significant observable inputs
• Level 3 – significant unobservable inputs
The inputs or methodology used for valuing securities are not necessarily an indication of the risks associated with investing in those securities. The inputs used to measure fair value may fall into different levels of the fair value hierarchy. In such cases, for disclosure purposes, the level in the fair value hierarchy within which the fair value measurement falls in its entirety is determined based on the lowest level input that is significant to the fair value measurement.
The following is a summary of the inputs used to value each Fund’s investments as of May 31, 2012 by security type:
| | | | | | | | | | | | |
| Investments in Securities: | | | | | | | | | | | | |
Money Market Funds | | $ | 687,272,764 | | | $ | — | | | $ | — | | | $ | 687,272,764 | |
STADION INVESTMENT TRUST
NOTES TO FINANCIAL STATEMENTS (Continued)
May 31, 2012
Core Advantage Portfolio: | | | | | | | | | | | | |
| Investments in Securities: | | | | | | | | | | | | |
Exchange-Traded Funds | | $ | 32,360,898 | | | $ | — | | | $ | — | | | $ | 32,360,898 | |
Money Market Funds | | | 22,149,029 | | | | — | | | | — | | | | 22,149,029 | |
Total Investments in Securities | | $ | 54,509,927 | | | $ | — | | | $ | — | | | $ | 54,509,927 | |
| | | | | | | | | | | | |
| Investments in Securities: | | | | | | | | | | | | | | | | |
Exchange-Traded Funds | | $ | 8,324,161 | | | $ | — | | | $ | — | | | $ | 8,324,161 | |
Money Market Funds | | | 6,644,662 | | | | — | | | | — | | | | 6,644,662 | |
Total Investments in Securities | | $ | 14,968,823 | | | $ | — | | | $ | — | | | $ | 14,968,823 | |
| | | | | | | | | | | | |
| Investments in Securities: | | | | | | | | | | | | | | | | |
Common Stocks | | $ | 21,109,839 | | | $ | — | | | $ | — | | | $ | 21,109,839 | |
Exchange-Traded Funds | | | 20,760,846 | | | | — | | | | — | | | | 20,760,846 | |
Call Option Contracts | | | — | | | | 2,981,935 | | | | — | | | | 2,981,935 | |
Put Option Contracts | | | — | | | | 5,982,978 | | | | — | | | | 5,982,978 | |
Money Market Funds | | | 2,498,310 | | | | — | | | | — | | | | 2,498,310 | |
Total Investments in Securities | | $ | 44,368,995 | | | $ | 8,964,913 | | | $ | — | | | $ | 53,333,908 | |
| | | | | | | | | | | | | | | | | |
| Other Financial Instruments: | | | | | | | | | | | | | | | | |
Written Call Option Contracts | | $ | — | | | $ | (910,220 | ) | | $ | — | | | $ | (910,220 | ) |
Written Put Option Contracts | | | — | | | | (3,069,775 | ) | | | — | | | | (3,069,775 | ) |
| Total Other Financial Instruments | | $ | — | | | $ | (3,979,995 | ) | | $ | — | | | $ | (3,979,995 | ) |
During the period ended May 31, 2012, the Funds did not have any transfers in and out of any Level. The Funds did not have any assets or liabilities that were measured at fair value on a recurring basis using significant unobservable inputs (Level 3) during the period or as of May 31, 2012. It is the Funds’ policy to recognize transfers into and out of any Level at the end of the reporting period.
Share Valuation: The net asset value per share of each class of shares of each Fund is calculated daily by dividing the total value of the assets attributable to that class, less liabilities attributable to that class, by the number of shares of that class outstanding. The maximum offering price per share of Class A shares of each Fund is equal to the net asset value per share plus a sales load equal to 6.10% of the net asset value (or 5.75% of the offering price). The offering price of Class C shares and Class I shares is equal to the net asset value per share. The redemption price per share of each class of shares of each Fund is equal to the net asset value per share, except that certain purchases of $1 million or more of Class A shares are charged a contingent deferred sales charge of 1.00% if they are redeemed within 18 months of their purchase.
Securities Transactions and Investment Income: Security transactions are accounted for on trade date. Gains and losses on securities sold are determined on a specific identification basis. Dividend income is recorded on the ex-dividend date. Interest income is accrued as earned.
STADION INVESTMENT TRUST
NOTES TO FINANCIAL STATEMENTS (Continued)
May 31, 2012
Option Transactions: Trilogy Fund may purchase and write put and call options on broad-based U.S. stock indices or ETFs that replicate the performance of a broad-based U.S. stock index. The Fund may use option contracts on broad-based U.S. stock indices for the purpose of seeking to generate return and manage risk exposure among varying market conditions.
When the Fund writes an option, an amount equal to the net premium (the premium less the commission) received by the Fund is recorded as a liability in the Fund’s Statement of Assets and Liabilities and is subsequently marked-to market daily. If an option expires unexercised on the stipulated expiration date or if the Fund enters into a closing purchase transaction, it will realize a gain (or a loss if the cost of a closing purchase transaction exceeds the net premium received when the option is sold) and the liability related to such option will be eliminated. If an index option is exercised, the Fund will be required to pay the difference between the closing index value and the exercise price of the option. In this event, the proceeds of the sale will be increased by the net premium originally received and the Fund will realize a gain or loss.
Allocation Between Classes: Investment income earned, realized capital gains and losses, and unrealized appreciation and depreciation are allocated daily to each class of shares based upon its proportionate share of total net assets of each Fund. Class specific expenses are charged directly to the class incurring the expense. Common expenses which are not attributable to a specific class are allocated daily to each class of shares based upon its proportionate share of total net assets of each Fund.
Distributions to Shareholders: Dividends arising from net investment income, if any, are declared and paid quarterly to shareholders of each Fund. Net realized gains, if any, are distributed at least once each year. The amount of distributions from net investment income and net realized gains are determined in accordance with federal income tax regulations which may differ from GAAP. These “book/tax” differences are either temporary or permanent in nature and are primarily due to losses deferred due to wash sales. Dividends and distributions are recorded on the ex-dividend date.
Use of Estimates: The preparation of financial statements in conformity with GAAP requires management to make estimates and assumptions that affect the reported amount of assets and liabilities, the disclosure of contingent assets and liabilities, and revenues and expenses during the reporting period. Actual results could differ from those estimates.
Federal Income Taxes: It is each Fund’s policy to comply with the special provisions of Subchapter M of the Internal Revenue Code applicable to regulated investment companies. As provided therein, in any fiscal year in which a Fund so qualifies and distributes at least 90% of its taxable net income, the Fund (but not the shareholders) will be relieved of federal income tax on the income distributed. Accordingly, no provision for income taxes has been made.
In order to avoid imposition of the excise tax applicable to regulated investment companies, it is also each Fund’s intention to declare as dividends in each calendar year at least 98% of its net investment income (earned during the calendar year) and 98.2% of its net realized capital gains (earned during the twelve months ended October 31) plus undistributed amounts from prior years.
STADION INVESTMENT TRUST
NOTES TO FINANCIAL STATEMENTS (Continued)
May 31, 2012
3. SECURITY TRANSACTIONS
During the period ended May 31, 2012, cost of purchases and proceeds from sales and maturities of investment securities, other than short-term investments and U.S. government securities, amounted to $5,679,253,165 and $5,616,620,971, respectively, for Managed Portfolio; $332,212,183 and $325,442,895, respectively, for Core Advantage Portfolio; $9,401,790 and $881,456, respectively, for Olympus Fund; and $45,577,988 and $106,811, respectively, for Trilogy Fund.
4. TAX MATTERS
The tax character of distributions made during the period ended May 31, 2012 was as follows:
| | | | | | | | | | |
| Managed Portfolio: | | | | | | | | | | |
Class A | 5/31/2012 | | $ | 7,380,598 | | | $ | — | | | $ | 7,380,598 | |
| | 5/31/2011 | | | 8,178,057 | | | | — | | | | 8,178,057 | |
Class C | 5/31/2012 | | | 2,109,084 | | | | — | | | | 2,109,084 | |
| | 5/31/2011 | | | 1,428,352 | | | | — | | | | 1,428,352 | |
Class I | 5/31/2012 | | | 863,167 | | | | — | | | | 863,167 | |
| | 5/31/2011 | | | 1,136,203 | | | | — | | | | 1,136,203 | |
| Core Advantage Portfolio: | | | | | | | | | | | | | |
Class A | 5/31/2012 | | $ | 1,031,929 | | | $ | 1,273,253 | | | $ | 2,305,182 | |
| | 5/31/2011 | | | — | | | | — | | | | — | |
Class C | 5/31/2012 | | | 154,527 | | | | 190,665 | | | | 345,192 | |
| | 5/31/2011 | | | — | | | | — | | | | — | |
Class I | 5/31/2012 | | | 43,804 | | | | 54,047 | | | | 97,851 | |
| | 5/31/2011 | | | — | | | | — | | | | — | |
No distributions were paid to shareholders of Olympus Fund or Trilogy Fund during the period ended May 31, 2012.
STADION INVESTMENT TRUST
NOTES TO FINANCIAL STATEMENTS (Continued)
May 31, 2012
The following information is computed on a tax basis for each item as of May 31, 2012:
| | | | | | | | | | | | |
Tax cost of portfolio investments | | $ | 687,272,764 | | | $ | 54,331,022 | | | $ | 15,123,843 | | | $ | 50,190,989 | |
Gross unrealized appreciation | | $ | — | | | $ | 279,764 | | | $ | 12,665 | | | $ | 465,764 | |
Gross unrealized depreciation | | | — | | | | (100,859 | ) | | | (167,685 | ) | | | (1,302,840 | ) |
Net unrealized appreciation (depreciation) | | | — | | | | 178,905 | | | | (155,020 | ) | | | (837,076 | ) |
Undistributed ordinary income | | | — | | | | — | | | | — | | | | 13,240 | |
Capital loss carryforward | | | (62,632,194 | ) | | | (2,026,374 | ) | | | — | | | | — | |
Post-October losses | | | — | | | | — | | | | (41,153 | ) | | | (117,332 | ) |
Accumulated deficit | | $ | (62,632,194 | ) | | $ | (1,847,469 | ) | | $ | (196,173 | ) | | $ | (941,168 | ) |
The difference between the federal income tax cost of portfolio investments and the financial statement cost for Core Advantage Portfolio is due to certain timing differences in the recognition of capital gains or losses under income tax regulations and GAAP. These “book/tax” differences are temporary in nature and are due to the tax deferral of losses on wash sales.
As of May 31, 2012, Managed Portfolio and Core Advantage Portfolio have short-term capital loss carryforwards for federal income tax purposes of $62,632,194 and $2,026,374, respectively, which do not expire. In addition, Olympus Fund and Trilogy Fund had net realized losses of $41,153 and $117,332, respectively, during the period April 2, 2012 through May 31, 2012 (“post-October” losses), which are treated for federal income tax purposes as arising during each Fund’s tax year ending May 31, 2013. These capital loss carryforwards and post-October losses may utilized in future years to offset net realized capital gains, if any, prior to distributing such gains to shareholders.
For the period ended May 31, 2012, Managed Portfolio, Core Advantage Portfolio and Olympus Fund reclassified $11,799,353, $409,399 and $12,704, respectively, of net investment loss against paid-in capital on the Statements of Assets and Liabilities. For the period ended May 31, 2012, Managed Portfolio and Core Advantage Portfolio reclassified $1,364 and $354, respectively, of distributions in excess of realized gains against paid-in capital on the Statements of Assets and Liabilities. Such reclassifications, the result of permanent differences between the financial statement and income tax reporting requirements, have no effect on the Funds’ net assets or net asset value per share.
The Funds recognize the tax benefits or expenses of uncertain tax positions only when the position is “more-likely-than-not” to be sustained assuming examination by tax authorities. Management has reviewed the tax positions taken on Federal income tax returns for all applicable open tax years (tax years ended May 31, 2009 through May 31, 2012) and has concluded that no provision for unrecognized tax benefits or expenses is required in these financial statements.
STADION INVESTMENT TRUST
NOTES TO FINANCIAL STATEMENTS (Continued)
May 31, 2012
5. TRANSACTIONS WITH AFFILIATES
Certain Trustees and officers of the Trust are also officers of Stadion Money Management, LLC (the “Advisor”) or of Ultimus Fund Solutions, LLC (“Ultimus”), the Funds’ administrator, transfer agent and fund accounting services agent, or Ultimus Fund Distributors, LLC (the “Distributor”), the Funds’ principal underwriter.
INVESTMENT ADVISORY AGREEMENTS
Each Fund’s investments are managed by the Advisor under the terms of an Investment Advisory Agreement (the “Advisory Agreements”). Under the Advisory Agreements, each Fund has agreed to pay the Advisor an investment advisory fee at an annual rate of 1.25% of its average daily net assets up to $150 million and 1.00% of such assets over $150 million.
On June 30, 2011, a change in control of the Advisor occurred whereby certain investment entities controlled and managed by TA Associates, Inc. acquired in the aggregate a 54.4% interest in the Advisor. This transaction resulted in the termination of the investment advisory agreements of Managed Portfolio and Core Advantage Portfolio with the Advisor in effect prior to June 30, 2011. Under the previous investment advisory agreements, the Advisor provided the same advisory services to Managed Portfolio and Core Advantage Portfolio on the same terms and for the same advisory fees.
The Advisor has entered into an Expense Limitation Agreement with respect to each Fund under which it has agreed to waive its fees and to assume other expenses of the Funds, if necessary, in an amount that limits the annual operating expenses of Class A shares, Class C shares and Class I shares of the Funds (exclusive of interest, taxes, brokerage commissions, extraordinary expenses, Acquired Fund Fees and Expenses and payments, if any, under the Rule 12b-1 Plan) to not more than 1.70% of the average daily net assets allocable to each Class until October 1, 2012 for Managed Portfolio and Core Advantage Portfolio, and until April 1, 2013 for Olympus Fund and Trilogy Fund. Accordingly, during the period ended May 31, 2012, the Advisor waived fees and reimbursed expenses as follows:
| | | | | | | | | |
Waived fees | | $ | 13,167 | | | $ | 19,658 | | | $ | 9,331 | |
| Reimbursed expenses: | | | | | | | | | | | | |
Class A | | | — | | | | 2,514 | | | | 994 | |
Class C | | | 23,904 | | | | 2,014 | | | | 2,012 | |
Class I | | | 28,930 | | | | 2,014 | | | | 2,014 | |
| Total waivers and reimbursements | | $ | 66,001 | | | $ | 26,200 | | | $ | 14,351 | |
During the year ended May 31, 2012, there were no advisory fees waived or expenses reimbursed by the Advisor for Managed Portfolio. It is expected that the Expense Limitation Agreements will continue from year-to-year, provided such continuance is approved by the Board of Trustees of the Trust.
The Chief Compliance Officer of the Trust is an employee of the Advisor. The Funds reimburse the Advisor $82,500 annually for the services provided by the Chief Compliance Officer of the Trust. Each Fund bears a proportionate share of this fee based on an allocation approved by the Trustees.
STADION INVESTMENT TRUST
NOTES TO FINANCIAL STATEMENTS (Continued)
May 31, 2012
ADMINISTRATION AGREEMENT
Under the terms of an Administration Agreement, Ultimus supplies internal regulatory compliance services and executive and administrative services for the Funds. Ultimus supervises the preparation of tax returns, reports to shareholders of the Funds, reports to and filings with the Securities and Exchange Commission (the “SEC”) and state securities commissions and materials for meetings of the Board of Trustees. For these services, each Fund pays Ultimus a monthly fee for these services at an annual rate of 0.075% of its average daily net assets up to $500 million; 0.05% of such assets from $500 million to $2 billion; 0.04% of such assets from $2 billion to $3 billion; 0.03% of such assets from $3 billion to $5 billion; and 0.025% of such assets in excess of $5 billion, subject to a minimum monthly fee of $3,000.
FUND ACCOUNTING AGREEMENT
Under the terms of a Fund Accounting Agreement, Ultimus calculates the daily net asset value per share and maintains the financial books and records of each Fund. For these services, Ultimus receives from each Fund a base fee of $3,500 per month plus an asset-based fee of 0.01% of its average daily net assets up to $500 million; and 0.005% of such assets in excess of $500 million. In addition, each Fund reimburses certain out-of-pocket expenses incurred by Ultimus in obtaining valuations of the Funds’ portfolio securities.
TRANSFER AGENT AND SHAREHOLDER SERVICES AGREEMENT
Under the terms of a Transfer Agent and Shareholder Services Agreement, Ultimus maintains the records of each shareholder’s account, answers shareholders’ inquiries concerning their accounts, processes purchases and redemptions of each Fund’s shares, acts as dividend and distribution disbursing agent and performs other shareholder service functions. For these services, each Fund pays Ultimus a fee at an annual rate of $18 per shareholder account, provided, however, that the minimum monthly fee for a share class is $1,000 if such class has 25 accounts or less, $1,250 if such class has more than 25 accounts but less than 100 accounts and $1,500 per month if such class has 100 accounts or more. In addition, the Funds pay out-of-pocket expenses, including, but not limited to, postage and supplies.
DISTRIBUTION PLAN
The Trust has adopted plans of distribution (the “Plans”) pursuant to Rule 12b-1 under the 1940 Act, which permit Class A and Class C shares of each Fund to directly incur or reimburse the Funds’ principal underwriter for certain expenses related to the distribution of its shares. The annual limitation for payment of expenses pursuant to the Plans is 0.25% of each Fund’s average daily net assets attributable to Class A shares and 1.00% of each Fund’s average daily net assets attributable to Class C shares. The Trust has not adopted a plan of distribution with respect to Class I shares.
During the period ended May 31, 2012, the following distribution expenses were incurred by the funds:
| | | | | | |
| Managed Portfolio | | $ | 1,825,469 | | | $ | 1,996,529 | |
| Core Advantage Portfolio | | $ | 115,010 | | | $ | 61,818 | |
| Olympus Fund | | $ | 1,633 | | | $ | 2 | |
| Trilogy Fund | | $ | 9,589 | | | $ | 37 | |
STADION INVESTMENT TRUST
NOTES TO FINANCIAL STATEMENTS (Continued)
May 31, 2012
DISTRIBUTION AGREEMENT
Under the terms of a Distribution Agreement with the Trust, the Distributor provides distribution services to the Trust and serves as principal underwriter to the Funds. The Distributor receives $6,000 annually from the Funds for acting as principal underwriter. In addition, during the period ended May 31, 2012, the Distributor earned underwriter fees of $114,508, $9,309, $35 and $5 on the sale of Class A shares of Managed Portfolio, Core Advantage Portfolio, Olympus Fund and Trilogy Fund, respectively.
6. DERIVATIVE TRANSACTIONS
Transactions in option contracts written by Trilogy Fund during the period ended May 31, 2012 were as follows:
| | | | | | |
| Options outstanding at beginning of period | | | — | | | $ | — | |
| Options written | | | 1,675 | | | | 5,011,700 | |
| Options cancelled in a closing purchase transaction | | | (702 | ) | | | (1,588,683 | ) |
| Options outstanding at end of period | | | 973 | | | $ | 3,423,017 | |
A portion of Trilogy Fund’s securities are pledged as collateral for open option contracts.
The locations in the Statements of Assets and Liabilities of Trilogy Fund’s derivative positions are as follows:
| | | | | | | | | Gross Notional Amount Outstanding May 31, 2012 | |
| Call options purchased | Investments in securities at value | | $ | 2,981,935 | | | $ | — | | | $ | 43,502,956 | |
| Put options purchased | Investments in securities at value | | | 5,982,978 | | | | — | | | | 94,252,115 | |
| Call options written | Written call options, at value | | | — | | | | (910,220 | ) | | | (54,771,794 | ) |
| Put options written | Written call options, at value | | | — | | | | (3,069,775 | ) | | | (72,723,315 | ) |
The average monthly notional amount of call options purchased, put options purchased, call options written and put options written during the period ended May 31, 2012 was $22,590,224, $48,594,061, $28,364,434 and $37,479,986, respectively for Trilogy Fund.
STADION INVESTMENT TRUST
NOTES TO FINANCIAL STATEMENTS (Continued)
May 31, 2012
Trilogy Fund’s transactions in derivative instruments during the period ended May 31, 2012 are recorded in the following locations in the Statements of Operations:
| | | | | | | Change in Unrealized Gains (Losses) | |
| Call options purchased | Net realized gains (losses) from option contracts | | $ | — | | Net change in unrealized appreciation (depreciation) on option contracts | | $ | (741,392 | ) |
| Put options purchased | Net realized gains (losses) from option contracts | | | (20,368 | ) | Net change in unrealized appreciation (depreciation) on option contracts | | | 1,180,773 | |
| Call options written | Net realized gains (losses) from option contracts | | | 572,039 | | Net change in unrealized appreciation (depreciation) on option contracts | | | 302,432 | |
| Put options written | Net realized gains (losses) from option contracts | | | (397,103 | ) | Net change in unrealized appreciation (depreciation) on option contracts | | | (859,410 | ) |
Managed Portfolio, Core Advantage Portfolio and Olympus Fund had no transactions in derivative instruments during the period ended May 31, 2012.
7. CAPITAL SHARE TRANSACTIONS
Proceeds and payments on capital shares as shown in the Statements of Changes in Net Assets are the result of the following capital share transactions for the periods shown:
| | | | | | | | | |
| | | | | | | | | | | | | | | | | | |
| Managed Portfolio | | | | | | | | | | | | | | | | | | |
| Shares sold | | | 21,838,032 | | | | 71,977,554 | | | | 4,183,032 | | | | 19,310,168 | | | | 15,491,666 | | | | 16,474,548 | |
| Shares issued in reinvestment of distributions to shareholders | | | 779,481 | | | | 731,608 | | | | 230,575 | | | | 133,474 | | | | 91,371 | | | | 54,276 | |
| Shares redeemed | | | (78,054,072 | ) | | | (25,337,724 | ) | | | (10,413,817 | ) | | | (1,869,519 | ) | | | (11,466,632 | ) | | | (8,132,065 | ) |
| Net increase (decrease) in shares outstanding | | | (55,436,559 | ) | | | 47,371,438 | | | | (6,000,210 | ) | | | 17,574,123 | | | | 4,116,405 | | | | 8,396,759 | |
| Shares outstanding beginning of year | | | 98,848,446 | | | | 51,477,008 | | | | 23,340,177 | | | | 5,766,054 | | | | 8,396,863 | | | | 104 | |
| Shares outstanding end of year | | | 43,411,887 | | | | 98,848,446 | | | | 17,339,967 | | | | 23,340,177 | | | | 12,513,268 | | | | 8,396,863 | |
STADION INVESTMENT TRUST
NOTES TO FINANCIAL STATEMENTS (Continued)
May 31, 2012
| | | | | | | | | |
| | | | | | | | | | | | | | | | | | |
| Core Advantage Portfolio | | | | | | | | | | | | | | | | | | |
| Shares sold | | | 1,631,198 | | | | 1,024,191 | | | | 299,313 | | | | 526,283 | | | | 352,141 | | | | 126,736 | |
| Shares issued in reinvestment of distributions to shareholders | | | 224,624 | | | | — | | | | 33,660 | | | | — | | | | 9,658 | | | | — | |
| Shares redeemed | | | (2,892,768 | ) | | | (749,564 | ) | | | (336,027 | ) | | | (149,291 | ) | | | (230,727 | ) | | | (4,976 | ) |
| Net increase (decrease) in shares outstanding | | | (1,036,946 | ) | | | 274,627 | | | | (3,054 | ) | | | 376,992 | | | | 131,072 | | | | 121,760 | |
| Shares outstanding beginning of year | | | 4,304,658 | | | | 4,030,031 | | | | 520,305 | | | | 143,313 | | | | 121,858 | | | | 98 | |
| Shares outstanding end of year | | | 3,267,712 | | | | 4,304,658 | | | | 517,251 | | | | 520,305 | | | | 252,930 | | | | 121,858 | |
| | | | | | | | | |
| | Period Ended May 31, 2012(a) | | | Period Ended May 31, 2012(a) | | | Period Ended May 31, 2012(a) | |
| Olympus Fund | | | | | | | | | |
| Shares sold | | | 920,831 | | | | 100 | | | | 100 | |
| Shares redeemed | | | (6,881 | ) | | | — | | | | — | |
| Net increase in shares outstanding | | | 913,950 | | | | 100 | | | | 100 | |
| Shares outstanding beginning of period | | | — | | | | — | | | | — | |
| Shares outstanding end of period | | | 913,950 | | | | 100 | | | | 100 | |
| Trilogy Fund | | | | | | | | | | | | |
| Shares sold | | | 5,178,379 | | | | 5,059 | | | | 100 | |
| Shares redeemed | | | (153,842 | ) | | | — | | | | — | |
| Net increase in shares outstanding | | | 5,024,537 | | | | 5,059 | | | | 100 | |
| Shares outstanding beginning of period | | | — | | | | — | | | | — | |
| Shares outstanding end of period | | | 5,024,537 | | | | 5,059 | | | | 100 | |
| (a) | Represents the period from commencement of operations (April 2, 2012) through May 31, 2012. |
8. COMMITMENTS AND CONTINGENCIES
The Funds indemnify the Trust’s officers and Trustees for certain liabilities that might arise from their performance of their duties to the Funds. Additionally, in the normal course of business, the Funds enter into contracts that contain a variety of representations and warranties and which provide general indemnifications. The Funds’ maximum exposure under these arrangements is unknown, as this would involve future claims that may be made against the Funds that have not yet occurred. However, based on experience, the Funds expect the risk of loss to be remote.
STADION INVESTMENT TRUST
NOTES TO FINANCIAL STATEMENTS (Continued)
May 31, 2012
9. UNDERLYING INVESTMENT IN OTHER INVESTMENT COMPANIES
The Funds currently seek to achieve their investment objectives by investing a portion of their assets in Fidelity Institutional Money Market Government Portfolio – Class I (the “Portfolio”), a registered open-end management investment company organized as a Delaware statutory trust. The Funds may redeem their investments from the Portfolio at any time if the Advisor determines that it is in the best interest of the Funds and their shareholders to do so.
The performance of the Funds may be directly affected by the performance of the Portfolio. As of May 31, 2012, the percentage of net assets invested in the Portfolio was 20.0%, 53.0%, 76.2% and 5.0% for Managed Portfolio, Core Advantage Portfolio, Olympus Fund and Trilogy Fund, respectively.
10. SUBSEQUENT EVENTS
The Funds are required to recognize in the financial statements the effects of all subsequent events that provide additional evidence about conditions that existed as of the date of the Statements of Assets and Liabilities. For non-recognized subsequent events that must be disclosed to keep the financial statements from being misleading, the Funds are required to disclose the nature of the event as well as an estimate of its financial effect, or a statement that such an estimate cannot be made. Management has evaluated subsequent events through the issuance of these financial statements and has noted no such events.
STADION INVESTMENT TRUST
REPORT OF INDEPENDENT REGISTERED PUBLIC ACCOUNTING FIRM
To the Board of Trustees of Stadion Investment Trust
and the Shareholders of the Stadion Managed Portfolio,
the Stadion Core Advantage Portfolio, the Stadion Olympus Fund,
and the Stadion Trilogy Fund
We have audited the accompanying statements of assets and liabilities of the Stadion Managed Portfolio, the Stadion Core Advantage Portfolio, the Stadion Olympus Fund and the Stadion Trilogy Fund, each a series of the Stadion Investment Trust (the “Funds”), including the schedules of investments, as of May 31, 2012, and the related statements of operations for the year or period then ended, the statements of changes in net assets for each of the years and periods presented in the two-year period then ended and the financial highlights for each of the years and periods presented in the five-year period then ended. These financial statements and financial highlights are the responsibility of the Funds’ management. Our responsibility is to express an opinion on these financial statements and financial highlights based on our audits.
We conducted our audits in accordance with the standards of the Public Company Accounting Oversight Board (United States). Those standards require that we plan and perform the audits to obtain reasonable assurance about whether the financial statements and financial highlights are free of material misstatement. An audit includes examining, on a test basis, evidence supporting the amounts and disclosures in the financial statements. Our procedures included confirmation of securities owned as of May 31, 2012 by correspondence with the custodian and brokers. An audit also includes assessing the accounting principles used and significant estimates made by management, as well as evaluating the overall financial statement presentation. We believe that our audits provide a reasonable basis for our opinion.
In our opinion, the financial statements and financial highlights referred to above present fairly, in all material respects, the financial position of the Stadion Managed Portfolio, the Stadion Core Advantage Portfolio, the Stadion Olympus Fund and the Stadion Trilogy Fund as of May 31, 2012, the results of their operations for the year or period then ended, the changes in their net assets for each of the years and periods presented in the two-year period then ended, and their financial highlights for each of the years and periods presented in the five-year period then ended, in conformity with accounting principles generally accepted in the United States of America.
| |  |
| | BBD, LLP |
Philadelphia, Pennsylvania
July 25, 2012
STADION INVESTMENT TRUST
ABOUT YOUR FUNDS’ EXPENSES (Unaudited)
We believe it is important for you to understand the impact of costs on your investment. As a shareholder of the Funds, you may incur two types of costs: (1) transaction costs, possibly including front-end sales loads; and (2) ongoing costs, including management fees, distribution (12b-1) fees and other Fund expenses. The following examples are intended to help you understand your ongoing costs (in dollars) of investing in the Funds and to compare these costs with the ongoing costs of investing in other mutual funds.
A mutual fund’s ongoing costs are expressed as a percentage of its average net assets. This figure is known as the expense ratio. The expenses in the tables that follow are based on an investment of $1,000 made at the beginning of the most recent semi-annual period (December 1, 2011 for Managed Portfolio and Core Advantage Portfolio and April 2, 2012 for Olympus Fund and Trilogy Fund) and held until the end of the period (May 31, 2012).
The tables that follow illustrate the Funds’ costs in two ways:
Actual fund return – This section helps you to estimate the actual expenses that you paid over the period. The “Ending Account Value” shown is derived from each Fund’s actual return, and the third column shows the dollar amount of operating expenses that would have been paid by an investor who started with $1,000 in the Fund. You may use the information here, together with the amount you invested, to estimate the expenses that you paid over the period.
To do so, simply divide your account value by $1,000 (for example, an $8,600 account value divided by $1,000 = 8.6), then multiply the result by the number given for the Fund under the heading “Expenses Paid During Period.”
Hypothetical 5% return – This section is intended to help you compare the Funds’ ongoing costs with those of other mutual funds. It assumes that each Fund had an annual return of 5% before expenses during the period shown, but that the expense ratio is unchanged. In this case, because the returns used are not the Funds’ actual returns, the results do not apply to your investment. The example is useful in making comparisons because the SEC requires all mutual funds to calculate expenses based on a 5% return. You can assess each Fund’s ongoing costs by comparing this hypothetical example with the hypothetical examples that appear in shareholder reports of other funds.
Note that expenses shown in the tables are meant to highlight and help you compare ongoing costs only and do not reflect any transaction costs, such as sales charges (loads). The calculations assume no shares were bought or sold during the period. Your actual costs may have been higher or lower, depending on the amount of your investment and the timing of any purchases or redemptions.
More information about each Fund’s expenses, including historical annual expense ratios, can be found in this report. For additional information on operating expenses and other shareholder costs, please refer to the Funds’ prospectus.
STADION INVESTMENT TRUST
ABOUT YOUR FUNDS’ EXPENSES (Unaudited) (Continued)
| Annualized Expense Ratio for the Period Ended May 31, 2012(a) | Beginning Account Value Dec. 1, 2011 | Ending Account Value May 31, 2012 | Expenses Paid During Period(b) |
| Managed Portfolio – Class A | 1.53% | | | |
| Based on Actual Fund Return | | $1,000.00 | $1,063.70 | $7.89 |
Based on Hypothetical 5% Return (before expenses) | | $1,000.00 | $1,017.35 | $7.72 |
| Managed Portfolio – Class C | 2.31% | | | |
| Based on Actual Fund Return | | $1,000.00 | $1,060.20 | $11.90 |
Based on Hypothetical 5% Return (before expenses) | | $1,000.00 | $1,013.45 | $11.63 |
| Managed Portfolio – Class I | 1.29% | | | |
| Based on Actual Fund Return | | $1,000.00 | $1,064.50 | $6.66 |
Based on Hypothetical 5% Return (before expenses) | | $1,000.00 | $1,018.55 | $6.51 |
| Core Advantage – Class A | 1.82% | | | |
| Based on Actual Fund Return | | $1,000.00 | $1,044.80 | $9.30 |
Based on Hypothetical 5% Return (before expenses) | | $1,000.00 | $1,015.90 | $9.17 |
| Core Advantage – Class C | 2.70% | | | |
| Based on Actual Fund Return | | $1,000.00 | $1,040.50 | $13.77 |
Based on Hypothetical 5% Return (before expenses) | | $1,000.00 | $1,011.50 | $13.58 |
| Core Advantage – Class I | 1.70% | | | |
| Based on Actual Fund Return | | $1,000.00 | $1,045.60 | $8.69 |
Based on Hypothetical 5% Return (before expenses) | | $1,000.00 | $1,016.50 | $8.57 |
| Olympus Fund – Class A | 1.95% | | | |
Based on Hypothetical 5% Return (before expenses) | | $1,000.00 | $1,015.25 | $9.82 |
| Olympus Fund – Class C | 2.70% | | | |
Based on Hypothetical 5% Return (before expenses) | | $1,000.00 | $1,011.50 | $13.58 |
| Olympus Fund – Class I | 1.70% | | | |
Based on Hypothetical 5% Return (before expenses) | | $1,000.00 | $1,016.50 | $8.57 |
| Trilogy Fund – Class A | 1.95% | | | |
Based on Hypothetical 5% Return (before expenses) | | $1,000.00 | $1,015.25 | $9.82 |
STADION INVESTMENT TRUST
ABOUT YOUR FUNDS’ EXPENSES (Unaudited) (Continued)
| Annualized Expense Ratio for the Period Ended May 31, 2012(a) | Beginning Account Value Dec. 1, 2011 | Ending Account Value May 31, 2012 | Expenses Paid During Period(b) |
| Trilogy Fund – Class C | 2.70% | | | |
Based on Hypothetical 5% Return (before expenses) | | $1,000.00 | $1,011.50 | $13.58 |
| Trilogy Fund – Class I | 1.70% | | | |
Based on Hypothetical 5% Return (before expenses) | | $1,000.00 | $1,016.50 | $8.57 |
| (a) | Represents the six-month period ended May 31, 2012 for Managed Portfolio and Core Advantage Portfolio and the period from the commencement of operations (April 2, 2012) through May 31, 2012 for Olympus Fund and Trilogy Fund. |
| (b) | Expenses are equal to the annualized expense ratio of each class for the period, multiplied by the average account value over the period, multiplied by 183/366 (to reflect the one-half year period). |
| Annualized Expense Ratio for the Period Ended May 31, 2012(a) | Beginning Account Value April 2, 2012 | Ending Account Value May 31, 2012 | Expenses Paid During Period(b) |
| Olympus Fund – Class A | 1.95% | | | |
| Based on Actual Fund Return | | $1,000.00 | $954.00 | $3.12 |
| Olympus Fund – Class C | 2.70% | | | |
| Based on Actual Fund Return | | $1,000.00 | $953.00 | $4.32 |
| Olympus Fund – Class I | 1.70% | | | |
| Based on Actual Fund Return | | $1,000.00 | $955.00 | $2.72 |
| Trilogy Fund – Class A | 1.95% | | | |
| Based on Actual Fund Return | | $1,000.00 | $985.00 | $3.17 |
| Trilogy Fund – Class C | 2.70% | | | |
| Based on Actual Fund Return | | $1,000.00 | $985.00 | $4.39 |
| Trilogy Fund – Class I | 1.70% | | | |
| Based on Actual Fund Return | | $1,000.00 | $986.00 | $2.77 |
| (a) | Represents the period from the commencement of operations (April 2, 2012) through May 31, 2012. |
| (b) | Expenses are equal to the annualized expense ratio of each class for the period, multiplied by the average account value over the period, multiplied by 60/366 (to reflect the period ended May 31, 2012). |
STADION INVESTMENT TRUST
SUPPLEMENTAL INFORMATION (Unaudited)
As a supplement to Note 9 to the financial statements of Managed Portfolio, Core Advantage Portfolio, Olympus Fund and Trilogy Fund, the financial statements of the aforementioned underlying fund, the Fidelity Institutional Money Market Government Portfolio – Class I (the “Portfolio”), can be found at http://www.sec.gov/Archives/edgar/data/356173/000031570012000004/immi.htm. This link is the latest annual report published for the Portfolio, dated March 31, 2012. Only data presented for the Fidelity Institutional Money Market Government Portfolio – Class I is pertinent to the overall review of the financial statements of the Funds.
OTHER INFORMATION (Unaudited)
The Trust files a complete listing of portfolio holdings of the Funds with the SEC as of the end of the first and third quarters of each fiscal year on Form N-Q. The filings are available free of charge, upon request, by calling 1-866-383-7636. Furthermore, you may obtain a copy of these filings on the SEC’s website at http://www.sec.gov. The Trust’s Forms N-Q may also be reviewed and copied at the SEC’s Public Reference Room in Washington, DC, and information on the operation of the Public Reference Room may be obtained by calling (800) SEC-0330.
A description of the policies and procedures that the Funds use to determine how to vote proxies relating to portfolio securities is available without charge upon request by calling toll-free 1-866-383-7636, or on the SEC’s website at http://www.sec.gov. Information regarding how the Funds voted proxies relating to portfolio securities during the most recent 12-month period ended June 30 is also available without charge upon request by calling toll-free 1-866-383-7636, or on the SEC’s website at http://www.sec.gov.
FEDERAL TAX INFORMATION (Unaudited)
In accordance with federal tax requirements, the following provides shareholders with information concerning distributions from ordinary income and net realized gains made by the Funds during the fiscal year ended May 31, 2012. Certain dividends paid by the Funds may be subject to a maximum tax rate of 15%, as provided by the Jobs and Growth Tax Relief Reconciliation Act of 2003. Managed Portfolio and Core Advantage Portfolio intend to designate up to a maximum amount of $10,352,849 and $1,230,260, respectively, as taxed at a maximum rate of 15%. Additionally, Core Advantage Portfolio intends to designate $1,517,965 as a long-term gain distribution. As required by federal regulations, complete information was computed and reported in conjunction with your 2011 Form 1099-DIV.
STADION INVESTMENT TRUST
BOARD OF TRUSTEES AND EXECUTIVE OFFICERS (Unaudited)
The Board of Trustees has overall responsibility for management of the Trust’s affairs. The Trustees serve during the lifetime of Trust and until its termination, or until death, resignation, retirement or removal. The Trustees, in turn, elect the officers of the Trust to actively supervise its day-to-day operations. The officers have been elected for an annual term. The following are the Trustees and executive officers of the Trust:
| Interested Trustee |
Name, Age & Address | Position(s) Held with the Trust | Term of Office & Length of Time Served | Principal Occupation(s) During Past 5 Years | Number of Funds Overseen by Trustee | Directorships of Public Companies Held by Trustee |
Gregory L. Morris* 1061 Cliff Dawson Road Watkinsville, GA 30677 Year of Birth: 1948 | Trustee, Chairman | Indefinite Since June, 2007 | A Portfolio Manager of the Advisor since joining the Advisor in November 2004. | 4 | None |
| Disinterested (Independent) Trustees |
James M. Baker 1061 Cliff Dawson Road Watkinsville, GA 30677 Year of Birth: 1952 | Trustee | Indefinite Since June, 2003 | President of Baker & Lassiter, Inc. (real estate development and management) since 1994. | 4 | Director of Resurgens Bank (closely held state charted bank). |
Norman A. McLean 1061 Cliff Dawson Road Watkinsville, GA 30677 Year of Birth: 1954 | Trustee | Indefinite Since June, 2003 | Director of Marketing/Public Relations for St. Mary’s Health Care System (health care) since September, 2005. | 4 | None |
Ronald C. Baum 1061 Cliff Dawson Road Watkinsville, GA 30677 Year of Birth: 1941 | Trustee | Indefinite Since June, 2011 | Retired. Managing Partner of Grant Thornton LLP (public accounting) from 1987 through 2002. | 4 | None |
| * | Mr. Morris, as an affiliated person of the Advisor, is an “interested person” of the Trust within the meaning of Section 2(a)(19) of the 1940 Act. |
STADION INVESTMENT TRUST
BOARD OF TRUSTEES AND EXECUTIVE OFFICERS (Unaudited)
(Continued)
| Executive Officers |
Name, Age & Address | Position(s) Held with the Trust | Length of Time Served | Principal Occupation(s) During Past 5 Years |
Judson P. Doherty 1061 Cliff Dawson Road Watkinsville, GA 30677 Year of Birth: 1969 | President (Principal Executive Officer) | Since June, 2006 | President of the Advisor and its predecessor firm (Stadion Money Management, Inc.) since 2007 and Chief Financial Officer from 2001 until 2011; Chief Compliance Officer of Stadion Money Management, Inc. and the Trust from 2004 to 2010. He is also a member of the Advisor’s investment committee. |
Timothy A. Chapman 1061 Cliff Dawson Road Watkinsville, GA 30677 Year of Birth: 1960 | Treasurer (Principal Financial Officer) | Since June, 2006 | Chairman of the Board and Chief Executive Officer of the Advisor and its predecessor firm (Stadion Money Management, Inc.) since 1993. He is also a member of the Advisor’s investment committee. |
Michael Isaac 1061 Cliff Dawson Road Watkinsville, GA 30677 Year of Birth: 1975 | Chief Compliance Officer | Since April, 2010 | Chief Compliance Officer of the Advisor and its predecessor firm (Stadion Money Management, Inc.) since 2010. Previously, Chief Compliance Officer of J.P. Turner & Company LLC (an independent broker/dealer) from 2006 to 2010. |
Tina H. Bloom 225 Pictoria Drive, Suite 450 Cincinnati, OH 45246 Year of Birth: 1968 | Secretary | Since April, 2011 | Director of Fund Administration of Ultimus Fund Solutions, LLC, transfer agent, fund accountant and administrator to the Trust and Vice President of Ultimus Fund Distributors, LLC, a registered broker dealer. |
Robert G. Dorsey 225 Pictoria Drive, Suite 450 Cincinnati, OH 45246 Year of Birth: 1957 | Vice President | Since May, 2007 | Managing Director of Ultimus Fund Solutions, LLC, transfer agent, fund accountant and administrator to the Trust; Managing Director of Ultimus Fund Distributors, LLC, a registered broker dealer. |
Additional information about members of the Board of Trustees and executive officers is available in the Statement of Additional Information (“SAI”). To obtain a free copy of the SAI, please call 1-866-383-7636.
STADION INVESTMENT TRUST
APPROVAL OF INVESTMENT ADVISORY AGREEMENTS (Unaudited)
OLYMPUS FUND
The Board of Trustees (the “Board”), including the Independent Trustees voting separately, has reviewed and approved the Investment Advisory Agreement (the “Olympus Fund Advisory Agreement”) with the Advisor for the Olympus Fund. Approval took place at an in-person meeting held on October 25, 2011, at which all of the Trustees were present.
In the course of their deliberations, the Board was advised by legal counsel and the Independent Trustees were advised by independent legal counsel. The Board received and reviewed a substantial amount of information provided by the Advisor in response to requests of the Board and counsel.
In considering the approval of the Olympus Fund Advisory Agreement and reaching their conclusions with respect thereto, the Board reviewed and analyzed various factors that they determined were relevant, including the factors described below.
The nature, extent, and quality of the services to be provided by the Advisor. In this regard, the Board considered the responsibilities the Advisor would have under the Advisory Agreement. Accordingly, the Board considered the services that would be provided by the Advisor to the Olympus Fund including, without limitation, its investment advisory services, its coordination of services for the Olympus Fund by the Fund’s service providers, its compliance procedures and practices, and its efforts to promote the Olympus Fund and assist in its distribution. The Board noted that many of the Trust’s executive officers are employees of the Advisor, and (with the exception of the Chief Compliance Officer) serve the Trust without additional compensation from the Olympus Fund. The Board was mindful that the investment process that will be used by the Advisor in managing the Olympus Fund is similar to that used to manage other series of the Trust, but can be expected to be more specialized and complex in certain respects because the Fund will invest primarily in securities tracking non-U.S. markets and sectors. After reviewing the foregoing information and further information provided to the Board by the Advisor (including descriptions of the Advisor’s business and the Advisor’s Form ADV), the Board concluded that the quality, extent, and nature of the services to be provided by the Advisor are satisfactory and adequate for the Olympus Fund.
The investment management capabilities and experience of the Advisor. In this regard, the Board evaluated the investment management experience of the Advisor. In particular, the Board received information from the Advisor regarding the experience of the Olympus Fund’s portfolio managers in purchasing ETFs and index-based securities using technical asset allocation models to determine the degree of risk in the markets. The Board discussed with the Advisor the investment objectives and strategies for the Olympus Fund and the Advisor’s plans for implementing such strategies for the Fund. The Board also considered the consistency of the Advisor’s investment management approach. After consideration of these factors, as well as the Advisor’s capabilities and experience in managing the current series of the Trust, the Board determined that the Advisor would be an appropriate manager for the Olympus Fund.
The costs of the services to be provided and profits to be realized by the Advisor from its relationship with the Olympus Fund. In this regard, the Board examined and evaluated the arrangements between the Advisor and the Olympus Fund under the Olympus Fund Advisory Agreement. The Board considered the Advisor’s staffing, personnel, and methods of operating; the Advisor’s compliance policies
STADION INVESTMENT TRUST
APPROVAL OF INVESTMENT ADVISORY AGREEMENTS (Unaudited)
(Continued)
and procedures; the financial condition of the Advisor and the level of commitment to the Olympus Fund and the Advisor by the principals of the Advisor; the projected asset levels of the Olympus Fund; the Advisor’s payment of startup costs for the Olympus Fund and the overall expenses of the Olympus Fund. The Board reviewed the Olympus Fund’s proposed Expense Limitation Agreement with the Advisor and noted the benefit that would result to the Olympus Fund from the Advisor’s likely waiver of a portion of its management fees for a period of time based on the projected asset levels of the Olympus Fund.
The Board also considered potential benefits to the Advisor in managing the Olympus Fund, including promotion of the Advisor’s name and the ability for the Advisor to place small accounts into the Olympus Fund. The Board compared the fees and expenses of the Olympus Fund (including the management fee) to peer groups of other funds in the Morningstar categories considered by the Advisor to have similar investment objectives and strategies as the Olympus Fund, although it noted that the Olympus Fund’s relatively unique investment strategies and approaches raised questions about the usefulness of these comparisons. The Board also compared the fees to be paid by the Olympus Fund as compared to the fees paid by other clients of the Advisor, and considered the similarities and differences of services received by such other clients as compared to the services that will be received by the Olympus Fund. Following these comparisons and upon further consideration and discussion of the foregoing, the Board concluded that the fees to be paid to the Advisor by the Olympus Fund are appropriate and within the range of what would have been negotiated at arm’s length.
The extent to which economies of scale would be realized as the Olympus Fund grows and whether management fee levels reflect these economies of scale for the benefit of the Fund’s investors. In this regard, the Board considered that the Olympus Fund’s fee arrangements with the Advisor involve both a management fee breakpoint and a proposed Expense Limitation Agreement. The Board considered that the Olympus Fund would likely experience benefits from the Expense Limitation Agreement and would continue to do so until the Olympus Fund’s assets grow to a level where the Advisor begins to receive the full fee. Thereafter, the Board noted that the Olympus Fund has the potential to benefit from economies of scale under its agreements with the Advisor (e.g., through the breakpoint) and other service providers and acknowledged that, due to the Advisor’s unique investment approach, economies of scale are mitigated by the additional complexities faced by the Advisor as assets under management increase. Following further discussion of the Olympus Fund’s projected asset levels, expectations for growth and level of fees, the Board determined that the Olympus Fund’s fee arrangements with the Advisor would provide benefits through the proposed Expense Limitation Agreement and that, at the Olympus Fund’s projected asset levels for the next two years, the Fund’s arrangements with the Advisor are fair and reasonable.
The Advisor’s practices regarding brokerage and portfolio transactions. In this regard, the Board considered the Advisor’s standards, and performance in utilizing those standards, to seek best execution for the Olympus Fund’s portfolio transactions. The Board also considered the anticipated portfolio turnover rate for the Olympus Fund; the process by which evaluations are made of the overall reasonableness of commissions paid; the method and basis for selecting and evaluating the broker-dealers used; any anticipated allocation of portfolio business to persons affiliated
STADION INVESTMENT TRUST
APPROVAL OF INVESTMENT ADVISORY AGREEMENTS (Unaudited)
(Continued)
with the Advisor; and the extent to which the Advisor expects to allocate the Olympus Fund’s portfolio business to broker-dealers who provide research, statistical, or other services (“soft dollars”). After further review and discussion, the Board determined that the Advisor’s practices regarding brokerage and portfolio transactions are satisfactory.
Possible conflicts of interest. In evaluating the possibility for conflicts of interest, the Board considered such matters as the experience and abilities of the advisory personnel assigned to the Olympus Fund; the basis of decisions to buy or sell securities for the Olympus Fund and/or the Advisor’s other accounts; the method for bunching of portfolio securities transactions; and the substance and administration of the Advisor’s code of ethics. Following further consideration and discussion, the Board found the Advisor’s standards and practices relating to the identification and mitigation of potential conflicts of interests to be satisfactory.
Conclusion
After full consideration of the above factors as well as other factors, the Board unanimously concluded that approval of the Olympus Fund Advisory Agreement was in the best interests of the Olympus Fund and its shareholders. No single factor was considered in isolation or to be determinative to the decision of the Trustees to approve the Olympus Fund Advisory Agreement. Rather, the Trustees concluded, in light of their weighing and balancing all factors, that approval of the Olympus Fund Advisory Agreement was in the best interests of the Olympus Fund and its shareholders.
TRILOGY FUND
The Board, including the Independent Trustees voting separately, has reviewed and approved the Investment Advisory Agreement (the “Trilogy Fund Advisory Agreement”) with the Advisor for the Trilogy Fund. Approval took place at an in-person meeting held on January 23, 2012, at which all of the Trustees were present.
In the course of their deliberations, the Board was advised by legal counsel and the Independent Trustees were advised by independent legal counsel. The Board received and reviewed a substantial amount of information provided by the Advisor in response to requests of the Board and counsel.
In considering the approval of the Trilogy Fund Advisory Agreement and reaching their conclusions with respect thereto, the Board reviewed and analyzed various factors that they determined were relevant, including the factors described below.
The nature, extent, and quality of the services to be provided by the Advisor. In this regard, the Board considered the responsibilities the Advisor would have under the Trilogy Fund Advisory Agreement. Accordingly, the Board considered the services that would be provided by the Advisor to the Trilogy Fund including, without limitation, its investment advisory services, its coordination of services for the Trilogy Fund by the Fund’s service providers, its compliance procedures and practices, and its efforts to promote the Trilogy Fund and assist in its distribution. The Board noted that many of the Trust’s executive officers are employees of the Advisor, and (with the exception of the Chief Compliance Officer) serve the Trust without additional compensation from the Trilogy Fund. The Board was mindful that the investment process that will be used by the Advisor in managing the Trilogy Fund involves the development of a unique strategy and use of complex analytical skills. After reviewing the foregoing information and further information provided to the Board by
STADION INVESTMENT TRUST
APPROVAL OF INVESTMENT ADVISORY AGREEMENTS (Unaudited)
(Continued)
the Advisor (including descriptions of the Advisor’s business and the Advisor’s Form ADV), the Board concluded that the quality, extent, and nature of the services to be provided by the Advisor are satisfactory and adequate for the Trilogy Fund.
The investment management capabilities and experience of the Advisor. In this regard, the Board evaluated the investment management experience of the Advisor. In particular, the Board received information from the Advisor regarding the experience of members of the Advisor’s portfolio management team in managing separate accounts having substantially identical strategies and asset allocations as the Trilogy Fund. The Board discussed with the Advisor the investment objectives and strategies for the Trilogy Fund and the Advisor’s plans for implementing such strategies for the Fund. After consideration of these factors, as well as the Advisor’s capabilities and experience in managing the current series of the Trust, the Board determined that the Advisor would be an appropriate manager for the Trilogy Fund.
The costs of the services to be provided and profits to be realized by the Advisor from its relationship with the Trilogy Fund. In this regard, the Board examined and evaluated the arrangements between the Advisor and the Trilogy Fund under the Trilogy Fund Advisory Agreement. The Board considered the Advisor’s staffing, personnel, and methods of operating; the Advisor’s compliance policies and procedures; the financial condition of the Advisor and the level of commitment to the Trilogy Fund and the Advisor by the principals of the Advisor; the projected asset levels of the Trilogy Fund; the Advisor’s payment of startup costs for the Trilogy Fund and the overall expenses of the Trilogy Fund. The Board reviewed the Trilogy Fund’s proposed Expense Limitation Agreement with the Advisor and noted the benefit that would result to the Trilogy Fund from the Advisor’s likely waiver of a portion of its management fees for a period of time based on the projected asset levels of the Trilogy Fund.
The Board also considered potential benefits to the Advisor in managing the Trilogy Fund, including promotion of the Advisor’s name and the ability for the Advisor to place small accounts into the Trilogy Fund. The Board compared the fees and expenses of the Trilogy Fund (including the management fee) to peer groups of other funds in the Morningstar category considered by the Advisor to have similar investment objectives and strategies as the Trilogy Fund, although it noted that the Trilogy Fund’s relatively unique investment strategies and approaches raised questions about the usefulness of these comparisons. The Board determined that while the Trilogy Fund’s management fee is higher than the average of the other funds included in its peer group, the Fund’s net expense ratio will be less than the average of its peer group. The Board also compared the fees to be paid by the Trilogy Fund as compared to the fees paid by other clients of the Advisor, and considered the similarities and differences of services received by such other clients as compared to the services that will be received by the Trilogy Fund. Following these comparisons and upon further consideration and discussion of the foregoing, the Board concluded that the fees to be paid to the Advisor by the Trilogy Fund are appropriate and within the range of what would have been negotiated at arm’s length.
STADION INVESTMENT TRUST
APPROVAL OF INVESTMENT ADVISORY AGREEMENTS (Unaudited)
(Continued)
The extent to which economies of scale would be realized as the Trilogy Fund grows and whether management fee levels reflect these economies of scale for the benefit of the Fund’s investors. In this regard, the Board considered that the Trilogy Fund’s fee arrangements with the Advisor involve both a management fee breakpoint and a proposed Expense Limitation Agreement. The Board considered that the Trilogy Fund would likely experience benefits from the Expense Limitation Agreement and would continue to do so until the Trilogy Fund’s assets grow to a level where the Advisor begins to receive the full fee. Thereafter, the Board noted that the Trilogy Fund has the potential to benefit from economies of scale under its agreements with the Advisor (e.g., through the breakpoint) and other service providers. Following further discussion of the Trilogy Fund’s projected asset levels, expectations for growth and level of fees, the Board determined that the Trilogy Fund’s fee arrangements with the Advisor would provide benefits through the proposed Expense Limitation Agreement and that, at the Trilogy Fund’s projected asset levels, the Fund’s arrangements with the Advisor are fair and reasonable.
The Advisor’s practices regarding brokerage and portfolio transactions. In this regard, the Board considered the Advisor’s standards, and performance in utilizing those standards, to seek best execution for the Trilogy Fund’s portfolio transactions. The Board also considered the anticipated portfolio turnover rate for the Trilogy Fund; the process by which evaluations are made of the overall reasonableness of commissions paid; the method and basis for selecting and evaluating the broker-dealers used; any anticipated allocation of portfolio business to persons affiliated with the Advisor; the process by which the Advisor will aggregate the securities to be sold or purchased for the Fund with those to be sold or purchased for other managed accounts; and the extent to which the Advisor expects to allocate the Trilogy Fund’s portfolio business to broker-dealers who provide research, statistical, or other services (“soft dollars”). After further review and discussion, the Board determined that the Advisor’s practices regarding brokerage and portfolio transactions are satisfactory.
Possible conflicts of interest. In evaluating the possibility for conflicts of interest, the Board considered such matters as the experience and abilities of the advisory personnel assigned to the Trilogy Fund; the basis of decisions to buy or sell securities for the Trilogy Fund and/or the Advisor’s other accounts; the method for bunching of portfolio securities transactions; and the substance and administration of the Advisor’s code of ethics. Following further consideration and discussion, the Board found the Advisor’s standards and practices relating to the identification and mitigation of potential conflicts of interests to be satisfactory.
Conclusion
After full consideration of the above factors as well as other factors, the Board unanimously concluded that approval of the Trilogy Fund Advisory Agreement was in the best interests of the Trilogy Fund and its shareholders. No single factor was considered in isolation or to be determinative to the decision of the Trustees to approve the Trilogy Fund Advisory Agreement. Rather, the Trustees concluded, in light of their weighing and balancing all factors, that approval of the Trilogy Fund Advisory Agreement was in the best interests of the Trilogy Fund and its shareholders.
This page intentionally left blank.
This page intentionally left blank.
As of the end of the period covered by this report, the registrant has adopted a code of ethics that applies to the registrant’s principal executive officer, principal financial officer, principal accounting officer or controller, or persons performing similar functions, regardless of whether these individuals are employed by the registrant or a third party. Pursuant to Item 12(a)(1), a copy of registrant’s code of ethics has been filed with the Commission. During the period covered by this report, the code of ethics has not been amended, and the registrant has not granted any waivers, including implicit waivers, from the provisions of the code of ethics.
The registrant’s board of trustees has determined that the registrant has at least one audit committee financial expert serving on its audit committee. The name of the audit committee financial expert is Ronald C. Baum. Mr. Baum is “independent” for purposes of this Item.
(a) Based on their evaluation of the registrant’s disclosure controls and procedures (as defined in Rule 30a-3(c) under the Investment Company Act of 1940) as of a date within 90 days of the filing date of this report, the registrant’s principal executive officer and principal financial officer have concluded that such disclosure controls and procedures are reasonably designed and are operating effectively to ensure that material information relating to the registrant, including its consolidated subsidiaries, is made known to them by others within those entities, particularly during the period in which this report is being prepared, and that the information required in filings on Form N-CSR is recorded, processed, summarized, and reported on a timely basis.
(b) There were no changes in the registrant’s internal control over financial reporting (as defined in Rule 30a-3(d) under the Investment Company Act of 1940) that occurred during the second fiscal quarter of the period covered by this report that have materially affected, or are reasonably likely to materially affect, the registrant’s internal control over financial reporting.
File the exhibits listed below as part of this Form. Letter or number the exhibits in the sequence indicated.
(a)(1) Any code of ethics, or amendment thereto, that is the subject of the disclosure required by Item 2, to the extent that the registrant intends to satisfy the Item 2 requirements through filing of an exhibit: Attached hereto
(a)(2) A separate certification for each principal executive officer and principal financial officer of the registrant as required by Rule 30a-2(a) under the Act (17 CFR 270.30a-2(a)): Attached hereto
(a)(3) Any written solicitation to purchase securities under Rule 23c-1 under the Act (17 CFR 270.23c-1) sent or given during the period covered by the report by or on behalf of the registrant to 10 or more persons: Not applicable
(b) Certifications required by Rule 30a-2(b) under the Act (17 CFR 270.30a-2(b)): Attached hereto
Pursuant to the requirements of the Securities Exchange Act of 1934 and the Investment Company Act of 1940, the registrant has duly caused this report to be signed on its behalf by the undersigned, thereunto duly authorized.
Pursuant to the requirements of the Securities Exchange Act of 1934 and the Investment Company Act of 1940, this report has been signed below by the following persons on behalf of the registrant and in the capacities and on the dates indicated.