UNITED STATES
SECURITIES AND EXCHANGE COMMISSION
Washington, D.C. 20549
FORM N-CSR
CERTIFIED SHAREHOLDER REPORT OF REGISTERED MANAGEMENT
INVESTMENT COMPANIES
Investment Company Act file number: 811-21457
Name of Fund: BlackRock Allocation Target Shares
| | |
| | Series C Portfolio Series E Portfolio Series M Portfolio Series P Portfolio Series S Portfolio |
Fund Address: 100 Bellevue Parkway, Wilmington, DE 19809
Name and address of agent for service: John M. Perlowski, Chief Executive Officer, BlackRock Allocation
Target Shares, 55 East 52nd Street, New York, NY 10055
Registrant’s telephone number, including area code: (800) 441-7762
Date of fiscal year end: 03/31/2015
Date of reporting period: 03/31/2015
Item 1 – Report to Stockholders
MARCH 31, 2015
BlackRock Allocation Target Shares
▶ Series C Portfolio
▶ Series E Portfolio
▶ Series M Portfolio
▶ Series P Portfolio
▶ Series S Portfolio
| | |
| Not FDIC Insured ¡ May Lose Value ¡ No Bank Guarantee | | |
| | | | | | |
| 2 | | BLACKROCK ALLOCATION TARGET SHARES | | MARCH 31, 2015 | | |
Dear Shareholder,
Market volatility has remained low from a long-term perspective, but increased over the course of 2014 amid higher valuations in risk assets (such as equities and high yield bonds), geopolitical risks, uneven global economic growth and uncertainty around policy moves from the world’s largest central banks. As the U.S. Federal Reserve (the “Fed”) gradually reduced its bond buying program (which ultimately ended in October 2014), U.S. interest rates surprisingly trended lower and stock prices forged ahead despite high valuations on the back of a multi-year bull market. Geopolitical tensions intensified in Ukraine and the Middle East and oil prices became highly volatile in the middle of the summer, stoking worries about economic growth outside the United States. As the U.S. economy continued to show steady improvement, the stronger data caused concern among investors that the Fed would raise short-term rates sooner than previously anticipated. The U.S. dollar appreciated and global credit markets tightened, ultimately putting a strain on investor flows, and financial markets broadly weakened in the third quarter.
U.S. economic growth picked up considerably in the fourth quarter while the broader global economy showed signs of slowing. U.S. markets significantly outperformed international markets even as the European Central Bank (“ECB”) and the Bank of Japan eased monetary policy, which drove further strengthening in the U.S. dollar. Oil prices plummeted in the fourth quarter due to a global supply-and-demand imbalance, sparking a selloff in energy-related assets and stress in emerging markets. Fixed income investors piled into U.S. Treasuries as their persistently low yields became relatively attractive as compared to international sovereign debt.
Equity markets reversed in the first quarter of 2015 and U.S. stocks underperformed international markets, notably Europe and Japan, but also emerging markets. Investors had held high expectations for the U.S. economy, but after a harsh winter, first-quarter data disappointed and high valuations took their toll on U.S. stocks. Meanwhile, economic reports in Europe and Asia easily beat investors’ very low expectations for those economies, and accommodative policies from global central banks helped international equities rebound. The ECB’s asset purchase program (announced in January and commenced in March) was the largest in scale and effect on the markets. Overall, market volatility decreased in the first quarter as global risks abated, with a ceasefire in Ukraine and an improving outlook for Greece’s continued membership in the Eurozone.
At BlackRock, we believe investors need to think globally, extend their scope across a broad array of asset classes and be prepared to move freely as market conditions change over time. We encourage you to talk with your financial advisor and visit blackrock.com for further insight about investing in today’s markets.
Sincerely,

Rob Kapito
President, BlackRock Advisors, LLC

Rob Kapito
President, BlackRock Advisors, LLC
| | | | | | | | |
| Total Returns as of March 31, 2015 | |
| | | 6-month | | | 12-month | |
U.S. large cap equities
(S&P 500® Index) | | | 5.93 | % | | | 12.73 | % |
U.S. small cap equities
(Russell 2000® Index) | | | 14.46 | | | | 8.21 | |
International equities
(MSCI Europe, Australasia,
Far East Index) | | | 1.13 | | | | (0.92 | ) |
Emerging market equities
(MSCI Emerging Markets
Index) | | | (2.37 | ) | | | 0.44 | |
3-month Treasury bill
(BofA Merrill Lynch
3-Month U.S. Treasury
Bill Index) | | | 0.01 | | | | 0.03 | |
U.S. Treasury securities
(BofA Merrill Lynch
10- Year U.S. Treasury
Index) | | | 6.25 | | | | 9.88 | |
U.S. investment grade
bonds (Barclays U.S.
Aggregate Bond Index) | | | 3.43 | | | | 5.72 | |
Tax-exempt municipal
bonds (S&P Municipal
Bond Index) | | | 2.29 | | | | 6.60 | |
U.S. high yield bonds
(Barclays U.S. Corporate
High Yield 2% Issuer
Capped Index) | | | 1.50 | | | | 2.00 | |
|
| Past performance is no guarantee of future results. Index performance is shown for illustrative purposes only. You cannot invest directly in an index. | |
| | | | | | |
| | | THIS PAGE NOT PART OF YOUR FUND REPORT | | | | 3 |
| | | | |
| Fund Summary as of March 31, 2015 | | | Series C Portfolio | |
How did the Fund perform?
| • | | For the 12-month period ended March 31, 2015, the Fund outperformed its benchmark, the Barclays U.S. Credit Index. Shares of the Fund can be purchased or held only by or on behalf of certain separately managed account clients. Comparisons of the Fund’s performance versus its benchmark index will differ from comparisons of the benchmark against the performance of the separately managed accounts. |
What factors influenced performance?
| • | | Security selection within investment grade corporate bonds contributed to performance, as did the Fund’s yield curve positioning. Additionally, the Fund’s allocation to capital securities and high yield bonds aided performance during the period. |
| • | | The main detractor from performance was the Fund’s duration positioning (sensitivity to interest rate movements) and security selection within the emerging market debt area. |
Describe recent portfolio activity.
| • | | The Fund had a bias toward higher quality securities and continued to look for opportunities to increase credit quality. |
| • | | The Fund reduced its overweight position in 30-year corporate bonds late in 2014, as investors generally avoided longer-term debt within the asset class. |
| • | | The Fund increased its position in the energy sector during the second half of the period by taking advantage of opportunities in the primary market, but it retained an underweight position in the sector at period-end. The Fund remained overweight in financials, particularly in the life |
| | insurance industry, as the financial sector features lower event risk than the industrials sector. Within the financial sector, the Fund maintained an allocation to capital securities given the attractive yield premium available by moving down the capital structure. |
| • | | The Fund holds a neutral weighting in the emerging markets, with a bias toward higher-quality securities. |
Describe portfolio positioning at period end.
| • | | The Fund remained defensively positioned on the belief that overall valuations in the credit sectors were not particularly attractive. However, the investment advisor continued to look for ways to capitalize on market volatility and idiosyncratic opportunities. The Fund sought to avoid the risks associated with events such as mergers and acquisitions or other activities designed to benefit equity investors over bondholders. |
| • | | The Fund remained underweight in the industrials sector, with its largest underweights in the consumer cyclical, consumer non-cyclical, technology, and energy industries. Within the energy space, the Fund held a significant position in gas pipeline companies, which are largely insulated from fluctuations in the price of the underlying commodity. The Fund held a neutral weighting in utilities relative to the benchmark. |
| • | | Believing U.S. bond yields are too low given the nation’s healthy economic fundamentals, the Fund closed the period with a short duration (or an interest-rate sensitivity below that of the benchmark). The Fund maintained a bias toward a flattening yield curve on the belief that interest rate hikes by the U.S. Federal Reserve could have a disproportionate impact on short-term bonds (as prices and yields move in opposite directions). |
The views expressed reflect the opinions of BlackRock as of the date of this report and are subject to change based on changes in market, economic or other conditions. These views are not intended to be a forecast of future events and are no guarantee of future results.
| | |
| Portfolio Composition | | Percent of
Long-Term Investments |
| | | | |
Corporate Bonds | | | 84 | % |
Preferred Securities | | | 4 | |
U.S. Treasury Obligations | | | 3 | |
Foreign Government Obligations | | | 3 | |
Taxable Municipal Bonds | | | 3 | |
Foreign Agency Obligations | | | 3 | |
| | |
| Credit Quality Allocation1 | | Percent of
Long-Term Investments |
| | | | |
AAA/Aaa | | | 4 | % |
AA/Aa | | | 11 | |
A | | | 44 | |
BBB/Baa | | | 39 | |
BB/Ba | | | 2 | |
| | 1 | | For financial reporting purposes, credit quality ratings shown above reflect the highest rating assigned by either Standard & Poor’s (“S&P”) or Moody’s Investors Service (“Moody’s”) if ratings differ. These rating agencies are independent, nationally recognized statistical rating organizations and are widely used. Investment grade ratings are credit ratings of BBB/Baa or higher. Below investment grade ratings are credit ratings of BB/Ba or lower. Investments designated N/R are not rated by either rating agency. Unrated investments do not necessarily indicate low credit quality. Credit quality ratings are subject to change. |
| | 2 | | The investment advisor evaluates the credit quality of not-rated investments based upon certain factors including, but not limited to, credit ratings for similar investments and financial analysis of sectors, individual investments and/or issuers. Using this approach, the investment advisor has deemed not-rated U.S. Government Sponsored Agency Securities and U.S. Treasury Obligations as AAA/ Aaa. |
| | | | | | |
| 4 | | BLACKROCK ALLOCATION TARGET SHARES | | MARCH 31, 2015 | | |
|
| Total Return Based on a $10,000 Investment |
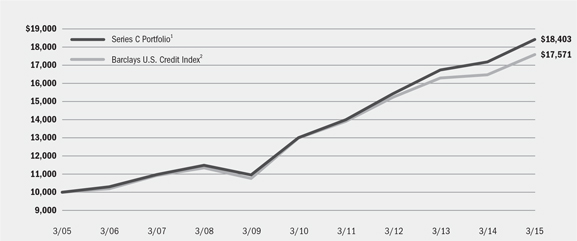
| | 1 | The Fund is non-diversified and will primarily invest its assets in investment grade fixed income securities, such as corporate bonds, notes and debentures, asset-backed securities, commercial and residential mortgage-backed securities, obligations of non-U.S. governments and supra-national organizations, which are chartered to promote economic development, collateralized mortgage obligations, U.S. Treasury and agency securities, cash equivalent investments, when-issued and delayed delivery securities, derivatives, repurchase agreements and reverse repurchase agreements. |
| | 2 | An unmanaged index that includes publicly issued U.S. corporate and non-corporate securities which include foreign agencies, sovereigns, supernationals and local authorities that meet the specified maturity, liquidity, and quality requirements. |
| | | | | | | | | | | | | | | | |
| Performance Summary for the Period Ended March 31, 2015 | |
| | | | | | Average Annual Total Returns3 | |
| | | 6-Month Total Returns | | | 1 Year | | | 5 Years | | | 10 Years | |
Series C Portfolio | | | 4.02 | % | | | 7.22 | % | | | 7.22 | % | | | 6.29 | % |
Barclays U.S. Credit Index | | | 3.96 | | | | 6.74 | | | | 6.23 | | | | 5.80 | |
| | 3 | | See “About Fund Performance” on page 14 for a detailed description of performance related information. |
| | | | Past performance is not indicative of future results. |
| | | | | | | | | | | | | | |
| | | Actual | | Hypothetical5 | | |
| | | Beginning Account Value
October 1, 2014 | | Ending Account Value
March 31, 2015 | | Expenses Paid
During the Period4 | | Beginning Account Value
October 1, 2014 | | Ending Account Value
March 31, 2015 | | Expenses Paid
During the Period4 | | Annualized
Expense Ratio |
Series M Portfolio | | $1,000.00 | | $1,040.20 | | $0.00 | | $1,000.00 | | $1,024.93 | | $0.00 | | 0.00% |
| | 4 | | For shares of the Fund, expenses are equal to the annualized expense ratio, multiplied by the average account value over the period, multiplied by 182/365 (to reflect the one-half year period shown). BlackRock has contractually agreed to waive all fees and pay or reimburse all direct expenses, except extraordinary expenses and interest expense, incurred by the Fund. This agreement has no fixed term. |
| | 5 | | Hypothetical 5% annual return before expenses is calculated by prorating the number of days in the most recent fiscal half year divided by 365. |
| | | | See “Disclosure of Expenses” on page 14 for further information on how expenses were calculated. |
| | | | | | |
| | | BLACKROCK ALLOCATION TARGET SHARES | | MARCH 31, 2015 | | 5 |
| | | | |
| Fund Summary as of March 31, 2015 | | | Series E Portfolio | |
Series E Portfolio’s (the “Fund”) investment objective is to seek to maximize Federal tax-free yield with a secondary goal of total return.
|
| Portfolio Management Commentary |
How did the Fund perform?
| • | | Since inception (August 4, 2014) through March 31, 2015, the Fund outperformed its benchmark, a customized Reference Benchmark consisting of 50% S&P® Municipal High-Yield Index, 25% S&P® Municipal Bond A Rating Band Index using the returns of only those A rated bonds that have maturities greater than 5 years and 25% S&P® Municipal Bond BBB Rating Band Index using the returns of only those BBB rated bonds that have maturities greater than 5 years. Shares of the Fund can be purchased or held only by or on behalf of certain separately managed account clients. Comparisons of the Fund’s performance versus its benchmark index will differ from comparisons of the benchmark against the performance of the separately managed accounts. |
What factors influenced performance?
| • | | The Fund’s performance was helped by its above-market weightings in the BBB and A ratings categories, both of which outperformed during the period. The Fund’s yield curve positioning, which favored longer-dated bonds, also aided performance as longer-term bonds generally outperformed those with shorter maturities. Sector allocation was an additional positive, led by an overweight position in health care and an underweight in the tax-backed (states) sector. Security selection within the tobacco and tax-backed (states) sectors further supported performance. |
| • | | The Fund’s security selection in the health care sector detracted from performance, as did its underweight in bonds rated CCC through C. The Fund was also negatively impacted by having a shorter duration relative to the benchmark (or a lower sensitivity to interest rate movements) in the initial weeks after the Fund’s inception. (Bond prices rise as yields fall). |
Describe recent portfolio activity.
| • | | Following the Fund’s launch in August, the Fund’s investment advisor’s initial goal was to achieve full investment in the municipal bond market. This process initially resulted in a high-quality portfolio in terms of credit ratings. In the following months, the Fund’s investment advisor adjusted the portfolio by swapping positions in certain higher-quality issues for bonds further down the credit spectrum. The Fund’s sector exposures were also repositioned, resulting in overweight allocations in the health care, education and transportation sectors. The heavy new-issue calendar was utilized to position the Fund accordingly. |
Describe portfolio positioning at period end.
| • | | The Fund closed the period with a duration slightly above that of its benchmark. The Fund’s underweight areas included the tax-backed (state & local) and utilities sectors. The Fund was overweight in the A and BBB credit tiers, and it was underweight in AA-rated issues. In addition, the Fund was underweight in the lower-quality BB through C rating groups. |
The views expressed reflect the opinions of BlackRock as of the date of this report and are subject to change based on changes in market, economic or other conditions. These views are not intended to be a forecast of future events and are no guarantee of future results.
| | |
| Sector Allocation | | Percent of
Long-Term Investments |
| | | | |
Health | | | 25 | % |
County/City/Special District/School District | | | 24 | |
Transportation | | | 20 | |
Tobacco | | | 13 | |
Education | | | 10 | |
Utilities | | | 6 | |
Housing | | | 2 | |
| | |
| Credit Quality Allocation1 | | Percent of
Long-Term Investments |
| | | | |
AA/Aa | | | 12 | % |
A | | | 39 | |
BBB/Baa | | | 21 | |
BB/Ba | | | 13 | |
B | | | 15 | |
| | 1 | | For financial reporting purposes, credit quality ratings shown above reflect the highest rating assigned by either S&P or Moody’s if ratings differ. These rating agencies are independent, nationally recognized statistical rating organizations and are widely used. Investment grade ratings are credit ratings of BBB/Baa or higher. Below investment grade ratings are credit ratings of BB/Ba or lower. Investments designated N/R are not rated by either rating agency. Unrated investments do not necessarily indicate low credit quality. Credit quality ratings are subject to change. |
| | 2 | | The investment advisor evaluates the credit quality of non-rated investments based upon certain factors including, but not limited to, credit ratings for similar investments and financial analysis of sectors, individual investments. Using this approach, the investment advisor has deemed U.S. Government Sponsored Agency Securities and U.S. Treasury Obligations as AAA/Aaa. |
| | | | | | |
| 6 | | BLACKROCK ALLOCATION TARGET SHARES | | MARCH 31, 2015 | | |
|
| Total Return Based on a $10,000 Investment |
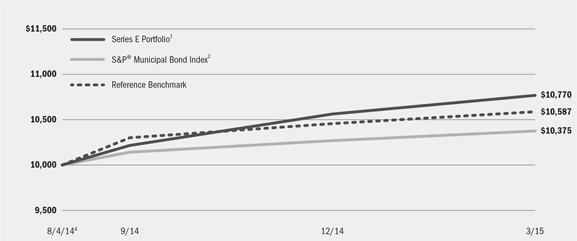
| | 1 | The Fund is diversified and will invest in investment grade and non-investment grade municipal bonds. Under normal circumstances, the Fund maintains an average portfolio duration that is within ±25% of the duration of the Reference Benchmark. |
| | 2 | The S&P® Municipal Bond Index is composed of bonds held by managed municipal bond fund customers of Standard & Poor’s Securities Pricing, Inc. that are priced daily. Bonds in the S&P® Municipal Bond Index must have an outstanding par value of at least $2 million and a remaining maturity of not less than one month. |
| | 3 | Reference Benchmark - a customized weighted index comprised of the returns of the S&P® Municipal High-Yield Index (50%)/S&P® Municipal Bond A Rating Band Index (25%) using the returns of only those A rated bonds that have maturities greater than 5 years/S&P® Municipal Bond BBB Rating Band Index (25%) using the returns of only those BBB rated bonds that have the maturities greater than 5 years. The benchmark value used to calculate since inception return is from the close of July 31, 2014. By using this value the benchmark is using 2 extra days of performance (August 1, 2014 and August 4, 2014) compared to the Fund. |
| | 4 | Commencement of operations. |
| | | | | | | | |
| Performance Summary for the Period Ended March 31, 2015 | | | | | | | | |
| | | | | | Aggregate Total Returns5 | |
| | | 6-Month
Total Returns | | | Since Inception6 | |
Series E Portfolio | | | 0.85 | % | | | 7.70 | % |
S&P® Municipal Bond Index | | | 2.29 | | | | 3.75 | |
Reference Benchmark | | | 2.77 | | | | 5.877 | |
| | 5 | | See “About Fund Performance” on page 14 for a detailed description of performance related information. |
| | 6 | | The Fund commenced operations on August 4, 2014. |
| | 7 | | The benchmark value used to calculate since inception return is from the close of July 31, 2014. By using this value the benchmark is using 2 extra days of performance (August 1, 2014 and August 4, 2014) compared to the Fund. |
| | | | Past performance is not indicative of future results. |
| | | | | | | | | | | | | | |
| Expense Example |
| | | Actual | | Hypothetical9 | | |
| | | Beginning Account Value
October 1, 2014 | | Ending Account Value
March 31, 2015 | | Expenses Paid
During the Period7 | | Beginning Account Value
October 1, 2014 | | Ending Account Value
March 31, 2015 | | Expenses Paid
During the Period8 | | Annualized
Expense Ratio |
Series E Portfolio | | $1,000.00 | | $1,054.00 | | $0.00 | | $1,000.00 | | $1,024.93 | | $0.00 | | 0.00% |
| | 8 | | For shares of the Fund, expenses are equal to the annualized expense ratio, multiplied by the average account value over the period, multiplied by 182/365 (to reflect the one-half year period shown). BlackRock has contractually agreed to waive all fees and pay or reimburse all direct expenses, except extraordinary expenses and interest expense, incurred by the Fund. This agreement has no fixed term. |
| | 9 | | Hypothetical 5% annual return before expenses is calculated by prorating the number of days in the most recent fiscal half year divided by 365. |
| | | | See “Disclosure of Expenses” on page 14 for further information on how expenses were calculated. |
| | | | | | |
| | | BLACKROCK ALLOCATION TARGET SHARES | | MARCH 31, 2015 | | 7 |
| | | | |
| Fund Summary as of Date | | | Series M Portfolio | |
Series M Portfolio’s (the “Fund”) investment objective is to seek to maximize total return, consistent with income generation and prudent investment management.
|
| Portfolio Management Commentary |
How did the Fund perform?
| • | | For the 12-month period ended March 31, 2015, the Fund outperformed its benchmark, the Barclays MBS Index. Shares of the Fund can be purchased or held only by or on behalf of certain separately managed account clients. Comparisons of the Fund’s performance versus its benchmark index will differ from comparisons of the benchmark against the performance of the separately managed accounts. |
What factors influenced performance?
| • | | The largest contributor to performance was the Fund’s allocation to agency mortgage-backed securities (“MBS”), specifically an overweight position for most of the period. In addition, a yield curve flattening bias helped performance as the Fund was positioned to benefit from declining yields on longer maturities. An overweight position in 30-year MBS versus 15-year MBS and a focus on higher coupons within 30-year MBS also had a positive impact on returns. |
| • | | The Fund’s allocation to commercial mortgage-backed securities (“CMBS”) and asset-backed securities (“ABS”) also contributed to performance as strong demand from yield-based investors provided support for tighter spreads. Within CMBS, overweight exposure to interest-only securities added to performance as investors sought yield during the period. |
| • | | The Fund’s exposure to interest rate swaps and below-benchmark duration (which measures sensitivity to interest rate changes) detracted from performance as rates declined during most of the 12-month period. |
Describe recent portfolio activity.
| • | | At the beginning of the period, the Fund held an overweight position in agency MBS as prepayments remained subdued and volatility moved lower. This overweight was maintained for most of the first half of the period, before the Fund moved to a modest underweight in MBS based on its strong performance and tight spreads relative to other sectors. While underweight in MBS overall, the Fund remained overweight in 30-year versus 15-year MBS arena, with a focus on higher coupons in 30-year MBS. Given the decline in interest rates over the period, prepayment speeds increased during the first quarter of 2015. Against this backdrop, the Fund maintained a bias toward more seasoned, higher coupon MBS and away from more recently issued, lower coupon mortgage pools that may be more sensitive to prepayment given the further decline in mortgage rates. The Fund continued to favor ABS, while selectively adding to CMBS interest-only securities. |
Describe portfolio positioning at period end.
| • | | Relative to the Barclays MBS Index, the Fund ended the period with a modest underweight position in agency MBS. At the same time, the Fund maintained a positive carry (income) profile versus the benchmark, with a bias toward higher coupon MBS. In addition, the Fund maintained overweight positions in both CMBS and ABS. |
| • | | While West Coast port closures and severe winter weather on the East Coast clouded the picture in recent months, the Fund maintained a modest underweight in duration relative to the benchmark index in view of the overall positive trajectory of the U.S. economy. |
The views expressed reflect the opinions of BlackRock as of the date of this report and are subject to change based on changes in market, economic or other conditions. These views are not intended to be a forecast of future events and are no guarantee of future results.
| | |
| Portfolio Composition | | Percent of
Long-Term Investments |
| | | | |
U.S. Government Sponsored Agency Securities | | | 94 | % |
Non-Agency Mortgage-Backed Securities | | | 5 | |
Asset-Backed Securities | | | 1 | |
| | |
| Credit Quality Allocation1 | | Percent of
Long-Term Investments |
| | 1 | | For financial reporting purposes, credit quality ratings shown above reflect the highest rating assigned by either S&P or Moody’s if ratings differ. These rating agencies are independent, nationally recognized statistical rating organizations and are widely used. Investment grade ratings are credit ratings of BBB/Baa or higher. Below investment grade ratings are credit ratings of BB/Ba or lower. Investments designated N/R are not rated by either rating agency. Unrated investments do not necessarily indicate low credit quality. Credit quality ratings are subject to change. |
| | 2 | | The investment advisor evaluates the credit quality of not-rated investments based upon certain factors including, but not limited to, credit ratings for similar investments and financial analysis of sectors, individual investments and/or issuers. Using this approach, the investment advisor has deemed not-rated U.S. Government Sponsored Agency Securities and U.S. Treasury Obligations as AAA/ Aaa. |
| | | | | | |
| 8 | | BLACKROCK ALLOCATION TARGET SHARES | | MARCH 31, 2015 | | |
|
| Total Return Based on a $10,000 Investment |
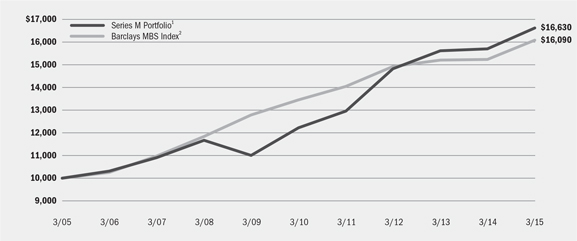
| | 1 | The Fund is non-diversified and will primarily invest its assets in investment grade commercial and residential mortgage-backed securities, asset-backed securities, collateralized mortgage obligations, U.S. Treasury and agency securities, cash equivalent instruments, when-issued and delayed delivery securities, derivatives and dollar rolls. |
| | 2 | An unmanaged index that includes the mortgage-backed pass-through securities of Ginnie Mae, Fannie Mae and Freddie Mac that meet the maturity and liquidity criteria. |
| | | | | | | | | | | | | | | | |
| Performance Summary for the Period Ended March 31, 2015 | | | | | | | | | | | | | | | | |
| | | | | | Average Annual Total Returns3 | |
| | | 6-Month
Total Returns | | | 1 Year | | | 5 Years | | | 10 Years | |
Series M Portfolio | | | 5.40 | % | | | 5.91 | % | | | 6.33 | % | | | 5.22 | % |
Barclays MBS Index | | | 2.86 | | | | 5.53 | | | | 3.63 | | | | 4.87 | |
| | 3 | | See “About Fund Performance” on page 14 for a detailed description of performance related information. |
| | | | Past performance is not indicative of future results. |
| | | | | | | | | | | | | | |
| Expense Example | | | | | | | | | | | | | | |
| | | Actual | | Hypothetical5 | | |
| | | Beginning Account Value
October 1, 2014 | | Ending Account Value
March 31, 2015 | | Expenses Paid
During the Period4 | | Beginning Account Value
October 1, 2014 | | Ending Account Value
March 31, 2015 | | Expenses Paid
During the Period4 | | Annualized
Expense Ratio |
Series M Portfolio | | $1,000.00 | | $1,030.50 | | $0.00 | | $1,000.00 | | $1,024.93 | | $0.00 | | 0.00% |
| | 4 | | For shares of the Fund, expenses are equal to the annualized expense ratio, multiplied by the average account value over the period, multiplied by 182/365 (to reflect the one-half year period shown). BlackRock has contractually agreed to waive all fees and pay or reimburse all direct expenses, except extraordinary expenses and interest expense, incurred by the Fund. This agreement has no fixed term. |
| | 5 | | Hypothetical 5% annual return before expenses is calculated by prorating the number of days in the most recent fiscal half year divided by 365. |
| | | | See “Disclosure of Expenses” on page 14 for further information on how expenses were calculated. |
| | | | | | |
| | | BLACKROCK ALLOCATION TARGET SHARES | | MARCH 31, 2015 | | 9 |
| | | | |
| Fund Summary as of Date | | | Series P Portfolio | |
Series P Portfolio’s (the “Fund”) investment objective is to seek to provide a duration that is the inverse of its benchmark.
|
| Portfolio Management Commentary |
How did the Fund perform?
| • | | For the 12-month period ended March 31, 2015, the Fund underperformed its benchmark, the Barclays U.S. Treasury 7-10 Year Bond Index. Shares of the Fund can be purchased or held only by or on behalf of certain separately managed account clients. Comparisons of the Fund’s performance versus its benchmark index will differ from comparisons of the benchmark against the performance of the separately managed accounts. |
What factors influenced performance?
| • | | As part of its strategy, the Fund engages in the selling of U.S. Treasury futures and uses interest rate swaps to achieve negative duration (i.e., the inverse effect of the benchmark index duration). Cash is received and held by the Fund as collateral for these transactions. During the period, the use of derivatives had a negative impact on Fund returns. The use and costs of derivatives will result in a negative contribution to returns when interest rates fall; however, the Fund’s strategy is designed to offset these costs by holding shares of BlackRock Allocation Target Shares: Series S Portfolio (“Series S Portfolio”), a short-term proprietary fund. The use of derivatives is necessary to achieve the Fund’s objective and should therefore be evaluated in a portfolio context and not as a stand-alone strategy. |
| • | | The Fund’s allocation to Series S Portfolio contributed positively to performance for the period. Series S Portfolio generated positive returns driven by sector allocation and security selection within structured products, including asset-backed securities (ABS) and commercial mortgage- |
| | backed securities. Series S Portfolio’s position in corporate bonds and agency mortgage-backed securities also aided performance. |
Describe recent portfolio activity.
| • | | During the 12-month period, the Fund actively managed interest rate risk on the 7- to 10-year part of the yield curve by using derivatives as described above. The Fund maintained its allocation to Series S Portfolio, a short-term proprietary fund, in order to offset the cost of the derivatives. |
| • | | During the period, Series S Portfolio increased its allocation to U.S. Treasuries due to their more attractive risk-adjusted return profile versus corporate bonds. Toward the second half of 2014, Series S Portfolio reduced its allocation in corporates because of their rich valuations, elevated market volatility and heightened event risks in the industrials sector. Series S Portfolio also reduced its position in agency mortgage-backed securities, as declining interest rates led to increased prepayment risks. Lastly, Series S Portfolio was positioned with a shorter duration bias, or an interest-rate sensitivity below that of its benchmark, at the close of the period. |
Describe portfolio positioning at period end.
| • | | At period end, the Fund held positions in U.S. Treasury futures and interest rate swaps, Series S Portfolio and the Bank of New York Cash Reserve Money Market Fund. Through its investment in Series S Portfolio, the Fund held exposures to investment grade corporate bonds, high yield, agency MBS, CMBS, ABS and U.S. agency debentures. |
The views expressed reflect the opinions of BlackRock as of the date of this report and are subject to change based on changes in market, economic or other conditions. These views are not intended to be a forecast of future events and are no guarantee of future results.
| | | | |
| Portfolio Composition | | Percent of
Net Assets | |
Fixed Income Funds | | | 30 | % |
Other Assets Less Liabilities | | | 70 | |
| | |
| Portfolio Holdings | | Percent of Affiliated
Investment Companies |
| | | | |
BlackRock Allocation Target Shares: Series S Portfolio | | | 100 | % |
| | | | | | |
| 10 | | BLACKROCK ALLOCATION TARGET SHARES | | MARCH 31, 2015 | | |
|
| Total Return Based on a $10,000 Investment |
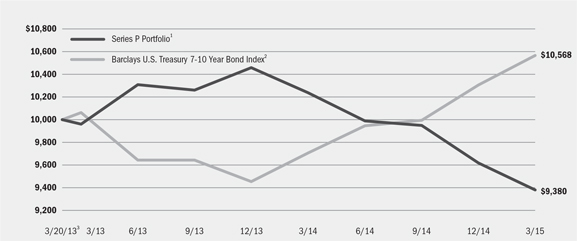
| | 1 | The Fund is non-diversified and may invest in a portfolio of securities and other financial instruments, including derivative instruments, in an attempt to provide returns that are the inverse of its benchmark index. |
| | 2 | An unmanaged index that includes all publicly issued, U.S. Treasury securities that have a remaining maturity of between 7 and 10 years, are non-convertible, are denominated in U.S. dollars, are rated Baa3 (or better) by Moody’s or BBB- (or better) by S&P, are fixed rate, and have more than $250 million par outstanding. |
| | 3 | Commencement of operations. |
| | | | | | | | | | | | |
| Performance Summary for the Period Ended March 31, 2015 | |
| | | 6-Month Total Returns | | | Average Annual Total Returns4 | |
| | | | 1 Year | | | | Since Inception5 | |
Series P Portfolio | | | 3.05 | % | | | (8.40 | )% | | | (3.10 | )% |
Barclays U.S. Treasury 7-10 Year Bond Index | | | 5.74 | | | | 8.88 | | | | 2.76 | |
| | 4 | | See “About Fund Performance” on page 14 for a detailed description of performance related information. |
| | 5 | | The Fund commenced operations on March 20, 2013. |
| | | | Past performance is not indicative of future results. |
| | | | | | | | | | | | | | |
| Expense Example |
| | | Actual | | Hypothetical7 | | |
| | | Beginning
Account Value
October 1, 2014 | | Ending
Account Value
March 31, 2015 | | Expenses Paid
During the Period6 | | Beginning
Account Value
October 1, 2014 | | Ending
Account Value
March 31, 2015 | | Expenses Paid
During the Period6 | | Annualized
Expense Ratio |
Series P Portfolio | | $1,000.00 | | $942.70 | | $0.00 | | $1,000.00 | | $1,024.93 | | $0.00 | | 0.00% |
| | 6 | | For shares of the Fund, expenses are equal to the annualized expense ratio, multiplied by the average account value over the period, multiplied by 182/365 (to reflect the one-half year period shown). The fees and expenses of the underlying funds in which the Fund invests are not included in the Fund’s annualized expense ratio. BlackRock has contractually agreed to waive all fees and pay or reimburse all direct expenses, except extraordinary expenses and interest expense, incurred by the Fund. This agreement has no fixed term. |
| | 7 | | Hypothetical 5% annual return before expenses is calculated by prorating the number of days in the most recent fiscal half year divided by 365. |
| | | | See “Disclosure of Expenses” on page 14 for further information on how expenses were calculated. |
| | | | | | |
| | | BLACKROCK ALLOCATION TARGET SHARES | | MARCH 31, 2015 | | 11 |
| | | | |
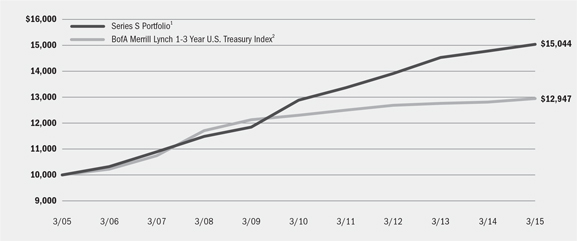
| Fund Summary as of March 31, 2015 | | | Series S Portfolio | |
Series S Portfolio’s (the “Fund”) investment objective is to seek to maximize total return, consistent with income generation and prudent investment management.
|
| Portfolio Management Commentary |
How did the Fund perform?
| • | | For the 12-month period ended March 31, 2015, the Fund outperformed its benchmark, the BofA Merrill Lynch 1-3 Year Treasury Index. Shares of the Fund can be purchased or held only by or on behalf of certain separately managed account clients. Comparisons of the Fund’s performance versus its benchmark index will differ from comparisons of the benchmark against the performance of the separately managed accounts. |
What factors influenced performance?
| • | | The main contributors to Fund performance were sector allocation and security selection within structured products, including asset-backed securities (ABS) and commercial mortgage-backed securities. The Fund’s positions in corporate bonds and agency mortgage-backed securities also aided performance. |
| • | | The Fund’s allocation to high yield bonds was the primary detractor from performance. High yield debt underperformed during the period, as the sharp decline in oil prices weighed heavily on the asset class during the second half of 2014. |
| • | | As part of its investment strategy, the Fund held derivatives during the period. Interest rate derivatives are used primarily as a means of managing the portfolio’s duration risk (sensitivity to interest rate movements). The Fund may also use credit default swaps against individual securities or broad indices to manage credit risk in the portfolio. Credit default swaps against indices also help manage market risk. In addition, |
| | the Fund may trade foreign currency exchange contracts or use foreign currency derivatives to manage currency risk in the portfolio. During the period, the use of derivatives had a negative impact on Fund returns. |
Describe recent portfolio activity.
| • | | During the period, the Fund increased its allocation to U.S. Treasuries due to their more attractive risk-adjusted return profile versus corporate bonds. Toward the second half of 2014, the Fund reduced its allocation in corporates because of their rich valuations, elevated market volatility and heightened event risks in the industrials sector. The Fund also reduced its position in agency mortgage-backed securities, as declining interest rates led to increased prepayment risks. |
Describe portfolio positioning at period end.
| • | | The Fund was positioned with a shorter duration bias, or an interest-rate sensitivity below that of the benchmark, at the close of the period. |
| • | | The Fund’s investment advisor retained a positive view on securitized assets due to negative net supply and the robust investor demand for ABS stemming from the continued improvement in consumer balance sheets. The investment advisor therefore continued to prefer ABS to corporate bonds, as the sector had comparatively stronger fundamentals and better valuations. Although the Fund’s investment advisor maintained a positive view on the underlying fundamentals of the corporate bond market, it remained cautious due to increased market volatility and potential event risk within industrials. |
The views expressed reflect the opinions of BlackRock as of the date of this report and are subject to change based on changes in market, economic or other conditions. These views are not intended to be a forecast of future events and are no guarantee of future results.
| | |
| Portfolio Composition | | Percent of
Long-Term Investments |
| | | | |
Corporate Bonds | | | 36 | % |
Asset-Backed Securities | | | 23 | |
Non-Agency Mortgage-Backed Securities | | | 18 | |
U.S. Treasury Obligations | | | 11 | |
U.S. Government Sponsored Agency Securities | | | 8 | |
Foreign Government Obligations | | | 4 | |
| | |
| Credit Quality Allocation1 | | Percent of
Long-Term Investments |
| | | | |
AAA/Aaa | | | 53 | % |
AA/Aa | | | 6 | |
A | | | 20 | |
BBB/Baa | | | 21 | |
| | 1 | | For financial reporting purposes, credit quality ratings shown above reflect the highest rating assigned by either S&P or Moody’s if ratings differ. These rating agencies are independent, nationally recognized statistical rating organizations and are widely used. Investment grade ratings are credit ratings of BBB/Baa or higher. Below investment grade ratings are credit ratings of BB/Ba or lower. Investments designated N/R are not rated by either rating agency. Unrated investments do not necessarily indicate low credit quality. Credit quality ratings are subject to change. |
| | 2 | | The investment advisor evaluates the credit quality of not-rated investments based upon certain factors including, but not limited to, credit ratings for similar investments and financial analysis of sectors, individual investments and/or issuers. Using this approach, the investment advisor has deemed not-rated U.S. Government Sponsored Agency Securities and U.S. Treasury Obligations as AAA/ Aaa. |
| | | | | | |
| 12 | | BLACKROCK ALLOCATION TARGET SHARES | | MARCH 31, 2015 | | |
|
| Total Return Based on a $10,000 Investment |
| | 1 | The Fund is non-diversified and will primarily invest its assets in investment grade fixed income securities, such as commercial and residential mortgage-backed securities, obligations of non-U.S. governments and supra-national organizations, which are chartered to promote economic development, obligations of domestic and non-U.S. corporations, asset-backed securities, U.S. Treasury and agency securities, cash equivalent investments, when-issued and delayed delivery securities, repurchase agreements, reverse repurchase agreements and dollar rolls. |
| | 2 | An unmanaged index comprised of Treasury securities with maturities ranging from one to three years. |
| | | | | | | | | | | | | | | | |
| Performance Summary for the Period Ended March 31, 2015 | |
| | | | | | Average Annual Total Returns3 | |
| | | 6 Months
Total Returns | | | 1 Year | | | 5 Years | | | 10 Years | |
Series S Portfolio | | | (5.73 | )% | | | 1.81 | % | | | 3.13 | % | | | 4.17 | % |
BofA Merrill Lynch 1-3 Year Treasury Index | | | 0.70 | | | | 1.00 | | | | 1.02 | | | | 2.62 | |
| | 3 | | See “About Fund Performance” on page 14 for a detailed description of performance related information. Past performance is not indicative of future results. |
| | | | | | | | | | | | | | | | | | | | | | | | | | | | | | | | | | | | |
| Expense Example | |
| | | Actual | | | Hypothetical6 | |
| | | | | | | | | Including
Interest Expense | | | Excluding
Interest Expense | | | | | | Including
Interest Expense | | | Excluding
Interest Expense | |
| | | Beginning
Account Value
October 1,
2014 | | | Ending
Account Value
March 31,
2015 | | | Expenses
Paid During
the Period4 | | | Expenses
Paid During
the Period5 | | | Beginning
Account Value
October 1,
2014 | | | Ending
Account Value
March 31,
2015 | | | Expenses
Paid During
the Period4 | | | Ending
Account Value
March 31,
2015 | | | Expenses
Paid During
the Period5 | |
Series S Portfolio | | $ | 1,000.00 | | | $ | 1,008.50 | | | $ | 0.05 | | | $ | 0.00 | | | $ | 1,000.00 | | | $ | 1,024.88 | | | $ | 0.05 | | | $ | 1,024.93 | | | $ | 0.00 | |
| | 4 | | For shares of the Fund, expenses are equal to the annualized expense ratio of 0.01%, multiplied by the average account value over the period, multiplied by 182/365 (to reflect the one-half year period shown). BlackRock has contractually agreed to waive all fees and pay or reimburse all direct expenses, except extraordinary expenses and interest expense, incurred by the Fund. This agreement has no fixed term. |
| | 5 | | For shares of the Fund, expenses are equal to the annualized expense ratio of 0.00%, multiplied by the average account value over the period, multiplied by 182/365 (to reflect the one-half year period shown). BlackRock has contractually agreed to waive all fees and pay or reimburse all direct expenses, except extraordinary expenses and interest expense, incurred by the Fund. This agreement has no fixed term. |
| | 6 | | Hypothetical 5% annual return before expenses is calculated by prorating the number of days in the most recent fiscal half year divided by 365. |
| | | | See “Disclosure of Expenses” on page 14 for further information on how expenses were calculated. |
| | | | | | |
| | | BLACKROCK ALLOCATION TARGET SHARES | | MARCH 31, 2015 | | 13 |
| | |
| The Benefits and Risks of Leveraging | | |
The Funds may utilize leverage to seek to enhance yield and net asset value (“NAV”). However, these objectives cannot be achieved in all interest rate environments.
The Funds may utilize leverage by entering into reverse repurchase agreements. In general, the concept of leveraging is based on the premise that the financing cost of leverage, which is based on short-term interest rates, is normally lower than the income earned on its longer-term portfolio investments purchased with the proceeds from leverage. To the extent that the total assets of each Fund (including the assets obtained from leverage) are invested in higher-yielding portfolio investments, each Fund’s shareholders will benefit from the incremental net income.
The interest earned on securities purchased with the proceeds from leverage is distributed to Fund shareholders, and the value of these portfolio holdings is reflected in each Fund’s per share NAV. However, in order to benefit shareholders, the return on assets purchased with leverage proceeds must exceed the ongoing costs associated with the leverage. If interest and other ongoing costs of leverage exceed a Fund’s return on assets purchased with leverage proceeds, income to shareholders is lower than if a Fund had not used leverage.
Furthermore, the value of each Fund’s portfolio investments generally varies inversely with the direction of long-term interest rates, although other factors can influence the value of portfolio investments. As a result, changes in interest rates can influence each Fund’s NAV positively or negatively in addition to the impact on Fund performance from leverage. Changes in the direction of interest rates are difficult to predict accurately, and there is no assurance that a Fund’s leveraging strategy will be successful.
The use of leverage also generally causes greater changes in each Fund’s NAV and distribution rates than a comparable fund that does not use leverage. In a declining market, leverage is likely to cause a greater decline in the NAV of a Fund’s shares than if a Fund were not leveraged. In addition, each Fund may be required to sell portfolio securities at inopportune times or at distressed values in order to comply with regulatory requirements applicable to the use of leverage or as required by the terms of leverage instruments, which may cause a Fund to incur losses. The use of leverage may limit a Fund’s ability to invest in certain types of securities or use certain types of hedging strategies. Each Fund incurs expenses in connection with the use of leverage, all of which are borne by Fund shareholders and may reduce income.
Performance information reflects past performance and does not guarantee future results. Current performance may be lower or higher than the performance data quoted. Performance results do not reflect the deduction of taxes that a shareholder would pay on fund distributions or the redemption of fund shares. Figures shown in each of the performance tables on the previous pages assume reinvestment of all distributions, if any, at NAV on the ex-dividend/payable dates. Investment return and principal value of shares will fluctuate so that shares, when redeemed, may be worth more or less than their original cost.
The performance information also reflects fee waivers and reimbursements that subsidize and reduce the total operating expenses of each Fund. The Funds’ returns would have been lower if there were no such waivers and reimbursements.
| | | | | | |
| 14 | | BLACKROCK ALLOCATION TARGET SHARES | | MARCH 31, 2015 | | |
Shareholders of the Funds may incur the following charges: (a) transactional expenses and (b) operating expenses, including administration fees and other Fund expenses. The expense examples on the previous pages (which are based on a hypothetical investment of $1,000 invested on October 1, 2014 and held through March 31, 2015) are intended to assist shareholders both in calculating expenses based on an investment in each Fund and in comparing these expenses with similar costs of investing in other mutual funds.
The expense examples provide information about actual account values and actual expenses. In order to estimate the expenses a shareholder paid during the period covered by this report, shareholders can divide their account value by $1,000 and then multiply the result by the number corresponding to their Fund under the headings entitled “Expenses Paid During the Period.”
The expense examples also provide information about hypothetical account values and hypothetical expenses based on a Fund’s actual expense ratio and an assumed rate of return of 5% per year before expenses. In order to assist shareholders in comparing the ongoing expenses of investing in these Funds and other funds, compare the 5% hypothetical example with the 5% hypothetical examples that appear in shareholder reports of other funds.
The expenses shown in the expense examples are intended to highlight shareholders’ ongoing costs only and do not reflect any transactional expenses, if any. Therefore, the hypothetical examples are useful in comparing ongoing expenses only, and will not help shareholders determine the relative total expenses of owning different funds. If these transactional expenses were included, shareholder expenses would have been higher.
|
| Derivative Financial Instruments |
The Funds may invest in various derivative financial instruments. Derivative financial instruments are used to obtain exposure to a security, index and/or market without owning or taking physical custody of securities or to manage equity, credit, interest rate, foreign currency exchange rate, commodity and.or other risks. Derivative financial instruments may give rise to a form of economic leverage. Derivative financial instruments also involve risks, including the imperfect correlation between the value of a derivative financial instrument and the underlying asset, possible default of the counterparty to the transaction or illiquidity of the derivative financial
instrument. The Funds’ ability to use a derivative financial instrument successfully depends on the investment advisor’s ability to predict pertinent market movements accurately, which cannot be assured. The use of derivative financial instruments may result in losses greater than if they had not been used, may limit the amount of appreciation a Fund can realize on an investment and/or may result in lower distributions paid to shareholders. The Funds’ investments in these instruments are discussed in detail in the Notes to Financial Statements.
| | | | | | |
| | | BLACKROCK ALLOCATION TARGET SHARES | | MARCH 31, 2015 | | 15 |
| | | | |
| Schedule of Investments March 31, 2015 | | | Series C Portfolio | |
| | | (Percentages shown are based on Net Assets) | |
| | | | | | | | |
| Corporate Bonds | | Par
(000) | | | Value | |
Aerospace & Defense — 1.1% | | | | | | | | |
The Boeing Co., 2.50%, 3/01/25 | | $ | 305 | | | $ | 303,820 | |
Northrop Grumman Systems Corp., 7.88%, 3/01/26 | | | 1,000 | | | | 1,384,924 | |
United Technologies Corp.: | | | | | | | | |
1.80%, 6/01/17 | | | 820 | | | | 835,094 | |
6.05%, 6/01/36 | | | 450 | | | | 594,811 | |
4.50%, 6/01/42 | | | 740 | | | | 820,763 | |
| | | | | | | | |
| | | | | | | | 3,939,412 | |
Air Freight & Logistics — 0.1% | | | | | | | | |
Federal Express Corp. Pass-Through Trust, Series 2012, 2.63%, 1/15/18 (a) | | | 503 | | | | 512,845 | |
Airlines — 0.7% | | | | | | | | |
American Airlines Pass-Through Trust, Series 2014-1, Class B, 4.38%, 4/01/24 | | | 150 | | | | 155,250 | |
Doric Nimrod Air Alpha Pass-Through Trust, Series 2013-1, Class A, 5.25%, 5/30/25 (a) | | | 936 | | | | 996,685 | |
U.S. Airways Pass-Through Trust, Series 2013-1, Class A, 3.95%, 5/15/27 | | | 898 | | | | 931,742 | |
Virgin Australia Trust, 5.00%, 10/23/25 (a) | | | 279 | | | | 293,849 | |
| | | | | | | | |
| | | | | | | | 2,377,526 | |
Auto Components — 0.4% | | | | | | | | |
Icahn Enterprises LP/Icahn Enterprises Finance Corp.: | | | | | | | | |
3.50%, 3/15/17 | | | 225 | | | | 226,687 | |
4.88%, 3/15/19 | | | 501 | | | | 510,394 | |
5.88%, 2/01/22 | | | 600 | | | | 618,000 | |
| | | | | | | | |
| | | | | | | | 1,355,081 | |
Automobiles — 0.9% | | | | | | | | |
Daimler Finance North America LLC, 1.25%, 1/11/16 (a) | | | 2,300 | | | | 2,308,510 | |
Volkswagen Group of America Finance LLC, 1.60%, 11/20/17 (a) | | | 1,050 | | | | 1,059,190 | |
| | | | | | | | |
| | | | | | | | 3,367,700 | |
Banks — 11.9% | | | | | | | | |
Abbey National Treasury Services PLC: | | | | | | | | |
1.65%, 9/29/17 | | | 975 | | | | 981,084 | |
2.38%, 3/16/20 | | | 1,075 | | | | 1,082,667 | |
Associated Banc-Corp., 5.13%, 3/28/16 | | | 1,490 | | | | 1,543,542 | |
Bank of America Corp.: | | | | | | | | |
6.05%, 5/16/16 | | | 1,350 | | | | 1,417,133 | |
6.50%, 8/01/16 | | | 3,330 | | | | 3,553,939 | |
5.63%, 10/14/16 | | | 325 | | | | 346,020 | |
5.75%, 12/01/17 | | | 1,755 | | | | 1,931,114 | |
5.70%, 1/24/22 | | | 2,125 | | | | 2,484,633 | |
4.20%, 8/26/24 | | | 1,210 | | | | 1,251,825 | |
4.00%, 1/22/25 | | | 605 | | | | 609,896 | |
5.00%, 1/21/44 | | | 625 | | | | 717,389 | |
4.88%, 4/01/44 | | | 500 | | | | 562,765 | |
| | | | | | | | |
| Corporate Bonds | | Par
(000) | | | Value | |
Banks (concluded) | | | | | | | | |
Bank of America N.A., 1.65%, 3/26/18 | | $ | 1,075 | | | $ | 1,077,680 | |
Barclays Bank PLC, 5.14%, 10/14/20 | | | 300 | | | | 333,305 | |
Barclays PLC: | | | | | | | | |
2.75%, 11/08/19 | | | 805 | | | | 812,931 | |
4.38%, 9/11/24 | | | 375 | | | | 379,287 | |
Citigroup, Inc.: | | | | | | | | |
1.85%, 11/24/17 | | | 1,400 | | | | 1,409,838 | |
2.50%, 7/29/19 | | | 950 | | | | 963,545 | |
6.00%, 10/31/33 | | | 100 | | | | 118,204 | |
Cooperatieve Centrale Raiffeisen-Boerenleenbank BA, 3.95%, 11/09/22 | | | 1,050 | | | | 1,086,962 | |
HSBC Holdings PLC: | | | | | | | | |
4.25%, 3/14/24 | | | 550 | | | | 577,141 | |
6.80%, 6/01/38 | | | 755 | | | | 992,852 | |
HSBC USA, Inc., 1.70%, 3/05/18 | | | 955 | | | | 956,788 | |
ING Bank NV: | | | | | | | | |
3.00%, 9/01/15 (a) | | | 1,625 | | | | 1,639,560 | |
2.50%, 10/01/19 (a) | | | 950 | | | | 964,889 | |
Intesa Sanpaolo SpA, 3.13%, 1/15/16 | | | 630 | | | | 638,581 | |
JPMorgan Chase & Co.: | | | | | | | | |
1.70%, 3/01/18 | | | 1,075 | | | | 1,079,319 | |
2.20%, 10/22/19 | | | 1,655 | | | | 1,659,503 | |
2.25%, 1/23/20 | | | 1,800 | | | | 1,803,856 | |
3.20%, 1/25/23 | | | 400 | | | | 406,656 | |
3.88%, 2/01/24 | | | 700 | | | | 740,494 | |
3.63%, 5/13/24 | | | 1,175 | | | | 1,221,753 | |
4.85%, 2/01/44 | | | 625 | | | | 713,221 | |
Macquarie Bank Ltd., 1.60%, 10/27/17 (a) | | | 1,300 | | | | 1,299,395 | |
Regions Financial Corp., 5.75%, 6/15/15 | | | 550 | | | | 554,879 | |
Royal Bank of Scotland Group PLC: | | | | | | | | |
6.13%, 12/15/22 | | | 75 | | | | 84,457 | |
6.00%, 12/19/23 | | | 1,250 | | | | 1,390,427 | |
5.13%, 5/28/24 | | | 300 | | | | 314,733 | |
Wells Fargo & Co.: | | | | | | | | |
3.68%, 6/15/16 (b) | | | 300 | | | | 310,636 | |
3.50%, 3/08/22 | | | 1,500 | | | | 1,592,465 | |
4.13%, 8/15/23 | | | 350 | | | | 373,589 | |
5.61%, 1/15/44 | | | 200 | | | | 242,180 | |
4.65%, 11/04/44 | | | 605 | | | | 648,880 | |
| | | | | | | | |
| | | | | | | | 42,870,013 | |
Beverages — 0.3% | | | | | | | | |
Anheuser-Busch InBev Worldwide, Inc., 2.50%, 7/15/22 | | | 1,000 | | | | 986,574 | |
Biotechnology — 0.2% | | | | | | | | |
Amgen, Inc., 5.38%, 5/15/43 | | | 520 | | | | 620,393 | |
Capital Markets — 5.7% | | | | | | | | |
Credit Suisse: | | | | | | | | |
3.00%, 10/29/21 | | | 665 | | | | 677,801 | |
3.63%, 9/09/24 | | | 1,150 | | | | 1,188,602 | |
| | | | | | | | | | |
| Portfolio Abbreviations |
| AMT | | Alternative Minimum Tax (subject to) | | OTC | | Over-the-counter | | | | |
| EDA | | Economic Development Authority | | RB | | Revenue Bonds | | | | |
| GO | | General Obligation Bonds | | REIT | | Real Estate Investment Trust | | | | |
| IDA | | Industrial Development Authority | | TBA | | To-be-announced | | | | |
| LIBOR | | London Interbank Offered Rate | | | | | | | | |
See Notes to Financial Statements.
| | | | | | |
| 16 | | BLACKROCK ALLOCATION TARGET SHARES | | MARCH 31, 2015 | | |
| | | | |
| Schedule of Investments (continued) | | | Series C Portfolio | |
| | | (Percentages shown are based on Net Assets) | |
| | | | | | | | |
| Corporate Bonds | | Par
(000) | | | Value | |
Capital Markets (concluded) | | | | | | | | |
Credit Suisse Group Funding Guernsey Ltd., 2.75%, 3/26/20 (a) | | $ | 905 | | | $ | 910,163 | |
Deutsche Bank AG: | | | | | | | | |
1.88%, 2/13/18 | | | 640 | | | | 640,902 | |
4.50%, 4/01/25 | | | 895 | | | | 894,026 | |
The Goldman Sachs Group, Inc.: | | | | | | | | |
6.25%, 9/01/17 | | | 635 | | | | 704,173 | |
6.15%, 4/01/18 | | | 850 | | | | 955,605 | |
2.63%, 1/31/19 | | | 1,000 | | | | 1,021,666 | |
2.55%, 10/23/19 | | | 1,470 | | | | 1,490,433 | |
5.75%, 1/24/22 | | | 165 | | | | 192,614 | |
6.25%, 2/01/41 | | | 725 | | | | 945,020 | |
4.80%, 7/08/44 | | | 975 | | | | 1,082,825 | |
Morgan Stanley: | | | | | | | | |
0.73%, 10/15/15 (c) | | | 2,050 | | | | 2,052,903 | |
6.25%, 8/28/17 | | | 885 | | | | 977,670 | |
1.88%, 1/05/18 | | | 1,240 | | | | 1,248,484 | |
7.30%, 5/13/19 | | | 1,625 | | | | 1,944,013 | |
5.63%, 9/23/19 | | | 265 | | | | 301,642 | |
5.50%, 7/28/21 | | | 10 | | | | 11,601 | |
4.35%, 9/08/26 | | | 655 | | | | 686,613 | |
4.30%, 1/27/45 | | | 210 | | | | 217,608 | |
UBS AG: | | | | | | | | |
1.80%, 3/26/18 | | | 1,460 | | | | 1,464,051 | |
2.38%, 8/14/19 | | | 973 | | | | 980,760 | |
| | | | | | | | |
| | | | | | | | 20,589,175 | |
Chemicals — 0.6% | | | | | | | | |
CF Industries, Inc., 5.38%, 3/15/44 | | | 350 | | | | 393,246 | |
Eastman Chemical Co., 4.65%, 10/15/44 | | | 700 | | | | 734,621 | |
LyondellBasell Industries NV, 5.00%, 4/15/19 | | | 825 | | | | 909,781 | |
| | | | | | | | |
| | | | | | | | 2,037,648 | |
Commercial Services & Supplies — 0.6% | | | | | | | | |
The ADT Corp., 2.25%, 7/15/17 | | | 400 | | | | 397,000 | |
Aviation Capital Group Corp., 6.75%, 4/06/21 (a) | | | 1,575 | | | | 1,792,415 | |
| | | | | | | | |
| | | | | | | | 2,189,415 | |
Consumer Finance — 2.4% | | | | | | | | |
American Express Credit Corp., 1.55%, 9/22/17 | | | 460 | | | | 463,411 | |
Capital One Financial Corp.: | | | | | | | | |
1.00%, 11/06/15 | | | 475 | | | | 475,572 | |
3.50%, 6/15/23 | | | 850 | | | | 872,592 | |
Discover Financial Services, 3.85%, 11/21/22 | | | 650 | | | | 666,877 | |
Ford Motor Credit Co. LLC: | | | | | | | | |
2.75%, 5/15/15 | | | 2,350 | | | | 2,355,189 | |
1.70%, 5/09/16 | | | 700 | | | | 703,257 | |
1.72%, 12/06/17 | | | 1,275 | | | | 1,272,177 | |
Navient Corp., 3.88%, 9/10/15 | | | 1,700 | | | | 1,712,189 | |
| | | | | | | | |
| | | | | | | | 8,521,264 | |
Diversified Financial Services — 3.9% | | | | | | | | |
BP Capital Markets PLC: | | | | | | | | |
3.13%, 10/01/15 | | | 2,875 | | | | 2,911,369 | |
3.54%, 11/04/24 | | | 610 | | | | 621,215 | |
3.51%, 3/17/25 | | | 570 | | | | 581,375 | |
CME Group Index Services LLC, 4.40%, 3/15/18 (a) | | | 1,700 | | | | 1,863,299 | |
General Electric Capital Corp.: | | | | | | | | |
6.75%, 3/15/32 | | | 1,075 | | | | 1,486,885 | |
6.15%, 8/07/37 | | | 715 | | | | 949,087 | |
General Motors Financial Co., Inc.: | | | | | | | | |
3.25%, 5/15/18 | | | 660 | | | | 672,375 | |
6.75%, 6/01/18 | | | 325 | | | | 365,625 | |
3.15%, 1/15/20 | | | 760 | | | | 769,041 | |
| | | | | | | | |
| Corporate Bonds | | Par
(000) | | | Value | |
Diversified Financial Services (concluded) | | | | | | | | |
HSBC Finance Corp., 6.68%, 1/15/21 | | $ | 1,100 | | | $ | 1,306,173 | |
Shell International Finance BV, 6.38%, 12/15/38 | | | 800 | | | | 1,107,650 | |
SteelRiver Transmission Co. LLC, 4.71%, 6/30/17 (a) | | | 529 | | | | 553,544 | |
Voya Financial, Inc., 2.90%, 2/15/18 | | | 775 | | | | 799,650 | |
| | | | | | | | |
| | | | | | | | 13,987,288 | |
Diversified Telecommunication Services — 3.6% | | | | | | | | |
AT&T Inc.: | | | | | | | | |
0.00%, 11/27/22 (a)(d) | | | 1,000 | | | | 778,241 | |
4.30%, 12/15/42 | | | 76 | | | | 72,694 | |
4.80%, 6/15/44 | | | 65 | | | | 66,562 | |
4.35%, 6/15/45 | | | 105 | | | | 100,430 | |
Deutsche Telekom International Finance BV, 3.13%, 4/11/16 (a) | | | 950 | | | | 970,530 | |
Telefonica Moviles Chile SA, 2.88%, 11/09/15 (a) | | | 1,375 | | | | 1,386,903 | |
Verizon Communications, Inc.: | | | | | | | | |
3.65%, 9/14/18 | | | 3,500 | | | | 3,721,725 | |
5.15%, 9/15/23 | | | 725 | | | | 831,201 | |
4.27%, 1/15/36 (a) | | | 1,475 | | | | 1,463,725 | |
6.25%, 4/01/37 | | | 850 | | | | 1,048,338 | |
3.85%, 11/01/42 | | | 425 | | | | 386,077 | |
6.55%, 9/15/43 | | | 553 | | | | 720,094 | |
4.67%, 3/15/55 (a) | | | 562 | | | | 550,390 | |
Verizon Global Funding Corp., 7.75%, 12/01/30 | | | 750 | | | | 1,056,424 | |
| | | | | | | | |
| | | | | | | | 13,153,334 | |
Electric Utilities — 5.9% | | | | | | | | |
American Transmission Systems, Inc., 5.25%, 1/15/22 (a) | | | 400 | | | | 459,562 | |
Carolina Power & Light Co., 6.30%, 4/01/38 | | | 750 | | | | 1,053,270 | |
Duke Energy Carolinas LLC: | | | | | | | | |
5.25%, 1/15/18 | | | 450 | | | | 499,129 | |
3.75%, 6/01/45 | | | 420 | | | | 431,611 | |
Duke Energy Corp., 3.35%, 4/01/15 | | | 1,700 | | | | 1,700,000 | |
E.ON International Finance BV, 5.80%, 4/30/18 (a) | | | 1,100 | | | | 1,229,789 | |
Entergy Arkansas, Inc., 3.70%, 6/01/24 | | | 825 | | | | 883,238 | |
Eversource Energy, 1.60%, 1/15/18 | | | 125 | | | | 125,257 | |
Florida Power & Light Co., 5.95%, 2/01/38 | | | 800 | | | | 1,088,035 | |
Great Plains Energy, Inc., 5.29%, 6/15/22 (b)(e) | | | 745 | | | | 855,247 | |
Jersey Central Power & Light Co., 5.65%, 6/01/17 | | | 1,710 | | | | 1,853,746 | |
Kentucky Utilities Co., 5.13%, 11/01/40 | | | 375 | | | | 467,995 | |
MidAmerican Energy Holdings Co.: | | | | | | | | |
5.30%, 3/15/18 | | | 2,170 | | | | 2,410,534 | |
5.75%, 4/01/18 | | | 1,475 | | | | 1,656,894 | |
Mississippi Power Co., 4.25%, 3/15/42 | | | 400 | | | | 413,817 | |
Northern States Power Co., 6.20%, 7/01/37 | | | 725 | | | | 1,010,841 | |
Ohio Power Co., 6.60%, 3/01/33 | | | 675 | | | | 900,047 | |
Oncor Electric Delivery Co. LLC, 5.30%, 6/01/42 | | | 960 | | | | 1,208,554 | |
PacifiCorp, 6.00%, 1/15/39 | | | 450 | | | | 606,763 | |
Progress Energy, Inc.: | | | | | | | | |
4.88%, 12/01/19 | | | 1,075 | | | | 1,205,810 | |
3.15%, 4/01/22 | | | 775 | | | | 798,852 | |
Trans-Allegheny Interstate Line Co., 3.85%, 6/01/25 (a) | | | 445 | | | | 464,814 | |
| | | | | | | | |
| | | | | | | | 21,323,805 | |
Energy Equipment & Services — 0.4% | | | | | | | | |
Ensco PLC: | | | | | | | | |
4.50%, 10/01/24 | | | 80 | | | | 77,540 | |
See Notes to Financial Statements.
| | | | | | |
| | | BLACKROCK ALLOCATION TARGET SHARES | | MARCH 31, 2015 | | 17 |
| | | | |
| Schedule of Investments (continued) | | | Series C Portfolio | |
| | | (Percentages shown are based on Net Assets) | |
| | | | | | | | |
| Corporate Bonds | | Par
(000) | | | Value | |
Energy Equipment & Services (concluded) | | | | | | | | |
5.20%, 3/15/25 | | $ | 225 | | | $ | 225,350 | |
Transocean, Inc.: | | | | | | | | |
5.05%, 12/15/16 | | | 1,095 | | | | 1,105,950 | |
6.38%, 12/15/21 | | | 14 | | | | 11,777 | |
| | | | | | | | |
| | | | | | | | 1,420,617 | |
Food & Staples Retailing — 0.5% | | | | | | | | |
CVS Health Corp., 5.30%, 12/05/43 | | | 425 | | | | 519,198 | |
Wal-Mart Stores, Inc.: | | | | | | | | |
5.25%, 9/01/35 | | | 675 | | | | 834,028 | |
6.50%, 8/15/37 | | | 160 | | | | 223,521 | |
6.20%, 4/15/38 | | | 230 | | | | 313,191 | |
| | | | | | | | |
| | | | | | | | 1,889,938 | |
Food Products — 0.1% | | | | | | | | |
Kraft Foods Group, Inc., 5.00%, 6/04/42 | | | 250 | | | | 276,656 | |
Gas Utilities — 0.3% | | | | | | | | |
Atmos Energy Corp., 8.50%, 3/15/19 | | | 800 | | | | 993,740 | |
Health Care Equipment & Supplies — 2.4% | | | | | | | | |
Becton Dickinson and Co.: | | | | | | | | |
2.68%, 12/15/19 | | | 100 | | | | 102,142 | |
3.73%, 12/15/24 | | | 160 | | | | 167,456 | |
Covidien International Finance SA: | | | | | | | | |
1.35%, 5/29/15 | | | 800 | | | | 801,112 | |
6.00%, 10/15/17 | | | 2,300 | | | | 2,564,988 | |
2.95%, 6/15/23 | | | 525 | | | | 533,036 | |
Medtronic, Inc.: | | | | | | | | |
3.15%, 3/15/22 (a) | | | 960 | | | | 996,829 | |
3.50%, 3/15/25 (a) | | | 1,455 | | | | 1,521,044 | |
4.63%, 3/15/44 | | | 500 | | | | 559,334 | |
4.63%, 3/15/45 (a) | | | 360 | | | | 408,050 | |
Zimmer Holdings, Inc.: | | | | | | | | |
2.00%, 4/01/18 | | | 390 | | | | 393,120 | |
2.70%, 4/01/20 | | | 680 | | | | 689,483 | |
| | | | | | | | |
| | | | | | | | 8,736,594 | |
Health Care Providers & Services — 1.2% | | | | | | | | |
Aetna, Inc.: | | | | | | | | |
3.50%, 11/15/24 | | | 395 | | | | 412,022 | |
4.50%, 5/15/42 | | | 135 | | | | 149,805 | |
Coventry Health Care, Inc., 5.45%, 6/15/21 | | | 850 | | | | 990,598 | |
UnitedHealth Group, Inc.: | | | | | | | | |
4.63%, 11/15/41 | | | 645 | | | | 728,178 | |
4.25%, 3/15/43 | | | 530 | | | | 573,414 | |
Anthem, Inc., 4.35%, 8/15/20 | | | 1,275 | | | | 1,407,381 | |
| | | | | | | | |
| | | | | | | | 4,261,398 | |
Independent Power and Renewable Electricity Producers — 0.3% | | | | | |
IPALCO Enterprises, Inc., 5.00%, 5/01/18 | | | 925 | | | | 980,500 | |
Industrial Conglomerates — 0.7% | | | | | | | | |
Eaton Corp., 4.15%, 11/02/42 | | | 900 | | | | 927,235 | |
Hutchison Whampoa International Ltd., 4.63%, 9/11/15 (a) | | | 1,000 | | | | 1,016,763 | |
Tyco Electronics Group SA, 3.50%, 2/03/22 | | | 600 | | | | 625,942 | |
| | | | | | | | |
| | | | | | | | 2,569,940 | |
Insurance — 4.1% | | | | | | | | |
ACE INA Holdings, Inc., 2.60%, 11/23/15 | | | 625 | | | | 632,281 | |
Allied World Assurance Co. Holdings Ltd., 5.50%, 11/15/20 | | | 825 | | | | 934,586 | |
American International Group, Inc.: | | | | | | | | |
5.85%, 1/16/18 | | | 1,530 | | | | 1,709,221 | |
3.38%, 8/15/20 | | | 1,000 | | | | 1,055,153 | |
6.40%, 12/15/20 | | | 485 | | | | 587,488 | |
4.50%, 7/16/44 | | | 200 | | | | 214,683 | |
Genworth Holdings, Inc., 4.90%, 8/15/23 | | | 313 | | | | 267,615 | |
| | | | | | | | |
| Corporate Bonds | | Par
(000) | | | Value | |
Insurance (concluded) | | | | | | | | |
Manulife Financial Corp., 4.90%, 9/17/20 | | $ | 750 | | | $ | 837,887 | |
Massachusetts Mutual Life Insurance Co., 8.88%, 6/01/39 (a) | | | 575 | | | | 943,341 | |
MetLife Institutional Funding II, 1.63%, 4/02/15 (a) | | | 6,000 | | | | 6,000,000 | |
MetLife, Inc., 4.72%, 12/15/44 | | | 215 | | | | 243,969 | |
Teachers Insurance & Annuity Association of America, 6.85%, 12/16/39 (a) | | | 1,050 | | | | 1,463,199 | |
| | | | | | | | |
| | | | | | | | 14,889,423 | |
Internet Software & Services — 0.3% | | | | | | | | |
Alibaba Group Holding Ltd., 1.63%, 11/28/17 (a) | | | 975 | | | | 977,572 | |
IT Services — 0.2% | | | | | | | | |
Fidelity National Information Services, Inc., 3.50%, 4/15/23 | | | 625 | | | | 627,162 | |
Life Sciences Tools & Services — 0.6% | | | | | | | | |
Life Technologies Corp.: | | | | | | | | |
3.50%, 1/15/16 | | | 1,295 | | | | 1,320,464 | |
6.00%, 3/01/20 | | | 820 | | | | 947,012 | |
| | | | | | | | |
| | | | | | | | 2,267,476 | |
Machinery — 0.3% | | | | | | | | |
AGCO Corp., 5.88%, 12/01/21 | | | 350 | | | | 397,521 | |
John Deere Capital Corp., 1.35%, 1/16/18 | | | 790 | | | | 793,143 | |
| | | | | | | | |
| | | | | | | | 1,190,664 | |
Media — 3.0% | | | | | | | | |
21st Century Fox America, Inc., 6.40%, 12/15/35 | | | 781 | | | | 1,027,487 | |
Comcast Corp.: | | | | | | | | |
4.25%, 1/15/33 | | | 650 | | | | 697,259 | |
6.50%, 11/15/35 | | | 550 | | | | 747,569 | |
6.55%, 7/01/39 | | | 500 | | | | 683,365 | |
4.50%, 1/15/43 | | | 225 | | | | 247,021 | |
COX Communications, Inc., 8.38%, 3/01/39 (a) | | | 466 | | | | 659,841 | |
DIRECTV Holdings LLC/DIRECTV Financing Co., Inc.: | | | | | | | | |
5.20%, 3/15/20 | | | 800 | | | | 902,918 | |
3.80%, 3/15/22 | | | 1,110 | | | | 1,150,501 | |
5.15%, 3/15/42 | | | 325 | | | | 339,648 | |
Grupo Televisa SAB, 6.63%, 1/15/40 | | | 900 | | | | 1,109,865 | |
Sky PLC: | | | | | | | | |
2.63%, 9/16/19 (a) | | | 200 | | | | 203,105 | |
3.75%, 9/16/24 (a) | | | 510 | | | | 527,261 | |
Time Warner Cable, Inc.: | | | | | | | | |
8.25%, 4/01/19 | | | 695 | | | | 850,082 | |
6.55%, 5/01/37 | | | 625 | | | | 784,904 | |
Time Warner, Inc., 6.25%, 3/29/41 | | | 682 | | | | 880,170 | |
| | | | | | | | |
| | | | | | | | 10,810,996 | |
Metals & Mining — 1.5% | | | | | | | | |
Alcoa, Inc., 5.13%, 10/01/24 | | | 535 | | | | 572,617 | |
Barrick Gold Corp.: | | | | | | | | |
3.85%, 4/01/22 | | | 377 | | | | 368,651 | |
4.10%, 5/01/23 | | | 471 | | | | 464,647 | |
Corp Nacional del Cobre de Chile, 4.88%, 11/04/44 (a) | | | 353 | | | | 368,848 | |
Freeport-McMoRan, Inc.: | | | | | | | | |
3.10%, 3/15/20 | | | 88 | | | | 85,744 | |
3.55%, 3/01/22 | | | 1,530 | | | | 1,416,212 | |
5.40%, 11/14/34 | | | 888 | | | | 811,885 | |
Rio Tinto Finance USA Ltd., 7.13%, 7/15/28 | | | 550 | | | | 735,857 | |
Rio Tinto Finance USA PLC: | | | | | | | | |
4.75%, 3/22/42 | | | 55 | | | | 59,034 | |
4.13%, 8/21/42 | | | 183 | | | | 180,235 | |
See Notes to Financial Statements.
| | | | | | |
| 18 | | BLACKROCK ALLOCATION TARGET SHARES | | MARCH 31, 2015 | | |
| | | | |
| Schedule of Investments (continued) | | | Series C Portfolio | |
| | | (Percentages shown are based on Net Assets) | |
| | | | | | | | |
| Corporate Bonds | | Par
(000) | | | Value | |
Metals & Mining (concluded) | | | | | | | | |
Southern Copper Corp., 6.75%, 4/16/40 | | $ | 300 | | | $ | 319,830 | |
| | | | | | | | |
| | | | | | | | 5,383,560 | |
Multiline Retail — 0.2% | | | | | | | | |
Target Corp., 4.00%, 7/01/42 | | | 675 | | | | 715,127 | |
Multi-Utilities — 2.3% | | | | | | | | |
Berkshire Hathaway Energy Co., 4.50%, 2/01/45 | | | 900 | | | | 979,771 | |
CenterPoint Energy, Inc., 6.50%, 5/01/18 | | | 850 | | | | 967,158 | |
CMS Energy Corp., 5.05%, 3/15/22 | | | 1,644 | | | | 1,880,396 | |
Dominion Gas Holdings LLC, 2.50%, 12/15/19 | | | 845 | | | | 861,314 | |
NiSource Finance Corp., 5.25%, 2/15/43 | | | 440 | | | | 523,682 | |
Pacific Gas & Electric Co.: | | | | | | | | |
3.85%, 11/15/23 | | | 575 | | | | 613,912 | |
3.40%, 8/15/24 | | | 880 | | | | 917,340 | |
4.30%, 3/15/45 | | | 220 | | | | 236,750 | |
Virginia Electric & Power Co., 6.00%, 1/15/36 | | | 900 | | | | 1,192,190 | |
| | | | | | | | |
| | | | | | | | 8,172,513 | |
Oil, Gas & Consumable Fuels — 9.1% | | | | | | | | |
Anadarko Petroleum Corp., 6.38%, 9/15/17 | | | 1,545 | | | | 1,719,015 | |
Canadian Natural Resources Ltd.: | | | | | | | | |
1.75%, 1/15/18 | | | 495 | | | | 492,548 | |
5.90%, 2/01/18 | | | 1,700 | | | | 1,876,200 | |
Chevron Corp., 2.19%, 11/15/19 | | | 255 | | | | 260,321 | |
ConocoPhillips Co.: | | | | | | | | |
3.35%, 11/15/24 | | | 370 | | | | 381,286 | |
4.30%, 11/15/44 | | | 385 | | | | 408,634 | |
Continental Resources, Inc.: | | | | | | | | |
7.13%, 4/01/21 | | | 460 | | | | 481,275 | |
5.00%, 9/15/22 | | | 1,300 | | | | 1,282,125 | |
4.50%, 4/15/23 | | | 400 | | | | 388,212 | |
El Paso Natural Gas Co. LLC, 8.63%, 1/15/22 | | | 485 | | | | 605,833 | |
El Paso Pipeline Partners Operating Co. LLC, 6.50%, 4/01/20 | | | 390 | | | | 445,894 | |
Energy Transfer Partners LP: | | | | | | | | |
5.20%, 2/01/22 | | | 1,130 | | | | 1,231,191 | |
6.50%, 2/01/42 | | | 560 | | | | 649,593 | |
Enterprise Products Operating LLC: | | | | | | | | |
3.70%, 6/01/15 | | | 500 | | | | 502,213 | |
6.45%, 9/01/40 | | | 800 | | | | 1,004,454 | |
5.70%, 2/15/42 | | | 490 | | | | 586,417 | |
Exxon Mobil Corp.: | | | | | | | | |
2.40%, 3/06/22 | | | 900 | | | | 907,077 | |
2.71%, 3/06/25 | | | 725 | | | | 732,388 | |
Freeport-McMoRan Oil & Gas LLC/FCX Oil & Gas, Inc., 6.50%, 11/15/20 | | | 762 | | | | 808,673 | |
Kerr-McGee Corp., 7.88%, 9/15/31 | | | 450 | | | | 613,079 | |
Kinder Morgan Energy Partners LP: | | | | | | | | |
6.00%, 2/01/17 | | | 1,325 | | | | 1,423,822 | |
7.30%, 8/15/33 | | | 1,400 | | | | 1,690,958 | |
5.00%, 3/01/43 | | | 190 | | | | 185,567 | |
Kinder Morgan, Inc.: | | | | | | | | |
2.00%, 12/01/17 | | | 80 | | | | 79,875 | |
3.05%, 12/01/19 | | | 1,255 | | | | 1,267,455 | |
6.50%, 9/15/20 | | | 925 | | | | 1,070,835 | |
Marathon Petroleum Corp., 4.75%, 9/15/44 | | | 631 | | | | 642,144 | |
Noble Energy, Inc., 5.25%, 11/15/43 | | | 425 | | | | 444,153 | |
Phillips 66, 4.88%, 11/15/44 | | | 828 | | | | 886,727 | |
Pioneer Natural Resources Co., 6.88%, 5/01/18 | | | 880 | | | | 997,292 | |
Plains All American Pipeline LP/PAA Finance Corp.: | | | | | | | | |
2.60%, 12/15/19 | | | 900 | | | | 904,239 | |
| | | | | | | | |
| Corporate Bonds | | Par (000) | | | Value | |
Oil, Gas & Consumable Fuels (concluded) | | | | | | | | |
4.90%, 2/15/45 | | $ | 700 | | | $ | 736,020 | |
Schlumberger Norge AS, 4.20%, 1/15/21 (a) | | | 975 | | | | 1,072,114 | |
Texas Eastern Transmission LP, 2.80%, 10/15/22 (a) | | | 1,400 | | | | 1,346,507 | |
TransCanada PipeLines Ltd., 6.10%, 6/01/40 | | | 500 | | | | 620,715 | |
Western Gas Partners LP, 5.38%, 6/01/21 | | | 1,025 | | | | 1,132,656 | |
The Williams Cos., Inc.: | | | | | | | | |
3.70%, 1/15/23 | | | 1,200 | | | | 1,109,281 | |
4.55%, 6/24/24 | | | 220 | | | | 213,073 | |
8.75%, 3/15/32 | | | 155 | | | | 185,500 | |
Williams Partners LP: | | | | | | | | |
4.50%, 11/15/23 | | | 1,300 | | | | 1,347,931 | |
6.30%, 4/15/40 | | | 225 | | | | 247,566 | |
| | | | | | | | |
| | | | | | | | 32,980,858 | |
Pharmaceuticals — 4.6% | | | | | | | | |
AbbVie, Inc.: | | | | | | | | |
1.75%, 11/06/17 | | | 2,220 | | | | 2,227,874 | |
4.40%, 11/06/42 | | | 795 | | | | 818,386 | |
Actavis Funding SCS: | | | | | | | | |
3.45%, 3/15/22 | | | 1,780 | | | | 1,823,213 | |
3.85%, 6/15/24 | | | 2,450 | | | | 2,530,700 | |
3.80%, 3/15/25 | | | 480 | | | | 495,374 | |
4.55%, 3/15/35 | | | 525 | | | | 547,217 | |
4.85%, 6/15/44 | | | 425 | | | | 451,416 | |
Allergan, Inc., 5.75%, 4/01/16 | | | 550 | | | | 575,696 | |
EMD Finance LLC, 1.70%, 3/19/18 (a) | | | 1,800 | | | | 1,809,639 | |
Hospira, Inc., 5.20%, 8/12/20 | | | 900 | | | | 1,026,530 | |
Merck & Co., Inc.: | | | | | | | | |
2.35%, 2/10/22 | | | 310 | | | | 310,273 | |
3.70%, 2/10/45 | | | 175 | | | | 175,828 | |
Mylan, Inc., 2.60%, 6/24/18 | | | 968 | | | | 988,461 | |
Pfizer, Inc., 3.00%, 6/15/23 | | | 325 | | | | 332,856 | |
Roche Holdings, Inc.: | | | | | | | | |
6.00%, 3/01/19 (a) | | | 498 | | | | 576,614 | |
4.00%, 11/28/44 (a) | | | 400 | | | | 431,873 | |
Teva Pharmaceutical Finance Co. LLC, 6.15%, 2/01/36 | | | 10 | | | | 12,707 | |
Teva Pharmaceutical Finance IV BV, 3.65%, 11/10/21 | | | 514 | | | | 541,343 | |
Wyeth LLC, 5.95%, 4/01/37 | | | 800 | | | | 1,024,206 | |
| | | | | | | | |
| | | | | | | | 16,700,206 | |
Professional Services — 0.5% | | | | | | | | |
The Dun & Bradstreet Corp., 3.25%, 12/01/17 | | | 1,300 | | | | 1,329,588 | |
Experian Finance PLC, 2.38%, 6/15/17 (a) | | | 600 | | | | 605,593 | |
| | | | | | | | |
| | | | | | | | 1,935,181 | |
Real Estate Investment Trusts (REITs) — 2.0% | | | | | | | | |
American Tower Corp.: | | | | | | | | |
4.70%, 3/15/22 | | | 1,325 | | | | 1,421,009 | |
3.50%, 1/31/23 | | | 525 | | | | 520,400 | |
5.00%, 2/15/24 | | | 568 | | | | 621,105 | |
AvalonBay Communities, Inc., 4.20%, 12/15/23 | | | 1,000 | | | | 1,075,818 | |
DDR Corp., 4.75%, 4/15/18 | | | 280 | | | | 301,433 | |
HCP, Inc., 3.75%, 2/01/16 | | | 525 | | | | 536,920 | |
Host Hotels & Resorts LP, 6.00%, 10/01/21 | | | 725 | | | | 839,196 | |
Simon Property Group LP: | | | | | | | | |
1.50%, 2/01/18 (a) | | | 725 | | | | 726,390 | |
10.35%, 4/01/19 | | | 280 | | | | 362,936 | |
4.25%, 10/01/44 | | | 225 | | | | 235,856 | |
See Notes to Financial Statements.
| | | | | | |
| | | BLACKROCK ALLOCATION TARGET SHARES | | MARCH 31, 2015 | | 19 |
| | | | |
| Schedule of Investments (continued) | | | Series C Portfolio | |
| | | (Percentages shown are based on Net Assets) | |
| | | | | | | | |
| Corporate Bonds | | Par (000) | | | Value | |
Real Estate Investment Trusts (REITs) (concluded) | | | | | | | | |
WEA Finance LLC/Westfield UK & Europe Finance PLC, 3.75%, 9/17/24 (a) | | $ | 650 | | | $ | 672,307 | |
| | | | | | | | |
| | | | | | | | 7,313,370 | |
Road & Rail — 1.9% | | | | | | | | |
Burlington Northern Santa Fe LLC: | | | | | | | | |
3.40%, 9/01/24 | | | 1,275 | | | | 1,330,710 | |
5.75%, 5/01/40 | | | 500 | | | | 624,971 | |
4.15%, 4/01/45 | | | 90 | | | | 93,622 | |
Canadian National Railway Co.: | | | | | | | | |
2.95%, 11/21/24 | | | 755 | | | | 775,007 | |
6.25%, 8/01/34 | | | 1,100 | | | | 1,484,983 | |
Canadian Pacific Railway Co., 7.25%, 5/15/19 | | | 500 | | | | 600,329 | |
Kansas City Southern de Mexico SA de CV, 2.35%, 5/15/20 | | | 370 | | | | 364,443 | |
Penske Truck Leasing Co. LP/PTL Finance Corp., 3.13%, 5/11/15 (a) | | | 1,500 | | | | 1,503,171 | |
| | | | | | | | |
| | | | | | | | 6,777,236 | |
Software — 0.6% | | | | | | | | |
Autodesk, Inc., 1.95%, 12/15/17 | | | 550 | | | | 550,438 | |
Oracle Corp.: | | | | | | | | |
2.80%, 7/08/21 | | | 820 | | | | 849,343 | |
3.63%, 7/15/23 | | | 800 | | | | 860,107 | |
| | | | | | | | |
| | | | | | | | 2,259,888 | |
Specialty Retail — 0.6% | | | | | | | | |
The Home Depot, Inc., 4.40%, 3/15/45 | | | 215 | | | | 240,055 | |
QVC, Inc.: | | | | | | | | |
7.38%, 10/15/20 (a) | | | 310 | | | | 321,625 | |
4.38%, 3/15/23 | | | 1,700 | | | | 1,732,047 | |
| | | | | | | | |
| | | | | | | | 2,293,727 | |
Tobacco — 1.5% | | | | | | | | |
Altria Group, Inc., 5.38%, 1/31/44 | | | 725 | | | | 847,899 | |
BAT International Finance PLC, 1.40%, 6/05/15 (a) | | | 1,200 | | | | 1,201,385 | |
Imperial Tobacco Finance PLC, 2.05%, 2/11/18 (a) | | | 950 | | | | 955,422 | |
Lorillard Tobacco Co., 7.00%, 8/04/41 | | | 350 | | | | 453,773 | |
Philip Morris International, Inc.: | | | | | | | | |
3.88%, 8/21/42 | | | 700 | | | | 689,126 | |
4.25%, 11/10/44 | | | 975 | | | | 1,022,541 | |
Reynolds American, Inc.: | | | | | | | | |
3.25%, 11/01/22 | | | 180 | | | | 179,109 | |
4.85%, 9/15/23 | | | 220 | | | | 243,078 | |
| | | | | | | | |
| | | | | | | | 5,592,333 | |
Wireless Telecommunication Services — 1.8% | | | | | | | | |
Alltel Corp., 7.88%, 7/01/32 | | | 470 | | | | 671,693 | |
America Movil SAB de CV, 2.38%, 9/08/16 | | | 3,140 | | | | 3,191,465 | |
CC Holdings GS V LLC/Crown Castle GS III Corp., 2.38%, 12/15/17 | | | 300 | | | | 302,512 | |
Crown Castle Towers LLC, 6.11%, 1/15/40 (a) | | | 1,450 | | | | 1,654,131 | |
Orange SA, 5.50%, 2/06/44 | | | 350 | | | | 415,535 | |
Vodafone Group PLC, 4.38%, 2/19/43 | | | 272 | | | | 267,538 | |
| | | | | | | | |
| | | | | | | | 6,502,874 | |
Total Corporate Bonds — 79.3% | | | | | | | 286,351,022 | |
| | | | | | | | |
| Foreign Agency Obligations | | Par (000) | | | Value | |
CDP Financial, Inc., 3.15%, 7/24/24 (a) | | $ | 975 | | | $ | 1,011,725 | |
CNOOC Finance 2013 Ltd., 3.00%, 5/09/23 | | | 800 | | | | 781,438 | |
Export-Import Bank of Korea, 1.00%, 1/14/17 (c) | | | 1,307 | | | | 1,313,196 | |
Nakilat, Inc., 6.07%, 12/31/33 (a) | | | 25 | | | | 29,094 | |
Petrobras Global Finance BV: | | | | | | | | |
3.88%, 1/27/16 | | | 700 | | | | 686,616 | |
5.88%, 3/01/18 | | | 1,874 | | | | 1,794,355 | |
Petroleos Mexicanos: | | | | | | | | |
3.50%, 7/18/18 | | | 1,700 | | | | 1,768,000 | |
3.50%, 1/30/23 | | | 650 | | | | 634,725 | |
6.38%, 1/23/45 | | | 475 | | | | 531,050 | |
Total Foreign Agency Obligations — 2.4% | | | | | | | 8,550,199 | |
| | | | | | | | |
| Foreign Government Obligations | | | | | | |
Brazil — 0.3% | | | | | | | | |
Federative Republic of Brazil, 5.00%, 1/27/45 | | | 1,350 | | | | 1,248,750 | |
Canada — 0.1% | | | | | | | | |
Province of Manitoba, 3.05%, 5/14/24 | | | 469 | | | | 497,300 | |
Colombia — 0.6% | | | | | | | | |
Republic of Colombia: | | | | | | | | |
2.63%, 3/15/23 | | | 1,200 | | | | 1,128,000 | |
4.00%, 2/26/24 | | | 200 | | | | 206,200 | |
5.63%, 2/26/44 | | | 813 | | | | 908,527 | |
| | | | | | | | |
| | | | | | | | 2,242,727 | |
Indonesia — 0.4% | | | | | | | | |
Republic of Indonesia, 4.13%, 1/15/25 | | | 1,250 | | | | 1,282,813 | |
Mexico — 1.2% | | | | | | | | |
United Mexican States: | | | | | | | | |
4.75%, 3/08/44 | | | 2,525 | | | | 2,651,250 | |
5.55%, 1/21/45 | | | 1,350 | | | | 1,582,875 | |
| | | | | | | | |
| | | | | | | | 4,234,125 | |
Peru — 0.1% | | | | | | | | |
Republic of Peru, 5.63%, 11/18/50 | | | 290 | | | | 354,525 | |
Philippines — 0.1% | | | | | | | | |
Republic of Philippine, 4.20%, 1/21/24 | | | 203 | | | | 227,360 | |
Uruguay — 0.1% | | | | | | | | |
Republic of Uruguay, 5.10%, 6/18/50 | | | 375 | | | | 390,000 | |
Total Foreign Government Obligations — 2.9% | | | | | | | 10,477,600 | |
| | | | | | | | |
| Preferred Securities | | | | | | |
Capital Trusts | | | | | | | | |
Banks — 1.4% | | | | | | | | |
HSBC Holdings PLC, 6.38% (c)(f) | | | 580 | | | | 594,500 | |
JPMorgan Chase & Co.: | | | | | | | | |
6.00% (c)(f) | | | 975 | | | | 987,187 | |
7.90% (c)(f) | | | 1,850 | | | | 1,991,063 | |
Wachovia Capital Trust III, 5.57% (c)(f) | | | 225 | | | | 222,165 | |
Wells Fargo & Co., 5.90% (c)(f) | | | 1,100 | | | | 1,145,375 | |
| | | | | | | | |
| | | | | | | | 4,940,290 | |
Capital Markets — 0.3% | | | | | | | | |
State Street Capital Trust IV, 1.24%, 6/01/77 (c) | | | 1,075 | | | | 908,375 | |
See Notes to Financial Statements.
| | | | | | |
| 20 | | BLACKROCK ALLOCATION TARGET SHARES | | MARCH 31, 2015 | | |
| | | | |
| Schedule of Investments (continued) | | | Series C Portfolio | |
| | | (Percentages shown are based on Net Assets) | |
| | | | | | | | |
| Preferred Securities | | Par (000) | | | Value | |
Capital Trusts (concluded) | | | | | | | | |
Diversified Financial Services | | | | | | | | |
General Electric Capital Corp., 5.25% (c)(f) | | $ | 300 | | | $ | 308,250 | |
ZFS Finance USA Trust V, 6.50%, 5/09/67 (a)(c) | | | 500 | | | | 526,250 | |
| | | | | | | | |
| | | | | | | | 834,500 | |
Insurance — 1.0% | | | | | | | | |
The Allstate Corp.: | | | | | | | | |
5.75%, 8/15/53 (c) | | | 835 | | | | 909,106 | |
6.50%, 5/15/67 (c) | | | 240 | | | | 277,800 | |
American International Group, Inc., 8.18%, 5/15/68 (c) | | | 760 | | | | 1,077,718 | |
MetLife Capital Trust IV, 7.88%, 12/15/67 (a) | | | 420 | | | | 556,500 | |
New York Life Insurance Co., 6.75%, 11/15/39 (a) | | | 600 | | | | 859,422 | |
| | | | | | | | |
| | | | | | | | 3,680,546 | |
Oil, Gas & Consumable Fuels — 0.3% | | | | | | | | |
Enterprise Products Operating LLC, 7.03%, 1/15/68 (c) | | | 1,090 | | | | 1,178,425 | |
Total Capital Trusts — 3.2% | | | | | | | 11,542,136 | |
| | | | | | | | |
| Preferred Stocks | | Shares | | | | |
Media — 0.6% | | | | | | | | |
NBCUniversal Enterprise, Inc., 5.25% (a)(f) | | | 2,200,000 | | | | 2,332,440 | |
Total Preferred Securities — 3.8% | | | | | | | 13,874,576 | |
| | | | | | | | |
| Taxable Municipal Bonds | | Par (000) | | | | |
Chicago O’Hare International Airport RB, 6.40%, 1/01/40 | | $ | 1,000 | | | | 1,359,980 | |
Los Angeles Department of Water & Power RB, 6.57%, 7/01/45 | | | 1,075 | | | | 1,575,585 | |
Metropolitan Transportation Authority, New York RB, 7.34%, 11/15/39 | | | 1,125 | | | | 1,751,063 | |
Municipal Electric Authority of Georgia RB, 6.64%, 4/01/57 | | | 1,200 | | | | 1,569,912 | |
Port Authority of New York & New Jersey RB, 4.46%, 10/01/62 | | | 1,300 | | | | 1,420,575 | |
State of California GO: | | | | | | | | |
7.30%, 10/01/39 | | | 510 | | | | 760,175 | |
7.63%, 3/01/40 | | | 150 | | | | 233,397 | |
7.60%, 11/01/40 | | | 430 | | | | 689,948 | |
Total Taxable Municipal Bonds — 2.6% | | | | | | | 9,360,635 | |
| | | | | | | | |
| U.S. Government Sponsored Agency Securities | | Par (000) | | | Value | |
Agency Obligations — 0.2% | | | | | | | | |
Fannie Mae, 0.00%, 10/09/19 (d) | | $ | 815 | | | $ | 748,915 | |
| | | | | | | | |
U.S. Treasury Obligations | | | | | | | | |
U.S. Treasury Bonds: | | | | | | | | |
3.38%, 5/15/44 | | | 4,020 | | | | 4,709,366 | |
3.00%, 11/15/44 | | | 1,725 | | | | 1,890,088 | |
2.50%, 2/15/45 | | | 550 | | | | 544,929 | |
U.S. Treasury Notes: | | | | | | | | |
1.25%, 1/31/20 | | | 175 | | | | 174,098 | |
2.38%, 8/15/24 | | | 525 | | | | 545,754 | |
2.25%, 11/15/24 | | | 3,720 | | | | 3,824,335 | |
Total U.S. Treasury Obligations — 3.2% | | | | | | | 11,688,570 | |
Total Long-Term Investments (Cost — $319,806,448) — 94.4% | | | | | | | 341,051,517 | |
| | | | | | | | |
| Short-Term Securities | | Shares | | | | |
Dreyfus Treasury Prime, 0.00% (g) | | | 17,985,247 | | | | 17,985,247 | |
Total Short-Term Securities (Cost — $17,985,247) — 5.0% | | | | | | | 17,985,247 | |
| | | | | | | | |
| Options Purchased | | | | | | |
(Cost — $1,769,893) — 0.1% | | | | | | | 425,322 | |
Total Investments Before Options Written (Cost — $339,561,588) — 99.5% | | | | | | | 359,462,086 | |
| | | | | | | | |
| Options Written | | | | | | |
(Premiums Received — $1,577,229) — (0.1)% | | | | | | | (390,952 | ) |
Total Investments Net of Options Written — 99.4% | | | | 359,071,134 | |
Other Assets Less Liabilities — 0.6% | | | | | | | 2,011,399 | |
| | | | | | | | |
Net Assets — 100.0% | | | | | | $ | 361,082,533 | |
| | | | | | | | |
|
| Notes to Schedule of Investments |
| (a) | Security exempt from registration pursuant to Rule 144A under the Securities Act of 1933, as amended. These securities may be resold in transactions exempt from registration to qualified institutional investors. |
| (b) | Represents a step-up bond that pays an initial coupon rate for the first period and then a higher coupon rate for the following periods. Rate shown is as of report date. |
| (c) | Variable rate security. Rate shown is as of report date. |
| (e) | Represents a step-down bond that pays an initial coupon rate for the first period and then a lower coupon rate for the following periods. Rate shown is as of report date. |
| (f) | Security is perpetual in nature and has no stated maturity date. |
| (g) | Represents the current yield as of report date. |
See Notes to Financial Statements.
| | | | | | |
| | | BLACKROCK ALLOCATION TARGET SHARES | | MARCH 31, 2015 | | 21 |
| | | | |
| Schedule of Investments (continued) | | | Series C Portfolio | |
| • | | For Fund compliance purposes, the Fund’s industry classifications refer to any one or more of the industry sub-classifications used by one or more widely recognized market indexes or ratings group indexes, and/or as defined by the investment advisor. These definitions may not apply for purposes of this report, which may combine such industry sub-classifications for reporting ease. |
| • | | As of March 31, 2015, financial futures contracts outstanding were as follows: |
| | | | | | | | | | | | | | | | | | |
Contracts
Long/
(Short) | | | Issue | | Exchange | | Expiration | | | Notional
Value | | | Unrealized
Appreciation
(Depreciation) | |
| | 26 | | | U.S. Treasury Notes (2 Year) | | Chicago Board of Trade | | | June 2015 | | | $ | 5,698,063 | | | $ | 13,938 | |
| | 349 | | | U.S. Treasury Notes (5 Year) | | Chicago Board of Trade | | | June 2015 | | | $ | 41,953,617 | | | | 315,247 | |
| | 71 | | | U.S. Treasury Notes (10 Year) | | Chicago Board of Trade | | | June 2015 | | | $ | 9,152,344 | | | | 34,088 | |
| | 89 | | | U.S. Ultra Treasury Bonds | | Chicago Board of Trade | | | June 2015 | | | $ | 15,118,875 | | | | 150,191 | |
| | (71 | ) | | U.S. Treasury Bonds (20 Year) | | Chicago Board of Trade | | | June 2015 | | | $ | 11,635,125 | | | | (119,076 | ) |
| | (150 | ) | | Euro Dollar Futures | | Chicago Mercantile | | | March 2016 | | | $ | 37,185,000 | | | | (82,746 | ) |
| | (135 | ) | | Euro Dollar Futures | | Chicago Mercantile | | | December 2016 | | | $ | 33,275,813 | | | | (127,595 | ) |
| | Total | | | | | | | | | | | | | | | $ | 184,047 | |
| | | | | | | | | | | | | | | | | | |
| • | | As of March 31, 2015, exchange-traded options purchased were as follows: |
| | | | | | | | | | | | | | | | | | | | |
| Description | | Put/
Call | | | Strike
Price | | | Expiration
Date | | | Contracts | | | Value | |
Euro Dollar 1-Year Mid-Curve | | | Put | | | $ | 98.50 | | | | 6/12/15 | | | | 319 | | | $ | 9,969 | |
Euro Dollar 90-Day | | | Put | | | $ | 99.00 | | | | 12/14/15 | | | | 158 | | | | 17,775 | |
Euro Dollar 90-Day | | | Put | | | $ | 98.00 | | | | 12/14/15 | | | | 158 | | | | 987 | |
Total | | | | | | | | | | | | | | | | | | $ | 28,731 | |
| | | | | | | | | | | | | | | | | | | | |
| • | | As of March 31, 2015, exchange-traded options written were as follows: |
| | | | | | | | | | | | | | | | | | | | |
| Description | | Put/ Call | | | Strike Price | | | Expiration Date | | | Contracts | | | Value | |
Euro Dollar 90-Day | | | Put | | | $ | 98.50 | | | | 12/14/15 | | | | 316 | | | $ | (7,900 | ) |
| • | | As of March 31, 2015, OTC interest rate swaptions purchased were as follows: |
| | | | | | | | | | | | | | | | | | | | |
| Description | | Counterparty | | Put/ Call | | Exercise Rate | | Pay/Receive Exercise Rate | | Floating Rate Index | | Expiration Date | | Notional Amount (000) | | | Value | |
30-Year Interest Rate Swap | | Deutsche Bank AG | | Put | | 3.05% | | Pay | | 3-month LIBOR | | 1/08/16 | | $ | 4,440 | | | $ | 102,142 | |
5-Year Interest Rate Swap | | JPMorgan Chase Bank N.A. | | Put | | 4.50% | | Pay | | 3-month LIBOR | | 8/07/18 | | $ | 41,400 | | | | 294,449 | |
Total | | | | | | | | | | | | | | | | | | $ | 396,591 | |
| | | | | | | | | | | | | | | | | | | | |
| • | | As of March 31, 2015, OTC interest rate swaptions written were as follows: |
| | | | | | | | | | | | | | | | | | | | |
| Description | | Counterparty | | Put/ Call | | Exercise Rate | | Pay/Receive Exercise Rate | | Floating Rate Index | | Expiration Date | | Notional Amount (000) | | | Value | |
10-Year Interest Rate Swap | | Citibank N.A. | | Call | | 1.90% | | Pay | | 3-month LIBOR | | 3/02/17 | | $ | 3,400 | | | $ | (80,946 | ) |
10-Year Interest Rate Swap | | Citibank N.A. | | Put | | 2.90% | | Receive | | 3-month LIBOR | | 3/02/17 | | $ | 3,400 | | | | (92,183 | ) |
5-Year Interest Rate Swap | | JPMorgan Chase Bank N.A. | | Put | | 6.00% | | Receive | | 3-month LIBOR | | 8/07/18 | | $ | 82,800 | | | | (209,923 | ) |
Total | | | | | | | | | | | | | | | | | | $ | (383,052 | ) |
| | | | | | | | | | | | | | | | | | | | |
See Notes to Financial Statements.
| | | | | | |
| 22 | | BLACKROCK ALLOCATION TARGET SHARES | | MARCH 31, 2015 | | |
| | | | |
| Schedule of Investments (continued) | | | Series C Portfolio | |
| • | | As of March 31, 2015, centrally cleared interest rate swaps outstanding were as follows: |
| | | | | | | | | | | | | | | | | | |
Fixed Rate | | Floating Rate | | | Clearinghouse | | | Expiration Date | | Notional Amount (000) | | | Unrealized
Appreciation
(Depreciation) | |
1.82%1 | | | 3-month LIBOR | | | | Chicago Mercantile | | | 12/09/19 | | $ | 8,000 | | | $ | (169,183 | ) |
3.03%1 | | | 3-month LIBOR | | | | Chicago Mercantile | | | 2/15/40 | | $ | 913 | | | | (122,452 | ) |
3.05%1 | | | 3-month LIBOR | | | | Chicago Mercantile | | | 2/15/40 | | $ | 913 | | | | (124,440 | ) |
3.05%1 | | | 3-month LIBOR | | | | Chicago Mercantile | | | 2/15/40 | | $ | 913 | | | | (124,906 | ) |
3.06%1 | | | 3-month LIBOR | | | | Chicago Mercantile | | | 2/15/40 | | $ | 913 | | | | (127,482 | ) |
2.54%2 | | | 3-month LIBOR | | | | Chicago Mercantile | | | 1/12/45 | | $ | 1,800 | | | | 68,254 | |
Total | | | | | | | | | | | | | | | | $ | (600,209 | ) |
| | | | | | | | | | | | | | | | | | |
| | 1 | | Fund pays the fixed rate and receives the floating rate. |
| | 2 | | Fund pays the floating rate and receives the fixed rate. |
| • | | As of March 31, 2015, OTC credit default swaps — buy protection outstanding were as follows: |
| | | | | | | | | | | | | | | | | | | | | | | | |
| Issuer | | Pay Fixed Rate | | | Counterparty | | Expiration Date | | Notional Amount (000) | | | Value | | | Premiums Paid (Received) | | | Unrealized
Depreciation | |
Cigna Corp. | | | 1.00 | % | | Goldman Sachs Bank USA | | 9/20/17 | | $ | 1,200 | | | $ | (27,604 | ) | | $ | (1,360 | ) | | $ | (26,244 | ) |
General Dynamics Corp. | | | 1.00 | % | | Credit Suisse International | | 9/20/17 | | $ | 1,380 | | | | (31,994 | ) | | | (16,920 | ) | | | (15,074 | ) |
Humana, Inc. | | | 1.00 | % | | Goldman Sachs Bank USA | | 9/20/17 | | $ | 1,200 | | | | (24,829 | ) | | | 9,865 | | | | (34,694 | ) |
Lockheed Martin Corp. | | | 1.00 | % | | Credit Suisse International | | 9/20/17 | | $ | 1,380 | | | | (32,690 | ) | | | (5,840 | ) | | | (26,850 | ) |
Northrop Grumman Corp. | | | 1.00 | % | | Credit Suisse International | | 9/20/17 | | $ | 1,165 | | | | (27,564 | ) | | | (13,136 | ) | | | (14,428 | ) |
Raytheon Co. | | | 1.00 | % | | Credit Suisse International | | 9/20/17 | | $ | 1,165 | | | | (27,279 | ) | | | (13,996 | ) | | | (13,283 | ) |
Total | | | | | | | | | | | | | | $ | (171,960 | ) | | $ | (41,387 | ) | | $ | (130,573 | ) |
| | | | | | | | | | | | | | | | |
| • | | As of March 31, 2015, OTC credit default swaps — sold protection outstanding were as follows: |
| | | | | | | | | | | | | | | | | | | | | | | | | | | | |
| Issuer | | Receive Fixed Rate | | | Counterparty | | Expiration
Date | | Credit Rating1 | | | Notional
Amount
(000)2 | | | Value | | | Premiums Paid (Received) | | | Unrealized
Appreciation | |
Anadarko Petroleum Corp. | | | 1.00 | % | | Morgan Stanley Capital Services LLC | | 6/20/17 | | | BBB- | | | $ | 200 | | | $ | 2,586 | | | $ | (4,924 | ) | | $ | 7,510 | |
Comcast Corp. | | | 1.00 | % | | Credit Suisse International | | 9/20/17 | | | A- | | | $ | 1,400 | | | | 31,607 | | | | 2,916 | | | | 28,691 | |
UnitedHealth Group, Inc. | | | 1.00 | % | | Goldman Sachs Bank USA | | 9/20/17 | | | A | | | $ | 1,200 | | | | 27,339 | | | | (1,482 | ) | | | 28,821 | |
Anthem, Inc. | | | 1.00 | % | | Goldman Sachs Bank USA | | 9/20/17 | | | Not Rated | | | $ | 1,200 | | | | 24,990 | | | | (5,701 | ) | | | 30,691 | |
Host Hotels & Resorts LP | | | 1.00 | % | | Credit Suisse International | | 3/20/19 | | | BBB | | | $ | 825 | | | | 11,590 | | | | (4,032 | ) | | | 15,622 | |
Valero Energy Corp. | | | 1.00 | % | | Barclays Bank PLC | | 9/20/19 | | | BBB | | | $ | 14 | | | | 198 | | | | 52 | | | | 146 | |
Valero Energy Corp. | | | 1.00 | % | | Barclays Bank PLC | | 9/20/19 | | | BBB | | | $ | 6 | | | | 78 | | | | 23 | | | | 55 | |
Valero Energy Corp. | | | 1.00 | % | | Barclays Bank PLC | | 9/20/19 | | | BBB | | | $ | 1 | | | | 9 | | | | 3 | | | | 6 | |
Valero Energy Corp. | | | 1.00 | % | | Citibank N.A. | | 9/20/19 | | | BBB | | | $ | 3 | | | | 43 | | | | 23 | | | | 20 | |
Total | | | | | | | | | | | | | | | | | | $ | 98,440 | | | $ | (13,122 | ) | | $ | 111,562 | |
| | | | | | | | | | | | | | | | | | | | |
| | 1 | | Using S&P’s rating of the issuer or the underlying securities of the index, as applicable. |
| | 2 | | The maximum potential amount the Fund may pay should a negative credit event take place as defined under the terms of the agreement. |
| • | | Fair Value Measurements — Various inputs are used in determining the fair value of investments and derivative financial instruments. These inputs to valuation techniques are categorized into a disclosure hierarchy consisting of three broad levels for financial statement purposes. The hierarchy gives the highest priority to unadjusted quoted prices in active markets for identical assets or liabilities (Level 1 measurements) and the lowest priority to unobservable inputs (Level 3 measurements). Accordingly, the degree of judgment exercised in determining fair value is greatest for instruments categorized in Level 3. The inputs used to measure fair value may fall into different levels of the fair value hierarchy. In such cases, for disclosure purposes, the fair value hierarchy classification is determined based on the lowest level input that is significant to the fair value measurement in its entirety. The categorization of a value determined for investments and derivative financial instruments is based on the pricing transparency of the investment and derivative financial instruments and is not necessarily an indication of the risks associated with investing in those securities. The three levels of the fair value hierarchy are as follows: |
| | • | | Level 1 — unadjusted quoted prices in active markets/exchanges for identical assets or liabilities that the Fund has the ability to access |
| | • | | Level 2 — other observable inputs (including, but not limited to, quoted prices for similar assets or liabilities in markets that are active, quoted prices for identical or similar assets or liabilities in markets that are not active, inputs other than quoted prices that are observable for the assets or liabilities (such as interest rates, yield curves, volatilities, prepayment speeds, loss severities, credit risks and default rates) or other market–corroborated inputs) |
| | • | | Level 3 — unobservable inputs based on the best information available in the circumstances, to the extent observable inputs are not available (including the Fund’s own assumptions used in determining the fair value of investments and derivative financial instruments) |
See Notes to Financial Statements.
| | | | | | |
| | | BLACKROCK ALLOCATION TARGET SHARES | | MARCH 31, 2015 | | 23 |
| | | | |
| Schedule of Investments (concluded) | | | Series C Portfolio | |
Changes in valuation techniques may result in transfers into or out of an assigned level within the disclosure hierarchy. In accordance with the Fund’s policy, transfers between different levels of the fair value disclosure hierarchy are deemed to have occurred as of the beginning of the reporting period. For information about the Fund’s policy regarding valuation of investments and derivative financial instruments, refer to Note 2 of the Notes to Financial Statements.
As of March 31, 2015, the following tables summarize the Fund’s investments and derivative financial instruments categorized in the disclosure hierarchy:
| | | | | | | | | | | | | | | | | | | | |
| | | Level 1 | | Level 2 | | Level 3 | | Total |
Assets: | | | | | | | | | | | | | | | | | | | | |
Investments: | | | | | | | | | | | | | | | | | | | | |
Long-Term Investments1 | | | | — | | | | $ | 341,051,517 | | | | | — | | | | $ | 341,051,517 | |
Short-Term Securities | | | $ | 17,985,247 | | | | | — | | | | | — | | | | | 17,985,247 | |
Options Purchased | | | | 28,731 | | | | | 396,591 | | | | | — | | | | | 425,322 | |
| | | | | |
Total | | | $ | 18,013,978 | | | | $ | 341,448,108 | | | | | — | | | | $ | 359,462,086 | |
| | | | | |
1 See above Schedule of Investments for values in each security type. | |
| | | | | | | | | | | | | | | | | | | | |
| | | Level 1 | | Level 2 | | Level 3 | | Total |
Derivative Financial Instruments2 | | | | | | | | | | | | | | | | | | | | |
Assets: | | | | | | | | | | | | | | | | | | | | |
Credit contracts | | | | — | | | | $ | 111,562 | | | | | — | | | | $ | 111,562 | |
Interest rate contracts | | | $ | 513,464 | | | | | 68,254 | | | | | — | | | | | 581,718 | |
Liabilities: | | | | | | | | | | | | | | | | | | | | |
Credit contracts | | | | — | | | | | (130,573 | ) | | | | — | | | | | (130,573 | ) |
Interest rate contracts | | | | (337,317 | ) | | | | (1,051,515 | ) | | | | — | | | | | (1,388,832 | ) |
| | | | | |
Total | | | $ | 176,147 | | | | $ | (1,002,272 | ) | | | | — | | | | $ | (826,125 | ) |
| | | | | |
2 Derivative financial instruments are swaps, financial futures contracts and options written. Swaps and financial futures contracts are valued at the unrealized appreciation/ depreciation on the instrument and options written are shown at value. | |
|
| The Fund may hold assets and/or liabilities in which the fair value approximates the carrying amount for financial statement purposes. As of March 31, 2015, such assets are categorized within the disclosure hierarchy as follows: | |
| | | | | | | | | | | | | | | | | | | | |
| | | Level 1 | | Level 2 | | Level 3 | | Total |
Assets: | | | | | | | | | | | | | | | | | | | | |
Cash | | | $ | 11,334 | | | | | — | | | | | — | | | | $ | 11,334 | |
Cash pledged for centrally cleared swaps | | | | 300,000 | | | | | — | | | | | — | | | | | 300,000 | |
Cash pledged for financial futures contracts | | | | 479,000 | | | | | — | | | | | — | | | | | 479,000 | |
| | | | | |
Total | | | $ | 790,334 | | | | | — | | | | | — | | | | $ | 790,334 | |
| | | | | |
During the year ended March 31, 2015, there were no transfers between levels.
See Notes to Financial Statements.
| | | | | | |
| 24 | | BLACKROCK ALLOCATION TARGET SHARES | | MARCH 31, 2015 | | |
| | | | |
| Schedule of Investments March 31, 2015 | | | Series E Portfolio | |
| | | (Percentages shown are based on Net Assets) | |
| | | | | | | | |
| Municipal Bonds | | Par (000) | | | Value | |
Alabama — 1.1% | | | | | | | | |
County of Jefferson Alabama Sewer, Refunding RB, Sub-Lien, Warrants, Series D, 6.50%, 10/01/53 | | $ | 455 | | | $ | 529,611 | |
Alaska — 1.0% | | | | | | | | |
Northern Tobacco Securitization Corp., Refunding RB, Asset-Backed, Series A, 4.63%, 6/01/23 | | | 500 | | | | 502,275 | |
Arizona — 1.4% | | | | | | | | |
Salt Verde Financial Corp., RB, 5.00%, 12/01/37 | | | 500 | | | | 583,900 | |
The IDA of the City of Phoenix, Refunding RB, Basis School Project, 5.00%, 7/01/45 | | | 100 | | | | 100,871 | |
| | | | | | | | |
| | | | | | | | 684,771 | |
Arkansas — 0.6% | | | | | | | | |
Pulaski County Public Facilities Board, RB, 5.00%, 12/01/42 | | | 250 | | | | 283,150 | |
California — 13.7% | | | | | | | | |
Bay Area Toll Authority, Refunding RB, Series F-1, 5.00%, 4/01/54 | | | 1,000 | | | | 1,128,950 | |
California County Tobacco Securitization Agency, RB, Asset-Backed: | | | | | | | | |
5.45%, 6/01/28 | | | 500 | | | | 490,575 | |
5.60%, 6/01/36 | | | 160 | | | | 147,517 | |
California County Tobacco Securitization Agency, Refunding RB, Asset-Backed: | | | | | | | | |
Merced County Project, 5.00%, 6/01/26 | | | 55 | | | | 55,025 | |
Sonoma County Corp. Project, 5.00%, 6/01/26 | | | 215 | | | | 202,777 | |
Sonoma County Corp. Project, 5.25%, 6/01/45 | | | 135 | | | | 113,165 | |
California Municipal Finance Authority, RB, Sycamore Academy Project, 5.63%, 7/01/44 (a) | | | 150 | | | | 154,399 | |
California School Finance Authority, RB, Alta Public Schools Project, Series A, 6.75%, 11/01/45 (a) | | | 250 | | | | 261,923 | |
California Statewide Communities Development Authority, Refunding RB: | | | | | | | | |
5.00%, 11/15/49 | | | 500 | | | | 565,720 | |
899 Charleston Project, Series A, 5.25%, 11/01/44 | | | 250 | | | | 256,137 | |
Huntington Memorial Hospital, Series B, 5.00%, 7/01/44 | | | 500 | | | | 564,280 | |
California Statewide Financing Authority, RB, Asset-Backed, Series B: | | | | | | | | |
5.63%, 5/01/29 | | | 125 | | | | 125,014 | |
6.00%, 5/01/43 | | | 140 | | | | 140,003 | |
City & County of San Francisco Airports Commission-San Francisco International Airport Refunding RB, AMT, Series A, 5.00%, 5/01/44 | | | 1,000 | | | | 1,111,660 | |
City of Irvine, Community Facilities District No. 2013-3, (Great Park) Improvement Area No. 1, Special Tax Bonds, 5.00%, 9/01/44 | | | 250 | | | | 283,070 | |
City of Roseville, Special Tax Bonds, CFD No. 1,5.00%, 9/01/44 | | | 500 | | | | 507,485 | |
Golden State Tobacco Securitization Corp., Refunding RB, Asset-Backed, Senior, Series A-1, 5.75%, 6/01/47 | | | 645 | | | | 543,780 | |
| | | | | | | | |
| | | | | | | | 6,651,480 | |
Colorado — 4.1% | | | | | | | | |
Colorado Educational & Cultural Facilities Authority, Refunding RB: | | | | | | | | |
| | | | | | | | |
| Municipal Bonds | | Par (000) | | | Value | |
Colorado (concluded) | | | | | | | | |
Charter School-University Project, 5.00%, 12/15/45 (a) | | $ | 500 | | | $ | 504,505 | |
Classical Academy Project, Series A, 5.00%, 12/01/38 | | | 350 | | | | 389,063 | |
Colorado Health Facilities Authority, Refunding RB, Covenant Retirement Communities Project, 5.00%, 12/01/35 | | | 500 | | | | 543,585 | |
Foothills Metropolitan District, Special Assessment Bonds, 6.00%, 12/01/38 | | | 500 | | | | 537,055 | |
| | | | | | | | |
| | | | | | | | 1,974,208 | |
Connecticut — 0.6% | | | | | | | | |
Mohegan Tribal Finance Authority, RB, 7.00%, 2/01/45 | | | 100 | | | | 100,752 | |
Mohegan Tribe of Indians of Connecticut,: | | | | | | | | |
RB, Series A, 6.75%, 2/01/45 (a) | | | 110 | | | | 111,183 | |
Refunding RB, Public Improvement, Priority Distribution, 6.25%, 1/01/31 | | | 100 | | | | 100,033 | |
| | | | | | | | |
| | | | | | | | 311,968 | |
District of Columbia — 0.5% | | | | | | | | |
District of Columbia Tobacco Settlement Financing Corp., Refunding RB, Asset-Backed, 6.50%, 5/15/33 | | | 200 | | | | 251,478 | |
Florida — 6.1% | | | | | | | | |
Alachua County Health Facilities Authority, RB, Shands Teaching Hospital & Clinics Project, 5.00%, 12/01/44 | | | 250 | | | | 279,647 | |
Brevard County Health Facilities Authority, Refunding RB, Health First, Inc. Project, 4.00%, 4/01/36 | | | 890 | | | | 888,745 | |
Capital Trust Agency, Inc., RB, Faulk Senior Services Project, 6.75%, 12/01/49 | | | 250 | | | | 252,245 | |
Celebration Pointe Community Development District, Special Assessment Bonds, 5.13%, 5/01/45 | | | 250 | | | | 255,803 | |
Collier County Health Facilities Authority, Refunding RB, Series A, 4.00%, 5/01/45 | | | 100 | | | | 99,132 | |
Florida Development Finance Corp., RB: | | | | | | | | |
Miami Arts Charter School Project, Series A, 6.00%, 6/15/44 (a) | | | 150 | | | | 153,066 | |
Renaissance Charter School Project, Series A, 6.13%, 6/15/44 | | | 150 | | | | 150,768 | |
Lakewood Ranch Stewardship District, Special Assessment Bonds, 4.88%, 5/01/35 | | | 250 | | | | 245,313 | |
Miami-Dade County IDA, RB: | | | | | | | | |
Biscayne Properties, Series A, 5.00%, 6/01/35 | | | 115 | | | | 122,150 | |
Biscayne Properties, Series A, 5.00%, 6/01/40 | | | 155 | | | | 163,590 | |
Biscayne Properties, Series A, 5.00%, 6/01/48 | | | 115 | | | | 120,696 | |
Trout Creek Community Development District, Special Assessment Bonds, 5.63%, 5/01/45 | | | 250 | | | | 246,953 | |
| | | | | | | | |
| | | | | | | | 2,978,108 | |
Georgia — 1.2% | | | | | | | | |
Gainesville & Hall County Hospital Authority, Refunding RB, North East Georgia Health Systems, Inc. Project, 5.50%, 8/15/54 | | | 250 | | | | 292,333 | |
Private Colleges & Universities Authority RB, Savannah College of Art & Design Project, 5.00%, 4/01/44 | | | 250 | | | | 275,290 | |
| | | | | | | | |
| | | | | | | | 567,623 | |
See Notes to Financial Statements.
| | | | | | |
| | | BLACKROCK ALLOCATION TARGET SHARES | | MARCH 31, 2015 | | 25 |
| | | | |
| Schedule of Investments (continued) | | | Series E Portfolio | |
| | | (Percentages shown are based on Net Assets) | |
| | | | | | | | |
| Municipal Bonds | | Par (000) | | | Value | |
Idaho — 1.2% | | | | | | | | |
Idaho Health Facilities Authority, RB, St. Luke’s Health Systems, Inc., Project, 5.00%, 3/01/44 | | $ | 500 | | | $ | 556,975 | |
Illinois — 3.1% | | | | | | | | |
City of Chicago, GO, Refunding, Series A, 5.00%, 1/01/36 | | | 250 | | | | 251,920 | |
City of Chicago, O’Hare International Airport Revenue Refunding RB, Series D, 5.00%, 1/01/39 | | | 260 | | | | 287,373 | |
Illinois Finance Authority, Refunding RB: | | | | | | | | |
Lutheran Home & Services Project, 5.50%, 5/15/30 | | | 500 | | | | 536,740 | |
Senior, Rogers Park Montessori School Project, 6.13%, 2/01/45 | | | 150 | | | | 153,317 | |
State of Illinois, GO, 5.00%, 2/01/39 | | | 250 | | | | 262,343 | |
| | | | | | | | |
| | | | | | | | 1,491,693 | |
Indiana — 0.6% | | | | | | | | |
Indiana Finance Authority, RB, Private Activity Bond, Ohio River Bridges East End Crossing Project, AMT, 5.25%, 1/01/51 | | | 250 | | | | 272,493 | |
Iowa — 2.2% | | | | | | | | |
Iowa Finance Authority, Refunding RB, Iowa Fertilizer Co. Project, 5.50%, 12/01/22 | | | 750 | | | | 800,970 | |
Iowa Tobacco Settlement Authority, Refunding RB: | | | | | | | | |
Asset-Backed, Series C, 5.50%, 6/01/42 | | | 150 | | | | 132,527 | |
Capital Appreciation, Asset-Backed, Series B, 5.60%, 6/01/34 | | | 160 | | | | 153,104 | |
| | | | | | | | |
| | | | | | | | 1,086,601 | |
Louisiana — 0.3% | | | | | | | | |
Juban Crossing Economic Development District, Refunding RB, General Infrastructure Projects, Series C, 7.00%, 9/15/44 (a) | | | 150 | | | | 152,651 | |
Maryland — 1.1% | | | | | | | | |
Anne Arundel County Consolidated Special Taxing District, Special Tax Bonds, Villages at 2 Rivers Project, 5.25%, 7/01/44 | | | 250 | | | | 257,565 | |
County of Frederick, RB, Jefferson Technology Park Project, Series B, 7.13%, 7/01/43 | | | 150 | | | | 170,871 | |
Maryland Economic Development Corp., Refunding RB, University of Maryland Project, 5.00%, 7/01/39 | | | 100 | | | | 108,248 | |
| | | | | | | | |
| | | | | | | | 536,684 | |
Massachusetts — 1.9% | | | | | | | | |
Massachusetts Development Finance Agency: | | | | | | | | |
RB, Baystate Medical Center Project, Series N, 5.00%, 7/01/44 | | | 500 | | | | 562,555 | |
Refunding RB, Covanta Energy Project, Series B, 4.88%, 11/01/42 (a) | | | 350 | | | | 359,513 | |
| | | | | | | | |
| | | | | | | | 922,068 | |
Michigan — 2.6% | | | | | | | | |
Michigan Finance Authority, Refunding RB, AMT, Senior Lien, Detroit Water & Sewerage Department Project, 5.00%, 7/01/44 | | | 250 | | | | 261,103 | |
Michigan Tobacco Settlement Finance Authority, RB, Turbo Project, Series A, 6.88%, 6/01/42 | | | 150 | | | | 148,797 | |
Wayne County Airport Authority, RB: | | | | | | | | |
AMT, Detroit Metropolitan Wayne County Airport Project, 5.00%, 12/01/39 | | | 250 | | | | 277,270 | |
Detroit Metropolitan Wayne County Airport Project, Series B, 5.00%, 12/01/44 | | | 500 | | | | 555,835 | |
| | | | | | | | |
| | | | | | | | 1,243,005 | |
| | | | | | | | |
| Municipal Bonds | | Par (000) | | | Value | |
Minnesota — 0.4% | | | | | | | | |
St. Paul Port Authority, RB, AMT, Gerdau St. Paul Steel Mill Project, 4.50%, 10/01/37 | | $ | 100 | | | $ | 98,884 | |
Woodbury Housing & Redevelopment Authority, RB, St. Therese of Woodbury Project, 5.13%, 12/01/44 | | | 100 | | | | 101,477 | |
| | | | | | | | |
| | | | | | | | 200,361 | |
New Jersey — 7.4% | | | | | | | | |
Casino Reinvestment Development Authority, Refunding RB: | | | | | | | | |
5.25%, 11/01/39 | | | 250 | | | | 269,910 | |
5.25%, 11/01/44 | | | 250 | | | | 269,297 | |
New Jersey EDA, RB: | | | | | | | | |
Leap Academy Charter School Project, Series A, 6.20%, 10/01/44 | | | 150 | | | | 155,555 | |
Refunding, Charter, Greater Brunswick Project, Series A, 6.00%, 8/01/49 | | | 250 | | | | 256,983 | |
New Jersey Health Care Facilities Financing Authority, Refunding RB: | | | | | | | | |
Barnabas Health Obligated Project, 4.25%, 7/01/44 | | | 500 | | | | 506,845 | |
Barnabas Health Obligated Project, 5.00%, 7/01/44 | | | 220 | | | | 246,611 | |
New Jersey State Turnpike Authority, RB, Series A, 5.00%, 1/01/43 | | | 1,000 | | | | 1,113,550 | |
New Jersey Transportation Trust Fund Authority, RB: | | | | | | | | |
Transportation Program, Series AA, 5.00%, 6/15/38 | | | 250 | | | | 265,823 | |
Transportation Program, Series AA, 5.00%, 6/15/44 | | | 200 | | | | 213,516 | |
Tobacco Settlement Financing Corp., Refunding RB, Series 1A, 5.00%, 6/01/41 | | | 365 | | | | 279,944 | |
| | | | | | | | |
| | | | | | | | 3,578,034 | |
New Mexico — 0.7% | | | | | | | | |
New Mexico Hospital Equipment Loan Council, Refunding RB, Gerald Champion Regional Medical Center Project, 5.50%, 7/01/42 | | | 325 | | | | 327,284 | |
New York — 17.0% | | | | | | | | |
Build NYC Resource Corp., RB, 5.50%, 11/01/44 | | | 250 | | | | 270,493 | |
Build NYC Resource Corp., Refunding RB, AMT, Pratt Paper, Inc. Project, 5.00%, 1/01/35 (a) | | | 100 | | | | 108,002 | |
County of Cattaraugus New York, RB, St. Bonaventure University Project, 5.00%, 5/01/44 | | | 195 | | | | 208,956 | |
Hempstead Town Local Development Corp., RB, Molloy College Project, 5.00%, 7/01/44 | | | 500 | | | | 541,935 | |
Long Island Power Authority, Refunding RB, Series A, 5.00%, 9/01/44 | | | 500 | | | | 560,135 | |
Metropolitan Transportation Authority, RB, Sub Series D-1, 5.25%, 11/15/44 | | | 1,000 | | | | 1,166,790 | |
New York Counties Tobacco Trust IV, Refunding RB: | | | | | | | | |
Series A, 6.25%, 6/01/41 (a) | | | 550 | | | | 561,341 | |
Series A, 5.00%, 6/01/42 | | | 265 | | | | 223,450 | |
New York Liberty Development Corp., RB, Goldman Sachs Headquarters Project, 5.25%, 10/01/35 | | | 700 | | | | 845,887 | |
See Notes to Financial Statements.
| | | | | | |
| 26 | | BLACKROCK ALLOCATION TARGET SHARES | | MARCH 31, 2015 | | |
| | | | |
| Schedule of Investments (continued) | | | Series E Portfolio | |
| | | (Percentages shown are based on Net Assets) | |
| | | | | | | | |
| Municipal Bonds | | Par
(000) | | | Value | |
New York (concluded) | | | | | | | | |
New York Liberty Development Corp., Refunding RB: | | | | | | | | |
Class 1-3 World Trade Center Project, 5.00%, 11/15/44 (a) | | $ | 365 | | | $ | 384,148 | |
Class 2-3 World Trade Center Project, 5.38%, 11/15/40 (a) | | | 150 | | | | 165,945 | |
Class 3-3 World Trade Center Project, 7.25%, 11/15/44 (a) | | | 100 | | | | 121,269 | |
New York State Thruway Authority, Refunding RB, Series J, 5.00%, 1/01/41 | | | 1,000 | | | | 1,130,670 | |
Tompkins County Development Corp., Refunding RB, Kendal at Ithaca Project, 5.00%, 7/01/44 | | | 500 | | | | 541,105 | |
TSASC, Inc., Refunding RB: | | | | | | | | |
Series 1,4.75%, 6/01/22 | | | 265 | | | | 267,311 | |
Series 1,5.00%, 6/01/34 | | | 160 | | | | 146,333 | |
Ulster Tobacco Asset Securitization Corp., RB, Asset-Backed, 6.00%, 6/01/40 | | | 125 | | | | 124,994 | |
Westchester County Healthcare Corp., RB, Senior Lien, Series A, 5.00%, 11/01/44 | | | 500 | | | | 563,225 | |
Westchester Tobacco Asset Securitization, Refunding RB, 5.13%, 6/01/45 | | | 300 | | | | 280,992 | |
| | | | | | | | |
| | | | | | | | 8,212,981 | |
North Carolina — 0.5% | | | | | | | | |
North Carolina Medical Care Commission, Refunding RB, 1st Mortgage, Galloway Ridge Project, Series A, 5.25%, 1/01/41 | | | 250 | | | | 256,860 | |
North Dakota — 0.4% | | | | | | | | |
City of Williston, RB, Eagle Crest Apartments LLC Project, 7.75%, 9/01/38 | | | 200 | | | | 208,358 | |
Ohio — 1.8% | | | | | | | | |
Buckeye Tobacco Settlement Financing Authority, RB, Asset-Backed, Series A-2, 5.88%, 6/01/47 | | | 250 | | | | 204,617 | |
County of Franklin, RB, OPRS Communities Obligation Group Project, Series A, 6.13%, 7/01/40 | | | 585 | | | | 648,542 | |
| | | | | | | | |
| | | | | | | | 853,159 | |
Oregon — 0.3% | | | | | | | | |
Hospital Facilities Authority of Multnomah County Oregon, Refunding RB, Mirabella at South Waterfront Project, 5.50%, 10/01/49 | | | 150 | | | | 164,415 | |
Pennsylvania — 7.1% | | | | | | | | |
Lancaster County Hospital Authority, Refunding RB, St. Anne’s Retirement Community Project, 5.00%, 4/01/33 | | | 250 | | | | 255,323 | |
Montgomery County IDA, First Mortgage RB, NHS III Properties Project, 6.50%, 10/01/37 | | | 250 | | | | 255,393 | |
Montgomery County IDA, Refunding RB, Whitemarsh Continuing Care Retirement Community Project, 5.38%, 1/01/50 | | | 285 | | | | 288,531 | |
Northampton County IDA, Tax Allocation Bonds, Route 33 Project, 7.00%, 7/01/32 | | | 150 | | | | 164,755 | |
Pennsylvania Economic Development Financing Authority,: | | | | | | | | |
RB, AMT, The Pennsylvania Rapid Bridge Replacement Project, 5.00%, 6/30/42 | | | 250 | | | | 276,035 | |
Refunding RB, AMT, National Gypson Co. Project, 5.50%, 11/01/44 | | | 500 | | | | 517,520 | |
Pennsylvania Higher Educational Facilities Authority, Refunding RB, Widener University Project, 5.00%, 7/15/38 | | | 250 | | | | 273,077 | |
| | | | | | | | |
| Municipal Bonds | | Par
(000) | | | Value | |
Pennsylvania (concluded) | | | | | | | | |
Pennsylvania Turnpike Commission, RB, Series B, 5.25%, 12/01/44 | | $ | 1,000 | | | $ | 1,146,840 | |
Philadelphia Hospitals & Higher Education Facilities Authority, RB, Temple University Health System Project, Series A, 5.63%, 7/01/42 | | | 250 | | | | 268,815 | |
| | | | | | | | |
| | | | | | | | 3,446,289 | |
Puerto Rico — 0.9% | | | | | | | | |
Children’s Trust Fund, Refunding RB, Asset-Backed: | | | | | | | | |
5.50%, 5/15/39 | | | 110 | | | | 110,675 | |
5.63%, 5/15/43 | | | 10 | | | | 10,012 | |
Commonwealth of Puerto Rico, GO, Refunding, Series A, 8.00%, 7/01/35 | | | 400 | | | | 328,512 | |
| | | | | | | | |
| | | | | | | | 449,199 | |
Rhode Island — 1.7% | | | | | | | | |
Tobacco Settlement Financing Corp.,: | | | | | | | | |
RB, Asset-Backed, Series A, 6.25%, 6/01/42 | | | 200 | | | | 200,574 | |
Refunding RB, Series A, 5.00%, 6/01/40 | | | 100 | | | | 107,847 | |
Refunding RB, Series B, 4.50%, 6/01/45 | | | 500 | | | | 504,035 | |
| | | | | | | | |
| | | | | | | | 812,456 | |
South Carolina — 2.4% | | | | | | | | |
South Carolina State Public Service Authority, Refunding RB, Series A, 5.50%, 12/01/54 | | | 1,000 | | | | 1,159,030 | |
Tennessee — 0.6% | | | | | | | | |
Chattanooga-Hamilton County Hospital Authority, Refunding RB, 5.00%, 10/01/44 | | | 250 | | | | 274,993 | |
Texas — 4.0% | | | | | | | | |
Central Texas Regional Mobility Authority, RB, Senior Lien, 6.25%, 1/01/46 | | | 175 | | | | 205,226 | |
Central Texas Turnpike System, Refunding RB, Series C, 5.00%, 8/15/37 | | | 200 | | | | 221,260 | |
City of Houston Texas Airport System,: | | | | | | | | |
RB, AMT, Series B-1, 5.00%, 7/15/35 | | | 100 | | | | 105,153 | |
Refunding RB, AMT, United Airlines, Inc. Project, 5.00%, 7/01/29 | | | 500 | | | | 539,515 | |
Mesquite Health Facility Development Corp., Refunding RB, Christian Care Centers, Inc. Project, 5.13%, 2/15/42 | | | 250 | | | | 258,173 | |
New Hope Cultural Education Facilities Corp., RB: | | | | | | | | |
Collegiate HSG-Tarleton St. Project, 5.00%, 4/01/47 | | | 100 | | | | 107,748 | |
Wesleyan Homes, Inc. Project, 5.50%, 1/01/49 | | | 250 | | | | 255,130 | |
Tarrant County Cultural Education Facilities Finance Corp., Refunding RB, Trinity Terrace Project, 5.00%, 10/01/49 | | | 250 | | | | 268,587 | |
| | | | | | | | |
| | | | | | | | 1,960,792 | |
Utah — 1.1% | | | | | | | | |
Utah State Charter School Finance Authority, RB, Early Light Academy Project, 5.13%, 7/15/49 (a) | | | 545 | | | | 540,171 | |
Virginia — 1.1% | | | | | | | | |
Fairfax County EDA, RB, Vinson Hall LLC Project, Series A, 5.00%, 12/01/42 | | | 400 | | | | 407,864 | |
See Notes to Financial Statements.
| | | | | | |
| | | BLACKROCK ALLOCATION TARGET SHARES | | MARCH 31, 2015 | | 27 |
| | | | |
| Schedule of Investments (continued) | | | Series E Portfolio | |
| | | | | | | | |
| Municipal Bonds | | Par
(000) | | | Value | |
Virginia (concluded) | | | | | | | | |
Virginia College Building Authority, Refunding RB, Marymount University Project, Series A, 5.00%, 7/01/45 | | $ | 100 | | | $ | 105,900 | |
| | | | | | | | |
| | | | | | | | 513,764 | |
Washington — 1.0% | | | | | | | | |
Greater Wenatchee Regional Events Center Public Facilities District, Refunding RB, Series A, 5.50%, 9/01/42 | | | 250 | | | | 264,475 | |
King County Public Hospital District No. 4, GO, Refunding, Improvement, Snoqualmie Valley Hospital Project, 7.00%, 12/01/40 | | | 200 | | | | 215,700 | |
| | | | | | | | |
| | | | | | | | 480,175 | |
Wisconsin — 1.2% | | | | | | | | |
Public Finance Authority, RB, Voyager Foundation, Inc. Project, Series A, 5.13%, 10/01/45 | | | 150 | | | | 152,238 | |
Public Finance Authority, Refunding RB, AMT, Senior Obligation Group Project, 5.00%, 7/01/42 | | | 400 | | | | 423,540 | |
| | | | | | | | |
| | | | | | | | 575,778 | |
| | | | | | | | |
| | | | | | Value | |
Total Long-Term Investments (Cost — $43,923,721) — 92.9% | | | | | | $ | 45,010,941 | |
| | | | | | | | |
| Short-Term Securities | | Shares | | | | |
Dreyfus Tax Exempt Cash Management, 0.00% (b) | | | 2,829,925 | | | | 2,829,925 | |
Total Short-Term Securities (Cost — $2,829,925) — 5.8% | | | | | | | 2,829,925 | |
Total Investments (Cost — $46,753,646) — 98.7% | | | | | | | 47,840,866 | |
Other Assets in Excess of Liabilities — 1.3% | | | | | | | 620,622 | |
| | | | | | | | |
Net Assets — 100.0% | | | | | | $ | 48,461,488 | |
| | | | | | | | |
|
| Notes to Schedule of Investments |
| (a) | Security exempt from registration pursuant to Rule 144A under the Securities Act of 1933, as amended. These securities may be resold in transactions exempt from registration to qualified institutional investors. |
| (b) | Represents the current yield as of report date. |
| • | | As of March 31, 2015, financial futures contracts outstanding were as follows: |
| | | | | | | | | | | | | | | | | | |
Contracts
Short | | | Issue | | Exchange | | Expiration | | | Notional
Value | | | Unrealized
Depreciation | |
| | (28 | ) | | U.S. Treasury Notes (10 Year) | | Chicago Board of Trade | | | June 2015 | | | $ | 3,609,375 | | | $ | (61,279 | ) |
| • | | Fair Value Measurements — Various inputs are used in determining the fair value of investments and derivative financial instruments. These inputs to valuation techniques are categorized into a disclosure hierarchy consisting of three broad levels for financial statement purposes. The hierarchy gives the highest priority to unadjusted quoted prices in active markets for identical assets or liabilities (Level 1 measurements) and the lowest priority to unobservable inputs (Level 3 measurements). Accordingly, the degree of judgment exercised in determining fair value is greatest for instruments categorized in Level 3. The inputs used to measure fair value may fall into different levels of the fair value hierarchy. In such cases, for disclosure purposes, the fair value hierarchy classification is determined based on the lowest level input that is significant to the fair value measurement in its entirety. The categorization of a value determined for investments and derivative financial instruments is based on the pricing transparency of the investment and derivative financial instruments and is not necessarily an indication of the risks associated with investing in those securities. The three levels of the fair value hierarchy are as follows: |
| | • | | Level 1 — unadjusted quoted prices in active markets/exchanges for identical assets or liabilities that the Fund has the ability to access |
| | • | | Level 2 — other observable inputs (including, but not limited to, quoted prices for similar assets or liabilities in markets that are active, quoted prices for identical or similar assets or liabilities in markets that are not active, inputs other than quoted prices that are observable for the assets or liabilities (such as interest rates, yield curves, volatilities, prepayment speeds, loss severities, credit risks and default rates) or other market–corroborated inputs) |
| | • | | Level 3 — unobservable inputs based on the best information available in the circumstances, to the extent observable inputs are not available (including the Fund’s own assumptions used in determining the fair value of investments and derivative financial instruments) |
Changes in valuation techniques may result in transfers into or out of an assigned level within the disclosure hierarchy. In accordance with the Fund’s policy, transfers between different levels of the fair value disclosure hierarchy are deemed to have occurred as of the beginning of the reporting period. For information about the Fund’s policy regarding valuation of investments and derivative financial instruments, refer to Note 2 of the Notes to Financial Statements.
As of March 31, 2015, the following tables summarize the Fund’s investments and derivative financial instruments categorized in the disclosure hierarchy:
| | | | | | | | | | | | | | |
| | | Level 1 | | | Level 2 | | | Level 3 | | Total | |
Assets: | | | | | | | | | | | | | | |
Investments: | | | | | | | | | | | | | | |
Long-Term Investments1 | | | — | | | $ | 45,010,941 | | | — | | $ | 45,010,941 | |
Short-Term Securities | | $ | 2,829,925 | | | | — | | | — | | | 2,829,925 | |
| | | | |
Total | | $ | 2,829,925 | | | $ | 45,010,941 | | | — | | $ | 47,840,866 | |
| | | | |
| | 1 | | See above Schedule of Investments for values in each state. |
See Notes to Financial Statements.
| | | | | | |
| 28 | | BLACKROCK ALLOCATION TARGET SHARES | | MARCH 31, 2015 | | |
| | | | |
| Schedule of Investments (concluded) | | | Series E Portfolio | |
| | | | | | | | | | | | | | | | | | | | |
| | | Level 1 | | Level 2 | | Level 3 | | Total |
Derivative Financial Instruments2 | | | | | | | | | | | | | | | | | | | | |
Liabilities: | | | | | | | | | | | | | | | | | | | | |
Interest rate contracts | | | $ | (61,279 | ) | | | | — | | | | | — | | | | $ | (61,279 | ) |
| | | | | |
2 Derivative financial instruments are financial futures contracts, which are valued at the unrealized appreciation/depreciation on the instrument. | |
|
| The Fund may hold assets and/or liabilities in which the fair value approximates the carrying amount for financial statement purposes. As of March 31, 2015, such assets are categorized within the disclosure hierarchy as follows: | |
| | | | | | | | | | | | | | | | | | | | |
| | | Level 1 | | Level 2 | | Level 3 | | Total |
Assets: | | | | | | | | | | | | | | | | | | | | |
Cash | | | $ | 167,840 | | | | | — | | | | | — | | | | $ | 167,840 | |
Cash pledged for financial futures contracts | | | | 47,000 | | | | | — | | | | | — | | | | | 47,000 | |
| | | | | |
Total | | | $ | 214,840 | | | | | — | | | | | — | | | | $ | 214,840 | |
| | | | | |
During the year ended March 31, 2015, there were no transfers between levels.
See Notes to Financial Statements.
| | | | | | |
| | | BLACKROCK ALLOCATION TARGET SHARES | | MARCH 31, 2015 | | 29 |
| | | | |
| Schedule of Investments March 31, 2015 | | | Series M Portfolio | |
| | | (Percentages shown are based on Net Assets) | |
| | | | | | | | |
| Asset-Backed Securities | | Par (000) | | | Value | |
AmeriCredit Automobile Receivables Trust: | | | | | | | | |
Series 2013-5, Class A2A, 0.65%, 3/08/17 | | $ | 342 | | | $ | 342,144 | |
Series 2013-5, Class A2B, 0.53%, 3/08/17 (a) | | | 380 | | | | 380,203 | |
SLM Private Education Loan Trust, Series 2012-C, Class A1, 1.27%, 8/15/23 (a)(b) | | | 640 | | | | 643,266 | |
SLM Student Loan Trust, Series 2008-4, Class A4, 1.88%, 7/25/22 (a) | | | 7,350 | | | | 7,654,011 | |
Total Asset-Backed Securities — 1.7% | | | | | | | 9,019,624 | |
| | | | | | | | |
| Non-Agency Mortgage-Backed Securities | | | | | | |
Commercial Mortgage-Backed Securities — 5.6% | | | | | | | | |
Bear Stearns Commercial Mortgage Securities: | | | | | | | | |
Series 2005-PW10, Class A4, 5.41%, 12/11/40 (a) | | | 771 | | | | 782,853 | |
Series 2007-PW17, Class A4, 5.69%, 6/11/50 (a) | | | 10,255 | | | | 11,082,804 | |
BHMS Mortgage Trust, Series 2014-ATLS, Class AFL, 1.67%, 7/05/33 (a)(b) | | | 2,600 | | | | 2,645,526 | |
Citigroup Commercial Mortgage Trust, Series 2014-GC21, Class A5, 3.86%, 5/10/47 | | | 2,800 | | | | 3,045,874 | |
Citigroup/Deutsche Bank Commercial Mortgage Trust, Series 2006-CD3, Class A5, 5.62%, 10/15/48 | | | 420 | | | | 438,731 | |
Credit Suisse Mortgage Capital Certificates, Series 2006-C4, Class A3, 5.47%, 9/15/39 | | | 4,751 | | | | 4,966,148 | |
GAHR Commercial Mortgage Trust, Series 2015-NRF, Class DFX, 3.38%, 12/15/19 (b) | | | 3,600 | | | | 3,561,264 | |
JPMorgan Chase Commercial Mortgage Securities Corp.: | | | | | | | | |
Series 2005-CB12, Class A4, 4.90%, 9/12/37 | | | 243 | | | | 243,841 | |
Series 2006-LDP7, Class A4, 5.88%, 4/15/45 (a) | | | 2,105 | | | | 2,175,094 | |
LB-UBS Commercial Mortgage Trust, Series 2006-C3, Class A4, 5.66%, 3/15/39 (a) | | | 290 | | | | 297,533 | |
| | | | | | | | |
| | | | | | | | 29,239,668 | |
Interest Only Commercial Mortgage-Backed Securities — 2.5% | | | | | |
Commercial Mortgage Trust: | | | | | | | | |
Series 2012-CR5, Class XA, 1.90%, 12/10/45 (a) | | | 5,961 | | | | 548,259 | |
Series 2013-CR7, Class XA, 1.53%, 3/10/46 (a) | | | 3,932 | | | | 309,366 | |
Series 2014-CR14, Class XA, 1.04%, 2/10/47 (a) | | | 3,564 | | | | 169,916 | |
Series 2014-CR15, Class XA, 1.35%, 2/10/47 (a) | | | 25,007 | | | | 1,692,400 | |
Series 2015-DC1, Class XA, 1.34%, 2/10/48 (a) | | | 18,575 | | | | 1,500,266 | |
Series 2015-LC19, Class XA, 1.24%, 2/10/48 (a) | | | 8,094 | | | | 738,223 | |
Credit Suisse Mortgage Capital Certificates, Series 2014-USA, Class X1, 0.55%, 9/15/25 (a)(b) | | | 26,000 | | | | 1,258,140 | |
CSAIL Commercial Mortgage Trust, Series 2015-C1, Class XA, 1.12%, 4/15/50 (a) | | | 14,600 | | | | 1,019,722 | |
JPMorgan Chase Commercial Mortgage Securities Corp.: | | | | | | | | |
Series 2013-LC11, Class XA, 1.57%, 4/15/46 (a) | | | 4,641 | | | | 392,752 | |
| | | | | | | | |
| Non-Agency Mortgage-Backed Securities | | Par (000) | | | Value | |
Interest Only Commercial Mortgage-Backed Securities (concluded) | | | | | |
Series 2015-C27, Class XA, 1.40%, 2/15/48 (a) | | $ | 24,279 | | | $ | 2,192,376 | |
Morgan Stanley Bank of America Merrill Lynch Trust: | | | | | | | | |
Series 2013-C13, Class XA, 1.23%, 11/15/46 (a) | | | 4,627 | | | | 336,558 | |
Series 2014-C18, Class XA, 1.00%, 10/29/47 (a) | | | 1,397 | | | | 76,293 | |
Series 2014-C19, Class XA, 1.17%, 12/15/47 (a) | | | 16,874 | | | | 1,250,231 | |
WF-RBS Commercial Mortgage Trust: | | | | | | | | |
Series 2014-C22, Class XA, 0.97%, 9/15/57 (a) | | | 10,063 | | | | 655,716 | |
Series 2014-C24, Class XA, 0.99%, 11/15/47 (a) | | | 6,090 | | | | 416,934 | |
Series 2014-LC14, Class XA, 1.46%, 3/15/47 (a) | | | 4,220 | | | | 347,779 | |
| | | | | | | | |
| | | | | | | | 12,904,931 | |
Total Non-Agency Mortgage-Backed Securities — 8.1% | | | | | | | 42,144,599 | |
| | | | | | | | |
| U.S. Government Sponsored Agency Securities | | | | | | |
Collateralized Mortgage Obligations — 0.4% | | | | | | | | |
Ginnie Mae: | | | | | | | | |
Series 2014-12, Class ZA, 3.10%, 1/20/44 | | | 1,243 | | | | 1,228,894 | |
Series 2014-62, Class Z, 3.00%, 4/20/44 | | | 1,028 | | | | 984,847 | |
| | | | | | | | |
| | | | | | | | 2,213,741 | |
Commercial Mortgage-Backed Securities — 1.2% | | | | | | | | |
Freddie Mac, Series K035, Class A2, 3.46%, 8/25/23 | | | 5,600 | | | | 6,062,829 | |
Interest Only Collateralized Mortgage Obligations — 0.2% | | | | | |
Freddie Mac, Series 4307, Class SE, 5.93%, 9/15/36 (a) | | | 463 | | | | 80,005 | |
Ginnie Mae: | | | | | | | | |
Series 2009-121, Class UI, 5.00%, 12/20/39 | | | 301 | | | | 53,757 | |
Series 2010-9, Class UI, 5.00%, 1/20/40 | | | 905 | | | | 168,080 | |
Series 2010-35, Class UI, 5.00%, 3/20/40 | | | 293 | | | | 52,310 | |
Series 2013-54, Class LI, 5.00%, 2/20/43 | | | 147 | | | | 15,319 | |
Series 2013-103, Class IO, 5.00%, 6/20/43 | | | 230 | | | | 39,472 | |
Series 2013-106, Class DS, 6.02%, 2/20/43 (a) | | | 1,002 | | | | 146,755 | |
Series 2013-113, Class SA, 6.52%, 8/20/43 (a) | | | 212 | | | | 38,537 | |
Series 2013-134, Class DS, 5.92%, 9/20/43 (a) | | | 219 | | | | 29,707 | |
Series 2013-147, Class SD, 6.47%, 12/20/39 (a) | | | 223 | | | | 33,737 | |
Series 2014-180, Class IO, 5.00%, 12/20/44 | | | 569 | | | | 102,379 | |
Series 2014-182, Class KI, 5.00%, 10/20/44 | | | 94 | | | | 16,276 | |
Series 2015-14, Class IO, 5.00%, 10/20/44 | | | 675 | | | | 125,072 | |
| | | | | | | | |
| | | | | | | | 901,406 | |
See Notes to Financial Statements.
| | | | | | |
| 30 | | BLACKROCK ALLOCATION TARGET SHARES | | MARCH 31, 2015 | | |
| | | | |
| Schedule of Investments (continued) | | | Series M Portfolio | |
| | | (Percentages shown are based on Net Assets) | |
| | | | | | | | |
| U.S. Government Sponsored Agency Securities | | Par (000) | | | Value | |
Interest Only Commercial Mortgage-Backed Securities — 0.7% | | | | | |
Fannie Mae, Series 2012-M9, Class X1, 4.03%, 12/25/17 (a) | | $ | 16,318 | | | $ | 1,382,891 | |
Freddie Mac: | | | | | | | | |
Series K040, Class X1, 0.74%, 9/25/24 | | | 9,482 | | | | 546,719 | |
Series K041, Class X1, 0.56%, 10/25/24 | | | 13,784 | | | | 618,933 | |
Series K042, Class X1, 1.06%, 12/25/24 | | | 4,097 | | | | 342,463 | |
Series K043, Class X1, 0.68%, 12/25/24 | | | 16,400 | | | | 743,314 | |
| | | | | | | | |
| | | | | | | | 3,634,320 | |
Mortgage-Backed Securities — 152.2% | | | | | | | | |
Fannie Mae Mortgage-Backed Securities: | | | | | | | | |
2.00%, 4/01/29 (c) | | | 1,500 | | | | 1,501,700 | |
2.50%, 4/01/30 (c) | | | 23,500 | | | | 24,115,152 | |
3.00%, 5/01/29-4/01/45 (c) | | | 108,782 | | | | 112,708,911 | |
3.50%, 9/01/28-4/01/45 (c) | | | 57,905 | | | | 61,463,324 | |
4.00%, 2/01/29-4/01/45 (c) | | | 51,475 | | | | 55,054,150 | |
4.50%, 5/01/24-4/01/45 (c) | | | 66,544 | | | | 72,680,520 | |
5.00%, 5/01/33-4/01/45 (c) | | | 45,538 | | | | 50,754,681 | |
5.50%, 4/01/45 (c) | | | 9,300 | | | | 10,478,485 | |
6.00%, 2/01/38-4/01/45 (c) | | | 6,498 | | | | 7,423,428 | |
6.50%, 5/01/36-4/01/45 (c) | | | 1,806 | | | | 2,080,092 | |
Freddie Mac Mortgage-Backed Securities: | | | | | | | | |
2.53%, 5/01/36 (a) | | | 769 | | | | 825,241 | |
3.00%, 4/01/30-4/01/45 (c) | | | 15,016 | | | | 15,400,599 | |
3.50%, 7/01/18-4/01/45 (c) | | | 35,984 | | | | 37,749,934 | |
4.00%, 4/01/30-4/01/45 (c) | | | 17,266 | | | | 18,452,843 | |
4.50%, 4/01/18-4/01/45 (c) | | | 17,301 | | | | 18,834,425 | |
5.00%, 5/01/28-11/01/41 | | | 4,930 | | | | 5,477,172 | |
5.50%, 1/01/28-4/01/45 (c) | | | 2,315 | | | | 2,596,416 | |
6.00%, 8/01/28-4/01/45 (c) | | | 2,295 | | | | 2,611,600 | |
Ginnie Mae Mortgage-Backed Securities: | | | | | | | | |
3.00%, 4/15/45 (c) | | | 24,400 | | | | 25,114,300 | |
3.50%, 9/15/42-4/15/45 (c) | | | 93,914 | | | | 98,791,913 | |
4.00%, 9/20/40-4/15/45 (c) | | | 121,048 | | | | 129,260,539 | |
4.50%, 4/15/40-4/15/45 (c) | | | 23,352 | | | | 25,523,664 | |
5.00%, 7/15/33-4/15/45 | | | 7,734 | | | | 8,573,249 | |
5.50%, 7/15/38-12/20/41 | | | 2,571 | | | | 2,906,894 | |
6.00%, 4/15/45 (c) | | | 2,100 | | | | 2,390,355 | |
| | | | | | | | |
| | | | | | | | 792,769,587 | |
Total U.S. Government Sponsored Agency Securities — 154.7% | | | | 805,581,883 | |
| | | | | | | | |
| U.S. Treasury Obligations | | | | | | |
U.S. Treasury Notes: | | | | | | | | |
1.38%, 2/29/20 | | | 155 | | | | 155,036 | |
2.00%, 2/15/25 | | | 3,100 | | | | 3,119,617 | |
Total U.S. Treasury Obligations — 0.6% | | | | | | | 3,274,653 | |
Total Long-Term Investments (Cost — $852,260,569) — 165.1% | | | | | | | 860,020,759 | |
| | | | | | | | |
| Short-Term Securities | | Shares | | | Value | |
Dreyfus Treasury Prime, 0.00% (d) | | | 209,714,050 | | | $ | 209,714,050 | |
Total Short-Term Securities (Cost — $209,714,050) — 40.3% | | | | | | | 209,714,050 | |
Total Investments Before TBA Sale Commitments (Cost — $1,061,974,619) — 205.4% | | | | 1,069,734,809 | |
| | | | | | | | |
| TBA Sale Commitments (c) | | Par (000) | | | | |
Fannie Mae Mortgage-Backed Securities: | | | | | | | | |
2.50%, 4/01/30 | | $ | 9,700 | | | | (9,962,203 | ) |
3.00%, 4/01/30-4/01/45 | | | 38,500 | | | | (40,094,265 | ) |
3.50%, 4/01/30-4/01/45 | | | 31,400 | | | | (33,168,641 | ) |
4.00%, 4/01/30-4/01/45 | | | 27,000 | | | | (28,844,220 | ) |
4.50%, 4/01/45 | | | 21,800 | | | | (23,782,442 | ) |
5.00%, 4/01/45 | | | 20,650 | | | | (22,949,748 | ) |
6.00%, 4/01/45 | | | 600 | | | | (684,187 | ) |
6.50%, 4/01/45 | | | 800 | | | | (919,656 | ) |
Freddie Mac Mortgage-Backed Securities: | | | | | | | | |
3.50%, 4/01/45 | | | 10,400 | | | | (10,899,485 | ) |
4.00%, 4/01/45 | | | 9,100 | | | | (9,712,546 | ) |
4.50%, 4/01/30-4/01/45 | | | 17,100 | | | | (18,607,900 | ) |
5.00%, 4/01/45 | | | 1,900 | | | | (2,106,922 | ) |
5.50%, 4/01/45 | | | 400 | | | | (448,813 | ) |
6.00%, 4/01/45 | | | 2,000 | | | | (2,274,843 | ) |
Ginnie Mae Mortgage-Backed Securities: | | | | | | | | |
3.00%, 4/15/45 | | | 2,700 | | | | (2,780,103 | ) |
3.50%, 4/15/45 | | | 59,800 | | | | (62,902,900 | ) |
4.00%, 4/15/45 | | | 69,000 | | | | (73,514,649 | ) |
4.50%, 4/15/45 | | | 6,600 | | | | (7,204,847 | ) |
5.00%, 4/15/45 | | | 1,600 | | | | (1,783,062 | ) |
5.50%, 4/15/45 | | | 1,200 | | | | (1,345,000 | ) |
Total TBA Sale Commitments (Proceeds — $352,445,976) — (68.0)% | | | | | | | (353,986,432 | ) |
Total Investments Net of TBA Sale Commitments — 137.4% | | | | 715,748,377 | |
Liabilities in Excess of Other Assets — (37.4)% | | | | (194,815,113 | ) |
| | | | | | | | |
Net Assets — 100.0% | | | | | | $ | 520,933,264 | |
| | | | | | | | |
|
| Notes to Schedule of Investments |
| (a) | Variable rate security. Rate shown is as of report date. |
| (b) | Security exempt from registration pursuant to Rule 144A under the Securities Act of 1933, as amended. These securities may be resold in transactions exempt from registration to qualified institutional investors. |
See Notes to Financial Statements.
| | | | | | |
| | | BLACKROCK ALLOCATION TARGET SHARES | | MARCH 31, 2015 | | 31 |
| | | | |
| Schedule of Investments (continued) | | | Series M Portfolio | |
| (c) | Represents or includes a TBA transaction. As of March 31, 2015, unsettled TBA transactions were as follows: |
| | | | | | | | |
| Counterparty | | Value | | | Unrealized
Appreciation
(Depreciation) | |
Barclays Capital, Inc. | | $ | 4,958,281 | | | $ | 24,676 | |
BB&T Securities LLC | | $ | (320,766 | ) | | $ | (1,156 | ) |
BNP Paribas Securities Corp. | | $ | (2,655,371 | ) | | $ | (22,035 | ) |
Citigroup Global Markets, Inc. | | $ | 30,054,896 | | | $ | 196,026 | |
Credit Suisse Securities (USA) LLC | | $ | 57,635,742 | | | $ | 333,697 | |
Deutsche Bank Securities, Inc. | | $ | 26,127,657 | | | $ | 388,146 | |
Goldman Sachs & Co. | | $ | 14,614,462 | | | $ | 2,110 | |
J.P. Morgan Securities LLC | | $ | 29,181,367 | | | $ | 228,160 | |
Merrill Lynch, Pierce, Fenner & Smith, Inc. | | $ | 11,097,538 | | | $ | 63,670 | |
Morgan Stanley & Co. LLC | | $ | 4,981,309 | | | $ | 47,916 | |
Nomura Securities International, Inc. | | $ | 16,886,431 | | | $ | 165,517 | |
SG Americas Securities LLC | | $ | (1,088,984 | ) | | $ | (3,984 | ) |
Wells Fargo Securities, LLC | | $ | 2,565,300 | | | $ | 5,175 | |
| (d) | Represents the current yield as of report date. |
| • | | As of March 31, 2015, financial futures contracts outstanding were as follows: |
| | | | | | | | | | | | | | | | |
Contracts
Long/
(Short) | | | Issue | | Exchange | | Expiration | | Notional
Value | | | Unrealized
Appreciation
(Depreciation) | |
| | 216 | | | U.S. Treasury Notes (10 Year) | | Chicago Board of Trade | | June 2015 | | $ | 27,843,750 | | | $ | 49,410 | |
| | 1 | | | Euro Dollar Futures | | Chicago Mercantile | | June 2015 | | $ | 249,175 | | | | 639 | |
| | 93 | | | Euro Dollar Futures | | Chicago Mercantile | | June 2016 | | $ | 23,010,525 | | | | 40,602 | |
| | 1 | | | Euro Dollar Futures | | Chicago Mercantile | | December 2016 | | $ | 246,488 | | | | 63 | |
| | 1 | | | Euro Dollar Futures | | Chicago Mercantile | | March 2018 | | $ | 244,975 | | | | (99 | ) |
| | (3 | ) | | Euro Dollar Futures | | Chicago Mercantile | | September 2015 | | $ | 746,400 | | | | (1,246 | ) |
| | (119 | ) | | U.S. Treasury Notes (5 Year) | | Chicago Board of Trade | | June 2015 | | $ | 14,305,102 | | | | (64,443 | ) |
| | (2 | ) | | Euro Dollar Futures | | Chicago Mercantile | | March 2016 | | $ | 495,800 | | | | (1,072 | ) |
| | (5 | ) | | Euro Dollar Futures | | Chicago Mercantile | | September 2016 | | $ | 1,234,688 | | | | (2,868 | ) |
| | (5 | ) | | Euro Dollar Futures | | Chicago Mercantile | | March 2017 | | $ | 1,230,625 | | | | (4,656 | ) |
| | (6 | ) | | Euro Dollar Futures | | Chicago Mercantile | | June 2017 | | $ | 1,474,650 | | | | (4,698 | ) |
| | (2 | ) | | Euro Dollar Futures | | Chicago Mercantile | | September 2017 | | $ | 490,950 | | | | (1,672 | ) |
| | (100 | ) | | Euro Dollar Futures | | Chicago Mercantile | | December 2017 | | $ | 24,518,750 | | | | (87,971 | ) |
| | Total | | | | | | | | | | | | | $ | (78,011 | ) |
| | | | | | | | | | | | | | | | |
| • | | As of March 31, 2015, centrally cleared interest rate swaps outstanding were as follows: |
| | | | | | | | | | | | | | | | | | |
Fixed
Rate | | | Floating Rate | | Clearinghouse | | Expiration
Date | | | Notional
Amount
(000) | | | Unrealized
Appreciation | |
| | 2.03 | %1 | | 3-month LIBOR | | Chicago Mercantile | | | 3/24/25 | | | $ | 300 | | | $ | 225 | |
| | 1 | | Fund pays the floating rate and receives the fixed rate. |
| • | | As of March 31, 2015, OTC total return swaps outstanding were as follows: |
| | | | | | | | | | | | | | | | | | | | | | |
| Reference Entity | | Floating Rate | | Counterparty | | Expiration
Date | | Notional
Amount
(000) | | | Value | | | Premiums
Paid (Received) | | | Unrealized
Appreciation
(Depreciation) | |
Return on Markit IOS 6.00%, 30-year, fixed rate Fannie Mae | | 1-month LIBOR1 | | Deutsche Bank AG | | 1/12/39 | | $ | 166 | | | $ | (1,167 | ) | | $ | 1,563 | | | $ | (2,730 | ) |
Return on Markit IOS 4.50%, 30-year, fixed rate Fannie Mae | | 1-month LIBOR2 | | Citibank N.A. | | 1/12/41 | | $ | 177 | | | | (2,076 | ) | | | (1,793 | ) | | | (283 | ) |
Return on Markit IOS 4.50%, 30-year, fixed rate Fannie Mae | | 1-month LIBOR2 | | Credit Suisse International | | 1/12/41 | | $ | 177 | | | | (2,075 | ) | | | (2,700 | ) | | | 625 | |
See Notes to Financial Statements.
| | | | | | |
| 32 | | BLACKROCK ALLOCATION TARGET SHARES | | MARCH 31, 2015 | | |
| | | | |
| Schedule of Investments (continued) | | | Series M Portfolio | |
As of March 31, 2015, OTC total return swaps outstanding were as follows: (concluded)
| | | | | | | | | | | | | | | | | | | | | | |
| Reference Entity | | Floating Rate | | Counterparty | | Expiration
Date | | Notional Amount (000) | | | Value | | | Premiums
Paid
(Received) | | | Unrealized
Appreciation
(Depreciation) | |
Return on Markit IOS 4.50%, 30-year, fixed rate Fannie Mae | | 1-month LIBOR2 | | Credit Suisse International | | 1/12/41 | | $ | 177 | | | | (2,075 | ) | | | (994 | ) | | $ | (1,081 | ) |
Return on Markit IOS 4.50%, 30-year, fixed rate Fannie Mae | | 1-month LIBOR2 | | Credit Suisse International | | 1/12/41 | | $ | 142 | | | | (1,786 | ) | | | (1,805 | ) | | | 19 | |
Return on Markit IOS 4.50%, 30-year, fixed rate Fannie Mae | | 1-month LIBOR2 | | Credit Suisse International | | 1/12/41 | | $ | 142 | | | | (1,660 | ) | | | (1,221 | ) | | | (439 | ) |
Return on Markit IOS 4.50%, 30-year, fixed rate Fannie Mae | | 1-month LIBOR2 | | Credit Suisse International | | 1/12/41 | | $ | 142 | | | | (1,6 60 | ) | | | 1,623 | | | | (3,283 | ) |
Return on Markit IOS 4.50%, 30-year, fixed rate Fannie Mae | | 1-month LIBOR2 | | Credit Suisse International | | 1/12/41 | | $ | 142 | | | | (1,660 | ) | | | 1,863 | | | | (3,523 | ) |
Return on Markit IOS 4.00%, 30-year, fixed rate Fannie Mae | | 1-month LIBOR2 | | Credit Suisse International | | 1/12/45 | | $ | 276 | | | | (4,977 | ) | | | (2,272 | ) | | | (2,705 | ) |
Return on Markit IOS 4.00%, 30-year, fixed rate Fannie Mae | | 1-month LIBOR2 | | Credit Suisse International | | 1/12/45 | | $ | 184 | | | | (3,318 | ) | | | (3,581 | ) | | | 263 | |
Return on Markit IOS 4.00%, 30-year, fixed rate Fannie Mae | | 1-month LIBOR2 | | Goldman Sachs Bank USA | | 1/12/45 | | $ | 184 | | | | (3,319 | ) | | | (1,515 | ) | | | (1,804 | ) |
Total | | | | | | | | | | | | $ | (25,773 | ) | | $ | (10,832 | ) | | $ | (14,941 | ) |
| | | | | | | | | | | | | | |
| | 1 | | Fund pays the total return of the reference entity and receives the floating rate. |
| | 2 | | Fund pays the floating rate and receives the total return of the reference entity. |
| • | | Fair Value Measurements — Various inputs are used in determining the fair value of investments and derivative financial instruments. These inputs to valuation techniques are categorized into a disclosure hierarchy consisting of three broad levels for financial statement purposes. The hierarchy gives the highest priority to unadjusted quoted prices in active markets for identical assets or liabilities (Level 1 measurements) and the lowest priority to unobservable inputs (Level 3 measurements). Accordingly, the degree of judgment exercised in determining fair value is greatest for instruments categorized in Level 3. The inputs used to measure fair value may fall into different levels of the fair value hierarchy. In such cases, for disclosure purposes, the fair value hierarchy classification is determined based on the lowest level input that is significant to the fair value measurement in its entirety. The categorization of a value determined for investments and derivative financial instruments is based on the pricing transparency of the investment and derivative financial instruments and is not necessarily an indication of the risks associated with investing in those securities. The three levels of the fair value hierarchy are as follows: |
| | • | | Level 1 — unadjusted quoted prices in active markets/exchanges for identical assets or liabilities that the Fund has the ability to access |
| | • | | Level 2 — other observable inputs (including, but not limited to, quoted prices for similar assets or liabilities in markets that are active, quoted prices for identical or similar assets or liabilities in markets that are not active, inputs other than quoted prices that are observable for the assets or liabilities (such as interest rates, yield curves, volatilities, prepayment speeds, loss severities, credit risks and default rates) or other market–corroborated inputs) |
| | • | | Level 3 — unobservable inputs based on the best information available in the circumstances, to the extent observable inputs are not available (including the Fund’s own assumptions used in determining the fair value of investments and derivative financial instruments) |
Changes in valuation techniques may result in transfers into or out of an assigned level within the disclosure hierarchy. In accordance with the Fund’s policy, transfers between different levels of the fair value disclosure hierarchy are deemed to have occurred as of the beginning of the reporting period. For information about the Fund’s policy regarding valuation of investments and derivative financial instruments, refer to Note 2 of the Notes to Financial Statements.
See Notes to Financial Statements.
| | | | | | |
| | | BLACKROCK ALLOCATION TARGET SHARES | | MARCH 31, 2015 | | 33 |
| | | | |
| Schedule of Investments (concluded) | | | Series M Portfolio | |
As of March 31, 2015, the following tables summarize the Fund’s investments and derivative financial instruments categorized in the disclosure hierarchy:
| | | | | | | | | | | | | | | | | | | | |
| | | Level 1 | | Level 2 | | Level 3 | | Total |
Assets: | | | | | | | | | | | | | | | | | | | | |
Investments: | | | | | | | | | | | | | | | | | | | | |
Long-Term Investments: | | | | | | | | | | | | | | | | | | | | |
Asset-Backed Securities | | | | — | | | | $ | 9,019,624 | | | | | — | | | | $ | 9,019,624 | |
Non-Agency Mortgage-Backed Securities | | | | — | | | | | 38,932,501 | | | | $ | 3,212,098 | | | | | 42,144,599 | |
U.S. Government Sponsored Agency Securities | | | | — | | | | | 805,581,883 | | | | | — | | | | | 805,581,883 | |
U.S. Treasury Obligations | | | | — | | | | | 3,274,653 | | | | | — | | | | | 3,274,653 | |
Short-Term Securities | | | $ | 209,714,050 | | | | | — | | | | | — | | | | | 209,714,050 | |
Liabilities: | | | | | | | | | | | | | | | | | | | | |
Investments: | | | | | | | | | | | | | | | | | | | | |
TBA Sale Commitments | | | | — | | | | | (353,986,432 | ) | | | | — | | | | | (353,986,432 | ) |
| | | | | |
Total | | | $ | 209,714,050 | | | | $ | 502,822,229 | | | | $ | 3,212,098 | | | | $ | 715,748,377 | |
| | | | | |
| | | | | | | | | | | | | | | | | | | | |
| | | Level 1 | | Level 2 | | Level 3 | | Total |
Derivative Financial Instruments1 | | | | | | | | | | | | | | | | | | | | |
Assets: | | | | | | | | | | | | | | | | | | | | |
Interest rate contracts | | | $ | 90,714 | | | | $ | 1,132 | | | | | — | | | | $ | 91,846 | |
Liabilities: | | | | | | | | | | | | | | | | | | | | |
Interest rate contracts | | | | (168,725 | ) | | | | (15,848 | ) | | | | — | | | | | (184,573 | ) |
| | | | | |
Total | | | $ | (78,011 | ) | | | $ | (14,716 | ) | | | | — | | | | $ | (92,727 | ) |
| | | | | |
1 Derivative financial instruments are swaps and financial futures contracts, which are valued at the unrealized appreciation/depreciation on the instrument. | |
|
| The Fund may hold assets and/or liabilities in which the fair value approximates the carrying amount for financial statement purposes. As of March 31, 2015, such assets are categorized within the disclosure hierarchy as follows: | |
| | | | | | | | | | | | | | | | | | | | |
| | | Level 1 | | Level 2 | | Level 3 | | Total |
Assets: | | | | | | | | | | | | | | | | | | | | |
Cash | | | $ | 649,089 | | | | | — | | | | | — | | | | $ | 649,089 | |
Cash pledged for financial futures contracts | | | | 253,000 | | | | | — | | | | | — | | | | | 253,000 | |
Cash pledged for centrally cleared swaps | | | | 20,000 | | | | | — | | | | | — | | | | | 20,000 | |
| | | | | |
Total | | | $ | 922,089 | | | | | — | | | | | — | | | | $ | 922,089 | |
| | | | | |
|
| During the year ended March 31, 2015, there were no transfers between levels. | |
See Notes to Financial Statements.
| | | | | | |
| 34 | | BLACKROCK ALLOCATION TARGET SHARES | | MARCH 31, 2015 | | |
| | | | |
| Schedule of Investments March 31, 2015 | | | Series P Portfolio | |
| | | (Percentages shown are based on Net Assets) | |
| | | | | | | | |
| Affiliated Investment Companies (a) | | Shares | | | Value | |
Fixed Income Funds — 29.5% | | | | | | | | |
BlackRock Allocation Target Shares: Series S Portfolio | | | 9,740,810 | | | $ | 95,070,306 | |
| | | | | | |
| | | | | Value | |
Total Affiliated Investment Companies (Cost — $95,709,987) — 29.5% | | | | $ | 95,070,306 | |
Other Assets Less Liabilities — 70.5% | | | | | 227,427,261 | |
| | | | | | |
Net Assets — 100.0% | | | | $ | 322,497,567 | |
| | | | | | |
|
| Notes to Schedule of Investments |
| (a) | During the year ended March 31, 2015, investments in issuers considered to be an affiliate of the Fund for purposes of Section 2(a)(3) of the Investment Company Act of 1940, as amended, were as follows: |
| | | | | | | | | | | | | | | | | | | | |
| Affiliate | | Shares Held at
March 31, 2014 | | | Shares
Purchased | | | Shares Held at
March 31, 2015 | | | Value at
March 31, 2015 | | | Income | |
BlackRock Allocation Target Shares: Series S Portfolio | | | 6,350,110 | | | | 3,390,700 | | | | 9,740,810 | | | $ | 95,070,306 | | | $ | 1,909,044 | |
| • | | As of March 31, 2015, financial futures contracts outstanding were as follows: |
| | | | | | | | | | | | | | | | | | |
Contracts
Long/
(Short) | | | Issue | | Exchange | | Expiration | | | Notional Value | | | Unrealized
Appreciation
(Depreciation) | |
| | 415 | | | U.S. Treasury Notes (5 Year) | | Chicago Board of Trade | | | June 2015 | | | $ | 49,887,539 | | | $ | 345,014 | |
| | (184 | ) | | U.S. Treasury Notes (2 Year) | | Chicago Board of Trade | | | June 2015 | | | $ | 40,324,750 | | | | (53,690 | ) |
| | (1,450 | ) | | U.S. Treasury Notes (10 Year) | | Chicago Board of Trade | | | June 2015 | | | $ | 186,914,063 | | | | (2,316,268 | ) |
| | Total | | | | | | | | | | | | | | | $ | (2,024,944 | ) |
| | | | | | | | | | | | | | | | | | |
| • | | As of March 31, 2015, centrally cleared interest rate swaps outstanding were as follows: |
| | | | | | | | | | | | | | | | |
Fixed
Rate | | Floating Rate | | Clearinghouse | | Expiration
Date | | | Notional
Amount
(000) | | | Unrealized
Depreciation | |
| 0.93%1 | | 3-month LIBOR | | Chicago Mercantile | | | 3/20/17 | | | $ | 40,000 | | | $ | (119,254 | ) |
| 1.25%1 | | 3-month LIBOR | | Chicago Mercantile | | | 3/18/18 | | | $ | 40,000 | | | | (191,447 | ) |
| 2.10%1 | | 3-month LIBOR | | Chicago Mercantile | | | 3/18/25 | | | $ | 155,000 | | | | (1,126,530 | ) |
| Total | | | | | | | | | | | | | | $ | (1,437,231 | ) |
| | | | | | | | | | | | | | | | |
| | 1 | | Fund pays the fixed rate and receives the floating rate. |
| • | | Fair Value Measurements — Various inputs are used in determining the fair value of investments and derivative financial instruments. These inputs to valuation techniques are categorized into a disclosure hierarchy consisting of three broad levels for financial statement purposes. The hierarchy gives the highest priority to unadjusted quoted prices in active markets for identical assets or liabilities (Level 1 measurements) and the lowest priority to unobservable inputs (Level 3 measurements). Accordingly, the degree of judgment exercised in determining fair value is greatest for instruments categorized in Level 3. The inputs used to measure fair value may fall into different levels of the fair value hierarchy. In such cases, for disclosure purposes, the fair value hierarchy classification is determined based on the lowest level input that is significant to the fair value measurement in its entirety. The categorization of a value determined for investments and derivative financial instruments is based on the pricing transparency of the investment and derivative financial instruments and is not necessarily an indication of the risks associated with investing in those securities. The three levels of the fair value hierarchy are as follows: |
| | • | | Level 1 — unadjusted quoted prices in active markets/exchanges for identical assets or liabilities that the Fund has the ability to access |
| | • | | Level 2 — other observable inputs (including, but not limited to, quoted prices for similar assets or liabilities in markets that are active, quoted prices for identical or similar assets or liabilities in markets that are not active, inputs other than quoted prices that are observable for the assets or liabilities (such as interest rates, yield curves, volatilities, prepayment speeds, loss severities, credit risks and default rates) or other market–corroborated inputs) |
| | • | | Level 3 — unobservable inputs based on the best information available in the circumstances, to the extent observable inputs are not available (including the Fund’s own assumptions used in determining the fair value of investments and derivative financial instruments) |
Changes in valuation techniques may result in transfers into or out of an assigned level within the disclosure hierarchy. In accordance with the Fund’s policy, transfers between different levels of the fair value disclosure hierarchy are deemed to have occurred as of the beginning of the reporting period. For information about the Fund’s policy regarding valuation of investments and derivative financial instruments, refer to Note 2 of the Notes to Financial Statements.
See Notes to Financial Statements.
| | | | | | |
| | | BLACKROCK ALLOCATION TARGET SHARES | | MARCH 31, 2015 | | 35 |
| | | | |
| Schedule of Investments (concluded) | | | Series P Portfolio | |
As of March 31, 2015, the following tables summarize the Fund’s investments and derivative financial instruments categorized in the disclosure hierarchy:
| | | | | | | | | | | | | | | | | | | | |
| | | Level 1 | | Level 2 | | Level 3 | | Total |
Assets: | | | | | | | | | | | | | | | | | | | | |
Investments: | | | | | | | | | | | | | | | | | | | | |
Long-Term Investments: | | | | | | | | | | | | | | | | | | | | |
Affiliated Investment Companies | | | $ | 95,070,306 | | | | | — | | | | | — | | | | $ | 95,070,306 | |
| | | | | |
| | | | | | | | | | | | | | | | | | | | |
| | | Level 1 | | Level 2 | | Level 3 | | Total |
Derivative Financial Instruments1 | | | | | | | | | | | | | | | | | | | | |
Assets: | | | | | | | | | | | | | | | | | | | | |
Interest rate contracts | | | $ | 345,014 | | | | | — | | | | | — | | | | $ | 345,014 | |
Liabilities: | | | | | | | | | | | | | | | | | | | | |
Interest rate contracts | | | | (2,369,958 | ) | | | $ | (1,437,232 | ) | | | | — | | | | | (3,807,190 | ) |
| | | | | |
Total | | | $ | (2,024,944 | ) | | | $ | (1,437,232 | ) | | | | — | | | | $ | (3,462,176 | ) |
| | | | | |
1 Derivative financial instruments are swaps and financial futures contracts, which are valued at the unrealized appreciation/depreciation on the instrument. | |
|
| The Fund may hold assets and/or liabilities in which the fair value approximates the carrying amount for financial statement purposes. As of March 31, 2015, such assets are categorized within the disclosure hierarchy as follows: | |
| | | | | | | | | | | | | | | | | | | | |
| | | Level 1 | | Level 2 | | Level 3 | | Total |
Assets: | | | | | | | | | | | | | | | | | | | | |
Cash | | | $ | 219,081,066 | | | | | — | | | | | — | | | | $ | 219,081,066 | |
Cash pledged for financial futures contracts | | | | 1,961,000 | | | | | — | | | | | — | | | | | 1,961,000 | |
Cash pledged for centrally cleared swaps | | | | 6,381,000 | | | | | — | | | | | — | | | | | 6,381,000 | |
| | | | | |
Total | | | $ | 227,423,066 | | | | | — | | | | | — | | | | $ | 227,423,066 | |
| | | | | |
During the year ended March 31, 2015, there were no transfers between levels.
See Notes to Financial Statements.
| | | | | | |
| 36 | | BLACKROCK ALLOCATION TARGET SHARES | | MARCH 31, 2015 | | |
| | | | |
| Schedule of Investments March 31, 2015 | | | Series S Portfolio | |
| | | (Percentages shown are based on Net Assets) | |
| | | | | | | | |
| Asset-Backed Securities | | Par
(000) | | | Value | |
American Express Credit Account Master Trust, Series 2013-3, Class A, 0.98%, 5/15/19 | | $ | 750 | | | $ | 751,321 | |
AmeriCredit Automobile Receivables Trust: | | | | | | | | |
Series 2011-3, Class D, 4.04%, 7/10/17 | | | 669 | | | | 680,750 | |
Series 2013-2, Class B, 1.19%, 5/08/18 | | | 480 | | | | 481,512 | |
Series 2013-2, Class C, 1.79%, 3/08/19 | | | 575 | | | | 575,003 | |
Series 2013-4, Class A3, 0.96%, 4/09/18 | | | 800 | | | | 801,002 | |
Series 2013-4, Class B, 1.66%, 9/10/18 | | | 300 | | | | 302,153 | |
Series 2013-4, Class C, 2.72%, 9/09/19 | | | 300 | | | | 305,788 | |
Series 2013-5, Class C, 2.29%, 11/08/19 | | | 545 | | | | 548,741 | |
BA Credit Card Trust, Series 2014-A1, Class A, 0.55%, 6/15/21 (a) | | | 990 | | | | 989,487 | |
Cabela’s Credit Card Master Note Trust: | | | | | | | | |
Series 2012-2A, Class A1, 1.45%, 6/15/20 (b) | | | 1,515 | | | | 1,522,251 | |
Series 2015-1A, Class A1, 2.26%, 3/15/23 | | | 880 | | | | 889,756 | |
Capital One Multi-Asset Execution Trust: | | | | | | | | |
Series 2014-A5, Class A, 1.48%, 7/15/20 | | | 2,465 | | | | 2,483,118 | |
Series 2015-A1, Class A, 1.39%, 1/15/21 | | | 2,490 | | | | 2,491,556 | |
CarMax Auto Owner Trust, Series 2015-1, Class A3, 1.38%, 11/15/19 | | | 2,005 | | | | 2,011,665 | |
Chase Issuance Trust: | | | | | | | | |
Series 2012-A4, Class A4, 1.58%, 8/16/21 | | | 1,340 | | | | 1,326,667 | |
Series 2015-A2, Class A, 1.59%, 2/18/20 | | | 3,000 | | | | 3,021,198 | |
Chesapeake Funding LLC, Series 2012-1A, Class A, 0.92%, 11/07/23 (a)(b) | | | 98 | | | | 98,012 | |
Citibank Credit Card Issuance Trust: | | | | | | | | |
Series 2007-A8, Class A8, 5.65%, 9/20/19 | | | 3,715 | | | | 4,115,967 | |
Series 2013-A6, Class A6, 1.32%, 9/07/18 | | | 348 | | | | 350,573 | |
CNH Equipment Trust: | | | | | | | | |
Series 2012-B, Class A4, 1.16%, 6/15/20 | | | 1,750 | | | | 1,756,541 | |
Series 2014-A, Class A4, 1.50%, 5/15/20 | | | 1,850 | | | | 1,855,779 | |
Series 2015-A, Class A3, 1.30%, 4/15/20 | | | 1,785 | | | | 1,788,402 | |
Credit Acceptance Auto Loan Trust: | | | | | | | | |
Series 2013-1A, Class A, 1.21%, 10/15/20 (b) | | | 770 | | | | 770,506 | |
Series 2013-2A, Class A, 1.50%, 4/15/21 (b) | | | 1,150 | | | | 1,153,353 | |
Drive Auto Receivables Trust, Series 2015-AA, Class A3, 1.43%, 7/16/18 (b) | | | 1,070 | | | | 1,069,893 | |
Ford Credit Auto Owner Trust: | | | | | | | | |
Series 2014-C, Class A3, 1.06%, 5/15/19 | | | 1,545 | | | | 1,547,898 | |
Series 2015-A, Class A3, 1.28%, 9/15/19 | | | 1,115 | | | | 1,116,673 | |
Ford Credit Floorplan Master Owner Trust: | | | | | | | | |
Series 2012-2, Class D, 3.50%, 1/15/19 | | | 965 | | | | 999,429 | |
Series 2014-1, Class A1, 1.20%, 2/15/19 | | | 1,715 | | | | 1,719,631 | |
Series 2015-1, Class A2, 0.57%, 1/15/20 (a) | | | 2,480 | | | | 2,481,565 | |
Honda Auto Receivables Owner Trust, Series 2013-3, Class A4, 1.13%, 9/16/19 | | | 775 | | | | 777,778 | |
Invitation Homes Trust, Series 2015-SFR1, Class A, 1.62%, 3/17/32 (a)(b) | | | 1,800 | | | | 1,808,702 | |
| | | | | | | | |
| Asset-Backed Securities | | Par
(000) | | | Value | |
MOTOR PLC, Series 2015-1A, Class A1,
0.80%, 6/25/22 (a)(b) | | $ | 725 | | | $ | 725,073 | |
OneMain Financial Issuance Trust: | | | | | | | | |
Series 2014-1A, Class A, 2.43%, 6/18/24 (b) | | | 1,595 | | | | 1,597,408 | |
Series 2014-2A, Class A, 2.47%, 9/18/24 (b) | | | 3,765 | | | | 3,755,324 | |
Series 2015-1A, Class A, 3.19%, 3/18/26 (b) | | | 1,645 | | | | 1,659,904 | |
Series 2015-1A, Class B, 3.85%, 3/18/26 (b) | | | 555 | | | | 558,119 | |
PFS Financing Corp., Series 2014-AA, Class A, 0.77%, 2/15/19 (a)(b) | | | 1,050 | | | | 1,047,099 | |
Prestige Auto Receivables Trust, Series 2013-1A, Class B, 1.74%, 5/15/19 (b) | | | 1,300 | | | | 1,306,200 | |
Progress Residential Trust, Series 2015-SFR1, Class A, 1.57%, 2/17/32 (a)(b) | | | 1,185 | | | | 1,188,359 | |
Santander Drive Auto Receivables Trust: | | | | | | | | |
Series 2012-1, Class C, 3.78%, 11/15/17 | | | 251 | | | | 252,978 | |
Series 2012-3, Class C, 3.01%, 4/16/18 | | | 1,075 | | | | 1,085,081 | |
Series 2012-5, Class C, 2.70%, 8/15/18 | | | 160 | | | | 162,314 | |
Series 2012-6, Class C, 1.94%, 3/15/18 | | | 145 | | | | 145,869 | |
Series 2012-AA, Class A3, 0.65%, 3/15/17 (b) | | | 9 | | | | 9,493 | |
Series 2012-AA, Class B, 1.21%, 10/16/17 (b) | | | 555 | | | | 555,395 | |
Series 2012-AA, Class C, 1.78%, 11/15/18 (b) | | | 1,330 | | | | 1,334,584 | |
Series 2013-1, Class C, 1.76%, 1/15/19 | | | 1,315 | | | | 1,319,437 | |
Series 2013-3, Class C, 1.81%, 4/15/19 | | | 450 | | | | 450,671 | |
Series 2013-A, Class C, 3.12%, 10/15/19 (b) | | | 720 | | | | 737,744 | |
Series 2014-S1, Class R, 1.42%, 8/16/18 (b) | | | 483 | | | | 480,957 | |
Series 2015-1, Class A3, 1.27%, 2/15/19 | | | 1,020 | | | | 1,022,052 | |
SLM Private Credit Student Loan Trust: | | | | | | | | |
Series 2003-B, Class A2, 0.63%, 3/15/22 (a) | | | 243 | | | | 240,984 | |
Series 2004-B, Class A2, 0.43%, 6/15/21 (a) | | | 314 | | | | 311,681 | |
SLM Private Education Loan Trust: | | | | | | | | |
Series 2011-C, Class A1, 1.57%, 12/15/23 (a)(b) | | | 630 | | | | 632,862 | |
Series 2012-B, Class A1, 1.27%, 12/15/21 (a)(b) | | | 50 | | | | 49,932 | |
Series 2012-C, Class A1, 1.27%, 8/15/23 (a)(b) | | | 301 | | | | 302,335 | |
Series 2012-E, Class A1, 0.92%, 10/16/23 (a)(b) | | | 552 | | | | 553,329 | |
Series 2013-A, Class A1, 0.76%, 8/15/22 (a)(b) | | | 1,423 | | | | 1,424,042 | |
Series 2013-C, Class A1, 1.02%, 2/15/22 (a)(b) | | | 601 | | | | 602,767 | |
SLM Student Loan Trust: | | | | | | | | |
Series 2008-5, Class A4, 1.93%, 7/25/23 (a) | | | 1,125 | | | | 1,170,826 | |
Series 2013-4, Class A, 0.72%, 6/25/27 (a) | | | 610 | | | | 611,998 | |
SoFi Professional Loan Program LLC, Series 2015-A, Class A1, 1.42%, 3/25/33 (a)(b) | | | 3,817 | | | | 3,817,760 | |
Springleaf Funding Trust, Series 2015-AA, Class A, 3.16%, 11/15/24 (b) | | | 1,955 | | | | 1,973,531 | |
Synchrony Credit Card Master Note Trust, Series 2015-1, Class A, 2.37%, 3/15/23 | | | 1,185 | | | | 1,200,349 | |
See Notes to Financial Statements.
| | | | | | |
| | | BLACKROCK ALLOCATION TARGET SHARES | | MARCH 31, 2015 | | 37 |
| | | | |
| Schedule of Investments (continued) | | | Series S Portfolio | |
| | | (Percentages shown are based on Net Assets) | |
| | | | | | | | |
| Asset-Backed Securities | | Par
(000) | | | Value | |
Toyota Auto Receivables Owner Trust, Series 2013-A, Class A4, 0.69%, 11/15/18 | | $ | 775 | | | $ | 773,441 | |
World Financial Network Credit Card Master Trust: | | | | | | | | |
Series 2012-C, Class A, 2.23%, 8/15/22 | | | 930 | | | | 946,985 | |
Series 2012-D, Class B, 3.34%, 4/17/23 | | | 330 | | | | 342,080 | |
Total Asset-Backed Securities — 28.9% | | | | | | | 76,941,633 | |
| | | | | | | | |
| Corporate Bonds | | | | | | |
Air Freight & Logistics — 0.1% | | | | | | | | |
Federal Express Corp. Pass-Through Trust, Series 2012, 2.63%, 1/15/18 (b) | | | 147 | | | | 149,765 | |
Airlines — 0.6% | | | | | | | | |
Continental Airlines Pass-Through Trust, Series 2009-1, 9.00%, 7/08/16 | | | 500 | | | | 541,594 | |
UAL Pass-Through Trust: | | | | | | | | |
10.40%, 5/01/18 | | | 207 | | | | 225,605 | |
9.75%, 7/15/18 | | | 290 | | | | 321,540 | |
Virgin Australia Trust, Series 2013-1A, 5.00%, 10/23/25 (b) | | | 515 | | | | 542,491 | |
| | | | | | | | |
| | | | | | | | 1,631,230 | |
Auto Components — 0.1% | | | | | | | | |
Icahn Enterprises LP/Icahn Enterprises Finance Corp., 3.50%, 3/15/17 | | | 350 | | | | 352,625 | |
Automobiles — 0.6% | | | | | | | | |
Daimler Finance North America LLC: | | | | | | | | |
1.30%, 7/31/15 (b) | | | 590 | | | | 591,569 | |
1.45%, 8/01/16 (b) | | | 300 | | | | 302,011 | |
1.65%, 3/02/18 (b) | | | 755 | | | | 759,196 | |
| | | | | | | | |
| | | | | | | | 1,652,776 | |
Banks — 13.4% | | | | | | | | |
ABN AMRO Bank NV, 1.06%, 10/28/16 (a)(b) | | | 550 | | | | 553,669 | |
Amsouth Bank, Series AI, 5.20%, 4/01/15 | | | 800 | | | | 800,000 | |
ANZ New Zealand International Ltd., 1.75%, 3/29/18 (b) | | | 1,250 | | | | 1,252,395 | |
Bank of America Corp.: | | | | | | | | |
6.50%, 8/01/16 | | | 1,107 | | | | 1,181,445 | |
1.70%, 8/25/17 (c) | | | 1,500 | | | | 1,505,801 | |
2.60%, 1/15/19 | | | 1,000 | | | | 1,017,792 | |
2.65%, 4/01/19 (c) | | | 1,673 | | | | 1,704,677 | |
Citigroup, Inc.: | | | | | | | | |
1.80%, 2/05/18 (c) | | | 1,000 | | | | 1,002,088 | |
2.55%, 4/08/19 | | | 1,000 | | | | 1,019,452 | |
JPMorgan Chase & Co.: | | | | | | | | |
5.15%, 10/01/15 (c) | | | 680 | | | | 694,090 | |
2.60%, 1/15/16 (c) | | | 940 | | | | 952,980 | |
3.45%, 3/01/16 | | | 573 | | | | 586,001 | |
3.15%, 7/05/16 (c) | | | 939 | | | | 963,372 | |
2.35%, 1/28/19 | | | 2,250 | | | | 2,286,880 | |
2.25%, 1/23/20 (c) | | | 1,250 | | | | 1,252,677 | |
National Australia Bank Ltd., 2.00%, 6/20/17 (b) | | | 2,000 | | | | 2,038,106 | |
Regions Financial Corp., 2.00%, 5/15/18 | | | 1,000 | | | | 999,074 | |
Royal Bank of Canada, 1.20%, 9/19/17 | | | 7,485 | | | | 7,488,765 | |
Santander Bank N.A., 8.75%, 5/30/18 | | | 650 | | | | 767,358 | |
The Toronto-Dominion Bank, 1.50%, 3/13/17 (b) | | | 7,385 | | | | 7,463,517 | |
| | | | | | | | |
| | | | | | | | 35,530,139 | |
Beverages — 0.4% | | | | | | | | |
SABMiller Holdings, Inc., 2.45%, 1/15/17 (b) | | | 1,000 | | | | 1,021,940 | |
| | | | | | | | |
| Corporate Bonds | | Par
(000) | | | Value | |
Capital Markets — 4.5% | | | | | | | | |
The Bank of New York Mellon Corp., 2.15%, 2/24/20 | | $ | 300 | | | $ | 302,449 | |
Credit Suisse AG, 1.38%, 5/26/17 (c) | | | 2,090 | | | | 2,093,766 | |
Credit Suisse Group Funding Guernsey Ltd., 2.75%, 3/26/20 (b) | | | 315 | | | | 316,797 | |
Deutsche Bank AG, 1.88%, 2/13/18 | | | 450 | | | | 450,634 | |
The Goldman Sachs Group, Inc.: | | | | | | | | |
5.35%, 1/15/16 | | | 489 | | | | 505,755 | |
3.63%, 2/07/16 (c) | | | 1,761 | | | | 1,798,680 | |
5.95%, 1/18/18 (c) | | | 1,800 | | | | 2,004,251 | |
2.63%, 1/31/19 | | | 750 | | | | 766,249 | |
2.60%, 4/23/20 | | | 799 | | | | 807,501 | |
Morgan Stanley: | | | | | | | | |
5.75%, 10/18/16 | | | 250 | | | | 266,731 | |
1.88%, 1/05/18 (c) | | | 1,000 | | | | 1,006,842 | |
6.63%, 4/01/18 | | | 750 | | | | 853,014 | |
2.38%, 7/23/19 | | | 750 | | | | 755,596 | |
Murray Street Investment Trust I, 4.65%, 3/09/17 (d) | | | 140 | | | | 148,359 | |
| | | | | | | | |
| | | | | | | | 12,076,624 | |
Chemicals — 0.2% | | | | | | | | |
Lubrizol Corp., 8.88%, 2/01/19 | | | 423 | | | | 527,912 | |
Commercial Services & Supplies — 0.4% | | | | | | | | |
Aviation Capital Group Corp.: | | | | | | | | |
3.88%, 9/27/16 (b) | | | 900 | | | | 919,177 | |
4.63%, 1/31/18 (b) | | | 200 | | | | 208,633 | |
| | | | | | | | |
| | | | | | | | 1,127,810 | |
Consumer Finance — 3.5% | | | | | | | | |
American Express Credit Corp.: | | | | | | | | |
2.75%, 9/15/15 | | | 1,005 | | | | 1,014,754 | |
1.30%, 7/29/16 | | | 1,260 | | | | 1,267,239 | |
2.80%, 9/19/16 | | | 500 | | | | 514,053 | |
Capital One Financial Corp.: | | | | | | | | |
3.15%, 7/15/16 | | | 800 | | | | 820,451 | |
5.25%, 2/21/17 | | | 1,000 | | | | 1,071,810 | |
2.45%, 4/24/19 | | | 1,464 | | | | 1,481,410 | |
Ford Motor Credit Co. LLC: | | | | | | | | |
4.21%, 4/15/16 | | | 100 | | | | 102,858 | |
3.98%, 6/15/16 | | | 120 | | | | 123,723 | |
8.00%, 12/15/16 | | | 500 | | | | 553,903 | |
1.72%, 12/06/17 | | | 2,000 | | | | 1,995,572 | |
Synchrony Financial, 1.88%, 8/15/17 | | | 405 | | | | 405,328 | |
| | | | | | | | |
| | | | | | | | 9,351,101 | |
Diversified Financial Services — 1.1% | | | | | | | | |
International Lease Finance Corp.: | | | | | | | | |
6.75%, 9/01/16 (b) | | | 527 | | | | 559,937 | |
7.13%, 9/01/18 (b) | | | 210 | | | | 235,725 | |
Moody’s Corp., 2.75%, 7/15/19 | | | 690 | | | | 705,341 | |
Voya Financial, Inc., 2.90%, 2/15/18 | | | 1,502 | | | | 1,549,774 | |
| | | | | | | | |
| | | | | | | | 3,050,777 | |
Diversified Telecommunication Services — 0.9% | | | | | | | | |
AT&T Inc., 0.90%, 2/12/16 | | | 1,040 | | | | 1,041,649 | |
Verizon Communications, Inc., 2.50%, 9/15/16 | | | 1,300 | | | | 1,327,667 | |
| | | | | | | | |
| | | | | | | | 2,369,316 | |
Electric Utilities — 0.9% | | | | | | | | |
Ohio Power Co., 6.05%, 5/01/18 | | | 1,275 | | | | 1,437,898 | |
Progress Energy, Inc., 5.63%, 1/15/16 | | | 1,000 | | | | 1,037,388 | |
| | | | | | | | |
| | | | | | | | 2,475,286 | |
See Notes to Financial Statements.
| | | | | | |
| 38 | | BLACKROCK ALLOCATION TARGET SHARES | | MARCH 31, 2015 | | |
| | | | |
| Schedule of Investments (continued) | | | Series S Portfolio | |
| | | (Percentages shown are based on Net Assets) | |
| | | | | | | | |
Corporate Bonds | | Par
(000) | | | Value | |
Electronic Equipment, Instruments & Components — 0.1% | |
Jabil Circuit, Inc., 7.75%, 7/15/16 | | $ | 354 | | | $ | 379,665 | |
Health Care Equipment & Supplies — 0.2% | | | | | | | | |
Boston Scientific Corp., 6.25%, 11/15/15 | | | 425 | | | | 438,255 | |
Health Care Providers & Services — 0.3% | | | | | | | | |
Anthem, Inc.: | | | | | | | | |
1.25%, 9/10/15 | | | 306 | | | | 306,731 | |
2.38%, 2/15/17 | | | 500 | | | | 510,305 | |
| | | | | | | | |
| | | | | | | | 817,036 | |
Insurance — 1.9% | | | | | | | | |
AIA Group Ltd., 2.25%, 3/11/19 (b) | | | 500 | | | | 503,335 | |
AXIS Specialty Finance PLC, 2.65%, 4/01/19 | | | 736 | | | | 744,865 | |
The Hartford Financial Services Group, Inc., 4.00%, 10/15/17 | | | 477 | | | | 507,936 | |
Jackson National Life Global Funding, 2.30%, 4/16/19 (b) | | | 800 | | | | 809,532 | |
Lincoln National Corp., 4.30%, 6/15/15 (c) | | | 810 | | | | 815,346 | |
Marsh & McLennan Cos., Inc., 2.30%, 4/01/17 | | | 1,000 | | | | 1,020,029 | |
New York Life Global Funding, 1.95%, 2/11/20 (b) | | | 705 | | | | 705,123 | |
| | | | | | | | |
| | | | | | | | 5,106,166 | |
IT Services — 0.3% | | | | | | | | |
Computer Sciences Corp., 2.50%, 9/15/15 | | | 345 | | | | 347,460 | |
The Western Union Co., 2.38%, 12/10/15 | | | 500 | | | | 504,211 | |
| | | | | | | | |
| | | | | | | | 851,671 | |
Life Sciences Tools & Services — 0.9% | | | | | | | | |
Life Technologies Corp., 3.50%, 1/15/16 | | | 1,225 | | | | 1,249,087 | |
Thermo Fisher Scientific, Inc., 2.25%, 8/15/16 | | | 1,250 | | | | 1,271,431 | |
| | | | | | | | |
| | | | | | | | 2,520,518 | |
Machinery — 0.2% | | | | | | | | |
Pentair Finance SA, 1.35%, 12/01/15 | | | 400 | | | | 400,966 | |
Media — 2.3% | | | | | | | | |
British Sky Broadcasting Group PLC, 6.10%, 2/15/18 (b) | | | 278 | | | | 309,720 | |
COX Communications, Inc., 6.25%, 6/01/18 (b) | | | 1,000 | | | | 1,135,974 | |
DIRECTV Holdings LLC/DIRECTV Financing Co., Inc.: | | | | | | | | |
3.13%, 2/15/16 | | | 1,576 | | | | 1,605,901 | |
2.40%, 3/15/17 | | | 295 | | | | 300,293 | |
The Interpublic Group of Cos., Inc., 2.25%, 11/15/17 | | | 942 | | | | 949,570 | |
Omnicom Group, Inc., 5.90%, 4/15/16 | | | 254 | | | | 265,874 | |
Sky PLC, 2.63%, 9/16/19 (b) | | | 1,255 | | | | 1,274,483 | |
Time Warner Cable, Inc., 5.85%, 5/01/17 | | | 135 | | | | 146,836 | |
| | | | | | | | |
| | | | | | | | 5,988,651 | |
Metals & Mining — 0.2% | | | | | | | | |
Rio Tinto Finance USA Ltd., 1.88%, 11/02/15 | | | 510 | | | | 511,893 | |
Multi-Utilities — 0.1% | | | | | | | | |
CenterPoint Energy, Inc., Series B, 6.85%, 6/01/15 | | | 375 | | | | 378,575 | |
Oil, Gas & Consumable Fuels — 1.2% | | | | | | | | |
Enterprise Products Operating LLC, Series A, 8.38%, 8/01/66 (a) | | | 660 | | | | 695,475 | |
Kinder Morgan Energy Partners LP, 5.95%, 2/15/18 | | | 311 | | | | 343,822 | |
Kinder Morgan, Inc.: | | | | | | | | |
7.00%, 6/15/17 | | | 281 | | | | 309,954 | |
2.00%, 12/01/17 | | | 185 | | | | 184,712 | |
3.05%, 12/01/19 | | | 300 | | | | 302,977 | |
| | | | | | | | |
| Corporate Bonds | | Par
(000) | | | Value | |
Oil, Gas & Consumable Fuels (concluded) | | | | | | | | |
Pioneer Natural Resources Co., 5.88%, 7/15/16 | | $ | 1,290 | | | $ | 1,361,666 | |
| | | | | | | | |
| | | | | | | | 3,198,606 | |
Pharmaceuticals — 1.5% | | | | | | | | |
Actavis Funding SCS, 2.35%, 3/12/18 | | | 1,295 | | | | 1,312,514 | |
Actavis, Inc., 1.88%, 10/01/17 | | | 1,684 | | | | 1,687,909 | |
Mylan, Inc., 7.88%, 7/15/20 (b) | | | 569 | | | | 601,155 | |
Zoetis, Inc., 1.15%, 2/01/16 | | | 250 | | | | 250,069 | |
| | | | | | | | |
| | | | | | | | 3,851,647 | |
Professional Services — 0.1% | | | | | | | | |
Experian Finance PLC, 2.38%, 6/15/17 (b)(c) | | | 290 | | | | 292,703 | |
Real Estate Investment Trusts (REITs) — 4.5% | | | | | | | | |
ARC Properties Operating Partnership LP, 2.00%, 2/06/17 | | | 1,751 | | | | 1,697,595 | |
ERP Operating LP: | | | | | | | | |
6.58%, 4/13/15 | | | 900 | | | | 901,038 | |
5.13%, 3/15/16 | | | 432 | | | | 449,029 | |
HCP, Inc.: | | | | | | | | |
3.75%, 2/01/16 | | | 130 | | | | 132,952 | |
6.00%, 1/30/17 | | | 750 | | | | 809,974 | |
3.75%, 2/01/19 | | | 800 | | | | 843,335 | |
Health Care REIT, Inc.: | | | | | | | | |
6.20%, 6/01/16 | | | 600 | | | | 635,542 | |
4.70%, 9/15/17 | | | 1,450 | | | | 1,557,597 | |
Host Hotels & Resorts LP, 5.88%, 6/15/19 | | | 1,070 | | | | 1,110,438 | |
Prologis LP: | | | | | | | | |
4.50%, 8/15/17 | | | 300 | | | | 321,190 | |
4.00%, 1/15/18 | | | 1,400 | | | | 1,479,477 | |
Ventas Realty LP, 1.55%, 9/26/16 | | | 1,343 | | | | 1,351,916 | |
Ventas Realty LP/Ventas Capital Corp., 2.00%, 2/15/18 | | | 657 | | | | 663,322 | |
| | | | | | | | |
| | | | | | | | 11,953,405 | |
Road & Rail — 1.6% | | | | | | | | |
Kansas City Southern de Mexico SA de CV, 0.96%, 10/28/16 (a) | | | 850 | | | | 848,140 | |
Penske Truck Leasing Co. LP/PTL Finance Corp.: | | | | | | | | |
3.13%, 5/11/15 (b) | | | 818 | | | | 819,729 | |
3.75%, 5/11/17 (b) | | | 90 | | | | 93,868 | |
3.38%, 3/15/18 (b) | | | 2,006 | | | | 2,082,431 | |
2.88%, 7/17/18 (b) | | | 363 | | | | 371,299 | |
| | | | | | | | |
| | | | | | | | 4,215,467 | |
Specialty Retail — 0.7% | | | | | | | | |
QVC, Inc.: | | | | | | | | |
3.13%, 4/01/19 | | | 1,668 | | | | 1,679,469 | |
7.38%, 10/15/20 (b) | | | 150 | | | | 155,625 | |
| | | | | | | | |
| | | | | | | | 1,835,094 | |
Technology Hardware, Storage & Peripherals — 0.1% | | | | | |
Seagate HDD Cayman, 3.75%, 11/15/18 | | | 250 | | | | 260,545 | |
Tobacco — 0.5% | | | | | | | | |
Lorillard Tobacco Co., 2.30%, 8/21/17 | | | 1,037 | | | | 1,047,109 | |
Reynolds American, Inc., 1.05%, 10/30/15 | | | 250 | | | | 250,223 | |
| | | | | | | | |
| | | | | | | | 1,297,332 | |
Trading Companies & Distributors — 1.2% | | | | | | | | |
Air Lease Corp.: | | | | | | | | |
4.50%, 1/15/16 | | | 300 | | | | 306,375 | |
2.13%, 1/15/18 | | | 1,385 | | | | 1,378,075 | |
3.38%, 1/15/19 | | | 500 | | | | 510,000 | |
See Notes to Financial Statements.
| | | | | | |
| | | BLACKROCK ALLOCATION TARGET SHARES | | MARCH 31, 2015 | | 39 |
| | | | |
| Schedule of Investments (continued) | | | Series S Portfolio | |
| | | (Percentages shown are based on Net Assets) | |
| | | | | | | | |
| Corporate Bonds | | Par
(000) | | | Value | |
Trading Companies & Distributors (concluded) | | | | | | | | |
GATX Corp., 2.50%, 3/15/19 | | $ | 1,000 | | | $ | 1,001,637 | |
| | | | | | | | |
| | | | | | | | 3,196,087 | |
Wireless Telecommunication Services — 0.6% | | | | | | | | |
ADC Telecommunications, Inc.,
3.50%, 7/15/15 (e) | | | 1,410 | | | | 1,415,287 | |
CC Holdings GS V LLC/Crown Castle GS III Corp.,
2.38%, 12/15/17 | | | 100 | | | | 100,837 | |
| | | | | | | | |
| | | | | | | | 1,516,124 | |
Total Corporate Bonds — 45.2% | | | | | | | 120,327,707 | |
| | | | | | | | |
| Foreign Agency Obligations — 0.3% | | | | | | |
Sinopec Capital Ltd., 1.25%, 4/24/16 (b) | | | 750 | | | | 748,964 | |
| | | | | | | | |
| Foreign Government Obligations | | | | | | |
Canada — 4.1% | | | | | | | | |
Province of British Columbia, 1.20%, 4/25/17 (c) | | | 5,425 | | | | 5,465,791 | |
Province of Ontario, 1.10%, 10/25/17 (c) | | | 5,590 | | | | 5,601,974 | |
| | | | | | | | |
| | | | | | | | 11,067,765 | |
Iceland — 0.5% | | | | | | | | |
Republic of Iceland: | | | | | | | | |
4.88%, 6/16/16 | | | 895 | | | | 931,256 | |
4.88%, 6/16/16 | | | 315 | | | | 327,761 | |
| | | | | | | | |
| | | | | | | | 1,259,017 | |
Latvia — 0.4% | | | | | | | | |
Republic of Latvia, 5.25%, 2/22/17 (b) | | | 1,000 | | | | 1,073,205 | |
Total Foreign Government Obligations — 5.0% | | | | | | | 13,399,987 | |
| | | | | | | | |
| Non-Agency Mortgage-Backed Securities | | | | | | |
Collateralized Mortgage Obligations — 1.7% | | | | | | | | |
Arran Residential Mortgages Funding PLC,
Series 2011-1A, Class A2C, 1.71%, 11/19/47 (a)(b) | | | 394 | | | | 395,763 | |
Bear Stearns Adjustable Rate Mortgage Trust,
Series 2004-7, Class 4A, 2.58%, 10/25/34 (a) | | | 50 | | | | 49,048 | |
Bear Stearns Alt-A Trust, Series 2004-13, Class A1, 0.91%, 11/25/34 (a) | | | 6 | | | | 5,737 | |
Countrywide Home Loan Mortgage Pass-Through Trust, Series 2004-HYB1, Class 2A, 2.51%, 5/20/34 (a) | | | 158 | | | | 151,087 | |
Granite Master Issuer PLC: | | | | | | | | |
Series 2006-1A, Class A5, 0.32%, 12/20/54 (a)(b) | | | 429 | | | | 426,210 | |
Series 2006-3, Class A3, 0.26%, 12/20/54 (a) | | | 1,849 | | | | 1,836,479 | |
Holmes Master Issuer PLC: | | | | | | | | |
Series 2012-1A, Class A2, 1.90%, 10/15/54 (a)(b) | | | 616 | | | | 616,582 | |
Series 2012-1X, Class A2, 1.90%, 10/15/54 (a) | | | 516 | | | | 516,330 | |
Lanark Master Issuer PLC, Series 2012-2A, Class 1A, 1.66%, 12/22/54 (a)(b) | | | 344 | | | | 347,658 | |
Structured Adjustable Rate Mortgage Loan Trust, Series 2004-6, Class 4A1, 2.40%, 6/25/34 (a) | | | 147 | | | | 146,468 | |
| | | | | | | | |
| | | | | | | | 4,491,362 | |
| | | | | | | | |
| Non-Agency Mortgage-Backed Securities | | Par
(000) | | | Value | |
Commercial Mortgage-Backed Securities — 20.4% | | | | | | | | |
Banc of America Commercial Mortgage Trust: | | | | | | | | |
Series 2007-1, Class A4, 5.45%, 1/15/49 | | $ | 1,431 | | | $ | 1,521,100 | |
Series 2007-3, Class A1A, 5.55%, 6/10/49 (a) | | | 401 | | | | 431,286 | |
Series 2007-5, Class A3, 5.62%, 2/10/51 | | | 27 | | | | 26,469 | |
Bear Stearns Commercial Mortgage Securities Trust: | | | | | | | | |
Series 2005-PWR8, Class A4 4.67%, 6/11/41 | | | 970 | | | | 971,042 | |
Series 2006-PW12, Class A4, 5.70%, 9/11/38 (a) | | | 956 | | | | 994,666 | |
Series 2007-PW16, Class A4, 5.71%, 6/11/40 (a) | | | 700 | | | | 754,897 | |
Series 2007-PW16, Class AM, 5.90%, 6/11/40 (a) | | | 750 | | | | 816,451 | |
Citigroup Commercial Mortgage Trust, Series 2007-C6, Class A1A, 5.70%, 12/10/49 (a) | | | 2,061 | | | | 2,219,401 | |
Citigroup/Deutsche Bank Commercial Mortgage Trust: | | | | | | | | |
Series 2005-CD1, Class A4, 5.23%, 7/15/44 (a) | | | 790 | | | | 793,964 | |
Series 2007-CD5, Class AJA, 6.12%, 11/15/44 (a) | | | 1,415 | | | | 1,545,537 | |
Commercial Mortgage Trust: | | | | | | | | |
Series 2007-C9, Class A4, 5.80%, 12/10/49 (a) | | | 1,440 | | | | 1,564,921 | |
Series 2010-C1, Class A1, 3.16%, 7/10/46 (b) | | | 409 | | | | 411,434 | |
Series 2012-9W57, Class A, 2.36%, 2/10/29 (b) | | | 2,200 | | | | 2,246,614 | |
Series 2013-CR12, Class A2, 2.90%, 10/10/46 | | | 1,730 | | | | 1,798,311 | |
Series 2013-FL3, Class A, 1.52%, 10/13/28 (a)(b) | | | 887 | | | | 889,194 | |
Series 2013-SFS, Class A1, 1.87%, 4/12/35 (b) | | | 400 | | | | 396,846 | |
Series 2014-CR15, Class A2, 2.93%, 2/10/47 | | | 2,200 | | | | 2,285,017 | |
Series 2014-UBS2, Class A2, 2.82%, 3/10/47 | | | 1,380 | | | | 1,427,473 | |
Series 2015-DC1, Class A2, 2.87%, 2/04/48 | | | 1,245 | | | | 1,288,570 | |
Credit Suisse Commercial Mortgage Trust: | | | | | | | | |
Series 2007-C5, Class AAB, 5.62%, 9/15/40 (a) | | | 490 | | | | 511,270 | |
Series 2008-C1, Class A2, 5.97%, 2/15/41 (a) | | | 286 | | | | 285,993 | |
Del Coronado Trust, Series 2013-HDC, Class A, 0.97%, 3/15/26 (a)(b) | | | 325 | | | | 325,014 | |
Deutsche Bank Re-REMIC Trust, Series 2011-C32, Class A3A, 5.72%, 6/17/49 (a)(b) | | | 1,045 | | | | 1,119,436 | |
GAHR Commercial Mortgage Trust, Series 2015-NRF, Class AFL1, 1.47%, 12/15/16 (a)(b) | | | 1,295 | | | | 1,294,666 | |
GMAC Commercial Mortgage Securities, Inc., Series 2004-C2, Class A4, 5.30%, 8/10/38 (a) | | | 6 | | | | 6,228 | |
Greenwich Capital Commercial Funding Corp., Series 2006-GG7, Class A4, 5.79%, 7/10/38 (a) | | | 1,150 | | | | 1,192,222 | |
GS Mortgage Securities Trust, Series 2006-GG6, Class A4, 5.55%, 4/10/38 (a) | | | 1,000 | | | | 1,016,207 | |
Hilton USA Trust, Series 2013-HLT, Class DFX, 4.41%, 11/05/30 (b) | | | 1,675 | | | | 1,723,957 | |
See Notes to Financial Statements.
| | | | | | |
| 40 | | BLACKROCK ALLOCATION TARGET SHARES | | MARCH 31, 2015 | | |
| | | | |
| Schedule of Investments (continued) | | | Series S Portfolio | |
| | | (Percentages shown are based on Net Assets) | |
| | | | | | | | |
| Non-Agency Mortgage-Backed Securities | | Par
(000) | | | Value | |
Commercial Mortgage-Backed Securities (concluded) | | | | | |
JPMorgan Chase Commercial Mortgage Securities Trust: | | | | | | | | |
Series 2004-LN2, Class A2, 5.12%, 7/15/41 | | $ | 36 | | | $ | 36,120 | |
Series 2005-LDP3, Class A4A, 4.94%, 8/15/42 (a) | | | 477 | | | | 478,695 | |
Series 2006-LDP9, Class A3, 5.34%, 5/15/47 | | | 2,853 | | | | 3,005,204 | |
Series 2007-CB18, Class A4, 5.44%, 6/12/47 | | | 1,675 | | | | 1,769,187 | |
LB-UBS Commercial Mortgage Trust: | | | | | | | | |
Series 2005-C5, Class A4, 4.95%, 9/15/30 | | | 216 | | | | 216,119 | |
Series 2007-C1, Class A4, 5.42%, 2/15/40 | | | 561 | | | | 596,403 | |
Series 2007-C2, Class A1A, 5.39%, 2/15/40 | | | 1,946 | | | | 2,088,809 | |
Series 2007-C2, Class A3, 5.43%, 2/15/40 | | | 784 | | | | 836,582 | |
Series 2007-C6, Class AM, 6.11%, 7/15/40 (a) | | | 285 | | | | 308,522 | |
Series 2007-C7, Class AM, 6.26%, 9/15/45 (a) | | | 1,350 | | | | 1,496,532 | |
Merrill Lynch Mortgage Trust, Series 2005-MCP1, Class A4, 4.75%, 5/12/15 (a) | | | 133 | | | | 133,239 | |
ML-CFC Commercial Mortgage Trust, Series 2006-4, Class AM, 5.20%, 12/12/49 | | | 750 | | | | 794,819 | |
Morgan Stanley Capital I Trust: | | | | | | | | |
Series 2005-HQ7, Class A4, 5.19%, 11/14/42 (a) | | | 627 | | | | 633,163 | |
Series 2006-IQ12, Class A1A, 5.32%, 12/15/43 | | | 807 | | | | 852,303 | |
Series 2006-IQ12, Class A4, 5.33%, 12/15/43 | | | 592 | | | | 621,664 | |
Series 2007-IQ15, Class A4, 5.91%, 6/11/49 (a) | | | 1,208 | | | | 1,311,847 | |
Morgan Stanley Re-REMIC Trust: | | | | | | | | |
Series 2010-GG10, Class A4A, 5.80%, 8/15/45 (a)(b) | | | 2,489 | | | | 2,663,746 | |
Series 2012-XA, Class A, 2.00%, 7/27/49 (b) | | | 447 | | | | 447,290 | |
STRIPs Ltd., Series 2012-1A, Class A, 1.50%, 12/25/44 (b) | | | 131 | | | | 131,127 | |
Wachovia Bank Commercial Mortgage Trust: Series 2006-C23, Class A4, 5.42%, 1/15/45 (a) | | | 1,134 | | | | 1,153,411 | |
Series 2006-C29, Class A1A, 5.30%, 11/15/48 | | | 762 | | | | 807,325 | |
Series 2007-C32, Class A1A, 5.71%, 6/15/49 (a) | | | 916 | | | | 983,712 | |
Series 2007-C32, Class AMFX, 5.70%, 6/15/49 (b) | | | 1,145 | | | | 1,231,161 | |
Series 2007-C33, Class A4, 5.94%, 2/15/51 (a) | | | 566 | | | | 603,941 | |
Series 2007-C33, Class AM, 5.96%, 2/15/51 (a) | | | 610 | | | | 660,997 | |
Wells Fargo Resecuritization Trust, Series 2012-IO, Class A, 1.75%, 8/20/21 (b) | | | 134 | | | | 133,779 | |
WF-RBS Commercial Mortgage Trust, Series 2011-C2, Class A2, 3.79%, 2/15/44 (b) | | | 480 | | | | 487,183 | |
| | | | | | | | |
| | | | | | | | 54,341,066 | |
Interest Only Commercial Mortgage-Backed Securities — 1.0% | |
Commercial Mortgage Pass-Through Certificates: | | | | | | | | |
Series 2012-CR2, Class XA, 1.90%, 8/15/45 (a) | | | 1,085 | | | | 104,861 | |
Series 2013-CR7, Class XA, 1.53%, 3/10/46 (a) | | | 3,513 | | | | 276,391 | |
| | | | | | | | |
| Non-Agency Mortgage-Backed Securities | | Par
(000) | | | Value | |
Interest Only Commercial Mortgage-Backed Securities (concluded) | |
JPMorgan Chase Commercial Mortgage Securities Corp., Series 2012-LC9, Class XA, 1.89%, 12/15/47 (a) | | $ | 4,580 | | | $ | 418,062 | |
JPMorgan Chase Commercial Mortgage Securities Trust, Series 2013-LC11, Class XA, 1.57%, 4/15/46 (a) | | | 5,234 | | | | 442,891 | |
Morgan Stanley Bank of America Merrill Lynch Trust, Series 2013-C13, Class XA, 1.23%, 11/15/46 (a) | | | 4,195 | | | | 305,139 | |
WF-RBS Commercial Mortgage Trust: | | | | | | | | |
Series 2012-C9, Class XA, 2.20%, 11/15/45 (a)(b) | | | 3,259 | | | | 353,429 | |
Series 2013-C14, Class XA, 0.91%, 6/15/46 (a) | | | 9,802 | | | | 508,997 | |
Series 2013-C15, Class XA, 0.62%, 8/15/46 (a) | | | 7,563 | | | | 257,209 | |
| | | | | | | | |
| | | | | | | | 2,666,979 | |
Total Non-Agency Mortgage-Backed Securities — 23.1% | | | | 61,499,407 | |
| | | | | | | | |
| Taxable Municipal Bonds — 0.1% | | | | | | |
State of California GO, 3.95%, 11/01/15 | | | 175 | | | | 178,719 | |
| | | | | | | | |
| U.S. Government Sponsored Agency Securities | | | | | | |
Collateralized Mortgage Obligations — 3.8% | | | | | | | | |
Freddie Mac: | | | | | | | | |
Series 3786, Class P, 4.00%, 1/15/41 | | | 5,234 | | | | 5,582,705 | |
Series 3959, Class MA, 4.50%, 11/15/41 | | | 553 | | | | 609,666 | |
Series 3986, Class M, 4.50%, 9/15/41 | | | 500 | | | | 552,120 | |
Series 4239, Class AB, 4.00%, 12/15/39 | | | 1,591 | | | | 1,725,163 | |
Series 4253, Class PA, 3.50%, 8/15/41 | | | 1,634 | | | | 1,760,755 | |
| | | | | | | | |
| | | | | | | | 10,230,409 | |
Interest Only Commercial Mortgage-Backed Securities — 0.1% | |
Fannie Mae, Series 2013-M5, Class X2, 2.48%, 1/25/22 (a) | | | 1,489 | | | | 160,755 | |
Mortgage-Backed Securities — 6.0% | | | | | | | | |
Fannie Mae Mortgage-Backed Securities: | | | | | | | | |
2.50%, 12/01/27-5/01/28 (c) | | | 3,413 | | | | 3,512,875 | |
3.00%, 4/01/30 (f) | | | 3,685 | | | | 3,862,916 | |
3.50%, 4/01/30 (f) | | | 2,355 | | | | 2,498,508 | |
3.64%, 9/01/42 (a) | | | 1,351 | | | | 1,428,648 | |
4.00%, 4/01/30 (f) | | | 345 | | | | 364,622 | |
4.50%, 9/01/26-1/01/27 (c) | | | 1,389 | | | | 1,482,681 | |
5.00%, 7/01/19-7/01/25 (c) | | | 1,405 | | | | 1,493,527 | |
Freddie Mac Mortgage-Backed Securities: | | | | | | | | |
5.00%, 1/01/19-9/01/21 (c) | | | 638 | | | | 676,708 | |
5.50%, 5/01/22 (c) | | | 568 | | | | 608,538 | |
| | | | | | | | |
| | | | | | | | 15,929,023 | |
Total U.S. Government Sponsored Agency Securities — 9.9% | | | | 26,320,187 | |
See Notes to Financial Statements.
| | | | | | |
| | | BLACKROCK ALLOCATION TARGET SHARES | | MARCH 31, 2015 | | 41 |
| | | | |
| Schedule of Investments (continued) | | | Series S Portfolio | |
| |
| (Percentages shown are based on Net Assets)
|
|
| | | | | | | | |
| U.S. Treasury Obligations | | Par (000) | | | Value | |
U.S. Treasury Notes: | | | | | | | | |
0.50%, 11/30/16 (c) | | $ | 5,000 | | | $ | 5,002,345 | |
0.63%, 12/31/16 (c) | | | 12,000 | | | | 12,029,064 | |
1.00%, 3/15/18 (c) | | | 17,900 | | | | 17,965,729 | |
1.63%, 12/31/19 (c) | | | 2,000 | | | | 2,025,468 | |
Total U.S. Treasury Obligations — 13.9% | | | | | | | 37,022,606 | |
Total Long-Term Investments Cost — $336,842,260) — 126.4% | | | | | | | 336,439,210 | |
| | | | | | | | |
| Short-Term Securities | | Shares | | | Value | |
Dreyfus Treasury Prime, 0.00% (g) | | | 2,195,748 | | | $ | 2,195,748 | |
Total Short-Term Securities (Cost — $2,195,748) — 0.8% | | | | | | | 2,195,748 | |
| | | | | | | | |
| Options Purchased | | | | | | |
(Cost — $173,010) — 0.1% | | | | | | | 91,113 | |
Total Investments Before Options Written (Cost — $339,211,018) — 127.3% | | | | | | | 338,726,071 | |
| | | | | | | | |
| Options Written | | | | | | |
(Premiums Received — $ 147,116) — (0.0)% | | | | | | | (71,413 | ) |
Total Investments Net of Options Written — 127.3% | | | | | | | 338,654,658 | |
Liabilities in Excess of Other Assets — (27.3)% | | | | | | | (72,530,522 | ) |
| | | | | | | | |
Net Assets — 100.0% | | | | | | $ | 266,124,136 | |
| | | | | | | | |
|
| Notes to Schedule of Investments |
| (a) | Variable rate security. Rate shown is as of report date. |
| (b) | Security exempt from registration pursuant to Rule 144A under the Securities Act of 1933, as amended. These securities may be resold in transactions exempt from registration to qualified institutional investors. |
| (c) | All or a portion of security has been pledged as collateral in connection with outstanding reverse repurchase agreements. |
| (d) | Represents a step-up bond that pays an initial coupon rate for the first period and then a higher coupon rate for the following periods. Rate shown is as of report date. |
| (f) | As of March 31, 2015, represents or includes a TBA transaction. Unsettled TBA transactions were as follows: |
| | | | | | | | |
| Counterparty | | Value | | | Unrealized
Appreciation | |
Credit Suisse Securities (USA) LLC | | $ | 3,008,567 | | | $ | 21,661 | |
Deutsche Bank Securities, Inc. | | $ | 120,552 | | | $ | 809 | |
Goldman Sachs & Co. | | $ | 364,622 | | | $ | 970 | |
J.P. Morgan Securities LLC | | $ | 733,797 | | | $ | 5,359 | |
Morgan Stanley & Co. LLC | | $ | 2,498,508 | | | $ | 8,923 | |
| (g) | Represents the current yield as of report date. |
| • | | For Fund compliance purposes, the Fund’s industry classifications refer to any one or more of the industry sub-classifications used by one or more widely recognized market indexes or ratings group indexes, and/or as defined by the investment advisor. These definitions may not apply for purposes of this report, which may combine such industry sub-classifications for reporting ease. |
| • | | As of March 31, 2015, reverse repurchase agreements outstanding were as follows: |
| | | | | | | | | | | | | | | | | | | | |
| Counterparty | | Interest
Rate | | | Trade
Date | | | Maturity
Date | | | Face Value | | | Face Value
Including Accrued
Interest | |
Barclays Capital, Inc. | | | 0.35 | % | | | 4/17/14 | | | | Open | | | $ | 281,000 | | | $ | 281,930 | |
Barclays Capital, Inc. | | | 0.35 | % | | | 4/17/14 | | | | Open | | | | 918,000 | | | | 921,037 | |
Credit Suisse Securities (USA) LLC | | | 0.40 | % | | | 12/19/14 | | | | Open | | | | 763,000 | | | | 764,045 | |
Credit Suisse Securities (USA) LLC | | | 0.50 | % | | | 12/19/14 | | | | Open | | | | 660,000 | | | | 660,904 | |
Merrill Lynch, Pierce, Fenner & Smith, Inc. | | | 0.01 | % | | | 3/10/15 | | | | Open | | | | 12,015,000 | | | | 12,015,722 | |
Merrill Lynch, Pierce, Fenner & Smith, Inc. | | | 0.20 | % | | | 3/10/15 | | | | Open | | | | 5,000,000 | | | | 5,000,361 | |
Merrill Lynch, Pierce, Fenner & Smith, Inc. | | | 0.25 | % | | | 3/10/15 | | | | Open | | | | 2,010,000 | | | | 2,010,145 | |
Credit Suisse Securities (USA) LLC | | | 0.24 | % | | | 3/11/15 | | | | 4/14/15 | | | | 3,958,000 | | | | 3,958,512 | |
RBC Capital Markets, LLC | | | 0.39 | % | | | 3/12/15 | | | | Open | | | | 1,610,262 | | | | 1,610,606 | |
RBC Capital Markets, LLC | | | 0.39 | % | | | 3/12/15 | | | | Open | | | | 1,417,500 | | | | 1,417,802 | |
RBC Capital Markets, LLC | | | 0.39 | % | | | 3/12/15 | | | | Open | | | | 940,000 | | | | 940,200 | |
RBC Capital Markets, LLC | | | 0.39 | % | | | 3/12/15 | | | | Open | | | | 1,890,000 | | | | 1,890,403 | |
RBC Capital Markets, LLC | | | 0.39 | % | | | 3/12/15 | | | | Open | | | | 1,699,365 | | | | 1,699,727 | |
RBC Capital Markets, LLC | | | 0.39 | % | | | 3/12/15 | | | | Open | | | | 945,000 | | | | 945,201 | |
Citigroup Global Markets, Inc. | | | 0.24 | % | | | 3/12/15 | | | | 4/14/15 | | | | 2,279,000 | | | | 2,279,295 | |
RBC Capital Markets, LLC | | | 0.39 | % | | | 3/18/15 | | | | Open | | | | 2,100,450 | | | | 2,100,763 | |
See Notes to Financial Statements.
| | | | | | |
| 42 | | BLACKROCK ALLOCATION TARGET SHARES | | MARCH 31, 2015 | | |
| | | | |
| Schedule of Investments (continued) | | | Series S Portfolio | |
| | | | | | | | | | | | | | | | | | | | |
| Counterparty | | Interest
Rate | | | Trade
Date | | | Maturity
Date | | | Face Value | | | Face Value
Including Accrued
Interest | |
RBC Capital Markets, LLC | | | 0.39 | % | | | 3/18/15 | | | | Open | | | $ | 1,175,000 | | | $ | 1,175,175 | |
RBC Capital Markets, LLC | | | 0.39 | % | | | 3/18/15 | | | | Open | | | | 910,830 | | | | 910,966 | |
RBC Capital Markets, LLC | | | 0.39 | % | | | 3/24/15 | | | | Open | | | | 5,282,550 | | | | 5,283,000 | |
RBC Capital Markets, LLC | | | 0.39 | % | | | 3/24/15 | | | | Open | | | | 5,167,312 | | | | 5,167,753 | |
BNP Paribas Securities Corp. | | | 0.20 | % | | | 3/31/15 | | | | Open | | | | 4,015,000 | | | | 4,015,022 | |
Total | | | | | | | | | | | | | | $ | 55,037,270 | | | $ | 55,048,569 | |
| | | | | | | | | | | | | | | | |
| • | | As of March 31, 2015, financial futures contracts outstanding were as follows: |
| | | | | | | | | | | | | | | | |
Contracts
Long/
(Short) | | | Issue | | Exchange | | Expiration | | Notional Value | | | Unrealized
Appreciation
(Depreciation) | |
| | 487 | | | U.S. Treasury Notes (2 Year) | | Chicago Board of Trade | | June 2015 | | $ | 106,729,094 | | | $ | 233,585 | |
| | 50 | | | Euro Dollar Futures | | Chicago Mercantile | | September 2015 | | $ | 12,440,000 | | | | 11,999 | |
| | (100 | ) | | Euro Dollar Futures | | Chicago Mercantile | | June 2015 | | $ | 24,917,500 | | | | (16,114 | ) |
| | (479 | ) | | U.S. Treasury Notes (5 Year) | | Chicago Board of Trade | | June 2015 | | $ | 57,581,039 | | | | (453,514 | ) |
| | (41 | ) | | U.S. Treasury Notes (10 Year) | | Chicago Board of Trade | | June 2015 | | $ | 5,285,156 | | | | (45,877 | ) |
| | Total | | | | | | | | | | | | | $ | (269,921 | ) |
| | | | | | | | | | | | | | | | |
| • | | As of March 31, 2015, exchange-traded options purchased were as follows: |
| | | | | | | | | | | | | | | | | | | | |
| Description | | Put/
Call | | | Strike
Price | | | Expiration
Date | | | Contracts | | | Value | |
Euro Dollar 90-Day | | | Put | | | $ | 98.63 | | | | 6/13/16 | | | | 197 | | | $ | 72,644 | |
Euro Dollar 90-Day | | | Put | | | $ | 97.88 | | | | 6/13/16 | | | | 197 | | | | 18,469 | |
Total | | | | | | | | | | | | | | | | | | $ | 91,113 | |
| | | | | | | | | | | | | | | | | | | | |
| • | | As of March 31, 2015, exchange-traded options written were as follows: |
| | | | | | | | | | | | | | | | | | | | |
| Description | | Put/
Call | | | Strike
Price | | | Expiration
Date | | | Contracts | | | Value | |
Euro Dollar 90-Day | | | Put | | | $ | 98.25 | | | | 6/13/16 | | | | 394 | | | $ | (71,413 | ) |
| • | | As of March 31, 2015, centrally cleared interest rate swaps outstanding were as follows: |
| | | | | | | | | | | | | | | | | | |
Fixed Rate | | Floating Rate | | | Clearinghouse | | Expiration
Date | | | Notional
Amount
(000) | | | Unrealized
Appreciation | |
0.74%1 | | | 3-month LIBOR | | | Chicago Mercantile | | | 11/14/16 | | | $ | 50,000 | | | $ | 174,435 | |
| | 1 | | Fund pays the floating rate and receives the fixed rate. |
| • | | Fair Value Measurements — Various inputs are used in determining the fair value of investments and derivative financial instruments. These inputs to valuation techniques are categorized into a disclosure hierarchy consisting of three broad levels for financial statement purposes. The hierarchy gives the highest priority to unadjusted quoted prices in active markets for identical assets or liabilities (Level 1 measurements) and the lowest priority to unobservable inputs (Level 3 measurements). Accordingly, the degree of judgment exercised in determining fair value is greatest for instruments categorized in Level 3. The inputs used to measure fair value may fall into different levels of the fair value hierarchy. In such cases, for disclosure purposes, the fair value hierarchy classification is determined based on the lowest level input that is significant to the fair value measurement in its entirety. The categorization of a value determined for investments and derivative financial instruments is based on the pricing transparency of the investment and derivative financial instruments and is not necessarily an indication of the risks associated with investing in those securities. The three levels of the fair value hierarchy are as follows: |
| | • | | Level 1 — unadjusted quoted prices in active markets/exchanges for identical assets or liabilities that the Fund has the ability to access |
| | • | | Level 2 — other observable inputs (including, but not limited to, quoted prices for similar assets or liabilities in markets that are active, quoted prices for identical or similar assets or liabilities in markets that are not active, inputs other than quoted prices that are observable for the assets or liabilities (such as interest rates, yield curves, volatilities, prepayment speeds, loss severities, credit risks and default rates) or other market–corroborated inputs) |
| | • | | Level 3 — unobservable inputs based on the best information available in the circumstances, to the extent observable inputs are not available (including the Fund’s own assumptions used in determining the fair value of investments and derivative financial instruments) |
Changes in valuation techniques may result in transfers into or out of an assigned level within the disclosure hierarchy. In accordance with the Fund’s policy, transfers between different levels of the fair value disclosure hierarchy are deemed to have occurred as of the beginning of the reporting period. For information about the Fund’s policy regarding valuation of investments and derivative financial instruments, refer to Note 2 of the Notes to Financial Statements.
See Notes to Financial Statements.
| | | | | | |
| | | BLACKROCK ALLOCATION TARGET SHARES | | MARCH 31, 2015 | | 43 |
| | | | |
| Schedule of Investments (continued) | | | Series S Portfolio | |
As of March 31, 2015, the following tables summarize the Fund’s investments and derivative financial instruments categorized in the disclosure hierarchy:
| | | | | | | | | | | | | | | | | | | | |
| | | Level 1 | | Level 2 | | Level 3 | | Total |
Assets: | | | | | | | | | | | | | | | | | | | | |
Investments: | | | | | | | | | | | | | | | | | | | | |
Long-Term Investments: | | | | | | | | | | | | | | | | | | | | |
Asset-Backed Securities | | | | — | | | | $ | 72,127,374 | | | | $ | 4,814,259 | | | | $ | 76,941,633 | |
Corporate Bonds | | | | — | | | | | 118,912,420 | | | | | 1,415,287 | | | | | 120,327,707 | |
Foreign Agency Obligations | | | | — | | | | | 748,964 | | | | | — | | | | | 748,964 | |
Foreign Government Obligations | | | | — | | | | | 13,399,987 | | | | | — | | | | | 13,399,987 | |
Non-Agency Mortgage-Backed Securities | | | | — | | | | | 61,368,280 | | | | | 131,127 | | | | | 61,499,407 | |
Taxable Municipal Bonds | | | | — | | | | | 178,719 | | | | | — | | | | | 178,719 | |
U.S. Government Sponsored Agency Securities | | | | — | | | | | 26,320,187 | | | | | — | | | | | 26,320,187 | |
U.S. Treasury Obligations | | | | — | | | | | 37,022,606 | | | | | — | | | | | 37,022,606 | |
Short-Term Securities | | | $ | 2,195,748 | | | | | — | | | | | — | | | | | 2,195,748 | |
Options Purchased | | | | 91,113 | | | | | — | | | | | — | | | | | 91,113 | |
Liabilities: | | | | | | | | | | | | | | | | | | | | |
Investments: | | | | | | | | | | | | | | | | | | | | |
| | | | | |
Total | | | $ | 2,286,861 | | | | $ | 330,078,537 | | | | $ | 6,360,673 | | | | $ | 338,726,071 | |
| | | | | |
| | | | | | | | | | | | | | | | | | | | |
| | | Level 1 | | Level 2 | | Level 3 | | Total |
Derivative Financial Instruments1 | | | | | | | | | | | | | | | | | | | | |
Assets: | | | | | | | | | | | | | | | | | | | | |
Interest rate contracts | | | $ | 245,584 | | | | $ | 174,435 | | | | | — | | | | $ | 420,019 | |
Liabilities: | | | | | | | | | | | | | | | | | | | | |
Interest rate contracts | | | | (586,918 | ) | | | | — | | | | | — | | | | | (586,918 | ) |
| | | | | |
Total | | | $ | (341,334 | ) | | | $ | 174,435 | | | | | — | | | | $ | (166,899 | ) |
| | | | | |
1 Derivative financial instruments are swaps and financial futures contracts, which are valued at the unrealized appreciation/depreciation on the instrument. | |
|
| The Fund may hold assets and/or liabilities in which the fair value, approximates the carrying amount or face value, including accrued interest, for financial statement purposes. As of March 31, 2015, such assets and/or liabilities are categorized within the disclosure hierarchy as follows: | |
| | | | | | | | | | | | | | | | | | | | |
| | | Level 1 | | Level 2 | | Level 3 | | Total |
Assets: | | | | | | | | | | | | | | | | | | | | |
Cash | | | $ | 73,632 | | | | | — | | | | | — | | | | $ | 73,632 | |
Cash pledged for financial futures contracts | | | | 227,000 | | | | | — | | | | | — | | | | | 227,000 | |
Cash pledged for centrally cleared swaps | | | | 270,000 | | | | | — | | | | | — | | | | | 270,000 | |
Liabilities: | | | | | | | | | | | | | | | | | | | | |
Reverse repurchase agreements | | | | — | | | | $ | (55,048,569 | ) | | | | — | | | | | (55,048,569 | ) |
| | | | | |
Total | | | $ | 570,632 | | | | $ | (55,048,569 | ) | | | | — | | | | $ | (54,477,937 | ) |
| | | | | |
During the year ended March 31, 2015, there were no transfers between Level 1 and Level 2.
See Notes to Financial Statements.
| | | | | | |
| 44 | | BLACKROCK ALLOCATION TARGET SHARES | | MARCH 31, 2015 | | |
| | | | |
| Schedule of Investments (concluded) | | | Series S Portfolio | |
A reconciliation of Level 3 investments is presented when the Fund had a significant amount of Level 3 investments at the beginning and/or end of the period in relation to net assets. The following table is a reconciliation of Level 3 investments for which significant unobservable inputs were used in determining fair value:
| | | | | | | | | | | | | | | | |
| | | Asset-
Backed
Securities | | | Corporate
Bonds | | | Non-
Agency
Mortgage-
Backed
Securities | | | Total | |
Assets: | | | | | | | | | | | | | | | | |
Opening Balance, as of March 31, 2014 | | | — | | | $ | 1,427,625 | | | $ | 235,462 | | | $ | 1,663,087 | |
Transfers into Level 3 | | | — | | | | — | | | | — | | | | — | |
Transfers out of Level 3 | | | — | | | | — | | | | — | | | | — | |
Accrued discounts/premiums | | $ | 8 | | | | — | | | | 65 | | | | 73 | |
Net realized gain (loss) | | | 12 | | | | — | | | | 1,179 | | | | 1,191 | |
Net change in unrealized appreciation/depreciation1 | | | (264 | ) | | | (12,338 | ) | | | (111 | ) | | | (12,713 | ) |
Purchases | | | 5,711,114 | | | | — | | | | — | | | | 5,711,114 | |
Sales | | | (896,611 | ) | | | — | | | | (105,468 | ) | | | (1,002,079 | ) |
Closing Balance, as of March 31, 2015 | | $ | 4,814,259 | | | $ | 1,415,287 | | | $ | 131,127 | | | $ | 6,360,673 | |
| | | | |
Net change in unrealized appreciation/depreciation on investments still held at March 31, 2015 | | $ | (264 | ) | | $ | (12,338 | ) | | $ | (111 | ) | | $ | (12,713 | ) |
| | | | |
| | 1 | | Included in the related net change in unrealized appreciation/depreciation in the Statements of Operations. |
The Fund’s investments that are categorized as Level 3 were valued utilizing third party pricing information without adjustment. Such valuations are based on unobservable inputs. A significant change in third party information could result in a significantly lower or higher value of such Level 3 investments.
See Notes to Financial Statements.
| | | | | | |
| | | BLACKROCK ALLOCATION TARGET SHARES | | MARCH 31, 2015 | | 45 |
| | |
| Statements of Assets and Liabilities | | |
| | | | | | | | | | | | | | | | | | | | |
| March 31, 2015 | | Series C Portfolio | | | Series E Portfolio | | | Series M Portfolio | | | Series P Portfolio | | | Series S Portfolio | |
| | | | | | | | | | | | | | | | | | | | |
| Assets | | | | | | | | | | | | | | | | | | | | |
Investments at value — unaffiliated1 | | $ | 359,462,086 | | | $ | 47,840,866 | | | $ | 1,069,734,809 | | | | — | | | $ | 338,726,071 | |
Investments at value — affiliated2 | | | — | | | | — | | | | — | | | $ | 95,070,306 | | | | — | |
Cash | | | 11,334 | | | | 167,840 | | | | 649,089 | | | | 219,081,066 | | | | 73,632 | |
Cash pledged for financial futures contracts | | | 479,000 | | | | 47,000 | | | | 253,000 | | | | 1,961,000 | | | | 227,000 | |
Cash pledged for centrally cleared swaps | | | 300,000 | | | | — | | | | 20,000 | | | | 6,381,000 | | | | 270,000 | |
Variation margin receivable on financial futures contracts | | | 110,743 | | | | — | | | | 77,340 | | | | 89,931 | | | | 72,757 | |
Variation margin receivable on centrally cleared swaps | | | — | | | | — | | | | 874 | | | | — | | | | 16,237 | |
Investments sold receivable | | | 802,521 | | | | — | | | | 189,081 | | | | — | | | | — | |
TBA sale commitments receivable | | | — | | | | — | | | | 352,445,976 | | | | — | | | | — | |
Swaps receivable | | | — | | | | — | | | | 3,014 | | | | — | | | | — | |
Swap premiums paid | | | 12,882 | | | | — | | | | 5,049 | | | | — | | | | — | |
Unrealized appreciation on OTC swaps | | | 111,562 | | | | — | | | | 907 | | | | — | | | | — | |
Capital shares sold receivable | | | 854,248 | | | | 814,482 | | | | 2,185,827 | | | | 895,080 | | | | 120,790 | |
Interest receivable | | | 3,279,937 | | | | 649,957 | | | | 1,283,126 | | | | — | | | | 1,312,313 | |
Receivable from Manager | | | 13,144 | | | | 26,422 | | | | 43,696 | | | | 25,828 | | | | 40,625 | |
Principal paydowns receivable | | | — | | | | — | | | | 10,378 | | | | — | | | | 550 | |
Dividends receivable — affiliated | | | — | | | | — | | | | — | | | | 186,935 | | | | — | |
Deferred offering costs | | | — | | | | 15,701 | | | | — | | | | — | | | | — | |
Prepaid expenses | | | 23,337 | | | | 4,955 | | | | 30,084 | | | | 39,748 | | | | 19,081 | |
| | | | |
Total assets | | | 365,460,794 | | | | 49,567,223 | | | | 1,426,932,250 | | | | 323,730,894 | | | | 340,879,056 | |
| | | | |
| | | | | | | | | | | | | | | | | | | | |
| Liabilities | | | | | | | | | | | | | | | | | | | | |
Options written at value3 | | | 390,952 | | | | — | | | | — | | | | — | | | | 71,413 | |
TBA sale commitments at value4 | | | — | | | | — | | | | 353,986,432 | | | | — | | | | — | |
Reverse repurchase agreements | | | — | | | | — | | | | — | | | | — | | | | 55,048,569 | |
Variation margin payable on financial futures contracts | | | 53,406 | | | | 8,683 | | | | 36,472 | | | | 479,000 | | | | 101,706 | |
Variation margin payable on centrally cleared swaps | | | 20,220 | | | | — | | | | — | | | | 381,602 | | | | — | |
Investments purchased payable | | | 891,510 | | | | 846,293 | | | | 549,067,996 | | | | — | | | | 18,261,506 | |
Swap premiums received | | | 67,391 | | | | — | | | | 15,881 | | | | — | | | | — | |
Unrealized depreciation on OTC swaps | | | 130,573 | | | | — | | | | 15,848 | | | | — | | | | — | |
Income dividends payable | | | 1,119,966 | | | | 168,482 | | | | 1,078,115 | | | | — | | | | 583,187 | |
Capital shares redeemed payable | | | 1,543,201 | | | | 33,494 | | | | 1,610,201 | | | | 273,040 | | | | 531,344 | |
Officer’s and Trustees’ fees payable | | | 7,311 | | | | — | | | | 7,590 | | | | 6,986 | | | | 6,916 | |
Other accrued expenses payable | | | 153,731 | | | | 48,783 | | | | 180,451 | | | | 92,699 | | | | 150,279 | |
| | | | |
Total liabilities | | | 4,378,261 | | | | 1,105,735 | | | | 905,998,986 | | | | 1,233,327 | | | | 74,754,920 | |
| | | | |
Net Assets | | $ | 361,082,533 | | | $ | 48,461,488 | | | $ | 520,933,264 | | | $ | 322,497,567 | | | $ | 266,124,136 | |
| | | | |
| | | | | | | | | | | | | | | | | | | | |
| Net Assets Consist of | | | | | | | | | | | | | | | | | | | | |
Paid-in capital | | $ | 337,785,177 | | | $ | 47,294,887 | | | $ | 510,932,871 | | | $ | 347,030,827 | | | $ | 268,588,894 | |
Undistributed (distributions in excess of) net investment income | | | (19,233 | ) | | | 4,436 | | | | 220,947 | | | | (168,844 | ) | | | (164,682 | ) |
Accumulated net realized gain (loss) | | | 2,664,987 | | | | 136,224 | | | | 3,652,439 | | | | (20,262,560 | ) | | | (1,795,346 | ) |
Net unrealized appreciation/depreciation | | | 20,651,602 | | | | 1,025,941 | | | | 6,127,007 | | | | (4,101,856 | ) | | | (504,730 | ) |
| | | | |
Net Assets | | $ | 361,082,533 | | | $ | 48,461,488 | | | $ | 520,933,264 | | | $ | 322,497,567 | | | $ | 266,124,136 | |
| | | | |
| | | | | | | | | | | | | | | | | | | | |
| Net Asset Value | | | | | | | | | | | | | | | | | | | | |
Shares outstanding5 | | | 33,536,633 | | | | 4,628,095 | | | | 51,914,524 | | | | 34,399,663 | | | | 27,253,039 | |
| | | | |
Net asset value | | $ | 10.77 | | | $ | 10.47 | | | $ | 10.03 | | | $ | 9.38 | | | $ | 9.76 | |
| | | | |
1 Investments at cost — unaffiliated | | $ | 339,561,588 | | | $ | 46,753,646 | | | $ | 1,061,974,619 | | | | — | | | $ | 339,211,018 | |
2 Investments at cost — affiliated | | | — | | | | — | | | | — | | | $ | 95,709,987 | | | | — | |
3 Premiums received | | $ | 1,577,229 | | | | — | | | | — | | | | — | | | $ | 147,116 | |
4 Proceeds from TBA sale commitments | | | — | | | | — | | | $ | 352,445,976 | | | | — | | | | — | |
5 Unlimited number of shares authorized, $0.001 par value. | | | | | | | | | | | | | | | | | | | | |
See Notes to Financial Statements.
| | | | | | |
| 46 | | BLACKROCK ALLOCATION TARGET SHARES | | MARCH 31, 2015 | | |
| | | | | | | | | | | | | | | | | | | | |
| Year Ended March 31, 2015 | | Series C Portfolio | | | Series E Portfolio2 | | | Series M Portfolio | | | Series P Portfolio | | | Series S Portfolio | |
| | | | | | | | | | | | | | | | | | | | |
| Investment Income | | | | | | | | | | | | | | | | | | | | |
Interest | | $ | 12,908,524 | | | $ | 772,496 | | | $ | 8,400,285 | | | | — | | | $ | 5,650,588 | |
Dividends — unaffiliated | | | 22 | | | | 1 | | | | 75 | | | | — | | | | 30 | |
Dividends — affiliated | | | — | | | | — | | | | — | | | $ | 1,909,044 | | | | — | |
| | | | |
Total income | | | 12,908,546 | | | | 772,497 | | | | 8,400,360 | | | | 1,909,044 | | | | 5,650,618 | |
| | | | |
| | | | | | | | | | | | | | | | | | | | |
| Expenses | | | | | | | | | | | | | | | | | | | | |
Transfer agent | | | 115,581 | | | | 2,024 | | | | 129,428 | | | | 34,633 | | | | 35,087 | |
Professional | | | 85,349 | | | | 44,879 | | | | 85,236 | | | | 88,011 | | | | 82,799 | |
Administration | | | 80,859 | | | | 12,474 | | | | 95,588 | | | | 69,764 | | | | 61,426 | |
Pricing | | | 42,018 | | | | — | | | | 32,609 | | | | 520 | | | | 56,095 | |
Registration | | | 39,367 | | | | 6,039 | | | | 66,021 | | | | 83,805 | | | | 45,379 | |
Custodian | | | 23,094 | | | | 6,531 | | | | 61,318 | | | | 15,716 | | | | 24,736 | |
Officer and Trustees | | | 20,949 | | | | 4,177 | | | | 22,151 | | | | 20,162 | | | | 19,685 | |
Printing | | | 10,668 | | | | 6,556 | | | | 11,621 | | | | 8,952 | | | | 10,713 | |
Organization and offering | | | — | | | | 103,500 | | | | — | | | | — | | | | — | |
Miscellaneous | | | 11,150 | | | | 8,294 | | | | 17,376 | | | | 5,210 | | | | 5,934 | |
| | | | |
Total expenses excluding interest expense | | | 429,035 | | | | 194,474 | | | | 521,348 | | | | 326,773 | | | | 341,854 | |
Interest expense1 | | | 30,265 | | | | — | | | | 14 | | | | — | | | | 55,091 | |
| | | | |
Total expenses | | | 459,300 | | | | 194,474 | | | | 521,362 | | | | 326,773 | | | | 396,945 | |
Less administration fees waived | | | — | | | | (7,722 | ) | | | — | | | | — | | | | — | |
Less expenses reimbursed by Manager | | | (428,810 | ) | | | (186,752 | ) | | | (521,123 | ) | | | (326,548 | ) | | | (341,629 | ) |
| | | | |
Total expenses after fees waived and/or reimbursed | | | 30,490 | | | | — | | | | 239 | | | | 225 | | | | 55,316 | |
| | | | |
Net investment income | | | 12,878,056 | | | | 772,497 | | | | 8,400,121 | | | | 1,908,819 | | | | 5,595,302 | |
| | | | |
| | | | | | | | | | | | | | | | | | | | |
| Realized and Unrealized Gain (Loss) | | | | | | | | | | | | | | | | | | | | |
Net realized gain (loss) from: | | | | | | | | | | | | | | | | | | | | |
Investments — unaffiliated | | | 4,315,780 | | | | 165,188 | | | | 9,954,564 | | | | — | | | | 1,028,199 | |
Options written | | | 18,743 | | | | — | | | | 43,442 | | | | — | | | | 30,251 | |
Financial futures contracts | | | 2,031,681 | | | | 21,766 | | | | 296,446 | | | | (6,820,207 | ) | | | (1,789,924 | ) |
Swaps | | | (339,441 | ) | | | — | | | | (348,670 | ) | | | (15,408,048 | ) | | | (140,431 | )3 |
| | | | |
| | | 6,026,763 | | | | 186,954 | | | | 9,945,782 | | | | (22,228,255 | ) | | | (871,905 | ) |
| | | | |
Net change in unrealized appreciation/depreciation on: | | | | | | | | | | | | | | | | | | | | |
Investments — unaffiliated | | | 4,075,357 | | | | 1,087,220 | | | | 5,388,828 | | | | — | | | | (133,597 | ) |
Investments — affiliated | | | — | | | | — | | | | — | | | | (650,657 | ) | | | — | |
Options written | | | 685,017 | | | | — | | | | 9,793 | | | | — | | | | 87,641 | |
Financial futures contracts | | | 131,678 | | | | (61,279 | ) | | | (78,903 | ) | | | (2,853,753 | ) | | | (441,074 | ) |
Swaps | | | (534,579 | ) | | | — | | | | (362,264 | ) | | | (622,644 | ) | | | 76,766 | |
| | | | |
| | | 4,357,473 | | | | 1,025,941 | | | | 4,957,454 | | | | (4,127,054 | ) | | | (410,264 | ) |
| | | | |
Total realized and unrealized gain (loss) | | | 10,384,236 | | | | 1,212,895 | | | | 14,903,236 | | | | (26,355,309 | ) | | | (1,282,169 | ) |
| | | | |
Net Increase (Decrease) in Net Assets Resulting from Operations | | $ | 23,262,292 | | | $ | 1,985,392 | | | $ | 23,303,357 | | | $ | (24,446,490 | ) | | $ | 4,313,133 | |
| | | | |
| | 1 | | See Note 3 of the Notes to Financial Statements for details of short-term borrowings. |
| | 2 | | Commencement of operations on August 4, 2014. |
| | 3 | | Includes a payment by an affiliate of $183,022 to compensate for investments erroneously made in violation of the investment guidelines. |
See Notes to Financial Statements.
| | | | | | |
| | | BLACKROCK ALLOCATION TARGET SHARES | | MARCH 31, 2015 | | 47 |
| | |
| Statements of Changes in Net Assets | | |
| | | | | | | | | | | | | | | | | | | | |
| | | Series C Portfolio | | | Series E Portfolio | | | Series M Portfolio | |
| | | Year Ended March 31, | | | Period August 4, 20142 to March 31, | | | Year Ended March 31, | |
| Increase (Decrease) in Net Assets: | | 2015 | | | 2014 | | | 2015 | | | 2015 | | | 2014 | |
| | | | | | | | | | | | | | | | | | | | |
| Operations | | | | | | | | | | | | | | | | | | | | |
Net investment income | | $ | 12,878,056 | | | $ | 14,211,785 | | | $ | 772,497 | | | $ | 8,400,121 | | | $ | 5,474,167 | |
Net realized gain (loss) | | | 6,026,763 | | | | 5,011,251 | | | | 186,954 | | | | 9,945,782 | | | | (1,382,246 | ) |
Net change in unrealized appreciation/depreciation | | | 4,357,473 | | | | (11,923,492 | ) | | | 1,025,941 | | | | 4,957,454 | | | | (3,500,381 | ) |
| | | | | | | | | | | | |
Net increase in net assets resulting from operations | | | 23,262,292 | | | | 7,299,544 | | | | 1,985,392 | | | | 23,303,357 | | | | 591,540 | |
| | | | | | | | | | | | |
| | | | | | | | | | | | | | | | | | | | |
| Distributions to Shareholders From1 | | | | | | | | | | | | | | | | | | | | |
Net investment income | | | (12,724,205 | ) | | | (14,022,130 | ) | | | (767,932 | ) | | | (10,028,087 | ) | | | (6,547,063 | ) |
Net realized gain | | | (5,559,271 | ) | | | (5,063,534 | ) | | | (50,859 | ) | | | (100,004 | ) | | | (258,487 | ) |
| | | | | | | | | | | | |
Decrease in net assets resulting from distributions to shareholders | | | (18,283,476 | ) | | | (19,085,664 | ) | | | (818,791 | ) | | | (10,128,091 | ) | | | (6,805,550 | ) |
| | | | | | | | | | | | |
| | | | | | | | | | | | | | | | | | | | |
| Capital Share Transactions | | | | | | | | | | | | | | | | | | | | |
Shares sold | | | 110,794,441 | | | | 65,500,228 | | | | 49,936,376 | | | | 258,529,311 | | | | 155,701,977 | |
Shares redeemed | | | (72,937,745 | ) | | | (104,110,643 | ) | | | (2,641,489 | ) | | | (80,627,955 | ) | | | (87,486,128 | ) |
| | | | | | | | | | | | |
Net increase (decrease) in net assets derived from capital share transactions | | | 37,856,696 | | | | (38,610,415 | ) | | | 47,294,887 | | | | 177,901,356 | | | | 68,215,849 | |
| | | | | | | | | | | | |
| | | | | | | | | | | | | | | | | | | | |
| Net Assets | | | | | | | | | | | | | | | | | | | | |
Total increase (decrease) in net assets | | | 42,835,512 | | | | (50,396,535 | ) | | | 48,461,488 | | | | 191,076,622 | | | | 62,001,839 | |
Beginning of period | | | 318,247,021 | | | | 368,643,556 | | | | — | | | | 329,856,642 | | | | 267,854,803 | |
| | | | | | | | | | | | |
End of period | | $ | 361,082,533 | | | $ | 318,247,021 | | | $ | 48,461,488 | | | $ | 520,933,264 | | | $ | 329,856,642 | |
| | | | | | | | | | | | |
Undistributed (distributions in excess of) net investment income, end of period | | $ | (19,233 | ) | | $ | (55,196 | ) | | $ | 4,436 | | | $ | 220,947 | | | $ | 187,077 | |
| | | | | | | | | | | | |
| | 1 | | Distributions for annual periods determined in accordance with federal income tax regulations. |
| | 2 | | Commencement of operations. |
See Notes to Financial Statements.
| | | | | | |
| 48 | | BLACKROCK ALLOCATION TARGET SHARES | | MARCH 31, 2015 | | |
| | |
| Statements of Changes in Net Assets (concluded) | | |
| | | | | | | | | | | | | | | | |
| | | Series P Portfolio | | | Series S Portfolio | |
| | | Year Ended March 31, | | | Year Ended March 31, | |
| Increase in Net Assets: | | 2015 | | | 2014 | | | 2015 | | | 2014 | |
| | | | | | | | | | | | | | | | |
| Operations | | | | | | | | | | | | | | | | |
Net investment income | | $ | 1,908,819 | | | $ | 937,961 | | | $ | 5,595,302 | | | $ | 4,694,365 | |
Net realized gain (loss) | | | (22,228,255 | ) | | | (2,379,782 | ) | | | (871,905 | ) | | | 328,329 | |
Net change in unrealized appreciation/depreciation | | | (4,127,054 | ) | | | 32,232 | | | | (410,264 | ) | | | (1,339,781 | ) |
| | | | | | | | |
Net increase (decrease) in net assets resulting from operations | | | (24,446,490 | ) | | | (1,409,589 | ) | | | 4,313,133 | | | | 3,682,913 | |
| | | | | | | | |
| | | | | | | | | | | | | | | | |
| Distributions to Shareholders From1 | | | | | | | | | | | | | | | | |
Net investment income | | | — | | | | — | | | | (6,279,653 | ) | | | (5,296,797 | ) |
Net realized gain | | | — | | | | — | | | | — | | | | (1,002,862 | ) |
| | | | | | | | |
Decrease in net assets resulting from distributions to shareholders | | | — | | | | — | | | | (6,279,653 | ) | | | (6,299,659 | ) |
| | | | | | | | |
| | | | | | | | | | | | | | | | |
| Capital Share Transactions | | | | | | | | | | | | | | | | |
Shares sold | | | 233,005,189 | | | | 273,575,140 | | | | 93,591,301 | | | | 155,385,390 | |
Shares redeemed | | | (147,891,551 | ) | | | (17,893,958 | ) | | | (58,617,956 | ) | | | (70,955,037 | ) |
| | | | | | | | |
Net increase in net assets derived from capital share transactions | | | 85,113,638 | | | | 255,681,182 | | | | 34,973,345 | | | | 84,430,353 | |
| | | | | | | | |
| | | | | | | | | | | | | | | | |
| Net Assets | | | | | | | | | | | | | | | | |
Total increase in net assets | | | 60,667,148 | | | | 254,271,593 | | | | 33,006,825 | | | | 81,813,607 | |
Beginning of year | | | 261,830,419 | | | | 7,558,826 | | | | 233,117,311 | | | | 151,303,704 | |
| | | | | | | | |
End of year | | $ | 322,497,567 | | | $ | 261,830,419 | | | $ | 266,124,136 | | | $ | 233,117,311 | |
| | | | | | | | |
Undistributed (distributions in excess of) net investment income, end of year | | $ | (168,844 | ) | | $ | 90,789 | | | $ | (164,682 | ) | | $ | (171,159 | ) |
| | | | | | | | |
| | 1 | | Distributions for annual periods determined in accordance with federal income tax regulations. |
See Notes to Financial Statements.
| | | | | | |
| | | BLACKROCK ALLOCATION TARGET SHARES | | MARCH 31, 2015 | | 49 |
| | | | |
| Year Ended March 31, 2015 | | Series S Portfolio | |
| | | | |
| Cash Used for Operating Activities | | | | |
Net increase in net assets resulting from operations: | | $ | 4,313,133 | |
Adjustments to reconcile net increase in net assets resulting from operations to net cash used for operating activities: | | | | |
Decrease in cash pledged for financial futures contracts | | | 175,000 | |
Decrease in cash pledged for centrally cleared swaps | | | 95,000 | |
Increase in variation margin receivable on financial futures contracts | | | (50,078 | ) |
Increase in variation margin receivable on centrally cleared swaps | | | (16,237 | ) |
Decrease in interest receivable | | | 342,046 | |
Increase in principal paydowns receivable | | | (550 | ) |
Increase in receivable from Manager | | | (13,785 | ) |
Increase in prepaid expenses | | | (5,918 | ) |
Increase in variation margin payable on financial futures contracts | | | 80,762 | |
Decrease in variation margin payable on centrally cleared swaps | | | (15,214 | ) |
Decrease in professional fees payable | | | (55,735 | ) |
Decrease in officer’s and Trustees’ fees payable | | | (343 | ) |
Increase in other accrued expenses payable | | | 107,408 | |
Amortization of premium and accretion of discount on investments | | | 2,242,668 | |
Net realized (gain) loss on investments and options written | | | (1,058,450 | ) |
Net unrealized (gain) loss on investments, options written and swaps | | | 45,956 | |
Premiums received from options written | | | 147,116 | |
Purchases of long-term investments | | | (1,054,803,665 | ) |
Proceeds from sales of long-term investments | | | 1,024,400,988 | |
Net proceeds from sales of short-term securities | | | 4,526,689 | |
| | | | |
Net cash used for operating activities | | | (19,543,209 | ) |
| | | | |
| | | | |
| Cash Provided by Financing Activities | | | | |
Net payments of reverse repurchase agreements | | | (10,788,136 | ) |
Proceeds from issuance of capital shares | | | 93,924,391 | |
Payments on redemption of capital shares | | | (58,387,155 | ) |
Cash distributions paid to shareholders | | | (6,212,615 | ) |
| | | | |
Net cash provided by financing activities | | | 18,536,485 | |
| | | | |
| | | | |
| Cash | | | | |
Net decrease in cash | | | (1,006,724 | ) |
Cash at beginning of year | | | 1,080,356 | |
| | | | |
Cash at end of year | | $ | 73,632 | |
| | | | |
| | | | |
| Supplemental Disclosure of Cash Flow Information | | | | |
Cash paid during the year for interest expense | | $ | 93,747 | |
| | | | |
See Notes to Financial Statements.
| | | | | | |
| 50 | | BLACKROCK ALLOCATION TARGET SHARES | | MARCH 31, 2015 | | |
| | | | | | | | | | | | | | | | | | | | |
| | | Series C Portfolio | |
| | | Year Ended March 31, | |
| | | 2015 | | | 2014 | | | 2013 | | | 2012 | | | 2011 | |
| | | | | | | | | | | | | | | | | | | | |
| Per Share Operating Performance | | | | | | | | | | | | | | | | | | | | |
Net asset value, beginning of year | | $ | 10.60 | | | $ | 10.95 | | | $ | 10.53 | | | $ | 10.04 | | | $ | 9.81 | |
| | | | |
Net investment income1 | | | 0.41 | | | | 0.45 | | | | 0.47 | | | | 0.52 | | | | 0.53 | |
Net realized and unrealized gain (loss) | | | 0.33 | | | | (0.19 | ) | | | 0.42 | | | | 0.48 | | | | 0.22 | |
| | | | |
Net increase from investment operations | | | 0.74 | | | | 0.26 | | | | 0.89 | | | | 1.00 | | | | 0.75 | |
| | | | |
Distributions from:2 | | | | | | | | | | | | | | | | | | | | |
Net investment income | | | (0.40 | ) | | | (0.45 | ) | | | (0.47 | ) | | | (0.51 | ) | | | (0.52 | ) |
Net realized gain | | | (0.17 | ) | | | (0.16 | ) | | | — | | | | — | | | | — | |
| | | | |
Total distributions | | | (0.57 | ) | | | (0.61 | ) | | | (0.47 | ) | | | (0.51 | ) | | | (0.52 | ) |
| | | | |
Net asset value, end of year | | $ | 10.77 | | | $ | 10.60 | | | $ | 10.95 | | | $ | 10.53 | | | $ | 10.04 | |
| | | | |
| | | | | | | | | | | | | | | | | | | | |
| Total Return3 | | | | | | | | | | | | | | | | | | | | |
Based on net asset value | | | 7.22 | % | | | 2.55 | % | | | 8.53 | % | | | 10.20 | % | | | 7.73 | % |
| | | | |
| | | | | | | | | | | | | | | | | | | | |
| Ratios to Average Net Assets | | | | | | | | | | | | | | | | | | | | |
Total expenses | | | 0.14 | % | | | 0.15 | % | | | 0.13 | % | | | 0.14 | % | | | 0.14 | % |
| | | | |
Total expenses after fees reimbursed | | | 0.01 | % | | | 0.02 | % | | | 0.01 | % | | | 0.01 | % | | | 0.00 | % |
| | | | |
Total expenses after fees reimbursed and excluding interest expense | | | 0.00 | % | | | 0.00 | % | | | 0.00 | % | | | 0.00 | % | | | 0.00 | % |
| | | | |
Net investment income | | | 3.81 | % | | | 4.27 | % | | | 4.31 | % | | | 5.02 | % | | | 5.24 | % |
| | | | |
| | | | | | | | | | | | | | | | | | | | |
| Supplemental Data | | | | | | | | | | | | | | | | | | | | |
Net assets, end of year (000) | | $ | 361,083 | | | $ | 318,247 | | | $ | 368,644 | | | $ | 341,995 | | | $ | 314,835 | |
| | | | |
Portfolio turnover rate | | | 44 | % | | | 43 | % | | | 51 | % | | | 41 | % | | | 55 | % |
| | | | |
| | 1 | | Based on average shares outstanding. |
| | 2 | | Distributions for annual periods determined in accordance with federal income tax regulations. |
| | 3 | | Where applicable, assumes the reinvestment of distributions. |
See Notes to Financial Statements.
| | | | | | |
| | | BLACKROCK ALLOCATION TARGET SHARES | | MARCH 31, 2015 | | 51 |
| | | | |
| | | Series E Portfolio | |
| | | Period | |
| | | August 4, 20141 to March 31, 2015 | |
| | | | |
| Per Share Operating Performance | | | | |
Net asset value, beginning of period | | $ | 10.00 | |
| | | | |
Net investment income2 | | | 0.28 | |
Net realized and unrealized gain | | | 0.48 | |
| | | | |
Net increase from investment operations | | | 0.76 | |
| | | | |
Distributions from:3 | | | | |
Net investment income | | | (0.28 | ) |
Net realized gain | | | (0.01 | ) |
| | | | |
Total distributions | | | (0.29 | ) |
| | | | |
Net asset value, end of period | | $ | 10.47 | |
| | | | |
| | | | |
| Total Return4,5 | | | | |
Based on net asset value | | | 7.70 | % |
| | | | |
| | | | |
| Ratios to Average Net Assets6 | | | | |
Total expenses7 | | | 0.94 | % |
| | | | |
Total expenses after fees waived and/or reimbursed | | | 0.00 | % |
| | | | |
Net investment income | | | 4.07 | % |
| | | | |
| | | | |
| Supplemental Data | | | | |
Net assets, end of period (000) | | $ | 48,461 | |
| | | | |
Portfolio turnover rate | | | 30 | % |
| | | | |
| | 1 | | Commencement of operations. |
| | 2 | | Based on average shares outstanding. |
| | 3 | | Distributions for annual periods determined in accordance with federal income tax regulations. |
| | 4 | | Where applicable, assumes the reinvestment of distributions. |
| | 5 | | Aggregate total return. |
| | 7 | | Organization expenses were not annualized in the calculation of the expense ratios. If these expenses were annualized, the total expenses would have been 1.02%. |
See Notes to Financial Statements.
| | | | | | |
| 52 | | BLACKROCK ALLOCATION TARGET SHARES | | MARCH 31, 2015 | | |
| | | | | | | | | | | | | | | | | | | | |
| | | Series M Portfolio | |
| | | Year Ended March 31, | |
| | | 2015 | | | 2014 | | | 2013 | | | 2012 | | | 2011 | |
| | | | | | | | | | | | | | | | | | | | |
| Per Share Operating Performance | | | | | | | | | | | | | | | | | | | | |
Net asset value, beginning of year | | $ | 9.70 | | | $ | 9.89 | | | $ | 10.52 | | | $ | 9.44 | | | $ | 9.21 | |
| | | | |
Net investment income1 | | | 0.20 | | | | 0.19 | | | | 0.21 | | | | 0.28 | | | | 0.29 | |
Net realized and unrealized gain (loss) | | | 0.37 | | | | (0.14 | ) | | | 0.35 | | | | 1.07 | | | | 0.26 | |
| | | | |
Net increase from investment operations | | | 0.57 | | | | 0.05 | | | | 0.56 | | | | 1.35 | | | | 0.55 | |
| | | | |
Distributions from:2 | | | | | | | | | | | | | | | | | | | | |
Net investment income | | | (0.24 | ) | | | (0.23 | ) | | | (0.31 | ) | | | (0.27 | ) | | | (0.32 | ) |
Net realized gain | | | (0.00 | )3 | | | (0.01 | ) | | | (0.88 | ) | | | — | | | | — | |
| | | | |
Total distributions | | | (0.24 | ) | | | (0.24 | ) | | | (1.19 | ) | | | (0.27 | ) | | | (0.32 | ) |
| | | | |
Net asset value, end of year | | $ | 10.03 | | | $ | 9.70 | | | $ | 9.89 | | | $ | 10.52 | | | $ | 9.44 | |
| | | | |
| | | | | | | | | | | | | | | | | | | | |
| Total Return4 | | | | | | | | | | | | | | | | | | | | |
Based on net asset value | | | 5.91 | % | | | 0.52 | % | | | 5.33 | % | | | 14.46 | % | | | 5.91 | % |
| | | | |
| | | | | | | | | | | | | | | | | | | | |
| Ratios to Average Net Assets | | | | | | | | | | | | | | | | | | | | |
Total expenses | | | 0.13 | %5 | | | 0.16 | %5 | | | 0.14 | % | | | 0.13 | % | | | 0.12 | % |
| | | | |
Total expenses after fees reimbursed | | | 0.00 | %5 | | | 0.00 | %5 | | | 0.00 | % | | | 0.00 | % | | | 0.00 | % |
| | | | |
Total expenses after fees reimbursed and excluding interest expense | | | 0.00 | %5 | | | 0.00 | %5 | | | 0.00 | % | | | 0.00 | % | | | 0.00 | % |
| | | | |
Net investment income | | | 2.04 | %5 | | | 1.97 | %5 | | | 2.00 | % | | | 2.76 | % | | | 3.04 | % |
| | | | |
| | | | | | | | | | | | | | | | | | | | |
| Supplemental Data | | | | | | | | | | | | | | | | | | | | |
Net assets, end of year (000) | | $ | 520,933 | | | $ | 329,857 | | | $ | 267,855 | | | $ | 318,176 | | | $ | 313,345 | |
| | | | |
Portfolio turnover rate6 | | | 2,258 | % | | | 1,879 | % | | | 798 | % | | | 523 | % | | | 301 | % |
| | | | |
| | 1 | | Based on average shares outstanding. |
| | 2 | | Distributions for annual periods determined in accordance with federal income tax regulations. |
| | 3 | | Amount is greater than $(0.005) per share. |
| | 4 | | Where applicable, assumes the reinvestment of distributions. |
| | 5 | | Excludes expenses incurred indirectly as a result of investments in underlying funds as follows: |
| | | | | | | | |
| | | | |
| | | Year Ended March 31, | |
| | | 2015 | | | 2014 | |
Investments in underlying funds | | | 0.01 | % | | | 0.02 | % |
| | 6 | | Includes mortgage dollar roll transactions (“MDRs”). Additional information regarding portfolio turnover rate is as follows: |
| | | | | | | | | | | | | | | | | | | | |
| | | | Year Ended March 31, | |
| | | 2015 | | | 2014 | | | 2013 | | | 2012 | | | 2011 | |
Portfolio turnover rate (excluding MDRs) | | | 1,356 | % | | | 1,131 | % | | | 518 | % | | | 88 | % | | | 92 | % |
Portfolio turnover rate including TBA Sale Commitments, to conform to the current presentation | | | — | | | | — | | | | 1,355 | % | | | 523 | % | | | 301 | % |
Portfolio turnover rate including TBA Sale Commitments and excluding MDRs | | | — | | | | — | | | | 941 | % | | | — | | | | — | |
See Notes to Financial Statements.
| | | | | | |
| | | BLACKROCK ALLOCATION TARGET SHARES | | MARCH 31, 2015 | | 53 |
| | | | | | | | | | | | |
| | | Series P Portfolio | |
| | | Year Ended March 31, | | | Period
March 20,
20131 to March 31, 2013 | |
| | | 2015 | | | 2014 | | |
| | | | | | | | | | | | |
| Per Share Operating Performance | | | | | | | | | | | | |
Net asset value, beginning of period | | $ | 10.24 | | | $ | 9.96 | | | $ | 10.00 | |
| | | | |
Net investment income2 | | | 0.07 | | | | 0.07 | | | | 0.00 | 3 |
Net realized and unrealized gain (loss) | | | (0.93 | ) | | | 0.21 | | | | (0.04 | ) |
| | | | |
Net increase (decrease) from investment operations | | | (0.86 | ) | | | 0.28 | | | | (0.04 | ) |
| | | | |
Net asset value, end of period | | $ | 9.38 | | | $ | 10.24 | | | $ | 9.96 | |
| | | | |
| | | | | | | | | | | | |
| Total Return4 | | | | | | | | | | | | |
Based on net asset value | | | (8.40 | )% | | | 2.81 | % | | | (0.40 | )%5 |
| | | | |
| | | | | | | | | | | | |
| Ratios to Average Net Assets | | | | | | | | | | | | |
Total expenses6 | | | 0.12 | % | | | 0.18 | % | | | 41.03 | %7,8 |
| | | | |
Total expenses after fees waived and/or reimbursed6 | | | 0.00 | % | | | 0.00 | % | | | 0.00 | %7 |
| | | | |
Net investment income6 | | | 0.67 | % | | | 0.69 | % | | | 0.38 | %7 |
| | | | |
| | | | | | | | | | | | |
| Supplemental Data | | | | | | | | | | | | |
Net assets, end of period (000) | | $ | 322,498 | | | $ | 261,830 | | | $ | 7,559 | |
| | | | |
Portfolio turnover rate | | | 0 | % | | | 6 | % | | | 0 | % |
| | | | |
| | 1 | | Commencement of operations. |
| | 2 | | Based on average shares outstanding. |
| | 3 | | Amount is less than $0.005 per share. |
| | 4 | | Where applicable, assumes the reinvestment of distributions. |
| | 5 | | Aggregate total return. |
| | 6 | | Excludes expenses incurred indirectly as a result of investments in underlying funds as follows: |
| | | | | | | | | | | | |
| | | | | | Period
March 20,
20131 to March 31, 2013 | |
| | | Year Ended March 31, | | |
| | | | | | | | |
| | | 2015 | | | 2014 | | |
Investments in underlying funds | | | 0.04 | % | | | 0.02 | % | | | 0.02 | % |
| | 8 | | Organization expenses were not annualized in the calculation of the expense ratios. If these expenses were annualized, the total expenses would have been 43.36%. |
See Notes to Financial Statements.
| | | | | | |
| 54 | | BLACKROCK ALLOCATION TARGET SHARES | | MARCH 31, 2015 | | |
| | | | | | | | | | | | | | | | | | | | |
| | | Series S Portfolio | |
| | | Year Ended March 31, | |
| | | 2015 | | | 2014 | | | 2013 | | | 2012 | | | 2011 | |
| | | | | | | | | | | | | | | | | | | | |
| Per Share Operating Performance | | | | | | | | | | | | | | | | | | | | |
Net asset value, beginning of year | | $ | 9.84 | | | $ | 10.02 | | | $ | 10.03 | | | $ | 10.01 | | | $ | 10.14 | |
| | | | |
Net investment income1 | | | 0.23 | | | | 0.24 | | | | 0.35 | | | | 0.29 | | | | 0.29 | |
Net realized and unrealized gain (loss) | | | (0.05 | ) | | | (0.08 | ) | | | 0.09 | | | | 0.10 | | | | 0.08 | |
| | | | |
Net increase from investment operations | | | 0.18 | | | | 0.16 | | | | 0.44 | | | | 0.39 | | | | 0.37 | |
| | | | |
Distributions from:2 | | | | | | | | | | | | | | | | | | | | |
Net investment income | | | (0.26 | ) | | | (0.28 | ) | | | (0.35 | ) | | | (0.32 | ) | | | (0.31 | ) |
Net realized gain | | | — | | | | (0.06 | ) | | | (0.10 | ) | | | (0.05 | ) | | | (0.19 | ) |
| | | | |
Total distributions | | | (0.26 | ) | | | (0.34 | ) | | | (0.45 | ) | | | (0.37 | ) | | | (0.50 | ) |
| | | | |
Net asset value, end of year | | $ | 9.76 | | | $ | 9.84 | | | $ | 10.02 | | | $ | 10.03 | | | $ | 10.01 | |
| | | | |
| | | | | | | | | | | | | | | | | | | | |
| Total Return3 | | | | | | | | | | | | | | | | | | | | |
Based on net asset value | | | 1.81 | %4 | | | 1.66 | % | | | 4.47 | % | | | 4.03 | % | | | 3.73 | % |
| | | | |
| | | | | | | | | | | | | | | | | | | | |
| Ratios to Average Net Assets | | | | | | | | | | | | | | | | | | | | |
Total expenses | | | 0.16 | % | | | 0.21 | % | | | 0.35 | % | | | 0.23 | % | | | 0.18 | % |
| | | | |
Total expenses after fees reimbursed | | | 0.02 | % | | | 0.06 | % | | | 0.14 | % | | | 0.05 | % | | | 0.03 | % |
| | | | |
Total expenses after fees reimbursed and excluding interest expense | | | 0.00 | % | | | 0.00 | % | | | 0.00 | % | | | 0.00 | % | | | 0.00 | % |
| | | | |
Net investment income | | | 2.32 | % | | | 2.47 | % | | | 3.59 | % | | | 2.90 | % | | | 2.93 | % |
| | | | |
| | | | | | | | | | | | | | | | | | | | |
| Supplemental Data | | | | | | | | | | | | | | | | | | | | |
Net assets, end of year (000) | | $ | 266,124 | | | $ | 233,117 | | | $ | 151,304 | | | $ | 135,541 | | | $ | 177,913 | |
| | | | |
Portfolio turnover rate5 | | | 318 | % | | | 239 | % | | | 123 | % | | | 192 | % | | | 131 | % |
| | | | |
| | 1 | | Based on average shares outstanding. |
| | 2 | | Distributions for annual periods determined in accordance with federal income tax regulations. |
| | 3 | | Where applicable, assumes the reinvestment of distributions. |
| | 4 | | Includes a payment by an affiliate to compensate for investments erroneously made in violation of the investment guidelines, which impacted the Fund’s total return. Excluding this payment, the Fund’s total return would have been 1.70%. |
| | 5 | | Includes MDRs. Additional information regarding portfolio turnover rate is as follows: |
| | | | | | | | | | | | | | | | | | | | |
| | | Year Ended March 31, | |
| | | 2015 | | | 2014 | | | 2013 | | | 2012 | | | 2011 | |
Portfolio turnover rate (excluding MDRs) | | | 239 | % | | | 183 | % | | | 120 | % | | | 121 | % | | | 105 | % |
See Notes to Financial Statements.
| | | | | | |
| | | BLACKROCK ALLOCATION TARGET SHARES | | MARCH 31, 2015 | | 55 |
| | |
| Notes to Financial Statements | | |
1. Organization:
BlackRock Allocation Target Shares (the “Trust”) is registered under the Investment Company Act of 1940, as amended (the “1940 Act”), as an open-end management investment company. The Trust is organized as a Delaware statutory trust. The following Series of the Trust are referred to herein collectively as the “Funds” or individually, a “Fund”:
| | | | |
| Fund Name | | Herein Referred To As | | Diversification Classification |
BlackRock Allocation Target Shares: Series C Portfolio | | Series C | | Non-diversified |
BlackRock Allocation Target Shares: Series E Portfolio | | Series E | | Diversified |
BlackRock Allocation Target Shares: Series M Portfolio | | Series M | | Non-diversified |
BlackRock Allocation Target Shares: Series P Portfolio | | Series P | | Non-diversified |
BlackRock Allocation Target Shares: Series S Portfolio | | Series S | | Non-diversified |
Shares of the Funds are offered to separate account clients of the investment advisor or certain of its affiliates. Participants in wrap-fee programs pay a single aggregate fee to the program sponsor for all costs and expenses of the wrap-fee programs including investment advice and portfolio execution.
The Funds, together with certain other registered investment companies advised by the BlackRock Advisors, LLC (the “Manager”) or its affiliates, are included in a complex of open-end funds referred to as the Equity-Bond Complex.
2. Significant Accounting Policies:
The Funds’ financial statements are prepared in conformity with accounting principles generally accepted in the United States of America (“U.S. GAAP”), which may require management to make estimates and assumptions that affect the reported amounts of assets and liabilities in the financial statements and the reported amounts of increases and decreases in net assets from operations during the reporting period. Actual results could differ from those estimates. Each Fund is considered an investment company under U.S. GAAP and follows the accounting and reporting guidance applicable to investment companies. The following is a summary of significant accounting policies followed by the Funds:
Valuation: The Funds’ investments are valued at fair value as of the close of trading on the New York Stock Exchange (“NYSE”) (generally 4:00 p.m., Eastern time). U.S. GAAP defines fair value as the price the Funds would receive to sell an asset or pay to transfer a liability in an orderly transaction between market participants at the measurement date. The Funds determine the fair values of their financial instruments at market value using independent dealers or pricing services under policies approved by the Board of Trustees of the Trust (the “Board”). The BlackRock Global Valuation Methodologies Committee (the “Global Valuation Committee”) is the committee formed by management to develop global pricing policies and procedures and to provide oversight of the pricing function for the Funds for all financial instruments.
Bond investments are valued on the basis of last available bid prices or current market quotations provided by dealers or pricing services. In determining the value of a particular investment, pricing services may use certain information with respect to transactions in such investments, quotations from dealers, pricing matrixes, market transactions in comparable investments, various relationships observed in the market between investments and calculated yield measures. Asset-backed and mortgage-backed securities are valued by independent pricing services using models that consider estimated cash flows of each tranche of the security, establish a benchmark yield and develop an estimated tranche-specific spread to the benchmark yield based on the unique attributes of the tranche. Financial futures contracts traded on exchanges are valued at their last sale price. To-be-announced (“TBA”) commitments are valued on the basis of last available bid prices or current market quotations provided by pricing services. Swap agreements are valued utilizing quotes received daily by the Funds’ pricing service or through brokers, which are derived using daily swap curves and models that incorporate a number of market data factors, such as discounted cash flows, trades and values of the underlying reference instruments. Certain centrally cleared swaps are valued at the price determined by the relevant exchange or clearinghouse. Investments in open-end registered investment companies are valued at NAV each business day.
Municipal investments (including commitments to purchase such investments on a “when-issued” basis) are valued on the basis of prices provided by dealers or pricing services. In determining the value of a particular investment, pricing services may use certain information with respect to transactions in such investments, quotations from dealers, pricing matrixes, market transactions in comparable investments and information with respect to various relationships between investments.
Exchange-traded options are valued at the mean between the last bid and ask prices at the close of the options market in which the options trade. An exchange-traded option for which there is no mean price is valued at the last bid (long positions) or ask (short positions) price. If no bid or ask price is available, the prior day’s price will be used, unless it is determined that the prior day’s price no longer reflects the fair value of the option. Over-the-counter (“OTC”) options and options on swaps (“swaptions”) are valued by an independent pricing service using a mathematical model, which incorporates a number of market data factors, such as the trades and prices of the underlying instruments.
In the event that the application of these methods of valuation results in a price for an investment that is deemed not to be representative of the market value of such investment, or if a price is not available, the investment will be valued by the Global Valuation Committee, or its delegate, in accordance with a policy approved by the Board as reflecting fair value (“Fair Value Investments”). When determining the price for Fair Value Investments, the Global Valuation Committee, or its delegate, seeks to determine the price that each Fund might reasonably expect to receive or pay from the current sale or purchase of that asset or liability in an arm’s-length transaction. Fair value determinations shall be based upon all available factors that the Global Valuation Committee, or its delegate, deems relevant consistent with the principles of fair value measurement, which include the market
| | | | | | |
| 56 | | BLACKROCK ALLOCATION TARGET SHARES | | MARCH 31, 2015 | | |
| | |
| Notes to Financial Statements (continued) | | |
approach, income approach and/or in the case of recent investments, the cost approach, as appropriate. The market approach generally consists of using comparable market transactions. The income approach generally is used to discount future cash flows to present value and is adjusted for liquidity as appropriate. These factors include but are not limited to: (i) attributes specific to the investment or asset; (ii) the principal market for the investment or asset; (iii) the customary participants in the principal market for the investment or asset; (iv) data assumptions by market participants for the investment or asset, if reasonably available; (v) quoted prices for similar investments or assets in active markets; and (vi) other factors, such as future cash flows, interest rates, yield curves, volatilities, prepayment speeds, loss severities, credit risks, recovery rates, liquidation amounts and/or default rates. Due to the inherent uncertainty of valuations of such investments, the fair values may differ from the values that would have been used had an active market existed. The Global Valuation Committee, or its delegate, employs various methods for calibrating valuation approaches for investments where an active market does not exist, including regular due diligence of the Funds’ pricing vendors, regular reviews of key inputs and assumptions, transactional back-testing or disposition analysis to compare unrealized gains and losses to realized gains and losses, reviews of missing or stale prices and large movements in market values and reviews of any market related activity. The pricing of all Fair Value Investments is subsequently reported to the Board or a committee thereof on a quarterly basis.
Segregation and Collateralization: In cases where a Fund enters into certain investments (e.g., dollar rolls, TBA sale commitments, financial futures contracts, options written and swaps), or certain borrowings (e.g., reverse repurchase transactions) that would be “senior securities” for 1940 Act purposes, a Fund may segregate or designate on its books and records cash or liquid securities having a market value at least equal to the amount of a Fund’s future obligations under such investments or borrowings. Doing so allows the investment or borrowing to be excluded from treatment as a “senior security.” Furthermore, if required by an exchange or counterparty agreement, the Funds may be required to deliver/deposit cash and/or securities to/with an exchange, or broker-dealer or custodian as collateral for certain investments or obligations.
Investment Transactions and Investment Income: For financial reporting purposes, investment transactions are recorded on the dates the transactions are entered into (the trade dates). Realized gains and losses on investment transactions are determined on the identified cost basis. Dividend income is recorded on the ex-dividend date. Interest income, including amortization and accretion of premiums and discounts on debt securities, is recognized on the accrual basis.
Distributions: Distributions from net investment income are declared daily and paid monthly, except for Series P, which declares and pays dividends at least annually. Distributions of capital gains are recorded on the ex-dividend date. The character and timing of distributions are determined in accordance with federal income tax regulations, which may differ from U.S. GAAP.
Organization and Offering Costs: Upon commencement of operations, organization costs associated with the establishment of Series E were expensed by the Fund and reimbursed by the Manager. The Manager reimbursed Series E $45,931, which is included in expenses reimbursed by the Manager in the Statements of Operations. Offering costs are amortized over a 12-month period beginning with the commencement of operations.
Recent Accounting Standard: In June 2014, the Financial Accounting Standards Board issued guidance to improve the financial reporting of reverse repurchase agreements and other similar transactions. The guidance will require expanded disclosure for entities that enter into reverse repurchase agreements and similar transactions accounted for as secured borrowings. It is effective for financial statements with fiscal years beginning on or after December 15, 2014 and for interim periods beginning after March 15, 2015. Management is evaluating the impact, if any, of this guidance on the Funds’ financial statement disclosures.
Other: Expenses directly related to a Fund are charged to that Fund. Other operating expenses shared by several funds are prorated among those funds on the basis of relative net assets or other appropriate methods. Expenses directly related to the Funds and other shared expenses prorated to the Funds are allocated daily based on its relative net assets or other appropriate methods.
The Funds have an arrangement with the custodian whereby fees may be reduced by credits earned on uninvested cash balances, which, if applicable, are shown as fees paid indirectly in the Statements of Operations. The custodian imposes fees on overdrawn cash balances, which can be offset by accumulated credits earned or may result in additional custody charges.
3. Securities and Other Investments:
Asset-Backed and Mortgage-Backed Securities: The Funds may invest in asset-backed securities. Asset-backed securities are generally issued as pass-through certificates, which represent undivided fractional ownership interests in an underlying pool of assets, or as debt instruments, which are also known as collateralized obligations, and are generally issued as the debt of a special purpose entity organized solely for the purpose of owning such assets and issuing such debt. Asset-backed securities are often backed by a pool of assets representing the obligations of a number of different parties. The yield characteristics of certain asset-backed securities may differ from traditional debt securities. One such major difference is that all or a principal part of the obligations may be prepaid at any time because the underlying assets (i.e., loans) may be prepaid at any time. As a result, a decrease in interest rates in the market may result in increases in the level of prepayments as borrowers, particularly mortgagors, refinance and repay their loans. An increased prepayment rate with respect to an asset-backed security subject to such a prepayment feature will have the effect of shortening the maturity of the security. In addition, the Funds may subsequently have to reinvest the proceeds at lower interest rates. If a Fund has purchased such an asset-backed security at a premium, a faster than anticipated prepayment rate could result in a loss of principal to the extent of the premium paid.
| | | | | | |
| | | BLACKROCK ALLOCATION TARGET SHARES | | MARCH 31, 2015 | | 57 |
| | |
| Notes to Financial Statements (continued) | | |
The Funds may purchase certain mortgage pass-through securities. There are a number of important differences among the agencies and instrumentalities of the U.S. Government that issue mortgage-related securities and among the securities that they issue. For example, mortgage-related securities guaranteed by Ginnie Mae are guaranteed as to the timely payment of principal and interest by Ginnie Mae and such guarantee is backed by the full faith and credit of the United States. However, mortgage-related securities issued by Freddie Mac and Fannie Mae, including Freddie Mac and Fannie Mae guaranteed mortgage pass-through certificates, which are solely the obligations of Freddie Mac and Fannie Mae, are not backed by or entitled to the full faith and credit of the United States, but are supported by the right of the issuer to borrow from the U.S. Treasury.
Inflation-Indexed Bonds: The Funds may invest in inflation-indexed bonds. Inflation-indexed bonds are fixed income securities whose principal value is periodically adjusted according to the rate of inflation. If the index measuring inflation rises or falls, the principal value of inflation-indexed bonds will be adjusted upward or downward, and consequently the interest payable on these securities (calculated with respect to a larger or smaller principal amount) will be increased or reduced, respectively. Any upward or downward adjustment in the principal amount of an inflation-indexed bond will be included as interest income in the Statements of Operations, even though investors do not receive their principal until maturity. Repayment of the original bond principal upon maturity (as adjusted for inflation) is guaranteed in the case of U.S. Treasury inflation-indexed bonds. For bonds that do not provide a similar guarantee, the adjusted principal value of the bond repaid at maturity may be less than the original principal.
Multiple Class Pass-Through Securities: The Funds may invest in multiple class pass-through securities, including collateralized mortgage obligations (“CMOs”) and commercial mortgage-backed securities. These multiple class securities may be issued by Ginnie Mae, U.S. Government agencies or instrumentalities or by trusts formed by private originators of, or investors in, mortgage loans. In general, CMOs are debt obligations of a legal entity that are collateralized by, and multiple class pass-through securities represent direct ownership interests in, a pool of residential or commercial mortgage loans or mortgage pass-through securities (the “Mortgage Assets”), the payments on which are used to make payments on the CMOs or multiple pass-through securities. Classes of CMOs include interest only (“IOs”), principal only (“POs”), planned amortization classes and targeted amortization classes. IOs and POs are stripped mortgage-backed securities representing interests in a pool of mortgages, the cash flow from which has been separated into interest and principal components. IOs receive the interest portion of the cash flow while POs receive the principal portion. IOs and POs can be extremely volatile in response to changes in interest rates. As interest rates rise and fall, the value of IOs tends to move in the same direction as interest rates. POs perform best when prepayments on the underlying mortgages rise since this increases the rate at which the principal is returned and the yield to maturity on the PO. When payments on mortgages underlying a PO are slower than anticipated, the life of the PO is lengthened and the yield to maturity is reduced. If the underlying Mortgage Assets experience greater than anticipated prepayments of principal, a Fund may not fully recoup its initial investment in IOs.
Stripped Mortgage-Backed Securities: The Funds may invest in stripped mortgage-backed securities issued by the U.S. Government, its agencies and instrumentalities. Stripped mortgage-backed securities are usually structured with two classes that receive different proportions of the interest (IOs) and principal (POs) distributions on a pool of Mortgage Assets. The Funds also may invest in stripped mortgage-backed securities that are privately issued.
Zero-Coupon Bonds: The Funds may invest in zero-coupon bonds, which are normally issued at a significant discount from face value and do not provide for periodic interest payments. Zero-coupon bonds may experience greater volatility in market value than other debt obligations of similar maturity which provide for regular interest payments.
Capital Trusts and Trust Preferred Securities: The Funds may invest in capital trusts and/or trust preferred securities. These securities are typically issued by corporations, generally in the form of interest-bearing notes with preferred securities characteristics, or by an affiliated business trust of a corporation, generally in the form of beneficial interests in subordinated debentures or similarly structured securities. The securities can be structured as either fixed or adjustable coupon securities that can have either a perpetual or stated maturity date. For trust preferred securities, the issuing bank or corporation will pay interest to the trust, which will then be distributed to holders of the trust preferred securities as a dividend. Dividends can be deferred without creating an event of default or acceleration, although maturity cannot take place unless all cumulative payment obligations have been met. The deferral of payments does not affect the purchase or sale of these securities in the open market. Payments on these securities are treated as interest rather than dividends for federal income tax purposes. These securities generally are rated below that of the issuing company’s senior debt securities and are freely callable at the issuer’s option.
Forward Commitments and When-Issued Delayed Delivery Securities: The Funds may purchase securities on a when-issued basis and may purchase or sell securities on a forward commitment basis. Settlement of such transactions normally occurs within a month or more after the purchase or sale commitment is made. The Funds may purchase securities under such conditions with the intention of actually acquiring them, but may enter into a separate agreement to sell the securities before the settlement date. Since the value of securities purchased may fluctuate prior to settlement, the Funds may be required to pay more at settlement than the security is worth. In addition, the Funds are not entitled to any of the interest earned prior to settlement. When purchasing a security on a delayed delivery basis, the Funds assume the rights and risks of ownership of the security, including the risk of price and yield fluctuations. In the event of default by the counterparty, the Funds’ maximum amount of loss is the unrealized appreciation of unsettled when-issued transactions, which is shown in the Schedules of Investments.
TBA Commitments: The Funds may enter into TBA commitments. TBA commitments are forward agreements for the purchase or sale of mortgage-backed securities for a fixed price, with payment and delivery on an agreed upon future settlement date. The specific securities to be delivered are not identified at the trade date. However, delivered securities must meet specified terms, including issuer, rate and mortgage terms. When entering into
| | | | | | |
| 58 | | BLACKROCK ALLOCATION TARGET SHARES | | MARCH 31, 2015 | | |
| | |
| Notes to Financial Statements (continued) | | |
TBA commitments, a Fund may take possession of or deliver the underlying mortgage-backed securities but can extend the settlement or roll the transaction. TBA commitments involve a risk of loss if the value of the security to be purchased or sold declines or increases, respectively, prior to settlement date.
In order to better define contractual rights and to secure rights that will help the Funds mitigate their counterparty risk, TBA commitments may be entered into by the Funds under Master Securities Forward Transaction Agreements (each, an “MSFTA”). An MSFTA typically contains, among other things, collateral posting terms and netting provisions in the event of default and/or termination event. The collateral requirements are typically calculated by netting the mark to market amount for each transaction under such agreement and comparing that amount to the value of the collateral currently pledged by a Fund and the counterparty. Cash collateral that has been pledged to cover the obligations of a Fund and cash collateral received from the counterparty, if any, is reported separately on the Statements of Assets and Liabilities as cash pledged as collateral for TBA commitments or cash received as collateral for TBA commitments, respectively. Non-cash collateral pledged by a Fund, if any, is noted in the Schedules of Investments. Typically, the Funds are permitted to sell, repledge or use the collateral they receive; however, the counterparty is not permitted to do so. To the extent amounts due to the Funds are not fully collateralized, contractually or otherwise, a Fund bears the risk of loss from counterparty non-performance.
Mortgage Dollar Roll Transactions: The Funds may sell TBA mortgage-backed securities and simultaneously contract to repurchase substantially similar (i.e., same type, coupon and maturity) securities on a specific future date at an agreed upon price. During the period between the sale and repurchase, the Funds will not be entitled to receive interest and principal payments on the securities sold. The Funds account for mortgage dollar roll transactions as purchases and sales and realize gains and losses on these transactions. These transactions may increase the Funds’ portfolio turnover rate. Mortgage dollar rolls involve the risk that the market value of the securities that the Funds are required to purchase may decline below the agreed upon repurchase price of those securities.
Reverse Repurchase Agreements: The Funds may enter into reverse repurchase agreements with qualified third party broker-dealers. In a reverse repurchase agreement, the Funds sell securities to a bank or broker-dealer and agree to repurchase the same securities at a mutually agreed upon date and price. During the term of the reverse repurchase agreement, the Funds continue to receive the principal and interest payments on the securities sold. Certain agreements have no stated maturity and can be terminated by either party at any time. Interest on the value of the reverse repurchase agreements issued and outstanding is based upon competitive market rates determined at the time of issuance. The Funds may utilize reverse repurchase agreements when it is anticipated that the interest income to be earned from the investment of the proceeds of the transaction is greater than the interest expense of the transaction. Reverse repurchase agreements involve leverage risk and also the risk that the market value of the securities to be repurchased may decline below the repurchase price.
For financial reporting purposes, cash received in exchange for securities delivered plus accrued interest due to the counterparty is recorded as a liability in the Statements of Assets and Liabilities at face value including accrued interest. Due to the short-term nature of the reverse repurchase agreements, face value approximates fair value. Interest payments made by the Funds to the counterparties are recorded as a component of interest expense in the Statements of Operations. In periods of increased demand for the security, the Funds may receive a fee for use of the security by the counterparty, which may result in interest income to the Funds.
For the year ended March 31, 2015, the average amount of reverse repurchase agreements outstanding and the daily weighted average interest rates were as follows:
| | | | | | | | |
| | | Average
Borrowings | | | Daily Weighted
Average Interest Rate | |
Series C | | $ | 10,200,392 | | | | 0.27 | % |
Series M | | $ | 52,960 | | | | 0.04 | % |
Series S | | $ | 62,693,344 | | | | 0.23 | % |
Reverse repurchase transactions are entered into by the Funds under Master Repurchase Agreements (each, an “MRA”), which permit the Funds, under certain circumstances, including an event of default (such as bankruptcy or insolvency), to offset payables and/or receivables under an MRA with collateral held and/or posted to the counterparty and create one single net payment due to or from a Fund. With reverse repurchase transactions, typically the Funds and the counterparties are permitted to sell, re-pledge, or use the collateral associated with the transaction. Bankruptcy or insolvency laws of a particular jurisdiction may impose restrictions on or prohibitions against such a right of offset in the event of the MRA counterparty’s bankruptcy or insolvency. Pursuant to the terms of the MRA, a Fund receives or posts securities as collateral with a market value in excess of the repurchase price to be paid or received by a Fund upon the maturity of the transaction. Upon a bankruptcy or insolvency of the MRA counterparty, a Fund is considered an unsecured creditor with respect to excess collateral and, as such, the return of excess collateral may be delayed.
| | | | | | |
| | | BLACKROCK ALLOCATION TARGET SHARES | | MARCH 31, 2015 | | 59 |
| | |
| Notes to Financial Statements (continued) | | |
As of March 31, 2015, the following table is a summary of Series S’s open reverse repurchase agreements by counterparty which are subject to offset under a MRA on a net basis:
| | | | | | | | | | | | | | | | |
| Counterparty | | Reverse
Repurchase
Agreements | | | Fair Value of
Non-cash
Collateral
Pledged
Including
Accrued
Interest1 | | | Cash Collateral
Pledged | | | Net Amount2 | |
Barclays Capital, Inc. | | $ | (1,202,967 | ) | | $ | (1,202,967 | ) | | | — | | | | — | |
BNP Paribas Securities Corp. | | | (4,015,022 | ) | | | (4,015,022 | ) | | | — | | | | — | |
Citigroup Global Markets, Inc. | | | (2,279,295 | ) | | | (2,279,295 | ) | | | — | | | | — | |
Credit Suisse Securities (USA) LLC | | | (5,383,461 | ) | | | (5,383,461 | ) | | | — | | | | — | |
Merrill Lynch, Pierce, Fenner & Smith, Inc. | | | (19,026,228 | ) | | | (19,026,228 | ) | | | — | | | | — | |
RBC Capital Markets, LLC | | | (23,141,596 | ) | | | (23,141,596 | ) | | | — | | | | — | |
Total | | $ | (55,048,569 | ) | | $ | (55,048,569 | ) | | | — | | | | — | |
| | | | |
| | 1 | | Collateral with a value of $69,700,297 has been pledged in connection with open reverse repurchase agreements. Excess of collateral pledged to the individual counterparty is not shown for financial reporting purposes. |
| | 2 | | Net amount represents the net amount payable due to the counterparty in the event of default. |
4. Derivative Financial Instruments:
The Funds engage in various portfolio investment strategies using derivative contracts both to increase the returns of the Funds and/or to economically manage their exposure to certain risks such as credit risk or interest rate risk. These contracts may be transacted on an exchange or OTC.
Financial Futures Contracts: The Funds invest in long and/or short positions in financial futures contracts and options on financial futures contracts to gain exposure to, or economically hedge against, changes in interest rates (interest rate risk). Financial futures contracts are agreements between a Fund and a counterparty to buy or sell a specific quantity of an underlying instrument at a specified price and at a specified date. Depending on the terms of the particular contract, financial futures contracts are settled either through physical delivery of the underlying instrument on the settlement date or by payment of a cash settlement amount on the settlement date.
Upon entering into a financial futures contract, the Funds are required to deposit initial margin with the broker in the form of cash or securities in an amount that varies depending on a contract’s size and risk profile. The initial margin deposit must then be maintained at an established level over the life of the contract. Securities deposited as initial margin are designated on the Schedules of Investments and cash deposited, if any, is recorded on the Statements of Assets and Liabilities as cash pledged for financial futures contracts. Pursuant to the contract, the Funds agree to receive from or pay to the broker an amount of cash equal to the daily fluctuation in value of the contract. Such receipts or payments are known as variation margin. Variation margin is recorded by the Funds as unrealized appreciation or depreciation and, if applicable, as a receivable or payable for variation margin in the Statements of Assets and Liabilities.
When the contract is closed, the Funds record a realized gain or loss equal to the difference between the value of the contract at the time it was opened and the value at the time it was closed. The use of financial futures contracts involves the risk of an imperfect correlation in the movements in the price of financial futures contracts, interest rates and the underlying assets.
Options: Certain Funds purchase and write call and put options to increase or decrease their exposure to underlying instruments (including interest rate risk) and/or in the case of options written, to generate gains from options premiums. A call option gives the purchaser (holder) of the option the right (but not the obligation) to buy, and obligates the seller (writer) to sell (when the option is exercised) the underlying instrument at the exercise or strike price at any time or at a specified time during the option period. A put option gives the holder the right to sell and obligates the writer to buy the underlying instrument at the exercise or strike price at any time or at a specified time during the option period. When the Funds purchase (write) an option, an amount equal to the premium paid (received) by the Funds is reflected as an asset (liability). The amount of the asset (liability) is subsequently marked-to-market to reflect the current market value of the option purchased (written). When an instrument is purchased or sold through an exercise of an option, the related premium paid (or received) is added to (or deducted from) the basis of the instrument acquired or deducted from (or added to) the proceeds of the instrument sold. When an option expires (or the Funds enter into a closing transaction), the Funds realize a gain or loss on the option to the extent of the premiums received or paid (or gain or loss to the extent the cost of the closing transaction exceeds the premiums received or paid). When the Funds write a call option, such option is “covered,” meaning that the Funds hold the underlying instrument subject to being called by the option counterparty. When the Funds write a put option, such option is covered by cash in an amount sufficient to cover the obligation.
Swaptions are similar to options on securities except that instead of selling or purchasing the right to buy or sell a security, the writer or purchaser of the swaptions is granting or buying the right to enter into a previously agreed upon interest rate or credit default swap agreement (interest rate risk and/or credit risk) at any time before the expiration of the option.
| | | | | | |
| 60 | | BLACKROCK ALLOCATION TARGET SHARES | | MARCH 31, 2015 | | |
| | |
| Notes to Financial Statements (continued) | | |
In purchasing and writing options, the Funds bear the risk of an unfavorable change in the value of the underlying instrument or the risk that the Funds may not be able to enter into a closing transaction due to an illiquid market. Exercise of a written option could result in the Funds purchasing or selling a security when it otherwise would not, at a price different from the current market value.
For the year ended March 31, 2015, transactions in options written including swaptions were as follows:
| | | | | | | | | | | | | | | | | | | | | | |
| | | Series C | |
| | | Calls | | | | | Puts | |
| | | | | | | | | | |
| | | Notional
(000) | | | Premiums
Received | | | | | Contracts | | | Notional
(000) | | | Premiums
Received | |
| | | | | | | | | | |
Outstanding options, beginning of year | | | — | | | | — | | | | | | — | | | $ | 89,800 | | | $ | 1,438,530 | |
Options written | | $ | 13,400 | | | $ | 534,835 | | | | | | 316 | | | | 13,400 | | | | 695,114 | |
Options closed | | | (10,000 | ) | | | (477,375 | ) | | | | | — | | | | (17,000 | ) | | | (613,875 | ) |
| | | | | | | | | | |
Outstanding options, end of year | | $ | 3,400 | | | $ | 57,460 | | | | | | 316 | | | $ | 86,200 | | | $ | 1,519,769 | |
| | | | |
| | | | | | | | | | | | | | | | | | | | | | |
| | | | | | | | | | | | | | | | | | | | | | | | | | | | |
| | | Series M | | | | | Series S | |
| | | | |
| | | Calls | | | | | Puts | | | | | Puts | |
| | | | | | | | | | | | | | | | |
| | | Contracts | | | Premiums
Received | | | | | Contracts | | | Premiums
Received | | | | | Contracts | | | Premiums
Received | |
| | | | | | | | | | | | | | | | |
Outstanding options, beginning of year | | | — | | | | — | | | | | | 62 | | | $ | 15,395 | | | | | | 150 | | | $ | 30,251 | |
Options written | | | 93 | | | | 17,293 | | | | | | 62 | | | | 10,754 | | | | | | 394 | | | | 147,116 | |
Options expired | | | (93 | ) | | | (17,293 | ) | | | | | (124 | ) | | | (26,149 | ) | | | | | (150 | ) | | | (30,251 | ) |
| | | | | | | | | | | | | | | | |
Outstanding options, end of year | | | — | | | | — | | | | | | — | | | | — | | | | | | 394 | | | $ | 147,116 | |
| | | | |
Swaps: The Funds enter into swap agreements in which a Fund and a counterparty agree either to make periodic net payments on a specified notional amount or a net payment upon termination. Swap agreements are privately negotiated in the OTC market and may be entered into as a bilateral contract (“OTC swaps”) or centrally cleared (“centrally cleared swaps”). Swaps are marked-to-market daily and changes in value are recorded as unrealized appreciation (depreciation).
For OTC swaps, any upfront premiums paid are recorded as assets and any upfront fees received are recorded as liabilities and are shown as swap premiums paid and swap premiums received, respectively, in the Statements of Assets and Liabilities and amortized over the term of the OTC swap. Payments received or made by the Funds for OTC swaps are recorded in the Statements of Operations as realized gains or losses, respectively. When an OTC swap is terminated, the Funds will record a realized gain or loss equal to the difference between the proceeds from (or cost of) the closing transaction and a Fund’s basis in the contract, if any. Generally, the basis of the contract is the premium received or paid.
In a centrally cleared swap, immediately following execution of the swap agreement, the swap agreement is novated to a central counterparty (the “CCP”) and a Fund’s counterparty on the swap agreement becomes the CCP. The Funds are required to interface with the CCP through a broker. Upon entering into a centrally cleared swap, the Funds are required to deposit initial margin with the broker in the form of cash or securities in an amount that varies depending on the size and risk profile of the particular swap. Securities deposited as initial margin are designated on the Schedules of Investments and cash deposited is recorded on the Statements of Assets and Liabilities as cash pledged for centrally cleared swaps. The daily change in valuation of centrally cleared swaps is recorded as a receivable or payable for variation margin in the Statements of Assets and Liabilities. Payments received from (paid to) the counterparty, including at termination, are recorded as realized gain (loss) in the Statements of Operations.
Swap transactions involve, to varying degrees, elements of interest rate, credit and market risk in excess of the amounts recognized in the Statements of Assets and Liabilities. Such risks involve the possibility that there will be no liquid market for these agreements, that the counterparty to the agreements may default on its obligation to perform or disagree as to the meaning of the contractual terms in the agreements, and that there may be unfavorable changes in interest rates and/or market values associated with these transactions.
| • | | Credit default swaps — Certain Funds enter into credit default swaps to manage their exposure to the market or certain sectors of the market, to reduce their risk exposure to defaults of corporate and/or sovereign issuers or to create exposure to corporate and/or sovereign issuers to which it is not otherwise exposed (credit risk). The Funds may either buy or sell (write) credit default swaps on single-name issuers (corporate or sovereign), a combination or basket of single-name issuers or traded indexes. Credit default swaps on single-name issuers are agreements in which the protection buyer pays fixed periodic payments to the seller in consideration for a guarantee from the protection seller to make a specific payment should a negative credit event take place with respect to the referenced entity (e.g., bankruptcy, failure to pay, obligation accelerators, repudiation, moratorium or restructuring). Credit default swaps on traded indexes are agreements in which the buyer pays fixed periodic payments to the seller in consideration for a guarantee from the seller to make a specific payment should a write-down, principal or interest shortfall or default of all or individual underlying securities included in the index occur. As a buyer, if an underlying credit event occurs, the Funds will either (i) receive from the |
| | | | | | |
| | | BLACKROCK ALLOCATION TARGET SHARES | | MARCH 31, 2015 | | 61 |
| | |
| Notes to Financial Statements (continued) | | |
| | seller an amount equal to the notional amount of the swap and deliver the referenced security or underlying securities comprising the index, or (ii) receive a net settlement of cash equal to the notional amount of the swap less the recovery value of the security or underlying securities comprising the index. As a seller (writer), if an underlying credit event occurs, the Funds will either pay the buyer an amount equal to the notional amount of the swap and take delivery of the referenced security or underlying securities comprising the index or pay a net settlement of cash equal to the notional amount of the swap less the recovery value of the security or underlying securities comprising the index. |
| • | | Total return swaps — Certain Funds enter into total return swaps to obtain exposure to a security or market without owning such security or investing directly in that market or to transfer the risk/return of one market (e.g., fixed income) to another market (e.g., equity or commodity prices) (equity risk, commodity price risk and/or interest rate risk). Total return swaps are agreements in which there is an exchange of cash flows whereby one party commits to make payments based on the total return (coupons plus capital gains/losses) of an underlying instrument in exchange for fixed or floating rate interest payments. To the extent the total return of the instrument or index underlying the transaction exceeds or falls short of the offsetting interest rate obligation, the Funds will receive a payment from or make a payment to the counterparty. |
| • | | Interest rate swaps — Certain Funds enter into interest rate swaps to gain or reduce exposure to interest rates or to manage duration, the yield curve or interest rate risk by economically hedging the value of the fixed rate bonds which may decrease when interest rates rise (interest rate risk). Interest rate swaps are agreements in which one party pays a stream of interest payments, either fixed or floating, for another party’s stream of interest payments, either fixed or floating, on the same notional amount for a specified period of time. In more complex swaps, the notional principal amount may decline (or amortize) over time. |
The following is a summary of the Funds’ derivative financial instruments categorized by risk exposure:
| | | | | | | | | | | | | | | | | | | | | | |
| Fair Values of Derivative Financial Instruments as of March 31, 2015 | |
| | | | | Series C | | | Series E | | | Series M | |
| | | | | | |
| | | | | Value | |
| | | Statements of Assets and Liabilities Location | | Derivative
Assets | | | Derivative
Liabilities | | | Derivative
Liabilities | | | Derivative
Assets | | | Derivative
Liabilities | |
Interest rate contracts | | Net unrealized appreciation/depreciation1; Unrealized appreciation on OTC swaps; Swap premiums paid/received; Investments at value2 | | $ | 1,007,040 | | | $ | 1,388,832 | | | $ | 61,279 | | | $ | 96,895 | | | $ | 200,454 | |
Credit contracts | | Unrealized appreciation/depreciation on OTC swaps; Swap premiums paid/received | | | 124,444 | | | | 197,964 | | | | — | | | | — | | | | — | |
Total | | | | $ | 1,131,484 | | | $ | 1,586,796 | | | $ | 61,279 | | | $ | 96,895 | | | $ | 200,454 | |
| | | | | | |
| | | | | | | | | | | | | | | | | | |
| Fair Values of Derivative Financial Instruments as of March 31, 2015 | |
| | | | | Series P | | | Series S | |
| | | | | Value | |
| | | Statements of Assets and Liabilities Location | | Derivative
Assets | | | Derivative
Liabilities | | | Derivative
Assets | | | Derivative
Liabilities | |
Interest rate contracts | | Net unrealized appreciation/depreciation1; Investments at value2 | | $ | 345,014 | | | $ | 3,807,189 | | | $ | 511,132 | | | $ | 586,918 | |
| | 1 | | Includes cumulative appreciation/depreciation on financial futures contracts and centrally cleared swaps, if any, as reported in the Schedules of Investments. Only current day’s variation margin is reported within the Statements of Assets and Liabilities. |
| | 2 | | Includes options purchased at value as reported in the Schedules of Investments. |
| | | | | | | | | | | | | | | | | | | | | | | | | | |
The Effect of Derivative Financial Instruments in the Statements of Operations Period Ended March 31, 2015 | |
| | | Series C | | | Series E | | | Series M | | | | | Series C | | | Series E | | | Series M | |
| | | | | | | | | | |
| | | Net Realized Gain (Loss)
from | | | | | Net Change in Unrealized
Appreciation/Depreciation on | |
Interest rate contracts: | | | | | | | | | | | | | | | | | | | | | | | | | | |
Financial futures contracts | | $ | 2,031,681 | | | $ | 21,766 | | | $ | 296,446 | | | | | $ | 131,678 | | | $ | (61,279 | ) | | $ | (78,903 | ) |
Swaps | | | (265,274 | ) | | | — | | | | (348,670 | ) | | | | | (580,863 | ) | | | — | | | | (362,264 | ) |
Options3 | | | (191,363 | ) | | | — | | | | 4,198 | | | | | | (165,351 | ) | | | — | | | | (6,271 | ) |
Credit contracts: | | | | | | | | | | | | | | | | | | | | | | | | | | |
Swaps | | | (74,167 | ) | | | — | | | | — | | | | | | 46,284 | | | | — | | | | — | |
| | | | | | | | | | |
Total | | $ | 1,500,877 | | | $ | 21,766 | | | $ | (48,026 | ) | | | | $ | (568,252 | ) | | $ | (61,279 | ) | | $ | (447,438 | ) |
| | | | |
| | | | | | |
| 62 | | BLACKROCK ALLOCATION TARGET SHARES | | MARCH 31, 2015 | | |
| | |
| Notes to Financial Statements (continued) | | |
| | | | | | | | | | | | | | | | | | |
The Effect of Derivative Financial Instruments in the Statements of Operations Year Ended March 31, 2015 | |
| | | Series P | | | Series S | | | | | Series P | | | Series S | |
| | | | | | | |
| | | Net Realized Gain (Loss)
from | | | | | Net Change in Unrealized
Appreciation/Depreciation on | |
Interest rate contracts: | | | | | | | | | | | | | | | | | | |
Financial futures contracts | | $ | (6,820,207 | ) | | $ | (1,789,924 | ) | | | | $ | (2,853,753 | ) | | $ | (441,074 | ) |
Swaps | | | (15,408,048 | ) | | | (139,530 | ) | | | | | (622,644 | ) | | | 79,644 | |
Options3 | | | — | | | | (274,769 | ) | | | | | — | | | | 110,156 | |
Credit contracts: | | | | | | | | | | | | | | | | | | |
Swaps | | | — | | | | (901 | ) | | | | | — | | | | (2,878 | ) |
| | | | | | | | | | |
Total | | $ | (22,228,255 | ) | | $ | (2,205,124 | ) | | | | $ | (3,476,397 | ) | | $ | (254,152 | ) |
| | | | |
| | 3 | | Options purchased are included in the net realized gain (loss) from investments and net change in unrealized appreciation/depreciation on investments. |
For the year ended March 31, 2015, the average quarterly balances of outstanding derivative financial instruments were as follows:
| | | | | | | | | | | | | | | | | | | | |
| | | | Series C | | | | Series E | | | | Series M | | | | Series P | | | | Series S | |
Financial futures contracts: | | | | | | | | | | | | | | | | | | | | |
Average notional value of contracts - long | | $ | 65,268,125 | | | | — | | | $ | 35,168,745 | | | $ | 52,034,422 | | | $ | 78,605,805 | |
Average notional value of contracts - short | | $ | 54,560,622 | | | $ | 902,344 | | | $ | 33,253,592 | | | $ | 164,760,942 | | | $ | 70,791,252 | |
Options: | | | | | | | | | | | | | | | | | | | | |
Average value of option contracts purchased | | $ | 135,048 | | | | — | | | $ | 1,938 | | | | — | | | $ | 22,778 | |
Average value of option contracts written | | $ | 41,475 | | | | — | | | $ | 969 | | | | — | | | $ | 17,853 | |
Average notional value of swaption contracts purchased | | $ | 53,235,000 | | | | — | | | | — | | | | — | | | | — | |
Average notional value of swaption contracts written | | $ | 87,000,000 | | | | — | | | | — | | | | — | | | | — | |
Credit default swaps: | | | | | | | | | | | | | | | | | | | | |
Average notional value - buy protection | | $ | 7,490,000 | | | | — | | | | — | | | | — | | | | — | |
Average notional value - sell protection | | $ | 6,031,750 | | | | — | | | | — | | | | — | | | | — | |
Interest rate swaps: | | | | | | | | | | | | | | | | | | | | |
Average notional value - pays fixed rate | | $ | 9,650,000 | | | | — | | | $ | 22,300,000 | | | $ | 182,000,000 | | | $ | 8,800,000 | |
Average notional value - receives fixed rate | | $ | 450,000 | | | | — | | | $ | 75,000 | | | | — | | | $ | 25,000,000 | |
Total return swaps: | | | | | | | | | | | | | | | | | | | | |
Average notional value | | | — | | | | — | | | $ | 89,110,707 | | | | — | | | | — | |
Counterparty Credit Risk: A derivative contract may suffer a mark-to-market loss if the value of the contract decreases due to an unfavorable change in the market rates or values of the underlying instrument. Losses can also occur if the counterparty does not perform under the contract.
A Fund’s risk of loss from counterparty credit risk on OTC derivatives is generally limited to the aggregate unrealized gain less the value of any collateral held by such Fund. For OTC options purchased, each Fund bears the risk of loss of the amount of the premiums paid plus the positive change in market values net of any collateral held by such Fund should the counterparty fail to perform under the contracts. Options written by the Funds do not typically give rise to counterparty credit risk, as options written generally obligate the Funds, and not the counterparty, to perform.
With exchange-traded purchased options and futures and centrally cleared swaps, there is less counterparty credit risk to the Funds since the exchange or clearinghouse, as counterparty to such instruments, guarantees against a possible default. The clearinghouse stands between the buyer and the seller of the contract; therefore, credit risk is limited to failure of the clearinghouse. While offset rights may exist under applicable law, the Funds do not have a contractual right of offset against a clearing broker or clearinghouse in the event of a default (including the bankruptcy or insolvency) of the clearing broker or clearinghouse. Additionally, credit risk exists in exchange-traded futures and centrally cleared swaps with respect to initial and variation margin that is held in a clearing broker’s customer accounts. While clearing brokers are required to segregate customer margin from their own assets, in the event that a clearing broker becomes insolvent or goes into bankruptcy and at that time there is a shortfall in the aggregate amount of margin held by the clearing broker for all its clients, typically the shortfall would be allocated on a pro rata basis across all the clearing broker’s customers, potentially resulting in losses to the Funds.
In order to better define its contractual rights and to secure rights that will help the Funds mitigate their counterparty risk, a Fund may enter into an International Swaps and Derivatives Association, Inc. Master Agreement (“ISDA Master Agreement”) or similar agreement with its counterparties. An ISDA Master Agreement is a bilateral agreement between each Fund and a counterparty that governs certain OTC derivatives and typically contains, among other things, collateral posting terms and netting provisions in the event of a default and/or termination event. Under an ISDA Master Agreement, each Fund may, under certain circumstances, offset with the counterparty certain derivative financial instruments’ payables and/or receivables with collateral held and/or posted and create one single net payment. The provisions of the ISDA Master Agreement typically permit a single net payment in the event of default including the bankruptcy or insolvency of the counterparty. Bankruptcy or insolvency laws of a particular jurisdiction may restrict or prohibit the right of offset in bankruptcy, insolvency or other events. In addition, certain ISDA Master Agreements allow counterparties to
| | | | | | |
| | | BLACKROCK ALLOCATION TARGET SHARES | | MARCH 31, 2015 | | 63 |
| | |
| Notes to Financial Statements (continued) | | |
terminate derivative contracts prior to maturity in the event a Fund’s net assets decline by a stated percentage or a Fund fails to meet the terms of its ISDA Master Agreements, which would cause a Fund to accelerate payment of any net liability owed to the counterparty.
Collateral Requirements: For derivatives traded under an ISDA Master Agreement, the collateral requirements are typically calculated by netting the mark to market amount for each transaction under such agreement and comparing that amount to the value of any collateral currently pledged by the Funds and the counterparty.
Cash collateral that has been pledged to cover obligations of the Funds and cash collateral received from the counterparty, if any, is reported separately on the Statements of Assets and Liabilities as cash pledged as collateral and cash received as collateral, respectively. Non-cash collateral pledged by the Funds, if any, is noted in the Schedules of Investments. Generally, the amount of collateral due from or to a party has to exceed a minimum transfer amount threshold (typically either $250,000 or $500,000) before a transfer is required, which is determined at the close of business of the Funds. Any additional required collateral is delivered to/pledged by the Funds on the next business day. Typically, the Funds and counterparties are not permitted to sell, re-pledge or use the collateral they receive. To the extent amounts due to the Funds from their counterparties are not fully collateralized, the Funds bear the risk of loss from counterparty non-performance. Likewise, to the extent the Funds have delivered collateral to a counterparty and stand ready to perform under the terms of its agreement with such counterparty, the Funds bear the risk of loss from a counterparty in the amount of the value of the collateral in the event the counterparty fails to return such collateral.
For financial reporting purposes, the Funds do not offset derivative assets and derivative liabilities that are subject to netting arrangements, if any, in the Statements of Assets and Liabilities.
As of March 31, 2015, the Funds’ derivative assets and liabilities (by type) are as follows:
| | | | | | | | | | | | | | | | | | | | |
| | | Series C | | | Series E | | | Series M | |
| | | Assets | | | Liabilities | | | Liabilities | | | Assets | | | Liabilities | |
Derivative Financial Instruments: | | | | | | | | | | | | | | | | | | | | |
Financial futures contracts | | $ | 110,743 | | | $ | 53,406 | | | $ | 8,683 | | | $ | 77,340 | | | $ | 36,472 | |
Options1 | | | 425,322 | | | | 390,952 | | | | — | | | | — | | | | — | |
Swaps-Centrally cleared | | | — | | | | 20,220 | | | | — | | | | 874 | | | | — | |
Swaps-OTC2 | | | 124,444 | | | | 197,964 | | | | — | | | | 5,956 | | | | 31,729 | |
| | | | | | | | | | | | |
Total derivative assets and liabilities in the Statements of Assets and Liabilities | | $ | 660,509 | | | $ | 662,542 | | | $ | 8,683 | | | $ | 84,170 | | | $ | 68,201 | |
| | | | | | | | | | | | |
Derivatives not subject to a Master Netting Agreement or similar agreement (“MNA”) | | | (139,474 | ) | | | (81,526 | ) | | | (8,683 | ) | | | (78,214 | ) | | | (36,472 | ) |
| | | | | | | | | | | | |
Total derivative assets and liabilities subject to an MNA | | $ | 521,035 | | | $ | 581,016 | | | | — | | | $ | 5,956 | | | $ | 31,729 | |
| | | | | | | | | | | | |
| | 1 | | Includes options purchased at value which are included in Investments at value — unaffiliated in the Statements of Assets and Liabilities and reported in the Schedules of Investments. |
| | 2 | | Includes unrealized appreciation/depreciation on OTC swaps and swap premiums paid/received in the Statements of Assets and Liabilities. |
| | | | | | | | | | | | | | | | |
| | | Series P | | | Series S | |
| | | Assets | | | Liabilities | | | Assets | | | Liabilities | |
Derivative Financial Instruments: | | | | | | | | | | | | | | | | |
Financial futures contracts | | $ | 89,931 | | | $ | 479,000 | | | $ | 72,757 | | | $ | 101,706 | |
Options1 | | | — | | | | — | | | | 91,113 | | | | 71,413 | |
Swaps-Centrally cleared | | | — | | | | 381,602 | | | | 16,237 | | | | — | |
| | | | | | | | |
Total derivative assets and liabilities in the Statements of Assets and Liabilities | | $ | 89,931 | | | $ | 860,602 | | | $ | 180,107 | | | $ | 173,119 | |
| | | | | | | | |
Derivatives not subject to an MNA | | | (89,931 | ) | | | (860,602 | ) | | | (180,107 | ) | | | (173,119 | ) |
| | | | | | | | |
Total derivative assets and liabilities subject to an MNA | | | — | | | | — | | | | — | | | | — | |
| | | | | | | | |
| | | | | | |
| 64 | | BLACKROCK ALLOCATION TARGET SHARES | | MARCH 31, 2015 | | |
| | |
| Notes to Financial Statements (continued) | | |
As of March 31, 2015, the following tables present the Funds’ derivative assets and/or liabilities by counterparty net of amounts available for offset under a MNA and net of the related collateral received and pledged by the Funds:
| | | | | | | | | | | | | | | | | | | | |
| Series C | | | | | | | | | | | | | | | |
| Counterparty | | Derivative Assets
Subject to an MNA by
Counterparty | | | Derivative Available
for Offset1 | | | Non-cash
Collateral
Received | | | Cash
Collateral
Received | | | Net Amount of
Derivative Assets2 | |
Barclays Bank PLC | | $ | 285 | | | | — | | | | — | | | | — | | | $ | 285 | |
Citibank N.A. | | | 43 | | | $ | (43 | ) | | | — | | | | — | | | | — | |
Credit Suisse International | | | 47,229 | | | | (47,229 | ) | | | — | | | | — | | | | — | |
Deutsche Bank AG | | | 102,142 | | | | — | | | | — | | | | — | | | | 102,142 | |
Goldman Sachs Bank USA | | | 69,377 | | | | (69,377 | ) | | | — | | | | — | | | | — | |
JPMorgan Chase Bank N.A. | | | 294,449 | | | | (209,923 | ) | | | — | | | | — | | | | 84,526 | |
Morgan Stanley Capital Services LLC | | | 7,510 | | | | (4,924 | ) | | | — | | | | — | | | | 2,586 | |
| | | | |
Total | | $ | 521,035 | | | $ | (331,496 | ) | | | — | | | | — | | | $ | 189,539 | |
| | | | |
| | | | | | | | | | | | | | | | | | | | |
| Counterparty | | Derivative Liabilities
Subject to an MNA by
Counterparty | | | Derivative Available
for Offset1 | | | Non-cash
Collateral
Pledged | | | Cash
Collateral
Pledged | | | Net Amount of
Derivative Liabilities3 | |
Citibank N.A. | | $ | 173,129 | | | $ | (43 | ) | | | — | | | | — | | | $ | 173,086 | |
Credit Suisse International | | | 123,559 | | | | (47,229 | ) | | | — | | | | — | | | | 76,330 | |
Goldman Sachs Bank USA | | | 69,481 | | | | (69,377 | ) | | | — | | | | — | | | | 104 | |
JPMorgan Chase Bank N.A. | | | 209,923 | | | | (209,923 | ) | | | — | | | | — | | | | — | |
Morgan Stanley Capital Services LLC | | | 4,924 | | | | (4,924 | ) | | | — | | | | — | | | | — | |
| | | | |
Total | | $ | 581,016 | | | $ | (331,496 | ) | | | — | | | | — | | | $ | 249,520 | |
| | | | |
| | | | | | | | | | | | | | | | | | | | |
| Series M | | | | | | | | | | | | | | | |
| Counterparty | | Derivative Assets
Subject to an MNA by
Counterparty | | | Derivative Available
for Offset1 | | | Non-cash
Collateral
Received | | | Cash
Collateral
Received | | | Net Amount of
Derivative Assets | |
Credit Suisse International | | $ | 4,393 | | | $ | (4,393 | ) | | | — | | | | — | | | | — | |
Deutsche Bank AG | | | 1,563 | | | | (1,563 | ) | | | — | | | | — | | | | — | |
| | | | |
Total | | $ | 5,956 | | | $ | (5,956 | ) | | | — | | | | — | | | | — | |
| | | | |
| | | | | | | | | | | | | | | | | | | | |
| Counterparty | | Derivative Liabilities
Subject to an MNA by
Counterparty | | | Derivative Available
for Offset1 | | | Non-cash
Collateral
Pledged | | | Cash
Collateral
Pledged | | | Net Amount of
Derivative Liabilities3 | |
Citibank N.A. | | $ | 2,076 | | | | — | | | | — | | | | — | | | $ | 2,076 | |
Credit Suisse International | | | 23,604 | | | $ | (4,393 | ) | | | — | | | | — | | | | 19,211 | |
Deutsche Bank AG | | | 2,730 | | | | (1,563 | ) | | | — | | | | — | | | | 1,167 | |
Goldman Sachs Bank USA | | | 3,319 | | | | — | | | | — | | | | — | | | | 3,319 | |
| | | | |
Total | | $ | 31,729 | | | $ | (5,956 | ) | | | — | | | | — | | | $ | 25,773 | |
| | | | |
| | 1 | | The amount of derivatives available for offset is limited to the amount of derivative assets and/or liabilities that are subject to an MNA. |
| | 2 | | Net amount represents the net amount receivable from the counterparty in the event of default. |
| | 3 | | Net amount represents the net amount payable due to the counterparty in the event of default. |
| | | | | | |
| | | BLACKROCK ALLOCATION TARGET SHARES | | MARCH 31, 2015 | | 65 |
| | |
| Notes to Financial Statements (continued) | | |
5. Investment Advisory Agreement and Other Transactions with Affiliates:
The PNC Financial Services Group, Inc. is the largest stockholder and an affiliate of BlackRock, Inc. (“BlackRock”) for 1940 Act purposes.
The Trust, on behalf of the Funds, entered into an Investment Advisory Agreement with the Manager, the Funds’ investment advisor, an indirect, wholly owned subsidiary of BlackRock, to provide investment advisory services. The Manager receives no advisory fee from the Funds under the Investment Advisory Agreement.
The Manager contractually agreed to waive all fees and pay or reimburse all operating expenses of each Fund, excluding interest expense, dividend expense, tax expense, acquired fund fees and expenses and certain other fund expenses, which constitute extraordinary expenses not incurred in the ordinary course of business. This agreement has no fixed term. Although the Funds do not compensate the Manager directly for its services under the Investment Advisory Agreement, because each Fund is an investment option for certain wrap-fee or other separately managed account program clients, the Manager may benefit from the fees charged to such clients who have retained the Manager’s affiliates to manage their accounts.
Each Fund entered into a Distribution Agreement and a Distribution and Service Plan with BlackRock Investments, LLC (“BRIL”), an affiliate of the Manager.
The Manager reimbursed Series S $183,022 to compensate for an investment erroneously made in violation of the investment guidelines, which is included in net realized gain (loss) from swaps in the Statements of Operations.
Certain officers and/or trustees of the Trust are officers and/or directors of BlackRock or its affiliates. The Funds reimburse the Manager for a portion of the compensation paid to the Trust’s Chief Compliance Officer, which is included in officer and trustees in the Statements of Operations.
The Funds may purchase securities from, or sell securities to, an affiliated fund provided the affiliation is due solely to having a common investment advisor, common officers, or common trustees. For the year ended March 31, 2015, the sale transactions with an affiliated fund in compliance with Rule 17a-7 under the 1940 Act for Series C and Series S were $306,195 and $325,545, respectively.
6. Purchases and Sales:
For the year ended March 31, 2015, purchases and sales of investments, including mortgage dollar rolls and excluding short-term securities, were as follows:
| | | | | | | | | | | | | | | | | | | | |
| Purchases | | | | | | | | | | | | | | | |
| | | Series C | | | Series E | | | Series M | | | Series P | | | Series S | |
Non-U.S. Government Securities | | $ | 123,469,080 | | | $ | 52,479,326 | | | $ | 9,397,535,864 | | | $ | 33,235,882 | | | $ | 683,272,509 | |
U.S. Government Securities | | | 30,608,336 | | | | — | | | | 56,625,830 | | | | — | | | | 366,484,464 | |
Total Purchases | | $ | 154,077,416 | | | $ | 52,479,326 | | | $ | 9,454,161,694 | | | $ | 33,235,882 | | | $ | 1,049,756,973 | |
| | | | |
| | | | | | | | | | | | | | | | | | | | |
| | | | | | | | | | | | | | | | |
| Sales | | | | | | | | | | | | |
| | | Series C | | | Series E | | | Series M | | | Series S | |
Non-U.S. Government Securities | | $ | 117,380,205 | | | $ | 8,663,283 | | | $ | 9,388,845,862 | * | | $ | 641,803,589 | * |
U.S. Government Securities | | | 27,985,494 | | | | — | | | | 57,817,364 | | | | 382,191,986 | |
Total Sales | | $ | 145,365,699 | | | $ | 8,663,283 | | | $ | 9,446,663,226 | | | $ | 1,023,995,575 | |
| | | | |
For the year ended March 31, 2015, purchases and sales related to mortgage dollar rolls were as follows:
| | | | | | | | |
| | | Series M | | | Series S | |
Purchases | | $ | 3,771,416,669 | | | $ | 252,374,390 | |
Sales | | $ | 3,774,631,259 | | | $ | 252,900,589 | |
7. Income Tax Information:
It is the Funds’ policy to comply with the requirements of the Internal Revenue Code of 1986, as amended, applicable to regulated investment companies, and to distribute substantially all of their taxable income to their shareholders. Therefore, no federal income tax provision is required.
| | | | | | |
| 66 | | BLACKROCK ALLOCATION TARGET SHARES | | MARCH 31, 2015 | | |
| | |
| Notes to Financial Statements (continued) | | |
The Funds file U.S. federal and various state and local tax returns. No income tax returns are currently under examination. The statute of limitations on the Funds’ U.S. federal tax returns, except with respect to Series E and Series P, remains open for each of the four years ended March 31, 2015. The statute of limitations on Series E’s U.S. federal tax return remains open for the period ended March 31, 2015. The statute of limitations on Series P’s U.S. federal tax return remains open for the two years ended March 31, 2015 and the period ended March 31, 2013. The statutes of limitations on the Funds’ state and local tax returns may remain open for an additional year depending upon the jurisdiction.
Management has analyzed tax laws and regulations and their application to the Funds as of March 31, 2015, inclusive of the open tax return years, and does not believe there are any uncertain tax positions that require recognition of a tax liability in the Funds’ financial statements.
U.S. GAAP requires that certain components of net assets be adjusted to reflect permanent differences between financial and tax reporting. These reclassifications have no effect on net assets or net asset values per share. As of March 31, 2015, the following permanent differences attributable to the accounting for swap agreements, a net operating loss and net paydown losses were reclassified to the following accounts:
| | | | | | | | | | | | |
| | | Paid-in
capital | | | Undistributed
(distributions
in excess of)
net investment
income | | | Accumulated
net realized
gain (loss) | |
Series C | | | — | | | $ | (117,888 | ) | | $ | 117,888 | |
Series E | | | — | | | $ | (129 | ) | | $ | 129 | |
Series M | | | — | | | $ | 1,661,836 | | | $ | (1,661,836 | ) |
Series P | | $ | (1,233,756 | ) | | $ | (2,168,452 | ) | | $ | 3,402,208 | |
Series S | | | — | | | $ | 690,828 | | | $ | (690,828 | ) |
The tax character of distributions paid was as follows:
| | | | | | | | | | | | | | | | |
| | | Series C | | | Series E | | | Series M | | | Series S | |
Tax-exempt income1 | | | | | | | | | | | | | | | | |
3/31/15 | | | — | | | $ | 767,932 | | | | — | | | | — | |
3/31/14 | | | — | | | | — | | | | — | | | | — | |
Ordinary income | | | | | | | | | | | | | | | | |
3/31/15 | | $ | 14,099,204 | | | | 47,426 | | | $ | 10,128,091 | | | $ | 6,279,653 | |
3/31/14 | | $ | 14,022,130 | | | | — | | | $ | 6,547,063 | | | $ | 6,055,042 | |
Long-term capital gain | | | | | | | | | | | | | | | | |
3/31/15 | | | 4,184,272 | | | | 3,433 | | | | — | | | | — | |
3/31/14 | | | 5,063,534 | | | | — | | | | 258,487 | | | | 244,617 | |
| | | | |
Total | | | | | | | | | | | | | | | | |
3/31/15 | | $ | 18,283,476 | | | $ | 818,791 | | | $ | 10,128,091 | | | $ | 6,279,653 | |
| | | | |
3/31/14 | | $ | 19,085,664 | | | | — | | | $ | 6,805,550 | | | $ | 6,299,659 | |
| | | | |
| | 1 | | The Funds designate these amounts paid during the fiscal year ended March 31, 2015 as exempt-interest dividends. |
As of March 31, 2015, the tax components of accumulated net earnings (losses) were as follows:
| | | | | | | | | | | | | | | | | | | | |
| | | Series C | | | Series E | | | Series M | | | Series P | | | Series S | |
Undistributed ordinary income | | $ | 743,308 | | | $ | 104,048 | | | $ | 3,745,769 | | | | — | | | | — | |
Undistributed long-term capital gains | | | 1,925,860 | | | | — | | | | 35,241 | | | | — | | | | — | |
Capital loss carryforwards | | | — | | | | — | | | | — | | | $ | (9,438,519 | ) | | $ | (1,009,325 | ) |
Net unrealized gains (losses)1 | | | 20,628,188 | | | | 1,089,693 | | | | 6,219,383 | | | | (1,946,024 | ) | | | (548,830 | ) |
Qualified late year losses2 | | | — | | | | (27,140 | ) | | | — | | | | (13,148,717 | ) | | | (906,603 | ) |
| | | | |
Total | | $ | 23,297,356 | | | $ | 1,166,601 | | | $ | 10,000,393 | | | $ | (24,533,260 | ) | | $ | (2,464,758 | ) |
| | | | |
| | 1 | | The differences between book-basis and tax-basis net unrealized gains (losses) were attributable primarily to the tax deferral of losses on wash sales, amortization methods for discounts on fixed income securities, the realization for tax purposes of unrealized gains/losses on certain futures and options contracts and the accounting for swap agreements. |
| | 2 | | The Fund has elected to defer certain qualified late-year losses and recognize such losses in the next taxable year. |
As of March 31, 2015, Series P and S had capital loss carryforwards, with no expiration dates, available to offset future realized capital gains of $9,438,519 and $1,009,325, respectively.
During the year ended March 31, 2015, Series M utilized $4,524,257 of their capital loss carryforward.
| | | | | | |
| | | BLACKROCK ALLOCATION TARGET SHARES | | MARCH 31, 2015 | | 67 |
| | |
| Notes to Financial Statements (continued) | | |
As of March 31, 2015, gross unrealized appreciation and depreciation based on cost for federal income tax purposes were as follows:
| | | | | | | | | | | | | | | | | | | | |
| | | Series C | | | Series E | | | Series M | | | Series P | | | Series S | |
Tax cost | | $ | 339,561,588 | | | $ | 46,751,072 | | | $ | 1,061,974,948 | | | $ | 95,709,987 | | | $ | 339,241,288 | |
| | | | |
Gross unrealized appreciation | | $ | 22,260,987 | | | $ | 1,152,542 | | | $ | 10,862,933 | | | | — | | | $ | 2,270,198 | |
Gross unrealized depreciation | | | (2,360,489 | ) | | | (62,748 | ) | | | (3,103,072 | ) | | $ | (639,681 | ) | | | (2,785,415 | ) |
| | | | |
Net unrealized appreciation (depreciation) | | $ | 19,900,498 | | | $ | 1,089,794 | | | $ | 7,759,861 | | | $ | (639,681 | ) | | $ | (515,217 | ) |
| | | | |
8. Bank Borrowings:
The Trust, on behalf of the Funds, along with certain other funds managed by the Manager and its affiliates (“Participating Funds”), was a party to a 364-day, $1.1 billion credit agreement with a group of lenders, under which the Funds may borrow to fund shareholder redemptions. Excluding commitments designated for a certain individual fund, the Participating Funds, including the Funds, could borrow up to an aggregate commitment amount of $650 million, subject to asset coverage and other limitations as specified in the agreement. Effective November 25, 2014, the credit agreement was amended to an aggregate commitment amount of $2.1 billion, of which the Participating Funds, including the Funds, can borrow up to $1.6 billion at any time outstanding, subject to asset coverage and other limitations as specified in the agreement. The agreement terminates on April 23, 2015, unless otherwise extended to November 24, 2015 or renewed for a period of 364 days from April 23, 2015. The amended agreement has the following terms: a fee of 0.06% per annum on unused commitment amounts and interest at a rate equal to the higher of (a) one-month LIBOR (but, in any event, not less than 0.00%) on the date the loan is made plus 0.80% per annum or (b) the Fed Funds rate (but, in any event, not less than 0.00%) in effect from time to time plus 0.80% per annum on amounts borrowed. Participating Funds paid administration, legal and arrangement fees, which are included in miscellaneous expenses in the Statements of Operations, and along with commitment fees, were allocated among such funds based upon portions of the aggregate commitment available to them and relative net assets of Participating Funds. During the year ended March 31, 2015, the Funds did not borrow under the credit agreement.
9. Principal Risks:
In the normal course of business, the Funds invest in securities and enter into transactions where risks exist due to fluctuations in the market (market risk) or failure of the issuer of a security to meet all its obligations (issuer credit risk). The value of securities held by the Funds may decline in response to certain events, including those directly involving the issuers whose securities are owned by the Funds; conditions affecting the general economy; overall market changes; local, regional or global political, social or economic instability; and currency, interest rate and price fluctuations. Similar to issuer credit risk, the Funds may be exposed to counterparty credit risk, or the risk that an entity with which the Funds have unsettled or open transactions may fail to or be unable to perform on its commitments. The Funds manage counterparty credit risk by entering into transactions only with counterparties that they believe have the financial resources to honor their obligations and by monitoring the financial stability of those counterparties. Financial assets, which potentially expose the Funds to market, issuer and counterparty credit risks, consist principally of financial instruments and receivables due from counterparties. The extent of the Funds’ exposure to market, issuer and counterparty credit risks with respect to these financial assets is generally approximated by their value recorded in the Statements of Assets and Liabilities, less any collateral held by the Funds.
The Funds invest a significant portion of their assets in fixed income securities and/or use derivatives tied to the fixed income markets. Changes in market interest rates or economic conditions, may affect the value and/or liquidity of such investments. Interest rate risk is the risk that prices of bonds and other fixed income securities will increase as interest rates fall and decrease as interest rates rise. The Funds may be subject to a greater risk of rising interest rates due to the current period of historically low rates.
Series M and Series S invest a significant portion of their assets in securities backed by commercial or residential mortgage loans or in issuers that hold mortgage and other asset-backed securities. Investment percentages in these securities are presented in the Schedules of Investments. Changes in economic conditions, including delinquencies and/or defaults on assets underlying these securities, can affect the value, income and/or liquidity of such positions.
| | | | | | |
| 68 | | BLACKROCK ALLOCATION TARGET SHARES | | MARCH 31, 2015 | | |
| | |
| Notes to Financial Statements (concluded) | | |
10. Capital Share Transactions:
Transactions in capital shares were as follows:
| | | | | | | | |
| Series C | | Year Ended
March 31,
2015 | | | Year Ended
March 31,
2014 | |
Shares sold | | | 10,323,009 | | | | 6,187,280 | |
Shares redeemed | | | (6,803,698 | ) | | | (9,836,652 | ) |
| | | | |
Net increase (decrease) | | | 3,519,311 | | | | (3,649,372 | ) |
| | | | |
| | | | |
| Series E | | Period
August 4,
20141
to March 31,
2015 | |
Shares sold | | | 4,881,304 | |
Shares redeemed | | | (253,209 | ) |
| | | | |
Net increase | | | 4,628,095 | |
| | | | |
| | | | | | | | |
| Series M | | Year Ended
March 31,
2015 | | | Year Ended
March 31,
2014 | |
Shares sold | | | 26,049,074 | | | | 15,996,845 | |
Shares redeemed | | | (8,132,394 | ) | | | (9,086,329 | ) |
| | | | |
Net increase | | | 17,916,680 | | | | 6,910,516 | |
| | | | |
| | |
| Series P | | | | | | |
Shares sold | | | 24,033,692 | | | | 26,553,021 | |
Shares redeemed | | | (15,211,492 | ) | | | (1,734,292 | ) |
| | | | |
Net increase | | | 8,822,200 | | | | 24,818,729 | |
| | | | |
| | |
| Series S | | | | | | |
Shares sold | | | 9,544,967 | | | | 15,771,940 | |
Shares redeemed | | | (5,973,351 | ) | | | (7,186,703 | ) |
| | | | |
Net increase | | | 3,571,616 | | | | 8,585,237 | |
| | | | |
| | 1 | | Commencement of operations. |
At March 31, 2015, 1,000,000 shares of Series E were owned by affiliates.
11. Subsequent Events:
Management’s evaluation of the impact of all subsequent events on the Funds’ financial statements was completed through the date the financial statements were issued and the following item was noted:
Effective April 23, 2015, the 364-day, $2.1 billion credit agreement to which the Funds are a party, was further amended to expire on April 21, 2016, unless otherwise extended or renewed.
| | | | | | |
| | | BLACKROCK ALLOCATION TARGET SHARES | | MARCH 31, 2015 | | 69 |
| | |
| Report of Independent Registered Public Accounting Firm | | |
To the Board of Trustees of BlackRock Allocation Target Shares and Shareholders of BlackRock Allocation Target Shares: Series C Portfolio, BlackRock Allocation Target Shares: Series E Portfolio, BlackRock Allocation Target Shares: Series M Portfolio, BlackRock Allocation Target Shares: Series P Portfolio and BlackRock Allocation Target Shares: Series S Portfolio:
We have audited the accompanying statements of assets and liabilities of the BlackRock Allocation Target Shares: Series C Portfolio, BlackRock Allocation Target Shares: Series E Portfolio, BlackRock Allocation Target Shares: Series M Portfolio, BlackRock Allocation Target Shares: Series P Portfolio and BlackRock Allocation Target Shares: Series S Portfolio (collectively, the “Funds”), including the schedules of investments, as of March 31, 2015, and the related statements of operations for the year then ended, the statements of changes in net assets for each of the two years in the period then ended (as to BlackRock Allocation Target Shares: Series E Portfolio, for the period from August 4, 2014 (commencement of operations) to March 31, 2015), the financial highlights for each of the periods presented, and the statement of cash flows for BlackRock Allocation Target Shares: Series S Portfolio for the year then ended. These financial statements and financial highlights are the responsibility of the Funds’ management. Our responsibility is to express an opinion on these financial statements and financial highlights based on our audits.
We conducted our audits in accordance with the standards of the Public Company Accounting Oversight Board (United States). Those standards require that we plan and perform the audit to obtain reasonable assurance about whether the financial statements and financial highlights are free of material misstatement. The Funds are not required to have, nor were we engaged to perform, an audit of its internal control over financial reporting. Our audits included consideration of internal control over financial reporting as a basis for designing audit procedures that are appropriate in the circumstances, but not for the purpose of expressing an opinion on the effectiveness of the Funds’ internal control over financial reporting. Accordingly, we express no such opinion. An audit also includes examining, on a test basis, evidence supporting the amounts and disclosures in the financial statements, assessing the accounting principles used and significant estimates made by management, as well as evaluating the overall financial statement presentation. Our procedures included confirmation of securities owned as of March 31, 2015, by correspondence with the custodian and brokers; where replies were not received from brokers, we perform other auditing procedures. We believe that our audits provides a reasonable basis for our opinion.
In our opinion, such financial statements and financial highlights referred to above present fairly, in all material respects, the financial position of the BlackRock Allocation Target Shares: Series C Portfolio, BlackRock Allocation Target Shares: Series E Portfolio, BlackRock Allocation Target Shares: Series M Portfolio, BlackRock Allocation Target Shares: Series P Portfolio and BlackRock Allocation Target Shares: Series S Portfolio, as of March 31, 2015, the results of their operations for the period then ended, the changes in their net assets, financial highlights for each of the periods presented, and cash flows for the BlackRock Allocation Target Shares: Series S Portfolio for the year then ended, in conformity with accounting principles generally accepted in the United States of America.
Deloitte & Touche LLP
Philadelphia, Pennsylvania
May 22, 2015
| | | | | | |
| 70 | | BLACKROCK ALLOCATION TARGET SHARES | | MARCH 31, 2015 | | |
| | |
| Important Tax Information | | |
During the fiscal year ended March 31, 2015, the following information is provided with respect to the ordinary income distributions paid by the Funds:
| | | | | | | | |
Interest Related Distributions and Qualified Short-Term Capital Gains for Non-US Residents1 | |
| | | April 2014 -
December 2014 | | | January 2015 -
March 2015 | |
Series C | | | 70.96 | % | | | 63.11 | % |
Series M | | | 96.94 | % | | | 95.29 | % |
Series S | | | 85.35 | % | | | 100.00 | % |
Federal Obligation Interest2 | |
| | | | | | April 2014 -
March 2015 | |
Series C | | | | | | | 0.79 | % |
Series M | | | | | | | 0.48 | % |
Series S | | | | | | | 8.57 | % |
| | 1 | | Represents the portion of the taxable ordinary income distributions eligible for exemptions from U.S. withholding tax for nonresident aliens and foreign corporations. |
| | 2 | | The law varies in each state as to whether and what percentage of ordinary income distributions is eligible for exemption from state income tax. We recommend that you consult your tax advisor to determine if any portion of the distributions you received are exempt from state income tax. |
Additionally, Series C distributed long-term capital gains of $0.059413 and $0.071872 per share to shareholders of record on July 16, 2014 and December 4, 2014, respectively. Furthermore, Series E distributed long-term capital gains of $0.00097 per share to shareholders of record on December 4, 2014.
| | | | | | |
| | | BLACKROCK ALLOCATION TARGET SHARES | | MARCH 31, 2015 | | 71 |
| | | | | | | | | | |
Name, Address1 and Year of Birth | | Position(s)
Held with
Trust | | Length
of Time
Served as
a Trustee3 | | Principal Occupation(s) During Past Five Years | | Number of BlackRock-
Advised Registered
Investment Companies
(“RICs”) Consisting of
Investment Portfolios
(“Portfolios”) Overseen | | Public
Directorships |
| Independent Trustees2 |
Robert M. Hernandez 1944 | | Chairman of the Board and Trustee | | Since 2007 | | Director, Vice Chairman and Chief Financial Officer of USX Corporation (energy and steel business) from 1991 to 2001; Director, TE Connectivity (electronics) from 2006 to 2012. | | 28 RICs consisting of 98 Portfolios | | ACE Limited (insurance company); Eastman Chemical Company; RTI International Metals, Inc. |
Fred G. Weiss 1941 | | Vice Chairman of the Board and Trustee | | Since 2007 | | Managing Director, FGW Associates (consulting and investment company) since 1997; Director and Treasurer, Michael J. Fox Foundation for Parkinson’s Research since 2000; Director, BTG International Plc (medical technology commercialization company) from 2001 to 2007. | | 28 RICs consisting of 98 Portfolios | | Actavis, Plc (pharmaceuticals) |
James H. Bodurtha 1944 | | Trustee | | Since 2007 | | Director, The China Business Group, Inc. (consulting and investing firm) from 1996 to 2013 and Executive Vice President thereof from 1996 to 2003; Chairman of the Board, Berkshire Holding Corporation since 1980. | | 28 RICs consisting of 98 Portfolios | | None |
Bruce R. Bond 1946 | | Trustee | | Since 2007 | | Trustee and Member of the Governance Committee, State Street Research Mutual Funds from 1997 to 2005; Board Member of Governance, Audit and Finance Committee, Avaya Inc. (computer equipment) from 2003 to 2007. | | 28 RICs consisting of 98 Portfolios | | None |
Donald W. Burton 1944 | | Trustee | | Since 2007 | | Managing General Partner, The Burton Partnership, LP (an investment partnership) since 1979; Managing General Partner, The Burton Partnership (QP), LP (an investment partnership) since 2000; Managing General Partner, The South Atlantic Venture Funds from 1983 to 2012; Director, IDology, Inc. (technology solutions) since 2006; Director, Knology, Inc. (telecommunications) from 1996 to 2012; Director, Capital Southwest (financials) from 2006 to 2012. | | 28 RICs consisting of 98 Portfolios | | None |
Honorable Stuart E. Eizenstat 1943 | | Trustee | | Since 2007 | | Partner and Head of International Practice, Covington and Burling LLP (law firm) since 2001; International Advisory Board Member, The Coca-Cola Company from 2002 to 2011; Advisory Board Member, Veracity Worldwide, LLC (risk management) from 2007 to 2012; Member of the International Advisory Board GML Ltd. (energy) since 2003; Advisory Board Member, BT Americas (telecommunications) from 2004 to 2009. | | 28 RICs consisting of 98 Portfolios | | Alcatel-Lucent (telecom- munications); Global Specialty Metallurgical; UPS Corporation (delivery service) |
Kenneth A. Froot 1957 | | Trustee | | Since 2007 | | Professor, Harvard University from 1993 to 2012 | | 28 RICs consisting of 98 Portfolios | | None |
John F. O’Brien 1943 | | Trustee | | Since 2007 | | Chairman, Woods Hole Oceanographic Institute since 2009 and Trustee thereof from 2003 to 2009. | | 28 RICs consisting of 98 Portfolios | | Cabot Corporation (chemicals); LKQ Corporation (auto parts manufacturing); TJX Companies, Inc. (retailer) |
Roberta Cooper Ramo 1942 | | Trustee | | Since 2007 | | Shareholder and Attorney, Modrall, Sperling, Roehl, Harris & Sisk, P.A. (law firm) since 1993; Chairman of the Board, Cooper’s Inc., (retail) since 1999; Director, ECMC Group (service provider to students, schools and lenders) since 2001; President, The American Law Institute (non-profit) since 2008; Vice President, Santa Fe Opera (non-profit) since 2011; Chair, Think New Mexico (non-profit), since 2013. | | 28 RICs consisting of 98 Portfolios | | None |
| | | | | | |
| 72 | | BLACKROCK ALLOCATION TARGET SHARES | | MARCH 31, 2015 | | |
| | |
| Officers and Trustees (continued) | | |
| | | | | | | | | | |
Name, Address1 and Year of Birth | | Position(s)
Held with
Trust | | Length
of Time
Served as
a Trustee3 | | Principal Occupation(s) During Past Five Years | | Number of BlackRock- Advised Registered Investment Companies
(“RICs”) Consisting of
Investment Portfolios
(“Portfolios”) Overseen | | Public
Directorships |
| Independent Trustees2 (concluded) |
David H. Walsh 1941 | | Trustee | | Since 2007 | | Director, National Museum of Wildlife Art since 2007; Trustee, University of Wyoming Foundation from 2008 to 2012; Director, The American Museum of Fly Fishing since 1997. | | 28 RICs consisting of 98 Portfolios | | None |
| | 1 The address of each Trustee and Officer is c/o BlackRock, Inc., Park Avenue Plaza 55 East 52nd Street New York, NY 10055. 2 Each Independent Trustee holds office until his or her successor is duly elected and qualifies or until his or her earlier death, resignation or removal as provided by the Trust’s by-laws or charter or statute. In no event may an Independent Trustee hold office beyond December 31 of the year in which he or she turns 74. 3 Date shown is the earliest date a person has served for the Trust. Following the combination of Merrill Lynch Investment Managers, L.P. (“MLIM”) and BlackRock in September 2006, the various legacy MLIM and legacy BlackRock fund boards were realigned and consolidated into three new fund boards in 2007. As a result, although the chart shows certain Directors as joining the Trust’s board in 2007, those Trustees first became members of the boards of other legacy MLIM or legacy BlackRock funds as follows: James H. Bodurtha, 1995; Bruce R. Bond, 2005; Donald W. Burton, 2002; Honorable Stuart E. Eizenstat, 2001; Kenneth A. Froot, 2005; Robert M. Hernandez, 1996; John F. O’Brien, 2005; Roberta Cooper Ramo, 1999; David H. Walsh, 2003; and Fred G. Weiss, 1998. |
| Interested Trustees4 | | | | | | | | | | |
Robert Fairbairn 1965 | | Trustee | | Since 2015 | | Senior Managing Director of BlackRock, Inc. since 2010; Global Head of BlackRock’s 2011 Retail and iShares businesses since 2012; Member of BlackRock’s Global Executive and Global Operating Committees Officer; Head of BlackRock’s Global Client Group from 2009 to 2012; Chairman of BlackRock’s international businesses from 2007 to 2010. | | 28 RICs consisting of 98 Portfolios | | None |
Henry Gabbay 1947 | | Trustee | | Since 2007 | | Consultant, BlackRock, Inc. from 2007 to 2008; Managing Director, BlackRock from 1989 to 2007; Chief Administrative Officer, BlackRock Advisors, LLC from 1998 to 2007; President of BlackRock Funds and BlackRock Allocation Target Shares (formerly, BlackRock Bond Allocation Target Shares) from 2005 to 2007 and Treasurer of certain closed-end funds in the BlackRock fund complex from 1989 to 2006. | | 28 RICs consisting of 98 Portfolios | | None |
John M. Perlowski 1964 | | Trustee, President and Chief Executive Officer | | 2015 to present (Trustee); 2010 to present (President and Chief Executive Officer) | | Managing Director of BlackRock, Inc. since 2009; Head of Global Fund Services since 2009; Managing Director and Chief Operating Officer of the Global Product Group at Goldman Sachs Asset Management, L.P. from 2003 to 2009; Treasurer of Goldman Sachs Mutual Funds from 2003 to 2009 and Senior Vice President thereof from 2007 to 2009; Director of Goldman Sachs Offshore Funds from 2002 to 2009; Director of Family Resource Network (charitable foundation) since 2009. | | 104 RICs consisting of 174 Portfolios | | None |
| | 4 Messrs. Fairbairn and Perlowski are both “interested persons,” as defined in the 1940 Act, of the Trust based on their positions with BlackRock and its affiliates. Mr. Gabbay may be deemed an “interested person” of the Trust based on his former positions with BlackRock, Inc. and its affiliates. Mr. Gabbay does not currently serve as an officer or employee of BlackRock, Inc. or The PNC Financial Services Group, Inc. Mr. Gabbay is a non-management Interested Trustee. Interested Trustees serve until their successor is duly elected and qualifies or until their earlier death, resignation, retirement or removal as provided by the Trust’s by-laws or charter or statute, or until December 31 of the year in which they turn 72. Officers of the Trust serve at the pleasure of the Board. |
| | | | | | |
| | | BLACKROCK ALLOCATION TARGET SHARES | | MARCH 31, 2015 | | 73 |
| | |
| Officers and Trustees (concluded) | | |
| | | | | | |
Name, Address1 and Year of Birth | | Position(s)
Held with
Fund/
Master LLC | | Length
of Time
Served as
an Officer | | Principal Occupation(s) During Past 5 Years |
| Officers2 |
John M. Perlowski 1964 | | Trustee, President and Chief Executive Officer | | 2015 to present (Trustee); 2010 to present (President and Chief Executive Officer) | | Managing Director of BlackRock, Inc. since 2009; Head of Global Fund Services since 2009; Managing Director and Chief Operating Officer of the Global Product Group at Goldman Sachs Asset Management, L.P. from 2003 to 2009; Treasurer of Goldman Sachs Mutual Funds from 2003 to 2009 and Senior Vice President thereof from 2007 to 2009; Director of Goldman Sachs Offshore Funds from 2002 to 2009; Director of Family Resource Network (charitable foundation) since 2009. |
Jennifer McGovern 1977 | | Vice President | | Since 2014 | | Director of BlackRock, Inc. since 2011; Head of Product Structure and Oversight for BlackRock’s U.S. Wealth Advisory Group since 2013; Vice President of BlackRock, Inc. from 2008 to 2010. |
Neal Andrews 1966 | | Chief Financial Officer | | Since 2007 | | Managing Director of BlackRock, Inc. since 2006; Senior Vice President and Line of Business Head of Fund Accounting and Administration at PNC Global Investment Servicing (U.S.) Inc. from 1992 to 2006. |
Jay Fife 1970 | | Treasurer | | Since 2007 | | Managing Director of BlackRock, Inc. since 2007; Director of BlackRock, Inc. in 2006; Assistant Treasurer of the MLIM and Fund Asset Management, L.P. advised funds from 2005 to 2006; Director of MLIM Fund Services Group from 2001 to 2006. |
Charles Park 1967 | | Chief Compliance Officer | | Since 2014 | | Anti-Money Laundering Compliance Officer for the BlackRock Funds in the Equity-Bond Complex, the Equity-Liquidity Complex and the Closed-End Complex from 2014 to 2015; Chief Compliance Officer of BlackRock Advisors, LLC and the BlackRock-advised Funds in the Equity-Bond Complex, the Equity-Liquidity Complex and the Closed-End Complex since 2014; Principal of and Chief Compliance Officer for iShares® Delaware Trust Sponsor LLC since 2012 and BlackRock Fund Advisors (“BFA”) since 2006; Chief Compliance Officer for the BFA-advised iShares exchange traded funds since 2006; Chief Compliance Officer for BlackRock Asset Management International Inc. since 2012. |
Fernanda Piedra 1977 | | Anti-Money Laundering Compliance Officer | | Since 2015 | | Director of BlackRock, Inc. since 2014; Anti-Money Laundering Compliance Officer and Regional Head of Financial Crime for the Americas of BlackRock, Inc. since 2014; Head of Regulatory Changes and Remediation for the Asset Wealth Management Division of Deutsche Bank from 2010 to 2014; Vice President of Goldman Sachs (Anti-Money Laundering/Suspicious Activities Group) from 2004 to 2010. |
Benjamin Archibald 1975 | | Secretary | | Since 2012 | | Managing Director of BlackRock, Inc. since 2014; Director of BlackRock, Inc. from 2010 to 2013; Assistant Secretary of the BlackRock-advised funds from 2010 to 2012; General Counsel and Chief Operating Officer of Uhuru Capital Management from 2009 to 2010; Executive Director and Counsel of Goldman Sachs Asset Management from 2005 to 2009. |
| | 1 The address of each Officer is c/o BlackRock, Inc., Park Avenue Plaza, 55 East 52nd Street, New York, NY 10055. 2 Officers of the Trust serve at the pleasure of the Board. |
| | Further information about the Officers and Trustees is available in the Trust’s Statement of Additional Information, which can be obtained without charge by calling 1-800-882-0052. |
Effective December 31, 2014, Paul L. Audet and Laurence D. Fink resigned as Trustees of the Trust. Effective January 1, 2015, Robert Fairbairn and John M. Perlowski were appointed to serve as Trustees of the Trust.
Effective March 1, 2015, Charles Park resigned as Anti-Money Laundering Compliance Officer of the Trust and Fernanda Piedra became Anti-Money Laundering Compliance Officer of the Trust.
Effective as of the close of business on May 13, 2015, Valerie G. Brown and Donald C. Opatrny were appointed to serve as Trustees of the Trust.
| | | | | | |
| | | | |
Investment Advisor BlackRock Advisors, LLC Wilmington, DE 19809 | | Accounting Agent, Administrator and Transfer Agent BNY Mellon Investment Servicing (US) Inc. Wilmington, DE 19809 | | Custodian The Bank of New York Mellon New York, NY 10286 | | Distributor BlackRock Investments, LLC New York, NY 10022 |
| | | | | | |
Legal Counsel Willkie Farr & Gallagher LLP New York, NY 10019 | | Independent Registered Public Accounting Firm Deloitte & Touche LLP Philadelphia, PA 19103 | | Address of the Trust 100 Bellevue Parkway Wilmington, DE 19809 | | |
| | | | | | |
| 74 | | BLACKROCK ALLOCATION TARGET SHARES | | MARCH 31, 2015 | | |
Householding
The Funds will mail only one copy of shareholder documents, including prospectuses, annual and semi-annual reports and proxy statements, to shareholders with multiple accounts at the same address. This practice is commonly called “householding” and is intended to reduce expenses and eliminate duplicate mailings of shareholder documents. Mailings of your shareholder documents may be householded indefinitely unless you instruct us otherwise. If you do not want the mailing of these documents to be combined with those for other members of your household, please call the Funds at (800) 882-0052.
Availability of Quarterly Schedule of Investments
The Funds file their complete schedule of portfolio holdings with the SEC for the first and third quarters of each fiscal year on Form N-Q. The Funds’ Forms N-Q are available on the SEC’s website at http://www.sec.gov and may also be reviewed and copied at the SEC’s Public Reference Room in Washington, DC. Information on how to access documents on the SEC’s website without charge may be obtained by calling (800) SEC-0330. The Funds’ Forms N-Q may also be obtained upon request and without charge by calling (800) 882-0052.
Availability of Proxy Voting Policies and Procedures
A description of the policies and procedures that the Funds use to determine how to vote proxies relating to portfolio securities is available upon request and without charge, (1) by calling (800) 882-0052; (2) at http://www.blackrock.com; and (3) on the SEC’s website at http://www.sec.gov.
Availability of Proxy Voting Record
Information about how the Funds voted proxies relating to securities held in the Funds’ portfolios during the most recent 12-month period ended June 30 is available upon request and without charge (1) at http://www.blackrock.com or by calling (800) 882-0052 and (2) on the SEC’s website at http://www.sec.gov.
|
| BlackRock Privacy Principles |
BlackRock is committed to maintaining the privacy of its current and former fund investors and individual clients (collectively, “Clients”) and to safeguarding their non-public personal information. The following information is provided to help you understand what personal information BlackRock collects, how we protect that information and why in certain cases we share such information with select parties.
If you are located in a jurisdiction where specific laws, rules or regulations require BlackRock to provide you with additional or different privacy-related rights beyond what is set forth below, then BlackRock will comply with those specific laws, rules or regulations.
BlackRock obtains or verifies personal non-public information from and about you from different sources, including the following: (i) information we receive from you or, if applicable, your financial intermediary, on applications, forms or other documents; (ii) information about your transactions with us, our affiliates, or others; (iii) information we receive from a consumer reporting agency; and (iv) from visits to our websites.
BlackRock does not sell or disclose to non-affiliated third parties any non-public personal information about its Clients, except as permitted by law or as is necessary to respond to regulatory requests or to service Client accounts. These non-affiliated third parties are required to protect the confidentiality and security of this information and to use it only for its intended purpose.
We may share information with our affiliates to service your account or to provide you with information about other BlackRock products or services that may be of interest to you. In addition, BlackRock restricts access to non-public personal information about its Clients to those BlackRock employees with a legitimate business need for the information. BlackRock maintains physical, electronic and procedural safeguards that are designed to protect the non-public personal information of its Clients, including procedures relating to the proper storage and disposal of such information.
| | | | | | |
| | | BLACKROCK ALLOCATION TARGET SHARES | | MARCH 31, 2015 | | 75 |
This report is intended for current holders. It is not authorized for use as an offer of sale or a solicitation of an offer to buy shares of the Funds unless preceded or accompanied by the Funds’ current prospectus. Past performance results shown in this report should not be considered a representation of future performance. Investment returns and principal value of shares will fluctuate so that shares, when redeemed, may be worth more or less than their original cost. Statements and other information herein are as dated and are subject to change.

| | |
| |
BATS-3/15-AR | |  |
| | |
| Item 2 – | | Code of Ethics – The registrant (or the “Fund”) has adopted a code of ethics, as of the end of the period covered by this report, applicable to the registrant’s principal executive officer, principal financial officer, principal accounting officer or controller, or persons performing similar functions. During the period covered by this report, the code of ethics was amended to update certain information and to make other non-material changes. During the period covered by this report, there have been no waivers granted under the code of ethics. A copy of the code of ethics is available without charge at www.blackrock.com. |
| |
| Item 3 – | | Audit Committee Financial Expert – The registrant’s board of directors (the “board of directors”), has determined that (i) the registrant has the following audit committee financial experts serving on its audit committee and (ii) each audit committee financial expert is independent: Robert M. Hernandez Fred G. Weiss Stuart E. Eizenstat |
| |
| | Under applicable securities laws, a person determined to be an audit committee financial expert will not be deemed an “expert” for any purpose, including without limitation for the purposes of Section 11 of the Securities Act of 1933, as a result of being designated or identified as an audit committee financial expert. The designation or identification of a person as an audit committee financial expert does not impose on such person any duties, obligations, or liabilities greater than the duties, obligations, and liabilities imposed on such person as a member of the audit committee and board of directors in the absence of such designation or identification. |
| |
| Item 4 – | | Principal Accountant Fees and Services |
The following table presents fees billed by Deloitte & Touche LLP (“D&T”) in each of the last two fiscal years for the services rendered to the Funds:
| | | | | | | | | | | | | | | | |
| | | (a) Audit Fees | | (b) Audit-Related Fees1 | | (c) Tax Fees2 | | (d) All Other Fees3 |
| Entity Name | | Current
Fiscal Year
End | | Previous
Fiscal Year
End | | Current
Fiscal Year
End | | Previous
Fiscal Year
End | | Current
Fiscal Year
End | | Previous
Fiscal Year
End | | Current
Fiscal Year
End | | Previous
Fiscal Year
End |
| | | | | | | | | | | | | | | | | |
Series C Portfolio | | $39,588 | | $39,588 | | $0 | | $0 | | $15,402 | | $15,100 | | $0 | | $0 |
Series E Portfolio | | $40,500 | | N/A | | $0 | | $0 | | $13,362 | | N/A | | $0 | | $0 |
Series M Portfolio | | $35,638 | | $35,638 | | $0 | | $0 | | $15,402 | | $15,100 | | $0 | | $0 |
Series P Portfolio | | $38,100 | | $38,100 | | $0 | | $0 | | $15,402 | | $15,100 | | $0 | | $0 |
Series S Portfolio | | $39,588 | | $39,588 | | $0 | | $0 | | $15,402 | | $15,100 | | $0 | | $0 |
The following table presents fees billed by D&T that were required to be approved by the registrant’s audit committee (the “Committee”) for services that relate directly to the operations or financial reporting of the Fund and that are rendered on behalf of BlackRock Advisors, LLC (“Investment Adviser” or “BlackRock”) and entities controlling, controlled by, or under common control with BlackRock (not including any sub-adviser whose role is primarily portfolio management and is subcontracted with or overseen by another investment adviser) that provide ongoing services to the Fund (“Fund Service Providers”):
2
| | | | |
| | | Current Fiscal Year End | | Previous Fiscal Year End |
(b) Audit-Related Fees1 | | $0 | | $0 |
(c) Tax Fees2 | | $0 | | $0 |
(d) All Other Fees3 | | $2,391,000 | | $2,555,000 |
1 The nature of the services includes assurance and related services reasonably related to the performance of the audit of financial statements not included in Audit Fees.
2 The nature of the services includes tax compliance, tax advice and tax planning.
3 Aggregate fees borne by BlackRock in connection with the review of compliance procedures and attestation thereto performed by D&T with respect to all of the registered closed-end funds and some of the registered open-end funds advised by BlackRock.
(e)(1) Audit Committee Pre-Approval Policies and Procedures:
The Committee has adopted policies and procedures with regard to the pre-approval of services. Audit, audit-related and tax compliance services provided to the registrant on an annual basis require specific pre-approval by the Committee. The Committee also must approve other non-audit services provided to the registrant and those non-audit services provided to the Investment Adviser and Fund Service Providers that relate directly to the operations and the financial reporting of the registrant. Certain of these non-audit services that the Committee believes are (a) consistent with the SEC’s auditor independence rules and (b) routine and recurring services that will not impair the independence of the independent accountants may be approved by the Committee without consideration on a specific case-by-case basis (“general pre-approval”). The term of any general pre-approval is 12 months from the date of the pre-approval, unless the Committee provides for a different period. Tax or other non-audit services provided to the registrant which have a direct impact on the operations or financial reporting of the registrant will only be deemed pre-approved provided that any individual project does not exceed $10,000 attributable to the registrant or $50,000 per project. For this purpose, multiple projects will be aggregated to determine if they exceed the previously mentioned cost levels.
Any proposed services exceeding the pre-approved cost levels will require specific pre-approval by the Committee, as will any other services not subject to general pre-approval (e.g., unanticipated but permissible services). The Committee is informed of each service approved subject to general pre-approval at the next regularly scheduled in-person board meeting. At this meeting, an analysis of such services is presented to the Committee for ratification. The Committee may delegate to the Committee Chairman the authority to approve the provision of and fees for any specific engagement of permitted non-audit services, including services exceeding pre-approved cost levels.
(e)(2) None of the services described in each of Items 4(b) through (d) were approved by the Committee
pursuant to the de minimis exception in paragraph (c)(7)(i)(C) of Rule 2-01 of Regulation S-X.
(f) Not Applicable
(g) The aggregate non-audit fees paid to the accountant for services rendered by the accountant to the registrant, the Investment Adviser and the Fund Service Providers were:
| | | | | | |
| | | Entity Name | | Current Fiscal Year End | | Previous Fiscal Year End |
| | Series C Portfolio | | $15,402 | | $15,100 |
| | Series E Portfolio | | $13,362 | | N/A |
| | Series M Portfolio | | $15,402 | | $15,100 |
| | Series P Portfolio | | $15,402 | | $15,100 |
3
| | | | | | |
| | | | | | | |
| | Series S Portfolio | | $15,402 | | $15,100 |
| | |
| | Additionally, SSAE 16 Review (Formerly, SAS No. 70) fees for the current and previous fiscal years of $2,391,000 and $2,555,000, respectively, were billed by D&T to the Investment Adviser. |
| |
| | (h) The Committee has considered and determined that the provision of non-audit services that were rendered to the Investment Adviser and the Fund Service Providers that were not pre-approved pursuant to paragraph (c)(7)(ii) of Rule 2-01 of Regulation S-X is compatible with maintaining the principal accountant’s independence. |
| |
| Item 5 – | | Audit Committee of Listed Registrants – Not Applicable |
| |
| Item 6 – | | Investments (a) The registrant’s Schedule of Investments is included as part of the Report to Stockholders filed under Item 1 of this Form. |
| |
| | (b) Not Applicable due to no such divestments during the semi-annual period covered since the previous Form N-CSR filing. |
| |
| Item 7 – | | Disclosure of Proxy Voting Policies and Procedures for Closed-End Management Investment Companies – Not Applicable |
| |
| Item 8 – | | Portfolio Managers of Closed-End Management Investment Companies – Not Applicable |
| |
| Item 9 – | | Purchases of Equity Securities by Closed-End Management Investment Company and Affiliated Purchasers – Not Applicable |
| |
| Item 10 – | | Submission of Matters to a Vote of Security Holders – There have been no material changes to these procedures. |
| |
| Item 11 – | | Controls and Procedures |
| |
| | (a) The registrant’s principal executive and principal financial officers, or persons performing similar functions, have concluded that the registrant’s disclosure controls and procedures (as defined in Rule 30a-3(c) under the Investment Company Act of 1940, as amended (the “1940 Act”)) are effective as of a date within 90 days of the filing of this report based on the evaluation of these controls and procedures required by
Rule 30a-3(b) under the 1940 Act and Rule 15d-15(b) under the Securities Exchange Act of 1934, as amended. |
| |
| | (b) There were no changes in the registrant’s internal control over financial reporting (as defined in
Rule 30a-3(d) under the 1940 Act) that occurred during the second fiscal quarter of the period covered by this report that have materially affected, or are reasonably likely to materially affect, the registrant’s internal control over financial reporting. |
| |
| Item 12 – | | Exhibits attached hereto |
| |
| | | (a)(1) Code of Ethics – See Item 2 |
4
| | |
| | (a)(2) Certifications – Attached hereto |
| |
| | (a)(3) Not Applicable |
| |
| | (b) Certifications – Attached hereto |
5
Pursuant to the requirements of the Securities Exchange Act of 1934 and the Investment Company Act of 1940, the registrant has duly caused this report to be signed on its behalf by the undersigned, thereunto duly authorized.
BlackRock Allocation Target Shares
| | |
| By: | | /s/ John M. Perlowski |
| | John M. Perlowski |
| | Chief Executive Officer (principal executive officer) of |
| | | BlackRock Allocation Target Shares |
Date: June 2, 2015
Pursuant to the requirements of the Securities Exchange Act of 1934 and the Investment Company Act of 1940, this report has been signed below by the following persons on behalf of the registrant and in the capacities and on the dates indicated.
| | |
| By: | | /s/ John M. Perlowski |
| | John M. Perlowski |
| | Chief Executive Officer (principal executive officer) of |
| | | BlackRock Allocation Target Shares |
Date: June 2, 2015
| | |
| By: | | /s/ Neal J. Andrews |
| | Neal J. Andrews |
| | Chief Financial Officer (principal financial officer) of |
| | | BlackRock Allocation Target Shares |
Date: June 2, 2015
6