UNITED STATES
SECURITIES AND EXCHANGE COMMISSION
Washington, D.C. 20549
Form N-CSR
CERTIFIED SHAREHOLDER REPORT OF REGISTERED
MANAGEMENT INVESTMENT COMPANIES
Investment Company Act File Number: 811-21323
Eaton Vance Limited Duration Income Fund
(Exact Name of Registrant as Specified in Charter)
Two International Place, Boston, Massachusetts 02110
(Address of Principal Executive Offices)
Maureen A. Gemma
Two International Place, Boston, Massachusetts 02110
(Name and Address of Agent for Services)
(617) 482-8260
(Registrant’s Telephone Number)
March 31
Date of Fiscal Year End
March 31, 2018
Date of Reporting Period
Item 1. Reports to Stockholders

Eaton Vance
Limited Duration Income Fund (EVV)
Annual Report
March 31, 2018

Commodity Futures Trading Commission Registration. Effective December 31, 2012, the Commodity Futures Trading Commission (“CFTC”) adopted certain regulatory changes that subject registered investment companies and advisers to regulation by the CFTC if a fund invests more than a prescribed level of its assets in certain CFTC-regulated instruments (including futures, certain options and swap agreements) or markets itself as providing investment exposure to such instruments. The Fund has claimed an exclusion from the definition of the term “commodity pool operator” under the Commodity Exchange Act. Accordingly, neither the Fund nor the adviser with respect to the operation of the Fund is subject to CFTC regulation. Because of its management of other strategies, the Fund’s adviser is registered with the CFTC as a commodity pool operator and a commodity trading advisor.
Fund shares are not insured by the FDIC and are not deposits or other obligations of, or guaranteed by, any depository institution. Shares are subject to investment risks, including possible loss of principal invested.
Annual Report March 31, 2018
Eaton Vance
Limited Duration Income Fund
Table of Contents
Management’s Discussion of Fund Performance | 2 | |||
Performance | 3 | |||
Fund Profile | 3 | |||
Endnotes and Additional Disclosures | 4 | |||
Financial Statements | 5 | |||
Report of Independent Registered Public Accounting Firm | 72 | |||
Federal Tax Information | 73 | |||
Annual Meeting of Shareholders | 74 | |||
Dividend Reinvestment Plan | 75 | |||
Management and Organization | 77 | |||
Important Notices | 80 | |||
Eaton Vance
Limited Duration Income Fund
March 31, 2018
Management’s Discussion of Fund Performance1
Economic and Market Conditions
Credit markets generated positive returns in the mostly favorable economic and earnings environment for the 12 months ended March 31, 2018. Demand for global fixed-income assets was a tailwind, as well as accommodative or easy monetary policies from most central banks to foster economic growth, rising corporate earnings and the most synchronized global expansion since the financial crisis. The supportive backdrop provided by central bank liquidity also helped suppress volatility for most of the 12-month period, although volatility returned in the first quarter of 2018.
Although liquidity remained abundant, there were continued signs of a gradual pullback in crisis-era stimulus. In October 2017, the Federal Reserve (the Fed) began reducing its balance sheet by capping reinvestments on its mortgage and Treasury holdings. This was a well-telegraphed move that did not surprise markets, but it was in addition to the two rate hikes the Fed had already delivered in the first half of the year and was followed by a third, 25-basis-point hike in December 2017. While most other central banks remained in net easing mode, markets increasingly began considering the probability of other central banks reducing stimulus as well given the strong momentum in economic growth. In fiscal policy, U.S. lawmakers succeeded in passing a tax bill in late December — stimulus that came on the heels of above-trend GDP growth.
Against this backdrop, the ICE BofAML 1-3 Year U.S. Treasury Index and the Bloomberg Barclays U.S. Aggregate Bond Index2 returned 0.03% and 1.20%, respectively, during the 12-month period ended March 31, 2018. The ICE BofAML U.S. High Yield Index returned 3.69%% for the period, while the S&P/LSTA Leveraged Loan Index, a loan market barometer, returned 4.43%.
Fund Performance
For the 12-month period ended March 31, 2018, Eaton Vance Limited Duration Income Fund (the Fund) had total returns of 4.72% at net asset value (NAV) and 0.99% at market price.
The Fund’s floating-rate loan investments outperformed the loan market, as measured by the S&P/LSTA Leveraged Loan Index. The Fund’s bank loan performance was enhanced by credit selection as well as several industry weightings. A market overweight in cable and satellite television and a market underweight in oil and gas both contributed
to the outperformance, while a market overweight to drug companies, which underperformed, slightly detracted from Fund performance during the period. Individual credit selection contributed to the majority of the outperformance, with several overweight positions providing solid returns.
The Fund’s high-yield bond investments posted gains over the course of the one-year period, outperforming the broader high-yield market, as measured by the ICE BofAML U.S. High Yield Index. The Fund’s outperformance in high yield was mainly driven by credit selection and to a lesser extent, an overweight in the higher quality, better performing single B category. Exposure to CCC-rated9 names also aided performance as spreads in these issues compressed over the period. Though offset by positive credit selection, positioning across the various duration8 segments proved to be challenging relative to the Index over the period. Credit selection in the 2-5 year segment was a significant contributor to performance, while the Fund’s underweight to issues with shorter durations (less than 2 years) and an elevated cash position detracted from performance. From a sector perspective, credit selection in the services and retail sectors aided performance for the period. Credit selection, combined with a small underweight in the diversified financial services sector, detracted from performance during the period, while credit selection in the banks and thrifts sector also hurt performance. The Fund’s focus on higher quality, less volatile issues in the energy sector also weighed negatively on performance as lower quality, higher beta names in this sector generally outperformed over the period.
The Fund’s investments in agency mortgage-backed securities (MBS) outperformed the U.S. Treasury market, as measured by the ICE BofAML 1-10 Year U.S. Treasury Index (Treasury Index). Management held the view that the Treasury yield curve would continue to flatten throughout the year and increased its allocation to floating rate agency MBS, which would benefit from rising short end yields. The agency MBS the Fund invested in also have a shorter duration than the Treasury Index, which aided Fund performance as U.S. Treasury yields in the intermediate part of the curve rose as Fed rate hike projections increased. The Fund also benefitted from its investment in negative duration interest only agency MBS, which saw substantial spread tightening as U.S. Treasury yields rose and prepayment declined, providing additional yield on the securities.
See Endnotes and Additional Disclosures in this report.
Past performance is no guarantee of future results. Returns are historical and are calculated by determining the percentage change in net asset value (NAV) or market price (as applicable) with all distributions reinvested and include management fees and other expenses. Fund performance at market price will differ from its results at NAV due to factors such as changing perceptions about the Fund, market conditions, fluctuations in supply and demand for Fund shares, or changes in Fund distributions. Investment return and principal value will fluctuate so that shares, when sold, may be worth more or less than their original cost. Performance less than or equal to one year is cumulative. Performance is for the stated time period only; due to market volatility, current Fund performance may be lower or higher than the quoted return. For performance as of the most recent month-end, please refer to eatonvance.com.
| 2 |
Eaton Vance
Limited Duration Income Fund
March 31, 2018
Performance3
Portfolio Managers Scott H. Page, CFA, Payson F. Swaffield, CFA, Michael W. Weilheimer, CFA, Catherine McDermott, Andrew Szczurowski, CFA, and Eric A. Stein, CFA
| % Average Annual Total Returns | Inception Date | One Year | Five Years | Ten Years | ||||||||||||
Fund at NAV | 05/30/2003 | 4.72 | % | 5.57 | % | 8.07 | % | |||||||||
Fund at Market Price | — | 0.99 | 2.68 | 8.09 | ||||||||||||
| % Premium/Discount to NAV4 | ||||||||||||||||
| –11.73 | % | |||||||||||||||
| Distributions5 | ||||||||||||||||
Total Distributions per share for the period | $ | 0.967 | ||||||||||||||
Distribution Rate at NAV | 6.56 | % | ||||||||||||||
Distribution Rate at Market Price | 7.43 | % | ||||||||||||||
| % Total Leverage6 | ||||||||||||||||
Auction Preferred Shares (APS) | 9.68 | % | ||||||||||||||
Borrowings | 28.12 | |||||||||||||||
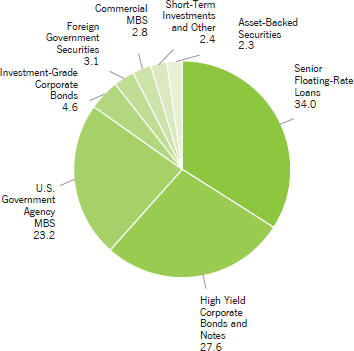
Fund Profile
Asset Allocation (% of total investments)7
See Endnotes and Additional Disclosures in this report.
Past performance is no guarantee of future results. Returns are historical and are calculated by determining the percentage change in net asset value (NAV) or market price (as applicable) with all distributions reinvested and include management fees and other expenses. Fund performance at market price will differ from its results at NAV due to factors such as changing perceptions about the Fund, market conditions, fluctuations in supply and demand for Fund shares, or changes in Fund distributions. Investment return and principal value will fluctuate so that shares, when sold, may be worth more or less than their original cost. Performance less than or equal to one year is cumulative. Performance is for the stated time period only; due to market volatility, current Fund performance may be lower or higher than the quoted return. For performance as of the most recent month-end, please refer to eatonvance.com.
| 3 |
Eaton Vance
Limited Duration Income Fund
March 31, 2018
Endnotes and Additional Disclosures
| 1 | The views expressed in this report are those of the portfolio manager(s) and are current only through the date stated at the top of this page. These views are subject to change at any time based upon market or other conditions, and Eaton Vance and the Fund(s) disclaim any responsibility to update such views. These views may not be relied upon as investment advice and, because investment decisions are based on many factors, may not be relied upon as an indication of trading intent on behalf of any Eaton Vance fund. This commentary may contain statements that are not historical facts, referred to as “forward looking statements”. The Fund’s actual future results may differ significantly from those stated in any forward looking statement, depending on factors such as changes in securities or financial markets or general economic conditions, the volume of sales and purchases of Fund shares, the continuation of investment advisory, administrative and service contracts, and other risks discussed from time to time in the Fund’s filings with the Securities and Exchange Commission. |
| 2 | ICE BofAML 1-3 Year U.S. Treasury Index is an unmanaged index of short-term U.S. Treasury securities. ICE BofAML U.S. High Yield Index is an unmanaged index of below-investment grade U.S. corporate bonds. ICE BofAML 1-10 Year U.S. Treasury Index is an unmanaged index of Treasury securities with maturities ranging from 1 to 10 years. ICE Data Indices, LLC indices not for redistribution or other uses; provided “as is”, without warranties, and with no liability. Eaton Vance has prepared this report, ICE Data Indices, LLC does not endorse it, or guarantee, review, or endorse Eaton Vance’s products. Bloomberg Barclays U.S. Aggregate Bond Index is an unmanaged index of domestic investment-grade bonds, including corporate, government and mortgage-backed securities. S&P/LSTA Leveraged Loan Index is an unmanaged index of the institutional leveraged loan market. Unless otherwise stated, index returns do not reflect the effect of any applicable sales charges, commissions, expenses, taxes or leverage, as applicable. It is not possible to invest directly in an index. |
| 3 | Performance results reflect the effects of leverage. The Fund’s performance for certain periods reflects the effects of expense reductions. Absent these reductions, performance would have been lower. |
| 4 | The shares of the Fund often trade at a discount or premium from their net asset value. The discount or premium of the Fund may vary over time and may be higher or lower than what is quoted in this report. For up-to-date premium/discount information, please refer to http://eatonvance.com/closedend. |
| 5 | The Distribution Rate is based on the Fund’s last regular distribution per share in the period (annualized) divided by the Fund’s NAV or market price at the end of the period. The Fund’s distributions may be comprised of amounts characterized for federal income tax purposes as qualified and non-qualified ordinary dividends, capital gains and nondividend distributions, also known as return of capital. For additional information about nondividend distributions, please refer to Eaton Vance Closed-End Fund Distribution Notices (19a) posted on our website, eatonvance.com. The Fund will determine the federal income tax character of distributions paid to a shareholder after the end of the calendar year. This is reported on the IRS form 1099-DIV and provided to the shareholder shortly after each year-end. For information about the tax character of distributions made in prior calendar years, please refer to Performance-Tax Character of Distributions on the Fund’s webpage available at eatonvance.com. The Fund’s distributions are determined by the investment adviser based on its current assessment of the Fund’s long-term return potential. Fund distributions may be affected by numerous factors including changes in Fund performance, the cost of financing for leverage, portfolio holdings, realized and projected returns, and other factors. As portfolio and market conditions change, the rate of distributions paid by the Fund could change. |
| 6 | Leverage represents the liquidation value of the Fund’s APS and borrowings outstanding as a percentage of Fund net assets applicable to common shares plus APS and borrowings outstanding. Use of leverage creates an opportunity for income, but creates risks including greater price volatility. The cost of leverage rises and falls with changes in short-term interest rates. The Fund may be required to maintain prescribed asset coverage for its leverage and may be required to reduce its leverage at an inopportune time. |
| 7 | Asset allocation as a percentage of the Fund’s net assets amounted to 159.7%. |
| 8 | Duration is a measure of the expected change in price of a bond — in percentage terms — given a one percent change in interest rates, all else being constant. Securities with lower durations tend to be less sensitive to interest rate changes. |
| 9 | Credit ratings are categorized using S&P. If S&P does not publish a rating, then the Moody’s rating is applied. Ratings, which are subject to change, apply to the creditworthiness of the issuers of the underlying securities and not to the Fund or its shares. Credit ratings measure the quality of a bond based on the issuer’s creditworthiness, with ratings ranging from AAA, being the highest, to D, being the lowest based on S&P’s measures. Ratings of BBB or higher by S&P or Baa or higher by Moody’s are considered to be investment-grade quality. Credit ratings are based largely on the ratings agency’s analysis at the time of rating. The rating assigned to any particular security is not necessarily a reflection of the issuer’s current financial condition and does not necessarily reflect its assessment of the volatility of a security’s market value or of the liquidity of an investment in the security. |
| Fund profile subject to change due to active management. |
| Important Notice to Shareholders |
| Effective October 23, 2017, the BofA Merrill Lynch indices have been rebranded as Intercontinental Exchange’s (“ICE”) BofAML indices. |
| 4 |
Eaton Vance
Limited Duration Income Fund
March 31, 2018
Portfolio of Investments
| Senior Floating-Rate Loans — 54.2%(1) | ||||||||||||
| Borrower/Tranche Description | Principal Amount* (000’s omitted) | Value | ||||||||||
| Aerospace and Defense — 0.5% | ||||||||||||
| Accudyne Industries, LLC | ||||||||||||
Term Loan, 5.13%, (1 mo. USD LIBOR + 3.25%), Maturing August 18, 2024 | 771 | $ | 776,005 | |||||||||
| IAP Worldwide Services, Inc. | ||||||||||||
Revolving Loan, 1.46%, (3 mo. USD LIBOR + 5.50%), Maturing July 18, 2018(2) | 172 | 172,470 | ||||||||||
Term Loan - Second Lien, 8.80%, (3 mo. USD LIBOR + 6.50%), Maturing | 229 | 186,763 | ||||||||||
| TransDigm, Inc. | ||||||||||||
Term Loan, 4.77%, (USD LIBOR + 2.75%), Maturing June 9, 2023(4) | 5,642 | 5,670,419 | ||||||||||
Term Loan, 4.71%, (USD LIBOR + 2.50%), Maturing August 22, 2024(4) | 1,402 | 1,408,493 | ||||||||||
| Wesco Aircraft Hardware Corp. | ||||||||||||
Term Loan, 4.88%, (1 mo. USD LIBOR + 3.00%), Maturing October 4, 2021 | 1,064 | 1,062,420 | ||||||||||
| $ | 9,276,570 | |||||||||||
| Automotive — 1.5% | ||||||||||||
| Allison Transmission, Inc. | ||||||||||||
Term Loan, 3.60%, (1 mo. USD LIBOR + 1.75%), Maturing September 23, 2022 | 1,774 | $ | 1,786,317 | |||||||||
| American Axle and Manufacturing, Inc. | ||||||||||||
Term Loan, 4.13%, (1 mo. USD LIBOR + 2.25%), Maturing April 6, 2024 | 3,521 | 3,540,080 | ||||||||||
| Apro, LLC | ||||||||||||
Term Loan, 5.69%, (1 mo. USD LIBOR + 4.00%), Maturing August 8, 2024 | 293 | 294,831 | ||||||||||
| Belron Finance US, LLC | ||||||||||||
Term Loan, 4.29%, (3 mo. USD LIBOR + 2.50%), Maturing November 7, 2024 | 599 | 602,989 | ||||||||||
| Chassix, Inc. | ||||||||||||
Term Loan, 7.28%, (USD LIBOR + 5.50%), Maturing November 15, 2023(4) | 1,496 | 1,513,083 | ||||||||||
| CS Intermediate Holdco 2, LLC | ||||||||||||
Term Loan, 4.30%, (3 mo. USD LIBOR + 2.00%), Maturing November 2, 2023 | 1,707 | 1,718,436 | ||||||||||
| Dayco Products, LLC | ||||||||||||
Term Loan, 6.98%, (3 mo. USD LIBOR + 5.00%), Maturing May 19, 2023 | 1,191 | 1,205,143 | ||||||||||
| FCA US, LLC | ||||||||||||
Term Loan, 3.86%, (1 mo. USD LIBOR + 2.00%), Maturing December 31, 2018 | 1,597 | 1,603,399 | ||||||||||
| Federal-Mogul Holdings Corporation | ||||||||||||
Term Loan, 5.55%, (1 mo. USD LIBOR + 3.75%), Maturing April 15, 2021 | 4,784 | 4,819,226 | ||||||||||
| Borrower/Tranche Description | Principal Amount* (000’s omitted) | Value | ||||||||||
| Automotive (continued) | ||||||||||||
| Goodyear Tire & Rubber Company (The) | ||||||||||||
Term Loan - Second Lien, 3.71%, (3 mo. USD LIBOR + 2.00%), Maturing March 7, 2025 | 2,258 | $ | 2,268,213 | |||||||||
| Horizon Global Corporation | ||||||||||||
Term Loan, 6.38%, (1 mo. USD LIBOR + 4.50%), Maturing June 30, 2021 | 419 | 421,439 | ||||||||||
| Sage Automotive Interiors, Inc. | ||||||||||||
Term Loan, 6.88%, (1 mo. USD LIBOR + 5.00%), Maturing October 27, 2022 | 864 | 873,783 | ||||||||||
| TI Group Automotive Systems, LLC | ||||||||||||
Term Loan, 3.50%, (3 mo. EURIBOR + 2.75%, Floor 0.75%), Maturing June 30, 2022 | EUR | 926 | 1,146,293 | |||||||||
Term Loan, 4.38%, (1 mo. USD LIBOR + 2.50%), Maturing June 30, 2022 | 1,137 | 1,144,383 | ||||||||||
| Tower Automotive Holdings USA, LLC | ||||||||||||
Term Loan, 4.50%, (1 mo. USD LIBOR + 2.75%), Maturing March 7, 2024 | 3,164 | 3,171,963 | ||||||||||
| $ | 26,109,578 | |||||||||||
| Beverage and Tobacco — 0.2% | ||||||||||||
| Arterra Wines Canada, Inc. | ||||||||||||
Term Loan, 4.95%, (3 mo. USD LIBOR + 2.75%), Maturing December 15, 2023 | 2,568 | $ | 2,581,139 | |||||||||
| Flavors Holdings, Inc. | ||||||||||||
Term Loan, 8.05%, (3 mo. USD LIBOR + 5.75%), Maturing April 3, 2020 | 866 | 788,287 | ||||||||||
Term Loan - Second Lien, 12.30%, (3 mo. USD LIBOR + 10.00%), Maturing October 3, 2021 | 1,000 | 775,000 | ||||||||||
| $ | 4,144,426 | |||||||||||
| Brokerage / Securities Dealers / Investment Houses — 0.2% | ||||||||||||
| Aretec Group, Inc. | ||||||||||||
Term Loan, 6.13%, (1 mo. USD LIBOR + 4.25%), Maturing November 23, 2020 | 958 | $ | 963,282 | |||||||||
Term Loan - Second Lien, 7.15%, (1 mo. USD LIBOR + 5.50% (2.00% Cash, 5.15% PIK)), Maturing May 23, 2021 | 1,819 | 1,825,891 | ||||||||||
| Salient Partners L.P. | ||||||||||||
Term Loan, 10.32%, (1 mo. USD LIBOR + 8.50%), Maturing May 19, 2021 | 812 | 800,066 | ||||||||||
| $ | 3,589,239 | |||||||||||
| Building and Development — 1.4% | ||||||||||||
| American Builders & Contractors Supply Co., Inc. | ||||||||||||
Term Loan, 4.38%, (1 mo. USD LIBOR + 2.50%), Maturing | 3,020 | $ | 3,030,403 | |||||||||
| 5 | See Notes to Financial Statements. |
Eaton Vance
Limited Duration Income Fund
March 31, 2018
Portfolio of Investments — continued
| Borrower/Tranche Description | Principal Amount* (000’s omitted) | Value | ||||||||||
| Building and Development (continued) | ||||||||||||
| Beacon Roofing Supply, Inc. | ||||||||||||
Term Loan, 3.94%, (1 mo. USD LIBOR + 2.25%), Maturing January 2, 2025 | 650 | $ | 653,972 | |||||||||
| Core & Main L.P. | ||||||||||||
Term Loan, 5.12%, (USD LIBOR + 3.00%), Maturing August 1, 2024(4) | 848 | 852,247 | ||||||||||
| CPG International, Inc. | ||||||||||||
Term Loan, 5.59%, (3 mo. USD LIBOR + 3.75%), Maturing May 3, 2024 | 1,725 | 1,743,405 | ||||||||||
| DTZ U.S. Borrower, LLC | ||||||||||||
Term Loan, 5.18%, (3 mo. USD LIBOR + 3.25%), Maturing November 4, 2021 | 4,567 | 4,548,883 | ||||||||||
| Henry Company, LLC | ||||||||||||
Term Loan, 5.88%, (1 mo. USD LIBOR + 4.00%), Maturing October 5, 2023 | 2,345 | 2,381,958 | ||||||||||
| Quikrete Holdings, Inc. | ||||||||||||
Term Loan, 4.63%, (1 mo. USD LIBOR + 2.75%), Maturing November 15, 2023 | 3,005 | 3,021,710 | ||||||||||
| RE/MAX International, Inc. | ||||||||||||
Term Loan, 5.05%, (3 mo. USD LIBOR + 2.75%), Maturing December 15, 2023 | 2,256 | 2,269,064 | ||||||||||
| Realogy Corporation | ||||||||||||
Term Loan, 3.96%, (1 mo. USD LIBOR + 2.25%), Maturing February 8, 2025 | 919 | 925,811 | ||||||||||
| Summit Materials Companies I, LLC | ||||||||||||
Term Loan, 4.13%, (1 mo. USD LIBOR + 2.25%), Maturing November 21, 2024 | 698 | 703,705 | ||||||||||
| Werner FinCo L.P. | ||||||||||||
Term Loan, 5.88%, (1 mo. USD LIBOR + 4.00%), Maturing July 24, 2024 | 1,048 | 1,061,163 | ||||||||||
| WireCo WorldGroup, Inc. | ||||||||||||
Term Loan, 7.48%, (3 mo. USD LIBOR + 5.50%), Maturing | 690 | 699,627 | ||||||||||
Term Loan - Second Lien, 10.98%, (3 mo. USD LIBOR + 9.00%), Maturing September 30, 2024 | 1,650 | 1,658,250 | ||||||||||
| $ | 23,550,198 | |||||||||||
| Business Equipment and Services — 4.9% | ||||||||||||
| Acosta Holdco, Inc. | ||||||||||||
Term Loan, 5.13%, (1 mo. USD LIBOR + 3.25%), Maturing | 2,220 | $ | 1,883,524 | |||||||||
| AlixPartners, LLP | ||||||||||||
Term Loan, 5.05%, (3 mo. USD LIBOR + 2.75%), Maturing April 4, 2024 | 2,178 | 2,190,251 | ||||||||||
| Altisource Solutions S.a.r.l. | ||||||||||||
Term Loan, 5.38%, (1 mo. USD LIBOR + 3.50%), Maturing December 9, 2020 | 998 | 996,156 | ||||||||||
| Borrower/Tranche Description | Principal Amount* (000’s omitted) | Value | ||||||||
| Business Equipment and Services (continued) | ||||||||||
| Altran Technologies S.A. | ||||||||||
Term Loan, 3.25%, (3 mo. EURIBOR + 3.25%), Maturing January 17, 2025 | EUR | 2,100 | $ | 2,585,022 | ||||||
| Brand Energy & Infrastructure Services, Inc. | ||||||||||
Term Loan, 6.00%, (3 mo. USD LIBOR + 4.25%), Maturing June 21, 2024 | 596 | 601,124 | ||||||||
| Camelot UK Holdco Limited | ||||||||||
Term Loan, 5.13%, (1 mo. USD LIBOR + 3.25%), Maturing October 3, 2023 | 2,352 | 2,369,190 | ||||||||
| Cast and Crew Payroll, LLC | ||||||||||
Term Loan, 5.31%, (3 mo. USD LIBOR + 3.00%), Maturing | 470 | 471,438 | ||||||||
| Change Healthcare Holdings, Inc. | ||||||||||
Term Loan, 4.63%, (1 mo. USD LIBOR + 2.75%), Maturing March 1, 2024 | 7,648 | 7,674,838 | ||||||||
| Corporate Capital Trust, Inc. | ||||||||||
Term Loan, 5.56%, (3 mo. USD LIBOR + 3.25%), Maturing May 20, 2019 | 2,201 | 2,210,729 | ||||||||
| CPM Holdings, Inc. | ||||||||||
Term Loan, 5.38%, (1 mo. USD LIBOR + 3.50%), Maturing April 11, 2022 | 339 | 344,532 | ||||||||
| Crossmark Holdings, Inc. | ||||||||||
Term Loan, 5.80%, (3 mo. USD LIBOR + 3.50%), Maturing December 20, 2019 | 1,969 | 979,478 | ||||||||
| Cypress Intermediate Holdings III, Inc. | ||||||||||
Term Loan, 4.88%, (1 mo. USD LIBOR + 3.00%), Maturing April 27, 2024 | 1,439 | 1,445,271 | ||||||||
| EAB Global, Inc. | ||||||||||
Term Loan, 5.48%, (3 mo. USD LIBOR + 3.75%), Maturing November 15, 2024 | 1,425 | 1,432,125 | ||||||||
| Education Management, LLC | ||||||||||
Term Loan, 0.00%, Maturing | 885 | 0 | ||||||||
Term Loan, 10.25%, (3 mo. USD Prime+ 5.50%), Maturing July 2, 2020(3) | 393 | 186,788 | ||||||||
| EIG Investors Corp. | ||||||||||
Term Loan, 5.96%, (3 mo. USD LIBOR + 4.00%), Maturing February 9, 2023 | 3,655 | 3,686,860 | ||||||||
| Element Materials Technology Group US Holdings, Inc. | ||||||||||
Term Loan, 5.80%, (3 mo. USD LIBOR + 3.50%), Maturing June 28, 2024 | 424 | 426,852 | ||||||||
| Extreme Reach, Inc. | ||||||||||
Term Loan, 8.13%, (1 mo. USD LIBOR + 6.25%), Maturing February 7, 2020 | 1,629 | 1,629,639 | ||||||||
| First Data Corporation | ||||||||||
Term Loan, 4.12%, (1 mo. USD LIBOR + 2.25%), Maturing July 8, 2022 | 5,085 | 5,097,892 | ||||||||
| 6 | See Notes to Financial Statements. |
Eaton Vance
Limited Duration Income Fund
March 31, 2018
Portfolio of Investments — continued
| Borrower/Tranche Description | Principal Amount* (000’s omitted) | Value | ||||||||
| Business Equipment and Services (continued) | ||||||||||
| Garda World Security Corporation | ||||||||||
Term Loan, 5.51%, (3 mo. USD LIBOR + 3.50%), Maturing May 24, 2024 | 2,189 | $ | 2,214,571 | |||||||
Term Loan, 5.92%, (3 mo. USD LIBOR + 4.25%), Maturing May 24, 2024 | CAD | 1,017 | 795,547 | |||||||
| Global Payments, Inc. | ||||||||||
Term Loan, 3.63%, (1 mo. USD LIBOR + 1.75%), Maturing April 21, 2023 | 1,053 | 1,056,934 | ||||||||
| GreenSky Holdings, LLC | ||||||||||
Term Loan, Maturing March 22, 2025(6) | 1,550 | 1,559,687 | ||||||||
| IG Investment Holdings, LLC | ||||||||||
Term Loan, 5.80%, (3 mo. USD LIBOR + 3.50%), Maturing | 2,479 | 2,508,609 | ||||||||
| Information Resources, Inc. | ||||||||||
Term Loan, 6.19%, (3 mo. USD LIBOR + 4.25%), Maturing | 1,015 | 1,023,787 | ||||||||
| ION Trading Technologies S.a.r.l. | ||||||||||
Term Loan, 3.75%, (3 mo. EURIBOR + 2.75%, Floor 1.00%), Maturing November 21, 2024 | EUR | 2,294 | 2,832,134 | |||||||
| Iron Mountain, Inc. | ||||||||||
Term Loan, 3.62%, (1 mo. USD LIBOR + 1.75%), Maturing January 2, 2026 | 925 | 925,386 | ||||||||
| J.D. Power and Associates | ||||||||||
Term Loan, 6.55%, (3 mo. USD LIBOR + 4.25%), Maturing | 1,184 | 1,190,341 | ||||||||
| KAR Auction Services, Inc. | ||||||||||
Term Loan, 4.56%, (3 mo. USD LIBOR + 2.25%), Maturing March 11, 2021 | 2,200 | 2,219,996 | ||||||||
| Kronos Incorporated | ||||||||||
Term Loan, 4.88%, (2 mo. USD LIBOR + 3.00%), Maturing | 6,955 | 7,002,265 | ||||||||
| LegalZoom.com, Inc. | ||||||||||
Term Loan, 6.34%, (1 mo. USD LIBOR + 4.50%), Maturing | 798 | 804,982 | ||||||||
Term Loan - Second Lien, 10.34%, (1 mo. USD LIBOR + 8.50%), Maturing November 21, 2025 | 600 | 606,000 | ||||||||
| Monitronics International, Inc. | ||||||||||
Term Loan, 7.80%, (3 mo. USD LIBOR + 5.50%), Maturing | 2,919 | 2,847,916 | ||||||||
| ON Assignment, Inc. | ||||||||||
Term Loan, Maturing February 21, 2025(6) | 525 | 527,494 | ||||||||
| PGX Holdings, Inc. | ||||||||||
Term Loan, 7.13%, (1 mo. USD LIBOR + 5.25%), Maturing | 1,539 | 1,492,453 | ||||||||
| Ping Identity Corporation | ||||||||||
Term Loan, 5.62%, (1 mo. USD LIBOR + 3.75%), Maturing | 375 | 376,875 | ||||||||
| Borrower/Tranche Description | Principal Amount* (000’s omitted) | Value | ||||||||||
| Business Equipment and Services (continued) | ||||||||||||
| Prime Security Services Borrower, LLC | ||||||||||||
Term Loan, 4.63%, (1 mo. USD LIBOR + 2.75%), Maturing | 2,001 | $ | 2,019,035 | |||||||||
| Red Ventures, LLC | ||||||||||||
Term Loan, 5.88%, (1 mo. USD LIBOR + 4.00%), Maturing November 8, 2024 | 1,318 | 1,332,383 | ||||||||||
| Shutterfly, Inc. | ||||||||||||
Term Loan, Maturing | 575 | 579,312 | ||||||||||
| SMG Holdings, Inc. | ||||||||||||
Term Loan, 5.14%, (1 mo. USD LIBOR + 3.25%), Maturing | 250 | 252,761 | ||||||||||
| Solera, LLC | ||||||||||||
Term Loan, 4.63%, (1 mo. USD LIBOR + 2.75%), Maturing | 873 | 875,842 | ||||||||||
| Spin Holdco, Inc. | ||||||||||||
Term Loan, 5.08%, (3 mo. USD LIBOR + 3.25%), Maturing November 14, 2022 | 3,937 | 3,964,952 | ||||||||||
| Techem GmbH | ||||||||||||
Term Loan, 3.00%, (3 mo. EURIBOR + 3.00%), Maturing | EUR | 1,425 | 1,755,739 | |||||||||
| Tempo Acquisition, LLC | ||||||||||||
Term Loan, 4.88%, (1 mo. USD LIBOR + 3.00%), Maturing | 993 | 998,083 | ||||||||||
| Trans Union, LLC | ||||||||||||
Term Loan, 3.88%, (1 mo. USD LIBOR + 2.00%), Maturing | 294 | 295,134 | ||||||||||
| Travelport Finance (Luxembourg) S.a.r.l. | ||||||||||||
Term Loan, 4.40%, (2 mo. USD LIBOR + 2.50%), Maturing | 2,150 | 2,156,719 | ||||||||||
| Vantiv, LLC | ||||||||||||
Term Loan, 3.78%, (1 mo. USD LIBOR + 2.00%), Maturing | 1,375 | 1,384,167 | ||||||||||
| Vestcom Parent Holdings, Inc. | ||||||||||||
Term Loan, 5.88%, (1 mo. USD LIBOR + 4.00%), Maturing December 19, 2023 | 617 | 621,816 | ||||||||||
| WASH Multifamily Laundry Systems, LLC | ||||||||||||
Term Loan, 5.13%, (1 mo. USD LIBOR + 3.25%), Maturing | 310 | 312,342 | ||||||||||
| West Corporation | ||||||||||||
Term Loan, 5.88%, (1 mo. USD LIBOR + 4.00%), Maturing | 1,222 | 1,232,884 | ||||||||||
Term Loan, Maturing | 350 | 353,500 | ||||||||||
| $ | 84,331,355 | |||||||||||
| Cable and Satellite Television — 2.3% | ||||||||||||
| Charter Communications Operating, LLC | ||||||||||||
Term Loan, 3.88%, (1 mo. USD LIBOR + 2.00%), Maturing | 3,840 | $ | 3,858,617 | |||||||||
| 7 | See Notes to Financial Statements. |
Eaton Vance
Limited Duration Income Fund
March 31, 2018
Portfolio of Investments — continued
| Borrower/Tranche Description | Principal Amount* (000’s omitted) | Value | ||||||||||
| Cable and Satellite Television (continued) | ||||||||||||
| CSC Holdings, LLC | ||||||||||||
Term Loan, 4.04%, (1 mo. USD LIBOR + 2.25%), Maturing | 4,035 | $ | 4,035,986 | |||||||||
Term Loan, 4.28%, (1 mo. USD LIBOR + 2.50%), Maturing January 25, 2026 | 1,375 | 1,376,933 | ||||||||||
| MCC Iowa, LLC | ||||||||||||
Term Loan, 3.74%, (1 week USD LIBOR + 2.00%), Maturing January 15, 2025 | 1,096 | 1,100,584 | ||||||||||
| Mediacom Illinois, LLC | ||||||||||||
Term Loan, 3.99%, (1 week USD LIBOR + 2.25%), Maturing February 15, 2024 | 631 | 633,763 | ||||||||||
| Numericable Group S.A. | ||||||||||||
Term Loan, 3.00%, (3 mo. EURIBOR + 3.00%), Maturing July 31, 2025 | EUR | 521 | 617,827 | |||||||||
Term Loan, 4.52%, (3 mo. USD LIBOR + 2.75%), Maturing | 2,134 | 2,072,526 | ||||||||||
| Radiate Holdco, LLC | ||||||||||||
Term Loan, 4.88%, (1 mo. USD LIBOR + 3.00%), Maturing February 1, 2024 | 2,163 | 2,153,565 | ||||||||||
| Telenet Financing USD, LLC | ||||||||||||
Term Loan, 4.28%, (1 mo. USD LIBOR + 2.50%), Maturing | 2,525 | 2,540,329 | ||||||||||
| Unitymedia Finance, LLC | ||||||||||||
Term Loan, 4.03%, (1 mo. USD LIBOR + 2.25%), Maturing January 15, 2026 | 1,050 | 1,049,836 | ||||||||||
| Unitymedia Hessen GmbH & Co. KG | ||||||||||||
Term Loan, 2.75%, (6 mo. EURIBOR + 2.75%), Maturing | EUR | 1,000 | 1,229,901 | |||||||||
| UPC Financing Partnership | ||||||||||||
Term Loan, 4.28%, (1 mo. USD LIBOR + 2.50%), Maturing January 15, 2026 | 2,800 | 2,812,001 | ||||||||||
Term Loan, 2.75%, (6 mo. EURIBOR + 2.75%), Maturing | EUR | 1,000 | 1,229,425 | |||||||||
| Virgin Media Bristol, LLC | ||||||||||||
Term Loan, 4.28%, (1 mo. USD LIBOR + 2.50%), Maturing January 15, 2026 | 8,050 | 8,100,312 | ||||||||||
| Ziggo Secured Finance B.V. | ||||||||||||
Term Loan, 3.00%, (6 mo. EURIBOR + 3.00%), Maturing April 15, 2025 | EUR | 2,625 | 3,220,735 | |||||||||
| Ziggo Secured Finance Partnership | ||||||||||||
Term Loan, 4.28%, (1 mo. USD LIBOR + 2.50%), Maturing April 15, 2025 | 4,150 | 4,125,357 | ||||||||||
| $ | 40,157,697 | |||||||||||
| Chemicals and Plastics — 2.7% | ||||||||||||
| Alpha 3 B.V. | ||||||||||||
Term Loan, 5.30%, (3 mo. USD LIBOR + 3.00%), Maturing January 31, 2024 | 645 | $ | 650,770 | |||||||||
| Borrower/Tranche Description | Principal Amount* (000’s omitted) | Value | ||||||||
| Chemicals and Plastics (continued) | ||||||||||
| Aruba Investments, Inc. | ||||||||||
Term Loan, 5.55%, (3 mo. USD LIBOR + 3.25%), Maturing February 2, 2022 | 367 | $ | 366,956 | |||||||
| Ashland, Inc. | ||||||||||
Term Loan, 3.78%, (1 mo. USD LIBOR + 2.00%), Maturing May 17, 2024 | 620 | 625,934 | ||||||||
| Axalta Coating Systems US Holdings, Inc. | ||||||||||
Term Loan, 4.30%, (3 mo. USD LIBOR + 2.00%), Maturing June 1, 2024 | 2,859 | 2,870,207 | ||||||||
| CeramTec Group GmbH | ||||||||||
Term Loan, Maturing March 7, 2025(6) | EUR | 925 | 1,136,337 | |||||||
| Chemours Company (The) | ||||||||||
Term Loan, 6.25%, (3 mo. USD Prime + 1.50%), Maturing May 12, 2022 | 525 | 525,928 | ||||||||
| Emerald Performance Materials, LLC | ||||||||||
Term Loan, 5.38%, (1 mo. USD LIBOR + 3.50%), Maturing August 1, 2021 | 648 | 655,516 | ||||||||
Term Loan - Second Lien, 9.63%, (1 mo. USD LIBOR + 7.75%), Maturing August 1, 2022 | 725 | 727,115 | ||||||||
| Ferro Corporation | ||||||||||
Term Loan, 4.38%, (1 mo. USD LIBOR + 2.50%), Maturing February 14, 2024 | 495 | 498,403 | ||||||||
| Flint Group GmbH | ||||||||||
Term Loan, 4.74%, (3 mo. USD LIBOR + 3.00%), Maturing September 7, 2021 | 192 | 181,113 | ||||||||
| Flint Group US, LLC | ||||||||||
Term Loan, 4.74%, (3 mo. USD LIBOR + 3.00%), Maturing September 7, 2021 | 1,159 | 1,095,582 | ||||||||
| Gemini HDPE, LLC | ||||||||||
Term Loan, 4.28%, (3 mo. USD LIBOR + 2.50%), Maturing August 7, 2024 | 2,027 | 2,039,236 | ||||||||
| H.B. Fuller Company | ||||||||||
Term Loan, 4.07%, (1 mo. USD LIBOR + 2.25%), Maturing October 20, 2024 | 2,239 | 2,252,941 | ||||||||
| Ineos US Finance, LLC | ||||||||||
Term Loan, 2.50%, (1 mo. EURIBOR + 2.00%, Floor 0.50%), Maturing March 31, 2024 | EUR | 3,292 | 4,042,106 | |||||||
Term Loan, 3.88%, (1 mo. USD LIBOR + 2.00%), Maturing March 31, 2024 | 1,596 | 1,602,483 | ||||||||
| Invictus US, LLC | ||||||||||
Term Loan, Maturing January 24, 2025(6) | 525 | 529,840 | ||||||||
| Kraton Polymers, LLC | ||||||||||
Term Loan, 4.38%, (1 mo. USD LIBOR + 2.50%), Maturing March 5, 2025 | 998 | 1,005,603 | ||||||||
| MacDermid, Inc. | ||||||||||
Term Loan, 4.38%, (1 mo. USD LIBOR + 2.50%), Maturing June 7, 2020 | 362 | 363,639 | ||||||||
| 8 | See Notes to Financial Statements. |
Eaton Vance
Limited Duration Income Fund
March 31, 2018
Portfolio of Investments — continued
| Borrower/Tranche Description | Principal Amount* (000’s omitted) | Value | ||||||||
| Chemicals and Plastics (continued) | ||||||||||
| MacDermid, Inc. (continued) | ||||||||||
Term Loan, 4.88%, (1 mo. USD LIBOR + 3.00%), Maturing June 7, 2023 | 2,714 | $ | 2,735,899 | |||||||
| Minerals Technologies, Inc. | ||||||||||
Term Loan, 4.19%, (USD LIBOR + 2.25%), Maturing | 1,141 | 1,154,413 | ||||||||
| Orion Engineered Carbons GmbH | ||||||||||
Term Loan, 4.80%, (3 mo. USD LIBOR + 2.50%), Maturing July 25, 2024 | 724 | 729,136 | ||||||||
Term Loan, 2.50%, (3 mo. EURIBOR + 2.50%), Maturing July 31, 2024 | EUR | 988 | 1,224,719 | |||||||
| PolyOne Corporation | ||||||||||
Term Loan, 3.82%, (1 mo. USD LIBOR + 2.00%), Maturing | 587 | 589,161 | ||||||||
| PQ Corporation | ||||||||||
Term Loan, 4.29%, (3 mo. USD LIBOR + 2.50%), Maturing | 2,322 | 2,332,676 | ||||||||
| Prince Minerals, Inc. | ||||||||||
Term Loan, Maturing March 20, 2025(6) | 400 | 403,250 | ||||||||
| Solenis International L.P. | ||||||||||
Term Loan, 4.50%, (3 mo. EURIBOR + 3.50%, Floor 1.00%), Maturing | EUR | 1,255 | 1,545,769 | |||||||
Term Loan, 5.23%, (3 mo. USD LIBOR + 3.25%), Maturing July 31, 2021 | 386 | 385,662 | ||||||||
| Sonneborn Refined Products B.V. | ||||||||||
Term Loan, 5.63%, (1 mo. USD LIBOR + 3.75%), Maturing | 80 | 80,202 | ||||||||
| Sonneborn, LLC | ||||||||||
Term Loan, 5.63%, (1 mo. USD LIBOR + 3.75%), Maturing | 451 | 454,476 | ||||||||
| Spectrum Holdings III Corp. | ||||||||||
Term Loan, 1.00%, Maturing January 31, 2025(2) | 36 | 36,180 | ||||||||
Term Loan, 5.13%, (1 mo. USD LIBOR + 3.25%), Maturing | 364 | 365,820 | ||||||||
| Tata Chemicals North America, Inc. | ||||||||||
Term Loan, 5.06%, (3 mo. USD LIBOR + 2.75%), Maturing August 7, 2020 | 1,019 | 1,028,769 | ||||||||
| Trinseo Materials Operating S.C.A. | ||||||||||
Term Loan, 4.38%, (1 mo. USD LIBOR + 2.50%), Maturing | 2,828 | 2,846,052 | ||||||||
| Tronox Blocked Borrower, LLC | ||||||||||
Term Loan, 5.30%, (3 mo. USD LIBOR + 3.00%), Maturing September 22, 2024 | 1,138 | 1,149,455 | ||||||||
| Tronox Finance, LLC | ||||||||||
Term Loan, 5.30%, (3 mo. USD LIBOR + 3.00%), Maturing | 2,627 | 2,652,588 | ||||||||
| Borrower/Tranche Description | Principal Amount* (000’s omitted) | Value | ||||||||||
| Chemicals and Plastics (continued) | ||||||||||||
| Unifrax Corporation | ||||||||||||
Term Loan, 5.80%, (3 mo. USD LIBOR + 3.50%), Maturing | 620 | $ | 626,136 | |||||||||
| Univar, Inc. | ||||||||||||
Term Loan, 4.38%, (1 mo. USD LIBOR + 2.50%), Maturing | 3,268 | 3,292,960 | ||||||||||
| Venator Materials Corporation | ||||||||||||
Term Loan, 4.88%, (1 mo. USD LIBOR + 3.00%), Maturing | 423 | 425,650 | ||||||||||
| Versum Materials, Inc. | ||||||||||||
Term Loan, 4.30%, (3 mo. USD LIBOR + 2.00%), Maturing September 29, 2023 | 714 | 719,592 | ||||||||||
| $ | 45,948,274 | |||||||||||
| Conglomerates — 0.1% | ||||||||||||
| Penn Engineering & Manufacturing Corp. | ||||||||||||
Term Loan, 4.63%, (1 mo. USD LIBOR + 2.75%), Maturing | 273 | $ | 274,302 | |||||||||
| Spectrum Brands, Inc. | ||||||||||||
Term Loan, 3.86%, (USD LIBOR + 2.00%), Maturing June 23, 2022(4) | 2,221 | 2,232,402 | ||||||||||
| $ | 2,506,704 | |||||||||||
| Containers and Glass Products — 1.3% | ||||||||||||
| Berry Global, Inc. | ||||||||||||
Term Loan, 3.82%, (1 mo. USD LIBOR + 2.00%), Maturing | 1,023 | $ | 1,028,286 | |||||||||
| BWAY Holding Company | ||||||||||||
Term Loan, 4.96%, (3 mo. USD LIBOR + 3.25%), Maturing | 1,117 | 1,123,425 | ||||||||||
| Consolidated Container Company, LLC | ||||||||||||
Term Loan, 4.88%, (1 mo. USD LIBOR + 3.00%), Maturing | 448 | 451,111 | ||||||||||
| Flex Acquisition Company, Inc. | ||||||||||||
Term Loan, 4.69%, (3 mo. USD LIBOR + 3.00%), Maturing December 29, 2023 | 2,283 | 2,296,305 | ||||||||||
| Horizon Holdings III SAS | ||||||||||||
Term Loan, 2.75%, (6 mo. EURIBOR + 2.75%), Maturing | EUR | 1,785 | 2,185,219 | |||||||||
| Libbey Glass, Inc. | ||||||||||||
Term Loan, 4.72%, (1 mo. USD LIBOR + 3.00%), Maturing April 9, 2021 | 989 | 977,827 | ||||||||||
| Pelican Products, Inc. | ||||||||||||
Term Loan, 6.13%, (1 mo. USD LIBOR + 4.25%), Maturing | 356 | 357,580 | ||||||||||
| 9 | See Notes to Financial Statements. |
Eaton Vance
Limited Duration Income Fund
March 31, 2018
Portfolio of Investments — continued
| Borrower/Tranche Description | Principal Amount* (000’s omitted) | Value | ||||||||||
| Containers and Glass Products (continued) | ||||||||||||
| Reynolds Group Holdings, Inc. | ||||||||||||
Term Loan, 4.63%, (1 mo. USD LIBOR + 2.75%), Maturing February 5, 2023 | 9,991 | $ | 10,053,081 | |||||||||
| Ring Container Technologies Group, LLC | ||||||||||||
Term Loan, 4.63%, (1 mo. USD LIBOR + 2.75%), Maturing October 31, 2024 | 823 | 826,538 | ||||||||||
| SIG Combibloc US Acquisition, Inc. | ||||||||||||
Term Loan, 4.63%, (1 mo. USD LIBOR + 2.75%), Maturing March 13, 2022 | 2,654 | 2,672,734 | ||||||||||
| Tekni-Plex, Inc. | ||||||||||||
Term Loan, Maturing October 5, 2024(6) | 133 | 133,972 | ||||||||||
Term Loan, 5.13%, (1 mo. USD LIBOR + 3.25%), Maturing October 17, 2024 | 349 | 350,653 | ||||||||||
Term Loan, Maturing October 17, 2024(6) | 217 | 217,705 | ||||||||||
| $ | 22,674,436 | |||||||||||
| Cosmetics / Toiletries — 0.3% | ||||||||||||
| Coty, Inc. | ||||||||||||
Term Loan, 4.19%, (1 mo. USD LIBOR + 2.50%), Maturing October 27, 2022 | 1,029 | $ | 1,026,506 | |||||||||
| Galleria Co. | ||||||||||||
Term Loan, 4.69%, (1 mo. USD LIBOR + 3.00%), Maturing September 29, 2023 | 2,090 | 2,094,724 | ||||||||||
| KIK Custom Products, Inc. | ||||||||||||
Term Loan, 5.88%, (1 mo. USD LIBOR + 4.00%), Maturing May 15, 2023 | 1,690 | 1,709,246 | ||||||||||
| Prestige Brands, Inc. | ||||||||||||
Term Loan, 3.88%, (1 mo. USD LIBOR + 2.00%), Maturing January 26, 2024 | 535 | 536,756 | ||||||||||
| $ | 5,367,232 | |||||||||||
| Drugs — 1.9% | ||||||||||||
| Alkermes, Inc. | ||||||||||||
Term Loan, 4.13%, (1 mo. USD LIBOR + 2.25%), Maturing March 23, 2023 | 1,138 | $ | 1,146,604 | |||||||||
| Amneal Pharmaceuticals, LLC | ||||||||||||
Term Loan, 5.38%, (1 mo. USD LIBOR + 3.50%), Maturing November 1, 2019 | 4,593 | 4,606,357 | ||||||||||
| Arbor Pharmaceuticals, Inc. | ||||||||||||
Term Loan, 6.99%, (2 mo. USD LIBOR + 5.00%), Maturing July 5, 2023 | 2,863 | 2,909,968 | ||||||||||
| Endo Luxembourg Finance Company I S.a.r.l. | ||||||||||||
Term Loan, 6.19%, (1 mo. USD LIBOR + 4.25%), Maturing April 29, 2024 | 5,384 | 5,390,370 | ||||||||||
| Borrower/Tranche Description | Principal Amount* (000’s omitted) | Value | ||||||||||
| Drugs (continued) | ||||||||||||
| Horizon Pharma, Inc. | ||||||||||||
Term Loan, 5.13%, (1 mo. USD LIBOR + 3.25%), Maturing | 1,088 | $ | 1,095,587 | |||||||||
| Jaguar Holding Company II | ||||||||||||
Term Loan, 4.60%, (USD LIBOR + 2.50%), Maturing | 6,429 | 6,457,903 | ||||||||||
| Mallinckrodt International Finance S.A. | ||||||||||||
Term Loan, 5.20%, (3 mo. USD LIBOR + 2.75%), Maturing September 24, 2024 | 3,464 | 3,465,624 | ||||||||||
Term Loan, 4.82%, (3 mo. USD LIBOR + 3.00%), Maturing February 24, 2025 | 925 | 927,601 | ||||||||||
| PharMerica Corporation | ||||||||||||
Term Loan, 5.21%, (1 mo. USD LIBOR + 3.50%), Maturing December 6, 2024 | 875 | 879,922 | ||||||||||
| Valeant Pharmaceuticals International, Inc. | ||||||||||||
Term Loan, 5.24%, (1 mo. USD LIBOR + 3.50%), Maturing | 5,155 | 5,215,588 | ||||||||||
| $ | 32,095,524 | |||||||||||
| Ecological Services and Equipment — 0.5% | ||||||||||||
| Advanced Disposal Services, Inc. | ||||||||||||
Term Loan, 3.98%, (1 week USD LIBOR + 2.25%), Maturing November 10, 2023 | 2,465 | $ | 2,475,442 | |||||||||
| Charah, LLC | ||||||||||||
Term Loan, 8.19%, (USD LIBOR + 6.25%), Maturing | 687 | 696,319 | ||||||||||
| EnergySolutions, LLC | ||||||||||||
Term Loan, 6.63%, (1 mo. USD LIBOR + 4.75%), Maturing May 29, 2020 | 1,793 | 1,819,890 | ||||||||||
| GFL Environmental, Inc. | ||||||||||||
Term Loan, 5.05%, (3 mo. USD LIBOR + 2.75%), Maturing September 29, 2023 | 960 | 966,377 | ||||||||||
Term Loan, 5.47%, (3 mo. USD LIBOR + 3.75%), Maturing September 29, 2023 | CAD | 1,576 | 1,232,445 | |||||||||
| Wastequip, LLC | ||||||||||||
Term Loan, 5.32%, (1 mo. USD LIBOR + 3.50%), Maturing March 13, 2025 | 150 | 151,125 | ||||||||||
| Wrangler Buyer Corp. | ||||||||||||
Term Loan, 4.88%, (1 mo. USD LIBOR + 3.00%), Maturing September 27, 2024 | 574 | 577,745 | ||||||||||
| $ | 7,919,343 | |||||||||||
| Electronics / Electrical — 5.8% | ||||||||||||
| Almonde, Inc. | ||||||||||||
Term Loan, 5.48%, (3 mo. USD LIBOR + 3.50%), Maturing | 2,985 | $ | 2,986,036 | |||||||||
| 10 | See Notes to Financial Statements. |
Eaton Vance
Limited Duration Income Fund
March 31, 2018
Portfolio of Investments — continued
| Borrower/Tranche Description | Principal Amount* (000’s omitted) | Value | ||||||||
| Electronics / Electrical (continued) | ||||||||||
| Answers Finance, LLC | ||||||||||
Term Loan - Second Lien, 9.00%, (3 mo. USD Prime + 7.90%, Cap 1.10%), Maturing September 15, 2021 | 406 | $ | 397,962 | |||||||
| Applied Systems, Inc. | ||||||||||
Term Loan, 5.55%, (3 mo. USD LIBOR + 3.25%), Maturing September 19, 2024 | 2,488 | 2,510,042 | ||||||||
| Aptean, Inc. | ||||||||||
Term Loan, 6.56%, (3 mo. USD LIBOR + 4.25%), Maturing December 20, 2022 | 1,559 | 1,564,611 | ||||||||
| Avast Software B.V. | ||||||||||
Term Loan, 5.05%, (3 mo. USD LIBOR + 2.75%), Maturing September 30, 2023 | 2,253 | 2,269,176 | ||||||||
| Barracuda Networks, Inc. | ||||||||||
Term Loan, 5.06%, (3 mo. USD LIBOR + 3.25%), Maturing February 12, 2025 | 400 | 402,188 | ||||||||
| Campaign Monitor Finance Pty. Limited | ||||||||||
Term Loan, 7.55%, (3 mo. USD LIBOR + 5.25%), Maturing March 18, 2021 | 891 | 893,589 | ||||||||
| CommScope, Inc. | ||||||||||
Term Loan, 3.88%, (1 mo. USD LIBOR + 2.00%), Maturing December 29, 2022 | 1,491 | 1,500,739 | ||||||||
| CPI International, Inc. | ||||||||||
Term Loan, 5.38%, (1 mo. USD LIBOR + 3.50%), Maturing July 26, 2024 | 721 | 724,982 | ||||||||
| Cypress Semiconductor Corporation | ||||||||||
Term Loan, 4.11%, (1 mo. USD LIBOR + 2.25%), Maturing July 5, 2021 | 1,249 | 1,257,491 | ||||||||
| DigiCert, Inc. | ||||||||||
Term Loan, 6.52%, (3 mo. USD LIBOR + 4.75%), Maturing October 31, 2024 | 1,050 | 1,063,519 | ||||||||
| Electrical Components International, Inc. | ||||||||||
Term Loan, 7.05%, (3 mo. USD LIBOR + 4.75%), Maturing May 28, 2021 | 1,994 | 2,007,455 | ||||||||
| Electro Rent Corporation | ||||||||||
Term Loan, 6.98%, (3 mo. USD LIBOR + 5.00%), Maturing January 31, 2024 | 1,457 | 1,465,666 | ||||||||
| Entegris, Inc. | ||||||||||
Term Loan, 4.13%, (1 mo. USD LIBOR + 2.25%), Maturing April 30, 2021 | 154 | 154,531 | ||||||||
| Epicor Software Corporation | ||||||||||
Term Loan, 5.13%, (1 mo. USD LIBOR + 3.25%), Maturing June 1, 2022 | 224 | 225,670 | ||||||||
| Exact Merger Sub, LLC | ||||||||||
Term Loan, 6.55%, (3 mo. USD LIBOR + 4.25%), Maturing September 27, 2024 | 672 | 678,971 | ||||||||
| Borrower/Tranche Description | Principal Amount* (000’s omitted) | Value | ||||||||
| Electronics / Electrical (continued) | ||||||||||
| EXC Holdings III Corp. | ||||||||||
Term Loan, 5.16%, (6 mo. USD LIBOR + 3.50%), Maturing December 2, 2024 | 524 | $ | 530,234 | |||||||
| Eze Castle Software, Inc. | ||||||||||
Term Loan, 5.04%, (USD LIBOR + 3.00%), Maturing April 6, 2020(4) | 724 | 730,269 | ||||||||
| Flexera Software, LLC | ||||||||||
Term Loan, 5.13%, (1 mo. USD LIBOR + 3.25%), Maturing February 26, 2025 | 250 | 251,406 | ||||||||
| Go Daddy Operating Company, LLC | ||||||||||
Term Loan, 4.13%, (1 mo. USD LIBOR + 2.25%), Maturing February 15, 2024 | 6,320 | 6,344,923 | ||||||||
| GTCR Valor Companies, Inc. | ||||||||||
Term Loan, 5.13%, (1 mo. USD LIBOR + 3.25%), Maturing June 16, 2023 | 1,818 | 1,835,841 | ||||||||
| Hyland Software, Inc. | ||||||||||
Term Loan, 5.13%, (1 mo. USD LIBOR + 3.25%), Maturing July 1, 2022 | 4,146 | 4,201,284 | ||||||||
| Infoblox, Inc. | ||||||||||
Term Loan, 6.38%, (1 mo. USD LIBOR + 4.50%), Maturing November 7, 2023 | 1,020 | 1,035,269 | ||||||||
| Infor (US), Inc. | ||||||||||
Term Loan, 4.63%, (1 mo. USD LIBOR + 2.75%), Maturing February 1, 2022 | 9,034 | 9,068,131 | ||||||||
| Informatica Corporation | ||||||||||
Term Loan, 3.50%, (3 mo. EURIBOR + 3.50%), Maturing August 5, 2022 | EUR | 349 | 431,079 | |||||||
Term Loan, 5.13%, (1 mo. USD LIBOR + 3.25%), Maturing August 5, 2022 | 3,064 | 3,085,203 | ||||||||
| Lattice Semiconductor Corporation | ||||||||||
Term Loan, 5.95%, (1 mo. USD LIBOR + 4.25%), Maturing March 10, 2021 | 612 | 617,952 | ||||||||
| MA FinanceCo., LLC | ||||||||||
Term Loan, 4.38%, (1 mo. USD LIBOR + 2.50%), Maturing November 19, 2021 | 4,652 | 4,621,354 | ||||||||
Term Loan, 4.63%, (1 mo. USD LIBOR + 2.75%), Maturing June 21, 2024 | 558 | 552,485 | ||||||||
| MACOM Technology Solutions Holdings, Inc. | ||||||||||
Term Loan, 4.13%, (1 mo. USD LIBOR + 2.25%), Maturing May 17, 2024 | 1,492 | 1,473,760 | ||||||||
| Microsemi Corporation | ||||||||||
Term Loan, 3.74%, (2 mo. USD LIBOR + 2.00%), Maturing January 15, 2023 | 503 | 504,211 | ||||||||
| MTS Systems Corporation | ||||||||||
Term Loan, 4.99%, (1 mo. USD LIBOR + 3.25%), Maturing July 5, 2023 | 1,425 | 1,437,569 | ||||||||
| 11 | See Notes to Financial Statements. |
Eaton Vance
Limited Duration Income Fund
March 31, 2018
Portfolio of Investments — continued
| Borrower/Tranche Description | Principal Amount* (000’s omitted) | Value | ||||||||
| Electronics / Electrical (continued) | ||||||||||
| Prometric Holdings, Inc. | ||||||||||
Term Loan, 4.77%, (3 mo. USD LIBOR + 3.00%), Maturing January 29, 2025 | 325 | $ | 327,539 | |||||||
| Renaissance Learning, Inc. | ||||||||||
Term Loan, 6.05%, (3 mo. USD LIBOR + 3.75%), Maturing April 9, 2021 | 894 | 899,233 | ||||||||
Term Loan - Second Lien, 9.30%, (3 mo. USD LIBOR + 7.00%), Maturing April 11, 2022 | 300 | 301,875 | ||||||||
| Rocket Software, Inc. | ||||||||||
Term Loan, 6.55%, (3 mo. USD LIBOR + 4.25%), Maturing October 14, 2023 | 1,354 | 1,362,840 | ||||||||
| Seattle Spinco, Inc. | ||||||||||
Term Loan, 4.63%, (1 mo. USD LIBOR + 2.75%), Maturing June 21, 2024 | 3,767 | 3,768,111 | ||||||||
| SGS Cayman L.P. | ||||||||||
Term Loan, 7.68%, (3 mo. USD LIBOR + 5.38%), Maturing April 23, 2021 | 255 | 245,534 | ||||||||
| SkillSoft Corporation | ||||||||||
Term Loan, 6.63%, (1 mo. USD LIBOR + 4.75%), Maturing April 28, 2021 | 5,058 | 4,904,845 | ||||||||
| SolarWinds Holdings, Inc. | ||||||||||
Term Loan, 4.88%, (1 mo. USD LIBOR + 3.00%), Maturing February 21, 2024 | 1,197 | 1,203,807 | ||||||||
| Southwire Company | ||||||||||
Term Loan, 3.97%, (1 mo. USD LIBOR + 2.25%), Maturing February 10, 2021 | 1,281 | 1,288,286 | ||||||||
| SS&C Technologies Holdings Europe S.a.r.l. | ||||||||||
Term Loan, Maturing February 28, 2025(6) | 1,091 | 1,097,484 | ||||||||
| SS&C Technologies, Inc. | ||||||||||
Term Loan, 4.13%, (1 mo. USD LIBOR + 2.25%), Maturing July 8, 2022 | 19 | 18,743 | ||||||||
Term Loan, 4.13%, (1 mo. USD LIBOR + 2.25%), Maturing July 8, 2022 | 1,634 | 1,645,121 | ||||||||
Term Loan, Maturing February 28, 2025(6) | 3,109 | 3,129,093 | ||||||||
| SurveyMonkey, Inc. | ||||||||||
Term Loan, 6.81%, (3 mo. USD LIBOR + 4.50%), Maturing April 13, 2024 | 993 | 994,981 | ||||||||
| Sutherland Global Services, Inc. | ||||||||||
Term Loan, 7.68%, (3 mo. USD LIBOR + 5.38%), Maturing April 23, 2021 | 1,096 | 1,054,803 | ||||||||
| Switch, Ltd. | ||||||||||
Term Loan, 4.13%, (1 mo. USD LIBOR + 2.25%), Maturing June 27, 2024 | 273 | 274,856 | ||||||||
| Syncsort Incorporated | ||||||||||
Term Loan, 7.30%, (3 mo. USD LIBOR + 5.00%), Maturing August 9, 2024 | 2,637 | 2,648,286 | ||||||||
| Borrower/Tranche Description | Principal Amount* (000’s omitted) | Value | ||||||||||
| Electronics / Electrical (continued) | ||||||||||||
| Tibco Software, Inc. | ||||||||||||
Term Loan, 5.38%, (1 mo. USD LIBOR + 3.50%), Maturing December 4, 2020 | 620 | $ | 623,313 | |||||||||
| TTM Technologies, Inc. | ||||||||||||
Term Loan, Maturing | 350 | 351,531 | ||||||||||
| Uber Technologies | ||||||||||||
Term Loan, 5.88%, (1 mo. USD LIBOR + 4.00%), Maturing July 13, 2023 | 3,595 | 3,614,574 | ||||||||||
Term Loan, Maturing April 4, 2025(6) | 3,100 | 3,123,250 | ||||||||||
| Veritas Bermuda Ltd. | ||||||||||||
Term Loan, 6.80%, (3 mo. USD LIBOR + 4.50%), Maturing January 27, 2023 | 3,713 | 3,702,069 | ||||||||||
| VF Holding Corp. | ||||||||||||
Term Loan, 5.13%, (1 mo. USD LIBOR + 3.25%), Maturing June 30, 2023 | 2,783 | 2,808,712 | ||||||||||
| Wall Street Systems Delaware, Inc. | ||||||||||||
Term Loan, 4.00%, (3 mo. EURIBOR + 3.00%, Floor 1.00%), Maturing November 21, 2024 | EUR | 648 | 801,283 | |||||||||
Term Loan, 5.30%, (3 mo. USD LIBOR + 3.00%), Maturing November 21, 2024 | 823 | 824,652 | ||||||||||
| Western Digital Corporation | ||||||||||||
Term Loan, 3.88%, (1 mo. USD LIBOR + 2.00%), Maturing | 2,226 | 2,242,054 | ||||||||||
| $ | 100,080,473 | |||||||||||
| Equipment Leasing — 0.9% | ||||||||||||
| Avolon TLB Borrower 1 (Luxembourg) S.a.r.l. | ||||||||||||
Term Loan, 4.07%, (1 mo. USD LIBOR + 2.25%), Maturing April 3, 2022 | 6,848 | $ | 6,862,042 | |||||||||
| Delos Finance S.a.r.l. | ||||||||||||
Term Loan, 4.05%, (3 mo. USD LIBOR + 1.75%), Maturing October 6, 2023 | 3,275 | 3,293,013 | ||||||||||
| Flying Fortress, Inc. | ||||||||||||
Term Loan, 4.05%, (3 mo. USD LIBOR + 1.75%), Maturing October 30, 2022 | 4,712 | 4,736,488 | ||||||||||
| $ | 14,891,543 | |||||||||||
| Financial Intermediaries — 2.3% | ||||||||||||
| Armor Holding II, LLC | ||||||||||||
Term Loan, 6.81%, (3 mo. USD LIBOR + 4.50%), Maturing June 26, 2020 | 1,714 | $ | 1,721,818 | |||||||||
Term Loan - Second Lien, 11.31%, (3 mo. USD LIBOR + 9.00%), Maturing December 26, 2020 | 2,475 | 2,487,375 | ||||||||||
| 12 | See Notes to Financial Statements. |
Eaton Vance
Limited Duration Income Fund
March 31, 2018
Portfolio of Investments — continued
| Borrower/Tranche Description | Principal Amount* (000’s omitted) | Value | ||||||||
| Financial Intermediaries (continued) | ||||||||||
| Citco Funding, LLC | ||||||||||
Term Loan, 4.88%, (1 mo. USD LIBOR + 3.00%), Maturing March 31, 2022 | 4,037 | $ | 4,075,666 | |||||||
| Clipper Acquisitions Corp. | ||||||||||
Term Loan, 4.02%, (3 mo. USD LIBOR + 2.00%), Maturing December 27, 2024 | 1,272 | 1,276,185 | ||||||||
| Ditech Holding Corporation | ||||||||||
Term Loan, 7.88%, (1 mo. USD LIBOR + 6.00%), Maturing June 30, 2022 | 4,692 | 4,571,404 | ||||||||
| Donnelley Financial Solutions, Inc. | ||||||||||
Term Loan, 4.88%, (1 mo. USD LIBOR + 3.00%), Maturing October 2, 2023 | 1,032 | 1,038,594 | ||||||||
| EIG Management Company, LLC | ||||||||||
Term Loan, 5.65%, (3 mo. USD LIBOR + 3.75%), Maturing January 30, 2025 | 275 | 278,094 | ||||||||
| FinCo I, LLC | ||||||||||
Term Loan, 4.63%, (1 mo. USD LIBOR + 2.75%), Maturing December 27, 2022 | 1,294 | 1,310,770 | ||||||||
| Focus Financial Partners, LLC | ||||||||||
Term Loan, 5.05%, (3 mo. USD LIBOR + 2.75%), Maturing July 3, 2024 | 1,544 | 1,552,559 | ||||||||
| Freedom Mortgage Corporation | ||||||||||
Term Loan, 6.62%, (1 mo. USD LIBOR + 4.75%), Maturing February 23, 2022 | 1,272 | 1,289,280 | ||||||||
| Greenhill & Co., Inc. | ||||||||||
Term Loan, 5.59%, (USD LIBOR + 3.75%), Maturing October 12, 2022(4) | 1,136 | 1,145,562 | ||||||||
| Guggenheim Partners, LLC | ||||||||||
Term Loan, 4.86%, (1 mo. USD LIBOR + 2.75%), Maturing July 21, 2023 | 3,057 | 3,080,079 | ||||||||
| Harbourvest Partners, LLC | ||||||||||
Term Loan, 4.55%, (3 mo. USD LIBOR + 2.25%), Maturing February 20, 2025 | 1,248 | 1,250,665 | ||||||||
| LPL Holdings, Inc. | ||||||||||
Term Loan, 4.47%, (3 mo. USD LIBOR + 2.25%), Maturing September 23, 2024 | 1,588 | 1,593,975 | ||||||||
| MIP Delaware, LLC | ||||||||||
Term Loan, 5.30%, (3 mo. USD LIBOR + 3.00%), Maturing March 9, 2020 | 113 | 113,633 | ||||||||
| NXT Capital, Inc. | ||||||||||
Term Loan, 5.38%, (1 mo. USD LIBOR + 3.50%), Maturing November 22, 2022 | 3,038 | 3,087,101 | ||||||||
| Ocwen Financial Corporation | ||||||||||
Term Loan, 6.79%, (1 mo. USD LIBOR + 5.00%), Maturing December 5, 2020 | 417 | 421,645 | ||||||||
| Quality Care Properties, Inc. | ||||||||||
Term Loan, 7.13%, (1 mo. USD LIBOR + 5.25%), Maturing October 31, 2022 | 3,326 | 3,367,403 | ||||||||
| Borrower/Tranche Description | Principal Amount* (000’s omitted) | Value | ||||||||
| Financial Intermediaries (continued) | ||||||||||
| Sesac Holdco II, LLC | ||||||||||
Term Loan, 4.88%, (1 mo. USD LIBOR + 3.00%), Maturing | 644 | $ | 644,707 | |||||||
| StepStone Group L.P. | ||||||||||
Term Loan, Maturing March 14, 2025(6) | 650 | 651,625 | ||||||||
| Titan Acquisition Limited | ||||||||||
Term Loan, Maturing March 28, 2025(6) | 3,175 | 3,172,273 | ||||||||
| Victory Capital Management, Inc. | ||||||||||
Term Loan, 5.05%, (3 mo. USD LIBOR + 2.75%), Maturing February 7, 2025 | 336 | 338,246 | ||||||||
| Virtus Investment Partners, Inc. | ||||||||||
Term Loan, 4.28%, (1 mo. USD LIBOR + 2.50%), Maturing June 1, 2024 | 572 | 575,343 | ||||||||
Term Loan, 1.25%, Maturing June 3, 2024(2) | 200 | 201,125 | ||||||||
| Walker & Dunlop, Inc. | ||||||||||
Term Loan, 4.88%, (1 mo. USD LIBOR + 3.00%), Maturing | 830 | 840,107 | ||||||||
| $ | 40,085,234 | |||||||||
| Food Products — 1.8% | ||||||||||
| Alphabet Holding Company, Inc. | ||||||||||
Term Loan, 5.38%, (1 mo. USD LIBOR + 3.50%), Maturing | 2,662 | $ | 2,481,965 | |||||||
| American Seafoods Group, LLC | ||||||||||
Term Loan, 4.65%, (1 mo. USD LIBOR + 2.75%), Maturing August 21, 2023 | 364 | 364,518 | ||||||||
| Badger Buyer Corp. | ||||||||||
Term Loan, 6.30%, (3 mo. USD LIBOR + 4.00%), Maturing | 398 | 400,985 | ||||||||
| Blue Buffalo Company Ltd. | ||||||||||
Term Loan, 3.88%, (1 mo. USD LIBOR + 2.00%), Maturing May 27, 2024 | 1,117 | 1,118,656 | ||||||||
| CH Guenther & Son, Incorporated | ||||||||||
Term Loan, Maturing March 22, 2025(6) | 500 | 503,359 | ||||||||
| Del Monte Foods, Inc. | ||||||||||
Term Loan, 5.16%, (3 mo. USD LIBOR + 3.25%), Maturing | 3,798 | 3,272,906 | ||||||||
| Dole Food Company, Inc. | ||||||||||
Term Loan, 4.81%, (1 mo. USD LIBOR + 3.00%), Maturing April 6, 2024 | 1,963 | 1,968,786 | ||||||||
| Froneri International PLC | ||||||||||
Term Loan, 2.63%, (1 mo. EURIBOR + 2.63%), Maturing January 22, 2025 | EUR | 3,075 | 3,795,162 | |||||||
| High Liner Foods Incorporated | ||||||||||
Term Loan, 5.02%, (3 mo. USD LIBOR + 3.25%), Maturing April 24, 2021 | 1,005 | 989,652 | ||||||||
| 13 | See Notes to Financial Statements. |
Eaton Vance
Limited Duration Income Fund
March 31, 2018
Portfolio of Investments — continued
| Borrower/Tranche Description | Principal Amount* (000’s omitted) | Value | ||||||||
| Food Products (continued) | ||||||||||
| HLF Financing S.a.r.l. | ||||||||||
Term Loan, 7.38%, (1 mo. USD LIBOR + 5.50%), Maturing February 15, 2023 | 1,665 | $ | 1,684,772 | |||||||
| Jacobs Douwe Egberts International B.V. | ||||||||||
Term Loan, 2.75%, (3 mo. EURIBOR + 2.00%, Floor 0.75%), Maturing July 2, 2022 | EUR | 421 | 522,386 | |||||||
Term Loan, 4.06%, (3 mo. USD LIBOR + 2.25%), Maturing | 2,451 | 2,462,960 | ||||||||
| JBS USA, LLC | ||||||||||
Term Loan, 4.68%, (3 mo. USD LIBOR + 2.50%), Maturing October 30, 2022 | 7,425 | 7,412,006 | ||||||||
| Nomad Foods Europe Midco Limited | ||||||||||
Term Loan, 4.03%, (1 mo. USD LIBOR + 2.25%), Maturing | 675 | 676,547 | ||||||||
| Pinnacle Foods Finance, LLC | ||||||||||
Term Loan, 3.38%, (1 mo. USD LIBOR + 1.75%), Maturing February 2, 2024 | 521 | 523,585 | ||||||||
| Post Holdings, Inc. | ||||||||||
Term Loan, 3.88%, (1 mo. USD LIBOR + 2.00%), Maturing | 1,861 | 1,867,188 | ||||||||
| $ | 30,045,433 | |||||||||
| Food Service — 0.9% | ||||||||||
| 1011778 B.C. Unlimited Liability Company | ||||||||||
Term Loan, 4.29%, (USD LIBOR + 2.25%), Maturing | 7,560 | $ | 7,577,489 | |||||||
| Aramark Services, Inc. | ||||||||||
Term Loan, 3.88%, (1 mo. USD LIBOR + 2.00%), Maturing March 11, 2025 | 998 | 1,007,059 | ||||||||
| CFSP Acquisition Corp. | ||||||||||
Term Loan, 0.00%, Maturing | 51 | 50,614 | ||||||||
Term Loan, 4.82%, (1 mo. USD LIBOR + 3.00%), Maturing | 224 | 224,386 | ||||||||
| IRB Holding Corp. | ||||||||||
Term Loan, 4.94%, (1 mo. USD LIBOR + 3.25%), Maturing February 5, 2025 | 900 | 910,312 | ||||||||
| NPC International, Inc. | ||||||||||
Term Loan, 5.38%, (1 mo. USD LIBOR + 3.50%), Maturing | 993 | 1,008,008 | ||||||||
| Pizza Hut Holdings, LLC | ||||||||||
Term Loan, 3.81%, (1 mo. USD LIBOR + 2.00%), Maturing | 1,182 | 1,186,862 | ||||||||
| Seminole Hard Rock Entertainment, Inc. | ||||||||||
Term Loan, 4.44%, (3 mo. USD LIBOR + 2.75%), Maturing | 310 | 312,832 | ||||||||
| TKC Holdings, Inc. | ||||||||||
Term Loan, 6.03%, (3 mo. USD LIBOR + 4.25%), Maturing February 1, 2023 | 1,213 | 1,226,393 | ||||||||
| Borrower/Tranche Description | Principal Amount* (000’s omitted) | Value | ||||||||
| Food Service (continued) | ||||||||||
| Welbilt, Inc. | ||||||||||
Term Loan, 4.63%, (1 mo. USD LIBOR + 2.75%), Maturing March 3, 2023 | 1,860 | $ | 1,876,533 | |||||||
| $ | 15,380,488 | |||||||||
| Food / Drug Retailers — 0.5% | ||||||||||
| Albertsons, LLC | ||||||||||
Term Loan, 4.63%, (1 mo. USD LIBOR + 2.75%), Maturing August 25, 2021 | 3,647 | $ | 3,611,147 | |||||||
Term Loan, 5.29%, (3 mo. USD LIBOR + 3.00%), Maturing December 21, 2022 | 691 | 685,502 | ||||||||
Term Loan, 4.96%, (3 mo. USD LIBOR + 3.00%), Maturing June 22, 2023 | 3,242 | 3,207,577 | ||||||||
| Diplomat Pharmacy, Inc. | ||||||||||
Term Loan, 6.38%, (1 mo. USD LIBOR + 4.50%), Maturing December 20, 2024 | 508 | 512,573 | ||||||||
| Supervalu, Inc. | ||||||||||
Term Loan, 5.38%, (1 mo. USD LIBOR + 3.50%), Maturing June 8, 2024 | 260 | 258,153 | ||||||||
Term Loan, 5.38%, (1 mo. USD LIBOR + 3.50%), Maturing June 8, 2024 | 433 | 430,256 | ||||||||
| $ | 8,705,208 | |||||||||
| Forest Products — 0.1% | ||||||||||
| Expera Specialty Solutions, LLC | ||||||||||
Term Loan, 6.13%, (1 mo. USD LIBOR + 4.25%), Maturing November 3, 2023 | 2,216 | $ | 2,255,034 | |||||||
| $ | 2,255,034 | |||||||||
| Health Care — 4.9% | ||||||||||
| Acadia Healthcare Company, Inc. | ||||||||||
Term Loan, 4.38%, (1 mo. USD LIBOR + 2.50%), Maturing February 11, 2022 | 286 | $ | 289,602 | |||||||
| ADMI Corp. | ||||||||||
Term Loan, 5.59%, (USD LIBOR + 3.75%), Maturing April 30, 2022(4) | 1,855 | 1,863,582 | ||||||||
| Akorn, Inc. | ||||||||||
Term Loan, 6.19%, (1 mo. USD LIBOR + 4.25%), Maturing April 16, 2021 | 1,115 | 1,110,030 | ||||||||
| Alliance Healthcare Services, Inc. | ||||||||||
Term Loan, 6.34%, (USD LIBOR + 4.50%), Maturing October 24, 2023(4) | 870 | 876,053 | ||||||||
Term Loan - Second Lien, 11.88%, (USD LIBOR + 10.00%), Maturing | 525 | 522,375 | ||||||||
| 14 | See Notes to Financial Statements. |
Eaton Vance
Limited Duration Income Fund
March 31, 2018
Portfolio of Investments — continued
| Borrower/Tranche Description | Principal Amount* (000’s omitted) | Value | ||||||||
| Health Care (continued) | ||||||||||
| Ardent Legacy Acquisitions, Inc. | ||||||||||
Term Loan, 7.38%, (1 mo. USD LIBOR + 5.50%), Maturing August 4, 2021 | 1,267 | $ | 1,272,905 | |||||||
| Argon Medical Devices, Inc. | ||||||||||
Term Loan, 6.05%, (3 mo. USD LIBOR + 3.75%), Maturing January 23, 2025 | 425 | 428,188 | ||||||||
| Auris Luxembourg III S.a.r.l. | ||||||||||
Term Loan, 5.30%, (3 mo. USD LIBOR + 3.00%), Maturing January 17, 2022 | 970 | 976,738 | ||||||||
| Avantor, Inc. | ||||||||||
Term Loan, 5.88%, (1 mo. USD LIBOR + 4.00%), Maturing November 21, 2024 | 3,367 | 3,405,840 | ||||||||
| Beaver-Visitec International, Inc. | ||||||||||
Term Loan, 7.30%, (3 mo. USD LIBOR + 5.00%), Maturing August 21, 2023 | 960 | 965,177 | ||||||||
| BioClinica, Inc. | ||||||||||
Term Loan, 6.00%, (3 mo. USD LIBOR + 4.25%), Maturing October 20, 2023 | 790 | 774,200 | ||||||||
| Carestream Dental Equipment, Inc. | ||||||||||
Term Loan, 5.55%, (3 mo. USD LIBOR + 3.25%), Maturing September 1, 2024 | 423 | 424,725 | ||||||||
| CHG Healthcare Services, Inc. | ||||||||||
Term Loan, 4.77%, (3 mo. USD LIBOR + 3.00%), Maturing June 7, 2023 | 3,046 | 3,076,008 | ||||||||
| Community Health Systems, Inc. | ||||||||||
Term Loan, 4.73%, (3 mo. USD LIBOR + 2.75%), Maturing December 31, 2019 | 2,119 | 2,070,990 | ||||||||
| Concentra, Inc. | ||||||||||
Term Loan, 4.53%, (3 mo. USD LIBOR + 2.75%), Maturing June 1, 2022 | 921 | 923,503 | ||||||||
| Convatec, Inc. | ||||||||||
Term Loan, 4.55%, (3 mo. USD LIBOR + 2.25%), Maturing October 31, 2023 | 692 | 696,634 | ||||||||
| CPI Holdco, LLC | ||||||||||
Term Loan, 5.80%, (3 mo. USD LIBOR + 3.50%), Maturing March 21, 2024 | 767 | 773,007 | ||||||||
| CryoLife, Inc. | ||||||||||
Term Loan, 6.30%, (3 mo. USD LIBOR + 4.00%), Maturing November 14, 2024 | 549 | 556,169 | ||||||||
| DaVita HealthCare Partners, Inc. | ||||||||||
Term Loan, 4.63%, (1 mo. USD LIBOR + 2.75%), Maturing June 24, 2021 | 3,746 | 3,783,658 | ||||||||
| DJO Finance, LLC | ||||||||||
Term Loan, 5.03%, (USD LIBOR + 3.25%), Maturing June 8, 2020(4) | 2,559 | 2,575,105 | ||||||||
| Borrower/Tranche Description | Principal Amount* (000’s omitted) | Value | ||||||||
| Health Care (continued) | ||||||||||
| Envision Healthcare Corporation | ||||||||||
Term Loan, 4.88%, (1 mo. USD LIBOR + 3.00%), Maturing December 1, 2023 | 4,758 | $ | 4,788,099 | |||||||
| Equian, LLC | ||||||||||
Term Loan, 5.15%, (3 mo. USD LIBOR + 3.25%), Maturing May 20, 2024 | 721 | 725,765 | ||||||||
| Genoa, a QoL Healthcare Company, LLC | ||||||||||
Term Loan, 5.13%, (1 mo. USD LIBOR + 3.25%), Maturing October 28, 2023 | 690 | 694,711 | ||||||||
| GHX Ultimate Parent Corporation | ||||||||||
Term Loan, 5.30%, (3 mo. USD LIBOR + 3.00%), Maturing June 28, 2024 | 720 | 722,711 | ||||||||
| Greatbatch Ltd. | ||||||||||
Term Loan, 4.99%, (1 mo. USD LIBOR + 3.25%), Maturing October 27, 2022 | 1,746 | 1,762,011 | ||||||||
| Grifols Worldwide Operations USA, Inc. | ||||||||||
Term Loan, 3.99%, (1 week USD LIBOR + 2.25%), Maturing January 31, 2025 | 3,985 | 4,002,805 | ||||||||
| Hanger, Inc. | ||||||||||
Term Loan, 5.38%, (1 mo. USD LIBOR + 3.50%), Maturing February 26, 2025 | 1,150 | 1,151,437 | ||||||||
| INC Research, LLC | ||||||||||
Term Loan, 4.13%, (1 mo. USD LIBOR + 2.25%), Maturing August 1, 2024 | 500 | 502,658 | ||||||||
| Indivior Finance S.a.r.l. | ||||||||||
Term Loan, 6.42%, (2 mo. USD LIBOR + 4.50%), Maturing December 18, 2022 | 923 | 927,301 | ||||||||
| Kindred Healthcare, Inc. | ||||||||||
Term Loan, 5.25%, (3 mo. USD LIBOR + 3.50%), Maturing April 9, 2021 | 3,267 | 3,281,907 | ||||||||
| Kinetic Concepts, Inc. | ||||||||||
Term Loan, 5.55%, (3 mo. USD LIBOR + 3.25%), Maturing February 2, 2024 | 3,176 | 3,194,659 | ||||||||
| KUEHG Corp. | ||||||||||
Term Loan, 6.05%, (3 mo. USD LIBOR + 3.75%), Maturing August 13, 2022 | 1,960 | 1,975,838 | ||||||||
Term Loan - Second Lien, 10.55%, (3 mo. USD LIBOR + 8.25%), Maturing August 18, 2025 | 425 | 432,437 | ||||||||
| Medical Depot Holdings, Inc. | ||||||||||
Term Loan, 7.80%, (3 mo. USD LIBOR + 5.50%), Maturing January 3, 2023 | 848 | 792,559 | ||||||||
| Medical Solutions, LLC | ||||||||||
Term Loan, 5.63%, (1 mo. USD LIBOR + 3.75%), Maturing June 9, 2024 | 823 | 826,356 | ||||||||
| MPH Acquisition Holdings, LLC | ||||||||||
Term Loan, 5.05%, (3 mo. USD LIBOR + 2.75%), Maturing June 7, 2023 | 2,512 | 2,526,948 | ||||||||
| 15 | See Notes to Financial Statements. |
Eaton Vance
Limited Duration Income Fund
March 31, 2018
Portfolio of Investments — continued
| Borrower/Tranche Description | Principal Amount* (000’s omitted) | Value | ||||||||
| Health Care (continued) | ||||||||||
| National Mentor Holdings, Inc. | ||||||||||
Term Loan, 5.30%, (3 mo. USD LIBOR + 3.00%), Maturing January 31, 2021 | 672 | $ | 675,570 | |||||||
| Navicure, Inc. | ||||||||||
Term Loan, 5.63%, (1 mo. USD LIBOR + 3.75%), Maturing November 1, 2024 | 673 | 677,521 | ||||||||
| New Millennium Holdco, Inc. | ||||||||||
Term Loan, 8.38%, (1 mo. USD LIBOR + 6.50%), Maturing December 21, 2020 | 355 | 122,199 | ||||||||
| Opal Acquisition, Inc. | ||||||||||
Term Loan, 6.03%, (3 mo. USD LIBOR + 4.00%), Maturing November 27, 2020 | 2,274 | 2,159,896 | ||||||||
| Ortho-Clinical Diagnostics S.A. | ||||||||||
Term Loan, 5.63%, (1 mo. USD LIBOR + 3.75%), Maturing June 30, 2021 | 4,033 | 4,070,802 | ||||||||
| Parexel International Corporation | ||||||||||
Term Loan, 4.63%, (1 mo. USD LIBOR + 2.75%), Maturing September 27, 2024 | 2,910 | 2,914,741 | ||||||||
| Press Ganey Holdings, Inc. | ||||||||||
Term Loan, 4.88%, (1 mo. USD LIBOR + 3.00%), Maturing October 21, 2023 | 864 | 869,823 | ||||||||
| Prospect Medical Holdings, Inc. | ||||||||||
Term Loan, 7.19%, (1 mo. USD LIBOR + 5.50%), Maturing February 22, 2024 | 1,275 | 1,278,187 | ||||||||
| Quintiles IMS Incorporated | ||||||||||
Term Loan, 4.30%, (3 mo. USD LIBOR + 2.00%), Maturing March 7, 2024 | 3,328 | 3,349,225 | ||||||||
Term Loan, 4.30%, (3 mo. USD LIBOR + 2.00%), Maturing January 17, 2025 | 1,517 | 1,526,543 | ||||||||
| RadNet, Inc. | ||||||||||
Term Loan, 5.22%, (3 mo. USD LIBOR + 3.50%), Maturing June 30, 2023 | 1,859 | 1,883,409 | ||||||||
| Select Medical Corporation | ||||||||||
Term Loan, 4.46%, (3 mo. USD LIBOR + 2.75%), Maturing March 1, 2021 | 1,931 | 1,943,772 | ||||||||
| Sotera Health Holdings, LLC | ||||||||||
Term Loan, 4.88%, (1 mo. USD LIBOR + 3.00%), Maturing May 15, 2022 | 1,003 | 1,007,178 | ||||||||
| Surgery Center Holdings, Inc. | ||||||||||
Term Loan, 5.13%, (1 mo. USD LIBOR + 3.25%), Maturing September 2, 2024 | 1,095 | 1,095,355 | ||||||||
| Team Health Holdings, Inc. | ||||||||||
Term Loan, 4.63%, (1 mo. USD LIBOR + 2.75%), Maturing February 6, 2024 | 2,401 | 2,304,720 | ||||||||
| Tecomet, Inc. | ||||||||||
Term Loan, 5.28%, (3 mo. USD LIBOR + 3.50%), Maturing May 1, 2024 | 893 | 902,555 | ||||||||
| Borrower/Tranche Description | Principal Amount* (000’s omitted) | Value | ||||||||
| Health Care (continued) | ||||||||||
| U.S. Anesthesia Partners, Inc. | ||||||||||
Term Loan, 4.88%, (1 mo. USD LIBOR + 3.00%), Maturing June 23, 2024 | 1,266 | $ | 1,274,350 | |||||||
| Wink Holdco, Inc. | ||||||||||
Term Loan, 4.66%, (1 mo. USD LIBOR + 3.00%), Maturing | 499 | 497,659 | ||||||||
| $ | 84,226,196 | |||||||||
| Home Furnishings — 0.4% | ||||||||||
| Bright Bidco B.V. | ||||||||||
Term Loan, 5.73%, (USD LIBOR + 3.50%), Maturing June 30, 2024(4) | 1,588 | $ | 1,613,475 | |||||||
| Serta Simmons Bedding, LLC | ||||||||||
Term Loan, 5.22%, (3 mo. USD LIBOR + 3.50%), Maturing | 5,272 | 4,820,356 | ||||||||
| $ | 6,433,831 | |||||||||
| Industrial Equipment — 2.1% | ||||||||||
| Apex Tool Group, LLC | ||||||||||
Term Loan, 5.63%, (1 mo. USD LIBOR + 3.75%), Maturing | 2,609 | $ | 2,611,244 | |||||||
| Clark Equipment Company | ||||||||||
Term Loan, 4.30%, (3 mo. USD LIBOR + 2.00%), Maturing May 18, 2024 | 2,312 | 2,316,353 | ||||||||
| Delachaux S.A. | ||||||||||
Term Loan, 5.80%, (3 mo. USD LIBOR + 3.50%), Maturing | 502 | 504,422 | ||||||||
| DexKo Global, Inc. | ||||||||||
Term Loan, 3.75%, (3 mo. EURIBOR + 3.75%), Maturing July 24, 2024 | EUR | 33 | 40,423 | |||||||
Term Loan, 3.75%, (3 mo. EURIBOR + 3.75%), Maturing July 24, 2024 | EUR | 82 | 101,058 | |||||||
Term Loan, 3.75%, (3 mo. EURIBOR + 3.75%), Maturing July 24, 2024(2) | EUR | 296 | 363,564 | |||||||
Term Loan, 3.75%, (3 mo. EURIBOR + 3.75%), Maturing July 24, 2024(2) | EUR | 740 | 908,909 | |||||||
Term Loan, 5.80%, (3 mo. USD LIBOR + 3.50%), Maturing July 24, 2024 | 948 | 956,509 | ||||||||
| DXP Enterprises, Inc. | ||||||||||
Term Loan, 7.38%, (1 mo. USD LIBOR + 5.50%), Maturing August 29, 2023 | 572 | 574,628 | ||||||||
| Engineered Machinery Holdings, Inc. | ||||||||||
Term Loan, 5.55%, (3 mo. USD LIBOR + 3.25%), Maturing July 19, 2024 | 1,622 | 1,624,791 | ||||||||
| EWT Holdings III Corp. | ||||||||||
Term Loan, 5.30%, (3 mo. USD LIBOR + 3.00%), Maturing | 1,802 | 1,816,722 | ||||||||
| 16 | See Notes to Financial Statements. |
Eaton Vance
Limited Duration Income Fund
March 31, 2018
Portfolio of Investments — continued
| Borrower/Tranche Description | Principal Amount* (000’s omitted) | Value | ||||||||
| Industrial Equipment (continued) | ||||||||||
| Filtration Group Corporation | ||||||||||
Term Loan, Maturing February 27, 2025(6) | EUR | 400 | $ | 490,949 | ||||||
Term Loan, Maturing | 1,750 | 1,757,656 | ||||||||
| Gardner Denver, Inc. | ||||||||||
Term Loan, 3.00%, (3 mo. EURIBOR + 3.00%), Maturing July 30, 2024 | EUR | 455 | 559,267 | |||||||
Term Loan, 5.05%, (3 mo. USD LIBOR + 2.75%), Maturing | 1,443 | 1,451,668 | ||||||||
| Gates Global, LLC | ||||||||||
Term Loan, 3.00%, (3 mo. EURIBOR + 3.00%), Maturing April 1, 2024 | EUR | 990 | 1,217,033 | |||||||
Term Loan, 5.05%, (3 mo. USD LIBOR + 2.75%), Maturing | 5,034 | 5,068,797 | ||||||||
| Hayward Industries, Inc. | ||||||||||
Term Loan, 5.38%, (1 mo. USD LIBOR + 3.50%), Maturing | 498 | 500,298 | ||||||||
| Milacron, LLC | ||||||||||
Term Loan, 4.38%, (1 mo. USD LIBOR + 2.50%), Maturing September 28, 2023 | 3,228 | 3,242,186 | ||||||||
| Paladin Brands Holding, Inc. | ||||||||||
Term Loan, 7.80%, (3 mo. USD LIBOR + 5.50%), Maturing | 1,369 | 1,385,861 | ||||||||
| Pro Mach Group, Inc. | ||||||||||
Term Loan, 5.03%, (3 mo. USD LIBOR + 3.00%), Maturing | 250 | 250,692 | ||||||||
| Rexnord, LLC | ||||||||||
Term Loan, 4.11%, (1 mo. USD LIBOR + 2.25%), Maturing | 3,426 | 3,449,025 | ||||||||
| Robertshaw US Holding Corp. | ||||||||||
Term Loan, 5.44%, (1 mo. USD LIBOR + 3.50%), Maturing February 19, 2025 | 1,050 | 1,060,500 | ||||||||
| Signode Industrial Group US, Inc. | ||||||||||
Term Loan, 5.42%, (1 mo. USD LIBOR + 2.75%), Maturing | 1,158 | 1,156,394 | ||||||||
| Tank Holding Corp. | ||||||||||
Term Loan, 5.19%, (1 mo. USD LIBOR + 3.50%), Maturing | 703 | 707,797 | ||||||||
| Thermon Industries, Inc. | ||||||||||
Term Loan, 5.41%, (1 mo. USD LIBOR + 3.75%), Maturing | 360 | 363,150 | ||||||||
| Wittur GmbH | ||||||||||
Term Loan, 5.00%, (3 mo. EURIBOR + 4.00%, Floor 1.00%), Maturing March 31, 2022 | EUR | 1,100 | 1,366,353 | |||||||
| $ | 35,846,249 | |||||||||
| Borrower/Tranche Description | Principal Amount* (000’s omitted) | Value | ||||||||
| Insurance — 1.8% | ||||||||||
| Alliant Holdings I, Inc. | ||||||||||
Term Loan, 5.13%, (1 mo. USD LIBOR + 3.25%), Maturing August 12, 2022 | 2,778 | $ | 2,797,920 | |||||||
| AmWINS Group, Inc. | ||||||||||
Term Loan, 4.59%, (1 mo. USD LIBOR + 2.75%), Maturing | 2,568 | 2,584,669 | ||||||||
| Asurion, LLC | ||||||||||
Term Loan, 4.63%, (1 mo. USD LIBOR + 2.75%), Maturing August 4, 2022 | 5,724 | 5,763,875 | ||||||||
Term Loan, 4.63%, (1 mo. USD LIBOR + 2.75%), Maturing | 2,727 | 2,748,272 | ||||||||
Term Loan - Second Lien, 7.88%, (1 mo. USD LIBOR + 6.00%), Maturing August 4, 2025 | 1,775 | 1,827,141 | ||||||||
| Cunningham Lindsey U.S., Inc. | ||||||||||
Term Loan, 6.05%, (3 mo. USD LIBOR + 3.75%), Maturing | 1,088 | 1,087,140 | ||||||||
Term Loan - Second Lien, 10.30%, (3 mo. USD LIBOR + 8.00%), Maturing June 10, 2020 | 572 | 571,484 | ||||||||
| Financiere CEP | ||||||||||
Term Loan, 4.25%, (3 mo. EURIBOR + 4.25%), Maturing | EUR | 550 | 668,953 | |||||||
| Hub International Limited | ||||||||||
Term Loan, 4.84%, (3 mo. USD LIBOR + 3.00%), Maturing October 2, 2020 | 5,611 | 5,646,386 | ||||||||
| NFP Corp. | ||||||||||
Term Loan, 4.88%, (1 mo. USD LIBOR + 3.00%), Maturing January 8, 2024 | 2,333 | 2,341,720 | ||||||||
| Sedgwick Claims Management Services, Inc. | ||||||||||
Term Loan, Maturing March 1, 2021(6) | 1,175 | 1,175,587 | ||||||||
| USI, Inc. | ||||||||||
Term Loan, 5.30%, (3 mo. USD LIBOR + 3.00%), Maturing May 16, 2024 | 3,234 | 3,247,493 | ||||||||
| $ | 30,460,640 | |||||||||
| Leisure Goods / Activities / Movies — 2.5% | ||||||||||
| AMC Entertainment, Inc. | ||||||||||
Term Loan, 4.03%, (1 mo. USD LIBOR + 2.25%), Maturing | 644 | $ | 645,611 | |||||||
| Ancestry.com Operations, Inc. | ||||||||||
Term Loan, 5.13%, (1 mo. USD LIBOR + 3.25%), Maturing | 4,332 | 4,357,405 | ||||||||
| Bombardier Recreational Products, Inc. | ||||||||||
Term Loan, 4.38%, (1 mo. USD LIBOR + 2.50%), Maturing June 30, 2023 | 5,368 | 5,419,283 | ||||||||
| Bright Horizons Family Solutions, Inc. | ||||||||||
Term Loan, 3.88%, (1 mo. USD LIBOR + 2.00%), Maturing | 858 | 863,795 | ||||||||
| 17 | See Notes to Financial Statements. |
Eaton Vance
Limited Duration Income Fund
March 31, 2018
Portfolio of Investments — continued
| Borrower/Tranche Description | Principal Amount* (000’s omitted) | Value | ||||||||
| Leisure Goods / Activities / Movies (continued) | ||||||||||
| CDS U.S. Intermediate Holdings, Inc. | ||||||||||
Term Loan, 6.05%, (3 mo. USD LIBOR + 3.75%), Maturing July 8, 2022 | 1,307 | $ | 1,310,319 | |||||||
| ClubCorp Club Operations, Inc. | ||||||||||
Term Loan, 5.55%, (3 mo. USD LIBOR + 3.25%), Maturing | 1,959 | 1,973,576 | ||||||||
| Crown Finance US, Inc. | ||||||||||
Term Loan, 2.63%, (1 mo. EURIBOR + 2.63%), Maturing February 28, 2025 | EUR | 925 | 1,138,166 | |||||||
Term Loan, 4.38%, (1 mo. USD LIBOR + 2.50%), Maturing | 2,175 | 2,174,865 | ||||||||
| Delta 2 (LUX) S.a.r.l. | ||||||||||
Term Loan, 4.38%, (1 mo. USD LIBOR + 2.50%), Maturing | 725 | 727,627 | ||||||||
| Emerald Expositions Holding, Inc. | ||||||||||
Term Loan, 4.63%, (1 mo. USD LIBOR + 2.75%), Maturing | 1,265 | 1,278,883 | ||||||||
| Etraveli Holding AB | ||||||||||
Term Loan, 4.75%, (3 mo. EURIBOR + 4.75%), Maturing | EUR | 850 | 1,045,882 | |||||||
| Kasima, LLC | ||||||||||
Term Loan, 4.73%, (USD LIBOR + 2.50%), Maturing May 17, 2021(4) | 290 | 291,573 | ||||||||
| Lindblad Expeditions, Inc. | ||||||||||
Term Loan, 6.34%, (6 mo. USD LIBOR + 4.50%), Maturing May 8, 2021 | 271 | 272,579 | ||||||||
Term Loan, 5.95%, (6 mo. USD LIBOR + 3.50%), Maturing March 21, 2025 | 2,097 | 2,115,111 | ||||||||
| Live Nation Entertainment, Inc. | ||||||||||
Term Loan, 3.69%, (1 mo. USD LIBOR + 1.75%), Maturing | 6,764 | 6,816,426 | ||||||||
| Match Group, Inc. | ||||||||||
Term Loan, 4.29%, (1 mo. USD LIBOR + 2.50%), Maturing | 1,510 | 1,521,260 | ||||||||
| National CineMedia, LLC | ||||||||||
Term Loan, 4.63%, (1 mo. USD LIBOR + 2.75%), Maturing | 575 | 576,797 | ||||||||
| Sabre GLBL, Inc. | ||||||||||
Term Loan, 3.88%, (1 mo. USD LIBOR + 2.00%), Maturing | 1,146 | 1,151,194 | ||||||||
| SeaWorld Parks & Entertainment, Inc. | ||||||||||
Term Loan, 5.30%, (3 mo. USD LIBOR + 3.00%), Maturing March 31, 2024 | 2,242 | 2,236,616 | ||||||||
| SRAM, LLC | ||||||||||
Term Loan, 5.13%, (2 mo. USD LIBOR + 3.25%), Maturing March 15, 2024 | 1,722 | 1,725,815 | ||||||||
| Borrower/Tranche Description | Principal Amount* (000’s omitted) | Value | ||||||||
| Leisure Goods / Activities / Movies (continued) | ||||||||||
| Steinway Musical Instruments, Inc. | ||||||||||
Term Loan, 5.54%, (1 mo. USD LIBOR + 3.75%), Maturing | 925 | $ | 933,094 | |||||||
| UFC Holdings, LLC | ||||||||||
Term Loan, 5.13%, (1 mo. USD LIBOR + 3.25%), Maturing August 18, 2023 | 2,395 | 2,410,777 | ||||||||
| WMG Acquisition Corp. | ||||||||||
Term Loan, 4.13%, (1 mo. USD LIBOR + 2.25%), Maturing | 1,378 | 1,384,719 | ||||||||
| $ | 42,371,373 | |||||||||
| Lodging and Casinos — 2.4% | ||||||||||
| Amaya Holdings B.V. | ||||||||||
Term Loan, 5.80%, (3 mo. USD LIBOR + 3.50%), Maturing August 1, 2021 | 5,156 | $ | 5,188,184 | |||||||
Term Loan - Second Lien, 9.30%, (3 mo. USD LIBOR + 7.00%), Maturing August 1, 2022 | 455 | 457,684 | ||||||||
| Aristocrat Leisure Limited | ||||||||||
Term Loan, 3.74%, (3 mo. USD LIBOR + 2.00%), Maturing | 1,297 | 1,304,855 | ||||||||
| Boyd Gaming Corporation | ||||||||||
Term Loan, 4.24%, (1 week USD LIBOR + 2.50%), Maturing September 15, 2023 | 1,103 | 1,110,170 | ||||||||
| CityCenter Holdings, LLC | ||||||||||
Term Loan, 4.38%, (1 mo. USD LIBOR + 2.50%), Maturing April 18, 2024 | 2,283 | 2,295,769 | ||||||||
| Cyan Blue Holdco 3 Limited | ||||||||||
Term Loan, 5.05%, (3 mo. USD LIBOR + 2.75%), Maturing August 23, 2024 | 323 | 323,877 | ||||||||
| Eldorado Resorts, LLC | ||||||||||
Term Loan, 4.13%, (2 mo. USD LIBOR + 2.25%), Maturing April 17, 2024 | 940 | 944,368 | ||||||||
| ESH Hospitality, Inc. | ||||||||||
Term Loan, 4.13%, (1 mo. USD LIBOR + 2.25%), Maturing August 30, 2023 | 2,254 | 2,269,533 | ||||||||
| Four Seasons Hotels Limited | ||||||||||
Term Loan, 3.88%, (1 mo. USD LIBOR + 2.00%), Maturing | 1,086 | 1,092,748 | ||||||||
| Gateway Casinos & Entertainment Limited | ||||||||||
Term Loan, 4.75%, (1 mo. USD LIBOR + 3.00%), Maturing March 13, 2025 | 275 | 277,406 | ||||||||
| Golden Nugget, Inc. | ||||||||||
Term Loan, 4.98%, (USD LIBOR + 3.25%), Maturing October 4, 2023(4) | 3,826 | 3,862,749 | ||||||||
| GVC Holdings PLC | ||||||||||
Term Loan, Maturing March 15, 2024(6) | GBP | 700 | 982,612 | |||||||
Term Loan, Maturing March 15, 2024(6) | 1,175 | 1,176,835 | ||||||||
Term Loan, Maturing March 15, 2024(6) | EUR | 1,350 | 1,659,921 | |||||||
| 18 | See Notes to Financial Statements. |
Eaton Vance
Limited Duration Income Fund
March 31, 2018
Portfolio of Investments — continued
| Borrower/Tranche Description | Principal Amount* (000’s omitted) | Value | ||||||||
| Lodging and Casinos (continued) | ||||||||||
| Hanjin International Corp. | ||||||||||
Term Loan, 4.23%, (3 mo. USD LIBOR + 2.50%), Maturing October 18, 2020 | 550 | $ | 553,437 | |||||||
| Hilton Worldwide Finance, LLC | ||||||||||
Term Loan, 3.87%, (1 mo. USD LIBOR + 2.00%), Maturing October 25, 2023 | 6,387 | 6,429,399 | ||||||||
| La Quinta Intermediate Holdings, LLC | ||||||||||
Term Loan, 4.72%, (3 mo. USD LIBOR + 3.00%), Maturing April 14, 2021 | 2,235 | 2,242,919 | ||||||||
| MGM Growth Properties Operating Partnership L.P. | ||||||||||
Term Loan, 3.88%, (1 mo. USD LIBOR + 2.00%), Maturing April 25, 2023 | 2,303 | 2,311,348 | ||||||||
| Playa Resorts Holding B.V. | ||||||||||
Term Loan, 5.00%, (3 mo. USD LIBOR + 3.25%), Maturing April 29, 2024 | 2,410 | 2,428,542 | ||||||||
| VICI Properties 1, LLC | ||||||||||
Term Loan, 3.85%, (1 mo. USD LIBOR + 2.00%), Maturing December 20, 2024 | 2,315 | 2,325,222 | ||||||||
| Wyndham Hotels & Resorts, Inc. | ||||||||||
Term Loan, Maturing March 28, 2025(6) | 1,375 | 1,375,000 | ||||||||
| $ | 40,612,578 | |||||||||
| Nonferrous Metals / Minerals — 0.6% | ||||||||||
| Dynacast International, LLC | ||||||||||
Term Loan, 5.55%, (3 mo. USD LIBOR + 3.25%), Maturing January 28, 2022 | 1,469 | $ | 1,479,617 | |||||||
| Fairmount Santrol, Inc. | ||||||||||
Term Loan, 8.30%, (3 mo. USD LIBOR + 6.00%), Maturing November 1, 2022 | 1,913 | 1,940,070 | ||||||||
| Global Brass & Copper, Inc. | ||||||||||
Term Loan, 5.19%, (1 mo. USD LIBOR + 3.25%), Maturing July 18, 2023 | 1,010 | 1,019,721 | ||||||||
| Murray Energy Corporation | ||||||||||
Term Loan, 9.55%, (3 mo. USD LIBOR + 7.25%), Maturing April 16, 2020 | 2,296 | 1,957,658 | ||||||||
| New Day Aluminum, LLC | ||||||||||
Term Loan, 10.00%, (4.00% Cash, 6.00% PIK), Maturing October 28, 2020(3)(7) | 31 | 18,821 | ||||||||
| Noranda Aluminum Acquisition Corporation | ||||||||||
Term Loan, 0.00%, Maturing February 28, 2019(3)(5) | 468 | 40,472 | ||||||||
| Oxbow Carbon, LLC | ||||||||||
Term Loan, 5.63%, (1 mo. USD LIBOR + 3.75%), Maturing January 4, 2023 | 691 | 700,755 | ||||||||
Term Loan - Second Lien, 9.38%, (1 mo. USD LIBOR + 7.50%), Maturing January 4, 2024 | 800 | 814,000 | ||||||||
| Borrower/Tranche Description | Principal Amount* (000’s omitted) | Value | ||||||||
| Nonferrous Metals / Minerals (continued) | ||||||||||
| Rain Carbon GmbH | ||||||||||
Term Loan, 3.00%, (3 mo. EURIBOR + 3.00%), Maturing January 16, 2025 | EUR | 1,025 | $ | 1,265,940 | ||||||
| United Central Industrial Supply Company, LLC | ||||||||||
Term Loan - Second Lien, 15.00%, (0.00% Cash, 15.00% PIK), Maturing April 9, 2019(3)(7) | 666 | 402,262 | ||||||||
| $ | 9,639,316 | |||||||||
| Oil and Gas — 1.0% | ||||||||||
| Ameriforge Group, Inc. | ||||||||||
Term Loan, 11.30%, (3 mo. USD LIBOR + 9.00% (10.30% Cash, 1.00% PIK)), Maturing June 8, 2022 | 750 | $ | 813,640 | |||||||
| BCP Raptor, LLC | ||||||||||
Term Loan, 6.04%, (2 mo. USD LIBOR + 4.25%), Maturing June 24, 2024 | 769 | 775,245 | ||||||||
| Bronco Midstream Funding, LLC | ||||||||||
Term Loan, 5.87%, (3 mo. USD LIBOR + 4.00%), Maturing August 15, 2020 | 1,512 | 1,532,048 | ||||||||
| CITGO Petroleum Corporation | ||||||||||
Term Loan, 5.19%, (3 mo. USD LIBOR + 3.50%), Maturing July 29, 2021 | 1,750 | 1,754,492 | ||||||||
| Delek US Holdings, Inc. | ||||||||||
Term Loan, Maturing March 13, 2025(6) | 400 | 402,000 | ||||||||
| Fieldwood Energy, LLC | ||||||||||
DIP Loan, 1.00%, Maturing | 29 | 29,564 | ||||||||
Term Loan, 4.75%, (1 mo. USD LIBOR + 2.88%), Maturing | 1,296 | 1,294,317 | ||||||||
Term Loan, 8.88%, (1 mo. USD LIBOR + 7.00%), Maturing August 31, 2020 | 1,475 | 1,476,844 | ||||||||
Term Loan, 0.00%, Maturing | 363 | 343,916 | ||||||||
Term Loan - Second Lien, 0.00%, Maturing | 512 | 103,162 | ||||||||
| Green Plains Renewable Energy, Inc. | ||||||||||
Term Loan, 7.38%, (1 mo. USD LIBOR + 5.50%), Maturing August 18, 2023 | 1,119 | 1,136,166 | ||||||||
| Medallion Midland Acquisition, LLC | ||||||||||
Term Loan, 5.13%, (1 mo. USD LIBOR + 3.25%), Maturing October 30, 2024 | 673 | 674,996 | ||||||||
| MEG Energy Corp. | ||||||||||
Term Loan, 5.81%, (3 mo. USD LIBOR + 3.50%), Maturing December 31, 2023 | 1,292 | 1,294,226 | ||||||||
| Paragon Offshore Finance Company | ||||||||||
Term Loan, 0.00%, Maturing | 9 | 0 | ||||||||
| 19 | See Notes to Financial Statements. |
Eaton Vance
Limited Duration Income Fund
March 31, 2018
Portfolio of Investments — continued
| Borrower/Tranche Description | Principal Amount* (000’s omitted) | Value | ||||||||
| Oil and Gas (continued) | ||||||||||
| PSC Industrial Holdings Corp. | ||||||||||
Term Loan, 6.04%, (1 mo. USD LIBOR + 4.25%), Maturing October 3, 2024 | 798 | $ | 805,980 | |||||||
Term Loan - Second Lien, 10.29%, (1 mo. USD LIBOR + 8.50%), Maturing October 3, 2025 | 450 | 447,750 | ||||||||
| Sheridan Investment Partners II L.P. | ||||||||||
Term Loan, 5.49%, (3 mo. USD LIBOR + 3.50%), Maturing December 16, 2020 | 46 | 39,743 | ||||||||
Term Loan, 5.49%, (3 mo. USD LIBOR + 3.50%), Maturing December 16, 2020 | 123 | 106,566 | ||||||||
Term Loan, 5.49%, (3 mo. USD LIBOR + 3.50%), Maturing December 16, 2020 | 884 | 766,069 | ||||||||
| Sheridan Production Partners I, LLC | ||||||||||
Term Loan, 5.53%, (3 mo. USD LIBOR + 3.50%), Maturing October 1, 2019 | 143 | 121,524 | ||||||||
Term Loan, 5.53%, (3 mo. USD LIBOR + 3.50%), Maturing October 1, 2019 | 235 | 198,957 | ||||||||
Term Loan, 5.53%, (3 mo. USD LIBOR + 3.50%), Maturing October 1, 2019 | 1,770 | 1,501,471 | ||||||||
| Ultra Resources, Inc. | ||||||||||
Term Loan, 4.76%, (1 mo. USD LIBOR + 3.00%), Maturing | 1,650 | 1,639,687 | ||||||||
| $ | 17,258,363 | |||||||||
| Packaging & Containers — 0.1% | ||||||||||
| Crown Holdings, Inc. | ||||||||||
Term Loan, Maturing | EUR | 650 | $ | 806,374 | ||||||
| $ | 806,374 | |||||||||
| Publishing — 0.7% | ||||||||||
| Ascend Learning, LLC | ||||||||||
Term Loan, 4.88%, (1 mo. USD LIBOR + 3.00%), Maturing | 1,219 | $ | 1,224,081 | |||||||
| Getty Images, Inc. | ||||||||||
Term Loan, 5.80%, (3 mo. USD LIBOR + 3.50%), Maturing October 18, 2019 | 4,188 | 4,021,416 | ||||||||
| Harland Clarke Holdings Corp. | ||||||||||
Term Loan, 7.05%, (3 mo. USD LIBOR + 4.75%), Maturing November 3, 2023 | 397 | 400,822 | ||||||||
| Lamar Media Corporation | ||||||||||
Term Loan, 3.56%, (1 mo. USD LIBOR + 1.75%), Maturing February 16, 2025 | 575 | 578,834 | ||||||||
| LSC Communications, Inc. | ||||||||||
Term Loan, 7.38%, (1 mo. USD LIBOR + 5.50%), Maturing September 30, 2022 | 1,140 | 1,151,400 | ||||||||
| Borrower/Tranche Description | Principal Amount* (000’s omitted) | Value | ||||||||
| Publishing (continued) | ||||||||||
| Merrill Communications, LLC | ||||||||||
Term Loan, 7.02%, (3 mo. USD LIBOR + 5.25%), Maturing June 1, 2022 | 612 | $ | 620,151 | |||||||
| Multi Color Corporation | ||||||||||
Term Loan, 4.13%, (1 mo. USD LIBOR + 2.25%), Maturing October 31, 2024 | 374 | 376,517 | ||||||||
| ProQuest, LLC | ||||||||||
Term Loan, 5.63%, (1 mo. USD LIBOR + 3.75%), Maturing October 24, 2021 | 1,850 | 1,878,908 | ||||||||
| Tweddle Group, Inc. | ||||||||||
Term Loan, 7.77%, (3 mo. USD LIBOR + 6.00%), Maturing October 24, 2022 | 2,292 | 1,948,359 | ||||||||
| $ | 12,200,488 | |||||||||
| Radio and Television — 1.8% | ||||||||||
| ALM Media Holdings, Inc. | ||||||||||
Term Loan, 6.80%, (3 mo. USD LIBOR + 4.50%), Maturing July 31, 2020 | 525 | $ | 451,231 | |||||||
| CBS Radio, Inc. | ||||||||||
Term Loan, 4.62%, (3 mo. USD LIBOR + 2.75%), Maturing November 17, 2024 | 1,759 | 1,768,615 | ||||||||
| Cumulus Media Holdings, Inc. | ||||||||||
Term Loan, 4.90%, (1 mo. USD LIBOR + 3.25%), Maturing December 23, 2020 | 5,230 | 4,477,809 | ||||||||
| E.W. Scripps Company (The) | ||||||||||
Term Loan, 6.00%, (3 mo. USD Prime + 1.25%), Maturing October 2, 2024 | 423 | 424,989 | ||||||||
| Entravision Communications Corporation | ||||||||||
Term Loan, 4.63%, (1 mo. USD LIBOR + 2.75%), Maturing November 29, 2024 | 1,169 | 1,171,317 | ||||||||
| Gray Television, Inc. | ||||||||||
Term Loan, 3.92%, (1 mo. USD LIBOR + 2.25%), Maturing February 7, 2024 | 296 | 297,886 | ||||||||
| Hubbard Radio, LLC | ||||||||||
Term Loan, Maturing March 14, 2025(6) | 175 | 176,148 | ||||||||
Term Loan, 4.88%, (1 mo. USD LIBOR + 3.00%), Maturing March 28, 2025 | 578 | 582,102 | ||||||||
| iHeartCommunications, Inc. | ||||||||||
Term Loan, 0.00%, Maturing | 1,066 | 852,357 | ||||||||
Term Loan, 0.00%, Maturing | 1,682 | 1,340,593 | ||||||||
| Mission Broadcasting, Inc. | ||||||||||
Term Loan, 4.16%, (1 mo. USD LIBOR + 2.50%), Maturing January 17, 2024 | 356 | 357,365 | ||||||||
| Nexstar Broadcasting, Inc. | ||||||||||
Term Loan, 4.16%, (1 mo. USD LIBOR + 2.50%), Maturing January 17, 2024 | 2,763 | 2,775,850 | ||||||||
| 20 | See Notes to Financial Statements. |
Eaton Vance
Limited Duration Income Fund
March 31, 2018
Portfolio of Investments — continued
| Borrower/Tranche Description | Principal Amount* (000’s omitted) | Value | ||||||||
| Radio and Television (continued) | ||||||||||
| Radio Systems Corporation | ||||||||||
Term Loan, 5.14%, (1 mo. USD LIBOR + 3.25%), Maturing May 2, 2024 | 471 | $ | 474,237 | |||||||
| Raycom TV Broadcasting, LLC | ||||||||||
Term Loan, 4.13%, (1 mo. USD LIBOR + 2.25%), Maturing August 23, 2024 | 1,194 | 1,196,985 | ||||||||
| Sinclair Television Group, Inc. | ||||||||||
Term Loan, 4.13%, (1 mo. USD LIBOR + 2.25%), Maturing January 3, 2024 | 499 | 501,732 | ||||||||
Term Loan, Maturing December 12, 2024(6) | 3,200 | 3,220,384 | ||||||||
| Townsquare Media, Inc. | ||||||||||
Term Loan, 4.88%, (1 mo. USD LIBOR + 3.00%), Maturing April 1, 2022 | 2,276 | 2,285,784 | ||||||||
| Univision Communications, Inc. | ||||||||||
Term Loan, 4.63%, (1 mo. USD LIBOR + 2.75%), Maturing March 15, 2024 | 7,936 | 7,823,240 | ||||||||
| $ | 30,178,624 | |||||||||
| Retailers (Except Food and Drug) — 2.2% | ||||||||||
| Ascena Retail Group, Inc. | ||||||||||
Term Loan, 6.44%, (1 mo. USD LIBOR + 4.50%), Maturing August 21, 2022 | 3,703 | $ | 3,295,244 | |||||||
| Bass Pro Group, LLC | ||||||||||
Term Loan, 6.88%, (1 mo. USD LIBOR + 5.00%), Maturing September 25, 2024 | 1,542 | 1,529,334 | ||||||||
| BJ’s Wholesale Club, Inc. | ||||||||||
Term Loan, 5.19%, (1 mo. USD LIBOR + 3.50%), Maturing February 3, 2024 | 1,141 | 1,141,894 | ||||||||
| CDW, LLC | ||||||||||
Term Loan, 4.31%, (3 mo. USD LIBOR + 2.00%), Maturing August 17, 2023 | 2,538 | 2,548,511 | ||||||||
| Coinamatic Canada, Inc. | ||||||||||
Term Loan, 5.13%, (1 mo. USD LIBOR + 3.25%), Maturing May 14, 2022 | 54 | 54,700 | ||||||||
| David’s Bridal, Inc. | ||||||||||
Term Loan, 6.31%, (3 mo. USD LIBOR + 4.00%), Maturing October 11, 2019 | 3,582 | 3,083,204 | ||||||||
| Evergreen Acqco 1 L.P. | ||||||||||
Term Loan, 5.49%, (3 mo. USD LIBOR + 3.75%), Maturing July 9, 2019 | 3,133 | 3,020,332 | ||||||||
| Global Appliance, Inc. | ||||||||||
Term Loan, 5.88%, (1 mo. USD LIBOR + 4.00%), Maturing September 29, 2024 | 1,095 | 1,112,272 | ||||||||
| Go Wireless, Inc. | ||||||||||
Term Loan, 8.38%, (1 mo. USD LIBOR + 6.50%), Maturing December 22, 2024 | 790 | 789,670 | ||||||||
| Borrower/Tranche Description | Principal Amount* (000’s omitted) | Value | ||||||||
| Retailers (Except Food and Drug) (continued) | ||||||||||
| Harbor Freight Tools USA, Inc. | ||||||||||
Term Loan, 4.38%, (1 mo. USD LIBOR + 2.50%), Maturing August 18, 2023 | 574 | $ | 575,036 | |||||||
| J. Crew Group, Inc. | ||||||||||
Term Loan, 5.10%, (USD LIBOR + 3.00%), Maturing March 5, 2021(3)(4) | 3,796 | 2,442,521 | ||||||||
| LSF9 Atlantis Holdings, LLC | ||||||||||
Term Loan, 7.69%, (1 mo. USD LIBOR + 6.00%), Maturing May 1, 2023 | 1,128 | 1,115,743 | ||||||||
| Men’s Wearhouse, Inc. (The) | ||||||||||
Term Loan, 5.20%, (USD LIBOR + 3.50%), Maturing June 18, 2021(4) | 1,025 | 1,029,002 | ||||||||
| Michaels Stores, Inc. | ||||||||||
Term Loan, 4.59%, (1 mo. USD LIBOR + 2.75%), Maturing January 30, 2023 | 1,166 | 1,173,241 | ||||||||
| Neiman Marcus Group Ltd., LLC | ||||||||||
Term Loan, 4.94%, (1 mo. USD LIBOR + 3.25%), Maturing October 25, 2020 | 2,445 | 2,118,843 | ||||||||
| Party City Holdings, Inc. | ||||||||||
Term Loan, 4.49%, (USD LIBOR + 2.75%), Maturing August 19, 2022(4) | 1,795 | 1,804,670 | ||||||||
| PetSmart, Inc. | ||||||||||
Term Loan, 4.68%, (1 mo. USD LIBOR + 3.00%), Maturing March 11, 2022 | 4,399 | 3,541,162 | ||||||||
| PFS Holding Corporation | ||||||||||
Term Loan, 5.38%, (1 mo. USD LIBOR + 3.50%), Maturing January 31, 2021 | 2,254 | 1,521,349 | ||||||||
| Pier 1 Imports (U.S.), Inc. | ||||||||||
Term Loan, 5.95%, (6 mo. USD LIBOR + 3.50%), Maturing April 30, 2021 | 650 | 618,827 | ||||||||
| Rent-A-Center, Inc. | ||||||||||
Term Loan, 4.88%, (1 mo. USD LIBOR + 3.00%), Maturing March 19, 2021 | 125 | 124,862 | ||||||||
| Staples, Inc. | ||||||||||
Term Loan, 5.79%, (3 mo. USD LIBOR + 4.00%), Maturing September 12, 2024 | 673 | 668,263 | ||||||||
| Toys ‘R’ Us Property Company I, LLC | ||||||||||
Term Loan, 0.00%, Maturing August 21, 2019(5) | 2,157 | 1,798,538 | ||||||||
| Vivid Seats Ltd. | ||||||||||
Term Loan, 5.38%, (1 mo. USD LIBOR + 3.50%), Maturing June 30, 2024 | 2,136 | 2,143,039 | ||||||||
| $ | 37,250,257 | |||||||||
| Steel — 0.3% | ||||||||||
| Atkore International, Inc. | ||||||||||
Term Loan, 5.06%, (3 mo. USD LIBOR + 2.75%), Maturing December 22, 2023 | 424 | $ | 427,276 | |||||||
| 21 | See Notes to Financial Statements. |
Eaton Vance
Limited Duration Income Fund
March 31, 2018
Portfolio of Investments — continued
| Borrower/Tranche Description | Principal Amount* (000’s omitted) | Value | ||||||||
| Steel (continued) | ||||||||||
| GrafTech Finance, Inc. | ||||||||||
Term Loan, 5.24%, (1 mo. USD LIBOR + 3.50%), Maturing February 12, 2025 | 2,000 | $ | 2,002,500 | |||||||
| Neenah Foundry Company | ||||||||||
Term Loan, 8.39%, (2 mo. USD LIBOR + 6.50%), Maturing December 13, 2022 | 889 | 909,858 | ||||||||
| Phoenix Services International, LLC | ||||||||||
Term Loan, 5.41%, (1 mo. USD LIBOR + 3.75%), Maturing March 1, 2025 | 900 | 905,625 | ||||||||
| Zekelman Industries, Inc. | ||||||||||
Term Loan, 5.00%, (3 mo. USD LIBOR + 2.75%), Maturing June 14, 2021 | 1,322 | 1,330,512 | ||||||||
| $ | 5,575,771 | |||||||||
| Surface Transport — 0.3% | ||||||||||
| Agro Merchants NAI Holdings, LLC | ||||||||||
Term Loan, 6.05%, (3 mo. USD LIBOR + 3.75%), Maturing December 6, 2024 | 399 | $ | 403,018 | |||||||
| Hertz Corporation (The) | ||||||||||
Term Loan, 4.63%, (1 mo. USD LIBOR + 2.75%), Maturing June 30, 2023 | 1,246 | 1,248,552 | ||||||||
| Kenan Advantage Group, Inc. | ||||||||||
Term Loan, 4.88%, (1 mo. USD LIBOR + 3.00%), Maturing July 31, 2022 | 131 | 131,287 | ||||||||
Term Loan, 4.88%, (1 mo. USD LIBOR + 3.00%), Maturing July 31, 2022 | 429 | 431,724 | ||||||||
| PODS, LLC | ||||||||||
Term Loan, 4.71%, (1 mo. USD LIBOR + 3.00%), Maturing December 6, 2024 | 672 | 676,942 | ||||||||
| Stena International S.a.r.l. | ||||||||||
Term Loan, 5.31%, (3 mo. USD LIBOR + 3.00%), Maturing March 3, 2021 | 2,016 | 1,935,360 | ||||||||
| XPO Logistics, Inc. | ||||||||||
Term Loan, 3.92%, (3 mo. USD LIBOR + 2.00%), Maturing February 24, 2025 | 650 | 653,129 | ||||||||
| $ | 5,480,012 | |||||||||
| Telecommunications — 2.0% | ||||||||||
| CenturyLink, Inc. | ||||||||||
Term Loan, 4.63%, (1 mo. USD LIBOR + 2.75%), Maturing January 31, 2025 | 5,686 | $ | 5,605,797 | |||||||
| Ciena Corporation | ||||||||||
Term Loan, 4.32%, (1 mo. USD LIBOR + 2.50%), Maturing January 28, 2022 | 1,394 | 1,402,683 | ||||||||
| Borrower/Tranche Description | Principal Amount* (000’s omitted) | Value | ||||||||
| Telecommunications (continued) | ||||||||||
| Colorado Buyer, Inc. | ||||||||||
Term Loan, 4.78%, (3 mo. USD LIBOR + 3.00%), Maturing May 1, 2024 | 943 | $ | 945,134 | |||||||
| Consolidated Communications, Inc. | ||||||||||
Term Loan, 4.88%, (1 mo. USD LIBOR + 3.00%), Maturing October 4, 2023 | 1,263 | 1,247,356 | ||||||||
| Digicel International Finance Limited | ||||||||||
Term Loan, 5.02%, (3 mo. USD LIBOR + 3.25%), Maturing May 28, 2024 | 871 | 867,905 | ||||||||
| eircom Finco S.a.r.l. | ||||||||||
Term Loan, 3.25%, (1 mo. EURIBOR + 3.25%), Maturing April 19, 2024 | EUR | 2,200 | 2,706,989 | |||||||
| Frontier Communications Corp. | ||||||||||
Term Loan, 5.63%, (1 mo. USD LIBOR + 3.75%), Maturing June 15, 2024 | 2,134 | 2,109,869 | ||||||||
| Gamma Infrastructure III B.V. | ||||||||||
Term Loan, 3.50%, (3 mo. EURIBOR + 3.50%), Maturing December 28, 2024 | EUR | 850 | 1,048,171 | |||||||
| Global Eagle Entertainment, Inc. | ||||||||||
Term Loan, 9.36%, (6 mo. USD LIBOR + 7.50%), Maturing January 6, 2023 | 2,278 | 2,380,492 | ||||||||
| Intelsat Jackson Holdings S.A. | ||||||||||
Term Loan, 6.46%, (3 mo. USD LIBOR + 4.50%), Maturing January 14, 2024 | 1,500 | 1,549,375 | ||||||||
| IPC Corp. | ||||||||||
Term Loan, 6.28%, (3 mo. USD LIBOR + 4.50%), Maturing August 6, 2021 | 1,088 | 1,068,799 | ||||||||
| Level 3 Financing, Inc. | ||||||||||
Term Loan, 4.11%, (1 mo. USD LIBOR + 2.25%), Maturing February 22, 2024 | 700 | 701,805 | ||||||||
| Mitel Networks Corporation | ||||||||||
Term Loan, 5.63%, (1 mo. USD LIBOR + 3.75%), Maturing September 25, 2023 | 498 | 501,853 | ||||||||
| Onvoy, LLC | ||||||||||
Term Loan, 6.80%, (3 mo. USD LIBOR + 4.50%), Maturing February 10, 2024 | 842 | 814,151 | ||||||||
| Sprint Communications, Inc. | ||||||||||
Term Loan, 4.44%, (1 mo. USD LIBOR + 2.50%), Maturing February 2, 2024 | 4,084 | 4,089,492 | ||||||||
| Syniverse Holdings, Inc. | ||||||||||
Term Loan, 6.72%, (1 mo. USD LIBOR + 5.00%), Maturing March 9, 2023 | 1,075 | 1,089,277 | ||||||||
| Telesat Canada | ||||||||||
Term Loan, 5.31%, (3 mo. USD LIBOR + 3.00%), Maturing November 17, 2023 | 5,642 | 5,674,973 | ||||||||
| $ | 33,804,121 | |||||||||
| 22 | See Notes to Financial Statements. |
Eaton Vance
Limited Duration Income Fund
March 31, 2018
Portfolio of Investments — continued
| Borrower/Tranche Description | Principal Amount* (000’s omitted) | Value | ||||||||
| Utilities — 1.0% | ||||||||||
| Calpine Construction Finance Company L.P. | ||||||||||
Term Loan, 4.38%, (1 mo. USD LIBOR + 2.50%), Maturing | 2,799 | $ | 2,810,230 | |||||||
| Calpine Corporation | ||||||||||
Term Loan, 3.63%, (1 mo. USD LIBOR + 1.75%), Maturing | 545 | 545,436 | ||||||||
Term Loan, 4.81%, (3 mo. USD LIBOR + 2.50%), Maturing | 3,671 | 3,687,249 | ||||||||
| Dayton Power & Light Company (The) | ||||||||||
Term Loan, 3.88%, (1 mo. USD LIBOR + 2.00%), Maturing August 24, 2022 | 667 | 670,103 | ||||||||
| Granite Acquisition, Inc. | ||||||||||
Term Loan, 5.19%, (3 mo. USD LIBOR + 3.50%), Maturing | 3,163 | 3,211,621 | ||||||||
Term Loan, 5.80%, (3 mo. USD LIBOR + 3.50%), Maturing | 143 | 145,501 | ||||||||
| Invenergy Thermal Operating I, LLC | ||||||||||
Term Loan, 7.80%, (3 mo. USD LIBOR + 5.50%), Maturing | 205 | 197,180 | ||||||||
| Lightstone Generation, LLC | ||||||||||
Term Loan, 5.63%, (1 mo. USD LIBOR + 3.75%), Maturing | 109 | 109,434 | ||||||||
Term Loan, 5.63%, (1 mo. USD LIBOR + 3.75%), Maturing | 1,712 | 1,723,456 | ||||||||
| Lonestar Generation, LLC | ||||||||||
Term Loan, 6.01%, (3 mo. USD LIBOR + 4.25%), Maturing | 2,293 | 2,278,742 | ||||||||
| Longview Power, LLC | ||||||||||
Term Loan, 7.78%, (3 mo. USD LIBOR + 6.00%), Maturing April 13, 2021 | 340 | 283,362 | ||||||||
| Talen Energy Supply, LLC | ||||||||||
Term Loan, 5.88%, (1 mo. USD LIBOR + 4.00%), Maturing July 15, 2023 | 1,092 | 1,078,083 | ||||||||
Term Loan, 5.88%, (1 mo. USD LIBOR + 4.00%), Maturing April 15, 2024 | 815 | 802,874 | ||||||||
| $ | 17,543,271 | |||||||||
Total Senior Floating-Rate Loans | $ | 928,801,453 | ||||||||
| Corporate Bonds & Notes — 51.4% | ||||||||||
| Security | Principal Amount* (000’s omitted) | Value | ||||||||
| Aerospace and Defense — 1.2% | ||||||||||
| Bombardier, Inc. | ||||||||||
6.00%, 10/15/22(8) | 1,005 | $ | 1,001,231 | |||||||
| Security | Principal Amount* (000’s omitted) | Value | ||||||||
| Aerospace and Defense (continued) | ||||||||||
| Bombardier, Inc. (continued) | ||||||||||
6.125%, 1/15/23(8) | 125 | $ | 125,311 | |||||||
7.50%, 12/1/24(8) | 1,100 | 1,141,250 | ||||||||
| Booz Allen Hamilton, Inc. | ||||||||||
5.125%, 5/1/25(8) | 345 | 337,238 | ||||||||
| Hexcel Corp. | ||||||||||
4.70%, 8/15/25 | 369 | 385,148 | ||||||||
3.95%, 2/15/27 | 1,000 | 993,920 | ||||||||
| Huntington Ingalls Industries, Inc. | ||||||||||
5.00%, 11/15/25(8) | 415 | 438,223 | ||||||||
| Latam Finance, Ltd. | ||||||||||
6.875%, 4/11/24(8) | 950 | 997,500 | ||||||||
| Lockheed Martin Corp. | ||||||||||
3.55%, 1/15/26 | 960 | 953,034 | ||||||||
| Northrop Grumman Corp. | ||||||||||
2.93%, 1/15/25 | 770 | 739,017 | ||||||||
| Orbital ATK, Inc. | ||||||||||
5.25%, 10/1/21 | 1,515 | 1,550,981 | ||||||||
| TA MFG., Ltd. | ||||||||||
3.625%, 4/15/23(9) | EUR | 375 | 470,211 | |||||||
| TransDigm, Inc. | ||||||||||
6.00%, 7/15/22 | 2,850 | 2,914,125 | ||||||||
6.50%, 7/15/24 | 7,535 | 7,742,213 | ||||||||
6.50%, 5/15/25 | 185 | 187,313 | ||||||||
| United Continental Holdings, Inc. | ||||||||||
4.25%, 10/1/22 | 820 | 804,625 | ||||||||
| $ | 20,781,340 | |||||||||
| Air Transport — 0.2% | ||||||||||
| Azul Investments LLP | ||||||||||
5.875%, 10/26/24(8) | 1,030 | $ | 1,017,125 | |||||||
| WestJet Airlines, Ltd. | ||||||||||
3.50%, 6/16/21(8) | 2,000 | 1,992,939 | ||||||||
| $ | 3,010,064 | |||||||||
| Automotive — 0.6% | ||||||||||
| Deck Chassis Acquisition, Inc. | ||||||||||
10.00%, 6/15/23(8) | 1,840 | $ | 2,001,000 | |||||||
| Fiat Chrysler Finance Europe SA | ||||||||||
4.75%, 3/22/21(9) | EUR | 325 | 442,818 | |||||||
| General Motors Co. | ||||||||||
5.00%, 4/1/35 | 1,095 | 1,086,511 | ||||||||
| General Motors Financial Co., Inc. | ||||||||||
6.75%, 6/1/18 | 1,365 | 1,374,020 | ||||||||
| 23 | See Notes to Financial Statements. |
Eaton Vance
Limited Duration Income Fund
March 31, 2018
Portfolio of Investments — continued
| Security | Principal Amount* (000’s omitted) | Value | ||||||||
| Automotive (continued) | ||||||||||
| Gestamp Funding Luxembourg SA | ||||||||||
3.50%, 5/15/23(9) | EUR | 300 | $ | 383,479 | ||||||
| Navistar International Corp. | ||||||||||
6.625%, 11/1/25(8) | 3,015 | 3,022,537 | ||||||||
| RAC Bond Co. PLC | ||||||||||
5.00%, 11/6/22(9) | GBP | 250 | 332,933 | |||||||
| Wabash National Corp. | ||||||||||
5.50%, 10/1/25(8) | 985 | 962,838 | ||||||||
| ZF North America Capital, Inc. | ||||||||||
4.50%, 4/29/22(8) | 392 | 398,370 | ||||||||
| $ | 10,004,506 | |||||||||
| Banks and Thrifts — 0.9% | ||||||||||
| Astoria Financial Corp. | ||||||||||
3.50%, 6/8/20 | 952 | $ | 948,405 | |||||||
| Banco Comercial Portugues SA | ||||||||||
4.50% to 12/7/22, 12/7/27(9)(10) | EUR | 500 | 612,107 | |||||||
| Banco do Brasil SA | ||||||||||
6.25% to 4/15/24(8)(10)(11) | 1,000 | 913,750 | ||||||||
| Banco Mercantil del Norte SA/Grand Cayman | ||||||||||
5.75% to 10/4/26, 10/4/31(8)(10) | 1,685 | 1,657,619 | ||||||||
| Banco Safra SA | ||||||||||
4.125%, 2/8/23(8) | 1,085 | 1,061,890 | ||||||||
| Bank of America Corp. | ||||||||||
3.593% to 7/21/27, 7/21/28(10) | 1,450 | 1,409,033 | ||||||||
| Bank of Montreal | ||||||||||
3.803% to 12/15/27, 12/15/32(10) | 1,325 | 1,256,922 | ||||||||
| BankUnited, Inc. | ||||||||||
4.875%, 11/17/25 | 1,815 | 1,869,819 | ||||||||
| BBVA Bancomer SA | ||||||||||
5.125% to 1/18/28, 1/18/33(8)(10) | 1,000 | 965,000 | ||||||||
| Citizens Financial Group, Inc. | ||||||||||
4.15%, 9/28/22(8) | 258 | 261,150 | ||||||||
| First Midwest Bancorp, Inc. | ||||||||||
5.875%, 9/29/26 | 1,000 | 1,064,584 | ||||||||
| Flagstar Bancorp, Inc. | ||||||||||
6.125%, 7/15/21 | 650 | 685,935 | ||||||||
| Goldman Sachs Group, Inc. (The) | ||||||||||
3.691% to 6/5/27, 6/5/28(10) | 1,500 | 1,454,907 | ||||||||
| Itau Unibanco Holding SA | ||||||||||
5.50%, 8/6/22(8) | 430 | 440,320 | ||||||||
| Wells Fargo & Co. | ||||||||||
4.65%, 11/4/44 | 700 | 706,474 | ||||||||
| $ | 15,307,915 | |||||||||
| Security | Principal Amount* (000’s omitted) | Value | ||||||||
| Beverage and Tobacco — 0.1% | ||||||||||
| Anheuser-Busch InBev Finance, Inc. | ||||||||||
3.65%, 2/1/26 | 895 | $ | 890,645 | |||||||
| BAT Capital Corp. | ||||||||||
3.557%, 8/15/27(8) | 1,045 | 1,001,342 | ||||||||
| $ | 1,891,987 | |||||||||
| Broadcast Radio and Television — 0.1% | ||||||||||
| Meredith Corp. | ||||||||||
6.875%, 2/1/26(8) | 980 | $ | 1,008,175 | |||||||
| $ | 1,008,175 | |||||||||
| Brokerage / Securities Dealers / Investment Houses — 0.2% | ||||||||||
| Alliance Data Systems Corp. | ||||||||||
5.875%, 11/1/21(8) | 1,620 | $ | 1,656,450 | |||||||
| Intrum Justitia AB | ||||||||||
3.125%, 7/15/24(9) | EUR | 400 | 477,342 | |||||||
| Neuberger Berman Group, LLC/Neuberger Berman Finance Corp. | ||||||||||
4.50%, 3/15/27(8) | 454 | 461,216 | ||||||||
4.875%, 4/15/45(8) | 500 | 483,284 | ||||||||
| $ | 3,078,292 | |||||||||
| Building and Development — 1.6% | ||||||||||
| AT Securities B.V. | ||||||||||
5.25% to 7/21/23 (9)(10)(11) | 500 | $ | 488,063 | |||||||
| Beacon Escrow Corp. | ||||||||||
4.875%, 11/1/25(8) | 1,300 | 1,244,750 | ||||||||
| Builders FirstSource, Inc. | ||||||||||
5.625%, 9/1/24(8) | 2,057 | 2,074,999 | ||||||||
| Core & Main L.P. | ||||||||||
6.125%, 8/15/25(8) | 740 | 725,200 | ||||||||
| DEMIRE Deutsche Mittelstand Real Estate AG | ||||||||||
2.875%, 7/15/22(9) | EUR | 400 | 502,454 | |||||||
| Five Point Operating Co., L.P./Five Point Capital Corp. | ||||||||||
7.875%, 11/15/25(8) | 2,965 | 2,998,356 | ||||||||
| Greystar Real Estate Partners, LLC | ||||||||||
5.75%, 12/1/25(8) | 2,975 | 2,975,000 | ||||||||
| Hillman Group, Inc. (The) | ||||||||||
6.375%, 7/15/22(8) | 2,075 | 2,012,750 | ||||||||
| Jeld-Wen, Inc. | ||||||||||
4.625%, 12/15/25(8) | 195 | 187,688 | ||||||||
4.875%, 12/15/27(8) | 195 | 184,763 | ||||||||
| 24 | See Notes to Financial Statements. |
Eaton Vance
Limited Duration Income Fund
March 31, 2018
Portfolio of Investments — continued
| Security | Principal Amount* (000’s omitted) | Value | ||||||||
| Building and Development (continued) | ||||||||||
| Kennedy Wilson Europe Real Estate PLC | ||||||||||
3.25%, 11/12/25(9) | EUR | 500 | $ | 630,687 | ||||||
| MDC Holdings, Inc. | ||||||||||
6.00%, 1/15/43 | 982 | 924,307 | ||||||||
| Pisces Midco, Inc. | ||||||||||
8.00%, 4/15/26(8)(12) | 1,405 | 1,405,000 | ||||||||
| Reliance Intermediate Holdings, L.P. | ||||||||||
6.50%, 4/1/23(8) | 4,610 | 4,799,932 | ||||||||
| Standard Industries, Inc. | ||||||||||
6.00%, 10/15/25(8) | 2,330 | 2,399,900 | ||||||||
| TRI Pointe Group, Inc./TRI Pointe Homes, Inc. | ||||||||||
4.375%, 6/15/19 | 1,725 | 1,737,937 | ||||||||
5.875%, 6/15/24 | 2,235 | 2,279,029 | ||||||||
| $ | 27,570,815 | |||||||||
| Business Equipment and Services — 1.7% | ||||||||||
| Arena Luxembourg Finance S.a.r.l | ||||||||||
2.75%, (3 mo. EURIBOR + 2.75%), 11/1/23(9)(13) | EUR | 500 | $ | 620,612 | ||||||
| Carlson Travel, Inc. | ||||||||||
6.75%, 12/15/23(8) | 365 | 365,000 | ||||||||
| EIG Investors Corp. | ||||||||||
10.875%, 2/1/24 | 3,810 | 4,175,112 | ||||||||
| First Data Corp. | ||||||||||
7.00%, 12/1/23(8) | 6,630 | 6,986,362 | ||||||||
5.00%, 1/15/24(8) | 815 | 818,056 | ||||||||
| FTI Consulting, Inc. | ||||||||||
6.00%, 11/15/22 | 3,974 | 4,093,220 | ||||||||
| KAR Auction Services, Inc. | ||||||||||
5.125%, 6/1/25(8) | 1,555 | 1,551,113 | ||||||||
| Prime Security Services Borrower, LLC/Prime Finance, Inc. | ||||||||||
9.25%, 5/15/23(8) | 3,706 | 4,025,642 | ||||||||
| ServiceMaster Co., LLC (The) | ||||||||||
7.45%, 8/15/27 | 1,975 | 2,137,937 | ||||||||
| Solera, LLC/Solera Finance, Inc. | ||||||||||
10.50%, 3/1/24(8) | 1,035 | 1,156,613 | ||||||||
| United Rentals North America, Inc. | ||||||||||
5.50%, 5/15/27 | 295 | 297,950 | ||||||||
| Vantiv, LLC/Vanity Issuer Corp. | ||||||||||
3.875%, 11/15/25(9) | GBP | 350 | 485,870 | |||||||
4.375%, 11/15/25(8) | 945 | 916,650 | ||||||||
| West Corp. | ||||||||||
8.50%, 10/15/25(8) | 1,645 | 1,599,763 | ||||||||
| $ | 29,229,900 | |||||||||
| Security | Principal Amount* (000’s omitted) | Value | ||||||||
| Cable and Satellite Television — 3.7% | ||||||||||
| Altice US Finance I Corp. | ||||||||||
5.50%, 5/15/26(8) | 2,000 | $ | 1,955,000 | |||||||
| Cablevision Systems Corp. | ||||||||||
8.00%, 4/15/20 | 635 | 671,116 | ||||||||
5.875%, 9/15/22 | 1,085 | 1,079,250 | ||||||||
| CCO Holdings, LLC/CCO Holdings Capital Corp. | ||||||||||
5.25%, 9/30/22 | 4,295 | 4,367,521 | ||||||||
5.75%, 1/15/24 | 1,980 | 2,014,650 | ||||||||
5.875%, 4/1/24(8) | 230 | 234,600 | ||||||||
5.375%, 5/1/25(8) | 3,605 | 3,559,937 | ||||||||
5.75%, 2/15/26(8) | 1,885 | 1,880,306 | ||||||||
5.00%, 2/1/28(8) | 1,755 | 1,654,088 | ||||||||
| Cequel Communications Holdings I, LLC/Cequel Capital Corp. | ||||||||||
6.375%, 9/15/20(8) | 157 | 160,140 | ||||||||
5.125%, 12/15/21(8) | 105 | 105,394 | ||||||||
| Charter Communications Operating, LLC/Charter Communications Operating Capital | ||||||||||
3.75%, 2/15/28 | 1,300 | 1,196,183 | ||||||||
| Comcast Corp. | ||||||||||
3.15%, 2/15/28 | 1,105 | 1,055,688 | ||||||||
| CSC Holdings, LLC | ||||||||||
6.75%, 11/15/21 | 2,780 | 2,901,625 | ||||||||
10.125%, 1/15/23(8) | 2,880 | 3,204,000 | ||||||||
5.25%, 6/1/24 | 355 | 338,581 | ||||||||
10.875%, 10/15/25(8) | 2,816 | 3,315,812 | ||||||||
| DISH DBS Corp. | ||||||||||
6.75%, 6/1/21 | 2,165 | 2,192,063 | ||||||||
5.875%, 7/15/22 | 3,055 | 2,928,981 | ||||||||
5.875%, 11/15/24 | 530 | 474,350 | ||||||||
7.75%, 7/1/26 | 85 | 80,325 | ||||||||
| SFR Group S.A. | ||||||||||
6.00%, 5/15/22(8) | 4,835 | 4,732,256 | ||||||||
7.375%, 5/1/26(8) | 965 | 922,781 | ||||||||
| Time Warner, Inc. | ||||||||||
3.80%, 2/15/27 | 500 | 483,999 | ||||||||
| Unitymedia Hessen GmbH & Co. KG/Unitymedia NRW GmbH | ||||||||||
4.00%, 1/15/25(9) | EUR | 500 | 649,954 | |||||||
| UPC Holding B.V. | ||||||||||
5.50%, 1/15/28(8) | 1,825 | 1,688,125 | ||||||||
| Virgin Media Finance PLC | ||||||||||
6.375%, 4/15/23(8) | 10,705 | 10,919,100 | ||||||||
5.75%, 1/15/25(8) | 2,015 | 1,936,919 | ||||||||
| 25 | See Notes to Financial Statements. |
Eaton Vance
Limited Duration Income Fund
March 31, 2018
Portfolio of Investments — continued
| Security | Principal Amount* (000’s omitted) | Value | ||||||||
| Cable and Satellite Television (continued) | ||||||||||
| Virgin Media Receivables Financing Notes I DAC | ||||||||||
5.50%, 9/15/24(9) | GBP | 475 | $ | 656,058 | ||||||
| Virgin Media Secured Finance PLC | ||||||||||
5.50%, 1/15/25(8) | 725 | 709,594 | ||||||||
5.25%, 1/15/26(8) | 2,430 | 2,347,987 | ||||||||
| Ziggo Bond Finance B.V. | ||||||||||
5.875%, 1/15/25(8) | 930 | 883,500 | ||||||||
6.00%, 1/15/27 (8) | 1,670 | 1,561,450 | ||||||||
| Ziggo Secured Finance B.V. | ||||||||||
5.50%, 1/15/27(8) | 1,035 | 975,187 | ||||||||
| $ | 63,836,520 | |||||||||
| Capital Goods — 0.1% | ||||||||||
| Valmont Industries, Inc. | ||||||||||
5.00%, 10/1/44 | 1,000 | $ | 998,447 | |||||||
| $ | 998,447 | |||||||||
| Chemicals and Plastics — 0.9% | ||||||||||
| Alpha 3 B.V./Alpha US Bidco, Inc. | ||||||||||
6.25%, 2/1/25(8) | 655 | $ | 666,463 | |||||||
| Chemours Co. (The) | ||||||||||
7.00%, 5/15/25 | 1,085 | 1,177,225 | ||||||||
| CTC BondCo GmbH | ||||||||||
5.25%, 12/15/25(9) | EUR | 375 | 459,545 | |||||||
| Monitchem HoldCo 3 S.A. | ||||||||||
5.25%, 6/15/21(9) | EUR | 250 | 311,255 | |||||||
| Mosaic Co. (The) | ||||||||||
4.05%, 11/15/27 | 1,000 | 976,560 | ||||||||
| Olin Corp. | ||||||||||
5.00%, 2/1/30 | 725 | 695,094 | ||||||||
| Platform Specialty Products Corp. | ||||||||||
6.50%, 2/1/22(8) | 2,190 | 2,231,062 | ||||||||
| SPCM S.A. | ||||||||||
4.875%, 9/15/25(8) | 560 | 545,300 | ||||||||
| Tronox Finance PLC | ||||||||||
5.75%, 10/1/25(8) | 865 | 843,375 | ||||||||
| Tronox Finance, LLC | ||||||||||
7.50%, 3/15/22(8) | 1,280 | 1,328,790 | ||||||||
| Tronox, Inc. | ||||||||||
6.50%, 4/15/26(8)(12) | 1,475 | 1,478,687 | ||||||||
| Valvoline, Inc. | ||||||||||
5.50%, 7/15/24 | 375 | 385,781 | ||||||||
| Venator Finance S.a.r.l./Venator Materials, LLC | ||||||||||
5.75%, 7/15/25(8) | 835 | 837,088 | ||||||||
| Security | Principal Amount* (000’s omitted) | Value | ||||||||
| Chemicals and Plastics (continued) | ||||||||||
| Versum Materials, Inc. | ||||||||||
5.50%, 9/30/24(8) | 1,270 | $ | 1,317,625 | |||||||
| W.R. Grace & Co. | ||||||||||
5.125%, 10/1/21(8) | 2,170 | 2,226,962 | ||||||||
5.625%, 10/1/24(8) | 490 | 506,538 | ||||||||
| $ | 15,987,350 | |||||||||
| Clothing / Textiles — 0.3% | ||||||||||
| CBR Fashion Finance B.V. | ||||||||||
5.125%, 10/1/22(9) | EUR | 385 | $ | 434,652 | ||||||
| PrestigeBidCo GmbH | ||||||||||
6.25%, 12/15/23(9) | EUR | 265 | 348,279 | |||||||
| PVH Corp. | ||||||||||
7.75%, 11/15/23 | 3,740 | 4,431,900 | ||||||||
| $ | 5,214,831 | |||||||||
| Commercial Services — 0.3% | ||||||||||
| Algeco Global Finance PLC | ||||||||||
6.50%, 2/15/23(9) | EUR | 350 | $ | 432,531 | ||||||
8.00%, 2/15/23(8) | 1,755 | 1,755,000 | ||||||||
| Block Financial, LLC | ||||||||||
5.25%, 10/1/25 | 1,110 | 1,159,683 | ||||||||
| Inter Media and Communication SpA | ||||||||||
4.875%, 12/31/22(9) | EUR | 235 | 292,278 | |||||||
| IPD 3 B.V. | ||||||||||
4.50%, 7/15/22(9) | EUR | 475 | 596,153 | |||||||
| Verisure Holding AB | ||||||||||
6.00%, 11/1/22(9) | EUR | 315 | 409,289 | |||||||
| $ | 4,644,934 | |||||||||
| Computers — 0.2% | ||||||||||
| Seagate HDD Cayman | ||||||||||
4.75%, 1/1/25 | 665 | $ | 647,810 | |||||||
4.875%, 6/1/27 | 969 | 919,406 | ||||||||
5.75%, 12/1/34 | 1,030 | 984,172 | ||||||||
| $ | 2,551,388 | |||||||||
| Conglomerates — 0.3% | ||||||||||
| Spectrum Brands, Inc. | ||||||||||
5.75%, 7/15/25 | 2,745 | $ | 2,813,625 | |||||||
| TMS International Corp. | ||||||||||
7.25%, 8/15/25(8) | 1,425 | 1,489,125 | ||||||||
| $ | 4,302,750 | |||||||||
| 26 | See Notes to Financial Statements. |
Eaton Vance
Limited Duration Income Fund
March 31, 2018
Portfolio of Investments — continued
| Security | Principal Amount* (000’s omitted) | Value | ||||||||
| Consumer Products — 0.1% | ||||||||||
| Central Garden & Pet Co. | ||||||||||
6.125%, 11/15/23 | 575 | $ | 603,032 | |||||||
| HRG Group, Inc. | ||||||||||
7.75%, 1/15/22 | 250 | 260,156 | ||||||||
| $ | 863,188 | |||||||||
| Containers and Glass Products — 1.0% | ||||||||||
| Ardagh Packaging Finance PLC/Ardagh Holdings USA, Inc. | ||||||||||
6.00%, 6/30/21(8) | 615 | $ | 629,606 | |||||||
4.25%, 9/15/22(8) | 690 | 688,275 | ||||||||
2.75%, 3/15/24(9) | EUR | 500 | 623,693 | |||||||
7.25%, 5/15/24(8) | 325 | 346,938 | ||||||||
6.00%, 2/15/25(8) | 2,335 | 2,352,512 | ||||||||
| Ball Corp. | ||||||||||
4.375%, 12/15/20 | 2,375 | 2,422,500 | ||||||||
| Berry Global, Inc. | ||||||||||
6.00%, 10/15/22 | 970 | 1,005,163 | ||||||||
| BWAY Holding Co. | ||||||||||
5.50%, 4/15/24(8) | 1,730 | 1,745,138 | ||||||||
7.25%, 4/15/25(8) | 820 | 838,450 | ||||||||
| Crown Americas, LLC/Crown Americas Capital Corp., VI | ||||||||||
4.75%, 2/1/26(8) | 1,040 | 1,008,800 | ||||||||
| Owens-Brockway Glass Container, Inc. | ||||||||||
5.875%, 8/15/23 (8) | 1,345 | 1,394,597 | ||||||||
6.375%, 8/15/25(8) | 700 | 740,250 | ||||||||
| Reynolds Group Issuer, Inc./Reynolds Group Issuer, LLC | ||||||||||
5.75%, 10/15/20 | 242 | 245,608 | ||||||||
5.125%, 7/15/23(8) | 1,015 | 1,026,114 | ||||||||
7.00%, 7/15/24(8) | 1,315 | 1,379,106 | ||||||||
| Verallia Packaging SASU | ||||||||||
5.125%, 8/1/22(9) | EUR | 230 | 293,732 | |||||||
| $ | 16,740,482 | |||||||||
| Distribution & Wholesale — 0.1% | ||||||||||
| American Tire Distributors, Inc. | ||||||||||
10.25%, 3/1/22(8) | 1,875 | $ | 1,924,219 | |||||||
| H&E Equipment Services, Inc. | ||||||||||
5.625%, 9/1/25 | 395 | 399,444 | ||||||||
| $ | 2,323,663 | |||||||||
| Security | Principal Amount* (000’s omitted) | Value | ||||||||||
| Diversified Financial Services — 0.9% | ||||||||||||
| Arrow Global Finance PLC | ||||||||||||
2.875%, (3 mo. EURIBOR + 2.875%), 4/1/25(9)(13) | EUR | 250 | $ | 300,937 | ||||||||
| Barclays PLC | ||||||||||||
4.836%, 5/9/28 | 1,990 | 1,957,382 | ||||||||||
| BrightSphere Investment Group PLC | ||||||||||||
4.80%, 7/27/26 | 2,195 | 2,205,675 | ||||||||||
| Cadence Financial Corp. | ||||||||||||
4.875%, 6/28/19(8) | 1,375 | 1,392,639 | ||||||||||
| Central Storage Safety Project Trust | ||||||||||||
4.823%, 2/1/38(8) | 240 | 249,076 | ||||||||||
| FBM Finance, Inc. | ||||||||||||
8.25%, 8/15/21(8) | 1,415 | 1,485,750 | ||||||||||
| Grupo KUO SAB de CV | ||||||||||||
5.75%, 7/7/27(8) | 1,000 | 1,002,500 | ||||||||||
| Jefferies Finance, LLC/JFIN Co-Issuer Corp. | ||||||||||||
7.25%, 8/15/24(8) | 2,260 | 2,241,694 | ||||||||||
| Leucadia National Corp. | ||||||||||||
6.625%, 10/23/43 | 683 | 742,428 | ||||||||||
| LSF10 Wolverine Investments SCA | ||||||||||||
4.625%, (3 mo. EURIBOR + 4.625%), 3/15/24(9)(13) | EUR | 200 | 247,567 | |||||||||
| Mercury BondCo PLC | ||||||||||||
8.25%, (8.25% cash or 9.00% PIK), 5/30/21(9)(14) | EUR | 270 | 347,407 | |||||||||
| Och-Ziff Finance Co., LLC | ||||||||||||
4.50%, 11/20/19(8) | 2,009 | 1,973,843 | ||||||||||
| SASU Newco SAB 20 SAS | ||||||||||||
4.25%, 9/30/24(9) | EUR | 490 | 587,203 | |||||||||
| UniCredit SpA | ||||||||||||
5.861% to 6/19/27, 6/19/32(8)(10) | 1,000 | 1,017,710 | ||||||||||
| Unifin Financiera SAB de CV SOFOM ENR | ||||||||||||
8.875% to 1/29/25 (8)(10)(11) | 248 | 243,660 | ||||||||||
| $ | 15,995,471 | |||||||||||
| Drugs — 1.5% | ||||||||||||
| Catalent Pharma Solutions, Inc. | ||||||||||||
4.875%, 1/15/26(8) | 3,385 | $ | 3,308,837 | |||||||||
| Jaguar Holding Co. II/Pharmaceutical Product Development, LLC | ||||||||||||
6.375%, 8/1/23(8) | 4,400 | 4,460,500 | ||||||||||
| Johnson & Johnson | ||||||||||||
1.65%, 3/1/21 | 590 | 574,188 | ||||||||||
| Merck & Co., Inc. | ||||||||||||
1.85%, 2/10/20 | 600 | 592,565 | ||||||||||
| 27 | See Notes to Financial Statements. |
Eaton Vance
Limited Duration Income Fund
March 31, 2018
Portfolio of Investments — continued
| Security | Principal Amount* (000’s omitted) | Value | ||||||||||
| Drugs (continued) | ||||||||||||
| Nidda Healthcare Holding GmbH | ||||||||||||
3.50%, 9/30/24(9) | EUR | 200 | $ | 246,188 | ||||||||
| Valeant Pharmaceuticals International, Inc. | ||||||||||||
7.50%, 7/15/21(8) | 3,210 | 3,246,113 | ||||||||||
5.625%, 12/1/21(8) | 1,165 | 1,116,944 | ||||||||||
6.50%, 3/15/22(8) | 2,419 | 2,506,689 | ||||||||||
7.25%, 7/15/22(8) | 275 | 276,031 | ||||||||||
5.875%, 5/15/23(8) | 1,135 | 1,011,569 | ||||||||||
7.00%, 3/15/24(8) | 4,105 | 4,294,856 | ||||||||||
5.50%, 11/1/25(8) | 2,585 | 2,526,191 | ||||||||||
9.00%, 12/15/25(8) | 1,705 | 1,700,738 | ||||||||||
| $ | 25,861,409 | |||||||||||
| Ecological Services and Equipment — 0.8% | ||||||||||||
| Advanced Disposal Services, Inc. | ||||||||||||
5.625%, 11/15/24(8) | 1,405 | $ | 1,422,562 | |||||||||
| Clean Harbors, Inc. | ||||||||||||
5.125%, 6/1/21 | 900 | 913,500 | ||||||||||
| Covanta Holding Corp. | ||||||||||||
6.375%, 10/1/22 | 1,960 | 1,999,200 | ||||||||||
5.875%, 3/1/24 | 1,900 | 1,866,750 | ||||||||||
5.875%, 7/1/25 | 860 | 836,350 | ||||||||||
| GFL Environmental, Inc. | ||||||||||||
9.875%, 2/1/21(8) | 225 | 237,938 | ||||||||||
5.375%, 3/1/23(8) | 1,695 | 1,669,575 | ||||||||||
| Waste Pro USA, Inc. | ||||||||||||
5.50%, 2/15/26(8) | 655 | 648,450 | ||||||||||
| Wrangler Buyer Corp. | ||||||||||||
6.00%, 10/1/25(8) | 3,793 | 3,745,587 | ||||||||||
| $ | 13,339,912 | |||||||||||
| Electric Utilities — 0.3% | ||||||||||||
| Drax Finco PLC | ||||||||||||
4.25%, 5/1/22(9) | GBP | 325 | $ | 458,255 | ||||||||
| Engie Energia Chile SA | ||||||||||||
4.50%, 1/29/25(8) | 637 | 650,021 | ||||||||||
| NRG Yield Operating, LLC | ||||||||||||
5.375%, 8/15/24 | 825 | 832,219 | ||||||||||
5.00%, 9/15/26 | 1,455 | 1,436,812 | ||||||||||
| State Grid Overseas Investment 2016, Ltd. | ||||||||||||
2.875%, 5/18/26(9) | 2,300 | 2,145,026 | ||||||||||
| TenneT Holding B.V. | ||||||||||||
2.995% to 6/1/24 (9)(10)(11) | EUR | 350 | 440,347 | |||||||||
| $ | 5,962,680 | |||||||||||
| Security | Principal Amount* (000’s omitted) | Value | ||||||||||
| Electronics / Electrical — 1.4% | ||||||||||||
| Anixter, Inc. | ||||||||||||
5.50%, 3/1/23 | 1,890 | $ | 1,963,238 | |||||||||
| Avnet, Inc. | ||||||||||||
4.625%, 4/15/26 | 985 | 983,718 | ||||||||||
| Duke Energy Corp. | ||||||||||||
2.65%, 9/1/26 | 850 | 776,683 | ||||||||||
| Electricite de France S.A. | ||||||||||||
6.00% to 1/29/26(9)(10)(11) | GBP | 400 | 585,638 | |||||||||
| Enel Finance International NV | ||||||||||||
3.625%, 5/25/27(8) | 1,000 | 953,598 | ||||||||||
| Entegris, Inc. | ||||||||||||
4.625%, 2/10/26(8) | 1,350 | 1,323,149 | ||||||||||
| Exelon Corp. | ||||||||||||
5.625%, 6/15/35 | 819 | 979,236 | ||||||||||
| Infor (US), Inc. | ||||||||||||
6.50%, 5/15/22 | 1,760 | 1,799,600 | ||||||||||
| Ingram Micro, Inc. | ||||||||||||
5.45%, 12/15/24 | 1,889 | 1,830,506 | ||||||||||
| NXP B.V./NXP Funding, LLC | ||||||||||||
4.625%, 6/1/23(8) | 1,430 | 1,459,029 | ||||||||||
| SS&C Technologies Holdings, Inc. | ||||||||||||
5.875%, 7/15/23 | 2,650 | 2,805,025 | ||||||||||
| Veritas US, Inc./Veritas Bermuda, Ltd. | ||||||||||||
7.50%, 2/1/23(8) | 1,455 | 1,462,275 | ||||||||||
7.50%, 2/1/23(9) | EUR | 500 | 646,599 | |||||||||
10.50%, 2/1/24(8) | 2,125 | 1,997,500 | ||||||||||
| Western Digital Corp. | ||||||||||||
4.75%, 2/15/26 | 4,765 | 4,763,451 | ||||||||||
| $ | 24,329,245 | |||||||||||
| Energy — 0.1% | ||||||||||||
| Sunoco, L.P./Sunoco Finance Corp. | ||||||||||||
4.875%, 1/15/23(8) | 950 | $ | 917,938 | |||||||||
5.50%, 2/15/26(8) | 510 | 493,425 | ||||||||||
| Ultrapar International S.A. | ||||||||||||
5.25%, 10/6/26(8) | 1,000 | 998,750 | ||||||||||
| $ | 2,410,113 | |||||||||||
| Entertainment — 0.0%(15) | ||||||||||||
| CPUK Finance, Ltd. | ||||||||||||
4.875%, 2/28/47(9) | GBP | 485 | $ | 685,045 | ||||||||
| $ | 685,045 | |||||||||||
| 28 | See Notes to Financial Statements. |
Eaton Vance
Limited Duration Income Fund
March 31, 2018
Portfolio of Investments — continued
| Security | Principal Amount* (000’s omitted) | Value | ||||||||||
| Financial Intermediaries — 1.6% | ||||||||||||
| Ally Financial, Inc. | ||||||||||||
8.00%, 12/31/18 | 75 | $ | 77,531 | |||||||||
3.50%, 1/27/19 | 5,000 | 5,018,750 | ||||||||||
| CIT Group, Inc. | ||||||||||||
5.375%, 5/15/20 | 570 | 589,238 | ||||||||||
4.125%, 3/9/21 | 1,105 | 1,113,287 | ||||||||||
6.125%, 3/9/28 | 650 | 676,000 | ||||||||||
| Credit Acceptance Corp. | ||||||||||||
7.375%, 3/15/23 | 1,475 | 1,543,219 | ||||||||||
| Icahn Enterprises, L.P./Icahn Enterprises Finance Corp. | ||||||||||||
6.25%, 2/1/22 | 2,385 | 2,432,700 | ||||||||||
6.375%, 12/15/25 | 820 | 826,150 | ||||||||||
| JPMorgan Chase & Co. | ||||||||||||
4.25%, 10/1/27 | 1,250 | 1,266,893 | ||||||||||
Series S, 6.75% to 2/1/24(10)(11) | 3,325 | 3,631,731 | ||||||||||
| Navient Corp. | ||||||||||||
5.50%, 1/15/19 | 3,125 | 3,167,187 | ||||||||||
4.875%, 6/17/19 | 215 | 217,258 | ||||||||||
8.00%, 3/25/20 | 2,150 | 2,289,750 | ||||||||||
5.00%, 10/26/20 | 995 | 1,003,706 | ||||||||||
7.25%, 1/25/22 | 215 | 227,900 | ||||||||||
| OneMain Financial Holdings, LLC | ||||||||||||
7.25%, 12/15/21(8) | 500 | 518,438 | ||||||||||
| Titan Acquisition, Ltd./Titan Co-Borrower, LLC | ||||||||||||
7.75%, 4/15/26(8) | 3,515 | 3,512,803 | ||||||||||
| $ | 28,112,541 | |||||||||||
| Financial Services — 0.4% | ||||||||||||
| Banco BTG Pactual SA/Cayman Islands | ||||||||||||
5.75%, 9/28/22(8) | 1,592 | $ | 1,583,244 | |||||||||
| Banco BTG Pactual SA/Luxembourg | ||||||||||||
5.50%, 1/31/23(8) | 510 | 499,647 | ||||||||||
| Brookfield Finance, Inc. | ||||||||||||
3.90%, 1/25/28 | 2,000 | 1,946,070 | ||||||||||
| Sensata Technologies UK Financing Co. PLC | ||||||||||||
6.25%, 2/15/26(8) | 2,735 | 2,888,023 | ||||||||||
| $ | 6,916,984 | |||||||||||
| Food Products — 0.9% | ||||||||||||
| Dean Foods Co. | ||||||||||||
6.50%, 3/15/23(8) | 1,025 | $ | 977,594 | |||||||||
| Dole Food Co., Inc. | ||||||||||||
7.25%, 6/15/25(8) | 2,900 | 2,987,000 | ||||||||||
| Security | Principal Amount* (000’s omitted) | Value | ||||||||||
| Food Products (continued) | ||||||||||||
| Iceland Bondco PLC | ||||||||||||
4.772%, (3 mo. GBP LIBOR + 4.25%), 7/15/20(8)(13) | GBP | 254 | $ | 356,052 | ||||||||
| Pilgrim’s Pride Corp. | ||||||||||||
5.75%, 3/15/25(8) | 1,250 | 1,217,188 | ||||||||||
5.875%, 9/30/27(8) | 660 | 622,050 | ||||||||||
| Post Holdings, Inc. | ||||||||||||
5.50%, 3/1/25(8) | 1,680 | 1,659,000 | ||||||||||
8.00%, 7/15/25(8) | 745 | 839,056 | ||||||||||
5.00%, 8/15/26(8) | 2,275 | 2,166,937 | ||||||||||
5.625%, 1/15/28(8) | 1,670 | 1,601,112 | ||||||||||
| Smithfield Foods, Inc. | ||||||||||||
2.65%, 10/3/21(8) | 550 | 526,765 | ||||||||||
| Tesco PLC | ||||||||||||
6.125%, 2/24/22 | GBP | 400 | 632,827 | |||||||||
| US Foods, Inc. | ||||||||||||
5.875%, 6/15/24(8) | 1,870 | 1,921,425 | ||||||||||
| $ | 15,507,006 | |||||||||||
| Food Service — 0.7% | ||||||||||||
| 1011778 B.C. Unlimited Liability Company/New Red Finance, Inc. | ||||||||||||
4.625%, 1/15/22(8) | 2,410 | $ | 2,422,050 | |||||||||
4.25%, 5/15/24(8) | 2,720 | 2,604,400 | ||||||||||
5.00%, 10/15/25(8) | 3,705 | 3,546,426 | ||||||||||
| IRB Holding Corp. | ||||||||||||
6.75%, 2/15/26(8) | 1,045 | 1,026,817 | ||||||||||
| Welbilt, Inc. | ||||||||||||
9.50%, 2/15/24 | 815 | 912,800 | ||||||||||
| Yum! Brands, Inc. | ||||||||||||
5.30%, 9/15/19 | 425 | 437,750 | ||||||||||
3.875%, 11/1/23 | 190 | 183,112 | ||||||||||
| $ | 11,133,355 | |||||||||||
| Food / Drug Retailers — 0.3% | ||||||||||||
| CVS Health Corp. | ||||||||||||
3.375%, 8/12/24 | 925 | $ | 896,789 | |||||||||
4.30%, 3/25/28 | 934 | 941,623 | ||||||||||
| ESAL GmbH | ||||||||||||
6.25%, 2/5/23(8) | 2,075 | 1,986,812 | ||||||||||
| Sigma Alimentos SA de CV | ||||||||||||
4.125%, 5/2/26(8) | 1,070 | 1,033,888 | ||||||||||
| $ | 4,859,112 | |||||||||||
| 29 | See Notes to Financial Statements. |
Eaton Vance
Limited Duration Income Fund
March 31, 2018
Portfolio of Investments — continued
| Security | Principal Amount* (000’s omitted) | Value | ||||||||||
| Forest Products — 0.0%(15) | ||||||||||||
| Mercer International, Inc. | ||||||||||||
5.50%, 1/15/26(8) | 450 | $ | 447,750 | |||||||||
| $ | 447,750 | |||||||||||
| Health Care — 3.5% | ||||||||||||
| Abbott Laboratories | ||||||||||||
4.90%, 11/30/46 | 360 | $ | 395,593 | |||||||||
| Aetna, Inc. | ||||||||||||
4.125%, 11/15/42 | 385 | 362,300 | ||||||||||
| Amgen, Inc. | ||||||||||||
2.60%, 8/19/26 | 840 | 767,883 | ||||||||||
| Centene Corp. | ||||||||||||
4.75%, 5/15/22 | 870 | 885,225 | ||||||||||
6.125%, 2/15/24 | 200 | 208,640 | ||||||||||
4.75%, 1/15/25 | 2,450 | 2,394,875 | ||||||||||
| Charles River Laboratories International, Inc. | ||||||||||||
5.50%, 4/1/26(8)(12) | 545 | 555,219 | ||||||||||
| CHS/Community Health Systems, Inc. | ||||||||||||
6.25%, 3/31/23 | 2,785 | 2,579,606 | ||||||||||
| Constantin Investissement 3 SASU | ||||||||||||
5.375%, 4/15/25(9) | EUR | 300 | 364,618 | |||||||||
| Eagle Holding Co. II, LLC | ||||||||||||
7.625%, (7.625% cash or 8.375% PIK), 5/15/22(8)(14) | 1,260 | 1,272,600 | ||||||||||
| Envision Healthcare Corp. | ||||||||||||
5.625%, 7/15/22 | 1,050 | 1,059,975 | ||||||||||
6.25%, 12/1/24(8) | 3,600 | 3,735,000 | ||||||||||
| Gilead Sciences, Inc. | ||||||||||||
2.95%, 3/1/27 | 800 | 757,263 | ||||||||||
| Grifols S.A. | ||||||||||||
3.20%, 5/1/25(9) | EUR | 550 | 683,610 | |||||||||
| HCA Healthcare, Inc. | ||||||||||||
6.25%, 2/15/21 | 1,710 | 1,799,775 | ||||||||||
| HCA, Inc. | ||||||||||||
6.50%, 2/15/20 | 3,215 | 3,379,769 | ||||||||||
7.50%, 2/15/22 | 2,930 | 3,226,662 | ||||||||||
4.75%, 5/1/23 | 1,125 | 1,140,469 | ||||||||||
5.875%, 2/15/26 | 2,705 | 2,759,100 | ||||||||||
4.50%, 2/15/27 | 1,515 | 1,465,763 | ||||||||||
| Hologic, Inc. | ||||||||||||
4.375%, 10/15/25(8) | 1,665 | 1,610,888 | ||||||||||
| inVentiv Group Holdings, Inc./inVentiv Health, Inc./ inVentiv Health Clinical, Inc. | ||||||||||||
7.50%, 10/1/24(8) | 1,629 | 1,738,957 | ||||||||||
| Security | Principal Amount* (000’s omitted) | Value | ||||||||||
| Health Care (continued) | ||||||||||||
| Kinetic Concepts, Inc./KCI USA, Inc. | ||||||||||||
7.875%, 2/15/21(8) | 1,405 | $ | 1,447,150 | |||||||||
12.50%, 11/1/21(8) | 2,965 | 3,365,275 | ||||||||||
| Medtronic Global Holdings SCA | ||||||||||||
3.35%, 4/1/27 | 750 | 740,520 | ||||||||||
| MPH Acquisition Holdings, LLC | ||||||||||||
7.125%, 6/1/24(8) | 2,150 | 2,225,250 | ||||||||||
| Polaris Intermediate Corp. | ||||||||||||
8.50%, 12/1/22(8)(14) | 2,940 | 3,006,179 | ||||||||||
| Synlab Bondco PLC | ||||||||||||
3.50%, (3 mo. EURIBOR + 3.50%), 7/1/22(9)(13) | EUR | 580 | 719,855 | |||||||||
| Team Health Holdings, Inc. | ||||||||||||
6.375%, 2/1/25(8) | 2,020 | 1,742,452 | ||||||||||
| Teleflex, Inc. | ||||||||||||
5.25%, 6/15/24 | 790 | 811,725 | ||||||||||
4.625%, 11/15/27 | 1,055 | 1,019,404 | ||||||||||
| Tenet Healthcare Corp. | ||||||||||||
6.00%, 10/1/20 | 1,795 | 1,862,312 | ||||||||||
7.50%, 1/1/22(8) | 680 | 719,100 | ||||||||||
8.125%, 4/1/22 | 4,125 | 4,315,781 | ||||||||||
6.75%, 6/15/23 | 325 | 319,313 | ||||||||||
| UnitedHealth Group, Inc. | ||||||||||||
3.375%, 4/15/27 | 475 | 467,621 | ||||||||||
| WellCare Health Plans, Inc. | ||||||||||||
5.25%, 4/1/25 | 3,275 | 3,295,469 | ||||||||||
| $ | 59,201,196 | |||||||||||
| Home Furnishings — 0.1% | ||||||||||||
| Harman International Industries, Inc. | ||||||||||||
4.15%, 5/15/25 | 940 | $ | 952,476 | |||||||||
| $ | 952,476 | |||||||||||
| Industrial Equipment — 0.4% | ||||||||||||
| ABG Orphan Holdco S.a.r.l. | ||||||||||||
14.00%, (5.00% cash, 9.00% PIK) 2/28/21(8) | 167 | $ | 179,907 | |||||||||
| BlueLine Rental Finance Corp./BlueLine Rental, LLC | ||||||||||||
9.25%, 3/15/24(8) | 1,010 | 1,085,427 | ||||||||||
| Cleaver-Brooks, Inc. | ||||||||||||
7.875%, 3/1/23(8) | 670 | 697,638 | ||||||||||
| CNH Industrial Capital, LLC | ||||||||||||
3.625%, 4/15/18 | 2,500 | 2,506,875 | ||||||||||
| Orano SA | ||||||||||||
4.875%, 9/23/24 | EUR | 450 | 608,198 | |||||||||
| 30 | See Notes to Financial Statements. |
Eaton Vance
Limited Duration Income Fund
March 31, 2018
Portfolio of Investments — continued
| Security | Principal Amount* (000’s omitted) | Value | ||||||||
| Industrial Equipment (continued) | ||||||||||
| Wabtec Corp. | ||||||||||
3.45%, 11/15/26 | 1,000 | $ | 959,485 | |||||||
| Wittur International Holding GmbH | ||||||||||
8.50%, 2/15/23(9) | EUR | 580 | 739,495 | |||||||
| $ | 6,777,025 | |||||||||
| Insurance — 0.9% | ||||||||||
| Alliant Holdings Intermediate, LLC/Alliant Holdings Co-Issuer | ||||||||||
8.25%, 8/1/23(8) | 5,430 | $ | 5,606,475 | |||||||
| Ardonagh Midco 3 PLC | ||||||||||
8.375%, 7/15/23(9) | GBP | 440 | 635,840 | |||||||
8.625%, 7/15/23(8) | 2,335 | 2,422,562 | ||||||||
| Athene Holding, Ltd. | ||||||||||
4.125%, 1/12/28 | 1,000 | 960,845 | ||||||||
| Berkshire Hathaway Energy Co. | ||||||||||
4.50%, 2/1/45 | 680 | 728,481 | ||||||||
| Hub Holdings, LLC/Hub Holdings Finance, Inc. | ||||||||||
8.125%, (8.125% cash or 8.875% PIK), 7/15/19(8)(14) | 1,695 | 1,699,238 | ||||||||
| Hub International, Ltd. | ||||||||||
7.875%, 10/1/21(8) | 2,325 | 2,409,281 | ||||||||
| Metropolitan Life Global Funding I | ||||||||||
3.00%, 9/19/27(8) | 760 | 718,117 | ||||||||
| MGIC Investment Corp. | ||||||||||
5.75%, 8/15/23 | 1,000 | 1,052,500 | ||||||||
| $ | 16,233,339 | |||||||||
| Internet Software & Services — 0.6% | ||||||||||
| eDreams Odigeo SA | ||||||||||
8.50%, 8/1/21(9) | EUR | 244 | $ | 319,181 | ||||||
| Netflix, Inc. | ||||||||||
5.50%, 2/15/22 | 1,825 | 1,898,000 | ||||||||
3.625%, 5/15/27(9) | EUR | 340 | 412,571 | |||||||
4.875%, 4/15/28(8) | 1,665 | 1,603,145 | ||||||||
| Riverbed Technology, Inc. | ||||||||||
8.875%, 3/1/23(8) | 3,495 | 3,333,356 | ||||||||
| Symantec Corp. | ||||||||||
5.00%, 4/15/25(8) | 1,995 | 2,016,408 | ||||||||
| $ | 9,582,661 | |||||||||
| Security | Principal Amount* (000’s omitted) | Value | ||||||||
| Leisure Goods / Activities / Movies — 0.9% | ||||||||||
| AMC Entertainment Holdings, Inc. | ||||||||||
6.375%, 11/15/24 | GBP | 225 | $ | 324,277 | ||||||
5.875%, 11/15/26 | 710 | 699,350 | ||||||||
6.125%, 5/15/27 | 2,545 | 2,513,188 | ||||||||
| Cinemark USA, Inc. | ||||||||||
4.875%, 6/1/23 | 2,730 | 2,708,979 | ||||||||
| Mattel, Inc. | ||||||||||
6.75%, 12/31/25(8) | 555 | 544,011 | ||||||||
| National CineMedia, LLC | ||||||||||
6.00%, 4/15/22 | 725 | 735,875 | ||||||||
| NCL Corp., Ltd. | ||||||||||
4.75%, 12/15/21(8) | 1,345 | 1,361,813 | ||||||||
| Sabre GLBL, Inc. | ||||||||||
5.375%, 4/15/23(8) | 855 | 866,756 | ||||||||
| Viking Cruises, Ltd. | ||||||||||
6.25%, 5/15/25(8) | 1,690 | 1,698,450 | ||||||||
5.875%, 9/15/27(8) | 4,505 | 4,279,750 | ||||||||
| $ | 15,732,449 | |||||||||
| Lodging and Casinos — 2.1% | ||||||||||
| Caesars Resort Collection, LLC/CRC Finco, Inc. | ||||||||||
5.25%, 10/15/25(8) | 4,300 | $ | 4,133,074 | |||||||
| Eldorado Resorts, Inc. | ||||||||||
6.00%, 4/1/25 | 1,450 | 1,479,000 | ||||||||
| ESH Hospitality, Inc. | ||||||||||
5.25%, 5/1/25(8) | 1,260 | 1,228,878 | ||||||||
| Gateway Casinos & Entertainment, Ltd. | ||||||||||
8.25%, 3/1/24(8) | 255 | 271,734 | ||||||||
| GLP Capital, L.P./GLP Financing II, Inc. | ||||||||||
4.875%, 11/1/20 | 2,650 | 2,711,347 | ||||||||
| Golden Nugget, Inc. | ||||||||||
6.75%, 10/15/24(8) | 3,745 | 3,782,450 | ||||||||
8.75%, 10/1/25(8) | 1,995 | 2,074,800 | ||||||||
| Hilton Domestic Operating Co., Inc. | ||||||||||
4.25%, 9/1/24 | 1,410 | 1,371,225 | ||||||||
| Jack Ohio Finance, LLC/Jack Ohio Finance 1 Corp. | ||||||||||
6.75%, 11/15/21(8) | 1,395 | 1,443,825 | ||||||||
10.25%, 11/15/22(8) | 1,310 | 1,431,175 | ||||||||
| MGM Growth Properties Operating Partnership, L.P./MGP Finance Co-Issuer, Inc. | ||||||||||
5.625%, 5/1/24 | 480 | 496,800 | ||||||||
4.50%, 9/1/26 | 895 | 859,200 | ||||||||
| MGM Resorts International | ||||||||||
6.625%, 12/15/21 | 2,455 | 2,654,469 | ||||||||
| 31 | See Notes to Financial Statements. |
Eaton Vance
Limited Duration Income Fund
March 31, 2018
Portfolio of Investments — continued
| Security | Principal Amount* (000’s omitted) | Value | ||||||||||
| Lodging and Casinos (continued) | ||||||||||||
| MGM Resorts International (continued) | ||||||||||||
7.75%, 3/15/22 | 3,340 | $ | 3,728,275 | |||||||||
6.00%, 3/15/23 | 890 | 936,725 | ||||||||||
| NH Hotel Group S.A. | ||||||||||||
3.75%, 10/1/23(9) | EUR | 250 | 323,470 | |||||||||
| RHP Hotel Properties, L.P./RHP Finance Corp. | ||||||||||||
5.00%, 4/15/23 | 1,215 | 1,224,112 | ||||||||||
| Studio City Co., Ltd. | ||||||||||||
7.25%, 11/30/21(8) | 845 | 881,969 | ||||||||||
| Tunica-Biloxi Gaming Authority | ||||||||||||
3.78%, 12/15/20(8) | 4,721 | 1,298,219 | ||||||||||
| VICI Properties 1, LLC/VICI FC, Inc. | ||||||||||||
8.00%, 10/15/23 | 2,969 | 3,302,733 | ||||||||||
| Wynn Las Vegas, LLC/Wynn Las Vegas Capital Corp. | ||||||||||||
5.25%, 5/15/27(8) | 335 | 329,138 | ||||||||||
| $ | 35,962,618 | |||||||||||
| Machinery — 0.2% | ||||||||||||
| Cloud Crane, LLC | ||||||||||||
10.125%, 8/1/24(8) | 1,625 | $ | 1,803,750 | |||||||||
| Nvent Finance S.a.r.l. | ||||||||||||
4.55%, 4/15/28(8) | 1,000 | 1,005,918 | ||||||||||
| $ | 2,809,668 | |||||||||||
| Manufacturing — 0.2% | ||||||||||||
| Novelis Corp. | ||||||||||||
6.25%, 8/15/24(8) | 1,065 | $ | 1,094,287 | |||||||||
5.875%, 9/30/26(8) | 1,530 | 1,510,875 | ||||||||||
| $ | 2,605,162 | |||||||||||
| Media — 0.0%(15) | ||||||||||||
| McGraw-Hill Global Education Holdings, LLC/ McGraw-Hill Global Education Finance | ||||||||||||
7.875%, 5/15/24(8) | 135 | $ | 129,569 | |||||||||
| $ | 129,569 | |||||||||||
| Metals / Mining — 0.5% | ||||||||||||
| Alcoa Nederland Holding B.V. | ||||||||||||
6.75%, 9/30/24(8) | 670 | $ | 720,250 | |||||||||
7.00%, 9/30/26(8) | 200 | 216,500 | ||||||||||
| Constellium N.V. | ||||||||||||
4.25%, 2/15/26(8) | EUR | 1,000 | 1,249,614 | |||||||||
| Security | Principal Amount* (000’s omitted) | Value | ||||||||||
| Metals / Mining (continued) | ||||||||||||
| Constellium N.V. (continued) | ||||||||||||
4.25%, 2/15/26(9) | EUR | 400 | $ | 499,846 | ||||||||
5.875%, 2/15/26(8) | 1,205 | 1,189,937 | ||||||||||
| Hudbay Minerals, Inc. | ||||||||||||
7.25%, 1/15/23(8) | 1,015 | 1,058,138 | ||||||||||
7.625%, 1/15/25(8) | 1,825 | 1,936,781 | ||||||||||
| Yamana Gold, Inc. | ||||||||||||
4.625%, 12/15/27(8) | 1,000 | 985,958 | ||||||||||
| $ | 7,857,024 | |||||||||||
| Nonferrous Metals / Minerals — 1.1% | ||||||||||||
| Eldorado Gold Corp. | ||||||||||||
6.125%, 12/15/20(8) | 3,685 | $ | 3,509,962 | |||||||||
| First Quantum Minerals, Ltd. | ||||||||||||
7.00%, 2/15/21(8) | 655 | 657,866 | ||||||||||
7.25%, 4/1/23(8) | 2,010 | 1,984,875 | ||||||||||
7.50%, 4/1/25(8) | 3,755 | 3,701,022 | ||||||||||
6.875%, 3/1/26(8) | 1,765 | 1,681,163 | ||||||||||
| Imperial Metals Corp. | ||||||||||||
7.00%, 3/15/19(8) | 880 | 814,000 | ||||||||||
| New Gold, Inc. | ||||||||||||
6.25%, 11/15/22(8) | 2,130 | 2,180,587 | ||||||||||
6.375%, 5/15/25(8) | 695 | 712,375 | ||||||||||
| SunCoke Energy Partners, L.P./SunCoke Energy Partners Finance Corp. | ||||||||||||
7.50%, 6/15/25(8) | 1,530 | 1,583,550 | ||||||||||
| Teck Resources, Ltd. | ||||||||||||
6.00%, 8/15/40 | 350 | 362,250 | ||||||||||
5.20%, 3/1/42 | 315 | 296,100 | ||||||||||
5.40%, 2/1/43 | 700 | 670,250 | ||||||||||
| $ | 18,154,000 | |||||||||||
| Oil and Gas — 6.5% | ||||||||||||
| Aker BP ASA | ||||||||||||
5.875%, 3/31/25(8) | 965 | $ | 979,475 | |||||||||
| AmeriGas Partners, L.P./AmeriGas Finance Corp. | ||||||||||||
5.625%, 5/20/24 | 280 | 279,650 | ||||||||||
5.50%, 5/20/25 | 3,020 | 2,929,400 | ||||||||||
5.875%, 8/20/26 | 465 | 456,863 | ||||||||||
5.75%, 5/20/27 | 255 | 245,119 | ||||||||||
| Andeavor Logistics, L.P./Tesoro Logistics Finance Corp. | ||||||||||||
5.25%, 1/15/25 | 305 | 310,460 | ||||||||||
| 32 | See Notes to Financial Statements. |
Eaton Vance
Limited Duration Income Fund
March 31, 2018
Portfolio of Investments — continued
| Security | Principal Amount* (000’s omitted) | Value | ||||||||||
| Oil and Gas (continued) | ||||||||||||
| Antero Resources Corp. | ||||||||||||
5.375%, 11/1/21 | 2,715 | $ | 2,772,694 | |||||||||
5.625%, 6/1/23 | 270 | 276,750 | ||||||||||
| Berry Petroleum Co., LLC | ||||||||||||
7.00%, 2/15/26(8) | 1,385 | 1,399,265 | ||||||||||
| Canbriam Energy, Inc. | ||||||||||||
9.75%, 11/15/19(8) | 2,265 | 2,321,625 | ||||||||||
| Centennial Resource Production, LLC | ||||||||||||
5.375%, 1/15/26(8) | 2,175 | 2,139,656 | ||||||||||
| Cheniere Corpus Christi Holdings, LLC | ||||||||||||
7.00%, 6/30/24 | 340 | 377,400 | ||||||||||
5.875%, 3/31/25 | 2,065 | 2,168,250 | ||||||||||
| Cheniere Energy Partners, L.P. | ||||||||||||
5.25%, 10/1/25(8) | 1,590 | 1,572,112 | ||||||||||
| Chesapeake Energy Corp. | ||||||||||||
8.00%, 12/15/22(8) | 98 | 103,758 | ||||||||||
| CrownRock, L.P./CrownRock Finance, Inc. | ||||||||||||
5.625%, 10/15/25(8) | 4,165 | 4,133,762 | ||||||||||
| CVR Refining, LLC/Coffeyville Finance, Inc. | ||||||||||||
6.50%, 11/1/22 | 5,055 | 5,181,375 | ||||||||||
| Denbury Resources, Inc. | ||||||||||||
9.00%, 5/15/21(8) | 650 | 669,500 | ||||||||||
| Diamondback Energy, Inc. | ||||||||||||
4.75%, 11/1/24 | 490 | 486,325 | ||||||||||
5.375%, 5/31/25 | 1,235 | 1,258,774 | ||||||||||
| Ecopetrol S.A. | ||||||||||||
5.875%, 5/28/45 | 1,000 | 989,700 | ||||||||||
| Endeavor Energy Resources, L.P./EER Finance, Inc. | ||||||||||||
5.50%, 1/30/26(8) | 1,045 | 1,042,388 | ||||||||||
5.75%, 1/30/28(8) | 1,390 | 1,390,000 | ||||||||||
| Energy Transfer Equity, L.P. | ||||||||||||
7.50%, 10/15/20 | 1,950 | 2,104,781 | ||||||||||
5.875%, 1/15/24 | 875 | 905,625 | ||||||||||
| Energy Transfer Partners, L.P. | ||||||||||||
Series A, 6.25% to 2/15/23(10)(11) | 1,745 | 1,671,928 | ||||||||||
| Ensco PLC | ||||||||||||
7.75%, 2/1/26 | 1,030 | 947,600 | ||||||||||
| EP Energy, LLC/Everest Acquisition Finance, Inc. | ||||||||||||
8.00%, 11/29/24(8) | 875 | 883,750 | ||||||||||
8.00%, 2/15/25(8) | 1,350 | 907,875 | ||||||||||
| Extraction Oil & Gas, Inc. | ||||||||||||
7.375%, 5/15/24(8) | 535 | 561,750 | ||||||||||
5.625%, 2/1/26(8) | 2,455 | 2,323,044 | ||||||||||
| Security | Principal Amount* (000’s omitted) | Value | ||||||||||
| Oil and Gas (continued) | ||||||||||||
| Great Western Petroleum, LLC/Great Western Finance Corp. | ||||||||||||
9.00%, 9/30/21(8) | 2,485 | $ | 2,559,550 | |||||||||
| Gulfport Energy Corp. | ||||||||||||
6.625%, 5/1/23 | 2,085 | 2,116,275 | ||||||||||
6.00%, 10/15/24 | 1,175 | 1,120,656 | ||||||||||
| Holly Energy Partners, L.P./Holly Energy Finance Corp. | ||||||||||||
6.00%, 8/1/24(8) | 525 | 538,125 | ||||||||||
| Kinder Morgan Energy Partners, L.P. | ||||||||||||
4.30%, 5/1/24 | 1,025 | 1,033,694 | ||||||||||
| Matador Resources Co. | ||||||||||||
6.875%, 4/15/23 | 2,675 | 2,788,687 | ||||||||||
| Moss Creek Resources Holdings, Inc. | ||||||||||||
7.50%, 1/15/26(8) | 1,915 | 1,938,363 | ||||||||||
| Nabors Industries, Inc. | ||||||||||||
4.625%, 9/15/21 | 255 | 247,414 | ||||||||||
5.50%, 1/15/23 | 1,840 | 1,808,002 | ||||||||||
5.75%, 2/1/25(8) | 1,985 | 1,875,825 | ||||||||||
| Oasis Petroleum, Inc. | ||||||||||||
6.50%, 11/1/21 | 420 | 427,350 | ||||||||||
6.875%, 3/15/22 | 110 | 111,841 | ||||||||||
6.875%, 1/15/23 | 910 | 924,788 | ||||||||||
| Oceaneering International, Inc. | ||||||||||||
4.65%, 11/15/24 | 1,250 | 1,207,391 | ||||||||||
| Parsley Energy, LLC/Parsley Finance Corp. | ||||||||||||
6.25%, 6/1/24(8) | 345 | 358,369 | ||||||||||
5.375%, 1/15/25(8) | 1,240 | 1,243,100 | ||||||||||
5.25%, 8/15/25(8) | 1,170 | 1,165,613 | ||||||||||
5.625%, 10/15/27(8) | 1,255 | 1,258,138 | ||||||||||
| PBF Holding Co., LLC/PBF Finance Corp. | ||||||||||||
7.00%, 11/15/23 | 730 | 759,200 | ||||||||||
7.25%, 6/15/25 | 990 | 1,030,838 | ||||||||||
| PBF Logistics, L.P./PBF Logistics Finance Corp. | ||||||||||||
6.875%, 5/15/23 | 1,800 | 1,831,500 | ||||||||||
| Petrobras Global Finance B.V. | ||||||||||||
6.125%, 1/17/22 | 1,648 | 1,765,008 | ||||||||||
| Petroleos Mexicanos | ||||||||||||
6.75%, 9/21/47 | 1,000 | 1,014,380 | ||||||||||
| Precision Drilling Corp. | ||||||||||||
6.50%, 12/15/21 | 153 | 154,913 | ||||||||||
7.75%, 12/15/23 | 90 | 93,938 | ||||||||||
7.125%, 1/15/26(8) | 500 | 496,250 | ||||||||||
| QEP Resources, Inc. | ||||||||||||
5.625%, 3/1/26 | 620 | 587,450 | ||||||||||
| 33 | See Notes to Financial Statements. |
Eaton Vance
Limited Duration Income Fund
March 31, 2018
Portfolio of Investments — continued
| Security | Principal Amount* (000’s omitted) | Value | ||||||||||
| Oil and Gas (continued) | ||||||||||||
| Resolute Energy Corp. | ||||||||||||
8.50%, 5/1/20 | 560 | $ | 560,000 | |||||||||
| Rowan Cos., Inc. | ||||||||||||
4.875%, 6/1/22 | 1,810 | 1,656,150 | ||||||||||
| RSP Permian, Inc. | ||||||||||||
6.625%, 10/1/22 | 3,090 | 3,236,775 | ||||||||||
| Sabine Pass Liquefaction, LLC | ||||||||||||
5.625%, 2/1/21 | 935 | 983,501 | ||||||||||
5.625%, 3/1/25 | 1,910 | 2,054,125 | ||||||||||
| SESI, LLC | �� | |||||||||||
7.75%, 9/15/24(8) | 220 | 228,250 | ||||||||||
| Seven Generations Energy, Ltd. | ||||||||||||
6.875%, 6/30/23(8) | 1,250 | 1,303,125 | ||||||||||
5.375%, 9/30/25(8) | 1,710 | 1,637,325 | ||||||||||
| Shelf Drilling Holdings, Ltd. | ||||||||||||
8.25%, 2/15/25(8) | 1,700 | 1,710,625 | ||||||||||
| SM Energy Co. | ||||||||||||
6.125%, 11/15/22 | 750 | 753,750 | ||||||||||
6.50%, 1/1/23 | 1,995 | 1,995,000 | ||||||||||
6.75%, 9/15/26 | 1,205 | 1,198,975 | ||||||||||
| Tallgrass Energy Partners, L.P./Tallgrass Energy Finance Corp. | ||||||||||||
5.50%, 1/15/28(8) | 3,795 | 3,832,950 | ||||||||||
| Tervita Escrow Corp. | ||||||||||||
7.625%, 12/1/21(8) | 1,655 | 1,687,388 | ||||||||||
| Transocean, Inc. | ||||||||||||
7.50%, 1/15/26(8) | 650 | 641,875 | ||||||||||
| Trinidad Drilling, Ltd. | ||||||||||||
6.625%, 2/15/25(8) | 1,675 | 1,570,312 | ||||||||||
| Weatherford International, Ltd. | ||||||||||||
8.25%, 6/15/23 | 360 | 314,100 | ||||||||||
9.875%, 2/15/24 | 835 | 766,113 | ||||||||||
| Whiting Petroleum Corp. | ||||||||||||
6.625%, 1/15/26(8) | 2,070 | 2,088,112 | ||||||||||
| WildHorse Resource Development Corp. | ||||||||||||
6.875%, 2/1/25 | 3,510 | 3,536,325 | ||||||||||
| Williams Cos., Inc. (The) | ||||||||||||
3.70%, 1/15/23 | 1,605 | 1,568,887 | ||||||||||
4.55%, 6/24/24 | 1,240 | 1,254,843 | ||||||||||
5.75%, 6/24/44 | 790 | 839,375 | ||||||||||
| Woodside Finance, Ltd. | ||||||||||||
3.70%, 9/15/26(8) | 1,000 | 985,842 | ||||||||||
| $ | 110,651,035 | |||||||||||
| Security | Principal Amount* (000’s omitted) | Value | ||||||||||
| Packaging & Containers — 0.4% | ||||||||||||
| ARD Finance S.A. | ||||||||||||
7.125%, (7.125% cash or 7.875% PIK), 9/15/23(14) | 2,025 | $ | 2,103,469 | |||||||||
| ARD Securities Finance S.a.r.l. | ||||||||||||
8.75%, | 5,125 | 5,381,250 | ||||||||||
| $ | 7,484,719 | |||||||||||
| Pharmaceuticals — 0.2% | ||||||||||||
| AbbVie, Inc. | ||||||||||||
4.45%, 5/14/46 | 380 | $ | 378,737 | |||||||||
| Teva Pharmaceutical Finance Netherlands III B.V. | ||||||||||||
6.00%, 4/15/24(8) | 2,500 | 2,429,882 | ||||||||||
| Vizient, Inc. | ||||||||||||
10.375%, 3/1/24(8) | 1,005 | 1,118,062 | ||||||||||
| $ | 3,926,681 | |||||||||||
| Pipelines — 0.3% | ||||||||||||
| Antero Midstream Partners, L.P./Antero Midstream Finance Corp. | ||||||||||||
5.375%, 9/15/24 | 620 | $ | 627,750 | |||||||||
| Georgian Oil and Gas Corp. JSC | ||||||||||||
6.75%, 4/26/21(9) | 615 | 640,117 | ||||||||||
| NGPL PipeCo, LLC | ||||||||||||
4.375%, 8/15/22(8) | 340 | 339,150 | ||||||||||
| Plains All American Pipeline, L.P. | ||||||||||||
Series B, 6.125% to 11/15/22(10)(11) | 1,850 | 1,789,875 | ||||||||||
| Western Gas Partners, L.P. | ||||||||||||
4.65%, 7/1/26 | 1,025 | 1,038,807 | ||||||||||
| $ | 4,435,699 | |||||||||||
| Publishing — 0.3% | ||||||||||||
| Laureate Education, Inc. | ||||||||||||
8.25%, 5/1/25(8) | 2,835 | $ | 3,047,625 | |||||||||
| MHGE Parent, LLC/MHGE Parent Finance, Inc. | ||||||||||||
8.50%, (8.50% cash or 9.25% PIK), | 317 | 315,019 | ||||||||||
| Tribune Media Co. | ||||||||||||
5.875%, 7/15/22 | 1,390 | 1,416,062 | ||||||||||
| $ | 4,778,706 | |||||||||||
| Radio and Television — 0.6% | ||||||||||||
| CBS Radio, Inc. | ||||||||||||
7.25%, 11/1/24(8) | 1,420 | $ | 1,453,725 | |||||||||
| 34 | See Notes to Financial Statements. |
Eaton Vance
Limited Duration Income Fund
March 31, 2018
Portfolio of Investments — continued
| Security | Principal Amount* (000’s omitted) | Value | ||||||||||
| Radio and Television (continued) | ||||||||||||
| Clear Channel Worldwide Holdings, Inc. | ||||||||||||
Series A, 7.625%, 3/15/20 | 470 | $ | 468,825 | |||||||||
Series A, 6.50%, 11/15/22 | 1,100 | 1,122,000 | ||||||||||
Series B, 6.50%, 11/15/22 | 2,130 | 2,177,925 | ||||||||||
| iHeartCommunications, Inc. | ||||||||||||
9.00%, 12/15/19(5) | 226 | 180,518 | ||||||||||
| Nielsen Co. Luxembourg S.a.r.l. (The) | ||||||||||||
5.50%, 10/1/21(8) | 1,250 | 1,270,312 | ||||||||||
| Salem Media Group, Inc. | ||||||||||||
6.75%, 6/1/24(8) | 150 | 144,375 | ||||||||||
| Sirius XM Radio, Inc. | ||||||||||||
6.00%, 7/15/24(8) | 2,830 | 2,921,975 | ||||||||||
5.00%, 8/1/27(8) | 1,410 | 1,332,450 | ||||||||||
| $ | 11,072,105 | |||||||||||
| Real Estate Investment Trusts (REITs) — 0.4% | ||||||||||||
| CBL & Associates, L.P. | ||||||||||||
5.25%, 12/1/23 | 1,465 | $ | 1,268,457 | |||||||||
| DDR Corp. | ||||||||||||
3.625%, 2/1/25 | 781 | 748,791 | ||||||||||
| EPR Properties | ||||||||||||
4.50%, 6/1/27 | 1,100 | 1,073,706 | ||||||||||
| Mattamy Group Corp. | ||||||||||||
6.875%, 12/15/23(8) | 2,145 | 2,214,713 | ||||||||||
6.50%, 10/1/25(8) | 1,300 | 1,319,500 | ||||||||||
| VEREIT Operating Partnership, L.P. | ||||||||||||
3.95%, 8/15/27 | 1,060 | 996,750 | ||||||||||
| $ | 7,621,917 | |||||||||||
| Retailers (Except Food and Drug) — 1.2% | ||||||||||||
| Dollar Tree, Inc. | ||||||||||||
5.75%, 3/1/23 | 4,400 | $ | 4,607,306 | |||||||||
| Hot Topic, Inc. | ||||||||||||
9.25%, 6/15/21(8) | 1,170 | 1,164,150 | ||||||||||
| L Brands, Inc. | ||||||||||||
5.625%, 2/15/22 | 790 | 823,575 | ||||||||||
6.875%, 11/1/35 | 1,560 | 1,521,000 | ||||||||||
| Macy’s Retail Holdings, Inc. | ||||||||||||
6.70%, 7/15/34 | 785 | 826,189 | ||||||||||
4.30%, 2/15/43 | 1,252 | 1,021,775 | ||||||||||
| Murphy Oil USA, Inc. | ||||||||||||
6.00%, 8/15/23 | 4,165 | 4,310,775 | ||||||||||
5.625%, 5/1/27 | 560 | 564,900 | ||||||||||
| Security | Principal Amount* (000’s omitted) | Value | ||||||||||
| Retailers (Except Food and Drug) (continued) | ||||||||||||
| Nordstrom, Inc. | ||||||||||||
5.00%, 1/15/44 | 500 | $ | 470,685 | |||||||||
| Party City Holdings, Inc. | ||||||||||||
6.125%, 8/15/23(8) | 2,910 | 2,979,112 | ||||||||||
| Signet UK Finance PLC | ||||||||||||
4.70%, 6/15/24 | 644 | 618,081 | ||||||||||
| Tapestry, Inc. | ||||||||||||
4.125%, 7/15/27 | 1,000 | 980,189 | ||||||||||
| Vista Outdoor, Inc. | ||||||||||||
5.875%, 10/1/23 | 535 | 501,562 | ||||||||||
| $ | 20,389,299 | |||||||||||
| Road & Rail — 0.1% | ||||||||||||
| Watco Cos., LLC/Watco Finance Corp. | ||||||||||||
6.375%, 4/1/23(8) | 1,990 | $ | 2,047,213 | |||||||||
| $ | 2,047,213 | |||||||||||
| Software and Services — 0.5% | ||||||||||||
| Camelot Finance S.A. | ||||||||||||
7.875%, 10/15/24(8) | 1,115 | $ | 1,166,569 | |||||||||
| Gartner, Inc. | ||||||||||||
5.125%, 4/1/25(8) | 795 | 796,988 | ||||||||||
| IHS Markit, Ltd. | ||||||||||||
5.00%, 11/1/22(8) | 2,240 | 2,335,200 | ||||||||||
| Infor Software Parent, LLC/Infor Software Parent, Inc. | ||||||||||||
7.125%, (7.125% cash or 7.875% PIK), 5/1/21(8)(14) | 2,090 | 2,118,737 | ||||||||||
| j2 Cloud Services, LLC/j2 Global Co-Obligor, Inc. | ||||||||||||
6.00%, 7/15/25(8) | 1,915 | 1,970,056 | ||||||||||
| Microsoft Corp. | ||||||||||||
3.30%, 2/6/27 | 890 | 883,985 | ||||||||||
| $ | 9,271,535 | |||||||||||
| Steel — 0.3% | ||||||||||||
| Allegheny Ludlum, LLC | ||||||||||||
6.95%, 12/15/25 | 225 | $ | 232,312 | |||||||||
| Allegheny Technologies, Inc. | ||||||||||||
5.95%, 1/15/21 | 455 | 466,375 | ||||||||||
7.875%, 8/15/23 | 3,195 | 3,486,544 | ||||||||||
| Big River Steel, LLC/BRS Finance Corp. | ||||||||||||
7.25%, 9/1/25(8) | 1,080 | 1,123,200 | ||||||||||
| $ | 5,308,431 | |||||||||||
| 35 | See Notes to Financial Statements. |
Eaton Vance
Limited Duration Income Fund
March 31, 2018
Portfolio of Investments — continued
| Security | Principal Amount* (000’s omitted) | Value | ||||||||||
| Super Retail — 0.0%(15) | ||||||||||||
| Dufry Finance SCA | ||||||||||||
4.50%, 8/1/23(9) | EUR | 500 | $ | 643,221 | ||||||||
| $ | 643,221 | |||||||||||
| Surface Transport — 1.1% | ||||||||||||
| Anglian Water Osprey Financing PLC | ||||||||||||
4.00%, 3/8/26(9) | GBP | 225 | $ | 301,984 | ||||||||
| CEVA Group PLC | ||||||||||||
7.00%, 3/1/21(8) | 335 | 329,975 | ||||||||||
| CMA CGM S.A. | ||||||||||||
7.75%, 1/15/21(9) | EUR | 200 | 254,708 | |||||||||
5.25%, 1/15/25(9) | EUR | 185 | 205,217 | |||||||||
| DAE Funding, LLC | ||||||||||||
4.50%, 8/1/22(8) | 1,050 | 998,813 | ||||||||||
5.00%, 8/1/24(8) | 1,745 | 1,655,569 | ||||||||||
| Debt and Asset Trading Corp. | ||||||||||||
1.00%, 10/10/25(9) | 2,600 | 1,837,927 | ||||||||||
| Dubai DOF Sukuk, Ltd. | ||||||||||||
3.875%, 1/30/23(9) | 2,000 | 2,021,940 | ||||||||||
| Flexi-Van Leasing, Inc. | ||||||||||||
10.00%, 2/15/23(8) | 2,015 | 2,004,925 | ||||||||||
| Hertz Corp. (The) | ||||||||||||
6.25%, 10/15/22 | 435 | 409,988 | ||||||||||
5.50%, 10/15/24(8) | 635 | 539,750 | ||||||||||
| Moto Finance PLC | ||||||||||||
4.50%, 10/1/22(9) | GBP | 250 | 353,118 | |||||||||
| Park Aerospace Holdings, Ltd. | ||||||||||||
5.25%, 8/15/22(8) | 2,990 | 2,940,515 | ||||||||||
5.50%, 2/15/24(8) | 1,333 | 1,296,342 | ||||||||||
| XPO Logistics, Inc. | ||||||||||||
6.50%, 6/15/22(8) | 3,035 | 3,141,225 | ||||||||||
6.125%, 9/1/23(8) | 705 | 730,556 | ||||||||||
| $ | 19,022,552 | |||||||||||
| Technology — 0.6% | ||||||||||||
| Abengoa Finance S.A. | ||||||||||||
7.50%, 3/31/27(5)(8) | 1,125 | $ | 16,875 | |||||||||
| Dell International, LLC/EMC Corp. | ||||||||||||
5.875%, 6/15/21(8) | 100 | 102,625 | ||||||||||
7.125%, 6/15/24(8) | 2,440 | 2,607,064 | ||||||||||
6.02%, 6/15/26(8) | 1,945 | 2,096,773 | ||||||||||
| Exela Intermediate, LLC/Exela Finance, Inc. | ||||||||||||
10.00%, 7/15/23(8) | 1,380 | 1,402,425 | ||||||||||
| Security | Principal Amount* (000’s omitted) | Value | ||||||||||
| Technology (continued) | ||||||||||||
| International Game Technology PLC | ||||||||||||
6.50%, 2/15/25(8) | 720 | $ | 774,900 | |||||||||
| Israel Electric Corp., Ltd. | ||||||||||||
5.00%, 11/12/24(8)(9) | 1,800 | 1,877,562 | ||||||||||
| Safari Holding Verwaltungs GmbH | ||||||||||||
5.375%, 11/30/22(9) | EUR | 250 | 311,036 | |||||||||
| Western Union Co. (The) | ||||||||||||
6.20%, 11/17/36 | 637 | 668,426 | ||||||||||
| $ | 9,857,686 | |||||||||||
| Telecommunications — 4.3% | ||||||||||||
| Altice Financing S.A. | ||||||||||||
6.625%, 2/15/23(8) | 865 | $ | 858,513 | |||||||||
| Altice Luxembourg S.A. | ||||||||||||
7.25%, 5/15/22(9) | EUR | 304 | 364,277 | |||||||||
7.75%, 5/15/22(8) | 2,860 | 2,663,375 | ||||||||||
7.625%, 2/15/25(8) | 1,290 | 1,107,788 | ||||||||||
| AT&T, Inc. | ||||||||||||
4.75%, 5/15/46 | 1,400 | 1,362,628 | ||||||||||
| CenturyLink, Inc. | ||||||||||||
5.80%, 3/15/22 | 210 | 206,063 | ||||||||||
6.75%, 12/1/23 | 1,695 | 1,656,862 | ||||||||||
7.50%, 4/1/24 | 420 | 424,200 | ||||||||||
| CommScope Technologies, LLC | ||||||||||||
6.00%, 6/15/25(8) | 2,315 | 2,420,332 | ||||||||||
5.00%, 3/15/27(8) | 2,975 | 2,833,687 | ||||||||||
| Digicel, Ltd. | ||||||||||||
6.00%, 4/15/21(8) | 2,305 | 2,172,462 | ||||||||||
| Equinix, Inc. | ||||||||||||
5.875%, 1/15/26 | 2,725 | 2,847,625 | ||||||||||
2.875%, 2/1/26 | EUR | 440 | 516,477 | |||||||||
5.375%, 5/15/27 | 1,010 | 1,027,675 | ||||||||||
| Frontier Communications Corp. | ||||||||||||
10.50%, 9/15/22 | 815 | 685,684 | ||||||||||
7.625%, 4/15/24 | 285 | 179,550 | ||||||||||
6.875%, 1/15/25 | 1,845 | 1,100,081 | ||||||||||
| Hughes Satellite Systems Corp. | ||||||||||||
6.50%, 6/15/19 | 2,912 | 3,010,280 | ||||||||||
5.25%, 8/1/26 | 1,245 | 1,224,769 | ||||||||||
6.625%, 8/1/26 | 1,490 | 1,493,725 | ||||||||||
| Intelsat Jackson Holdings S.A. | ||||||||||||
7.25%, 10/15/20 | 2,735 | 2,543,550 | ||||||||||
7.50%, 4/1/21 | 220 | 200,200 | ||||||||||
5.50%, 8/1/23 | 1,525 | 1,239,063 | ||||||||||
8.00%, 2/15/24(8) | 490 | 516,338 | ||||||||||
| 36 | See Notes to Financial Statements. |
Eaton Vance
Limited Duration Income Fund
March 31, 2018
Portfolio of Investments — continued
| Security | Principal Amount* (000’s omitted) | Value | ||||||||||
| Telecommunications (continued) | ||||||||||||
| Level 3 Financing, Inc. | ||||||||||||
5.375%, 1/15/24 | 1,000 | $ | 976,880 | |||||||||
| Level 3 Parent, LLC | ||||||||||||
5.75%, 12/1/22 | 330 | 330,620 | ||||||||||
| Matterhorn Telecom SA | ||||||||||||
3.875%, 5/1/22(9) | EUR | 250 | 311,050 | |||||||||
| Nokia OYJ | ||||||||||||
4.375%, 6/12/27 | 1,025 | 964,781 | ||||||||||
| Qualitytech, L.P./QTS Finance Corp. | ||||||||||||
4.75%, 11/15/25(8) | 795 | 749,288 | ||||||||||
| SBA Communications Corp. | ||||||||||||
4.00%, 10/1/22(8) | 1,020 | 981,750 | ||||||||||
4.875%, 9/1/24 | 460 | 452,525 | ||||||||||
| Sprint Capital Corp. | ||||||||||||
6.875%, 11/15/28 | 990 | 926,888 | ||||||||||
| Sprint Communications, Inc. | ||||||||||||
9.00%, 11/15/18(8) | 5,014 | 5,176,955 | ||||||||||
7.00%, 8/15/20 | 3,605 | 3,758,212 | ||||||||||
6.00%, 11/15/22 | 365 | 359,069 | ||||||||||
| Sprint Corp. | ||||||||||||
7.25%, 9/15/21 | 3,265 | 3,383,356 | ||||||||||
7.875%, 9/15/23 | 10,250 | 10,493,437 | ||||||||||
7.625%, 2/15/25 | 1,785 | 1,760,456 | ||||||||||
7.625%, 3/1/26 | 1,360 | 1,331,100 | ||||||||||
| T-Mobile USA, Inc. | ||||||||||||
6.375%, 3/1/25 | 1,395 | 1,461,263 | ||||||||||
6.50%, 1/15/26 | 595 | 633,675 | ||||||||||
4.50%, 2/1/26 | 980 | 942,025 | ||||||||||
4.75%, 2/1/28 | 445 | 428,313 | ||||||||||
| TalkTalk Telecom Group PLC | ||||||||||||
5.375%, 1/15/22(9) | GBP | 250 | 348,516 | |||||||||
| Wind Tre SpA | ||||||||||||
2.75%, (3 mo. EURIBOR + 2.75%), 1/20/24(8)(13) | EUR | 650 | 739,480 | |||||||||
| Zayo Group, LLC/Zayo Capital, Inc. | ||||||||||||
6.375%, 5/15/25 | 1,700 | 1,765,875 | ||||||||||
5.75%, 1/15/27(8) | 3,325 | 3,254,344 | ||||||||||
| $ | 74,185,062 | |||||||||||
| Transportation — 0.1% | ||||||||||||
| A.P. Moller – Maersk A/S | ||||||||||||
3.75%, 9/22/24(8) | 1,025 | $ | 1,008,157 | |||||||||
| JSL Europe S.A. | ||||||||||||
7.75%, 7/26/24(8) | 1,000 | 1,018,750 | ||||||||||
| $ | 2,026,907 | |||||||||||
| Security | Principal Amount* (000’s omitted) | Value | ||||||||||
| Utilities — 1.5% | ||||||||||||
| AES Corp. (The) | ||||||||||||
4.00%, 3/15/21 | 1,060 | $ | 1,066,625 | |||||||||
5.50%, 4/15/25 | 309 | 320,974 | ||||||||||
6.00%, 5/15/26 | 1,655 | 1,750,162 | ||||||||||
5.125%, 9/1/27 | 165 | 168,300 | ||||||||||
| Calpine Corp. | ||||||||||||
5.50%, 2/1/24 | 285 | 260,419 | ||||||||||
5.75%, 1/15/25 | 2,285 | 2,096,487 | ||||||||||
5.25%, 6/1/26(8) | 1,040 | 1,007,500 | ||||||||||
| Dynegy, Inc. | ||||||||||||
7.375%, 11/1/22 | 1,130 | 1,193,562 | ||||||||||
7.625%, 11/1/24 | 1,733 | 1,878,139 | ||||||||||
8.00%, 1/15/25(8) | 770 | 841,225 | ||||||||||
8.125%, 1/30/26(8) | 2,315 | 2,563,862 | ||||||||||
| ITC Holdings Corp. | ||||||||||||
5.30%, 7/1/43 | 660 | 747,909 | ||||||||||
| Kansas City Power & Light Co. | ||||||||||||
4.20%, 6/15/47 |
| 750 | 752,398 | |||||||||
| NextEra Energy Operating Partners, L.P. | ||||||||||||
4.25%, 9/15/24(8) |
| 660 | 641,850 | |||||||||
| NRG Energy, Inc. | ||||||||||||
7.25%, 5/15/26 |
| 3,000 | 3,195,000 | |||||||||
5.75%, 1/15/28(8) |
| 1,455 | 1,425,900 | |||||||||
| Pattern Energy Group, Inc. | ||||||||||||
5.875%, 2/1/24(8) |
| 970 | 996,675 | |||||||||
| Southern Co. (The) | ||||||||||||
3.25%, 7/1/26 |
| 1,000 | 951,330 | |||||||||
| Southwestern Electric Power Co. | ||||||||||||
6.20%, 3/15/40 |
| 696 | 885,921 | |||||||||
| TerraForm Power Operating, LLC | ||||||||||||
4.25%, 1/31/23(8) |
| 655 | 631,256 | |||||||||
6.625%, 6/15/25(8) |
| 580 | 625,675 | |||||||||
5.00%, 1/31/28(8) |
| 985 | 938,213 | |||||||||
| Thames Water Kemble Finance PLC | ||||||||||||
5.875%, 7/15/22(9) | GBP | 450 | 689,127 | |||||||||
| $ | 25,628,509 | |||||||||||
Total Corporate Bonds & Notes | $ | 879,255,634 | ||||||||||
| 37 | See Notes to Financial Statements. |
Eaton Vance
Limited Duration Income Fund
March 31, 2018
Portfolio of Investments — continued
| Foreign Corporate Bonds — 0.1% | ||||||||||||
| Security | Principal Amount* (000’s omitted) | Value | ||||||||||
Export-Import Bank of India, 3.375%, 8/5/26(9) | 1,700 | $ | 1,603,226 | |||||||||
| $ | 1,603,226 | |||||||||||
Total Foreign Corporate Bonds |
| $ | 1,603,226 | |||||||||
| Foreign Government Securities — 4.9% | ||||||||||||
| Security | Principal Amount* (000’s omitted) | Value | ||||||||||
| Albania — 0.2% | ||||||||||||
| Republic of Albania | ||||||||||||
5.75%, 11/12/20(9) | EUR | 2,820 | $ | 3,881,915 | ||||||||
Total Albania | $ | 3,881,915 | ||||||||||
| Argentina — 0.0%(15) | ||||||||||||
| Republic of Argentina | ||||||||||||
3.875%, 1/15/22(9) | EUR | 425 | $ | 538,180 | ||||||||
Total Argentina | $ | 538,180 | ||||||||||
| Armenia — 0.2% | ||||||||||||
| Republic of Armenia | ||||||||||||
6.00%, 9/30/20(9) | 700 | $ | 726,460 | |||||||||
7.15%, 3/26/25(9) | 1,675 | 1,854,610 | ||||||||||
Total Armenia | $ | 2,581,070 | ||||||||||
| Barbados — 0.2% | ||||||||||||
| Barbados Government International Bond | ||||||||||||
6.625%, 12/5/35(9) | 2,300 | $ | 1,702,000 | |||||||||
7.00%, 8/4/22(9) | 712 | 606,517 | ||||||||||
7.25%, 12/15/21(9) | 892 | 776,040 | ||||||||||
Total Barbados | $ | 3,084,557 | ||||||||||
| Belarus — 0.1% | ||||||||||||
| Republic of Belarus | ||||||||||||
6.20%, 2/28/30(9) | 254 | $ | 253,047 | |||||||||
6.875%, 2/28/23(9) | 500 | 530,904 | ||||||||||
7.625%, 6/29/27(9) | 500 | 551,587 | ||||||||||
Total Belarus | $ | 1,335,538 | ||||||||||
| Security | Principal Amount* (000’s omitted) | Value | ||||||||||
| Colombia — 0.1% | ||||||||||||
| Republic of Colombia | ||||||||||||
2.625%, 3/15/23 | 2,250 | $ | 2,155,219 | |||||||||
Total Colombia | $ | 2,155,219 | ||||||||||
| Croatia — 0.1% | ||||||||||||
| Croatia | ||||||||||||
3.875%, 5/30/22(9) | EUR | 1,601 | $ | 2,191,569 | ||||||||
Total Croatia | $ | 2,191,569 | ||||||||||
| Cyprus — 0.2% | ||||||||||||
| Republic of Cyprus | ||||||||||||
3.75%, 7/26/23(9) | EUR | 57 | $ | 78,850 | ||||||||
4.25%, 11/4/25(9) | EUR | 2,143 | 3,085,831 | |||||||||
Total Cyprus | $ | 3,164,681 | ||||||||||
| Dominican Republic — 0.2% | ||||||||||||
| Dominican Republic International Bond | ||||||||||||
8.625%, 4/20/27(9) | 2,671 | $ | 3,171,812 | |||||||||
Total Dominican Republic | $ | 3,171,812 | ||||||||||
| Ecuador — 0.0%(15) | ||||||||||||
| Republic of Ecuador | ||||||||||||
10.75%, 3/28/22(9) | 325 | $ | 356,769 | |||||||||
Total Ecuador | $ | 356,769 | ||||||||||
| Egypt — 0.1% | ||||||||||||
| Egypt Government International Bond | ||||||||||||
6.125%, 1/31/22(9) | 1,000 | $ | 1,036,614 | |||||||||
Total Egypt | $ | 1,036,614 | ||||||||||
| El Salvador — 0.3% | ||||||||||||
| Republic of El Salvador | ||||||||||||
7.375%, 12/1/19(9) | 1,210 | $ | 1,263,095 | |||||||||
7.75%, 1/24/23(9) | 1,800 | 1,968,516 | ||||||||||
8.25%, 4/10/32(9) | 1,001 | 1,126,896 | ||||||||||
8.625%, 2/28/29(9) | 1,039 | 1,194,850 | ||||||||||
Total El Salvador | $ | 5,553,357 | ||||||||||
| Fiji — 0.1% | ||||||||||||
| Republic of Fiji | ||||||||||||
6.625%, 10/2/20(9) | 2,443 | $ | 2,467,801 | |||||||||
Total Fiji | $ | 2,467,801 | ||||||||||
| 38 | See Notes to Financial Statements. |
Eaton Vance
Limited Duration Income Fund
March 31, 2018
Portfolio of Investments — continued
| Security | Principal Amount* (000’s omitted) | Value | ||||||||||
| Georgia — 0.1% | ||||||||||||
| Republic of Georgia | ||||||||||||
6.875%, 4/12/21(9) | 939 | $ | 1,016,590 | |||||||||
Total Georgia | $ | 1,016,590 | ||||||||||
| Greece — 0.0%(15) | ||||||||||||
| Hellenic Republic Government Bond | ||||||||||||
3.50%, 1/30/23(9) | EUR | 380 | $ | 470,194 | ||||||||
Total Greece | $ | 470,194 | ||||||||||
| Honduras — 0.3% | ||||||||||||
| Honduras Government International Bond | ||||||||||||
6.25%, 1/19/27(9) | 150 | $ | 159,295 | |||||||||
7.50%, 3/15/24(9) | 400 | 442,732 | ||||||||||
8.75%, 12/16/20(9) | 3,323 | 3,684,011 | ||||||||||
Total Honduras | $ | 4,286,038 | ||||||||||
| Hungary — 0.1% | ||||||||||||
| Hungary Government Bond | ||||||||||||
5.75%, 11/22/23 | 820 | $ | 907,371 | |||||||||
Total Hungary | $ | 907,371 | ||||||||||
| Indonesia — 0.1% | ||||||||||||
| Republic of Indonesia | ||||||||||||
2.15%, 7/18/24(9) | EUR | 280 | $ | 355,637 | ||||||||
2.625%, 6/14/23(9) | EUR | 850 | 1,112,818 | |||||||||
3.70%, 1/8/22(9) | 650 | 652,970 | ||||||||||
Total Indonesia | $ | 2,121,425 | ||||||||||
| Ivory Coast — 0.0%(15) | ||||||||||||
| Ivory Coast | ||||||||||||
5.125%, 6/15/25(9) | EUR | 435 | $ | 561,786 | ||||||||
Total Ivory Coast | $ | 561,786 | ||||||||||
| Lebanon — 0.1% | ||||||||||||
| Lebanese Republic | ||||||||||||
5.15%, 11/12/18(9) | 2,200 | $ | 2,203,366 | |||||||||
Total Lebanon | $ | 2,203,366 | ||||||||||
| Macedonia — 0.3% | ||||||||||||
| Republic of Macedonia | ||||||||||||
2.75%, 1/18/25(9) | EUR | 110 | $ | 135,547 | ||||||||
3.975%, 7/24/21(9) | EUR | 2,914 | 3,856,919 | |||||||||
| Security | Principal Amount* (000’s omitted) | Value | ||||||||||
| Macedonia (continued) | ||||||||||||
| Republic of Macedonia (continued) | ||||||||||||
4.875%, 12/1/20(9) | EUR | 788 | $ | 1,064,305 | ||||||||
Total Macedonia | $ | 5,056,771 | ||||||||||
| Mexico — 0.3% | ||||||||||||
| United Mexican States | ||||||||||||
3.625%, 3/15/22 | 1,632 | $ | 1,662,094 | |||||||||
4.125%, 1/21/26 | 1,785 | 1,812,221 | ||||||||||
4.15%, 3/28/27 | 1,850 | 1,872,663 | ||||||||||
Total Mexico | $ | 5,346,978 | ||||||||||
| Nigeria — 0.0%(15) | ||||||||||||
| Republic of Nigeria | ||||||||||||
6.75%, 1/28/21(9) | 550 | $ | 580,359 | |||||||||
Total Nigeria | $ | 580,359 | ||||||||||
| Peru — 0.1% | ||||||||||||
| Republic of Peru | ||||||||||||
7.35%, 7/21/25 | 1,700 | $ | 2,112,250 | |||||||||
Total Peru | $ | 2,112,250 | ||||||||||
| Poland — 0.1% | ||||||||||||
| Republic of Poland | ||||||||||||
4.00%, 1/22/24 | 890 | $ | 925,919 | |||||||||
Total Poland | $ | 925,919 | ||||||||||
| Romania — 0.1% | ||||||||||||
| Romania Government Bond | ||||||||||||
6.75%, 2/7/22(9) | 830 | $ | 923,408 | |||||||||
Total Romania | $ | 923,408 | ||||||||||
| Rwanda — 0.2% | ||||||||||||
| Republic of Rwanda | ||||||||||||
6.625%, 5/2/23(9) | 4,090 | $ | 4,236,115 | |||||||||
Total Rwanda | $ | 4,236,115 | ||||||||||
| Saudi Arabia — 0.1% | ||||||||||||
| Saudi Government International Bond | ||||||||||||
3.25%, 10/26/26(9) | 2,300 | $ | 2,157,761 | |||||||||
Total Saudi Arabia | $ | 2,157,761 | ||||||||||
| 39 | See Notes to Financial Statements. |
Eaton Vance
Limited Duration Income Fund
March 31, 2018
Portfolio of Investments — continued
| Security | Principal Amount* (000’s omitted) | Value | ||||||||||
| Senegal — 0.0%(15) | ||||||||||||
| Republic of Senegal | ||||||||||||
4.75%, 3/13/28(9) | EUR | 315 | $ | 388,012 | ||||||||
Total Senegal | $ | 388,012 | ||||||||||
| Serbia — 0.2% | ||||||||||||
| Republic of Serbia | ||||||||||||
4.875%, 2/25/20(9) | 2,615 | $ | 2,681,139 | |||||||||
5.875%, 12/3/18(9) | 980 | 999,188 | ||||||||||
Total Serbia | $ | 3,680,327 | ||||||||||
| Seychelles — 0.1% | ||||||||||||
| Republic of Seychelles | ||||||||||||
8.00%, 1/1/26(9) | 1,792 | $ | 1,878,458 | |||||||||
Total Seychelles | $ | 1,878,458 | ||||||||||
| Sri Lanka — 0.3% | ||||||||||||
| Republic of Sri Lanka | ||||||||||||
6.125%, 6/3/25(9) | 4,230 | $ | 4,228,215 | |||||||||
6.85%, 11/3/25(9) | 1,000 | 1,037,331 | ||||||||||
Total Sri Lanka | $ | 5,265,546 | ||||||||||
| Suriname — 0.1% | ||||||||||||
| Republic of Suriname | ||||||||||||
9.25%, 10/26/26(9) | 1,255 | $ | 1,292,650 | |||||||||
Total Suriname | $ | 1,292,650 | ||||||||||
| Turkey — 0.4% | ||||||||||||
| Republic of Turkey | ||||||||||||
5.625%, 3/30/21 | 2,380 | $ | 2,466,275 | |||||||||
6.25%, 9/26/22 | 1,230 | 1,304,725 | ||||||||||
7.00%, 6/5/20 | 2,390 | 2,535,826 | ||||||||||
Total Turkey | $ | 6,306,826 | ||||||||||
| Ukraine — 0.1% | ||||||||||||
| Ukraine Government International Bond | ||||||||||||
7.75%, 9/1/20(9) | 900 | $ | 946,125 | |||||||||
Total Ukraine | $ | 946,125 | ||||||||||
Total Foreign Government Securities |
| $ | 84,183,357 | |||||||||
| Sovereign Loans — 0.3% | ||||||||||||
| Borrower | Principal Amount (000’s omitted) | Value | ||||||||||
| Barbados — 0.1% | ||||||||||||
| Government of Barbados | ||||||||||||
Term Loan, 11.78%, (6 mo. USD LIBOR + 10.00%), Maturing December 20, 2019(13)(16) | $ | 1,200 | $ | 1,186,467 | ||||||||
Total Barbados | $ | 1,186,467 | ||||||||||
| Kenya — 0.0%(15) | ||||||||||||
| Government of Kenya | ||||||||||||
Term Loan, 6.53%, (6 mo. USD LIBOR + 5.00%), Maturing April 18, 2019(13) | $ | 200 | $ | 200,000 | ||||||||
Total Kenya | $ | 200,000 | ||||||||||
| Tanzania — 0.2% | ||||||||||||
| Government of the United Republic of Tanzania | ||||||||||||
Term Loan, 7.03%, (6 mo. USD LIBOR + 5.20%), Maturing June 23, 2022(13) | $ | 3,575 | $ | 3,629,297 | ||||||||
Total Tanzania | $ | 3,629,297 | ||||||||||
Total Sovereign Loans |
| $ | 5,015,764 | |||||||||
| Mortgage Pass-Throughs — 9.1% | ||||||||||||
| Security | Principal Amount (000’s omitted) | Value | ||||||||||
| Federal Home Loan Mortgage Corp.: | ||||||||||||
5.00%, with various maturities to 2019 | $ | 490 | $ | 493,733 | ||||||||
5.50%, with various maturities to 2032 | 703 | 763,648 | ||||||||||
6.00%, with maturity at 2021 | 23 | 23,655 | ||||||||||
6.50%, with various maturities to 2036 | 5,866 | 6,536,743 | ||||||||||
7.00%, with various maturities to 2036(17) | 5,794 | 6,525,730 | ||||||||||
7.13%, with maturity at 2023 | 85 | 89,744 | ||||||||||
7.50%, with various maturities to 2035 | 4,083 | 4,558,772 | ||||||||||
7.65%, with maturity at 2022 | 67 | 70,021 | ||||||||||
8.00%, with various maturities to 2034 | 2,050 | 2,258,360 | ||||||||||
8.25%, with maturity at 2020 | 15 | 14,972 | ||||||||||
8.30%, with maturity at 2020 | 107 | 108,639 | ||||||||||
8.50%, with various maturities to 2031 | 1,312 | 1,480,121 | ||||||||||
9.00%, with various maturities to 2031 | 199 | 217,485 | ||||||||||
9.50%, with various maturities to 2025 | 119 | 122,743 | ||||||||||
10.00%, with maturity at 2020 | 6 | 6,497 | ||||||||||
10.50%, with maturity at 2020 | 6 | 6,421 | ||||||||||
| $ | 23,277,284 | |||||||||||
| 40 | See Notes to Financial Statements. |
Eaton Vance
Limited Duration Income Fund
March 31, 2018
Portfolio of Investments — continued
| Security | Principal Amount (000’s omitted) | Value | ||||||||||
| Federal National Mortgage Association: | ||||||||||||
2.707%, (COF + 1.252%), with | $ | 1,067 | $ | 1,045,849 | ||||||||
3.083%, (6 mo. USD LIBOR + 1.54%), with maturity at 2037(18) | 1,883 | 1,962,458 | ||||||||||
3.299%, (1 yr. CMT + 2.25%), with | 107 | 107,828 | ||||||||||
3.367%, (1 yr. CMT + 2.254%), with | 10,795 | 11,397,692 | ||||||||||
4.50%, with maturity at 2042(17) | 9,537 | 10,080,434 | ||||||||||
5.00%, with various maturities to 2040(17) | 10,054 | 10,848,040 | ||||||||||
5.50%, with various maturities to 2033 | 1,078 | 1,183,954 | ||||||||||
6.00%, with various maturities to 2033 | 2,985 | 3,221,294 | ||||||||||
6.323%, (COF + 2.00%), with | 3,114 | 3,354,031 | ||||||||||
6.50%, with various maturities to 2036(17) | 24,151 | 26,958,484 | ||||||||||
6.75%, with maturity at 2023 | 58 | 61,585 | ||||||||||
7.00%, with various maturities to 2037 | 11,187 | 12,635,530 | ||||||||||
7.50%, with various maturities to 2035 | 4,755 | 5,408,237 | ||||||||||
7.90%, with maturity at 2027(19) | 313 | 348,763 | ||||||||||
8.00%, with various maturities to 2034 | 1,438 | 1,617,104 | ||||||||||
8.271%, with maturity at 2028(19) | 88 | 99,852 | ||||||||||
8.272%, with maturity at 2024(19) | 17 | 18,681 | ||||||||||
8.293%, with maturity at 2029(19) | 77 | 86,762 | ||||||||||
8.441%, with maturity at 2027(19) | 110 | 124,457 | ||||||||||
8.50%, with various maturities to 2037 | 1,267 | 1,425,999 | ||||||||||
9.00%, with various maturities to 2032 | 1,885 | 2,087,263 | ||||||||||
9.295%, with maturity at 2025(19) | 14 | 15,378 | ||||||||||
9.50%, with various maturities to 2030 | 668 | 731,725 | ||||||||||
10.00%, with various maturities to 2020 | 8 | 8,191 | ||||||||||
10.50%, with maturity at 2021 | 48 | 51,674 | ||||||||||
| $ | 94,881,265 | |||||||||||
| Government National Mortgage Association: | ||||||||||||
4.50%, with maturity at 2047(17) | $ | 11,097 | $ | 11,538,939 | ||||||||
5.00%, with maturity at 2047(17) | 9,534 | 10,032,304 | ||||||||||
6.00%, with maturity at 2024 | 542 | 578,488 | ||||||||||
6.50%, with maturity at 2024(17) | 3,078 | 3,321,594 | ||||||||||
7.00%, with maturity at 2026 | 250 | 279,202 | ||||||||||
7.50%, with various maturities to 2032(17) | 5,819 | 6,461,122 | ||||||||||
8.00%, with various maturities to 2034(17) | 3,632 | 4,160,736 | ||||||||||
8.30%, with maturity at 2020 | 33 | 34,023 | ||||||||||
8.50%, with maturity at 2022 | 147 | 158,323 | ||||||||||
9.00%, with various maturities to 2025 | 679 | 752,424 | ||||||||||
9.50%, with various maturities to 2021 | 268 | 282,477 | ||||||||||
| Security | Principal Amount (000’s omitted) | Value | ||||||||||
| Government National Mortgage Association: (continued) | ||||||||||||
10.00%, with maturity at 2019 | $ | 10 | $ | 10,679 | ||||||||
| $ | 37,610,311 | |||||||||||
Total Mortgage Pass-Throughs |
| $ | 155,768,860 | |||||||||
| Collateralized Mortgage Obligations — 27.4% | ||||||||||||
| Security | Principal Amount (000’s omitted) | Value | ||||||||||
| Federal Home Loan Mortgage Corp.: | ||||||||||||
Series 24, Class J, 6.25%, 11/25/23 | $ | 302 | $ | 321,385 | ||||||||
Series 1497, Class K, 7.00%, 4/15/23 | 266 | 285,883 | ||||||||||
Series 1529, Class Z, 7.00%, 6/15/23 | 387 | 416,627 | ||||||||||
Series 1620, Class Z, 6.00%, 11/15/23 | 314 | 333,567 | ||||||||||
Series 1677, Class Z, 7.50%, 7/15/23 | 220 | 239,719 | ||||||||||
Series 1702, Class PZ, 6.50%, 3/15/24 | 2,734 | 2,939,029 | ||||||||||
Series 2113, Class QG, 6.00%, 1/15/29 | 626 | 684,376 | ||||||||||
Series 2122, Class K, 6.00%, 2/15/29 | 117 | 127,008 | ||||||||||
Series 2130, Class K, 6.00%, 3/15/29 | 79 | 86,049 | ||||||||||
Series 2167, Class BZ, 7.00%, 6/15/29 | 87 | 96,642 | ||||||||||
Series 2182, Class ZB, 8.00%, 9/15/29 | 922 | 1,054,682 | ||||||||||
Series 2198, Class ZA, 8.50%, 11/15/29 | 1,093 | 1,253,465 | ||||||||||
Series 2245, Class A, 8.00%, 8/15/27 | 2,540 | 2,900,503 | ||||||||||
Series 2458, Class ZB, 7.00%, 6/15/32 | 948 | 1,080,954 | ||||||||||
Series 3762, Class SH, 6.672%, (10.00% - 1 mo. USD LIBOR x 2.00), 11/15/40(20) | 770 | 817,867 | ||||||||||
Series 4097, Class PE, 3.00%, 11/15/40 | 1,704 | 1,701,100 | ||||||||||
Series 4273, Class PU, 4.00%, 11/15/43 | 2,263 | 2,338,295 | ||||||||||
Series 4273, Class SP, 7.562%, (12.00% - 1 mo. USD LIBOR x 2.67), 11/15/43(20) | 503 | 577,138 | ||||||||||
Series 4337, Class YT, 3.50%, 4/15/49 | 6,525 | 6,468,452 | ||||||||||
Series 4407, Class LN, 5.443%, (9.32% - 1 mo. USD LIBOR x 2.33), 12/15/43(20) | 156 | 142,595 | ||||||||||
Series 4416, Class SU, 5.272%, (8.60% - 1 mo. USD LIBOR x 2.00), 12/15/44(20) | 4,785 | 4,057,512 | ||||||||||
Series 4452, Class ZJ, 3.00%, 11/15/44 | 2,954 | 2,622,727 | ||||||||||
Series 4584, Class PM, 3.00%, 5/15/46 | 6,418 | 6,437,091 | ||||||||||
Series 4594, Class FM, 2.664%, (1 mo. USD LIBOR + 1.00%), 6/15/46(13) | 730 | 736,803 | ||||||||||
Series 4608, Class TV, 3.50%, 1/15/55 | 9,049 | 8,930,171 | ||||||||||
Series 4616, Class EZ, 3.00%, 9/15/46 | 261 | 235,178 | ||||||||||
Series 4617, Class CZ, 3.50%, 5/15/46 | 2,667 | 2,558,812 | ||||||||||
Series 4630, Class CZ, 3.00%, 12/15/43 | 9,819 | 9,390,766 | ||||||||||
Series 4637, Class CU, 3.00%, 8/15/44 | 6,687 | 6,333,842 | ||||||||||
| 41 | See Notes to Financial Statements. |
Eaton Vance
Limited Duration Income Fund
March 31, 2018
Portfolio of Investments — continued
| Security | Principal Amount (000’s omitted) | Value | ||||||||
| Federal Home Loan Mortgage Corp.: (continued) | ||||||||||
Series 4637, Class QF, 2.664%, (1 mo. USD LIBOR + 1.00%), 4/15/44(13) | $ | 12,783 | $ | 12,841,929 | ||||||
Series 4639, Class KF, 2.964%, (1 mo. USD LIBOR + 1.30%), 12/15/44(13) | 4,789 | 4,862,929 | ||||||||
Series 4648, Class WF, 2.664%, (1 mo. USD LIBOR + 1.00%), 1/15/47(13) | 1,464 | 1,482,943 | ||||||||
Series 4677, Class SB, 9.343%, (16.00% - 1 mo. USD LIBOR x 4.00), | 3,560 | 3,625,016 | ||||||||
Series 4678, Class PC, 3.00%, 1/15/46 | 15,048 | 14,971,604 | ||||||||
Series 4695, Class CA, 3.00%, 10/15/41 | 5,276 | 4,935,292 | ||||||||
Series 4746, Class CZ, 4.00%, 11/15/47 | 1,913 | 1,889,682 | ||||||||
Series 4751, Class ZC, 4.00%, 11/15/47 | 8,853 | 8,784,187 | ||||||||
Series 4774, Class MH, 4.50%, 12/15/42 | 10,000 | 10,454,909 | ||||||||
Series 4774, Class QD, 4.50%, 1/15/43 | 25,000 | 26,130,809 | ||||||||
Series 4776, Class C, 4.50%, 3/15/43 | 10,000 | 10,456,444 | ||||||||
| Interest Only:(21) | ||||||||||
Series 267, Class S5, 4.223%, (6.00% - 1 mo. USD LIBOR), 8/15/42(20) | 8,378 | 1,317,090 | ||||||||
Series 284, Class S6, 4.323%, (6.10% - 1 mo. USD LIBOR), 10/15/42(20) | 4,593 | 756,121 | ||||||||
Series 3727, Class PS, 4.923%, (6.70% - 1 mo. USD LIBOR), 11/15/38(20) | 932 | 13,113 | ||||||||
Series 3973, Class SG, 4.873%, (6.65% - 1 mo. USD LIBOR), 4/15/30(20) | 3,323 | 253,479 | ||||||||
Series 4067, Class JI, 3.50%, 6/15/27 | 4,799 | 506,978 | ||||||||
Series 4070, Class S, 4.323%, (6.10% - 1 mo. USD LIBOR), 6/15/32(20) | 9,317 | 1,339,077 | ||||||||
Series 4088, Class EI, 3.50%, 9/15/41 | 11,708 | 1,846,642 | ||||||||
Series 4094, Class CS, 4.223%, (6.00% - 1 mo. USD LIBOR), 8/15/42(20) | 4,547 | 795,936 | ||||||||
Series 4095, Class HS, 4.323%, (6.10% - 1 mo. USD LIBOR), 7/15/32(20) | 3,235 | 400,221 | ||||||||
Series 4109, Class ES, 4.373%, (6.15% - 1 mo. USD LIBOR), 12/15/41(20) | 91 | 14,814 | ||||||||
Series 4109, Class KS, 4.323%, (6.10% - 1 mo. USD LIBOR), 5/15/32(20) | 1,263 | 52,641 | ||||||||
Series 4110, Class SA, 3.873%, (5.65% - 1 mo. USD LIBOR), 9/15/42(20) | 5,801 | 749,467 | ||||||||
Series 4149, Class S, 4.473%, (6.25% - 1 mo. USD LIBOR), 1/15/33(20) | 4,609 | 699,054 | ||||||||
Series 4186, Class IQ, 4.00%, 12/15/28 | 823 | 8,852 | ||||||||
Series 4188, Class AI, 3.50%, 4/15/28 | 3,346 | 306,932 | ||||||||
Series 4203, Class QS, 4.473%, (6.25% - 1 mo. USD LIBOR), 5/15/43(20) | 8,764 | 1,172,556 | ||||||||
Series 4233, Class GI, 3.50%, 3/15/25 | 1,291 | 23,914 | ||||||||
Series 4408, Class IP, 3.50%, 4/15/44 | 7,522 | 1,396,375 | ||||||||
Series 4435, Class BI, 3.50%, 7/15/44 | 17,455 | 3,160,405 | ||||||||
Series 4629, Class QI, 3.50%, 11/15/46 | 9,033 | 1,546,612 | ||||||||
| Security | Principal Amount (000’s omitted) | Value | ||||||||
| Federal Home Loan Mortgage Corp.: (continued) | ||||||||||
| Interest Only:(21) (continued) | ||||||||||
Series 4644, Class TI, 3.50%, 1/15/45 | $ | 9,731 | $ | 1,726,431 | ||||||
Series 4653, Class PI, 3.50%, 7/15/44 | 5,061 | 766,237 | ||||||||
Series 4667, Class PI, 3.50%, 5/15/42 | 12,217 | 1,888,233 | ||||||||
Series 4676, Class DI, 4.00%, 7/15/44 | 20,525 | 3,288,880 | ||||||||
Series 4744, Class IO, 4.00%, 11/15/47 | 12,513 | 2,653,025 | ||||||||
Series 4749, Class IL, 4.00%, 12/15/47 | 5,891 | 1,365,824 | ||||||||
Series 4767, Class IM, 4.00%, 5/15/45 | 9,944 | 1,639,909 | ||||||||
| Principal Only:(22) | ||||||||||
Series 242, Class PO, 0.00%, 11/15/36 | 5,657 | 4,990,189 | ||||||||
Series 259, Class PO, 0.00%, 4/15/39 | 3,434 | 3,078,423 | ||||||||
Series 3606, Class PO, 0.00%, 12/15/39 | 3,750 | 3,200,878 | ||||||||
Series 4417, Class KO, 0.00%, 12/15/43 | 562 | 352,540 | ||||||||
Series 4478, Class PO, 0.00%, 5/15/45 | 2,876 | 2,365,606 | ||||||||
Series 4754, Class JO, 0.00%, 4/15/44 | 2,394 | 1,713,145 | ||||||||
| $ | 210,993,581 | |||||||||
| Federal Home Loan Mortgage Corp. Structured Agency Credit Risk Debt Notes: | ||||||||||
Series 2016-DNA2, Class M3, 6.522%, (1 mo. USD LIBOR + 4.65%), | $ | 6,250 | $ | 7,176,294 | ||||||
Series 2017-DNA2, Class M2, 5.322%, (1 mo. USD LIBOR + 3.45%), | 3,000 | 3,268,026 | ||||||||
| $ | 10,444,320 | |||||||||
| Federal National Mortgage Association: | ||||||||||
Series G92-44, Class Z, 8.00%, 7/25/22 | $ | 1 | $ | 1,060 | ||||||
Series G92-44, Class ZQ, 8.00%, 7/25/22 | 2 | 1,724 | ||||||||
Series G92-46, Class Z, 7.00%, 8/25/22 | 124 | 132,050 | ||||||||
Series G92-60, Class Z, 7.00%, 10/25/22 | 174 | 185,617 | ||||||||
Series G93-35, Class ZQ, 6.50%, 11/25/23 | 3,715 | 3,973,295 | ||||||||
Series G93-40, Class H, 6.40%, 12/25/23 | 779 | 832,660 | ||||||||
Series 1989-34, Class Y, 9.85%, 7/25/19 | 20 | 20,971 | ||||||||
Series 1990-17, Class G, 9.00%, 2/25/20 | 16 | 16,309 | ||||||||
Series 1990-27, Class Z, 9.00%, 3/25/20 | 14 | 14,576 | ||||||||
Series 1990-29, Class J, 9.00%, 3/25/20 | 16 | 16,408 | ||||||||
Series 1990-43, Class Z, 9.50%, 4/25/20 | 62 | 64,580 | ||||||||
Series 1991-98, Class J, 8.00%, 8/25/21 | 55 | 59,221 | ||||||||
Series 1992-77, Class ZA, 8.00%, 5/25/22 | 286 | 307,013 | ||||||||
Series 1992-103, Class Z, 7.50%, 6/25/22 | 21 | 22,113 | ||||||||
Series 1992-113, Class Z, 7.50%, 7/25/22 | 49 | 52,512 | ||||||||
Series 1992-185, Class ZB, 7.00%, 10/25/22 | 81 | 86,252 | ||||||||
Series 1993-16, Class Z, 7.50%, 2/25/23 | 202 | 218,466 | ||||||||
Series 1993-22, Class PM, 7.40%, 2/25/23 | 178 | 192,169 | ||||||||
Series 1993-25, Class J, 7.50%, 3/25/23 | 239 | 258,570 | ||||||||
Series 1993-30, Class PZ, 7.50%, 3/25/23 | 429 | 463,599 | ||||||||
Series 1993-42, Class ZQ, 6.75%, 4/25/23 | 609 | 651,804 | ||||||||
Series 1993-56, Class PZ, 7.00%, 5/25/23 | 90 | 96,568 | ||||||||
| 42 | See Notes to Financial Statements. |
Eaton Vance
Limited Duration Income Fund
March 31, 2018
Portfolio of Investments — continued
| Security | Principal Amount (000’s omitted) | Value | ||||||||
| Federal National Mortgage Association: (continued) | ||||||||||
Series 1993-156, Class ZB, | $ | 106 | $ | 114,801 | ||||||
Series 1994-45, Class Z, 6.50%, 2/25/24 | 767 | 820,137 | ||||||||
Series 1994-89, Class ZQ, | 504 | 558,621 | ||||||||
Series 1996-57, Class Z, | 511 | 562,984 | ||||||||
Series 1997-77, Class Z, | 259 | 288,850 | ||||||||
Series 1998-44, Class ZA, | 265 | 291,644 | ||||||||
Series 1999-45, Class ZG, | 76 | 83,455 | ||||||||
Series 2000-22, Class PN, | 896 | 978,445 | ||||||||
Series 2002-1, Class G, 7.00%, 7/25/23 | 133 | 143,140 | ||||||||
Series 2002-21, Class PE, | 639 | 715,271 | ||||||||
Series 2005-75, Class CS, 16.714%, (24.20% - 1 mo. USD LIBOR x 4.00), 9/25/35(20) | 948 | 1,584,678 | ||||||||
Series 2007-74, Class AC, | 6,780 | 7,187,084 | ||||||||
Series 2011-49, Class NT, 6.00%, (66.00% - 1 mo. USD LIBOR x 10.00, Cap 6.00%), 6/25/41(20) | 766 | 826,118 | ||||||||
Series 2011-109, Class PE, | 4,434 | 4,386,479 | ||||||||
Series 2012-134, Class ZT, | 3,904 | 3,190,156 | ||||||||
Series 2013-6, Class TA, 1.50%, 1/25/43 | 5,966 | 5,742,381 | ||||||||
Series 2013-52, Class MD, | 6,327 | 5,723,067 | ||||||||
Series 2013-67, Class NF, 2.872%, (1 mo. USD LIBOR + 1.00%), 7/25/43(13) | 2,784 | 2,783,297 | ||||||||
Series 2014-35, Class CF, 2.222%, (1 mo. USD LIBOR + 0.35%), 6/25/44(13) | 5,451 | 5,445,604 | ||||||||
Series 2014-64, Class PA, | 5,248 | 5,216,409 | ||||||||
Series 2015-89, Class ZB, | 515 | 513,622 | ||||||||
Series 2016-22, Class ZE, | 765 | 683,119 | ||||||||
Series 2017-13, Class KF, 2.664%, (1 mo. USD LIBOR + 1.00%), 2/25/47(13) | 1,765 | 1,784,251 | ||||||||
Series 2017-15, Class LE, | 17,396 | 17,240,865 | ||||||||
Series 2017-39, Class JZ, 3.00%, 5/25/47 | 1,389 | 1,312,701 | ||||||||
Series 2017-48, Class LG, 2.75%, 5/25/47 | 9,281 | 9,046,196 | ||||||||
Series 2017-66, Class ZJ, 3.00%, 9/25/57 | 3,766 | 3,408,837 | ||||||||
Series 2017-75, Class Z, 3.00%, 9/25/57 | 2,539 | 2,300,116 | ||||||||
Series 2017-76, Class Z, 3.00%, 10/25/57 | 3,615 | 3,367,016 | ||||||||
Series 2017-96, Class Z, 3.00%, 12/25/57 | 9,886 | 9,304,740 | ||||||||
Series 2017-110, Class Z, 3.00%, 2/25/57 | 8,411 | 7,872,074 | ||||||||
Series 2018-18, Class QD, 4.50%, 5/25/45 | 40,983 | 42,959,370 | ||||||||
| Interest Only:(21) | ||||||||||
Series 2010-99, Class NS, 4.729%, (6.60% - 1 mo. USD LIBOR), 3/25/39(20) | 1,999 | 96,925 | ||||||||
Series 2010-124, Class SJ, 4.179%, (6.05% - 1 mo. USD LIBOR), 11/25/38(20) | 2,798 | 164,855 | ||||||||
Series 2011-45, Class SA, 4.779%, (6.65% - 1 mo. USD LIBOR), 1/25/29(20) | 885 | 16,519 | ||||||||
Series 2011-101, Class IC, 3.50%, 10/25/26 | 11,629 | 1,038,862 | ||||||||
Series 2011-101, Class IE, 3.50%, 10/25/26 | 3,808 | 341,497 | ||||||||
| Security | Principal Amount (000’s omitted) | Value | ||||||||
| Federal National Mortgage Association: (continued) | ||||||||||
| Interest Only:(21) (continued) | ||||||||||
Series 2012-24, Class S, 3.629%, (5.50% - 1 mo. USD LIBOR), 5/25/30(20) | $ | 2,652 | $ | 175,376 | ||||||
Series 2012-33, Class CI, 3.50%, 3/25/27 | 6,558 | 613,558 | ||||||||
Series 2012-56, Class SU, 4.879%, (6.75% - 1 mo. USD LIBOR), 8/25/26(20) | 1,423 | 64,489 | ||||||||
Series 2012-94, Class KS, 4.779%, (6.65% - 1 mo. USD LIBOR), 5/25/38(20) | 7,128 | 883,945 | ||||||||
Series 2012-97, Class PS, 4.279%, (6.15% - 1 mo. USD LIBOR), 3/25/41(20) | 8,751 | 1,279,037 | ||||||||
Series 2012-103, Class GS, 4.229%, (6.10% - 1 mo. USD LIBOR), 2/25/40(20) | 6,938 | 561,863 | ||||||||
Series 2012-118, Class IN, 3.50%, 11/25/42 | 10,843 | 2,125,760 | ||||||||
Series 2012-124, Class IO, 1.352%, 11/25/42(19) | 7,391 | 314,381 | ||||||||
Series 2012-150, Class SK, 4.279%, (6.15% - 1 mo. USD LIBOR), 1/25/43(20) | 6,237 | 869,625 | ||||||||
Series 2013-12, Class SP, 3.779%, (5.65% - 1 mo. USD LIBOR), 11/25/41(20) | 3,197 | 357,175 | ||||||||
Series 2013-15, Class DS, 4.329%, (6.20% - 1 mo. USD LIBOR), 3/25/33(20) | 12,652 | 1,771,245 | ||||||||
Series 2013-16, Class SY, 4.279%, (6.15% - 1 mo. USD LIBOR), 3/25/43(20) | 2,863 | 418,151 | ||||||||
Series 2013-54, Class HS, 4.429%, (6.30% - 1 mo. USD LIBOR), 10/25/41(20) | 4,035 | 386,189 | ||||||||
Series 2013-64, Class PS, 4.379%, (6.25% - 1 mo. USD LIBOR), 4/25/43(20) | 4,895 | 642,720 | ||||||||
Series 2013-75, Class SC, 4.379%, (6.25% - 1 mo. USD LIBOR), 7/25/42(20) | 11,700 | 1,119,978 | ||||||||
Series 2014-32, Class EI, 4.00%, 6/25/44 | 1,780 | 378,203 | ||||||||
Series 2014-55, Class IN, 3.50%, 7/25/44 | 4,847 | 797,775 | ||||||||
Series 2014-89, Class IO, 3.50%, 1/25/45 | 6,002 | 1,126,126 | ||||||||
Series 2015-17, Class SA, 4.329%, (6.20% - 1 mo. USD LIBOR), 11/25/43(20) | 6,705 | 1,033,404 | ||||||||
Series 2015-52, Class MI, 3.50%, 7/25/45 | 5,346 | 915,255 | ||||||||
Series 2015-95, Class SB, 4.129%, (6.00% - 1 mo. USD LIBOR), 1/25/46(20) | 16,460 | 2,675,129 | ||||||||
Series 2016-1, Class SJ, 4.279%, (6.15% - 1 mo. USD LIBOR), 2/25/46(20) | 24,654 | 4,439,997 | ||||||||
Series 2017-46, Class NI, 3.00%, 8/25/42 | 13,475 | 1,935,227 | ||||||||
| Principal Only:(22) | ||||||||||
Series 379, Class 1, 0.00%, 5/25/37 | 3,758 | 3,305,875 | ||||||||
Series 2006-8, Class WQ, 0.00%, 3/25/36 | 5,134 | 4,409,910 | ||||||||
| $ | 188,362,116 | |||||||||
| Federal National Mortgage Association Connecticut Avenue Securities: | ||||||||||
Series 2017-C01, Class 1B1, 7.622%, (1 mo. USD LIBOR + 5.75%), 7/25/29(13) | $ | 4,500 | $ | 5,245,984 | ||||||
| 43 | See Notes to Financial Statements. |
Eaton Vance
Limited Duration Income Fund
March 31, 2018
Portfolio of Investments — continued
| Security | Principal Amount (000’s omitted) | Value | ||||||||
| Federal National Mortgage Association Connecticut Avenue Securities: (continued) | ||||||||||
Series 2017-C03, Class 1B1, 6.722%, (1 mo. USD LIBOR + 4.85%), 10/25/29(13) | $ | 2,000 | $ | 2,200,864 | ||||||
Series 2017-C03, Class 1M2, 4.872%, (1 mo. USD LIBOR + 3.00%), 10/25/29(13) | 2,750 | 2,900,371 | ||||||||
| $ | 10,347,219 | |||||||||
| Government National Mortgage Association: | ||||||||||
Series 2002-45, Class PG, 6.00%, 3/17/32 | $ | 89 | $ | 89,656 | ||||||
Series 2011-156, Class GA, 2.00%, 12/16/41 | 593 | 502,304 | ||||||||
Series 2016-129, Class ZC, 2.00%, 6/20/45 | 1,636 | 1,543,235 | ||||||||
Series 2017-82, Class CZ, 2.50%, 2/16/43 | 628 | 617,243 | ||||||||
Series 2017-82, Class TZ, 2.50%, 2/16/43 | 896 | 835,972 | ||||||||
Series 2017-110, Class ZJ, 3.00%, 7/20/47 | 634 | 590,948 | ||||||||
Series 2017-121, Class DF, 2.322%, (1 mo. USD LIBOR + 0.50%), 8/20/47(13) | 20,917 | 20,929,105 | ||||||||
Series 2017-137, Class AF, 2.322%, (1 mo. USD LIBOR + 0.50%), 9/20/47(13) | 12,457 | 12,397,244 | ||||||||
Series 2017-141, Class KZ, 3.00%, 9/20/47 | 4,802 | 4,557,820 | ||||||||
Series 2018-6, Class JZ, 4.00%, 1/20/48 | 4,178 | 4,226,455 | ||||||||
| Interest Only:(21) | ||||||||||
Series 2017-104, Class SD, 4.378%, (6.20% - 1 mo. USD LIBOR), 7/20/47(20) | 9,561 | 1,729,692 | ||||||||
| $ | 48,019,674 | |||||||||
Total Collateralized Mortgage Obligations |
| $ | 468,166,910 | |||||||
| Commercial Mortgage-Backed Securities — 4.4% | ||||||||||
| Security | Principal Amount (000’s omitted) | Value | ||||||||
| Agate Bay Mortgage Trust | ||||||||||
Series 2015-1, Class A4, 3.50%, 1/25/45(8)(19) | $ | 3,102 | $ | 3,139,806 | ||||||
| Banc of America Merrill Lynch Large Loan, Inc. | ||||||||||
Series 2013-DSNY, Class E, 4.377%, (1 mo. USD LIBOR + 2.60%), 9/15/26(8)(13) | 1,500 | 1,500,881 | ||||||||
| CFCRE Commercial Mortgage Trust | ||||||||||
Series 2016-C7, Class D, 4.441%, 12/10/54(8) | 1,000 | 848,880 | ||||||||
| Citigroup Commercial Mortgage Trust | ||||||||||
Series 2015-P1, Class D, 3.225%, 9/15/48(8) | 1,500 | 1,215,771 | ||||||||
| COMM Mortgage Trust | ||||||||||
Series 2012-CR2, Class D, 4.833%, 8/15/45(8)(19) | 1,650 | 1,599,843 | ||||||||
Series 2013-CR11, Class D, 5.167%, 8/10/50(8)(19) | 2,500 | 2,357,335 | ||||||||
Series 2015-CR22, Class D, 4.122%, 3/10/48(8)(19) | 4,100 | 3,436,574 | ||||||||
| Security | Principal Amount (000’s omitted) | Value | ||||||||
| Credit Suisse Mortgage Trust | ||||||||||
Series 2016-NXSR, Class C, 4.363%, 12/15/49(19) | $ | 2,770 | $ | 2,780,190 | ||||||
| JPMBB Commercial Mortgage Securities Trust | ||||||||||
Series 2014-C19, Class A2, 3.046%, 4/15/47 | 2,416 | 2,425,132 | ||||||||
Series 2014-C19, Class D, | 1,425 | 1,270,680 | ||||||||
Series 2014-C22, Class C, 4.559%, 9/15/47 | 730 | 714,689 | ||||||||
Series 2014-C22, Class D, | 2,000 | 1,669,690 | ||||||||
Series 2014-C25, Class C, 4.446%, 11/15/47 | 900 | 890,663 | ||||||||
Series 2014-C25, Class D, 3.946%, 11/15/47(8)(19) | 2,080 | 1,693,226 | ||||||||
Series 2015-C29, Class D, | 2,000 | 1,630,875 | ||||||||
| JPMorgan Chase Commercial Mortgage Securities Trust | ||||||||||
Series 2006-LDP9, Class AM, | 1,475 | 1,484,899 | ||||||||
Series 2010-C2, Class D, | 3,247 | 3,317,654 | ||||||||
Series 2011-C5, Class D, | 3,000 | 2,951,287 | ||||||||
Series 2012-CBX, Class AS, | 1,000 | 1,030,172 | ||||||||
Series 2013-C13, Class D, | 3,000 | 2,833,667 | ||||||||
Series 2014-DSTY, Class B, | 2,600 | 2,579,762 | ||||||||
| Morgan Stanley Bank of America Merrill Lynch Trust | ||||||||||
Series 2014-C15, Class D, | 2,450 | 2,305,647 | ||||||||
Series 2015-C23, Class D, | 2,000 | 1,759,261 | ||||||||
Series 2016-C32, Class D, 3.396%, 12/15/49(8)(19) | 1,600 | 1,204,390 | ||||||||
| Morgan Stanley Capital I Trust | ||||||||||
Series 2017-CLS, Class A, 2.477%, (1 mo. USD LIBOR + 0.70%), 11/15/34(8)(13) | 3,125 | 3,132,039 | ||||||||
| Motel 6 Trust | ||||||||||
Series 2017-MTL6, Class C, 3.177%, (1 mo. USD LIBOR + 1.40%), 8/15/34(8)(13) | 2,963 | 2,977,628 | ||||||||
| RETL Trust | ||||||||||
Series 2018-RVP, Class C, 3.827%, (1 mo. USD LIBOR + 2.05%), 3/15/33(8)(13) | 1,075 | 1,086,627 | ||||||||
| UBS Commercial Mortgage Trust | ||||||||||
Series 2012-C1, Class D, | 3,000 | 2,975,929 | ||||||||
| Wells Fargo Commercial Mortgage Trust | ||||||||||
Series 2013-LC12, Class D, 4.291%, 7/15/46(8)(19) | 3,000 | 2,518,414 | ||||||||
Series 2015-C29, Class D, | 4,076 | 3,563,362 | ||||||||
Series 2015-C31, Class D, | 2,475 | 1,934,072 | ||||||||
Series 2015-LC22, Class C, | 1,250 | 1,257,419 | ||||||||
Series 2015-NXS1, Class D, | 2,500 | 2,243,226 | ||||||||
Series 2015-SG1, Class C, | 2,575 | 2,487,586 | ||||||||
| WF-RBS Commercial Mortgage Trust | ||||||||||
Series 2014-C24, Class B, 4.204%, 11/15/47(19) | 2,500 | 2,445,733 | ||||||||
| 44 | See Notes to Financial Statements. |
Eaton Vance
Limited Duration Income Fund
March 31, 2018
Portfolio of Investments — continued
| Security | Principal Amount (000’s omitted) | Value | ||||||||
| WF-RBS Commercial Mortgage Trust (continued) | ||||||||||
Series 2014-LC14, Class D, 4.586%, 3/15/47(8)(19) | $ | 3,000 | $ | 2,560,265 | ||||||
Total Commercial Mortgage-Backed Securities |
| $ | 75,823,274 | |||||||
| Asset-Backed Securities — 3.7% | ||||||||||
| Security | Principal Amount (000’s omitted) | Value | ||||||||
| AASET U.S., Ltd. | ||||||||||
Series 2018-1A, Class A, 3.844%, 1/16/38(8) | $ | 492 | $ | 489,074 | ||||||
Series 2018-1A, Class B, 5.437%, 1/16/38(8) | 660 | 654,141 | ||||||||
| Apidos CLO XVII | ||||||||||
Series 2014-17A, Class C, 5.031%, (3 mo. USD LIBOR + 3.30%), 4/17/26(8)(13) | 1,000 | 1,004,128 | ||||||||
| Avis Budget Rental Car Funding, LLC | ||||||||||
Series 2013-2A, Class B, 3.66%, 2/20/20(8) | 450 | 452,080 | ||||||||
| Blackbird Capital Aircraft Lease Securitization, Ltd. | ||||||||||
Series 2016-1A, Class AA, 2.487% to 12/16/24, 12/16/41(8)(23) | 3,844 | 3,778,808 | ||||||||
| Coinstar Funding, LLC | ||||||||||
Series 2017-1A, Class A2, 5.216%, 4/25/47(8) | 2,958 | 3,041,236 | ||||||||
| Conn Funding II L.P. | ||||||||||
Series 2017-A, Class B, 5.11%, 2/15/20(8) | 2,085 | 2,101,887 | ||||||||
Series 2017-B, Class A, 2.73%, 7/15/20(8) | 554 | 553,519 | ||||||||
| Consumer Loan Underlying Bond Credit Trust | ||||||||||
Series 2017-NP1, Class A, 2.39%, 4/17/23(8) | 148 | 147,631 | ||||||||
Series 2017-P1, Class A, 2.42%, 9/15/23(8) | 980 | 978,076 | ||||||||
| DB Master Finance, LLC | ||||||||||
Series 2015-1A, Class A2II, 3.98%, 2/20/45(8) | 2,158 | 2,179,686 | ||||||||
Series 2017-1A, Class A2I, 3.629%, 11/20/47(8) | 187 | 185,928 | ||||||||
| Dell Equipment Finance Trust | ||||||||||
Series 2016-1, Class B, 2.03%, 7/22/21(8) | 1,750 | 1,742,566 | ||||||||
| First Investors Auto Owner Trust | ||||||||||
Series 2015-1A, Class C, 2.71%, 6/15/21(8) | 1,400 | 1,391,999 | ||||||||
Series 2016-2A, Class A1, 1.53%, 11/16/20(8) | 250 | 249,228 | ||||||||
| FirstKey Lending Trust | ||||||||||
Series 2015-SFR1, Class A, 2.553%, 3/9/47(8) | 1,331 | 1,325,067 | ||||||||
| FOCUS Brands Funding, LLC | ||||||||||
Series 2017-1A, Class A2I, 3.857%, 4/30/47(8) | 1,608 | 1,619,291 | ||||||||
| Ford Credit Auto Owner Trust | ||||||||||
Series 2014-1, Class B, 2.41%, 11/15/25(8) | 3,600 | 3,582,971 | ||||||||
| Foundation Finance Trust | ||||||||||
Series 2017-1A, Class A, 3.30%, 7/15/33(8) | 581 | 574,022 | ||||||||
| Security | Principal Amount (000’s omitted) | Value | ||||||||
| GMF Floorplan Owner Revolving Trust | ||||||||||
Series 2015-1, Class B, 1.97%, 5/15/20(8) | $ | 255 | $ | 254,765 | ||||||
| Invitation Homes Trust | ||||||||||
Series 2015-SFR2, Class C, 3.808%, (1 mo. USD LIBOR + 2.00%), 6/17/32(8)(13) | 2,000 | 2,001,784 | ||||||||
Series 2017-SFR2, Class B, 2.958%, (1 mo. USD LIBOR + 1.15%), 12/17/36(8)(13) | 1,595 | 1,605,760 | ||||||||
Series 2018-SFR1, Class C, 3.058%, (1 mo. USD LIBOR + 1.25%), 3/17/37(8)(13) | 615 | 620,064 | ||||||||
| Marlette Funding Trust | ||||||||||
Series 2018-1A, Class A, 2.61%, 3/15/28(8) | 1,685 | 1,682,899 | ||||||||
| MVW Owner Trust | ||||||||||
Series 2014-1A, Class A, 2.25%, 9/22/31(8) | 718 | 704,301 | ||||||||
| NextGear Floorplan Master Owner Trust | ||||||||||
Series 2015-2A, Class A, 2.38%, 10/15/20(8) | 1,600 | 1,598,509 | ||||||||
| OneMain Financial Issuance Trust | ||||||||||
Series 2015-1A, Class B, 3.85%, 3/18/26(8) | 1,200 | 1,204,366 | ||||||||
Series 2017-1A, Class A1, 2.37%, 9/14/32(8) | 2,375 | 2,335,993 | ||||||||
| Progress Residential Trust | ||||||||||
Series 2016-SFR1, Class D, 4.558%, (1 mo. USD LIBOR + 2.75%), 9/17/33(8)(13) | 1,000 | 1,013,260 | ||||||||
| Prosper Marketplace Issuance Trust | ||||||||||
Series 2017-1A, Class A, 2.56%, 6/15/23(8) | 420 | 420,015 | ||||||||
Series 2017-1A, Class B, 3.65%, 6/15/23(8) | 750 | 753,181 | ||||||||
Series 2017-2A, Class B, 3.48%, 9/15/23(8) | 2,000 | 1,996,619 | ||||||||
Series 2017-3A, Class A, 2.36%, 11/15/23(8) | 1,492 | 1,486,213 | ||||||||
Series 2018-1A, Class A, 3.11%, 6/17/24(8) | 1,910 | 1,909,853 | ||||||||
| Purchasing Power Funding, LLC | ||||||||||
Series 2018-A, Class A, 3.34%, 8/15/22(8) | 3,200 | 3,208,125 | ||||||||
| Sierra Receivables Funding Co., LLC | ||||||||||
Series 2014-1A, Class B, 2.42%, 3/20/30(8) | 300 | 298,851 | ||||||||
Series 2015-1A, Class B, 3.05%, 3/22/32(8) | 610 | 607,310 | ||||||||
| SpringCastle America Funding LLC | ||||||||||
Series 2016-AA, Class A, 3.05%, 4/25/29(8) | 1,489 | 1,488,511 | ||||||||
| Synchrony Credit Card Master Note Trust | ||||||||||
Series 2015-3, Class A, 1.74%, 9/15/21 | 1,000 | 996,707 | ||||||||
| Taco Bell Funding, LLC | ||||||||||
Series 2016-1A, Class A2I, | 2,953 | 2,974,803 | ||||||||
| TCF Auto Receivables Owner Trust | ||||||||||
Series 2016-PT1A, Class A, | 563 | 557,851 | ||||||||
| Tesla Auto Lease Trust | ||||||||||
Series 2018-A, Class A, 2.32%, 12/20/19(8) | 735 | 733,413 | ||||||||
| Thunderbolt Aircraft Lease, Ltd. | ||||||||||
Series 2017-A, Class B, 5.75% to 4/15/24, 5/17/32(8)(23) | 1,888 | 1,921,800 | ||||||||
| Trafigura Securitisation Finance PLC | ||||||||||
Series 2017-1A, Class B, 3.477%, (1 mo. USD LIBOR + 1.70%), 12/15/20(8)(13) | 1,500 | 1,508,538 | ||||||||
| 45 | See Notes to Financial Statements. |
Eaton Vance
Limited Duration Income Fund
March 31, 2018
Portfolio of Investments — continued
| Security | Principal Amount (000’s omitted) | Value | ||||||||||
| Tricon American Homes | ||||||||||||
Series 2016-SFR1, Class D, 3.886%, 11/17/33(8) | $ | 1,300 | $ | 1,303,139 | ||||||||
| Vantage Data Centers Issuer, LLC | ||||||||||||
Series 2018-1A, Class A2, 4.072%, 2/16/43(8) | 204 | 205,937 | ||||||||||
| Verizon Owner Trust | ||||||||||||
Series 2016-1A, Class A, 1.42%, 1/20/21(8) | 2,400 | 2,381,447 | ||||||||||
Total Asset-Backed Securities |
| $ | 63,825,352 | |||||||||
| U.S. Government Agency Obligations — 0.6% | ||||||||||||
| Security | Principal Amount (000’s omitted) | Value | ||||||||||
| Federal Farm Credit Bank | ||||||||||||
3.25%, 7/1/30 | $ | 5,000 | $ | 5,020,610 | ||||||||
| $ | 5,020,610 | |||||||||||
| Federal Home Loan Bank | ||||||||||||
5.50%, 7/15/36 | $ | 4,000 | $ | 5,333,136 | ||||||||
| $ | 5,333,136 | |||||||||||
Total U.S. Government Agency Obligations |
| $ | 10,353,746 | |||||||||
| Common Stocks — 0.8% | ||||||||||||
| Security | Shares | Value | ||||||||||
| Aerospace and Defense — 0.0%(15) | ||||||||||||
IAP Global Services, LLC(3)(24)(25) | 31 | $ | 333,004 | |||||||||
| $ | 333,004 | |||||||||||
| Automotive — 0.1% | ||||||||||||
Dayco Products, LLC(24)(25) | 27,250 | $ | 967,375 | |||||||||
| $ | 967,375 | |||||||||||
| Business Equipment and Services — 0.1% | ||||||||||||
Education Management Corp.(3)(24)(25) | 5,580,468 | $ | 0 | |||||||||
RCS Capital Corp.(24)(25) | 37,523 | 2,626,610 | ||||||||||
| $ | 2,626,610 | |||||||||||
| Electronics / Electrical — 0.0%(15) | ||||||||||||
Answers Corp.(3)(24)(25) | 78,756 | $ | 651,312 | |||||||||
| $ | 651,312 | |||||||||||
| Security | Shares | Value | ||||||||||
| Health Care — 0.0%(15) | ||||||||||||
New Millennium Holdco, Inc.(24)(25) | 42,216 | $ | 2,111 | |||||||||
| $ | 2,111 | |||||||||||
| Lodging and Casinos — 0.0%(15) | ||||||||||||
Caesars Entertainment Corp.(24)(25) | 11,732 | $ | 131,985 | |||||||||
| $ | 131,985 | |||||||||||
| Nonferrous Metals / Minerals — 0.0% | ||||||||||||
ASP United/GHX Holding, LLC(3)(24)(25) | 707 | $ | 0 | |||||||||
| $ | 0 | |||||||||||
| Oil and Gas — 0.3% | ||||||||||||
AFG Holdings, Inc.(3)(24)(25) | 58,344 | $ | 3,471,468 | |||||||||
Nine Point Energy Holdings, Inc.(3)(24)(26) | 25,410 | 187,526 | ||||||||||
Paragon Offshore Finance Company, Class A(24)(25) | 2,021 | 2,779 | ||||||||||
Paragon Offshore Finance Company, Class B(24)(25) | 1,011 | 33,110 | ||||||||||
Samson Resources II, LLC, Class A(24)(25) | 45,294 | 996,468 | ||||||||||
Southcross Holdings Group, LLC(3)(24)(25) | 78 | 0 | ||||||||||
Southcross Holdings L.P., Class A(24)(25) | 78 | 31,200 | ||||||||||
| $ | 4,722,551 | |||||||||||
| Publishing — 0.3% | ||||||||||||
ION Media Networks, Inc.(3)(24)(25) | 5,187 | $ | 3,371,083 | |||||||||
Laureate Education, Inc.(24)(25) | 87,028 | 1,196,635 | ||||||||||
MediaNews Group, Inc.(24)(25) | 14,016 | 252,283 | ||||||||||
| $ | 4,820,001 | |||||||||||
Total Common Stocks |
| $ | 14,254,949 | |||||||||
| Convertible Bonds — 0.0%(15) | ||||||||||||
| Security | Principal Amount (000’s omitted) | Value | ||||||||||
| Utilities — 0.0%(15) | ||||||||||||
NRG Yield, Inc., 3.25%, 6/1/20(8) | $ | 225 | $ | 223,371 | ||||||||
Total Convertible Bonds |
| $ | 223,371 | |||||||||
| 46 | See Notes to Financial Statements. |
Eaton Vance
Limited Duration Income Fund
March 31, 2018
Portfolio of Investments — continued
| Convertible Preferred Stocks — 0.1% | ||||||||||
| Security | Shares | Value | ||||||||
| Business Equipment and Services — 0.0% | ||||||||||
Education Management Corp., | 6,209 | $ | 0 | |||||||
| $ | 0 | |||||||||
| Oil and Gas — 0.1% | ||||||||||
Nine Point Energy Holdings, Inc., Series A, 12.00%(3)(24)(26) | 555 | $ | 814,723 | |||||||
| $ | 814,723 | |||||||||
Total Convertible Preferred Stocks |
| $ | 814,723 | |||||||
| Preferred Stocks — 0.0%(15) | ||||||||||
| Security | Shares | Value | ||||||||
| Pipelines — 0.0%(15) | ||||||||||
NuStar Energy, LP, Series B, 7.625% to 6/15/22(10) | 31,500 | $ | 686,700 | |||||||
Total Preferred Stocks |
| $ | 686,700 | |||||||
| Closed-End Funds — 1.3% | ||||||||||
| Security | Shares | Value | ||||||||
BlackRock Corporate High Yield Fund, Inc. | 2,060,222 | $ | 21,817,751 | |||||||
Total Closed-End Funds |
| $ | 21,817,751 | |||||||
| Miscellaneous — 0.0% | ||||||||||
| Security | Principal Amount/ Shares | Value | ||||||||
| Cable and Satellite Television — 0.0% | ||||||||||
ACC Claims Holdings, LLC(3)(24) | 2,257,600 | $ | 0 | |||||||
| $ | 0 | |||||||||
| Telecommunications — 0.0% | ||||||||||
Avaya, Inc., Escrow Certificates(3)(24) | $ | 1,135,000 | $ | 0 | ||||||
| $ | 0 | |||||||||
Total Miscellaneous |
| $ | 0 | |||||||
| Short-Term Investments — 1.4% | ||||||||||
| U.S. Treasury Obligations — 0.0%(15) | ||||||||||
| Security | Principal Amount (000’s omitted) | Value | ||||||||
U.S. Treasury Bill, 0.00%, 5/17/18(27) | $ | 500 | $ | 498,977 | ||||||
Total U.S. Treasury Obligations |
| $ | 498,977 | |||||||
| Other — 1.4% | ||||||||||
| Description | Units | Value | ||||||||
Eaton Vance Cash Reserves Fund, LLC, 1.89%(28) | 23,968,168 | $ | 23,963,374 | |||||||
Total Other |
| $ | 23,963,374 | |||||||
Total Short-Term Investments |
| $ | 24,462,351 | |||||||
Total Investments — 159.7% |
| $ | 2,735,057,421 | |||||||
Less Unfunded Loan Commitments — (0.1)% |
| $ | (1,513,008 | ) | ||||||
Net Investments — 159.6% |
| $ | 2,733,544,413 | |||||||
Other Assets, Less Liabilities — (44.0)% |
| $ | (754,226,841 | ) | ||||||
Auction Preferred Shares Plus Cumulative |
| $ | (266,734,546 | ) | ||||||
Net Assets Applicable to Common Shares — 100.0% |
| $ | 1,712,583,026 | |||||||
The percentage shown for each investment category in the Portfolio of Investments is based on net assets applicable to common shares.
| * | In U.S. dollars unless otherwise indicated. |
| (1) | Senior floating-rate loans (Senior Loans) often require prepayments from excess cash flows or permit the borrowers to repay at their election. The degree to which borrowers repay, whether as a contractual requirement or at their election, cannot be predicted with accuracy. As a result, the actual remaining maturity may be substantially less than the stated maturities shown. However, Senior Loans will typically have an expected average life of approximately two to four years. Senior Loans typically have rates of interest which are redetermined periodically by reference to a base lending rate, plus a spread. These base lending rates are primarily the London Interbank Offered Rate (“LIBOR”) and secondarily, the prime rate offered by one or more major United States banks (the “Prime Rate”). Base lending rates may be subject to a floor, or minimum rate. |
| (2) | Unfunded or partially unfunded loan commitments. The stated interest rate reflects the weighted average of the reference rate and spread for the funded portion and the commitment fees on the portion of the loan that is unfunded. See Note 1F for description. |
| 47 | See Notes to Financial Statements. |
Eaton Vance
Limited Duration Income Fund
March 31, 2018
Portfolio of Investments — continued
| (3) | For fair value measurement disclosure purposes, security is categorized as Level 3 (see Note 12). |
| (4) | The stated interest rate represents the weighted average interest rate at March 31, 2018 of contracts within the senior loan facility. Interest rates on contracts are primarily redetermined either weekly, monthly or quarterly by reference to the indicated base lending rate and spread and the reset period. |
| (5) | Issuer is in default with respect to interest and/or principal payments. For a variable rate security, interest rate has been adjusted to reflect non-accrual status. |
| (6) | This Senior Loan will settle after March 31, 2018, at which time the interest rate will be determined. |
| (7) | Fixed-rate loan. |
| (8) | Security exempt from registration pursuant to Rule 144A under the Securities Act of 1933, as amended. These securities may be sold in certain transactions in reliance on an exemption from registration (normally to qualified institutional buyers). At March 31, 2018, the aggregate value of these securities is $579,554,649 or 33.8% of the Fund’s net assets applicable to common shares. |
| (9) | Security exempt from registration under Regulation S of the Securities Act of 1933, which exempts from registration securities offered and sold outside the United States. Security may not be offered or sold in the United States except pursuant to an exemption from, or in a transaction not subject to, the registration requirements of the Securities Act of 1933. At March 31, 2018, the aggregate value of these securities is $100,534,513 or 5.9% of the Fund’s net assets applicable to common shares. |
| (10) | Security converts to floating rate after the indicated fixed-rate coupon period. |
| (11) | Perpetual security with no stated maturity date but may be subject to calls by the issuer. |
| (12) | When-issued security. |
| (13) | Variable rate security. The stated interest rate represents the rate in effect at March 31, 2018. |
| (14) | Represents a payment-in-kind security which may pay interest in additional principal at the issuer’s discretion. |
| (15) | Amount is less than 0.05%. |
| (16) | Loan is subject to scheduled mandatory prepayments. Maturity date shown reflects the final maturity date. |
| (17) | Security (or a portion thereof) has been pledged for the benefit of the counterparty for reverse repurchase agreements. |
| (18) | Adjustable rate mortgage security whose interest rate generally adjusts monthly based on a weighted average of interest rates on the underlying mortgages. The coupon rate may not reflect the applicable index value as interest rates on the underlying mortgages may adjust on various dates and at various intervals and may be subject to lifetime ceilings and lifetime floors and lookback periods. Rate shown is the coupon rate at March 31, 2018. |
| (19) | Weighted average fixed-rate coupon that changes/updates monthly. Rate shown is the rate at March 31, 2018. |
| (20) | Inverse floating-rate security whose coupon varies inversely with changes in the interest rate index. The stated interest rate represents the coupon rate in effect at March 31, 2018. |
| (21) | Interest only security that entitles the holder to receive only interest payments on the underlying mortgages. Principal amount shown is the notional amount of the underlying mortgages on which coupon interest is calculated. |
| (22) | Principal only security that entitles the holder to receive only principal payments on the underlying mortgages. |
| (23) | Multi-step coupon bond. Interest rate represents the rate in effect at March 31, 2018. |
| (24) | Non-income producing security. |
| (25) | Security was acquired in connection with a restructuring of a Senior Loan and may be subject to restrictions on resale. |
| (26) | Restricted security (see Note 7). |
| (27) | Security (or a portion thereof) has been pledged to cover margin requirements on open financial futures contracts. |
| (28) | Affiliated investment company, available to Eaton Vance portfolios and funds, which invests in high quality, U.S. dollar denominated money market instruments. The rate shown is the annualized seven-day yield as of March 31, 2018. |
| Forward Foreign Currency Exchange Contracts | ||||||||||||||||||||||||
| Currency Purchased | Currency Sold | Counterparty | Settlement Date | Unrealized Appreciation | Unrealized (Depreciation) | |||||||||||||||||||
| EUR | 325,201 | USD | 399,505 | State Street Bank and Trust Company | 4/30/18 | $ | 1,380 | $ | — | |||||||||||||||
| EUR | 100,000 | USD | 123,311 | State Street Bank and Trust Company | 4/30/18 | — | (38 | ) | ||||||||||||||||
| EUR | 193,825 | USD | 239,789 | State Street Bank and Trust Company | 4/30/18 | — | (856 | ) | ||||||||||||||||
| EUR | 253,500 | USD | 316,112 | State Street Bank and Trust Company | 4/30/18 | — | (3,616 | ) | ||||||||||||||||
| EUR | 358,022 | USD | 447,137 | State Street Bank and Trust Company | 4/30/18 | — | (5,795 | ) | ||||||||||||||||
| EUR | 493,096 | USD | 615,527 | State Street Bank and Trust Company | 4/30/18 | — | (7,675 | ) | ||||||||||||||||
| GBP | 226,454 | USD | 314,081 | State Street Bank and Trust Company | 4/30/18 | 3,986 | — | |||||||||||||||||
| GBP | 241,220 | USD | 335,635 | State Street Bank and Trust Company | 4/30/18 | 3,170 | — | |||||||||||||||||
| GBP | 280,990 | USD | 392,197 | State Street Bank and Trust Company | 4/30/18 | 2,468 | — | |||||||||||||||||
| GBP | 139,310 | USD | 194,424 | State Street Bank and Trust Company | 4/30/18 | 1,243 | — | |||||||||||||||||
| GBP | 209,032 | USD | 292,882 | State Street Bank and Trust Company | 4/30/18 | 715 | — | |||||||||||||||||
| USD | 15,035,665 | EUR | 12,060,120 | Goldman Sachs International | 4/30/18 | 168,840 | — | |||||||||||||||||
| USD | 1,964,214 | EUR | 1,575,000 | HSBC Bank USA, N.A. | 4/30/18 | 22,670 | — | |||||||||||||||||
| USD | 1,422,082 | EUR | 1,135,816 | HSBC Bank USA, N.A. | 4/30/18 | 21,931 | — | |||||||||||||||||
| 48 | See Notes to Financial Statements. |
Eaton Vance
Limited Duration Income Fund
March 31, 2018
Portfolio of Investments — continued
| Forward Foreign Currency Exchange Contracts (continued) | ||||||||||||||||||||||||
| Currency Purchased | Currency Sold | Counterparty | Settlement Date | Unrealized Appreciation | Unrealized (Depreciation) | |||||||||||||||||||
| USD | 431,842 | EUR | 350,000 | HSBC Bank USA, N.A. | 4/30/18 | $ | 388 | $ | — | |||||||||||||||
| USD | 1,110,263 | EUR | 900,626 | JPMorgan Chase Bank, N.A. | 4/30/18 | 38 | — | |||||||||||||||||
| USD | 19,020,432 | EUR | 15,247,059 | State Street Bank and Trust Company | 4/30/18 | 224,983 | — | |||||||||||||||||
| USD | 611,637 | EUR | 489,725 | State Street Bank and Trust Company | 4/30/18 | 7,940 | — | |||||||||||||||||
| USD | 1,256,044 | EUR | 1,015,790 | State Street Bank and Trust Company | 4/30/18 | 3,854 | — | |||||||||||||||||
| USD | 309,111 | EUR | 248,213 | State Street Bank and Trust Company | 4/30/18 | 3,133 | — | |||||||||||||||||
| USD | 253,578 | EUR | 204,972 | State Street Bank and Trust Company | 4/30/18 | 905 | — | |||||||||||||||||
| USD | 247,164 | EUR | 200,000 | State Street Bank and Trust Company | 4/30/18 | 619 | — | |||||||||||||||||
| USD | 126,934 | EUR | 102,695 | State Street Bank and Trust Company | 4/30/18 | 340 | — | |||||||||||||||||
| USD | 543,363 | EUR | 440,645 | State Street Bank and Trust Company | 4/30/18 | 169 | — | |||||||||||||||||
| USD | 257,444 | EUR | 208,913 | State Street Bank and Trust Company | 4/30/18 | — | (88 | ) | ||||||||||||||||
| USD | 7,883,308 | GBP | 5,554,422 | State Street Bank and Trust Company | 4/30/18 | 81,841 | — | |||||||||||||||||
| USD | 524,304 | GBP | 370,142 | State Street Bank and Trust Company | 4/30/18 | 4,420 | — | |||||||||||||||||
| USD | 347,295 | GBP | 248,820 | State Street Bank and Trust Company | 4/30/18 | — | (2,185 | ) | ||||||||||||||||
| USD | 2,782,460 | EUR | 2,237,328 | Australia and New Zealand Banking Group Limited | 5/30/18 | 18,535 | — | |||||||||||||||||
| USD | 490,128 | EUR | 389,339 | Australia and New Zealand Banking Group Limited | 5/30/18 | 9,151 | — | |||||||||||||||||
| USD | 588,632 | EUR | 474,835 | Australia and New Zealand Banking Group Limited | 5/30/18 | 2,035 | — | |||||||||||||||||
| USD | 589,937 | EUR | 476,088 | Australia and New Zealand Banking Group Limited | 5/30/18 | 1,793 | — | |||||||||||||||||
| USD | 444,415 | EUR | 361,000 | Australia and New Zealand Banking Group Limited | 5/30/18 | — | (1,553 | ) | ||||||||||||||||
| USD | 1,474,341 | EUR | 1,197,613 | Australia and New Zealand Banking Group Limited | 5/30/18 | — | (5,153 | ) | ||||||||||||||||
| USD | 2,197,400 | EUR | 1,784,957 | Australia and New Zealand Banking Group Limited | 5/30/18 | — | (7,680 | ) | ||||||||||||||||
| USD | 548,062 | EUR | 440,415 | HSBC Bank USA, N.A. | 5/30/18 | 3,988 | — | |||||||||||||||||
| USD | 2,055,538 | CAD | 2,616,792 | HSBC Bank USA, N.A. | 5/31/18 | 22,248 | — | |||||||||||||||||
| USD | 1,049,040 | EUR | 845,750 | HSBC Bank USA, N.A. | 5/31/18 | 4,153 | — | |||||||||||||||||
| USD | 1,154,573 | EUR | 925,000 | State Street Bank and Trust Company | 5/31/18 | 11,776 | — | |||||||||||||||||
| USD | 627,212 | EUR | 506,104 | State Street Bank and Trust Company | 5/31/18 | 1,942 | — | |||||||||||||||||
| USD | 389,575 | EUR | 315,129 | Australia and New Zealand Banking Group Limited | 6/19/18 | — | (347 | ) | ||||||||||||||||
| USD | 3,578,829 | EUR | 2,884,524 | Deutsche Bank AG | 6/28/18 | 7,031 | — | |||||||||||||||||
| USD | 18,214,704 | EUR | 14,579,286 | Goldman Sachs International | 6/29/18 | 160,228 | — | |||||||||||||||||
| USD | 2,617,549 | EUR | 2,094,466 | JPMorgan Chase Bank, N.A. | 6/29/18 | 23,836 | — | |||||||||||||||||
| USD | 2,632,665 | EUR | 2,096,338 | Goldman Sachs International | 7/12/18 | 33,913 | — | |||||||||||||||||
| USD | 2,364,602 | EUR | 1,889,112 | Goldman Sachs International | 7/12/18 | 22,739 | — | |||||||||||||||||
| $ | 878,401 | $ | (34,986 | ) | ||||||||||||||||||||
| Futures Contracts | ||||||||||||||||||||
| Description | Number of Contracts | Position | Expiration Month/Year | Notional Amount | Value/Net Appreciation | |||||||||||||||
Interest Rate Futures | ||||||||||||||||||||
| 5-Year USD Deliverable Interest Rate Swap | 106 | Short | Jun-18 | $ | (10,230,656 | ) | $ | (39,500 | ) | |||||||||||
| 10-Year USD Deliverable Interest Rate Swap | 133 | Short | Jun-18 | (12,622,531 | ) | (137,811 | ) | |||||||||||||
| U.S. 2-Year Treasury Note | 270 | Short | Jun-18 | (57,404,532 | ) | (4,532 | ) | |||||||||||||
| U.S. 5-Year Treasury Note | 451 | Short | Jun-18 | (51,621,883 | ) | (153,505 | ) | |||||||||||||
| 49 | See Notes to Financial Statements. |
Eaton Vance
Limited Duration Income Fund
March 31, 2018
Portfolio of Investments — continued
| Futures Contracts (continued) | ||||||||||||||||||||
| Description | Number of Contracts | Position | Expiration Month/Year | Notional Amount | Value/Net Appreciation | |||||||||||||||
| U.S. 10-Year Treasury Note | 119 | Long | Jun-18 | $ | 14,415,734 | $ | 166,209 | |||||||||||||
| U.S. 10-Year Treasury Note | 334 | Short | Jun-18 | (40,460,969 | ) | (317,461 | ) | |||||||||||||
| U.S. Ultra 10-Year Treasury Note | 196 | Short | Jun-18 | (25,452,438 | ) | (349,918 | ) | |||||||||||||
| $ | (836,518 | ) | ||||||||||||||||||
| Centrally Cleared Interest Rate Swaps | ||||||||||||||||||
| Counterparty | Notional (000’s omitted) | Fund Pays/Receives Floating Rate | Floating Rate | Annual Fixed Rate | Termination Date | Value/Net Appreciation | ||||||||||||
| LCH.Clearnet | EUR | 8,572 | Receives | 6-month Euro Interbank Offered Rate (pays semi-annually) | 0.25% (pays annually)(1) | 9/20/22 | $ | (18,341 | ) | |||||||||
| LCH.Clearnet | EUR | 500 | Receives | 6-month Euro Interbank Offered Rate (pays semi-annually) | 1.00% (pays annually)(1) | 3/21/23 | (4,597 | ) | ||||||||||
| LCH.Clearnet | EUR | 1,640 | Receives | 6-month Euro Interbank Offered Rate (pays semi-annually) | 1.00% (pays annually)(1) | 9/20/27 | (234 | ) | ||||||||||
| LCH.Clearnet | EUR | 240 | Receives | 6-month Euro Interbank Offered Rate (pays semi-annually) | 1.01% (pays annually) | 3/20/28 | (1,680 | ) | ||||||||||
| LCH.Clearnet | EUR | 290 | Receives | 6-month Euro Interbank Offered Rate (pays semi-annually) | 1.01% (pays annually) | 3/21/28 | (2,546 | ) | ||||||||||
| LCH.Clearnet | USD | 1,700 | Receives | 3-month USD-LIBOR-BBA (pays quarterly) | 1.75% (pays semi-annually)(1) | 9/20/19 | 20,113 | |||||||||||
| LCH.Clearnet | USD | 2,250 | Receives | 3-month USD-LIBOR-BBA (pays quarterly) | 1.50% (pays semi-annually)(1) | 3/20/20 | 34,772 | |||||||||||
| LCH.Clearnet | USD | 760 | Receives | 3-month USD-LIBOR-BBA (pays quarterly) | 1.93% (pays semi-annually) | 11/3/20 | 9,013 | |||||||||||
| LCH.Clearnet | USD | 100 | Receives | 3-month USD-LIBOR-BBA (pays quarterly) | 1.96% (pays semi-annually) | 11/17/20 | 880 | |||||||||||
| LCH.Clearnet | USD | 550 | Receives | 3-month USD-LIBOR-BBA (pays quarterly) | 2.68% (pays semi-annually) | 3/16/21 | (1,166 | ) | ||||||||||
| LCH.Clearnet | USD | 650 | Receives | 3-month USD-LIBOR-BBA (pays quarterly) | 2.69% (pays semi-annually) | 3/16/21 | (945 | ) | ||||||||||
| LCH.Clearnet | USD | 650 | Receives | 3-month USD-LIBOR-BBA (pays quarterly) | 2.68% (pays semi-annually) | 3/16/21 | (1,355 | ) | ||||||||||
| LCH.Clearnet | USD | 500 | Receives | 3-month USD-LIBOR-BBA (pays quarterly) | 2.68% (pays semi-annually) | 3/19/21 | (673 | ) | ||||||||||
| LCH.Clearnet | USD | 375 | Receives | 3-month USD-LIBOR-BBA (pays quarterly) | 2.77% (pays semi-annually) | 3/26/21 | (579 | ) | ||||||||||
| LCH.Clearnet | USD | 1,450 | Receives | 3-month USD-LIBOR-BBA (pays quarterly) | 2.09% (pays semi-annually) | 11/3/22 | 28,885 | |||||||||||
| LCH.Clearnet | USD | 665 | Receives | 3-month USD-LIBOR-BBA (pays quarterly) | 2.09% (pays semi-annually) | 11/7/22 | 13,463 | |||||||||||
| LCH.Clearnet | USD | 3,950 | Receives | 3-month USD-LIBOR-BBA (pays quarterly) | 2.07% (pays semi-annually) | 11/14/22 | 83,952 | |||||||||||
| 50 | See Notes to Financial Statements. |
Eaton Vance
Limited Duration Income Fund
March 31, 2018
Portfolio of Investments — continued
| Centrally Cleared Interest Rate Swaps (continued) | ||||||||||||||||||
| Counterparty | Notional (000’s omitted) | Fund Pays/Receives Floating Rate | Floating Rate | Annual Fixed Rate | Termination Date | Value/Net Appreciation | ||||||||||||
| LCH.Clearnet | USD | 170 | Receives | 3-month USD-LIBOR-BBA (pays quarterly) | 2.09% (pays semi-annually) | 11/17/22 | $ | 3,215 | ||||||||||
| LCH.Clearnet | USD | 210 | Receives | 3-month USD-LIBOR-BBA (pays quarterly) | 2.09% (pays semi-annually) | 11/17/22 | 3,951 | |||||||||||
| LCH.Clearnet | USD | 275 | Receives | 3-month USD-LIBOR-BBA (pays quarterly) | 2.09% (pays semi-annually) | 11/17/22 | 5,174 | |||||||||||
| LCH.Clearnet | USD | 2,000 | Receives | 3-month USD-LIBOR-BBA (pays quarterly) | 2.21% (pays semi-annually) | 12/7/22 | 30,734 | |||||||||||
| LCH.Clearnet | USD | 350 | Receives | 3-month USD-LIBOR-BBA (pays quarterly) | 2.76% (pays semi-annually) | 3/20/23 | (1,030 | ) | ||||||||||
| LCH.Clearnet | USD | 485 | Receives | 3-month USD-LIBOR-BBA (pays quarterly) | 2.76% (pays semi-annually) | 3/20/23 | (1,393 | ) | ||||||||||
| LCH.Clearnet | USD | 860 | Receives | 3-month USD-LIBOR-BBA (pays quarterly) | 2.11% (pays semi-annually) | 9/5/27 | 46,311 | |||||||||||
| LCH.Clearnet | USD | 1,114 | Receives | 3-month USD-LIBOR-BBA (pays quarterly) | 2.02% (pays semi-annually) | 9/11/27 | 68,495 | |||||||||||
| LCH.Clearnet | USD | 650 | Receives | 3-month USD-LIBOR-BBA (pays quarterly) | 2.31% (pays semi-annually) | 11/15/27 | 20,567 | |||||||||||
| LCH.Clearnet | USD | 300 | Receives | 3-month USD-LIBOR-BBA (pays quarterly) | 2.32% (pays semi-annually) | 11/17/27 | 8,389 | |||||||||||
| LCH.Clearnet | USD | 1,600 | Receives | 3-month USD-LIBOR-BBA (pays quarterly) | 2.36% (pays semi-annually) | 11/21/27 | 43,836 | |||||||||||
| LCH.Clearnet | USD | 1,655 | Receives | 3-month USD-LIBOR-BBA (pays quarterly) | 2.48% (pays semi-annually) | 12/27/27 | 31,508 | |||||||||||
| LCH.Clearnet | USD | 330 | Receives | 3-month USD-LIBOR-BBA (pays quarterly) | 2.68% (pays semi-annually) | 1/30/28 | 2,131 | |||||||||||
| LCH.Clearnet | USD | 140 | Receives | 3-month USD-LIBOR-BBA (pays quarterly) | 2.72% (pays semi-annually) | 1/31/28 | 344 | |||||||||||
| LCH.Clearnet | USD | 503 | Receives | 3-month USD-LIBOR-BBA (pays quarterly) | 2.74% (pays semi-annually) | 2/1/28 | 692 | |||||||||||
| LCH.Clearnet | USD | 370 | Receives | 3-month USD-LIBOR-BBA (pays quarterly) | 2.82% (pays semi-annually) | 2/5/28 | (2,300 | ) | ||||||||||
| LCH.Clearnet | USD | 249 | Receives | 3-month USD-LIBOR-BBA (pays quarterly) | 2.93% (pays semi-annually) | 2/23/28 | (3,623 | ) | ||||||||||
| LCH.Clearnet | USD | 250 | Receives | 3-month USD-LIBOR-BBA (pays quarterly) | 2.85% (pays semi-annually) | 3/16/28 | (1,891 | ) | ||||||||||
| LCH.Clearnet | USD | 1,015 | Receives | 3-month USD-LIBOR-BBA (pays quarterly) | 2.86% (pays semi-annually) | 3/20/28 | (7,875 | ) | ||||||||||
| $ | 406,197 | |||||||||||||||||
| (1) | Upfront payment is exchanged with the counterparty as a result of the standardized trading coupon. |
| Centrally Cleared Credit Default Swaps — Sell Protection | ||||||||||||||||||||||||||||
| Reference Entity | Counterparty | Notional Amount* (000’s omitted) | Contract Annual Fixed Rate** | Termination Date | Current Market Annual Fixed Rate*** | Market Value | Unamortized Upfront Payments | Net Unrealized Appreciation | ||||||||||||||||||||
| Russia | ICE Clear Credit | $ | 700 | 1.00% (pays quarterly)(1) | 12/20/22 | 1.12 | % | $ | (3,531 | ) | $ | 8,396 | $ | 4,865 | ||||||||||||||
Total | $ | 700 | $ | (3,531 | ) | $ | 8,396 | $ | 4,865 | |||||||||||||||||||
| 51 | See Notes to Financial Statements. |
Eaton Vance
Limited Duration Income Fund
March 31, 2018
Portfolio of Investments — continued
| Credit Default Swaps — Sell Protection | ||||||||||||||||||||||||||||
Reference Entity | Counterparty | Notional Amount* (000’s omitted) | Contract Annual Fixed Rate** | Termination Date | Current Market Annual Fixed Rate*** | Market Value | Unamortized Upfront Payments Received | Net Unrealized Appreciation | ||||||||||||||||||||
| Bahamas | Deutsche Bank AG | $ | 1,150 | 1.00% (pays quarterly)(1) | 6/20/22 | 1.61 | % | $ | (27,092 | ) | $ | 87,271 | $ | 60,179 | ||||||||||||||
| Brazil | Citibank, N.A. | 3,549 | 1.00% (pays quarterly)(1) | 6/20/23 | 1.62 | (104,002 | ) | 110,654 | 6,652 | |||||||||||||||||||
| Brazil | Goldman Sachs International | 900 | 1.00% (pays quarterly)(1) | 6/20/23 | 1.62 | (26,374 | ) | 28,470 | 2,096 | |||||||||||||||||||
| Russia | Citibank, N.A. | 2,800 | 1.00% (pays quarterly)(1) | 12/20/22 | 1.12 | (14,125 | ) | 54,717 | 40,592 | |||||||||||||||||||
| Russia | HSBC Bank USA, N.A. | 500 | 1.00% (pays quarterly)(1) | 12/20/22 | 1.12 | (2,522 | ) | 7,622 | 5,100 | |||||||||||||||||||
| Russia | HSBC Bank USA, N.A. | 300 | 1.00% (pays quarterly)(1) | 6/20/23 | 1.23 | (3,237 | ) | 2,788 | (449 | ) | ||||||||||||||||||
Total | $ | 9,199 | $ | (177,352 | ) | $ | 291,522 | $ | 114,170 | |||||||||||||||||||
| * | If the Fund is the seller of credit protection, the notional amount is the maximum potential amount of future payments the Fund could be required to make if a credit event, as defined in the credit default swap agreement, were to occur. At March 31, 2018, such maximum potential amount for all open credit default swaps in which the Fund is the seller was $9,899,000. |
| ** | The contract annual fixed rate represents the fixed rate of interest received by the Fund (as a seller of protection) on the notional amount of the credit default swap contract. |
| *** | Current market annual fixed rates, utilized in determining the net unrealized appreciation or depreciation as of period end, serve as an indicator of the market’s perception of the current status of the payment/performance risk associated with the credit derivative. The current market annual fixed rate of a particular reference entity reflects the cost, as quoted by the pricing vendor, of selling protection against default of that entity as of period end and may include upfront payments required to be made to enter into the agreement. The higher the fixed rate, the greater the market perceived risk of a credit event involving the reference entity. A rate identified as “Defaulted” indicates a credit event has occurred for the reference entity. |
| (1) | Upfront payment is exchanged with the counterparty as a result of the standardized trading coupon. |
Abbreviations:
| CMT | – | Constant Maturity Treasury | ||
| COF | – | Cost of Funds 11th District | ||
| DIP | – | Debtor In Possession | ||
| EURIBOR | – | Euro Interbank Offered Rate | ||
| LIBOR | – | London Interbank Offered Rate | ||
| PIK | – | Payment In Kind |
Currency Abbreviations:
| CAD | – | Canadian Dollar | ||
| EUR | – | Euro | ||
| GBP | – | British Pound Sterling | ||
| USD | – | United States Dollar |
| 52 | See Notes to Financial Statements. |
Eaton Vance
Limited Duration Income Fund
March 31, 2018
Statement of Assets and Liabilities
| Assets | March 31, 2018 | |||
Unaffiliated investments, at value (identified cost, $2,724,090,125) | $ | 2,709,581,039 | ||
Affiliated investment, at value (identified cost, $23,966,937) | 23,963,374 | |||
Cash | 29,511,612 | |||
Deposits for derivatives collateral — | ||||
Financial futures contracts | 1,825,585 | |||
Centrally cleared swap contracts | 1,364,303 | |||
OTC derivatives | 470,000 | |||
Reverse repurchase agreements | 1,422,699 | |||
Foreign currency, at value (identified cost, $1,029,640) | 1,031,087 | |||
Interest and dividends receivable | 21,490,235 | |||
Dividends receivable from affiliated investment | 69,511 | |||
Receivable for investments sold | 3,194,097 | |||
Receivable for open forward foreign currency exchange contracts | 878,401 | |||
Receivable for open swap contracts | 114,619 | |||
Tax reclaims receivable | 2,180 | |||
Prepaid upfront fees on notes payable | 384,895 | |||
Prepaid expenses | 56,080 | |||
Total assets | $ | 2,795,359,717 | ||
| Liabilities | ||||
Notes payable | $ | 663,000,000 | ||
Payable for reverse repurchase agreements, including accrued interest of $132,793 | 111,481,054 | |||
Payable for investments purchased | 33,599,110 | |||
Payable for when-issued securities | 3,425,000 | |||
Payable for variation margin on open financial futures contracts | 125 | |||
Payable for variation margin on open centrally cleared swap contracts | 26,270 | |||
Payable for open forward foreign currency exchange contracts | 34,986 | |||
Payable for open swap contracts | 449 | |||
Premium received on open non-centrally cleared swap contracts | 291,522 | |||
Payable to affiliates: | ||||
Investment adviser fee | 1,731,336 | |||
Accrued expenses | 2,452,293 | |||
Total liabilities | $ | 816,042,145 | ||
Commitments and Contingencies (Note 13) | ||||
Auction preferred shares (10,665 shares outstanding) at liquidation value plus cumulative unpaid dividends | $ | 266,734,546 | ||
Net assets applicable to common shares | $ | 1,712,583,026 | ||
| Sources of Net Assets | ||||
Common shares, $0.01 par value, unlimited number of shares authorized, 116,147,018 shares issued and outstanding | $ | 1,161,470 | ||
Additional paid-in capital | 1,827,864,804 | |||
Accumulated distributions in excess of net investment income | (5,545,653 | ) | ||
Accumulated net realized loss | (96,724,100 | ) | ||
Net unrealized depreciation | (14,173,495 | ) | ||
Net assets applicable to common shares | $ | 1,712,583,026 | ||
| Net Asset Value Per Common Share | ||||
($1,712,583,026 ÷ 116,147,018 common shares issued and outstanding) | $ | 14.74 | ||
| 53 | See Notes to Financial Statements. |
Eaton Vance
Limited Duration Income Fund
March 31, 2018
Statement of Operations
| Investment Income | Year Ended March 31, 2018 | |||
Interest and other income (net of foreign taxes, $2,726) | $ | 131,722,219 | ||
Dividends | 1,706,983 | |||
Dividends from affiliated investment | 751,124 | |||
Total investment income | $ | 134,180,326 | ||
| Expenses | ||||
Investment adviser fee | $ | 20,550,606 | ||
Trustees’ fees and expenses | 101,500 | |||
Custodian fee | 826,932 | |||
Transfer and dividend disbursing agent fees | 18,880 | |||
Legal and accounting services | 253,459 | |||
Printing and postage | 569,704 | |||
Interest expense and fees | 17,550,162 | |||
Preferred shares service fee | 300,449 | |||
Miscellaneous | 163,921 | |||
Total expenses | $ | 40,335,613 | ||
Net investment income | $ | 93,844,713 | ||
| Realized and Unrealized Gain (Loss) | ||||
Net realized gain (loss) — | ||||
Investment transactions | $ | 6,522,600 | ||
Investment transactions — affiliated investment | (22,419 | ) | ||
Financial futures contracts | 1,068,772 | |||
Swap contracts | 564,862 | |||
Foreign currency transactions | 653,826 | |||
Forward foreign currency exchange contracts | (8,249,188 | ) | ||
Net realized gain | $ | 538,453 | ||
Change in unrealized appreciation (depreciation) — | ||||
Investments | $ | (19,866,373 | ) | |
Investments — affiliated investment | (396 | ) | ||
Financial futures contracts | (932,102 | ) | ||
Swap contracts | 366,570 | |||
Foreign currency | (14,774 | ) | ||
Forward foreign currency exchange contracts | 808,943 | |||
Net change in unrealized appreciation (depreciation) | $ | (19,638,132 | ) | |
Net realized and unrealized loss | $ | (19,099,679 | ) | |
Distributions to preferred shareholders | ||||
From net investment income | $ | (4,960,007 | ) | |
Net increase in net assets from operations | $ | 69,785,027 | ||
| 54 | See Notes to Financial Statements. |
Eaton Vance
Limited Duration Income Fund
March 31, 2018
Statements of Changes in Net Assets
| Year Ended March 31, | ||||||||
| Increase (Decrease) in Net Assets | 2018 | 2017 | ||||||
From operations — | ||||||||
Net investment income | $ | 93,844,713 | $ | 104,427,224 | ||||
Net realized gain | 538,453 | 200,734 | ||||||
Net change in unrealized appreciation (depreciation) | (19,638,132 | ) | 97,125,557 | |||||
Distributions to preferred shareholders — | ||||||||
From net investment income | (4,960,007 | ) | (2,084,005 | ) | ||||
Net increase in net assets from operations | $ | 69,785,027 | $ | 199,669,510 | ||||
Distributions to common shareholders — | ||||||||
From net investment income | $ | (95,060,901 | ) | $ | (115,811,864 | ) | ||
Tax return of capital | (17,276,495 | ) | (13,738,521 | ) | ||||
Total distributions to common shareholders | $ | (112,337,396 | ) | $ | (129,550,385 | ) | ||
Net increase (decrease) in net assets | $ | (42,552,369 | ) | $ | 70,119,125 | |||
| Net Assets Applicable to Common Shares | ||||||||
At beginning of year | $ | 1,755,135,395 | $ | 1,685,016,270 | ||||
At end of year | $ | 1,712,583,026 | $ | 1,755,135,395 | ||||
| Accumulated distributions in excess of net investment income included in net assets applicable to common shares | ||||||||
At end of year | $ | (5,545,653 | ) | $ | (196,946 | ) | ||
| 55 | See Notes to Financial Statements. |
Eaton Vance
Limited Duration Income Fund
March 31, 2018
Statement of Cash Flows
| Cash Flows From Operating Activities | Year Ended March 31, 2018 | |||
Net increase in net assets from operations | $ | 69,785,027 | ||
Distributions to preferred shareholders | 4,960,007 | |||
Net increase in net assets from operations excluding distributions to preferred shareholders | $ | 74,745,034 | ||
Adjustments to reconcile net increase in net assets from operations to net cash provided by operating activities: | ||||
Investments purchased | (1,232,322,801 | ) | ||
Investments sold and principal repayments | 1,158,386,500 | |||
Decrease in short-term investments, net | 43,547,089 | |||
Net amortization/accretion of premium (discount) | 16,668,371 | |||
Amortization of prepaid upfront fees on notes payable | 522,071 | |||
Decrease in deposits for financial futures contracts | 195,702 | |||
Increase in deposits for centrally cleared swap contracts | (1,196,911 | ) | ||
Decrease in deposits for OTC derivatives | 360,000 | |||
Increase in deposits for reverse repurchase agreements | (753,699 | ) | ||
Decrease in interest and dividends receivable | 436,485 | |||
Increase in dividends receivable from affiliated investment | (7,272 | ) | ||
Increase in receivable for open forward foreign currency exchange contracts | (648,955 | ) | ||
Decrease in receivable for open swap contracts | 84,510 | |||
Decrease in receivable for closed swap contracts | 145,390 | |||
Increase in tax reclaims receivable | (820 | ) | ||
Increase in prepaid expenses | (24,803 | ) | ||
Decrease in payable for variation margin on open financial futures contracts | (962,146 | ) | ||
Increase in payable for variation margin on open centrally cleared swap contracts | 23,150 | |||
Decrease in payable for open forward foreign currency exchange contracts | (159,988 | ) | ||
Increase in payable for open swap contracts | 449 | |||
Decrease in premium received on open non-centrally cleared swap contracts | (170,455 | ) | ||
Decrease in payable to affiliate for investment adviser fee | (10,318 | ) | ||
Increase in accrued expenses | 454,296 | |||
Increase in accrued interest on reverse repurchase agreements | 78,227 | |||
Decrease in unfunded loan commitments | (2,544,154 | ) | ||
Net change in unrealized (appreciation) depreciation from investments | 19,866,769 | |||
Net realized gain from investments | (6,500,181 | ) | ||
Net cash provided by operating activities | $ | 70,211,540 | ||
| Cash Flows From Financing Activities | ||||
Distributions paid to common shareholders, net of reinvestments | $ | (112,337,396 | ) | |
Cash distributions paid to preferred shareholders | (4,882,203 | ) | ||
Proceeds from notes payable | 182,000,000 | |||
Repayments of notes payable | (104,000,000 | ) | ||
Repayments of reverse repurchase agreements, net | (16,051,722 | ) | ||
Net cash used in financing activities | $ | (55,271,321 | ) | |
Net increase in cash* | $ | 14,940,219 | ||
Cash at beginning of year(1) | $ | 15,602,480 | ||
Cash at end of year(1) | $ | 30,542,699 | ||
| Supplemental disclosure of cash flow information: | ||||
Cash paid for interest and fees on borrowings and reverse repurchase agreements | $ | 16,483,836 | ||
| * | Includes net change in unrealized appreciation (depreciation) on foreign currency of $3,621. |
| (1) | Balance includes foreign currency, at value. |
| 56 | See Notes to Financial Statements. |
Eaton Vance
Limited Duration Income Fund
March 31, 2018
Financial Highlights
Selected data for a common share outstanding during the periods stated
| Year Ended March 31, | ||||||||||||||||||||
| 2018 | 2017 | 2016 | 2015 | 2014 | ||||||||||||||||
Net asset value — Beginning of year (Common shares) | $ | 15.110 | $ | 14.510 | $ | 16.010 | $ | 16.600 | $ | 16.860 | ||||||||||
| Income (Loss) From Operations | ||||||||||||||||||||
Net investment income(1) | $ | 0.808 | $ | 0.899 | $ | 0.979 | $ | 1.044 | $ | 1.018 | ||||||||||
Net realized and unrealized gain (loss) | (0.168 | ) | 0.834 | (1.278 | ) | (0.411 | ) | (0.055 | ) | |||||||||||
Distributions to preferred shareholders | ||||||||||||||||||||
From net investment income(1) | (0.043 | ) | (0.018 | ) | (0.007 | ) | (0.003 | ) | (0.003 | ) | ||||||||||
Total income (loss) from operations | $ | 0.597 | $ | 1.715 | $ | (0.306 | ) | $ | 0.630 | $ | 0.960 | |||||||||
| Less Distributions to Common Shareholders | ||||||||||||||||||||
From net investment income | $ | (0.818 | ) | $ | (0.991 | ) | $ | (1.114 | ) | $ | (1.197 | ) | $ | (1.178 | ) | |||||
Tax return of capital | (0.149 | ) | (0.124 | ) | (0.106 | ) | (0.023 | ) | (0.042 | ) | ||||||||||
Total distributions to common shareholders | $ | (0.967 | ) | $ | (1.115 | ) | $ | (1.220 | ) | $ | (1.220 | ) | $ | (1.220 | ) | |||||
Anti-dilutive effect of share repurchase program (see Note 6)(1) | $ | — | $ | — | $ | 0.026 | $ | — | $ | — | ||||||||||
Net asset value — End of year (Common shares) | $ | 14.740 | $ | 15.110 | $ | 14.510 | $ | 16.010 | $ | 16.600 | ||||||||||
Market value — End of year (Common shares) | $ | 13.020 | $ | 13.830 | $ | 13.180 | $ | 14.390 | $ | 15.250 | ||||||||||
Total Investment Return on Net Asset Value(2) | 4.72 | % | 12.99 | % | (0.62 | )% | 4.73 | % | 6.50 | % | ||||||||||
Total Investment Return on Market Value(2) | 0.99 | % | 13.85 | % | 0.44 | % | 2.47 | % | (3.53 | )% | ||||||||||
| 57 | See Notes to Financial Statements. |
Eaton Vance
Limited Duration Income Fund
March 31, 2018
Financial Highlights — continued
Selected data for a common share outstanding during the periods stated
| Year Ended March 31, | ||||||||||||||||||||
| Ratios/Supplemental Data | 2018 | 2017 | 2016 | 2015 | 2014 | |||||||||||||||
Net assets applicable to common shares, end of year (000’s omitted) | $ | 1,712,583 | $ | 1,755,135 | $ | 1,685,016 | $ | 1,881,988 | $ | 1,950,819 | ||||||||||
Ratios (as a percentage of average daily net assets applicable to common shares):(3)† | ||||||||||||||||||||
Expenses excluding interest and fees(4) | 1.30 | % | 1.32 | % | 1.37 | % | 1.35 | % | 1.27 | % | ||||||||||
Interest and fee expense(5) | 1.00 | % | 0.73 | % | 0.63 | % | 0.54 | % | 0.44 | % | ||||||||||
Total expenses(4) | 2.30 | % | 2.05 | % | 2.00 | % | 1.89 | % | 1.71 | % | ||||||||||
Net investment income | 5.36 | % | 6.01 | % | 6.49 | % | 6.44 | % | 6.16 | % | ||||||||||
Portfolio Turnover | 43 | % | 45 | % | 33 | % | 35 | % | 37 | % | ||||||||||
Senior Securities: | ||||||||||||||||||||
Total notes payable outstanding (in 000’s) | $ | 663,000 | $ | 585,000 | $ | 660,000 | $ | 803,200 | $ | 828,200 | ||||||||||
Asset coverage per $1,000 of notes payable(6) | $ | 3,985 | $ | 4,456 | $ | 3,957 | $ | 3,675 | $ | 3,677 | ||||||||||
Total preferred shares outstanding | 10,665 | 10,665 | 10,665 | 10,665 | 10,665 | |||||||||||||||
Asset coverage per preferred share(7) | $ | 71,059 | $ | 76,524 | $ | 70,461 | $ | 68,979 | $ | 69,546 | ||||||||||
Involuntary liquidation preference per preferred share(8) | $ | 25,000 | $ | 25,000 | $ | 25,000 | $ | 25,000 | $ | 25,000 | ||||||||||
Approximate market value per preferred share(8) | $ | 25,000 | $ | 25,000 | $ | 25,000 | $ | 25,000 | $ | 25,000 | ||||||||||
| (1) | Computed using average common shares outstanding. |
| (2) | Returns are historical and are calculated by determining the percentage change in net asset value or market value with all distributions reinvested. Distributions are assumed to be reinvested at prices obtained under the Fund’s dividend reinvestment plan. |
| (3) | Ratios do not reflect the effect of dividend payments to preferred shareholders. |
| (4) | Excludes the effect of custody fee credits, if any, of less than 0.005%. Effective September 1, 2015, custody fee credits, which were earned on cash deposit balances, were discontinued by the custodian. |
| (5) | Interest and fee expense relates to the notes payable, a portion of which was incurred to partially redeem the Fund’s APS (see Note 9), and the reverse repurchase agreements (see Note 10). |
| (6) | Calculated by subtracting the Fund’s total liabilities (not including the notes payable and preferred shares) from the Fund’s total assets, and dividing the result by the notes payable balance in thousands. |
| (7) | Calculated by subtracting the Fund’s total liabilities (not including the notes payable and preferred shares) from the Fund’s total assets, dividing the result by the sum of the value of the notes payable and liquidation value of the preferred shares, and multiplying the result by the liquidation value of one preferred share. Such amount equates to 284%, 306%, 282%, 276% and 278% at March 31, 2018, 2017, 2016, 2015 and 2014, respectively. |
| (8) | Plus accumulated and unpaid dividends. |
| † | Ratios based on net assets applicable to common shares plus preferred shares and borrowings are presented below. Ratios do not reflect the effect of dividend payments to preferred shareholders and exclude the effect of custody fee credits, if any. |
| Year Ended March 31, | ||||||||||||||||||||
| 2018 | 2017 | 2016 | 2015 | 2014 | ||||||||||||||||
Expenses excluding interest and fees | 0.87 | % | 0.87 | % | 0.88 | % | 0.86 | % | 0.86 | % | ||||||||||
Interest and fee expense | 0.67 | % | 0.49 | % | 0.40 | % | 0.34 | % | 0.30 | % | ||||||||||
Total expenses | 1.54 | % | 1.36 | % | 1.28 | % | 1.20 | % | 1.16 | % | ||||||||||
Net investment income | 3.58 | % | 3.99 | % | 4.15 | % | 4.10 | % | 4.16 | % | ||||||||||
| 58 | See Notes to Financial Statements. |
Eaton Vance
Limited Duration Income Fund
March 31, 2018
Notes to Financial Statements
1 Significant Accounting Policies
Eaton Vance Limited Duration Income Fund (the Fund) is a Massachusetts business trust registered under the Investment Company Act of 1940, as amended (the 1940 Act), as a diversified, closed-end management investment company. The Fund’s primary investment objective is to provide a high level of current income. The Fund may, as a secondary objective, also seek capital appreciation to the extent it is consistent with its primary objective.
The following is a summary of significant accounting policies of the Fund. The policies are in conformity with accounting principles generally accepted in the United States of America (U.S. GAAP). The Fund is an investment company and follows accounting and reporting guidance in the Financial Accounting Standards Board (FASB) Accounting Standards Codification Topic 946.
A Investment Valuation — The following methodologies are used to determine the market value or fair value of investments.
Senior Floating-Rate Loans. Interests in senior floating-rate loans (Senior Loans) for which reliable market quotations are readily available are valued generally at the average mean of bid and ask quotations obtained from a third party pricing service. Other Senior Loans are valued at fair value by the investment adviser under procedures approved by the Trustees. In fair valuing a Senior Loan, the investment adviser utilizes one or more of the valuation techniques described in (i) through (iii) below to assess the likelihood that the borrower will make a full repayment of the loan underlying such Senior Loan relative to yields on other Senior Loans issued by companies of comparable credit quality. If the investment adviser believes that there is a reasonable likelihood of full repayment, the investment adviser will determine fair value using a matrix pricing approach that considers the yield on the Senior Loan. If the investment adviser believes there is not a reasonable likelihood of full repayment, the investment adviser will determine fair value using analyses that include, but are not limited to: (i) a comparison of the value of the borrower’s outstanding equity and debt to that of comparable public companies; (ii) a discounted cash flow analysis; or (iii) when the investment adviser believes it is likely that a borrower will be liquidated or sold, an analysis of the terms of such liquidation or sale. In certain cases, the investment adviser will use a combination of analytical methods to determine fair value, such as when only a portion of a borrower’s assets are likely to be sold. In conducting its assessment and analyses for purposes of determining fair value of a Senior Loan, the investment adviser will use its discretion and judgment in considering and appraising relevant factors. Fair value determinations are made by the portfolio managers of the Fund based on information available to such managers. The portfolio managers of other funds managed by the investment adviser that invest in Senior Loans may not possess the same information about a Senior Loan borrower as the portfolio managers of the Fund. At times, the fair value of a Senior Loan determined by the portfolio managers of other funds managed by the investment adviser that invest in Senior Loans may vary from the fair value of the same Senior Loan determined by the portfolio managers of the Fund. The fair value of each Senior Loan is periodically reviewed and approved by the investment adviser’s Valuation Committee and by the Trustees based upon procedures approved by the Trustees. Junior Loans (i.e., subordinated loans and second lien loans) are valued in the same manner as Senior Loans.
Debt Obligations. Debt obligations are generally valued on the basis of valuations provided by third party pricing services, as derived from such services’ pricing models. Inputs to the models may include, but are not limited to, reported trades, executable bid and asked prices, broker/dealer quotations, prices or yields of securities with similar characteristics, interest rates, anticipated prepayments, benchmark curves or information pertaining to the issuer, as well as industry and economic events. The pricing services may use a matrix approach, which considers information regarding securities with similar characteristics to determine the valuation for a security. Short-term obligations purchased with a remaining maturity of sixty days or less for which a valuation from a third party pricing service is not readily available may be valued at amortized cost, which approximates fair value.
Equity Securities. Equity securities listed on a U.S. securities exchange generally are valued at the last sale or closing price on the day of valuation or, if no sales took place on such date, at the mean between the closing bid and asked prices therefore on the exchange where such securities are principally traded. Equity securities listed on the NASDAQ Global or Global Select Market generally are valued at the NASDAQ official closing price. Unlisted or listed securities for which closing sales prices or closing quotations are not available are valued at the mean between the latest available bid and asked prices or, in the case of preferred equity securities that are not listed or traded in the over-the-counter market, by a third party pricing service that uses various techniques that consider factors including, but not limited to, prices or yields of securities with similar characteristics, benchmark yields, broker/dealer quotes, quotes of underlying common stock, issuer spreads, as well as industry and economic events.
Derivatives. Financial futures contracts are valued at the closing settlement price established by the board of trade or exchange on which they are traded. Forward foreign currency exchange contracts are generally valued at the mean of the average bid and average asked prices that are reported by currency dealers to a third party pricing service at the valuation time. Such third party pricing service valuations are supplied for specific settlement periods and the Fund’s forward foreign currency exchange contracts are valued at an interpolated rate between the closest preceding and subsequent settlement period reported by the third party pricing service. Swaps are normally valued using valuations provided by a third party pricing service. Such pricing service valuations are based on the present value of fixed and projected floating rate cash flows over the term of the swap contract, and in the case of credit default swaps, based on credit spread quotations obtained from broker/dealers and expected default recovery rates determined by the pricing service using proprietary models. Future cash flows on swaps are discounted to their present value using swap rates provided by electronic data services or by broker/dealers.
Foreign Securities and Currencies. Foreign securities and currencies are valued in U.S. dollars, based on foreign currency exchange rate quotations supplied by a third party pricing service. The pricing service uses a proprietary model to determine the exchange rate. Inputs to the model include reported trades and implied bid/ask spreads. The daily valuation of exchange-traded foreign securities generally is determined as of the close of trading on the principal exchange on which such securities trade. Events occurring after the close of trading on foreign exchanges may result in adjustments to the valuation of foreign securities to more accurately reflect their fair value as of the close of regular trading on the New York Stock Exchange. When valuing foreign equity securities that meet certain criteria, the Fund’s Trustees have approved the use of a fair value service that values such securities to reflect
| 59 |
Eaton Vance
Limited Duration Income Fund
March 31, 2018
Notes to Financial Statements — continued
market trading that occurs after the close of the applicable foreign markets of comparable securities or other instruments that have a strong correlation to the fair-valued securities.
Affiliated Fund. The Fund may invest in Eaton Vance Cash Reserves Fund, LLC (Cash Reserves Fund), an affiliated investment company managed by Eaton Vance Management (EVM). While Cash Reserves Fund is not a registered money market mutual fund, it conducts all of its investment activities in accordance with the requirements of Rule 2a-7 under the 1940 Act. Investments in Cash Reserves Fund are valued at the closing net asset value per unit on the valuation day. Cash Reserves Fund generally values its investment securities based on available market quotations provided by a third party pricing service.
Fair Valuation. Investments for which valuations or market quotations are not readily available or are deemed unreliable are valued at fair value using methods determined in good faith by or at the direction of the Trustees of the Fund in a manner that fairly reflects the security’s value, or the amount that the Fund might reasonably expect to receive for the security upon its current sale in the ordinary course. Each such determination is based on a consideration of relevant factors, which are likely to vary from one pricing context to another. These factors may include, but are not limited to, the type of security, the existence of any contractual restrictions on the security’s disposition, the price and extent of public trading in similar securities of the issuer or of comparable companies or entities, quotations or relevant information obtained from broker/dealers or other market participants, information obtained from the issuer, analysts, and/or the appropriate stock exchange (for exchange-traded securities), an analysis of the company’s or entity’s financial condition, and an evaluation of the forces that influence the issuer and the market(s) in which the security is purchased and sold.
B Investment Transactions — Investment transactions for financial statement purposes are accounted for on a trade date basis. Realized gains and losses on investments sold are determined on the basis of identified cost.
C Income — Interest income is recorded on the basis of interest accrued, adjusted for amortization of premium or accretion of discount. Fees associated with loan amendments are recognized immediately. Dividend income is recorded on the ex-dividend date for dividends received in cash and/or securities. Withholding taxes on foreign interest have been provided for in accordance with the Fund’s understanding of the applicable countries’ tax rules and rates. Distributions from investment companies are recorded as dividend income, capital gains or return of capital based on the nature of the distribution.
D Federal Taxes — The Fund’s policy is to comply with the provisions of the Internal Revenue Code applicable to regulated investment companies and to distribute to shareholders each year substantially all of its net investment income, and all or substantially all of its net realized capital gains. Accordingly, no provision for federal income or excise tax is necessary.
As of March 31, 2018, the Fund had no uncertain tax positions that would require financial statement recognition, de-recognition, or disclosure. The Fund files a U.S. federal income tax return annually after its fiscal year-end, which is subject to examination by the Internal Revenue Service for a period of three years from the date of filing.
E Foreign Currency Translation — Investment valuations, other assets, and liabilities initially expressed in foreign currencies are translated each business day into U.S. dollars based upon current exchange rates. Purchases and sales of foreign investment securities and income and expenses denominated in foreign currencies are translated into U.S. dollars based upon currency exchange rates in effect on the respective dates of such transactions. Recognized gains or losses on investment transactions attributable to changes in foreign currency exchange rates are recorded for financial statement purposes as net realized gains and losses on investments. That portion of unrealized gains and losses on investments that results from fluctuations in foreign currency exchange rates is not separately disclosed.
F Unfunded Loan Commitments — The Fund may enter into certain loan agreements all or a portion of which may be unfunded. The Fund is obligated to fund these commitments at the borrower’s discretion. These commitments are disclosed in the accompanying Portfolio of Investments. At March 31, 2018, the Fund had sufficient cash and/or securities to cover these commitments.
G Use of Estimates — The preparation of the financial statements in conformity with U.S. GAAP requires management to make estimates and assumptions that affect the reported amounts of assets and liabilities at the date of the financial statements and the reported amounts of income and expense during the reporting period. Actual results could differ from those estimates.
H Indemnifications — Under the Fund’s organizational documents, its officers and Trustees may be indemnified against certain liabilities and expenses arising out of the performance of their duties to the Fund. Under Massachusetts law, if certain conditions prevail, shareholders of a Massachusetts business trust (such as the Fund) could be deemed to have personal liability for the obligations of the Fund. However, the Fund’s Declaration of Trust contains an express disclaimer of liability on the part of Fund shareholders and the By-laws provide that the Fund shall assume the defense on behalf of any Fund shareholders. Moreover, the By-laws also provide for indemnification out of Fund property of any shareholder held personally liable solely by reason of being or having been a shareholder for all loss or expense arising from such liability. Additionally, in the normal course of business, the Fund enters into agreements with service providers that may contain indemnification clauses. The Fund’s maximum exposure under these arrangements is unknown as this would involve future claims that may be made against the Fund that have not yet occurred.
I Financial Futures Contracts — Upon entering into a financial futures contract, the Fund is required to deposit with the broker, either in cash or securities, an amount equal to a certain percentage of the contract amount (initial margin). Subsequent payments, known as variation margin, are made or received by the Fund each business day, depending on the daily fluctuations in the value of the underlying security, and are recorded as unrealized gains or losses by the Fund. Gains (losses) are realized upon the expiration or closing of the financial futures contracts. Should market conditions change unexpectedly,
| 60 |
Eaton Vance
Limited Duration Income Fund
March 31, 2018
Notes to Financial Statements — continued
the Fund may not achieve the anticipated benefits of the financial futures contracts and may realize a loss. Futures contracts have minimal counterparty risk as they are exchange traded and the clearinghouse for the exchange is substituted as the counterparty, guaranteeing counterparty performance.
J Forward Foreign Currency Exchange Contracts — The Fund may enter into forward foreign currency exchange contracts for the purchase or sale of a specific foreign currency at a fixed price on a future date. The forward foreign currency exchange contracts are adjusted by the daily exchange rate of the underlying currency and any gains or losses are recorded as unrealized until such time as the contracts have been closed. Risks may arise upon entering these contracts from the potential inability of counterparties to meet the terms of their contracts and from movements in the value of a foreign currency relative to the U.S. dollar.
K Interest Rate Swaps — Swap contracts are privately negotiated agreements between the Fund and a counterparty. Certain swap contracts may be centrally cleared (“centrally cleared swaps”), whereby all payments made or received by the Fund pursuant to the contract are with a central clearing party (CCP) rather than the original counterparty. The CCP guarantees the performance of the original parties to the contract. Upon entering into centrally cleared swaps, the Fund is required to deposit with the CCP, either in cash or securities, an amount of initial margin determined by the CCP, which is subject to adjustment.
Pursuant to interest rate swap agreements, the Fund either makes floating-rate payments to the counterparty (or CCP in the case of centrally cleared swaps) based on a benchmark interest rate in exchange for fixed-rate payments or the Fund makes fixed-rate payments to the counterparty (or CCP in the case of a centrally cleared swap) in exchange for payments on a floating benchmark interest rate. Payments received or made are recorded as realized gains or losses. During the term of the outstanding swap agreement, changes in the underlying value of the swap are recorded as unrealized gains or losses. For centrally cleared swaps, the daily change in valuation is recorded as a receivable or payable for variation margin and settled in cash with the CCP daily. The value of the swap is determined by changes in the relationship between two rates of interest. The Fund is exposed to credit loss in the event of non-performance by the swap counterparty. In the case of centrally cleared swaps, counterparty risk is minimal due to protections provided by the CCP. Risk may also arise from movements in interest rates.
L Credit Default Swaps — When the Fund is the buyer of a credit default swap contract, the Fund is entitled to receive the par (or other agreed-upon) value of a referenced debt obligation (or basket of debt obligations) from the counterparty (or CCP in the case of a centrally cleared swap) to the contract if a credit event by a third party, such as a U.S. or foreign corporate issuer or sovereign issuer, on the debt obligation occurs. In return, the Fund pays the counterparty a periodic stream of payments over the term of the contract provided that no credit event has occurred. If no credit event occurs, the Fund would have spent the stream of payments and received no proceeds from the contract. When the Fund is the seller of a credit default swap contract, it receives the stream of payments, but is obligated to pay to the buyer of the protection an amount up to the notional amount of the swap and in certain instances take delivery of securities of the reference entity upon the occurrence of a credit event, as defined under the terms of that particular swap agreement. Credit events are contract specific but may include bankruptcy, failure to pay, restructuring, obligation acceleration and repudiation/moratorium. If the Fund is a seller of protection and a credit event occurs, the maximum potential amount of future payments that the Fund could be required to make would be an amount equal to the notional amount of the agreement. This potential amount would be partially offset by any recovery value of the respective referenced obligation, or net amount received from the settlement of a buy protection credit default swap agreement entered into by the Fund for the same referenced obligation. As the seller, the Fund may create economic leverage to its portfolio because, in addition to its total net assets, the Fund is subject to investment exposure on the notional amount of the swap. The interest fee paid or received on the swap contract, which is based on a specified interest rate on a fixed notional amount, is accrued daily as a component of unrealized appreciation (depreciation) and is recorded as realized gain upon receipt or realized loss upon payment. The Fund also records an increase or decrease to unrealized appreciation (depreciation) in an amount equal to the daily valuation. For centrally cleared swaps, the daily change in valuation is recorded as a receivable or payable for variation margin and settled in cash with the CCP daily. All upfront payments, if any, are amortized over the life of the swap contract as realized gains or losses. Those upfront payments that are paid or received, typically for non-centrally cleared swaps, are recorded as other assets or other liabilities, respectively, net of amortization. For financial reporting purposes, unamortized upfront payments, if any, are netted with unrealized appreciation or depreciation on swap contracts to determine the market value of swaps as presented in Notes 8 and 12. The Fund segregates assets in the form of cash or liquid securities in an amount equal to the notional amount of the credit default swaps of which it is the seller. The Fund segregates assets in the form of cash or liquid securities in an amount equal to any unrealized depreciation of the credit default swaps of which it is the buyer, marked-to-market on a daily basis. These transactions involve certain risks, including the risk that the seller may be unable to fulfill the transaction. In the case of centrally cleared swaps, counterparty risk is minimal due to protections provided by the CCP.
M When-Issued Securities and Delayed Delivery Transactions — The Fund may purchase or sell securities on a delayed delivery or when-issued basis. Payment and delivery may take place after the customary settlement period for that security. At the time the transaction is negotiated, the price of the security that will be delivered is fixed. The Fund maintains cash and/or security positions for these commitments such that sufficient liquid assets will be available to make payments upon settlement. Securities purchased on a delayed delivery or when-issued basis are marked-to-market daily and begin earning interest on settlement date. Losses may arise due to changes in the market value of the underlying securities or if the counterparty does not perform under the contract.
N Reverse Repurchase Agreements — Under a reverse repurchase agreement, the Fund temporarily transfers possession of a portfolio security to another party, such as a bank or broker/dealer, in return for cash. At the same time, the Fund agrees to repurchase the security at an agreed upon time and price, which reflects an interest payment. In periods of increased demand for a security, the Fund may receive a payment from the counterparty for the use of the security, which is recorded as interest income. Because the Fund retains effective control over the transferred security, the transaction is accounted for as a
| 61 |
Eaton Vance
Limited Duration Income Fund
March 31, 2018
Notes to Financial Statements — continued
secured borrowing. The Fund may enter into such agreements when it believes it is able to invest the cash acquired at a rate higher than the cost of the agreement, which would increase earned income. When the Fund enters into a reverse repurchase agreement, any fluctuations in the market value of either the securities transferred to another party or the securities in which the proceeds may be invested would affect the market value of the Fund’s assets. Because reverse repurchase agreements may be considered to be the practical equivalent of borrowing funds (and the counterparty making a loan), they constitute a form of leverage. The Fund segregates cash or liquid assets equal to its obligation to repurchase the security. During the term of the agreement, the Fund may also be obligated to pledge additional cash and/or securities in the event of a decline in the fair value of the transferred security. In the event the counterparty to a reverse repurchase agreement becomes insolvent, recovery of the security transferred by the Fund may be delayed or the Fund may incur a loss equal to the amount by which the value of the security transferred by the Fund exceeds the repurchase price payable by the Fund.
O Stripped Mortgage-Backed Securities — The Fund may invest in Interest Only (IO) and Principal Only (PO) securities, a form of stripped mortgage-backed securities, whereby the IO security receives all the interest and the PO security receives all the principal on a pool of mortgage assets. The yield to maturity on an IO security is extremely sensitive to the rate of principal payments (including prepayments) on the related underlying mortgage assets, and a rapid rate of principal payments may have a material adverse effect on the yield to maturity from these securities. If the underlying mortgages experience greater than anticipated prepayments of principal, the Fund may fail to recoup its initial investment in an IO security. The market value of IO and PO securities can be unusually volatile due to changes in interest rates.
P Statement of Cash Flows — The cash amount shown in the Statement of Cash Flows of the Fund is the amount included in the Fund’s Statement of Assets and Liabilities and represents the unrestricted cash on hand at its custodian and does not include any short-term investments.
2 Auction Preferred Shares
The Fund issued Auction Preferred Shares (APS) on July 25, 2003 in a public offering. Dividends on the APS, which accrue daily, are cumulative at rates which are reset every seven days by an auction, unless a special dividend period has been set. Series of APS are identical in all respects except for the reset dates of the dividend rates. If the APS auctions do not successfully clear, the dividend payment rate over the next period for the APS holders is set at a specified maximum applicable rate until such time as the APS auctions are successful. Auctions have not cleared since February 13, 2008 and the rate since that date has been the maximum applicable rate (see Note 3). The maximum applicable rate on the APS is 150% of the “AA” Financial Composite Commercial Paper Rate at the date of the auction. The stated spread over the reference benchmark rate is determined based on the credit rating of the APS.
The number of APS issued and outstanding as of March 31, 2018 is as follows:
| APS Issued and Outstanding | ||||
Series A | 2,133 | |||
Series B | 2,133 | |||
Series C | 2,133 | |||
Series D | 2,133 | |||
Series E | 2,133 | |||
The APS are redeemable at the option of the Fund at a redemption price equal to $25,000 per share, plus accumulated and unpaid dividends, on any dividend payment date. The APS are also subject to mandatory redemption at a redemption price equal to $25,000 per share, plus accumulated and unpaid dividends, if the Fund is in default for an extended period on its asset maintenance requirements with respect to the APS. If the dividends on the APS remain unpaid in an amount equal to two full years’ dividends, the holders of the APS as a class have the right to elect a majority of the Board of Trustees. In general, the holders of the APS and the common shares have equal voting rights of one vote per share, except that the holders of the APS, as a separate class, have the right to elect at least two members of the Board of Trustees. The APS have a liquidation preference of $25,000 per share, plus accumulated and unpaid dividends. The Fund is required to maintain certain asset coverage with respect to the APS as defined in the Fund’s By-Laws and the 1940 Act. The Fund pays an annual fee up to 0.15% of the liquidation value of the APS to broker/dealers as a service fee if the auctions are unsuccessful; otherwise, the annual fee is 0.25%.
3 Distributions to Shareholders and Income Tax Information
The Fund intends to make monthly distributions of net investment income to common shareholders, after payment of any dividends on any outstanding APS. In addition, at least annually, the Fund intends to distribute all or substantially all of its net realized capital gains (reduced by available capital loss carryforwards from prior years). Distributions to common shareholders are recorded on the ex-dividend date. Distributions to preferred shareholders are
| 62 |
Eaton Vance
Limited Duration Income Fund
March 31, 2018
Notes to Financial Statements — continued
recorded daily and are payable at the end of each dividend period. The dividend rates for the APS at March 31, 2018, and the amount of dividends accrued (including capital gains, if any) to APS shareholders, average APS dividend rates, and dividend rate ranges for the year then ended were as follows:
| APS Dividend Rates at March 31, 2018 | Dividends Accrued to APS Shareholders | Average APS Dividend Rates | Dividend Ranges (%) | |||||||||||||
Series A | 2.78 | % | $ | 983,194 | 1.84 | % | 1.10–2.78 | |||||||||
Series B | 2.63 | 995,041 | 1.87 | 1.31–2.66 | ||||||||||||
Series C | 2.81 | 993,405 | 1.86 | 1.37–2.81 | ||||||||||||
Series D | 2.74 | 998,308 | 1.87 | 1.34–2.74 | ||||||||||||
Series E | 2.75 | 990,059 | 1.86 | 1.25–2.75 | ||||||||||||
Beginning February 13, 2008 and consistent with the patterns in the broader market for auction-rate securities, the Fund’s APS auctions were unsuccessful in clearing due to an imbalance of sell orders over bids to buy the APS. As a result, the dividend rates of the APS were reset to the maximum applicable rates. The table above reflects such maximum dividend rate for each series as of March 31, 2018.
Distributions to shareholders are determined in accordance with income tax regulations, which may differ from U.S. GAAP. As required by U.S. GAAP, only distributions in excess of tax basis earnings and profits are reported in the financial statements as a return of capital. Permanent differences between book and tax accounting relating to distributions are reclassified to paid-in capital. For tax purposes, distributions from short-term capital gains are considered to be from ordinary income.
The tax character of distributions declared for the years ended March 31, 2018 and March 31, 2017 was as follows:
| Year Ended March 31, | ||||||||
| 2018 | 2017 | |||||||
Distributions declared from: | ||||||||
Ordinary income | $ | 100,020,908 | $ | 117,895,869 | ||||
Tax return of capital | $ | 17,276,495 | $ | 13,738,521 | ||||
During the year ended March 31, 2018, accumulated net realized loss was decreased by $96,094,475, accumulated distributions in excess of net investment income was decreased by $827,488 and paid-in capital was decreased by $96,921,963 due to expired capital loss carryforwards and differences between book and tax accounting, primarily for foreign currency gain (loss), paydown gain (loss), swap contracts, tax straddle transactions, premium amortization, accretion of market discount, defaulted bond interest and investments in partnerships.These reclassifications had no effect on the net assets or net asset value per share of the Fund.
As of March 31, 2018, the components of distributable earnings (accumulated losses) on a tax basis were as follows:
Capital loss carryforwards and deferred capital losses | $ | (88,305,981 | ) | |
Net unrealized depreciation | $ | (28,137,267 | ) |
The differences between components of distributable earnings (accumulated losses) on a tax basis and the amounts reflected in the Statement of Assets and Liabilities are primarily due to wash sales, foreign currency transactions, futures contracts, swap contracts, investments in partnerships, premium amortization and accretion of market discount.
At March 31, 2018, the Fund, for federal income tax purposes, had capital loss carryforwards of $21,436,361 and deferred capital losses of $66,869,620 which would reduce its taxable income arising from future net realized gains on investment transactions, if any, to the extent permitted by the Internal Revenue Code, and thus would reduce the amount of distributions to shareholders, which would otherwise be necessary to relieve the Fund of any liability for federal income or excise tax. The capital loss carryforwards will expire on March 31, 2019 and their character is short-term. Under tax regulations, capital losses incurred in taxable years beginning after December 2010 are considered deferred capital losses and are treated as arising on the first day of the Fund’s next taxable year, retaining the same short-term or long-term character as when originally deferred. Deferred capital losses are required to be used prior to capital loss carryforwards, which carry an expiration date. As a result of this ordering rule, capital loss carryforwards may be more likely to expire unused. Of the deferred capital losses at March 31, 2018, $66,869,620 are long-term.
| 63 |
Eaton Vance
Limited Duration Income Fund
March 31, 2018
Notes to Financial Statements — continued
The cost and unrealized appreciation (depreciation) of investments, including open derivative contracts, of the Fund at March 31, 2018, as determined on a federal income tax basis, were as follows:
Aggregate cost | $ | 2,761,999,943 | ||
Gross unrealized appreciation | $ | 43,786,767 | ||
Gross unrealized depreciation | (71,731,059 | ) | ||
Net unrealized depreciation | $ | (27,944,292 | ) | |
4 Investment Adviser Fee and Other Transactions with Affiliates
The investment adviser fee is earned by EVM as compensation for management and investment advisory services rendered to the Fund. The fee is computed at an annual rate of 0.75% of the Fund’s average weekly gross assets and is payable monthly. Gross assets as referred to herein represent net assets plus obligations attributable to investment leverage. For the year ended March 31, 2018, the Fund’s investment adviser fee amounted to $20,550,606. The Fund invests its cash in Cash Reserves Fund. EVM does not currently receive a fee for advisory services provided to Cash Reserves Fund. EVM also serves as administrator of the Fund, but receives no compensation.
During the year ended March 31, 2018, EVM reimbursed the Fund $10,368 for a trading error. The amount of the reimbursement by EVM had an impact on total return on net asset value of less than 0.01%.
Trustees and officers of the Fund who are members of EVM’s organization receive remuneration for their services to the Fund out of the investment adviser fee. Trustees of the Fund who are not affiliated with EVM may elect to defer receipt of all or a percentage of their annual fees in accordance with the terms of the Trustees Deferred Compensation Plan. For the year ended March 31, 2018, no significant amounts have been deferred. Certain officers and Trustees of the Fund are officers of EVM.
5 Purchases and Sales of Investments
Purchases and sales of investments, other than short-term obligations and including maturities, paydowns and principal repayments on Senior Loans, for the year ended March 31, 2018 were as follows:
| Purchases | Sales | |||||||
Investments (non-U.S. Government) | $ | 900,093,674 | $ | 929,701,392 | ||||
U.S. Government and Agency Securities | 324,043,880 | 222,398,594 | ||||||
| $ | 1,224,137,554 | $ | 1,152,099,986 | |||||
6 Common Shares of Beneficial Interest
The Fund may issue common shares pursuant to its dividend reinvestment plan. There were no common shares issued by the Fund for the years ended March 31, 2018 and March 31, 2017.
On November 11, 2013, the Board of Trustees of the Fund authorized the repurchase by the Fund of up to 10% of its then currently outstanding common shares in open-market transactions at a discount to net asset value. The repurchase program does not obligate the Fund to purchase a specific amount of shares. There were no repurchases of common shares by the Fund for the years ended March 31, 2018 and March 31, 2017.
7 Restricted Securities
At March 31, 2018, the Fund owned the following securities (representing 0.1% of net assets applicable to common shares) which were restricted as to public resale and not registered under the Securities Act of 1933 (excluding Rule 144A securities). The Fund has various registration rights (exercisable
| 64 |
Eaton Vance
Limited Duration Income Fund
March 31, 2018
Notes to Financial Statements — continued
under a variety of circumstances) with respect to these securities. The value of these securities is determined based on valuations provided by brokers when available, or if not available, they are valued at fair value using methods determined in good faith by or at the direction of the Trustees.
| Description | Date of Acquisition | Shares | Cost | Value | ||||||||||||
Common Stocks | ||||||||||||||||
Nine Point Energy Holdings, Inc. | 7/15/14 | 25,410 | $ | 1,370,397 | $ | 187,526 | ||||||||||
Convertible Preferred Stocks | ||||||||||||||||
Nine Point Energy Holdings, Inc., Series A, 12.00% | 5/26/17 | 555 | $ | 555,000 | $ | 814,723 | ||||||||||
Total Restricted Securities | $ | 1,925,397 | $ | 1,002,249 | ||||||||||||
8 Financial Instruments
The Fund may trade in financial instruments with off-balance sheet risk in the normal course of its investing activities. These financial instruments may include forward foreign currency exchange contracts, financial futures contracts and swap contracts and may involve, to a varying degree, elements of risk in excess of the amounts recognized for financial statement purposes. The notional or contractual amounts of these instruments represent the investment the Fund has in particular classes of financial instruments and do not necessarily represent the amounts potentially subject to risk. The measurement of the risks associated with these instruments is meaningful only when all related and offsetting transactions are considered. A summary of obligations under these financial instruments at March 31, 2018 is included in the Portfolio of Investments. At March 31, 2018, the Fund had sufficient cash and/or securities to cover commitments under these contracts.
In the normal course of pursuing its investment objectives, the Fund is subject to the following risks:
Credit Risk: The Fund enters into credit default swap contracts to enhance total return and/or as a substitute for the purchase of securities.
Foreign Exchange Risk: The Fund holds foreign currency denominated investments. The value of these investments and related receivables and payables may change due to future changes in foreign currency exchange rates. To hedge against this risk, the Fund enters into forward foreign currency exchange contracts.
Interest Rate Risk: The Fund utilizes various interest rate derivatives including futures contracts and interest rate swaps to manage the duration of its portfolio and to hedge against fluctuations in securities prices due to interest rates.
The Fund enters into over-the-counter (OTC) derivatives that may contain provisions whereby the counterparty may terminate the contract under certain conditions, including but not limited to a decline in the Fund’s net assets below a certain level over a certain period of time, which would trigger a payment by the Fund for those derivatives in a liability position. At March 31, 2018, the fair value of derivatives with credit-related contingent features in a net liability position was $212,338. The aggregate fair value of assets pledged as collateral by the Fund for such liability was $470,000 at March 31, 2018.
The OTC derivatives in which the Fund invests are subject to the risk that the counterparty to the contract fails to perform its obligations under the contract. To mitigate this risk, the Fund has entered into an International Swaps and Derivatives Association, Inc. Master Agreement (“ISDA Master Agreement”) or similar agreement with substantially all its derivative counterparties. An ISDA Master Agreement is a bilateral agreement between the Fund and a counterparty that governs certain OTC derivatives and typically contains, among other things, set-off provisions in the event of a default and/or termination event as defined under the relevant ISDA Master Agreement. Under an ISDA Master Agreement, the Fund may, under certain circumstances, offset with the counterparty certain derivative financial instruments’ payables and/or receivables with collateral held and/or posted and create one single net payment. The provisions of the ISDA Master Agreement typically permit a single net payment in the event of default including the bankruptcy or insolvency of the counterparty. However, bankruptcy or insolvency laws of a particular jurisdiction may impose restrictions on or prohibitions against the right of offset in bankruptcy or insolvency. Certain ISDA Master Agreements allow counterparties to OTC derivatives to terminate derivative contracts prior to maturity in the event the Fund’s net assets decline by a stated percentage or the Fund fails to meet the terms of its ISDA Master Agreements, which would cause the counterparty to accelerate payment by the Fund of any net liability owed to it.
The collateral requirements for derivatives traded under an ISDA Master Agreement are governed by a Credit Support Annex to the ISDA Master Agreement. Collateral requirements are determined at the close of business each day and are typically based on changes in market values for each transaction under an ISDA Master Agreement and netted into one amount for such agreement. Generally, the amount of collateral due from or to a counterparty is subject to a minimum transfer threshold amount before a transfer is required, which may vary by counterparty. Collateral pledged for the benefit of the Fund and/or counterparty is held in segregated accounts by the Fund’s custodian and cannot be sold, re-pledged, assigned or otherwise used while pledged. The portion
| 65 |
Eaton Vance
Limited Duration Income Fund
March 31, 2018
Notes to Financial Statements — continued
of such collateral representing cash, if any, is reflected as deposits for derivatives collateral and, in the case of cash pledged by a counterparty for the benefit of the Fund, a corresponding liability on the Statement of Assets and Liabilities. Securities pledged by the Fund as collateral, if any, are identified as such in the Portfolio of Investments.
The fair value of open derivative instruments (not considered to be hedging instruments for accounting disclosure purposes) by risk exposure at March 31, 2018 was as follows:
| Fair Value | ||||||||||||||||
| Statement of Assets and Liabilities Caption | Credit | Foreign Exchange | Interest Rate | Total | ||||||||||||
Net unrealized depreciation* | $ | — | $ | — | $ | 622,634 | $ | 622,634 | ||||||||
Receivable for open forward foreign currency exchange contracts | — | 878,401 | — | 878,401 | ||||||||||||
Total Asset Derivatives | $ | — | $ | 878,401 | $ | 622,634 | $ | 1,501,035 | ||||||||
Derivatives not subject to master netting or similar agreements | $ | — | $ | — | $ | 622,634 | $ | 622,634 | ||||||||
Total Asset Derivatives subject to master netting or similar agreements | $ | — | $ | 878,401 | $ | — | $ | 878,401 | ||||||||
| Credit | Foreign Exchange | Interest Rate | Total | |||||||||||||
Net unrealized depreciation* | $ | (3,531 | ) | $ | — | $ | (1,052,955 | ) | $ | (1,056,486 | ) | |||||
Payable for open forward foreign currency exchange contracts | — | (34,986 | ) | — | (34,986 | ) | ||||||||||
Payable/receivable for open swap contracts; Premium received on open non-centrally cleared swap contracts | (177,352 | ) | — | — | (177,352 | ) | ||||||||||
Total Liability Derivatives | $ | (180,883 | ) | $ | (34,986 | ) | $ | (1,052,955 | ) | $ | (1,268,824 | ) | ||||
Derivatives not subject to master netting or similar agreements | $ | (3,531 | ) | $ | — | $ | (1,052,955 | ) | $ | (1,056,486 | ) | |||||
Total Liability Derivatives subject to master netting or similar agreements | $ | (177,352 | ) | $ | (34,986 | ) | $ | — | $ | (212,338 | ) | |||||
| * | For futures contracts and centrally cleared swap contracts, amount represents value as shown in the Portfolio of Investments. Only the current day’s variation margin on open futures contracts and centrally cleared swap contracts is reported within the Statement of Assets and Liabilities as Receivable or Payable for variation margin on open financial futures contracts and centrally cleared swap contracts, as applicable. |
| 66 |
Eaton Vance
Limited Duration Income Fund
March 31, 2018
Notes to Financial Statements — continued
The Fund’s derivative assets and liabilities at fair value by risk, which are reported gross in the Statement of Assets and Liabilities, are presented in the table above. The following tables present the Fund’s derivative assets and liabilities by counterparty, net of amounts available for offset under a master netting agreement and net of the related collateral received by the Fund for such assets and pledged by the Fund for such liabilities as of March 31, 2018.
| Counterparty | Derivative Assets Master Netting Agreement | Derivatives Available for Offset | Non-cash Collateral Received(a) | Cash Collateral Received(a) | Net Amount of Derivative Assets(b) | Total Cash Collateral Received | ||||||||||||||||||
Australia and New Zealand Banking Group Limited | $ | 31,514 | $ | (14,733 | ) | $ | — | $ | — | $ | 16,781 | $ | — | |||||||||||
Deutsche Bank AG | 7,031 | (7,031 | ) | — | — | — | — | |||||||||||||||||
Goldman Sachs International | 385,720 | (26,374 | ) | — | — | 359,346 | — | |||||||||||||||||
HSBC Bank USA, N.A. | 75,378 | (5,759 | ) | — | — | 69,619 | — | |||||||||||||||||
JPMorgan Chase Bank, N.A. | 23,874 | — | — | — | 23,874 | — | ||||||||||||||||||
State Street Bank and Trust Company | 354,884 | (20,253 | ) | (89,903 | ) | — | 244,728 | — | ||||||||||||||||
| $ | 878,401 | $ | (74,150 | ) | $ | (89,903 | ) | $ | — | $ | 714,348 | $ | — | |||||||||||
| Counterparty | Derivative Liabilities Master Netting Agreement | Derivatives Available for Offset | Non-cash Collateral Pledged(a) | Cash Collateral Pledged(a) | Net Amount of Derivative Liabilities(c) | Total Cash Collateral Pledged | ||||||||||||||||||
Australia and New Zealand Banking Group Limited | $ | (14,733 | ) | $ | 14,733 | $ | — | $ | — | $ | — | $ | — | |||||||||||
Citibank, N.A. | (118,127 | ) | — | — | 118,127 | — | 130,000 | |||||||||||||||||
Deutsche Bank AG | (27,092 | ) | 7,031 | — | — | (20,061 | ) | — | ||||||||||||||||
Goldman Sachs International | (26,374 | ) | 26,374 | — | — | — | 340,000 | |||||||||||||||||
HSBC Bank USA, N.A. | (5,759 | ) | 5,759 | — | — | — | — | |||||||||||||||||
State Street Bank and Trust Company | (20,253 | ) | 20,253 | — | — | — | — | |||||||||||||||||
| $ | (212,338 | ) | $ | 74,150 | $ | — | $ | 118,127 | $ | (20,061 | ) | $ | 470,000 | |||||||||||
Total — Deposits for derivatives collateral — OTC derivatives | $ | 470,000 | ||||||||||||||||||||||
| (a) | In some instances, the total collateral received and/or pledged may be more than the amount shown due to overcollateralization. |
| (b) | Net amount represents the net amount due from the counterparty in the event of default. |
| (c) | Net amount represents the net amount payable to the counterparty in the event of default. |
Information with respect to reverse repurchase agreements at March 31, 2018 is included at Note 10.
| 67 |
Eaton Vance
Limited Duration Income Fund
March 31, 2018
Notes to Financial Statements — continued
The effect of derivative instruments (not considered to be hedging instruments for accounting disclosure purposes) on the Statement of Operations by risk exposure for the year ended March 31, 2018 was as follows:
| Statement of Operations Caption | Credit | Foreign Exchange | Interest Rate | |||||||||
Net realized gain (loss) — | ||||||||||||
Financial futures contracts | $ | — | $ | — | $ | 1,068,772 | ||||||
Swap contracts | 477,975 | — | 86,887 | |||||||||
Forward foreign currency exchange contracts | — | (8,249,188 | ) | — | ||||||||
Total | $ | 477,975 | $ | (8,249,188 | ) | $ | 1,155,659 | |||||
Change in unrealized appreciation (depreciation) — | ||||||||||||
Financial futures contracts | $ | — | $ | — | $ | (932,102 | ) | |||||
Swap contracts | (80,094 | ) | — | 446,664 | ||||||||
Forward foreign currency exchange contracts | — | 808,943 | — | |||||||||
Total | $ | (80,094 | ) | $ | 808,943 | $ | (485,438 | ) | ||||
The average notional cost of futures contracts and average notional amounts of other derivative contracts outstanding during the year ended March 31, 2018, which are indicative of the volume of these derivative types, were approximately as follows:
| Futures Contracts — Long | Futures Contracts — Short | Forward Foreign Currency Exchange Contracts* | Swap Contracts | |||||||||||
| $2,192,000 | $ | 123,915,000 | $ | 74,402,000 | $ | 30,317,000 | ||||||||
| * | The average notional amount of forward foreign currency exchange contracts is based on the absolute value of notional amounts of currency purchased and currency sold. |
9 Credit Agreement
The Fund has entered into a Credit Agreement (the Agreement) with major financial institutions to borrow up to $900 million. Borrowings under the Agreement are secured by the assets of the Fund. Interest is charged at a rate above the London Interbank Offered Rate (LIBOR) and is payable monthly. Under the terms of the Agreement, in effect through December 21, 2018, the Fund pays a facility fee of 0.25% (0.35% if the Fund’s outstanding borrowings are less than 65% of the borrowing limit) per annum on the borrowing limit. The Fund also paid an upfront fee of $1,620,000, which is being amortized to interest expense over a period of three years through December 2018. The unamortized balance at March 31, 2018 is approximately $385,000 and is included in prepaid upfront fees on notes payable in the Statement of Assets and Liabilities. The Fund is required to maintain certain net asset levels during the term of the Agreement. At March 31, 2018, the Fund had borrowings outstanding under the Agreement of $663,000,000 at an interest rate of 2.63%. Based on the short-term nature of the borrowings under the Agreement and the variable interest rate, the carrying amount of the borrowings at March 31, 2018 approximated its fair value. If measured at fair value, borrowings under the Agreement would have been considered as Level 2 in the fair value hierarchy (see Note 12) at March 31, 2018. Facility fees for the year ended March 31, 2018 totaled $2,281,250 and are included in interest expense and fees on the Statement of Operations. For the year ended March 31, 2018, the average borrowings under the Agreement and the average interest rate (excluding fees) were $603,536,986 and 2.17%, respectively.
| 68 |
Eaton Vance
Limited Duration Income Fund
March 31, 2018
Notes to Financial Statements — continued
10 Reverse Repurchase Agreements
Reverse repurchase agreements outstanding as of March 31, 2018 were as follows:
| Counterparty | Trade Date | Maturity Date | Interest Rate | Principal Amount | Value Including Interest | U.S. Treasury and Agency Securities Pledged as | ||||||||||||||||||
| Bank of America | 3/8/18 | 4/10/18 | 1.88% | $ | 74,273,417 | $ | 74,362,627 | $ | 76,434,993 | |||||||||||||||
| KGS Alpha Capital | 3/8/18 | 4/10/18 | 1.84 | 37,074,844 | 37,118,427 | 38,730,597 | ||||||||||||||||||
Total | $ | 111,348,261 | $ | 111,481,054 | $ | 115,165,590 | ||||||||||||||||||
The Fund also pledged cash of $1,176,699 and $246,000 to Bank of America and KGS Alpha Capital, respectively, as additional collateral for its reverse repurchase agreements. At March 31, 2018, the remaining contractual maturity of all reverse repurchase agreements was less than 30 days.
For the year ended March 31, 2018, the average borrowings under settled reverse repurchase agreements and the average interest rate were $119,384,557 and 1.37%, respectively. The reverse repurchase agreements entered into by the Fund are subject to Master Repurchase Agreements (MRA), which permit the Fund, under certain circumstances, including an event of default (such as bankruptcy or insolvency), to offset payables and/or receivables under the MRA with collateral held and/or posted to the counterparty and create one single net payment due to or from the Fund. At March 31, 2018, the market value of securities and cash pledged for the benefit of counterparties for reverse repurchase agreements exceeded the amount of borrowings for each counterparty. Based on the short-term nature of the borrowings under the reverse repurchase agreements, the carrying value of the payable for reverse repurchase agreements approximated its fair value at March 31, 2018. If measured at fair value, borrowings under the reverse repurchase agreements would have been considered as Level 2 in the fair value hierarchy (see Note 12) at March 31, 2018.
11 Risks Associated with Foreign Investments
Investing in securities issued by companies or entities whose principal business activities are outside the United States may involve significant risks not present in domestic investments. For example, there is generally less publicly available information about foreign companies, particularly those not subject to the disclosure and reporting requirements of the U.S. securities laws. Certain foreign issuers are generally not bound by uniform accounting, auditing, and financial reporting requirements and standards of practice comparable to those applicable to domestic issuers. Investments in foreign securities also involve the risk of possible adverse changes in investment or exchange control regulations, expropriation or confiscatory taxation, limitation on the removal of funds or other assets of the Fund, political or financial instability or diplomatic and other developments which could affect such investments. Foreign securities markets, while growing in volume and sophistication, are generally not as developed as those in the United States, and securities of some foreign issuers (particularly those located in developing countries) may be less liquid and more volatile than securities of comparable U.S. companies. In general, there is less overall governmental supervision and regulation of foreign securities markets, broker/dealers and issuers than in the United States.
12 Fair Value Measurements
Under generally accepted accounting principles for fair value measurements, a three-tier hierarchy to prioritize the assumptions, referred to as inputs, is used in valuation techniques to measure fair value. The three-tier hierarchy of inputs is summarized in the three broad levels listed below.
| • | Level 1 – quoted prices in active markets for identical investments |
| • | Level 2 – other significant observable inputs (including quoted prices for similar investments, interest rates, prepayment speeds, credit risk, etc.) |
| • | Level 3 – significant unobservable inputs (including a fund’s own assumptions in determining the fair value of investments) |
In cases where the inputs used to measure fair value fall in different levels of the fair value hierarchy, the level disclosed is determined based on the lowest level input that is significant to the fair value measurement in its entirety. The inputs or methodology used for valuing securities are not necessarily an indication of the risk associated with investing in those securities.
| 69 |
Eaton Vance
Limited Duration Income Fund
March 31, 2018
Notes to Financial Statements — continued
At March 31, 2018, the hierarchy of inputs used in valuing the Fund’s investments and open derivative instruments, which are carried at value, were as follows:
| Asset Description | Level 1 | Level 2 | Level 3* | Total | ||||||||||||
Senior Floating-Rate Loans (Less Unfunded Loan Commitments) | $ | — | $ | 924,010,818 | $ | 3,277,627 | $ | 927,288,445 | ||||||||
Corporate Bonds & Notes | — | 879,255,634 | — | 879,255,634 | ||||||||||||
Foreign Corporate Bonds | — | 1,603,226 | — | 1,603,226 | ||||||||||||
Foreign Government Securities | — | 84,183,357 | — | 84,183,357 | ||||||||||||
Sovereign Loans | — | 5,015,764 | — | 5,015,764 | ||||||||||||
Mortgage Pass-Throughs | — | 155,768,860 | — | 155,768,860 | ||||||||||||
Collateralized Mortgage Obligations | — | 468,166,910 | — | 468,166,910 | ||||||||||||
Commercial Mortgage-Backed Securities | — | 75,823,274 | — | 75,823,274 | ||||||||||||
Asset-Backed Securities | — | 63,825,352 | — | 63,825,352 | ||||||||||||
U.S. Government Agency Obligations | — | 10,353,746 | — | 10,353,746 | ||||||||||||
Common Stocks | 1,328,620 | 4,911,936 | 8,014,393 | 14,254,949 | ||||||||||||
Convertible Bonds | — | 223,371 | — | 223,371 | ||||||||||||
Convertible Preferred Stocks | — | — | 814,723 | 814,723 | ||||||||||||
Preferred Stocks | 686,700 | — | — | 686,700 | ||||||||||||
Closed-End Funds | 21,817,751 | — | — | 21,817,751 | ||||||||||||
Miscellaneous | — | — | 0 | 0 | ||||||||||||
Short-Term Investments — | ||||||||||||||||
U.S. Treasury Obligations | — | 498,977 | — | 498,977 | ||||||||||||
Other | — | 23,963,374 | — | 23,963,374 | ||||||||||||
Total Investments | $ | 23,833,071 | $ | 2,697,604,599 | $ | 12,106,743 | $ | 2,733,544,413 | ||||||||
Forward Foreign Currency Exchange Contracts | $ | — | $ | 878,401 | $ | — | $ | 878,401 | ||||||||
Futures Contracts | 166,209 | — | — | 166,209 | ||||||||||||
Swap Contracts | — | 456,425 | — | 456,425 | ||||||||||||
Total | $ | 23,999,280 | $ | 2,698,939,425 | $ | 12,106,743 | $ | 2,735,045,448 | ||||||||
Liability Description | ||||||||||||||||
Forward Foreign Currency Exchange Contracts | $ | — | $ | (34,986 | ) | $ | — | $ | (34,986 | ) | ||||||
Futures Contracts | (1,002,727 | ) | — | — | (1,002,727 | ) | ||||||||||
Swap Contracts | — | (231,111 | ) | — | (231,111 | ) | ||||||||||
Total | $ | (1,002,727 | ) | $ | (266,097 | ) | $ | — | $ | (1,268,824 | ) | |||||
| * | None of the unobservable inputs for Level 3 assets, individually or collectively, had a material impact on the Fund. |
Level 3 investments at the beginning and/or end of the period in relation to net assets were not significant and accordingly, a reconciliation of Level 3 assets for the year ended March 31, 2018 is not presented.
At March 31, 2018, the value of investments transferred between Level 1 and Level 2 during the year then ended was not significant.
13 Legal Proceedings
In May 2015, the Fund was served with an amended complaint filed in an adversary proceeding in the United States Bankruptcy Court for the Southern District of New York. The adversary proceeding was filed by the Motors Liquidation Company Avoidance Action Trust (“AAT”) against the former holders of a $1.5 billion term loan issued by General Motors Corp. (“GM”) in 2006 (the “Term Loan Lenders”) who received a full repayment of the term loan pursuant to a court order in the GM bankruptcy proceeding. The court order was made with the understanding that the term loan was fully secured at the
| 70 |
Eaton Vance
Limited Duration Income Fund
March 31, 2018
Notes to Financial Statements — continued
time of GM’s bankruptcy filing in June 2009. The AAT is seeking (1) a determination from the Bankruptcy Court that the security interest held by the Term Loan Lenders was not perfected at the time GM filed for Chapter 11 Bankruptcy protection and thus the Term Loan Lenders should have been treated in the same manner as GM’s unsecured creditors, (2) disgorgement of any interest payments made to the Term Loan Lenders within ninety days of GM’s filing for Chapter 11 Bankruptcy protection, and (3) disgorgement of the $1.5 billion term loan repayment that was made to the Term Loan Lenders. The value of the payment received under the term loan agreement by the Fund is approximately $4,460,000 (equal to 0.26% of net assets applicable to common shares at March 31, 2018). The Fund cannot predict the outcome of these proceedings or the effect, if any, on the Fund’s net asset value. The attorneys’ fees and costs related to these actions are expensed by the Fund as incurred.
| 71 |
Eaton Vance
Limited Duration Income Fund
March 31, 2018
Report of Independent Registered Public Accounting Firm
To the Trustees and Shareholders of Eaton Vance Limited Duration Income Fund:
Opinion on the Financial Statements and Financial Highlights
We have audited the accompanying statement of assets and liabilities of Eaton Vance Limited Duration Income Fund (the “Fund”), including the portfolio of investments, as of March 31, 2018, the related statements of operations and cash flows for the year then ended, the statements of changes in net assets for each of the two years in the period then ended, the financial highlights for each of the five years in the period then ended, and the related notes. In our opinion, the financial statements and financial highlights present fairly, in all material respects, the financial position of the Fund as of March 31, 2018, and the results of its operations and its cash flows for the year then ended, the changes in its net assets for each of the two years in the period then ended, and the financial highlights for each of the five years in the period then ended in conformity with accounting principles generally accepted in the United States of America.
Basis for Opinion
These financial statements and financial highlights are the responsibility of the Fund’s management. Our responsibility is to express an opinion on the Fund’s financial statements and financial highlights based on our audits. We are a public accounting firm registered with the Public Company Accounting Oversight Board (United States) (PCAOB) and are required to be independent with respect to the Fund in accordance with the U.S. federal securities laws and the applicable rules and regulations of the Securities and Exchange Commission and the PCAOB.
We conducted our audits in accordance with the standards of the PCAOB. Those standards require that we plan and perform the audit to obtain reasonable assurance about whether the financial statements and financial highlights are free of material misstatement, whether due to error or fraud. The Fund is not required to have, nor were we engaged to perform, an audit of its internal control over financial reporting. As part of our audits we are required to obtain an understanding of internal control over financial reporting but not for the purpose of expressing an opinion on the effectiveness of the Fund’s internal control over financial reporting. Accordingly, we express no such opinion.
Our audits included performing procedures to assess the risks of material misstatement of the financial statements and financial highlights, whether due to error or fraud, and performing procedures that respond to those risks. Such procedures included examining, on a test basis, evidence regarding the amounts and disclosures in the financial statements and financial highlights. Our audits also included evaluating the accounting principles used and significant estimates made by management, as well as evaluating the overall presentation of the financial statements and financial highlights. Our procedures included confirmation of securities owned as of March 31, 2018, by correspondence with the custodian, brokers and selling or agent banks; when replies were not received from brokers and selling or agent banks, we performed other auditing procedures. We believe that our audits provide a reasonable basis for our opinion.
/s/ Deloitte & Touche LLP
Boston, Massachusetts
May 18, 2018
We have served as the auditor of one or more Eaton Vance investment companies since 1959.
| 72 |
Eaton Vance
Limited Duration Income Fund
March 31, 2018
Federal Tax Information (Unaudited)
The Form 1099-DIV you receive in February 2019 will show the tax status of all distributions paid to your account in calendar year 2018. Shareholders are advised to consult their own tax adviser with respect to the tax consequences of their investment in the Fund.
| 73 |
Eaton Vance
Limited Duration Income Fund
March 31, 2018
Annual Meeting of Shareholders (Unaudited)
The Fund held its Annual Meeting of Shareholders on January 18, 2018. The following action was taken by the shareholders:
Item 1. The election of George J. Gorman, Helen Frame Peters and Susan J. Sutherland as Class III Trustees of the Trust for a three-year term expiring in 2021. Mr. Gorman was elected solely by APS shareholders.
Nominees for Trustee Elected by All Shareholders | Number of Shares | |||||||
| For | Withheld | |||||||
Helen Frame Peters | 102,905,586 | 1,535,850 | ||||||
Susan J. Sutherland | 102,832,439 | 1,608,997 | ||||||
Nominees for Trustee Elected by APS Shareholders | Number of Shares | |||||||
| For | Withheld | |||||||
George J. Gorman | 7,465 | 227 | ||||||
| 74 |
Eaton Vance
Limited Duration Income Fund
March 31, 2018
Dividend Reinvestment Plan
The Fund offers a dividend reinvestment plan (Plan) pursuant to which shareholders may elect to have distributions automatically reinvested in common shares (Shares) of the Fund. You may elect to participate in the Plan by completing the Dividend Reinvestment Plan Application Form. If you do not participate, you will receive all distributions in cash paid by check mailed directly to you by American Stock Transfer & Trust Company, LLC (AST) as dividend paying agent. On the distribution payment date, if the NAV per Share is equal to or less than the market price per Share plus estimated brokerage commissions, then new Shares will be issued. The number of Shares shall be determined by the greater of the NAV per Share or 95% of the market price. Otherwise, Shares generally will be purchased on the open market by AST, the Plan agent (Agent). Distributions subject to income tax (if any) are taxable whether or not Shares are reinvested.
If your Shares are in the name of a brokerage firm, bank, or other nominee, you can ask the firm or nominee to participate in the Plan on your behalf. If the nominee does not offer the Plan, you will need to request that the Fund’s transfer agent re-register your Shares in your name or you will not be able to participate.
The Agent’s service fee for handling distributions will be paid by the Fund. Plan participants will be charged their pro rata share of brokerage commissions on all open-market purchases.
Plan participants may withdraw from the Plan at any time by writing to the Agent at the address noted on the following page. If you withdraw, you will receive Shares in your name for all Shares credited to your account under the Plan. If a participant elects by written notice to the Agent to sell part or all of his or her Shares and remit the proceeds, the Agent is authorized to deduct a $5.00 fee plus brokerage commissions from the proceeds.
If you wish to participate in the Plan and your Shares are held in your own name, you may complete the form on the following page and deliver it to the Agent. Any inquiries regarding the Plan can be directed to the Agent at 1-866-439-6787.
| 75 |
Eaton Vance
Limited Duration Income Fund
March 31, 2018
Application for Participation in Dividend Reinvestment Plan
This form is for shareholders who hold their common shares in their own names. If your common shares are held in the name of a brokerage firm, bank, or other nominee, you should contact your nominee to see if it will participate in the Plan on your behalf. If you wish to participate in the Plan, but your brokerage firm, bank, or nominee is unable to participate on your behalf, you should request that your common shares be re-registered in your own name which will enable your participation in the Plan.
The following authorization and appointment is given with the understanding that I may terminate it at any time by terminating my participation in the Plan as provided in the terms and conditions of the Plan.
Please print exact name on account
Shareholder signature Date
Shareholder signature Date
Please sign exactly as your common shares are registered. All persons whose names appear on the share certificate must sign.
YOU SHOULD NOT RETURN THIS FORM IF YOU WISH TO RECEIVE YOUR DISTRIBUTIONS IN CASH. THIS IS NOT A PROXY.
This authorization form, when signed, should be mailed to the following address:
Eaton Vance Limited Duration Income Fund
c/o American Stock Transfer & Trust Company, LLC
P.O. Box 922
Wall Street Station
New York, NY 10269-0560
| 76 |
Eaton Vance
Limited Duration Income Fund
March 31, 2018
Management and Organization
Fund Management. The Trustees of Eaton Vance Limited Duration Income Fund (the Fund) are responsible for the overall management and supervision of the Fund’s affairs. The Trustees and officers of the Fund are listed below. Except as indicated, each individual has held the office shown or other offices in the same company for the last five years. The “Noninterested Trustees” consist of those Trustees who are not “interested persons” of the Fund, as that term is defined under the 1940 Act. The business address of each Trustee and officer is Two International Place, Boston, Massachusetts 02110. As used below, “EVC” refers to Eaton Vance Corp., “EV” refers to Eaton Vance, Inc., “EVM” refers to Eaton Vance Management, “BMR” refers to Boston Management and Research and “EVD” refers to Eaton Vance Distributors, Inc. EVC and EV are the corporate parent and trustee, respectively, of EVM and BMR. EVD is a wholly-owned subsidiary of EVC. Each officer affiliated with Eaton Vance may hold a position with other Eaton Vance affiliates that is comparable to his or her position with EVM listed below. Each Trustee oversees 174 portfolios in the Eaton Vance Complex (including all master and feeder funds in a master feeder structure). Each officer serves as an officer of certain other Eaton Vance funds. Each Trustee serves for a three year term. Each officer serves until his or her successor is elected.
| Name and Year of Birth | Position(s) with the Fund | Term Expiring; Trustee | Principal Occupation(s) and Directorships During Past Five Years and Other Relevant Experience | |||
| Interested Trustee | ||||||
Thomas E. Faust Jr. 1958 | Class II Trustee | Until 2020. Trustee since 2007. | Chairman, Chief Executive Officer and President of EVC, Director and President of EV, Chief Executive Officer and President of EVM and BMR, and Director of EVD. Trustee and/or officer of 174 registered investment companies. Mr. Faust is an interested person because of his positions with EVM, BMR, EVD, EVC and EV, which are affiliates of the Fund. Directorships in the Last Five Years.(2) Director of EVC and Hexavest Inc. (investment management firm). | |||
| Noninterested Trustees | ||||||
Mark R. Fetting 1954 | Class II Trustee | Until 2020. Trustee since 2016. | Private investor. Formerly held various positions at Legg Mason, Inc. (investment management firm) (2000-2012), including President, Chief Executive Officer, Director and Chairman (2008-2012), Senior Executive Vice President (2004-2008) and Executive Vice President (2001-2004). Formerly, President of Legg Mason family of funds (2001-2008). Formerly, Division President and Senior Officer of Prudential Financial Group, Inc. and related companies (investment management firm) (1991-2000). Directorships in the Last Five Years. None. | |||
Cynthia E. Frost 1961 | Class I Trustee | Until 2019. Trustee since 2014. | Private investor. Formerly, Chief Investment Officer of Brown University (university endowment) (2000-2012); Formerly, Portfolio Strategist for Duke Management Company (university endowment manager) (1995-2000); Formerly, Managing Director, Cambridge Associates (investment consulting company) (1989-1995); Formerly, Consultant, Bain and Company (management consulting firm) (1987-1989); Formerly, Senior Equity Analyst, BA Investment Management Company (1983-1985). Directorships in the Last Five Years. None. | |||
George J. Gorman 1952 | Class III Trustee(4) | Until 2021. Trustee since 2014. | Principal at George J. Gorman LLC (consulting firm). Formerly, Senior Partner at Ernst & Young LLP (a registered public accounting firm) (1974-2009). Directorships in the Last Five Years. Formerly, Trustee of the BofA Funds Series Trust (11 funds) (2011-2014) and of the Ashmore Funds (9 funds) (2010-2014). | |||
Valerie A. Mosley 1960 | Class I Trustee | Until 2019. Trustee since 2014. | Chairwoman and Chief Executive Officer of Valmo Ventures (a consulting and investment firm). Former Partner and Senior Vice President, Portfolio Manager and Investment Strategist at Wellington Management Company, LLP (investment management firm) (1992-2012). Former Chief Investment Officer, PG Corbin Asset Management (1990-1992). Formerly worked in institutional corporate bond sales at Kidder Peabody (1986-1990). Directorships in the Last Five Years.(2) Director of Dynex Capital, Inc. (mortgage REIT) (since 2013). | |||
| 77 |
Eaton Vance
Limited Duration Income Fund
March 31, 2018
Management and Organization — continued
| Name and Year of Birth | Position(s) with the Fund | Term Expiring; Trustee Since(1) | Principal Occupation(s) and Directorships During Past Five Years and Other Relevant Experience | |||
| Noninterested Trustees (continued) | ||||||
William H. Park 1947 | Chairperson of the Board and Class II Trustee(4) | Until 2020. Chairperson of the Board since 2016 and Trustee since 2003. | Private investor. Formerly, Consultant (management and transactional) (2012-2014). Formerly, Chief Financial Officer, Aveon Group L.P. (investment management firm) (2010-2011). Formerly, Vice Chairman, Commercial Industrial Finance Corp. (specialty finance company) (2006-2010). Formerly, President and Chief Executive Officer, Prizm Capital Management, LLC (investment management firm) (2002-2005). Formerly, Executive Vice President and Chief Financial Officer, United Asset Management Corporation (investment management firm) (1982-2001). Formerly, Senior Manager, Price Waterhouse (now PricewaterhouseCoopers) (a registered public accounting firm) (1972-1981). Directorships in the Last Five Years.(2) None. | |||
Helen Frame Peters 1948 | Class III Trustee | Until 2021. Trustee since 2008. | Professor of Finance, Carroll School of Management, Boston College. Formerly, Dean, Carroll School of Management, Boston College (2000-2002). Formerly, Chief Investment Officer, Fixed Income, Scudder Kemper Investments (investment management firm) (1998-1999). Formerly, Chief Investment Officer, Equity and Fixed Income, Colonial Management Associates (investment management firm) (1991-1998). Directorships in the Last Five Years.(2) None. | |||
Susan J. Sutherland 1957 | Class III Trustee | Until 2021. Trustee since 2015. | Private investor. Formerly, Associate, Counsel and Partner at Skadden, Arps, Slate, Meagher & Flom LLP (law firm) (1982-2013). Directorships in the Last Five Years. Formerly, Director of Montpelier Re Holdings Ltd. (global provider of customized insurance and reinsurance products) (2013-2015). | |||
Harriett Tee Taggart 1948 | Class II Trustee | Until 2020. Trustee since 2011. | Managing Director, Taggart Associates (a professional practice firm). Formerly, Partner and Senior Vice President, Wellington Management Company, LLP (investment management firm) (1983-2006). Ms. Taggart has apprised the Board of Trustees that she intends to retire as a Trustee of all Eaton Vance Funds in 2018. Directorships in the Last Five Years.(2) Director of Albemarle Corporation (chemicals manufacturer) (since 2007) and The Hanover Group (specialty property and casualty insurance company) (since 2009). | |||
Scott E. Wennerholm 1959 | Class I Trustee | Until 2019. Trustee since 2016. | Trustee at Wheelock College (postsecondary institution) (since 2012). Formerly, Consultant at GF Parish Group (executive recruiting firm) (2016-2017). Formerly, Chief Operating Officer and Executive Vice President at BNY Mellon Asset Management (investment management firm) (2005-2011). Formerly, Chief Operating Officer and Chief Financial Officer at Natixis Global Asset Management (investment management firm) (1997-2004). Formerly, Vice President at Fidelity Investments Institutional Services (investment management firm) (1994-1997). Directorships in the Last Five Years. None | |||
| Name and Year of Birth | Position(s) Fund | Officer Since(3) | Principal Occupation(s) During Past Five Years | |||
| Principal Officers who are not Trustees | ||||||
Payson F. Swaffield 1956 | President | 2003 | Vice President and Chief Income Investment Officer of EVM and BMR. Also Vice President of Calvert Research and Management (“CRM”). | |||
Maureen A. Gemma 1960 | Vice President, Secretary and Chief Legal Officer | 2005 | Vice President of EVM and BMR. Also Vice President of CRM. | |||
James F. Kirchner 1967 | Treasurer | 2007 | Vice President of EVM and BMR. Also Vice President of CRM. | |||
| 78 |
Eaton Vance
Limited Duration Income Fund
March 31, 2018
Management and Organization — continued
| Name and Year of Birth | Position(s) Fund | Officer Since(3) | Principal Occupation(s) During Past Five Years | |||
| Principal Officers who are not Trustees (continued) | ||||||
Richard F. Froio 1968 | Chief Compliance Officer | 2017 | Vice President of EVM and BMR since 2017. Formerly Deputy Chief Compliance Officer (Adviser/Funds) and Chief Compliance Officer (Distribution) at PIMCO (2012-2017) and Managing Director at BlackRock/Barclays Global Investors (2009-2012). | |||
| (1) | Year first appointed to serve as Trustee for a fund in the Eaton Vance family of funds. Each Trustee has served continuously since appointment unless indicated otherwise. Each Trustee holds office until the annual meeting for the year in which his or her term expires and until his or her successor is elected and qualified, subject to a prior death, resignation, retirement, disqualification or removal. |
| (2) | During their respective tenures, the Trustees (except for Mmes. Frost and Sutherland and Messrs. Fetting, Gorman and Wennerholm) also served as Board members of one or more of the following funds (which operated in the years noted): eUnitsTM 2 Year U.S. Market Participation Trust: Upside to Cap / Buffered Downside (launched in 2012 and terminated in 2014); and eUnitsTM 2 Year U.S. Market Participation Trust II: Upside to Cap / Buffered Downside (launched in 2012 and terminated in 2014). However, Ms. Mosley did not serve as a Board member of eUnitsTM 2 Year U.S. Market Participation Trust: Upside to Cap / Buffered Downside (launched in 2012 and terminated in 2014). |
| (3) | Year first elected to serve as officer of a fund in the Eaton Vance family of funds when the officer has served continuously. Otherwise, year of most recent election as an officer of a fund in the Eaton Vance family of funds. Titles may have changed since initial election. |
| (4) | APS Trustee |
| 79 |
Eaton Vance Funds
IMPORTANT NOTICES
Privacy. The Eaton Vance organization is committed to ensuring your financial privacy. Each of the financial institutions identified below has in effect the following policy (“Privacy Policy”) with respect to nonpublic personal information about its customers:
| • | Only such information received from you, through application forms or otherwise, and information about your Eaton Vance fund transactions will be collected. This may include information such as name, address, social security number, tax status, account balances and transactions. |
| • | None of such information about you (or former customers) will be disclosed to anyone, except as permitted by law (which includes disclosure to employees necessary to service your account). In the normal course of servicing a customer’s account, Eaton Vance may share information with unaffiliated third parties that perform various required services such as transfer agents, custodians and broker-dealers. |
| • | Policies and procedures (including physical, electronic and procedural safeguards) are in place that are designed to protect the confidentiality of such information. |
| • | We reserve the right to change our Privacy Policy at any time upon proper notification to you. Customers may want to review our Privacy Policy periodically for changes by accessing the link on our homepage: www.eatonvance.com. |
Our pledge of privacy applies to the following entities within the Eaton Vance organization: the Eaton Vance Family of Funds, Eaton Vance Management, Eaton Vance Investment Counsel, Eaton Vance Distributors, Inc., Eaton Vance Trust Company, Eaton Vance Management (International) Limited, Eaton Vance Advisers International Ltd., Eaton Vance Management’s Real Estate Investment Group and Boston Management and Research. In addition, our Privacy Policy applies only to those Eaton Vance customers who are individuals and who have a direct relationship with us. If a customer’s account (i.e., fund shares) is held in the name of a third-party financial advisor/broker-dealer, it is likely that only such advisor’s privacy policies apply to the customer. This notice supersedes all previously issued privacy disclosures. For more information about Eaton Vance’s Privacy Policy, please call 1-800-262-1122.
Delivery of Shareholder Documents. The Securities and Exchange Commission (SEC) permits funds to deliver only one copy of shareholder documents, including prospectuses, proxy statements and shareholder reports, to fund investors with multiple accounts at the same residential or post office box address. This practice is often called “householding” and it helps eliminate duplicate mailings to shareholders. American Stock Transfer & Trust Company, LLC (“AST”), the closed-end funds transfer agent, or your financial advisor, may household the mailing of your documents indefinitely unless you instruct AST, or your financial advisor, otherwise. If you would prefer that your Eaton Vance documents not be householded, please contact AST or your financial advisor. Your instructions that householding not apply to delivery of your Eaton Vance documents will typically be effective within 30 days of receipt by AST or your financial advisor.
Portfolio Holdings. Each Eaton Vance Fund and its underlying Portfolio(s) (if applicable) will file a schedule of portfolio holdings on Form N-Q with the SEC for the first and third quarters of each fiscal year. The Form N-Q will be available on the Eaton Vance website at www.eatonvance.com, by calling Eaton Vance at 1-800-262-1122 or in the EDGAR database on the SEC’s website at www.sec.gov. Form N-Q may also be reviewed and copied at the SEC’s public reference room in Washington, D.C. (call 1-800-732-0330 for information on the operation of the public reference room).
Proxy Voting. From time to time, funds are required to vote proxies related to the securities held by the funds. The Eaton Vance Funds or their underlying Portfolios (if applicable) vote proxies according to a set of policies and procedures approved by the Funds’ and Portfolios’ Boards. You may obtain a description of these policies and procedures and information on how the Funds or Portfolios voted proxies relating to portfolio securities during the most recent 12-month period ended June 30, without charge, upon request, by calling 1-800-262-1122 and by accessing the SEC’s website at www.sec.gov.
Share Repurchase Program. The Fund’s Board of Trustees has approved a share repurchase program authorizing the Fund to repurchase up to 10% of its outstanding common shares as of the approved date in open-market transactions at a discount to net asset value. The repurchase program does not obligate the Fund to purchase a specific amount of shares. The Fund’s repurchase activity, including the number of shares purchased, average price and average discount to net asset value, is disclosed in the Fund’s annual and semi-annual reports to shareholders.
Additional Notice to Shareholders. If applicable, a Fund may also redeem or purchase its outstanding preferred shares in order to maintain compliance with regulatory requirements, borrowing or rating agency requirements or for other purposes as it deems appropriate or necessary.
Closed-End Fund Information. Eaton Vance closed-end funds make fund performance data and certain information about portfolio characteristics available on the Eaton Vance website shortly after the end of each month. Other information about the funds is available on the website. The funds’ net asset value per share is readily accessible on the Eaton Vance website. Portfolio holdings for the most recent month-end are also posted to the website approximately 30 days following the end of the month. This information is available at www.eatonvance.com on the fund information pages under “Individual Investors — Closed-End Funds”.
| 80 |
Investment Adviser and Administrator
Eaton Vance Management
Two International Place
Boston, MA 02110
Custodian
State Street Bank and Trust Company
State Street Financial Center, One Lincoln Street
Boston, MA 02111
Transfer Agent
American Stock Transfer & Trust Company, LLC
6201 15th Avenue
Brooklyn, NY 11219
Independent Registered Public Accounting Firm
Deloitte & Touche LLP
200 Berkeley Street
Boston, MA 02116-5022
Fund Offices
Two International Place
Boston, MA 02110
1856 3.31.18
Item 2. Code of Ethics
The registrant has adopted a code of ethics applicable to its Principal Executive Officer, Principal Financial Officer and Principal Accounting Officer. The registrant undertakes to provide a copy of such code of ethics to any person upon request, without charge, by calling 1-800-262-1122. The registrant has not amended the code of ethics as described in Form N-CSR during the period. The registrant has not granted any waiver, including an implicit waiver, from a provision of the code of ethics as described in Form N-CSR during the period covered by this report.
Item 3. Audit Committee Financial Expert
The registrant’s Board has designated William H. Park, an independent trustee, as its audit committee financial expert. Mr. Park is a certified public accountant who is a private investor. Previously, he served as a consultant, as the Chief Financial Officer of Aveon Group, L.P. (an investment management firm), as the Vice Chairman of Commercial Industrial Finance Corp. (specialty finance company), as President and Chief Executive Officer of Prizm Capital Management, LLC (investment management firm), as Executive Vice
President and Chief Financial Officer of United Asset Management Corporation (an institutional investment management firm) and as a Senior Manager at Price Waterhouse (now PricewaterhouseCoopers) (an independent registered public accounting firm).
Item 4. Principal Accountant Fees and Services
(a) –(d)
The following table presents the aggregate fees billed to the registrant for the registrant’s fiscal years ended March 31, 2017 and March 31, 2018 by D&T for professional services rendered for the audit of the registrant’s annual financial statements and fees billed for other services rendered by D&T during such periods.
Fiscal Years Ended | 3/31/17 | 3/31/18 | ||||||
Audit Fees | $ | 133,715 | $ | 133,265 | ||||
Audit-Related Fees(1) | $ | 0 | $ | 0 | ||||
Tax Fees(2) | $ | 21,201 | $ | 23,019 | ||||
All Other Fees(3) | $ | 0 | $ | 0 | ||||
|
|
|
| |||||
Total | $ | 154,916 | $ | 156,284 | ||||
|
|
|
| |||||
| (1) | Audit-related fees consist of the aggregate fees billed for assurance and related services that are reasonably related to the performance of the audit of financial statements and are not reported under the category of audit fees. |
| (2) | Tax fees consist of the aggregate fees billed for professional services rendered by the principal accountant relating to tax compliance, tax advice, and tax planning and specifically include fees for tax return preparation and other related tax compliance/planning matters. |
| (3) | All other fees consist of the aggregate fees billed for products and services provided by the principal accountant other than audit, audit-related, and tax services. |
(e)(1) The registrant’s audit committee has adopted policies and procedures relating to the pre-approval of services provided by the registrant’s principal accountant (the “Pre-Approval Policies”). The Pre-Approval Policies establish a framework intended to assist the audit committee in the proper discharge of its pre-approval responsibilities. As a general matter, the Pre-Approval Policies (i) specify certain types of audit, audit-related, tax, and other services determined to be pre-approved by the audit committee; and (ii) delineate specific procedures governing the mechanics of the pre-approval process, including the approval and monitoring of audit and non-audit service fees. Unless a service is specifically pre-approved under the Pre-Approval Policies, it must be separately pre-approved by the audit committee.
The Pre-Approval Policies and the types of audit and non-audit services pre-approved therein must be reviewed and ratified by the registrant’s audit committee at least annually. The registrant’s audit committee maintains full responsibility for the appointment, compensation, and oversight of the work of the registrant’s principal accountant.
(e)(2) No services described in paragraphs (b)-(d) above were approved by the registrant’s audit committee pursuant to the “de minimis exception” set forth in Rule 2-01(c)(7)(i)(C) of Regulation S-X.
(f) Not applicable.
(g) The following table presents (i) the aggregate non-audit fees (i.e., fees for audit-related, tax, and other services) billed to the registrant by D&T for the registrant’s fiscal years ended March 31, 2017 and March 31, 2018; and (ii) the aggregate non-audit fees (i.e., fees for audit-related, tax, and other services) billed to the Eaton Vance organization by D&T for the same time periods.
Fiscal Years Ended | 3/31/17 | 3/31/18 | ||||||
Registrant | $ | 21,201 | $ | 23,019 | ||||
Eaton Vance(1) | $ | 46,000 | $ | 155,208 | ||||
| (1) | The Investment Adviser to the registrant, as well as any of its affiliates that provide ongoing services to the registrant, are subsidiaries of Eaton Vance Corp. |
(h) The registrant’s audit committee has considered whether the provision by the registrant’s principal accountant of non-audit services to the registrant’s investment adviser and any entity controlling, controlled by, or under common control with the adviser that provides ongoing services to the registrant that were not pre-approved pursuant to Rule 2-01(c)(7)(ii) of Regulation S-X is compatible with maintaining the principal accountant’s independence.
Item 5. Audit Committee of Listed Registrants
The registrant has a separately-designated standing audit committee established in accordance with Section 3(a)(58)(A) of the Securities and Exchange Act of 1934, as amended. George J. Gorman (Chair), Valerie A. Mosley, William H. Park and Scott E. Wennerholm are the members of the registrant’s audit committee.
Item 6. Schedule of Investments
Please see schedule of investments contained in the Report to Stockholders included under Item 1 of this Form N-CSR.
Item 7. Disclosure of Proxy Voting Policies and Procedures for Closed-End Management Investment Companies
The Board of Trustees of the Trust has adopted a proxy voting policy and procedure (the “Fund Policy”), pursuant to which the Trustees have delegated proxy voting responsibility to the Fund’s investment adviser and adopted the investment adviser’s proxy voting policies and procedures (the “Policies”) which are described below. The Trustees will review the Fund’s proxy voting records from time to time and will annually consider approving the Policies for the upcoming year. In the event that a conflict of interest arises between the Fund’s shareholders and the investment adviser, the administrator, or any of their affiliates or any affiliate of the Fund, the investment adviser will generally refrain from voting the proxies related to the companies giving rise to such conflict until it consults with the Board’s Special Committee except as contemplated under the Fund Policy. The Board’s Special Committee will instruct the investment adviser on the appropriate course of action.
The Policies are designed to promote accountability of a company’s management to its shareholders and to align the interests of management with those shareholders. An independent proxy voting service (“Agent”), currently Institutional Shareholder Services, Inc., has been retained to assist in the voting of proxies through the provision of vote analysis, implementation and recordkeeping and disclosure services. The investment adviser will generally vote proxies through the Agent. The Agent is required to vote all proxies and/or refer them back to the investment adviser pursuant to the Policies. It is generally the policy of the investment adviser to vote in accordance with the recommendation of the Agent. The Agent shall refer to the investment adviser proxies relating to mergers and restructurings, and the disposition of assets, termination, liquidation and mergers
contained in mutual fund proxies. The investment adviser will normally vote against anti-takeover measures and other proposals designed to limit the ability of shareholders to act on possible transactions, except in the case of closed-end management investment companies. The investment adviser generally supports management on social and environmental proposals. The investment adviser may abstain from voting from time to time where it determines that the costs associated with voting a proxy outweighs the benefits derived from exercising the right to vote or the economic effect on shareholders interests or the value of the portfolio holding is indeterminable or insignificant.
In addition, the investment adviser will monitor situations that may result in a conflict of interest between the Fund’s shareholders and the investment adviser, the administrator, or any of their affiliates or any affiliate of the Fund by maintaining a list of significant existing and prospective corporate clients. The investment adviser’s personnel responsible for reviewing and voting proxies on behalf of the Fund will report any proxy received or expected to be received from a company included on that list to the personnel of the investment adviser identified in the Policies. If such personnel expects to instruct the Agent to vote such proxies in a manner inconsistent with the guidelines of the Policies or the recommendation of the Agent, the personnel will consult with members of senior management of the investment adviser to determine if a material conflict of interests exists. If it is determined that a material conflict does exist, the investment adviser will seek instruction on how to vote from the Special Committee.
Information on how the Fund voted proxies relating to portfolio securities during the most recent 12 month period ended June 30 is available (1) without charge, upon request, by calling 1-800-262-1122, and (2) on the Securities and Exchange Commission’s website at http://www.sec.gov.
Item 8. Portfolio Managers of Closed-End Management Investment Companies
Eaton Vance Management (“EVM” or “Eaton Vance”) is the investment adviser of the Fund. Catherine C. McDermott, Scott H. Page, Eric A. Stein, Payson F. Swaffield, Andrew Szczurowski and Michael W. Weilheimer comprise the investment team responsible for the overall management of the Fund’s investments.
Ms. McDermott is a Vice President of EVM and has been a portfolio manager of the Fund since January 2008. Mr. Page is a Vice President of EVM, has been a portfolio manager of the Fund since May 2003 and is Co-Director of EVM’s Floating-Rate Loan Group. Mr. Stein is a Vice President of EVM, has been a portfolio manager of the Fund since December 2012 and is Co-Director of EVM’s Global Income Group. Mr. Swaffield is a Vice President and Chief Income Investment Officer of EVM and has been a portfolio manager of the Fund since May 2003. Mr. Szczurowski is a Vice President of EVM and has been a portfolio manager of the Fund since November 2011. Mr. Weilheimer is a Vice President of EVM, has been a portfolio manager of the Fund since May 2003 and is Director of EVM’s High Yield Investments Group. Ms. McDermott and Messrs. Page, Stein, Swaffield, Szczurowski and Weilheimer have managed other Eaton Vance portfolios for more than five years. This information is provided as of the date of filing this report.
The following table shows, as of the Fund’s most recent fiscal year end, the number of accounts each portfolio manager managed in each of the listed categories and the total assets (in millions of dollars) in the accounts managed within each category. The table also shows the number of accounts with respect to which the advisory fee is based on the performance of the account, if any, and the total assets (in millions of dollars) in those accounts.
| Number of All Accounts | Total Assets of All Accounts | Number of Accounts Paying a Performance Fee | Total Assets of Accounts Paying a Performance Fee | |||||||||||||
Catherine C. McDermott | ||||||||||||||||
Registered Investment Companies | 2 | $ | 3,099.1 | 0 | $ | 0 | ||||||||||
Other Pooled Investment Vehicles | 0 | $ | 0 | 0 | $ | 0 | ||||||||||
Other Accounts | 0 | $ | 0 | 0 | $ | 0 | ||||||||||
Scott H. Page | ||||||||||||||||
Registered Investment Companies | 14 | $ | 30,722.8 | 0 | $ | 0 | ||||||||||
Other Pooled Investment Vehicles | 13 | $ | 8,747.6 | 1 | $ | 2.4 | ||||||||||
Other Accounts | 8 | $ | 6,414.8 | 0 | $ | 0 | ||||||||||
Eric A. Stein(1) | ||||||||||||||||
Registered Investment Companies | 14 | $ | 50,283.8 | 0 | $ | 0 | ||||||||||
Other Pooled Investment Vehicles | 3 | $ | 445.3 | 1 | $ | 15.1 | ||||||||||
Other Accounts | 0 | $ | 0 | 0 | $ | 0 | ||||||||||
Payson F. Swaffield | ||||||||||||||||
Registered Investment Companies | 2 | $ | 3,099.1 | 0 | $ | 0 | ||||||||||
Other Pooled Investment Vehicles | 0 | $ | 0 | 0 | $ | 0 | ||||||||||
Other Accounts | 0 | $ | 0 | 0 | $ | 0 | ||||||||||
Andrew Szczurowski(1) | ||||||||||||||||
Registered Investment Companies | 6 | �� | $ | 7,121.4 | 0 | $ | 0 | |||||||||
Other Pooled Investment Vehicles | 1 | $ | 194.0 | 0 | $ | 0 | ||||||||||
Other Accounts | 0 | $ | 0 | 0 | $ | 0 | ||||||||||
Michael W. Weilheimer | ||||||||||||||||
Registered Investment Companies | 7 | $ | 9,971.4 | 0 | $ | 0 | ||||||||||
Other Pooled Investment Vehicles | 3 | $ | 581.7 | 0 | $ | 0 | ||||||||||
Other Accounts | 21 | $ | 4,165.1 | 0 | $ | 0 | ||||||||||
| (1) | This portfolio manager serves as portfolio manager of one or more registered investment companies and pooled investment vehicles that invest or may invest in one or more underlying registered investment companies in the Eaton Vance family of funds. The underlying investment companies may be managed by this portfolio manager or another portfolio manager. |
The following table shows the dollar range of Fund shares beneficially owned by each portfolio manager as of the Fund’s most recent fiscal year end.
Portfolio Manager | Dollar Range of Equity Securities Beneficially Owned in the Fund | |
Catherine C. McDermott | None | |
Scott H. Page | $500,001 - $1,000,000 | |
Eric A. Stein | $1 - $10,000 | |
Payson F. Swaffield | $100,001 - $500,000 | |
Andrew Szczurowski | $10,001 - $50,000 | |
Michael W. Weilheimer | None |
Potential for Conflicts of Interest. It is possible that conflicts of interest may arise in connection with a portfolio manager’s management of the Trust’s investments on the one hand and the investments of other accounts for which a portfolio manager is responsible on the other. For example, a portfolio manager may have conflicts of interest in allocating management time, resources and investment opportunities among the Trust and other accounts he or she advises. In addition, due to differences in the investment strategies or restrictions between the Trust and the other accounts, the portfolio manager may take action with respect to another account that differs from the action taken with respect to the Trust. In some cases, another account managed by a portfolio manager may compensate the investment adviser based on the performance of the securities held by that account. The existence of such a performance based fee may create additional conflicts of interest for the portfolio manager in the allocation of management time, resources and investment opportunities. Whenever conflicts of interest arise, the portfolio manager will endeavor to exercise his or her discretion in a manner that he or she believes is equitable to all interested persons. EVM has adopted several policies and procedures designed to address these potential conflicts including a code of ethics and policies that govern the investment adviser’s trading practices, including among other things the aggregation and allocation of trades among clients, brokerage allocations, cross trades and best execution.
Compensation Structure for EVM
Compensation of EVM’s portfolio managers and other investment professionals has three primary components: (1) a base salary, (2) an annual cash bonus, and (3) annual non-cash compensation consisting of options to purchase shares of Eaton Vance Corp. (“EVC”) nonvoting common stock and/or restricted shares of EVC nonvoting common stock that generally are subject to a vesting schedule, and (4) (for equity portfolio managers) a Deferred Alpha Incentive Plan, which pays a deferred cash award tied to future excess returns in certain equity strategy portfolios. EVM’s investment professionals also receive certain retirement, insurance and other benefits that are broadly available to EVM’s employees. Compensation of EVM’s investment professionals is reviewed primarily on an annual basis. Cash bonuses, stock-based compensation awards, and adjustments in base salary are typically paid or put into effect at or shortly after the October 31st fiscal year end of EVC.
Method to Determine Compensation. EVM compensates its portfolio managers based primarily on the scale and complexity of their portfolio responsibilities and the total return performance of managed funds and accounts versus the benchmark(s) stated in the prospectus, as well as an appropriate peer group (as described below). In addition to rankings within peer groups of funds on the basis of absolute performance, consideration may also be given to relative risk-adjusted performance. Risk-adjusted performance measures include, but are not limited to, the Sharpe ratio (Sharpe ratio uses standard deviation and excess return to determine reward per unit of risk). Performance is normally based on periods ending on the September 30th preceding fiscal year end. Fund performance is normally evaluated primarily versus peer groups of funds as determined by Lipper Inc. and/or Morningstar, Inc. When a fund’s peer group as determined by Lipper or Morningstar is deemed by EVM’s management not to provide a fair comparison, performance may instead be evaluated primarily against a custom peer group or market index. In evaluating the performance of a fund and its manager, primary emphasis is normally placed on three-year performance, with secondary consideration of performance over longer and shorter periods. A portion of the compensation payable to equity portfolio managers and investment professionals will be determined based on the ability of one or more accounts managed by such manager to achieve a specified target average annual gross return over a three year period in excess of the account benchmark. The cash bonus to be payable at the end of the three year term will be established at the inception of the term and will be adjusted positively or negatively to the extent that the average annual gross return varies from the specified target return. For funds that are tax-managed or otherwise have an objective of after-tax returns, performance is measured net of taxes. For other funds, performance is evaluated on a pre-tax basis. For funds with an investment objective other than total return (such as current income), consideration will also be given to the fund’s success in achieving its objective. For managers responsible for multiple funds and accounts, investment performance is evaluated on an aggregate basis, based on averages or weighted averages among managed funds and accounts. Funds and accounts that have performance-based advisory fees are not accorded disproportionate weightings in measuring aggregate portfolio manager performance.
The compensation of portfolio managers with other job responsibilities (such as heading an investment group or providing analytical support to other portfolios) will include consideration of the scope of such responsibilities and the managers’ performance in meeting them.
EVM seeks to compensate portfolio managers commensurate with their responsibilities and performance, and competitive with other firms within the investment management industry. EVM participates in investment-industry compensation surveys and utilizes survey data as a factor in determining salary, bonus and stock-based compensation levels for portfolio managers and other investment professionals. Salaries, bonuses and stock-based compensation are also influenced by the operating performance of EVM and its parent company. The overall annual cash bonus pool is generally based on a substantially fixed percentage of pre-bonus adjusted operating income. While the salaries of EVM’s portfolio managers are comparatively fixed, cash bonuses and stock-based compensation may fluctuate significantly from year to year, based on changes in manager performance and other factors as described herein. For a high performing portfolio manager, cash bonuses and stock-based compensation may represent a substantial portion of total compensation.
Item 9. Purchases of Equity Securities by Closed-End Management Investment Company and Affiliated Purchasers
REGISTRANT PURCHASES OF EQUITY SECURITIES
Period* | Total Number of Shares Purchased | Average Price Paid per Share | Total Number of Shares Purchased as Part of Publicly Announced Programs | Maximum Number of Shares that May Yet Be Purchased Under the Programs | ||||||||||||
April 2017 | — | — | — | 10,354,702 | ||||||||||||
May 2017 | — | — | — | 10,354,702 | ||||||||||||
June 2017 | — | — | — | 10,354,702 | ||||||||||||
July 2017 | — | — | — | 10,354,702 | ||||||||||||
August 2017 | — | — | — | 10,354,702 | ||||||||||||
September 2017 | — | — | — | 10,354,702 | ||||||||||||
October 2017 | — | — | — | 10,354,702 | ||||||||||||
November 2017 | — | — | — | 10,354,702 | ||||||||||||
December 2017 | — | — | — | 10,354,702 | ||||||||||||
January 2018 | — | — | — | 10,354,702 | ||||||||||||
February 2018 | — | — | — | 10,354,702 | ||||||||||||
March 2018 | — | — | — | 10,354,702 | ||||||||||||
|
|
|
|
|
|
|
| |||||||||
Total | — | — | — | |||||||||||||
|
|
|
|
|
|
|
| |||||||||
| * | On November 11, 2013, the Fund’s Board of Trustees approved a share repurchase program authorizing the Fund to repurchase up to 10% of its then currently outstanding common shares in open-market transactions at a discount to net asset value. The repurchase program was announced on November 15, 2013. |
Item 10. Submission of Matters to a Vote of Security Holders
No material changes.
Item 11. Controls and Procedures
(a) It is the conclusion of the registrant’s principal executive officer and principal financial officer that the effectiveness of the registrant’s current disclosure controls and procedures (such disclosure controls and procedures having been evaluated within 90 days of the date of this filing) provide reasonable assurance that the information required to be disclosed by the registrant has been recorded, processed, summarized and reported within the time period specified in the Commission’s rules and forms and that the information required to be disclosed by the registrant has been accumulated and communicated to the registrant’s principal executive officer and principal financial officer in order to allow timely decisions regarding required disclosure.
(b) There have been no changes in the registrant’s internal controls over financial reporting during the second fiscal quarter of the period covered by this report that has materially affected, or is reasonably likely to materially affect, the registrant’s internal control over financial reporting.
Item 12. Disclosure of Securities Lending Activities for Closed-End Management Investment Companies
Not applicable.
Item 13. Exhibits
| (a)(1) | Registrant’s Code of Ethics – Not applicable (please see Item 2). | |
| (a)(2)(i) | Treasurer’s Section 302 certification. | |
| (a)(2)(ii) | President’s Section 302 certification. | |
| (b) | Combined Section 906 certification. | |
Signatures
Pursuant to the requirements of the Securities Exchange Act of 1934 and the Investment Company Act of 1940, the registrant has duly caused this report to be signed on its behalf by the undersigned, thereunto duly authorized.
Eaton Vance Limited Duration Income Fund
| By: | /s/ Payson F. Swaffield | |
| Payson F. Swaffield | ||
| President | ||
Date: | May 24, 2018 | |
Pursuant to the requirements of the Securities Exchange Act of 1934 and the Investment Company Act of 1940, this report has been signed below by the following persons on behalf of the registrant and in the capacities and on the dates indicated.
| By: | /s/ James F. Kirchner | |
| James F. Kirchner | ||
| Treasurer | ||
| Date: | May 24, 2018 | |
| By: | /s/ Payson F. Swaffield | |
| Payson F. Swaffield | ||
| President | ||
| Date: | May 24, 2018 | |