UNITED STATES
SECURITIES AND EXCHANGE COMMISSION
Washington, D.C. 20549
FormN-CSR
CERTIFIED SHAREHOLDER REPORT OF REGISTERED
MANAGEMENT INVESTMENT COMPANIES
Investment Company Act File Number:811-21323
Eaton Vance Limited Duration Income Fund
(Exact Name of Registrant as Specified in Charter)
Two International Place, Boston, Massachusetts 02110
(Address of Principal Executive Offices)
Maureen A. Gemma
Two International Place, Boston, Massachusetts 02110
(Name and Address of Agent for Services)
(617)482-8260
(Registrant’s Telephone Number)
March 31
Date of Fiscal Year End
March 31, 2020
Date of Reporting Period
| Item 1. | Reports to Stockholders |

Eaton Vance
Limited Duration Income Fund (EVV)
Annual Report
March 31, 2020
Important Note. Beginning on January 1, 2021, as permitted by regulations adopted by the Securities and Exchange Commission, paper copies of the Fund’s annual and semi-annual shareholder reports will no longer be sent by mail unless you specifically request paper copies of the reports. Instead, the reports will be made available on the Fund’s website (funds.eatonvance.com/closed-end-fund-and-term-trust-documents.php), and you will be notified by mail each time a report is posted and provided with a website address to access the report.
If you already elected to receive shareholder reports electronically, you will not be affected by this change and you need not take any action. If you hold shares at the Fund’s transfer agent, American Stock Transfer & Trust Company, LLC (“AST”), you may elect to receive shareholder reports and other communications from the Fund electronically by contacting AST. If you own your shares through a financial intermediary (such as a broker-dealer or bank), you must contact your financial intermediary to sign up.
You may elect to receive all future Fund shareholder reports in paper free of charge. If you hold shares at AST, you can inform AST that you wish to continue receiving paper copies of your shareholder reports by calling 1-866-439-6787. If you own these shares through a financial intermediary, you must contact your financial intermediary or follow instructions included with this disclosure, if applicable, to elect to continue to receive paper copies of your shareholder reports. Your election to receive reports in paper will apply to all funds held with AST or to all funds held through your financial intermediary, as applicable.

Commodity Futures Trading Commission Registration. Effective December 31, 2012, the Commodity Futures Trading Commission (“CFTC”) adopted certain regulatory changes that subject registered investment companies and advisers to regulation by the CFTC if a fund invests more than a prescribed level of its assets in certain CFTC-regulated instruments (including futures, certain options and swap agreements) or markets itself as providing investment exposure to such instruments. The investment adviser has claimed an exclusion from the definition of “commodity pool operator” under the Commodity Exchange Act with respect to its management of the Fund. Accordingly neither the Fund nor the adviser with respect to the operation of the Fund is subject to CFTC regulation. Because of its management of other strategies, the Fund’s adviser is registered with the CFTC as a commodity pool operator. The adviser is also registered as a commodity trading advisor.
Fund shares are not insured by the FDIC and are not deposits or other obligations of, or guaranteed by, any depository institution. Shares are subject to investment risks, including possible loss of principal invested.
Annual ReportMarch 31, 2020
Eaton Vance
Limited Duration Income Fund
Table of Contents
Management’s Discussion of Fund Performance | 2 | |||
Performance | 3 | |||
Fund Profile | 4 | |||
The Fund’s Investment Objective and Principal Strategies | 5 | |||
Endnotes and Additional Disclosures | 6 | |||
Financial Statements | 7 | |||
Report of Independent Registered Public Accounting Firm | 76 | |||
Federal Tax Information | 77 | |||
Annual Meeting of Shareholders | 78 | |||
Dividend Reinvestment Plan | 79 | |||
Management and Organization | 81 | |||
Important Notices | 84 | |||
Eaton Vance
Limited Duration Income Fund
March 31, 2020
Management’s Discussion of Fund Performance1
We are pleased to provide this annual report for Eaton Vance Limited Duration Income Fund (the Fund) covering the12-month period ended March 31, 2020. Information about the Fund over the period appears below and in the pages that follow.
Economic and Market Conditions
The12-month period ended March 31, 2020 began with investors debating the strength of the longest-ever U.S. economic expansion, and ended with markets bracing for a recession or even depression. A black swan event that no one had predicted — a global pandemic brought on by the novel coronavirus — spread across the globe in the final quarter of the period and brought most of the world’s economies to their knees.
As economic activity declined dramatically, corporate debt, along with equities, plunged in value. For the12-month period, high-yield bonds, as measured by the ICE BofA U.S. High Yield Index, returned-7.45%, while the S&P/LSTA Leveraged Loan Index, a loan market barometer, fell 9.16%. U.S. Treasuries, however, performed strongly, as the U.S. Federal Reserve (the Fed) rolled out stimulus programs to shore up the economy, including two emergency rate cuts in the final month of the period. The ICE BofA1-10 Year U.S. Treasury Index returned 8.97% for the12-month period, and the Bloomberg Barclays U.S. Aggregate Bond Index, a broad measure of the U.S. bond market, returned 8.93%.
In the high-yield market, the negative returns for the fiscal year were entirely generated in the last month of the period. While trade tensions and slowing global growth were concerns from the beginning of the period, those worries were somewhat eased as an accommodative Fed delivered on several rate cuts in 2019 that were supportive to high-yield bonds. The positive sentiment persisted untilmid-February 2020, when the high yield market experienced the sharpestsell-off in the history of the asset class, as markets anticipated an impending recession caused by the rapid spread of the novel coronavirus.
Until the final quarter, the period had been shaping up as a strong one for leveraged loan performance, with prices appreciating in the final months of 2019, issuer fundamentals remaining strong, and the default rate declining. The first quarter of 2020, however, marked the second worst calendar quarter in the asset class’ long history, with the S&P/LSTA Leveraged Loan Index plunging 13.05% — outdone only by the approximately 23% plunge in the fourth quarter of 2008. For the period as a whole, lower-rated loans declined more than higher-rated loans, and theD-rated (defaulted) credit tier lost over 49%. While the trailing12-month default rate ended the period at 1.84% on apar-weighted basis — below its long-term average — it was widely expected to climb in the months ahead.
In contrast, agency mortgage-backed securities (MBS) were a bright spot in a generally chaotic market, as the asset class benefited from substantial purchases by the Fed as part of its unlimited quantitative easing program. In an environment of heightened concerns on both liquidity and credit quality fronts, agency MBS continued to appear attractive for theirAAA-rating and highly liquid market.
Fund Performance
For the fiscal year ended March 31, 2020, the Fund had a total return of-11.69% at net asset value (NAV). By comparison, the blended benchmark of 33.33% S&P/LSTA Leveraged Loan Index (Loan Index), 33.33% ICE BofA B U.S. High Yield Index (High Yield Index) and 33.34% ICE BofA U.S. Mortgage-Backed Securities Index (MBS Index) returned-3.54% for the same12-month period.
For the Fund’s benchmark allocations, investments in MBS had a positive contribution to the Fund’s performance during the12-month period relative to the MBS Index, although results for the MBS sleeve trailed the MBS Index. The Fund’s agency MBS strategy had a shorter duration than the MBS Index, which detracted from relative results to the MBS Index, astwo-year U.S. Treasury yields fell more than 200 basis points over the period. Spreads widened throughout the12-month period, as refinancing activity increased. As U.S. Treasury yields fell over the period, an increasing number of homeowners refinanced their mortgages, which resulted in faster prepayments and wider spreads. During most of the period, spreads remained at levels wider than their historic five-year average.
The Fund’s allocation to high-yield corporate bonds had a negative contribution to the Fund’s performance, although this allocation outperformed the High Yield Index. From a sector perspective, credit selection in the energy, services and gaming sectors contributed to relative performance, while overweight positions in the technology and healthcare sectors were also additive to performance. Exposure to higher quality,BB-rated securities along with security selection inB-rated issues helped relative performance to the High Yield Index. Meanwhile, underweights to the telecommunications and energy sectors, as well as security selection in the telecommunications and restaurants sectors, detracted from relative performance to the High Yield Index. An exposure to lower quality,CCC-rated high yield bonds and security selection inBB-rated issues also hurt relative performance to the High Yield Index.
The Fund’s exposure to floating-rate corporate loans was a relative detractor, as this allocation trailed the Loan Index during the12-month period. In particular, a modest allocation to collateralized loan obligations (CLOs) detracted from performance relative to the Loan Index, as CLOs prices fell sharply during the12-month period. The Loan Index does not include CLOs. Additionally, loan selection in the financial intermediaries industry hurt relative performance to the Loan Index. On the other hand, underweights to the volatile oil & gas and retailers industries – and security selection within those industries – aided relative results to the Loan Index. Overweights to and security selection in the drugs, insurance and leisure goods/activities/movies industries also aided the Fund’s relative results to the Loan Index.
For the Fund’sout-of-benchmark exposures, emerging-market debt detracted from the Fund’s performance during the period, as did allocations to investment-grade corporate bonds, commercial MBS and European high-yield bonds.
We appreciate your support and value the privilege to serve as the Fund’s investment manager. For more information on the Fund, please visit our website at eatonvance.com.
See Endnotes and Additional Disclosures in this report.
Past performance is no guarantee of future results. Returns are historical and are calculated net of management fees and other expenses by determining the percentage change in net asset value (NAV) or market price (as applicable) with all distributions reinvested in accordance with the Fund’s Dividend Reinvestment Plan. Performance at market price will differ from performance at NAV due to variations in the Fund’s market price versus NAV, which may reflect factors such as fluctuations in supply and demand for Fund shares, changes in Fund distributions, shifting market expectations for the Fund’s future returns and distribution rates, and other considerations affecting the trading prices ofclosed-end funds. Investment return and principal value will fluctuate so that shares, when sold, may be worth more or less than their original cost. Performance for periods less than or equal to one year is cumulative. Performance is for the stated time period only; due to market volatility, current Fund performance may be lower or higher than the quoted return. For performance as of the most recentmonth-end, please refer to eatonvance.com.
| 2 |
Eaton Vance
Limited Duration Income Fund
March 31, 2020
Performance3,4
Portfolio ManagersPayson F. Swaffield, CFA, Catherine C. McDermott, Andrew Szczurowski, CFA, Eric A. Stein, CFA and Kelley G. Baccei
| % Average Annual Total Returns | Inception Date | One Year | Five Years | Ten Years | ||||||||||||
Fund at NAV | 05/30/2003 | –11.69 | % | 1.66 | % | 4.69 | % | |||||||||
Fund at Market Price | — | –9.33 | 1.66 | 3.91 | ||||||||||||
Blended Index | — | –3.54 | % | 2.19 | % | 3.90 | % | |||||||||
| % Premium/Discount to NAV5 | ||||||||||||||||
| –10.12 | % | |||||||||||||||
| Distributions6 | ||||||||||||||||
Total Distributions per share for the period | $ | 1.017 | ||||||||||||||
Distribution Rate at NAV | 10.20 | % | ||||||||||||||
Distribution Rate at Market Price | 11.35 | % | ||||||||||||||
| % Total Leverage7 | ||||||||||||||||
Auction Preferred Shares (APS) | 9.94 | % | ||||||||||||||
Borrowings | 27.22 | |||||||||||||||
See Endnotes and Additional Disclosures in this report.
Past performance is no guarantee of future results. Returns are historical and are calculated net of management fees and other expenses by determining the percentage change in net asset value (NAV) or market price (as applicable) with all distributions reinvested in accordance with the Fund’s Dividend Reinvestment Plan. Performance at market price will differ from performance at NAV due to variations in the Fund’s market price versus NAV, which may reflect factors such as fluctuations in supply and demand for Fund shares, changes in Fund distributions, shifting market expectations for the Fund’s future returns and distribution rates, and other considerations affecting the trading prices ofclosed-end funds. Investment return and principal value will fluctuate so that shares, when sold, may be worth more or less than their original cost. Performance for periods less than or equal to one year is cumulative. Performance is for the stated time period only; due to market volatility, current Fund performance may be lower or higher than the quoted return. For performance as of the most recentmonth-end, please refer to eatonvance.com.
| 3 |
Eaton Vance
Limited Duration Income Fund
March 31, 2020
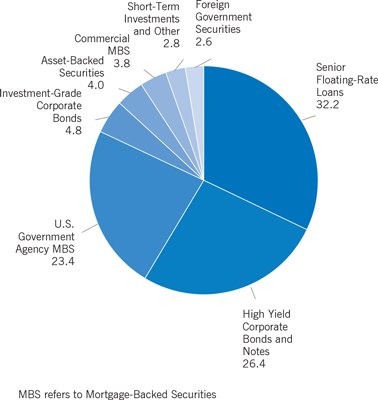
Fund Profile
Asset Allocation (% of total investments)8
See Endnotes and Additional Disclosures in this report.
| 4 |
Eaton Vance
Limited Duration Income Fund
March 31, 2020
The Fund’s Investment Objective and Principal Strategies2
The Fund’s investment objective is to provide a high level of current income. The Fund may, as a secondary objective, also seek capital appreciation to the extent consistent with its primary goal of high current income. Under normal market conditions, the Fund expects to maintain an average duration of no more than five years (including the effect of anticipated leverage).
In pursuing its investment objectives, the Fund normally invests at least 25% of its total assets in each of:
(1) investments rated investment grade, including, but not limited to, U.S. Government securities (which may include U.S. Treasuries and mortgage-backed securities (MBS) and other securities issued, backed, or otherwise guaranteed by the U.S. Government, or its agencies or instrumentalities), commercial MBS and corporate debt obligations; and (2) investments rated below investment grade, including, but not limited to, senior loans and high-yield debt securities. Investment-grade investments are those ratedBBB- or higher by S&P Global Ratings or Fitch Ratings, Baa3 or higher as determined by Moody’s Investor Service, Inc. or, if not rated, determined to be of comparable credit quality by the Fund’s portfolio managers.
Under normal market conditions, the Fund structures and seeks to maintain its portfolio of high-quality investments (such as MBS) and lower qualitynon-investment grade bonds and senior loans in such a manner that the Fund has an average dollar-weighted portfolio quality of investment grade. Within the foregoing guideline, the Fund may invest in individual investments of any credit quality.
The Fund may invest without limit in foreign investments denominated in U.S. dollars and may invest up to 15% of its net assets in foreign investments denominated in authorized foreign currencies, which include euros, British pounds, Swiss francs, Canadian dollars and Australian dollars. The Fund seeks to hedge against foreign currency fluctuations through the use of currency exchange contracts and other permitted hedging strategies. The total amount of the Fund’s outstanding forward commitments to purchase and sell generic U.S. government agency MBS may not exceed 10% of the Fund’s total net assets or 50% of the Fund’s MBS holdings. The Fund may also invest in other types of investments that are not part of its principal strategy from time to time.
The Fund employs leverage to seek opportunities for additional income. Leverage may amplify the effect on the Fund’s NAV of any increase or decrease in the value of investments held. There can be no assurance that the use of borrowings will be successful. The Fund has issued preferred shares and borrowed to establish leverage. The Fund also may establish leverage through derivatives and reverse repurchase agreements.
See Endnotes and Additional Disclosures in this report.
Past performance is no guarantee of future results. Returns are historical and are calculated net of management fees and other expenses by determining the percentage change in net asset value (NAV) or market price (as applicable) with all distributions reinvested in accordance with the Fund’s Dividend Reinvestment Plan. Performance at market price will differ from performance at NAV due to variations in the Fund’s market price versus NAV, which may reflect factors such as fluctuations in supply and demand for Fund shares, changes in Fund distributions, shifting market expectations for the Fund’s future returns and distribution rates, and other considerations affecting the trading prices ofclosed-end funds. Investment return and principal value will fluctuate so that shares, when sold, may be worth more or less than their original cost. Performance for periods less than or equal to one year is cumulative. Performance is for the stated time period only; due to market volatility, current Fund performance may be lower or higher than the quoted return. For performance as of the most recentmonth-end, please refer to eatonvance.com.
| 5 |
Eaton Vance
Limited Duration Income Fund
March 31, 2020
Endnotes and Additional Disclosures
| 1 | The views expressed in this report are those of the Fund’s investment adviser and are subject to change at any time based upon market or other conditions, and Eaton Vance and the Fund(s) disclaim any responsibility to update such views. These views may not be relied upon as investment advice and, because investment decisions are based on many factors, may not be relied upon as an indication of trading intent on behalf of any Eaton Vance fund. This commentary may contain statements that are not historical facts, referred to as “forward-looking statements.” The Fund’s actual future results may differ significantly from those stated in any forward-looking statement, depending on factors such as changes in securities or financial markets or general economic conditions, the volume of sales and purchases of Fund shares, the continuation of investment advisory, administrative and service contracts, and other risks discussed from time to time in the Fund’s filings with the Securities and Exchange Commission. |
| 2 | The information contained herein is provided for informational purposes only and does not constitute a solicitation of an offer to buy or sell Fund shares. Common shares of the Fund are available for purchase and sale only at current market prices in secondary market trading. There is no assurance that the Fund will achieve its investment objective. The Fund is subject to numerous risks, including investment risks. Shares ofclosed-end funds often trade at a discount from their NAV. The Fund is not a complete investment program and you may lose money investing in the Fund. |
| 3 | S&P/LSTA Leveraged Loan Index is an unmanaged index of the institutional leveraged loan market. S&P/LSTA Leveraged Loan indices are a product of S&P Dow Jones Indices LLC (“S&P DJI”) and have been licensed for use. S&P® is a registered trademark of S&P DJI; Dow Jones® is a registered trademark of Dow Jones Trademark Holdings LLC (“Dow Jones”); LSTA is a trademark of Loan Syndications and Trading Association, Inc. S&P DJI, Dow Jones, their respective affiliates and their third party licensors do not sponsor, endorse, sell or promote the Fund, will not have any liability with respect thereto and do not have any liability for any errors, omissions, or interruptions of the S&P Dow Jones Indices. ICE BofA B U.S. High Yield Index is an unmanaged index of below-investment grade U.S. corporate bonds with a credit quality rating of B. ICE BofA U.S. Mortgage-Backed Securities Index is an unmanaged index of fixed rate residential mortgage pass-through securities issued by U.S. agencies. ICE® BofA® indices are not for redistribution or other uses; provided “as is”, without warranties, and with no liability. Eaton Vance has prepared this report and ICE Data Indices, LLC does not endorse it, or guarantee, review, or endorse Eaton Vance’s products. BofA® is a licensed registered trademark of Bank of America Corporation in the United States and other countries. The Blended Index is rebalanced monthly. Unless otherwise stated, index returns do not reflect the effect of any applicable sales charges, commissions, expenses, taxes or leverage, as applicable. It is not possible to invest directly in an index. |
| 4 | Performance results reflect the effects of leverage. Included in the average annual total return at NAV for the five- andten-year periods is the impact of the 2018 tender and repurchase of a portion of the Fund’s Auction Preferred Shares (APS) at 92% of the Fund’s APS per share liquidation preference. Had this transaction not occurred, the total return at NAV would be lower for the Fund. The Fund’s performance for certain periods reflects the effects of expense reductions. Absent these reductions, performance would have been lower. Pursuant to the Fund’s Dividend Reinvestment Plan, if the NAV per share on the distribution payment date is equal to or less than the market price per share plus estimated brokerage commissions, then new shares are issued. The number of shares shall be determined by the greater of the NAV per share or 95% of the market price. Otherwise, shares generally are purchased on the open market by the Plan’s agent. |
| 5 | The shares of the Fund often trade at a discount or premium to their net asset value. The discount or premium may vary over time and may be higher or lower than what is quoted in this report. Forup-to-date premium/discount information, please refer tohttps://funds.eatonvance.com/closed-end-fund-prices.php. |
| 6 | The Distribution Rate is based on the Fund’s last regular distribution per share in the period (annualized) divided by the Fund’s NAV or market price at the end of the period. The Fund’s distributions in any period may be more or less than the net return earned by the Fund on its investments, and therefore should not be used as a measure of performance or confused with “yield” or “income.” Distributions in excess of Fund returns may include a return of capital which, over time, will cause the Fund’s net assets and net asset value per share to erode. When the Fund’s distributions include amounts from sources other than net investment income, shareholders are notified. The final determination of the tax characteristics of Fund distributions will occur after the end of the year, at which time that determination will be reported to shareholders. |
| 7 | Leverage represents the liquidation value of the Fund’s APS and borrowings outstanding as a percentage of Fund net assets applicable to common shares plus APS and borrowings outstanding. Use of leverage creates an opportunity for income, but creates risks including greater price volatility. The cost of leverage rises and falls with changes in short-term interest rates. The Fund may be required to maintain prescribed asset coverage for its leverage and may be required to reduce its leverage at an inopportune time. |
| 8 | Asset Allocation as a percentage of the Fund’s net assets amounted to 157.7%. |
Fund profile subject to change due to active management. |
Additional Information |
ICE BofA U.S. High Yield Index is an unmanaged index of below-investment grade U.S. corporate bonds. ICE BofA1-10 Year U.S. Treasury Index is an unmanaged index of U.S. Treasury securities with a maturity of less than 10 years. Bloomberg Barclays U.S. Aggregate Bond Index is an unmanaged index of domestic investment-grade bonds, including corporate, government and mortgage-backed securities. Unless otherwise stated, index returns do not reflect the effect of any applicable sales charges, commissions, expenses, taxes or leverage, as applicable. It is not possible to invest directly in an index. |
Credit ratings are categorized using S&P Global Ratings (“S&P”). If S&P does not publish a rating, then the Moody’s Investors Service, Inc. (“Moody’s”) rating is applied. Ratings, which are subject to change, apply to the creditworthiness of the issuers of the underlying securities and not to the Fund or its shares. Credit ratings measure the quality of a bond based on the issuer’s creditworthiness, with ratings ranging from AAA, being the highest, to D, being the lowest based on S&P’s measures. Ratings of BBB or higher by S&P or Baa or higher by Moody’s are considered to be investment-grade quality. Credit ratings are based largely on the ratings agency’s analysis at the time of rating. The rating assigned to any particular security is not necessarily a reflection of the issuer’s current financial condition and does not necessarily reflect its assessment of the volatility of a security’s market value or of the liquidity of an investment in the security. |
Duration is a measure of the expected change in price of a bond — in percentage terms — given a one percent change in interest rates, all else being constant. Securities with lower durations tend to be less sensitive to interest rate changes. |
Important Notice to Shareholders |
Effective January 1, 2020, the ICE BofAML indices were rebranded as ICE BofA indices. |
Effective November 1, 2020, the Fund will be managed by Catherine C. McDermott, Andrew Szczurowski, Eric A. Stein and Kelley G. Baccei. Payson F. Swaffield will serve as a member of the portfolio management team of the Fund through October 31, 2020. |
| 6 |
Eaton Vance
Limited Duration Income Fund
March 31, 2020
Portfolio of Investments
| Senior Floating-Rate Loans — 50.7%(1) |
| |||||||||||
| Borrower/Tranche Description | Principal Amount* (000’s omitted) | Value | ||||||||||
| Aerospace and Defense — 1.1% | ||||||||||||
| Aernnova Aerospace S.A.U | ||||||||||||
Term Loan, 3.00%, (3 mo. EURIBOR + 3.00%), Maturing February 22, 2027 | EUR | 204 | $ | 178,940 | ||||||||
Term Loan, 3.00%, (3 mo. EURIBOR + 3.00%), Maturing February 26, 2027 | EUR | 796 | 697,865 | |||||||||
| AI Convoy (Luxembourg) S.a.r.l. | ||||||||||||
Term Loan, 3.75%, (2 mo. EURIBOR + 3.75%), Maturing January 17, 2027 | EUR | 1,000 | 978,823 | |||||||||
Term Loan, 5.34%, (3 mo. USD LIBOR + 3.50%), Maturing January 17, 2027 | 750 | 705,000 | ||||||||||
| Dynasty Acquisition Co., Inc. | ||||||||||||
Term Loan, 4.95%, (3 mo. USD LIBOR + 3.50%), Maturing April 6, 2026 | 357 | 281,121 | ||||||||||
Term Loan, 4.95%, (3 mo. USD LIBOR + 3.50%), Maturing April 6, 2026 | 664 | 522,885 | ||||||||||
| IAP Worldwide Services, Inc. | ||||||||||||
Revolving Loan, 1.38%, (3 mo. USD LIBOR + 5.50%), Maturing July 19, 2021(2) | 172 | 154,172 | ||||||||||
Term Loan - Second Lien, 8.00%, (3 mo. USD LIBOR + 6.50%), Maturing July 18, 2021(3) | 225 | 175,875 | ||||||||||
| TransDigm, Inc. | ||||||||||||
Term Loan, 3.24%, (1 mo. USD LIBOR + 2.25%), Maturing August 22, 2024 | 1,374 | 1,268,859 | ||||||||||
Term Loan, 3.24%, (1 mo. USD LIBOR + 2.25%), Maturing December 9, 2025 | 5,530 | 5,170,186 | ||||||||||
| WP CPP Holdings, LLC | ||||||||||||
Term Loan, 5.53%, (USD LIBOR + 3.75%), Maturing April 30, | 6,651 | 5,071,658 | ||||||||||
| $ | 15,205,384 | |||||||||||
| Automotive — 1.0% | ||||||||||||
| Adient US, LLC | ||||||||||||
Term Loan, 5.52%, (3 mo. USD LIBOR + 4.00%), Maturing May 6, 2024 | 720 | $ | 639,511 | |||||||||
| American Axle and Manufacturing, Inc. | ||||||||||||
Term Loan, 3.20%, (1 mo. USD LIBOR + 2.25%), Maturing April 6, 2024 | 2,636 | 2,234,068 | ||||||||||
| Autokiniton US Holdings, Inc. | ||||||||||||
Term Loan, 7.36%, (1 mo. USD LIBOR + 6.38%), Maturing May 22, 2025 | 835 | 684,803 | ||||||||||
| Bright Bidco B.V. | ||||||||||||
Term Loan, 4.57%, (USD LIBOR + 3.50%), Maturing June 30, | 1,752 | 623,718 | ||||||||||
| Chassix, Inc. | ||||||||||||
Term Loan, 7.35%, (USD LIBOR + 5.50%), Maturing November 15, 2023(4) | 1,466 | 1,092,356 | ||||||||||
| Borrower/Tranche Description | Principal Amount* (000’s omitted) | Value | ||||||||||
| Automotive (continued) | ||||||||||||
| Dayco Products, LLC | ||||||||||||
Term Loan, 5.86%, (3 mo. USD LIBOR + 4.25%), Maturing May 19, 2023 | 1,167 | $ | 875,250 | |||||||||
| Garrett LX III S.a.r.l. | ||||||||||||
Term Loan, 3.77%, (3 mo. USD LIBOR + 2.50%), Maturing September 27, 2025 | 296 | 246,743 | ||||||||||
| IAA, Inc. | ||||||||||||
Term Loan, 3.25%, (1 mo. USD LIBOR + 2.25%, Floor 1.00%), Maturing June 28, 2026 | 581 | 557,280 | ||||||||||
| Panther BF Aggregator 2 L.P. | ||||||||||||
Term Loan, Maturing April 30, 2026(5) | EUR | 1,500 | 1,459,963 | |||||||||
| Tenneco, Inc. | ||||||||||||
Term Loan, 3.99%, (1 mo. USD LIBOR + 3.00%), Maturing October 1, 2025 | 3,728 | 2,628,108 | ||||||||||
| Thor Industries, Inc. | ||||||||||||
Term Loan, 5.36%, (1 mo. USD LIBOR + 3.75%), Maturing February 1, 2026 | 1,096 | 942,979 | ||||||||||
| TI Group Automotive Systems, LLC | ||||||||||||
Term Loan, 3.49%, (1 mo. USD LIBOR + 2.50%), Maturing June 30, 2022 | 1,065 | 974,266 | ||||||||||
Term Loan, 3.50%, (3 mo. EURIBOR + 2.75%, Floor 0.75%), Maturing June 30, 2022 | EUR | 907 | 885,536 | |||||||||
| $ | 13,844,581 | |||||||||||
| Beverage and Tobacco — 0.3% | ||||||||||||
| Arterra Wines Canada, Inc. | ||||||||||||
Term Loan, 3.80%, (3 mo. USD LIBOR + 2.75%), Maturing December 15, 2023 | 2,883 | $ | 2,450,469 | |||||||||
| Flavors Holdings, Inc. | ||||||||||||
Term Loan, 7.20%, (3 mo. USD LIBOR + 5.75%), Maturing June 30, 2020 | 760 | 729,360 | ||||||||||
Term Loan - Second Lien, 11.45%, (3 mo. USD LIBOR + 10.00%), Maturing October 3, 2021 | 1,000 | 910,000 | ||||||||||
| $ | 4,089,829 | |||||||||||
| Brokerage / Securities Dealers / Investment Houses — 0.2% | ||||||||||||
| Advisor Group, Inc. | ||||||||||||
Term Loan, 5.99%, (1 mo. USD LIBOR + 5.00%), Maturing July 31, 2026 | 1,172 | $ | 902,488 | |||||||||
| Clipper Acquisitions Corp. | ||||||||||||
Term Loan, 3.13%, (1 mo. USD LIBOR + 1.75%), Maturing December 27, 2024 | 1,246 | 1,165,302 | ||||||||||
| OZ Management L.P. | ||||||||||||
Term Loan, 5.56%, (1 mo. USD LIBOR + 4.75%), Maturing April 10, 2023 | 50 | 46,620 | ||||||||||
| $ | 2,114,410 | |||||||||||
| 7 | See Notes to Financial Statements. |
Eaton Vance
Limited Duration Income Fund
March 31, 2020
Portfolio of Investments — continued
| Borrower/Tranche Description | Principal Amount* (000’s omitted) | Value | ||||||||
| Building and Development — 1.8% | ||||||||||
| ACProducts, Inc. | ||||||||||
Term Loan, 8.19%, (3 mo. USD LIBOR + 6.50%), Maturing August 18, 2025 | 400 | $ | 365,000 | |||||||
| Advanced Drainage Systems, Inc. | ||||||||||
Term Loan, 3.81%, (1 mo. USD LIBOR + 2.25%), Maturing July 31, 2026 | 301 | 281,410 | ||||||||
| American Builders & Contractors Supply Co., Inc. | ||||||||||
Term Loan, 2.99%, (1 mo. USD LIBOR + 2.00%), Maturing January 15, 2027 | 2,438 | 2,214,289 | ||||||||
| APi Group DE, Inc. | ||||||||||
Term Loan, 3.49%, (1 mo. USD LIBOR + 2.50%), Maturing October 1, 2026 | 1,521 | 1,399,492 | ||||||||
| Beacon Roofing Supply, Inc. | ||||||||||
Term Loan, 3.24%, (1 mo. USD LIBOR + 2.25%), Maturing January 2, 2025 | 637 | 579,670 | ||||||||
| Brookfield Property REIT, Inc. | ||||||||||
Term Loan, 3.49%, (1 mo. USD LIBOR + 2.50%), Maturing August 27, 2025 | 1,010 | 724,911 | ||||||||
| Core & Main L.P. | ||||||||||
Term Loan, 4.33%, (USD LIBOR + 2.75%), Maturing August 1, 2024(4) | 1,178 | 1,042,716 | ||||||||
| CPG International, Inc. | ||||||||||
Term Loan, 5.93%, (12 mo. USD LIBOR + 3.75%), Maturing May 5, 2024 | 1,681 | 1,411,873 | ||||||||
| Cushman & Wakefield U.S. Borrower, LLC | ||||||||||
Term Loan, 3.74%, (1 mo. USD LIBOR + 2.75%), Maturing August 21, 2025 | 5,826 | 5,243,625 | ||||||||
| Henry Company, LLC | ||||||||||
Term Loan, 5.00%, (1 mo. USD LIBOR + 4.00%, Floor 1.00%), Maturing October 5, 2023 | 2,298 | 1,972,288 | ||||||||
| NCI Building Systems, Inc. | ||||||||||
Term Loan, 4.56%, (1 mo. USD LIBOR + 3.75%), Maturing April 12, 2025 | 788 | 689,474 | ||||||||
| Quikrete Holdings, Inc. | ||||||||||
Term Loan, 3.49%, (1 mo. USD LIBOR + 2.50%), Maturing February 1, 2027 | 2,997 | 2,607,647 | ||||||||
| RE/MAX International, Inc. | ||||||||||
Term Loan, 3.74%, (1 mo. USD LIBOR + 2.75%), Maturing December 15, 2023 | 2,211 | 1,934,286 | ||||||||
| Realogy Group, LLC | ||||||||||
Term Loan, 3.83%, (1 mo. USD LIBOR + 2.25%), Maturing February 8, 2025 | 901 | 779,024 | ||||||||
| Summit Materials Companies I, LLC | ||||||||||
Term Loan, 2.99%, (1 mo. USD LIBOR + 2.00%), Maturing November 21, 2024 | 684 | 606,417 | ||||||||
| Werner FinCo L.P. | ||||||||||
Term Loan, 5.00%, (1 mo. USD LIBOR + 4.00%, Floor 1.00%), Maturing July 24, 2024 | 1,024 | 906,613 | ||||||||
| Borrower/Tranche Description | Principal Amount* (000’s omitted) | Value | ||||||||||
| Building and Development (continued) | ||||||||||||
| WireCo WorldGroup, Inc. | ||||||||||||
Term Loan, 6.07%, (6 mo. USD LIBOR + 5.00%), Maturing September 30, 2023 | 1,353 | $ | 1,089,371 | |||||||||
Term Loan - Second Lien, 10.07%, (6 mo. USD LIBOR + 9.00%), Maturing September 30, 2024 | 1,425 | 1,200,563 | ||||||||||
| $ | 25,048,669 | |||||||||||
| Business Equipment and Services — 4.5% | ||||||||||||
| Adtalem Global Education, Inc. | ||||||||||||
Term Loan, 3.99%, (1 mo. USD LIBOR + 3.00%), Maturing April 11, 2025 | 418 | $ | 375,806 | |||||||||
| AlixPartners, LLP | ||||||||||||
Term Loan, 3.25%, (3 mo. EURIBOR + 3.25%), Maturing April 4, 2024 | EUR | 1,762 | 1,749,201 | |||||||||
| Allied Universal Holdco, LLC | ||||||||||||
Term Loan, 5.24%, (1 mo. USD LIBOR + 4.25%), Maturing July 10, 2026 | 2,768 | 2,560,458 | ||||||||||
| Altran Technologies S.A. | ||||||||||||
Term Loan, 3.00%, (1 mo. EURIBOR + 3.00%), Maturing March 20, 2025 | EUR | 1,398 | 1,480,406 | |||||||||
| Amentum Government Services Holdings, LLC | ||||||||||||
Term Loan, 4.99%, (1 mo. USD LIBOR + 4.00%), Maturing February 1, 2027 | 1,025 | 968,625 | ||||||||||
| AppLovin Corporation | ||||||||||||
Term Loan, 4.49%, (1 mo. USD LIBOR + 3.50%), Maturing August 15, 2025 | 2,273 | 2,051,367 | ||||||||||
| ASGN Incorporated | ||||||||||||
Term Loan, 2.74%, (1 mo. USD LIBOR + 1.75%), Maturing April 2, 2025 | 313 | 292,465 | ||||||||||
| Belfor Holdings, Inc. | ||||||||||||
Term Loan, 4.99%, (1 mo. USD LIBOR + 4.00%), Maturing April 6, 2026 | 546 | 526,769 | ||||||||||
| BidFair MergeRight, Inc. | ||||||||||||
Term Loan, 6.50%, (1 mo. USD LIBOR + 5.50%, Floor 1.00%), Maturing January 15, 2027 | 648 | 521,849 | ||||||||||
| Bracket Intermediate Holding Corp. | ||||||||||||
Term Loan, 6.16%, (3 mo. USD LIBOR + 4.25%), Maturing September 5, 2025 | 936 | 753,279 | ||||||||||
| Brand Energy & Infrastructure Services, Inc. | ||||||||||||
Term Loan, 6.08%, (3 mo. USD LIBOR + 4.25%), Maturing June 21, 2024 | 584 | 476,525 | ||||||||||
| Camelot U.S. Acquisition 1 Co. | ||||||||||||
Term Loan, 4.24%, (1 mo. USD LIBOR + 3.25%), Maturing October 31, 2026 | 1,845 | 1,670,064 | ||||||||||
| CCC Information Services, Inc. | ||||||||||||
Term Loan, 3.75%, (1 mo. USD LIBOR + 2.75%, Floor 1.00%), Maturing April 29, 2024 | 1,934 | 1,786,674 | ||||||||||
| 8 | See Notes to Financial Statements. |
Eaton Vance
Limited Duration Income Fund
March 31, 2020
Portfolio of Investments — continued
| Borrower/Tranche Description | Principal Amount* (000’s omitted) | Value | ||||||||
| Business Equipment and Services (continued) | ||||||||||
| Ceridian HCM Holding, Inc. | ||||||||||
Term Loan, 3.49%, (1 mo. USD LIBOR + 2.50%), Maturing April 30, 2025 | 1,527 | $ | 1,427,511 | |||||||
| CM Acquisition Co. | ||||||||||
Term Loan, 11.45%, (3 mo. USD LIBOR + 10.00%), Maturing July 26, 2023 | 265 | 248,476 | ||||||||
| Da Vinci Purchaser Corp. | ||||||||||
Term Loan, 5.87%, (3 mo. USD LIBOR + 4.00%), Maturing January 8, 2027 | 425 | 396,844 | ||||||||
| Deerfield Dakota Holding, LLC | ||||||||||
Term Loan, Maturing February 13, 2025(5) | 1,975 | 1,698,500 | ||||||||
| EAB Global, Inc. | ||||||||||
Term Loan, 5.74%, (3 mo. USD LIBOR + 3.75%), Maturing November 15, 2024 | 1,397 | 1,207,972 | ||||||||
| EIG Investors Corp. | ||||||||||
Term Loan, 5.39%, (3 mo. USD LIBOR + 3.75%), Maturing February 9, 2023 | 3,157 | 2,588,851 | ||||||||
| Element Materials Technology Group US Holdings, Inc. | ||||||||||
Term Loan, 4.95%, (3 mo. USD LIBOR + 3.50%), Maturing June 28, 2024 | 415 | 348,970 | ||||||||
| Garda World Security Corporation | ||||||||||
Term Loan, 6.39%, (3 mo. USD LIBOR + 4.75%), Maturing October 30, 2026 | 859 | 820,184 | ||||||||
| IG Investment Holdings, LLC | ||||||||||
Term Loan, 5.45%, (3 mo. USD LIBOR + 4.00%), Maturing May 23, 2025 | 2,902 | 2,351,001 | ||||||||
| IRI Holdings, Inc. | ||||||||||
Term Loan, 6.11%, (3 mo. USD LIBOR + 4.50%), Maturing December 1, 2025 | 10,033 | 8,076,915 | ||||||||
| Iron Mountain, Inc. | ||||||||||
Term Loan, 2.74%, (1 mo. USD LIBOR + 1.75%), Maturing January 2, 2026 | 907 | 874,772 | ||||||||
| KAR Auction Services, Inc. | ||||||||||
Term Loan, 3.19%, (1 mo. USD LIBOR + 2.25%), Maturing September 19, 2026 | 647 | 601,477 | ||||||||
| Kronos Incorporated | ||||||||||
Term Loan, 4.76%, (3 mo. USD LIBOR + 3.00%), Maturing November 1, 2023 | 6,816 | 6,313,120 | ||||||||
| KUEHG Corp. | ||||||||||
Term Loan, 5.20%, (3 mo. USD LIBOR + 3.75%), Maturing February 21, 2025 | 2,289 | 1,722,373 | ||||||||
Term Loan - Second Lien, 9.70%, (3 mo. USD LIBOR + 8.25%), Maturing August 18, 2025 | 425 | 359,125 | ||||||||
| LGC Group Holdings Ltd. | ||||||||||
Term Loan, Maturing January 22, | EUR | 1,000 | 954,795 | |||||||
| LGC Limited | ||||||||||
Term Loan, Maturing January 22, | 350 | 311,500 | ||||||||
| Borrower/Tranche Description | Principal Amount* (000’s omitted) | Value | ||||||||
| Business Equipment and Services (continued) | ||||||||||
| Monitronics International, Inc. | ||||||||||
Term Loan, 7.75%, (1 mo. USD LIBOR + 6.50%), Maturing March 29, 2024 | 2,013 | $ | 1,522,275 | |||||||
| PGX Holdings, Inc. | ||||||||||
Term Loan, 6.25%, (1 mo. USD LIBOR + 5.25%, Floor 1.00%), Maturing September 29, 2020 | 1,449 | 700,826 | ||||||||
| Pike Corporation | ||||||||||
Term Loan, 4.25%, (1 mo. USD LIBOR + 3.25%, Floor 1.00%), Maturing July 24, 2026 | 503 | 469,343 | ||||||||
| Pre-Paid Legal Services, Inc. | ||||||||||
Term Loan, 4.24%, (1 mo. USD LIBOR + 3.25%), Maturing May 1, 2025 | 494 | 422,156 | ||||||||
| Prime Security Services Borrower, LLC | ||||||||||
Term Loan, 4.61%, (1 mo. USD LIBOR + 3.25%), Maturing September 23, 2026 | 1,720 | 1,564,752 | ||||||||
| Prometric Holdings, Inc. | ||||||||||
Term Loan, 4.00%, (1 mo. USD LIBOR + 3.00%, Floor 1.00%), Maturing January 29, 2025 | 319 | 246,863 | ||||||||
| Red Ventures, LLC | ||||||||||
Term Loan, 3.49%, (1 mo. USD LIBOR + 2.50%), Maturing November 8, 2024 | 1,538 | 1,297,342 | ||||||||
| Rockwood Service Corporation | ||||||||||
Term Loan, 5.70%, (3 mo. USD LIBOR + 4.25%), Maturing January 23, 2027 | 500 | 455,625 | ||||||||
| SMG US Midco 2, Inc. | ||||||||||
Term Loan, 3.43%, (1 mo. USD LIBOR + 2.50%), Maturing January 23, 2025 | 245 | 184,983 | ||||||||
| Speedster Bidco GmbH | ||||||||||
Term Loan, Maturing February 12, | EUR | 1,000 | 948,498 | |||||||
| Spin Holdco, Inc. | ||||||||||
Term Loan, 5.09%, (3 mo. USD LIBOR + 3.25%), Maturing November 14, 2022 | 3,858 | 3,452,668 | ||||||||
| Techem Verwaltungsgesellschaft 675 mbH | ||||||||||
Term Loan, 2.88%, (2 mo. EURIBOR + 2.88%), Maturing July 15, 2025 | EUR | 826 | 860,113 | |||||||
| Tempo Acquisition, LLC | ||||||||||
Term Loan, 3.74%, (1 mo. USD LIBOR + 2.75%), Maturing May 1, 2024 | 973 | 873,629 | ||||||||
| Vestcom Parent Holdings, Inc. | ||||||||||
Term Loan, 5.07%, (6 mo. USD LIBOR + 4.00%), Maturing December 19, 2023 | 603 | 485,059 | ||||||||
| WASH Multifamily Laundry Systems, LLC | ||||||||||
Term Loan, 4.25%, (1 mo. USD LIBOR + 3.25%, Floor 1.00%), Maturing May 14, 2022 | 304 | 258,362 | ||||||||
| West Corporation | ||||||||||
Term Loan, 4.95%, (3 mo. USD LIBOR + 3.50%), Maturing October 10, 2024 | 344 | 258,594 | ||||||||
| 9 | See Notes to Financial Statements. |
Eaton Vance
Limited Duration Income Fund
March 31, 2020
Portfolio of Investments — continued
| Borrower/Tranche Description | Principal Amount* (000’s omitted) | Value | ||||||||||
| Business Equipment and Services (continued) | ||||||||||||
| West Corporation (continued) | ||||||||||||
Term Loan, 5.45%, (3 mo. USD LIBOR + 4.00%), Maturing October 10, 2024 | 1,197 | $ | 922,027 | |||||||||
| Zephyr Bidco Limited | ||||||||||||
Term Loan, 4.74%, (1 mo. GBP LIBOR + 4.50%), Maturing July 23, 2025 | GBP | 775 | 813,420 | |||||||||
| $ | 61,252,409 | |||||||||||
| Cable and Satellite Television — 1.6% | ||||||||||||
| CSC Holdings, LLC | ||||||||||||
Term Loan, 2.86%, (1 mo. USD LIBOR + 2.25%), Maturing July 17, 2025 | 3,954 | $ | 3,835,058 | |||||||||
Term Loan, 2.86%, (1 mo. USD LIBOR + 2.25%), Maturing January 15, 2026 | 1,064 | 1,029,662 | ||||||||||
Term Loan, 3.11%, (1 mo. USD LIBOR + 2.50%), Maturing April 15, 2027 | 1,358 | 1,314,815 | ||||||||||
| Numericable Group S.A. | ||||||||||||
Term Loan, 3.00%, (3 mo. EURIBOR + 3.00%), Maturing July 31, 2025 | EUR | 511 | 523,682 | |||||||||
Term Loan, 3.74%, (1 mo. USD LIBOR + 2.75%), Maturing July 31, 2025 | 2,091 | 1,925,347 | ||||||||||
| Radiate Holdco, LLC | ||||||||||||
Term Loan, 3.99%, (1 mo. USD LIBOR + 3.00%), Maturing February 1, 2024 | 610 | 565,970 | ||||||||||
| Telenet International Finance S.a.r.l. | ||||||||||||
Term Loan, 2.25%, (3 mo. EURIBOR + 2.25%), Maturing April 30, 2029 | EUR | 3,750 | 3,925,634 | |||||||||
| UPC Broadband Holding B.V. | ||||||||||||
Term Loan, 2.95%, (1 mo. USD LIBOR + 2.25%), Maturing April 30, 2028 | 900 | 817,500 | ||||||||||
Term Loan, 2.50%, (6 mo. EURIBOR + 2.50%), Maturing April 30, 2029 | EUR | 1,500 | 1,561,292 | |||||||||
| Virgin Media SFA Finance Limited | ||||||||||||
Term Loan, 3.50%, (1 mo. GBP LIBOR + 3.25%), Maturing November 15, 2027 | GBP | 1,500 | 1,710,992 | |||||||||
Term Loan, 2.50%, (6 mo. EURIBOR + 2.50%), Maturing January 31, 2029 | EUR | 1,300 | 1,335,556 | |||||||||
| Ziggo B.V. | ||||||||||||
Term Loan, 3.00%, (6 mo. EURIBOR + 3.00%), Maturing January 31, 2029 | EUR | 3,750 | 3,838,239 | |||||||||
| $ | 22,383,747 | |||||||||||
| Chemicals and Plastics — 2.3% | ||||||||||||
| Alpha 3 B.V. | ||||||||||||
Term Loan, 4.45%, (3 mo. USD LIBOR + 3.00%), Maturing January 31, 2024 | 675 | $ | 626,067 | |||||||||
| Borrower/Tranche Description | Principal Amount* (000’s omitted) | Value | ||||||||
| Chemicals and Plastics (continued) | ||||||||||
| Aruba Investments, Inc. | ||||||||||
Term Loan, 4.32%, (6 mo. USD LIBOR + 3.25%), Maturing February 2, 2022 | 359 | $ | 335,632 | |||||||
| Caldic B.V. | ||||||||||
Term Loan, 3.25%, (1 mo. EURIBOR + 3.25%), Maturing July 18, 2024 | EUR | 1,000 | 908,053 | |||||||
| Emerald Performance Materials, LLC | ||||||||||
Term Loan, 4.50%, (1 mo. USD LIBOR + 3.50%, Floor 1.00%), Maturing August 1, 2021 | 2,621 | 2,288,935 | ||||||||
| Ferro Corporation | ||||||||||
Term Loan, 3.70%, (3 mo. USD LIBOR + 2.25%), Maturing February 14, 2024 | 339 | 295,484 | ||||||||
Term Loan, 3.70%, (3 mo. USD LIBOR + 2.25%), Maturing February 14, 2024 | 347 | 301,907 | ||||||||
Term Loan, 3.70%, (3 mo. USD LIBOR + 2.25%), Maturing February 14, 2024 | 485 | 422,441 | ||||||||
| Flint Group GmbH | ||||||||||
Term Loan, 4.80%, (3 mo. USD LIBOR + 3.00%), Maturing September 7, 2021 | 188 | 133,723 | ||||||||
| Flint Group US, LLC | ||||||||||
Term Loan, 4.80%, (3 mo. USD LIBOR + 3.00%), Maturing September 7, 2021 | 1,135 | 808,914 | ||||||||
| Gemini HDPE, LLC | ||||||||||
Term Loan, 4.28%, (3 mo. USD LIBOR + 2.50%), Maturing August 7, 2024 | 1,863 | 1,564,877 | ||||||||
| Hexion, Inc. | ||||||||||
Term Loan, 4.00%, (3 mo. EURIBOR + 4.00%), Maturing July 1, 2026 | EUR | 1,575 | 1,380,968 | |||||||
Term Loan, 5.41%, (3 mo. USD LIBOR + 3.50%), Maturing July 1, 2026 | 769 | 657,655 | ||||||||
| INEOS Enterprises Holdings II Limited | ||||||||||
Term Loan, 3.25%, (3 mo. EURIBOR + 3.25%), Maturing August 28, 2026 | EUR | 200 | 203,761 | |||||||
| INEOS Enterprises Holdings US Finco, LLC | ||||||||||
Term Loan, 5.11%, (3 mo. USD LIBOR + 3.50%), Maturing August 28, 2026 | 225 | 207,995 | ||||||||
| INEOS Finance PLC | ||||||||||
Term Loan, 2.50%, (1 mo. EURIBOR + 2.00%, Floor 0.50%), Maturing April 1, 2024 | EUR | 1,231 | 1,255,693 | |||||||
| INEOS Styrolution Group GmbH | ||||||||||
Term Loan, 2.50%, (3 mo. EURIBOR + 2.00%, Floor 0.50%), Maturing January 22, 2027 | EUR | 1,000 | 1,006,396 | |||||||
| Inovyn Finance PLC | ||||||||||
Term Loan, 2.50%, (3 mo. EURIBOR + 2.00%, Floor 0.50%), Maturing February 25, 2027 | EUR | 1,000 | 1,010,072 | |||||||
| Messer Industries GmbH | ||||||||||
Term Loan, 3.95%, (3 mo. USD LIBOR + 2.50%), Maturing March 1, 2026 | 1,609 | 1,445,864 | ||||||||
| 10 | See Notes to Financial Statements. |
Eaton Vance
Limited Duration Income Fund
March 31, 2020
Portfolio of Investments — continued
| Borrower/Tranche Description | Principal Amount* (000’s omitted) | Value | ||||||||||
| Chemicals and Plastics (continued) | ||||||||||||
| Minerals Technologies, Inc. | ||||||||||||
Term Loan, 3.22%, (USD LIBOR + 2.25%), Maturing February 14, 2024(4) | 1,107 | $ | 1,024,171 | |||||||||
| Momentive Performance Materials, Inc. | ||||||||||||
Term Loan, 4.24%, (1 mo. USD LIBOR + 3.25%), Maturing May 15, 2024 | 471 | 388,936 | ||||||||||
| Orion Engineered Carbons GmbH | ||||||||||||
Term Loan, 2.25%, (3 mo. EURIBOR + 2.25%), Maturing July 25, 2024 | EUR | 964 | 957,245 | |||||||||
Term Loan, 3.45%, (3 mo. USD LIBOR + 2.00%), Maturing July 25, 2024 | 706 | 598,252 | ||||||||||
| PMHC II, Inc. | ||||||||||||
Term Loan, 4.50%, (12 mo. USD LIBOR + 3.50%, Floor 1.00%), Maturing March 31, 2025 | 2,684 | 1,630,604 | ||||||||||
| PQ Corporation | ||||||||||||
Term Loan, 4.03%, (3 mo. USD LIBOR + 2.25%), Maturing February 7, 2027 | 1,741 | 1,571,147 | ||||||||||
| Pregis TopCo Corporation | ||||||||||||
Term Loan, 4.99%, (1 mo. USD LIBOR + 4.00%), Maturing July 31, 2026 | 648 | 570,570 | ||||||||||
| Rohm Holding GmbH | ||||||||||||
Term Loan, 5.00%, (6 mo. EURIBOR + 5.00%), Maturing July 31, 2026 | EUR | 500 | 400,146 | |||||||||
Term Loan, 6.78%, (6 mo. USD LIBOR + 5.00%), Maturing July 31, 2026 | 349 | 240,895 | ||||||||||
| Spectrum Holdings III Corp. | ||||||||||||
Term Loan, 4.70%, (3 mo. USD LIBOR + 3.25%), Maturing January 31, 2025 | 207 | 162,575 | ||||||||||
| Starfruit Finco B.V. | ||||||||||||
Term Loan, 3.86%, (1 mo. USD LIBOR + 3.00%), Maturing October 1, 2025 | 2,942 | 2,692,109 | ||||||||||
| Tata Chemicals North America, Inc. | ||||||||||||
Term Loan, 4.38%, (1 mo. USD LIBOR + 2.75%), Maturing August 7, 2020 | 1,019 | 952,965 | ||||||||||
| Tronox Finance, LLC | ||||||||||||
Term Loan, 3.93%, (USD LIBOR + 2.75%), Maturing September 23, 2024(4) | 3,183 | 2,862,174 | ||||||||||
| Univar, Inc. | ||||||||||||
Term Loan, 3.70%, (3 mo. USD LIBOR + 2.25%), Maturing July 1, 2024 | 2,089 | 1,958,354 | ||||||||||
| Venator Materials Corporation | ||||||||||||
Term Loan, 3.99%, (1 mo. USD LIBOR + 3.00%), Maturing August 8, 2024 | 414 | 362,578 | ||||||||||
| $ | 31,227,158 | |||||||||||
| Borrower/Tranche Description | Principal Amount* (000’s omitted) | Value | ||||||||||
| Conglomerates — 0.1% | ||||||||||||
| Penn Engineering & Manufacturing Corp. | ||||||||||||
Term Loan, Maturing June 27, 2024(5) | EUR | 1,455 | $ | 1,399,900 | ||||||||
| $ | 1,399,900 | |||||||||||
| Containers and Glass Products — 1.1% | ||||||||||||
| Berry Global, Inc. | ||||||||||||
Term Loan, 2.86%, (1 mo. USD LIBOR + 2.00%), Maturing October 1, 2022 | 961 | $ | 927,593 | |||||||||
Term Loan, 2.86%, (1 mo. USD LIBOR + 2.00%), Maturing July 1, 2026 | 993 | 939,897 | ||||||||||
| BWAY Holding Company | ||||||||||||
Term Loan, 5.08%, (3 mo. USD LIBOR + 3.25%), Maturing April 3, 2024 | 2,564 | 2,127,984 | ||||||||||
| Consolidated Container Company, LLC | ||||||||||||
Term Loan, 3.75%, (1 mo. USD LIBOR + 2.75%, Floor 1.00%), Maturing May 22, 2024 | 439 | 412,449 | ||||||||||
| Flex Acquisition Company, Inc. | ||||||||||||
Term Loan, 4.90%, (USD LIBOR + 3.00%), Maturing December 29, 2023(4) | 1,530 | 1,364,223 | ||||||||||
Term Loan, 5.16%, (3 mo. USD LIBOR + 3.25%), Maturing June 29, 2025 | 1,517 | 1,352,394 | ||||||||||
| Libbey Glass, Inc. | ||||||||||||
Term Loan, 4.01%, (1 mo. USD LIBOR + 3.00%), Maturing April 9, 2021 | 6,732 | 3,209,115 | ||||||||||
| Pelican Products, Inc. | ||||||||||||
Term Loan, 4.50%, (6 mo. USD LIBOR + 3.50%, Floor 1.00%), Maturing May 1, 2025 | 639 | 522,076 | ||||||||||
| Reynolds Consumer Products, Inc. | ||||||||||||
Term Loan, 3.50%, (3 mo. USD LIBOR + 1.75%), Maturing February 4, 2027 | 2,500 | 2,373,437 | ||||||||||
| Ring Container Technologies Group, LLC | ||||||||||||
Term Loan, 3.74%, (1 mo. USD LIBOR + 2.75%), Maturing October 31, 2024 | 899 | 786,341 | ||||||||||
| Trident TPI Holdings, Inc. | ||||||||||||
Term Loan, 4.32%, (3 mo. USD LIBOR + 3.25%), Maturing October 17, 2024 | 832 | 698,964 | ||||||||||
| $ | 14,714,473 | |||||||||||
| Cosmetics / Toiletries — 0.1% | ||||||||||||
| Kronos Acquisition Holdings, Inc. | ||||||||||||
Term Loan, 5.00%, (1 mo. USD LIBOR + 4.00%, Floor 1.00%), Maturing May 15, 2023 | 2,115 | $ | 1,911,797 | |||||||||
| $ | 1,911,797 | |||||||||||
| 11 | See Notes to Financial Statements. |
Eaton Vance
Limited Duration Income Fund
March 31, 2020
Portfolio of Investments — continued
| Borrower/Tranche Description | Principal Amount* (000’s omitted) | Value | ||||||||||
| Drugs — 2.3% | ||||||||||||
| Aenova Holding GmbH | ||||||||||||
Term Loan, 5.00%, (6 mo. EURIBOR + 5.00%), Maturing February 14, 2025 | EUR | 500 | $ | 468,732 | ||||||||
| Akorn, Inc. | ||||||||||||
Term Loan, 16.13%, (1 mo. USD LIBOR + 13.75%), 15.38% Cash, 0.75% PIK, Maturing April 16, 2021 | 1,148 | 884,191 | ||||||||||
| Alkermes, Inc. | ||||||||||||
Term Loan, 2.87%, (1 mo. USD LIBOR + 2.25%), Maturing March 27, 2023 | 1,115 | 992,623 | ||||||||||
| Amneal Pharmaceuticals, LLC | ||||||||||||
Term Loan, 4.50%, (1 mo. USD LIBOR + 3.50%), Maturing May 4, 2025 | 3,684 | 3,232,279 | ||||||||||
| Arbor Pharmaceuticals, Inc. | ||||||||||||
Term Loan, 6.00%, (1 mo. USD LIBOR + 5.00%, Floor 1.00%), Maturing July 5, 2023 | 1,811 | 1,358,083 | ||||||||||
| Bausch Health Companies, Inc. | ||||||||||||
Term Loan, 3.61%, (1 mo. USD LIBOR + 3.00%), Maturing June 2, 2025 | 5,366 | 5,142,773 | ||||||||||
| Catalent Pharma Solutions, Inc. | ||||||||||||
Term Loan, 3.25%, (1 mo. USD LIBOR + 2.25%, Floor 1.00%), Maturing May 18, 2026 | 842 | 820,462 | ||||||||||
| Elanco Animal Health Incorporated | ||||||||||||
Term Loan, Maturing February 4, 2027(5) | 1,850 | 1,774,844 | ||||||||||
| Endo Luxembourg Finance Company I S.a.r.l. | ||||||||||||
Term Loan, 5.25%, (1 mo. USD LIBOR + 4.25%), Maturing April 29, 2024 | 5,276 | 4,735,042 | ||||||||||
| Horizon Therapeutics USA, Inc. | ||||||||||||
Term Loan, 3.31%, (1 mo. USD LIBOR + 2.25%), Maturing May 22, 2026 | 654 | 619,594 | ||||||||||
| Jaguar Holding Company II | ||||||||||||
Term Loan, 3.50%, (1 mo. USD LIBOR + 2.50%, Floor 1.00%), Maturing August 18, 2022 | 6,297 | 6,071,125 | ||||||||||
| Mallinckrodt International Finance S.A. | ||||||||||||
Term Loan, 4.20%, (3 mo. USD LIBOR + 2.75%), Maturing September 24, 2024 | 3,676 | 2,527,563 | ||||||||||
Term Loan, 4.70%, (3 mo. USD LIBOR + 3.00%), Maturing February 24, 2025 | 2,108 | 1,454,275 | ||||||||||
| Nidda Healthcare Holding AG | ||||||||||||
Term Loan, Maturing August 21, 2026(5) | EUR | 625 | 610,903 | |||||||||
Term Loan, Maturing August 21, 2026(5) | EUR | 1,000 | 988,014 | |||||||||
| $ | 31,680,503 | |||||||||||
| Ecological Services and Equipment — 0.5% | ||||||||||||
| Advanced Disposal Services, Inc. | ||||||||||||
Term Loan, 2.89%, (1 week USD LIBOR + 2.25%), Maturing November 10, 2023 | 2,315 | $ | 2,303,179 | |||||||||
| Borrower/Tranche Description | Principal Amount* (000’s omitted) | Value | ||||||||||
| Ecological Services and Equipment (continued) | ||||||||||||
| EnergySolutions, LLC | ||||||||||||
Term Loan, 5.20%, (3 mo. USD LIBOR + 3.75%), Maturing May 9, 2025 | 5,257 | $ | 4,468,447 | |||||||||
| Patriot Container Corp. | ||||||||||||
Term Loan, 4.50%, (1 mo. USD LIBOR + 3.50%), Maturing March 20, 2025 | 147 | 131,565 | ||||||||||
| US Ecology Holdings, Inc. | ||||||||||||
Term Loan, 3.49%, (1 mo. USD LIBOR + 2.50%), Maturing November 1, 2026 | 274 | 264,712 | ||||||||||
| $ | 7,167,903 | |||||||||||
| Electronics / Electrical — 7.8% | ||||||||||||
| Almonde, Inc. | ||||||||||||
Term Loan, 5.28%, (3 mo. USD LIBOR + 3.50%), Maturing June 13, 2024 | 2,778 | $ | 2,416,981 | |||||||||
| Applied Systems, Inc. | ||||||||||||
Term Loan, 4.70%, (3 mo. USD LIBOR + 3.25%), Maturing September 19, 2024 | 3,079 | 2,834,434 | ||||||||||
Term Loan - Second Lien, 8.45%, (3 mo. USD LIBOR + 7.00%), Maturing September 19, 2025 | 475 | 439,375 | ||||||||||
| Aptean, Inc. | ||||||||||||
Term Loan, 5.24%, (1 mo. USD LIBOR + 4.25%), Maturing April 23, 2026 | 744 | 610,077 | ||||||||||
Term Loan - Second Lien, 9.49%, (1 mo. USD LIBOR + 8.50%), Maturing April 23, 2027 | 1,450 | 1,332,187 | ||||||||||
| Astra Acquisition Corp. | ||||||||||||
Term Loan, 6.50%, (1 mo. USD LIBOR + 5.50%, Floor 1.00%), Maturing March 1, 2027 | 775 | 658,750 | ||||||||||
| Avast Software B.V. | ||||||||||||
Term Loan, Maturing September 29, 2023(5) | EUR | 2,119 | 2,237,571 | |||||||||
| Banff Merger Sub, Inc. | ||||||||||||
Term Loan, 4.75%, (3 mo. EURIBOR + 4.75%), Maturing October 2, 2025 | EUR | 296 | 285,484 | |||||||||
Term Loan, 5.24%, (1 mo. USD LIBOR + 4.25%), Maturing October 2, 2025 | 2,987 | 2,560,020 | ||||||||||
| Blackhawk Network Holdings, Inc. | ||||||||||||
Term Loan, 3.99%, (1 mo. USD LIBOR + 3.00%), Maturing June 15, 2025 | 835 | 690,370 | ||||||||||
| Buzz Merger Sub Ltd. | ||||||||||||
Term Loan, 3.74%, (1 mo. USD LIBOR + 2.75%), Maturing January 29, 2027 | 575 | 531,875 | ||||||||||
| Castle US Holding Corporation | ||||||||||||
Term Loan, 5.20%, (3 mo. USD LIBOR + 3.75%), Maturing January 29, 2027 | 1,060 | 923,525 | ||||||||||
| Celestica, Inc. | ||||||||||||
Term Loan, 3.46%, (1 mo. USD LIBOR + 2.50%), Maturing June 27, 2025 | 281 | 250,312 | ||||||||||
| 12 | See Notes to Financial Statements. |
Eaton Vance
Limited Duration Income Fund
March 31, 2020
Portfolio of Investments — continued
| Borrower/Tranche Description | Principal Amount* (000’s omitted) | Value | ||||||||
| Electronics / Electrical (continued) | ||||||||||
| Cohu, Inc. | ||||||||||
Term Loan, 3.99%, (1 mo. USD LIBOR + 3.00%), Maturing October 1, 2025 | 813 | $ | 609,469 | |||||||
| CommScope, Inc. | ||||||||||
Term Loan, 4.24%, (1 mo. USD LIBOR + 3.25%), Maturing April 6, 2026 | 1,816 | 1,725,081 | ||||||||
| CPI International, Inc. | ||||||||||
Term Loan, 4.50%, (1 mo. USD LIBOR + 3.50%, Floor 1.00%), Maturing July 26, 2024 | 707 | 593,775 | ||||||||
| Datto, Inc. | ||||||||||
Term Loan, 5.24%, (1 mo. USD LIBOR + 4.25%), Maturing April 2, 2026 | 372 | 322,640 | ||||||||
| ECI Macola/Max Holdings, LLC | ||||||||||
Term Loan, 5.70%, (3 mo. USD LIBOR + 4.25%), Maturing September 27, 2024 | 832 | 747,224 | ||||||||
| Electro Rent Corporation | ||||||||||
Term Loan, 6.80%, (3 mo. USD LIBOR + 5.00%), Maturing January 31, 2024 | 1,851 | 1,559,440 | ||||||||
| Epicor Software Corporation | ||||||||||
Term Loan, 4.25%, (1 mo. USD LIBOR + 3.25%, Floor 1.00%), Maturing June 1, 2022 | 220 | 203,838 | ||||||||
| EXC Holdings III Corp. | ||||||||||
Term Loan, 4.95%, (3 mo. USD LIBOR + 3.50%), Maturing December 2, 2024 | 513 | 454,171 | ||||||||
| Fiserv Investment Solutions, Inc. | ||||||||||
Term Loan, 6.44%, (3 mo. USD LIBOR + 4.75%), Maturing February 18, 2027 | 525 | 475,125 | ||||||||
| Flexera Software, LLC | �� | |||||||||
Term Loan, 4.50%, (1 mo. USD LIBOR + 3.50%, Floor 1.00%), Maturing February 26, 2025 | 270 | 245,975 | ||||||||
| GlobalLogic Holdings, Inc. | ||||||||||
Term Loan, 3.74%, (1 mo. USD LIBOR + 2.75%), Maturing August 1, 2025 | 454 | 431,029 | ||||||||
| Hyland Software, Inc. | ||||||||||
Term Loan, 4.24%, (1 mo. USD LIBOR + 3.25%), Maturing July 1, 2024 | 5,570 | 5,203,234 | ||||||||
| Infoblox, Inc. | ||||||||||
Term Loan, 5.49%, (1 mo. USD LIBOR + 4.50%), Maturing November 7, 2023 | 999 | 889,310 | ||||||||
| Infor (US), Inc. | ||||||||||
Term Loan, 3.25%, (1 mo. EURIBOR + 2.25%, Floor 1.00%), Maturing February 1, 2022 | EUR | 3,980 | 4,197,122 | |||||||
| Informatica, LLC | ||||||||||
Term Loan, 3.50%, (3 mo. EURIBOR + 3.50%), Maturing February 25, 2027 | EUR | 3,500 | 3,373,769 | |||||||
Term Loan, 4.24%, (1 mo. USD LIBOR + 3.25%), Maturing February 25, 2027 | 5,750 | 5,088,750 | ||||||||
| Borrower/Tranche Description | Principal Amount* (000’s omitted) | Value | ||||||||
| Electronics / Electrical (continued) | ||||||||||
| Informatica, LLC (continued) | ||||||||||
Term Loan - Second Lien, 7.125%, Maturing February 25, 2025(6) | 500 | $ | 450,000 | |||||||
| MA FinanceCo., LLC | ||||||||||
Term Loan, 3.24%, (1 mo. USD LIBOR + 2.25%), Maturing November 19, 2021 | 4,336 | 4,097,400 | ||||||||
Term Loan, 3.49%, (1 mo. USD LIBOR + 2.50%), Maturing June 21, 2024 | 533 | 486,248 | ||||||||
| MACOM Technology Solutions Holdings, Inc. | ||||||||||
Term Loan, 3.24%, (1 mo. USD LIBOR + 2.25%), Maturing May 17, 2024 | 1,462 | 1,330,450 | ||||||||
| Marcel LUX IV S.a.r.l. | ||||||||||
Term Loan, 3.50%, (3 mo. EURIBOR + 3.50%), Maturing March 16, 2026 | EUR | 1,500 | 1,458,585 | |||||||
| Microchip Technology Incorporated | ||||||||||
Term Loan, 2.99%, (1 mo. USD LIBOR + 2.00%), Maturing May 29, 2025 | 1,567 | 1,485,639 | ||||||||
| Mirion Technologies, Inc. | ||||||||||
Term Loan, 5.07%, (6 mo. USD LIBOR + 4.00%), Maturing March 6, 2026 | 446 | 394,543 | ||||||||
| MKS Instruments, Inc. | ||||||||||
Term Loan, 2.74%, (1 mo. USD LIBOR + 1.75%), Maturing February 2, 2026 | 332 | 304,185 | ||||||||
| MTS Systems Corporation | ||||||||||
Term Loan, 4.24%, (1 mo. USD LIBOR + 3.25%), Maturing July 5, 2023 | 596 | 557,405 | ||||||||
| NCR Corporation | ||||||||||
Term Loan, 3.49%, (1 mo. USD LIBOR + 2.50%), Maturing August 28, 2026 | 945 | 864,904 | ||||||||
| Recorded Books, Inc. | ||||||||||
Term Loan, Maturing August 29, 2025(5) | 250 | 218,750 | ||||||||
| Refinitiv US Holdings, Inc. | ||||||||||
Term Loan, 4.24%, (1 mo. USD LIBOR + 3.25%), Maturing October 1, 2025 | 1,210 | 1,169,365 | ||||||||
| Renaissance Holding Corp. | ||||||||||
Term Loan, 4.24%, (1 mo. USD LIBOR + 3.25%), Maturing May 30, 2025 | 1,277 | 1,136,752 | ||||||||
Term Loan - Second Lien, 7.99%, (1 mo. USD LIBOR + 7.00%), Maturing May 29, 2026 | 200 | 158,000 | ||||||||
| Seattle Spinco, Inc. | ||||||||||
Term Loan, 3.49%, (1 mo. USD LIBOR + 2.50%), Maturing June 21, 2024 | 3,602 | 3,283,753 | ||||||||
| SGS Cayman L.P. | ||||||||||
Term Loan, 6.83%, (3 mo. USD LIBOR + 5.38%), Maturing April 23, 2021 | 250 | 186,111 | ||||||||
| SkillSoft Corporation | ||||||||||
Term Loan, 6.53%, (3 mo. USD LIBOR + 4.75%), Maturing April 28, 2021 | 8,158 | 5,370,378 | ||||||||
| 13 | See Notes to Financial Statements. |
Eaton Vance
Limited Duration Income Fund
March 31, 2020
Portfolio of Investments — continued
| Borrower/Tranche Description | Principal Amount* (000’s omitted) | Value | ||||||||
| Electronics / Electrical (continued) | ||||||||||
| SolarWinds Holdings, Inc. | ||||||||||
Term Loan, 3.74%, (1 mo. USD LIBOR + 2.75%), Maturing February 5, 2024 | 1,173 | $ | 1,094,409 | |||||||
| Solera, LLC | ||||||||||
Term Loan, 4.36%, (3 mo. USD LIBOR + 2.75%), Maturing March 3, 2023 | 855 | 801,527 | ||||||||
| Sparta Systems, Inc. | ||||||||||
Term Loan, 4.56%, (6 mo. USD LIBOR + 3.50%), Maturing August 21, 2024 | 4,465 | 3,906,834 | ||||||||
| SS&C Technologies Holdings Europe S.a.r.l. | ||||||||||
Term Loan, 2.74%, (1 mo. USD LIBOR + 1.75%), Maturing April 16, 2025 | 1,177 | 1,121,419 | ||||||||
| SS&C Technologies, Inc. | ||||||||||
Term Loan, 2.74%, (1 mo. USD LIBOR + 1.75%), Maturing April 16, 2025 | 1,650 | 1,571,564 | ||||||||
| STG-Fairway Holdings, LLC | ||||||||||
Term Loan, 4.57%, (6 mo. USD LIBOR + 3.50%), Maturing January 31, 2027 | 425 | 388,875 | ||||||||
| SurveyMonkey, Inc. | ||||||||||
Term Loan, 4.37%, (1 week USD LIBOR + 3.75%), Maturing October 10, 2025 | 722 | 595,925 | ||||||||
| Sutherland Global Services, Inc. | ||||||||||
Term Loan, 6.83%, (3 mo. USD LIBOR + 5.38%), Maturing April 23, 2021 | 1,073 | 799,524 | ||||||||
| Switch, Ltd. | ||||||||||
Term Loan, 3.24%, (1 mo. USD LIBOR + 2.25%), Maturing June 27, 2024 | 267 | 247,380 | ||||||||
| Tibco Software, Inc. | ||||||||||
Term Loan, 4.74%, (1 mo. USD LIBOR + 3.75%), Maturing June 30, 2026 | 5,131 | 4,874,331 | ||||||||
Term Loan - Second Lien, 8.24%, (1 mo. USD LIBOR + 7.25%), Maturing March 3, 2028 | 475 | 453,625 | ||||||||
| TriTech Software Systems | ||||||||||
Term Loan, 5.20%, (3 mo. USD LIBOR + 3.75%), Maturing August 29, 2025 | 889 | 693,225 | ||||||||
| TTM Technologies, Inc. | ||||||||||
Term Loan, 4.08%, (1 mo. USD LIBOR + 2.50%), Maturing September 28, 2024 | 297 | 279,604 | ||||||||
| Uber Technologies, Inc. | ||||||||||
Term Loan, 4.49%, (1 mo. USD LIBOR + 3.50%), Maturing July 13, 2023 | 3,522 | 3,313,849 | ||||||||
Term Loan, 5.00%, (1 mo. USD LIBOR + 4.00%, Floor 1.00%), Maturing April 4, 2025 | 7,772 | 7,336,484 | ||||||||
| Ultimate Software Group, Inc. (The) | ||||||||||
Term Loan, 4.74%, (1 mo. USD LIBOR + 3.75%), Maturing May 4, 2026 | 1,716 | 1,621,974 | ||||||||
| Borrower/Tranche Description | Principal Amount* (000’s omitted) | Value | ||||||||||
| Electronics / Electrical (continued) | ||||||||||||
| Ultra Clean Holdings, Inc. | ||||||||||||
Term Loan, 5.49%, (1 mo. USD LIBOR + 4.50%), Maturing August 27, 2025 | 808 | $ | 687,096 | |||||||||
| Verifone Systems, Inc. | ||||||||||||
Term Loan, 5.69%, (3 mo. USD LIBOR + 4.00%), Maturing August 20, 2025 | 1,260 | 836,083 | ||||||||||
| Veritas Bermuda, Ltd. | ||||||||||||
Term Loan, 5.95%, (3 mo. USD LIBOR + 4.50%), Maturing January 27, 2023 | 2,658 | 2,272,832 | ||||||||||
| Vero Parent, Inc. | ||||||||||||
Term Loan, 7.86%, (3 mo. USD LIBOR + 6.25%), Maturing August 16, 2024 | 2,584 | 2,080,239 | ||||||||||
| Vertiv Group Corporation | ||||||||||||
Term Loan, 4.58%, (1 mo. USD LIBOR + 3.00%), Maturing March 2, 2027 | 100 | 91,000 | ||||||||||
| VS Buyer, LLC | ||||||||||||
Term Loan, 4.86%, (3 mo. USD LIBOR + 3.25%), Maturing February 28, 2027 | 1,100 | 1,061,500 | ||||||||||
| Vungle, Inc. | ||||||||||||
Term Loan, 6.49%, (1 mo. USD LIBOR + 5.50%), Maturing September 30, 2026 | 4,527 | 4,051,889 | ||||||||||
| Western Digital Corporation | ||||||||||||
Term Loan, 3.35%, (1 mo. USD LIBOR + 1.75%), Maturing April 29, 2023 | 1,535 | 1,485,431 | ||||||||||
| $ | 106,510,000 | |||||||||||
| Equipment Leasing — 0.2% | ||||||||||||
| Delos Finance S.a.r.l. | ||||||||||||
Term Loan, 3.20%, (3 mo. USD LIBOR + 1.75%), Maturing October 6, 2023 | 2,293 | $ | 2,047,489 | |||||||||
| IBC Capital Limited | ||||||||||||
Term Loan, 4.64%, (3 mo. USD LIBOR + 3.75%), Maturing September 11, 2023 | 363 | 307,758 | ||||||||||
| $ | 2,355,247 | |||||||||||
| Financial Intermediaries — 1.7% | ||||||||||||
| Apollo Commercial Real Estate Finance, Inc. | ||||||||||||
Term Loan, 3.45%, (1 mo. USD LIBOR + 2.75%), Maturing May 15, 2026 | 447 | $ | 355,067 | |||||||||
| Aretec Group, Inc. | ||||||||||||
Term Loan, 5.24%, (1 mo. USD LIBOR + 4.25%), Maturing October 1, 2025 | 2,378 | 1,640,748 | ||||||||||
| Citco Funding, LLC | ||||||||||||
Term Loan, 3.57%, (6 mo. USD LIBOR + 2.50%), Maturing September 28, 2023 | 3,955 | 3,841,306 | ||||||||||
| 14 | See Notes to Financial Statements. |
Eaton Vance
Limited Duration Income Fund
March 31, 2020
Portfolio of Investments — continued
| Borrower/Tranche Description | Principal Amount* (000’s omitted) | Value | ||||||||||
| Financial Intermediaries (continued) | ||||||||||||
| Claros Mortgage Trust, Inc. | ||||||||||||
Term Loan, 4.26%, (1 mo. USD LIBOR + 3.25%), Maturing August 9, 2026 | 796 | $ | 640,780 | |||||||||
| Ditech Holding Corporation | ||||||||||||
Term Loan, 0.00%, Maturing June 30, 2022(7) | 4,058 | 1,596,093 | ||||||||||
| EIG Management Company, LLC | ||||||||||||
Term Loan, 4.74%, (1 mo. USD LIBOR + 3.75%), Maturing February 22, 2025 | 270 | 238,507 | ||||||||||
| Evergood 4 ApS | ||||||||||||
Term Loan, 3.75%, (3 mo. EURIBOR + 3.75%), Maturing February 6, 2025 | EUR | 750 | 750,661 | |||||||||
| FinCo. I, LLC | ||||||||||||
Term Loan, 2.99%, (1 mo. USD LIBOR + 2.00%), Maturing December 27, 2022 | 955 | 878,877 | ||||||||||
| Focus Financial Partners, LLC | ||||||||||||
Term Loan, 2.99%, (1 mo. USD LIBOR + 2.00%), Maturing July 3, 2024 | 3,007 | 2,766,710 | ||||||||||
| Franklin Square Holdings L.P. | ||||||||||||
Term Loan, 3.25%, (1 mo. USD LIBOR + 2.25%), Maturing August 1, 2025 | 542 | 501,118 | ||||||||||
| Greenhill & Co., Inc. | ||||||||||||
Term Loan, 3.86%, (1 mo. USD LIBOR + 3.25%), Maturing April 12, 2024 | 1,143 | 1,011,850 | ||||||||||
| GreenSky Holdings, LLC | ||||||||||||
Term Loan, 4.25%, (1 mo. USD LIBOR + 3.25%), Maturing March 31, 2025 | 1,519 | 1,253,175 | ||||||||||
| Guggenheim Partners, LLC | ||||||||||||
Term Loan, 3.74%, (1 mo. USD LIBOR + 2.75%), Maturing July 21, 2023 | 2,707 | 2,436,393 | ||||||||||
| Harbourvest Partners, LLC | ||||||||||||
Term Loan, 3.93%, (2 mo. USD LIBOR + 2.25%), Maturing March 3, 2025 | 1,053 | 900,250 | ||||||||||
| Nets Holding A/S | ||||||||||||
Term Loan, 3.25%, (3 mo. EURIBOR + 3.25%), Maturing February 6, 2025 | EUR | 1,000 | 996,056 | |||||||||
| Starwood Property Trust, Inc. | ||||||||||||
Term Loan, 3.49%, (1 mo. USD LIBOR + 2.50%), Maturing July 27, 2026 | 522 | 467,526 | ||||||||||
| StepStone Group L.P. | ||||||||||||
Term Loan, 5.00%, (1 mo. USD LIBOR + 4.00%, Floor 1.00%), Maturing March 27, 2025 | 637 | 601,965 | ||||||||||
| Victory Capital Holdings, Inc. | ||||||||||||
Term Loan, 4.02%, (1 mo. USD LIBOR + 2.50%), Maturing July 1, 2026 | 1,205 | 1,072,288 | ||||||||||
| Virtus Investment Partners, Inc. | ||||||||||||
Term Loan, 3.27%, (1 mo. USD LIBOR + 2.25%), Maturing June 1, 2024 | 569 | 513,030 | ||||||||||
| $ | 22,462,400 | |||||||||||
| Borrower/Tranche Description | Principal Amount* (000’s omitted) | Value | ||||||||
| Food Products — 2.0% | ||||||||||
| Alphabet Holding Company, Inc. | ||||||||||
Term Loan, 4.49%, (1 mo. USD LIBOR + 3.50%), Maturing September 26, 2024 | 3,840 | $ | 3,114,213 | |||||||
| Atkins Nutritionals Holdings II, Inc. | ||||||||||
Term Loan, 4.75%, (1 mo. USD LIBOR + 3.75%, Floor 1.00%), Maturing July 7, 2024 | 388 | 362,589 | ||||||||
| B&G Foods, Inc. | ||||||||||
Term Loan, 3.49%, (1 mo. USD LIBOR + 2.50%), Maturing October 10, 2026 | 274 | 260,856 | ||||||||
| Badger Buyer Corp. | ||||||||||
Term Loan, 4.50%, (1 mo. USD LIBOR + 3.50%, Floor 1.00%), Maturing September 30, 2024 | 390 | 292,500 | ||||||||
| CHG PPC Parent, LLC | ||||||||||
Term Loan, 3.50%, (1 mo. EURIBOR + 3.50%), Maturing March 31, 2025 | EUR | 2,000 | 1,974,190 | |||||||
| Del Monte Foods, Inc. | ||||||||||
Term Loan, 4.86%, (3 mo. USD LIBOR + 3.25%), Maturing February 18, 2021 | 3,719 | 3,040,454 | ||||||||
| Dole Food Company, Inc. | ||||||||||
Term Loan, 3.75%, (1 mo. USD LIBOR + 2.75%, Floor 1.00%), Maturing April 6, 2024 | 1,863 | 1,690,219 | ||||||||
| Froneri International PLC | ||||||||||
Term Loan, 2.63%, (6 mo. EURIBOR + 2.63%), Maturing January 29, 2027 | EUR | 1,275 | 1,322,411 | |||||||
Term Loan, 3.24%, (1 mo. USD LIBOR + 2.25%), Maturing January 29, 2027 | 2,200 | 2,112,000 | ||||||||
| Hearthside Food Solutions, LLC | ||||||||||
Term Loan, 4.68%, (1 mo. USD LIBOR + 3.69%), Maturing May 23, 2025 | 761 | 651,029 | ||||||||
Term Loan, 4.99%, (1 mo. USD LIBOR + 4.00%), Maturing May 23, 2025 | 469 | 405,739 | ||||||||
| HLF Financing S.a.r.l. | ||||||||||
Term Loan, 3.74%, (1 mo. USD LIBOR + 2.75%), Maturing August 18, 2025 | 1,084 | 978,761 | ||||||||
| Jacobs Douwe Egberts International B.V. | ||||||||||
Term Loan, 2.25%, (2 mo. EURIBOR + 1.75%, Floor 0.50%), Maturing November 1, 2025 | EUR | 2,221 | 2,364,215 | |||||||
| JBS USA Lux S.A. | ||||||||||
Term Loan, 3.07%, (6 mo. USD LIBOR + 2.00%), Maturing May 1, 2026 | 4,727 | 4,463,876 | ||||||||
| Nomad Foods Europe Midco Limited | ||||||||||
Term Loan, 2.75%, (1 mo. EURIBOR + 2.75%), Maturing May 15, 2024 | EUR | 3,000 | 3,115,692 | |||||||
| Sunshine Investments B.V. | ||||||||||
Term Loan, 4.76%, (3 mo. GBP LIBOR + 4.00%), Maturing March 28, 2025 | GBP | 750 | 875,681 | |||||||
| 15 | See Notes to Financial Statements. |
Eaton Vance
Limited Duration Income Fund
March 31, 2020
Portfolio of Investments — continued
| Borrower/Tranche Description | Principal Amount* (000’s omitted) | Value | ||||||||||
| Food Products (continued) | ||||||||||||
| Valeo F1 Company Limited (Ireland) | ||||||||||||
Term Loan, 3.75%, (3 mo. EURIBOR + 3.75%), Maturing August 27, 2024 | EUR | 1,000 | $ | 896,657 | ||||||||
| $ | 27,921,082 | |||||||||||
| Food Service — 0.4% | ||||||||||||
| Aramark Services, Inc. | ||||||||||||
Term Loan, 2.74%, (1 mo. USD LIBOR + 1.75%), Maturing March 11, 2025 | 933 | $ | 875,148 | |||||||||
| IRB Holding Corp. | ||||||||||||
Term Loan, 3.75%, (USD LIBOR + 2.75%), Maturing February 5, 2025(4) | 2,239 | 1,746,735 | ||||||||||
| Restaurant Technologies, Inc. | ||||||||||||
Term Loan, 4.70%, (3 mo. USD LIBOR + 3.25%), Maturing October 1, 2025 | 222 | 187,193 | ||||||||||
| US Foods, Inc. | ||||||||||||
Term Loan, 2.82%, (6 mo. USD LIBOR + 1.75%), Maturing June 27, 2023 | 857 | 808,614 | ||||||||||
Term Loan, 3.07%, (6 mo. USD LIBOR + 2.00%), Maturing September 13, 2026 | 1,716 | 1,599,090 | ||||||||||
| $ | 5,216,780 | |||||||||||
| Food / Drug Retailers — 0.1% | ||||||||||||
| Allsup’s Convenience Stores, Inc. | ||||||||||||
Term Loan, 7.18%, (1 mo. USD LIBOR + 6.25%), Maturing November 18, 2024 | 642 | $ | 539,175 | |||||||||
| L1R HB Finance Limited | ||||||||||||
Term Loan, 4.25%, (3 mo. EURIBOR + 4.25%), Maturing August 9, 2024 | EUR | 750 | 459,771 | |||||||||
| $ | 998,946 | |||||||||||
| Forest Products — 0.0%(8) | ||||||||||||
| Clearwater Paper Corporation | ||||||||||||
Term Loan, 4.25%, (6 mo. USD LIBOR + 3.25%), Maturing July 26, 2026 | 349 | $ | 331,669 | |||||||||
| $ | 331,669 | |||||||||||
| Health Care — 5.0% | ||||||||||||
| Acadia Healthcare Company, Inc. | ||||||||||||
Term Loan, 3.49%, (1 mo. USD LIBOR + 2.50%), Maturing February 11, 2022 | 273 | $ | 254,255 | |||||||||
| Accelerated Health Systems, LLC | ||||||||||||
Term Loan, 4.30%, (1 mo. USD LIBOR + 3.50%), Maturing October 31, 2025 | 568 | 512,451 | ||||||||||
| Borrower/Tranche Description | Principal Amount* (000’s omitted) | Value | ||||||||
| Health Care (continued) | ||||||||||
| ADMI Corp. | ||||||||||
Term Loan, 4.20%, (3 mo. USD LIBOR + 2.75%), Maturing April 30, 2025 | 1,818 | $ | 1,631,547 | |||||||
| Alliance Healthcare Services, Inc. | ||||||||||
Term Loan, 5.50%, (1 mo. USD LIBOR + 4.50%, Floor 1.00%), Maturing October 24, 2023 | 820 | 643,945 | ||||||||
Term Loan - Second Lien, 11.00%, (1 mo. USD LIBOR + 10.00%, Floor 1.00%), Maturing April 24, 2024 | 525 | 380,625 | ||||||||
| athenahealth, Inc. | ||||||||||
Term Loan, 5.28%, (3 mo. USD LIBOR + 4.50%), Maturing February 11, 2026 | 1,955 | 1,837,935 | ||||||||
| Avantor, Inc. | ||||||||||
Term Loan, 3.25%, (1 mo. USD LIBOR + 2.25%, Floor 1.00%), Maturing November 21, 2024 | 1,167 | 1,117,703 | ||||||||
| BioClinica, Inc. | ||||||||||
Term Loan, 5.25%, (1 mo. USD LIBOR + 4.25%, Floor 1.00%), Maturing October 20, 2023 | 3,924 | 3,256,920 | ||||||||
| BW NHHC Holdco, Inc. | ||||||||||
Term Loan, 6.62%, (3 mo. USD LIBOR + 5.00%), Maturing May 15, 2025 | 3,787 | 2,291,310 | ||||||||
| Carestream Dental Equipment, Inc. | ||||||||||
Term Loan, 4.32%, (6 mo. USD LIBOR + 3.25%), Maturing September 1, 2024 | 265 | 218,741 | ||||||||
| CeramTec AcquiCo GmbH | ||||||||||
Term Loan, 2.50%, (3 mo. EURIBOR + 2.50%), Maturing March 7, 2025 | EUR | 903 | 846,435 | |||||||
| Change Healthcare Holdings, LLC | ||||||||||
Term Loan, 3.50%, (1 mo. USD LIBOR + 2.50%, Floor 1.00%), Maturing March 1, 2024 | 5,768 | 5,326,134 | ||||||||
| CHG Healthcare Services, Inc. | ||||||||||
Term Loan, 4.07%, (USD LIBOR + 3.00%), Maturing June 7, 2023(4) | 2,610 | 2,362,019 | ||||||||
| CryoLife, Inc. | ||||||||||
Term Loan, 4.70%, (3 mo. USD LIBOR + 3.25%), Maturing November 14, 2024 | 538 | 470,422 | ||||||||
| Elsan S.A.S. | ||||||||||
Term Loan, 3.25%, (6 mo. EURIBOR + 3.25%), Maturing October 31, 2024 | EUR | 1,500 | 1,488,914 | |||||||
| Ensemble RCM, LLC | ||||||||||
Term Loan, 5.51%, (3 mo. USD LIBOR + 3.75%), Maturing August 3, 2026 | 522 | 486,680 | ||||||||
| Envision Healthcare Corporation | ||||||||||
Term Loan, 4.74%, (1 mo. USD LIBOR + 3.75%), Maturing October 10, 2025 | 9,043 | 4,846,961 | ||||||||
| Gentiva Health Services, Inc. | ||||||||||
Term Loan, 4.25%, (1 mo. USD LIBOR + 3.25%), Maturing July 2, 2025 | 2,521 | 2,382,660 | ||||||||
| 16 | See Notes to Financial Statements. |
Eaton Vance
Limited Duration Income Fund
March 31, 2020
Portfolio of Investments — continued
| Borrower/Tranche Description | Principal Amount* (000’s omitted) | Value | ||||||||
| Health Care (continued) | ||||||||||
| GHX Ultimate Parent Corporation | ||||||||||
Term Loan, 4.62%, (3 mo. USD LIBOR + 3.25%), Maturing June 28, 2024 | 951 | $ | 888,852 | |||||||
| Greatbatch Ltd. | ||||||||||
Term Loan, 3.51%, (1 mo. USD LIBOR + 2.50%), Maturing October 27, 2022 | 1,174 | 1,120,956 | ||||||||
| Hanger, Inc. | ||||||||||
Term Loan, 4.49%, (1 mo. USD LIBOR + 3.50%), Maturing March 6, 2025 | 1,127 | 1,065,015 | ||||||||
| Inovalon Holdings, Inc. | ||||||||||
Term Loan, 3.75%, (1 mo. USD LIBOR + 3.00%), Maturing April 2, 2025 | 1,214 | 1,118,557 | ||||||||
| IQVIA, Inc. | ||||||||||
Term Loan, 2.74%, (1 mo. USD LIBOR + 1.75%), Maturing March 7, 2024 | 1,503 | 1,403,151 | ||||||||
Term Loan, 2.74%, (1 mo. USD LIBOR + 1.75%), Maturing January 17, 2025 | 1,487 | 1,388,370 | ||||||||
| Medical Solutions, LLC | ||||||||||
Term Loan, 5.50%, (1 mo. USD LIBOR + 4.50%, Floor 1.00%), Maturing June 14, 2024 | 1,229 | 1,093,798 | ||||||||
| Mehilainen Yhtiot Oy | ||||||||||
Term Loan, Maturing August 9, 2025(5) | EUR | 750 | 718,263 | |||||||
| MPH Acquisition Holdings, LLC | ||||||||||
Term Loan, 4.20%, (3 mo. USD LIBOR + 2.75%), Maturing June 7, 2023 | 9,123 | 8,302,308 | ||||||||
| National Mentor Holdings, Inc. | ||||||||||
Term Loan, 4.99%, (1 mo. USD LIBOR + 4.00%), Maturing March 9, 2026 | 617 | 561,418 | ||||||||
Term Loan, 5.46%, (3 mo. USD LIBOR + 4.00%), Maturing March 9, 2026 | 28 | 25,497 | ||||||||
| Navicure, Inc. | ||||||||||
Term Loan, 4.99%, (1 mo. USD LIBOR + 4.00%), Maturing October 22, 2026 | 1,000 | 945,000 | ||||||||
| One Call Corporation | ||||||||||
Term Loan, 6.95%, (3 mo. USD LIBOR + 5.25%), Maturing November 25, 2022 | 1,489 | 1,233,767 | ||||||||
| Ortho-Clinical Diagnostics S.A. | ||||||||||
Term Loan, 3.50%, (3 mo. EURIBOR + 3.50%), Maturing June 30, 2025 | EUR | 750 | 687,934 | |||||||
Term Loan, 4.77%, (1 mo. USD LIBOR + 3.25%), Maturing June 30, 2025 | 3,366 | 2,881,496 | ||||||||
| Parexel International Corporation | ||||||||||
Term Loan, 3.74%, (1 mo. USD LIBOR + 2.75%), Maturing September 27, 2024 | 582 | 500,138 | ||||||||
| Phoenix Guarantor, Inc. | ||||||||||
Term Loan, 4.11%, (1 mo. USD LIBOR + 3.25%), Maturing March 5, 2026 | 1,935 | 1,780,567 | ||||||||
| Borrower/Tranche Description | Principal Amount* (000’s omitted) | Value | ||||||||||
| Health Care (continued) | ||||||||||||
| Radiology Partners, Inc | ||||||||||||
Term Loan, 5.98%, (USD LIBOR + 4.25%), Maturing July 9, 2025(4) | 597 | $ | 506,260 | |||||||||
| RadNet, Inc. | ||||||||||||
Term Loan, 5.35%, (3 mo. USD LIBOR + 3.50%), Maturing June 30, 2023 | 1,823 | 1,622,502 | ||||||||||
| Select Medical Corporation | ||||||||||||
Term Loan, 3.43%, (1 mo. USD LIBOR + 2.50%), Maturing March 6, 2025 | 2,968 | 2,834,698 | ||||||||||
| Sound Inpatient Physicians | ||||||||||||
Term Loan, 3.74%, (1 mo. USD LIBOR + 2.75%), Maturing June 27, 2025 | 491 | 439,669 | ||||||||||
| Surgery Center Holdings, Inc. | ||||||||||||
Term Loan, 4.25%, (1 mo. USD LIBOR + 3.25%, Floor 1.00%), Maturing September 3, 2024 | 1,073 | 845,666 | ||||||||||
| Team Health Holdings, Inc. | ||||||||||||
Term Loan, 3.75%, (1 mo. USD LIBOR + 2.75%, Floor 1.00%), Maturing February 6, 2024 | 2,352 | 1,517,201 | ||||||||||
| Tecomet, Inc. | ||||||||||||
Term Loan, 5.50%, (USD Prime + 2.25%), Maturing May 1, 2024 | 1,174 | 1,004,181 | ||||||||||
| U.S. Anesthesia Partners, Inc. | ||||||||||||
Term Loan, 4.00%, (1 mo. USD LIBOR + 3.00%, Floor 1.00%), Maturing June 23, 2024 | 1,684 | 1,275,690 | ||||||||||
| Verscend Holding Corp. | ||||||||||||
Term Loan, 5.49%, (1 mo. USD LIBOR + 4.50%), Maturing August 27, 2025 | 1,576 | 1,497,200 | ||||||||||
| Viant Medical Holdings, Inc. | ||||||||||||
Term Loan, 5.20%, (3 mo. USD LIBOR + 3.75%), Maturing July 2, 2025 | 493 | 437,094 | ||||||||||
| Wink Holdco, Inc. | ||||||||||||
Term Loan, 4.45%, (3 mo. USD LIBOR + 3.00%), Maturing December 2, 2024 | 489 | 418,492 | ||||||||||
| $ | 68,469,397 | |||||||||||
| Home Furnishings — 0.3% | ||||||||||||
| Serta Simmons Bedding, LLC | ||||||||||||
Term Loan, 4.50%, (1 mo. USD LIBOR + 3.50%, Floor 1.00%), Maturing November 8, 2023 | 11,161 | $ | 4,594,714 | |||||||||
| $ | 4,594,714 | |||||||||||
| Industrial Equipment — 2.3% | ||||||||||||
| AI Alpine AT Bidco GmbH | ||||||||||||
Term Loan, 3.00%, (3 mo. EURIBOR + 3.00%), Maturing October 31, 2025 | EUR | 750 | $ | 691,208 | ||||||||
Term Loan, 4.62%, (3 mo. USD LIBOR + 2.75%), Maturing October 31, 2025 | 222 | 188,859 | ||||||||||
| 17 | See Notes to Financial Statements. |
Eaton Vance
Limited Duration Income Fund
March 31, 2020
Portfolio of Investments — continued
| Borrower/Tranche Description | Principal Amount* (000’s omitted) | Value | ||||||||
| Industrial Equipment (continued) | ||||||||||
| Altra Industrial Motion Corp. | ||||||||||
Term Loan, 2.99%, (1 mo. USD LIBOR + 2.00%), Maturing October 1, 2025 | 707 | $ | 648,549 | |||||||
| Apex Tool Group, LLC | ||||||||||
Term Loan, 6.75%, (1 mo. USD LIBOR + 5.50%, Floor 1.25%), Maturing August 1, 2024 | 4,454 | 3,465,794 | ||||||||
| Carlisle Foodservice Products, Inc. | ||||||||||
Term Loan, 4.00%, (1 mo. USD LIBOR + 3.00%, Floor 1.00%), Maturing March 20, 2025 | 270 | 232,107 | ||||||||
| CPM Holdings, Inc. | ||||||||||
Term Loan, 5.35%, (1 mo. USD LIBOR + 3.75%), Maturing November 17, 2025 | 321 | 265,576 | ||||||||
| Delachaux Group S.A. | ||||||||||
Term Loan, 3.75%, (3 mo. EURIBOR + 3.75%), Maturing April 16, 2026 | EUR | 375 | 347,413 | |||||||
Term Loan, 6.35%, (3 mo. USD LIBOR + 4.50%), Maturing April 16, 2026 | 475 | 396,625 | ||||||||
| DexKo Global, Inc. | ||||||||||
Term Loan, 3.75%, (3 mo. EURIBOR + 3.75%), Maturing July 24, 2024 | EUR | 321 | 287,568 | |||||||
Term Loan, 3.75%, (3 mo. EURIBOR + 3.75%), Maturing July 24, 2024 | EUR | 802 | 718,925 | |||||||
Term Loan, 4.50%, (1 mo. USD LIBOR + 3.50%, Floor 1.00%), Maturing July 24, 2024 | 924 | 792,418 | ||||||||
| DXP Enterprises, Inc. | ||||||||||
Term Loan, 5.74%, (1 mo. USD LIBOR + 4.75%), Maturing August 29, 2023 | 561 | 507,366 | ||||||||
| Dynacast International, LLC | ||||||||||
Term Loan, 4.70%, (3 mo. USD LIBOR + 3.25%), Maturing January 28, 2022 | 1,438 | 970,867 | ||||||||
| Engineered Machinery Holdings, Inc. | ||||||||||
Term Loan, 4.45%, (3 mo. USD LIBOR + 3.00%), Maturing July 19, 2024 | 1,588 | 1,334,287 | ||||||||
Term Loan, 5.70%, (3 mo. USD LIBOR + 4.25%), Maturing July 19, 2024 | 321 | 265,576 | ||||||||
| EWT Holdings III Corp. | ||||||||||
Term Loan, 3.74%, (1 mo. USD LIBOR + 2.75%), Maturing December 20, 2024 | 2,012 | 1,851,305 | ||||||||
| Filtration Group Corporation | ||||||||||
Term Loan, 3.50%, (3 mo. EURIBOR + 3.50%), Maturing March 29, 2025 | EUR | 1,392 | 1,331,817 | |||||||
| Gardner Denver, Inc. | ||||||||||
Term Loan, 2.00%, (1 mo. EURIBOR + 2.00%), Maturing March 1, 2027 | EUR | 1,444 | 1,486,774 | |||||||
| Gates Global, LLC | ||||||||||
Term Loan, 3.00%, (3 mo. EURIBOR + 3.00%), Maturing April 1, 2024 | EUR | 970 | 909,458 | |||||||
| Borrower/Tranche Description | Principal Amount* (000’s omitted) | Value | ||||||||||
| Industrial Equipment (continued) | ||||||||||||
| Gates Global, LLC (continued) | ||||||||||||
Term Loan, 3.75%, (1 mo. USD LIBOR + 2.75%, Floor 1.00%), Maturing April 1, 2024 | 4,933 | $ | 4,439,971 | |||||||||
| Hayward Industries, Inc. | ||||||||||||
Term Loan, 4.49%, (1 mo. USD LIBOR + 3.50%), Maturing August 5, 2024 | 478 | 385,006 | ||||||||||
| LTI Holdings, Inc. | ||||||||||||
Term Loan, 4.49%, (1 mo. USD LIBOR + 3.50%), Maturing September 6, 2025 | 3,453 | 2,580,911 | ||||||||||
Term Loan, 5.74%, (1 mo. USD LIBOR + 4.75%), Maturing July 24, 2026 | 199 | 151,903 | ||||||||||
| Minimax Viking GmbH | ||||||||||||
Term Loan, 3.00%, (1 mo. EURIBOR + 3.00%), Maturing July 31, 2025 | EUR | 975 | 958,862 | |||||||||
| Quimper AB | ||||||||||||
Term Loan, 4.25%, (2 mo. EURIBOR + 4.25%), Maturing February 13, 2026 | EUR | 1,875 | 1,616,438 | |||||||||
| Robertshaw US Holding Corp. | ||||||||||||
Term Loan, 4.25%, (1 mo. USD LIBOR + 3.25%, Floor 1.00%), Maturing February 28, 2025 | 1,029 | 668,850 | ||||||||||
| Thermon Industries, Inc. | ||||||||||||
Term Loan, 5.33%, (1 mo. USD LIBOR + 3.75%), Maturing October 30, 2024 | 282 | 240,768 | ||||||||||
| Titan Acquisition Limited | ||||||||||||
Term Loan, 4.45%, (3 mo. USD LIBOR + 3.00%), Maturing March 28, 2025 | 3,112 | 2,652,554 | ||||||||||
| Welbilt, Inc. | ||||||||||||
Term Loan, 3.49%, (1 mo. USD LIBOR + 2.50%), Maturing October 23, 2025 | 1,767 | 1,413,503 | ||||||||||
| $ | 31,801,258 | |||||||||||
| Insurance — 2.5% | ||||||||||||
| Alliant Holdings Intermediate, LLC | ||||||||||||
Term Loan, 3.86%, (1 mo. USD LIBOR + 3.25%), Maturing May 9, 2025 | 471 | $ | 437,258 | |||||||||
Term Loan, 3.99%, (1 mo. USD LIBOR + 3.00%), Maturing May 9, 2025 | 2,729 | 2,535,925 | ||||||||||
| AmWINS Group, Inc. | ||||||||||||
Term Loan, 3.75%, (1 mo. USD LIBOR + 2.75%, Floor 1.00%), Maturing January 25, 2024 | 4,344 | 4,066,917 | ||||||||||
| Andromeda Investissements | ||||||||||||
Term Loan, 4.25%, (6 mo. EURIBOR + 4.25%), Maturing June 12, 2026 | EUR | 1,250 | 1,268,334 | |||||||||
| AssuredPartners, Inc. | ||||||||||||
Term Loan, 4.49%, (1 mo. USD LIBOR + 3.50%), Maturing February 12, 2027 | 175 | 155,797 | ||||||||||
| 18 | See Notes to Financial Statements. |
Eaton Vance
Limited Duration Income Fund
March 31, 2020
Portfolio of Investments — continued
| Borrower/Tranche Description | Principal Amount* (000’s omitted) | Value | ||||||||||
| Insurance (continued) | ||||||||||||
| Asurion, LLC | ||||||||||||
Term Loan, 3.99%, (1 mo. USD LIBOR + 3.00%), Maturing August 4, 2022 | 4,659 | $ | 4,332,583 | |||||||||
Term Loan, 3.99%, (1 mo. USD LIBOR + 3.00%), Maturing November 3, 2023 | 2,671 | 2,577,063 | ||||||||||
Term Loan - Second Lien, 7.49%, (1 mo. USD LIBOR + 6.50%), Maturing August 4, 2025 | 2,750 | 2,571,250 | ||||||||||
| Financiere CEP S.A.S. | ||||||||||||
Term Loan, 4.00%, (2 mo. EURIBOR + 4.00%), Maturing January 16, 2025 | EUR | 550 | 516,111 | |||||||||
| FrontDoor, Inc. | ||||||||||||
Term Loan, 3.50%, (1 mo. USD LIBOR + 2.50%), Maturing August 16, 2025 | 468 | 451,499 | ||||||||||
| Hub International Limited | ||||||||||||
Term Loan, 4.54%, (2 mo. USD LIBOR + 2.75%), Maturing April 25, 2025 | 5,109 | 4,828,005 | ||||||||||
Term Loan, 5.69%, (3 mo. USD LIBOR + 4.00%), Maturing April 25, 2025 | 1,870 | 1,748,742 | ||||||||||
| NFP Corp. | ||||||||||||
Term Loan, 4.24%, (1 mo. USD LIBOR + 3.25%), Maturing February 15, 2027 | 3,187 | 2,788,250 | ||||||||||
| Sedgwick Claims Management Services, Inc. | ||||||||||||
Term Loan, 4.24%, (1 mo. USD LIBOR + 3.25%), Maturing December 31, 2025 | 1,259 | 1,112,172 | ||||||||||
| USI, Inc. | ||||||||||||
Term Loan, 3.99%, (1 mo. USD LIBOR + 3.00%), Maturing May 16, 2024 | 3,169 | 2,891,485 | ||||||||||
Term Loan, 4.99%, (1 mo. USD LIBOR + 4.00%), Maturing December 2, 2026 | 1,421 | 1,300,615 | ||||||||||
| $ | 33,582,006 | |||||||||||
| Leisure Goods / Activities / Movies — 2.1% | ||||||||||||
| AMC Entertainment Holdings, Inc. | ||||||||||||
Term Loan, 4.08%, (6 mo. USD LIBOR + 3.00%), Maturing April 22, 2026 | 1,856 | $ | 1,398,374 | |||||||||
| Amer Sports Oyj | ||||||||||||
Term Loan, 4.50%, (6 mo. EURIBOR + 4.50%), Maturing March 30, 2026 | EUR | 1,550 | 1,239,383 | |||||||||
| Ancestry.com Operations, Inc. | ||||||||||||
Term Loan, 5.24%, (1 mo. USD LIBOR + 4.25%), Maturing August 27, 2026 | 6,755 | 5,640,608 | ||||||||||
| ClubCorp Holdings, Inc. | ||||||||||||
Term Loan, 4.20%, (3 mo. USD LIBOR + 2.75%), Maturing September 18, 2024 | 1,950 | 1,252,875 | ||||||||||
| Crown Finance US, Inc. | ||||||||||||
Term Loan, 2.38%, (6 mo. EURIBOR + 2.38%), Maturing February 28, 2025 | EUR | 292 | 217,096 | |||||||||
| Borrower/Tranche Description | Principal Amount* (000’s omitted) | Value | ||||||||
| Leisure Goods / Activities / Movies (continued) | ||||||||||
| Crown Finance US, Inc. (continued) | ||||||||||
Term Loan, 3.57%, (6 mo. USD LIBOR + 2.50%), Maturing September 30, 2026 | 1,517 | $ | 1,004,502 | |||||||
| Delta 2 (LUX) S.a.r.l. | ||||||||||
Term Loan, 3.50%, (1 mo. USD LIBOR + 2.50%, Floor 1.00%), Maturing February 1, 2024 | 725 | 651,647 | ||||||||
| Emerald Expositions Holding, Inc. | ||||||||||
Term Loan, 3.74%, (1 mo. USD LIBOR + 2.75%), Maturing May 22, 2024 | 1,195 | 949,870 | ||||||||
| Etraveli Holding AB | ||||||||||
Term Loan, 4.00%, (6 mo. EURIBOR + 4.00%), Maturing August 2, 2024 | EUR | 950 | 827,726 | |||||||
| Lindblad Expeditions, Inc. | ||||||||||
Term Loan, 4.24%, (1 mo. USD LIBOR + 3.25%), Maturing March 27, 2025 | 465 | 369,816 | ||||||||
Term Loan, 4.24%, (1 mo. USD LIBOR + 3.25%), Maturing March 27, 2025 | 1,861 | 1,479,264 | ||||||||
| Match Group, Inc. | ||||||||||
Term Loan, 3.46%, (3 mo. USD LIBOR + 1.75%), Maturing February 15, 2027 | 675 | 631,125 | ||||||||
| Motion Finco S.a.r.l. | ||||||||||
Term Loan, 4.32%, (USD LIBOR + 3.25%), Maturing November 4, | 70 | 56,661 | ||||||||
Term Loan, 3.00%, (6 mo. EURIBOR + 3.00%), Maturing November 13, 2026 | EUR | 1,375 | 1,349,673 | |||||||
Term Loan, 4.32%, (USD LIBOR + 3.25%), Maturing November 13, | 529 | 446,325 | ||||||||
| NASCAR Holdings, Inc. | ||||||||||
Term Loan, 3.67%, (1 mo. USD LIBOR + 2.75%), Maturing October 19, 2026 | 731 | 646,594 | ||||||||
| Playtika Holding Corp. | ||||||||||
Term Loan, 7.07%, (6 mo. USD LIBOR + 6.00%), Maturing December 10, 2024 | 3,456 | 3,260,395 | ||||||||
| SeaWorld Parks & Entertainment, Inc. | ||||||||||
Term Loan, 3.99%, (1 mo. USD LIBOR + 3.00%), Maturing March 31, 2024 | 2,197 | 1,845,223 | ||||||||
| SRAM, LLC | ||||||||||
Term Loan, 3.75%, (1 mo. USD LIBOR + 2.75%, Floor 1.00%), Maturing March 15, 2024 | 1,100 | 1,050,825 | ||||||||
| Steinway Musical Instruments, Inc. | ||||||||||
Term Loan, 4.45%, (1 mo. USD LIBOR + 3.75%), Maturing February 14, 2025 | 518 | 484,366 | ||||||||
| Travel Leaders Group, LLC | ||||||||||
Term Loan, 4.96%, (1 mo. USD LIBOR + 4.00%), Maturing January 25, 2024 | 958 | 735,217 | ||||||||
| UFC Holdings, LLC | ||||||||||
Term Loan, 4.25%, (1 mo. USD LIBOR + 3.25%, Floor 1.00%), Maturing April 29, 2026 | 3,133 | 2,804,093 | ||||||||
| 19 | See Notes to Financial Statements. |
Eaton Vance
Limited Duration Income Fund
March 31, 2020
Portfolio of Investments — continued
| Borrower/Tranche Description | Principal Amount* (000’s omitted) | Value | ||||||||||
| Leisure Goods / Activities / Movies (continued) | ||||||||||||
| Vue International Bidco PLC | ||||||||||||
Term Loan, 4.25%, (2 mo. EURIBOR + 4.25%), Maturing July 3, 2026 | EUR | 1,081 | $ | 881,994 | ||||||||
Term Loan, Maturing July 3, 2026(5) | EUR | 76 | 62,193 | |||||||||
| $ | 29,285,845 | |||||||||||
| Lodging and Casinos — 2.0% | ||||||||||||
| Aristocrat Technologies, Inc. | ||||||||||||
Term Loan, 3.58%, (3 mo. USD LIBOR + 1.75%), Maturing October 19, 2024 | 1,061 | $ | 965,232 | |||||||||
| Azelis Finance S.A. | ||||||||||||
Term Loan, 3.50%, (1 mo. EURIBOR + 3.50%), Maturing November 10, 2025 | EUR | 1,925 | 1,734,557 | |||||||||
| Boyd Gaming Corporation | ||||||||||||
Term Loan, 2.93%, (1 week USD LIBOR + 2.25%), Maturing September 15, 2023 | 733 | 645,822 | ||||||||||
| CityCenter Holdings, LLC | ||||||||||||
Term Loan, 3.24%, (1 mo. USD LIBOR + 2.25%), Maturing April 18, 2024 | 2,776 | 2,459,935 | ||||||||||
| Eldorado Resorts, LLC | ||||||||||||
Term Loan, 3.25%, (6 mo. USD LIBOR + 2.25%), Maturing April 17, 2024 | 480 | 470,717 | ||||||||||
| ESH Hospitality, Inc. | ||||||||||||
Term Loan, 2.99%, (1 mo. USD LIBOR + 2.00%), Maturing September 18, 2026 | 1,203 | 1,050,699 | ||||||||||
| Four Seasons Hotels Limited | ||||||||||||
Term Loan, 2.99%, (1 mo. USD LIBOR + 2.00%), Maturing November 30, 2023 | 1,064 | 979,110 | ||||||||||
| GBT III B.V. | ||||||||||||
Term Loan, Maturing February 26, 2027(5) | 1,231 | 1,076,715 | ||||||||||
Term Loan, Maturing February 26, 2027(5) | 1,469 | 1,285,785 | ||||||||||
| Golden Nugget, Inc. | ||||||||||||
Term Loan, 3.58%, (USD LIBOR + 2.50%), Maturing October 4, 2023(4) | 4,297 | 3,358,641 | ||||||||||
| GVC Holdings PLC | ||||||||||||
Term Loan, 2.50%, (6 mo. EURIBOR + 2.50%), Maturing March 29, 2024 | EUR | 1,850 | 1,764,915 | |||||||||
Term Loan, 3.31%, (6 mo. USD LIBOR + 2.25%), Maturing March 29, 2024 | 1,152 | 957,664 | ||||||||||
| Hanjin International Corp. | ||||||||||||
Term Loan, 3.49%, (1 mo. USD LIBOR + 2.50%), Maturing October 18, 2020 | 550 | 440,000 | ||||||||||
| Playa Resorts Holding B.V. | ||||||||||||
Term Loan, 3.75%, (1 mo. USD LIBOR + 2.75%, Floor 1.00%), Maturing April 29, 2024 | 2,655 | 1,889,726 | ||||||||||
| Borrower/Tranche Description | Principal Amount* (000’s omitted) | Value | ||||||||||
| Lodging and Casinos (continued) | ||||||||||||
| Richmond UK Bidco Limited | ||||||||||||
Term Loan, 4.98%, (6 mo. GBP LIBOR + 4.25%), Maturing March 3, 2024 | GBP | 1,000 | $ | 1,049,575 | ||||||||
| Stars Group Holdings B.V. (The) | ||||||||||||
Term Loan, 3.75%, (3 mo. EURIBOR + 3.75%), Maturing July 10, 2025 | EUR | 975 | 1,036,795 | |||||||||
Term Loan, 4.95%, (3 mo. USD LIBOR + 3.50%), Maturing July 10, 2025 | 3,563 | 3,416,229 | ||||||||||
| VICI Properties 1, LLC | ||||||||||||
Term Loan, 2.67%, (1 mo. USD LIBOR + 1.75%), Maturing December 20, 2024 | 2,315 | 2,139,236 | ||||||||||
| $ | 26,721,353 | |||||||||||
| Nonferrous Metals / Minerals — 0.2% | ||||||||||||
| Arconic Rolled Products Corporation | ||||||||||||
Term Loan, Maturing February 4, | 525 | $ | 480,375 | |||||||||
| CD&R Hydra Buyer, Inc. | ||||||||||||
Term Loan, 7.50%, (0.00% cash, 7.50% PIK), Maturing August 15, 2021(3)(6) | 157 | 114,906 | ||||||||||
| Murray Energy Corporation | ||||||||||||
DIP Loan, 13.00%, (1 mo. USD LIBOR + 11.00%, Floor 2.00%), Maturing July 31, 2020 | 631 | 625,809 | ||||||||||
Term Loan, 0.00%, Maturing October 17, 2022(7) | 2,267 | 253,182 | ||||||||||
| Noranda Aluminum Acquisition Corporation | ||||||||||||
Term Loan, 0.00%, Maturing February 28, 2021(7) | 452 | 31,628 | ||||||||||
| Oxbow Carbon, LLC | ||||||||||||
Term Loan, 4.74%, (1 mo. USD LIBOR + 3.75%), Maturing January 4, 2023 | 621 | 543,594 | ||||||||||
| Rain Carbon GmbH | ||||||||||||
Term Loan, 3.00%, (6 mo. EURIBOR + 3.00%), Maturing January 16, 2025 | EUR | 1,025 | 977,858 | |||||||||
| $ | 3,027,352 | |||||||||||
| Oil and Gas — 1.2% | ||||||||||||
| Ameriforge Group, Inc. | ||||||||||||
Term Loan, 8.45%, (3 mo. USD LIBOR + 7.00%), Maturing June 8, 2022 | 736 | $ | 714,359 | |||||||||
| Apergy Corporation | ||||||||||||
Term Loan, 3.64%, (1 mo. USD LIBOR + 2.50%), Maturing May 9, 2025 | 239 | 209,526 | ||||||||||
| Blackstone CQP Holdco L.P. | ||||||||||||
Term Loan, 4.62%, (3 mo. USD LIBOR + 3.50%), Maturing September 30, 2024 | 1,017 | 829,110 | ||||||||||
| Buckeye Partners L.P. | ||||||||||||
Term Loan, 4.27%, (1 mo. USD LIBOR + 2.75%), Maturing November 1, 2026 | 2,775 | 2,580,750 | ||||||||||
| 20 | See Notes to Financial Statements. |
Eaton Vance
Limited Duration Income Fund
March 31, 2020
Portfolio of Investments — continued
| Borrower/Tranche Description | Principal Amount* (000’s omitted) | Value | ||||||||||
| Oil and Gas (continued) | ||||||||||||
| Centurion Pipeline Company, LLC | ||||||||||||
Term Loan, 4.24%, (1 mo. USD LIBOR + 3.25%), Maturing September 29, 2025 | 272 | $ | 203,672 | |||||||||
| CITGO Holding, Inc. | ||||||||||||
Term Loan, 8.00%, (1 mo. USD LIBOR + 7.00%, Floor 1.00%), Maturing August 1, 2023 | 249 | 201,488 | ||||||||||
| CITGO Petroleum Corporation | ||||||||||||
Term Loan, 5.50%, (1 mo. USD LIBOR + 4.50%, Floor 1.00%), Maturing July 29, 2021 | 1,709 | 1,581,210 | ||||||||||
Term Loan, 6.00%, (1 mo. USD LIBOR + 5.00%, Floor 1.00%), Maturing March 28, 2024 | 2,525 | 2,208,937 | ||||||||||
| Delek US Holdings, Inc. | ||||||||||||
Term Loan, 3.24%, (1 mo. USD LIBOR + 2.25%), Maturing March 31, 2025 | 1,386 | 1,027,919 | ||||||||||
| Fieldwood Energy, LLC | ||||||||||||
Term Loan, 7.03%, (3 mo. USD LIBOR + 5.25%), Maturing April 11, 2022 | 2,771 | 969,828 | ||||||||||
| Matador Bidco S.a.r.l. | ||||||||||||
Term Loan, 5.74%, (1 mo. USD LIBOR + 4.75%), Maturing October 15, 2026 | 1,750 | 1,583,750 | ||||||||||
| McDermott Technology Americas, Inc. | ||||||||||||
DIP Loan, 10.72%, (USD LIBOR + 9.00%), Maturing October 21, 2020(4) | 625 | 576,563 | ||||||||||
DIP Loan, 10.65%, (3 mo. USD LIBOR + 9.00%), Maturing October 22, 2020 | 499 | 494,304 | ||||||||||
Term Loan, 0.00%, Maturing May 9, 2025(7) | 1,302 | 393,147 | ||||||||||
| Prairie ECI Acquiror L.P. | ||||||||||||
Term Loan, 6.20%, (3 mo. USD LIBOR + 4.75%), Maturing March 11, 2026 | 854 | 448,128 | ||||||||||
Term Loan, Maturing March 11, 2026(5) | 450 | 236,250 | ||||||||||
| PSC Industrial Holdings Corp. | ||||||||||||
Term Loan, 4.75%, (1 mo. USD LIBOR + 3.75%, Floor 1.00%), Maturing October 11, 2024 | 782 | 722,372 | ||||||||||
| RDV Resources Properties, LLC | ||||||||||||
Term Loan, 6.87%, (3 mo. USD LIBOR + 5.50%), Maturing March 29, 2024 | 416 | 220,616 | ||||||||||
| Sunrise Oil & Gas Properties, LLC | ||||||||||||
Term Loan, 8.00%, (1 mo. USD LIBOR + 7.00%, Floor 1.00%), Maturing January 17, 2023 | 107 | 101,577 | ||||||||||
Term Loan - Second Lien, 8.00%, (1 mo. USD LIBOR + 7.00%, Floor 1.00%), Maturing January 17, 2023 | 107 | 90,350 | ||||||||||
Term Loan - Third Lien, 8.00%, (1 mo. USD LIBOR + 7.00%, Floor 1.00%), Maturing January 17, 2023 | 124 | 87,086 | ||||||||||
| UGI Energy Services, LLC | ||||||||||||
Term Loan, 4.74%, (1 mo. USD LIBOR + 3.75%), Maturing August 13, 2026 | 1,067 | 922,901 | ||||||||||
| $ | 16,403,843 | |||||||||||
| Borrower/Tranche Description | Principal Amount* (000’s omitted) | Value | ||||||||||
| Publishing — 0.4% | ||||||||||||
| Ascend Learning, LLC | ||||||||||||
Term Loan, 4.00%, (1 mo. USD LIBOR + 3.00%, Floor 1.00%), Maturing July 12, 2024 | 1,194 | $ | 1,082,900 | |||||||||
| Axel Springer S.E. | ||||||||||||
Term Loan, 5.00%, (3 mo. EURIBOR + 5.00%), Maturing December 18, 2026 | EUR | 1,000 | 940,332 | |||||||||
| Getty Images, Inc. | ||||||||||||
Term Loan, 5.50%, (1 mo. USD LIBOR + 4.50%), Maturing February 19, 2026 | 1,075 | 875,812 | ||||||||||
| Harland Clarke Holdings Corp. | ||||||||||||
Term Loan, 6.46%, (3 mo. USD LIBOR + 4.75%), Maturing November 3, 2023 | 7 | 4,237 | ||||||||||
| LSC Communications, Inc. | ||||||||||||
Term Loan, 0.00%, Maturing September 30, 2022(7) | 843 | 137,710 | ||||||||||
| ProQuest, LLC | ||||||||||||
Term Loan, 4.49%, (1 mo. USD LIBOR + 3.50%), Maturing October 23, 2026 | 1,596 | 1,508,220 | ||||||||||
| Tweddle Group, Inc. | ||||||||||||
Term Loan, 5.50%, (1 mo. USD LIBOR + 4.50%), Maturing September 17, 2023 | 576 | 419,271 | ||||||||||
| $ | 4,968,482 | |||||||||||
| Radio and Television — 1.3% | ||||||||||||
| Cumulus Media New Holdings, Inc. | ||||||||||||
Term Loan, 4.82%, (6 mo. USD LIBOR + 3.75%), Maturing March 31, 2026 | 473 | $ | 383,614 | |||||||||
| Diamond Sports Group, LLC | ||||||||||||
Term Loan, 4.18%, (1 mo. USD LIBOR + 3.25%), Maturing August 24, 2026 | 3,085 | 2,421,332 | ||||||||||
| Entercom Media Corp. | ||||||||||||
Term Loan, 3.49%, (1 mo. USD LIBOR + 2.50%), Maturing November 18, 2024 | 1,005 | 904,388 | ||||||||||
| Entravision Communications Corporation | ||||||||||||
Term Loan, 3.74%, (1 mo. USD LIBOR + 2.75%), Maturing November 29, 2024 | 852 | 702,797 | ||||||||||
| Gray Television, Inc. | ||||||||||||
Term Loan, 3.77%, (1 mo. USD LIBOR + 2.25%), Maturing February 7, 2024 | 278 | 263,595 | ||||||||||
Term Loan, 4.02%, (1 mo. USD LIBOR + 2.50%), Maturing January 2, 2026 | 637 | 614,929 | ||||||||||
| Hubbard Radio, LLC | ||||||||||||
Term Loan, 4.50%, (1 mo. USD LIBOR + 3.50%, Floor 1.00%), Maturing March 28, 2025 | 814 | 701,368 | ||||||||||
| iHeartCommunications, Inc. | ||||||||||||
Term Loan, 3.99%, (1 mo. USD LIBOR + 3.00%), Maturing May 1, 2026 | 499 | 427,179 | ||||||||||
| 21 | See Notes to Financial Statements. |
Eaton Vance
Limited Duration Income Fund
March 31, 2020
Portfolio of Investments — continued
| Borrower/Tranche Description | Principal Amount* (000’s omitted) | Value | ||||||||||
| Radio and Television (continued) | ||||||||||||
| Mission Broadcasting, Inc. | ||||||||||||
Term Loan, 3.83%, (1 mo. USD LIBOR + 2.25%), Maturing January 17, 2024 | 35 | $ | 33,170 | |||||||||
| Nexstar Broadcasting, Inc. | ||||||||||||
Term Loan, 3.19%, (1 mo. USD LIBOR + 2.25%), Maturing January 17, 2024 | 137 | 128,612 | ||||||||||
Term Loan, 4.33%, (1 mo. USD LIBOR + 2.75%), Maturing September 18, 2026 | 504 | 476,590 | ||||||||||
| Sinclair Television Group, Inc. | ||||||||||||
Term Loan, 3.24%, (1 mo. USD LIBOR + 2.25%), Maturing January 3, 2024 | 489 | 469,365 | ||||||||||
Term Loan, 3.21%, (1 mo. USD LIBOR + 2.50%), Maturing September 30, 2026 | 647 | 599,052 | ||||||||||
| Terrier Media Buyer, Inc. | ||||||||||||
Term Loan, 5.70%, (3 mo. USD LIBOR + 4.25%), Maturing December 17, 2026 | 1,870 | 1,621,327 | ||||||||||
| Townsquare Media, Inc. | ||||||||||||
Term Loan, 4.00%, (1 mo. USD LIBOR + 3.00%, Floor 1.00%), Maturing April 1, 2022 | 2,276 | 2,028,331 | ||||||||||
| Univision Communications, Inc. | ||||||||||||
Term Loan, 3.75%, (1 mo. USD LIBOR + 2.75%, Floor 1.00%), Maturing March 15, 2024 | 7,528 | 6,436,451 | ||||||||||
| $ | 18,212,100 | |||||||||||
| Retailers (Except Food and Drug) — 0.8% | ||||||||||||
| Apro, LLC | ||||||||||||
Term Loan, 4.00%, Maturing November 14, 2026(2) | 150 | $ | 131,625 | |||||||||
Term Loan, 5.00%, (1 mo. USD LIBOR + 4.00%, Floor 1.00%), Maturing November 14, 2026 | 524 | 459,536 | ||||||||||
| Ascena Retail Group, Inc. | ||||||||||||
Term Loan, 5.75%, (USD LIBOR + 4.50%), Maturing August 21, 2022(4) | 3,226 | 1,005,494 | ||||||||||
| Bass Pro Group, LLC | ||||||||||||
Term Loan, 6.07%, (6 mo. USD LIBOR + 5.00%), Maturing September 25, 2024 | 1,511 | 1,284,562 | ||||||||||
| BJ’s Wholesale Club, Inc. | ||||||||||||
Term Loan, 3.05%, (1 mo. USD LIBOR + 2.25%), Maturing February 3, 2024 | 912 | 870,917 | ||||||||||
| Coinamatic Canada, Inc. | ||||||||||||
Term Loan, 4.25%, (1 mo. USD LIBOR + 3.25%, Floor 1.00%), Maturing May 14, 2022 | 53 | 45,247 | ||||||||||
| David’s Bridal, Inc. | ||||||||||||
Term Loan, 7.65%, (3 mo. USD LIBOR + 6.00%), Maturing June 30, 2023 | 578 | 446,649 | ||||||||||
| Hoya Midco, LLC | ||||||||||||
Term Loan, 4.57%, (6 mo. USD LIBOR + 3.50%), Maturing June 30, 2024 | 2,093 | 1,632,544 | ||||||||||
| Borrower/Tranche Description | Principal Amount* (000’s omitted) | Value | ||||||||||
| Retailers (Except Food and Drug) (continued) | ||||||||||||
| J. Crew Group, Inc. | ||||||||||||
Term Loan, 4.45%, (3 mo. USD LIBOR + 3.00%), Maturing March 5, 2021(3) | 3,696 | $ | 2,274,246 | |||||||||
| LSF9 Atlantis Holdings, LLC | ||||||||||||
Term Loan, 7.00%, (1 mo. USD LIBOR + 6.00%, Floor 1.00%), Maturing May 1, 2023 | 1,071 | 864,782 | ||||||||||
| PFS Holding Corporation | ||||||||||||
Term Loan, 0.00%, Maturing January 31, 2021(7) | 2,213 | 793,829 | ||||||||||
| Pier 1 Imports (U.S.), Inc. | ||||||||||||
Term Loan, 0.00%, Maturing April 30, 2021(7) | 638 | 130,764 | ||||||||||
| Radio Systems Corporation | ||||||||||||
Term Loan, 3.75%, (1 mo. USD LIBOR + 2.75%, Floor 1.00%), Maturing May 2, 2024 | 462 | 420,363 | ||||||||||
| $ | 10,360,558 | |||||||||||
| Steel — 0.6% | ||||||||||||
| Atkore International, Inc. | ||||||||||||
Term Loan, 4.02%, (3 mo. USD LIBOR + 2.75%), Maturing December 22, 2023 | 394 | $ | 346,398 | |||||||||
| GrafTech Finance, Inc. | ||||||||||||
Term Loan, 4.50%, (1 mo. USD LIBOR + 3.50%, Floor 1.00%), Maturing February 12, 2025 | 6,044 | 5,288,302 | ||||||||||
| Neenah Foundry Company | ||||||||||||
Term Loan, 7.95%, (2 mo. USD LIBOR + 6.50%), Maturing December 13, 2022 | 747 | 653,771 | ||||||||||
| Phoenix Services International, LLC | ||||||||||||
Term Loan, 4.75%, (1 mo. USD LIBOR + 3.75%, Floor 1.00%), Maturing March 1, 2025 | 882 | 732,060 | ||||||||||
| Zekelman Industries, Inc. | ||||||||||||
Term Loan, 3.21%, (1 mo. USD LIBOR + 2.25%), Maturing January 24, 2027 | 1,150 | 1,075,250 | ||||||||||
| $ | 8,095,781 | |||||||||||
| Surface Transport — 0.2% | ||||||||||||
| Agro Merchants NAI Holdings, LLC | ||||||||||||
Term Loan, 5.20%, (3 mo. USD LIBOR + 3.75%), Maturing December 6, 2024 | 17 | $ | 14,431 | |||||||||
| Hertz Corporation (The) | ||||||||||||
Term Loan, 3.74%, (1 mo. USD LIBOR + 2.75%), Maturing June 30, 2023 | 1,195 | 856,641 | ||||||||||
| Kenan Advantage Group, Inc. | ||||||||||||
Term Loan, 4.00%, (1 mo. USD LIBOR + 3.00%, Floor 1.00%), Maturing July 31, 2022 | 128 | 108,694 | ||||||||||
Term Loan, 4.00%, (1 mo. USD LIBOR + 3.00%, Floor 1.00%), Maturing July 31, 2022 | 421 | 357,434 | ||||||||||
| 22 | See Notes to Financial Statements. |
Eaton Vance
Limited Duration Income Fund
March 31, 2020
Portfolio of Investments — continued
| Borrower/Tranche Description | Principal Amount* (000’s omitted) | Value | ||||||||||
| Surface Transport (continued) | ||||||||||||
| PODS, LLC | ||||||||||||
Term Loan, 3.75%, (1 mo. USD LIBOR + 2.75%, Floor 1.00%), Maturing December 6, 2024 | 658 | $ | 577,509 | |||||||||
| XPO Logistics, Inc. | ||||||||||||
Term Loan, 3.61%, (3 mo. USD LIBOR + 2.00%), Maturing February 24, 2025 | 650 | 610,459 | ||||||||||
| $ | 2,525,168 | |||||||||||
| Telecommunications — 2.1% | ||||||||||||
| CenturyLink, Inc. | ||||||||||||
Term Loan, 3.24%, (1 mo. USD LIBOR + 2.25%), Maturing March 15, 2027 | 7,382 | $ | 6,860,182 | |||||||||
| Colorado Buyer, Inc. | ||||||||||||
Term Loan, 4.00%, (1 mo. USD LIBOR + 3.00%, Floor 1.00%), Maturing May 1, 2024 | 924 | 627,465 | ||||||||||
| Digicel International Finance Limited | ||||||||||||
Term Loan, 4.87%, (3 mo. USD LIBOR + 3.25%), Maturing May 28, 2024 | 4,952 | 3,868,930 | ||||||||||
| eircom Finco S.a.r.l. | ||||||||||||
Term Loan, 3.25%, (1 mo. EURIBOR + 3.25%), Maturing May 15, 2026 | EUR | 1,786 | 1,879,747 | |||||||||
| Gamma Infrastructure III B.V. | ||||||||||||
Term Loan, 3.50%, (6 mo. EURIBOR + 3.50%), Maturing January 9, 2025 | EUR | 1,700 | 1,640,563 | |||||||||
| Global Eagle Entertainment, Inc. | ||||||||||||
Term Loan, 9.38%, (3 mo. USD LIBOR + 7.50%), Maturing January 6, 2023 | 2,173 | 1,423,214 | ||||||||||
| Intelsat Jackson Holdings S.A. | ||||||||||||
Term Loan, 6.43%, (3 mo. USD LIBOR + 4.50%), Maturing January 2, 2024 | 1,500 | 1,399,999 | ||||||||||
| IPC Corp. | ||||||||||||
Term Loan, 6.28%, (3 mo. USD LIBOR + 4.50%), Maturing August 6, 2021 | 1,088 | 652,702 | ||||||||||
| Onvoy, LLC | ||||||||||||
Term Loan, 5.50%, (1 mo. USD LIBOR + 4.50%, Floor 1.00%), Maturing February 10, 2024 | 825 | 638,988 | ||||||||||
| Plantronics, Inc. | ||||||||||||
Term Loan, 3.46%, (USD LIBOR + 2.50%), Maturing July 2, 2025(4) | 1,304 | 1,017,290 | ||||||||||
| Syniverse Holdings, Inc. | ||||||||||||
Term Loan, 6.87%, (6 mo. USD LIBOR + 5.00%), Maturing March 9, 2023 | 1,054 | 704,089 | ||||||||||
| Telesat Canada | ||||||||||||
Term Loan, 3.74%, (1 mo. USD LIBOR + 2.75%), Maturing December 7, 2026 | 1,397 | 1,302,236 | ||||||||||
| Borrower/Tranche Description | Principal Amount* (000’s omitted) | Value | ||||||||||
| Telecommunications (continued) | ||||||||||||
| Zayo Group Holdings, Inc. | ||||||||||||
Term Loan, 3.25%, (EURIBOR + 3.25%), Maturing March 9, | EUR | 1,000 | $ | 995,367 | ||||||||
Term Loan, 3.99%, (1 mo. USD LIBOR + 3.00%), Maturing March 9, 2027 | 2,325 | 2,179,687 | ||||||||||
| Ziggo Financing Partnership | ||||||||||||
Term Loan, 3.20%, (1 mo. USD LIBOR + 2.50%), Maturing April 30, 2028 | 4,150 | 3,875,062 | ||||||||||
| $ | 29,065,521 | |||||||||||
| Utilities — 0.6% | ||||||||||||
| Calpine Construction Finance Company L.P. | ||||||||||||
Term Loan, 2.99%, (1 mo. USD LIBOR + 2.00%), Maturing January 15, 2025 | 2,743 | $ | 2,537,149 | |||||||||
| Calpine Corporation | ||||||||||||
Term Loan, 3.24%, (1 mo. USD LIBOR + 2.25%), Maturing January 15, 2024 | 3,096 | 2,989,917 | ||||||||||
Term Loan, 3.24%, (1 mo. USD LIBOR + 2.25%), Maturing April 5, 2026 | 918 | 885,931 | ||||||||||
| Lightstone Holdco, LLC | ||||||||||||
Term Loan, 4.75%, (1 mo. USD LIBOR + 3.75%, Floor 1.00%), Maturing January 30, 2024 | 59 | 43,765 | ||||||||||
Term Loan, 4.75%, (1 mo. USD LIBOR + 3.75%, Floor 1.00%), Maturing January 30, 2024 | 1,045 | 775,955 | ||||||||||
| Longview Power, LLC | ||||||||||||
Term Loan, 0.00%, Maturing April 13, 2021(7) | 334 | 71,028 | ||||||||||
| Talen Energy Supply, LLC | ||||||||||||
Term Loan, 4.74%, (1 mo. USD LIBOR + 3.75%), Maturing July 8, 2026 | 422 | 373,472 | ||||||||||
| USIC Holdings, Inc. | ||||||||||||
Term Loan, 4.25%, (1 mo. USD LIBOR + 3.25%, Floor 1.00%), Maturing December 8, 2023 | 196 | 165,689 | ||||||||||
| $ | 7,842,906 | |||||||||||
Total Senior Floating-Rate Loans |
| $ | 692,793,171 | |||||||||
| Corporate Bonds & Notes — 49.2% |
| |||||||||||
| Security | Principal Amount* (000’s omitted) | Value | ||||||||||
| Aerospace and Defense — 1.5% | ||||||||||||
| Aerovias de Mexico S.A. de CV | ||||||||||||
7.00%, 2/5/25(9) | 925 | $ | 284,437 | |||||||||
| 23 | See Notes to Financial Statements. |
Eaton Vance
Limited Duration Income Fund
March 31, 2020
Portfolio of Investments — continued
| Security | Principal Amount* (000’s omitted) | Value | ||||||||||
| Aerospace and Defense (continued) | ||||||||||||
| Bombardier, Inc. | ||||||||||||
6.00%, 10/15/22(9) | 2,843 | $ | 2,153,572 | |||||||||
6.125%, 1/15/23(9) | 1,286 | 914,674 | ||||||||||
7.875%, 4/15/27(9) | 1,172 | 817,558 | ||||||||||
| Booz Allen Hamilton, Inc. | ||||||||||||
5.125%, 5/1/25(9) | 695 | 687,178 | ||||||||||
| BWX Technologies, Inc. | ||||||||||||
5.375%, 7/15/26(9) | 1,305 | 1,263,948 | ||||||||||
| F-Brasile SpA/F-Brasile US, LLC | ||||||||||||
7.375%, 8/15/26(9) | 527 | 527,000 | ||||||||||
| Lockheed Martin Corp. | ||||||||||||
3.55%, 1/15/26 | 960 | 1,040,269 | ||||||||||
| Moog, Inc. | ||||||||||||
4.25%, 12/15/27(9) | 955 | 869,050 | ||||||||||
| Northrop Grumman Corp. | ||||||||||||
2.93%, 1/15/25 | 770 | 785,319 | ||||||||||
| TransDigm UK Holdings PLC | ||||||||||||
6.875%, 5/15/26 | 725 | 680,443 | ||||||||||
| TransDigm, Inc. | ||||||||||||
6.50%, 7/15/24 | 4,410 | 4,226,567 | ||||||||||
6.50%, 5/15/25 | 185 | 176,907 | ||||||||||
6.25%, 3/15/26(9) | 2,408 | 2,409,498 | ||||||||||
7.50%, 3/15/27 | 1,862 | 1,804,743 | ||||||||||
5.50%, 11/15/27(9) | 2,052 | 1,853,059 | ||||||||||
| $ | 20,494,222 | |||||||||||
| Air Transport — 0.0%(8) | ||||||||||||
| Azul Investments LLP | ||||||||||||
5.875%, 10/26/24(9) | 1,030 | $ | 575,518 | |||||||||
| $ | 575,518 | |||||||||||
| Automotive — 1.0% | ||||||||||||
| Adient Global Holdings, Ltd. | ||||||||||||
3.50%, 8/15/24(10) | EUR | 150 | $ | 109,250 | ||||||||
| Fiat Chrysler Finance Europe S.A. | ||||||||||||
4.75%, 3/22/21(10) | EUR | 325 | 359,456 | |||||||||
| Frigoglass Finance B.V. | ||||||||||||
6.875%, 2/12/25(10) | EUR | 100 | 79,315 | |||||||||
| Garrett LX I S.a.r.l./Garrett Borrowing, LLC | ||||||||||||
5.125%, 10/15/26(10) | EUR | 200 | 141,094 | |||||||||
| General Motors Co. | ||||||||||||
5.00%, 4/1/35 | 1,495 | 1,127,804 | ||||||||||
| Gestamp Funding Luxembourg S.A. | ||||||||||||
3.50%, 5/15/23(10) | EUR | 300 | 296,790 | |||||||||
| Security | Principal Amount* (000’s omitted) | Value | ||||||||||
| Automotive (continued) | ||||||||||||
| GKN Holdings, Ltd. | ||||||||||||
4.625%, 5/12/32(10) | GBP | 120 | $ | 143,367 | ||||||||
| IAA, Inc. | ||||||||||||
5.50%, 6/15/27(9) | 537 | 522,528 | ||||||||||
| Jaguar Land Rover Automotive PLC | ||||||||||||
6.875%, 11/15/26(10) | EUR | 100 | 80,246 | |||||||||
| Lithia Motors, Inc. | ||||||||||||
4.625%, 12/15/27(9) | 514 | 466,506 | ||||||||||
| LKQ European Holdings B.V. | ||||||||||||
3.625%, 4/1/26(10) | EUR | 125 | 124,348 | |||||||||
| Navistar International Corp. | ||||||||||||
6.625%, 11/1/25(9) | 2,914 | 2,444,132 | ||||||||||
| Panther BF Aggregator 2 L.P./Panther Finance Co., Inc. | ||||||||||||
4.375%, 5/15/26(10) | EUR | 300 | 277,327 | |||||||||
6.25%, 5/15/26(9) | 1,671 | 1,588,489 | ||||||||||
8.50%, 5/15/27(9) | 5,763 | 5,059,626 | ||||||||||
| RAC Bond Co. PLC | ||||||||||||
5.00%, 11/6/22(10) | GBP | 250 | 250,949 | |||||||||
| ZF North America Capital, Inc. | ||||||||||||
4.50%, 4/29/22(9) | 392 | 366,227 | ||||||||||
| $ | 13,437,454 | |||||||||||
| Banks and Thrifts — 0.9% | ||||||||||||
| Australia & New Zealand Banking Group, Ltd. | ||||||||||||
2.95% to 7/22/25, 7/22/30(9)(11) | 482 | $ | 457,708 | |||||||||
| Banco Comercial Portugues S.A. | ||||||||||||
4.50% to 12/7/22, 12/7/27(10)(11) | EUR | 500 | 422,107 | |||||||||
| Banco Mercantil del Norte S.A./Grand Cayman | ||||||||||||
5.75% to 10/4/26, 10/4/31(9)(11) | 1,160 | 995,909 | ||||||||||
| Bank of Montreal | ||||||||||||
3.803% to 12/15/27, 12/15/32(11) | 1,325 | 1,288,059 | ||||||||||
| BBVA Bancomer S.A. | ||||||||||||
5.125% to 1/18/28, 1/18/33(9)(11) | 2,590 | 2,164,139 | ||||||||||
| Commonwealth Bank of Australia | ||||||||||||
3.61% to 9/12/29, 9/12/34(9)(11) | 1,500 | 1,362,579 | ||||||||||
| First Midwest Bancorp, Inc. | ||||||||||||
5.875%, 9/29/26 | 1,000 | 1,131,899 | ||||||||||
| Flagstar Bancorp, Inc. | ||||||||||||
6.125%, 7/15/21 | 650 | 653,947 | ||||||||||
| Lloyds Banking Group PLC | ||||||||||||
4.344%, 1/9/48 | 775 | 780,809 | ||||||||||
| Nationwide Building Society | ||||||||||||
4.125% to 10/18/27, 10/18/32(9)(11) | 1,280 | 1,254,338 | ||||||||||
| 24 | See Notes to Financial Statements. |
Eaton Vance
Limited Duration Income Fund
March 31, 2020
Portfolio of Investments — continued
| Security | Principal Amount* (000’s omitted) | Value | ||||||||||
| Banks and Thrifts (continued) | ||||||||||||
| Wells Fargo & Co. | ||||||||||||
3.584% to 5/22/27, 5/22/28(11) | 1,500 | $ | 1,573,682 | |||||||||
| $ | 12,085,176 | |||||||||||
| Beverage and Tobacco — 0.3% | ||||||||||||
| Anheuser-Busch InBev Finance, Inc. | ||||||||||||
4.625%, 2/1/44 | 860 | $ | 906,826 | |||||||||
| Fomento Economico Mexicano SAB de CV | ||||||||||||
3.50%, 1/16/50 | 274 | 256,427 | ||||||||||
| Kraft Heinz Foods Co. | ||||||||||||
4.375%, 6/1/46 | 3,059 | 2,773,363 | ||||||||||
| Vector Group, Ltd. | ||||||||||||
6.125%, 2/1/25(9) | 500 | 458,735 | ||||||||||
| $ | 4,395,351 | |||||||||||
| Brokerage / Securities Dealers / Investment Houses — 0.1% | ||||||||||||
| Alliance Data Systems Corp. | ||||||||||||
4.75%, 12/15/24(9) | 1,071 | $ | 821,993 | |||||||||
| Intrum AB | ||||||||||||
3.50%, 7/15/26(10) | EUR | 200 | 160,417 | |||||||||
| Neuberger Berman Group, LLC/Neuberger Berman Finance Corp. | ||||||||||||
4.875%, 4/15/45(9) | 688 | 630,199 | ||||||||||
| $ | 1,612,609 | |||||||||||
| Building and Development — 1.7% | ||||||||||||
| ADLER Real Estate AG | ||||||||||||
1.875%, 4/27/23(10) | EUR | 300 | $ | 301,293 | ||||||||
| AT Securities B.V. | ||||||||||||
5.25% to 7/21/23(10)(11)(12) | 500 | 456,890 | ||||||||||
| Brookfield Property REIT, Inc./BPR Cumulus, LLC/ BPR Nimbus, LLC/GGSI Sellco, LLC | ||||||||||||
5.75%, 5/15/26(9) | 1,592 | 1,300,667 | ||||||||||
| Brookfield Residential Properties, Inc./Brookfield Residential US Corp. | ||||||||||||
4.875%, 2/15/30(9) | 510 | 389,360 | ||||||||||
| Builders FirstSource, Inc. | ||||||||||||
6.75%, 6/1/27(9) | 380 | 375,646 | ||||||||||
5.00%, 3/1/30(9) | 510 | 461,869 | ||||||||||
| Core & Main Holdings, L.P. | ||||||||||||
8.625%, (8.625% cash or 9.375% PIK), 9/15/24(9)(13) | 1,191 | 1,100,180 | ||||||||||
| CyrusOne, L.P./CyrusOne Finance Corp. | ||||||||||||
3.45%, 11/15/29 | 562 | 499,202 | ||||||||||
| Security | Principal Amount* (000’s omitted) | Value | ||||||||||
| Building and Development (continued) | ||||||||||||
| Five Point Operating Co., L.P./Five Point Capital Corp. | ||||||||||||
7.875%, 11/15/25(9) | 1,213 | $ | 1,052,241 | |||||||||
| Greystar Real Estate Partners, LLC | ||||||||||||
5.75%, 12/1/25(9) | 1,731 | 1,579,589 | ||||||||||
| Hillman Group, Inc. (The) | ||||||||||||
6.375%, 7/15/22(9) | 2,695 | 2,114,729 | ||||||||||
| Masonite International Corp. | ||||||||||||
5.375%, 2/1/28(9) | 570 | 563,359 | ||||||||||
| MDC Holdings, Inc. | ||||||||||||
6.00%, 1/15/43 | 982 | 933,710 | ||||||||||
| Miller Homes Group Holdings PLC | ||||||||||||
5.50%, 10/15/24(10) | GBP | 100 | 109,902 | |||||||||
| Owens Corning | ||||||||||||
3.95%, 8/15/29 | 747 | 710,001 | ||||||||||
| PulteGroup, Inc. | ||||||||||||
6.00%, 2/15/35 | 446 | 451,618 | ||||||||||
| Reliance Intermediate Holdings, L.P. | ||||||||||||
6.50%, 4/1/23(9) | 4,610 | 4,717,113 | ||||||||||
| Shea Homes, L.P./Shea Homes Funding Corp. | ||||||||||||
4.75%, 2/15/28(9) | 1,423 | 1,222,891 | ||||||||||
| Standard Industries, Inc. | ||||||||||||
5.50%, 2/15/23(9) | 62 | 60,293 | ||||||||||
6.00%, 10/15/25(9) | 2,330 | 2,307,329 | ||||||||||
2.25%, 11/21/26(10) | EUR | 250 | 223,864 | |||||||||
| Taylor Morrison Communities, Inc. | ||||||||||||
5.875%, 6/15/27(9) | 808 | 756,076 | ||||||||||
5.75%, 1/15/28(9) | 1,062 | 957,348 | ||||||||||
| TRI Pointe Group, Inc./TRI Pointe Homes, Inc. | ||||||||||||
5.875%, 6/15/24 | 280 | 262,563 | ||||||||||
| $ | 22,907,733 | |||||||||||
| Business Equipment and Services — 0.8% | ||||||||||||
| Allied Universal Holdco, LLC | ||||||||||||
6.625%, 7/15/26(9) | 939 | $ | 924,331 | |||||||||
9.75%, 7/15/27(9) | 1,121 | 1,064,241 | ||||||||||
| EIG Investors Corp. | ||||||||||||
10.875%, 2/1/24 | 5,445 | 4,675,866 | ||||||||||
| ServiceMaster Co., LLC (The) | ||||||||||||
7.45%, 8/15/27 | 4,075 | 3,600,436 | ||||||||||
| $ | 10,264,874 | |||||||||||
| Cable and Satellite Television — 3.0% | ||||||||||||
| Cablevision Systems Corp. | ||||||||||||
5.875%, 9/15/22 | 1,085 | $ | 1,101,644 | |||||||||
| 25 | See Notes to Financial Statements. |
Eaton Vance
Limited Duration Income Fund
March 31, 2020
Portfolio of Investments — continued
| Security | Principal Amount* (000’s omitted) | Value | ||||||||||
| Cable and Satellite Television (continued) | ||||||||||||
| CCO Holdings, LLC/CCO Holdings Capital Corp. | ||||||||||||
5.875%, 4/1/24(9) | 230 | $ | 236,614 | |||||||||
5.375%, 5/1/25(9) | 3,605 | 3,718,395 | ||||||||||
5.75%, 2/15/26(9) | 1,885 | 1,915,066 | ||||||||||
5.00%, 2/1/28(9) | 1,755 | 1,771,778 | ||||||||||
5.375%, 6/1/29(9) | 595 | 614,724 | ||||||||||
4.75%, 3/1/30(9) | 1,789 | 1,794,456 | ||||||||||
4.50%, 8/15/30(9) | 1,640 | 1,616,425 | ||||||||||
4.50%, 5/1/32(9) | 771 | 756,216 | ||||||||||
| Charter Communications Operating, LLC/Charter Communications Operating Capital | ||||||||||||
4.80%, 3/1/50 | 475 | 497,294 | ||||||||||
| Comcast Corp. | ||||||||||||
3.999%, 11/1/49 | 780 | 925,588 | ||||||||||
| CSC Holdings, LLC | ||||||||||||
6.75%, 11/15/21 | 2,780 | 2,882,165 | ||||||||||
5.25%, 6/1/24 | 355 | 358,105 | ||||||||||
10.875%, 10/15/25(9) | 2,816 | 3,050,080 | ||||||||||
5.50%, 5/15/26(9) | 2,000 | 2,082,635 | ||||||||||
7.50%, 4/1/28(9) | 619 | 663,808 | ||||||||||
6.50%, 2/1/29(9) | 543 | 588,674 | ||||||||||
5.75%, 1/15/30(9) | 5,848 | 5,919,404 | ||||||||||
| DISH DBS Corp. | ||||||||||||
6.75%, 6/1/21 | 410 | 417,979 | ||||||||||
5.875%, 7/15/22 | 2,395 | 2,345,088 | ||||||||||
5.875%, 11/15/24 | 530 | 519,445 | ||||||||||
7.75%, 7/1/26 | 333 | 344,006 | ||||||||||
| TEGNA, Inc. | ||||||||||||
4.625%, 3/15/28(9) | 601 | 531,509 | ||||||||||
5.00%, 9/15/29(9) | 1,012 | 914,595 | ||||||||||
| UPC Holding B.V. | ||||||||||||
5.50%, 1/15/28(9) | 593 | 560,711 | ||||||||||
| UPCB Finance VII, Ltd. | ||||||||||||
3.625%, 6/15/29(10) | EUR | 200 | 201,269 | |||||||||
| Virgin Media Receivables Financing Notes I DAC | ||||||||||||
5.50%, 9/15/24(10) | GBP | 250 | 302,388 | |||||||||
| Virgin Media Secured Finance PLC | ||||||||||||
5.50%, 8/15/26(9) | 1,163 | 1,188,548 | ||||||||||
5.00%, 4/15/27(10) | GBP | 100 | 118,960 | |||||||||
| Ziggo B.V. | ||||||||||||
5.50%, 1/15/27(9) | 1,288 | 1,295,148 | ||||||||||
4.875%, 1/15/30(9) | 802 | 786,684 | ||||||||||
| Ziggo Bond Co., B.V. | ||||||||||||
6.00%, 1/15/27(9) | 745 | 727,841 | ||||||||||
3.375%, 2/28/30(10) | EUR | 230 | 228,545 | |||||||||
| $ | 40,975,787 | |||||||||||
| Security | Principal Amount* (000’s omitted) | Value | ||||||||||
| Capital Goods — 0.0%(8) | ||||||||||||
| Valmont Industries, Inc. | ||||||||||||
5.25%, 10/1/54 | 610 | $ | 605,176 | |||||||||
| $ | 605,176 | |||||||||||
| Chemicals and Plastics — 0.6% | ||||||||||||
| Alpek SAB de CV | ||||||||||||
4.25%, 9/18/29(9) | 310 | $ | 254,439 | |||||||||
| Hexion, Inc. | ||||||||||||
7.875%, 7/15/27(9) | 488 | 418,497 | ||||||||||
| Huntsman International, LLC | ||||||||||||
4.50%, 5/1/29 | 500 | 427,509 | ||||||||||
| Nufarm Australia, Ltd./Nufarm Americas, Inc. | ||||||||||||
5.75%, 4/30/26(9) | 1,296 | 1,143,118 | ||||||||||
| SPCM S.A. | ||||||||||||
4.875%, 9/15/25(9) | 1,356 | 1,291,549 | ||||||||||
| Univar Solutions USA, Inc. | ||||||||||||
5.125%, 12/1/27(9) | 360 | 329,598 | ||||||||||
| Valvoline, Inc. | ||||||||||||
4.25%, 2/15/30(9) | 790 | 739,144 | ||||||||||
| Venator Finance S.a.r.l./Venator Materials, LLC | ||||||||||||
5.75%, 7/15/25(9) | 424 | 333,900 | ||||||||||
| W.R. Grace & Co. | ||||||||||||
5.125%, 10/1/21(9) | 2,170 | 2,211,881 | ||||||||||
| Westlake Chemical Corp. | ||||||||||||
5.00%, 8/15/46 | 710 | 678,643 | ||||||||||
| $ | 7,828,278 | |||||||||||
| Clothing / Textiles — 0.4% | ||||||||||||
| PrestigeBidCo GmbH | ||||||||||||
6.25%, 12/15/23(10) | EUR | 265 | $ | 275,272 | ||||||||
| PVH Corp. | ||||||||||||
7.75%, 11/15/23 | 3,740 | 3,896,311 | ||||||||||
| William Carter Co. (The) | ||||||||||||
5.625%, 3/15/27(9) | 811 | 783,047 | ||||||||||
| $ | 4,954,630 | |||||||||||
| Commercial Services — 0.6% | ||||||||||||
| Ellaktor Value PLC | ||||||||||||
6.375%, 12/15/24(9) | EUR | 455 | $ | 351,282 | ||||||||
6.375%, 12/15/24(10) | EUR | 3,372 | 2,522,694 | |||||||||
| GW B-CR Security Corp. | ||||||||||||
9.50%, 11/1/27(9) | 3,375 | 3,035,644 | ||||||||||
| Intertrust Group B.V. | ||||||||||||
3.375%, 11/15/25(10) | EUR | 340 | 361,051 | |||||||||
| 26 | See Notes to Financial Statements. |
Eaton Vance
Limited Duration Income Fund
March 31, 2020
Portfolio of Investments — continued
| Security | Principal Amount* (000’s omitted) | Value | ||||||||||
| Commercial Services (continued) | ||||||||||||
| IPD 3 B.V. | ||||||||||||
4.50%, 7/15/22(10) | EUR | 475 | $ | 513,579 | ||||||||
| Korn Ferry | ||||||||||||
4.625%, 12/15/27(9) | 355 | 311,069 | ||||||||||
| Loxam SAS | ||||||||||||
3.25%, 1/14/25(10) | EUR | 200 | 177,379 | |||||||||
| Nexi SpA | ||||||||||||
1.75%, 10/31/24(10) | EUR | 200 | 204,142 | |||||||||
| Q-Park Holding I B.V. | ||||||||||||
2.00%, 3/1/27(10) | EUR | 300 | 284,383 | |||||||||
| Sisal Pay SpA | ||||||||||||
3.875%, (3 mo. EURIBOR + 3.875%), 12/17/26(10)(14) | EUR | 110 | 103,060 | |||||||||
| Verisure Holding AB | ||||||||||||
3.50%, 5/15/23(10) | EUR | 140 | 144,410 | |||||||||
| Verisure Midholding AB | ||||||||||||
5.75%, 12/1/23(10) | EUR | 200 | 194,130 | |||||||||
| $ | 8,202,823 | |||||||||||
| Computers — 0.3% | ||||||||||||
| Apple, Inc. | ||||||||||||
3.75%, 11/13/47 | 500 | $ | 600,822 | |||||||||
| DXC Technology Co. | ||||||||||||
4.75%, 4/15/27 | 1,000 | 1,006,036 | ||||||||||
| Presidio Holdings, Inc. | ||||||||||||
4.875%, 2/1/27(9) | 354 | 320,591 | ||||||||||
8.25%, 2/1/28(9) | 1,005 | 893,194 | ||||||||||
| Seagate HDD Cayman | ||||||||||||
5.75%, 12/1/34 | 995 | 924,791 | ||||||||||
| $ | 3,745,434 | |||||||||||
| Conglomerates — 0.3% | ||||||||||||
| Spectrum Brands, Inc. | ||||||||||||
5.75%, 7/15/25 | 3,470 | $ | 3,270,371 | |||||||||
5.00%, 10/1/29(9) | 406 | 348,568 | ||||||||||
| TMS International Holding Corp. | ||||||||||||
7.25%, 8/15/25(9) | 543 | 493,449 | ||||||||||
| $ | 4,112,388 | |||||||||||
| Consumer Products — 0.1% | ||||||||||||
| Central Garden & Pet Co. | ||||||||||||
6.125%, 11/15/23 | 575 | $ | 552,658 | |||||||||
5.125%, 2/1/28 | 285 | 266,060 | ||||||||||
| $ | 818,718 | |||||||||||
| Security | Principal Amount* (000’s omitted) | Value | ||||||||||
| Containers and Glass Products — 0.5% | ||||||||||||
| Ardagh Packaging Finance PLC/Ardagh Holdings USA, Inc. | ||||||||||||
4.25%, 9/15/22(9) | 375 | $ | 377,336 | |||||||||
2.75%, 3/15/24(10) | EUR | 500 | 530,643 | |||||||||
5.25%, 8/15/27(9) | 1,661 | 1,711,744 | ||||||||||
| Berry Global, Inc. | ||||||||||||
6.00%, 10/15/22 | 485 | 483,333 | ||||||||||
| Crown Americas, LLC/Crown Americas Capital Corp. V | ||||||||||||
4.25%, 9/30/26 | 660 | 655,738 | ||||||||||
| Crown Americas, LLC/Crown Americas Capital Corp. VI | ||||||||||||
4.75%, 2/1/26 | 750 | 774,932 | ||||||||||
| Reynolds Group Issuer, Inc./Reynolds Group Issuer, LLC | ||||||||||||
5.125%, 7/15/23(9) | 1,015 | 1,013,726 | ||||||||||
7.00%, 7/15/24(9) | 1,426 | 1,457,194 | ||||||||||
| Smurfit Kappa Acquisitions ULC | ||||||||||||
2.375%, 2/1/24(10) | EUR | 200 | 221,234 | |||||||||
2.875%, 1/15/26(10) | EUR | 100 | 108,611 | |||||||||
| $ | 7,334,491 | |||||||||||
| Cosmetics / Toiletries — 0.0%(8) | ||||||||||||
| Prestige Brands, Inc. | ||||||||||||
5.125%, 1/15/28(9) | 357 | $ | 356,215 | |||||||||
| $ | 356,215 | |||||||||||
| Distribution & Wholesale — 0.1% | ||||||||||||
| LKQ Italia Bondco SpA | ||||||||||||
3.875%, 4/1/24(10) | EUR | 200 | $ | 219,905 | ||||||||
| Parts Europe S.A. | ||||||||||||
4.375%, (3 mo. EURIBOR + 4.375%), 5/1/22(10)(14) | EUR | 447 | 384,273 | |||||||||
| Performance Food Group, Inc. | ||||||||||||
5.50%, 10/15/27(9) | 935 | 874,295 | ||||||||||
| Travis Perkins PLC | ||||||||||||
4.50%, 9/7/23(10) | GBP | 175 | 186,175 | |||||||||
| $ | 1,664,648 | |||||||||||
| Diversified Financial Services — 1.1% | ||||||||||||
| AG Issuer, LLC | ||||||||||||
6.25%, 3/1/28(9) | 1,583 | $ | 1,341,592 | |||||||||
| Arrow Global Finance PLC | ||||||||||||
2.875%, (3 mo. EURIBOR + 2.875%), 4/1/25(10)(14) | EUR | 250 | 243,482 | |||||||||
| 27 | See Notes to Financial Statements. |
Eaton Vance
Limited Duration Income Fund
March 31, 2020
Portfolio of Investments — continued
| Security | Principal Amount* (000’s omitted) | Value | ||||||||||
| Diversified Financial Services (continued) | ||||||||||||
| Autostrade per l’Italia SpA | ||||||||||||
5.875%, 6/9/24 | EUR | 500 | $ | 560,549 | ||||||||
| Barclays PLC | ||||||||||||
5.088% to 6/20/29, 6/20/30(11) | 1,000 | 1,037,960 | ||||||||||
| BrightSphere Investment Group, Inc. | ||||||||||||
4.80%, 7/27/26 | 2,195 | 2,074,486 | ||||||||||
| Cabot Financial Luxembourg S.A. | ||||||||||||
7.50%, 10/1/23(10) | GBP | 100 | 116,648 | |||||||||
| Cabot Financial Luxembourg II S.A. | ||||||||||||
6.375%, (3 mo. EURIBOR + 6.375%), 6/14/24(10)(14) | EUR | 500 | 513,537 | |||||||||
| Discover Bank | ||||||||||||
4.682% to 8/9/23, 8/9/28(11) | 1,000 | 1,019,025 | ||||||||||
| GE Capital UK Funding Unlimited Co. | ||||||||||||
5.875%, 11/4/20 | GBP | 106 | 133,868 | |||||||||
| GEMS MENASA Cayman, Ltd./GEMS Education Delaware, LLC | ||||||||||||
7.125%, 7/31/26(9) | 2,279 | 1,909,813 | ||||||||||
7.125%, 7/31/26(10) | 350 | 293,302 | ||||||||||
| Jefferies Group, LLC/Jefferies Group Capital Finance, Inc. | ||||||||||||
4.15%, 1/23/30 | 1,000 | 959,664 | ||||||||||
| Lincoln Financing S.a.r.l. | ||||||||||||
3.625%, 4/1/24(10) | EUR | 145 | 133,430 | |||||||||
| Louvre Bidco SAS | ||||||||||||
4.25%, 9/30/24(10) | EUR | 390 | 384,614 | |||||||||
| LSF10 Wolverine Investments SCA | ||||||||||||
4.625%, (3 mo. EURIBOR + 4.625%), 3/15/24(10)(14) | EUR | 151 | 156,095 | |||||||||
| UniCredit SpA | ||||||||||||
5.861% to 6/19/27, 6/19/32(9)(11) | 715 | 659,291 | ||||||||||
7.296% to 4/2/29, 4/2/34(9)(11) | 500 | 557,211 | ||||||||||
| Unifin Financiera SAB de CV | ||||||||||||
7.375%, 2/12/26(9) | 620 | 377,302 | ||||||||||
| Vivion Investments S.a.r.l. | ||||||||||||
3.00%, 8/8/24(10) | EUR | 2,300 | 2,021,319 | |||||||||
3.50%, 11/1/25(10) | EUR | 600 | 525,620 | |||||||||
| $ | 15,018,808 | |||||||||||
| Drugs — 2.1% | ||||||||||||
| Bausch Health Americas, Inc. | ||||||||||||
9.25%, 4/1/26(9) | 670 | $ | 703,131 | |||||||||
8.50%, 1/31/27(9) | 3,076 | 3,231,492 | ||||||||||
| Bausch Health Companies, Inc. | ||||||||||||
6.50%, 3/15/22(9) | 2,419 | 2,452,261 | ||||||||||
| Security | Principal Amount* (000’s omitted) | Value | ||||||||||
| Drugs (continued) | ||||||||||||
| Bausch Health Companies, Inc. (continued) | ||||||||||||
5.50%, 3/1/23(9) | 198 | $ | 195,771 | |||||||||
5.875%, 5/15/23(9) | 114 | 113,074 | ||||||||||
7.00%, 3/15/24(9) | 3,810 | 3,929,082 | ||||||||||
6.125%, 4/15/25(9) | 345 | 341,983 | ||||||||||
5.50%, 11/1/25(9) | 955 | 970,810 | ||||||||||
9.00%, 12/15/25(9) | 2,340 | 2,484,378 | ||||||||||
5.75%, 8/15/27(9) | 412 | 426,482 | ||||||||||
7.00%, 1/15/28(9) | 2,092 | 2,181,015 | ||||||||||
5.00%, 1/30/28(9) | 1,051 | 1,002,864 | ||||||||||
7.25%, 5/30/29(9) | 544 | 567,582 | ||||||||||
5.25%, 1/30/30(9) | 2,106 | 1,984,905 | ||||||||||
| Catalent Pharma Solutions, Inc. | ||||||||||||
4.875%, 1/15/26(9) | 2,700 | 2,642,065 | ||||||||||
5.00%, 7/15/27(9) | 656 | 639,961 | ||||||||||
2.375%, 3/1/28(10) | EUR | 1,374 | 1,408,655 | |||||||||
| Jaguar Holding Co. II/Pharmaceutical Product Development, LLC | ||||||||||||
6.375%, 8/1/23(9) | 3,240 | 3,320,903 | ||||||||||
| Nidda Healthcare Holding GmbH | ||||||||||||
3.50%, 9/30/24(10) | EUR | 124 | 127,124 | |||||||||
| $ | 28,723,538 | |||||||||||
| Ecological Services and Equipment — 0.7% | ||||||||||||
| Advanced Disposal Services, Inc. | ||||||||||||
5.625%, 11/15/24(9) | 1,405 | $ | 1,434,849 | |||||||||
| Clean Harbors, Inc. | ||||||||||||
4.875%, 7/15/27(9) | 551 | 542,432 | ||||||||||
5.125%, 7/15/29(9) | 332 | 311,596 | ||||||||||
| Covanta Holding Corp. | ||||||||||||
5.875%, 3/1/24 | 1,900 | 1,807,366 | ||||||||||
5.875%, 7/1/25 | 860 | 798,721 | ||||||||||
| GFL Environmental, Inc. | ||||||||||||
7.00%, 6/1/26(9) | 1,870 | 1,825,976 | ||||||||||
8.50%, 5/1/27(9) | 2,822 | 2,850,925 | ||||||||||
| Waste Pro USA, Inc. | ||||||||||||
5.50%, 2/15/26(9) | 446 | 416,906 | ||||||||||
| $ | 9,988,771 | |||||||||||
| Electric Utilities — 0.4% | ||||||||||||
| Consolidated Edison Co. of New York, Inc. | ||||||||||||
4.125%, 5/15/49 | 400 | $ | 434,978 | |||||||||
| ContourGlobal Power Holdings S.A. | ||||||||||||
4.125%, 8/1/25(10) | EUR | 200 | 195,725 | |||||||||
| 28 | See Notes to Financial Statements. |
Eaton Vance
Limited Duration Income Fund
March 31, 2020
Portfolio of Investments — continued
| Security | Principal Amount* (000’s omitted) | Value | ||||||||||
| Electric Utilities (continued) | ||||||||||||
| Drax Finco PLC | ||||||||||||
4.25%, 5/1/22(10) | GBP | 325 | $ | 378,564 | ||||||||
6.625%, 11/1/25(9) | 806 | 813,057 | ||||||||||
| Edison International | ||||||||||||
3.55%, 11/15/24 | 614 | 611,054 | ||||||||||
| EDP - Energias de Portugal S.A. | ||||||||||||
4.496% to 4/30/24, 4/30/79(10)(11) | EUR | 300 | 342,201 | |||||||||
| MidAmerican Energy Co. | ||||||||||||
3.15%, 4/15/50 | 800 | 815,035 | ||||||||||
| Southern California Edison Co. | ||||||||||||
4.00%, 4/1/47 | 845 | 883,912 | ||||||||||
| TenneT Holding B.V. | ||||||||||||
2.995% to 6/1/24(10)(11)(12) | EUR | 350 | 373,800 | |||||||||
| Virginia Electric & Power Co. | ||||||||||||
4.00%, 1/15/43 | 410 | 440,322 | ||||||||||
| $ | 5,288,648 | |||||||||||
| Electronics / Electrical — 1.6% | ||||||||||||
| Duke Energy Progress, LLC | ||||||||||||
3.45%, 3/15/29 | 1,000 | $ | 1,075,060 | |||||||||
| Enel Finance International NV | ||||||||||||
3.625%, 5/25/27(9) | 2,310 | 2,350,891 | ||||||||||
| Energizer Holdings, Inc. | ||||||||||||
6.375%, 7/15/26(9) | 1,443 | 1,465,439 | ||||||||||
7.75%, 1/15/27(9) | 657 | 682,787 | ||||||||||
| Engie Energia Chile S.A. | ||||||||||||
3.40%, 1/28/30(9) | 960 | 825,120 | ||||||||||
| Entegris, Inc. | ||||||||||||
4.625%, 2/10/26(9) | 517 | 494,019 | ||||||||||
| Go Daddy Operating Co., LLC/GD Finance Co., Inc. | ||||||||||||
5.25%, 12/1/27(9) | 1,249 | 1,267,423 | ||||||||||
| Infor (US), Inc. | ||||||||||||
6.50%, 5/15/22 | 1,760 | 1,724,202 | ||||||||||
| Ingram Micro, Inc. | ||||||||||||
5.45%, 12/15/24 | 1,889 | 1,545,243 | ||||||||||
| Jabil, Inc. | ||||||||||||
3.95%, 1/12/28 | 1,040 | 1,001,269 | ||||||||||
| MTS Systems Corp. | ||||||||||||
5.75%, 8/15/27(9) | 360 | 336,975 | ||||||||||
| Open Text Corp. | ||||||||||||
3.875%, 2/15/28(9) | 1,009 | 953,190 | ||||||||||
| Open Text Holdings, Inc. | ||||||||||||
4.125%, 2/15/30(9) | 883 | 835,208 | ||||||||||
| Perusahaan Listrik Negara PT | ||||||||||||
5.25%, 10/24/42(10) | 3,900 | 3,862,189 | ||||||||||
| Security | Principal Amount* (000’s omitted) | Value | ||||||||||
| Electronics / Electrical (continued) | ||||||||||||
| RWE AG | ||||||||||||
6.625% to 3/30/26, 7/30/75(10)(11) | 200 | $ | 208,780 | |||||||||
| Sensata Technologies, Inc. | ||||||||||||
4.375%, 2/15/30(9) | 627 | 569,050 | ||||||||||
| SS&C Technologies, Inc. | ||||||||||||
5.50%, 9/30/27(9) | 517 | 536,064 | ||||||||||
| Trimble, Inc. | ||||||||||||
4.90%, 6/15/28 | 967 | 1,043,622 | ||||||||||
| Veritas US, Inc./Veritas Bermuda, Ltd. | ||||||||||||
7.50%, 2/1/23(9) | 605 | 537,691 | ||||||||||
| Western Digital Corp. | ||||||||||||
4.75%, 2/15/26 | 793 | 809,058 | ||||||||||
| $ | 22,123,280 | |||||||||||
| Energy — 0.4% | ||||||||||||
| Empresa Electrica Cochrane SpA | ||||||||||||
5.50%, 5/14/27(9) | 2,230 | $ | 2,032,088 | |||||||||
| Enviva Partners, L.P./Enviva Partners Finance Corp. | ||||||||||||
6.50%, 1/15/26(9) | 1,530 | 1,503,225 | ||||||||||
| Sunoco, L.P./Sunoco Finance Corp. | ||||||||||||
4.875%, 1/15/23 | 950 | 925,694 | ||||||||||
5.50%, 2/15/26 | 412 | 360,015 | ||||||||||
| $ | 4,821,022 | |||||||||||
| Entertainment — 0.3% | ||||||||||||
| Banijay Entertainment SASU | ||||||||||||
3.50%, 3/1/25(10) | EUR | 115 | $ | 115,055 | ||||||||
| CPUK Finance, Ltd. | ||||||||||||
4.875%, 2/28/47(10) | GBP | 485 | 486,420 | |||||||||
| Live Nation Entertainment, Inc. | ||||||||||||
4.75%, 10/15/27(9) | 1,226 | 1,104,074 | ||||||||||
| Merlin Entertainments PLC | ||||||||||||
5.75%, 6/15/26(9) | 870 | 742,582 | ||||||||||
| Motion Bondco DAC | ||||||||||||
6.625%, 11/15/27(9) | 284 | 205,900 | ||||||||||
| Pinewood Finance Co., Ltd. | ||||||||||||
3.25%, 9/30/25(10) | GBP | 450 | 521,775 | |||||||||
| Scientific Games International, Inc. | ||||||||||||
7.00%, 5/15/28(9) | 555 | 344,405 | ||||||||||
7.25%, 11/15/29(9) | 148 | 92,419 | ||||||||||
| Speedway Motorsports, LLC/Speedway Funding II, Inc. | ||||||||||||
4.875%, 11/1/27(9) | 871 | 790,433 | ||||||||||
| $ | 4,403,063 | |||||||||||
| 29 | See Notes to Financial Statements. |
Eaton Vance
Limited Duration Income Fund
March 31, 2020
Portfolio of Investments — continued
| Security | Principal Amount* (000’s omitted) | Value | ||||||||||
| Equipment Leasing — 0.1% | ||||||||||||
| Ashtead Capital, Inc. | ||||||||||||
4.125%, 8/15/25(9) | 1,425 | $ | 1,311,000 | |||||||||
4.25%, 11/1/29(9) | 526 | 449,273 | ||||||||||
| $ | 1,760,273 | |||||||||||
| Financial Intermediaries — 1.5% | ||||||||||||
| Alpha Holding S.A. de CV | ||||||||||||
10.00%, 12/19/22(9) | 200 | $ | 139,689 | |||||||||
9.00%, 2/10/25(9) | 765 | 533,587 | ||||||||||
| CIT Group, Inc. | ||||||||||||
6.125%, 3/9/28 | 650 | 616,553 | ||||||||||
| Citigroup, Inc. | ||||||||||||
3.98% to 3/20/29, 3/20/30(11) | 1,200 | 1,285,244 | ||||||||||
| Ford Motor Credit Co., LLC | ||||||||||||
5.596%, 1/7/22 | 410 | 398,725 | ||||||||||
2.645%, (3 mo. USD LIBOR + 1.27%), 3/28/22(14) | 230 | 186,993 | ||||||||||
3.339%, 3/28/22 | 530 | 495,709 | ||||||||||
4.25%, 9/20/22 | 500 | 471,100 | ||||||||||
5.584%, 3/18/24 | 257 | 239,653 | ||||||||||
| Icahn Enterprises, L.P./Icahn Enterprises Finance Corp. | ||||||||||||
6.25%, 2/1/22 | 1,606 | 1,618,591 | ||||||||||
6.375%, 12/15/25 | 820 | 780,029 | ||||||||||
6.25%, 5/15/26 | 1,615 | 1,535,255 | ||||||||||
5.25%, 5/15/27 | 1,614 | 1,503,037 | ||||||||||
| JPMorgan Chase & Co. | ||||||||||||
4.60% to 2/1/25(11)(12) | 1,674 | 1,467,177 | ||||||||||
4.26% to 2/22/47, 2/22/48(11) | 1,035 | 1,248,818 | ||||||||||
Series S, 6.75% to 2/1/24(11)(12) | 3,325 | 3,476,936 | ||||||||||
| KKR Group Finance Co. VI, LLC | ||||||||||||
3.75%, 7/1/29(9) | 1,000 | 1,000,243 | ||||||||||
| MSCI, Inc. | ||||||||||||
3.625%, 9/1/30(9) | 520 | 496,275 | ||||||||||
| Navient Corp. | ||||||||||||
5.00%, 10/26/20 | 995 | 983,508 | ||||||||||
7.25%, 1/25/22 | 215 | 211,192 | ||||||||||
| Synovus Financial Corp. | ||||||||||||
5.90% to 2/7/24, 2/7/29(11) | 1,511 | 1,416,676 | ||||||||||
| $ | 20,104,990 | |||||||||||
| Financial Services — 0.6% | ||||||||||||
| Banco BTG Pactual S.A./Cayman Islands | ||||||||||||
4.50%, 1/10/25(9) | 1,100 | $ | 968,000 | |||||||||
| Security | Principal Amount* (000’s omitted) | Value | ||||||||||
| Financial Services (continued) | ||||||||||||
| Brookfield Finance, Inc. | ||||||||||||
4.70%, 9/20/47 | 1,050 | $ | 990,775 | |||||||||
| Carlyle Finance Subsidiary, LLC | ||||||||||||
3.50%, 9/19/29(9) | 1,000 | 898,296 | ||||||||||
| Debt and Asset Trading Corp. | ||||||||||||
1.00%, 10/10/25(10) | 2,600 | 2,021,500 | ||||||||||
| Nordea Bank Abp | ||||||||||||
4.625% to 9/13/28, 9/13/33(9)(11) | 1,000 | 1,066,091 | ||||||||||
| Sensata Technologies UK Financing Co. PLC | ||||||||||||
6.25%, 2/15/26(9) | 2,735 | 2,695,479 | ||||||||||
| $ | 8,640,141 | |||||||||||
| Food Products — 0.5% | ||||||||||||
| Iceland Bondco PLC | ||||||||||||
4.975%, (3 mo. GBP LIBOR + 4.25%), 7/15/20(9)(14) | GBP | 187 | $ | 230,044 | ||||||||
| JBS USA LUX S.A./JBS USA Finance, Inc. | ||||||||||||
6.75%, 2/15/28(9) | 1,350 | 1,448,617 | ||||||||||
| JBS USA LUX S.A./JBS USA Food Co./JBS USA Finance, Inc. | ||||||||||||
5.50%, 1/15/30(9) | 1,592 | 1,652,576 | ||||||||||
| PepsiCo, Inc. | ||||||||||||
2.85%, 2/24/26 | 750 | 792,370 | ||||||||||
| Post Holdings, Inc. | ||||||||||||
5.00%, 8/15/26(9) | 1,377 | 1,424,782 | ||||||||||
| Smithfield Foods, Inc. | ||||||||||||
2.65%, 10/3/21(9) | 550 | 515,217 | ||||||||||
| Tesco PLC | ||||||||||||
6.125%, 2/24/22 | GBP | 200 | 263,953 | |||||||||
| $ | 6,327,559 | |||||||||||
| Food Service — 0.6% | ||||||||||||
| 1011778 B.C. Unlimited Liability Company/ New Red Finance, Inc. | ||||||||||||
5.00%, 10/15/25(9) | 3,470 | $ | 3,335,520 | |||||||||
3.875%, 1/15/28(9) | 663 | 633,530 | ||||||||||
4.375%, 1/15/28(9) | 1,014 | 942,462 | ||||||||||
| US Foods, Inc. | ||||||||||||
5.875%, 6/15/24(9) | 2,560 | 2,326,387 | ||||||||||
| Yum! Brands, Inc. | ||||||||||||
7.75%, 4/1/25(9) | 304 | 319,960 | ||||||||||
| $ | 7,557,859 | |||||||||||
| 30 | See Notes to Financial Statements. |
Eaton Vance
Limited Duration Income Fund
March 31, 2020
Portfolio of Investments — continued
| Security | Principal Amount* (000’s omitted) | Value | ||||||||||
| Food / Drug Retailers — 0.2% | ||||||||||||
| Albertsons Cos., Inc./Safeway, Inc./ New Albertsons, L.P./Albertsons, LLC | ||||||||||||
5.875%, 2/15/28(9) | 1,004 | $ | 1,027,443 | |||||||||
4.875%, 2/15/30(9) | 1,042 | 1,039,395 | ||||||||||
| $ | 2,066,838 | |||||||||||
| Health Care — 4.3% | ||||||||||||
| Amgen, Inc. | ||||||||||||
2.60%, 8/19/26 | 840 | $ | 864,522 | |||||||||
| Centene Corp. | ||||||||||||
4.75%, 5/15/22 | 870 | 878,996 | ||||||||||
4.75%, 1/15/25 | 2,450 | 2,495,950 | ||||||||||
5.25%, 4/1/25(9) | 2,775 | 2,847,844 | ||||||||||
5.375%, 6/1/26(9) | 2,690 | 2,785,925 | ||||||||||
5.375%, 8/15/26(9) | 1,706 | 1,759,312 | ||||||||||
4.25%, 12/15/27(9) | 1,795 | 1,808,373 | ||||||||||
4.625%, 12/15/29(9) | 1,758 | 1,776,547 | ||||||||||
3.375%, 2/15/30(9) | 1,833 | 1,711,564 | ||||||||||
| Charles River Laboratories International, Inc. | ||||||||||||
5.50%, 4/1/26(9) | 545 | 559,697 | ||||||||||
4.25%, 5/1/28(9) | 502 | 486,664 | ||||||||||
| Encompass Health Corp. | ||||||||||||
4.50%, 2/1/28 | 520 | 512,876 | ||||||||||
4.75%, 2/1/30 | 620 | 614,141 | ||||||||||
| Gilead Sciences, Inc. | ||||||||||||
2.95%, 3/1/27 | 800 | 829,897 | ||||||||||
| Grifols S.A. | ||||||||||||
1.625%, 2/15/25(10) | EUR | 120 | 127,742 | |||||||||
3.20%, 5/1/25(10) | EUR | 550 | 591,897 | |||||||||
| HCA, Inc. | ||||||||||||
5.00%, 3/15/24 | 675 | 700,110 | ||||||||||
5.875%, 2/15/26 | 2,705 | 2,832,000 | ||||||||||
5.375%, 9/1/26 | 1,610 | 1,670,496 | ||||||||||
5.625%, 9/1/28 | 1,990 | 2,093,977 | ||||||||||
5.875%, 2/1/29 | 1,076 | 1,141,905 | ||||||||||
3.50%, 9/1/30 | 1,549 | 1,411,714 | ||||||||||
| Hologic, Inc. | ||||||||||||
4.375%, 10/15/25(9) | 1,665 | 1,659,247 | ||||||||||
| IQVIA, Inc. | ||||||||||||
3.25%, 3/15/25(10) | EUR | 300 | 325,082 | |||||||||
5.00%, 10/15/26(9) | 850 | 872,922 | ||||||||||
5.00%, 5/15/27 (9) | 577 | 594,003 | ||||||||||
2.25%, 1/15/28(10) | EUR | 250 | 254,086 | |||||||||
| Kinetic Concepts, Inc./KCI USA, Inc. | ||||||||||||
12.50%, 11/1/21(9) | 2,480 | 2,501,576 | ||||||||||
| Security | Principal Amount* (000’s omitted) | Value | ||||||||||
| Health Care (continued) | ||||||||||||
| LifePoint Health, Inc. | ||||||||||||
4.375%, 2/15/27(9) | 1,408 | $ | 1,336,896 | |||||||||
| MPH Acquisition Holdings, LLC | ||||||||||||
7.125%, 6/1/24(9) | 9,217 | 8,088,194 | ||||||||||
| RegionalCare Hospital Partners Holdings, Inc./ LifePoint Health, Inc. | ||||||||||||
9.75%, 12/1/26(9) | 2,226 | 2,125,218 | ||||||||||
| Select Medical Corp. | ||||||||||||
6.25%, 8/15/26(9) | 1,312 | 1,319,223 | ||||||||||
| Surgery Center Holdings, Inc. | ||||||||||||
6.75%, 7/1/25(9) | 82 | 59,757 | ||||||||||
10.00%, 4/15/27(9) | 368 | 260,744 | ||||||||||
| Synlab Bondco PLC | ||||||||||||
3.50%, (3 mo. EURIBOR + 3.50%), 7/1/22(10)(14) | EUR | 580 | 600,513 | |||||||||
| Team Health Holdings, Inc. | ||||||||||||
6.375%, 2/1/25(9) | 703 | 252,198 | ||||||||||
| Teleflex, Inc. | ||||||||||||
4.625%, 11/15/27 | 1,055 | 1,059,695 | ||||||||||
| Tenet Healthcare Corp. | ||||||||||||
8.125%, 4/1/22 | 2,040 | 1,938,694 | ||||||||||
6.75%, 6/15/23 | 325 | 301,845 | ||||||||||
4.625%, 9/1/24(9) | 268 | 258,030 | ||||||||||
4.875%, 1/1/26(9) | 1,607 | 1,536,694 | ||||||||||
5.125%, 11/1/27(9) | 1,607 | 1,540,711 | ||||||||||
| UnitedHealth Group, Inc. | ||||||||||||
3.375%, 4/15/27 | 475 | 509,112 | ||||||||||
3.75%, 10/15/47 | 650 | 729,914 | ||||||||||
| $ | 58,626,503 | |||||||||||
| Home Furnishings — 0.1% | ||||||||||||
| Harman International Industries, Inc. | ||||||||||||
4.15%, 5/15/25 | 940 | $ | 976,002 | |||||||||
| $ | 976,002 | |||||||||||
| Homebuilders / Real Estate — 0.0%(8) | ||||||||||||
| M/I Homes, Inc. | ||||||||||||
4.95%, 2/1/28(9) | 459 | $ | 393,019 | |||||||||
| $ | 393,019 | |||||||||||
| Industrial Equipment — 0.1% | ||||||||||||
| Colfax Escrow Corp. | ||||||||||||
6.00%, 2/15/24(9) | 478 | $ | 478,600 | |||||||||
6.375%, 2/15/26(9) | 780 | 771,225 | ||||||||||
| 31 | See Notes to Financial Statements. |
Eaton Vance
Limited Duration Income Fund
March 31, 2020
Portfolio of Investments — continued
| Security | Principal Amount* (000’s omitted) | Value | ||||||||||
| Industrial Equipment (continued) | ||||||||||||
| Orano S.A. | ||||||||||||
4.875%, 9/23/24 | EUR | 200 | $ | 227,151 | ||||||||
| Welbilt, Inc. | ||||||||||||
9.50%, 2/15/24 | 414 | 355,521 | ||||||||||
| $ | 1,832,497 | |||||||||||
| Insurance — 1.0% | ||||||||||||
| Alliant Holdings Intermediate, LLC/Alliant Holdings Co-Issuer | ||||||||||||
6.75%, 10/15/27(9) | 1,857 | $ | 1,749,201 | |||||||||
| AmWINS Group, Inc. | ||||||||||||
7.75%, 7/1/26(9) | 1,335 | 1,314,691 | ||||||||||
| Athene Holding, Ltd. | ||||||||||||
4.125%, 1/12/28 | 1,000 | 905,754 | ||||||||||
| Galaxy Finco, Ltd. | ||||||||||||
9.25%, 7/31/27(10) | GBP | 575 | 651,714 | |||||||||
| GTCR AP Finance, Inc. | ||||||||||||
8.00%, 5/15/27(9) | 1,078 | 1,000,969 | ||||||||||
| Hub International, Ltd. | ||||||||||||
7.00%, 5/1/26(9) | 2,352 | 2,346,296 | ||||||||||
| Metropolitan Life Global Funding I | ||||||||||||
3.45%, 12/18/26(9) | 975 | 1,028,157 | ||||||||||
| Radian Group, Inc. | ||||||||||||
4.875%, 3/15/27 | 1,032 | 1,025,336 | ||||||||||
| USI, Inc. | ||||||||||||
6.875%, 5/1/25(9) | 3,948 | 3,701,132 | ||||||||||
| $ | 13,723,250 | |||||||||||
| Internet Software & Services — 0.9% | ||||||||||||
| CDK Global, Inc. | ||||||||||||
5.25%, 5/15/29(9) | 531 | $ | 543,611 | |||||||||
| Netflix, Inc. | ||||||||||||
5.50%, 2/15/22 | 1,825 | 1,870,625 | ||||||||||
4.875%, 4/15/28 | 1,665 | 1,710,912 | ||||||||||
5.875%, 11/15/28 | 1,810 | 1,946,746 | ||||||||||
5.375%, 11/15/29(9) | 1,000 | 1,050,550 | ||||||||||
3.625%, 6/15/30(10) | EUR | 500 | 541,846 | |||||||||
4.875%, 6/15/30(9) | 1,300 | 1,326,910 | ||||||||||
| Oracle Corp. | ||||||||||||
3.25%, 11/15/27 | 1,180 | 1,218,713 | ||||||||||
| Riverbed Technology, Inc. | ||||||||||||
8.875%, 3/1/23(9) | 2,199 | 1,407,360 | ||||||||||
| Science Applications International Corp. | ||||||||||||
4.875%, 4/1/28(9) | 362 | 349,556 | ||||||||||
| $ | 11,966,829 | |||||||||||
| Security | Principal Amount* (000’s omitted) | Value | ||||||||||
| Leisure Goods / Activities / Movies — 0.6% | ||||||||||||
| AMC Entertainment Holdings, Inc. | ||||||||||||
5.875%, 11/15/26 | 574 | $ | 242,209 | |||||||||
6.125%, 5/15/27 | 2,545 | 1,075,453 | ||||||||||
| Cinemark USA, Inc. | ||||||||||||
4.875%, 6/1/23 | 2,730 | 2,061,068 | ||||||||||
| NCL Corp, Ltd. | ||||||||||||
3.625%, 12/15/24(9) | 1,065 | 687,245 | ||||||||||
| Sabre GLBL, Inc. | ||||||||||||
5.375%, 4/15/23(9) | 855 | 787,673 | ||||||||||
| Viking Cruises, Ltd. | ||||||||||||
6.25%, 5/15/25(9) | 1,690 | 1,096,379 | ||||||||||
5.875%, 9/15/27(9) | 3,200 | 1,890,112 | ||||||||||
| WMG Acquisition Corp. | ||||||||||||
3.625%, 10/15/26(10) | EUR | 165 | 186,286 | |||||||||
| $ | 8,026,425 | |||||||||||
| Lodging and Casinos — 2.0% | ||||||||||||
| Caesars Resort Collection, LLC/CRC Finco, Inc. | ||||||||||||
5.25%, 10/15/25(9) | 3,279 | $ | 2,392,686 | |||||||||
| Eldorado Resorts, Inc. | ||||||||||||
6.00%, 4/1/25 | 930 | 842,817 | ||||||||||
| ESH Hospitality, Inc. | ||||||||||||
5.25%, 5/1/25(9) | 1,260 | 1,066,281 | ||||||||||
4.625%, 10/1/27(9) | 1,250 | 981,938 | ||||||||||
| Gateway Casinos & Entertainment, Ltd. | ||||||||||||
8.25%, 3/1/24(9) | 2,255 | 1,981,570 | ||||||||||
| Golden Nugget, Inc. | ||||||||||||
6.75%, 10/15/24(9) | 1,665 | 1,061,204 | ||||||||||
8.75%, 10/1/25(9) | 1,052 | 550,953 | ||||||||||
| Hilton Domestic Operating Co., Inc. | ||||||||||||
4.25%, 9/1/24 | 1,410 | 1,330,680 | ||||||||||
| MGM Growth Properties Operating Partnership, L.P./MGP Finance Co-Issuer, Inc. | ||||||||||||
5.625%, 5/1/24 | 480 | 463,802 | ||||||||||
4.50%, 9/1/26 | 895 | 749,086 | ||||||||||
5.75%, 2/1/27 | 573 | 500,659 | ||||||||||
| MGM Resorts International | ||||||||||||
7.75%, 3/15/22 | 2,300 | 2,290,478 | ||||||||||
5.75%, 6/15/25 | 948 | 855,542 | ||||||||||
| NH Hotel Group S.A. | ||||||||||||
3.75%, 10/1/23(10) | EUR | 225 | 203,524 | |||||||||
| RHP Hotel Properties, L.P./RHP Finance Corp. | ||||||||||||
5.00%, 4/15/23 | 798 | 629,419 | ||||||||||
| 32 | See Notes to Financial Statements. |
Eaton Vance
Limited Duration Income Fund
March 31, 2020
Portfolio of Investments — continued
| Security | Principal Amount* (000’s omitted) | Value | ||||||||||
| Lodging and Casinos (continued) | ||||||||||||
| Stars Group Holdings B.V./Stars Group US Co-Borrower, LLC | ||||||||||||
7.00%, 7/15/26(9) | 3,930 | $ | 3,716,797 | |||||||||
| Studio City Co., Ltd. | ||||||||||||
7.25%, 11/30/21(9) | 845 | 825,607 | ||||||||||
| TVL Finance PLC | ||||||||||||
6.10%, (3 mo. GBP LIBOR + 5.375%), 7/15/25(10)(14) | GBP | 300 | 285,062 | |||||||||
| VICI Properties, L.P./VICI Note Co., Inc. | ||||||||||||
4.25%, 12/1/26(9) | 1,653 | 1,525,727 | ||||||||||
3.75%, 2/15/27(9) | 1,108 | 1,050,523 | ||||||||||
4.625%, 12/1/29(9) | 1,574 | 1,441,076 | ||||||||||
4.125%, 8/15/30(9) | 1,108 | 1,056,063 | ||||||||||
| Wynn Las Vegas, LLC/Wynn Las Vegas Capital Corp. | ||||||||||||
5.25%, 5/15/27(9) | 1,754 | 1,593,948 | ||||||||||
| Wynn Resorts Finance, LLC/Wynn Resorts Capital Corp. | ||||||||||||
5.125%, 10/1/29(9) | 453 | 414,778 | ||||||||||
| $ | 27,810,220 | |||||||||||
| Machinery — 0.2% | ||||||||||||
| Cloud Crane, LLC | ||||||||||||
10.125%, 8/1/24(9) | 860 | $ | 682,630 | |||||||||
| Granite US Holdings Corp. | ||||||||||||
11.00%, 10/1/27(9) | 514 | 445,359 | ||||||||||
| nVent Finance S.a.r.l. | ||||||||||||
4.55%, 4/15/28 | 1,500 | 1,676,876 | ||||||||||
| $ | 2,804,865 | |||||||||||
| Manufacturing — 0.2% | ||||||||||||
| Novelis Corp. | ||||||||||||
5.875%, 9/30/26(9) | 1,530 | $ | 1,512,149 | |||||||||
4.75%, 1/30/30(9) | 1,259 | 1,127,592 | ||||||||||
| $ | 2,639,741 | |||||||||||
| Media — 0.3% | ||||||||||||
| Discovery Communications, LLC | ||||||||||||
4.125%, 5/15/29 | 1,400 | $ | 1,359,909 | |||||||||
| MDC Partners, Inc. | ||||||||||||
6.50%, 5/1/24(9) | 131 | 99,232 | ||||||||||
| Nexstar Escrow, Inc. | ||||||||||||
5.625%, 7/15/27(9) | 1,312 | 1,289,762 | ||||||||||
| Scripps Escrow, Inc. | ||||||||||||
5.875%, 7/15/27(9) | 1,036 | 917,430 | ||||||||||
| Security | Principal Amount* (000’s omitted) | Value | ||||||||||
| Media (continued) | ||||||||||||
| Telenet Finance Luxembourg S.a.r.l. | ||||||||||||
3.50%, 3/1/28(10) | EUR | 200 | $ | 208,448 | ||||||||
| TWDC Enterprises 18 Corp. | ||||||||||||
3.00%, 7/30/46 | 495 | 502,155 | ||||||||||
| $ | 4,376,936 | |||||||||||
| Metals / Mining — 0.7% | ||||||||||||
| Alcoa Nederland Holding B.V. | ||||||||||||
7.00%, 9/30/26(9) | 200 | $ | 187,110 | |||||||||
6.125%, 5/15/28(9) | 569 | 520,948 | ||||||||||
| Arconic Corp. | ||||||||||||
6.125%, 2/15/28(9) | 2,448 | 2,521,440 | ||||||||||
| Cleveland-Cliffs, Inc. | ||||||||||||
6.75%, 3/15/26(9) | 1,722 | 1,531,504 | ||||||||||
| Compass Minerals International, Inc. | ||||||||||||
6.75%, 12/1/27(9) | 3,005 | 2,729,442 | ||||||||||
| Constellium N.V. | ||||||||||||
4.25%, 2/15/26(10) | EUR | 150 | 124,655 | |||||||||
5.875%, 2/15/26(9) | 837 | 734,530 | ||||||||||
| Freeport-McMoRan, Inc. | ||||||||||||
5.45%, 3/15/43 | 1,258 | 1,135,722 | ||||||||||
| $ | 9,485,351 | |||||||||||
| Nonferrous Metals / Minerals — 0.4% | ||||||||||||
| Eldorado Gold Corp. | ||||||||||||
9.50%, 6/1/24(9) | 537 | $ | 533,641 | |||||||||
| First Quantum Minerals, Ltd. | ||||||||||||
7.25%, 4/1/23(9) | 1,332 | 1,148,857 | ||||||||||
7.50%, 4/1/25(9) | 1,615 | 1,354,089 | ||||||||||
6.875%, 3/1/26(9) | 637 | 514,728 | ||||||||||
| New Gold, Inc. | ||||||||||||
6.25%, 11/15/22(9) | 1,097 | 1,073,667 | ||||||||||
6.375%, 5/15/25(9) | 912 | 855,565 | ||||||||||
| $ | 5,480,547 | |||||||||||
| Oil and Gas — 4.1% | ||||||||||||
| Aker BP ASA | ||||||||||||
6.00%, 7/1/22(9) | 150 | $ | 134,400 | |||||||||
4.75%, 6/15/24(9) | 1,106 | 930,518 | ||||||||||
5.875%, 3/31/25(9) | 675 | 599,242 | ||||||||||
| AmeriGas Partners, L.P./AmeriGas Finance Corp. | ||||||||||||
5.625%, 5/20/24 | 216 | 202,764 | ||||||||||
5.50%, 5/20/25 | 880 | 816,174 | ||||||||||
| 33 | See Notes to Financial Statements. |
Eaton Vance
Limited Duration Income Fund
March 31, 2020
Portfolio of Investments — continued
| Security | Principal Amount* (000’s omitted) | Value | ||||||||
| Oil and Gas (continued) | ||||||||||
| Antero Resources Corp. | ||||||||||
5.375%, 11/1/21 | 2,715 | $ | 1,989,986 | |||||||
| Archrock Partners, L.P./Archrock Partners Finance Corp. | ||||||||||
6.25%, 4/1/28(9) | 756 | 527,310 | ||||||||
| Ascent Resources Utica Holdings, LLC/ARU Finance Corp. | ||||||||||
7.00%, 11/1/26(9) | 1,951 | 577,579 | ||||||||
| Berry Petroleum Co., LLC | ||||||||||
7.00%, 2/15/26(9) | 722 | 294,968 | ||||||||
| Buckeye Partners L.P. | ||||||||||
4.50%, 3/1/28(9) | 921 | 762,127 | ||||||||
| Centennial Resource Production, LLC | ||||||||||
5.375%, 1/15/26(9) | 2,175 | 540,580 | ||||||||
6.875%, 4/1/27(9) | 2,055 | 517,793 | ||||||||
| CGG Holding US, Inc. | ||||||||||
9.00%, 5/1/23(9) | 200 | 169,200 | ||||||||
| Cheniere Corpus Christi Holdings, LLC | ||||||||||
7.00%, 6/30/24 | 244 | 214,722 | ||||||||
5.875%, 3/31/25 | 1,536 | 1,401,660 | ||||||||
| Cheniere Energy Partners, L.P. | ||||||||||
5.25%, 10/1/25 | 1,590 | 1,490,577 | ||||||||
5.625%, 10/1/26 | 1,265 | 1,183,562 | ||||||||
4.50%, 10/1/29(9) | 1,722 | 1,542,137 | ||||||||
| CrownRock, L.P./CrownRock Finance, Inc. | ||||||||||
5.625%, 10/15/25(9) | 3,677 | 1,939,507 | ||||||||
| CVR Energy, Inc. | ||||||||||
5.75%, 2/15/28(9) | 1,280 | 966,400 | ||||||||
| Endeavor Energy Resources, L.P./EER Finance, Inc. | ||||||||||
5.50%, 1/30/26(9) | 1,045 | 728,550 | ||||||||
5.75%, 1/30/28(9) | 1,390 | 952,914 | ||||||||
| Energy Transfer Operating, L.P. | ||||||||||
5.875%, 1/15/24 | 875 | 828,394 | ||||||||
Series A, 6.25% to 2/15/23(11)(12) | 1,045 | 519,099 | ||||||||
| Eni SpA | ||||||||||
4.75%, 9/12/28(9) | 1,000 | 997,132 | ||||||||
| EP Energy, LLC/Everest Acquisition Finance, Inc. | ||||||||||
7.75%, 5/15/26(7)(9) | 480 | 69,600 | ||||||||
| EQT Corp. | ||||||||||
6.125%, 2/1/25 | 954 | 741,830 | ||||||||
| Extraction Oil & Gas, Inc. | ||||||||||
7.375%, 5/15/24(9) | 689 | 128,323 | ||||||||
5.625%, 2/1/26(9) | 1,821 | 316,021 | ||||||||
| Gran Tierra Energy International Holdings, Ltd. | ||||||||||
6.25%, 2/15/25(9) | 550 | 142,313 | ||||||||
| Security | Principal Amount* (000’s omitted) | Value | ||||||||
| Oil and Gas (continued) | ||||||||||
| Gran Tierra Energy, Inc. | ||||||||||
7.75%, 5/23/27(9) | 405 | $ | 105,806 | |||||||
| Great Western Petroleum, LLC/Great Western Finance Corp. | ||||||||||
9.00%, 9/30/21(9) | 2,423 | 1,571,800 | ||||||||
| Hilcorp Energy I, L.P./Hilcorp Finance Co. | ||||||||||
5.75%, 10/1/25(9) | 113 | 52,968 | ||||||||
6.25%, 11/1/28(9) | 2,325 | 1,042,861 | ||||||||
| Ithaca Energy North Sea PLC | ||||||||||
9.375%, 7/15/24(9) | 200 | 95,494 | ||||||||
| Jagged Peak Energy, LLC | ||||||||||
5.875%, 5/1/26 | 507 | 382,743 | ||||||||
| Laredo Petroleum, Inc. | ||||||||||
9.50%, 1/15/25 | 414 | 167,153 | ||||||||
10.125%, 1/15/28 | 622 | 241,025 | ||||||||
| Matador Resources Co. | ||||||||||
5.875%, 9/15/26 | 2,220 | 637,639 | ||||||||
| MEG Energy Corp. | ||||||||||
7.125%, 2/1/27(9) | 1,030 | 520,150 | ||||||||
| Moss Creek Resources Holdings, Inc. | ||||||||||
7.50%, 1/15/26(9) | 1,915 | 571,709 | ||||||||
| Nabors Industries, Ltd. | ||||||||||
7.25%, 1/15/26(9) | 617 | 214,407 | ||||||||
7.50%, 1/15/28(9) | 665 | 217,787 | ||||||||
| National Oilwell Varco, Inc. | ||||||||||
3.60%, 12/1/29 | 1,000 | 751,634 | ||||||||
| Neptune Energy Bondco PLC | ||||||||||
6.625%, 5/15/25(9) | 3,725 | 2,113,826 | ||||||||
6.625%, 5/15/25(10) | 450 | 255,361 | ||||||||
| Nine Energy Service, Inc. | ||||||||||
8.75%, 11/1/23(9) | 500 | 129,925 | ||||||||
| Parsley Energy, LLC/Parsley Finance Corp. | ||||||||||
5.375%, 1/15/25(9) | 1,240 | 967,138 | ||||||||
5.25%, 8/15/25(9) | 1,170 | 899,432 | ||||||||
5.625%, 10/15/27(9) | 923 | 655,838 | ||||||||
| Patterson-UTI Energy, Inc. | ||||||||||
3.95%, 2/1/28 | 1,310 | 515,084 | ||||||||
| PBF Holding Co., LLC/PBF Finance Corp. | ||||||||||
7.25%, 6/15/25 | 3,219 | 2,177,831 | ||||||||
6.00%, 2/15/28(9) | 1,823 | 1,239,640 | ||||||||
| Petroleos Mexicanos | ||||||||||
6.49%, 1/23/27(10) | 1,051 | 779,054 | ||||||||
6.50%, 3/13/27 | 3,036 | 2,272,879 | ||||||||
5.35%, 2/12/28 | 429 | 299,675 | ||||||||
5.95%, 1/28/31(10) | 796 | 551,310 | ||||||||
| 34 | See Notes to Financial Statements. |
Eaton Vance
Limited Duration Income Fund
March 31, 2020
Portfolio of Investments — continued
| Security | Principal Amount* (000’s omitted) | Value | ||||||||||
| Oil and Gas (continued) | ||||||||||||
| Precision Drilling Corp. | ||||||||||||
6.50%, 12/15/21 | 41 | $ | 31,110 | |||||||||
7.75%, 12/15/23 | 216 | 88,289 | ||||||||||
7.125%, 1/15/26(9) | 500 | 169,271 | ||||||||||
| Sabine Pass Liquefaction, LLC | ||||||||||||
5.625%, 2/1/21 | 935 | 920,157 | ||||||||||
| Seven Generations Energy, Ltd. | ||||||||||||
6.875%, 6/30/23(9) | 1,250 | 868,306 | ||||||||||
5.375%, 9/30/25(9) | 1,710 | 953,274 | ||||||||||
| Shelf Drilling Holdings, Ltd. | ||||||||||||
8.25%, 2/15/25(9) | 2,715 | 1,365,645 | ||||||||||
| Shell International Finance B.V. | ||||||||||||
2.375%, 11/7/29 | 500 | 498,289 | ||||||||||
3.75%, 9/12/46 | 400 | 430,180 | ||||||||||
| SM Energy Co. | ||||||||||||
6.125%, 11/15/22 | 561 | 242,107 | ||||||||||
5.00%, 1/15/24 | 58 | 17,617 | ||||||||||
5.625%, 6/1/25 | 529 | 148,784 | ||||||||||
6.75%, 9/15/26 | 1,773 | 547,046 | ||||||||||
6.625%, 1/15/27 | 536 | 159,745 | ||||||||||
| Tallgrass Energy Partners, L.P./Tallgrass Energy Finance Corp. | ||||||||||||
5.50%, 1/15/28(9) | 612 | 322,504 | ||||||||||
| Targa Resources Partners, L.P./Targa Resources Partners Finance Corp. | ||||||||||||
5.875%, 4/15/26 | 985 | 825,550 | ||||||||||
6.50%, 7/15/27 | 566 | 486,760 | ||||||||||
| Tervita Corp. | ||||||||||||
7.625%, 12/1/21(9) | 2,381 | 1,682,772 | ||||||||||
| Transocean Guardian, Ltd. | ||||||||||||
5.875%, 1/15/24(9) | 885 | 714,692 | ||||||||||
| Transocean Pontus, Ltd. | ||||||||||||
6.125%, 8/1/25(9) | 605 | 494,876 | ||||||||||
| Transocean Poseidon, Ltd. | ||||||||||||
6.875%, 2/1/27(9) | 294 | 240,188 | ||||||||||
| Transocean, Inc. | ||||||||||||
7.50%, 1/15/26(9) | 523 | 249,454 | ||||||||||
| Williams Cos., Inc. (The) | ||||||||||||
3.70%, 1/15/23 | 1,259 | 1,165,446 | ||||||||||
4.55%, 6/24/24 | 1,117 | 1,019,769 | ||||||||||
5.75%, 6/24/44 | 790 | 829,128 | ||||||||||
| WPX Energy, Inc. | ||||||||||||
5.25%, 10/15/27 | 371 | 206,109 | ||||||||||
| $ | 56,332,619 | |||||||||||
| Security | Principal Amount* (000’s omitted) | Value | ||||||||||
| Packaging & Containers — 0.6% | ||||||||||||
| ARD Finance S.A. | ||||||||||||
5.00%, (5.00% cash or 5.75% PIK), 6/30/27(10)(13) | EUR | 172 | $ | 147,921 | ||||||||
6.50%, (6.50% cash or 7.25% PIK), 6/30/27(9)(13) | 3,913 | 3,382,593 | ||||||||||
| Silgan Holdings, Inc. | ||||||||||||
2.25%, 6/1/28(10) | EUR | 1,070 | 1,051,471 | |||||||||
| Smurfit Kappa Treasury ULC | ||||||||||||
1.50%, 9/15/27(10) | EUR | 145 | 149,526 | |||||||||
| Trivium Packaging Finance B.V. | ||||||||||||
3.75%, 8/15/26(10) | EUR | 280 | 283,319 | |||||||||
5.50%, 8/15/26(9) | 779 | 779,484 | ||||||||||
8.50%, 8/15/27(9) | 2,858 | 2,888,152 | ||||||||||
| $ | 8,682,466 | |||||||||||
| Pharmaceuticals — 0.3% | ||||||||||||
| Cheplapharm Arzneimittel GmbH | ||||||||||||
3.50%, 2/11/27(10) | EUR | 300 | $ | 306,054 | ||||||||
| CVS Health Corp. | ||||||||||||
4.78%, 3/25/38 | 1,080 | 1,190,430 | ||||||||||
| Diocle SpA | ||||||||||||
3.875%, (3 mo. EURIBOR + 3.875%), 6/30/26(10)(14) | EUR | 140 | 138,047 | |||||||||
| Pfizer, Inc. | ||||||||||||
2.95%, 3/15/24 | 1,000 | 1,038,824 | ||||||||||
| Rossini S.a.r.l. | ||||||||||||
3.875%, (3 mo. EURIBOR + 3.875%), 10/30/25(10)(14) | EUR | 300 | 291,039 | |||||||||
| Teva Pharmaceutical Finance Netherlands III B.V. | ||||||||||||
6.00%, 4/15/24 | 864 | 854,276 | ||||||||||
| $ | 3,818,670 | |||||||||||
| Pipelines — 0.3% | ||||||||||||
| Antero Midstream Partners, L.P./Antero Midstream Finance Corp. | ||||||||||||
5.75%, 3/1/27(9) | 1,378 | $ | 892,359 | |||||||||
| Crestwood Midstream Partners L.P./Crestwood Midstream Finance Corp. | ||||||||||||
5.625%, 5/1/27(9) | 1,060 | 590,722 | ||||||||||
| EnLink Midstream, LLC | ||||||||||||
5.375%, 6/1/29 | 653 | 344,110 | ||||||||||
| Georgian Oil and Gas Corp. JSC | ||||||||||||
6.75%, 4/26/21(10) | 615 | 596,316 | ||||||||||
| NGPL PipeCo, LLC | ||||||||||||
4.375%, 8/15/22(9) | 340 | 324,798 | ||||||||||
| Plains All American Pipeline, L.P. | ||||||||||||
Series B, 6.125% to 11/15/22(11)(12) | 1,850 | 928,228 | ||||||||||
| 35 | See Notes to Financial Statements. |
Eaton Vance
Limited Duration Income Fund
March 31, 2020
Portfolio of Investments — continued
| Security | Principal Amount* (000’s omitted) | Value | ||||||||||
| Pipelines (continued) | ||||||||||||
| TransCanada PipeLines, Ltd. | ||||||||||||
4.75%, 5/15/38 | 390 | $ | 387,662 | |||||||||
| $ | 4,064,195 | |||||||||||
| Publishing — 0.1% | ||||||||||||
| Laureate Education, Inc. | ||||||||||||
8.25%, 5/1/25(9) | 1,175 | $ | 1,177,902 | |||||||||
| $ | 1,177,902 | |||||||||||
| Radio and Television — 1.5% | ||||||||||||
| Clear Channel Worldwide Holdings, Inc. | ||||||||||||
5.125%, 8/15/27(9) | 1,276 | $ | 1,201,928 | |||||||||
| Diamond Sports Group, LLC/Diamond Sports Finance Co. | ||||||||||||
5.375%, 8/15/26(9) | 2,646 | 2,164,804 | ||||||||||
6.625%, 8/15/27(9) | 1,346 | 907,608 | ||||||||||
| iHeartCommunications, Inc. | ||||||||||||
6.375%, 5/1/26 | 179 | 170,418 | ||||||||||
8.375%, 5/1/27 | 2,770 | 2,374,178 | ||||||||||
| Nielsen Co. Luxembourg S.a.r.l. (The) | ||||||||||||
5.50%, 10/1/21(9) | 1,250 | 1,233,437 | ||||||||||
| Sinclair Television Group, Inc. | ||||||||||||
5.50%, 3/1/30(9) | 1,040 | 866,372 | ||||||||||
| Sirius XM Radio, Inc. | ||||||||||||
4.625%, 7/15/24(9) | 1,595 | 1,628,790 | ||||||||||
5.00%, 8/1/27(9) | 1,609 | 1,641,904 | ||||||||||
| Terrier Media Buyer, Inc. | ||||||||||||
8.875%, 12/15/27(9) | 8,896 | 7,539,360 | ||||||||||
| $ | 19,728,799 | |||||||||||
| Real Estate Investment Trusts (REITs) — 0.2% | ||||||||||||
| Consus Real Estate AG | ||||||||||||
9.625%, 5/15/24(10) | EUR | 250 | $ | 230,230 | ||||||||
| EPR Properties | ||||||||||||
3.75%, 8/15/29 | 1,275 | 956,428 | ||||||||||
| Service Properties Trust | ||||||||||||
4.75%, 10/1/26 | 1,990 | 1,512,729 | ||||||||||
| $ | 2,699,387 | |||||||||||
| Retail — 0.2% | ||||||||||||
| eG Global Finance PLC | ||||||||||||
6.25%, 10/30/25(10) | EUR | 100 | $ | 88,766 | ||||||||
| Security | Principal Amount* (000’s omitted) | Value | ||||||||||
| Retail (continued) | ||||||||||||
| Newmark Group, Inc. | ||||||||||||
6.125%, 11/15/23 | 2,126 | $ | 2,166,196 | |||||||||
| $ | 2,254,962 | |||||||||||
| Retailers (Except Food and Drug) — 0.5% | ||||||||||||
| Asbury Automotive Group, Inc. | ||||||||||||
4.50%, 3/1/28(9) | 136 | $ | 116,620 | |||||||||
4.75%, 3/1/30(9) | 190 | 162,925 | ||||||||||
| Best Buy Co., Inc. | ||||||||||||
4.45%, 10/1/28 | 1,000 | 1,028,405 | ||||||||||
| L Brands, Inc. | ||||||||||||
6.875%, 11/1/35 | 1,336 | 995,754 | ||||||||||
6.75%, 7/1/36 | 223 | 162,299 | ||||||||||
7.60%, 7/15/37 | 254 | 157,558 | ||||||||||
| Macy’s Retail Holdings, Inc. | ||||||||||||
4.30%, 2/15/43 | 1,252 | 775,286 | ||||||||||
| Murphy Oil USA, Inc. | ||||||||||||
5.625%, 5/1/27 | 560 | 553,472 | ||||||||||
4.75%, 9/15/29 | 728 | 686,540 | ||||||||||
| Nordstrom, Inc. | ||||||||||||
4.375%, 4/1/30 | 158 | 127,186 | ||||||||||
5.00%, 1/15/44 | 775 | 544,954 | ||||||||||
| Tapestry, Inc. | ||||||||||||
4.125%, 7/15/27 | 948 | 810,056 | ||||||||||
| Walmart, Inc. | ||||||||||||
3.55%, 6/26/25 | 1,000 | 1,093,665 | ||||||||||
| $ | 7,214,720 | |||||||||||
| Road & Rail — 0.1% | ||||||||||||
| Watco Cos., LLC/Watco Finance Corp. | ||||||||||||
6.375%, 4/1/23(9) | 1,990 | $ | 1,957,653 | |||||||||
| $ | 1,957,653 | |||||||||||
| Software and Services — 0.5% | ||||||||||||
| Gartner, Inc. | ||||||||||||
5.125%, 4/1/25(9) | 795 | $ | 782,085 | |||||||||
| IHS Markit, Ltd. | ||||||||||||
5.00%, 11/1/22(9) | 2,240 | 2,361,227 | ||||||||||
| j2 Cloud Services, LLC/j2 Global Co-Obligor, Inc. | ||||||||||||
6.00%, 7/15/25(9) | 1,915 | 1,912,597 | ||||||||||
| Microsoft Corp. | ||||||||||||
3.75%, 2/12/45 | 750 | 909,017 | ||||||||||
| 36 | See Notes to Financial Statements. |
Eaton Vance
Limited Duration Income Fund
March 31, 2020
Portfolio of Investments — continued
| Security | Principal Amount* (000’s omitted) | Value | ||||||||||
| Software and Services (continued) | ||||||||||||
| PTC, Inc. | ||||||||||||
3.625%, 2/15/25(9) | 502 | $ | 473,135 | |||||||||
4.00%, 2/15/28(9) | 505 | 488,739 | ||||||||||
| $ | 6,926,800 | |||||||||||
| Steel — 0.6% | ||||||||||||
| Allegheny Ludlum, LLC | ||||||||||||
6.95%, 12/15/25 | 225 | $ | 208,967 | |||||||||
| Allegheny Technologies, Inc. | ||||||||||||
7.875%, 8/15/23 | 4,896 | 4,753,845 | ||||||||||
5.875%, 12/1/27 | 1,541 | 1,285,194 | ||||||||||
| Infrabuild Australia Pty, Ltd. | ||||||||||||
12.00%, 10/1/24(9) | 2,494 | 2,004,540 | ||||||||||
| $ | 8,252,546 | |||||||||||
| Surface Transport — 0.6% | ||||||||||||
| Anglian Water Osprey Financing PLC | ||||||||||||
4.00%, 3/8/26(10) | GBP | 325 | $ | 391,572 | ||||||||
| CMA CGM S.A. | ||||||||||||
5.25%, 1/15/25(10) | EUR | 185 | 119,559 | |||||||||
| DAE Funding, LLC | ||||||||||||
4.50%, 8/1/22(9) | 1,050 | 981,728 | ||||||||||
5.00%, 8/1/24(9) | 1,745 | 1,592,260 | ||||||||||
| Moto Finance PLC | ||||||||||||
4.50%, 10/1/22(10) | GBP | 250 | 279,473 | |||||||||
| XPO Logistics, Inc. | ||||||||||||
6.50%, 6/15/22(9) | 2,276 | 2,293,844 | ||||||||||
6.125%, 9/1/23(9) | 2,221 | 2,187,696 | ||||||||||
| $ | 7,846,132 | |||||||||||
| Technology — 0.4% | ||||||||||||
| Dell International, LLC/EMC Corp. | ||||||||||||
5.875%, 6/15/21(9) | 66 | $ | 66,000 | |||||||||
7.125%, 6/15/24(9) | 2,440 | 2,528,450 | ||||||||||
6.02%, 6/15/26(9) | 1,945 | 2,073,707 | ||||||||||
| Western Union Co. (The) | ||||||||||||
6.20%, 11/17/36 | 872 | 842,631 | ||||||||||
| $ | 5,510,788 | |||||||||||
| Telecommunications — 4.2% | ||||||||||||
| Altice Financing S.A. | ||||||||||||
2.25%, 1/15/25(10) | EUR | 100 | $ | 98,880 | ||||||||
| Altice Finco S.A. | ||||||||||||
4.75%, 1/15/28(10) | EUR | 716 | 653,836 | |||||||||
| Security | Principal Amount* (000’s omitted) | Value | ||||||||
| Telecommunications (continued) | ||||||||||
| Altice France Holding S.A. | ||||||||||
8.00%, 5/15/27(9) | EUR | 140 | $ | 152,890 | ||||||
10.50%, 5/15/27(9) | 1,599 | 1,694,940 | ||||||||
4.00%, 2/15/28(10) | EUR | 1,429 | 1,312,056 | |||||||
6.00%, 2/15/28(9) | 852 | 755,877 | ||||||||
| Altice France S.A. | ||||||||||
7.375%, 5/1/26(9) | 1,249 | 1,268,422 | ||||||||
8.125%, 2/1/27(9) | 4,904 | 5,139,637 | ||||||||
5.50%, 1/15/28(9) | 841 | 792,096 | ||||||||
| AT&T, Inc. | ||||||||||
3.80%, 2/15/27 | 500 | 520,715 | ||||||||
4.75%, 5/15/46 | 1,347 | 1,502,836 | ||||||||
| Cellnex Telecom S.A. | ||||||||||
2.375%, 1/16/24(10) | EUR | 200 | 220,227 | |||||||
| CenturyLink, Inc. | ||||||||||
7.50%, 4/1/24 | 47 | 51,759 | ||||||||
| CommScope Technologies, LLC | ||||||||||
6.00%, 6/15/25(9) | 357 | 329,404 | ||||||||
5.00%, 3/15/27(9) | 1,000 | 875,075 | ||||||||
| Connect Finco S.a.r.l./Connect US Finco, LLC | ||||||||||
6.75%, 10/1/26(9) | 2,698 | 2,239,340 | ||||||||
| Crystal Almond S.a.r.l. | ||||||||||
4.25%, 10/15/24(10) | EUR | 286 | 276,884 | |||||||
| Digicel, Ltd. | ||||||||||
6.00%, 4/15/21(9) | 1,942 | 1,123,835 | ||||||||
| Equinix, Inc. | ||||||||||
2.875%, 2/1/26 | EUR | 440 | 469,731 | |||||||
| Front Range Bidco, Inc. | ||||||||||
6.125%, 3/1/28(9) | 1,067 | 1,019,652 | ||||||||
| Hughes Satellite Systems Corp. | ||||||||||
5.25%, 8/1/26 | 1,245 | 1,243,185 | ||||||||
6.625%, 8/1/26 | 770 | 786,522 | ||||||||
| Intelsat Jackson Holdings S.A. | ||||||||||
5.50%, 8/1/23 | 995 | 618,149 | ||||||||
8.00%, 2/15/24(9) | 490 | 476,523 | ||||||||
8.50%, 10/15/24(9) | 1,236 | 786,040 | ||||||||
| LCPR Senior Secured Financing DAC | ||||||||||
6.75%, 10/15/27(9) | 786 | 778,572 | ||||||||
| Level 3 Financing, Inc. | ||||||||||
5.375%, 1/15/24 | 2,190 | 2,209,152 | ||||||||
| Matterhorn Telecom S.A. | ||||||||||
3.125%, 9/15/26(10) | EUR | 200 | 195,709 | |||||||
| Sable International Finance, Ltd. | ||||||||||
5.75%, 9/7/27(9) | 818 | 743,188 | ||||||||
| 37 | See Notes to Financial Statements. |
Eaton Vance
Limited Duration Income Fund
March 31, 2020
Portfolio of Investments — continued
| Security | Principal Amount* (000’s omitted) | Value | ||||||||||
| Telecommunications (continued) | ||||||||||||
| SBA Communications Corp. | ||||||||||||
4.00%, 10/1/22 | 1,020 | $ | 1,027,323 | |||||||||
4.875%, 9/1/24 | 460 | 468,625 | ||||||||||
| SoftBank Group Corp. | ||||||||||||
3.125%, 9/19/25(10) | EUR | 250 | 234,551 | |||||||||
| Sprint Capital Corp. | ||||||||||||
6.875%, 11/15/28 | 840 | 964,110 | ||||||||||
| Sprint Communications, Inc. | ||||||||||||
7.00%, 8/15/20 | 1,055 | 1,065,286 | ||||||||||
6.00%, 11/15/22 | 365 | 381,768 | ||||||||||
| Sprint Corp. | ||||||||||||
7.25%, 9/15/21 | 3,265 | 3,383,062 | ||||||||||
7.875%, 9/15/23 | 9,822 | 10,889,013 | ||||||||||
7.625%, 2/15/25 | 1,785 | 1,988,758 | ||||||||||
7.625%, 3/1/26 | 993 | 1,129,389 | ||||||||||
| Summer (BC) Holdco B S.a.r.l. | ||||||||||||
5.75%, 10/31/26(10) | EUR | 150 | 139,124 | |||||||||
| T-Mobile USA, Inc. | ||||||||||||
6.375%, 3/1/25 | 1,395 | 1,435,113 | ||||||||||
6.50%, 1/15/26 | 595 | 628,052 | ||||||||||
4.50%, 2/1/26 | 980 | 1,002,589 | ||||||||||
4.75%, 2/1/28 | 1,045 | 1,084,762 | ||||||||||
| TalkTalk Telecom Group PLC | ||||||||||||
3.875%, 2/20/25(10) | GBP | 420 | 474,209 | |||||||||
| Telecom Italia Capital S.A. | ||||||||||||
6.00%, 9/30/34 | 475 | 473,560 | ||||||||||
| Telecom Italia SpA | ||||||||||||
2.50%, 7/19/23(10) | EUR | 400 | 431,894 | |||||||||
5.303%, 5/30/24(9) | 1,118 | 1,132,008 | ||||||||||
2.75%, 4/15/25(10) | EUR | 500 | 520,146 | |||||||||
3.00%, 9/30/25(10) | EUR | 140 | 147,260 | |||||||||
| ViaSat, Inc. | ||||||||||||
5.625%, 4/15/27(9) | 796 | 790,468 | ||||||||||
| $ | 58,126,202 | |||||||||||
| Transportation — 0.4% | ||||||||||||
| A.P. Moller - Maersk A/S | ||||||||||||
4.50%, 6/20/29(9) | 1,000 | $ | 1,023,048 | |||||||||
| Atlas Air Worldwide Holdings, Inc. | ||||||||||||
2.25%, 6/1/22 | 1,700 | 1,511,938 | ||||||||||
| Cargo Aircraft Management, Inc. | ||||||||||||
4.75%, 2/1/28(9) | 716 | 669,460 | ||||||||||
| FedEx Corp. | ||||||||||||
4.10%, 2/1/45 | 500 | 458,204 | ||||||||||
| Security | Principal Amount* (000’s omitted) | Value | ||||||||||
| Transportation (continued) | ||||||||||||
| JSL Europe S.A. | ||||||||||||
7.75%, 7/26/24(9) | 1,000 | $ | 727,545 | |||||||||
| XPO CNW, Inc. | ||||||||||||
6.70%, 5/1/34 | 1,000 | 859,665 | ||||||||||
| $ | 5,249,860 | |||||||||||
| Utilities — 1.5% | ||||||||||||
| AES Corp. (The) | ||||||||||||
4.00%, 3/15/21 | 595 | $ | 588,009 | |||||||||
5.50%, 4/15/25 | 309 | 305,128 | ||||||||||
6.00%, 5/15/26 | 1,694 | 1,677,992 | ||||||||||
5.125%, 9/1/27 | 445 | 448,573 | ||||||||||
| Calpine Corp. | ||||||||||||
5.50%, 2/1/24 | 285 | 272,879 | ||||||||||
5.75%, 1/15/25 | 310 | 289,075 | ||||||||||
5.25%, 6/1/26(9) | 1,040 | 995,246 | ||||||||||
4.50%, 2/15/28(9) | 1,073 | 1,044,029 | ||||||||||
5.125%, 3/15/28(9) | 1,511 | 1,401,453 | ||||||||||
| ENERGO-PRO AS | ||||||||||||
4.50%, 5/4/24(10) | EUR | 450 | 466,775 | |||||||||
| NextEra Energy Operating Partners, L.P. | ||||||||||||
4.25%, 9/15/24(9) | 660 | 647,628 | ||||||||||
4.50%, 9/15/27(9) | 851 | 835,654 | ||||||||||
| NRG Energy, Inc. | ||||||||||||
7.25%, 5/15/26 | 1,278 | 1,345,798 | ||||||||||
5.75%, 1/15/28 | 1,455 | 1,492,175 | ||||||||||
5.25%, 6/15/29(9) | 673 | 696,925 | ||||||||||
| Pattern Energy Group, Inc. | ||||||||||||
5.875%, 2/1/24(9) | 970 | 971,382 | ||||||||||
| Southern Co. (The) | ||||||||||||
3.25%, 7/1/26 | 1,000 | 1,010,754 | ||||||||||
| TerraForm Power Operating, LLC | ||||||||||||
4.25%, 1/31/23(9) | 655 | 654,981 | ||||||||||
5.00%, 1/31/28(9) | 1,497 | 1,576,865 | ||||||||||
| Thames Water Kemble Finance PLC | ||||||||||||
5.875%, 7/15/22(10) | GBP | 200 | 250,378 | |||||||||
| Vistra Energy Corp. | ||||||||||||
8.125%, 1/30/26(9) | 2,315 | 2,421,490 | ||||||||||
| Vistra Operations Co., LLC | ||||||||||||
5.00%, 7/31/27(9) | 1,278 | 1,304,263 | ||||||||||
4.30%, 7/15/29(9) | 202 | 180,015 | ||||||||||
| $ | 20,877,467 | |||||||||||
Total Corporate Bonds & Notes |
| $ | 672,059,668 | |||||||||
| 38 | See Notes to Financial Statements. |
Eaton Vance
Limited Duration Income Fund
March 31, 2020
Portfolio of Investments — continued
| Foreign Government Securities — 4.2% |
| |||||||||||
| Security | Principal Amount* (000’s omitted) | Value | ||||||||||
| Barbados — 0.3% | ||||||||||||
| Government of Barbados | ||||||||||||
6.50%, 2/1/21(9) | 249 | $ | 243,006 | |||||||||
6.50%, 10/1/29(9) | 4,063 | 3,656,520 | ||||||||||
Total Barbados | $ | 3,899,526 | ||||||||||
| Belarus — 0.2% | ||||||||||||
| Republic of Belarus | ||||||||||||
6.875%, 2/28/23(10) | 2,615 | $ | 2,574,781 | |||||||||
Total Belarus | $ | 2,574,781 | ||||||||||
| Benin — 0.1% | ||||||||||||
| Benin Government International Bond | ||||||||||||
5.75%, 3/26/26(10) | EUR | 1,928 | $ | 1,792,111 | ||||||||
Total Benin | $ | 1,792,111 | ||||||||||
| Costa Rica — 0.1% | ||||||||||||
| Costa Rica Government International Bond | ||||||||||||
7.158%, 3/12/45(10) | 1,000 | $ | 810,305 | |||||||||
Total Costa Rica | $ | 810,305 | ||||||||||
| Ecuador — 0.1% | ||||||||||||
| Republic of Ecuador | ||||||||||||
7.875%, 3/27/25(10) | 2,506 | $ | 717,343 | |||||||||
9.50%, 3/27/30(10) | 608 | 182,400 | ||||||||||
9.625%, 6/2/27(10) | 300 | 82,500 | ||||||||||
Total Ecuador | $ | 982,243 | ||||||||||
| Egypt — 0.7% | ||||||||||||
| Arab Republic of Egypt | ||||||||||||
8.15%, 11/20/59(10) | 4,338 | $ | 3,536,728 | |||||||||
8.50%, 1/31/47(10) | 3,343 | 2,756,778 | ||||||||||
8.70%, 3/1/49(10) | 3,463 | 2,891,155 | ||||||||||
Total Egypt | $ | 9,184,661 | ||||||||||
| El Salvador — 0.3% | ||||||||||||
| Republic of El Salvador | ||||||||||||
7.125%, 1/20/50(10) | 2,767 | $ | 2,155,493 | |||||||||
7.625%, 2/1/41(10) | 150 | 124,547 | ||||||||||
7.65%, 6/15/35(10) | 1,661 | 1,428,967 | ||||||||||
8.25%, 4/10/32(10) | 647 | 596,049 | ||||||||||
Total El Salvador | $ | 4,305,056 | ||||||||||
| Security | Principal Amount* (000’s omitted) | Value | ||||||||||
| Fiji — 0.2% | ||||||||||||
| Republic of Fiji | ||||||||||||
6.625%, 10/2/20(10) | 2,443 | $ | 2,452,161 | |||||||||
Total Fiji | $ | 2,452,161 | ||||||||||
| Ghana — 0.1% | ||||||||||||
| Ghana Government International Bond | ||||||||||||
8.95%, 3/26/51(10) | 2,850 | $ | 2,025,672 | |||||||||
Total Ghana | $ | 2,025,672 | ||||||||||
| Jordan — 0.2% | ||||||||||||
| Jordan Government International Bond | ||||||||||||
7.375%, 10/10/47(10) | 2,600 | $ | 2,193,170 | |||||||||
Total Jordan | $ | 2,193,170 | ||||||||||
| Kenya — 0.1% | ||||||||||||
| Republic of Kenya | ||||||||||||
7.25%, 2/28/28(10) | 1,900 | $ | 1,776,622 | |||||||||
Total Kenya | $ | 1,776,622 | ||||||||||
| Pakistan — 0.1% | ||||||||||||
| Pakistan Government International Bond | ||||||||||||
6.875%, 12/5/27(10) | 2,550 | $ | 2,131,162 | |||||||||
Total Pakistan | $ | 2,131,162 | ||||||||||
| Poland — 0.2% | ||||||||||||
| Republic of Poland | ||||||||||||
5.125%, 4/21/21 | 2,400 | $ | 2,493,108 | |||||||||
Total Poland | $ | 2,493,108 | ||||||||||
| Romania — 0.5% | ||||||||||||
| Romanian Government International Bond | ||||||||||||
3.375%, 1/28/50(10) | EUR | 2,758 | $ | 2,732,744 | ||||||||
4.625%, 4/3/49(10) | EUR | 3,423 | 4,009,430 | |||||||||
Total Romania | $ | 6,742,174 | ||||||||||
| Seychelles — 0.1% | ||||||||||||
| Republic of Seychelles | ||||||||||||
8.00%, 1/1/26(10) | 1,344 | $ | 1,336,880 | |||||||||
Total Seychelles | $ | 1,336,880 | ||||||||||
| 39 | See Notes to Financial Statements. |
Eaton Vance
Limited Duration Income Fund
March 31, 2020
Portfolio of Investments — continued
| Security | Principal Amount* (000’s omitted) | Value | ||||||||||
| Suriname — 0.1% | ||||||||||||
| Suriname Government International Bond | ||||||||||||
9.25%, 10/26/26(10) | 2,289 | $ | 1,238,509 | |||||||||
Total Suriname | $ | 1,238,509 | ||||||||||
| Ukraine — 0.8% | ||||||||||||
| Ukraine Government International Bond | ||||||||||||
0.00%, GDP-Linked, 5/31/40(9)(10)(15) | 3,915 | $ | 2,899,449 | |||||||||
7.75%, 9/1/20(10) | 700 | 688,585 | ||||||||||
9.75%, 11/1/28(10) | 7,659 | 7,476,027 | ||||||||||
Total Ukraine | $ | 11,064,061 | ||||||||||
Total Foreign Government Securities |
| $ | 57,002,202 | |||||||||
| Sovereign Loans — 0.7% |
| |||||||||||
| Borrower | Principal Amount (000’s omitted) | Value | ||||||||||
| Kenya — 0.3% | ||||||||||||
| Government of Kenya | ||||||||||||
Term Loan, 8.37%, (6 mo. USD LIBOR + 6.45%), Maturing June 29, 2025(14) | $ | 4,500 | $ | 4,264,983 | ||||||||
Total Kenya | $ | 4,264,983 | ||||||||||
| Nigeria — 0.1% | ||||||||||||
| Bank of Industry Limited | ||||||||||||
Term Loan, 7.85%, (3 mo. USD LIBOR + 6.00%), Maturing May 21, 2021(14)(16) | $ | 1,188 | $ | 1,129,068 | ||||||||
Total Nigeria | $ | 1,129,068 | ||||||||||
| Tanzania — 0.3% | ||||||||||||
| Government of the United Republic of Tanzania | ||||||||||||
Term Loan, 7.12%, (6 mo. USD LIBOR + 5.20%), Maturing June 23, 2022(14) | $ | 2,554 | $ | 2,440,006 | ||||||||
Term Loan, 7.09%, (6 mo. USD LIBOR + 5.20%), Maturing May 23, 2023(14) | 1,700 | 1,593,998 | ||||||||||
Total Tanzania | $ | 4,034,004 | ||||||||||
Total Sovereign Loans |
| $ | 9,428,055 | |||||||||
| Mortgage Pass-Throughs — 10.9% |
| |||||||||||
| Security | Principal Amount (000’s omitted) | Value | ||||||||||
| Federal Home Loan Mortgage Corp.: | ||||||||||||
3.00%, with maturity at 2050 | $ | 19,811 | $ | 20,822,349 | ||||||||
4.50%, with various maturities to 2048 | 1,403 | 1,475,895 | ||||||||||
5.50%, with maturity at 2032 | 461 | 516,144 | ||||||||||
6.00%, with maturity at 2021 | 1 | 908 | ||||||||||
6.50%, with various maturities to 2036 | 3,777 | 4,256,015 | ||||||||||
7.00%, with various maturities to 2036 | 3,497 | 3,950,964 | ||||||||||
7.13%, with maturity at 2023 | 33 | 33,515 | ||||||||||
7.50%, with various maturities to 2035 | 2,383 | 2,637,297 | ||||||||||
7.65%, with maturity at 2022 | 8 | 7,855 | ||||||||||
8.00%, with various maturities to 2030 | 671 | 698,077 | ||||||||||
8.50%, with various maturities to 2022 | 107 | 114,459 | ||||||||||
9.00%, with various maturities to 2031 | 71 | 78,379 | ||||||||||
9.50%, with various maturities to 2025 | 7 | 6,969 | ||||||||||
| $ | 34,598,826 | |||||||||||
| Federal National Mortgage Association: | ||||||||||||
3.054%, (COF + 1.25%), with maturity at 2036(17) | $ | 710 | $ | 708,972 | ||||||||
3.649%, (6 mo. USD LIBOR + 1.54%), with maturity at 2037(17) | 1,097 | 1,118,758 | ||||||||||
4.488%, (1 yr. CMT + 2.261%), with maturity at 2036(17) | 5,881 | 6,087,630 | ||||||||||
4.50%, with various maturities to 2049(18) | 44,608 | 48,169,517 | ||||||||||
5.00%, with various maturities to 2040(18) | 6,862 | 7,597,221 | ||||||||||
5.50%, with various maturities to 2033 | 689 | 775,150 | ||||||||||
5.819%, with maturity at 2048 | 3,000 | 3,378,780 | ||||||||||
6.00%, with various maturities to 2029 | 1,125 | 1,200,832 | ||||||||||
6.328%, (COF + 2.00%, Floor 6.328%), with maturity at 2032(17) | 1,635 | 1,776,009 | ||||||||||
6.50%, with various maturities to 2036(18) | 15,226 | 17,177,183 | ||||||||||
6.75%, with maturity at 2023 | 24 | 25,843 | ||||||||||
7.00%, with various maturities to 2037 | 3,895 | 4,386,152 | ||||||||||
7.50%, with various maturities to 2035 | 1,949 | 2,251,613 | ||||||||||
7.887%, with maturity at 2027(19) | 171 | 186,636 | ||||||||||
8.00%, with various maturities to 2027 | 252 | 274,277 | ||||||||||
8.224%, with maturity at 2028(19) | 43 | 47,161 | ||||||||||
8.232%, with maturity at 2024(19) | 9 | 9,136 | ||||||||||
8.277%, with maturity at 2029(19) | 39 | 42,561 | ||||||||||
8.298%, with maturity at 2027(19) | 54 | 60,049 | ||||||||||
8.50%, with various maturities to 2037 | 634 | 709,541 | ||||||||||
9.00%, with various maturities to 2032 | 686 | 756,762 | ||||||||||
9.132%, with maturity at 2025(19) | 3 | 3,438 | ||||||||||
9.50%, with various maturities to 2030 | 133 | 146,548 | ||||||||||
10.50%, with maturity at 2021 | 10 | 10,361 | ||||||||||
| $ | 96,900,130 | |||||||||||
| 40 | See Notes to Financial Statements. |
Eaton Vance
Limited Duration Income Fund
March 31, 2020
Portfolio of Investments — continued
| Security | Principal Amount (000’s omitted) | Value | ||||||||||
| Government National Mortgage Association: | ||||||||||||
4.00%, with maturity at 2049 | $ | 1,776 | $ | 1,898,289 | ||||||||
4.50%, with maturity at 2047 | 5,767 | 6,406,214 | ||||||||||
6.00%, with maturity at 2024 | 260 | 274,317 | ||||||||||
6.50%, with maturity at 2024(18) | 1,546 | 1,641,440 | ||||||||||
7.00%, with maturity at 2026 | 151 | 166,067 | ||||||||||
7.50%, with various maturities to | 3,056 | 3,359,090 | ||||||||||
8.00%, with various maturities to 2034(18) | 2,298 | 2,583,416 | ||||||||||
8.50%, with maturity at 2022 | 39 | 40,168 | ||||||||||
9.00%, with various maturities to 2025 | 335 | 363,206 | ||||||||||
9.50%, with various maturities to 2021 | 23 | 23,611 | ||||||||||
| $ | 16,755,818 | |||||||||||
Total Mortgage Pass-Throughs |
| $ | 148,254,774 | |||||||||
| Collateralized Mortgage Obligations — 26.0% |
| |||||||||||
| Security | Principal Amount (000’s omitted) | Value | ||||||||||
| Federal Home Loan Mortgage Corp.: | ||||||||||||
Series 24, Class J, 6.25%, 11/25/23 | $ | 149 | $ | 160,181 | ||||||||
Series 1497, Class K, 7.00%, 4/15/23 | 114 | 122,702 | ||||||||||
Series 1529, Class Z, 7.00%, 6/15/23 | 200 | 215,908 | ||||||||||
Series 1620, Class Z, 6.00%, 11/15/23 | 139 | 148,854 | ||||||||||
Series 1677, Class Z, 7.50%, 7/15/23 | 112 | 121,401 | ||||||||||
Series 1702, Class PZ, 6.50%, 3/15/24 | 1,440 | 1,564,269 | ||||||||||
Series 2113, Class QG, 6.00%, 1/15/29 | 380 | 432,268 | ||||||||||
Series 2122, Class K, 6.00%, 2/15/29 | 75 | 84,807 | ||||||||||
Series 2130, Class K, 6.00%, 3/15/29 | 51 | 57,458 | ||||||||||
Series 2167, Class BZ, 7.00%, 6/15/29 | 60 | 68,443 | ||||||||||
Series 2182, Class ZB, 8.00%, 9/15/29 | 587 | 687,769 | ||||||||||
Series 2198, Class ZA, 8.50%, 11/15/29 | 657 | 762,414 | ||||||||||
Series 2458, Class ZB, 7.00%, 6/15/32 | 674 | 812,888 | ||||||||||
Series 3762, Class SH, 7.289%, (10.00% - 1 mo. USD LIBOR x 2.00), 11/15/40(20) | 673 | 842,200 | ||||||||||
Series 4097, Class PE, 3.00%, 11/15/40 | 1,279 | 1,331,947 | ||||||||||
Series 4273, Class PU, 4.00%, 11/15/43 | 2,263 | 2,621,073 | ||||||||||
Series 4273, Class SP, 8.385%, (12.00% - 1 mo. USD LIBOR x 2.67), 11/15/43(20) | 503 | 851,711 | ||||||||||
Series 4337, Class YT, 3.50%, 4/15/49 | 4,487 | 4,547,854 | ||||||||||
Series 4407, Class LN, 6.161%, (9.32% - 1 mo. USD LIBOR x 2.33), 12/15/43(20) | 97 | 99,534 | ||||||||||
Series 4416, Class SU, 5.889%, (8.60% - 1 mo. USD LIBOR x 2.00), 12/15/44(20) | 1,223 | 1,243,586 | ||||||||||
Series 4452, Class ZJ, 3.00%, 11/15/44 | 3,137 | 3,161,010 | ||||||||||
Series 4584, Class PM, 3.00%, 5/15/46 | 3,030 | 3,106,824 | ||||||||||
| Security | Principal Amount (000’s omitted) | Value | ||||||||
| Federal Home Loan Mortgage Corp.: (continued) | ||||||||||
Series 4594, Class FM, 2.356%, (1 mo. USD LIBOR + 1.00%), 6/15/46(14) | $ | 493 | $ | 490,725 | ||||||
Series 4608, Class TV, 3.50%, 1/15/55 | 5,974 | 6,041,502 | ||||||||
Series 4630, Class CZ, 3.00%, 12/15/43 | 7,292 | 7,326,618 | ||||||||
Series 4637, Class CU, 3.00%, 8/15/44 | 5,991 | 6,151,285 | ||||||||
Series 4637, Class QF, 2.356%, (1 mo. USD LIBOR + 1.00%), 4/15/44(14)(18) | 10,616 | 10,479,907 | ||||||||
Series 4639, Class KF, 2.656%, (1 mo. USD LIBOR + 1.30%), 12/15/44(14) | 3,321 | 3,320,912 | ||||||||
Series 4677, Class SB, 10.577%, (16.00% - 1 mo. USD LIBOR x 4.00), 4/15/47(20) | 1,676 | 1,728,076 | ||||||||
Series 4678, Class PC, 3.00%, 1/15/46 | 8,472 | 8,738,740 | ||||||||
Series 4751, Class ZC, 4.00%, 11/15/47 | 872 | 872,204 | ||||||||
Series 4774, Class MH, 4.50%, 12/15/42 | 5,124 | 5,301,787 | ||||||||
Series 4774, Class QD, 4.50%, 1/15/43 | 12,984 | 13,445,466 | ||||||||
Series 4776, Class C, 4.50%, 3/15/43 | 3,901 | 3,973,473 | ||||||||
Series 4858, Class LA, 4.50%, 8/15/43 | 4,020 | 4,057,742 | ||||||||
Series 4859, Class GA, 4.50%, 10/15/43 | 7,707 | 7,822,104 | ||||||||
Series 4911, Class JZ, 3.50%, 9/25/49 | 3,858 | 3,872,018 | ||||||||
Series 4914, Class DZ, 4.00%, 9/25/49 | 1,392 | 1,393,422 | ||||||||
Series 4941, Class ZD, 3.50%, 9/25/49 | 5,063 | 5,066,991 | ||||||||
| Interest Only:(21) | ||||||||||
Series 284, Class S6, 5.395%, (6.10% - 1 mo. USD LIBOR), 10/15/42(20) | 3,256 | 490,675 | ||||||||
Series 362, Class C7, 3.50%, 9/15/47 | 19,493 | 1,481,008 | ||||||||
Series 362, Class C11, 4.00%, 12/15/47 | 15,939 | 1,517,656 | ||||||||
Series 3973, Class SG, 5.945%, (6.65% - 1 mo. USD LIBOR), 4/15/30(20) | 1,206 | 34,704 | ||||||||
Series 4067, Class JI, 3.50%, 6/15/27 | 2,669 | 206,014 | ||||||||
Series 4070, Class S, 5.395%, (6.10% - 1 mo. USD LIBOR), 6/15/32(20) | 6,901 | 997,434 | ||||||||
Series 4088, Class EI, 3.50%, 9/15/41 | 8,235 | 480,556 | ||||||||
Series 4094, Class CS, 5.295%, (6.00% - 1 mo. USD LIBOR), 8/15/42(20) | 2,934 | 509,434 | ||||||||
Series 4095, Class HS, 5.395%, (6.10% - 1 mo. USD LIBOR), 7/15/32(20) | 1,925 | 237,465 | ||||||||
Series 4109, Class ES, 5.445%, (6.15% - 1 mo. USD LIBOR), 12/15/41(20) | 87 | 22,102 | ||||||||
Series 4109, Class KS, 5.395%, (6.10% - 1 mo. USD LIBOR), 5/15/32(20) | 164 | 940 | ||||||||
Series 4110, Class SA, 4.945%, (5.65% - 1 mo. USD LIBOR), 9/15/42(20) | 4,096 | 838,805 | ||||||||
Series 4149, Class S, 5.545%, (6.25% - 1 mo. USD LIBOR), 1/15/33(20) | 3,241 | 495,570 | ||||||||
Series 4188, Class AI, 3.50%, 4/15/28 | 1,992 | 137,635 | ||||||||
Series 4203, Class QS, 5.545%, (6.25% - 1 mo. USD LIBOR), 5/15/43(20) | 5,710 | 956,948 | ||||||||
| 41 | See Notes to Financial Statements. |
Eaton Vance
Limited Duration Income Fund
March 31, 2020
Portfolio of Investments — continued
| Security | Principal Amount (000’s omitted) | Value | ||||||||||
| Interest Only: (continued) | ||||||||||||
Series 4408, Class IP, 3.50%, 4/15/44 | $ | 5,568 | $ | 452,209 | ||||||||
Series 4435, Class BI, 3.50%, 7/15/44 | 11,914 | 1,036,652 | ||||||||||
Series 4629, Class QI, 3.50%, 11/15/46 | 6,522 | 425,799 | ||||||||||
Series 4644, Class TI, 3.50%, 1/15/45 | 6,883 | 359,029 | ||||||||||
Series 4653, Class PI, 3.50%, 7/15/44 | 2,786 | 68,766 | ||||||||||
Series 4667, Class PI, 3.50%, 5/15/42 | 8,294 | 266,402 | ||||||||||
Series 4676, Class DI, 4.00%, 7/15/44 | 12,792 | 441,560 | ||||||||||
Series 4744, Class IO, 4.00%, 11/15/47 | 9,435 | 850,728 | ||||||||||
Series 4749, Class IL, 4.00%, 12/15/47 | 4,128 | 376,011 | ||||||||||
Series 4767, Class IM, 4.00%, 5/15/45 | 6,532 | 249,592 | ||||||||||
Series 4793, Class SD, 5.495%, (6.20% - 1 mo. USD LIBOR), 6/15/48(20) | 22,163 | 2,729,135 | ||||||||||
| Principal Only:(22) | ||||||||||||
Series 242, Class PO, 0.00%, 11/15/36 | 3,976 | 3,799,654 | ||||||||||
Series 259, Class PO, 0.00%, 4/15/39 | 2,347 | 2,301,257 | ||||||||||
Series 3606, Class PO, 0.00%, 12/15/39 | 2,650 | 2,495,013 | ||||||||||
Series 4417, Class KO, 0.00%, 12/15/43 | 533 | 473,453 | ||||||||||
Series 4478, Class PO, 0.00%, 5/15/45 | 1,796 | 1,686,205 | ||||||||||
Series 4754, Class JO, 0.00%, 4/15/44 | 1,988 | 1,884,002 | ||||||||||
| $ | 141,430,486 | |||||||||||
| Federal Home Loan Mortgage Corp. Structured Agency Credit Risk Debt Notes: | ||||||||||||
Series 2018-DNA1, Class M2, 2.747%, (1 mo. USD LIBOR + 1.80%), 7/25/30(14) | $ | 7,517 | $ | 6,363,591 | ||||||||
Series 2018-DNA2, Class M2, 3.097%, (1 mo. USD LIBOR + 2.15%), 12/25/30(9)(14) | 7,000 | 5,837,583 | ||||||||||
| $ | 12,201,174 | |||||||||||
| Federal National Mortgage Association: | ||||||||||||
Series G92-44, Class ZQ, 8.00%, 7/25/22 | $ | 1 | $ | 686 | ||||||||
Series G92-46, Class Z, 7.00%, 8/25/22 | 41 | 43,887 | ||||||||||
Series G92-60, Class Z, 7.00%, 10/25/22 | 71 | 74,949 | ||||||||||
Series G93-35, Class ZQ, 6.50%, 11/25/23 | 1,738 | 1,868,139 | ||||||||||
Series G93-40, Class H, 6.40%, 12/25/23 | 398 | 426,353 | ||||||||||
Series 1991-98, Class J, 8.00%, 8/25/21 | 15 | 15,566 | ||||||||||
Series 1992-77, Class ZA, 8.00%, 5/25/22 | 72 | 75,743 | ||||||||||
Series 1992-103, Class Z, 7.50%, 6/25/22 | 8 | 8,929 | ||||||||||
Series 1992-113, Class Z, 7.50%, 7/25/22 | 23 | 24,773 | ||||||||||
Series 1992-185, Class ZB, 7.00%, 10/25/22 | 35 | 37,144 | ||||||||||
Series 1993-16, Class Z, 7.50%, 2/25/23 | 87 | 93,932 | ||||||||||
Series 1993-22, Class PM, 7.40%, 2/25/23 | 70 | 74,896 | ||||||||||
Series 1993-25, Class J, 7.50%, 3/25/23 | 105 | 113,017 | ||||||||||
Series 1993-30, Class PZ, 7.50%, 3/25/23 | 198 | 213,663 | ||||||||||
Series 1993-42, Class ZQ, 6.75%, 4/25/23 | 259 | 276,083 | ||||||||||
Series 1993-56, Class PZ, 7.00%, 5/25/23 | 42 | 44,774 | ||||||||||
Series 1993-156, Class ZB, 7.00%, 9/25/23 | 52 | 56,814 | ||||||||||
| Security | Principal Amount (000’s omitted) | Value | ||||||||
| Federal National Mortgage Association: (continued) | ||||||||||
Series 1994-45, Class Z, 6.50%, 2/25/24 | $ | 364 | $ | 391,070 | ||||||
Series 1994-89, Class ZQ, 8.00%, 7/25/24 | 291 | 323,193 | ||||||||
Series 1996-57, Class Z, 7.00%, 12/25/26 | 304 | 342,939 | ||||||||
Series 1997-77, Class Z, 7.00%, 11/18/27 | 157 | 180,197 | ||||||||
Series 1998-44, Class ZA, 6.50%, 7/20/28 | 173 | 195,521 | ||||||||
Series 1999-45, Class ZG, 6.50%, 9/25/29 | 49 | 55,789 | ||||||||
Series 2000-22, Class PN, 6.00%, 7/25/30 | 626 | 718,246 | ||||||||
Series 2002-1, Class G, 7.00%, 7/25/23 | 61 | 66,368 | ||||||||
Series 2002-21, Class PE, 6.50%, 4/25/32 | 412 | 483,623 | ||||||||
Series 2005-75, Class CS, 20.414%, (24.20% - 1 mo. USD LIBOR x 4.00), 9/25/35(20) | 948 | 1,777,893 | ||||||||
Series 2007-74, Class AC, 5.00%, 8/25/37 | 4,727 | 5,314,469 | ||||||||
Series 2011-49, Class NT, 6.00%, (66.00% - 1 mo. USD LIBOR x 10.00, Cap 6.00%), 6/25/41(20) | 500 | 560,776 | ||||||||
Series 2011-109, Class PE, 3.00%, 8/25/41 | 3,004 | 3,086,740 | ||||||||
Series 2012-134, Class ZT, 2.00%, 12/25/42 | 2,825 | 2,735,472 | ||||||||
Series 2013-6, Class TA, 1.50%, 1/25/43 | 4,406 | 4,395,308 | ||||||||
Series 2013-52, Class MD, 1.25%, 6/25/43 | 4,450 | 4,370,700 | ||||||||
Series 2013-67, Class NF, 1.947%, (1 mo. USD LIBOR + 1.00%), 7/25/43(14) | 2,784 | 2,738,225 | ||||||||
Series 2014-64, Class PA, 3.00%, 3/25/44 | 3,126 | 3,250,085 | ||||||||
Series 2016-22, Class ZE, 3.00%, 6/25/44 | 777 | 784,162 | ||||||||
Series 2017-13, Class KF, 2.581%, (1 mo. USD LIBOR + 1.00%), 2/25/47(14) | 607 | 605,876 | ||||||||
Series 2017-15, Class LE, 3.00%, 6/25/46(18) | 9,442 | 9,702,751 | ||||||||
Series 2017-39, Class JZ, 3.00%, 5/25/47 | 816 | 821,335 | ||||||||
Series 2017-48, Class LG, 2.75%, 5/25/47 | 6,371 | 6,697,622 | ||||||||
Series 2017-66, Class ZJ, 3.00%, 9/25/57 | 2,433 | 2,435,593 | ||||||||
Series 2017-75, Class Z, 3.00%, 9/25/57 | 1,632 | 1,634,040 | ||||||||
Series 2017-76, Class Z, 3.00%, 10/25/57 | 946 | 939,048 | ||||||||
Series 2017-96, Class Z, 3.00%, 12/25/57 | 1,200 | 1,190,099 | ||||||||
Series 2017-110, Class Z, 3.00%, 2/25/57 | 1,247 | 1,235,952 | ||||||||
Series 2018-18, Class QD, 4.50%, 5/25/45 | 21,477 | 22,485,213 | ||||||||
Series 2019-50, Class NZ, 3.50%, 9/25/49 | 3,371 | 3,377,291 | ||||||||
Series 2019-69, Class NZ, 3.50%, 12/25/49 | 6,328 | 6,333,731 | ||||||||
Series 2019-73, Class CZ, 3.00%, 12/25/49 | 3,474 | 3,472,725 | ||||||||
| Interest Only:(21) | ||||||||||
Series 2010-124, Class SJ, 5.103%, (6.05% - 1 mo. USD LIBOR), 11/25/38(20) | 1,133 | 39,313 | ||||||||
Series 2011-101, Class IC, 3.50%, 10/25/26 | 6,662 | 442,428 | ||||||||
Series 2011-101, Class IE, 3.50%, 10/25/26 | 2,151 | 143,041 | ||||||||
Series 2012-24, Class S, 4.553%, (5.50% - 1 mo. USD LIBOR), 5/25/30(20) | 1,197 | 36,651 | ||||||||
Series 2012-33, Class CI, 3.50%, 3/25/27 | 3,846 | 245,409 | ||||||||
Series 2012-56, Class SU, 5.803%, (6.75% - 1 mo. USD LIBOR), 8/25/26(20) | 167 | 3,286 | ||||||||
| 42 | See Notes to Financial Statements. |
Eaton Vance
Limited Duration Income Fund
March 31, 2020
Portfolio of Investments — continued
| Security | Principal Amount (000’s omitted) | Value | ||||||||||
| Interest Only: (continued) | ||||||||||||
Series 2012-94, Class KS, 5.703%,(6.65% - 1 mo. USD LIBOR), 5/25/38(20) | $ | 4,411 | $ | 291,601 | ||||||||
Series 2012-97, Class PS, 5.203%,(6.15% - 1 mo. USD LIBOR), 3/25/41(20) | 6,191 | 529,280 | ||||||||||
Series 2012-103, Class GS, 5.153%,(6.10% - 1 mo. USD LIBOR), 2/25/40(20) | 2,700 | 78,704 | ||||||||||
Series 2012-118, Class IN, 3.50%, 11/25/42 | 7,895 | 877,489 | ||||||||||
Series 2012-124, Class IO, 1.573%, 11/25/42(19) | 3,271 | 162,828 | ||||||||||
Series 2012-125, Class IG, 3.50%, 11/25/42 | 23,358 | 2,769,630 | ||||||||||
Series 2012-150, Class SK, 5.203%,(6.15% - 1 mo. USD LIBOR), 1/25/43(20) | 4,133 | 732,190 | ||||||||||
Series 2013-12, Class SP, 4.703%,(5.65% - 1 mo. USD LIBOR), 11/25/41(20) | 2,168 | 143,893 | ||||||||||
Series 2013-15, Class DS, 5.253%,(6.20% - 1 mo. USD LIBOR), 3/25/33(20) | 8,410 | 1,609,400 | ||||||||||
Series 2013-16, Class SY, 5.203%,(6.15% - 1 mo. USD LIBOR), 3/25/43(20) | 1,921 | 384,324 | ||||||||||
Series 2013-54, Class HS, 5.353%,(6.30% - 1 mo. USD LIBOR), 10/25/41(20) | 1,776 | 136,965 | ||||||||||
Series 2013-64, Class PS, 5.303%,(6.25% - 1 mo. USD LIBOR), 4/25/43(20) | 2,865 | 465,406 | ||||||||||
Series 2013-75, Class SC, 5.303%,(6.25% - 1 mo. USD LIBOR), 7/25/42(20) | 6,256 | 655,681 | ||||||||||
Series 2014-32, Class EI, 4.00%, 6/25/44 | 1,242 | 148,940 | ||||||||||
Series 2014-55, Class IN, 3.50%, 7/25/44 | 3,082 | 296,903 | ||||||||||
Series 2014-89, Class IO, 3.50%, 1/25/45 | 3,864 | 286,668 | ||||||||||
Series 2015-17, Class SA, 5.253%,(6.20% - 1 mo. USD LIBOR), 11/25/43(20) | 4,312 | 349,284 | ||||||||||
Series 2015-52, Class MI, 3.50%, 7/25/45 | 3,357 | 322,773 | ||||||||||
Series 2017-46, Class NI, 3.00%, 8/25/42 | 10,308 | 353,984 | ||||||||||
Series 2018-21, Class IO, 3.00%, 4/25/48 | 19,054 | 1,305,002 | ||||||||||
Series 2019-1, Class AS, 5.053%,(6.00% - 1 mo. USD LIBOR), 2/25/49(20) | 22,067 | 3,772,752 | ||||||||||
Series 2019-33, Class SK, 5.103%,(6.05% - 1 mo. USD LIBOR), 7/25/49(20) | 23,399 | 2,562,188 | ||||||||||
| Principal Only:(22) | ||||||||||||
Series 379, Class 1, 0.00%, 5/25/37 | 2,533 | 2,423,993 | ||||||||||
Series 2006-8, Class WQ, 0.00%, 3/25/36 | 3,659 | 3,471,065 | ||||||||||
| $ | 121,192,471 | |||||||||||
| Government National Mortgage Association: | ||||||||||||
Series 2011-156, Class GA, 2.00%, 12/16/41 | $ | 593 | $ | 594,933 | ||||||||
Series 2017-82, Class TZ, 2.50%, 2/16/43 | 180 | 178,809 | ||||||||||
Series 2017-121, Class DF, 1.273%, (1 mo. USD LIBOR + 0.50%), 8/20/47(14)(18) | 11,151 | 11,041,498 | ||||||||||
Series 2017-137, Class AF, 1.273%, (1 mo. USD LIBOR + 0.50%), 9/20/47(14)(18) | 6,275 | 6,228,073 | ||||||||||
Series 2017-141, Class KZ, 3.00%, 9/20/47 | 1,817 | 1,819,521 | ||||||||||
Series 2018-6, Class JZ, 4.00%, 1/20/48 | 4,526 | 4,796,349 | ||||||||||
| Security | Principal Amount (000’s omitted) | Value | ||||||||||
| Government National Mortgage Association: (continued) | ||||||||||||
Series 2018-67, Class LT, 4.50%,(13.50% - 1 mo. USD LIBOR x 2.25, Cap 4.50%), 4/20/48(20) | $ | 2,785 | $ | 2,796,842 | ||||||||
Series 2019-97, Class ZC, 3.50%, 8/20/49 | 7,713 | 7,714,107 | ||||||||||
Series 2019-108, Class KZ, 3.50%, 8/20/49 | 3,794 | 3,808,809 | ||||||||||
Series 2019-115, Class ZH, 4.00%, 9/20/49 | 4,851 | 4,853,771 | ||||||||||
Series 2019-117, Class Z, 3.50%, 9/20/49 | 9,732 | 9,750,522 | ||||||||||
Series 2019-136, Class CZ, 3.50%, 11/20/49 | 6,464 | 6,462,807 | ||||||||||
Series 2019-151, Class HZ, 3.50%, 12/20/49 | 8,070 | 8,058,275 | ||||||||||
Series 2019-153, Class MZ, 3.50%, 12/20/49 | 11,584 | 11,580,699 | ||||||||||
| Interest Only:(21) | ||||||||||||
Series 2017-104, Class SD, 5.427%,(6.20% - 1 mo. USD LIBOR), 7/20/47(20) | 7,202 | 1,165,278 | ||||||||||
| $ | 80,850,293 | |||||||||||
Total Collateralized Mortgage Obligations |
| $ | 355,674,424 | |||||||||
| Commercial Mortgage-Backed Securities — 6.1% |
| |||||||||||
| Security | Principal Amount (000’s omitted) | Value | ||||||||||
| Agate Bay Mortgage Trust | ||||||||||||
Series 2015-1, Class A4, 3.50%, 1/25/45(9)(19) | $ | 1,319 | $ | 1,327,468 | ||||||||
| BAMLL Commercial Mortgage Securities Trust | ||||||||||||
Series 2019-BPR, Class ENM, 3.843%, 11/5/32(9)(19) | 795 | 651,398 | ||||||||||
Series 2019-BPR, Class FNM, 3.843%, 11/5/32(9)(19) | 3,205 | 2,277,351 | ||||||||||
| CFCRE Commercial Mortgage Trust | ||||||||||||
Series 2016-C3, Class D, 3.052%, 1/10/48(9)(19) | 3,500 | 2,601,118 | ||||||||||
Series 2016-C7, Class D, 4.431%, 12/10/54(9)(19) | 1,675 | 1,305,638 | ||||||||||
| Citigroup Commercial Mortgage Trust | ||||||||||||
Series 2015-P1, Class D, 3.225%, 9/15/48(9) | 1,000 | 765,028 | ||||||||||
Series 2017-MDRB, Class C, 3.205%, (1 mo. USD LIBOR + 2.50%), 7/15/30(9)(14) | 5,000 | 4,909,426 | ||||||||||
| COMM Mortgage Trust | ||||||||||||
Series 2013-CR11, Class D, 5.124%, 8/10/50(9)(19) | 4,500 | 4,064,283 | ||||||||||
Series 2015-CR22, Class D, 4.11%, 3/10/48(9)(19) | 4,100 | 3,376,589 | ||||||||||
| Credit Suisse Mortgage Trust | ||||||||||||
Series 2016-NXSR, Class C, 4.359%, 12/15/49(19) | 2,770 | 2,335,971 | ||||||||||
Series 2016-NXSR, Class D, 4.359%, 12/15/49(9)(19) | 3,000 | 2,337,770 | ||||||||||
| Federal National Mortgage Association Multifamily Connecticut Avenue Securities Trust | ||||||||||||
Series 2019-01, Class M7, 2.647%, (1 mo. USD LIBOR + 1.70%), 10/15/49(9)(14) | 218 | 196,099 | ||||||||||
| 43 | See Notes to Financial Statements. |
Eaton Vance
Limited Duration Income Fund
March 31, 2020
Portfolio of Investments — continued
| Security | Principal Amount (000’s omitted) | Value | ||||||||
| Federal National Mortgage Association Multifamily Connecticut Avenue Securities Trust (continued) | ||||||||||
Series 2019-01, Class M10, 4.197%, (1 mo. USD LIBOR + 3.25%), 10/15/49(9)(14) | $ | 120 | $ | 85,367 | ||||||
Series 2020-01, Class M10, 4.362%, (1 mo. USD LIBOR + 3.75%), 3/25/50(9)(14 | 2,000 | 1,585,674 | ||||||||
| JPMBB Commercial Mortgage Securities Trust | ||||||||||
Series 2014-C22, Class C, 4.554%, 9/15/47(19) | 730 | 659,374 | ||||||||
Series 2014-C22, Class D, 4.554%, 9/15/47(9)(19) | 5,276 | 4,510,723 | ||||||||
Series 2014-C25, Class D, 3.946%, 11/15/47(9)(19) | 2,974 | 2,451,768 | ||||||||
Series 2015-C29, Class D, 3.678%, 5/15/48(19) | 2,000 | 1,587,811 | ||||||||
| JPMorgan Chase Commercial Mortgage Securities Trust | ||||||||||
Series 2011-C5, Class D, 5.419%, 8/15/46(9)(19) | 7,167 | 6,938,358 | ||||||||
Series 2012-CBX, Class AS, 4.271%, 6/15/45 | 1,000 | 1,030,861 | ||||||||
Series 2013-C13, Class D, 4.079%, 1/15/46(9)(19) | 3,000 | 2,632,851 | ||||||||
Series 2013-C16, Class D, 5.027%, 12/15/46(9)(19) | 3,500 | 3,129,247 | ||||||||
Series 2014-DSTY, Class B, 3.771%, 6/10/27(9) | 2,600 | 2,298,545 | ||||||||
| Morgan Stanley Bank of America Merrill Lynch Trust | ||||||||||
Series 2015-C23, Class D, 4.155%, 7/15/50(9)(19) | 2,000 | 1,624,098 | ||||||||
Series 2016-C29, Class D, 3.00%, 5/15/49(9) | 3,577 | 2,612,653 | ||||||||
Series 2016-C32, Class D, 3.396%, 12/15/49(9)(19) | 1,600 | 1,160,032 | ||||||||
| Morgan Stanley Capital I Trust | ||||||||||
Series 2016-UB12, Class D, 3.312%, 12/15/49(9) | 4,489 | 3,248,804 | ||||||||
Series 2017-CLS, Class A, 1.405%, (1 mo. USD LIBOR + 0.70%), 11/15/34(9)(14) | 2,000 | 1,916,480 | ||||||||
Series 2019-BPR, Class C, 3.755%, (1 mo. USD LIBOR + 3.05%), 5/15/36(9)(14) | 1,845 | 1,616,003 | ||||||||
| Motel 6 Trust | ||||||||||
Series 2017-MTL6, Class C, 2.105%, (1 mo. USD LIBOR + 1.40%), 8/15/34(9)(14) | 2,407 | 2,094,662 | ||||||||
| RETL Trust | ||||||||||
Series 2019-RVP, Class B, 2.255%, (1 mo. USD LIBOR + 1.55%), 3/15/36(9)(14) | 735 | 655,915 | ||||||||
| UBS Commercial Mortgage Trust | ||||||||||
Series 2012-C1, Class D, 5.573%, 5/10/45(9)(19) | 3,000 | 2,867,979 | ||||||||
| UBS-Barclays Commercial Mortgage Trust | ||||||||||
Series 2013-C6, Class D, 4.309%, 4/10/46(9)(19) | 4,437 | 3,968,083 | ||||||||
| Wells Fargo Commercial Mortgage Trust | ||||||||||
Series 2013-LC12, Class D, 4.283%, 7/15/46(9)(19) | 3,000 | 2,651,512 | ||||||||
Series 2015-C31, Class D, 3.852%, 11/15/48 | 2,475 | 1,938,455 | ||||||||
Series 2015-LC22, Class C, 4.534%, 9/15/58(19) | 1,250 | 1,096,293 | ||||||||
Series 2016-C35, Class D, 3.142%, 7/15/48(9) | 1,850 | 1,345,965 | ||||||||
Series 2016-C36, Class D, 2.942%, 11/15/59(9) | 1,500 | 1,063,227 | ||||||||
Total Commercial Mortgage-Backed Securities |
| $ | 82,918,879 | |||||||
| Asset-Backed Securities — 6.2% |
| |||||||||
| Security | Principal Amount (000’s omitted) | Value | ||||||||
| Alinea CLO, Ltd. | ||||||||||
Series 2018-1A, Class E, 7.819%, (3 mo. USD LIBOR + 6.00%), 7/20/31(9)(14) | $ | 1,000 | $ | 583,419 | ||||||
| AMMC CLO 15, Ltd. | ||||||||||
Series 2014-15A, Class ERR, 8.741%, (3 mo. USD LIBOR + 6.91%), 1/15/32(9)(14) | 500 | 306,873 | ||||||||
| AMMC CLO XII, Ltd. | ||||||||||
Series 2013-12A, Class ER, 7.914%, (3 mo. USD LIBOR + 6.18%), 11/10/30(9)(14) | 2,000 | 1,199,008 | ||||||||
| Ares LII CLO, Ltd. | ||||||||||
Series 2019-52A, Class E, 8.352%, (3 mo. USD LIBOR + 6.55%), 4/22/31(9)(14) | 1,000 | 628,162 | ||||||||
| Ares XL CLO, Ltd. | ||||||||||
Series 2016-40A, Class DR, 8.181%, (3 mo. USD LIBOR + 6.35%), 1/15/29(9)(14) | 1,000 | 637,710 | ||||||||
| Ares XXXIV CLO, Ltd. | ||||||||||
Series 2015-2A, Class ER, 7.625%, (3 mo. USD LIBOR + 6.85%), 4/17/33(9)(14) | 2,000 | 1,244,350 | ||||||||
| Ares XXXVR CLO, Ltd. | ||||||||||
Series 2015-35RA, Class E, 7.531%, (3 mo. USD LIBOR + 5.70%), 7/15/30(9)(14) | 2,000 | 1,257,366 | ||||||||
| Babson CLO, Ltd. | ||||||||||
Series 2016-1A, Class ER, 7.806%, (3 mo. USD LIBOR + 6.00%), 7/23/30(9)(14) | 1,000 | 618,311 | ||||||||
| Bain Capital Credit CLO, Ltd. | ||||||||||
Series 2017-2A, Class E, 8.144%, (3 mo. USD LIBOR + 6.35%), 7/25/30(9)(14) | 2,000 | 1,280,588 | ||||||||
| Bardot CLO, Ltd. | ||||||||||
Series 2019-2A, Class E, 8.816%, (3 mo. USD LIBOR + 6.95%), 10/22/32(9)(14) | 1,850 | 1,093,988 | ||||||||
| Benefit Street Partners CLO XVI, Ltd. | ||||||||||
Series 2018-16A, Class E, 8.536%, (3 mo. USD LIBOR + 6.70%), 1/17/32(9)(14) | 3,000 | 1,786,734 | ||||||||
| Benefit Street Partners CLO XVII, Ltd. | ||||||||||
Series 2019-17A, Class E, 8.431%, (3 mo. USD LIBOR + 6.60%), 7/15/32(9)(14) | 3,000 | 1,737,321 | ||||||||
| Benefit Street Partners CLO XVIII, Ltd. | ||||||||||
Series 2019-18A, Class E, 8.717%, (3 mo. USD LIBOR + 6.90%), 10/15/32(9)(14) | 4,500 | 2,655,486 | ||||||||
| BlueMountain CLO XXIV, Ltd. | ||||||||||
Series 2019-24A, Class E, 8.579%, (3 mo. USD LIBOR + 6.76%), 4/20/31(9)(14) | 1,000 | 620,511 | ||||||||
| BlueMountain CLO XXV, Ltd. | ||||||||||
Series 2019-25A, Class E, 8.531%, (3 mo. USD LIBOR + 6.70%), 7/15/32(9)(14) | 4,500 | 2,751,912 | ||||||||
| BlueMountain CLO XXVI, Ltd. | ||||||||||
Series 2019-26A, Class E, 9.526%, (3 mo. USD LIBOR + 7.70%), 10/20/32(9)(14) | 6,500 | 4,246,755 | ||||||||
| 44 | See Notes to Financial Statements. |
Eaton Vance
Limited Duration Income Fund
March 31, 2020
Portfolio of Investments — continued
| Security | Principal Amount (000’s omitted) | Value | ||||||||
| BlueMountain CLO, Ltd. | ||||||||||
Series 2016-3A, Class ER, 7.642%, (3 mo. USD LIBOR + 5.95%), 11/15/30(9)(14) | $ | 2,000 | $ | 1,213,776 | ||||||
Series 2018-1A, Class E, 7.72%, (3 mo. USD LIBOR + 5.95%), 7/30/30(9)(14) | 1,000 | 627,463 | ||||||||
| Canyon Capital CLO, Ltd. | ||||||||||
Series 2016-2A, Class ER, 7.831%, (3 mo. USD LIBOR + 6.00%), 10/15/31(9)(14) | 3,350 | 1,925,121 | ||||||||
Series 2019-2A, Class E, 9.238%, (3 mo. USD LIBOR + 7.15%), 10/15/32(9)(14) | 1,000 | 603,405 | ||||||||
| Carlyle Global Market Strategies CLO, Ltd. | ||||||||||
Series 2012-3A, Class DR2, 8.338%, (3 mo. USD LIBOR + 6.50%), 1/14/32(9)(14) | 2,000 | 1,259,940 | ||||||||
Series 2014-4RA, Class D, 7.481%, (3 mo. USD LIBOR + 5.65%), 7/15/30(9)(14) | 1,250 | 742,859 | ||||||||
Series 2015-5A, Class DR, 8.519%, (3 mo. USD LIBOR + 6.70%), 1/20/32(9)(14) | 1,000 | 653,843 | ||||||||
Series C17A, Class DR, 7.77%, (3 mo. USD LIBOR + 6.00%), 4/30/31(9)(14) | 1,750 | 1,119,907 | ||||||||
| Cedar Funding X CLO, Ltd. | ||||||||||
Series 2019-10A, Class E, 8.135%, (3 mo. USD LIBOR + 7.00%), 10/20/32(9)(14) | 1,500 | 876,942 | ||||||||
| Cole Park CLO, Ltd. | ||||||||||
Series 2015-1A, Class ER, 8.419%, (3 mo. USD LIBOR + 6.60%), 10/20/28(9)(14) | 2,000 | 1,370,004 | ||||||||
| Dryden Senior Loan Fund | ||||||||||
Series 2015-41A, Class ER, 7.131%, (3 mo. USD LIBOR + 5.30%), 4/15/31(9)(14) | 2,000 | 1,220,934 | ||||||||
Series 2016-42A, Class ER, 7.381%, (3 mo. USD LIBOR + 5.55%), 7/15/30(9)(14) | 1,000 | 616,434 | ||||||||
| FOCUS Brands Funding, LLC | ||||||||||
Series 2017-1A, Class A2I, 3.857%, 4/30/47(9) | 1,575 | 1,503,498 | ||||||||
| Fort Washington CLO, Ltd. | ||||||||||
Series 2019-1A, Class E, 9.158%, (3 mo. USD LIBOR + 7.25%), 10/20/32(9)(14) | 1,500 | 895,235 | ||||||||
| Galaxy XIX CLO, Ltd. | ||||||||||
Series 2015-19A, Class D2R, 8.801%, (3 mo. USD LIBOR + 7.00%), 7/24/30(9)(14) | 1,600 | 1,018,690 | ||||||||
| Galaxy XV CLO, Ltd. | ||||||||||
Series 2013-15A, Class ER, 8.476%, (3 mo. USD LIBOR + 6.65%), 10/15/30(9)(14) | 3,275 | 2,079,465 | ||||||||
| Galaxy XXI CLO, Ltd. | ||||||||||
Series 2015-21A, Class ER, 7.069%, (3 mo. USD LIBOR + 5.25%), 4/20/31(9)(14) | 1,100 | 613,432 | ||||||||
| Galaxy XXV CLO, Ltd. | ||||||||||
Series 2018-25A, Class E, 7.744%, (3 mo. USD LIBOR + 5.95%), 10/25/31(9)(14) | 1,000 | 577,881 | ||||||||
| Golub Capital Partners CLO, Ltd. | ||||||||||
Series 2018-37A, Class E, 7.569%, (3 mo. USD LIBOR + 5.75%), 7/20/30(9)(14) | 3,000 | 1,712,421 | ||||||||
| Security | Principal Amount (000’s omitted) | Value | ||||||||
| Kayne CLO 5, Ltd. | ||||||||||
Series 2019-5A, Class E, 8.501%, (3 mo. USD LIBOR + 6.70%), 7/24/32(9)(14) | $ | 4,550 | $ | 2,659,730 | ||||||
| Madison Park Funding XVII, Ltd. | ||||||||||
Series 2015-17A, Class ER, 8.319%, (3 mo. USD LIBOR + 6.50%), 7/21/30(9)(14) | 2,000 | 1,275,576 | ||||||||
| Madison Park Funding XXXVI, Ltd. | ||||||||||
Series 2019-36A, Class E, 9.192%, (3 mo. USD LIBOR + 7.25%), 1/15/33(9)(14) | 1,500 | 940,965 | ||||||||
| Madison Park Funding XXXVII, Ltd. | ||||||||||
Series 2019-37A, Class E, 8.381%, (3 mo. USD LIBOR + 6.55%), 7/15/32(9)(14) | 5,500 | 3,617,564 | ||||||||
| Magnetite XXII, Ltd. | ||||||||||
Series 2019-22A, Class E, 8.581%, (3 mo. USD LIBOR + 6.75%), 4/15/31(9)(14) | 1,500 | 996,438 | ||||||||
| Magnetite XXIV, Ltd. | ||||||||||
Series 2019-24A, Class E, 8.857%, (3 mo. USD LIBOR + 6.95%), 1/15/33(9)(14) | 3,000 | 1,787,361 | ||||||||
| MVW Owner Trust | ||||||||||
Series 2014-1A, Class A, 2.25%, 9/22/31(9) | 337 | 333,280 | ||||||||
| Neuberger Berman CLO XXII, Ltd. | ||||||||||
Series 2016-22A, Class ER, 7.896%, (3 mo. USD LIBOR + 6.06%), 10/17/30(9)(14) | 1,500 | 947,131 | ||||||||
| Neuberger Berman Loan Advisers CLO 30, Ltd. | ||||||||||
Series 2018-30A, Class E, 8.569%, (3 mo. USD LIBOR + 6.75%), 1/20/31(9)(14) | 2,000 | 1,330,762 | ||||||||
| Neuberger Berman Loan Advisers CLO 31, Ltd. | ||||||||||
Series 2019-31A, Class E, 8.569%, (3 mo. USD LIBOR + 6.75%), 4/20/31(9)(14) | 1,000 | 650,803 | ||||||||
| Neuberger Berman Loan Advisers CLO 33, Ltd. | ||||||||||
Series 2019-33A, Class E, 8.811%, (3 mo. USD LIBOR + 6.80%), 10/16/32(9)(14) | 2,250 | 1,368,533 | ||||||||
| Oaktree CLO, Ltd. | ||||||||||
Series 2019-3A, Class E, 8.589%, (3 mo. USD LIBOR + 6.77%), 7/20/31(9)(14) | 3,625 | 2,121,607 | ||||||||
| Palmer Square CLO, Ltd. | ||||||||||
Series 2013-2A, Class DRR, 7.686%, (3 mo. USD LIBOR + 5.85%), 10/17/31(9)(14) | 2,000 | 1,250,750 | ||||||||
Series 2018-2A, Class D, 7.443%, (3 mo. USD LIBOR + 5.60%), 7/16/31(9)(14) | 1,000 | 625,431 | ||||||||
Series 2019-1A, Class D, 8.935%, (3 mo. USD LIBOR + 7.00%), 11/14/32(9)(14) | 2,000 | 1,272,662 | ||||||||
| Purchasing Power Funding, LLC | ||||||||||
Series 2018-A, Class A, 3.34%, 8/15/22(9) | 3,200 | 3,191,204 | ||||||||
| Regatta IX Funding, Ltd. | ||||||||||
Series 2017-1A, Class E, 7.836%, (3 mo. USD LIBOR + 6.00%), 4/17/30(9)(14) | 450 | 281,666 | ||||||||
| Regatta XII Funding, Ltd. | ||||||||||
Series 2019-1A, Class E, 8.767%, (3 mo. USD LIBOR + 6.85%), 10/15/32(9)(14) | 2,000 | 1,172,478 | ||||||||
| 45 | See Notes to Financial Statements. |
Eaton Vance
Limited Duration Income Fund
March 31, 2020
Portfolio of Investments — continued
| Security | Principal Amount (000’s omitted) | Value | ||||||||||
| Regatta XIII Funding, Ltd. | ||||||||||||
Series 2018-2A, Class D, 7.781%, (3 mo. USD LIBOR + 5.95%), 7/15/31(9)(14) | $ | 2,000 | $ | 1,134,596 | ||||||||
| Regatta XIV Funding, Ltd. | ||||||||||||
Series 2018-3A, Class E, 7.744%, (3 mo. USD LIBOR + 5.95%), 10/25/31(9)(14) | 1,000 | 576,853 | ||||||||||
| Regatta XVI Funding, Ltd. | ||||||||||||
Series 2019-2A, Class E, 8.903%, (3 mo. USD LIBOR + 7.00%), 1/15/33(9)(14) | 1,800 | 1,063,348 | ||||||||||
| Southwick Park CLO, LLC | ||||||||||||
Series 2019-4A, Class E, 8.519%, (3 mo. USD LIBOR + 6.70%), 7/20/32(9)(14) | 6,000 | 3,654,516 | ||||||||||
| Trafigura Securitisation Finance PLC | ||||||||||||
Series 2017-1A, Class B, 2.405%, (1 mo. USD LIBOR + 1.70%), 12/15/20(9)(14) | 1,500 | 1,493,070 | ||||||||||
| Tricon American Homes Trust | ||||||||||||
Series 2016-SFR1, Class D, 3.886%, 11/17/33(9) | 1,300 | 1,276,953 | ||||||||||
| Vibrant CLO IX, Ltd. | ||||||||||||
Series 2018-9A, Class D, 8.069%, (3 mo. USD LIBOR + 6.25%), 7/20/31(9)(14) | 1,000 | 574,199 | ||||||||||
| Vibrant CLO XI, Ltd. | ||||||||||||
Series 2019-11A, Class D, 8.589%, (3 mo. USD LIBOR + 6.77%), 7/20/32(9)(14) | 575 | 333,156 | ||||||||||
| Voya CLO, Ltd. | ||||||||||||
Series 2015-3A, Class DR, 8.019%, (3 mo. USD LIBOR + 6.20%), 10/20/31(9)(14) | 3,000 | 1,908,591 | ||||||||||
Series 2016-3A, Class DR, 7.899%, (3 mo. USD LIBOR + 6.08%), 10/18/31(9)(14) | 1,400 | 809,824 | ||||||||||
Series 2019-4A, Class E, 9.223%, (3 mo. USD LIBOR + 7.48%), 1/15/33(9)(14) | 3,000 | 1,848,576 | ||||||||||
| Wellfleet CLO, Ltd. | ||||||||||||
Series 2020-1A, Class D, 8.422%, (3 mo. USD LIBOR + 7.24%), 4/15/33(9)(14) | 2,000 | 1,350,000 | ||||||||||
Total Asset-Backed Securities |
| $ | 85,127,367 | |||||||||
| Common Stocks — 0.4% |
| |||||||||||
| Security | Shares | Value | ||||||||||
| Aerospace and Defense — 0.0%(8) | ||||||||||||
IAP Global Services, LLC(3)(23)(24) | 31 | $ | 409,333 | |||||||||
| $ | 409,333 | |||||||||||
| Automotive — 0.0%(8) | ||||||||||||
Dayco Products, LLC(23)(24) | 27,250 | $ | 204,375 | |||||||||
| $ | 204,375 | |||||||||||
| Security | Shares | Value | ||||||||||
| Business Equipment and Services — 0.0%(8) | ||||||||||||
Crossmark Holdings, Inc.(23)(24) | 4,883 | $ | 267,344 | |||||||||
| $ | 267,344 | |||||||||||
| Electronics / Electrical — 0.0%(8) | ||||||||||||
Answers Corp.(3)(23) | 78,756 | $ | 145,699 | |||||||||
| $ | 145,699 | |||||||||||
| Health Care — 0.0% | ||||||||||||
New Millennium Holdco, Inc.(3)(23)(24) | 42,216 | $ | 0 | |||||||||
| $ | 0 | |||||||||||
| Oil and Gas — 0.1% | ||||||||||||
AFG Holdings, Inc.(3)(23)(24) | 29,751 | $ | 552,476 | |||||||||
Fieldwood Energy, Inc.(23)(24) | 10,085 | 15,128 | ||||||||||
Nine Point Energy Holdings, Inc.(3)(24)(25) | 29,787 | 298 | ||||||||||
RDV Resources, Inc., Class A(3)(23)(24) | 27,724 | 0 | ||||||||||
Samson Resources II, LLC, Class A(23) | 45,294 | 826,615 | ||||||||||
Southcross Holdings Group, LLC(3)(23)(24) | 78 | 0 | ||||||||||
Southcross Holdings L.P., Class A(23)(24) | 78 | 566 | ||||||||||
Sunrise Oil & Gas, Inc., Class A(23)(24) | 15,647 | 109,529 | ||||||||||
| $ | 1,504,612 | |||||||||||
| Publishing — 0.2% | ||||||||||||
ION Media Networks, Inc.(3)(23) | 5,187 | $ | 1,962,398 | |||||||||
Tweddle Group, Inc.(3)(23)(24) | 5,433 | 48,245 | ||||||||||
| $ | 2,010,643 | |||||||||||
| Radio and Television — 0.0%(8) | ||||||||||||
Clear Channel Outdoor Holdings, Inc.(23)(24) | 74,443 | $ | 47,643 | |||||||||
Cumulus Media, Inc., Class A(23)(24) | 50,522 | 273,829 | ||||||||||
iHeartMedia, Inc., Class A(23)(24) | 31,657 | 231,413 | ||||||||||
| $ | 552,885 | |||||||||||
| Retailers (Except Food and Drug) — 0.1% | ||||||||||||
David’s Bridal, LLC(3)(23)(24) | 40,851 | $ | 688,339 | |||||||||
| $ | 688,339 | |||||||||||
Total Common Stocks |
| $ | 5,783,230 | |||||||||
| 46 | See Notes to Financial Statements. |
Eaton Vance
Limited Duration Income Fund
March 31, 2020
Portfolio of Investments — continued
| Convertible Preferred Stocks — 0.0%(8) |
| |||||||||||
| Security | Shares | Value | ||||||||||
| Oil and Gas — 0.0%(8) | ||||||||||||
Nine Point Energy Holdings, Inc., Series A, 12.00%(3)(24)(25) | 555 | $ | 320,663 | |||||||||
Total Convertible Preferred Stocks |
| $ | 320,663 | |||||||||
| Preferred Stocks — 0.1% |
| |||||||||||
| Security | Shares | Value | ||||||||||
| Building and Development — 0.1% | ||||||||||||
Brookfield Property Partners, L.P., 5.75%(23) | 40,000 | $ | 560,000 | |||||||||
| $ | 560,000 | |||||||||||
| Pipelines — 0.0%(8) | ||||||||||||
NuStar Energy, L.P., Series B, 7.625% to 6/15/22 (11) | 31,500 | $ | 305,550 | |||||||||
| $ | 305,550 | |||||||||||
| Retailers (Except Food and Drug) — 0.0%(8) | ||||||||||||
David’s Bridal, LLC, Series A(3)(23)(24) | 1,136 | $ | 90,880 | |||||||||
David’s Bridal, LLC, Series B(3)(23)(24) | 4,631 | 374,926 | ||||||||||
| $ | 465,806 | |||||||||||
Total Preferred Stocks |
| $ | 1,331,356 | |||||||||
| Closed-End Funds — 1.4% |
| |||||||||||
| Security | Shares | Value | ||||||||||
BlackRock Corporate High Yield Fund, Inc. |
| 2,089,114 | $ | 18,384,203 | ||||||||
Total Closed-End Funds |
| $ | 18,384,203 | |||||||||
| Warrants — 0.0% |
| |||||||||||
| Security | Shares | Value | ||||||||||
| Retailers (Except Food and Drug) — 0.0% | ||||||||||||
David’s Bridal, LLC, Exp. 11/26/22(3)(23)(24) | 8 | $ | 0 | |||||||||
Total Warrants |
| $ | 0 | |||||||||
| Miscellaneous — 0.0%(8) |
| |||||||||||
| Security | Shares | Value | ||||||||||
| Cable and Satellite Television — 0.0% | ||||||||||||
ACC Claims Holdings, LLC(3)(24) | 2,257,600 | $ | 0 | |||||||||
| $ | 0 | |||||||||||
| Oil and Gas — 0.0%(8) | ||||||||||||
Paragon Offshore Finance Company, Class A(23)(24) | 2,021 | $ | 606 | |||||||||
Paragon Offshore Finance Company, Class B(23)(24) | 1,011 | 19,462 | ||||||||||
| $ | 20,068 | |||||||||||
Total Miscellaneous |
| $ | 20,068 | |||||||||
| Short-Term Investments — 1.8% |
| |||||||||||
| U.S. Treasury Obligations — 0.0%(8) |
| |||||||||||
| Security | Principal Amount (000’s omitted) | Value | ||||||||||
U.S. Treasury Bill, 0.00%, 4/9/20 | $ | 500 | $ | 499,995 | ||||||||
Total U.S. Treasury Obligations |
| $ | 499,995 | |||||||||
| Other — 1.8% |
| |||||||||||
| Description | Units | Value | ||||||||||
Eaton Vance Cash Reserves Fund, LLC, 0.69%(26) | 24,671,567 | $ | 24,661,698 | |||||||||
Total Other |
| $ | 24,661,698 | |||||||||
Total Short-Term Investments |
| $ | 25,161,693 | |||||||||
Total Investments — 157.7% |
| $ | 2,154,259,753 | |||||||||
Less Unfunded Loan Commitments — (0.0)%(8) |
| $ | (305,068 | ) | ||||||||
Net Investments — 157.7% |
| $ | 2,153,954,685 | |||||||||
Other Assets, Less Liabilities — (41.9)% |
| $ | (572,685,844 | ) | ||||||||
Auction Preferred Shares Plus Cumulative Unpaid |
| $ | (216,071,902 | ) | ||||||||
Net Assets Applicable to Common Shares — 100.0% |
| $ | 1,365,196,939 | |||||||||
| 47 | See Notes to Financial Statements. |
Eaton Vance
Limited Duration Income Fund
March 31, 2020
Portfolio of Investments — continued
The percentage shown for each investment category in the Portfolio of Investments is based on net assets applicable to common shares.
| * | In U.S. dollars unless otherwise indicated. |
| (1) | Senior floating-rate loans (Senior Loans) often require prepayments from excess cash flows or permit the borrowers to repay at their election. The degree to which borrowers repay, whether as a contractual requirement or at their election, cannot be predicted with accuracy. As a result, the actual remaining maturity may be substantially less than the stated maturities shown. However, Senior Loans will typically have an expected average life of approximately two to four years. Senior Loans typically have rates of interest which are redetermined periodically by reference to a base lending rate, plus a spread. These base lending rates are primarily the London Interbank Offered Rate (“LIBOR”) and secondarily, the prime rate offered by one or more major United States banks (the “Prime Rate”). Base lending rates may be subject to a floor, or minimum rate. |
| (2) | Unfunded or partially unfunded loan commitments. The stated interest rate reflects the weighted average of the reference rate and spread for the funded portion, if any, and the commitment fees on the portion of the loan that is unfunded. At March 31, 2020, the total value of unfunded loan commitments is $270,380. See Note 1F for description. |
| (3) | For fair value measurement disclosure purposes, security is categorized as Level 3 (see Note 12). |
| (4) | The stated interest rate represents the weighted average interest rate at March 31, 2020 of contracts within the senior loan facility. Interest rates on contracts are primarily redetermined either weekly, monthly or quarterly by reference to the indicated base lending rate and spread and the reset period. |
| (5) | This Senior Loan will settle after March 31, 2020, at which time the interest rate will be determined. |
| (6) | Fixed-rate loan. |
| (7) | Issuer is in default with respect to interest and/or principal payments. For a variable rate security, interest rate has been adjusted to reflect non-accrual status. |
| (8) | Amount is less than 0.05% or (0.05)%, as applicable. |
| (9) | Security exempt from registration pursuant to Rule 144A under the Securities Act of 1933, as amended. These securities may be sold in certain transactions in reliance on an exemption from registration (normally to qualified institutional buyers). At March 31, 2020, the aggregate value of these securities is $568,314,848 or 41.6% of the Fund’s net assets applicable to common shares. |
| (10) | Security exempt from registration under Regulation S of the Securities Act of 1933, which exempts from registration securities offered and sold outside the United States. Security may not be offered or sold in the United States except pursuant to an exemption from, or in a transaction not subject to, the registration requirements of the Securities Act of 1933. At March 31, 2020, the aggregate value of these securities is $91,039,923 or 6.7% of the Fund’s net assets applicable to common shares. |
| (11) | Security converts to variable rate after the indicated fixed-rate coupon period. |
| (12) | Perpetual security with no stated maturity date but may be subject to calls by the issuer. |
| (13) | Represents a payment-in-kind security which may pay interest in additional principal at the issuer’s discretion. |
| (14) | Variable rate security. The stated interest rate represents the rate in effect at March 31, 2020. |
| (15) | Amounts payable in respect of the security are contingent upon and determined by reference to Ukraine’s GDP and Real GDP Growth Rate. Principal amount represents the notional amount used to calculate payments due to the security holder and does not represent an entitlement for payment. |
| (16) | Loan is subject to scheduled mandatory prepayments. Maturity date shown reflects the final maturity date. |
| (17) | Adjustable rate mortgage security whose interest rate generally adjusts monthly based on a weighted average of interest rates on the underlying mortgages. The coupon rate may not reflect the applicable index value as interest rates on the underlying mortgages may adjust on various dates and at various intervals and may be subject to lifetime ceilings and lifetime floors and lookback periods. Rate shown is the coupon rate at March 31, 2020. |
| (18) | Security (or a portion thereof) has been pledged for the benefit of the counterparty for reverse repurchase agreements. |
| (19) | Weighted average fixed-rate coupon that changes/updates monthly. Rate shown is the rate at March 31, 2020. |
| (20) | Inverse floating-rate security whose coupon varies inversely with changes in the interest rate index. The stated interest rate represents the coupon rate in effect at March 31, 2020. |
| (21) | Interest only security that entitles the holder to receive only interest payments on the underlying mortgages. Principal amount shown is the notional amount of the underlying mortgages on which coupon interest is calculated. |
| (22) | Principal only security that entitles the holder to receive only principal payments on the underlying mortgages. |
| (23) | Security was acquired in connection with a restructuring of a Senior Loan and may be subject to restrictions on resale. |
| (24) | Non-income producing security. |
| (25) | Restricted security (see Note 7). |
| (26) | Affiliated investment company, available to Eaton Vance portfolios and funds, which invests in high quality, U.S. dollar denominated money market instruments. The rate shown is the annualized seven-day yield as of March 31, 2020. |
| 48 | See Notes to Financial Statements. |
Eaton Vance
Limited Duration Income Fund
March 31, 2020
Portfolio of Investments — continued
| Centrally Cleared Forward Foreign Currency Exchange Contracts | ||||||||||||||||||
| Currency Purchased | Currency Sold | Settlement Date | Value/ Unrealized Appreciation (Depreciation) | |||||||||||||||
| USD | 1,929,502 | EUR | 1,780,945 | 4/9/20 | $ | (35,092 | ) | |||||||||||
| EUR | 1,000,000 | USD | 1,072,250 | 4/15/20 | 31,143 | |||||||||||||
| USD | 450,662 | EUR | 413,924 | 4/15/20 | (6,059 | ) | ||||||||||||
| USD | 690,093 | EUR | 637,117 | 4/15/20 | (12,897 | ) | ||||||||||||
| USD | 793,454 | EUR | 732,523 | 4/15/20 | (14,806 | ) | ||||||||||||
| USD | 2,302,599 | EUR | 2,116,204 | 4/15/20 | (32,405 | ) | ||||||||||||
| USD | 2,646,908 | EUR | 2,430,362 | 4/15/20 | (34,737 | ) | ||||||||||||
| USD | 2,338,216 | EUR | 2,155,199 | 4/15/20 | (39,815 | ) | ||||||||||||
| EUR | 19,140 | USD | 20,882 | 7/17/20 | 309 | |||||||||||||
| EUR | 273,518 | USD | 308,482 | 7/17/20 | (5,648 | ) | ||||||||||||
| USD | 330,069 | EUR | 292,658 | 7/17/20 | 6,043 | |||||||||||||
| $ | (143,964 | ) | ||||||||||||||||
| Forward Foreign Currency Exchange Contracts | ||||||||||||||||||||||
| Currency Purchased | Currency Sold | Counterparty | Settlement Date | Unrealized Appreciation | Unrealized (Depreciation) | |||||||||||||||||
| EUR | 1,240,608 | USD | 1,419,186 | JPMorgan Chase Bank, N.A. | 4/2/20 | $ | — | $ | (50,920 | ) | ||||||||||||
| EUR | 2,687,855 | USD | 3,004,177 | Standard Chartered Bank | 4/2/20 | — | (39,743 | ) | ||||||||||||||
| EUR | 1,851,964 | USD | 1,979,337 | State Street Bank and Trust Company | 4/2/20 | 63,194 | — | |||||||||||||||
| EUR | 944,186 | USD | 1,015,082 | State Street Bank and Trust Company | 4/2/20 | 26,261 | — | |||||||||||||||
| EUR | 609,736 | USD | 698,635 | State Street Bank and Trust Company | 4/2/20 | — | (26,158 | ) | ||||||||||||||
| USD | 2,024,387 | EUR | 1,850,344 | Bank of America, N.A. | 4/2/20 | — | (16,356 | ) | ||||||||||||||
| USD | 1,116,415 | EUR | 997,500 | Goldman Sachs International | 4/2/20 | 16,273 | — | |||||||||||||||
| USD | 1,128,555 | EUR | 1,000,000 | HSBC Bank USA, N.A. | 4/2/20 | 25,656 | — | |||||||||||||||
| USD | 1,112,082 | EUR | 997,468 | JPMorgan Chase Bank, N.A. | 4/2/20 | 11,975 | — | |||||||||||||||
| USD | 832,452 | EUR | 750,000 | JPMorgan Chase Bank, N.A. | 4/2/20 | 5,277 | — | |||||||||||||||
| USD | 26,384,990 | EUR | 23,976,443 | Standard Chartered Bank | 4/2/20 | — | (58,614 | ) | ||||||||||||||
| EUR | 249,660 | USD | 268,395 | Bank of America, N.A. | 4/30/20 | 7,248 | — | |||||||||||||||
| EUR | 153,332 | USD | 164,749 | Bank of America, N.A. | 4/30/20 | 4,541 | — | |||||||||||||||
| EUR | 341,868 | USD | 373,251 | Bank of America, N.A. | 4/30/20 | 4,197 | — | |||||||||||||||
| EUR | 127,780 | USD | 137,369 | Bank of America, N.A. | 4/30/20 | 3,710 | — | |||||||||||||||
| EUR | 230,491 | USD | 251,007 | Bank of America, N.A. | 4/30/20 | 3,472 | — | |||||||||||||||
| EUR | 120,529 | USD | 131,593 | Bank of America, N.A. | 4/30/20 | 1,480 | — | |||||||||||||||
| EUR | 397,131 | USD | 438,601 | Bank of America, N.A. | 4/30/20 | — | (138 | ) | ||||||||||||||
| EUR | 649,163 | USD | 716,951 | Bank of America, N.A. | 4/30/20 | — | (225 | ) | ||||||||||||||
| EUR | 187,794 | USD | 209,059 | Bank of America, N.A. | 4/30/20 | — | (1,720 | ) | ||||||||||||||
| EUR | 117,227 | USD | 134,111 | Bank of America, N.A. | 4/30/20 | — | (4,684 | ) | ||||||||||||||
| EUR | 365,982 | USD | 410,095 | Bank of America, N.A. | 4/30/20 | — | (6,023 | ) | ||||||||||||||
| EUR | 486,889 | USD | 544,116 | Bank of America, N.A. | 4/30/20 | — | (6,554 | ) | ||||||||||||||
| EUR | 416,980 | USD | 467,240 | Bank of America, N.A. | 4/30/20 | — | (6,862 | ) | ||||||||||||||
| EUR | 245,424 | USD | 280,773 | Bank of America, N.A. | 4/30/20 | — | (9,806 | ) | ||||||||||||||
| 49 | See Notes to Financial Statements. |
Eaton Vance
Limited Duration Income Fund
March 31, 2020
Portfolio of Investments — continued
| Forward Foreign Currency Exchange Contracts (continued) | ||||||||||||||||||||||
| Currency Purchased | Currency Sold | Counterparty | Settlement Date | Unrealized Appreciation | Unrealized (Depreciation) | |||||||||||||||||
| EUR | 895,929 | USD | 1,001,234 | Bank of America, N.A. | 4/30/20 | $ | — | $ | (12,059 | ) | ||||||||||||
| EUR | 365,142 | USD | 417,825 | Bank of America, N.A. | 4/30/20 | — | (14,681 | ) | ||||||||||||||
| EUR | 209,782 | USD | 231,685 | Citibank, N.A. | 4/30/20 | — | (70 | ) | ||||||||||||||
| EUR | 526,348 | USD | 567,646 | Goldman Sachs International | 4/30/20 | 13,482 | — | |||||||||||||||
| EUR | 220,606 | USD | 237,915 | Goldman Sachs International | 4/30/20 | 5,651 | — | |||||||||||||||
| EUR | 689,308 | USD | 778,910 | Goldman Sachs International | 4/30/20 | — | (17,861 | ) | ||||||||||||||
| EUR | 695,916 | USD | 786,377 | Goldman Sachs International | 4/30/20 | — | (18,033 | ) | ||||||||||||||
| EUR | 2,242,007 | USD | 2,492,743 | HSBC Bank USA, N.A. | 4/30/20 | — | (17,396 | ) | ||||||||||||||
| EUR | 184,248 | USD | 196,907 | State Street Bank and Trust Company | 4/30/20 | 6,516 | — | |||||||||||||||
| EUR | 505,673 | USD | 552,135 | State Street Bank and Trust Company | 4/30/20 | 6,167 | — | |||||||||||||||
| EUR | 242,683 | USD | 262,858 | State Street Bank and Trust Company | 4/30/20 | 5,083 | — | |||||||||||||||
| EUR | 281,032 | USD | 306,603 | State Street Bank and Trust Company | 4/30/20 | 3,678 | — | |||||||||||||||
| EUR | 72,423 | USD | 77,624 | State Street Bank and Trust Company | 4/30/20 | 2,336 | — | |||||||||||||||
| EUR | 68,161 | USD | 73,827 | State Street Bank and Trust Company | 4/30/20 | 1,428 | — | |||||||||||||||
| EUR | 140,951 | USD | 154,578 | State Street Bank and Trust Company | 4/30/20 | 1,042 | — | |||||||||||||||
| EUR | 285,584 | USD | 314,966 | State Street Bank and Trust Company | 4/30/20 | 341 | — | |||||||||||||||
| GBP | 116,526 | USD | 140,943 | Bank of America, N.A. | 4/30/20 | 3,882 | — | |||||||||||||||
| GBP | 63,924 | USD | 75,633 | Bank of America, N.A. | 4/30/20 | 3,815 | — | |||||||||||||||
| GBP | 94,330 | USD | 116,714 | Bank of America, N.A. | 4/30/20 | 524 | — | |||||||||||||||
| GBP | 2,648 | USD | 3,133 | Bank of America, N.A. | 4/30/20 | 158 | — | |||||||||||||||
| GBP | 2,671 | USD | 3,231 | Bank of America, N.A. | 4/30/20 | 89 | — | |||||||||||||||
| GBP | 73,248 | USD | 87,084 | State Street Bank and Trust Company | 4/30/20 | 3,952 | — | |||||||||||||||
| GBP | 55,842 | USD | 65,858 | State Street Bank and Trust Company | 4/30/20 | 3,545 | — | |||||||||||||||
| GBP | 43,613 | USD | 51,367 | State Street Bank and Trust Company | 4/30/20 | 2,837 | — | |||||||||||||||
| GBP | 119,453 | USD | 146,632 | State Street Bank and Trust Company | 4/30/20 | 1,830 | — | |||||||||||||||
| GBP | 3,917 | USD | 4,620 | State Street Bank and Trust Company | 4/30/20 | 249 | — | |||||||||||||||
| GBP | 2,763 | USD | 3,285 | State Street Bank and Trust Company | 4/30/20 | 149 | — | |||||||||||||||
| GBP | 2,280 | USD | 2,685 | State Street Bank and Trust Company | 4/30/20 | 148 | — | |||||||||||||||
| GBP | 6,772 | USD | 8,313 | State Street Bank and Trust Company | 4/30/20 | 104 | — | |||||||||||||||
| GBP | 8,406 | USD | 10,861 | State Street Bank and Trust Company | 4/30/20 | — | (414 | ) | ||||||||||||||
| GBP | 14,121 | USD | 18,106 | State Street Bank and Trust Company | 4/30/20 | — | (555 | ) | ||||||||||||||
| GBP | 96,634 | USD | 123,902 | State Street Bank and Trust Company | 4/30/20 | — | (3,801 | ) | ||||||||||||||
| GBP | 139,110 | USD | 179,775 | State Street Bank and Trust Company | 4/30/20 | — | (6,882 | ) | ||||||||||||||
| GBP | 101,773 | USD | 133,471 | State Street Bank and Trust Company | 4/30/20 | — | (6,983 | ) | ||||||||||||||
| GBP | 213,510 | USD | 276,545 | State Street Bank and Trust Company | 4/30/20 | — | (11,184 | ) | ||||||||||||||
| USD | 12,006,878 | EUR | 10,844,000 | Bank of America, N.A. | 4/30/20 | 34,269 | — | |||||||||||||||
| USD | 1,866,469 | EUR | 1,682,724 | Bank of America, N.A. | 4/30/20 | 8,612 | — | |||||||||||||||
| USD | 232,820 | EUR | 204,851 | Bank of America, N.A. | 4/30/20 | 6,648 | — | |||||||||||||||
| USD | 1,794,831 | EUR | 1,621,000 | Bank of America, N.A. | 4/30/20 | 5,123 | — | |||||||||||||||
| USD | 138,676 | EUR | 122,664 | Bank of America, N.A. | 4/30/20 | 3,246 | — | |||||||||||||||
| USD | 224,459 | EUR | 201,248 | Bank of America, N.A. | 4/30/20 | 2,265 | — | |||||||||||||||
| USD | 173,028 | EUR | 156,411 | Bank of America, N.A. | 4/30/20 | 339 | — | |||||||||||||||
| USD | 110,885 | EUR | 100,444 | Bank of America, N.A. | 4/30/20 | — | (13 | ) | ||||||||||||||
| USD | 412,277 | EUR | 374,789 | Bank of America, N.A. | 4/30/20 | — | (1,519 | ) | ||||||||||||||
| USD | 254,504 | EUR | 235,000 | Bank of America, N.A. | 4/30/20 | — | (4,954 | ) | ||||||||||||||
| 50 | See Notes to Financial Statements. |
Eaton Vance
Limited Duration Income Fund
March 31, 2020
Portfolio of Investments — continued
| Forward Foreign Currency Exchange Contracts (continued) | ||||||||||||||||||||||||
| Currency Purchased | Currency Sold | Counterparty | Settlement Date | Unrealized Appreciation | Unrealized (Depreciation) | |||||||||||||||||||
| USD | 1,233,531 | EUR | 1,139,000 | Bank of America, N.A. | 4/30/20 | $ | — | $ | (24,012 | ) | ||||||||||||||
| USD | 4,507,852 | EUR | 4,071,244 | Citibank, N.A. | 4/30/20 | 12,886 | — | |||||||||||||||||
| USD | 674,215 | EUR | 608,914 | Citibank, N.A. | 4/30/20 | 1,927 | — | |||||||||||||||||
| USD | 6,078,643 | EUR | 5,490,000 | Goldman Sachs International | 4/30/20 | 17,261 | — | |||||||||||||||||
| USD | 909,028 | EUR | 821,000 | Goldman Sachs International | 4/30/20 | 2,581 | — | |||||||||||||||||
| USD | 101,070 | EUR | 91,994 | Goldman Sachs International | 4/30/20 | — | (499 | ) | ||||||||||||||||
| USD | 26,998,759 | EUR | 24,239,895 | HSBC Bank USA, N.A. | 4/30/20 | 236,052 | — | |||||||||||||||||
| USD | 2,486,529 | EUR | 2,242,007 | HSBC Bank USA, N.A. | 4/30/20 | 11,181 | — | |||||||||||||||||
| USD | 231,146 | EUR | 208,219 | HSBC Bank USA, N.A. | 4/30/20 | 1,256 | — | |||||||||||||||||
| USD | 3,137,200 | EUR | 2,820,520 | State Street Bank and Trust Company | 4/30/20 | 23,129 | — | |||||||||||||||||
| USD | 423,055 | EUR | 380,350 | State Street Bank and Trust Company | 4/30/20 | 3,119 | — | |||||||||||||||||
| USD | 111,397 | EUR | 100,000 | State Street Bank and Trust Company | 4/30/20 | 989 | — | |||||||||||||||||
| USD | 127,684 | EUR | 115,000 | State Street Bank and Trust Company | 4/30/20 | 715 | — | |||||||||||||||||
| USD | 902,980 | EUR | 817,500 | State Street Bank and Trust Company | 4/30/20 | 397 | — | |||||||||||||||||
| USD | 110,656 | EUR | 100,000 | State Street Bank and Trust Company | 4/30/20 | 248 | — | |||||||||||||||||
| USD | 506,978 | EUR | 458,985 | State Street Bank and Trust Company | 4/30/20 | 223 | — | |||||||||||||||||
| USD | 108,931 | EUR | 98,646 | State Street Bank and Trust Company | 4/30/20 | 18 | — | |||||||||||||||||
| USD | 363,951 | EUR | 330,000 | State Street Bank and Trust Company | 4/30/20 | — | (394 | ) | ||||||||||||||||
| USD | 220,035 | EUR | 200,000 | State Street Bank and Trust Company | 4/30/20 | — | (780 | ) | ||||||||||||||||
| USD | 180,922 | EUR | 167,000 | State Street Bank and Trust Company | 4/30/20 | — | (3,459 | ) | ||||||||||||||||
| USD | 978,278 | EUR | 903,000 | State Street Bank and Trust Company | 4/30/20 | — | (18,704 | ) | ||||||||||||||||
| USD | 329,923 | GBP | 253,935 | Bank of America, N.A. | 4/30/20 | 14,321 | — | |||||||||||||||||
| USD | 339,661 | GBP | 262,486 | Bank of America, N.A. | 4/30/20 | 13,431 | — | |||||||||||||||||
| USD | 3,225,330 | GBP | 2,470,000 | Citibank, N.A. | 4/30/20 | 155,494 | — | |||||||||||||||||
| USD | 228,515 | GBP | 175,000 | Citibank, N.A. | 4/30/20 | 11,017 | — | |||||||||||||||||
| USD | 236,822 | GBP | 189,273 | Citibank, N.A. | 4/30/20 | 1,585 | — | |||||||||||||||||
| USD | 2,275,193 | GBP | 1,742,442 | State Street Bank and Trust Company | 4/30/20 | 109,602 | — | |||||||||||||||||
| USD | 222,274 | GBP | 170,000 | State Street Bank and Trust Company | 4/30/20 | 10,990 | — | |||||||||||||||||
| USD | 160,324 | GBP | 122,783 | State Street Bank and Trust Company | 4/30/20 | 7,723 | — | |||||||||||||||||
| USD | 55,786 | GBP | 44,893 | State Street Bank and Trust Company | 4/30/20 | — | (9 | ) | ||||||||||||||||
| USD | 113,100 | GBP | 95,000 | State Street Bank and Trust Company | 4/30/20 | — | (4,971 | ) | ||||||||||||||||
| EUR | 1,850,344 | USD | 2,027,137 | Bank of America, N.A. | 5/5/20 | 16,202 | — | |||||||||||||||||
| USD | 24,430,340 | EUR | 22,237,405 | Standard Chartered Bank | 5/5/20 | — | (126,473 | ) | ||||||||||||||||
| EUR | 1,500,000 | USD | 1,607,159 | JPMorgan Chase Bank, N.A. | 5/29/20 | 50,834 | — | |||||||||||||||||
| EUR | 882,476 | USD | 974,894 | JPMorgan Chase Bank, N.A. | 5/29/20 | 532 | — | |||||||||||||||||
| USD | 3,914,999 | EUR | 3,500,000 | Bank of America, N.A. | 5/29/20 | 46,350 | — | |||||||||||||||||
| USD | 23,973,310 | EUR | 21,685,000 | State Street Bank and Trust Company | 5/29/20 | 4,267 | — | |||||||||||||||||
| USD | 1,674,532 | EUR | 1,530,250 | State Street Bank and Trust Company | 5/29/20 | — | (16,896 | ) | ||||||||||||||||
| USD | 4,587,178 | GBP | 3,686,943 | State Street Bank and Trust Company | 5/29/20 | 2,638 | — | |||||||||||||||||
| $ | 1,057,760 | $ | (540,405 | ) | ||||||||||||||||||||
| 51 | See Notes to Financial Statements. |
Eaton Vance
Limited Duration Income Fund
March 31, 2020
Portfolio of Investments — continued
| Futures Contracts | ||||||||||||||||||||
| Description | Number of Contracts | Position | Expiration Date | Notional Amount | Value/ Unrealized Appreciation (Depreciation) | |||||||||||||||
Interest Rate Futures | ||||||||||||||||||||
| 5-Year USD Deliverable Interest Rate Swap | 9 | Short | 6/15/20 | $ | (934,805 | ) | $ | (3,867 | ) | |||||||||||
| 10-Year USD Deliverable Interest Rate Swap | 12 | Short | 6/15/20 | (1,262,813 | ) | 12,844 | ||||||||||||||
| Euro-Bobl | 11 | Short | 6/8/20 | (1,640,353 | ) | 11,525 | ||||||||||||||
| U.S. 10-Year Treasury Note | 310 | Long | 6/19/20 | 42,993,125 | 1,571,406 | |||||||||||||||
| U.S. Long Treasury Bond | 24 | Short | 6/19/20 | (4,297,500 | ) | (277,784 | ) | |||||||||||||
| U.S. Long Treasury Bond | 158 | Long | 6/19/20 | 28,291,875 | 2,002,501 | |||||||||||||||
| U.S. Ultra 10-Year Treasury Note | 475 | Long | 6/19/20 | 74,114,844 | 1,424,159 | |||||||||||||||
| $ | 4,740,784 | |||||||||||||||||||
| Centrally Cleared Interest Rate Swaps | ||||||||||||||||||||||||||
| Notional Amount (000’s omitted) | Fund Pays/ Receives Floating Rate | Floating Rate | Annual Fixed Rate | Termination Date | Value | Unamortized Upfront Receipts (Payments) | Unrealized Appreciation (Depreciation) | |||||||||||||||||||
| EUR | 950 | Receives | 6-month EURIBOR(pays semi-annually) | (0.53)% (pays annually) | 8/22/24 | $ | 15,167 | $ | — | $ | 15,167 | |||||||||||||||
| EUR | 246 | Receives | 6-month EURIBOR(pays semi-annually) | 0.37% (pays annually) | 2/12/50 | (16,006 | ) | — | (16,006 | ) | ||||||||||||||||
| EUR | 207 | Receives | 6-month EURIBOR (pays semi-annually) | 0.38% (pays annually) | 2/13/50 | (13,907 | ) | 3 | (13,904 | ) | ||||||||||||||||
| EUR | 61 | Receives | 6-month EURIBOR (pays semi-annually) | 0.38% (pays annually) | 2/13/50 | (4,176 | ) | — | (4,176 | ) | ||||||||||||||||
| EUR | 242 | Receives | 6-month EURIBOR (pays semi-annually) | 0.39% (pays annually) | 2/13/50 | (16,839 | ) | — | (16,839 | ) | ||||||||||||||||
| EUR | 104 | Receives | 6-month EURIBOR (pays semi-annually) | 0.39% (pays annually) | 2/14/50 | (7,397 | ) | — | (7,397 | ) | ||||||||||||||||
| EUR | 525 | Receives | 6-month EURIBOR (pays semi-annually) | 0.32% (pays annually) | 2/21/50 | (25,289 | ) | — | (25,289 | ) | ||||||||||||||||
| EUR | 1,500 | Receives | 6-month EURIBOR (pays semi-annually) | 0.26% (pays annually) | 2/25/50 | (44,202 | ) | — | (44,202 | ) | ||||||||||||||||
| EUR | 260 | Receives | 6-month EURIBOR (pays semi-annually) | 0.21% (pays annually) | 2/26/50 | (3,373 | ) | (2 | ) | (3,375 | ) | |||||||||||||||
| USD | 760 | Receives | 3-month USD-LIBOR (pays quarterly) | 1.93% (pays semi- annually) | 11/3/20 | (8,424 | ) | — | (8,424 | ) | ||||||||||||||||
| USD | 100 | Receives | 3-month USD-LIBOR (pays quarterly) | 1.96%(pays semi-annually) | 11/17/20 | (1,205 | ) | (57 | ) | (1,262 | ) | |||||||||||||||
| USD | 650 | Receives | 3-month USD-LIBOR (pays quarterly) | 2.68%(pays semi-annually) | 3/16/21 | (13,749 | ) | (95 | ) | (13,844 | ) | |||||||||||||||
| USD | 2,680 | Receives | 3-month USD-LIBOR (pays quarterly) | 0.55% (pays semi-annually) | 3/12/23 | (9,287 | ) | — | (9,287 | ) | ||||||||||||||||
| USD | 1,146 | Receives | 3-month USD-LIBOR (pays quarterly) | 1.44% (pays semi-annually) | 9/26/24 | (48,424 | ) | — | (48,424 | ) | ||||||||||||||||
| 52 | See Notes to Financial Statements. |
Eaton Vance
Limited Duration Income Fund
March 31, 2020
Portfolio of Investments — continued
| Centrally Cleared Interest Rate Swaps (continued) | ||||||||||||||||||||||||||
| Notional Amount (000’s omitted) | Fund Pays/ Receives Floating Rate | Floating Rate | Annual Fixed Rate | Termination Date | Value | Unamortized Upfront Receipts (Payments) | Unrealized Appreciation (Depreciation) | |||||||||||||||||||
| USD | 200 | Receives | 3-month USD-LIBOR (pays quarterly) | 1.49% (pays semi-annually) | 1/28/25 | $ | (9,149 | ) | $ | — | $ | (9,149 | ) | |||||||||||||
| USD | 461 | Receives | 3-month USD-LIBOR (pays quarterly) | 1.46% (pays semi-annually) | 1/30/25 | (20,569 | ) | — | (20,569 | ) | ||||||||||||||||
| USD | 800 | Receives | 3-month USD-LIBOR (pays quarterly) | 1.41% (pays semi-annually) | 2/3/25 | (33,711 | ) | — | (33,711 | ) | ||||||||||||||||
| USD | 260 | Receives | 3-month USD-LIBOR (pays quarterly) | 1.44% (pays semi-annually) | 2/18/25 | (11,772 | ) | — | (11,772 | ) | ||||||||||||||||
| USD | 200 | Receives | 3-month USD-LIBOR (pays quarterly) | 1.16% (pays semi-annually) | 2/28/25 | (6,172 | ) | — | (6,172 | ) | ||||||||||||||||
| USD | 120 | Receives | 3-month USD-LIBOR (pays quarterly) | 0.83% (pays semi-annually) | 3/5/25 | (1,826 | ) | — | (1,826 | ) | ||||||||||||||||
| USD | 3,160 | Receives | 3-month USD-LIBOR (pays quarterly) | 1.74% (pays semi-annually) | 12/16/26 | (254,701 | ) | — | (254,701 | ) | ||||||||||||||||
| USD | 1,954 | Receives | 3-month USD-LIBOR (pays quarterly) | 2.63% (pays semi-annually) | 3/25/29 | (331,134 | ) | 16,659 | (314,475 | ) | ||||||||||||||||
| USD | 5,222 | Receives | 3-month USD-LIBOR (pays quarterly) | 2.09% (pays semi-annually) | 7/15/29 | (649,043 | ) | 1,647 | (647,396 | ) | ||||||||||||||||
| USD | 427 | Receives | 3-month USD-LIBOR (pays quarterly) | 2.03% (pays semi-annually) | 7/17/29 | (50,771 | ) | (362 | ) | (51,133 | ) | |||||||||||||||
| USD | 1,885 | Receives | 3-month USD-LIBOR (pays quarterly) | 1.74% (pays semi-annually) | 12/12/29 | (192,714 | ) | — | (192,714 | ) | ||||||||||||||||
| USD | 3,170 | Receives | 3-month USD-LIBOR (pays quarterly) | 1.74% (pays semi-annually) | 12/12/29 | (321,871 | ) | — | (321,871 | ) | ||||||||||||||||
| USD | 800 | Receives | 3-month USD-LIBOR (pays quarterly) | 1.76% (pays semi-annually) | 12/12/29 | (83,264 | ) | — | (83,264 | ) | ||||||||||||||||
| USD | 787 | Receives | 3-month USD-LIBOR (pays quarterly) | 1.61% (pays semi-annually) | 2/7/30 | (65,646 | ) | — | (65,646 | ) | ||||||||||||||||
| USD | 720 | Receives | 3-month USD-LIBOR (pays quarterly) | 1.57% (pays semi-annually) | 2/14/30 | (57,785 | ) | — | (57,785 | ) | ||||||||||||||||
| USD | 370 | Receives | 3-month USD-LIBOR (pays quarterly) | 1.58% (pays semi-annually) | 2/14/30 | (30,018 | ) | — | (30,018 | ) | ||||||||||||||||
| USD | 890 | Receives | 3-month USD-LIBOR (pays quarterly) | 1.56% (pays semi-annually) | 2/18/30 | (71,533 | ) | — | (71,533 | ) | ||||||||||||||||
| USD | 1,280 | Receives | 3-month USD-LIBOR (pays quarterly) | 2.88% (pays semi-annually) | 1/31/49 | (652,890 | ) | (647 | ) | (653,537 | ) | |||||||||||||||
| USD | 945 | Receives | 3-month USD-LIBOR (pays quarterly) | 2.21% (pays semi-annually) | 8/1/49 | (323,005 | ) | — | (323,005 | ) | ||||||||||||||||
| USD | 128 | Receives | 3-month USD-LIBOR (pays quarterly) | 1.71% (pays semi-annually) | 8/27/49 | (27,396 | ) | — | (27,396 | ) | ||||||||||||||||
| USD | 148 | Receives | 3-month USD-LIBOR (pays quarterly) | 1.70% (pays semi-annually) | 8/27/49 | (31,251 | ) | — | (31,251 | ) | ||||||||||||||||
| USD | 160 | Receives | 3-month USD-LIBOR (pays quarterly) | 1.65% (pays semi-annually) | 8/28/49 | (31,439 | ) | — | (31,439 | ) | ||||||||||||||||
| USD | 85 | Receives | 3-month USD-LIBOR (pays quarterly) | 1.54% (pays semi-annually) | 8/30/49 | (14,319 | ) | — | (14,319 | ) | ||||||||||||||||
| 53 | See Notes to Financial Statements. |
Eaton Vance
Limited Duration Income Fund
March 31, 2020
Portfolio of Investments — continued
| Centrally Cleared Interest Rate Swaps (continued) | ||||||||||||||||||||||||||
| Notional Amount (000’s omitted) | Fund Pays/ Receives Floating Rate | Floating Rate | Annual Fixed Rate | Termination Date | Value | Unamortized Upfront Receipts (Payments) | Unrealized Appreciation (Depreciation) | |||||||||||||||||||
| USD | 88 | Receives | 3-month USD-LIBOR (pays quarterly) | 1.70% (pays semi-annually) | 9/12/49 | $ | (18,677 | ) | $ | — | $ | (18,677 | ) | |||||||||||||
| USD | 1,400 | Receives | 3-month USD-LIBOR (pays quarterly) | 1.87% (pays semi-annually) | 10/25/49 | (365,352 | ) | — | (365,352 | ) | ||||||||||||||||
| USD | 647 | Receives | 3-month USD-LIBOR (pays quarterly) | 1.82% (pays semi-annually) | 12/6/49 | (158,087 | ) | — | (158,087 | ) | ||||||||||||||||
| USD | 91 | Receives | 3-month USD-LIBOR (pays quarterly) | 1.81% (pays semi-annually) | 12/6/49 | (22,001 | ) | — | (22,001 | ) | ||||||||||||||||
| USD | 1,313 | Receives | 3-month USD-LIBOR (pays quarterly) | 2.05% (pays semi-annually) | 12/30/49 | (402,257 | ) | — | (402,257 | ) | ||||||||||||||||
| USD | 19 | Receives | 3-month USD-LIBOR (pays quarterly) | 1.94% (payssemi-annually) | 1/9/50 | (5,294 | ) | ��� | (5,294 | ) | ||||||||||||||||
Total | $ | (4,440,758 | ) | $ | 17,146 | $ | (4,423,612 | ) | ||||||||||||||||||
| Centrally Cleared Credit Default Swaps — Sell Protection | ||||||||||||||||||||||||||
| Reference Entity | Notional Amount* (000’s omitted) | Contract Annual Fixed Rate** | Termination Date | Current Market | Value | Unamortized Upfront Receipts (Payments) | Unrealized Appreciation (Depreciation) | |||||||||||||||||||
| Colombia | $ | 3,725 | 1.00% (pays quarterly)(1) | 6/20/25 | 2.24 | % | $ | (225,689 | ) | $ | 349,801 | $ | 124,112 | |||||||||||||
| Turkey | 1,200 | 1.00% (pays quarterly)(1) | 6/20/20 | 3.71 | (6,849 | ) | 8,727 | 1,878 | ||||||||||||||||||
| Turkey | 2,400 | 1.00% (pays quarterly)(1) | 6/20/25 | 5.50 | (472,955 | ) | 448,606 | (24,349 | ) | |||||||||||||||||
Total | $ | 7,325 | $ | (705,493 | ) | $ | 807,134 | $ | 101,641 | |||||||||||||||||
| Credit Default Swaps — Sell Protection | ||||||||||||||||||||||||||||
| Reference Entity | Counterparty | Notional Amount* (000’s omitted) | Contract Annual Fixed Rate** | Termination Date | Current Market Annual Fixed Rate*** | Value | Unamortized Upfront Receipts (Payments) | Unrealized Appreciation (Depreciation) | ||||||||||||||||||||
| Bahamas | Deutsche Bank AG | $ | 1,150 | 1.00% (pays quarterly)(1) | 6/20/22 | 3.35 | % | $ | (57,530 | ) | $ | 45,872 | $ | (11,658 | ) | |||||||||||||
Total | $ | 1,150 | $ | (57,530 | ) | $ | 45,872 | $ | (11,658 | ) | ||||||||||||||||||
| * | If the Fund is the seller of credit protection, the notional amount is the maximum potential amount of future payments the Fund could be required to make if a credit event, as defined in the credit default swap agreement, were to occur. At March 31, 2020, such maximum potential amount for all open credit default swaps in which the Fund is the seller was $8,475,000. |
| 54 | See Notes to Financial Statements. |
Eaton Vance
Limited Duration Income Fund
March 31, 2020
Portfolio of Investments — continued
| ** | The contract annual fixed rate represents the fixed rate of interest received by the Fund (as a seller of protection) on the notional amount of the credit default swap contract. |
| *** | Current market annual fixed rates, utilized in determining the net unrealized appreciation or depreciation as of period end, serve as an indicator of the market’s perception of the current status of the payment/performance risk associated with the credit derivative. The current market annual fixed rate of a particular reference entity reflects the cost, as quoted by the pricing vendor, of selling protection against default of that entity as of period end and may include upfront payments required to be made to enter into the agreement. The higher the fixed rate, the greater the market perceived risk of a credit event involving the reference entity. A rate identified as “Defaulted” indicates a credit event has occurred for the reference entity. |
| (1) | Upfront payment is exchanged with the counterparty as a result of the standardized trading coupon. |
Abbreviations:
| CMT | – | Constant Maturity Treasury | ||
| COF | – | Cost of Funds 11th District | ||
| DIP | – | Debtor In Possession | ||
| EURIBOR | – | Euro Interbank Offered Rate | ||
| GDP | – | Gross Domestic Product | ||
| LIBOR | – | London Interbank Offered Rate | ||
| PIK | – | Payment In Kind | ||
Currency Abbreviations:
| EUR | – | Euro | ||
| GBP | – | British Pound Sterling | ||
| USD | – | United States Dollar | ||
| 55 | See Notes to Financial Statements. |
Eaton Vance
Limited Duration Income Fund
March 31, 2020
Statement of Assets and Liabilities
| Assets | March 31, 2020 | |||
Unaffiliated investments, at value (identified cost, $2,427,686,938) | $ | 2,129,292,987 | ||
Affiliated investment, at value (identified cost, $24,661,293) | 24,661,698 | |||
Cash | 6,266,860 | |||
Deposits for derivatives collateral — | ||||
Financial futures contracts | 3,572,524 | |||
Centrally cleared derivatives | 6,321,744 | |||
OTC derivatives | 330,000 | |||
Deposits for reverse repurchase agreements | 2,492,942 | |||
Foreign currency, at value (identified cost, $8,375,503) | 8,414,659 | |||
Interest and dividends receivable | 21,090,345 | |||
Dividends receivable from affiliated investment | 35,927 | |||
Receivable for investments sold | 5,319,034 | |||
Receivable for variation margin on open centrally cleared derivatives | 559,363 | |||
Receivable for open forward foreign currency exchange contracts | 1,057,760 | |||
Tax reclaims receivable | 5,391 | |||
Prepaid upfront fees on notes payable | 894,997 | |||
Prepaid expenses | 53,214 | |||
Total assets | $ | 2,210,369,445 | ||
| Liabilities | ||||
Notes payable | $ | 525,000,000 | ||
Cash collateral due to brokers | 330,000 | |||
Payable for reverse repurchase agreements, including accrued interest of $23,405 | 66,503,561 | |||
Payable for investments purchased | 31,856,426 | |||
Payable for variation margin on open financial futures contracts | 672,603 | |||
Payable for open forward foreign currency exchange contracts | 540,405 | |||
Payable for open swap contracts | 11,658 | |||
Upfront receipts on open non-centrally cleared swap contracts | 45,872 | |||
Payable to affiliate: | ||||
Investment adviser fee | 1,555,254 | |||
Accrued expenses | 2,584,825 | |||
Total liabilities | $ | 629,100,604 | ||
Auction preferred shares (8,640 shares outstanding) at liquidation value plus cumulative unpaid dividends | $ | 216,071,902 | ||
Net assets applicable to common shares | $ | 1,365,196,939 | ||
| Sources of Net Assets | ||||
Common shares, $0.01 par value, unlimited number of shares authorized, 116,147,018 shares issued and outstanding | $ | 1,161,470 | ||
Additional paid-in capital | 1,790,375,350 | |||
Accumulated loss | (426,339,881 | ) | ||
Net assets applicable to common shares | $ | 1,365,196,939 | ||
| Net Asset Value Per Common Share | ||||
($1,365,196,939 ÷ 116,147,018 common shares issued and outstanding) | $ | 11.75 | ||
| 56 | See Notes to Financial Statements. |
Eaton Vance
Limited Duration Income Fund
March 31, 2020
Statement of Operations
| Investment Income | Year Ended March 31, 2020 | |||
Interest and other income (net of foreign taxes, $1,520) | $ | 128,140,675 | ||
Dividends | 3,043,259 | |||
Dividends from affiliated investment | 763,298 | |||
Total investment income | $ | 131,947,232 | ||
| Expenses | ||||
Investment adviser fee | $ | 19,325,630 | ||
Trustees’ fees and expenses | 108,500 | |||
Custodian fee | 723,609 | |||
Transfer and dividend disbursing agent fees | 18,550 | |||
Legal and accounting services | 225,497 | |||
Printing and postage | 562,424 | |||
Interest expense and fees | 22,070,508 | |||
Preferred shares service fee | 227,224 | |||
Miscellaneous | 186,279 | |||
Total expenses | $ | 43,448,221 | ||
Net investment income | $ | 88,499,011 | ||
| Realized and Unrealized Gain (Loss) | ||||
Net realized gain (loss) — | ||||
Investment transactions | $ | (23,820,063 | ) | |
Investment transactions — affiliated investment | (32,843 | ) | ||
Financial futures contracts | 2,285,541 | |||
Swap contracts | (5,843,516 | ) | ||
Foreign currency transactions | 83,289 | |||
Forward foreign currency exchange contracts | 5,762,003 | |||
Net realized loss | $ | (21,565,589 | ) | |
Change in unrealized appreciation (depreciation) — | ||||
Investments | $ | (258,601,994 | ) | |
Investments — affiliated investment | 428 | |||
Financial futures contracts | 6,714,602 | |||
Swap contracts | (2,866,962 | ) | ||
Foreign currency | 131,331 | |||
Forward foreign currency exchange contracts | (1,015,012 | ) | ||
Net change in unrealized appreciation (depreciation) | $ | (255,637,607 | ) | |
Net realized and unrealized loss | $ | (277,203,196 | ) | |
Distributions to preferred shareholders | $ | (6,436,406 | ) | |
Net decrease in net assets from operations | $ | (195,140,591 | ) | |
| 57 | See Notes to Financial Statements. |
Eaton Vance
Limited Duration Income Fund
March 31, 2020
Statements of Changes in Net Assets
| Year Ended March 31, | ||||||||
| Increase (Decrease) in Net Assets | 2020 | 2019 | ||||||
From operations — | ||||||||
Net investment income | $ | 88,499,011 | $ | 95,904,037 | ||||
Net realized loss | (21,565,589 | ) | (3,713,929 | ) | ||||
Net change in unrealized appreciation (depreciation) | (255,637,607 | ) | (27,735,781 | ) | ||||
Distributions to preferred shareholders | (6,436,406 | ) | (7,666,504 | ) | ||||
Discount on redemption and repurchase of auction preferred shares | — | 4,050,000 | ||||||
Net increase (decrease) in net assets from operations | $ | (195,140,591 | ) | $ | 60,837,823 | |||
Distributions to common shareholders | $ | (97,429,716 | ) | $ | (94,961,802 | ) | ||
Tax return of capital to common shareholders | $ | (20,691,801 | ) | $ | — | |||
Net decrease in net assets | $ | (313,262,108 | ) | $ | (34,123,979 | ) | ||
| Net Assets Applicable to Common Shares | ||||||||
At beginning of year | $ | 1,678,459,047 | $ | 1,712,583,026 | ||||
At end of year | $ | 1,365,196,939 | $ | 1,678,459,047 | ||||
| 58 | See Notes to Financial Statements. |
Eaton Vance
Limited Duration Income Fund
March 31, 2020
Statement of Cash Flows
| Cash Flows From Operating Activities | Year Ended March 31, 2020 | |||
Net decrease in net assets from operations | $ | (195,140,591 | ) | |
Distributions to preferred shareholders | 6,436,406 | |||
Net decrease in net assets from operations excluding distributions to preferred shareholders | $ | (188,704,185 | ) | |
Adjustments to reconcile net decrease in net assets from operations to net cash provided by operating activities: | ||||
Investments purchased | (1,230,229,409 | ) | ||
Investments sold and principal repayments | 1,338,002,356 | |||
Decrease in short-term investments, net | 18,914,051 | |||
Net amortization/accretion of premium (discount) | 19,272,550 | |||
Amortization of prepaid upfront fees on notes payable | 519,949 | |||
Increase in interest and dividends receivable | (379,364 | ) | ||
Decrease in dividends receivable from affiliated investment | 41,428 | |||
Decrease in receivable for variation margin on open financial futures contracts | 312,771 | |||
Increase in receivable for variation margin on open centrally cleared derivatives | (452,923 | ) | ||
Decrease in receivable for open forward foreign currency exchange contracts | 388,125 | |||
Decrease in receivable for open swap contracts | 58,740 | |||
Increase in tax reclaims receivable | (2,771 | ) | ||
Decrease in prepaid expenses | 19,479 | |||
Decrease in cash collateral due to brokers | (110,000 | ) | ||
Increase in payable for variation margin on open financial futures contracts | 672,603 | |||
Increase in payable for open forward foreign currency exchange contracts | 482,923 | |||
Decrease in payable for open swap contracts | (4,974 | ) | ||
Decrease in upfront receipts on open non-centrally cleared swap contracts | (38,008 | ) | ||
Decrease in payable to affiliate for investment adviser fee | (102,817 | ) | ||
Increase in accrued expenses | (402,516 | ) | ||
Decrease in accrued interest on reverse repurchase agreements | (134,189 | ) | ||
Decrease in unfunded loan commitments | (78,125 | ) | ||
Net change in unrealized (appreciation) depreciation from investments | 258,601,566 | |||
Net realized loss from investments | 23,852,906 | |||
Net cash provided by operating activities | $ | 240,500,166 | ||
| Cash Flows From Financing Activities | ||||
Cash distributions paid to common shareholders | $ | (118,121,517 | ) | |
Cash distributions paid to preferred shareholders | (6,466,556 | ) | ||
Proceeds from notes payable | 353,000,000 | |||
Repayments of notes payable | (423,000,000 | ) | ||
Repayments of reverse repurchase agreements, net | (38,194,580 | ) | ||
Net cash used in financing activities | $ | (232,782,653 | ) | |
Net increase in cash and restricted cash* | $ | 7,717,513 | ||
Cash and restricted cash at beginning of year (including foreign currency) | $ | 19,681,216 | ||
Cash and restricted cash at end of year (including foreign currency) | $ | 27,398,729 | ||
| Supplemental disclosure of cash flow information: | ||||
Cash paid for interest and fees on borrowings and reverse repurchase agreements | $ | 22,316,126 | ||
| * | Includes net change in unrealized appreciation (depreciation) on foreign currency of $32,909. |
| 59 | See Notes to Financial Statements. |
Eaton Vance
Limited Duration Income Fund
March 31, 2020
Statement of Cash Flows — continued
The following table provides a reconciliation of cash and restricted cash reported within the Statement of Assets and Liabilities that sum to the total of such amounts shown on the Statement of Cash Flows.
| March 31, 2020 | ||||
Cash | $ | 6,266,860 | ||
Deposit for derivatives collateral — | ||||
Financial futures contracts | 3,572,524 | |||
Centrally cleared derivatives | 6,321,744 | |||
OTC derivatives | 330,000 | |||
Deposits for reverse repurchase agreements | 2,492,942 | |||
Foreign currency | 8,414,659 | |||
Total cash and restricted cash as shown on the Statement of Cash Flows | $ | 27,398,729 | ||
| 60 | See Notes to Financial Statements. |
Eaton Vance
Limited Duration Income Fund
March 31, 2020
Financial Highlights
Selected data for a common share outstanding during the periods stated
| Year Ended March 31, | ||||||||||||||||||||
| 2020 | 2019 | 2018 | 2017 | 2016 | ||||||||||||||||
Net asset value — Beginning of year (Common shares) | $ | 14.450 | $ | 14.740 | $ | 15.110 | $ | 14.510 | $ | 16.010 | ||||||||||
| Income (Loss) From Operations | ||||||||||||||||||||
Net investment income(1) | $ | 0.762 | $ | 0.826 | $ | 0.808 | $ | 0.899 | $ | 0.979 | ||||||||||
Net realized and unrealized gain (loss) | (2.390 | ) | (0.267 | ) | (0.168 | ) | 0.834 | (1.278 | ) | |||||||||||
Distributions to preferred shareholders — | ||||||||||||||||||||
From net investment income(1) | (0.055 | ) | (0.066 | ) | (0.043 | ) | (0.018 | ) | (0.007 | ) | ||||||||||
Discount on redemption and repurchase of auction preferred shares(1) | — | 0.035 | — | — | — | |||||||||||||||
Total income (loss) from operations | $ | (1.683 | ) | $ | 0.528 | $ | 0.597 | $ | 1.715 | $ | (0.306 | ) | ||||||||
| Less Distributions to Common Shareholders | ||||||||||||||||||||
From net investment income | $ | (0.839 | ) | $ | (0.818 | ) | $ | (0.818 | ) | $ | (0.991 | ) | $ | (1.114 | ) | |||||
Tax return of capital | (0.178 | ) | — | (0.149 | ) | (0.124 | ) | (0.106 | ) | |||||||||||
Total distributions to common shareholders | $ | (1.017 | ) | $ | (0.818 | ) | $ | (0.967 | ) | $ | (1.115 | ) | $ | (1.220 | ) | |||||
Anti-dilutive effect of share repurchase program (see Note 6)(1) | $ | — | $ | — | $ | — | $ | — | $ | 0.026 | ||||||||||
Net asset value — End of year (Common shares) | $ | 11.750 | $ | 14.450 | $ | 14.740 | $ | 15.110 | $ | 14.510 | ||||||||||
Market value — End of year (Common shares) | $ | 10.570 | $ | 12.650 | $ | 13.020 | $ | 13.830 | $ | 13.180 | ||||||||||
Total Investment Return on Net Asset Value(2) | (11.69 | )% | 4.57 | %(3) | 4.72 | % | 12.99 | % | (0.62 | )% | ||||||||||
Total Investment Return on Market Value(2) | (9.33 | )% | 3.70 | % | 0.99 | % | 13.85 | % | 0.44 | % | ||||||||||
| 61 | See Notes to Financial Statements. |
Eaton Vance
Limited Duration Income Fund
March 31, 2020
Financial Highlights — continued
Selected data for a common share outstanding during the periods stated
| Year Ended March 31, | ||||||||||||||||||||
| Ratios/Supplemental Data | 2020 | 2019 | 2018 | 2017 | 2016 | |||||||||||||||
Net assets applicable to common shares, end of year (000’s omitted) | $ | 1,365,197 | $ | 1,678,459 | $ | 1,712,583 | $ | 1,755,135 | $ | 1,685,016 | ||||||||||
Ratios (as a percentage of average daily net assets applicable to common shares):(4)† | ||||||||||||||||||||
Expenses excluding interest and fees(5) | 1.29 | % | 1.31 | % | 1.30 | % | 1.32 | % | 1.37 | % | ||||||||||
Interest and fee expense(6) | 1.33 | % | 1.43 | % | 1.00 | % | 0.73 | % | 0.63 | % | ||||||||||
Total expenses(5) | 2.62 | % | 2.74 | % | 2.30 | % | 2.05 | % | 2.00 | % | ||||||||||
Net investment income | 5.33 | % | 5.71 | % | 5.36 | % | 6.01 | % | 6.49 | % | ||||||||||
Portfolio Turnover | 49 | % | 34 | % | 43 | % | 45 | % | 33 | % | ||||||||||
Senior Securities: |
| |||||||||||||||||||
Total notes payable outstanding (in 000’s) | $ | 525,000 | $ | 595,000 | $ | 663,000 | $ | 585,000 | $ | 660,000 | ||||||||||
Asset coverage per $1,000 of notes payable(7) | $ | 4,012 | $ | 4,184 | $ | 3,985 | $ | 4,456 | $ | 3,957 | ||||||||||
Total preferred shares outstanding | 8,640 | 8,640 | 10,665 | 10,665 | 10,665 | |||||||||||||||
Asset coverage per preferred share(8) | $ | 71,062 | $ | 76,744 | $ | 71,059 | $ | 76,524 | $ | 70,461 | ||||||||||
Involuntary liquidation preference per preferred share(9) | $ | 25,000 | $ | 25,000 | $ | 25,000 | $ | 25,000 | $ | 25,000 | ||||||||||
Approximate market value per preferred share(9) | $ | 25,000 | $ | 25,000 | $ | 25,000 | $ | 25,000 | $ | 25,000 | ||||||||||
| (1) | Computed using average common shares outstanding. |
| (2) | Returns are historical and are calculated by determining the percentage change in net asset value or market value with all distributions reinvested. Distributions are assumed to be reinvested at prices obtained under the Fund’s dividend reinvestment plan. |
| (3) | The total return based on net asset value reflects the impact of the tender and repurchase by the Fund of a portion of its Auction Preferred Shares at 92% of the per share liquidation preference. Absent this transaction, the total return based on net asset value would have been 4.31%. |
| (4) | Ratios do not reflect the effect of dividend payments to preferred shareholders. |
| (5) | Excludes the effect of custody fee credits, if any, of less than 0.005%. Effective September 1, 2015, custody fee credits, which were earned on cash deposit balances, were discontinued by the custodian. |
| (6) | Interest and fee expense relates to the notes payable, a portion of which was incurred to partially redeem the Fund’s Auction Preferred Shares (see Note 2), and the reverse repurchase agreements (see Note 10). |
| (7) | Calculated by subtracting the Fund’s total liabilities (not including the notes payable and preferred shares) from the Fund’s total assets, and dividing the result by the notes payable balance in thousands. |
| (8) | Calculated by subtracting the Fund’s total liabilities (not including the notes payable and preferred shares) from the Fund’s total assets, dividing the result by the sum of the value of the notes payable and liquidation value of the preferred shares, and multiplying the result by the liquidation value of one preferred share. Such amount equates to 284%, 307%, 284%, 306% and 282% at March 31, 2020, 2019, 2018, 2017 and 2016, respectively. |
| (9) | Plus accumulated and unpaid dividends. |
| † | Ratios based on net assets applicable to common shares plus preferred shares and borrowings are presented below. Ratios do not reflect the effect of dividend payments to preferred shareholders and exclude the effect of custody fee credits, if any. |
| Year Ended March 31, | ||||||||||||||||||||
| 2020 | 2019 | 2018 | 2017 | 2016 | ||||||||||||||||
Expenses excluding interest and fees | 0.86 | % | 0.87 | % | 0.87 | % | 0.87 | % | 0.88 | % | ||||||||||
Interest and fee expense | 0.89 | % | 0.95 | % | 0.67 | % | 0.49 | % | 0.40 | % | ||||||||||
Total expenses | 1.75 | % | 1.82 | % | 1.54 | % | 1.36 | % | 1.28 | % | ||||||||||
Net investment income | 3.57 | % | 3.79 | % | 3.58 | % | 3.99 | % | 4.15 | % | ||||||||||
| 62 | See Notes to Financial Statements. |
Eaton Vance
Limited Duration Income Fund
March 31, 2020
Notes to Financial Statements
1 Significant Accounting Policies
Eaton Vance Limited Duration Income Fund (the Fund) is a Massachusetts business trust registered under the Investment Company Act of 1940, as amended (the 1940 Act), as a diversified, closed-end management investment company. The Fund’s primary investment objective is to provide a high level of current income. The Fund may, as a secondary objective, also seek capital appreciation to the extent it is consistent with its primary objective.
The following is a summary of significant accounting policies of the Fund. The policies are in conformity with accounting principles generally accepted in the United States of America (U.S. GAAP). The Fund is an investment company and follows accounting and reporting guidance in the Financial Accounting Standards Board (FASB) Accounting Standards Codification Topic 946.
A Investment Valuation — The following methodologies are used to determine the market value or fair value of investments.
Senior Floating-Rate Loans. Interests in senior floating-rate loans (Senior Loans) for which reliable market quotations are readily available are valued generally at the average mean of bid and ask quotations obtained from a third party pricing service. Other Senior Loans are valued at fair value by the investment adviser under procedures approved by the Trustees. In fair valuing a Senior Loan, the investment adviser utilizes one or more of the valuation techniques described in (i) through (iii) below to assess the likelihood that the borrower will make a full repayment of the loan underlying such Senior Loan relative to yields on other Senior Loans issued by companies of comparable credit quality. If the investment adviser believes that there is a reasonable likelihood of full repayment, the investment adviser will determine fair value using a matrix pricing approach that considers the yield on the Senior Loan. If the investment adviser believes there is not a reasonable likelihood of full repayment, the investment adviser will determine fair value using analyses that include, but are not limited to: (i) a comparison of the value of the borrower’s outstanding equity and debt to that of comparable public companies; (ii) a discounted cash flow analysis; or (iii) when the investment adviser believes it is likely that a borrower will be liquidated or sold, an analysis of the terms of such liquidation or sale. In certain cases, the investment adviser will use a combination of analytical methods to determine fair value, such as when only a portion of a borrower’s assets are likely to be sold. In conducting its assessment and analyses for purposes of determining fair value of a Senior Loan, the investment adviser will use its discretion and judgment in considering and appraising relevant factors. Fair value determinations are made by the portfolio managers of the Fund based on information available to such managers. The portfolio managers of other funds managed by the investment adviser that invest in Senior Loans may not possess the same information about a Senior Loan borrower as the portfolio managers of the Fund. At times, the fair value of a Senior Loan determined by the portfolio managers of other funds managed by the investment adviser that invest in Senior Loans may vary from the fair value of the same Senior Loan determined by the portfolio managers of the Fund. The fair value of each Senior Loan is periodically reviewed and approved by the investment adviser’s Valuation Committee and by the Trustees based upon procedures approved by the Trustees. Junior Loans (i.e., subordinated loans and second lien loans) are valued in the same manner as Senior Loans.
Debt Obligations. Debt obligations are generally valued on the basis of valuations provided by third party pricing services, as derived from such services’ pricing models. Inputs to the models may include, but are not limited to, reported trades, executable bid and ask prices, broker/dealer quotations, prices or yields of securities with similar characteristics, interest rates, anticipated prepayments, benchmark curves or information pertaining to the issuer, as well as industry and economic events. The pricing services may use a matrix approach, which considers information regarding securities with similar characteristics to determine the valuation for a security. Short-term debt obligations purchased with a remaining maturity of sixty days or less for which a valuation from a third party pricing service is not readily available may be valued at amortized cost, which approximates fair value.
Equity Securities. Equity securities listed on a U.S. securities exchange generally are valued at the last sale or closing price on the day of valuation or, if no sales took place on such date, at the mean between the closing bid and ask prices on the exchange where such securities are principally traded. Equity securities listed on the NASDAQ Global or Global Select Market generally are valued at the NASDAQ official closing price. Unlisted or listed securities for which closing sales prices or closing quotations are not available are valued at the mean between the latest available bid and ask prices or, in the case of preferred equity securities that are not listed or traded in the over-the-counter market, by a third party pricing service that uses various techniques that consider factors including, but not limited to, prices or yields of securities with similar characteristics, benchmark yields, broker/dealer quotes, quotes of underlying common stock, issuer spreads, as well as industry and economic events.
Derivatives. Financial futures contracts are valued at the closing settlement price established by the board of trade or exchange on which they are traded. Forward foreign currency exchange contracts are generally valued at the mean of the average bid and average ask prices that are reported by currency dealers to a third party pricing service at the valuation time. Such third party pricing service valuations are supplied for specific settlement periods and the Fund’s forward foreign currency exchange contracts are valued at an interpolated rate between the closest preceding and subsequent settlement period reported by the third party pricing service. Swaps are normally valued using valuations provided by a third party pricing service. Such pricing service valuations are based on the present value of fixed and projected floating rate cash flows over the term of the swap contract, and in the case of credit default swaps, based on credit spread quotations obtained from broker/dealers and expected default recovery rates determined by the pricing service using proprietary models. Future cash flows on swaps are discounted to their present value using swap rates provided by electronic data services or by broker/dealers.
Foreign Securities and Currencies. Foreign securities and currencies are valued in U.S. dollars, based on foreign currency exchange rate quotations supplied by a third party pricing service. The pricing service uses a proprietary model to determine the exchange rate. Inputs to the model include reported trades and implied bid/ask spreads. The daily valuation of exchange-traded foreign securities generally is determined as of the close of trading on the principal exchange on which such securities trade. Events occurring after the close of trading on foreign exchanges may result in adjustments to the valuation of foreign securities to more accurately reflect their fair value as of the close of regular trading on the New York Stock Exchange. When valuing foreign equity securities that meet certain criteria, the Fund’s Trustees have approved the use of a fair value service that values such securities to reflect market trading that occurs after the close of the applicable foreign markets of comparable securities or other instruments that have a strong correlation to the fair-valued securities.
| 63 |
Eaton Vance
Limited Duration Income Fund
March 31, 2020
Notes to Financial Statements — continued
Affiliated Fund. The Fund may invest in Eaton Vance Cash Reserves Fund, LLC (Cash Reserves Fund), an affiliated investment company managed by Eaton Vance Management (EVM). While Cash Reserves Fund is not a registered money market mutual fund, it conducts all of its investment activities in accordance with the requirements of Rule 2a-7 under the 1940 Act. Investments in Cash Reserves Fund are valued at the closing net asset value per unit on the valuation day. Cash Reserves Fund generally values its investment securities based on available market quotations provided by a third party pricing service.
Fair Valuation. Investments for which valuations or market quotations are not readily available or are deemed unreliable are valued at fair value using methods determined in good faith by or at the direction of the Trustees of the Fund in a manner that most fairly reflects the security’s “fair value”, which is the amount that the Fund might reasonably expect to receive for the security upon its current sale in the ordinary course. Each such determination is based on a consideration of relevant factors, which are likely to vary from one pricing context to another. These factors may include, but are not limited to, the type of security, the existence of any contractual restrictions on the security’s disposition, the price and extent of public trading in similar securities of the issuer or of comparable companies or entities, quotations or relevant information obtained from broker/dealers or other market participants, information obtained from the issuer, analysts, and/or the appropriate stock exchange (for exchange-traded securities), an analysis of the company’s or entity’s financial statements, and an evaluation of the forces that influence the issuer and the market(s) in which the security is purchased and sold.
B Investment Transactions — Investment transactions for financial statement purposes are accounted for on a trade date basis. Realized gains and losses on investments sold are determined on the basis of identified cost.
C Income — Interest income is recorded on the basis of interest accrued, adjusted for amortization of premium or accretion of discount. Fees associated with loan amendments are recognized immediately. Dividend income is recorded on the ex-dividend date for dividends received in cash and/or securities. Withholding taxes on foreign interest has been provided for in accordance with the Fund’s understanding of the applicable countries’ tax rules and rates. Distributions from investment companies are recorded as dividend income, capital gains or return of capital based on the nature of the distribution.
D Federal Taxes — The Fund’s policy is to comply with the provisions of the Internal Revenue Code applicable to regulated investment companies and to distribute to shareholders each year substantially all of its net investment income, and all or substantially all of its net realized capital gains. Accordingly, no provision for federal income or excise tax is necessary.
As of March 31, 2020, the Fund had no uncertain tax positions that would require financial statement recognition, de-recognition, or disclosure. The Fund files a U.S. federal income tax return annually after its fiscal year-end, which is subject to examination by the Internal Revenue Service for a period of three years from the date of filing.
E Foreign Currency Translation — Investment valuations, other assets, and liabilities initially expressed in foreign currencies are translated each business day into U.S. dollars based upon current exchange rates. Purchases and sales of foreign investment securities and income and expenses denominated in foreign currencies are translated into U.S. dollars based upon currency exchange rates in effect on the respective dates of such transactions. Recognized gains or losses on investment transactions attributable to changes in foreign currency exchange rates are recorded for financial statement purposes as net realized gains and losses on investments. That portion of unrealized gains and losses on investments that results from fluctuations in foreign currency exchange rates is not separately disclosed.
F Unfunded Loan Commitments — The Fund may enter into certain loan agreements all or a portion of which may be unfunded. The Fund is obligated to fund these commitments at the borrower’s discretion. These commitments are disclosed in the accompanying Portfolio of Investments. At March 31, 2020, the Fund had sufficient cash and/or securities to cover these commitments.
G Use of Estimates — The preparation of the financial statements in conformity with U.S. GAAP requires management to make estimates and assumptions that affect the reported amounts of assets and liabilities at the date of the financial statements and the reported amounts of income and expense during the reporting period. Actual results could differ from those estimates.
H Indemnifications — Under the Fund’s organizational documents, its officers and Trustees may be indemnified against certain liabilities and expenses arising out of the performance of their duties to the Fund. Under Massachusetts law, if certain conditions prevail, shareholders of a Massachusetts business trust (such as the Fund) could be deemed to have personal liability for the obligations of the Fund. However, the Fund’s Declaration of Trust contains an express disclaimer of liability on the part of Fund shareholders and the By-laws provide that the Fund shall assume, upon request by the shareholder, the defense on behalf of any Fund shareholders. Moreover, the By-laws also provide for indemnification out of Fund property of any shareholder held personally liable solely by reason of being or having been a shareholder for all loss or expense arising from such liability. Additionally, in the normal course of business, the Fund enters into agreements with service providers that may contain indemnification clauses. The Fund’s maximum exposure under these arrangements is unknown as this would involve future claims that may be made against the Fund that have not yet occurred.
I Financial Futures Contracts — Upon entering into a financial futures contract, the Fund is required to deposit with the broker, either in cash or securities, an amount equal to a certain percentage of the contract amount (initial margin). Subsequent payments, known as variation margin, are made or received by the Fund each business day, depending on the daily fluctuations in the value of the underlying security, and are recorded as unrealized gains or losses by the Fund. Gains (losses) are realized upon the expiration or closing of the financial futures contracts. Should market conditions change unexpectedly, the Fund may not achieve the anticipated benefits of the financial futures contracts and may realize a loss. Futures contracts have minimal counterparty risk as they are exchange traded and the clearinghouse for the exchange is substituted as the counterparty, guaranteeing counterparty performance.
| 64 |
Eaton Vance
Limited Duration Income Fund
March 31, 2020
Notes to Financial Statements — continued
J Forward Foreign Currency Exchange Contracts — The Fund may enter into forward foreign currency exchange contracts for the purchase or sale of a specific foreign currency at a fixed price on a future date. The forward foreign currency exchange contracts are adjusted by the daily exchange rate of the underlying currency and any gains or losses are recorded as unrealized until such time as the contracts have been closed. While forward foreign currency exchange contracts are privately negotiated agreements between the Fund and a counterparty, certain contracts may be “centrally cleared”, whereby all payments made or received by the Fund pursuant to the contract are with a central clearing party (CCP) rather than the original counterparty. The CCP guarantees the performance of the original parties to the contract. Upon entering into centrally cleared contracts, the Fund is required to deposit with the CCP, either in cash or securities, an amount of initial margin determined by the CCP, which is subject to adjustment. For centrally cleared contracts, the daily change in valuation is recorded as a receivable or payable for variation margin and settled in cash with the CCP daily. Risks may arise upon entering forward foreign currency exchange contracts from the potential inability of counterparties to meet the terms of their contracts and from movements in the value of a foreign currency relative to the U.S. dollar. In the case of centrally cleared contracts, counterparty risk is minimal due to protections provided by the CCP.
K Interest Rate Swaps — Pursuant to interest rate swap agreements, the Fund either makes floating-rate payments to the counterparty (or CCP in the case of centrally cleared swaps) based on a benchmark interest rate in exchange for fixed-rate payments or the Fund makes fixed-rate payments to the counterparty (or CCP in the case of a centrally cleared swap) in exchange for payments on a floating benchmark interest rate. Payments received or made, including amortization of upfront payments/receipts, are recorded as realized gains or losses. During the term of the outstanding swap agreement, changes in the underlying value of the swap are recorded as unrealized gains or losses. For centrally cleared swaps, the daily change in valuation is recorded as a receivable or payable for variation margin and settled in cash with the CCP daily. The value of the swap is determined by changes in the relationship between two rates of interest. The Fund is exposed to credit loss in the event of non-performance by the swap counterparty. In the case of centrally cleared swaps, counterparty risk is minimal due to protections provided by the CCP. Risk may also arise from movements in interest rates.
L Credit Default Swaps — When the Fund is the buyer of a credit default swap contract, the Fund is entitled to receive the par (or other agreed-upon) value of a referenced debt obligation (or basket of debt obligations) from the counterparty (or CCP in the case of a centrally cleared swap) to the contract if a credit event by a third party, such as a U.S. or foreign corporate issuer or sovereign issuer, on the debt obligation occurs. In return, the Fund pays the counterparty a periodic stream of payments over the term of the contract provided that no credit event has occurred. If no credit event occurs, the Fund would have spent the stream of payments and received no proceeds from the contract. When the Fund is the seller of a credit default swap contract, it receives the stream of payments, but is obligated to pay to the buyer of the protection an amount up to the notional amount of the swap and in certain instances take delivery of securities of the reference entity upon the occurrence of a credit event, as defined under the terms of that particular swap agreement. Credit events are contract specific but may include bankruptcy, failure to pay, restructuring, obligation acceleration and repudiation/moratorium. If the Fund is a seller of protection and a credit event occurs, the maximum potential amount of future payments that the Fund could be required to make would be an amount equal to the notional amount of the agreement. This potential amount would be partially offset by any recovery value of the respective referenced obligation, or net amount received from the settlement of a buy protection credit default swap agreement entered into by the Fund for the same referenced obligation. As the seller, the Fund may create economic leverage to its portfolio because, in addition to its total net assets, the Fund is subject to investment exposure on the notional amount of the swap. The interest fee paid or received on the swap contract, which is based on a specified interest rate on a fixed notional amount, is accrued daily as a component of unrealized appreciation (depreciation) and is recorded as realized gain upon receipt or realized loss upon payment. The Fund also records an increase or decrease to unrealized appreciation (depreciation) in an amount equal to the daily valuation. For centrally cleared swaps, the daily change in valuation is recorded as a receivable or payable for variation margin and settled in cash with the CCP daily. All upfront payments and receipts, if any, are amortized over the life of the swap contract as realized gains or losses. Those upfront payments or receipts for non-centrally cleared swaps are recorded as other assets or other liabilities, respectively, net of amortization. For financial reporting purposes, unamortized upfront payments or receipts, if any, are netted with unrealized appreciation or depreciation on swap contracts to determine the market value of swaps as presented in Notes 8 and 12. The Fund segregates assets in the form of cash or liquid securities in an amount equal to the notional amount of the credit default swaps of which it is the seller. The Fund segregates assets in the form of cash or liquid securities in an amount equal to any unrealized depreciation of the credit default swaps of which it is the buyer, marked-to-market on a daily basis. These transactions involve certain risks, including the risk that the seller may be unable to fulfill the transaction. In the case of centrally cleared swaps, counterparty risk is minimal due to protections provided by the CCP.
M Reverse Repurchase Agreements — Under a reverse repurchase agreement, the Fund temporarily transfers possession of a portfolio security to another party, such as a bank or broker/dealer, in return for cash. At the same time, the Fund agrees to repurchase the security at an agreed upon time and price, which reflects an interest payment. In periods of increased demand for a security, the Fund may receive a payment from the counterparty for the use of the security, which is recorded as interest income. Because the Fund retains effective control over the transferred security, the transaction is accounted for as a secured borrowing. The Fund may enter into such agreements when it believes it is able to invest the cash acquired at a rate higher than the cost of the agreement, which would increase earned income. When the Fund enters into a reverse repurchase agreement, any fluctuations in the market value of either the securities transferred to another party or the securities in which the proceeds may be invested would affect the market value of the Fund’s assets. Because reverse repurchase agreements may be considered to be the practical equivalent of borrowing funds (and the counterparty making a loan), they constitute a form of leverage. The Fund segregates cash or liquid assets equal to its obligation to repurchase the security. During the term of the agreement, the Fund may also be obligated to pledge additional cash and/or securities in the event of a decline in the fair value of the transferred security. In the event the counterparty to a reverse repurchase agreement becomes insolvent, recovery of the security transferred by the Fund may be delayed or the Fund may incur a loss equal to the amount by which the value of the security transferred by the Fund exceeds the repurchase price payable by the Fund.
| 65 |
Eaton Vance
Limited Duration Income Fund
March 31, 2020
Notes to Financial Statements — continued
N Stripped Mortgage-Backed Securities — The Fund may invest in Interest Only (IO) and Principal Only (PO) securities, a form of stripped mortgage-backed securities, whereby the IO security receives all the interest and the PO security receives all the principal on a pool of mortgage assets. The yield to maturity on an IO security is extremely sensitive to the rate of principal payments (including prepayments) on the related underlying mortgage assets, and a rapid rate of principal payments may have a material adverse effect on the yield to maturity from these securities. If the underlying mortgages experience greater than anticipated prepayments of principal, the Fund may fail to recoup its initial investment in an IO security. The market value of IO and PO securities can be unusually volatile due to changes in interest rates.
2 Auction Preferred Shares
The Fund issued Auction Preferred Shares (APS) on July 25, 2003 in a public offering. Dividends on the APS, which accrue daily, are cumulative at rates which are reset every seven days by an auction, unless a special dividend period has been set. Series of APS are identical in all respects except for the reset dates of the dividend rates. If the APS auctions do not successfully clear, the dividend payment rate over the next period for the APS holders is set at a specified maximum applicable rate until such time as the APS auctions are successful. Auctions have not cleared since February 13, 2008 and the rate since that date has been the maximum applicable rate (see Note 3). The maximum applicable rate on the APS is 150% of the “AA” Financial Composite Commercial Paper Rate at the date of the auction. The stated spread over the reference benchmark rate is determined based on the credit rating of the APS.
The number of APS issued and outstanding at March 31, 2020 are as follows:
| APS Issued and Outstanding | ||||
Series A | 1,728 | |||
Series B | 1,728 | |||
Series C | 1,728 | |||
Series D | 1,728 | |||
Series E | 1,728 | |||
The APS are redeemable at the option of the Fund at a redemption price equal to $25,000 per share, plus accumulated and unpaid dividends, on any dividend payment date. The APS are also subject to mandatory redemption at a redemption price equal to $25,000 per share, plus accumulated and unpaid dividends, if the Fund is in default for an extended period on its asset maintenance requirements with respect to the APS. If the dividends on the APS remain unpaid in an amount equal to two full years’ dividends, the holders of the APS as a class have the right to elect a majority of the Board of Trustees. In general, the holders of the APS and the common shares have equal voting rights of one vote per share, except that the holders of the APS, as a separate class, have the right to elect at least two members of the Board of Trustees. The APS have a liquidation preference of $25,000 per share, plus accumulated and unpaid dividends. The Fund is required to maintain certain asset coverage with respect to the APS as defined in the Fund’s By-Laws and the 1940 Act. The Fund pays an annual fee up to 0.15% of the liquidation value of the APS to broker/dealers as a service fee if the auctions are unsuccessful; otherwise, the annual fee is 0.25%.
On June 29, 2018, the Fund announced a tender offer to purchase up to 19% of its outstanding APS at a price per share equal to 92% of the APS liquidation preference of $25,000 per share (or $23,000 per share), plus any accrued but unpaid APS dividends. The tender offer expired on September 14, 2018. The number of APS redeemed during the year ended March 31, 2019 pursuant to the tender offer and the redemption amount (excluding the final dividend payment) were as follows:
| APS Redeemed During the Year | Redemption Amount | |||||||
Series A | 405 | $ | 9,315,000 | |||||
Series B | 405 | 9,315,000 | ||||||
Series C | 405 | 9,315,000 | ||||||
Series D | 405 | 9,315,000 | ||||||
Series E | 405 | 9,315,000 | ||||||
3 Distributions to Shareholders and Income Tax Information
The Fund intends to make monthly distributions of net investment income to common shareholders, after payment of any dividends on any outstanding APS. In addition, at least annually, the Fund intends to distribute all or substantially all of its net realized capital gains. Distributions to common
| 66 |
Eaton Vance
Limited Duration Income Fund
March 31, 2020
Notes to Financial Statements — continued
shareholders are recorded on the ex-dividend date. Distributions to preferred shareholders are recorded daily and are payable at the end of each dividend period. The dividend rates for the APS at March 31, 2020, and the amount of dividends accrued (including capital gains, if any) to APS shareholders, average APS dividend rates, and dividend rate ranges for the year then ended were as follows:
| APS Dividend Rates at March 31, 2020 | Dividends Accrued to APS Shareholders | Average APS Dividend Rates | Dividend Rate Ranges (%) | |||||||||||||
Series A | 3.32 | % | $ | 1,297,805 | 3.00 | % | 1.50–3.73 | |||||||||
Series B | 3.32 | 1,296,123 | 3.00 | 1.50–3.70 | ||||||||||||
Series C | 3.46 | 1,295,116 | 3.00 | 1.50–3.73 | ||||||||||||
Series D | 2.90 | 1,279,327 | 2.96 | 1.50–3.74 | ||||||||||||
Series E | 3.32 | 1,268,035 | 2.94 | 0.54–3.73 | ||||||||||||
Beginning February 13, 2008 and consistent with the patterns in the broader market for auction-rate securities, the Fund’s APS auctions were unsuccessful in clearing due to an imbalance of sell orders over bids to buy the APS. As a result, the dividend rates of the APS were reset to the maximum applicable rates. The table above reflects such maximum dividend rate for each series as of March 31, 2020.
Distributions to shareholders are determined in accordance with income tax regulations, which may differ from U.S. GAAP. As required by U.S. GAAP, only distributions in excess of tax basis earnings and profits are reported in the financial statements as a return of capital. Permanent differences between book and tax accounting relating to distributions are reclassified to paid-in capital. For tax purposes, distributions from short-term capital gains are considered to be from ordinary income.
The tax character of distributions declared for the years ended March 31, 2020 and March 31, 2019 was as follows:
| Year Ended March 31, | ||||||||
| 2020 | 2019 | |||||||
Ordinary income | $ | 103,866,122 | $ | 102,628,306 | ||||
Tax return of capital | $ | 20,691,801 | $ | — | ||||
As of March 31, 2020, the components of distributable earnings (accumulated loss) on a tax basis were as follows:
Deferred capital losses | $ | (116,241,745 | ) | |
Net unrealized depreciation | $ | (310,098,136 | ) | |
At March 31, 2020, the Fund, for federal income tax purposes, had deferred capital losses of $116,241,745 which would reduce its taxable income arising from future net realized gains on investment transactions, if any, to the extent permitted by the Internal Revenue Code, and thus would reduce the amount of distributions to shareholders, which would otherwise be necessary to relieve the Fund of any liability for federal income or excise tax. The deferred capital losses are treated as arising on the first day of the Fund’s next taxable year and retain the same short-term or long-term character as when originally deferred. Of the deferred capital losses at March 31, 2020, $15,423,802 are short-term and $100,817,943 are long-term.
The cost and unrealized appreciation (depreciation) of investments, including open derivative contracts, of the Fund at March 31, 2020, as determined on a federal income tax basis, were as follows:
Aggregate cost | $ | 2,458,155,740 | ||
Gross unrealized appreciation | $ | 24,732,522 | ||
Gross unrealized depreciation | (334,896,775 | ) | ||
Net unrealized depreciation | $ | (310,164,253 | ) | |
| 67 |
Eaton Vance
Limited Duration Income Fund
March 31, 2020
Notes to Financial Statements — continued
4 Investment Adviser Fee and Other Transactions with Affiliates
The investment adviser fee is earned by EVM as compensation for management and investment advisory services rendered to the Fund. The fee is computed at an annual rate of 0.75% of the Fund’s average weekly gross assets and is payable monthly. Gross assets as referred to herein represent net assets plus obligations attributable to investment leverage. For the year ended March 31, 2020, the Fund’s investment adviser fee amounted to $19,325,630. The Fund invests its cash in Cash Reserves Fund. EVM does not currently receive a fee for advisory services provided to Cash Reserves Fund. EVM also serves as administrator of the Fund, but receives no compensation.
Trustees and officers of the Fund who are members of EVM’s organization receive remuneration for their services to the Fund out of the investment adviser fee. Trustees of the Fund who are not affiliated with EVM may elect to defer receipt of all or a percentage of their annual fees in accordance with the terms of the Trustees Deferred Compensation Plan. For the year ended March 31, 2020, no significant amounts have been deferred. Certain officers and Trustees of the Fund are officers of EVM.
During the year ended March 31, 2020, EVM reimbursed the Fund $1,073 for a net realized loss due to a trading error. The amount of the reimbursement had an impact on total return of less than 0.01%.
5 Purchases and Sales of Investments
Purchases and sales of investments, other than short-term obligations, and including maturities, paydowns and principal repayments on Senior Loans, for the year ended March 31, 2020 were as follows:
| Purchases | Sales | |||||||
Investments (non-U.S. Government) | $ | 949,557,663 | $ | 949,853,247 | ||||
U.S. Government and Agency Securities | 278,310,595 | 388,582,878 | ||||||
| $ | 1,227,868,258 | $ | 1,338,436,125 | |||||
6 Common Shares of Beneficial Interest
The Fund may issue common shares pursuant to its dividend reinvestment plan. There were no common shares issued by the Fund for the years ended March 31, 2020 and March 31, 2019.
In November 2013, the Board of Trustees initially approved a share repurchase program for the Fund. Pursuant to the reauthorization of the share repurchase program by the Board of Trustees in March 2019, the Fund is authorized to repurchase up to 10% of its common shares outstanding as of the last day of the prior calendar year at market prices when shares are trading at a discount to net asset value. The share repurchase program does not obligate the Fund to purchase a specific amount of shares. There were no repurchases of common shares by the Fund for the years ended March 31, 2020 and March 31, 2019.
7 Restricted Securities
At March 31, 2020, the Fund owned the following securities (representing less than 0.1% of net assets applicable to common shares) which were restricted as to public resale and not registered under the Securities Act of 1933 (excluding Rule 144A securities). The Fund has various registration rights (exercisable under a variety of circumstances) with respect to these securities. The value of these securities is determined based on valuations provided by brokers when available, or if not available, they are valued at fair value using methods determined in good faith by or at the direction of the Trustees.
| Description | Date of Acquisition | Shares | Cost | Value | ||||||||||||
Common Stocks | ||||||||||||||||
Nine Point Energy Holdings, Inc. | 7/15/14 | 29,787 | $ | 1,370,397 | $ | 298 | ||||||||||
Convertible Preferred Stocks | ||||||||||||||||
Nine Point Energy Holdings, Inc., Series A, 12.00% | 5/26/17 | 555 | $ | 555,000 | $ | 320,663 | ||||||||||
Total Restricted Securities | $ | 1,925,397 | $ | 320,961 | ||||||||||||
| 68 |
Eaton Vance
Limited Duration Income Fund
March 31, 2020
Notes to Financial Statements — continued
8 Financial Instruments
The Fund may trade in financial instruments with off-balance sheet risk in the normal course of its investing activities. These financial instruments may include forward foreign currency exchange contracts, financial futures contracts and swap contracts and may involve, to a varying degree, elements of risk in excess of the amounts recognized for financial statement purposes. The notional or contractual amounts of these instruments represent the investment the Fund has in particular classes of financial instruments and do not necessarily represent the amounts potentially subject to risk. The measurement of the risks associated with these instruments is meaningful only when all related and offsetting transactions are considered. A summary of obligations under these financial instruments at March 31, 2020 is included in the Portfolio of Investments. At March 31, 2020, the Fund had sufficient cash and/or securities to cover commitments under these contracts.
In the normal course of pursuing its investment objectives, the Fund is subject to the following risks:
Credit Risk: The Fund enters into credit default swap contracts to enhance total return and/or as a substitute for the purchase of securities.
Foreign Exchange Risk: The Fund holds foreign currency denominated investments. The value of these investments and related receivables and payables may change due to future changes in foreign currency exchange rates. To hedge against this risk, the Fund enters into forward foreign currency exchange contracts.
Interest Rate Risk: The Fund utilizes various interest rate derivatives including futures contracts and interest rate swaps to manage the duration of its portfolio and to hedge against fluctuations in securities prices due to interest rates.
The Fund enters into over-the-counter (OTC) derivatives that may contain provisions whereby the counterparty may terminate the contract under certain conditions, including but not limited to a decline in the Fund’s net assets below a certain level over a certain period of time, which would trigger a payment by the Fund for those derivatives in a liability position. At March 31, 2020, the fair value of derivatives with credit-related contingent features in a net liability position was $597,935. At March 31, 2020, there were no assets pledged by the Fund for such liability.
The OTC derivatives in which the Fund invests are subject to the risk that the counterparty to the contract fails to perform its obligations under the contract. To mitigate this risk, the Fund has entered into an International Swaps and Derivatives Association, Inc. Master Agreement (“ISDA Master Agreement”) or similar agreement with substantially all its derivative counterparties. An ISDA Master Agreement is a bilateral agreement between the Fund and a counterparty that governs certain OTC derivatives and typically contains, among other things, set-off provisions in the event of a default and/or termination event as defined under the relevant ISDA Master Agreement. Under an ISDA Master Agreement, the Fund may, under certain circumstances, offset with the counterparty certain derivative financial instruments’ payables and/or receivables with collateral held and/or posted and create one single net payment. The provisions of the ISDA Master Agreement typically permit a single net payment in the event of default including the bankruptcy or insolvency of the counterparty. However, bankruptcy or insolvency laws of a particular jurisdiction may impose restrictions on or prohibitions against the right of offset in bankruptcy or insolvency. Certain ISDA Master Agreements allow counterparties to OTC derivatives to terminate derivative contracts prior to maturity in the event the Fund’s net assets decline by a stated percentage or the Fund fails to meet the terms of its ISDA Master Agreements, which would cause the counterparty to accelerate payment by the Fund of any net liability owed to it.
The collateral requirements for derivatives traded under an ISDA Master Agreement are governed by a Credit Support Annex to the ISDA Master Agreement. Collateral requirements are determined at the close of business each day and are typically based on changes in market values for each transaction under an ISDA Master Agreement and netted into one amount for such agreement. Generally, the amount of collateral due from or to a counterparty is subject to a minimum transfer threshold amount before a transfer is required, which may vary by counterparty. Collateral pledged for the benefit of the Fund and/or counterparty is held in segregated accounts by the Fund’s custodian and cannot be sold, re-pledged, assigned or otherwise used while pledged. The portion of such collateral representing cash, if any, is reflected as deposits for derivatives collateral and, in the case of cash pledged by a counterparty for the benefit of the Fund, a corresponding liability on the Statement of Assets and Liabilities. Securities pledged by the Fund as collateral, if any, are identified as such in the Portfolio of Investments. The carrying amount of the liability for cash collateral due to brokers at March 31, 2020 approximated its fair value. If measured at fair value, such liability would have been considered as Level 2 in the fair value hierarchy (see Note 12) at March 31, 2020.
| 69 |
Eaton Vance
Limited Duration Income Fund
March 31, 2020
Notes to Financial Statements — continued
The fair value of open derivative instruments (not considered to be hedging instruments for accounting disclosure purposes) by risk exposure at March 31, 2020 was as follows:
| Fair Value | ||||||||||||||||
| Statement of Assets and Liabilities Caption | Credit | Foreign Exchange | Interest Rate | Total | ||||||||||||
Accumulated loss | $ | — | $ | 37,495 | * | $ | 5,037,602 | * | $ | 5,075,097 | ||||||
Receivable for open forward foreign currency exchange contracts | — | 1,057,760 | — | 1,057,760 | ||||||||||||
Total Asset Derivatives | $ | — | $ | 1,095,255 | $ | 5,037,602 | $ | 6,132,857 | ||||||||
Derivatives not subject to master netting or similar agreements | $ | — | $ | 37,495 | $ | 5,037,602 | $ | 5,075,097 | ||||||||
Total Asset Derivatives subject to master netting or similar agreements | $ | — | $ | 1,057,760 | $ | — | $ | 1,057,760 | ||||||||
Accumulated loss | $ | (705,493 | )* | $ | (181,459 | )* | $ | (4,737,576 | )* | $ | (5,624,528 | ) | ||||
Payable for open forward foreign currency exchange contracts | — | (540,405 | ) | — | (540,405 | ) | ||||||||||
Payable/receivable for open swap contracts; Upfront receipts on open non-centrally cleared swap contracts | (57,530 | ) | — | — | (57,530 | ) | ||||||||||
Total Liability Derivatives | $ | (763,023 | ) | $ | (721,864 | ) | $ | (4,737,576 | ) | $ | (6,222,463 | ) | ||||
Derivatives not subject to master netting or similar agreements | $ | (705,493 | ) | $ | (181,459 | ) | $ | (4,737,576 | ) | $ | (5,624,528 | ) | ||||
Total Liability Derivatives subject to master netting or similar agreements | $ | (57,530 | ) | $ | (540,405 | ) | $ | — | $ | (597,935 | ) | |||||
| * | For futures contracts and centrally cleared derivatives, amount represents value as shown in the Portfolio of Investments. Only the current day’s variation margin on open futures contracts and centrally cleared derivatives is reported within the Statement of Assets and Liabilities as Receivable or Payable for variation margin on open financial futures contracts and centrally cleared derivatives, as applicable. |
| 70 |
Eaton Vance
Limited Duration Income Fund
March 31, 2020
Notes to Financial Statements — continued
The Fund’s derivative assets and liabilities at fair value by risk, which are reported gross in the Statement of Assets and Liabilities, are presented in the table above. The following tables present the Fund’s derivative assets and liabilities by counterparty, net of amounts available for offset under a master netting agreement and net of the related collateral received by the Fund for such assets and pledged by the Fund for such liabilities as of March 31, 2020.
| Counterparty | Derivative Assets Subject to | Derivatives Available for Offset | Non-cash Collateral Received(a) | Cash Collateral Received(a) | Net Amount of Derivative Assets(b) | Total Cash Collateral Received | ||||||||||||||||||
Bank of America, N.A. | $ | 183,922 | $ | (109,606 | ) | $ | (74,316 | ) | $ | — | $ | — | $ | — | ||||||||||
Citibank, N.A. | 182,909 | (70 | ) | — | (182,839 | ) | — | 270,000 | ||||||||||||||||
Goldman Sachs International | 55,248 | (36,393 | ) | — | — | 18,855 | — | |||||||||||||||||
HSBC Bank USA, N.A. | 274,145 | (17,396 | ) | (256,749 | ) | — | — | — | ||||||||||||||||
JPMorgan Chase Bank, N.A. | 68,618 | (50,920 | ) | — | (17,698 | ) | — | 60,000 | ||||||||||||||||
State Street Bank and Trust Company | 292,918 | (101,190 | ) | (191,728 | ) | — | — | — | ||||||||||||||||
| $ | 1,057,760 | $ | (315,575 | ) | $ | (522,793 | ) | $ | (200,537 | ) | $ | 18,855 | $ | 330,000 | ||||||||||
| Counterparty | Derivative Liabilities Subject to Master Netting Agreement | Derivatives Available for Offset | Non-cash Collateral Pledged(a) | Cash Collateral Pledged(a) | Net Amount of Derivative Liabilities(c) | Total Cash Collateral Pledged | ||||||||||||||||||
Bank of America, N.A. | $ | (109,606 | ) | $ | 109,606 | $ | — | $ | — | $ | — | $ | — | |||||||||||
Citibank, N.A. | (70 | ) | 70 | — | — | — | — | |||||||||||||||||
Deutsche Bank AG | (57,530 | ) | — | — | — | (57,530 | ) | — | ||||||||||||||||
Goldman Sachs International | (36,393 | ) | 36,393 | — | — | — | — | |||||||||||||||||
HSBC Bank USA, N.A. | (17,396 | ) | 17,396 | — | — | — | — | |||||||||||||||||
JPMorgan Chase Bank, N.A. | (50,920 | ) | 50,920 | — | — | — | — | |||||||||||||||||
Standard Chartered Bank | (224,830 | ) | — | — | — | (224,830 | ) | — | ||||||||||||||||
State Street Bank and Trust Company | (101,190 | ) | 101,190 | — | — | — | — | |||||||||||||||||
| $ | (597,935 | ) | $ | 315,575 | $ | — | $ | — | $ | (282,360 | ) | $ | — | |||||||||||
| (a) | In some instances, the total collateral received and/or pledged may be more than the amount shown due to overcollateralization. |
| (b) | Net amount represents the net amount due from the counterparty in the event of default. |
| (c) | Net amount represents the net amount payable to the counterparty in the event of default. |
Information with respect to reverse repurchase agreements at March 31, 2020 is included at Note 10.
| 71 |
Eaton Vance
Limited Duration Income Fund
March 31, 2020
Notes to Financial Statements — continued
The effect of derivative instruments (not considered to be hedging instruments for accounting disclosure purposes) on the Statement of Operations by risk exposure for the year ended March 31, 2020 was as follows:
| Statement of Operations Caption | Credit | Foreign Exchange | Interest Rate | Total | ||||||||||||
Net realized gain (loss) — | ||||||||||||||||
Financial futures contracts | $ | — | $ | — | $ | 2,285,541 | $ | 2,285,541 | ||||||||
Swap contracts | (849,314 | ) | — | (4,994,202 | ) | (5,843,516 | ) | |||||||||
Forward foreign currency exchange contracts | — | 5,762,003 | — | 5,762,003 | ||||||||||||
Total | $ | (849,314 | ) | $ | 5,762,003 | $ | (2,708,661 | ) | $ | 2,204,028 | ||||||
Change in unrealized appreciation (depreciation) — | ||||||||||||||||
Financial futures contracts | $ | — | $ | — | $ | 6,714,602 | $ | 6,714,602 | ||||||||
Swap contracts | 108,358 | — | (2,975,320 | ) | (2,866,962 | ) | ||||||||||
Forward foreign currency exchange contracts | — | (1,015,012 | ) | — | (1,015,012 | ) | ||||||||||
Total | $ | 108,358 | $ | (1,015,012 | ) | $ | 3,739,282 | $ | 2,832,628 | |||||||
The average notional cost of futures contracts and average notional amounts of other derivative contracts outstanding during the year ended March 31, 2020, which are indicative of the volume of these derivative types, were approximately as follows:
| Futures Contracts — Long | Futures Contracts — Short | Forward Foreign Currency Exchange Contracts* | Swap Contracts | |||||||||||
| $71,545,000 | $ | 78,776,000 | $ | 140,114,000 | $ | 50,316,000 | ||||||||
| * | The average notional amount of forward foreign currency exchange contracts is based on the absolute value of notional amounts of currency purchased and currency sold. |
9 Credit Agreement
The Fund has entered into a Credit Agreement, as amended (the Agreement) with major financial institutions to borrow up to $850 million. Borrowings under the Agreement are secured by the assets of the Fund. Interest is charged at a rate above the London Interbank Offered Rate (LIBOR) and is payable monthly. Under the terms of the Agreement, in effect through December 17, 2021, the Fund pays a facility fee of 0.25% per annum on the borrowing limit. In connection with the renewal of the Agreement on December 18, 2018, the Fund paid an upfront fee of $1,530,000, which is being amortized to interest expense over a period of three years through December 2021. The unamortized balance at March 31, 2020 is approximately $895,000 and is included in prepaid upfront fees on notes payable in the Statement of Assets and Liabilities. The Fund is required to maintain certain net asset levels during the term of the Agreement. At March 31, 2020, the Fund had borrowings outstanding under the Agreement of $525,000,000 at an interest rate of 1.54%. Based on the short-term nature of the borrowings under the Agreement and the variable interest rate, the carrying amount of the borrowings at March 31, 2020 approximated its fair value. If measured at fair value, borrowings under the Agreement would have been considered as Level 2 in the fair value hierarchy (see Note 12) at March 31, 2020. Facility fees for the year ended March 31, 2020 totaled $2,160,417 and are included in interest expense and fees on the Statement of Operations. For the year ended March 31, 2020, the average borrowings under the Agreement and the average interest rate (excluding fees) were $602,685,792 and 2.86%, respectively.
| 72 |
Eaton Vance
Limited Duration Income Fund
March 31, 2020
Notes to Financial Statements — continued
10 Reverse Repurchase Agreements
Reverse repurchase agreements outstanding as of March 31, 2020 were as follows:
| Counterparty | Trade Date | Maturity Date | Interest Rate | Principal Amount | Value Including Interest | U.S. Government Securities Pledged as | ||||||||||||||||||
Bank of America | 3/19/20 | 4/21/20 | 1.00 | % | $ | 11,294,217 | $ | 11,297,982 | $ | 11,617,827 | ||||||||||||||
Bank of America | 3/19/20 | 4/21/20 | 1.05 | 35,694,951 | 35,707,444 | 37,452,228 | ||||||||||||||||||
Bank of Montreal | 3/19/20 | 4/21/20 | 1.10 | 19,490,988 | 19,498,135 | 20,691,474 | ||||||||||||||||||
Total | $ | 66,480,156 | $ | 66,503,561 | $ | 69,761,529 | ||||||||||||||||||
The Fund also pledged cash of $2,492,942 to Bank of America as additional collateral for its reverse repurchase agreements. At March 31, 2020, the remaining contractual maturity of all reverse repurchase agreements was less than 30 days.
For the year ended March 31, 2020, the average borrowings under settled reverse repurchase agreements and the average interest rate were $91,412,452 and 2.35%, respectively. The reverse repurchase agreements entered into by the Fund are subject to Master Repurchase Agreements (MRA), which permit the Fund, under certain circumstances, including an event of default (such as bankruptcy or insolvency), to offset payables and/or receivables under the MRA with collateral held and/or posted to the counterparty and create one single net payment due to or from the Fund. At March 31, 2020, the market value of securities and cash pledged for the benefit of counterparties for reverse repurchase agreements exceeded the amount of borrowings for each counterparty. Based on the short-term nature of the borrowings under the reverse repurchase agreements, the carrying value of the payable for reverse repurchase agreements approximated its fair value at March 31, 2020. If measured at fair value, borrowings under the reverse repurchase agreements would have been considered as Level 2 in the fair value hierarchy (see Note 12) at March 31, 2020.
11 Investments in Affiliated Funds
At March 31, 2020, the value of the Fund’s investment in affiliated funds was $24,661,698, which represents 1.8% of the Fund’s net assets applicable to common shares. Transactions in affiliated funds by the Fund for the year ended March 31, 2020 were as follows:
| Name of affiliated fund | Value, beginning of period | Purchases | Sales proceeds | Net realized gain (loss) | Change in unrealized appreciation (depreciation) | Value, end of period | Dividend income | Units, end of period | ||||||||||||||||||||||||
Short-Term Investments |
| |||||||||||||||||||||||||||||||
Eaton Vance Cash Reserves Fund, LLC | $ | 43,608,087 | $ | 1,232,840,351 | $ | (1,251,754,325 | ) | $ | (32,843 | ) | $ | 428 | $ | 24,661,698 | $ | 763,298 | 24,671,567 | |||||||||||||||
12 Fair Value Measurements
Under generally accepted accounting principles for fair value measurements, a three-tier hierarchy to prioritize the assumptions, referred to as inputs, is used in valuation techniques to measure fair value. The three-tier hierarchy of inputs is summarized in the three broad levels listed below.
| • | Level 1 — quoted prices in active markets for identical investments |
| • | Level 2 — other significant observable inputs (including quoted prices for similar investments, interest rates, prepayment speeds, credit risk, etc.) |
| • | Level 3 — significant unobservable inputs (including a fund’s own assumptions in determining the fair value of investments) |
In cases where the inputs used to measure fair value fall in different levels of the fair value hierarchy, the level disclosed is determined based on the lowest level input that is significant to the fair value measurement in its entirety. The inputs or methodology used for valuing securities are not necessarily an indication of the risk associated with investing in those securities.
| 73 |
Eaton Vance
Limited Duration Income Fund
March 31, 2020
Notes to Financial Statements — continued
At March 31, 2020, the hierarchy of inputs used in valuing the Fund’s investments and open derivative instruments, which are carried at value, were as follows:
| Asset Description | Level 1 | Level 2 | Level 3* | Total | ||||||||||||
Senior Floating-Rate Loans (Less Unfunded Loan Commitments) | $ | — | $ | 689,923,076 | $ | 2,565,027 | $ | 692,488,103 | ||||||||
Corporate Bonds & Notes | — | 672,059,668 | — | 672,059,668 | ||||||||||||
Foreign Government Securities | — | 57,002,202 | — | 57,002,202 | ||||||||||||
Sovereign Loans | — | 9,428,055 | — | 9,428,055 | ||||||||||||
Mortgage Pass-Throughs | — | 148,254,774 | — | 148,254,774 | ||||||||||||
Collateralized Mortgage Obligations | — | 355,674,424 | — | 355,674,424 | ||||||||||||
Commercial Mortgage-Backed Securities | — | 82,918,879 | — | 82,918,879 | ||||||||||||
Asset-Backed Securities | — | 85,127,367 | — | 85,127,367 | ||||||||||||
Common Stocks | 552,885 | 1,423,557 | 3,806,788 | 5,783,230 | ||||||||||||
Convertible Preferred Stocks | — | — | 320,663 | 320,663 | ||||||||||||
Preferred Stocks | 865,550 | — | 465,806 | 1,331,356 | ||||||||||||
Closed-End Funds | 18,384,203 | — | — | 18,384,203 | ||||||||||||
Warrants | — | — | 0 | 0 | ||||||||||||
Miscellaneous | — | 20,068 | 0 | 20,068 | ||||||||||||
Short-Term Investments — | ||||||||||||||||
U.S. Treasury Obligations | — | 499,995 | — | 499,995 | ||||||||||||
Other | — | 24,661,698 | — | 24,661,698 | ||||||||||||
Total Investments | $ | 19,802,638 | $ | 2,126,993,763 | $ | 7,158,284 | $ | 2,153,954,685 | ||||||||
Forward Foreign Currency Exchange Contracts | $ | — | $ | 1,095,255 | $ | — | $ | 1,095,255 | ||||||||
Futures Contracts | 5,022,435 | — | — | 5,022,435 | ||||||||||||
Swap Contracts | — | 15,167 | — | 15,167 | ||||||||||||
Total | $ | 24,825,073 | $ | 2,128,104,185 | $ | 7,158,284 | $ | 2,160,087,542 | ||||||||
Liability Description | ||||||||||||||||
Forward Foreign Currency Exchange Contracts | $ | — | $ | (721,864 | ) | $ | — | $ | (721,864 | ) | ||||||
Futures Contracts | (281,651 | ) | — | — | (281,651 | ) | ||||||||||
Swap Contracts | — | (5,218,948 | ) | — | (5,218,948 | ) | ||||||||||
Total | $ | (281,651 | ) | $ | (5,940,812 | ) | $ | — | $ | (6,222,463 | ) | |||||
| * | None of the unobservable inputs for Level 3 assets, individually or collectively, had a material impact on the Fund. |
Level 3 investments at the beginning and/or end of the period in relation to net assets were not significant and accordingly, a reconciliation of Level 3 assets for the year ended March 31, 2020 is not presented.
13 Legal Proceedings
In May 2015, the Fund was served with an amended complaint filed in an adversary proceeding in the United States Bankruptcy Court for the Southern District of New York. The adversary proceeding was filed by the Motors Liquidation Company Avoidance Action Trust (“AAT”) against the former holders of a $1.5 billion term loan issued by General Motors Corp. (“GM”) in 2006 (the “Term Loan Lenders”) who received a full repayment of the term loan pursuant to a court order in the GM bankruptcy proceeding. The court order was made with the understanding that the term loan was fully secured at the time of GM’s bankruptcy filing in June 2009. The AAT sought (1) a determination from the Bankruptcy Court that the security interest held by the Term Loan Lenders was not perfected at the time GM filed for Chapter 11 Bankruptcy protection and thus the Term Loan Lenders should have been treated in the same manner as GM’s unsecured creditors, (2) disgorgement of any interest payments made to the Term Loan Lenders within ninety days of GM’s filing for Chapter 11 Bankruptcy protection, and (3) disgorgement of the $1.5 billion term loan repayment that was made to the Term Loan Lenders. The value of the payment received under the term loan agreement by the Fund was approximately $4,460,000. In April 2019, the parties to the litigation
| 74 |
Eaton Vance
Limited Duration Income Fund
March 31, 2020
Notes to Financial Statements — continued
reached a settlement agreement in principle, subject to Court approval. On June 12, 2019, the Court approved the settlement, and all claims and cross claims in the litigation were dismissed on July 2, 2019. The Fund did not suffer any loss to the Fund’s net asset value as a result of the settlement and recovered a portion of the attorneys’ fees and costs incurred, which were previously expensed by the Fund.
14 Risks and Uncertainties
Risks Associated with Foreign Investments
Investing in securities issued by companies or entities whose principal business activities are outside the United States may involve significant risks not present in domestic investments. For example, there is generally less publicly available information about foreign companies, particularly those not subject to the disclosure and reporting requirements of the U.S. securities laws. Certain foreign issuers are generally not bound by uniform accounting, auditing, and financial reporting requirements and standards of practice comparable to those applicable to domestic issuers. Investments in foreign securities also involve the risk of possible adverse changes in investment or exchange control regulations, expropriation or confiscatory taxation, limitation on the removal of funds or other assets of the Fund, political or financial instability or diplomatic and other developments which could affect such investments. Foreign securities markets, while growing in volume and sophistication, are generally not as developed as those in the United States, and securities of some foreign issuers (particularly those located in developing countries) may be less liquid and more volatile than securities of comparable U.S. companies. In general, there is less overall governmental supervision and regulation of foreign securities markets, broker/dealers and issuers than in the United States.
Pandemic Risk
An outbreak of respiratory disease caused by a novel coronavirus that was first detected in China in December 2019 has spread rapidly internationally. This coronavirus has resulted in closing borders, enhanced health screenings, changes to healthcare service preparation and delivery, quarantines, cancellations, disruptions to supply chains and customer activity, as well as general concern and uncertainty. The impact of this outbreak has negatively affected the worldwide economy, as well as the economies of individual countries and individual companies and can affect the market in general in significant and unforeseen ways. Health crises caused by outbreaks, such as the coronavirus outbreak, may exacerbate other pre-existing political, social and economic risks and disrupt normal market conditions and operations. The near-term impact of this coronavirus has resulted in substantial market volatility, which may have an adverse effect on the Fund’s investments.
| 75 |
Eaton Vance
Limited Duration Income Fund
March 31, 2020
Report of Independent Registered Public Accounting Firm
To the Trustees and Shareholders of Eaton Vance Limited Duration Income Fund:
Opinion on the Financial Statements and Financial Highlights
We have audited the accompanying statement of assets and liabilities of Eaton Vance Limited Duration Income Fund (the “Fund”), including the portfolio of investments, as of March 31, 2020, the related statements of operations and cash flows for the year then ended, the statements of changes in net assets for each of the two years in the period then ended, the financial highlights for each of the five years in the period then ended, and the related notes. In our opinion, the financial statements and financial highlights present fairly, in all material respects, the financial position of the Fund as of March 31, 2020, the results of its operations and its cash flows for the year then ended, the changes in its net assets for each of the two years in the period then ended, and the financial highlights for each of the five years in the period then ended in conformity with accounting principles generally accepted in the United States of America.
Basis for Opinion
These financial statements and financial highlights are the responsibility of the Fund’s management. Our responsibility is to express an opinion on the Fund’s financial statements and financial highlights based on our audits. We are a public accounting firm registered with the Public Company Accounting Oversight Board (United States) (PCAOB) and are required to be independent with respect to the Fund in accordance with the U.S. federal securities laws and the applicable rules and regulations of the Securities and Exchange Commission and the PCAOB.
We conducted our audits in accordance with the standards of the PCAOB. Those standards require that we plan and perform the audit to obtain reasonable assurance about whether the financial statements and financial highlights are free of material misstatement, whether due to error or fraud. The Fund is not required to have, nor were we engaged to perform, an audit of its internal control over financial reporting. As part of our audits we are required to obtain an understanding of internal control over financial reporting but not for the purpose of expressing an opinion on the effectiveness of the Fund’s internal control over financial reporting. Accordingly, we express no such opinion.
Our audits included performing procedures to assess the risks of material misstatement of the financial statements and financial highlights, whether due to error or fraud, and performing procedures that respond to those risks. Such procedures included examining, on a test basis, evidence regarding the amounts and disclosures in the financial statements and financial highlights. Our audits also included evaluating the accounting principles used and significant estimates made by management, as well as evaluating the overall presentation of the financial statements and financial highlights. Our procedures included confirmation of securities and senior loans owned as of March 31, 2020, by correspondence with the custodian, brokers and selling or agent banks; when replies were not received from brokers and selling or agent banks, we performed other auditing procedures. We believe that our audits provide a reasonable basis for our opinion.
/s/ Deloitte & Touche LLP
Boston, Massachusetts
May 22, 2020
We have served as the auditor of one or more Eaton Vance investment companies since 1959.
| 76 |
Eaton Vance
Limited Duration Income Fund
March 31, 2020
Federal Tax Information (Unaudited)
The Form 1099-DIV you receive in February 2021 will show the tax status of all distributions paid to your account in calendar year 2020. Shareholders are advised to consult their own tax adviser with respect to the tax consequences of their investment in the Fund. As required by the Internal Revenue Code and/or regulations, shareholders must be notified regarding the status of qualified dividend income for individuals.
Qualified Dividend Income. For the fiscal year ended March 31, 2020, the Fund designates approximately $3,043,259, or up to the maximum amount of such dividends allowable pursuant to the Internal Revenue Code, as qualified dividend income eligible for the reduced tax rate of 15%.
| 77 |
Eaton Vance
Limited Duration Income Fund
March 31, 2020
Annual Meeting of Shareholders (Unaudited)
The Fund held its Annual Meeting of Shareholders on January 16, 2020. The following actions were taken by the shareholders:
Item 1: The election of Thomas E. Faust Jr., Mark R. Fetting, William H. Park and Keith Quinton as Class II Trustees of the Fund, each for a three-year term expiring in 2023. Mr. Park was elected solely by APS shareholders.
Nominees for Trustee Elected by All Shareholders | Number of Shares | |||||||
| For | Withheld | |||||||
Thomas E. Faust Jr. | 91,129,269 | 15,289,865 | ||||||
Mark R. Fetting | 91,069,162 | 15,349,972 | ||||||
Keith Quinton | 91,158,341 | 15,260,793 | ||||||
Nominee for Trustee Elected by APS Shareholders | Number of Shares | |||||||
| For | Withheld | |||||||
William H. Park | 2,267 | 5,158 | ||||||
Item 2: A non-binding shareholder proposal that the Board take the necessary steps to declassify the Board of Trustees of the Fund so that all Trustees are elected on an annual basis. In light of the results below, the Fund’s Board will take the declassification proposal into consideration.
| Number of Shares | ||||||||
| For | Against | |||||||
| 32,221,989 | 30,066,096 | |||||||
| 78 |
Eaton Vance
Limited Duration Income Fund
March 31, 2020
Dividend Reinvestment Plan
The Fund offers a dividend reinvestment plan (Plan) pursuant to which shareholders may elect to have distributions automatically reinvested in common shares (Shares) of the Fund. You may elect to participate in the Plan by completing the Dividend Reinvestment Plan Application Form. If you do not participate, you will receive all distributions in cash paid by check mailed directly to you by American Stock Transfer & Trust Company, LLC (AST) as dividend paying agent. On the distribution payment date, if the NAV per Share is equal to or less than the market price per Share plus estimated brokerage commissions, then new Shares will be issued. The number of Shares shall be determined by the greater of the NAV per Share or 95% of the market price. Otherwise, Shares generally will be purchased on the open market by AST, the Plan agent (Agent). Distributions subject to income tax (if any) are taxable whether or not Shares are reinvested.
If your Shares are in the name of a brokerage firm, bank, or other nominee, you can ask the firm or nominee to participate in the Plan on your behalf. If the nominee does not offer the Plan, you will need to request that the Fund’s transfer agent re-register your Shares in your name or you will not be able to participate.
The Agent’s service fee for handling distributions will be paid by the Fund. Plan participants will be charged their pro rata share of brokerage commissions on all open-market purchases.
Plan participants may withdraw from the Plan at any time by writing to the Agent at the address noted on the following page. If you withdraw, you will receive Shares in your name for all Shares credited to your account under the Plan. If a participant elects by written notice to the Agent to sell part or all of his or her Shares and remit the proceeds, the Agent is authorized to deduct a $5.00 fee plus brokerage commissions from the proceeds.
If you wish to participate in the Plan and your Shares are held in your own name, you may complete the form on the following page and deliver it to the Agent. Any inquiries regarding the Plan can be directed to the Agent at 1-866-439-6787.
| 79 |
Eaton Vance
Limited Duration Income Fund
March 31, 2020
Application for Participation in Dividend Reinvestment Plan
This form is for shareholders who hold their common shares in their own names. If your common shares are held in the name of a brokerage firm, bank, or other nominee, you should contact your nominee to see if it will participate in the Plan on your behalf. If you wish to participate in the Plan, but your brokerage firm, bank, or nominee is unable to participate on your behalf, you should request that your common shares be re-registered in your own name which will enable your participation in the Plan.
The following authorization and appointment is given with the understanding that I may terminate it at any time by terminating my participation in the Plan as provided in the terms and conditions of the Plan.
Please print exact name on account
Shareholder signature Date
Shareholder signature Date
Please sign exactly as your common shares are registered. All persons whose names appear on the share certificate must sign.
YOU SHOULD NOT RETURN THIS FORM IF YOU WISH TO RECEIVE YOUR DISTRIBUTIONS IN CASH. THIS IS NOT A PROXY.
This authorization form, when signed, should be mailed to the following address:
Eaton Vance Limited Duration Income Fund
c/o American Stock Transfer & Trust Company, LLC
P.O. Box 922
Wall Street Station
New York, NY 10269-0560
| 80 |
Eaton Vance
Limited Duration Income Fund
March 31, 2020
Management and Organization
Fund Management. The Trustees of Eaton Vance Limited Duration Income Fund (the Fund) are responsible for the overall management and supervision of the Fund’s affairs. The Trustees and officers of the Fund are listed below. Except as indicated, each individual has held the office shown or other offices in the same company for the last five years. The “Noninterested Trustees” consist of those Trustees who are not “interested persons” of the Fund, as that term is defined under the 1940 Act. The business address of each Trustee and officer is Two International Place, Boston, Massachusetts 02110. As used below, “EVC” refers to Eaton Vance Corp., “EV” refers to Eaton Vance, Inc., “EVM” refers to Eaton Vance Management, “BMR” refers to Boston Management and Research and “EVD” refers to Eaton Vance Distributors, Inc. EVC and EV are the corporate parent and trustee, respectively, of EVM and BMR. EVD is a wholly-owned subsidiary of EVC. Each officer affiliated with Eaton Vance may hold a position with other Eaton Vance affiliates that is comparable to his or her position with EVM listed below. Each Trustee oversees 159 portfolios in the Eaton Vance Complex (including all master and feeder funds in a master feeder structure).
| Name and Year of Birth | Position(s) with the Fund | Term Expiring; Trustee Since(1) | Principal Occupation(s) and Directorships During Past Five Years and Other Relevant Experience | |||
| Interested Trustee | ||||||
Thomas E. Faust Jr. 1958 | Class II Trustee | Until 2023. Trustee since 2007. | Chairman, Chief Executive Officer and President of EVC, Director and President of EV, Chief Executive Officer and President of EVM and BMR, and Director of EVD. Trustee and/or officer of 159 registered investment companies. Mr. Faust is an interested person because of his positions with EVM, BMR, EVD, EVC and EV, which are affiliates of the Fund. Directorships in the Last Five Years. Director of EVC and Hexavest Inc. (investment management firm). | |||
| Noninterested Trustees | ||||||
Mark R. Fetting 1954 | Class II Trustee | Until 2023. Trustee since 2016. | Private investor. Formerly held various positions at Legg Mason, Inc. (investment management firm) (2000-2012), including President, Chief Executive Officer, Director and Chairman (2008-2012), Senior Executive Vice President(2004-2008) and Executive Vice President (2001-2004). Formerly, President of Legg Mason family of funds (2001-2008). Formerly, Division President and Senior Officer of Prudential Financial Group, Inc. and related companies (investment management firm) (1991-2000). Other Directorships in the Last Five Years. None. | |||
Cynthia E. Frost 1961 | Class I Trustee | Until 2022. Trustee since 2014. | Private investor. Formerly, Chief Investment Officer of Brown University (university endowment) (2000-2012). Formerly, Portfolio Strategist for Duke Management Company (university endowment manager) (1995-2000). Formerly, Managing Director, Cambridge Associates (investment consulting company) (1989-1995). Formerly, Consultant, Bain and Company (management consulting firm) (1987-1989). Formerly, Senior Equity Analyst, BA Investment Management Company (1983-1985). Other Directorships in the Last Five Years. None. | |||
George J. Gorman 1952 | Class III Trustee | Until 2021. Trustee since 2014. | Principal at George J. Gorman LLC (consulting firm). Formerly, Senior Partner at Ernst & Young LLP (a registered public accounting firm) (1974-2009). Other Directorships in the Last Five Years. Formerly, Trustee of the BofA Funds Series Trust (11 funds) (2011-2014) and of the Ashmore Funds (9 funds) (2010-2014). | |||
Valerie A. Mosley 1960 | Class I Trustee | Until 2022. Trustee since 2014. | Director of Groupon, Inc. (ecommerce provider) (since April 2020). Chairwoman and Chief Executive Officer of Valmo Ventures (a consulting and investment firm). Former Partner and Senior Vice President, Portfolio Manager and Investment Strategist at Wellington Management Company, LLP (investment management firm) (1992-2012). Former Chief Investment Officer, PG Corbin Asset Management (1990-1992). Formerly worked in institutional corporate bond sales at Kidder Peabody (1986-1990). Other Directorships in the Last Five Years. Director of Groupon, Inc. (e-commerce provider) (since April 2020). Director of Envestnet, Inc. (provider of intelligent systems for wealth management and financial wellness) (since 2018). Director of Dynex Capital, Inc. (mortgage REIT) (since 2013). | |||
| 81 |
Eaton Vance
Limited Duration Income Fund
March 31, 2020
Management and Organization — continued
| Name and Year of Birth | Position(s) with the Fund | Term Expiring; Trustee Since(1) | Principal Occupation(s) and Directorships During Past Five Years and Other Relevant Experience | |||
| Noninterested Trustees (continued) | ||||||
William H. Park 1947 | Chairperson of the Board and Class II Trustee | Until 2023. Chairperson of the Board since 2016 and Trustee since 2003. | Private investor. Formerly, Consultant (management and transactional)(2012-2014). Formerly, Chief Financial Officer, Aveon Group L.P. (investment management firm) (2010-2011). Formerly, Vice Chairman, Commercial Industrial Finance Corp. (specialty finance company) (2006-2010). Formerly, President and Chief Executive Officer, Prizm Capital Management, LLC (investment management firm) (2002-2005). Formerly, Executive Vice President and Chief Financial Officer, United Asset Management Corporation (investment management firm) (1982-2001). Formerly, Senior Manager, Price Waterhouse (now PricewaterhouseCoopers) (a registered public accounting firm) (1972-1981). Other Directorships in the Last Five Years. None. | |||
Helen Frame Peters 1948 | Class III Trustee | Until 2021. Trustee since 2008. | Professor of Finance, Carroll School of Management, Boston College. Formerly, Dean, Carroll School of Management, Boston College (2000-2002). Formerly, Chief Investment Officer, Fixed Income, Scudder Kemper Investments (investment management firm) (1998-1999). Formerly, Chief Investment Officer, Equity and Fixed Income, Colonial Management Associates (investment management firm) (1991-1998). Other Directorships in the Last Five Years. None. | |||
Keith Quinton 1958 | Class II Trustee | Until 2023. Trustee since 2018. | Independent Investment Committee Member at New Hampshire Retirement System (since 2017). Formerly, Portfolio Manager and Senior Quantitative Analyst at Fidelity Investments (investment management firm) (2001-2014). Other Directorships in the Last Five Years. Director (since 2016) and Chairman (since 2019) of New Hampshire Municipal Bond Bank. | |||
Marcus L. Smith 1966 | Class III Trustee | Until 2021. Trustee since 2018. | Private investor. Member of Posse Boston Advisory Board (foundation) (since 2015). Formerly, Portfolio Manager at MFS Investment Management (investment management firm) (1994-2017). Other Directorships in the Last Five Years. Director of MSCI Inc. (global provider of investment decision support tools) (since 2017). Formerly, Director of DCT Industrial Trust Inc. (logistics real estate company) (2017-2018). | |||
Susan J. Sutherland 1957 | Class III Trustee | Until 2021. Trustee since 2015. | Private investor. Formerly, Associate, Counsel and Partner at Skadden, Arps, Slate, Meagher & Flom LLP (law firm) (1982-2013). Other Directorships in the Last Five Years. Formerly, Director of Montpelier Re Holdings Ltd. (global provider of customized insurance and reinsurance products) (2013-2015). | |||
Scott E. Wennerholm 1959 | Class I Trustee | Until 2022. Trustee since 2016. | Formerly, Trustee at Wheelock College (postsecondary institution) (2012-2018). Formerly, Consultant at GF Parish Group (executive recruiting firm) (2016-2017). Formerly, Chief Operating Officer and Executive Vice President at BNY Mellon Asset Management (investment management firm) (2005-2011). Formerly, Chief Operating Officer and Chief Financial Officer at Natixis Global Asset Management (investment management firm) (1997-2004). Formerly, Vice President at Fidelity Investments Institutional Services (investment management firm) (1994-1997). Other Directorships in the Last Five Years. None. | |||
| Name and Year of Birth | Position(s) with the Fund | Officer Since(2) | Principal Occupation(s) During Past Five Years | |||
| Principal Officers who are not Trustees | ||||||
Payson F. Swaffield 1956 | President | 2003 | Vice President and Chief Income Investment Officer of EVM and BMR. Also Vice President of Calvert Research and Management (“CRM”). | |||
Maureen A. Gemma 1960 | Vice President, Secretary and Chief Legal Officer | 2005 | Vice President of EVM and BMR. Also Vice President of CRM. | |||
| 82 |
Eaton Vance
Limited Duration Income Fund
March 31, 2020
Management and Organization — continued
| Name and Year of Birth | Position(s) with the Fund | Officer Since(2) | Principal Occupation(s) During Past Five Years | |||
| Principal Officers who are not Trustees (continued) | ||||||
James F. Kirchner 1967 | Treasurer | 2007 | Vice President of EVM and BMR. Also Vice President of CRM. | |||
Richard F. Froio 1968 | Chief Compliance Officer | 2017 | Vice President of EVM and BMR since 2017. Formerly, Deputy Chief Compliance Officer (Adviser/Funds) and Chief Compliance Officer (Distribution) at PIMCO (2012-2017) and Managing Director at BlackRock/Barclays Global Investors (2009-2012). | |||
| (1) | Year first appointed to serve as Trustee for a fund in the Eaton Vance family of funds. Each Trustee has served continuously since appointment unless indicated otherwise. |
| (2) | Year first elected to serve as officer of a fund in the Eaton Vance family of funds when the officer has served continuously. Otherwise, year of most recent election as an officer of a fund in the Eaton Vance family of funds. Titles may have changed since initial election. |
| 83 |
Eaton Vance Funds
IMPORTANT NOTICES
Privacy. The Eaton Vance organization is committed to ensuring your financial privacy. Each entity listed below has adopted a privacy policy and procedures (“Privacy Program”) Eaton Vance believes is reasonably designed to protect your personal information and to govern when and with whom Eaton Vance may share your personal information.
| • | At the time of opening an account, Eaton Vance generally requires you to provide us with certain information such as name, address, social security number, tax status, account numbers, and account balances. This information is necessary for us to both open an account for you and to allow us to satisfy legal requirements such as applicable anti-money laundering reviews and know-your-customer requirements. |
| • | On an ongoing basis, in the normal course of servicing your account, Eaton Vance may share your information with unaffiliated third parties that perform various services for Eaton Vance and/or your account. These third parties include transfer agents, custodians, broker/dealers and our professional advisers, including auditors, accountants, and legal counsel. Eaton Vance may additionally share your personal information with our affiliates. |
| • | We believe our Privacy Program is reasonably designed to protect the confidentiality of your personal information and to prevent unauthorized access to that information. |
| • | We reserve the right to change our Privacy Program at any time upon proper notification to you. You may want to review our Privacy Program periodically for changes by accessing the link on our homepage: www.eatonvance.com. |
Our pledge of protecting your personal information applies to the following entities within the Eaton Vance organization: the Eaton Vance Family of Funds, Eaton Vance Management, Eaton Vance Investment Counsel, Eaton Vance Distributors, Inc., Eaton Vance Trust Company, Eaton Vance Management (International) Limited, Eaton Vance Advisers International Limited, Eaton Vance Global Advisors Limited, Eaton Vance Management’s Real Estate Investment Group, Boston Management and Research, Calvert Research and Management, and Calvert Funds. This Privacy Notice supersedes all previously issued privacy disclosures. For more information about our Privacy Program or about how your personal information may be used, please call 1-800-262-1122.
Delivery of Shareholder Documents. The Securities and Exchange Commission (SEC) permits funds to deliver only one copy of shareholder documents, including prospectuses, proxy statements and shareholder reports, to fund investors with multiple accounts at the same residential or post office box address. This practice is often called “householding” and it helps eliminate duplicate mailings to shareholders. American Stock Transfer & Trust Company, LLC (“AST”), the closed-end funds transfer agent, or your financial intermediary, may household the mailing of your documents indefinitely unless you instruct AST, or your financial intermediary, otherwise. If you would prefer that your Eaton Vance documents not be householded, please contact AST or your financial intermediary. Your instructions that householding not apply to delivery of your Eaton Vance documents will typically be effective within 30 days of receipt by AST or your financial intermediary.
Portfolio Holdings. Each Eaton Vance Fund and its underlying Portfolio(s) (if applicable) files a schedule of portfolio holdings on Part F toForm N-PORT with the SEC for the first and third quarters of each fiscal year. The Form N-PORT will be available on the Eaton Vance website at www.eatonvance.com, by calling Eaton Vance at 1-800-262-1122 or in the EDGAR database on the SEC’s website at www.sec.gov.
Proxy Voting. From time to time, funds are required to vote proxies related to the securities held by the funds. The Eaton Vance Funds or their underlying Portfolios (if applicable) vote proxies according to a set of policies and procedures approved by the Funds’ and Portfolios’ Boards. You may obtain a description of these policies and procedures and information on how the Funds or Portfolios voted proxies relating to portfolio securities during the most recent 12-month period ended June 30, without charge, upon request, by calling 1-800-262-1122 and by accessing the SEC’s website at www.sec.gov.
Share Repurchase Program. The Fund’s Board of Trustees has approved a share repurchase program authorizing the Fund to repurchase up to 10% of its common shares outstanding as of the last day of the prior calendar year in open-market transactions at a discount to net asset value. The repurchase program does not obligate the Fund to purchase a specific amount of shares. The Fund’s repurchase activity, including the number of shares purchased, average price and average discount to net asset value, is disclosed in the Fund’s annual and semi-annual reports to shareholders.
Additional Notice to Shareholders. If applicable, a Fund may also redeem or purchase its outstanding preferred shares in order to maintain compliance with regulatory requirements, borrowing or rating agency requirements or for other purposes as it deems appropriate or necessary.
Closed-End Fund Information. Eaton Vance closed-end funds make fund performance data and certain information about portfolio characteristics available on the Eaton Vance website shortly after the end of each month. Other information about the funds is available on the website. The funds’ net asset value per share is readily accessible on the Eaton Vance website. Portfolio holdings for the most recent month-end are also posted to the website approximately 30 days following the end of the month. This information is available at www.eatonvance.com on the fund information pages under “Individual Investors — Closed-End Funds”.
| 84 |
Investment Adviser and Administrator
Eaton Vance Management
Two International Place
Boston, MA 02110
Custodian
State Street Bank and Trust Company
State Street Financial Center, One Lincoln Street
Boston, MA 02111
Transfer Agent
American Stock Transfer & Trust Company, LLC
6201 15th Avenue
Brooklyn, NY 11219
Independent Registered Public Accounting Firm
Deloitte & Touche LLP
200 Berkeley Street
Boston, MA 02116-5022
Fund Offices
Two International Place
Boston, MA 02110

1856 3.31.20
| Item 2. | Code of Ethics |
The registrant (sometimes referred to as the “Fund”) has adopted a code of ethics applicable to its Principal Executive Officer, Principal Financial Officer and Principal Accounting Officer. The registrant undertakes to provide a copy of such code of ethics to any person upon request, without charge, by calling1-800-262-1122. The registrant has not amended the code of ethics as described in FormN-CSR during the period. The registrant has not granted any waiver, including an implicit waiver, from a provision of the code of ethics as described in FormN-CSR during the period covered by this report.
| Item 3. | Audit Committee Financial Expert |
The registrant’s Board of Trustees (the “Board”) has designated George J. Gorman and William H. Park, each an independent trustee, as audit committee financial experts. Mr. Gorman is a certified public accountant who is the Principal at George J. Gorman LLC (a consulting firm). Previously, Mr. Gorman served in various capacities at Ernst & Young LLP (a registered public accounting firm), including as Senior Partner. Mr. Gorman also has experience serving as an independent trustee and audit committee financial expert of other mutual fund complexes. Mr. Park is a certified public accountant who is a private investor. Previously, he served as a consultant, as the Chief Financial Officer of Aveon Group, L.P. (an investment management firm), as the Vice Chairman of Commercial Industrial Finance Corp. (specialty finance company), as President and Chief Executive Officer of Prizm Capital Management, LLC (investment management firm), as Executive Vice President and Chief Financial Officer of United Asset Management Corporation (an institutional investment management firm) and as a Senior Manager at Price Waterhouse (now PricewaterhouseCoopers) (a registered public accounting firm).
| Item 4. | Principal Accountant Fees and Services |
(a) –(d)
The following table presents the aggregate fees billed to the registrant for the registrant’s fiscal years ended March 31, 2019 and March 31, 2020 by the registrant’s principal accountant, Deloitte & Touche LLP (“D&T”), for professional services rendered for the audit of the registrant’s annual financial statements and fees billed for other services rendered by D&T during such periods.
Fiscal Years Ended | 3/31/19 | 3/31/20 | ||||||
Audit Fees | $ | 139,090 | $ | 141,850 | ||||
Audit-Related Fees(1) | $ | 0 | $ | 0 | ||||
Tax Fees(2) | $ | 23,019 | $ | 20,942 | ||||
All Other Fees(3) | $ | 0 | $ | 0 | ||||
|
|
|
| |||||
Total | $ | 162,109 | $ | 162,792 | ||||
|
|
|
| |||||
| (1) | Audit-related fees consist of the aggregate fees billed for assurance and related services that are reasonably related to the performance of the audit of financial statements and are not reported under the category of audit fees. |
| (2) | Tax fees consist of the aggregate fees billed for professional services rendered by the principal accountant relating to tax compliance, tax advice, and tax planning and specifically include fees for tax return preparation and other related tax compliance/planning matters. |
| (3) | All other fees consist of the aggregate fees billed for products and services provided by the principal accountant other than audit, audit-related, and tax services. |
(e)(1) The registrant’s audit committee has adopted policies and procedures relating to thepre-approval of services provided by the registrant’s principal accountant (the“Pre-Approval Policies”). ThePre-Approval Policies establish a framework intended to assist the audit committee in the proper discharge of itspre-approval responsibilities. As a general matter, thePre-Approval Policies (i) specify certain types of audit, audit-related, tax, and other services determined to bepre-approved by the audit committee; and (ii) delineate specific procedures governing the mechanics of thepre-approval process, including the approval and monitoring of audit andnon-audit service fees. Unless a service is specificallypre-approved under thePre-Approval Policies, it must be separatelypre-approved by the audit committee.
ThePre-Approval Policies and the types of audit andnon-audit servicespre-approved therein must be reviewed and ratified by the registrant’s audit committee at least annually. The registrant’s audit committee maintains full responsibility for the appointment, compensation, and oversight of the work of the registrant’s principal accountant.
(e)(2) No services described in paragraphs (b)-(d) above were approved by the registrant’s audit committee pursuant to the “de minimis exception” set forth in Rule2-01(c)(7)(i)(C) of RegulationS-X.
(f) Not applicable.
(g)The following table presents (i) the aggregatenon-audit fees (i.e., fees for audit-related, tax, and other services) billed to the registrant by D&T for the registrant’s fiscal years ended March 31, 2019 and March 31, 2020; and (ii) the aggregatenon-audit fees (i.e., fees for audit-related, tax, and other services) billed to the Eaton Vance organization by D&T for the same time periods.
Fiscal Years Ended | 3/31/19 | 3/31/20 | ||||||
Registrant | $ | 23,019 | $ | 20,942 | ||||
Eaton Vance(1) | $ | 87,482 | $ | 51,903 | ||||
| (1) | The Investment Adviser to the registrant, as well as any of its affiliates that provide ongoing services to the registrant, are subsidiaries of Eaton Vance Corp. |
(h) The registrant’s audit committee has considered whether the provision by the registrant’s principal accountant ofnon-audit services to the registrant’s investment adviser and any entity controlling, controlled by, or under common control with the adviser that provides ongoing services to the registrant that were notpre-approved pursuant to Rule2-01(c)(7)(ii) of RegulationS-X is compatible with maintaining the principal accountant’s independence.
| Item 5. | Audit Committee of Listed Registrants |
The registrant has a separately-designated standing audit committee established in accordance with Section 3(a)(58)(A) of the Securities and Exchange Act of 1934, as amended. George J. Gorman (Chair), William H. Park, Helen Frame Peters and Scott E. Wennerholm are the members of the registrant’s audit committee.
| Item 6. | Schedule of Investments |
Please see schedule of investments contained in the Report to Stockholders included under Item 1 of this FormN-CSR.
| Item 7. | Disclosure of Proxy Voting Policies and Procedures forClosed-End Management Investment Companies |
The Board of the Fund has adopted a proxy voting policy and procedure (the “Fund Policy”), pursuant to which the trustees have delegated proxy voting responsibility to the Fund’s investment adviser and adopted the investment adviser’s proxy voting policies and procedures (the “Policies”) which are described below. The trustees will review the Policies annually. In the event that a conflict of interest arises between the Fund’s shareholders and the investment adviser, the administrator, or any of their affiliates or any affiliate of the Fund, the investment adviser will generally refrain from voting the proxies related to the companies giving rise to such conflict until it consults with the Board, or any committee,sub-committee or group of independent trustees identified by the Board, which will instruct the investment adviser on the appropriate course of action. If the Board Members are unable to meet and the failure to vote a proxy would have a material adverse impact on the Fund, the investment adviser may vote such proxy, provided that it discloses the existence of the material conflict to the Chairperson of the Fund’s Board as soon as practicable and to the Board at its next meeting.
The Policies are designed to promote accountability of a company’s management to its shareholders and to align the interests of management with those shareholders. An independent proxy voting service (“Agent”), currently Institutional Shareholder Services, Inc., has been retained to assist in the voting of proxies through the provision of vote analysis, implementation and recordkeeping and disclosure services. The investment adviser will generally vote proxies through the Agent. The Agent is required to vote all proxies in accordance with customized proxy voting guidelines (the “Guidelines”) and/or refer them back to the investment adviser pursuant to the Policies.
The Agent is required to establish and maintain adequate internal controls and policies in connection with the provision of proxy voting services, including methods to reasonably ensure that its analysis and recommendations are not influenced by a conflict of interest. The Guidelines include voting guidelines for matters relating to, among other things, the election of directors, approval of independent auditors, executive compensation, corporate structure and anti-takeover defenses. The investment adviser may cause the Fund to abstain from voting from time to time where it determines that the costs associated with voting a proxy outweigh the benefits derived from exercising the right to vote or it is unable to access or access timely ballots or other proxy information, among other stated reasons. The Agent will refer Fund proxies to the investment adviser for instructions under circumstances where, among others: (1) the application of the Guidelines is unclear; (2) a particular proxy question is not covered by the Guidelines; or (3) the Guidelines require input from the investment adviser. When a proxy voting issue has been referred to the investment adviser, the analyst (or portfolio manager if applicable) covering the company subject to the proxy proposal determines the final vote (or decision not to vote) and the investment adviser’s Proxy Administrator (described below) instructs the Agent to vote accordingly for securities held by the Fund. Where more than one analyst covers a particular company and the recommendations of such analysts voting a proposal conflict, the investment adviser’s Global Proxy Group (described below) will review such recommendations and any other available information related to the proposal and determine the manner in which it should be voted, which may result in different recommendations for the Fund that may differ from other clients of the investment adviser.
The investment adviser has appointed a Proxy Administrator to assist in the coordination of the voting of client proxies (including the Fund’s) in accordance with the Guidelines and the Policies. The investment adviser and its affiliates have also established a Global Proxy Group. The Global Proxy Group develops the investment adviser’s positions on all major corporate issues, creates the Guidelines and oversees the proxy voting process. The Proxy Administrator maintains a record of all proxy questions that have been referred by the Agent, all applicable recommendations, analysis and research received and any resolution of the matter. Before instructing the Agent to vote contrary to the Guidelines or the recommendation of the Agent, the Proxy Administrator will provide the Global Proxy Group with the Agent’s recommendation for the proposal along with any other relevant materials, including the basis for the analyst’s recommendation. The Proxy Administrator will then instruct the Agent to vote the proxy in the manner determined by the Global Proxy Group. A similar process
will be followed if the Agent has a conflict of interest with respect to a proxy. The investment adviser will report to the Fund’s Board any votes cast contrary to the Guidelines or Agent recommendations, as applicable, no less than annually.
The investment adviser’s Global Proxy Group is responsible for monitoring and resolving possible material conflicts with respect to proxy voting. Because the Guidelines are predetermined and designed to be in the best interests of shareholders, application of the Guidelines to vote client proxies should, in most cases, adequately address any possible conflict of interest. The investment adviser will monitor situations that may result in a conflict of interest between any of its clients and the investment adviser or any of its affiliates by maintaining a list of significant existing and prospective corporate clients. The Proxy Administrator will compare such list with the names of companies of which he or she has been referred a proxy statement (the “Proxy Companies”). If a company on the list is also a Proxy Company, the Proxy Administrator will report that fact to the Global Proxy Group. If the Proxy Administrator intends to instruct the Agent to vote in a manner inconsistent with the Guidelines, the Global Proxy Group will first determine, in consultation with legal counsel if necessary, whether a material conflict exists. If it is determined that a material conflict exists, the investment adviser will seek instruction on how the proxy should be voted from the Fund’s Board, or any committee or subcommittee identified by the Board. If a matter is referred to the Global Proxy Group, the decision made and basis for the decision will be documented by the Proxy Administrator and/or Global Proxy Group.
Information on how the Fund voted proxies relating to portfolio securities during the most recent 12 month period ended June 30 is available (1) without charge, upon request, by calling1-800-262-1122, and (2) on the Securities and Exchange Commission’s website athttp://www.sec.gov.
| Item 8. | Portfolio Managers ofClosed-End Management Investment Companies |
Eaton Vance Management (“EVM” or “Eaton Vance”) is the investment adviser of the Fund. Kelley G. Baccei, Catherine C. McDermott, Eric A. Stein, Payson F. Swaffield and Andrew Szczurowski comprise the investment team responsible for the overall management of the Fund’s investments.
Ms. Baccei is a Vice President of EVM and has been a portfolio manager of the Fund since March 2019. Ms. McDermott is a Vice President of EVM and has been a portfolio manager of the Fund since January 2008. Mr. Stein is a Vice President of EVM, has been a portfolio manager of the Fund since December 2012 and isCo-Director of EVM’s Global Income Group. Mr. Swaffield is a Vice President and Chief Income Investment Officer of EVM and has been a portfolio manager of the Fund since May 2003. Mr. Szczurowski is a Vice President of EVM and has been a portfolio manager of the Fund since November 2011. Mmes. Baccei and McDermott and Messrs.Stein, Swaffield and Szczurowski have managed other Eaton Vance portfolios for more than five years. This information is provided as of the date of filing this report.
The following table shows, as of the Fund’s most recent fiscal year end, the number of accounts each portfolio manager managed in each of the listed categories and the total assets (in millions of dollars) in the accounts managed within each category. The table also shows the number of accounts with respect to which the advisory fee is based on the performance of the account, if any, and the total assets (in millions of dollars) in those accounts.
| Number of All Accounts | Total Assets of All Accounts | Number of Accounts Paying a Performance Fee | Total Assets of Accounts Paying a Performance Fee | |||||||||||||
Kelley G. Baccei(1) | ||||||||||||||||
Registered Investment Companies | 9 | $ | 8,932.2 | 0 | $ | 0 | ||||||||||
Other Pooled Investment Vehicles | 1 | $ | 124.8 | 0 | $ | 0 | ||||||||||
Other Accounts | 0 | $ | 0 | 0 | $ | 0 | ||||||||||
Catherine C. McDermott | ||||||||||||||||
Registered Investment Companies | 8 | $ | 4,802.9 | 0 | $ | 0 | ||||||||||
Other Pooled Investment Vehicles | 0 | $ | 0 | 0 | $ | 0 | ||||||||||
Other Accounts | 0 | $ | 0 | 0 | $ | 0 | ||||||||||
Eric A. Stein(2) | ||||||||||||||||
Registered Investment Companies | 13 | $ | 18,721.5 | 0 | $ | 0 | ||||||||||
Other Pooled Investment Vehicles | 4 | $ | 533.2 | 1 | $ | 1.6 | ||||||||||
Other Accounts | 0 | $ | 0 | 0 | $ | 0 | ||||||||||
Payson F. Swaffield | ||||||||||||||||
Registered Investment Companies | 2 | $ | 2,458.8 | 0 | $ | 0 | ||||||||||
Other Pooled Investment Vehicles | 0 | $ | 0 | 0 | $ | 0 | ||||||||||
Other Accounts | 0 | $ | 0 | 0 | $ | 0 | ||||||||||
Andrew Szczurowski(2) | ||||||||||||||||
Registered Investment Companies | 5 | $ | 9,222.7 | 0 | $ | 0 | ||||||||||
Other Pooled Investment Vehicles | 1 | $ | 105.6 | 0 | $ | 0 | ||||||||||
Other Accounts | 0 | $ | 0 | 0 | $ | 0 | ||||||||||
| (1) | This portfolio manager serves as portfolio manager of one or more registered investment companies and/or pooled investment vehicles that invest or may invest in one or more underlying registered investment companies in the Eaton Vance family of funds. The underlying investment companies may be managed by this portfolio manager or another portfolio manager. |
| (2) | This portfolio manager serves as portfolio manager of one or more registered investment companies and/or pooled investment vehicles that invest or may invest in one or more underlying registered investment companies and/or separate pooled investment vehicles in the Eaton Vance family of funds. The underlying investment companies may be managed by this portfolio manager or another portfolio manager. |
The following table shows the dollar range of Fund shares beneficially owned by each portfolio manager as of the Fund’s most recent fiscal year end.
Portfolio Manager | Dollar Range of Equity Securities Beneficially Owned in the Fund | |
Kelley G. Baccei | None | |
Catherine C. McDermott | None | |
Eric A. Stein | $1 - $10,000 | |
Payson F. Swaffield | $100,001 - $500,000 | |
Andrew Szczurowski | $10,001 - $50,000 |
Potential for Conflicts of Interest. It is possible that conflicts of interest may arise in connection with a portfolio manager’s management of the Fund’s investments on the one hand and the investments of other accounts for which a portfolio manager is responsible on the other. For example, a portfolio manager may have conflicts of interest in allocating management time, resources and investment opportunities among the Fund and other accounts he or she advises. In addition, due to differences in the investment strategies or restrictions between the Fund and the other accounts, the portfolio manager may take action with respect to another account that differs from the action taken with respect to the Fund. In some cases, another account managed by a portfolio manager may compensate the investment adviser based on the performance of the securities held by that account. The existence of such a performance based fee may create additional conflicts of interest for the portfolio manager in the allocation of management time, resources and investment opportunities. Whenever conflicts of interest arise, the portfolio manager will endeavor to exercise his or her discretion in a manner that he or she believes is equitable to all interested persons. EVM has adopted several policies and procedures designed to address these potential conflicts including a code of ethics and policies that govern the investment adviser’s trading practices, including among other things the aggregation and allocation of trades among clients, brokerage allocations, cross trades and best execution.
Compensation Structure for EVM
Compensation of EVM’s portfolio managers and other investment professionals has the following primary components: (1) a base salary, (2) an annual cash bonus, (3) annualnon-cash compensation consisting of options to purchase shares of Eaton Vance Corp. (“EVC”) nonvoting common stock and/or restricted shares of EVC nonvoting common stock that generally are subject to a vesting schedule and (4) (for equity portfolio managers) a Deferred Alpha Incentive Plan, which pays a deferred cash award tied to future excess returns in certain equity strategy portfolios. EVM’s investment professionals also receive certain retirement, insurance and other benefits that are broadly available to EVM’s employees. Compensation of EVM’s investment professionals is reviewed primarily on an annual basis. Cash bonuses, stock-based compensation awards, and adjustments in base salary are typically paid or put into effect at or shortly after the October 31st fiscal year end of EVC.
Method to Determine Compensation. EVM compensates its portfolio managers based primarily on the scale and complexity of their portfolio responsibilities and the total return performance of managed funds and accounts versus the benchmark(s) stated in the prospectus, as well as an appropriate peer group (as described below). In addition to rankings within peer groups of funds on the basis of absolute performance, consideration may also be given to relative risk-adjusted performance. Risk-adjusted performance measures include, but are not limited to Sharpe ratio, which uses standard deviation and excess return to determine reward per unit of risk. Performance is normally based on periods ending on the September 30th preceding fiscal year end. Fund performance is normally evaluated primarily versus peer groups of funds as determined by Lipper Inc. and/or Morningstar, Inc. When a fund’s peer group as determined by Lipper or Morningstar is deemed by EVM’s management not to provide a fair comparison, performance may instead be evaluated primarily against a custom peer group or market index. In evaluating the performance of a fund and its manager, primary emphasis is normally placed on three-year performance, with secondary consideration of performance over longer and shorter periods. For funds that aretax-managed or otherwise have an objective ofafter-tax returns, performance is measured net of taxes. For other funds, performance is evaluated on apre-tax basis. For funds with an investment objective other than total return (such as current income), consideration will also be given to the fund’s success in achieving its objective. For managers responsible for multiple funds and accounts, investment
performance is evaluated on an aggregate basis, based on averages or weighted averages among managed funds and accounts. Funds and accounts that have performance-based advisory fees are not accorded disproportionate weightings in measuring aggregate portfolio manager performance. Pursuant to the Deferred Alpha Incentive Plan, a portion of the compensation payable to equity portfolio managers and investment professionals will be determined based on the ability of one or more accounts managed by such manager, that are not advised by Calvert Management and Research to achieve a specified target average annual gross return over a three year period in excess of the account benchmark. The cash award to be payable at the end of the three year term will be established at the inception of the term and will be adjusted positively or negatively to the extent that the average annual gross return varies from the specified target return.
The compensation of portfolio managers with other job responsibilities (such as heading an investment group or providing analytical support to other portfolios) will include consideration of the scope of such responsibilities and the managers’ performance in meeting them.
EVM seeks to compensate portfolio managers commensurate with their responsibilities and performance, and competitive with other firms within the investment management industry. EVM participates in investment-industry compensation surveys and utilizes survey data as a factor in determining salary, bonus and stock-based compensation levels for portfolio managers and other investment professionals. Salaries, bonuses and stock-based compensation are also influenced by the operating performance of EVM and its parent company. The overall annual cash bonus pool is generally based on a substantially fixed percentage ofpre-bonus adjusted operating income. While the salaries of EVM’s portfolio managers are comparatively fixed, cash bonuses and stock-based compensation may fluctuate significantly from year to year, based on changes in manager performance and other factors as described herein. For a high performing portfolio manager, cash bonuses and stock-based compensation may represent a substantial portion of total compensation.
| Item 9. | Purchases of Equity Securities byClosed-End Management Investment Company and Affiliated Purchasers |
REGISTRANT PURCHASES OF EQUITY SECURITIES
Period* | Total Number of Shares Purchased | Average Price Paid per Share | Total Number of Shares Purchased as Part of Publicly Announced Programs | Maximum Number of Shares that May Yet Be Purchased Under the Programs | ||||||||||||
April 2019 | — | — | — | 10,354,702 | ||||||||||||
May 2019 | — | — | — | 10,354,702 | ||||||||||||
June 2019 | — | — | — | 10,354,702 | ||||||||||||
July 2019 | — | — | — | 10,354,702 | ||||||||||||
August 2019 | — | — | — | 10,354,702 | ||||||||||||
September 2019 | — | — | — | 10,354,702 | ||||||||||||
October 2019 | — | — | — | 10,354,702 | ||||||||||||
November 2019 | — | — | — | 10,354,702 | ||||||||||||
December 2019 | — | — | — | 10,354,702 | ||||||||||||
January 2020 | — | — | — | 10,354,702 | ||||||||||||
February 2020 | — | — | — | 10,354,702 | ||||||||||||
March 2020 | — | — | — | 10,354,702 | ||||||||||||
|
|
|
|
|
|
|
| |||||||||
Total | — | — | — | |||||||||||||
|
|
|
|
|
|
|
| |||||||||
| * | On November 11, 2013, the Fund’s Board of Trustees approved a share repurchase program authorizing the Fund to repurchase up to 10% of its then currently outstanding common shares in open-market transactions at a discount to net asset value. The repurchase program was announced on November 15, 2013. |
| Item 10. | Submission of Matters to a Vote of Security Holders |
No material changes.
| Item 11. | Controls and Procedures |
(a) It is the conclusion of the registrant’s principal executive officer and principal financial officer that the effectiveness of the registrant’s current disclosure controls and procedures (such disclosure controls and procedures having been evaluated within 90 days of the date of this filing) provide reasonable assurance that the information required to be disclosed by the registrant has been recorded, processed, summarized and reported within the time period specified in the Commission’s rules and forms and that the information required to be disclosed by the registrant has been accumulated and communicated to the registrant’s principal executive officer and principal financial officer in order to allow timely decisions regarding required disclosure.
(b) There have been no changes in the registrant’s internal controls over financial reporting during the second fiscal quarter of the period covered by this report that has materially affected, or is reasonably likely to materially affect, the registrant’s internal control over financial reporting.
| Item 12. | Disclosure of Securities Lending Activities forClosed-End Management Investment Companies |
No activity to report for the registrant’s most recent fiscal year end.
| Item 13. | Exhibits |
| (a)(1) | Registrant’s Code of Ethics – Not applicable (please see Item 2). | |
| (a)(2)(i) | Treasurer’s Section 302 certification. | |
| (a)(2)(ii) | President’s Section 302 certification. | |
| (b) | Combined Section 906 certification. | |
Signatures
Pursuant to the requirements of the Securities Exchange Act of 1934 and the Investment Company Act of 1940, the registrant has duly caused this report to be signed on its behalf by the undersigned, thereunto duly authorized.
Eaton Vance Limited Duration Income Fund
| ||
| By: | /s/ Payson F. Swaffield | |
| Payson F. Swaffield | ||
| President | ||
| Date: | May 26, 2020 | |
Pursuant to the requirements of the Securities Exchange Act of 1934 and the Investment Company Act of 1940, this report has been signed below by the following persons on behalf of the registrant and in the capacities and on the dates indicated.
| By: | /s/ James F. Kirchner | |
| James F. Kirchner | ||
| Treasurer | ||
| Date: | May 26, 2020 | |
| By: | /s/ Payson F. Swaffield | |
| Payson F. Swaffield | ||
| President | ||
| Date: | May 26, 2020 | |