UNITED STATES
SECURITIES AND EXCHANGE COMMISSION
Washington, D.C. 20549
Form N-CSR
CERTIFIED SHAREHOLDER REPORT OF REGISTERED
MANAGEMENT INVESTMENT COMPANIES
Investment Company Act File Number: 811-21323
Eaton Vance Limited Duration Income Fund
(Exact Name of Registrant as Specified in Charter)
Two International Place, Boston, Massachusetts 02110
(Address of Principal Executive Offices)
Deidre E. Walsh
Two International Place, Boston, Massachusetts 02110
(Name and Address of Agent for Services)
(617) 482-8260
(Registrant’s Telephone Number)
March 31
Date of Fiscal Year End
March 31, 2023
Date of Reporting Period
Item 1. Reports to Stockholders
Eaton Vance
Limited Duration Income
Fund (EVV)
Annual Report
March 31, 2023
Commodity Futures Trading Commission Registration. The Commodity Futures Trading Commission (“CFTC”) has adopted regulations that subject registered investment companies and advisers to regulation by the CFTC if a fund invests more than a prescribed level of its assets in certain CFTC-regulated instruments (including futures, certain options and swap agreements) or markets itself as providing investment exposure to such instruments. The investment adviser has claimed an exclusion from the definition of “commodity pool operator” under the Commodity Exchange Act with respect to its management of the Fund. Accordingly, neither the Fund nor the adviser with respect to the operation of the Fund is subject to CFTC regulation. Because of its management of other strategies, the Fund's adviser is registered with the CFTC as a commodity pool operator. The adviser is also registered as a commodity trading advisor.
Fund shares are not insured by the FDIC and are not deposits or other obligations of, or guaranteed by, any depository institution. Shares are subject to investment risks, including possible loss of principal invested.
Annual Report March 31, 2023
Eaton Vance
Limited Duration Income Fund
Eaton Vance
Limited Duration Income Fund
March 31, 2023
Management’s Discussion of Fund Performance†
Economic and Market Conditions
As the 12-month period began on April 1, 2022, interest rates were rising and bond prices were falling, as investors became increasingly concerned about the twin threats of inflation and U.S. Federal Reserve (Fed) interest rate hikes.
After a short respite of positive performance in July 2022, bond returns turned negative again from August through November, as investors reacted to statements by Fed officials that the central bank was not done with rate hikes and fighting inflation remained its top priority. After the Fed’s third straight 0.75% federal funds rate hike, the Bloomberg U.S. Aggregate Bond Index, a broad measure of the U.S. bond market, fell 4.32% in September -- its worst one-month performance since February 1980.
In November 2022, however, fixed-income performance rebounded. Despite the Fed’s fourth 0.75% rate hike that month, the Bloomberg U.S. Aggregate Bond Index rose 3.68% -- its best monthly performance during the period. Drivers of the rally included Fed signals that future rate hikes might be smaller, a better-than-expected U.S. inflation report, and growing investor demand for bonds amid lower supplies of new issues.
In December 2022, the Fed did deliver a smaller 0.50% rate hike, but raised expectations for how high rates might go in 2023. In response, bond prices declined during the month. As the new year began, bond returns continued their roller-coaster ride, turning positive on evidence of moderating inflation and hope that the Fed would temper its rate hikes in response. In February 2023, however, the bond rally stalled as robust economic reports -- including unexpectedly strong job creation in January -- led investors to fear the Fed might keep rates higher for longer than previously expected.
As the period closed, bond returns turned positive once again. The second- and third-largest bank failures in U.S. history triggered a “flight to quality” that drove U.S. Treasurys and other high-quality bonds to strong March 2023 performance, despite the Fed announcing its ninth consecutive rate hike that month.
For the period as a whole, fixed-income returns were generally negative. The Bloomberg U.S. Aggregate Bond Index returned -4.78%, the Bloomberg U.S. Treasury Index returned -4.51%, and the ICE BofA U.S. Mortgage-Backed Securities Index returned -4.92%.
In the below-investment-grade category, the ICE BofA U.S. High Yield Index returned -3.56%. The Morningstar® LSTA® U.S. Leveraged Loan IndexSM, a broad measure of corporate floating-rate loans, was a performance outlier with a positive 2.54% return, as the asset class benefited from near-zero duration in the period’s rising rate environment.
Fund Performance
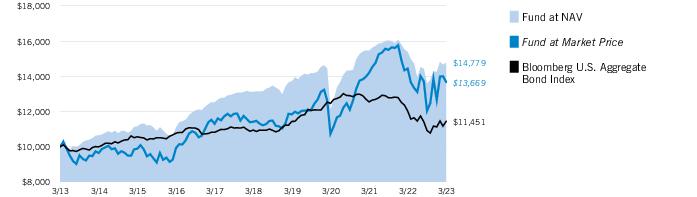
For the 12-month period ended March 31, 2023, Eaton Vance Limited Duration Income Fund (the Fund) returned -3.98% at net asset value of its common shares (NAV), outperforming its primary benchmark, the Bloomberg U.S. Aggregate Bond Index (the Index), which returned -4.78%. In contrast, the Fund underperformed its secondary benchmark -- 33.33% Morningstar® LSTA® US Leveraged Loan IndexSM, 33.34% ICE BofA U.S. Mortgage-Backed Securities IndexSM, and 33.33% ICE BofA Single-B U.S. High Yield Index (the Blended Index) -- which returned -1.99% during the period.
The Fund’s out-of-Blended Index allocations to investment-grade corporate bonds, commercial mortgage-backed securities (MBS), and emerging-market debt detracted from Fund performance relative to the Blended Index, as these segments underperformed the Blended Index during the period.
Among the Fund’s Blended Index allocations, exposure to floating-rate corporate loans had a positive return and outperformed the Blended Index during the period. The loan allocation’s top individual contributors included rebounding positions in a movie theater operator and a glass container maker. In contrast, the largest individual detractors in the floating-rate loan allocation included a struggling health care company and a mattress maker. Additionally, the Fund’s out-of-Blended Index allocation to European floating-rate loans benefited Fund performance relative to the Blended Index.
The Fund’s MBS allocation also contributed to performance versus the Blended Index during the period. The period was particularly challenging for the agency MBS market, as decreased demand from the U.S. Federal Reserve -- which began reducing its agency MBS holdings during the period -- pushed spreads nearly 50 basis points wider. The Fund’s preference for higher coupon fixed-rate agency MBS, and maintaining a shorter duration than the Blended Index, contributed to relative returns as mortgage rates and U.S. Treasury yields surged during the period.
The Fund’s allocation to high yield corporate bonds outperformed the Blended Index during the period as well. Within the high yield allocation, credit selections in B-rated bonds and out-of-Blended Index exposure to BB-rated bonds contributed to relative performance, while out-of-Blended Index exposure to CCC-rated bonds detracted from relative returns. Credit selections and an underweight position in bonds with durations of 3-5 years aided relative returns, while an overweight position in bonds with durations of less than one year had a negative impact on relative performance during the period.
On a sector basis, the best-performing sectors within the Fund’s high yield allocation during the period were health care and cable & satellite TV. Within health care, the Fund’s lack of exposure to a poor-performing specialty pharmaceutical company was the main driver of relative outperformance. Within cable & satellite TV, a lack of exposure to the distressed unsecured bonds of a satellite TV provider further aided relative returns.
In contrast, the worst-performing sectors in the Fund’s high yield allocation were diversified media and banking & thrifts. Within diversified media, an overweight position in an American in-theater cinema advertising company detracted from relative performance. In the banking & thrifts sector, an out-of-Blended-Index position in a California-based commercial bank that failed in March was the primary detractor during the period.
See Endnotes and Additional Disclosures in this report.
Past performance is no guarantee of future results. Returns are historical and are calculated net of management fees and other expenses by determining the percentage change in net asset value (NAV) or market price (as applicable) with all distributions reinvested in accordance with the Fund’s Dividend Reinvestment Plan. Furthermore, returns do not reflect the deduction of taxes that shareholders may have to pay on Fund distributions or upon the sale of Fund shares. Performance at market price will differ from performance at NAV due to variations in the Fund’s market price versus NAV, which may reflect factors such as fluctuations in supply and demand for Fund shares, changes in Fund distributions, shifting market expectations for the Fund’s future returns and distribution rates, and other considerations affecting the trading prices of closed-end funds. Investment return and principal value will fluctuate so that shares, when sold, may be worth more or less than their original cost. Performance for periods less than or equal to one year is cumulative. Performance is for the stated time period only; due to market volatility, current Fund performance may be lower or higher than the quoted return. For performance as of the most recent month-end, please refer to eatonvance.com.
Eaton Vance
Limited Duration Income Fund
March 31, 2023
Performance
Portfolio Manager(s) Catherine C. McDermott, Andrew Szczurowski, CFA, Eric A. Stein, CFA and Kelley Gerrity
| % Average Annual Total Returns1,2 | Inception Date | One Year | Five Years | Ten Years |
| Fund at NAV | 05/30/2003 | (3.98)% | 2.42% | 3.98% |
| Fund at Market Price | — | (5.30) | 3.67 | 3.17 |
|
| Bloomberg U.S. Aggregate Bond Index | — | (4.78)% | 0.90% | 1.36% |
| Blended Index | — | (1.99) | 2.28 | 2.85 |
| % Premium/Discount to NAV3 | |
| As of period end | (6.19)% |
| Distributions 4 | |
| Total Distributions per share for the period | $1.200 |
| Distribution Rate at NAV | 11.43% |
| Distribution Rate at Market Price | 12.18 |
| % Total Leverage5 | |
| Auction Preferred Shares (APS) | 12.33% |
| Borrowings | 17.93 |
Growth of $10,000
This graph shows the change in value of a hypothetical investment of $10,000 in the Fund for the period indicated. For comparison, the same investment is shown in the indicated index.
See Endnotes and Additional Disclosures in this report.
Past performance is no guarantee of future results. Returns are historical and are calculated net of management fees and other expenses by determining the percentage change in net asset value (NAV) or market price (as applicable) with all distributions reinvested in accordance with the Fund’s Dividend Reinvestment Plan. Furthermore, returns do not reflect the deduction of taxes that shareholders may have to pay on Fund distributions or upon the sale of Fund shares. Performance at market price will differ from performance at NAV due to variations in the Fund’s market price versus NAV, which may reflect factors such as fluctuations in supply and demand for Fund shares, changes in Fund distributions, shifting market expectations for the Fund’s future returns and distribution rates, and other considerations affecting the trading prices of closed-end funds. Investment return and principal value will fluctuate so that shares, when sold, may be worth more or less than their original cost. Performance for periods less than or equal to one year is cumulative. Performance is for the stated time period only; due to market volatility, current Fund performance may be lower or higher than the quoted return. For performance as of the most recent month-end, please refer to eatonvance.com.
Eaton Vance
Limited Duration Income Fund
March 31, 2023
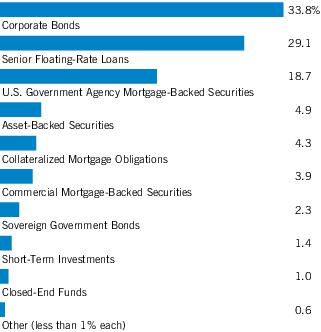
| Asset Allocation (% of total investments)1 |
Footnotes:
| 1 | Including the Fund’s use of leverage, Asset Allocation as a percentage of the Fund's net assets amounted to 160.2%. |
Eaton Vance
Limited Duration Income Fund
March 31, 2023
The Fund's Investment Objectives, Principal Strategies and Principal Risks‡
Investment Objectives. The Fund’s investment objective is to provide a high level of current income. The Fund may, as a secondary objective, also seek capital appreciation to the extent consistent with its primary goal of high current income. Under normal market conditions, the Fund expects to maintain an average duration of no more than five years (including the effect of anticipated leverage).
Principal Strategies. In pursuing its investment objectives, the Fund normally invests at least 25% of its total assets in each of: (1) investments rated investment grade, including, but not limited to, U.S. Government securities (which may include U.S. Treasuries and mortgage-backed securities (MBS) and other securities issued, backed, or otherwise guaranteed by the U.S. Government, or its agencies or instrumentalities), commercial MBS and corporate debt obligations; and (2) investments rated below investment-grade, including, but not limited to, senior loans, high-yield debt securities and collateralized loan obligations. Investment-grade investments are those rated BBB- or higher by S&P Global Ratings or Fitch Ratings, Baa3 or higher as determined by Moody’s Investor Service, Inc. or, if not rated, determined to be of comparable credit quality by the Fund’s portfolio managers.
Under normal market conditions, the Fund structures and seeks to maintain its portfolio of high-quality investments (such as MBS) and lower quality non-investment grade instruments and securities in such a manner that the Fund has an average dollar-weighted portfolio credit quality of investment grade. Within the foregoing guideline, the Fund may invest in individual investments of any credit quality.
The Fund may invest without limit in foreign investments denominated in U.S. dollars and may invest up to 15% of its net assets in foreign investments denominated in authorized foreign currencies, which include euros, British pounds, Swiss francs, Canadian dollars and Australian dollars. The Fund seeks to hedge against foreign currency fluctuations through the use of currency exchange contracts and other permitted hedging strategies. The Fund may enter into forward commitments to buy or sell agency MBS (to-be-announced transactions, or “TBAs”). The Fund may also invest in other types of investments that are not part of its principal strategy from time to time.
The Fund employs leverage to seek opportunities for additional income. Leverage may amplify the effect on the Fund’s NAV of any increase or decrease in the value of investments held. There can be no assurance that the use of borrowings will be successful. The Fund has issued preferred shares and borrowed to establish leverage. The Fund also may establish leverage through derivatives and reverse repurchase agreements. The Fund may purchase or sell derivative instruments for risk management purposes, such as hedging against fluctuations in securities prices or interest rates; diversification purposes; or changing the duration of the Fund. The Fund is permitted to invest up to 10% of its gross assets in credit default swaps (“CDS”) on below-investment-grade corporate securities, senior floating-rate bank loans and/or indices related to such investments to gain exposure to such underlying credits or indices. In addition, the Fund may invest in CDS for risk management purposes, including diversification.
Principal Risks
Market Risk. The value of investments held by the Fund may increase or decrease in response to social, economic, political, financial, public health crises or other disruptive events (whether real, expected or perceived) in the U.S. and global markets and include events as war, natural disasters, epidemics and pandemics, terrorism, conflicts and social unrest. These events may negatively impact broad segments of businesses and populations and may exacerbate pre-existing risks to the Fund. The frequency and magnitude of resulting changes in the value of the Fund’s investments cannot be predicted. Certain securities and other investments held by the Fund may experience increased volatility, illiquidity, or other potentially adverse effects in reaction to changing market conditions. Monetary and/or fiscal actions taken by U.S. or foreign governments to stimulate or stabilize the global economy may not be effective and could lead to high market volatility. No active trading market may exist for certain investments held by the Fund, which may impair the ability of the Fund to sell or to realize the current valuation of such investments in the event of the need to liquidate such assets.
Loans Risk. Loans are traded in a private, unregulated inter-dealer or inter-bank resale market and are generally subject to contractual restrictions that must be satisfied before a loan can be bought or sold. These restrictions may impede the Fund’s ability to buy or sell loans (thus affecting their liquidity) and may negatively impact the transaction price. See also “Market Risk” above. It also may take longer than seven days for transactions in loans to settle. The types of covenants included in loan agreements generally vary depending on market conditions, the creditworthiness of the issuer, the nature of the collateral securing the loan and possibly other factors. Loans with fewer covenants that restrict activities of the borrower may provide the borrower with more flexibility to take actions that may be detrimental to the loan holders and provide fewer investor protections in the event of such actions or if covenants are breached. The Fund may experience relatively greater realized or unrealized losses or delays and expense in enforcing its rights with respect to loans with fewer restrictive covenants. Loans to entities located outside of the U.S. may have substantially different lender protections and covenants as compared to loans to U.S. entities and may involve greater risks. The Fund may have difficulties and incur expenses enforcing its rights with respect to non-U.S. loans and such loans could be subject to bankruptcy laws that are materially different than in the U.S. Loans may be structured such that they are not securities under securities law, and in the event of fraud or misrepresentation by a borrower, lenders may not have the protection of the anti-fraud provisions of the federal securities laws. Loans are also subject to risks associated with other types of income investments, including credit risk and risks of lower rated investments.
Lower Rated Investments Risk. Investments rated below investment-grade and comparable unrated investments (sometimes referred to as “junk”) have speculative characteristics because of the credit risk associated with their issuers. Changes in economic conditions or other circumstances typically have a greater effect on the ability of issuers of lower rated investments to make principal and interest payments than they do on issuers of higher rated investments. An economic downturn generally leads to a higher non-payment rate, and a lower rated investment may lose significant value before a default occurs. Lower rated investments typically are subject to greater price volatility and illiquidity than higher rated investments.
See Endnotes and Additional Disclosures in this report.
5
Eaton Vance
Limited Duration Income Fund
March 31, 2023
The Fund's Investment Objectives, Principal Strategies and Principal Risks‡ — continued
Mortgage- and Asset-Backed Securities Risk. Mortgage- and asset-backed securities represent interests in “pools” of commercial or residential mortgages or other assets, including consumer loans or receivables. Movements in interest rates (both increases and decreases) may quickly and significantly reduce the value of certain types of mortgage- and asset-backed securities. Although certain mortgage- and asset-backed securities are guaranteed as to timely payment of interest and principal by a government entity, the market price for such securities is not guaranteed and will fluctuate. The purchase of mortgage- and asset-backed securities issued by non-government entities may entail greater risk than such securities that are issued or guaranteed by a government entity. Mortgage and asset-backed securities issued by non-government entities may offer higher yields than those issued by government entities, but may also be subject to greater volatility than government issues and can also be subject to greater credit risk and the risk of default on the underlying mortgages or other assets. Investments in mortgage- and asset-backed securities are subject to both extension risk, where borrowers pay off their debt obligations more slowly in times of rising interest rates, and prepayment risk, where borrowers pay off their debt obligations sooner than expected in times of declining interest rates. Asset-backed securities represent interests in a pool of assets, such as home equity loans, commercial mortgage-backed securities (“CMBS”), automobile receivables or credit card receivables, and include collateralized loan obligations (“CLOs”) and stripped securities. Interests in collateralized loan obligations (“CLOs”) are split into two or more portions, called tranches, which vary in risk, maturity, payment priority and yield. Each CLO tranche is entitled to scheduled debt payments from the underlying loans and assumes the risk of a default by the underlying loans. The Fund will indirectly bear any management fees and expenses incurred by a CLO.
U.S. Government Securities Risk. Although certain U.S. Government-sponsored agencies (such as the Federal Home Loan Mortgage Corporation and the Federal National Mortgage Association) may be chartered or sponsored by acts of Congress, their securities are neither issued nor guaranteed by the U.S. Treasury. U.S. Treasury securities generally have a lower return than other obligations because of their higher credit quality and market liquidity.
Credit Risk. Investments in fixed income and other debt obligations, including loans (referred to below as “debt instruments”), are subject to the risk of non-payment of scheduled principal and interest. Changes in economic conditions or other circumstances may reduce the capacity of the party obligated to make principal and interest payments on such instruments and may lead to defaults. Such non-payments and defaults may reduce the value of Fund shares and income distributions. The value of debt instruments also may decline because of concerns about the issuer’s ability to make principal and interest payments. In addition, the credit ratings of debt instruments may be lowered if the financial condition of the party obligated to make payments with respect to such instruments deteriorates. In the event of bankruptcy of the issuer of a debt instrument, the Fund could experience delays or limitations with respect to its ability to realize the benefits of any collateral securing the instrument. In order to enforce its rights in the event of a default, bankruptcy or similar situation, the Fund may be required to retain legal or similar counsel, which may increase the Fund’s operating expenses and adversely affect net asset value.
Interest Rate Risk. In general, the value of income securities will fluctuate based on changes in interest rates. The value of these securities is likely to increase when interest rates fall and decline when interest rates rise. Duration measures the time-weighted expected cash flows of a fixed-income security, while maturity refers to the amount of time until a fixed-income security matures. Generally, securities with longer durations or maturities are more sensitive to changes in interest rates than securities with shorter durations or maturities, causing them to be more volatile. Conversely, fixed-income securities with shorter durations or maturities will be less volatile but may provide lower returns than fixed-income securities with longer durations or maturities. In a rising interest rate environment, the duration of income securities that have the ability to be prepaid or called by the issuer may be extended. In a declining interest rate environment, the proceeds from prepaid or maturing instruments may have to be reinvested at a lower interest rate.
LIBOR Risk. The London Interbank Offered Rate or LIBOR historically has been used throughout global banking and financial industries to determine interest rates for a variety of financial instruments (such as debt instruments and derivatives) and borrowing arrangements. The ICE Benchmark Administration Limited, the administrator of LIBOR, ceased publishing certain LIBOR settings on December 31, 2021, and is expected to cease publishing the remaining LIBOR settings on June 30, 2023. In addition, global regulators have announced that, with limited exceptions, no new LIBOR-based contracts should be entered into after 2021.The Fund has exposure to LIBOR-based instruments. Although the transition process away from LIBOR has become increasingly well defined, the impact on certain debt securities, derivatives and other financial instruments that utilize LIBOR remains uncertain. The transition process may involve, among other things, increased volatility or illiquidity in markets for instruments that continue to urrently rely on LIBOR, such as floating-rate debt obligations. Any such effects of the transition away from LIBOR and the adoption of alternative reference rates, as well as other unforeseen effects, could result in losses to the Fund, and such effects may occur prior to the anticipated discontinuation of the remaining LIBOR settings in 2023. Furthermore, the risks associated with the expected discontinuation of LIBOR and transition to replacement rates may be exacerbated if an orderly transition to an alternative reference rate is not completed in a timely manner.
Foreign Investment Risk. Foreign investments can be adversely affected by political, economic and market developments abroad, including the imposition of economic and other sanctions by the United States or another country against a particular country or countries, organizations, entities and/or individuals. There may be less publicly available information about foreign issuers because they may not be subject to reporting practices, requirements or regulations comparable to those to which United States companies are subject. Adverse changes in investment regulations, capital requirements or exchange controls could adversely affect the value of the Fund’s investments. Foreign markets may be smaller, less liquid and more volatile than the major markets in the United States, and as a result, Fund share values may be more volatile. Trading in foreign markets typically involves higher expense than trading in the United States. The Fund may have difficulties enforcing its legal or contractual rights in a foreign country.
Emerging Markets Investment Risk. Investment markets within emerging market countries are typically smaller, less liquid, less developed and more volatile than those in more developed markets like the United States, and may be focused in certain sectors. Emerging market securities often involve greater risks than developed market securities. The information available about an emerging market issuer may be less reliable than for comparable issuers
See Endnotes and Additional Disclosures in this report.
6
Eaton Vance
Limited Duration Income Fund
March 31, 2023
The Fund's Investment Objectives, Principal Strategies and Principal Risks‡ — continued
in more developed capital markets. The Fund may invest in Sukuk, which are foreign or emerging market securities based on Islamic principles. Sukuk are securities with cash flows similar to conventional bonds, issued by an issuer, which is usually a special purpose vehicle incorporated by the sovereign or corporate entity seeking financing, to obtain an upfront payment in exchange for an income stream and a future promise to return capital. Such income stream may or may not be linked to a tangible asset. For Sukuk that are not linked to a tangible asset, the Sukuk represents a contractual payment obligation of the issuer or issuing vehicle to pay income or periodic payments or distributions to the investor, and such contractual payment obligation is linked to the issuer or issuing vehicle and not from interest on the investor’s money for Sukuk. For Sukuk linked to a tangible asset, the Fund will not have a direct interest in, or recourse to, the underlying asset or pool of assets. Sukuk involve many of the same risks that conventional bonds incur, such as credit risk and interest rate risk, as well as the risks associated with foreign or emerging market securities. In addition to these risks, there are certain risks specific to Sukuk, such as those relating to their structures. The unique characteristics of Sukuk may lead to uncertainties regarding their tax treatment within the Fund. In light of tax requirements applicable to the Fund, it may be necessary or advisable for the Fund to sell one or more Sukuk (or another investment), including at a disadvantageous time or price. As a result, the Fund may incur losses or costs associated with such transaction.
Currency Risk. Exchange rates for currencies fluctuate daily. The value of foreign investments may be affected favorably or unfavorably by changes in currency exchange rates in relation to the U.S. dollar. Currency markets generally are not as regulated as securities markets and currency transactions are subject to settlement, custodial and other operational risks.
Derivatives Risk. The Fund’s exposure to derivatives involves risks different from, or possibly greater than, the risks associated with investing directly in securities and other investments. The use of derivatives can lead to losses because of adverse movements in the price or value of the security, instrument, index, currency, commodity, economic indicator or event underlying a derivative (“reference instrument”), due to failure of a counterparty or due to tax or regulatory constraints. Derivatives may create leverage in the Fund, which represents a non-cash exposure to the underlying reference instrument. Leverage can increase both the risk and return potential of the Fund. Derivatives risk may be more significant when derivatives are used to enhance return or as a substitute for a cash investment position, rather than solely to hedge the risk of a position held by the Fund. Use of derivatives involves the exercise of specialized skill and judgment, and a transaction may be unsuccessful in whole or in part because of market behavior or unexpected events. Changes in the value of a derivative (including one used for hedging) may not correlate perfectly with the underlying reference instrument. Derivative instruments traded in over-the-counter markets may be difficult to value, may be illiquid, and may be subject to wide swings in valuation caused by changes in the value of the underlying reference instrument. If a derivative’s counterparty is unable to honor its commitments, the value of Fund shares may decline and the Fund could experience delays in (or be unable to achieve) the return of collateral or other assets held by the counterparty. The loss on derivative transactions may substantially exceed the initial investment. A derivative investment also involves the risks relating to the reference instrument underlying the investment.
When-Issued and Forward Commitment Risk. Securities purchased on a when-issued or forward commitment basis are subject to the risk that when delivered they will be worth less than the agreed upon payment price.
Risks of Repurchase Agreements and Reverse Repurchase Agreements. In the event of the insolvency of the counterparty to a repurchase agreement or reverse repurchase agreement, recovery of the repurchase price owed to the Fund or, in the case of a reverse repurchase agreement, the securities sold by the Fund, may be delayed. In a repurchase agreement, such insolvency may result in a loss to the extent that the value of the purchased securities decreases during the delay or that value has otherwise not been maintained at an amount equal to the repurchase price. In a reverse repurchase agreement, the counterparty’s insolvency may result in a loss equal to the amount by which the value of the securities sold by the Fund exceeds the repurchase price payable by the Fund; if the value of the purchased securities increases during such a delay, that loss may also be increased. When the Fund enters into a reverse repurchase agreement, any fluctuations in the market value of either the securities sold to the counterparty or the securities which the Fund purchases with its proceeds from the agreement would affect the value of the Fund’s assets. As a result, such agreements may increase fluctuations in the net asset value of the Fund’s shares. Because reverse repurchase agreements may be considered to be a form of borrowing by the Fund (and a loan from the counterparty), they constitute create leverage. If the Fund reinvests the proceeds of a reverse repurchase agreement at a rate lower than the cost of the agreement, entering into the agreement will lower the Fund’s yield.
Leverage Risk. Certain Fund transactions may give rise to leverage. Leverage can result from a non-cash exposure to an underlying reference instrument. Leverage can also result from borrowings, issuance of preferred shares or participation in residual interest bond transactions. Leverage can increase both the risk and return potential of the Fund. The use of leverage may cause the Fund to maintain liquid assets or liquidate portfolio positions when it may not be advantageous to do so to satisfy its obligations or to meet segregation requirements. Leverage may cause the Fund’s NAV to be more volatile than if it had not been leveraged, as certain types of leverage may exaggerate the effect of any increase or decrease in the Fund’s portfolio securities. The loss on leveraged investments may substantially exceed the initial investment.
Liquidity Risk. The Fund is exposed to liquidity risk when trading volume, lack of a market maker or trading partner, large position size, market conditions, or legal restrictions impair its ability to sell particular investments or to sell them at advantageous market prices. Consequently, the Fund may have to accept a lower price to sell an investment or continue to hold it or keep the position open, sell other investments to raise cash or abandon an investment opportunity, any of which could have a negative effect on the Fund’s performance. These effects may be exacerbated during times of financial or political stress.
See Endnotes and Additional Disclosures in this report.
7
Eaton Vance
Limited Duration Income Fund
March 31, 2023
The Fund's Investment Objectives, Principal Strategies and Principal Risks‡ — continued
Research Process. The Fund’s portfolio management utilizes information provided by, and the expertise of, the research staff of the investment adviser and/or certain of its affiliates in making investment decisions. As part of the research process, portfolio management may consider financially material environmental, social and governance (“ESG”) factors. Such factors, alongside other relevant factors, may be taken into account in the Fund’s securities selection process.
Cash and Money Market Instruments; Temporary Defensive Positions. The Fund may invest in cash or money market instruments, including high quality short-term instruments or an affiliated investment company that invests in such instruments. During unusual market conditions, including for temporary defensive purposes, the Fund may invest up to 100% of its assets in cash or money market instruments, which may be inconsistent with its investment objective(s) and other policies, and as such, the Fund may not achieve its investment objective(s) during this period. Money market instruments may be adversely affected by market and economic events, such as a sharp rise in prevailing short-term interest rates; adverse developments in the banking industry, which issues or guarantees many money market instruments; adverse economic, political or other developments affecting issuers of money market instruments; changes in the credit quality of issuers; and default by a counterparty.
Market Discount Risk. As with any security, the market value of the common shares may increase or decrease from the amount initially paid for the common shares. The Fund’s common shares have traded both at a premium and at a discount relative to NAV. The shares of closed-end management investment companies frequently trade at a discount from their NAV. This is a risk separate and distinct from the risk that the Fund’s NAV may decrease.
Risks Associated with Active Management. The success of the Fund’s investment strategy depends on portfolio management’s successful application of analytical skills and investment judgment. Active management involves subjective decisions and there is no guarantee that such decisions will produce the desired results or expected returns.
Recent Market Conditions. The outbreak of COVID-19 and efforts to contain its spread have resulted in closing borders, enhanced health screenings, changes to healthcare service preparation and delivery, quarantines, cancellations, disruptions to supply chains and customer activity, as well as general concern and uncertainty. The impact of this coronavirus, and the effects of the infectious illness outbreaks, epidemics or pandemics, may be short term or continue for an extended period of time. Health crises caused by outbreaks of disease, such as the coronavirus outbreak, may exacerbate other pre-existing political, social and economic risks and disrupt normal market conditions and operations. For example, a global pandemic or other widespread health crisis could cause substantial market volatility and exchange trading suspensions and closures. In addition, the increasing interconnectedness of markets around the world may result in many markets being affected by events or conditions in a single country or region or events affecting a single or small number of issuers. The coronavirus outbreak and public and private sector responses thereto have led to large portions of the populations of many countries working from home for indefinite periods of time, temporary or permanent layoffs, disruptions in supply chains, and lack of availability of certain goods. The impact of such responses could adversely affect the information technology and operational systems upon which the Fund and the Fund’s service providers rely, and could otherwise disrupt the ability of the employees of the Fund’s service providers to perform critical tasks relating to the Fund. Any such impact could adversely affect the Fund’s performance, or the performance of the securities in which the Fund invests and may lead to losses on your investment in the Fund.
Cybersecurity Risk. With the increased use of technologies by Fund service providers to conduct business, such as the Internet, the Fund is susceptible to operational, information security and related risks. In general, cyber incidents can result from deliberate attacks or unintentional events. Cybersecurity failures by or breaches of the Fund’s investment adviser or administrator and other service providers (including, but not limited to, the custodian or transfer agent), and the issuers of securities in which the Fund invests, may disrupt and otherwise adversely affect their business operations. This may result in financial losses to the Fund, impede Fund trading, interfere with the Fund’s ability to calculate its net asset value, interfere with Fund shareholders’ ability to transact business or cause violations of applicable privacy and other laws, regulatory fines, penalties, reputational damage, reimbursement or other compensation costs or additional compliance costs.
General Fund Investing Risks. The Fund is not a complete investment program and there is no guarantee that the Fund will achieve its investment objective. It is possible to lose money by investing in the Fund. An investment in the Fund is not a deposit in a bank and is not insured or guaranteed by the Federal Deposit Insurance Corporation or any other government agency.
Important Notice to Shareholders
The following information in this annual report is a summary of certain changes since March 31, 2022. This information may not reflect all of the changes that have occurred since you purchased this Fund.
Prior to June 1, 2023, the Fund’s portfolio management team includes Kelley Gerrity, Catherine McDermott, Andrew Szczurowski, CFA and Eric Stein, CFA. Effective June 1, 2023, the Fund’s portfolio management team will include Kelley Gerrity, Tara O'Brien, Catherine McDermott, Andrew Szczurowski, CFA and Eric Stein, CFA. Ms. O'Brien is a Vice President of Eaton Vance Management and has been employed by the Eaton Vance organization for more than five years.
On January 26, 2023, the Fund’s Board of Trustees voted to exempt, on a going forward basis, all prior and, until further notice, new acquisitions of Fund shares that otherwise might be deemed “Control Share Acquisitions” under the Fund’s By-Laws from the Control Share Provisions of the Fund’s By-Laws.
See Endnotes and Additional Disclosures in this report.
8
Eaton Vance
Limited Duration Income Fund
March 31, 2023
Endnotes and Additional Disclosures
| † | The views expressed in this report are those of the portfolio manager(s) and are current only through the date stated at the top of this page. These views are subject to change at any time based upon market or other conditions, and Eaton Vance and the Fund(s) disclaim any responsibility to update such views. These views may not be relied upon as investment advice and, because investment decisions are based on many factors, may not be relied upon as an indication of trading intent on behalf of any Eaton Vance fund. This commentary may contain statements that are not historical facts, referred to as “forward-looking statements.” The Fund’s actual future results may differ significantly from those stated in any forward-looking statement, depending on factors such as changes in securities or financial markets or general economic conditions, the volume of sales and purchases of Fund shares, the continuation of investment advisory, administrative and service contracts, and other risks discussed from time to time in the Fund’s filings with the Securities and Exchange Commission. |
| ‡ | The information contained herein is provided for informational purposes only and does not constitute a solicitation of an offer to buy or sell Fund shares. Common shares of the Fund are available for purchase and sale only at current market prices in secondary market trading. |
| | |
| 1 | Bloomberg U.S. Aggregate Bond Index is an unmanaged index of domestic investment-grade bonds, including corporate, government and mortgage-backed securities. The Blended Index consists of 33.33% Morningstar® LSTA® US Leveraged Loan IndexSM, 33.33% ICE BofA Single-B U.S. High Yield Index and 33.34% ICE BofA U.S. Mortgage-Backed Securities Index, rebalanced monthly. Morningstar® LSTA® US Leveraged Loan IndexSM is an unmanaged index of the institutional leveraged loan market. Morningstar® LSTA® Leveraged Loan indices are a product of Morningstar, Inc. (“Morningstar”) and have been licensed for use. Morningstar® is a registered trademark of Morningstar licensed for certain use. Loan Syndications and Trading Association® and LSTA® are trademarks of the LSTA licensed for certain use by Morningstar, and further sublicensed by Morningstar for certain use. Neither Morningstar nor LSTA guarantees the accuracy and/or completeness of the Morningstar® LSTA® US Leveraged Loan IndexSM or any data included therein, and shall have no liability for any errors, omissions, or interruptions therein. Prior to August 29, 2022, the index name was S&P/LSTA Leveraged Loan Index. ICE BofA Single-B U.S. High Yield Index is an unmanaged index of below-investment grade U.S. corporate bonds with a credit quality rating of B. ICE BofA U.S. Mortgage-Backed Securities Index is an unmanaged index of fixed rate residential mortgage pass-through securities issued by U.S. agencies. ICE® BofA® indices are not for redistribution or other uses; provided “as is”, without warranties, and with no liability. Eaton Vance has prepared this report and ICE Data Indices, LLC does not endorse it, or guarantee, review, or endorse Eaton Vance’s products. BofA® is a licensed registered trademark of Bank of America Corporation in the United States and other countries. Unless otherwise stated, index returns do not reflect the effect of any applicable sales charges, commissions, expenses, taxes or leverage, as applicable. It is not possible to invest directly in an index. |
| 2 | Performance results reflect the effects of leverage. Included in the average annual total return at NAV for the five- and ten-year periods is the impact of the 2018 tender and repurchase of a portion of the Fund’s Auction Preferred Shares (APS) at 92% of the Fund’s APS per share liquidation preference. Had this transaction not occurred, the total return at NAV would be lower for the Fund. Performance reflects expenses waived and/or reimbursed, if applicable. Without such waivers and/or reimbursements, performance would have been lower. Pursuant to the Fund’s Dividend Reinvestment Plan, if the NAV per share on the distribution payment date is equal to or less than the market price per share plus estimated brokerage commissions, then new shares are issued. The number of shares shall be determined by the greater of the NAV per share or 95% of the market price. Otherwise, shares generally are purchased on the open market by the Plan’s agent. |
| 3 | The shares of the Fund often trade at a discount or premium to their net asset value. The discount or premium may vary over time and may be higher or lower than what is quoted in this report. For up-to-date premium/discount information, please refer to https://funds.eatonvance.com/closed-end-fund-prices.php. |
| 4 | The Distribution Rate is based on the Fund’s last regular distribution per share in the period (annualized) divided by the Fund’s NAV or market price at the end of the period. The Fund’s distributions in any period may be more or less than the net return earned by the Fund on its investments, and therefore should not be used as a measure of performance or confused with “yield” or “income.” Distributions in excess of Fund returns may include a return of capital which, over time, will cause the Fund’s net assets and net asset value per share to erode. When the Fund’s distributions include amounts from sources other than net investment income, shareholders are notified. The final determination of the tax characteristics of Fund distributions will occur after the end of the year, at which time that determination will be reported to shareholders. |
| 5 | Leverage represents the liquidation value of the Fund’s APS and borrowings outstanding as a percentage of Fund net assets applicable to common shares plus APS and borrowings outstanding. Use of leverage creates an opportunity for income, but creates risks including greater price volatility. The cost of leverage rises and falls with changes in short-term interest rates. The Fund may be required to maintain prescribed asset coverage for its leverage and may be required to reduce its leverage at an inopportune time. |
| | Fund profile subject to change due to active management. |
| | Additional Information |
| | Bloomberg U.S. Treasury Index measures the performance of U.S. Treasuries with a maturity of one year or more. ICE BofA U.S. High Yield Index is an unmanaged index of below-investment grade U.S. corporate bonds. |
| | Duration is a measure of the expected change in price of a bond — in percentage terms — given a one percent change in interest rates, all else being constant. Securities with lower durations tend to be less sensitive to interest rate changes. |
| | Spread is the difference in yield between a U.S. Treasury bond and another debt security of the same maturity but different credit quality. |
Eaton Vance
Limited Duration Income Fund
March 31, 2023
| Asset-Backed Securities — 7.9% |
| Security | Principal
Amount
(000's omitted) | Value |
| AIG CLO, Ltd., Series 2019-1A, Class ER, 11.332%, (3 mo. SOFR + 6.70%), 4/18/35(1)(2) | $ | 2,877 | $ 2,514,955 |
| Alinea CLO, Ltd., Series 2018-1A, Class E, 10.808%, (3 mo. USD LIBOR + 6.00%), 7/20/31(1)(2) | | 1,000 | 825,613 |
| AMMC CLO 15, Ltd., Series 2014-15A, Class ERR, 11.702%, (3 mo. USD LIBOR + 6.91%), 1/15/32(1)(2) | | 500 | 422,510 |
| AMMC CLO XII, Ltd., Series 2013-12A, Class ER, 11.039%, (3 mo. USD LIBOR + 6.18%), 11/10/30(1)(2) | | 2,000 | 1,569,604 |
| Ares XXXIV CLO, Ltd., Series 2015-2A, Class ER, 11.642%, (3 mo. USD LIBOR + 6.85%), 4/17/33(1)(2) | | 2,000 | 1,794,064 |
| Ares XXXVR CLO, Ltd., Series 2015-35RA, Class E, 10.492%, (3 mo. USD LIBOR + 5.70%), 7/15/30(1)(2) | | 2,000 | 1,654,014 |
| Benefit Street Partners CLO XVI, Ltd., Series 2018-16A, Class E, 11.492%, (3 mo. USD LIBOR + 6.70%), 1/17/32(1)(2) | | 3,000 | 2,675,676 |
| Benefit Street Partners CLO XVII, Ltd., Series 2019-17A, Class ER, 11.142%, (3 mo. USD LIBOR + 6.35%), 7/15/32(1)(2) | | 3,000 | 2,744,505 |
| Benefit Street Partners CLO XVIII, Ltd., Series 2019-18A, Class ER, 11.542%, (3 mo. USD LIBOR + 6.75%), 10/15/34(1)(2) | | 4,500 | 4,119,331 |
| Benefit Street Partners CLO XXII, Ltd., Series 2020-22A, Class ER, 11.569%, (3 mo. SOFR + 6.93%), 4/20/35(1)(2) | | 2,000 | 1,807,466 |
| BlueMountain CLO XXIV, Ltd., Series 2019-24A, Class ER, 11.648%, (3 mo. USD LIBOR + 6.84%), 4/20/34(1)(2) | | 1,000 | 897,580 |
| BlueMountain CLO XXV, Ltd., Series 2019-25A, Class ER, 12.042%, (3 mo. USD LIBOR + 7.25%), 7/15/36(1)(2) | | 2,000 | 1,810,322 |
| BlueMountain CLO XXVI, Ltd., Series 2019-26A, Class ER, 11.938%, (3 mo. USD LIBOR + 7.13%), 10/20/34(1)(2) | | 2,500 | 2,308,438 |
| BlueMountain CLO XXX, Ltd., Series 2020-30A, Class ER, 11.358%, (3 mo. SOFR + 6.70%), 4/15/35(1)(2) | | 2,000 | 1,735,396 |
| BlueMountain CLO XXXIV, Ltd., Series 2022-34A, Class E, 12.189%, (3 mo. SOFR + 7.55%), 4/20/35(1)(2) | | 1,000 | 915,635 |
| BlueMountain CLO, Ltd.: | | | |
| Series 2016-3A, Class ER, 10.814%, (3 mo. USD LIBOR + 5.95%), 11/15/30(1)(2) | | 2,000 | 1,615,734 |
| Series 2018-1A, Class E, 10.752%, (3 mo. USD LIBOR + 5.95%), 7/30/30(1)(2) | | 1,000 | 772,315 |
| Security | Principal
Amount
(000's omitted) | Value |
| Canyon Capital CLO, Ltd.: | | | |
| Series 2016-2A, Class ER, 10.792%, (3 mo. USD LIBOR + 6.00%), 10/15/31(1)(2) | $ | 3,350 | $ 2,602,742 |
| Series 2019-2A, Class ER, 11.542%, (3 mo. USD LIBOR + 6.75%), 10/15/34(1)(2) | | 1,000 | 903,089 |
| Carlyle CLO C17, Ltd., Series C17A, Class DR, 10.802%, (3 mo. USD LIBOR + 6.00%), 4/30/31(1)(2) | | 1,750 | 1,439,018 |
| Carlyle Global Market Strategies CLO, Ltd.: | | | |
| Series 2012-3A, Class DR2, 11.292%, (3 mo. USD LIBOR + 6.50%), 1/14/32(1)(2) | | 2,000 | 1,635,262 |
| Series 2014-4RA, Class D, 10.442%, (3 mo. USD LIBOR + 5.65%), 7/15/30(1)(2) | | 1,250 | 1,011,170 |
| Series 2015-5A, Class DR, 11.508%, (3 mo. USD LIBOR + 6.70%), 1/20/32(1)(2) | | 1,000 | 796,018 |
| Cedar Funding X CLO, Ltd., Series 2019-10A, Class ER, 11.308%, (3 mo. USD LIBOR + 6.50%), 10/20/32(1)(2) | | 1,500 | 1,338,090 |
| Dryden Senior Loan Fund: | | | |
| Series 2015-41A, Class ER, 10.13%, (3 mo. USD LIBOR + 5.30%), 4/15/31(1)(2) | | 2,000 | 1,614,636 |
| Series 2016-42A, Class ER, 10.342%, (3 mo. USD LIBOR + 5.55%), 7/15/30(1)(2) | | 1,000 | 836,905 |
| Elmwood CLO 14, Ltd., Series 2022-1A, Class E, 10.989%, (3 mo. SOFR + 6.35%), 4/20/35(1)(2) | | 1,000 | 912,254 |
| Elmwood CLO 17, Ltd., Series 2022-4A, Class E, 11.808%, (3 mo. SOFR + 7.15%), 7/17/35(1)(2) | | 2,000 | 1,910,558 |
| Galaxy XIX CLO, Ltd., Series 2015-19A, Class D2R, 11.816%, (3 mo. USD LIBOR + 7.00%), 7/24/30(1)(2) | | 1,600 | 1,362,987 |
| Galaxy XV CLO, Ltd., Series 2013-15A, Class ER, 11.437%, (3 mo. USD LIBOR + 6.65%), 10/15/30(1)(2) | | 3,275 | 2,778,618 |
| Galaxy XXI CLO, Ltd., Series 2015-21A, Class ER, 10.058%, (3 mo. USD LIBOR + 5.25%), 4/20/31(1)(2) | | 1,100 | 941,587 |
| Galaxy XXV CLO, Ltd., Series 2018-25A, Class E, 10.768%, (3 mo. USD LIBOR + 5.95%), 10/25/31(1)(2) | | 1,000 | 864,835 |
| Golub Capital Partners CLO 37B, Ltd., Series 2018-37A, Class E, 10.558%, (3 mo. USD LIBOR + 5.75%), 7/20/30(1)(2) | | 3,000 | 2,849,103 |
| Golub Capital Partners CLO 50B-R, Ltd., Series 2020-50A, Class ER, 11.739%, (3 mo. SOFR + 7.10%), 4/20/35(1)(2) | | 2,000 | 1,827,048 |
| Madison Park Funding XVII, Ltd., Series 2015-17A, Class ER, 11.315%, (3 mo. USD LIBOR + 6.50%), 7/21/30(1)(2) | | 2,000 | 1,802,786 |
| Madison Park Funding XXXVI, Ltd., Series 2019-36A, Class ER, 11.708%, (3 mo. SOFR + 7.05%), 4/15/35(1)(2) | | 3,000 | 2,832,525 |
10
See Notes to Financial Statements.
Eaton Vance
Limited Duration Income Fund
March 31, 2023
Portfolio of Investments — continued
| Security | Principal
Amount
(000's omitted) | Value |
| Madison Park Funding XXXVII, Ltd., Series 2019-37A, Class ER, 10.942%, (3 mo. USD LIBOR + 6.15%), 7/15/33(1)(2) | $ | 3,500 | $ 3,226,626 |
| Neuberger Berman CLO XXII, Ltd., Series 2016-22A, Class ER, 10.852%, (3 mo. USD LIBOR + 6.06%), 10/17/30(1)(2) | | 1,500 | 1,320,687 |
| Neuberger Berman Loan Advisers CLO 30, Ltd., Series 2018-30A, Class ER, 11.008%, (3 mo. USD LIBOR + 6.20%), 1/20/31(1)(2) | | 2,000 | 1,819,232 |
| Neuberger Berman Loan Advisers CLO 31, Ltd., Series 2019-31A, Class ER, 11.308%, (3 mo. USD LIBOR + 6.50%), 4/20/31(1)(2) | | 1,000 | 912,890 |
| Neuberger Berman Loan Advisers CLO 48, Ltd., Series 2022-48A, Class E, 11.16%, (3 mo. SOFR + 6.50%), 4/25/36(1)(2) | | 2,000 | 1,834,678 |
| NRZ Excess Spread-Collateralized Notes, Series 2021-GNT1, Class A, 3.474%, 11/25/26(1) | | 3,607 | 3,295,676 |
| Palmer Square CLO, Ltd.: | | | |
| Series 2013-2A, Class DRR, 10.642%, (3 mo. USD LIBOR + 5.85%), 10/17/31(1)(2) | | 2,000 | 1,759,940 |
| Series 2018-2A, Class D, 10.43%, (3 mo. USD LIBOR + 5.60%), 7/16/31(1)(2) | | 1,000 | 917,925 |
| Series 2019-1A, Class DR, 11.369%, (3 mo. USD LIBOR + 6.50%), 11/14/34(1)(2) | | 2,000 | 1,811,384 |
| Series 2021-3A, Class E, 10.942%, (3 mo. USD LIBOR + 6.15%), 1/15/35(1)(2) | | 2,500 | 2,272,870 |
| RAD CLO 5, Ltd., Series 2019-5A, Class E, 11.516%, (3 mo. USD LIBOR + 6.70%), 7/24/32(1)(2) | | 4,550 | 3,981,209 |
| Regatta IX Funding, Ltd., Series 2017-1A, Class E, 10.792%, (3 mo. USD LIBOR + 6.00%), 4/17/30(1)(2) | | 450 | 391,117 |
| Regatta XII Funding, Ltd., Series 2019-1A, Class ER, 11.142%, (3 mo. USD LIBOR + 6.35%), 10/15/32(1)(2) | | 2,000 | 1,812,972 |
| Regatta XIII Funding, Ltd., Series 2018-2A, Class D, 10.742%, (3 mo. USD LIBOR + 5.95%), 7/15/31(1)(2) | | 2,000 | 1,610,944 |
| Regatta XIV Funding, Ltd., Series 2018-3A, Class E, 10.768%, (3 mo. USD LIBOR + 5.95%), 10/25/31(1)(2) | | 1,000 | 853,402 |
| Regatta XVI Funding, Ltd., Series 2019-2A, Class E, 11.792%, (3 mo. USD LIBOR + 7.00%), 1/15/33(1)(2) | | 1,800 | 1,677,364 |
| Vibrant CLO IX, Ltd., Series 2018-9A, Class D, 11.058%, (3 mo. USD LIBOR + 6.25%), 7/20/31(1)(2) | | 1,000 | 658,436 |
| Vibrant CLO XI, Ltd., Series 2019-11A, Class D, 11.578%, (3 mo. USD LIBOR + 6.77%), 7/20/32(1)(2) | | 575 | 480,181 |
| Voya CLO, Ltd.: | | | |
| Series 2015-3A, Class DR, 11.008%, (3 mo. USD LIBOR + 6.20%), 10/20/31(1)(2) | | 3,000 | 2,247,675 |
| Security | Principal
Amount
(000's omitted) | Value |
| Voya CLO, Ltd.: (continued) | | | |
| Series 2016-3A, Class DR, 10.875%, (3 mo. USD LIBOR + 6.08%), 10/18/31(1)(2) | $ | 1,400 | $ 1,008,225 |
| Wellfleet CLO, Ltd., Series 2020-1A, Class D, 12.032%, (3 mo. USD LIBOR + 7.24%), 4/15/33(1)(2) | | 2,000 | 1,697,672 |
Total Asset-Backed Securities
(identified cost $108,977,372) | | | $ 96,033,494 |
| Security | Shares | Value |
| BlackRock Corporate High Yield Fund, Inc. | | 2,188,579 | $ 19,084,409 |
Total Closed-End Funds
(identified cost $26,062,179) | | | $ 19,084,409 |
| Collateralized Mortgage Obligations — 6.9% |
| Security | Principal
Amount
(000's omitted) | Value |
| Cascade MH Asset Trust, Series 2022-MH1, Class A, 4.25% to 7/25/27, 8/25/54(1)(3) | $ | 2,911 | $ 2,591,461 |
| Federal Home Loan Mortgage Corp.: | | | |
| Series 24, Class J, 6.25%, 11/25/23 | | 8 | 7,907 |
| Series 1497, Class K, 7.00%, 4/15/23 | | 0 (4) | 249 |
| Series 1529, Class Z, 7.00%, 6/15/23 | | 4 | 4,013 |
| Series 1620, Class Z, 6.00%, 11/15/23 | | 6 | 6,261 |
| Series 1677, Class Z, 7.50%, 7/15/23 | | 3 | 2,744 |
| Series 1702, Class PZ, 6.50%, 3/15/24 | | 157 | 157,191 |
| Series 2113, Class QG, 6.00%, 1/15/29 | | 160 | 161,747 |
| Series 2122, Class K, 6.00%, 2/15/29 | | 32 | 31,937 |
| Series 2130, Class K, 6.00%, 3/15/29 | | 21 | 21,798 |
| Series 2167, Class BZ, 7.00%, 6/15/29 | | 25 | 25,365 |
| Series 2182, Class ZB, 8.00%, 9/15/29 | | 246 | 254,646 |
| Series 2198, Class ZA, 8.50%, 11/15/29 | | 241 | 249,085 |
| Series 2458, Class ZB, 7.00%, 6/15/32 | | 358 | 374,887 |
| Series 3762, Class SH, 0.676%, (10.00% - 1 mo. USD LIBOR x 2.00), 11/15/40(5) | | 381 | 355,285 |
| Series 4273, Class PU, 4.00%, 11/15/43 | | 2,263 | 2,107,983 |
| Series 4273, Class SP, 0.35%, (12.00% - 1 mo. USD LIBOR x 2.67), 11/15/43(5) | | 503 | 445,781 |
| Series 4678, Class PC, 3.00%, 1/15/46 | | 2,725 | 2,624,282 |
| Series 5028, Class TZ, 2.00%, 10/25/50 | | 2,618 | 1,609,002 |
| Series 5035, Class AZ, 2.00%, 11/25/50 | | 8,024 | 4,586,676 |
| Series 5083, Class SK, 0.00%, (3.87% - 30-day average SOFR x 1.33), 3/25/51(5) | | 2,047 | 1,424,982 |
11
See Notes to Financial Statements.
Eaton Vance
Limited Duration Income Fund
March 31, 2023
Portfolio of Investments — continued
| Security | Principal
Amount
(000's omitted) | Value |
| Interest Only:(6) | | | |
| Series 284, Class S6, 1.416%, (6.10% - 1 mo. USD LIBOR), 10/15/42(5) | $ | 1,082 | $ 123,075 |
| Series 362, Class C7, 3.50%, 9/15/47 | | 4,558 | 803,573 |
| Series 362, Class C11, 4.00%, 12/15/47 | | 4,276 | 842,775 |
| Series 4067, Class JI, 3.50%, 6/15/27 | | 680 | 30,193 |
| Series 4070, Class S, 1.416%, (6.10% - 1 mo. USD LIBOR), 6/15/32(5) | | 2,531 | 199,315 |
| Series 4088, Class EI, 3.50%, 9/15/41 | | 128 | 953 |
| Series 4094, Class CS, 1.316%, (6.00% - 1 mo. USD LIBOR), 8/15/42(5) | | 624 | 69,436 |
| Series 4095, Class HS, 1.416%, (6.10% - 1 mo. USD LIBOR), 7/15/32(5) | | 543 | 26,724 |
| Series 4109, Class ES, 1.466%, (6.15% - 1 mo. USD LIBOR), 12/15/41(5) | | 81 | 9,976 |
| Series 4110, Class SA, 0.966%, (5.65% - 1 mo. USD LIBOR), 9/15/42(5) | | 2,137 | 183,230 |
| Series 4149, Class S, 1.566%, (6.25% - 1 mo. USD LIBOR), 1/15/33(5) | | 1,379 | 113,655 |
| Series 4188, Class AI, 3.50%, 4/15/28 | | 561 | 22,819 |
| Series 4203, Class QS, 1.566%, (6.25% - 1 mo. USD LIBOR), 5/15/43(5) | | 2,399 | 176,467 |
| Series 4408, Class IP, 3.50%, 4/15/44 | | 1,509 | 193,209 |
| Series 4435, Class BI, 3.50%, 7/15/44 | | 3,159 | 482,880 |
| Series 4629, Class QI, 3.50%, 11/15/46 | | 1,235 | 241,768 |
| Series 4644, Class TI, 3.50%, 1/15/45 | | 1,412 | 198,960 |
| Series 4667, Class PI, 3.50%, 5/15/42 | | 136 | 620 |
| Series 4744, Class IO, 4.00%, 11/15/47 | | 2,198 | 414,528 |
| Series 4749, Class IL, 4.00%, 12/15/47 | | 977 | 184,464 |
| Series 4793, Class SD, 1.516%, (6.20% - 1 mo. USD LIBOR), 6/15/48(5) | | 4,622 | 541,663 |
| Series 4966, Class SY, 1.205%, (6.05% - 1 mo. USD LIBOR), 4/25/50(5) | | 12,002 | 1,577,448 |
| Principal Only:(7) | | | |
| Series 242, Class PO, 0.00%, 11/15/36 | | 1,947 | 1,582,176 |
| Series 259, Class PO, 0.00%, 4/15/39 | | 1,212 | 977,999 |
| Series 3606, Class PO, 0.00%, 12/15/39 | | 1,298 | 1,016,476 |
| Series 4417, Class KO, 0.00%, 12/15/43 | | 184 | 121,675 |
| Series 4478, Class PO, 0.00%, 5/15/45 | | 613 | 464,472 |
| Federal National Mortgage Association: | | | |
| Series G93-35, Class ZQ, 6.50%, 11/25/23 | | 93 | 92,535 |
| Series G93-40, Class H, 6.40%, 12/25/23 | | 22 | 22,078 |
| Series 1993-42, Class ZQ, 6.75%, 4/25/23 | | 0 (4) | 304 |
| Series 1993-56, Class PZ, 7.00%, 5/25/23 | | 1 | 571 |
| Series 1993-156, Class ZB, 7.00%, 9/25/23 | | 2 | 2,154 |
| Series 1994-45, Class Z, 6.50%, 2/25/24 | | 22 | 22,329 |
| Series 1994-89, Class ZQ, 8.00%, 7/25/24 | | 60 | 60,524 |
| Series 1996-57, Class Z, 7.00%, 12/25/26 | | 105 | 105,835 |
| Series 1997-77, Class Z, 7.00%, 11/18/27 | | 62 | 64,242 |
| Series 1998-44, Class ZA, 6.50%, 7/20/28 | | 75 | 77,038 |
| Security | Principal
Amount
(000's omitted) | Value |
| Federal National Mortgage Association: (continued) | | | |
| Series 1999-45, Class ZG, 6.50%, 9/25/29 | $ | 22 | $ 22,141 |
| Series 2000-22, Class PN, 6.00%, 7/25/30 | | 294 | 297,249 |
| Series 2002-1, Class G, 7.00%, 7/25/23 | | 2 | 1,709 |
| Series 2002-21, Class PE, 6.50%, 4/25/32 | | 205 | 215,383 |
| Series 2005-75, Class CS, 4.819%, (24.20% - 1 mo. USD LIBOR x 4.00), 9/25/35(5) | | 585 | 692,927 |
| Series 2007-74, Class AC, 5.00%, 8/25/37 | | 2,286 | 2,335,794 |
| Series 2011-49, Class NT, 6.00%, (66.00% - 1 mo. USD LIBOR x 10.00, Cap 6.00%), 6/25/41(5) | | 226 | 219,928 |
| Series 2011-109, Class PE, 3.00%, 8/25/41 | | 21 | 21,073 |
| Series 2012-134, Class ZT, 2.00%, 12/25/42 | | 1,351 | 1,126,700 |
| Series 2013-6, Class TA, 1.50%, 1/25/43 | | 1,321 | 1,220,123 |
| Series 2013-67, Class NF, 5.00%, (1 mo. USD LIBOR + 1.00%), 7/25/43(2) | | 947 | 916,230 |
| Series 2014-64, Class PA, 3.00%, 3/25/44 | | 54 | 53,738 |
| Series 2017-15, Class LE, 3.00%, 6/25/46 | | 481 | 466,601 |
| Series 2017-48, Class LG, 2.75%, 5/25/47 | | 1,397 | 1,250,239 |
| Interest Only:(6) | | | |
| Series 2011-101, Class IC, 3.50%, 10/25/26 | | 1,671 | 57,697 |
| Series 2011-101, Class IE, 3.50%, 10/25/26 | | 527 | 17,899 |
| Series 2012-33, Class CI, 3.50%, 3/25/27 | | 911 | 24,108 |
| Series 2012-118, Class IN, 3.50%, 11/25/42 | | 3,034 | 603,307 |
| Series 2012-124, Class IO, 0.455%, 11/25/42(8) | | 1,376 | 59,604 |
| Series 2012-125, Class IG, 3.50%, 11/25/42 | | 9,580 | 2,059,471 |
| Series 2012-150, Class SK, 1.305%, (6.15% - 1 mo. USD LIBOR), 1/25/43(5) | | 1,777 | 207,414 |
| Series 2013-12, Class SP, 0.805%, (5.65% - 1 mo. USD LIBOR), 11/25/41(5) | | 358 | 7,599 |
| Series 2013-15, Class DS, 1.355%, (6.20% - 1 mo. USD LIBOR), 3/25/33(5) | | 4,228 | 292,411 |
| Series 2013-16, Class SY, 1.305%, (6.15% - 1 mo. USD LIBOR), 3/25/43(5) | | 943 | 153,763 |
| Series 2013-54, Class HS, 1.455%, (6.30% - 1 mo. USD LIBOR), 10/25/41(5) | | 111 | 442 |
| Series 2013-64, Class PS, 1.405%, (6.25% - 1 mo. USD LIBOR), 4/25/43(5) | | 1,349 | 104,418 |
| Series 2013-75, Class SC, 1.405%, (6.25% - 1 mo. USD LIBOR), 7/25/42(5) | | 1,838 | 49,988 |
| Series 2014-32, Class EI, 4.00%, 6/25/44 | | 354 | 60,251 |
| Series 2014-55, Class IN, 3.50%, 7/25/44 | | 789 | 162,340 |
| Series 2014-89, Class IO, 3.50%, 1/25/45 | | 1,021 | 223,352 |
| Series 2015-52, Class MI, 3.50%, 7/25/45 | | 898 | 183,100 |
| Series 2018-21, Class IO, 3.00%, 4/25/48 | | 4,044 | 723,002 |
| Series 2019-1, Class AS, 1.155%, (6.00% - 1 mo. USD LIBOR), 2/25/49(5) | | 6,540 | 488,117 |
| Series 2019-33, Class SK, 1.205%, (6.05% - 1 mo. USD LIBOR), 7/25/49(5) | | 4,468 | 424,089 |
| Series 2020-23, Class SP, 1.205%, (6.05% - 1 mo. USD LIBOR), 2/25/50(5) | | 3,724 | 490,280 |
12
See Notes to Financial Statements.
Eaton Vance
Limited Duration Income Fund
March 31, 2023
Portfolio of Investments — continued
| Security | Principal
Amount
(000's omitted) | Value |
| Principal Only:(7) | | | |
| Series 379, Class 1, 0.00%, 5/25/37 | $ | 1,195 | $ 953,661 |
| Series 2006-8, Class WQ, 0.00%, 3/25/36 | | 2,019 | 1,657,998 |
| Federal National Mortgage Association Connecticut Avenue Securities, Series 2019-R04, Class 2B1, 10.095%, (1 mo. USD LIBOR + 5.25%), 6/25/39(1)(2) | | 4,167 | 4,257,459 |
| Government National Mortgage Association: | | | |
| Series 2017-121, Class DF, 5.00%, (1 mo. USD LIBOR + 0.50%), 8/20/47(2) | | 3,363 | 3,297,726 |
| Series 2017-137, Class AF, 5.00%, (1 mo. USD LIBOR + 0.50%), 9/20/47(2) | | 1,767 | 1,732,294 |
| Series 2018-6, Class JZ, 4.00%, 1/20/48 | | 5,102 | 5,268,799 |
| Series 2021-160, Class NZ, 3.00%, 9/20/51 | | 1,492 | 1,043,475 |
| Series 2021-165, Class MZ, 2.50%, 9/20/51 | | 9,095 | 7,094,474 |
| Series 2022-189, Class US, 6.017%, (22.73% - 30-day average SOFR x 3.67), 11/20/52(5) | | 4,741 | 5,073,371 |
| Interest Only:(6) | | | |
| Series 2017-104, Class SD, 1.439%, (6.20% - 1 mo. USD LIBOR), 7/20/47(5) | | 2,582 | 299,673 |
| Series 2020-151, Class AI, 2.00%, 10/20/50 | | 12,114 | 1,515,607 |
| Series 2020-154, Class PI, 2.50%, 10/20/50 | | 11,006 | 1,460,772 |
| Series 2020-176, Class HI, 2.50%, 11/20/50 | | 12,852 | 1,715,575 |
| Series 2021-131, Class QI, 3.00%, 7/20/51 | | 10,828 | 1,273,249 |
| Series 2021-193, Class IU, 3.00%, 11/20/49 | | 22,679 | 2,850,204 |
| Series 2021-209, Class IW, 3.00%, 11/20/51 | | 14,869 | 1,788,024 |
Total Collateralized Mortgage Obligations
(identified cost $124,874,387) | | | $ 84,606,269 |
| Commercial Mortgage-Backed Securities — 6.3% |
| Security | Principal
Amount
(000's omitted) | Value |
| BAMLL Commercial Mortgage Securities Trust: | | | |
| Series 2019-BPR, Class ENM, 3.719%, 11/5/32(1)(8) | $ | 910 | $ 650,407 |
| Series 2019-BPR, Class FNM, 3.719%, 11/5/32(1)(8) | | 3,505 | 2,331,740 |
| BBCMS Mortgage Trust, Series 2017-C1, Class D, 3.544%, 2/15/50(1)(8) | | 2,200 | 1,525,612 |
| BX Commercial Mortgage Trust, Series 2021-VOLT, Class C, 5.784%, (1 mo. USD LIBOR + 1.10%), 9/15/36(1)(2) | | 2,000 | 1,888,882 |
| BX Trust, Series 2018-EXCL, Class C, 6.66%, (1 mo. USD LIBOR + 1.975%), 9/15/37(1)(2) | | 318 | 313,060 |
| CFCRE Commercial Mortgage Trust: | | | |
| Series 2016-C3, Class C, 4.753%, 1/10/48(8) | | 1,300 | 1,106,215 |
| Series 2016-C3, Class D, 3.052%, 1/10/48(1)(8) | | 3,500 | 2,578,033 |
| Series 2016-C7, Class D, 4.385%, 12/10/54(1)(8) | | 1,675 | 1,175,231 |
| Security | Principal
Amount
(000's omitted) | Value |
| CGMS Commercial Mortgage Trust, Series 2015-P1, Class D, 3.225%, 9/15/48(1) | $ | 1,100 | $ 821,265 |
| COMM Mortgage Trust: | | | |
| Series 2013-CR9, Class D, 4.513%, 7/10/45(1)(8) | | 2,000 | 1,770,925 |
| Series 2013-CR11, Class D, 5.118%, 8/10/50(1)(8) | | 7,400 | 7,093,449 |
| Series 2014-CR21, Class C, 4.41%, 12/10/47(8) | | 2,000 | 1,831,111 |
| Series 2015-CR22, Class D, 4.071%, 3/10/48(1)(8) | | 4,100 | 3,200,283 |
| CSMC Trust: | | | |
| Series 2016-NXSR, Class C, 4.431%, 12/15/49(8) | | 2,770 | 2,076,117 |
| Series 2016-NXSR, Class D, 4.431%, 12/15/49(1)(8) | | 3,000 | 1,741,194 |
| Series 2020-TMIC, Class A, 8.184%, (1 mo. USD LIBOR + 3.50%), 12/15/35(1)(2) | | 2,100 | 2,081,777 |
| Federal National Mortgage Association Multifamily Connecticut Avenue Securities Trust, Series 2019-01, Class M10, 8.095%, (1 mo. USD LIBOR + 3.25%), 10/25/49(1)(2) | | 1,527 | 1,405,090 |
| JPMBB Commercial Mortgage Securities Trust: | | | |
| Series 2014-C22, Class D, 4.547%, 9/15/47(1)(8) | | 5,276 | 3,816,922 |
| Series 2014-C23, Class D, 3.979%, 9/15/47(1)(8) | | 3,488 | 2,949,436 |
| Series 2014-C25, Class D, 3.936%, 11/15/47(1)(8) | | 4,400 | 1,894,857 |
| Series 2015-C29, Class D, 3.687%, 5/15/48(8) | | 2,000 | 1,389,474 |
| JPMorgan Chase Commercial Mortgage Securities Trust: | | | |
| Series 2013-C13, Class D, 4.157%, 1/15/46(1)(8) | | 3,000 | 2,901,463 |
| Series 2013-C16, Class D, 5.008%, 12/15/46(1)(8) | | 3,500 | 3,208,238 |
| Series 2014-DSTY, Class B, 3.771%, 6/10/27(1) | | 2,600 | 458,640 |
| Series 2021-MHC, Class C, 5.984%, (1 mo. USD LIBOR + 1.30%), 4/15/38(1)(2) | | 1,900 | 1,808,571 |
| Morgan Stanley Bank of America Merrill Lynch Trust: | | | |
| Series 2014-C16, Class B, 4.301%, 6/15/47(8)(9) | | 363 | 342,690 |
| Series 2015-C23, Class D, 4.14%, 7/15/50(1)(8)(9) | | 2,670 | 2,054,435 |
| Series 2016-C29, Class D, 3.00%, 5/15/49(1)(9) | | 3,577 | 2,540,356 |
| Series 2016-C32, Class D, 3.396%, 12/15/49(1)(8)(9) | | 1,600 | 1,054,795 |
| Morgan Stanley Capital I Trust: | | | |
| Series 2016-UBS12, Class D, 3.312%, 12/15/49(1)(9) | | 4,489 | 2,198,211 |
| Series 2019-BPR, Class C, 7.984%, (1 mo. USD LIBOR + 3.30%), 5/15/36(1)(2)(9) | | 1,845 | 1,743,153 |
| UBS-Barclays Commercial Mortgage Trust, Series 2013-C6, Class D, 4.38%, 4/10/46(1)(8) | | 4,437 | 3,682,958 |
| VMC Finance, LLC, Series 2021-HT1, Class B, 9.261%, (1 mo. USD LIBOR + 4.50%), 1/18/37(1)(2) | | 6,000 | 5,666,230 |
| Wells Fargo Commercial Mortgage Trust: | | | |
| Series 2013-LC12, Class D, 4.364%, 7/15/46(1)(8) | | 3,000 | 1,151,967 |
| Series 2015-C31, Class D, 3.852%, 11/15/48 | | 2,475 | 1,881,150 |
| Series 2016-C35, Class D, 3.142%, 7/15/48(1) | | 1,850 | 1,341,897 |
13
See Notes to Financial Statements.
Eaton Vance
Limited Duration Income Fund
March 31, 2023
Portfolio of Investments — continued
| Security | Principal
Amount
(000's omitted) | Value |
| Wells Fargo Commercial Mortgage Trust: (continued) | | | |
| Series 2016-C36, Class D, 2.942%, 11/15/59(1) | $ | 1,500 | $ 849,859 |
Total Commercial Mortgage-Backed Securities
(identified cost $90,551,186) | | | $ 76,525,693 |
| Security | Shares | Value |
| Aerospace and Defense — 0.0%(10) |
| IAP Global Services, LLC(11)(12)(13) | | 30 | $ 136,445 |
| | | | $ 136,445 |
| Containers and Glass Products — 0.2% |
| LG Newco Holdco, Inc., Class A(12)(13) | | 166,175 | $ 1,730,995 |
| | | | $ 1,730,995 |
| Electronics/Electrical — 0.0%(10) |
| Riverbed Technology, Inc.(12)(13) | | 21,990 | $ 11,050 |
| Skillsoft Corp.(12)(13) | | 143,062 | 286,124 |
| | | | $ 297,174 |
| Health Care — 0.0% |
| Akorn Holding Company, LLC, Class A(11)(12)(13) | | 42,374 | $ 0 |
| | | | $ 0 |
| Investment Companies — 0.0%(10) |
| Aegletes B.V.(13) | | 11,215 | $ 190,655 |
| Jubilee Topco, Ltd., Class A(11)(12)(13) | | 807,124 | 0 |
| | | | $ 190,655 |
| Nonferrous Metals/Minerals — 0.0%(10) |
| ACNR Holdings, Inc., Class A(12)(13) | | 3,818 | $ 367,483 |
| | | | $ 367,483 |
| Oil and Gas — 0.0%(10) |
| AFG Holdings, Inc.(11)(12)(13) | | 29,751 | $ 88,063 |
| McDermott International, Ltd.(12)(13) | | 93,940 | 38,158 |
| | | | $ 126,221 |
| Radio and Television — 0.1% |
| Clear Channel Outdoor Holdings, Inc.(12)(13) | | 74,443 | $ 89,332 |
| Security | Shares | Value |
| Radio and Television (continued) |
| Cumulus Media, Inc., Class A(12)(13) | | 50,522 | $ 186,426 |
| iHeartMedia, Inc., Class A(12)(13) | | 31,657 | 123,462 |
| | | | $ 399,220 |
| Retailers (Except Food and Drug) — 0.0%(10) |
| David’s Bridal, LLC(11)(12)(13) | | 40,851 | $ 0 |
| Phillips Pet Holding Corp.(11)(12)(13) | | 582 | 43,032 |
| | | | $ 43,032 |
| Telecommunications — 0.0%(10) |
| GEE Acquisition Holdings Corp.(11)(12)(13) | | 37,259 | $ 356,196 |
| | | | $ 356,196 |
| Utilities — 0.0%(10) |
| Longview Intermediate Holdings, LLC, Class A(12)(13) | | 10,730 | $ 86,591 |
| | | | $ 86,591 |
Total Common Stocks
(identified cost $7,786,647) | | | $ 3,734,012 |
| Security | Principal
Amount
(000's omitted) | Value |
| Transportation — 0.1% |
| CryoPort, Inc., 0.75%, 12/1/26(1) | $ | 1,990 | $ 1,555,730 |
Total Convertible Bonds
(identified cost $1,602,212) | | | $ 1,555,730 |
| Convertible Preferred Stocks — 0.0%(10) |
| Security | Shares | Value |
| Electronics/Electrical — 0.0%(10) |
| Riverbed Technology, Inc., Series A, 6.50%, (1.50% cash, 5.00% PIK)(13) | | 7,179 | $ 1,831 |
Total Convertible Preferred Stocks
(identified cost $215,385) | | | $ 1,831 |
14
See Notes to Financial Statements.
Eaton Vance
Limited Duration Income Fund
March 31, 2023
Portfolio of Investments — continued
| Security | Principal
Amount*
(000's omitted) | Value |
| Aerospace and Defense — 1.3% |
| Bombardier, Inc.: | | | |
| 7.125%, 6/15/26(1) | | 736 | $ 739,312 |
| 7.875%, 4/15/27(1) | | 795 | 805,569 |
| Moog, Inc., 4.25%, 12/15/27(1) | | 955 | 884,595 |
| Rolls-Royce PLC: | | | |
| 5.75%, 10/15/27(1) | | 2,954 | 2,945,478 |
| 5.75%, 10/15/27(14) | GBP | 100 | 118,137 |
| Spirit AeroSystems, Inc.: | | | |
| 4.60%, 6/15/28 | | 567 | 481,196 |
| 9.375%, 11/30/29(1) | | 989 | 1,080,482 |
| TransDigm UK Holdings PLC, 6.875%, 5/15/26 | | 725 | 714,832 |
| TransDigm, Inc.: | | | |
| 5.50%, 11/15/27 | | 2,552 | 2,409,095 |
| 6.25%, 3/15/26(1) | | 2,408 | 2,412,635 |
| 6.75%, 8/15/28(1) | | 1,812 | 1,832,385 |
| 7.50%, 3/15/27 | | 1,862 | 1,859,235 |
| | | | $ 16,282,951 |
| Agriculture — 0.2% |
| Darling Ingredients, Inc., 6.00%, 6/15/30(1) | | 892 | $ 889,770 |
| Imperial Brands Finance PLC: | | | |
| 3.125%, 7/26/24(1) | | 300 | 290,740 |
| 6.125%, 7/27/27(1) | | 475 | 487,832 |
| Philip Morris International, Inc., 5.125%, 11/17/27 | | 750 | 767,974 |
| | | | $ 2,436,316 |
| Air Transport — 0.9% |
| Air France-KLM: | | | |
| 7.25%, 5/31/26(14) | EUR | 100 | $ 110,444 |
| 8.125%, 5/31/28(14) | EUR | 100 | 109,623 |
| American Airlines, Inc., 7.25%, 2/15/28(1) | | 478 | 465,316 |
| American Airlines, Inc./AAdvantage Loyalty IP, Ltd.: | | | |
| 5.50%, 4/20/26(1) | | 3,023 | 2,978,688 |
| 5.75%, 4/20/29(1) | | 1,952 | 1,874,507 |
| Delta Air Lines, Inc./SkyMiles IP, Ltd., 4.75%, 10/20/28(1) | | 1,016 | 981,302 |
| Deutsche Lufthansa AG: | | | |
| 2.875%, 5/16/27(14) | EUR | 100 | 98,069 |
| 3.00%, 5/29/26(14) | EUR | 100 | 101,339 |
| 3.50%, 7/14/29(14) | EUR | 100 | 95,409 |
| Gatwick Airport Finance PLC, 4.375%, 4/7/26(14) | GBP | 300 | 341,432 |
| Security | Principal
Amount*
(000's omitted) | Value |
| Air Transport (continued) |
| Heathrow Finance PLC, 4.75% to 12/1/23, 3/1/24(3)(14) | GBP | 225 | $ 272,160 |
| Mileage Plus Holdings, LLC/Mileage Plus Intellectual Property Assets, Ltd., 6.50%, 6/20/27(1) | | 2,055 | 2,050,684 |
| United Airlines, Inc.: | | | |
| 4.375%, 4/15/26(1) | | 835 | 799,828 |
| 4.625%, 4/15/29(1) | | 1,276 | 1,155,828 |
| | | | $ 11,434,629 |
| Airlines — 0.2% |
| Air Canada: | | | |
| 3.875%, 8/15/26(1) | | 2,639 | $ 2,399,013 |
| 4.625%, 8/15/29(1) | CAD | 717 | 473,326 |
| | | | $ 2,872,339 |
| Auto Components — 0.4% |
| Daimler Truck Finance North America, LLC, 2.00%, 12/14/26(1) | | 550 | $ 495,612 |
| General Motors Financial Co., Inc., 1.50%, 6/10/26 | | 1,125 | 1,001,873 |
| Hyundai Capital America, 1.30%, 1/8/26(1) | | 850 | 763,698 |
| Mercedes-Benz Finance North America, LLC, 3.30%, 5/19/25(1) | | 1,000 | 967,997 |
| Volkswagen Group of America Finance, LLC: | | | |
| 0.875%, 11/22/23(1) | | 975 | 948,381 |
| 1.25%, 11/24/25(1) | | 525 | 477,891 |
| | | | $ 4,655,452 |
| Automotive — 1.7% |
| Adient Global Holdings, Ltd., 3.50%, 8/15/24(14) | EUR | 19 | $ 20,222 |
| Asbury Automotive Group, Inc.: | | | |
| 4.625%, 11/15/29(1) | | 512 | 458,936 |
| 4.75%, 3/1/30 | | 1,134 | 1,016,274 |
| 5.00%, 2/15/32(1) | | 217 | 190,396 |
| Clarios Global, L.P., 6.75%, 5/15/25(1) | | 432 | 437,074 |
| Clarios Global, L.P./Clarios U.S. Finance Co.: | | | |
| 4.375%, 5/15/26(14) | EUR | 400 | 415,224 |
| 6.25%, 5/15/26(1) | | 1,504 | 1,501,947 |
| 8.50%, 5/15/27(1) | | 2,484 | 2,497,973 |
| Faurecia S.E.: | | | |
| 2.375%, 6/15/29(14) | EUR | 200 | 176,907 |
| 2.75%, 2/15/27(14) | EUR | 460 | 444,838 |
| 3.75%, 6/15/28(14) | EUR | 100 | 97,465 |
| Ford Motor Co.: | | | |
| 3.25%, 2/12/32 | | 2,825 | 2,224,311 |
| 4.75%, 1/15/43 | | 1,274 | 978,712 |
15
See Notes to Financial Statements.
Eaton Vance
Limited Duration Income Fund
March 31, 2023
Portfolio of Investments — continued
| Security | Principal
Amount*
(000's omitted) | Value |
| Automotive (continued) |
| Ford Motor Co.: (continued) | | | |
| 7.45%, 7/16/31 | | 457 | $ 483,679 |
| 9.625%, 4/22/30 | | 201 | 233,590 |
| Goodyear Europe B.V., 2.75%, 8/15/28(14) | EUR | 100 | 88,663 |
| Goodyear Tire & Rubber Co. (The): | | | |
| 5.00%, 7/15/29 | | 1,605 | 1,435,961 |
| 5.25%, 7/15/31 | | 709 | 613,186 |
| IHO Verwaltungs GmbH, 6.375%, (6.375% cash or 7.125% PIK), 5/15/29(1)(15) | | 200 | 176,456 |
| Jaguar Land Rover Automotive PLC, 2.20%, 1/15/24(14) | EUR | 100 | 106,263 |
| Lithia Motors, Inc.: | | | |
| 3.875%, 6/1/29(1) | | 651 | 563,935 |
| 4.375%, 1/15/31(1) | | 1,171 | 1,010,169 |
| 4.625%, 12/15/27(1) | | 514 | 478,662 |
| Real Hero Merger Sub 2, Inc., 6.25%, 2/1/29(1) | | 1,087 | 804,726 |
| Renault S.A.: | | | |
| 1.25%, 6/24/25(14) | EUR | 300 | 301,171 |
| 2.375%, 5/25/26(14) | EUR | 100 | 99,437 |
| 2.50%, 6/2/27(14) | EUR | 200 | 191,897 |
| 2.50%, 4/1/28(14) | EUR | 100 | 92,875 |
| Sonic Automotive, Inc.: | | | |
| 4.625%, 11/15/29(1) | | 1,297 | 1,088,048 |
| 4.875%, 11/15/31(1) | | 1,081 | 872,756 |
| TI Automotive Finance PLC, 3.75%, 4/15/29(14) | EUR | 212 | 176,187 |
| Volkswagen International Finance N.V., 3.875% to 6/17/29(14)(16)(17) | EUR | 200 | 186,372 |
| Wheel Pros, Inc., 6.50%, 5/15/29(1) | | 1,305 | 593,775 |
| ZF Finance GmbH, 5.75%, 8/3/26(14) | EUR | 100 | 109,058 |
| | | | $ 20,167,145 |
| Banks — 1.0% |
| Australia & New Zealand Banking Group, Ltd., 4.829%, 2/3/25(1) | | 900 | $ 903,265 |
| Bank of Montreal, 5.203%, 2/1/28 | | 925 | 933,082 |
| Banque Federative du Credit Mutuel S.A., 2.375%, 11/21/24(1) | | 1,025 | 976,277 |
| Canadian Imperial Bank of Commerce, 3.30%, 4/7/25 | | 500 | 484,343 |
| Citizens Bank NA, 6.064% to 10/24/24, 10/24/25(17) | | 700 | 659,161 |
| Credit Suisse Group AG, 6.442% to 8/11/27, 8/11/28(1)(17) | | 1,025 | 1,019,158 |
| Deutsche Bank AG, 0.962%, 11/8/23 | | 975 | 931,141 |
| Discover Bank, 2.45%, 9/12/24 | | 1,000 | 948,457 |
| Intesa Sanpaolo SpA, 7.00%, 11/21/25(1) | | 925 | 941,810 |
| National Bank of Canada, 0.55% to 11/15/23, 11/15/24(17) | | 1,000 | 970,365 |
| Security | Principal
Amount*
(000's omitted) | Value |
| Banks (continued) |
| NatWest Group PLC, 7.472% to 11/10/25, 11/10/26(17) | | 575 | $ 594,778 |
| Santander UK Group Holdings PLC, 6.833% to 11/21/25, 11/21/26(17) | | 1,900 | 1,926,240 |
| Toronto-Dominion Bank (The), 8.125% to 10/31/27, 10/31/82(17) | | 450 | 457,875 |
| | | | $ 11,745,952 |
| Banks and Thrifts — 0.6% |
| American Express Co., 2.55%, 3/4/27 | | 525 | $ 485,132 |
| BPCE S.A., 5.15%, 7/21/24(1) | | 950 | 932,243 |
| Capital One Financial Corp.: | | | |
| 3.273% to 3/1/29, 3/1/30(17) | | 395 | 336,857 |
| 5.468% to 2/1/28, 2/1/29(17) | | 400 | 390,199 |
| HSBC Holdings PLC: | | | |
| 6.161% to 3/9/28, 3/9/29(17) | | 975 | 1,003,299 |
| 7.39% to 11/3/27, 11/3/28(17) | | 375 | 399,447 |
| Swedbank AB, 3.356%, 4/4/25(1) | | 975 | 940,778 |
| Synchrony Bank, 5.625%, 8/23/27 | | 1,300 | 1,194,784 |
| Texas Capital Bancshares, Inc., 4.00% to 5/6/26, 5/6/31(17) | | 1,500 | 1,241,926 |
| United Overseas Bank, Ltd., 3.863% to 10/7/27, 10/7/32(1)(17) | | 686 | 648,136 |
| | | | $ 7,572,801 |
| Beverage and Tobacco — 0.1% |
| BAT Capital Corp., 3.557%, 8/15/27 | | 1,050 | $ 976,796 |
| JDE Peet's NV, 0.80%, 9/24/24(1) | | 800 | 745,916 |
| | | | $ 1,722,712 |
| Biotechnology — 0.0%(10) |
| Royalty Pharma PLC, 1.20%, 9/2/25 | | 525 | $ 476,266 |
| | | | $ 476,266 |
| Brokerage/Securities Dealers/Investment Houses — 0.1% |
| Bread Financial Holdings, Inc., 4.75%, 12/15/24(1) | | 825 | $ 738,533 |
| Intrum AB, 3.50%, 7/15/26(14) | EUR | 200 | 181,369 |
| | | | $ 919,902 |
| Building and Development — 1.8% |
| Brookfield Property REIT, Inc./BPR Cumulus, LLC/BPR Nimbus, LLC/GGSI Sellco, LLC, 4.50%, 4/1/27(1) | | 1,174 | $ 943,779 |
| Builders FirstSource, Inc.: | | | |
| 4.25%, 2/1/32(1) | | 2,118 | 1,847,509 |
| 5.00%, 3/1/30(1) | | 1,085 | 1,005,842 |
16
See Notes to Financial Statements.
Eaton Vance
Limited Duration Income Fund
March 31, 2023
Portfolio of Investments — continued
| Security | Principal
Amount*
(000's omitted) | Value |
| Building and Development (continued) |
| Castle UK Finco PLC, 7.904%, (3 mo. EURIBOR + 5.25%), 5/15/28(2)(14) | EUR | 200 | $ 181,242 |
| Greystar Real Estate Partners, LLC, 5.75%, 12/1/25(1) | | 1,396 | 1,361,484 |
| HT Troplast GmbH, 9.25%, 7/15/25(14) | EUR | 115 | 123,552 |
| James Hardie International Finance DAC, 3.625%, 10/1/26(14) | EUR | 400 | 410,683 |
| KB Home: | | | |
| 4.00%, 6/15/31 | | 86 | 74,575 |
| 4.80%, 11/15/29 | | 556 | 509,524 |
| Masonite International Corp., 5.375%, 2/1/28(1) | | 570 | 545,159 |
| MIWD Holdco II, LLC/MIWD Finance Corp., 5.50%, 2/1/30(1) | | 1,149 | 972,554 |
| Patrick Industries, Inc.: | | | |
| 4.75%, 5/1/29(1) | | 1,187 | 1,031,248 |
| 7.50%, 10/15/27(1) | | 225 | 221,412 |
| PGT Innovations, Inc., 4.375%, 10/1/29(1) | | 1,066 | 964,730 |
| Smyrna Ready Mix Concrete, LLC, 6.00%, 11/1/28(1) | | 3,078 | 2,893,920 |
| SRS Distribution, Inc.: | | | |
| 6.00%, 12/1/29(1) | | 692 | 572,374 |
| 6.125%, 7/1/29(1) | | 1,195 | 1,009,775 |
| Standard Industries, Inc.: | | | |
| 2.25%, 11/21/26(14) | EUR | 750 | 707,876 |
| 3.375%, 1/15/31(1) | | 1,634 | 1,315,075 |
| 4.375%, 7/15/30(1) | | 1,779 | 1,549,740 |
| 5.00%, 2/15/27(1) | | 457 | 434,657 |
| Taylor Morrison Communities, Inc.: | | | |
| 5.75%, 1/15/28(1) | | 1,062 | 1,045,704 |
| 5.875%, 6/15/27(1) | | 808 | 793,811 |
| Victoria PLC, 3.625%, 8/24/26(14) | EUR | 385 | 339,134 |
| White Cap Buyer, LLC, 6.875%, 10/15/28(1) | | 439 | 381,209 |
| White Cap Parent, LLC, 8.25%, (8.25% cash or 9.00% PIK), 3/15/26(1)(15) | | 691 | 629,349 |
| | | | $ 21,865,917 |
| Business Equipment and Services — 0.8% |
| Adtalem Global Education, Inc., 5.50%, 3/1/28(1) | | 1,900 | $ 1,804,791 |
| Allied Universal Holdco, LLC/Allied Universal Finance Corp.: | | | |
| 6.625%, 7/15/26(1) | | 2,443 | 2,350,166 |
| 9.75%, 7/15/27(1) | | 1,148 | 1,024,303 |
| Allied Universal Holdco, LLC/Allied Universal Finance Corp./Atlas Luxco 4 S.a.r.l.: | | | |
| 3.625%, 6/1/28(14) | EUR | 200 | 179,550 |
| 4.625%, 6/1/28(1) | | 776 | 652,203 |
| 4.625%, 6/1/28(1) | | 549 | 465,110 |
| 4.875%, 6/1/28(14) | GBP | 100 | 101,954 |
| Security | Principal
Amount*
(000's omitted) | Value |
| Business Equipment and Services (continued) |
| GEMS MENASA Cayman, Ltd./GEMS Education Delaware, LLC: | | | |
| 7.125%, 7/31/26(1) | | 2,576 | $ 2,507,368 |
| 7.125%, 7/31/26(14) | | 350 | 340,675 |
| Techem Verwaltungsgesellschaft 674 mbH, 6.00%, 7/30/26(14) | EUR | 264 | 272,241 |
| Techem Verwaltungsgesellschaft 675 mbH, 2.00%, 7/15/25(14) | EUR | 300 | 304,251 |
| | | | $ 10,002,612 |
| Cable and Satellite Television — 1.6% |
| Altice France S.A.: | | | |
| 2.125%, 2/15/25(14) | EUR | 100 | $ 100,457 |
| 2.50%, 1/15/25(14) | EUR | 100 | 101,265 |
| 5.125%, 7/15/29(1) | | 767 | 577,896 |
| 5.50%, 1/15/28(1) | | 841 | 691,680 |
| 5.875%, 2/1/27(14) | EUR | 200 | 192,143 |
| CCO Holdings, LLC/CCO Holdings Capital Corp.: | | | |
| 4.25%, 2/1/31(1) | | 2,263 | 1,853,012 |
| 4.50%, 8/15/30(1) | | 2,140 | 1,810,729 |
| 4.50%, 5/1/32 | | 771 | 631,380 |
| 4.75%, 3/1/30(1) | | 1,789 | 1,551,958 |
| 4.75%, 2/1/32(1) | | 1,044 | 878,116 |
| 5.00%, 2/1/28(1) | | 1,755 | 1,621,120 |
| 5.375%, 6/1/29(1) | | 595 | 547,001 |
| 6.375%, 9/1/29(1) | | 1,974 | 1,886,947 |
| Charter Communications Operating, LLC/Charter Communications Operating Capital, 4.908%, 7/23/25 | | 950 | 940,903 |
| DISH Network Corp., 11.75%, 11/15/27(1) | | 1,293 | 1,255,574 |
| UPC Holding B.V., 5.50%, 1/15/28(1) | | 593 | 531,675 |
| Virgin Media Finance PLC: | | | |
| 3.75%, 7/15/30(14) | EUR | 125 | 108,624 |
| 5.00%, 7/15/30(1) | | 946 | 782,919 |
| Virgin Media Secured Finance PLC, 5.25%, 5/15/29(14) | GBP | 100 | 107,945 |
| Virgin Media Vendor Financing Notes III DAC, 4.875%, 7/15/28(14) | GBP | 425 | 447,528 |
| Virgin Media Vendor Financing Notes IV DAC, 5.00%, 7/15/28(1) | | 1,091 | 970,815 |
| Ziggo B.V., 4.875%, 1/15/30(1) | | 628 | 536,017 |
| Ziggo Bond Co., B.V.: | | | |
| 3.375%, 2/28/30(14) | EUR | 230 | 193,862 |
| 6.00%, 1/15/27(1) | | 745 | 688,235 |
| | | | $ 19,007,801 |
17
See Notes to Financial Statements.
Eaton Vance
Limited Duration Income Fund
March 31, 2023
Portfolio of Investments — continued
| Security | Principal
Amount*
(000's omitted) | Value |
| Capital Goods — 0.1% |
| BWX Technologies, Inc.: | | | |
| 4.125%, 6/30/28(1) | | 948 | $ 854,735 |
| 4.125%, 4/15/29(1) | | 733 | 650,881 |
| | | | $ 1,505,616 |
| Chemicals — 0.1% |
| Diamond BC B.V., 4.625%, 10/1/29(1) | | 1,729 | $ 1,686,380 |
| | | | $ 1,686,380 |
| Chemicals and Plastics — 0.8% |
| ASP Unifrax Holdings, Inc., 5.25%, 9/30/28(1) | | 1,242 | $ 993,973 |
| Avient Corp., 7.125%, 8/1/30(1) | | 796 | 821,671 |
| Celanese US Holdings, LLC, 6.165%, 7/15/27 | | 1,164 | 1,172,293 |
| Herens Holdco S.a.r.l., 4.75%, 5/15/28(1) | | 545 | 439,305 |
| Herens Midco S.a.r.l., 5.25%, 5/15/29(14) | EUR | 156 | 113,923 |
| INEOS Finance PLC: | | | |
| 2.875%, 5/1/26(14) | EUR | 100 | 101,427 |
| 3.375%, 3/31/26(14) | EUR | 100 | 101,852 |
| INEOS Quattro Finance 2 PLC, 2.50%, 1/15/26(14) | EUR | 154 | 150,163 |
| Italmatch Chemicals SpA, 10.00%, 2/6/28(14) | EUR | 200 | 221,607 |
| NOVA Chemicals Corp.: | | | |
| 4.25%, 5/15/29(1) | | 1,242 | 1,016,695 |
| 4.875%, 6/1/24(1) | | 874 | 863,293 |
| Nufarm Australia, Ltd./Nufarm Americas, Inc., 5.00%, 1/27/30(1) | | 1,307 | 1,152,963 |
| Valvoline, Inc., 3.625%, 6/15/31(1) | | 802 | 681,933 |
| W.R. Grace Holdings, LLC: | | | |
| 4.875%, 6/15/27(1) | | 1,472 | 1,420,715 |
| 7.375%, 3/1/31(1) | | 611 | 613,893 |
| | | | $ 9,865,706 |
| Clothing/Textiles — 0.2% |
| Hanesbrands, Inc., 9.00%, 2/15/31(1) | | 1,084 | $ 1,110,780 |
| William Carter Co. (The), 5.625%, 3/15/27(1) | | 811 | 789,059 |
| | | | $ 1,899,839 |
| Commercial Services — 1.2% |
| Abertis Infraestructuras Finance B.V., 3.248% to 11/24/25(14)(16)(17) | EUR | 500 | $ 484,609 |
| APi Group DE, Inc., 4.75%, 10/15/29(1) | | 1,510 | 1,330,913 |
| Arena Luxembourg Finance S.a.r.l., 1.875%, 2/1/28(14) | EUR | 200 | 171,970 |
| Avis Budget Car Rental, LLC/Avis Budget Finance, Inc., 5.375%, 3/1/29(1) | | 792 | 736,338 |
| BCP V Modular Services Finance II PLC, 4.75%, 11/30/28(14) | EUR | 100 | 92,559 |
| Security | Principal
Amount*
(000's omitted) | Value |
| Commercial Services (continued) |
| EC Finance PLC, 3.00%, 10/15/26(14) | EUR | 102 | $ 102,404 |
| Global Payments, Inc., 4.95%, 8/15/27 | | 975 | 964,071 |
| HealthEquity, Inc., 4.50%, 10/1/29(1) | | 1,176 | 1,046,309 |
| IPD 3 B.V., 5.50%, 12/1/25(14) | EUR | 300 | 320,649 |
| Korn Ferry, 4.625%, 12/15/27(1) | | 1,355 | 1,281,715 |
| LABL, Inc.: | | | |
| 5.875%, 11/1/28(1) | | 507 | 451,453 |
| 8.25%, 11/1/29(1) | | 1,016 | 868,274 |
| Metis Merger Sub, LLC, 6.50%, 5/15/29(1) | | 1,938 | 1,615,943 |
| Mooney Group SpA, 6.69%, (3 mo. EURIBOR + 3.875%), 12/17/26(2)(14) | EUR | 110 | 116,998 |
| NESCO Holdings II, Inc., 5.50%, 4/15/29(1) | | 1,282 | 1,161,101 |
| PROG Holdings, Inc., 6.00%, 11/15/29(1) | | 1,085 | 923,808 |
| Sabre GLBL, Inc., 11.25%, 12/15/27(1) | | 996 | 928,735 |
| Verisure Holding AB: | | | |
| 3.25%, 2/15/27(14) | EUR | 200 | 193,102 |
| 3.875%, 7/15/26(14) | EUR | 200 | 201,760 |
| Verisure Midholding AB, 5.25%, 2/15/29(14) | EUR | 175 | 158,316 |
| WASH Multifamily Acquisition, Inc., 5.75%, 4/15/26(1) | | 2,060 | 1,951,562 |
| | | | $ 15,102,589 |
| Computers — 0.9% |
| Booz Allen Hamilton, Inc.: | | | |
| 3.875%, 9/1/28(1) | | 1,341 | $ 1,224,963 |
| 4.00%, 7/1/29(1) | | 717 | 647,676 |
| Dell International, LLC/EMC Corp., 5.25%, 2/1/28 | | 650 | 656,618 |
| Hewlett Packard Enterprise Co., 5.90%, 10/1/24 | | 754 | 763,737 |
| Kyndryl Holdings, Inc., 2.70%, 10/15/28 | | 625 | 524,011 |
| McAfee Corp., 7.375%, 2/15/30(1) | | 1,121 | 940,961 |
| NCR Corp.: | | | |
| 5.125%, 4/15/29(1) | | 550 | 476,437 |
| 5.25%, 10/1/30(1) | | 843 | 688,967 |
| Presidio Holdings, Inc., 8.25%, 2/1/28(1) | | 3,176 | 3,021,456 |
| Seagate HDD Cayman: | | | |
| 4.091%, 6/1/29 | | 418 | 369,677 |
| 9.625%, 12/1/32(1) | | 1,800 | 2,019,072 |
| | | | $ 11,333,575 |
| Consumer Products — 0.1% |
| Central Garden & Pet Co.: | | | |
| 4.125%, 10/15/30 | | 488 | $ 431,636 |
| 5.125%, 2/1/28 | | 864 | 832,728 |
| | | | $ 1,264,364 |
18
See Notes to Financial Statements.
Eaton Vance
Limited Duration Income Fund
March 31, 2023
Portfolio of Investments — continued
| Security | Principal
Amount*
(000's omitted) | Value |
| Containers and Glass Products — 0.4% |
| Ardagh Metal Packaging Finance USA, LLC/Ardagh Metal Packaging Finance PLC: | | | |
| 3.00%, 9/1/29(14) | EUR | 300 | $ 243,302 |
| 4.00%, 9/1/29(1) | | 1,177 | 922,126 |
| Ardagh Packaging Finance PLC/Ardagh Holdings USA, Inc., 2.125%, 8/15/26(14) | EUR | 200 | 190,516 |
| Berry Global, Inc., 5.50%, 4/15/28(1) | | 275 | 274,239 |
| Canpack S.A./Canpack US, LLC, 3.875%, 11/15/29(1) | | 2,027 | 1,643,490 |
| Crown Americas, LLC/Crown Americas Capital Corp. V, 4.25%, 9/30/26 | | 660 | 633,394 |
| Crown Americas, LLC/Crown Americas Capital Corp. VI, 4.75%, 2/1/26 | | 750 | 731,149 |
| Verallia S.A., 1.875%, 11/10/31(14) | EUR | 100 | 88,068 |
| | | | $ 4,726,284 |
| Cosmetics/Toiletries — 0.2% |
| Coty, Inc., 3.875%, 4/15/26(14) | EUR | 100 | $ 104,512 |
| Edgewell Personal Care Co.: | | | |
| 4.125%, 4/1/29(1) | | 441 | 386,864 |
| 5.50%, 6/1/28(1) | | 1,067 | 1,023,685 |
| Natura & Co. Luxembourg Holdings S.a.r.l., 6.00%, 4/19/29(1) | | 200 | 173,689 |
| Natura Cosmeticos S.A., 4.125%, 5/3/28(1) | | 643 | 524,234 |
| | | | $ 2,212,984 |
| Distribution & Wholesale — 0.7% |
| BCPE Empire Holdings, Inc., 7.625%, 5/1/27(1) | | 2,799 | $ 2,560,105 |
| Parts Europe S.A.: | | | |
| 6.342%, (3 mo. EURIBOR + 4.00%), 7/20/27(2)(14) | EUR | 328 | 351,821 |
| 6.50%, 7/16/25(14) | EUR | 100 | 109,366 |
| Performance Food Group, Inc.: | | | |
| 4.25%, 8/1/29(1) | | 2,429 | 2,183,810 |
| 5.50%, 10/15/27(1) | | 935 | 914,916 |
| Ritchie Bros Holdings, Inc.: | | | |
| 6.75%, 3/15/28(1) | | 558 | 575,343 |
| 7.75%, 3/15/31(1) | | 996 | 1,045,073 |
| Travis Perkins PLC, 4.50%, 9/7/23(14) | GBP | 100 | 122,098 |
| | | | $ 7,862,532 |
| Diversified Financial Services — 1.7% |
| AerCap Ireland Capital DAC/AerCap Global Aviation Trust: | | | |
| 1.65%, 10/29/24 | | 599 | $ 560,727 |
| 2.45%, 10/29/26 | | 975 | 876,284 |
| AG TTMT Escrow Issuer, LLC, 8.625%, 9/30/27(1) | | 1,133 | 1,141,498 |
| Air Lease Corp., 0.80%, 8/18/24 | | 750 | 699,910 |
| Security | Principal
Amount*
(000's omitted) | Value |
| Diversified Financial Services (continued) |
| American AgCredit Corp., Series QIB, 5.25% to 6/15/26(1)(16)(17) | | 410 | $ 354,138 |
| Aviation Capital Group, LLC, 6.25%, 4/15/28(1)(18) | | 275 | 275,215 |
| Cantor Fitzgerald, L.P., 4.50%, 4/14/27(1) | | 1,650 | 1,541,145 |
| CI Financial Corp., 3.20%, 12/17/30 | | 1,000 | 771,492 |
| Enact Holdings, Inc., 6.50%, 8/15/25(1) | | 708 | 691,029 |
| Encore Capital Group, Inc., 6.538%, (3 mo. EURIBOR + 4.25%), 1/15/28(2)(14) | EUR | 300 | 312,801 |
| Intrum AB: | | | |
| 4.875%, 8/15/25(14) | EUR | 125 | 125,453 |
| 9.25%, 3/15/28(14) | EUR | 100 | 106,422 |
| Jane Street Group/JSG Finance, Inc., 4.50%, 11/15/29(1) | | 1,823 | 1,634,247 |
| Jefferson Capital Holdings, LLC, 6.00%, 8/15/26(1) | | 1,275 | 1,083,311 |
| Jerrold Finco PLC, 4.875%, 1/15/26(14) | GBP | 200 | 213,561 |
| Lincoln Financing S.a.r.l., 3.625%, 4/1/24(14) | EUR | 120 | 129,570 |
| Louvre Bidco S.A.S., 6.50%, 9/30/24(14) | EUR | 400 | 420,027 |
| Oxford Finance, LLC/Oxford Finance Co-Issuer II, Inc., 6.375%, 2/1/27(1) | | 1,209 | 1,131,920 |
| PRA Group, Inc., 7.375%, 9/1/25(1) | | 1,566 | 1,560,732 |
| ProGroup AG, 3.00%, 3/31/26(14) | EUR | 500 | 507,211 |
| Radian Group, Inc., 6.625%, 3/15/25 | | 950 | 946,884 |
| Rocket Mortgage, LLC/Rocket Mortgage Co.-Issuer, Inc.: | | | |
| 3.625%, 3/1/29(1) | | 2,290 | 1,969,400 |
| 3.875%, 3/1/31(1) | | 600 | 498,081 |
| 4.00%, 10/15/33(1) | | 225 | 178,869 |
| Sherwood Financing PLC, 6.00%, 11/15/26(14) | GBP | 150 | 154,729 |
| Synchrony Financial, 4.875%, 6/13/25 | | 227 | 210,365 |
| Unifin Financiera SAB de CV, 7.375%, 2/12/26(1)(19) | | 620 | 21,700 |
| VistaJet Malta Finance PLC/XO Management Holding, Inc., 6.375%, 2/1/30(1) | | 2,192 | 1,955,814 |
| Vivion Investments S.a.r.l., 3.00%, 8/8/24(14) | EUR | 600 | 479,175 |
| | | | $ 20,551,710 |
| Drugs — 0.5% |
| Catalent Pharma Solutions, Inc., 2.375%, 3/1/28(14) | EUR | 250 | $ 244,641 |
| Endo DAC/Endo Finance, LLC/Endo Finco, Inc., 5.875%, 10/15/24(1) | | 649 | 484,839 |
| Endo Luxembourg Finance Co. I S.a.r.l./Endo US, Inc., 6.125%, 4/1/29(1) | | 1,550 | 1,147,978 |
| Jazz Securities DAC, 4.375%, 1/15/29(1) | | 1,371 | 1,262,554 |
| Organon & Co./Organon Foreign Debt Co.-Issuer B.V., 5.125%, 4/30/31(1) | | 1,037 | 921,455 |
| Perrigo Finance Unlimited Co.: | | | |
| 4.40%, 6/15/30 | | 2,255 | 2,027,318 |
19
See Notes to Financial Statements.
Eaton Vance
Limited Duration Income Fund
March 31, 2023
Portfolio of Investments — continued
| Security | Principal
Amount*
(000's omitted) | Value |
| Drugs (continued) |
| Perrigo Finance Unlimited Co.: (continued) | | | |
| 4.90%, 12/15/44 | | 200 | $ 141,517 |
| | | | $ 6,230,302 |
| Ecological Services and Equipment — 0.7% |
| Clean Harbors, Inc.: | | | |
| 4.875%, 7/15/27(1) | | 551 | $ 531,989 |
| 5.125%, 7/15/29(1) | | 332 | 316,913 |
| 6.375%, 2/1/31(1) | | 308 | 314,561 |
| Covanta Holding Corp.: | | | |
| 4.875%, 12/1/29(1) | | 1,536 | 1,368,284 |
| 5.00%, 9/1/30 | | 319 | 275,098 |
| GFL Environmental, Inc.: | | | |
| 3.50%, 9/1/28(1) | | 1,679 | 1,521,065 |
| 3.75%, 8/1/25(1) | | 776 | 746,532 |
| 4.75%, 6/15/29(1) | | 3,095 | 2,893,825 |
| Paprec Holding S.A.: | | | |
| 3.50%, 7/1/28(14) | EUR | 129 | 122,554 |
| 4.00%, 3/31/25(14) | EUR | 200 | 214,694 |
| | | | $ 8,305,515 |
| Electric Utilities — 1.2% |
| Dominion Energy, Inc., 1.45%, 4/15/26 | | 800 | $ 721,053 |
| Drax Finco PLC, 6.625%, 11/1/25(1) | | 281 | 276,880 |
| Edison International, 4.70%, 8/15/25 | | 500 | 493,439 |
| EDP - Energias de Portugal S.A., 4.496% to 1/30/24, 4/30/79(14)(17) | EUR | 600 | 645,334 |
| EDP Finance B.V., 6.30%, 10/11/27(1) | | 700 | 726,704 |
| Electricite de France S.A., 7.50% to 9/6/28(14)(16)(17) | EUR | 400 | 425,605 |
| Energizer Gamma Acquisition B.V., 3.50%, 6/30/29(14) | EUR | 1,200 | 1,050,063 |
| Fells Point Funding Trust, 3.046%, 1/31/27(1) | | 525 | 487,564 |
| FirstEnergy Corp.: | | | |
| 2.65%, 3/1/30 | | 410 | 349,166 |
| Series B, 4.15%, 7/15/27 | | 1,630 | 1,554,507 |
| Metropolitan Edison Co., 5.20%, 4/1/28(1) | | 225 | 227,438 |
| NextEra Energy Capital Holdings, Inc.: | | | |
| 4.625%, 7/15/27 | | 475 | 474,069 |
| 6.051%, 3/1/25 | | 175 | 178,119 |
| Pattern Energy Operations, L.P./Pattern Energy Operations, Inc., 4.50%, 8/15/28(1) | | 1,112 | 1,019,058 |
| Pennsylvania Electric Co., 5.15%, 3/30/26(1) | | 200 | 201,029 |
| Public Power Corp S.A., 4.375%, 3/30/26(14) | EUR | 300 | 307,960 |
| Southern California Edison Co., 5.85%, 11/1/27 | | 275 | 289,966 |
| Southern Co. (The), 5.113%, 8/1/27 | | 1,994 | 1,999,908 |
| Security | Principal
Amount*
(000's omitted) | Value |
| Electric Utilities (continued) |
| TransAlta Corp., 7.75%, 11/15/29 | | 1,045 | $ 1,099,465 |
| Wec Energy Group, Inc., 5.00%, 9/27/25 | | 475 | 475,494 |
| WESCO Distribution, Inc.: | | | |
| 7.125%, 6/15/25(1) | | 1,024 | 1,041,838 |
| 7.25%, 6/15/28(1) | | 915 | 940,419 |
| | | | $ 14,985,078 |
| Electronic Equipment, Instruments & Components — 0.1% |
| Nexans S.A., 5.50%, 4/5/28(14)(18) | EUR | 100 | $ 110,830 |
| Vontier Corp., 1.80%, 4/1/26 | | 800 | 709,140 |
| | | | $ 819,970 |
| Electronics/Electrical — 0.8% |
| Arrow Electronics, Inc., 6.125%, 3/1/26 | | 475 | $ 476,243 |
| Coherent Corp., 5.00%, 12/15/29(1) | | 1,246 | 1,132,302 |
| Electricite de France S.A., 2.875% to 12/15/26(14)(16)(17) | EUR | 200 | 182,301 |
| Imola Merger Corp., 4.75%, 5/15/29(1) | | 3,165 | 2,834,954 |
| Open Text Corp., 3.875%, 2/15/28(1) | | 1,009 | 901,794 |
| Open Text Holdings, Inc., 4.125%, 2/15/30(1) | | 883 | 758,408 |
| RWE AG, 6.625% to 3/30/26, 7/30/75(14)(17) | | 266 | 263,319 |
| Sensata Technologies B.V., 5.00%, 10/1/25(1) | | 447 | 444,184 |
| Sensata Technologies, Inc.: | | | |
| 3.75%, 2/15/31(1) | | 1,660 | 1,453,994 |
| 4.375%, 2/15/30(1) | | 627 | 572,036 |
| SS&C Technologies, Inc., 5.50%, 9/30/27(1) | | 517 | 502,226 |
| Verisure Holding AB, 7.288%, (3 mo. EURIBOR + 5.00%), 4/15/25(2)(14) | EUR | 100 | 109,060 |
| | | | $ 9,630,821 |
| Energy — 0.5% |
| Enviva Partners, L.P./Enviva Partners Finance Corp., 6.50%, 1/15/26(1) | | 2,651 | $ 2,415,154 |
| New Fortress Energy, Inc., 6.50%, 9/30/26(1) | | 1,974 | 1,817,886 |
| Sunoco, L.P./Sunoco Finance Corp.: | | | |
| 4.50%, 5/15/29 | | 884 | 812,542 |
| 4.50%, 4/30/30 | | 1,692 | 1,532,114 |
| | | | $ 6,577,696 |
| Engineering & Construction — 0.5% |
| Brundage-Bone Concrete Pumping Holdings, Inc., 6.00%, 2/1/26(1) | | 1,038 | $ 974,397 |
| Cellnex Finance Co. S.A.: | | | |
| 1.00%, 9/15/27(14) | EUR | 100 | 92,738 |
| 2.25%, 4/12/26(14) | EUR | 100 | 102,090 |
20
See Notes to Financial Statements.
Eaton Vance
Limited Duration Income Fund
March 31, 2023
Portfolio of Investments — continued
| Security | Principal
Amount*
(000's omitted) | Value |
| Engineering & Construction (continued) |
| Dycom Industries, Inc., 4.50%, 4/15/29(1) | | 1,389 | $ 1,255,163 |
| Infrastrutture Wireless Italiane SpA, 1.875%, 7/8/26(14) | EUR | 100 | 102,255 |
| TopBuild Corp., 4.125%, 2/15/32(1) | | 1,562 | 1,307,387 |
| VM Consolidated, Inc., 5.50%, 4/15/29(1) | | 1,899 | 1,683,847 |
| | | | $ 5,517,877 |
| Entertainment — 1.3% |
| Banijay Entertainment SASU, 3.50%, 3/1/25(14) | EUR | 200 | $ 211,734 |
| Boyne USA, Inc., 4.75%, 5/15/29(1) | | 839 | 750,011 |
| Caesars Entertainment, Inc.: | | | |
| 4.625%, 10/15/29(1) | | 529 | 463,158 |
| 6.25%, 7/1/25(1) | | 2,521 | 2,523,475 |
| 7.00%, 2/15/30(1) | | 800 | 814,732 |
| 8.125%, 7/1/27(1) | | 1,589 | 1,622,210 |
| CDI Escrow Issuer, Inc., 5.75%, 4/1/30(1) | | 1,751 | 1,692,770 |
| Cirsa Finance International S.a.r.l., 4.50%, 3/15/27(14) | EUR | 100 | 94,893 |
| CPUK Finance, Ltd.: | | | |
| 4.50%, 8/28/27(14) | GBP | 100 | 104,635 |
| 4.875%, 2/28/47(14) | GBP | 335 | 394,130 |
| Jacobs Entertainment, Inc., 6.75%, 2/15/29(1) | | 1,721 | 1,505,205 |
| Live Nation Entertainment, Inc., 4.75%, 10/15/27(1) | | 1,226 | 1,135,448 |
| Lottomatica SpA: | | | |
| 5.125%, 7/15/25(14) | EUR | 100 | 107,224 |
| 6.25%, 7/15/25(14) | EUR | 100 | 108,507 |
| Pinewood Finance Co., Ltd., 3.25%, 9/30/25(14) | GBP | 200 | 231,741 |
| Scientific Games International, Inc., 7.00%, 5/15/28(1) | | 1,647 | 1,632,136 |
| Speedway Motorsports, LLC/Speedway Funding II, Inc., 4.875%, 11/1/27(1) | | 1,515 | 1,392,198 |
| WarnerMedia Holdings, Inc.: | | | |
| 3.755%, 3/15/27(1) | | 1,050 | 989,703 |
| 6.412%, 3/15/26 | | 250 | 251,338 |
| | | | $ 16,025,248 |
| Environmental — 0.0%(10) |
| Waste Management, Inc., 0.75%, 11/15/25 | | 525 | $ 477,863 |
| | | | $ 477,863 |
| Equipment Leasing — 0.0%(10) |
| Ashtead Capital, Inc., 4.25%, 11/1/29(1) | | 526 | $ 483,026 |
| | | | $ 483,026 |
| Financial Intermediaries — 2.2% |
| Ally Financial, Inc.: | | | |
| Series B, 4.70% to 5/15/26(16)(17) | | 1,647 | $ 1,186,869 |
| Security | Principal
Amount*
(000's omitted) | Value |
| Financial Intermediaries (continued) |
| Ally Financial, Inc.: (continued) | | | |
| 5.75%, 11/20/25 | | 925 | $ 870,949 |
| Alpha Holding S.A. de CV: | | | |
| 9.00%, 2/10/25(1)(19) | | 722 | 9,924 |
| 10.00%, 12/19/22(1)(19) | | 188 | 1,159 |
| Citigroup, Inc.: | | | |
| 3.668% to 7/24/27, 7/24/28(17) | | 950 | 900,717 |
| 5.61% to 9/29/25, 9/29/26(17) | | 1,425 | 1,436,591 |
| Compass Group Diversified Holdings, LLC, 5.25%, 4/15/29(1) | | 771 | 679,802 |
| Ford Motor Credit Co., LLC: | | | |
| 1.744%, 7/19/24 | EUR | 200 | 208,419 |
| 2.90%, 2/16/28 | | 420 | 361,612 |
| 3.021%, 3/6/24 | EUR | 200 | 213,423 |
| 3.25%, 9/15/25 | EUR | 100 | 104,188 |
| 3.37%, 11/17/23 | | 513 | 503,903 |
| 3.625%, 6/17/31 | | 2,307 | 1,904,048 |
| 3.815%, 11/2/27 | | 1,984 | 1,780,918 |
| 4.00%, 11/13/30 | | 995 | 846,852 |
| 4.125%, 8/17/27 | | 2,739 | 2,513,320 |
| 4.271%, 1/9/27 | | 476 | 443,870 |
| 4.867%, 8/3/27 | EUR | 200 | 210,827 |
| 5.125%, 6/16/25 | | 938 | 919,470 |
| 5.584%, 3/18/24 | | 257 | 254,751 |
| Goldman Sachs Group, Inc. (The), 3.615% to 3/15/27, 3/15/28(17) | | 1,496 | 1,416,731 |
| Icahn Enterprises, L.P./Icahn Enterprises Finance Corp.: | | | |
| 5.25%, 5/15/27 | | 1,614 | 1,516,385 |
| 6.25%, 5/15/26 | | 1,095 | 1,078,575 |
| 6.375%, 12/15/25 | | 820 | 806,271 |
| JPMorgan Chase & Co.: | | | |
| 3.54%, 5/1/28(17) | | 1,550 | 1,467,024 |
| Series HH, 4.60% to 2/1/25(16)(17) | | 1,674 | 1,561,005 |
| 5.546%, 12/15/25(17) | | 1,400 | 1,410,346 |
| MSCI, Inc.: | | | |
| 3.625%, 9/1/30(1) | | 520 | 452,509 |
| 3.875%, 2/15/31(1) | | 899 | 801,009 |
| Synovus Financial Corp., 5.90% to 2/7/24, 2/7/29(17) | | 1,011 | 823,949 |
| | | | $ 26,685,416 |
| Financial Services — 0.5% |
| Bank of America Corp.: | | | |
| 1.734% to 7/22/26, 7/22/27(17) | | 1,625 | $ 1,458,487 |
| 5.08% to 1/20/26, 1/20/27(17) | | 975 | 972,697 |
21
See Notes to Financial Statements.
Eaton Vance
Limited Duration Income Fund
March 31, 2023
Portfolio of Investments — continued
| Security | Principal
Amount*
(000's omitted) | Value |
| Financial Services (continued) |
| Carlyle Finance Subsidiary, LLC, 3.50%, 9/19/29(1) | | 1,000 | $ 916,406 |
| Nationwide Building Society, 4.00%, 9/14/26(1) | | 525 | 489,585 |
| Nordea Bank Abp, 3.75%, 8/30/23(1) | | 475 | 471,419 |
| Vietnam Debt and Asset Trading Corp., 1.00%, 10/10/25(14) | | 2,600 | 2,210,000 |
| | | | $ 6,518,594 |
| Food Products — 0.7% |
| Bellis Acquisition Co. PLC, 3.25%, 2/16/26(14) | GBP | 200 | $ 202,817 |
| Casino Guichard Perrachon SA, 4.498%, 3/7/24(14) | EUR | 100 | 54,984 |
| Chobani, LLC/Chobani Finance Corp., Inc., 7.50%, 4/15/25(1) | | 1,619 | 1,580,195 |
| Ingles Markets, Inc., 4.00%, 6/15/31(1) | | 854 | 742,980 |
| Kraft Heinz Foods Co.: | | | |
| 3.875%, 5/15/27 | | 1,198 | 1,170,664 |
| 4.25%, 3/1/31 | | 1,439 | 1,393,372 |
| 4.375%, 6/1/46 | | 282 | 245,928 |
| 4.625%, 10/1/39 | | 425 | 390,025 |
| 5.50%, 6/1/50 | | 245 | 248,295 |
| Nomad Foods Bondco PLC, 2.50%, 6/24/28(14) | EUR | 336 | 319,982 |
| Pilgrim's Pride Corp., 3.50%, 3/1/32 | | 1,979 | 1,612,291 |
| Premier Foods Financing PLC, 3.50%, 10/15/26(14) | GBP | 125 | 140,730 |
| | | | $ 8,102,263 |
| Food Service — 0.7% |
| 1011778 B.C. Unlimited Liability Company/New Red Finance, Inc.: | | | |
| 3.875%, 1/15/28(1) | | 1,906 | $ 1,774,429 |
| 4.00%, 10/15/30(1) | | 2,705 | 2,321,972 |
| 4.375%, 1/15/28(1) | | 1,014 | 937,098 |
| 5.75%, 4/15/25(1) | | 372 | 373,711 |
| IRB Holding Corp., 7.00%, 6/15/25(1) | | 615 | 617,472 |
| US Foods, Inc., 4.75%, 2/15/29(1) | | 1,837 | 1,699,161 |
| Yum! Brands, Inc., 3.625%, 3/15/31 | | 238 | 209,178 |
| | | | $ 7,933,021 |
| Food/Drug Retailers — 0.2% |
| Albertsons Cos., Inc./Safeway, Inc./New Albertsons, L.P./Albertsons, LLC: | | | |
| 4.875%, 2/15/30(1) | | 1,595 | $ 1,490,480 |
| 5.875%, 2/15/28(1) | | 1,004 | 998,879 |
| | | | $ 2,489,359 |
| Security | Principal
Amount*
(000's omitted) | Value |
| Forest Products & Paper — 0.0%(10) |
| Georgia-Pacific, LLC, 1.75%, 9/30/25(1) | | 525 | $ 486,462 |
| | | | $ 486,462 |
| Health Care — 3.7% |
| Avantor Funding, Inc., 2.625%, 11/1/25(14) | EUR | 300 | $ 313,884 |
| Centene Corp.: | | | |
| 2.50%, 3/1/31 | | 1,992 | 1,614,914 |
| 3.00%, 10/15/30 | | 2,345 | 1,976,791 |
| 3.375%, 2/15/30 | | 1,397 | 1,220,062 |
| 4.25%, 12/15/27 | | 1,005 | 969,282 |
| 4.625%, 12/15/29 | | 1,758 | 1,654,524 |
| Chrome Bidco SASU, 3.50%, 5/31/28(14) | EUR | 450 | 407,198 |
| Chrome Holdco SASU, 5.00%, 5/31/29(14) | EUR | 300 | 242,062 |
| Encompass Health Corp.: | | | |
| 4.625%, 4/1/31 | | 683 | 597,284 |
| 4.75%, 2/1/30 | | 639 | 581,682 |
| Grifols Escrow Issuer S.A.: | | | |
| 3.875%, 10/15/28(14) | EUR | 494 | 418,416 |
| 4.75%, 10/15/28(1) | | 2,051 | 1,683,892 |
| Grifols S.A.: | | | |
| 1.625%, 2/15/25(14) | EUR | 100 | 102,350 |
| 3.20%, 5/1/25(14) | EUR | 350 | 346,347 |
| HCA, Inc.: | | | |
| 5.25%, 6/15/26 | | 475 | 475,706 |
| 5.375%, 9/1/26 | | 1,610 | 1,616,840 |
| 5.625%, 9/1/28 | | 1,472 | 1,490,271 |
| 5.875%, 2/15/26 | | 2,705 | 2,746,528 |
| 5.875%, 2/1/29 | | 1,076 | 1,100,112 |
| IQVIA, Inc.: | | | |
| 2.25%, 1/15/28(14) | EUR | 450 | 433,862 |
| 2.25%, 3/15/29(14) | EUR | 100 | 92,615 |
| 2.875%, 6/15/28(14) | EUR | 100 | 97,671 |
| 5.00%, 10/15/26(1) | | 850 | 831,767 |
| 5.00%, 5/15/27(1) | | 685 | 673,793 |
| Legacy LifePoint Health, LLC: | | | |
| 4.375%, 2/15/27(1) | | 989 | 809,827 |
| 6.75%, 4/15/25(1) | | 731 | 694,450 |
| LifePoint Health, Inc., 5.375%, 1/15/29(1) | | 2,888 | 1,768,900 |
| Medline Borrower, L.P., 5.25%, 10/1/29(1) | | 3,821 | 3,318,796 |
| ModivCare Escrow Issuer, Inc., 5.00%, 10/1/29(1) | | 759 | 645,230 |
| ModivCare, Inc., 5.875%, 11/15/25(1) | | 1,550 | 1,488,054 |
| Molina Healthcare, Inc.: | | | |
| 3.875%, 11/15/30(1) | | 1,330 | 1,161,645 |
| 3.875%, 5/15/32(1) | | 1,450 | 1,219,887 |
| Option Care Health, Inc., 4.375%, 10/31/29(1) | | 1,801 | 1,592,471 |
22
See Notes to Financial Statements.
Eaton Vance
Limited Duration Income Fund
March 31, 2023
Portfolio of Investments — continued
| Security | Principal
Amount*
(000's omitted) | Value |
| Health Care (continued) |
| RegionalCare Hospital Partners Holdings, Inc./LifePoint Health, Inc., 9.75%, 12/1/26(1) | | 702 | $ 568,471 |
| Team Health Holdings, Inc., 6.375%, 2/1/25(1) | | 1,890 | 1,139,764 |
| Tenet Healthcare Corp.: | | | |
| 4.375%, 1/15/30 | | 187 | 168,001 |
| 4.625%, 9/1/24 | | 268 | 263,549 |
| 4.875%, 1/1/26 | | 1,607 | 1,577,198 |
| 5.125%, 11/1/27 | | 1,607 | 1,544,328 |
| 6.125%, 10/1/28 | | 1,593 | 1,528,237 |
| 6.875%, 11/15/31 | | 878 | 839,408 |
| US Acute Care Solutions, LLC, 6.375%, 3/1/26(1) | | 2,637 | 2,350,793 |
| Varex Imaging Corp., 7.875%, 10/15/27(1) | | 706 | 692,171 |
| | | | $ 45,059,033 |
| Health Care Providers & Services — 0.1% |
| Boston Scientific Corp., 1.90%, 6/1/25 | | 525 | $ 496,508 |
| Catalent Pharma Solutions, Inc., 3.50%, 4/1/30(1) | | 1,322 | 1,163,003 |
| | | | $ 1,659,511 |
| Home Furnishings — 0.1% |
| CD&R Smokey Buyer, Inc., 6.75%, 7/15/25(1) | | 409 | $ 352,763 |
| Tempur Sealy International, Inc., 3.875%, 10/15/31(1) | | 1,475 | 1,233,144 |
| | | | $ 1,585,907 |
| Homebuilders/Real Estate — 0.0%(10) |
| M/I Homes, Inc., 4.95%, 2/1/28 | | 459 | $ 425,173 |
| | | | $ 425,173 |
| Hotels, Restaurants & Leisure — 0.1% |
| SeaWorld Parks & Entertainment, Inc., 8.75%, 5/1/25(1) | | 1,090 | $ 1,120,520 |
| | | | $ 1,120,520 |
| Industrial Equipment — 0.2% |
| Huntington Ingalls Industries, Inc., 0.67%, 8/16/23 | | 500 | $ 491,738 |
| Madison IAQ, LLC, 5.875%, 6/30/29(1) | | 2,000 | 1,546,980 |
| TK Elevator Holdco GmbH, 6.625%, 7/15/28(14) | EUR | 90 | 83,050 |
| TK Elevator Midco GmbH, 4.375%, 7/15/27(14) | EUR | 225 | 221,454 |
| | | | $ 2,343,222 |
| Insurance — 0.7% |
| Alliant Holdings Intermediate, LLC/Alliant Holdings Co-Issuer, 6.75%, 10/15/27(1) | | 1,615 | $ 1,499,447 |
| AmWINS Group, Inc., 4.875%, 6/30/29(1) | | 1,010 | 895,178 |
| Assurant, Inc., 6.10%, 2/27/26 | | 200 | 204,093 |
| Security | Principal
Amount*
(000's omitted) | Value |
| Insurance (continued) |
| AssuredPartners, Inc., 5.625%, 1/15/29(1) | | 450 | $ 389,401 |
| BroadStreet Partners, Inc., 5.875%, 4/15/29(1) | | 1,784 | 1,510,761 |
| F&G Annuities & Life, Inc., 7.40%, 1/13/28(1) | | 575 | 578,997 |
| Galaxy Finco, Ltd., 9.25%, 7/31/27(14) | GBP | 575 | 634,132 |
| GTCR AP Finance, Inc., 8.00%, 5/15/27(1) | | 820 | 783,530 |
| Jones DesLauriers Insurance Management, Inc., 10.50%, 12/15/30(1) | | 1,355 | 1,366,467 |
| Radian Group, Inc., 4.875%, 3/15/27 | | 1,032 | 971,531 |
| | | | $ 8,833,537 |
| Internet Software & Services — 0.7% |
| Amazon.com, Inc., 3.30%, 4/13/27 | | 1,025 | $ 992,488 |
| Arches Buyer, Inc.: | | | |
| 4.25%, 6/1/28(1) | | 655 | 548,075 |
| 6.125%, 12/1/28(1) | | 963 | 795,558 |
| Cars.com, Inc., 6.375%, 11/1/28(1) | | 1,770 | 1,674,491 |
| Match Group Holdings II, LLC, 3.625%, 10/1/31(1) | | 1,727 | 1,407,332 |
| Netflix, Inc., 5.375%, 11/15/29(1) | | 1,000 | 1,016,875 |
| Science Applications International Corp., 4.875%, 4/1/28(1) | | 1,487 | 1,386,513 |
| United Group B.V.: | | | |
| 4.00%, 11/15/27(14) | EUR | 100 | 80,291 |
| 4.875%, 7/1/24(14) | EUR | 400 | 422,715 |
| | | | $ 8,324,338 |
| Leisure Goods/Activities/Movies — 1.6% |
| Carnival Corp., 5.75%, 3/1/27(1) | | 1,316 | $ 1,080,982 |
| Cinemark USA, Inc.: | | | |
| 5.25%, 7/15/28(1) | | 1,481 | 1,282,768 |
| 5.875%, 3/15/26(1) | | 414 | 390,953 |
| 8.75%, 5/1/25(1) | | 303 | 309,612 |
| LHMC Finco 2 S.a.r.l., 7.25%, (7.25% cash or 8.00% PIK), 10/2/25(14)(15) | EUR | 262 | 263,344 |
| Life Time, Inc.: | | | |
| 5.75%, 1/15/26(1) | | 1,268 | 1,233,130 |
| 8.00%, 4/15/26(1) | | 638 | 609,169 |
| Lindblad Expeditions, LLC, 6.75%, 2/15/27(1) | | 1,667 | 1,615,856 |
| Motion Finco S.a.r.l., 7.00%, 5/15/25(14) | EUR | 300 | 330,329 |
| National CineMedia, LLC: | | | |
| 5.75%, 8/15/26(19) | | 1,186 | 28,594 |
| 5.875%, 4/15/28(1) | | 1,559 | 457,683 |
| NCL Corp., Ltd.: | | | |
| 3.625%, 12/15/24(1) | | 439 | 408,760 |
| 5.875%, 3/15/26(1) | | 662 | 564,123 |
| 5.875%, 2/15/27(1) | | 517 | 482,694 |
23
See Notes to Financial Statements.
Eaton Vance
Limited Duration Income Fund
March 31, 2023
Portfolio of Investments — continued
| Security | Principal
Amount*
(000's omitted) | Value |
| Leisure Goods/Activities/Movies (continued) |
| NCL Corp., Ltd.: (continued) | | | |
| 7.75%, 2/15/29(1) | | 433 | $ 371,705 |
| NCL Finance, Ltd., 6.125%, 3/15/28(1) | | 1,000 | 811,370 |
| Playtika Holding Corp., 4.25%, 3/15/29(1) | | 1,511 | 1,259,759 |
| Royal Caribbean Cruises, Ltd., 11.625%, 8/15/27(1) | | 1,612 | 1,732,900 |
| SeaWorld Parks & Entertainment, Inc., 5.25%, 8/15/29(1) | | 1,264 | 1,142,315 |
| Viking Cruises, Ltd.: | | | |
| 5.875%, 9/15/27(1) | | 2,472 | 2,131,111 |
| 6.25%, 5/15/25(1) | | 1,690 | 1,589,349 |
| 7.00%, 2/15/29(1) | | 658 | 565,058 |
| Viking Ocean Cruises Ship VII, Ltd., 5.625%, 2/15/29(1) | | 422 | 362,656 |
| | | | $ 19,024,220 |
| Lodging and Casinos — 0.3% |
| Accor S.A.: | | | |
| 2.375%, 11/29/28(14) | EUR | 200 | $ 192,222 |
| 4.375% to 1/30/24(14)(16)(17) | EUR | 100 | 105,588 |
| Marriott International, Inc., 4.90%, 4/15/29 | | 485 | 480,989 |
| MGM Resorts International: | | | |
| 4.75%, 10/15/28 | | 1,138 | 1,060,819 |
| 5.50%, 4/15/27 | | 453 | 440,007 |
| 5.75%, 6/15/25 | | 948 | 946,604 |
| | | | $ 3,226,229 |
| Machinery — 0.1% |
| Chart Industries, Inc., 9.50%, 1/1/31(1) | | 1,139 | $ 1,202,733 |
| IMA Industria Macchine Automatiche SpA, 3.75%, 1/15/28(14) | EUR | 221 | 211,640 |
| | | | $ 1,414,373 |
| Media — 0.5% |
| Beasley Mezzanine Holdings, LLC, 8.625%, 2/1/26(1) | | 1,595 | $ 1,060,857 |
| iHeartCommunications, Inc.: | | | |
| 6.375%, 5/1/26 | | 179 | 158,164 |
| 8.375%, 5/1/27 | | 324 | 236,369 |
| Outfront Media Capital, LLC/Outfront Media Capital Corp.: | | | |
| 4.625%, 3/15/30(1) | | 543 | 453,505 |
| 6.25%, 6/15/25(1) | | 807 | 803,705 |
| Univision Communications, Inc.: | | | |
| 4.50%, 5/1/29(1) | | 1,990 | 1,673,918 |
| 7.375%, 6/30/30(1) | | 391 | 370,019 |
| Urban One, Inc., 7.375%, 2/1/28(1) | | 1,006 | 914,856 |
| | | | $ 5,671,393 |
| Security | Principal
Amount*
(000's omitted) | Value |
| Metals/Mining — 1.2% |
| BHP Billiton Finance USA, Ltd., 4.75%, 2/28/28 | | 675 | $ 683,920 |
| Cleveland-Cliffs, Inc., 6.75%, 3/15/26(1) | | 2,658 | 2,708,502 |
| Compass Minerals International, Inc., 6.75%, 12/1/27(1) | | 3,216 | 3,064,880 |
| Constellium N.V., 5.875%, 2/15/26(1) | | 490 | 490,980 |
| Constellium SE: | | | |
| 3.125%, 7/15/29(14) | EUR | 100 | 88,216 |
| 5.625%, 6/15/28(1) | | 630 | 595,499 |
| Freeport-McMoRan, Inc., 5.45%, 3/15/43 | | 1,600 | 1,498,425 |
| Glencore Funding, LLC, 4.125%, 3/12/24(1) | | 475 | 470,048 |
| Hudbay Minerals, Inc.: | | | |
| 4.50%, 4/1/26(1) | | 1,085 | 1,003,215 |
| 6.125%, 4/1/29(1) | | 489 | 462,582 |
| Novelis Corp.: | | | |
| 3.25%, 11/15/26(1) | | 690 | 631,191 |
| 4.75%, 1/30/30(1) | | 1,068 | 982,560 |
| Novelis Sheet Ingot GmbH, 3.375%, 4/15/29(14) | EUR | 500 | 474,122 |
| Roller Bearing Co. of America, Inc., 4.375%, 10/15/29(1) | | 1,513 | 1,352,864 |
| | | | $ 14,507,004 |
| Nonferrous Metals/Minerals — 0.4% |
| Eldorado Gold Corp., 6.25%, 9/1/29(1) | | 1,333 | $ 1,240,643 |
| First Quantum Minerals, Ltd., 7.50%, 4/1/25(1) | | 1,340 | 1,340,241 |
| New Gold, Inc., 7.50%, 7/15/27(1) | | 2,250 | 2,167,853 |
| | | | $ 4,748,737 |
| Oil and Gas — 3.7% |
| Aethon III BR, LLC, 9.00%, 10/1/25 | | 2,366 | $ 2,365,989 |
| Aethon United BR, L.P./Aethon United Finance Corp., 8.25%, 2/15/26(1) | | 1,570 | 1,542,078 |
| Callon Petroleum Co.: | | | |
| 7.50%, 6/15/30(1) | | 601 | 565,520 |
| 8.00%, 8/1/28(1) | | 788 | 781,381 |
| Chord Energy Corp., 6.375%, 6/1/26(1) | | 1,111 | 1,101,762 |
| Continental Resources, Inc., 2.268%, 11/15/26(1) | | 550 | 488,961 |
| CrownRock, L.P./CrownRock Finance, Inc., 5.00%, 5/1/29(1) | | 1,519 | 1,416,923 |
| CVR Energy, Inc., 5.75%, 2/15/28(1) | | 2,905 | 2,669,027 |
| Hilcorp Energy I, L.P./Hilcorp Finance Co., 5.75%, 2/1/29(1) | | 700 | 645,253 |
| Marathon Petroleum Corp., 4.70%, 5/1/25 | | 475 | 474,287 |
| Nabors Industries, Ltd., 7.50%, 1/15/28(1) | | 665 | 614,328 |
| Neptune Energy Bondco PLC, 6.625%, 5/15/25(1) | | 3,382 | 3,281,776 |
| NiSource, Inc., 5.25%, 3/30/28 | | 950 | 967,129 |
24
See Notes to Financial Statements.
Eaton Vance
Limited Duration Income Fund
March 31, 2023
Portfolio of Investments — continued
| Security | Principal
Amount*
(000's omitted) | Value |
| Oil and Gas (continued) |
| Occidental Petroleum Corp.: | | | |
| 6.20%, 3/15/40 | | 480 | $ 483,331 |
| 6.625%, 9/1/30 | | 1,511 | 1,592,722 |
| 8.50%, 7/15/27 | | 1,965 | 2,163,337 |
| 8.875%, 7/15/30 | | 1,685 | 1,961,458 |
| Parkland Corp.: | | | |
| 4.50%, 10/1/29(1) | | 376 | 334,554 |
| 4.625%, 5/1/30(1) | | 1,501 | 1,336,618 |
| Permian Resources Operating, LLC: | | | |
| 5.375%, 1/15/26(1) | | 232 | 220,153 |
| 5.875%, 7/1/29(1) | | 2,252 | 2,134,896 |
| 7.75%, 2/15/26(1) | | 1,166 | 1,170,367 |
| Petroleos Mexicanos: | | | |
| 5.35%, 2/12/28 | | 470 | 398,425 |
| 5.95%, 1/28/31 | | 1,370 | 1,049,491 |
| 6.50%, 3/13/27 | | 360 | 327,481 |
| 6.50%, 1/23/29 | | 530 | 456,073 |
| 6.75%, 9/21/47 | | 1,366 | 889,008 |
| 6.84%, 1/23/30 | | 142 | 117,833 |
| 10.00%, 2/7/33(1) | | 267 | 256,132 |
| Precision Drilling Corp.: | | | |
| 6.875%, 1/15/29(1) | | 932 | 846,629 |
| 7.125%, 1/15/26(1) | | 500 | 488,780 |
| Repsol International Finance B.V., 4.50% to 3/25/25, 3/25/75(14)(17) | EUR | 100 | 105,460 |
| Shelf Drilling Holdings, Ltd.: | | | |
| 8.25%, 2/15/25(1) | | 1,535 | 1,367,808 |
| 8.875%, 11/15/24(1) | | 441 | 438,123 |
| Southwestern Energy Co., 4.75%, 2/1/32 | | 1,485 | 1,313,408 |
| Tap Rock Resources, LLC, 7.00%, 10/1/26(1) | | 2,569 | 2,252,931 |
| Targa Resources Partners, L.P./Targa Resources Partners Finance Corp.: | | | |
| 4.00%, 1/15/32 | | 1,038 | 905,816 |
| 4.875%, 2/1/31 | | 233 | 218,262 |
| 5.50%, 3/1/30 | | 224 | 219,121 |
| 6.50%, 7/15/27 | | 566 | 577,588 |
| Transocean Poseidon, Ltd., 6.875%, 2/1/27(1) | | 868 | 851,436 |
| Transocean, Inc., 8.75%, 2/15/30(1) | | 707 | 721,776 |
| UGI International, LLC, 2.50%, 12/1/29(14) | EUR | 200 | 170,515 |
| Var Energi ASA, 7.50%, 1/15/28(1) | | 600 | 622,349 |
| Weatherford International, Ltd., 8.625%, 4/30/30(1) | | 1,355 | 1,387,466 |
| Wintershall Dea Finance 2 B.V., 2.499% to 4/20/26(14)(16)(17) | EUR | 600 | 548,447 |
| | | | $ 44,842,208 |
| Security | Principal
Amount*
(000's omitted) | Value |
| Packaging & Containers — 0.2% |
| Kleopatra Finco S.a.r.l., 4.25%, 3/1/26(14) | EUR | 350 | $ 317,915 |
| Schoeller Packaging B.V., 6.375%, 11/1/24(14) | EUR | 200 | 156,395 |
| Sealed Air Corp., 6.125%, 2/1/28(1) | | 626 | 633,637 |
| Silgan Holdings, Inc., 1.40%, 4/1/26(1) | | 550 | 493,581 |
| Trivium Packaging Finance B.V.: | | | |
| 3.75%, 8/15/26(14) | EUR | 300 | 300,950 |
| 5.50%, 8/15/26(1) | | 424 | 406,705 |
| 6.404%, (3 mo. EURIBOR + 3.75%), 8/15/26(2)(14) | EUR | 200 | 213,344 |
| | | | $ 2,522,527 |
| Pharmaceuticals — 0.6% |
| Abbvie, Inc., 3.80%, 3/15/25 | | 725 | $ 713,519 |
| BellRing Brands, Inc., 7.00%, 3/15/30(1) | | 2,444 | 2,477,898 |
| Herbalife Nutrition, Ltd./HLF Financing, Inc., 7.875%, 9/1/25(1) | | 1,383 | 1,305,706 |
| Horizon Therapeutics USA, Inc., 5.50%, 8/1/27(1) | | 1,105 | 1,122,636 |
| P&L Development, LLC/PLD Finance Corp., 7.75%, 11/15/25(1) | | 1,595 | 1,249,508 |
| PRA Health Sciences, Inc., 2.875%, 7/15/26(1) | | 410 | 378,561 |
| Rossini S.a.r.l., 6.343%, (3 mo. EURIBOR + 3.875%), 10/30/25(2)(14) | EUR | 300 | 324,537 |
| | | | $ 7,572,365 |
| Pipelines — 2.0% |
| Antero Midstream Partners, L.P./Antero Midstream Finance Corp.: | | | |
| 5.75%, 3/1/27(1) | | 1,874 | $ 1,833,334 |
| 7.875%, 5/15/26(1) | | 879 | 895,900 |
| Cheniere Energy Partners, L.P.: | | | |
| 4.00%, 3/1/31 | | 2,706 | 2,410,992 |
| 4.50%, 10/1/29 | | 1,722 | 1,601,366 |
| Cheniere Energy, Inc., 4.625%, 10/15/28 | | 1,553 | 1,477,586 |
| DT Midstream, Inc., 4.125%, 6/15/29(1) | | 1,449 | 1,272,001 |
| Energy Transfer, L.P., 5.00%, 5/15/50 | | 1,094 | 935,465 |
| Enterprise Products Operating, LLC, 5.05%, 1/10/26 | | 125 | 126,802 |
| EQM Midstream Partners, L.P.: | | | |
| 4.50%, 1/15/29(1) | | 1,355 | 1,153,505 |
| 4.75%, 1/15/31(1) | | 1,086 | 902,890 |
| 6.00%, 7/1/25(1) | | 257 | 254,384 |
| 6.50%, 7/1/27(1) | | 702 | 681,172 |
| 7.50%, 6/1/30(1) | | 1,010 | 979,634 |
| Kinetik Holdings, L.P., 5.875%, 6/15/30(1) | | 2,308 | 2,224,912 |
| Midwest Connector Capital Co., LLC, 4.625%, 4/1/29(1) | | 1,269 | 1,191,142 |
25
See Notes to Financial Statements.
Eaton Vance
Limited Duration Income Fund
March 31, 2023
Portfolio of Investments — continued
| Security | Principal
Amount*
(000's omitted) | Value |
| Pipelines (continued) |
| Plains All American Pipeline, L.P., Series B, 8.974%, (3 mo. USD LIBOR + 4.11%)(2)(16) | | 1,462 | $ 1,308,825 |
| Sabine Pass Liquefaction, LLC, 5.75%, 5/15/24 | | 950 | 952,512 |
| Venture Global Calcasieu Pass, LLC: | | | |
| 3.875%, 8/15/29(1) | | 1,116 | 1,007,636 |
| 3.875%, 11/1/33(1) | | 665 | 559,361 |
| 4.125%, 8/15/31(1) | | 992 | 872,553 |
| Western Midstream Operating, L.P.: | | | |
| 4.30%, 2/1/30 | | 1,187 | 1,081,654 |
| 4.50%, 3/1/28 | | 148 | 140,154 |
| 4.75%, 8/15/28 | | 150 | 142,922 |
| Williams Cos., Inc. (The), 4.55%, 6/24/24 | | 950 | 943,348 |
| | | | $ 24,950,050 |
| Publishing — 0.2% |
| McGraw-Hill Education, Inc.: | | | |
| 5.75%, 8/1/28(1) | | 630 | $ 548,840 |
| 8.00%, 8/1/29(1) | | 2,438 | 2,002,220 |
| | | | $ 2,551,060 |
| Radio and Television — 0.8% |
| Audacy Capital Corp., 6.75%, 3/31/29(1) | | 1,627 | $ 116,941 |
| Clear Channel Outdoor Holdings, Inc.: | | | |
| 5.125%, 8/15/27(1) | | 740 | 664,919 |
| 7.75%, 4/15/28(1) | | 2,088 | 1,567,879 |
| CMG Media Corp., 8.875%, 12/15/27(1) | | 3,533 | 2,674,446 |
| Sirius XM Radio, Inc.: | | | |
| 3.125%, 9/1/26(1) | | 946 | 854,290 |
| 3.875%, 9/1/31(1) | | 951 | 740,339 |
| 5.00%, 8/1/27(1) | | 1,609 | 1,508,116 |
| Townsquare Media, Inc., 6.875%, 2/1/26(1) | | 1,492 | 1,412,790 |
| | | | $ 9,539,720 |
| Real Estate Investment Trusts (REITs) — 1.4% |
| CTR Partnership, L.P./CareTrust Capital Corp., 3.875%, 6/30/28(1) | | 1,591 | $ 1,362,047 |
| Emeria SASU: | | | |
| 3.375%, 3/31/28(14) | EUR | 200 | 172,232 |
| 7.75%, 3/31/28(14) | EUR | 150 | 154,541 |
| EPR Properties: | | | |
| 3.60%, 11/15/31 | | 600 | 449,763 |
| 3.75%, 8/15/29 | | 565 | 433,655 |
| Equinix, Inc., 1.00%, 9/15/25 | | 525 | 475,711 |
| Extra Space Storage, L.P., 5.70%, 4/1/28 | | 450 | 453,366 |
| Security | Principal
Amount*
(000's omitted) | Value |
| Real Estate Investment Trusts (REITs) (continued) |
| HAT Holdings I, LLC/HAT Holdings II, LLC: | | | |
| 3.375%, 6/15/26(1) | | 600 | $ 521,208 |
| 3.75%, 9/15/30(1) | | 1,816 | 1,373,677 |
| 6.00%, 4/15/25(1) | | 716 | 688,617 |
| Heimstaden Bostad AB: | | | |
| 3.00% to 10/29/27(14)(16)(17) | EUR | 352 | 211,862 |
| 3.248% to 11/19/24(14)(16)(17) | EUR | 300 | 202,312 |
| Newmark Group, Inc., 6.125%, 11/15/23 | | 2,126 | 2,109,516 |
| VICI Properties, L.P./VICI Note Co., Inc.: | | | |
| 3.75%, 2/15/27(1) | | 323 | 298,473 |
| 4.125%, 8/15/30(1) | | 1,108 | 979,679 |
| 4.25%, 12/1/26(1) | | 1,653 | 1,543,830 |
| 4.50%, 9/1/26(1) | | 895 | 842,921 |
| 4.625%, 12/1/29(1) | | 2,359 | 2,149,603 |
| 5.625%, 5/1/24(1) | | 480 | 476,400 |
| 5.75%, 2/1/27(1) | | 2,073 | 2,036,975 |
| | | | $ 16,936,388 |
| Retail — 1.2% |
| 7-Eleven, Inc., 0.80%, 2/10/24(1) | | 500 | $ 478,898 |
| Arko Corp., 5.125%, 11/15/29(1) | | 2,276 | 1,886,596 |
| B&M European Value Retail S.A., 3.625%, 7/15/25(14) | GBP | 200 | 232,833 |
| Dufry One B.V.: | | | |
| 2.00%, 2/15/27(14) | EUR | 200 | 187,815 |
| 2.50%, 10/15/24(14) | EUR | 200 | 213,528 |
| 3.375%, 4/15/28(14) | EUR | 139 | 133,019 |
| Evergreen AcqCo 1, L.P./TVI, Inc., 9.75%, 4/26/28(1) | | 1,323 | 1,258,206 |
| Ferrellgas, L.P./Ferrellgas Finance Corp., 5.875%, 4/1/29(1) | | 1,081 | 925,358 |
| Fertitta Entertainment, LLC/Fertitta Entertainment Finance Co., Inc.: | | | |
| 4.625%, 1/15/29(1) | | 745 | 654,743 |
| 6.75%, 1/15/30(1) | | 1,276 | 1,050,952 |
| Group 1 Automotive, Inc., 4.00%, 8/15/28(1) | | 1,328 | 1,170,898 |
| Ken Garff Automotive, LLC, 4.875%, 9/15/28(1) | | 957 | 814,797 |
| Kohl's Corp., 3.625%, 5/1/31 | | 1,114 | 752,908 |
| LCM Investments Holdings II, LLC, 4.875%, 5/1/29(1) | | 1,652 | 1,383,955 |
| Macy's Retail Holdings, LLC, 5.875%, 4/1/29(1) | | 479 | 443,631 |
| Michaels Cos., Inc., 5.25%, 5/1/28(1) | | 1,259 | 1,050,598 |
| Midco GB SASU, 7.75%, (7.75% cash or 8.50% PIK), 11/1/27(14)(15) | EUR | 130 | 128,120 |
| Punch Finance PLC, 6.125%, 6/30/26(14) | GBP | 125 | 134,839 |
| Starbucks Corp., 4.75%, 2/15/26 | | 575 | 578,622 |
| Stonegate Pub Co. Financing 2019 PLC, 8.25%, 7/31/25(14) | GBP | 100 | 115,487 |
26
See Notes to Financial Statements.
Eaton Vance
Limited Duration Income Fund
March 31, 2023
Portfolio of Investments — continued
| Security | Principal
Amount*
(000's omitted) | Value |
| Retail (continued) |
| Suburban Propane Partners, L.P./Suburban Energy Finance Corp., 5.00%, 6/1/31(1) | | 824 | $ 720,979 |
| Victoria's Secret & Co., 4.625%, 7/15/29(1) | | 973 | 789,463 |
| | | | $ 15,106,245 |
| Retailers (Except Food and Drug) — 0.9% |
| Bath & Body Works, Inc.: | | | |
| 6.625%, 10/1/30(1) | | 479 | $ 467,399 |
| 6.75%, 7/1/36 | | 437 | 391,023 |
| 6.95%, 3/1/33 | | 1,027 | 909,511 |
| 7.60%, 7/15/37 | | 488 | 421,895 |
| 9.375%, 7/1/25(1) | | 182 | 194,618 |
| Dave & Buster's, Inc., 7.625%, 11/1/25(1) | | 2,417 | 2,465,340 |
| Murphy Oil USA, Inc.: | | | |
| 4.75%, 9/15/29 | | 170 | 155,074 |
| 5.625%, 5/1/27 | | 560 | 542,698 |
| PetSmart, Inc./PetSmart Finance Corp.: | | | |
| 4.75%, 2/15/28(1) | | 1,290 | 1,212,149 |
| 7.75%, 2/15/29(1) | | 2,469 | 2,426,237 |
| Superior Plus, L.P./Superior General Partner, Inc., 4.50%, 3/15/29(1) | | 1,532 | 1,369,765 |
| | | | $ 10,555,709 |
| Semiconductors & Semiconductor Equipment — 0.3% |
| Broadcom, Inc., 3.459%, 9/15/26 | | 775 | $ 741,080 |
| Intel Corp., 4.875%, 2/10/28 | | 1,000 | 1,016,552 |
| NXP B.V./NXP Funding, LLC/NXP USA, Inc., 2.70%, 5/1/25 | | 550 | 522,277 |
| ON Semiconductor Corp., 3.875%, 9/1/28(1) | | 1,544 | 1,391,556 |
| | | | $ 3,671,465 |
| Software — 0.2% |
| Clarivate Science Holdings Corp., 4.875%, 7/1/29(1) | | 1,485 | $ 1,344,437 |
| Oracle Corp., 5.80%, 11/10/25 | | 475 | 487,078 |
| Sabre GLBL, Inc., 9.25%, 4/15/25(1) | | 637 | 600,666 |
| | | | $ 2,432,181 |
| Software and Services — 0.3% |
| Black Knight InfoServ, LLC, 3.625%, 9/1/28(1) | | 825 | $ 751,781 |
| Fair Isaac Corp., 4.00%, 6/15/28(1) | | 1,248 | 1,158,662 |
| Gartner, Inc.: | | | |
| 3.625%, 6/15/29(1) | | 427 | 381,399 |
| 3.75%, 10/1/30(1) | | 660 | 593,023 |
| 4.50%, 7/1/28(1) | | 908 | 862,750 |
| Security | Principal
Amount*
(000's omitted) | Value |
| Software and Services (continued) |
| Playtech PLC, 4.25%, 3/7/26(14) | EUR | 200 | $ 209,729 |
| | | | $ 3,957,344 |
| Specialty Retail — 0.0%(10) |
| Fiber Bidco SpA: | | | |
| 9.015%, (3 mo. EURIBOR + 6.00%), 10/25/27(2)(14) | EUR | 200 | $ 218,640 |
| 11.00%, 10/25/27(14) | EUR | 100 | 116,698 |
| | | | $ 335,338 |
| Steel — 0.3% |
| Allegheny Ludlum, LLC, 6.95%, 12/15/25 | | 465 | $ 468,464 |
| ATI, Inc., 5.875%, 12/1/27 | | 320 | 312,994 |
| Big River Steel, LLC/BRS Finance Corp., 6.625%, 1/31/29(1) | | 1,147 | 1,139,458 |
| Nucor Corp., 3.95%, 5/23/25 | | 500 | 492,370 |
| TMS International Corp., 6.25%, 4/15/29(1) | | 1,365 | 1,053,959 |
| | | | $ 3,467,245 |
| Surface Transport — 0.1% |
| Hertz Corp. (The): | | | |
| 4.625%, 12/1/26(1) | | 218 | $ 197,689 |
| 5.00%, 12/1/29(1) | | 1,771 | 1,468,761 |
| | | | $ 1,666,450 |
| Technology — 0.6% |
| Almaviva-The Italian Innovation Co. SpA, 4.875%, 10/30/26(14) | EUR | 265 | $ 269,974 |
| athenahealth Group, Inc., 6.50%, 2/15/30(1) | | 2,297 | 1,864,612 |
| International Game Technology PLC: | | | |
| 4.125%, 4/15/26(1) | | 892 | 861,806 |
| 5.25%, 1/15/29(1) | | 2,500 | 2,396,250 |
| 6.25%, 1/15/27(1) | | 976 | 987,951 |
| 6.50%, 2/15/25(1) | | 513 | 518,894 |
| | | | $ 6,899,487 |
| Telecommunications — 3.0% |
| Altice France Holding S.A., 10.50%, 5/15/27(1) | | 1,599 | $ 1,224,674 |
| Ciena Corp., 4.00%, 1/31/30(1) | | 883 | 769,005 |
| Connect Finco S.a.r.l./Connect US Finco, LLC, 6.75%, 10/1/26(1) | | 2,698 | 2,538,548 |
| Iliad Holding SASU: | | | |
| 5.125%, 10/15/26(14) | EUR | 100 | 104,786 |
| 5.625%, 10/15/28(14) | EUR | 236 | 238,897 |
| 6.50%, 10/15/26(1) | | 1,389 | 1,324,994 |
27
See Notes to Financial Statements.
Eaton Vance
Limited Duration Income Fund
March 31, 2023
Portfolio of Investments — continued
| Security | Principal
Amount*
(000's omitted) | Value |
| Telecommunications (continued) |
| Iliad Holding SASU: (continued) | | | |
| 7.00%, 10/15/28(1) | | 811 | $ 770,199 |
| LCPR Senior Secured Financing DAC: | | | |
| 5.125%, 7/15/29(1) | | 840 | 708,914 |
| 6.75%, 10/15/27(1) | | 1,482 | 1,401,090 |
| Level 3 Financing, Inc., 4.25%, 7/1/28(1) | | 400 | 226,090 |
| Lorca Telecom Bondco S.A., 4.00%, 9/18/27(14) | EUR | 843 | 842,219 |
| Matterhorn Telecom S.A., 3.125%, 9/15/26(14) | EUR | 500 | 504,021 |
| NBN Co., Ltd., 1.45%, 5/5/26(1) | | 1,075 | 972,334 |
| PLT VII Finance S.a.r.l., 4.625%, 1/5/26(14) | EUR | 400 | 408,423 |
| Rogers Communications, Inc., 2.95%, 3/15/25(1) | | 500 | 481,758 |
| Sprint Capital Corp., 6.875%, 11/15/28 | | 2,379 | 2,558,615 |
| Sprint Spectrum Co., LLC/Sprint Spectrum Co. II, LLC/Sprint Spectrum Co. III, LLC, 5.152%, 9/20/29(1) | | 475 | 472,206 |
| Sprint, LLC: | | | |
| 7.625%, 2/15/25 | | 1,785 | 1,852,591 |
| 7.625%, 3/1/26 | | 993 | 1,050,972 |
| 7.875%, 9/15/23 | | 7,378 | 7,439,193 |
| Summer (BC) Bidco B, LLC, 5.50%, 10/31/26(1) | | 907 | 772,095 |
| Summer (BC) Holdco A S.a.r.l., 9.25%, 10/31/27(14) | EUR | 135 | 121,107 |
| Summer (BC) Holdco B S.a.r.l., 5.75%, 10/31/26(14) | EUR | 150 | 142,345 |
| Telecom Italia Finance S.A., 7.75%, 1/24/33 | EUR | 60 | 69,986 |
| Telecom Italia SpA: | | | |
| 1.625%, 1/18/29(14) | EUR | 100 | 85,332 |
| 2.50%, 7/19/23(14) | EUR | 400 | 431,631 |
| 2.75%, 4/15/25(14) | EUR | 356 | 369,570 |
| 3.00%, 9/30/25(14) | EUR | 240 | 247,971 |
| 4.00%, 4/11/24(14) | EUR | 100 | 107,756 |
| 5.303%, 5/30/24(1) | | 1,118 | 1,096,697 |
| 6.875%, 2/15/28(14) | EUR | 100 | 111,099 |
| Telefonica Europe B.V.: | | | |
| 2.88% to 2/24/28(14)(16)(17) | EUR | 200 | 181,045 |
| 4.375% to 12/14/24(14)(16)(17) | EUR | 600 | 636,226 |
| 7.125% to 8/23/28(14)(16)(17) | EUR | 300 | 331,850 |
| T-Mobile USA, Inc.: | | | |
| 2.25%, 2/15/26 | | 851 | 792,248 |
| 2.625%, 2/15/29 | | 1,064 | 938,459 |
| 2.875%, 2/15/31 | | 638 | 551,046 |
| 4.75%, 2/1/28 | | 1,045 | 1,032,574 |
| Viasat, Inc., 5.625%, 4/15/27(1) | | 476 | 447,392 |
| Viavi Solutions, Inc., 3.75%, 10/1/29(1) | | 868 | 743,187 |
| Vmed O2 UK Financing I PLC: | | | |
| 3.25%, 1/31/31(14) | EUR | 200 | 177,349 |
| 4.50%, 7/15/31(14) | GBP | 100 | 98,688 |
| Security | Principal
Amount*
(000's omitted) | Value |
| Telecommunications (continued) |
| Vodafone Group PLC: | | | |
| 2.625% to 5/27/26, 8/27/80(14)(17) | EUR | 400 | $ 390,973 |
| 4.875% to 7/3/25, 10/3/78(14)(17) | GBP | 350 | 411,812 |
| Wp/ap Telecom Holdings III B.V., 5.50%, 1/15/30(14) | EUR | 250 | 226,477 |
| | | | $ 36,404,444 |
| Transportation — 0.3% |
| Cargo Aircraft Management, Inc., 4.75%, 2/1/28(1) | | 1,528 | $ 1,367,973 |
| Fenix Marine Service Holdings, Ltd., 8.00%, 1/15/24 | | 150 | 149,086 |
| Getlink S.E., 3.50%, 10/30/25(14) | EUR | 415 | 437,590 |
| Seaspan Corp., 5.50%, 8/1/29(1) | | 1,654 | 1,291,722 |
| | | | $ 3,246,371 |
| Utilities — 1.3% |
| Calpine Corp.: | | | |
| 4.50%, 2/15/28(1) | | 1,073 | $ 996,622 |
| 4.625%, 2/1/29(1) | | 680 | 588,056 |
| 5.00%, 2/1/31(1) | | 910 | 771,318 |
| 5.125%, 3/15/28(1) | | 1,511 | 1,385,452 |
| 5.25%, 6/1/26(1) | | 344 | 335,767 |
| Leeward Renewable Energy Operations, LLC, 4.25%, 7/1/29(1) | | 838 | 730,905 |
| NextEra Energy Operating Partners, L.P.: | | | |
| 4.25%, 9/15/24(1) | | 60 | 57,779 |
| 4.50%, 9/15/27(1) | | 1,207 | 1,153,808 |
| NRG Energy, Inc.: | | | |
| 3.375%, 2/15/29(1) | | 664 | 550,541 |
| 3.625%, 2/15/31(1) | | 1,107 | 888,876 |
| 3.875%, 2/15/32(1) | | 1,466 | 1,174,398 |
| 5.25%, 6/15/29(1) | | 673 | 625,735 |
| 5.75%, 1/15/28 | | 1,455 | 1,429,101 |
| 10.25% to 3/15/28(1)(16)(17) | | 1,413 | 1,351,612 |
| TerraForm Power Operating, LLC, 5.00%, 1/31/28(1) | | 1,497 | 1,424,026 |
| Vistra Operations Co., LLC: | | | |
| 4.375%, 5/1/29(1) | | 939 | 832,691 |
| 5.00%, 7/31/27(1) | | 1,278 | 1,210,145 |
| | | | $ 15,506,832 |
Total Corporate Bonds
(identified cost $711,553,848) | | | $ 660,549,511 |
28
See Notes to Financial Statements.
Eaton Vance
Limited Duration Income Fund
March 31, 2023
Portfolio of Investments — continued
| Security | Shares | Value |
| Financial Services — 0.0% |
| DBI Investors, Inc., Series A-1(11)(12)(13) | | 1,932 | $ 0 |
| | | | $ 0 |
| Nonferrous Metals/Minerals — 0.1% |
| ACNR Holdings, Inc., 15.00% (PIK)(12)(13) | | 1,803 | $ 1,059,263 |
| | | | $ 1,059,263 |
| Retailers (Except Food and Drug) — 0.0% |
| David’s Bridal, LLC: | | | |
| Series A, 8.00% (PIK)(11)(12)(13) | | 1,136 | $ 0 |
| Series B, 10.00% (PIK)(11)(12)(13) | | 4,631 | 0 |
| | | | $ 0 |
Total Preferred Stocks
(identified cost $374,926) | | | $ 1,059,263 |
| Senior Floating-Rate Loans — 46.6%(20) |
| Borrower/Description | Principal
Amount*
(000's omitted) | Value |
| Aerospace and Defense — 1.2% |
| Aernnova Aerospace S.A.U.: | | | |
| Term Loan, 5.436%, (6 mo. EURIBOR + 3.00%), 2/26/27 | EUR | 796 | $ 808,146 |
| Term Loan, 5.625%, (6 mo. EURIBOR + 3.00%), 2/26/27 | EUR | 204 | 207,217 |
| AI Convoy (Luxembourg) S.a.r.l., Term Loan, 5.532%, (6 mo. EURIBOR + 3.50%), 1/18/27 | EUR | 1,000 | 1,022,141 |
| Dynasty Acquisition Co., Inc.: | | | |
| Term Loan, 8.407%, (SOFR + 3.50%), 4/6/26 | | 644 | 630,974 |
| Term Loan, 8.407%, (SOFR + 3.50%), 4/6/26 | | 346 | 339,233 |
| IAP Worldwide Services, Inc., Term Loan - Second Lien, 11.659%, (3 mo. USD LIBOR + 6.50%), 7/18/23(11) | | 217 | 171,501 |
| TransDigm, Inc.: | | | |
| Term Loan, 8.148%, (SOFR + 3.25%), 2/22/27 | | 1,336 | 1,339,432 |
| Term Loan, 8.148%, (SOFR + 3.25%), 8/24/28 | | 4,610 | 4,604,186 |
| WP CPP Holdings, LLC, Term Loan, 8.58%, (3 mo. USD LIBOR + 3.75%), 4/30/25 | | 6,458 | 5,913,669 |
| | | | $ 15,036,499 |
| Airlines — 0.2% |
| Mileage Plus Holdings, LLC, Term Loan, 10.213%, (3 mo. USD LIBOR + 5.25%), 6/21/27 | | 638 | $ 662,956 |
| Borrower/Description | Principal
Amount*
(000's omitted) | Value |
| Airlines (continued) |
| SkyMiles IP, Ltd., Term Loan, 8.558%, (3 mo. USD LIBOR + 3.75%), 10/20/27 | | 1,853 | $ 1,922,895 |
| | | | $ 2,585,851 |
| Apparel & Luxury Goods — 0.0%(10) |
| Hanesbrands, Inc., Term Loan, 8.557%, (SOFR + 3.75%), 3/8/30 | | 375 | $ 374,063 |
| | | | $ 374,063 |
| Auto Components — 0.8% |
| Adient US, LLC, Term Loan, 8.09%, (1 mo. USD LIBOR + 3.25%), 4/10/28 | | 553 | $ 553,438 |
| Clarios Global, L.P., Term Loan, 6.155%, (1 mo. EURIBOR + 3.25%), 4/30/26 | EUR | 1,373 | 1,443,839 |
| DexKo Global, Inc.: | | | |
| Term Loan, 6.765%, (3 mo. EURIBOR + 3.75%), 10/4/28 | EUR | 96 | 93,214 |
| Term Loan, 6.765%, (3 mo. EURIBOR + 3.75%), 10/4/28 | EUR | 309 | 301,260 |
| Term Loan, 6.765%, (EURIBOR + 3.75%), 10/4/28(21) | EUR | 595 | 579,316 |
| Term Loan, 8.909%, (3 mo. USD LIBOR + 3.75%), 10/4/28 | | 817 | 767,016 |
| Term Loan, 11.398%, (SOFR + 6.50%), 10/4/28 | | 875 | 813,750 |
| Garrett LX I S.a.r.l.: | | | |
| Term Loan, 5.992%, (3 mo. EURIBOR + 3.50%), 4/30/28 | EUR | 1,000 | 1,063,262 |
| Term Loan, 8.08%, (3 mo. USD LIBOR + 3.25%), 4/30/28 | | 640 | 635,448 |
| LTI Holdings, Inc.: | | | |
| Term Loan, 8.34%, (1 mo. USD LIBOR + 3.50%), 9/6/25 | | 3,348 | 3,235,629 |
| Term Loan, 9.59%, (1 mo. USD LIBOR + 4.75%), 7/24/26 | | 711 | 691,151 |
| | | | $ 10,177,323 |
| Automobiles — 0.2% |
| MajorDrive Holdings IV, LLC: | | | |
| Term Loan, 9.00%, (3 mo. USD LIBOR + 4.00%), 6/1/28 | | 442 | $ 420,571 |
| Term Loan, 10.556%, (SOFR + 5.50%), 6/1/29 | | 1,634 | 1,576,328 |
| Thor Industries, Inc., Term Loan, 7.875%, (1 mo. USD LIBOR + 3.00%), 2/1/26 | | 716 | 714,390 |
| | | | $ 2,711,289 |
29
See Notes to Financial Statements.
Eaton Vance
Limited Duration Income Fund
March 31, 2023
Portfolio of Investments — continued
| Borrower/Description | Principal
Amount*
(000's omitted) | Value |
| Beverages — 0.0%(10) |
| City Brewing Company, LLC, Term Loan, 8.33%, (3 mo. USD LIBOR + 3.50%), 4/5/28 | | 640 | $ 270,777 |
| | | | $ 270,777 |
| Biotechnology — 0.1% |
| Alkermes, Inc., Term Loan, 7.21%, (1 mo. USD LIBOR + 2.50%), 3/12/26 | | 1,085 | $ 1,062,943 |
| Alltech, Inc., Term Loan, 8.84%, (1 mo. USD LIBOR + 4.00%), 10/13/28 | | 469 | 455,773 |
| | | | $ 1,518,716 |
| Building Products — 0.3% |
| LHS Borrower, LLC, Term Loan, 9.657%, (SOFR + 4.75%), 2/16/29 | | 1,836 | $ 1,492,116 |
| Oscar AcquisitionCo, LLC, Term Loan, 9.498%, (SOFR + 4.50%), 4/29/29 | | 896 | 865,556 |
| Standard Industries, Inc., Term Loan, 7.116%, (SOFR + 2.00%), 9/22/28 | | 1,114 | 1,110,774 |
| | | | $ 3,468,446 |
| Capital Markets — 1.4% |
| Advisor Group, Inc., Term Loan, 9.34%, (1 mo. USD LIBOR + 4.50%), 7/31/26 | | 1,137 | $ 1,122,197 |
| Andromeda Investissements, Term Loan, 5.957%, (3 mo. EURIBOR + 3.00%), 6/12/26 | EUR | 1,250 | 1,352,236 |
| Aretec Group, Inc.: | | | |
| Term Loan, 9.157%, (SOFR + 4.25%), 10/1/25 | | 2,306 | 2,295,928 |
| Term Loan, 3/8/30(22) | | 725 | 715,484 |
| Brookfield Property REIT, Inc., Term Loan, 7.407%, (SOFR + 2.50%), 8/27/25 | | 773 | 761,484 |
| CeramTec AcquiCo GmbH, Term Loan, 6.448%, (3 mo. EURIBOR + 3.75%), 3/16/29 | EUR | 760 | 786,877 |
| EIG Management Company, LLC, Term Loan, 8.557%, (1 mo. USD LIBOR + 3.75%), 2/22/25 | | 261 | 260,270 |
| FinCo I, LLC, Term Loan, 7.14%, (1 mo. USD LIBOR + 2.30%), 6/27/25 | | 638 | 638,511 |
| Focus Financial Partners, LLC, Term Loan, 8.057%, (SOFR + 3.25%), 6/30/28 | | 3,239 | 3,215,197 |
| Franklin Square Holdings, L.P., Term Loan, 7.125%, (1 mo. USD LIBOR + 2.25%), 8/1/25 | | 525 | 523,934 |
| Greenhill & Co., Inc., Term Loan, 8.203%, (3 mo. USD LIBOR + 3.25%), 4/12/24 | | 882 | 864,612 |
| HighTower Holdings, LLC, Term Loan, 8.815%, (3 mo. USD LIBOR + 4.00%), 4/21/28 | | 748 | 708,826 |
| Hudson River Trading, LLC, Term Loan, 7.84%, (SOFR + 3.00%), 3/20/28 | | 2,183 | 2,051,584 |
| Borrower/Description | Principal
Amount*
(000's omitted) | Value |
| Capital Markets (continued) |
| Mariner Wealth Advisors, LLC, Term Loan, 8.404%, (SOFR + 3.25%), 8/18/28 | | 790 | $ 774,884 |
| Victory Capital Holdings, Inc., Term Loan, 6.954%, (SOFR + 2.25%), 7/1/26 | | 891 | 884,961 |
| | | | $ 16,956,985 |
| Chemicals — 2.1% |
| Aruba Investments, Inc., Term Loan, 6.928%, (1 mo. EURIBOR + 4.00%), 11/24/27 | EUR | 980 | $ 1,028,269 |
| Flint Group GmbH, Term Loan, 9.82%, (USD LIBOR + 4.25%), 9.07% cash, 0.75% PIK, 9/21/23 | | 21 | 14,550 |
| Flint Group US LLC, Term Loan, 9.82%, (3 mo. USD LIBOR + 4.25%), 9.07% cash, 0.75% PIK, 9/21/23 | | 127 | 87,953 |
| Groupe Solmax, Inc., Term Loan, 9.909%, (3 mo. USD LIBOR + 4.75%), 5/29/28 | | 197 | 177,293 |
| INEOS Enterprises Holdings II Limited, Term Loan, 5.948%, (3 mo. EURIBOR + 3.25%), 8/31/26 | EUR | 200 | 213,172 |
| INEOS Enterprises Holdings US Finco, LLC, Term Loan, 8.49%, (SOFR + 3.50%), 8/28/26 | | 218 | 216,189 |
| INEOS Finance PLC, Term Loan, 6.905%, (1 mo. EURIBOR + 4.00%), 4/1/24 | EUR | 1,194 | 1,293,373 |
| INEOS Quattro Holdings UK Ltd.: | | | |
| Term Loan, 5.655%, (1 mo. EURIBOR + 2.75%), 1/29/26 | EUR | 1,000 | 1,048,350 |
| Term Loan, 8.657%, (SOFR + 3.75%), 3/14/30 | | 425 | 423,406 |
| INEOS Styrolution Group GmbH, Term Loan, 4.905%, (1 mo. EURIBOR + 2.00%), 1/29/27 | EUR | 1,000 | 1,034,342 |
| INEOS Styrolution US Holding, LLC, Term Loan, 7.59%, (1 mo. USD LIBOR + 2.75%), 1/29/26 | | 2,309 | 2,289,393 |
| INEOS US Finance, LLC: | | | |
| Term Loan, 7.407%, (SOFR + 2.50%), 11/8/28 | | 617 | 608,319 |
| Term Loan, 8.376%, (SOFR + 3.50%), 2/18/30 | | 775 | 770,883 |
| Term Loan, 8.556%, (SOFR + 3.75%), 11/8/27 | | 1,021 | 1,020,131 |
| Kraton Corporation, Term Loan, 8.544%, (SOFR + 3.25%), 3/15/29 | | 446 | 444,317 |
| Kraton Polymers Holdings B.V., Term Loan, 6.25%, (3 mo. EURIBOR + 3.25%), 3/15/29 | EUR | 500 | 528,694 |
| Lonza Group AG: | | | |
| Term Loan, 7.015%, (3 mo. EURIBOR + 4.00%), 7/3/28 | EUR | 1,000 | 1,001,468 |
| Term Loan, 9.159%, (3 mo. USD LIBOR + 4.00%), 7/3/28 | | 1,722 | 1,602,952 |
| LSF11 Skyscraper Holdco S.a.r.l., Term Loan, 6.405%, (1 mo. EURIBOR + 3.50%), 9/29/27 | EUR | 1,000 | 1,082,466 |
| Messer Industries GmbH, Term Loan, 7.66%, (SOFR + 2.50%), 3/2/26 | | 1,202 | 1,201,111 |
30
See Notes to Financial Statements.
Eaton Vance
Limited Duration Income Fund
March 31, 2023
Portfolio of Investments — continued
| Borrower/Description | Principal
Amount*
(000's omitted) | Value |
| Chemicals (continued) |
| Momentive Performance Materials, Inc., Term Loan, 3/31/28(22) | | 800 | $ 781,000 |
| Olympus Water US Holding Corporation, Term Loan, 9.498%, (SOFR + 4.50%), 11/9/28 | | 371 | 356,632 |
| Orion Engineered Carbons GmbH: | | | |
| Term Loan, 5.515%, (3 mo. EURIBOR + 2.50%), 9/24/28 | EUR | 1,000 | 1,074,333 |
| Term Loan, 7.409%, (3 mo. USD LIBOR + 2.25%), 9/24/28 | | 369 | 362,564 |
| Rohm Holding GmbH: | | | |
| Term Loan, 7.442%, (6 mo. EURIBOR + 4.50%), 7/31/26 | EUR | 500 | 467,239 |
| Term Loan, 10.102%, (6 mo. USD LIBOR + 5.00%), 7/31/26 | | 923 | 782,620 |
| SCUR-Alpha 1503 GmbH, Term Loan, 3/30/30(22) | | 925 | 832,500 |
| Starfruit Finco B.V., Term Loan, 7.526%, (SOFR + 2.75%), 10/1/25 | | 2,241 | 2,227,611 |
| Tronox Finance, LLC, Term Loan, 7.078%, (USD LIBOR + 2.25%), 3/10/28(21) | | 1,318 | 1,291,941 |
| W.R. Grace & Co.-Conn., Term Loan, 8.938%, (3 mo. USD LIBOR + 3.75%), 9/22/28 | | 1,111 | 1,105,152 |
| | | | $ 25,368,223 |
| Commercial Services & Supplies — 1.5% |
| Allied Universal Holdco, LLC: | | | |
| Term Loan, 6.655%, (1 mo. EURIBOR + 3.75%), 5/12/28 | EUR | 985 | $ 1,006,141 |
| Term Loan, 8.657%, (SOFR + 3.75%), 5/12/28 | | 2,699 | 2,565,935 |
| Aramark Services, Inc., Term Loan, 6.59%, (1 mo. USD LIBOR + 1.75%), 3/11/25 | | 933 | 931,264 |
| Asplundh Tree Expert, LLC, Term Loan, 6.59%, (1 mo. USD LIBOR + 1.75%), 9/7/27 | | 1,097 | 1,092,591 |
| EnergySolutions, LLC, Term Loan, 8.909%, (3 mo. USD LIBOR + 3.75%), 5/9/25 | | 4,710 | 4,580,048 |
| Harsco Corporation, Term Loan, 7.172%, (SOFR + 2.25%), 3/10/28 | | 393 | 378,385 |
| LABL, Inc., Term Loan, 9.84%, (1 mo. USD LIBOR + 5.00%), 10/29/28 | | 716 | 694,410 |
| Monitronics International, Inc., Term Loan, 12.325%, (3 mo. USD LIBOR + 7.50%), 3/29/24 | | 1,952 | 819,938 |
| PECF USS Intermediate Holding III Corporation, Term Loan, 9.09%, (1 mo. USD LIBOR + 4.25%), 12/15/28 | | 642 | 543,187 |
| Phoenix Services International, LLC: | | | |
| DIP Loan, 14.759%, (SOFR + 12.00%), 5/29/23(21) | | 101 | 96,696 |
| DIP Loan, 16.806%, (SOFR + 12.00%), 5/29/23 | | 210 | 201,411 |
| Term Loan, 0.00%, 3/1/25(19) | | 664 | 76,156 |
| Borrower/Description | Principal
Amount*
(000's omitted) | Value |
| Commercial Services & Supplies (continued) |
| Prime Security Services Borrower, LLC, Term Loan, 7.517%, (3 mo. USD LIBOR + 2.75%), 9/23/26 | | 1,513 | $ 1,510,350 |
| SITEL Group, Term Loan, 6.66%, (1 mo. EURIBOR + 3.75%), 8/28/28 | EUR | 500 | 524,966 |
| SITEL Worldwide Corporation, Term Loan, 8.60%, (1 mo. USD LIBOR + 3.75%), 8/28/28 | | 1,872 | 1,852,396 |
| Tempo Acquisition, LLC, Term Loan, 7.807%, (SOFR + 3.00%), 8/31/28 | | 831 | 830,681 |
| | | | $ 17,704,555 |
| Communications Equipment — 0.2% |
| CommScope, Inc., Term Loan, 8.09%, (1 mo. USD LIBOR + 3.25%), 4/6/26 | | 1,761 | $ 1,698,751 |
| Digi International, Inc., Term Loan, 9.84%, (1 mo. USD LIBOR + 5.00%), 11/1/28 | | 378 | 377,180 |
| | | | $ 2,075,931 |
| Construction Materials — 0.4% |
| Quikrete Holdings, Inc.: | | | |
| Term Loan, 7.465%, (1 mo. USD LIBOR + 2.625%), 2/1/27 | | 2,907 | $ 2,862,637 |
| Term Loan, 7.84%, (1 mo. USD LIBOR + 3.00%), 3/18/29 | | 2,153 | 2,132,256 |
| | | | $ 4,994,893 |
| Containers & Packaging — 0.8% |
| Berlin Packaging, LLC, Term Loan, 8.445%, (USD LIBOR + 3.75%), 3/11/28(21) | | 1,231 | $ 1,215,860 |
| Clydesdale Acquisition Holdings, Inc., Term Loan, 9.082%, (SOFR + 4.175%), 4/13/29 | | 571 | 559,014 |
| Kouti B.V., Term Loan, 5.873%, (3 mo. EURIBOR + 3.175%), 8/31/28 | EUR | 2,000 | 2,040,894 |
| Pregis TopCo Corporation, Term Loan, 8.672%, (SOFR + 3.75%), 7/31/26 | | 629 | 615,249 |
| Pretium PKG Holdings, Inc.: | | | |
| Term Loan, 8.843%, (3 mo. USD LIBOR + 4.00%), 10/2/28 | | 617 | 490,003 |
| Term Loan - Second Lien, 11.648%, (3 mo. USD LIBOR + 6.75%), 10/1/29 | | 350 | 224,766 |
| Proampac PG Borrower, LLC, Term Loan, 8.429%, (3 mo. USD LIBOR + 3.75%), 11/3/25 | | 565 | 554,770 |
| Reynolds Group Holdings, Inc.: | | | |
| Term Loan, 8.09%, (1 mo. USD LIBOR + 3.25%), 2/5/26 | | 1,228 | 1,224,945 |
| Term Loan, 8.09%, (1 mo. USD LIBOR + 3.25%), 9/24/28 | | 960 | 948,885 |
| Trident TPI Holdings, Inc.: | | | |
| Term Loan, 8.09%, (1 mo. USD LIBOR + 3.25%), 10/17/24 | | 807 | 802,026 |
31
See Notes to Financial Statements.
Eaton Vance
Limited Duration Income Fund
March 31, 2023
Portfolio of Investments — continued
| Borrower/Description | Principal
Amount*
(000's omitted) | Value |
| Containers & Packaging (continued) |
| Trident TPI Holdings, Inc.: (continued) | | | |
| Term Loan, 9.159%, (3 mo. USD LIBOR + 4.00%), 9/15/28 | | 788 | $ 767,263 |
| | | | $ 9,443,675 |
| Distributors — 0.1% |
| Autokiniton US Holdings, Inc., Term Loan, 9.422%, (SOFR + 4.50%), 4/6/28 | | 516 | $ 502,015 |
| Phillips Feed Service, Inc., Term Loan, 11.779%, (1 mo. USD LIBOR + 7.00%), 11/13/24(11) | | 106 | 85,022 |
| Winterfell Financing S.a.r.l., Term Loan, 5/4/28(22) | EUR | 500 | 526,999 |
| | | | $ 1,114,036 |
| Diversified Consumer Services — 0.3% |
| Ascend Learning, LLC, Term Loan, 8.407%, (SOFR + 3.50%), 12/11/28 | | 642 | $ 595,472 |
| KUEHG Corp.: | | | |
| Term Loan, 8.909%, (3 mo. USD LIBOR + 3.75%), 2/21/25 | | 2,219 | 2,184,769 |
| Term Loan - Second Lien, 13.409%, (3 mo. USD LIBOR + 8.25%), 8/22/25 | | 425 | 414,375 |
| Sotheby's, Term Loan, 9.33%, (3 mo. USD LIBOR + 4.50%), 1/15/27 | | 440 | 439,926 |
| | | | $ 3,634,542 |
| Diversified Financial Services — 0.2% |
| Concorde Midco Ltd., Term Loan, 6.132%, (3 mo. EURIBOR + 4.00%), 3/1/28 | EUR | 1,000 | $ 1,047,898 |
| Sandy BidCo B.V., Term Loan, 6.038%, (6 mo. EURIBOR + 4.00%), 8/17/29 | EUR | 1,000 | 1,055,354 |
| Zephyr Bidco Limited, Term Loan, 8.709%, (SONIA + 4.782%), 7/23/25 | GBP | 775 | 891,507 |
| | | | $ 2,994,759 |
| Diversified Telecommunication Services — 2.6% |
| Altice France S.A., Term Loan, 10.17%, (SOFR + 5.50%), 8/15/28 | | 1,076 | $ 1,025,247 |
| CenturyLink, Inc., Term Loan, 7.172%, (SOFR + 2.25%), 3/15/27 | | 2,520 | 1,678,205 |
| eircom Finco S.a.r.l., Term Loan, 5.823%, (1 mo. EURIBOR + 3.25%), 5/15/26 | EUR | 1,786 | 1,910,051 |
| GEE Holdings 2, LLC: | | | |
| Term Loan, 13.018%, (3 mo. USD LIBOR + 8.00%), 3/24/25 | | 329 | 322,237 |
| Term Loan - Second Lien, 13.268%, (3 mo. USD LIBOR + 8.25%), 3/23/26 | | 725 | 447,975 |
| Telenet International Finance S.a.r.l., Term Loan, 4.896%, (1 mo. EURIBOR + 2.25%), 4/30/29 | EUR | 1,750 | 1,832,279 |
| Borrower/Description | Principal
Amount*
(000's omitted) | Value |
| Diversified Telecommunication Services (continued) |
| UPC Broadband Holding B.V.: | | | |
| Term Loan, 5.146%, (1 mo. EURIBOR + 2.50%), 4/30/29 | EUR | 1,500 | $ 1,579,981 |
| Term Loan, 5.571%, (1 mo. EURIBOR + 2.925%), 1/31/29 | EUR | 3,000 | 3,184,363 |
| Term Loan, 6.934%, (1 mo. USD LIBOR + 2.25%), 4/30/28 | | 900 | 884,531 |
| UPC Financing Partnership, Term Loan, 7.609%, (1 mo. USD LIBOR + 2.925%), 1/31/29 | | 3,025 | 2,984,919 |
| Virgin Media Bristol, LLC, Term Loan, 7.934%, (1 mo. USD LIBOR + 3.25%), 1/31/29 | | 1,150 | 1,140,554 |
| Virgin Media Ireland Limited, Term Loan, 6.109%, (1 mo. EURIBOR + 3.4625%), 7/15/29 | EUR | 1,000 | 1,047,681 |
| Virgin Media SFA Finance Limited: | | | |
| Term Loan, 5.146%, (1 mo. EURIBOR + 2.50%), 1/31/29 | EUR | 1,300 | 1,369,023 |
| Term Loan, 7.21%, (SONIA + 3.25%), 11/15/27 | GBP | 1,500 | 1,744,773 |
| Zayo Group Holdings, Inc.: | | | |
| Term Loan, 6.155%, (1 mo. EURIBOR + 3.25%), 3/9/27 | EUR | 970 | 876,748 |
| Term Loan, 7.84%, (1 mo. USD LIBOR + 3.00%), 3/9/27 | | 2,171 | 1,764,912 |
| Ziggo B.V., Term Loan, 6.102%, (6 mo. EURIBOR + 3.00%), 1/31/29 | EUR | 3,750 | 3,847,149 |
| Ziggo Financing Partnership, Term Loan, 7.184%, (1 mo. USD LIBOR + 2.50%), 4/30/28 | | 4,150 | 4,104,607 |
| | | | $ 31,745,235 |
| Electrical Equipment — 0.0%(10) |
| AZZ, Inc., Term Loan, 9.157%, (SOFR + 4.25%), 5/13/29 | | 357 | $ 356,774 |
| | | | $ 356,774 |
| Electronic Equipment, Instruments & Components — 0.6% |
| Chamberlain Group, Inc., Term Loan, 8.09%, (1 mo. USD LIBOR + 3.25%), 11/3/28 | | 1,531 | $ 1,473,227 |
| Creation Technologies, Inc., Term Loan, 10.282%, (3 mo. USD LIBOR + 5.50%), 10/5/28 | | 968 | 841,888 |
| II-VI Incorporated, Term Loan, 7.672%, (SOFR + 2.75%), 7/2/29 | | 956 | 948,546 |
| Minimax Viking GmbH, Term Loan, 5.655%, (1 mo. EURIBOR + 2.75%), 7/31/25 | EUR | 945 | 1,021,642 |
| Mirion Technologies, Inc., Term Loan, 7.96%, (6 mo. USD LIBOR + 2.75%), 10/20/28 | | 588 | 585,008 |
| Robertshaw US Holding Corp., Term Loan, 8.688%, (3 mo. USD LIBOR + 3.50%), 2/28/25 | | 998 | 575,225 |
32
See Notes to Financial Statements.
Eaton Vance
Limited Duration Income Fund
March 31, 2023
Portfolio of Investments — continued
| Borrower/Description | Principal
Amount*
(000's omitted) | Value |
| Electronic Equipment, Instruments & Components (continued) |
| Verifone Systems, Inc., Term Loan, 8.958%, (3 mo. USD LIBOR + 4.00%), 8/20/25 | | 1,222 | $ 1,057,453 |
| Verisure Holding AB, Term Loan, 6.262%, (3 mo. EURIBOR + 3.25%), 3/27/28 | EUR | 1,000 | 1,044,340 |
| | | | $ 7,547,329 |
| Energy Equipment & Services — 0.1% |
| Ameriforge Group, Inc.: | | | |
| Term Loan, 16.101%, (1 mo. USD LIBOR + 13.00%), 2/1/26(23) | | 108 | $ 53,654 |
| Term Loan, 18.159%, (3 mo. USD LIBOR + 13.00%), 13.159% cash, 5.00% PIK, 2/1/26 | | 851 | 422,269 |
| Lealand Finance Company B.V., Term Loan, 8.84%, (1 mo. USD LIBOR + 4.00%), 5.84% cash, 3.00% PIK, 6/30/25 | | 229 | 153,376 |
| | | | $ 629,299 |
| Engineering & Construction — 0.4% |
| Aegion Corporation, Term Loan, 9.59%, (1 mo. USD LIBOR + 4.75%), 5/17/28 | | 468 | $ 458,224 |
| Amentum Government Services Holdings, LLC: | | | |
| Term Loan, 8.84%, (1 mo. USD LIBOR + 4.00%), 1/29/27 | | 997 | 978,122 |
| Term Loan, 8.906%, (SOFR + 4.00%), 2/15/29 | | 744 | 729,953 |
| American Residential Services, LLC, Term Loan, 8.659%, (3 mo. USD LIBOR + 3.50%), 10/15/27 | | 562 | 556,442 |
| APi Group DE, Inc., Term Loan, 7.34%, (1 mo. USD LIBOR + 2.50%), 10/1/26 | | 1,305 | 1,303,662 |
| Northstar Group Services, Inc., Term Loan, 10.422%, (1 mo. USD LIBOR + 5.50%), 11/12/26 | | 216 | 214,128 |
| | | | $ 4,240,531 |
| Entertainment — 1.1% |
| AMC Entertainment Holdings, Inc., Term Loan, 7.684%, (1 mo. USD LIBOR + 3.00%), 4/22/26 | | 1,800 | $ 1,306,876 |
| City Football Group Limited, Term Loan, 7.779%, (1 mo. USD LIBOR + 3.00%), 7/21/28 | | 1,358 | 1,308,592 |
| Crown Finance US, Inc.: | | | |
| DIP Loan, 14.674%, (SOFR + 10.00%), 9/7/23(21) | | 1,265 | 1,286,320 |
| Term Loan, 0.00%, 9/30/26(19) | | 1,500 | 233,924 |
| EP Purchaser, LLC, Term Loan, 8.659%, (3 mo. USD LIBOR + 3.50%), 11/6/28 | | 421 | 419,172 |
| Playtika Holding Corp., Term Loan, 7.59%, (1 mo. USD LIBOR + 2.75%), 3/13/28 | | 2,170 | 2,158,965 |
| Renaissance Holding Corp.: | | | |
| Term Loan, 8.09%, (1 mo. USD LIBOR + 3.25%), 4/5/30 | | 2,628 | 2,561,040 |
| Term Loan, 9.234%, (SOFR + 4.50%), 4/1/27 | | 174 | 173,427 |
| Borrower/Description | Principal
Amount*
(000's omitted) | Value |
| Entertainment (continued) |
| Renaissance Holding Corp.: (continued) | | | |
| Term Loan - Second Lien, 11.84%, (1 mo. USD LIBOR + 7.00%), 5/29/26 | | 200 | $ 194,000 |
| UFC Holdings, LLC, Term Loan, 7.57%, (3 mo. USD LIBOR + 2.75%), 4/29/26 | | 2,760 | 2,746,682 |
| Vue International Bidco PLC: | | | |
| Term Loan, 10.846%, (3 mo. EURIBOR + 8.00%), 4.346% cash, 6.50% PIK, 12/31/27 | EUR | 807 | 494,559 |
| Term Loan, 11.086%, (6 mo. EURIBOR + 8.00%), 6/30/27 | EUR | 121 | 116,295 |
| | | | $ 12,999,852 |
| Equity Real Estate Investment Trusts (REITs) — 0.1% |
| Iron Mountain, Inc., Term Loan, 6.59%, (1 mo. USD LIBOR + 1.75%), 1/2/26 | | 879 | $ 874,356 |
| | | | $ 874,356 |
| Financial Services — 0.0%(10) |
| Ditech Holding Corporation, Term Loan, 0.00%, 6/30/23(19) | | 2,331 | $ 256,463 |
| | | | $ 256,463 |
| Food & Staples Retailing — 0.1% |
| US Foods, Inc., Term Loan, 6.84%, (1 mo. USD LIBOR + 2.00%), 9/13/26 | | 1,435 | $ 1,429,866 |
| | | | $ 1,429,866 |
| Food Products — 1.1% |
| 8th Avenue Food & Provisions, Inc., Term Loan, 9.59%, (1 mo. USD LIBOR + 4.75%), 10/1/25 | | 591 | $ 527,837 |
| Badger Buyer Corp., Term Loan, 8.34%, (1 mo. USD LIBOR + 3.50%), 9/30/24 | | 378 | 309,960 |
| CHG PPC Parent, LLC: | | | |
| Term Loan, 6.405%, (1 mo. EURIBOR + 3.50%), 3/31/25 | EUR | 2,000 | 2,117,486 |
| Term Loan, 7.875%, (1 mo. USD LIBOR + 3.00%), 12/8/28 | | 470 | 466,135 |
| Del Monte Foods, Inc., Term Loan, 9.109%, (SOFR + 4.25%), 5/16/29 | | 449 | 438,326 |
| Froneri International, Ltd.: | | | |
| Term Loan, 5.067%, (6 mo. EURIBOR + 2.125%), 1/29/27 | EUR | 1,275 | 1,317,403 |
| Term Loan, 7.409%, (3 mo. USD LIBOR + 2.25%), 1/29/27 | | 2,140 | 2,111,727 |
| Monogram Food Solutions, LLC, Term Loan, 8.875%, (1 mo. USD LIBOR + 4.00%), 8/28/28 | | 543 | 524,116 |
| Nomad Foods Europe Midco Limited, Term Loan, 5.318%, (6 mo. EURIBOR + 2.50%), 6/24/28 | EUR | 3,000 | 3,242,314 |
33
See Notes to Financial Statements.
Eaton Vance
Limited Duration Income Fund
March 31, 2023
Portfolio of Investments — continued
| Borrower/Description | Principal
Amount*
(000's omitted) | Value |
| Food Products (continued) |
| Shearer's Foods, Inc., Term Loan, 8.34%, (1 mo. USD LIBOR + 3.50%), 9/23/27 | | 390 | $ 382,344 |
| Sovos Brands Intermediate, Inc., Term Loan, 8.325%, (3 mo. USD LIBOR + 3.50%), 6/8/28 | | 497 | 489,142 |
| United Petfood Group B.V., Term Loan, 5.501%, (3 mo. EURIBOR + 3.00%), 4/23/28 | EUR | 750 | 774,739 |
| Valeo F1 Company Limited (Ireland), Term Loan, 7.239%, (6 mo. EURIBOR + 4.00%), 9/29/28 | EUR | 1,000 | 908,269 |
| | | | $ 13,609,798 |
| Health Care Equipment & Supplies — 0.3% |
| Artivion, Inc., Term Loan, 8.66%, (SOFR + 3.50%), 6/1/27 | | 521 | $ 484,429 |
| Bayou Intermediate II, LLC, Term Loan, 9.296%, (3 mo. USD LIBOR + 4.50%), 8/2/28 | | 741 | 711,000 |
| Journey Personal Care Corp., Term Loan, 9.409%, (3 mo. USD LIBOR + 4.25%), 3/1/28 | | 1,529 | 1,191,499 |
| Medline Borrower, L.P., Term Loan, 6.405%, (1 mo. EURIBOR + 3.50%), 10/23/28 | EUR | 1,000 | 1,055,218 |
| | | | $ 3,442,146 |
| Health Care Providers & Services — 2.9% |
| AEA International Holdings (Lux) S.a.r.l., Term Loan, 8.938%, (3 mo. USD LIBOR + 3.75%), 9/7/28 | | 1,062 | $ 1,057,582 |
| Biogroup-LCD, Term Loan, 5.602%, (3 mo. EURIBOR + 3.00%), 2/9/28 | EUR | 750 | 745,466 |
| BW NHHC Holdco, Inc., Term Loan - Second Lien, 12.876%, (SOFR + 8.00%), 1/15/26 | | 3,705 | 2,667,428 |
| CCRR Parent, Inc., Term Loan, 8.60%, (1 mo. USD LIBOR + 3.75%), 3/6/28 | | 515 | 504,572 |
| Cerba Healthcare S.A.S., Term Loan, 6.155%, (1 mo. EURIBOR + 3.25%), 6/30/28 | EUR | 1,250 | 1,237,250 |
| CHG Healthcare Services, Inc., Term Loan, 8.09%, (1 mo. USD LIBOR + 3.25%), 9/29/28 | | 1,084 | 1,073,935 |
| CNT Holdings I Corp., Term Loan, 8.125%, (SOFR + 3.50%), 11/8/27 | | 686 | 675,367 |
| Covis Finco S.a.r.l., Term Loan, 11.548%, (SOFR + 6.50%), 2/18/27 | | 903 | 516,681 |
| Dedalus Finance GmbH, Term Loan, 5.782%, (6 mo. EURIBOR + 3.75%), 7/17/27 | EUR | 500 | ���476,276 |
| Electron BidCo, Inc., Term Loan, 7.84%, (1 mo. USD LIBOR + 3.00%), 11/1/28 | | 792 | 782,298 |
| Elsan S.A.S., Term Loan, 6.103%, (3 mo. EURIBOR + 3.35%), 6/16/28 | EUR | 1,500 | 1,556,935 |
| Ensemble RCM, LLC, Term Loan, 8.526%, (SOFR + 3.75%), 8/3/26 | | 1,313 | 1,313,237 |
| Envision Healthcare Corporation: | | | |
| Term Loan, 12.923%, (SOFR + 7.875%), 3/31/27 | | 1,023 | 895,464 |
| Borrower/Description | Principal
Amount*
(000's omitted) | Value |
| Health Care Providers & Services (continued) |
| Envision Healthcare Corporation: (continued) | | | |
| Term Loan - Second Lien, 9.148%, (SOFR + 4.25%), 3/31/27 | | 7,224 | $ 2,004,531 |
| IVC Acquisition, Ltd., Term Loan, 7.703%, (SONIA + 4.50%), 2/13/26 | GBP | 1,000 | 1,149,304 |
| LSCS Holdings, Inc., Term Loan, 9.34%, (1 mo. USD LIBOR + 4.50%), 12/16/28 | | 716 | 687,300 |
| Medical Solutions Holdings, Inc., Term Loan, 8.24%, (SOFR + 3.25%), 11/1/28 | | 1,461 | 1,421,200 |
| Mehilainen Yhtiot Oy, Term Loan, 6.54%, (3 mo. EURIBOR + 3.525%), 8/8/25 | EUR | 1,000 | 1,046,090 |
| Midwest Physician Administrative Services, LLC, Term Loan, 8.409%, (3 mo. USD LIBOR + 3.25%), 3/12/28 | | 466 | 438,007 |
| National Mentor Holdings, Inc.: | | | |
| Term Loan, 8.676%, (SOFR + 3.75%), 3/2/28(21) | | 2,041 | 1,575,671 |
| Term Loan, 8.748%, (SOFR + 3.75%), 3/2/28 | | 58 | 45,015 |
| Option Care Health, Inc., Term Loan, 7.59%, (1 mo. USD LIBOR + 2.75%), 10/27/28 | | 420 | 418,533 |
| Pacific Dental Services, LLC, Term Loan, 8.279%, (1 mo. USD LIBOR + 3.50%), 5/5/28 | | 491 | 488,333 |
| Pediatric Associates Holding Company, LLC: | | | |
| Term Loan, 7.36%, 12/29/28(23) | | 72 | 70,573 |
| Term Loan, 8.09%, (1 mo. USD LIBOR + 3.25%), 12/29/28 | | 473 | 463,842 |
| PetVet Care Centers, LLC, Term Loan, 8.34%, (1 mo. USD LIBOR + 3.50%), 2/14/25 | | 148 | 143,550 |
| Phoenix Guarantor, Inc.: | | | |
| Term Loan, 8.09%, (1 mo. USD LIBOR + 3.25%), 3/5/26 | | 1,877 | 1,832,023 |
| Term Loan, 8.34%, (1 mo. USD LIBOR + 3.50%), 3/5/26 | | 1,297 | 1,265,940 |
| Radiology Partners, Inc., Term Loan, 9.09%, (1 mo. USD LIBOR + 4.25%), 7/9/25 | | 1,197 | 970,380 |
| Radnet Management, Inc., Term Loan, 7.922%, (1 mo. USD LIBOR + 3.00%), 4/21/28 | | 1,007 | 1,002,782 |
| Ramsay Generale de Sante S.A., Term Loan, 5.443%, (3 mo. EURIBOR + 3.05%), 4/22/27 | EUR | 500 | 539,539 |
| Select Medical Corporation, Term Loan, 7.35%, (1 mo. USD LIBOR + 2.50%), 3/6/25 | | 2,968 | 2,962,087 |
| Sound Inpatient Physicians, Term Loan, 7.825%, (3 mo. USD LIBOR + 3.00%), 6/27/25 | | 476 | 376,833 |
| Surgery Center Holdings, Inc., Term Loan, 8.46%, (1 mo. USD LIBOR + 3.75%), 8/31/26 | | 943 | 938,202 |
| Synlab Bondco PLC, Term Loan, 5.193%, (6 mo. EURIBOR + 2.50%), 7/1/27 | EUR | 500 | 536,488 |
| U.S. Anesthesia Partners, Inc., Term Loan, 8.912%, (1 mo. USD LIBOR + 4.25%), 10/1/28 | | 1,501 | 1,449,431 |
| | | | $ 35,328,145 |
34
See Notes to Financial Statements.
Eaton Vance
Limited Duration Income Fund
March 31, 2023
Portfolio of Investments — continued
| Borrower/Description | Principal
Amount*
(000's omitted) | Value |
| Health Care Technology — 0.6% |
| Bracket Intermediate Holding Corp., Term Loan, 9.038%, (3 mo. USD LIBOR + 4.25%), 9/5/25 | | 907 | $ 895,342 |
| GHX Ultimate Parent Corporation, Term Loan, 8.09%, (1 mo. USD LIBOR + 3.25%), 6/28/24 | | 921 | 917,056 |
| Imprivata, Inc., Term Loan, 9.057%, (SOFR + 4.25%), 12/1/27 | | 223 | 219,614 |
| MedAssets Software Intermediate Holdings, Inc., Term Loan, 8.84%, (1 mo. USD LIBOR + 4.00%), 12/18/28 | | 1,089 | 1,020,938 |
| Navicure, Inc., Term Loan, 8.84%, (1 mo. USD LIBOR + 4.00%), 10/22/26 | | 1,654 | 1,649,075 |
| Project Ruby Ultimate Parent Corp., Term Loan, 8.09%, (1 mo. USD LIBOR + 3.25%), 3/10/28 | | 1,029 | 994,592 |
| Verscend Holding Corp., Term Loan, 8.84%, (1 mo. USD LIBOR + 4.00%), 8/27/25 | | 2,196 | 2,196,515 |
| | | | $ 7,893,132 |
| Hotels, Restaurants & Leisure — 1.9% |
| Bally's Corporation, Term Loan, 7.959%, (1 mo. USD LIBOR + 3.25%), 10/2/28 | | 1,160 | $ 1,111,289 |
| Carnival Corporation: | | | |
| Term Loan, 6.655%, (1 mo. EURIBOR + 3.75%), 6/30/25 | EUR | 1,474 | 1,578,039 |
| Term Loan, 7.84%, (1 mo. USD LIBOR + 3.00%), 6/30/25 | | 1,264 | 1,250,343 |
| Term Loan, 8.09%, (1 mo. USD LIBOR + 3.25%), 10/18/28 | | 2,666 | 2,611,259 |
| ClubCorp Holdings, Inc., Term Loan, 7.59%, (1 mo. USD LIBOR + 2.75%), 9/18/24 | | 1,890 | 1,811,448 |
| Dave & Buster's, Inc., Term Loan, 9.938%, (SOFR + 5.00%), 6/29/29 | | 746 | 747,369 |
| Fertitta Entertainment, LLC, Term Loan, 8.807%, (SOFR + 4.00%), 1/27/29 | | 4,170 | 4,114,452 |
| Four Seasons Hotels Limited, Term Loan, 8.157%, (SOFR + 3.25%), 11/30/29 | | 1,019 | 1,020,192 |
| GVC Holdings (Gibraltar) Limited, Term Loan, 5.942%, (3 mo. EURIBOR + 3.75%), 6/30/28 | EUR | 1,804 | 1,956,167 |
| Hilton Grand Vacations Borrower, LLC, Term Loan, 7.84%, (1 mo. USD LIBOR + 3.00%), 8/2/28 | | 911 | 911,125 |
| IRB Holding Corp., Term Loan, 7.83%, (SOFR + 3.00%), 12/15/27 | | 298 | 292,936 |
| Oravel Stays Singapore Pte, Ltd., Term Loan, 13.27%, (3 mo. USD LIBOR + 8.25%), 6/23/26 | | 540 | 468,775 |
| Playa Resorts Holding B.V., Term Loan, 8.993%, (SOFR + 4.25%), 1/5/29 | | 1,322 | 1,315,699 |
| Scientific Games Holdings, L.P., Term Loan, 6.172%, (3 mo. EURIBOR + 4.00%), 4/4/29 | EUR | 1,000 | 1,058,065 |
| SeaWorld Parks & Entertainment, Inc., Term Loan, 7.875%, (1 mo. USD LIBOR + 3.00%), 8/25/28 | | 887 | 884,284 |
| Borrower/Description | Principal
Amount*
(000's omitted) | Value |
| Hotels, Restaurants & Leisure (continued) |
| SMG US Midco 2, Inc., Term Loan, 7.325%, (3 mo. USD LIBOR + 2.50%), 1/23/25 | | 238 | $ 235,934 |
| Stars Group Holdings B.V. (The), Term Loan, 7.409%, (3 mo. USD LIBOR + 2.25%), 7/21/26 | | 2,241 | 2,242,276 |
| | | | $ 23,609,652 |
| Household Durables — 1.5% |
| ACProducts, Inc., Term Loan, 9.409%, (3 mo. USD LIBOR + 4.25%), 5/17/28 | | 1,744 | $ 1,394,060 |
| Libbey Glass, Inc., Term Loan, 13.461%, (SOFR + 8.50%), 8.711% cash, 4.75% PIK, 11/22/27 | | 9,472 | 8,856,043 |
| Serta Simmons Bedding, LLC: | | | |
| Term Loan, 0.00%, 8/10/23(19) | | 2,430 | 2,387,180 |
| Term Loan - Second Lien, 0.00%, 8/10/23(19) | | 8,032 | 4,620,951 |
| Solis IV B.V., Term Loan, 6.67%, (3 mo. EURIBOR + 4.00%), 2/26/29 | EUR | 1,000 | 1,004,970 |
| | | | $ 18,263,204 |
| Household Products — 0.1% |
| Kronos Acquisition Holdings, Inc., Term Loan, 11.023%, (SOFR + 6.00%), 12/22/26 | | 395 | $ 384,137 |
| Nobel Bidco B.V., Term Loan, 5.942%, (6 mo. EURIBOR + 3.50%), 9/1/28 | EUR | 1,000 | 906,461 |
| | | | $ 1,290,598 |
| Industrial Conglomerates — 0.1% |
| Rain Carbon GmbH, Term Loan, 5.628%, (6 mo. EURIBOR + 2.75%), 1/16/25 | EUR | 1,025 | $ 1,079,654 |
| | | | $ 1,079,654 |
| Insurance — 1.9% |
| Alliant Holdings Intermediate, LLC, Term Loan, 8.347%, (SOFR + 3.50%), 11/5/27 | | 1,513 | $ 1,498,196 |
| AmWINS Group, Inc.: | | | |
| Term Loan, 7.109%, (1 mo. USD LIBOR + 2.25%), 2/19/28 | | 3,788 | 3,748,659 |
| Term Loan, 7.657%, (SOFR + 2.75%), 2/19/28 | | 673 | 664,265 |
| AssuredPartners, Inc., Term Loan, 8.34%, (1 mo. USD LIBOR + 3.50%), 2/12/27 | | 169 | 167,919 |
| Financiere CEP S.A.S., Term Loan, 6.765%, (3 mo. EURIBOR + 3.75%), 6/18/27 | EUR | 750 | 792,532 |
| Hub International Limited: | | | |
| Term Loan, 7.818%, (3 mo. USD LIBOR + 3.00%), 4/25/25 | | 4,953 | 4,944,837 |
| Term Loan, 8.058%, (3 mo. USD LIBOR + 3.25%), 4/25/25 | | 1,814 | 1,813,067 |
35
See Notes to Financial Statements.
Eaton Vance
Limited Duration Income Fund
March 31, 2023
Portfolio of Investments — continued
| Borrower/Description | Principal
Amount*
(000's omitted) | Value |
| Insurance (continued) |
| NFP Corp., Term Loan, 8.09%, (1 mo. USD LIBOR + 3.25%), 2/15/27 | | 3,091 | $ 3,022,070 |
| Ryan Specialty Group, LLC, Term Loan, 7.907%, (SOFR + 3.00%), 9/1/27 | | 1,682 | 1,682,576 |
| USI, Inc.: | | | |
| Term Loan, 8.409%, (3 mo. USD LIBOR + 3.25%), 12/2/26 | | 1,379 | 1,380,118 |
| Term Loan, 8.648%, (SOFR + 3.75%), 11/22/29 | | 3,072 | 3,068,223 |
| | | | $ 22,782,462 |
| Interactive Media & Services — 0.4% |
| Adevinta ASA: | | | |
| Term Loan, 6.015%, (3 mo. EURIBOR + 3.00%), 6/26/28 | EUR | 1,456 | $ 1,568,026 |
| Term Loan, 7.909%, (3 mo. USD LIBOR + 2.75%), 6/26/28 | | 295 | 293,276 |
| Buzz Finco, LLC: | | | |
| Term Loan, 7.609%, (1 mo. USD LIBOR + 2.75%), 1/29/27 | | 558 | 554,961 |
| Term Loan, 8.109%, (1 mo. USD LIBOR + 3.25%), 1/29/27 | | 60 | 60,239 |
| Foundational Education Group, Inc., Term Loan, 8.91%, (SOFR + 3.75%), 8/31/28 | | 543 | 491,528 |
| Getty Images, Inc., Term Loan, 9.493%, (SOFR + 4.50%), 2/19/26(21) | | 724 | 724,911 |
| Match Group, Inc., Term Loan, 6.713%, (3 mo. USD LIBOR + 1.75%), 2/13/27 | | 675 | 672,047 |
| | | | $ 4,364,988 |
| IT Services — 1.7% |
| Asurion, LLC: | | | |
| Term Loan, 8.09%, (1 mo. USD LIBOR + 3.25%), 12/23/26 | | 3,089 | $ 2,880,399 |
| Term Loan, 8.09%, (1 mo. USD LIBOR + 3.25%), 7/31/27 | | 1,088 | 1,000,776 |
| Term Loan, 8.907%, (SOFR + 4.00%), 8/19/28 | | 1,010 | 931,047 |
| Term Loan - Second Lien, 10.09%, (1 mo. USD LIBOR + 5.25%), 1/31/28 | | 1,350 | 1,131,891 |
| Cyxtera DC Holdings, Inc., Term Loan, 7.82%, (3 mo. USD LIBOR + 3.00%), 5/1/24 | | 895 | 731,074 |
| Endure Digital, Inc., Term Loan, 8.219%, (1 mo. USD LIBOR + 3.50%), 2/10/28 | | 2,751 | 2,565,308 |
| Gainwell Acquisition Corp., Term Loan, 8.998%, (SOFR + 4.00%), 10/1/27 | | 3,080 | 2,935,608 |
| Indy US Bidco, LLC, Term Loan, 6.655%, (1 mo. EURIBOR + 3.75%), 3/6/28 | EUR | 735 | 681,180 |
| Informatica, LLC, Term Loan, 7.625%, (1 mo. USD LIBOR + 2.75%), 10/27/28 | | 2,648 | 2,633,904 |
| Borrower/Description | Principal
Amount*
(000's omitted) | Value |
| IT Services (continued) |
| NAB Holdings, LLC, Term Loan, 8.048%, (SOFR + 3.00%), 11/23/28 | | 1,111 | $ 1,094,620 |
| Rackspace Technology Global, Inc., Term Loan, 7.595%, (3 mo. USD LIBOR + 2.75%), 2/15/28 | | 1,323 | 714,420 |
| Sedgwick Claims Management Services, Inc., Term Loan, 8.557%, (SOFR + 3.75%), 2/17/28 | | 1,224 | 1,211,250 |
| Skopima Merger Sub, Inc., Term Loan, 8.84%, (1 mo. USD LIBOR + 4.00%), 5/12/28 | | 1,478 | 1,381,463 |
| team.blue Finco S.a.r.l., Term Loan, 6.715%, (3 mo. EURIBOR + 3.70%), 3/30/28 | EUR | 1,000 | 1,034,794 |
| | | | $ 20,927,734 |
| Leisure Products — 0.2% |
| Accell Group N.V., Term Loan, 7.527%, (6 mo. EURIBOR + 4.50%), 6/14/29 | EUR | 500 | $ 508,133 |
| Amer Sports Oyj, Term Loan, 6.992%, (3 mo. EURIBOR + 4.50%), 3/30/26 | EUR | 1,550 | 1,642,943 |
| Fender Musical Instruments Corporation, Term Loan, 8.843%, (SOFR + 4.00%), 12/1/28 | | 321 | 293,087 |
| Topgolf Callaway Brands Corp., Term Loan, 8.26%, (SOFR + 3.50%), 3/15/30 | | 525 | 522,594 |
| | | | $ 2,966,757 |
| Life Sciences Tools & Services — 0.5% |
| Avantor Funding, Inc., Term Loan, 5.402%, (1 mo. EURIBOR + 2.50%), 6/12/28 | EUR | 983 | $ 1,059,749 |
| Catalent Pharma Solutions, Inc., Term Loan, 6.813%, (1 mo. USD LIBOR + 2.00%), 2/22/28 | | 818 | 813,052 |
| Curia Global, Inc., Term Loan, 8.526%, (SOFR + 3.75%), 8/30/26 | | 244 | 209,876 |
| IQVIA, Inc., Term Loan, 6.59%, (1 mo. USD LIBOR + 1.75%), 1/17/25 | | 1,363 | 1,363,956 |
| LGC Group Holdings, Ltd., Term Loan, 5.655%, (1 mo. EURIBOR + 2.75%), 4/21/27 | EUR | 1,000 | 1,022,819 |
| Loire Finco Luxembourg S.a.r.l., Term Loan, 7.84%, (1 mo. USD LIBOR + 3.00%), 4/21/27 | | 340 | 329,428 |
| Packaging Coordinators Midco, Inc., Term Loan, 8.659%, (3 mo. USD LIBOR + 3.50%), 11/30/27 | | 1,349 | 1,322,214 |
| | | | $ 6,121,094 |
| Machinery — 2.5% |
| AI Alpine AT Bidco GmbH, Term Loan, 4.731%, (6 mo. EURIBOR + 3.00%), 10/31/25 | EUR | 750 | $ 783,213 |
| Albion Financing 3 S.a.r.l.: | | | |
| Term Loan, 10.065%, (3 mo. USD LIBOR + 5.25%), 8/17/26 | | 1,531 | 1,486,620 |
| Term Loan, 10.347%, (SOFR + 5.50%), 8/17/26 | | 300 | 294,000 |
36
See Notes to Financial Statements.
Eaton Vance
Limited Duration Income Fund
March 31, 2023
Portfolio of Investments — continued
| Borrower/Description | Principal
Amount*
(000's omitted) | Value |
| Machinery (continued) |
| Alliance Laundry Systems, LLC, Term Loan, 8.306%, (3 mo. USD LIBOR + 3.50%), 10/8/27 | | 1,063 | $ 1,056,596 |
| American Trailer World Corp., Term Loan, 8.657%, (SOFR + 3.75%), 3/3/28 | | 612 | 533,162 |
| Apex Tool Group, LLC, Term Loan, 10.093%, (SOFR + 5.25%), 2/8/29 | | 3,337 | 2,955,030 |
| Conair Holdings, LLC, Term Loan, 8.909%, (3 mo. USD LIBOR + 3.75%), 5/17/28 | | 1,527 | 1,354,991 |
| CPM Holdings, Inc., Term Loan, 8.162%, (1 mo. USD LIBOR + 3.50%), 11/17/25 | | 311 | 310,796 |
| Delachaux Group S.A., Term Loan, 9.325%, (3 mo. USD LIBOR + 4.50%), 4/16/26 | | 444 | 426,360 |
| Engineered Machinery Holdings, Inc.: | | | |
| Term Loan, 6.765%, (3 mo. EURIBOR + 3.75%), 5/21/28 | EUR | 985 | 1,033,515 |
| Term Loan, 8.659%, (3 mo. USD LIBOR + 3.50%), 5/19/28 | | 2,336 | 2,309,178 |
| Filtration Group Corporation: | | | |
| Term Loan, 6.405%, (1 mo. EURIBOR + 3.50%), 3/29/25 | EUR | 1,347 | 1,453,222 |
| Term Loan, 8.34%, (1 mo. USD LIBOR + 3.50%), 10/21/28 | | 739 | 729,977 |
| Gates Global, LLC, Term Loan, 7.407%, (SOFR + 2.50%), 3/31/27 | | 3,929 | 3,915,263 |
| Icebox Holdco III, Inc., Term Loan, 8.659%, (3 mo. USD LIBOR + 3.50%), 12/22/28 | | 842 | 804,328 |
| Illuminate Buyer, LLC, Term Loan, 8.34%, (1 mo. USD LIBOR + 3.50%), 6/30/27 | | 744 | 731,391 |
| Penn Engineering & Manufacturing Corp., Term Loan, 5.155%, (1 mo. EURIBOR + 2.25%), 6/27/24 | EUR | 1,131 | 1,213,777 |
| Roper Industrial Products Investment Company, LLC: | | | |
| Term Loan, 8.015%, (3 mo. EURIBOR + 5.25%), 11/22/29 | EUR | 500 | 516,832 |
| Term Loan, 9.398%, (SOFR + 4.50%), 11/22/29 | | 600 | 596,400 |
| SPX Flow, Inc., Term Loan, 9.407%, (SOFR + 4.50%), 4/5/29 | | 1,176 | 1,127,881 |
| Titan Acquisition Limited, Term Loan, 8.151%, (6 mo. USD LIBOR + 3.00%), 3/28/25 | | 3,016 | 2,868,573 |
| TK Elevator Topco GmbH, Term Loan, 6.567%, (6 mo. EURIBOR + 3.625%), 7/30/27 | EUR | 1,000 | 1,047,446 |
| Vertical US Newco, Inc., Term Loan, 8.602%, (6 mo. USD LIBOR + 3.50%), 7/30/27 | | 1,198 | 1,169,908 |
| Zephyr German BidCo GmbH, Term Loan, 6.645%, (3 mo. EURIBOR + 3.60%), 3/10/28 | EUR | 1,500 | 1,508,810 |
| | | | $ 30,227,269 |
| Media — 1.2% |
| Axel Springer SE, Term Loan, 7.50%, (3 mo. EURIBOR + 4.75%), 12/18/26 | EUR | 1,000 | $ 1,060,551 |
| Borrower/Description | Principal
Amount*
(000's omitted) | Value |
| Media (continued) |
| Diamond Sports Group, LLC: | | | |
| Term Loan, 13.064%, (SOFR + 8.10%), 5/25/26 | | 506 | $ 474,808 |
| Term Loan - Second Lien, 8.025%, (SOFR + 3.25%), 8/24/26 | | 3,000 | 200,247 |
| Gray Television, Inc.: | | | |
| Term Loan, 7.358%, (SOFR + 2.50%), 1/2/26 | | 637 | 628,470 |
| Term Loan, 7.662%, (1 mo. USD LIBOR + 3.00%), 12/1/28 | | 938 | 913,304 |
| Hubbard Radio, LLC, Term Loan, 9.10%, (1 mo. USD LIBOR + 4.25%), 3/28/25 | | 635 | 557,332 |
| iHeartCommunications, Inc., Term Loan, 7.84%, (1 mo. USD LIBOR + 3.00%), 5/1/26 | | 444 | 394,296 |
| Magnite, Inc., Term Loan, 9.909%, (USD LIBOR + 5.00%), 4/28/28(21) | | 639 | 612,282 |
| MJH Healthcare Holdings, LLC, Term Loan, 8.407%, (SOFR + 3.50%), 1/28/29 | | 272 | 266,465 |
| Nexstar Broadcasting, Inc., Term Loan, 7.34%, (1 mo. USD LIBOR + 2.50%), 9/18/26 | | 267 | 266,731 |
| Recorded Books, Inc., Term Loan, 8.792%, (SOFR + 4.00%), 8/29/25 | | 1,660 | 1,656,080 |
| Sinclair Television Group, Inc.: | | | |
| Term Loan, 7.35%, (1 mo. USD LIBOR + 2.50%), 9/30/26 | | 627 | 577,070 |
| Term Loan, 7.85%, (1 mo. USD LIBOR + 3.00%), 4/1/28 | | 405 | 367,901 |
| Univision Communications, Inc., Term Loan, 8.09%, (1 mo. USD LIBOR + 3.25%), 3/15/26 | | 6,803 | 6,780,985 |
| | | | $ 14,756,522 |
| Metals/Mining — 0.2% |
| American Consolidated Natural Resources, Inc., Term Loan, 20.822%, (1 mo. USD LIBOR + 16.00%), 17.822% cash, 3.00% PIK,, 9/16/25 | | 45 | $ 44,997 |
| Dynacast International, LLC: | | | |
| Term Loan, 9.458%, (3 mo. USD LIBOR + 4.50%), 7/22/25 | | 1,048 | 958,633 |
| Term Loan, 13.958%, (3 mo. USD LIBOR + 9.00%), 10/22/25 | | 404 | 305,315 |
| WireCo WorldGroup, Inc., Term Loan, 9.063%, (1 mo. USD LIBOR + 4.25%), 11/13/28 | | 467 | 463,426 |
| Zekelman Industries, Inc., Term Loan, 7.018%, (3 mo. USD LIBOR + 2.00%), 1/24/27 | | 1,104 | 1,093,896 |
| | | | $ 2,866,267 |
| Oil, Gas & Consumable Fuels — 0.7% |
| Buckeye Partners, L.P., Term Loan, 7.09%, (1 mo. USD LIBOR + 2.25%), 11/1/26 | | 2,685 | $ 2,683,433 |
37
See Notes to Financial Statements.
Eaton Vance
Limited Duration Income Fund
March 31, 2023
Portfolio of Investments — continued
| Borrower/Description | Principal
Amount*
(000's omitted) | Value |
| Oil, Gas & Consumable Fuels (continued) |
| Centurion Pipeline Company, LLC: | | | |
| Term Loan, 7.754%, (1 mo. USD LIBOR + 4.00%), 9/28/25 | | 222 | $ 222,604 |
| Term Loan, 8.09%, (1 mo. USD LIBOR + 3.25%), 9/29/25 | | 266 | 266,561 |
| Freeport LNG Investments, LLP, Term Loan, 8.308%, (3 mo. USD LIBOR + 3.50%), 12/21/28 | | 663 | 643,859 |
| Matador Bidco S.a.r.l., Term Loan, 9.407%, (1 mo. USD LIBOR + 4.50%), 10/15/26 | | 1,695 | 1,686,060 |
| Oryx Midstream Services Permian Basin, LLC, Term Loan, 8.063%, (SOFR + 3.25%), 10/5/28 | | 1,031 | 1,016,448 |
| Oxbow Carbon, LLC, Term Loan, 9.409%, (3 mo. USD LIBOR + 4.25%), 10/17/25 | | 306 | 306,378 |
| QuarterNorth Energy Holding, Inc., Term Loan - Second Lien, 12.84%, (1 mo. USD LIBOR + 8.00%), 8/27/26 | | 782 | 779,856 |
| UGI Energy Services, LLC, Term Loan, 8.157%, (SOFR + 3.25%), 2/22/30 | | 1,484 | 1,470,675 |
| | | | $ 9,075,874 |
| Personal Products — 0.2% |
| HLF Financing S.a.r.l., Term Loan, 7.34%, (1 mo. USD LIBOR + 2.50%), 8/18/25 | | 963 | $ 955,522 |
| Rainbow Finco S.a.r.l., Term Loan, 6.697%, (6 mo. EURIBOR + 3.50%), 2/23/29 | EUR | 1,000 | 1,030,275 |
| Sunshine Luxembourg VII S.a.r.l., Term Loan, 8.909%, (3 mo. USD LIBOR + 3.75%), 10/1/26 | | 196 | 194,372 |
| | | | $ 2,180,169 |
| Pharmaceuticals — 1.3% |
| Aenova Holding GmbH, Term Loan, 7.332%, (6 mo. EURIBOR + 4.50%), 3/6/26 | EUR | 1,000 | $ 1,017,622 |
| AI Sirona (Luxembourg) Acquisition S.a.r.l., Term Loan, 6.155%, (1 mo. EURIBOR + 3.25%), 9/29/25 | EUR | 1,000 | 1,054,676 |
| Akorn, Inc., Term Loan, 12.254%, (3 mo. USD LIBOR + 7.50%), 10/1/25 | | 180 | 44,975 |
| Amneal Pharmaceuticals, LLC, Term Loan, 8.375%, (1 mo. USD LIBOR + 3.50%), 5/4/25 | | 1,781 | 1,696,073 |
| Bausch Health Companies, Inc., Term Loan, 10.093%, (SOFR + 5.25%), 2/1/27 | | 3,017 | 2,257,482 |
| Horizon Therapeutics USA, Inc.: | | | |
| Term Loan, 6.563%, (1 mo. USD LIBOR + 1.75%), 3/15/28 | | 1,911 | 1,909,123 |
| Term Loan, 6.813%, (1 mo. USD LIBOR + 2.00%), 5/22/26 | | 654 | 653,687 |
| Jazz Financing Lux S.a.r.l., Term Loan, 8.34%, (1 mo. USD LIBOR + 3.50%), 5/5/28 | | 1,439 | 1,435,557 |
| Borrower/Description | Principal
Amount*
(000's omitted) | Value |
| Pharmaceuticals (continued) |
| Mallinckrodt International Finance S.A.: | | | |
| Term Loan, 9.978%, (1 mo. USD LIBOR + 5.25%), 9/30/27 | | 3,318 | $ 2,429,926 |
| Term Loan, 10.228%, (1 mo. USD LIBOR + 5.50%), 9/30/27 | | 1,902 | 1,387,921 |
| PharmaZell GmbH, Term Loan, 7.015%, (3 mo. EURIBOR + 4.00%), 5/12/27 | EUR | 1,000 | 1,059,195 |
| Recipharm AB, Term Loan, 5.882%, (3 mo. EURIBOR + 3.20%), 2/17/28 | EUR | 1,000 | 1,013,747 |
| | | | $ 15,959,984 |
| Professional Services — 1.6% |
| AlixPartners, LLP: | | | |
| Term Loan, 6.24%, (3 mo. EURIBOR + 3.25%), 2/4/28 | EUR | 980 | $ 1,039,340 |
| Term Loan, 7.609%, (1 mo. USD LIBOR + 2.75%), 2/4/28 | | 1,397 | 1,393,632 |
| APFS Staffing Holdings, Inc., Term Loan, 8.705%, (SOFR + 4.00%), 12/29/28(21) | | 272 | 269,527 |
| Apleona Holding GmbH, Term Loan, 5.692%, (3 mo. EURIBOR + 3.20%), 4/28/28 | EUR | 1,000 | 1,037,731 |
| Camelot U.S. Acquisition, LLC: | | | |
| Term Loan, 7.84%, (1 mo. USD LIBOR + 3.00%), 10/30/26 | | 1,526 | 1,521,995 |
| Term Loan, 7.84%, (1 mo. USD LIBOR + 3.00%), 10/30/26 | | 896 | 894,870 |
| CoreLogic, Inc., Term Loan, 8.375%, (1 mo. USD LIBOR + 3.50%), 6/2/28 | | 3,881 | 3,320,744 |
| Corporation Service Company, Term Loan, 8.157%, (SOFR + 3.25%), 11/2/29 | | 335 | 334,915 |
| Deerfield Dakota Holding, LLC, Term Loan, 8.557%, (SOFR + 3.75%), 4/9/27 | | 2,069 | 2,008,809 |
| Employbridge Holding Company, Term Loan, 9.497%, (3 mo. USD LIBOR + 4.75%), 7/19/28 | | 2,338 | 1,954,019 |
| First Advantage Holdings, LLC, Term Loan, 7.59%, (1 mo. USD LIBOR + 2.75%), 1/31/27 | | 606 | 603,993 |
| Neptune Bidco U.S., Inc., Term Loan, 9.735%, (SOFR + 5.00%), 4/11/29 | | 1,900 | 1,691,000 |
| Rockwood Service Corporation, Term Loan, 8.84%, (1 mo. USD LIBOR + 4.00%), 1/23/27 | | 596 | 594,294 |
| Techem Verwaltungsgesellschaft 675 mbH, Term Loan, 5.107%, (6 mo. EURIBOR + 2.375%), 7/15/25 | EUR | 826 | 875,723 |
| Trans Union, LLC, Term Loan, 7.09%, (1 mo. USD LIBOR + 2.25%), 12/1/28 | | 1,578 | 1,570,731 |
| Vaco Holdings, LLC, Term Loan, 10.048%, (SOFR + 5.00%), 1/21/29 | | 272 | 268,621 |
| | | | $ 19,379,944 |
38
See Notes to Financial Statements.
Eaton Vance
Limited Duration Income Fund
March 31, 2023
Portfolio of Investments — continued
| Borrower/Description | Principal
Amount*
(000's omitted) | Value |
| Real Estate Management & Development — 0.4% |
| Cushman & Wakefield U.S. Borrower, LLC: | | | |
| Term Loan, 7.59%, (1 mo. USD LIBOR + 2.75%), 8/21/25 | | 2,382 | $ 2,319,453 |
| Term Loan, 8.157%, (SOFR + 3.25%), 1/31/30 | | 3,005 | 2,929,412 |
| | | | $ 5,248,865 |
| Road & Rail — 0.6% |
| Grab Holdings, Inc., Term Loan, 9.35%, (1 mo. USD LIBOR + 4.50%), 1/29/26 | | 966 | $ 967,120 |
| Hertz Corporation (The): | | | |
| Term Loan, 8.09%, (1 mo. USD LIBOR + 3.25%), 6/30/28 | | 198 | 197,394 |
| Term Loan, 8.10%, (1 mo. USD LIBOR + 3.25%), 6/30/28 | | 1,033 | 1,029,068 |
| Kenan Advantage Group, Inc., Term Loan, 8.59%, (1 mo. USD LIBOR + 3.75%), 3/24/26 | | 2,199 | 2,184,804 |
| Uber Technologies, Inc., Term Loan, 7.87%, (SOFR + 2.75%), 2/28/30 | | 2,408 | 2,406,116 |
| | | | $ 6,784,502 |
| Semiconductors & Semiconductor Equipment — 0.3% |
| Altar Bidco, Inc., Term Loan, 6.608%, (SOFR + 3.10%), 2/1/29 | | 1,265 | $ 1,210,469 |
| Bright Bidco B.V., Term Loan, 13.676%, (SOFR + 9.00%), 5.676% cash, 8.00% PIK, 10/31/27 | | 333 | 295,595 |
| MACOM Technology Solutions Holdings, Inc., Term Loan, 7.09%, (1 mo. USD LIBOR + 2.25%), 5/17/24 | | 264 | 262,724 |
| MaxLinear, Inc., Term Loan, 7.09%, (1 mo. USD LIBOR + 2.25%), 6/23/28 | | 286 | 284,286 |
| MKS Instruments, Inc., Term Loan, 5.822%, (1 mo. EURIBOR + 3.00%), 8/17/29 | EUR | 995 | 1,064,915 |
| Synaptics Incorporated, Term Loan, 7.399%, (6 mo. USD LIBOR + 2.25%), 12/2/28 | | 394 | 391,599 |
| Ultra Clean Holdings, Inc., Term Loan, 8.59%, (1 mo. USD LIBOR + 3.75%), 8/27/25 | | 579 | 580,142 |
| | | | $ 4,089,730 |
| Software — 6.5% |
| Applied Systems, Inc., Term Loan, 9.398%, (SOFR + 4.50%), 9/18/26 | | 4,493 | $ 4,492,113 |
| AppLovin Corporation, Term Loan, 8.157%, (SOFR + 3.35%), 8/15/25 | | 1,587 | 1,580,361 |
| Aptean, Inc.: | | | |
| Term Loan, 9.157%, (SOFR + 4.25%), 4/23/26 | | 820 | 786,600 |
| Term Loan - Second Lien, 11.807%, (1 mo. USD LIBOR + 7.00%), 4/23/27 | | 1,450 | 1,353,937 |
| Borrower/Description | Principal
Amount*
(000's omitted) | Value |
| Software (continued) |
| Astra Acquisition Corp.: | | | |
| Term Loan, 10.09%, (1 mo. USD LIBOR + 5.25%), 10/25/28 | | 1,069 | $ 921,697 |
| Term Loan - Second Lien, 13.734%, (1 mo. USD LIBOR + 8.875%), 10/25/29 | | 1,650 | 1,369,171 |
| Banff Merger Sub, Inc.: | | | |
| Term Loan, 6.905%, (1 mo. EURIBOR + 4.00%), 10/2/25 | EUR | 485 | 512,203 |
| Term Loan, 8.59%, (1 mo. USD LIBOR + 3.75%), 10/2/25 | | 2,697 | 2,665,214 |
| Term Loan - Second Lien, 10.34%, (1 mo. USD LIBOR + 5.50%), 2/27/26 | | 900 | 875,089 |
| CDK Global, Inc., Term Loan, 9.148%, (SOFR + 4.25%), 7/6/29 | | 2,269 | 2,266,678 |
| CentralSquare Technologies, LLC, Term Loan, 8.909%, (3 mo. USD LIBOR + 3.75%), 8/29/25 | | 862 | 760,064 |
| Ceridian HCM Holding, Inc., Term Loan, 7.34%, (1 mo. USD LIBOR + 2.50%), 4/30/25 | | 1,480 | 1,478,092 |
| Cloudera, Inc.: | | | |
| Term Loan, 8.657%, (SOFR + 3.75%), 10/8/28 | | 2,772 | 2,619,540 |
| Term Loan - Second Lien, 10.907%, (SOFR + 6.00%), 10/8/29 | | 775 | 689,750 |
| Constant Contact, Inc., Term Loan, 8.806%, (3 mo. USD LIBOR + 4.00%), 2/10/28 | | 1,726 | 1,634,533 |
| Cornerstone OnDemand, Inc., Term Loan, 8.59%, (1 mo. USD LIBOR + 3.75%), 10/16/28 | | 1,337 | 1,237,933 |
| Delta TopCo, Inc.: | | | |
| Term Loan, 8.656%, (SOFR + 3.75%), 12/1/27 | | 1,376 | 1,278,641 |
| Term Loan - Second Lien, 12.156%, (SOFR + 7.25%), 12/1/28 | | 1,950 | 1,675,376 |
| ECI Macola Max Holding, LLC, Term Loan, 8.909%, (3 mo. USD LIBOR + 3.75%), 11/9/27 | | 1,272 | 1,255,957 |
| Epicor Software Corporation, Term Loan, 8.09%, (1 mo. USD LIBOR + 3.25%), 7/30/27 | | 774 | 762,563 |
| Finastra USA, Inc., Term Loan, 8.325%, (3 mo. USD LIBOR + 3.50%), 6/13/24 | | 2,950 | 2,776,167 |
| Fiserv Investment Solutions, Inc., Term Loan, 8.756%, (1 mo. USD LIBOR + 4.00%), 2/18/27 | | 511 | 490,140 |
| GoTo Group, Inc., Term Loan, 9.59%, (1 mo. USD LIBOR + 4.75%), 8/31/27 | | 1,784 | 1,032,773 |
| Greeneden U.S. Holdings II, LLC: | | | |
| Term Loan, 6.742%, (3 mo. EURIBOR + 4.25%), 12/1/27 | EUR | 735 | 786,396 |
| Term Loan, 8.84%, (1 mo. USD LIBOR + 4.00%), 12/1/27 | | 809 | 799,404 |
| Hyland Software, Inc., Term Loan, 8.34%, (1 mo. USD LIBOR + 3.50%), 7/1/24 | | 7,569 | 7,480,532 |
39
See Notes to Financial Statements.
Eaton Vance
Limited Duration Income Fund
March 31, 2023
Portfolio of Investments — continued
| Borrower/Description | Principal
Amount*
(000's omitted) | Value |
| Software (continued) |
| IGT Holding IV AB, Term Loan, 6.415%, (3 mo. EURIBOR + 3.40%), 3/31/28 | EUR | 1,000 | $ 1,047,446 |
| Ivanti Software, Inc., Term Loan, 9.212%, (3 mo. USD LIBOR + 4.25%), 12/1/27 | | 1,453 | 1,192,900 |
| Magenta Buyer, LLC: | | | |
| Term Loan, 9.58%, (3 mo. USD LIBOR + 4.75%), 7/27/28 | | 3,851 | 3,177,281 |
| Term Loan - Second Lien, 13.08%, (3 mo. USD LIBOR + 8.25%), 7/27/29 | | 1,050 | 794,500 |
| Marcel LUX IV S.a.r.l.: | | | |
| Term Loan, 5.72%, (3 mo. EURIBOR + 3.50%), 3/16/26 | EUR | 1,500 | 1,591,418 |
| Term Loan, 8.932%, (SOFR + 4.00%), 12/31/27 | | 95 | 94,787 |
| McAfee, LLC: | | | |
| Term Loan, 6.492%, (3 mo. EURIBOR + 4.00%), 3/1/29 | EUR | 992 | 1,019,280 |
| Term Loan, 8.515%, (SOFR + 3.75%), 3/1/29 | | 2,779 | 2,627,314 |
| Mediaocean, LLC, Term Loan, 8.407%, (SOFR + 3.50%), 12/15/28 | | 619 | 586,111 |
| MH Sub I, LLC, Term Loan, 8.59%, (1 mo. USD LIBOR + 3.75%), 9/13/24 | | 394 | 388,226 |
| Open Text Corporation, Term Loan, 8.157%, (SOFR + 3.25%), 1/31/30 | | 1,372 | 1,369,420 |
| Panther Commercial Holdings, L.P., Term Loan, 9.075%, (3 mo. USD LIBOR + 4.25%), 1/7/28 | | 885 | 826,358 |
| Polaris Newco, LLC: | | | |
| Term Loan, 6.492%, (3 mo. EURIBOR + 4.00%), 6/2/28 | EUR | 985 | 944,718 |
| Term Loan, 9.159%, (3 mo. USD LIBOR + 4.00%), 6/2/28 | | 2,808 | 2,568,190 |
| Proofpoint, Inc., Term Loan, 8.09%, (1 mo. USD LIBOR + 3.25%), 8/31/28 | | 2,469 | 2,418,217 |
| RealPage, Inc., Term Loan, 7.84%, (1 mo. USD LIBOR + 3.00%), 4/24/28 | | 2,832 | 2,753,211 |
| SolarWinds Holdings, Inc., Term Loan, 8.807%, (SOFR + 4.00%), 2/5/27 | | 1,700 | 1,697,345 |
| Sophia, L.P., Term Loan, 8.659%, (3 mo. USD LIBOR + 3.50%), 10/7/27 | | 391 | 386,255 |
| SurveyMonkey, Inc., Term Loan, 8.672%, (1 mo. USD LIBOR + 3.75%), 10/10/25 | | 617 | 615,458 |
| Turing Midco, LLC, Term Loan, 7.34%, (1 mo. USD LIBOR + 2.50%), 3/24/28 | | 168 | 168,098 |
| Ultimate Software Group, Inc. (The): | | | |
| Term Loan, 8.032%, (3 mo. USD LIBOR + 3.25%), 5/4/26 | | 3,862 | 3,767,907 |
| Term Loan, 8.575%, (3 mo. USD LIBOR + 3.75%), 5/4/26 | | 1,665 | 1,638,467 |
| Veritas US, Inc.: | | | |
| Term Loan, 7.765%, (3 mo. EURIBOR + 4.75%), 9/1/25 | EUR | 975 | 810,647 |
| Borrower/Description | Principal
Amount*
(000's omitted) | Value |
| Software (continued) |
| Veritas US, Inc.: (continued) | | | |
| Term Loan, 9.84%, (1 mo. USD LIBOR + 5.00%), 9/1/25 | | 2,413 | $ 1,840,114 |
| Vision Solutions, Inc., Term Loan, 8.818%, (3 mo. USD LIBOR + 4.00%), 4/24/28 | | 420 | 371,674 |
| VS Buyer, LLC, Term Loan, 7.70%, (3 mo. USD LIBOR + 3.00%), 2/28/27 | | 1,067 | 1,058,553 |
| | | | $ 79,334,819 |
| Specialty Retail — 1.3% |
| Belron Finance US, LLC, Term Loan, 7.30%, (3 mo. USD LIBOR + 2.425%), 4/13/28 | | 833 | $ 833,000 |
| Belron Luxembourg S.a.r.l., Term Loan, 5.045%, (3 mo. EURIBOR + 2.50%), 4/13/28 | EUR | 500 | 534,794 |
| Boels Topholding B.V., Term Loan, 5.901%, (EURIBOR + 3.25%), 2/6/27(21) | EUR | 1,000 | 1,064,166 |
| David's Bridal, Inc.: | | | |
| Term Loan, 10.83%, (1 mo. USD LIBOR + 6.00%), 12/31/24(11) | | 704 | 0 |
| Term Loan, 14.82%, (3 mo. USD LIBOR + 10.00%), 9.82% cash, 5.00% PIK, 6/23/23(11) | | 581 | 170,183 |
| Etraveli Holding AB, Term Loan, 7.015%, (3 mo. EURIBOR + 4.00%), 8/2/24 | EUR | 937 | 1,005,106 |
| Great Outdoors Group, LLC, Term Loan, 8.59%, (1 mo. USD LIBOR + 3.75%), 3/6/28 | | 2,395 | 2,369,204 |
| Harbor Freight Tools USA, Inc., Term Loan, 7.59%, (1 mo. USD LIBOR + 2.75%), 10/19/27 | | 1,869 | 1,819,452 |
| Hoya Midco, LLC, Term Loan, 7.926%, (SOFR + 3.25%), 2/3/29 | | 988 | 980,702 |
| Les Schwab Tire Centers, Term Loan, 8.064%, (3 mo. USD LIBOR + 3.25%), 11/2/27 | | 2,888 | 2,869,772 |
| Mattress Firm, Inc., Term Loan, 9.39%, (3 mo. USD LIBOR + 4.25%), 9/25/28 | | 1,187 | 1,113,391 |
| PetSmart, Inc., Term Loan, 8.657%, (SOFR + 3.75%), 2/11/28 | | 2,394 | 2,378,609 |
| Speedster Bidco GmbH, Term Loan, 6.54%, (6 mo. EURIBOR + 3.25%), 3/31/27 | EUR | 1,000 | 1,022,141 |
| | | | $ 16,160,520 |
| Technology Hardware, Storage & Peripherals — 0.1% |
| NCR Corporation, Term Loan, 7.33%, (3 mo. USD LIBOR + 2.50%), 8/28/26 | | 911 | $ 900,597 |
| | | | $ 900,597 |
| Trading Companies & Distributors — 1.2% |
| American Builders & Contractors Supply Co., Inc., Term Loan, 6.907%, (SOFR + 2.00%), 1/15/27 | | 2,364 | $ 2,357,415 |
40
See Notes to Financial Statements.
Eaton Vance
Limited Duration Income Fund
March 31, 2023
Portfolio of Investments — continued
| Borrower/Description | Principal
Amount*
(000's omitted) | Value |
| Trading Companies & Distributors (continued) |
| Electro Rent Corporation, Term Loan, 10.271%, (SOFR + 5.50%), 11/1/24 | | 1,794 | $ 1,764,427 |
| Hillman Group, Inc. (The): | | | |
| Term Loan, 3.132%, 7/14/28(23) | | 72 | 71,196 |
| Term Loan, 7.59%, (1 mo. USD LIBOR + 2.75%), 7/14/28 | | 295 | 293,137 |
| Patagonia Bidco Limited, Term Loan, 8.678%, (SONIA + 5.25%), 10/28/28 | GBP | 1,000 | 1,099,445 |
| PEARLS (Netherlands) Bidco B.V., Term Loan, 5.992%, (3 mo. EURIBOR + 3.50%), 2/26/29 | EUR | 1,000 | 1,042,476 |
| Quimper AB, Term Loan, 5.057%, (3 mo. EURIBOR + 2.925%), 2/16/26 | EUR | 1,875 | 1,949,558 |
| Spin Holdco, Inc., Term Loan, 8.986%, (3 mo. USD LIBOR + 4.00%), 3/4/28 | | 3,822 | 3,227,201 |
| SRS Distribution, Inc.: | | | |
| Term Loan, 8.157%, (SOFR + 3.25%), 6/2/28 | | 371 | 360,113 |
| Term Loan, 8.34%, (1 mo. USD LIBOR + 3.50%), 6/2/28 | | 985 | 951,756 |
| White Cap Buyer, LLC, Term Loan, 8.557%, (SOFR + 3.75%), 10/19/27 | | 2,053 | 2,031,842 |
| | | | $ 15,148,566 |
| Transportation Infrastructure — 0.1% |
| Brown Group Holding, LLC: | | | |
| Term Loan, 7.407%, (SOFR + 2.50%), 6/7/28 | | 221 | $ 219,672 |
| Term Loan, 8.462%, (SOFR + 3.75%), 7/2/29(21) | | 249 | 249,217 |
| KKR Apple Bidco, LLC, Term Loan, 7.59%, (1 mo. USD LIBOR + 2.75%), 9/23/28 | | 173 | 171,327 |
| | | | $ 640,216 |
| Wireless Telecommunication Services — 0.4% |
| Digicel International Finance Limited, Term Loan, 8.081%, (1 mo. USD LIBOR + 3.25%), 5/28/24 | | 4,800 | $ 4,325,902 |
| | | | $ 4,325,902 |
Total Senior Floating-Rate Loans
(identified cost $616,724,767) | | | $ 569,269,378 |
| Sovereign Government Bonds — 3.7% |
| Security | Principal
Amount*
(000's omitted) | Value |
| Albania — 0.0%(10) |
| Albania Government International Bond, 3.50%, 10/9/25(14) | EUR | 101 | $ 103,436 |
| | | | $ 103,436 |
| Security | Principal
Amount*
(000's omitted) | Value |
| Argentina — 0.1% |
| Province of Salta Argentina, 8.50%, 12/1/27(14) | | 81 | $ 66,622 |
| Provincia de Cordoba, 6.875%, 12/10/25(14) | | 320 | 272,825 |
| Republic of Argentina, 3.875% to 7/9/23, 1/9/38(3) | | 965 | 304,165 |
| | | | $ 643,612 |
| Armenia — 0.0%(10) |
| Republic of Armenia, 3.95%, 9/26/29(14) | | 200 | $ 164,237 |
| | | | $ 164,237 |
| Azerbaijan — 0.0%(10) |
| Republic of Azerbaijan, 3.50%, 9/1/32(14) | | 389 | $ 332,638 |
| | | | $ 332,638 |
| Bahrain — 0.1% |
| Kingdom of Bahrain: | | | |
| 5.625%, 5/18/34(14) | | 200 | $ 175,338 |
| 6.75%, 9/20/29(14) | | 300 | 298,640 |
| 7.375%, 5/14/30(14) | | 590 | 611,223 |
| | | | $ 1,085,201 |
| Barbados — 0.1% |
| Government of Barbados, 6.50%, 10/1/29(1) | | 949 | $ 886,095 |
| | | | $ 886,095 |
| Benin — 0.1% |
| Benin Government International Bond: | | | |
| 4.875%, 1/19/32(14) | EUR | 300 | $ 246,355 |
| 4.95%, 1/22/35(14) | EUR | 200 | 149,757 |
| 6.875%, 1/19/52(14) | EUR | 1,022 | 771,229 |
| | | | $ 1,167,341 |
| Brazil — 0.2% |
| Federative Republic of Brazil: | | | |
| 3.875%, 6/12/30 | | 371 | $ 333,091 |
| 4.625%, 1/13/28 | | 1,850 | 1,812,793 |
| 5.00%, 1/27/45 | | 600 | 473,007 |
| | | | $ 2,618,891 |
| Chile — 0.1% |
| Chile Government International Bond: | | | |
| 2.45%, 1/31/31 | | 465 | $ 401,917 |
| 3.24%, 2/6/28 | | 260 | 248,437 |
| 3.50%, 1/25/50 | | 845 | 634,624 |
| | | | $ 1,284,978 |
41
See Notes to Financial Statements.
Eaton Vance
Limited Duration Income Fund
March 31, 2023
Portfolio of Investments — continued
| Security | Principal
Amount*
(000's omitted) | Value |
| Croatia — 0.0%(10) |
| Croatia Government International Bond, 1.75%, 3/4/41(14) | EUR | 212 | $ 160,434 |
| | | | $ 160,434 |
| Dominican Republic — 0.1% |
| Dominican Republic: | | | |
| 4.50%, 1/30/30(14) | | 430 | $ 375,490 |
| 6.40%, 6/5/49(14) | | 150 | 125,696 |
| 6.85%, 1/27/45(14) | | 300 | 268,901 |
| 7.45%, 4/30/44(14) | | 300 | 289,448 |
| | | | $ 1,059,535 |
| Ecuador — 0.1% |
| Republic of Ecuador, 1.50% to 7/31/23, 7/31/40(3)(14) | | 2,958 | $ 632,795 |
| | | | $ 632,795 |
| Egypt — 0.1% |
| Arab Republic of Egypt: | | | |
| 5.80%, 9/30/27(14) | | 427 | $ 300,572 |
| 8.15%, 11/20/59(14) | | 1,071 | 599,439 |
| 8.50%, 1/31/47(14) | | 601 | 350,502 |
| 8.70%, 3/1/49(14) | | 452 | 265,675 |
| 8.875%, 5/29/50(14) | | 355 | 210,412 |
| | | | $ 1,726,600 |
| El Salvador — 0.0%(10) |
| Republic of El Salvador: | | | |
| 5.875%, 1/30/25(14) | | 61 | $ 47,580 |
| 6.375%, 1/18/27(14) | | 331 | 186,622 |
| 7.125%, 1/20/50(14) | | 150 | 69,421 |
| | | | $ 303,623 |
| Ethiopia — 0.1% |
| Ethiopia Government International Bond, 6.625%, 12/11/24(14) | | 970 | $ 683,797 |
| | | | $ 683,797 |
| Gabon — 0.0%(10) |
| Gabon Government International Bond, 6.625%, 2/6/31(14) | | 474 | $ 362,823 |
| | | | $ 362,823 |
| Security | Principal
Amount*
(000's omitted) | Value |
| Ghana — 0.0%(10) |
| Ghana Government International Bond, 8.627%, 6/16/49(14) | | 740 | $ 249,287 |
| | | | $ 249,287 |
| Guatemala — 0.0%(10) |
| Guatemala Government International Bond, 5.375%, 4/24/32(14) | | 338 | $ 329,114 |
| | | | $ 329,114 |
| Honduras — 0.1% |
| Honduras Government International Bond: | | | |
| 5.625%, 6/24/30(14) | | 601 | $ 476,945 |
| 6.25%, 1/19/27(14) | | 407 | 364,130 |
| | | | $ 841,075 |
| Hungary — 0.1% |
| Hungary Government International Bond: | | | |
| 2.125%, 9/22/31(14) | | 815 | $ 627,887 |
| 6.25%, 9/22/32(1) | | 400 | 408,742 |
| | | | $ 1,036,629 |
| India — 0.1% |
| Export-Import Bank of India: | | | |
| 2.25%, 1/13/31(14) | | 992 | $ 796,413 |
| 5.50%, 1/18/33(1) | | 230 | 230,081 |
| | | | $ 1,026,494 |
| Indonesia — 0.2% |
| Indonesia Government International Bond: | | | |
| 3.55%, 3/31/32 | | 1,813 | $ 1,666,761 |
| 4.65%, 9/20/32 | | 455 | 454,060 |
| | | | $ 2,120,821 |
| Iraq — 0.1% |
| Republic of Iraq, 5.80%, 1/15/28(14) | | 1,309 | $ 1,223,560 |
| | | | $ 1,223,560 |
| Ivory Coast — 0.0%(10) |
| Ivory Coast Government International Bond, 5.25%, 3/22/30(14) | EUR | 257 | $ 229,317 |
| | | | $ 229,317 |
42
See Notes to Financial Statements.
Eaton Vance
Limited Duration Income Fund
March 31, 2023
Portfolio of Investments — continued
| Security | Principal
Amount*
(000's omitted) | Value |
| Jordan — 0.1% |
| Kingdom of Jordan: | | | |
| 5.85%, 7/7/30(14) | | 300 | $ 268,077 |
| 7.375%, 10/10/47(14) | | 438 | 371,202 |
| | | | $ 639,279 |
| Kazakhstan — 0.0%(10) |
| Kazakhstan Government International Bond, 6.50%, 7/21/45(14) | | 500 | $ 522,475 |
| | | | $ 522,475 |
| Kenya — 0.0%(10) |
| Republic of Kenya, 7.25%, 2/28/28(14) | | 480 | $ 394,831 |
| | | | $ 394,831 |
| Kuwait — 0.0%(10) |
| Kuwait International Government Bond, 3.50%, 3/20/27(14) | | 247 | $ 242,388 |
| | | | $ 242,388 |
| Lebanon — 0.0%(10) |
| Lebanese Republic: | | | |
| 5.80%, 4/14/20(14)(19) | | 57 | $ 3,748 |
| 6.00%, 1/27/23(14)(19) | | 253 | 16,129 |
| 6.10%, 10/4/22(14)(19) | | 972 | 63,909 |
| 6.15%, 6/19/20(19) | | 75 | 4,838 |
| 6.20%, 2/26/25(14)(19) | | 80 | 5,301 |
| 6.25%, 5/27/22(19) | | 130 | 8,483 |
| 6.25%, 11/4/24(14)(19) | | 16 | 1,069 |
| 6.25%, 6/12/25(14)(19) | | 287 | 19,085 |
| 6.375%, 3/9/20(19) | | 1,110 | 74,231 |
| 6.40%, 5/26/23(19) | | 13 | 843 |
| 6.65%, 4/22/24(14)(19) | | 567 | 37,776 |
| 6.65%, 11/3/28(14)(19) | | 207 | 13,662 |
| 6.75%, 11/29/27(14)(19) | | 4 | 264 |
| 6.85%, 5/25/29(19) | | 5 | 331 |
| 7.00%, 3/20/28(14)(19) | | 506 | 33,333 |
| 7.05%, 11/2/35(14)(19) | | 86 | 5,676 |
| 7.15%, 11/20/31(14)(19) | | 451 | 29,725 |
| 8.20%, 5/17/33(19) | | 156 | 10,116 |
| 8.25%, 4/12/21(14)(19) | | 402 | 25,627 |
| 8.25%, 5/17/34(19) | | 129 | 8,402 |
| | | | $ 362,548 |
| Security | Principal
Amount*
(000's omitted) | Value |
| Macedonia — 0.2% |
| North Macedonia Government International Bond: | | | |
| 1.625%, 3/10/28(14) | EUR | 802 | $ 691,656 |
| 3.675%, 6/3/26(14) | EUR | 136 | 136,038 |
| 6.96%, 3/13/27(14) | EUR | 884 | 964,541 |
| | | | $ 1,792,235 |
| Mexico — 0.0%(10) |
| Mexico Government International Bond, 5.00%, 4/27/51 | | 370 | $ 318,363 |
| | | | $ 318,363 |
| Morocco — 0.0%(10) |
| Morocco Government International Bond, 3.00%, 12/15/32(14) | | 365 | $ 295,178 |
| | | | $ 295,178 |
| Mozambique — 0.0%(10) |
| Mozambique Government International Bond, 5.00% to 9/15/23, 9/15/31(3)(14) | | 416 | $ 300,706 |
| | | | $ 300,706 |
| Oman — 0.1% |
| Oman Government International Bond: | | | |
| 6.25%, 1/25/31(14) | | 683 | $ 696,655 |
| 6.75%, 1/17/48(14) | | 230 | 218,062 |
| 7.375%, 10/28/32(14) | | 457 | 499,755 |
| | | | $ 1,414,472 |
| Pakistan — 0.0%(10) |
| Islamic Republic of Pakistan: | | | |
| 7.375%, 4/8/31(14) | | 208 | $ 74,880 |
| 8.875%, 4/8/51(14) | | 222 | 77,028 |
| | | | $ 151,908 |
| Panama — 0.1% |
| Panama Government International Bond, 6.70%, 1/26/36 | | 1,100 | $ 1,166,911 |
| | | | $ 1,166,911 |
| Paraguay — 0.1% |
| Republic of Paraguay, 4.95%, 4/28/31(14) | | 577 | $ 561,052 |
| | | | $ 561,052 |
43
See Notes to Financial Statements.
Eaton Vance
Limited Duration Income Fund
March 31, 2023
Portfolio of Investments — continued
| Security | Principal
Amount*
(000's omitted) | Value |
| Peru — 0.1% |
| Peruvian Government International Bond: | | | |
| 2.783%, 1/23/31 | | 926 | $ 792,673 |
| 3.30%, 3/11/41 | | 447 | 336,341 |
| | | | $ 1,129,014 |
| Romania — 0.2% |
| Romania Government International Bond: | | | |
| 3.375%, 1/28/50(14) | EUR | 518 | $ 340,962 |
| 4.625%, 4/3/49(14) | EUR | 1,115 | 900,973 |
| 5.00%, 9/27/26(14) | EUR | 768 | 833,305 |
| 6.625%, 9/27/29(14) | EUR | 650 | 721,801 |
| | | | $ 2,797,041 |
| Serbia — 0.1% |
| Serbia Government International Bond, 2.125%, 12/1/30(14) | | 1,536 | $ 1,169,441 |
| | | | $ 1,169,441 |
| Sri Lanka — 0.2% |
| Sri Lanka Government International Bond: | | | |
| 5.75%, 4/18/23(14)(19) | | 858 | $ 308,944 |
| 6.20%, 5/11/27(14)(19) | | 400 | 144,083 |
| 6.35%, 6/28/24(14)(19) | | 760 | 275,461 |
| 6.75%, 4/18/28(14)(19) | | 1,089 | 392,089 |
| 6.825%, 7/18/26(14)(19) | | 200 | 74,255 |
| 6.85%, 3/14/24(14)(19) | | 681 | 246,828 |
| 6.85%, 11/3/25(14)(19) | | 400 | 148,022 |
| 7.55%, 3/28/30(14)(19) | | 400 | 143,984 |
| 7.85%, 3/14/29(14)(19) | | 764 | 275,012 |
| | | | $ 2,008,678 |
| Suriname — 0.3% |
| Republic of Suriname, 9.25%, 10/26/26(14)(19) | | 5,751 | $ 4,186,728 |
| | | | $ 4,186,728 |
| Ukraine — 0.1% |
| Ukraine Government International Bond: | | | |
| 0.00%, GDP-Linked, 8/1/41(12)(14)(24) | | 2,164 | $ 582,811 |
| 6.876%, 5/21/31(14) | | 1,629 | 295,057 |
| | | | $ 877,868 |
| United Arab Emirates — 0.2% |
| Finance Department Government of Sharjah: | | | |
| 4.375%, 3/10/51(14) | | 2,625 | $ 1,789,754 |
| Security | Principal
Amount*
(000's omitted) | Value |
| United Arab Emirates (continued) |
Finance Department Government of Sharjah:
(continued) | | | |
| 6.50%, 11/23/32(1) | | 860 | $ 878,218 |
| | | | $ 2,667,972 |
| Uzbekistan — 0.1% |
| Republic of Uzbekistan: | | | |
| 3.90%, 10/19/31(14) | | 564 | $ 453,809 |
| 4.75%, 2/20/24(14) | | 355 | 349,824 |
| 5.375%, 2/20/29(14) | | 300 | 275,259 |
| | | | $ 1,078,892 |
| Zambia — 0.1% |
| Zambia Government International Bond: | | | |
| 5.375%, 9/20/22(14)(19) | | 630 | $ 268,065 |
| 8.97%, 7/30/27(14)(19) | | 894 | 399,135 |
| | | | $ 667,200 |
Total Sovereign Government Bonds
(identified cost $54,944,133) | | | $ 45,017,513 |
| Borrower/Description | Principal
Amount
(000's omitted) | Value |
| Kenya — 0.1% |
| Government of Kenya, Term Loan, 11.176%, (6 mo. USD LIBOR + 6.45%), 6/29/25(2) | $ | 1,560 | $ 1,513,105 |
| | | | $ 1,513,105 |
| Nigeria — 0.1% |
| Bank of Industry Limited, Term Loan, 11.138%, (3 mo. USD LIBOR + 6.00%), 12/14/23(2)(25) | $ | 753 | $ 766,313 |
| | | | $ 766,313 |
| Tanzania — 0.3% |
| Government of the United Republic of Tanzania, Term Loan, 11.434%, (6 mo. USD LIBOR + 6.30%), 4/28/31(2) | $ | 4,410 | $ 4,246,062 |
| | | | $ 4,246,062 |
Total Sovereign Loans
(identified cost $6,720,678) | | | $ 6,525,480 |
44
See Notes to Financial Statements.
Eaton Vance
Limited Duration Income Fund
March 31, 2023
Portfolio of Investments — continued
| U.S. Government Agency Mortgage-Backed Securities — 30.0% |
| Security | Principal
Amount
(000's omitted) | Value |
| Federal Home Loan Mortgage Corp.: | | | |
| 5.00%, with various maturities to 2052 | $ | 52,731 | $ 52,706,372 |
| 5.50%, 5/1/32 | | 249 | 256,057 |
| 6.50%, with various maturities to 2036 | | 1,600 | 1,667,413 |
| 7.00%, with various maturities to 2036 | | 1,322 | 1,395,489 |
| 7.50%, with various maturities to 2035 | | 697 | 725,771 |
| 8.00%, with various maturities to 2030 | | 97 | 101,022 |
| 9.00%, with various maturities to 2031 | | 14 | 15,103 |
| Federal National Mortgage Association: | | | |
| 3.441%, (6 mo. USD LIBOR + 1.54%), 9/1/37(26) | | 493 | 495,924 |
| 3.782%, (COF + 1.31%), 10/1/36(26) | | 403 | 387,252 |
| 4.149%, (1 yr. CMT + 2.26%), 8/1/36(26) | | 2,620 | 2,681,125 |
| 4.50%, 7/1/42 | | 2,684 | 2,709,688 |
| 5.00%, with various maturities to 2052 | | 4,847 | 4,912,199 |
| 5.50%, 30-Year, TBA(27) | | 4,650 | 4,698,679 |
| 5.50%, with various maturities to 2033 | | 341 | 352,120 |
| 6.00%, 30-Year, TBA(27) | | 28,850 | 29,450,671 |
| 6.00%, with various maturities to 2029 | | 162 | 163,066 |
| 6.333%, (COF + 2.00%), 7/1/32(26) | | 490 | 501,721 |
| 6.50%, with various maturities to 2036 | | 6,648 | 6,909,769 |
| 7.00%, with various maturities to 2037 | | 1,472 | 1,545,266 |
| 7.50%, with various maturities to 2035 | | 716 | 761,696 |
| 8.00%, with various maturities to 2027 | | 40 | 41,615 |
| 8.019%, 9/15/27(8) | | 36 | 36,269 |
| 8.168%, 9/20/28(8) | | 8 | 8,267 |
| 8.221%, 10/15/29(8) | | 9 | 9,683 |
| 8.287%, 6/15/27(8) | | 15 | 15,089 |
| 8.50%, with various maturities to 2037 | | 165 | 173,587 |
| 9.00%, with various maturities to 2032 | | 160 | 165,136 |
| 9.50%, with various maturities to 2030 | | 30 | 31,232 |
| Government National Mortgage Association: | | | |
| 4.00%, 9/20/49 | | 221 | 215,375 |
| 4.50%, with various maturities to 2052 | | 2,549 | 2,517,038 |
| 5.00%, 6/20/52 | | 14,675 | 14,725,226 |
| 5.50%, 30-Year, TBA(27) | | 93,900 | 95,005,776 |
| 6.00%, 30-Year, TBA(27) | | 104,000 | 105,980,035 |
| 6.00%, 5/15/24 | | 25 | 25,311 |
| 6.50%, with various maturities to 2053 | | 31,893 | 32,848,423 |
| 7.00%, 4/20/26 | | 50 | 50,317 |
| 7.50%, with various maturities to 2032 | | 696 | 725,753 |
| 8.00%, with various maturities to 2034 | | 820 | 855,061 |
| Security | Principal
Amount
(000's omitted) | Value |
Government National Mortgage Association:
(continued) | | | |
| 9.00%, 12/15/25 | $ | 65 | $ 66,531 |
Total U.S. Government Agency Mortgage-Backed Securities
(identified cost $367,353,396) | | | $ 365,932,127 |
| Security | Shares | Value |
| Leisure Goods/Activities/Movies — 0.0% |
| Cineworld Group PLC, Exp. 11/23/25(12)(13) | | 78,565 | $ 0 |
| | | | $ 0 |
| Retailers (Except Food and Drug) — 0.0% |
| David’s Bridal, LLC, Exp. 12/31/28(11)(12)(13) | | 7,886 | $ ��� 0 |
| | | | $ 0 |
Total Warrants
(identified cost $0) | | | $ 0 |
| Security | Principal
Amount/
Shares | Value |
| Cable and Satellite Television — 0.0% |
| ACC Claims Holdings, LLC(11)(13) | | 2,257,600 | $ 0 |
| | | | $ 0 |
| Financial Intermediaries — 0.0% |
| Alpha Holding S.A., Escrow Certificates(11)(12) | | 400,000 | $ 0 |
| Alpha Holding S.A., Escrow Certificates(11)(12) | | 1,530,000 | 0 |
| | | | $ 0 |
| Surface Transport — 0.0%(10) |
| Hertz Corp., Escrow Certificates(12) | $ | 364,000 | $ 34,580 |
| | | | $ 34,580 |
Total Miscellaneous
(identified cost $0) | | | $ 34,580 |
45
See Notes to Financial Statements.
Eaton Vance
Limited Duration Income Fund
March 31, 2023
Portfolio of Investments — continued
| Short-Term Investments — 2.2% |
| Security | Shares | Value |
| Morgan Stanley Institutional Liquidity Funds - Government Portfolio, Institutional Class, 4.73%(28) | | 26,067,123 | $ 26,067,123 |
Total Affiliated Fund
(identified cost $26,067,123) | | | $ 26,067,123 |
| U.S. Treasury Obligations — 0.1% |
| Security | Principal
Amount
(000's omitted) | Value |
| U.S. Treasury Bills: | | | |
| 0.00%, 4/4/23 | $ | 265 | $ 264,966 |
| 0.00%, 4/11/23(29) | | 142 | 141,456 |
| 0.00%, 5/2/23(29) | | 93 | 93,055 |
Total U.S. Treasury Obligations
(identified cost $499,415) | | | $ 499,477 |
Total Short-Term Investments
(identified cost $26,566,538) | | | $ 26,566,600 |
Total Investments — 160.2%
(identified cost $2,144,307,654) | | | $1,956,495,890 |
| Less Unfunded Loan Commitments — (0.0)%(10) | | | $ (100,733) |
Net Investments — 160.2%
(identified cost $2,144,206,921) | | | $1,956,395,157 |
| Other Assets, Less Liabilities — (42.5)% | | | $ (519,078,578) |
| Auction Preferred Shares Plus Cumulative Unpaid Dividends — (17.7)% | | | $ (216,138,298) |
| Net Assets Applicable to Common Shares — 100.0% | | | $1,221,178,281 |
| The percentage shown for each investment category in the Portfolio of Investments is based on net assets applicable to common shares. |
| * | In U.S. dollars unless otherwise indicated. |
| (1) | Security exempt from registration under Rule 144A of the Securities Act of 1933, as amended. These securities may be sold in certain transactions in reliance on an exemption from registration (normally to qualified institutional buyers). At March 31, 2023, the aggregate value of these securities is $618,103,321 or 50.6% of the Fund's net assets applicable to common shares. |
| (2) | Variable rate security. The stated interest rate represents the rate in effect at March 31, 2023. |
| (3) | Step coupon security. Interest rate represents the rate in effect at March 31, 2023. |
| (4) | Principal amount is less than $500. |
| (5) | Inverse floating-rate security whose coupon varies inversely with changes in the interest rate index. The stated interest rate represents the coupon rate in effect at March 31, 2023. |
| (6) | Interest only security that entitles the holder to receive only interest payments on the underlying mortgages. Principal amount shown is the notional amount of the underlying mortgages on which coupon interest is calculated. |
| (7) | Principal only security that entitles the holder to receive only principal payments on the underlying mortgages. |
| (8) | Weighted average fixed-rate coupon that changes/updates monthly. Rate shown is the rate at March 31, 2023. |
| (9) | Represents an investment in an issuer that may be deemed to be an affiliate (see Note 9). |
| (10) | Amount is less than 0.05% or (0.05)%, as applicable. |
| (11) | For fair value measurement disclosure purposes, security is categorized as Level 3 (see Note 10). |
| (12) | Non-income producing security. |
| (13) | Security was acquired in connection with a restructuring of a Senior Loan and may be subject to restrictions on resale. |
| (14) | Security exempt from registration under Regulation S of the Securities Act of 1933, as amended, which exempts from registration securities offered and sold outside the United States. Security may not be offered or sold in the United States except pursuant to an exemption from, or in a transaction not subject to, the registration requirements of the Securities Act of 1933, as amended. At March 31, 2023, the aggregate value of these securities is $73,064,192 or 6.0% of the Fund's net assets applicable to common shares. |
| (15) | Represents a payment-in-kind security which may pay interest in additional principal at the issuer’s discretion. |
| (16) | Perpetual security with no stated maturity date but may be subject to calls by the issuer. |
| (17) | Security converts to variable rate after the indicated fixed-rate coupon period. |
| (18) | When-issued security. For a variable rate security interest rate will be determined after March 31, 2023. |
| (19) | Issuer is in default with respect to interest and/or principal payments. For a variable rate security, interest rate has been adjusted to reflect non-accrual status. |
| (20) | Senior floating-rate loans (Senior Loans) often require prepayments from excess cash flows or permit the borrowers to repay at their election. The degree to which borrowers repay, whether as a contractual requirement or at their election, cannot be predicted with accuracy. As a result, the actual remaining maturity may be substantially less than the stated maturities shown. However, Senior Loans will typically have an expected average life of approximately two to four years. Senior Loans typically have rates of interest which are redetermined periodically by reference to a base lending rate, plus a spread. These base lending rates are primarily the London Interbank Offered Rate (“LIBOR”) or the Secured Overnight Financing Rate (“SOFR”) and secondarily, the prime rate offered by one or more major United States banks (the “Prime Rate”). Base lending rates may be subject to a floor, or minimum rate. Rates for SOFR are generally 1 or 3-month tenors and may also be subject to a credit spread adjustment. Senior Loans are generally subject to contractual restrictions that must be satisfied before they can be bought or sold. |
46
See Notes to Financial Statements.
Eaton Vance
Limited Duration Income Fund
March 31, 2023
Portfolio of Investments — continued
| (21) | The stated interest rate represents the weighted average interest rate at March 31, 2023 of contracts within the senior loan facility. Interest rates on contracts are primarily redetermined either weekly, monthly or quarterly by reference to the indicated base lending rate and spread and the reset period. |
| (22) | This Senior Loan will settle after March 31, 2023, at which time the interest rate will be determined. |
| (23) | Unfunded or partially unfunded loan commitments. The stated interest rate reflects the weighted average of the reference rate and spread for the funded portion, if any, and the commitment fees on the portion of the loan that is unfunded. At March 31, 2023, the total value of unfunded loan commitments is $81,371. See Note 1F for description. |
| (24) | Amounts payable in respect of the security are contingent upon and determined by reference to Ukraine’s GDP and Real GDP Growth Rate. Principal amount represents the notional amount used to calculate payments due to the security holder and does not represent an entitlement for payment. |
| (25) | Loan is subject to scheduled mandatory prepayments. Maturity date shown reflects the final maturity date. |
| (26) | Adjustable rate mortgage security whose interest rate generally adjusts monthly based on a weighted average of interest rates on the underlying mortgages. The coupon rate may not reflect the applicable index value as interest rates on the underlying mortgages may adjust on various dates and at various intervals and may be subject to lifetime ceilings and lifetime floors and lookback periods. Rate shown is the coupon rate at March 31, 2023. |
| (27) | TBA (To Be Announced) securities are purchased on a forward commitment basis with an approximate principal amount and maturity date. The actual principal amount and maturity date are determined upon settlement. |
| (28) | May be deemed to be an affiliated investment company. The rate shown is the annualized seven-day yield as of March 31, 2023. |
| (29) | Security (or a portion thereof) has been pledged to cover margin requirements on open derivative contracts |
| Forward Foreign Currency Exchange Contracts (Centrally Cleared) |
| Currency Purchased | Currency Sold | Settlement
Date | Value/Unrealized
Appreciation
(Depreciation) |
| USD | 118,145 | EUR | 109,793 | 6/21/23 | $ (1,449) |
| USD | 673,167 | EUR | 625,975 | 6/21/23 | (8,683) |
| USD | 792,972 | EUR | 737,380 | 6/21/23 | (10,229) |
| USD | 1,850,398 | EUR | 1,720,675 | 6/21/23 | (23,869) |
| USD | 3,607,108 | EUR | 3,354,229 | 6/21/23 | (46,530) |
| | | | | | $(90,760) |
| Forward Foreign Currency Exchange Contracts (OTC) |
| Currency Purchased | Currency Sold | Counterparty | Settlement
Date | Unrealized
Appreciation | Unrealized
(Depreciation) |
| USD | 44,799,997 | EUR | 42,161,465 | Standard Chartered Bank | 4/4/23 | $ — | $ (924,107) |
| EUR | 1,000,000 | USD | 1,080,443 | Bank of America, N.A. | 4/14/23 | 4,654 | — |
| EUR | 142,236 | USD | 152,728 | Citibank, N.A. | 4/14/23 | 1,612 | — |
| USD | 829,761 | EUR | 776,340 | Citibank, N.A. | 4/14/23 | — | (12,643) |
| EUR | 88,721 | USD | 97,263 | Bank of America, N.A. | 4/28/23 | — | (916) |
| EUR | 539,293 | USD | 573,730 | Citibank, N.A. | 4/28/23 | 11,918 | — |
| EUR | 661,889 | USD | 708,248 | Citibank, N.A. | 4/28/23 | 10,534 | — |
| EUR | 89,923 | USD | 95,652 | Citibank, N.A. | 4/28/23 | 2,000 | — |
| EUR | 38,797 | USD | 41,274 | Citibank, N.A. | 4/28/23 | 857 | — |
| EUR | 40,863 | USD | 43,725 | Citibank, N.A. | 4/28/23 | 650 | — |
| EUR | 678,263 | USD | 731,108 | HSBC Bank USA, N.A. | 4/28/23 | 5,456 | — |
| GBP | 36,085 | USD | 43,407 | Goldman Sachs International | 4/28/23 | 1,129 | — |
| GBP | 11,982 | USD | 14,413 | Goldman Sachs International | 4/28/23 | 375 | — |
| USD | 3,329 | CAD | 4,428 | JPMorgan Chase Bank, N.A. | 4/28/23 | 51 | — |
47
See Notes to Financial Statements.
Eaton Vance
Limited Duration Income Fund
March 31, 2023
Portfolio of Investments — continued
| Forward Foreign Currency Exchange Contracts (OTC) (continued) |
| Currency Purchased | Currency Sold | Counterparty | Settlement
Date | Unrealized
Appreciation | Unrealized
(Depreciation) |
| USD | 487,576 | CAD | 648,693 | UBS AG | 4/28/23 | $ 7,422 | $ — |
| USD | 730,749 | EUR | 669,475 | Bank of America, N.A. | 4/28/23 | 3,729 | — |
| USD | 296,088 | EUR | 271,261 | Bank of America, N.A. | 4/28/23 | 1,511 | — |
| USD | 11,405 | EUR | 10,582 | Bank of America, N.A. | 4/28/23 | — | (87) |
| USD | 454,478 | EUR | 421,690 | Bank of America, N.A. | 4/28/23 | — | (3,458) |
| USD | 18,364,976 | EUR | 16,820,453 | Citibank, N.A. | 4/28/23 | 98,713 | — |
| USD | 14,303,749 | EUR | 13,102,702 | Citibank, N.A. | 4/28/23 | 74,799 | — |
| USD | 315,423 | EUR | 288,895 | Citibank, N.A. | 4/28/23 | 1,695 | — |
| USD | 245,670 | EUR | 225,042 | Citibank, N.A. | 4/28/23 | 1,285 | — |
| USD | 643,735 | EUR | 592,211 | Citibank, N.A. | 4/28/23 | 621 | — |
| USD | 187,222 | EUR | 175,506 | HSBC Bank USA, N.A. | 4/28/23 | — | (3,369) |
| USD | 91,248 | EUR | 83,551 | State Street Bank and Trust Company | 4/28/23 | 515 | — |
| USD | 270,983 | EUR | 253,686 | The Royal Bank of Scotland PLC | 4/28/23 | — | (4,509) |
| USD | 36,542 | GBP | 29,531 | Bank of America, N.A. | 4/28/23 | 94 | — |
| USD | 1,043 | GBP | 843 | Bank of America, N.A. | 4/28/23 | 3 | — |
| USD | 12,319 | GBP | 10,261 | Bank of America, N.A. | 4/28/23 | — | (345) |
| USD | 12,588 | GBP | 10,406 | HSBC Bank USA, N.A. | 4/28/23 | — | (255) |
| USD | 83,349 | GBP | 68,899 | HSBC Bank USA, N.A. | 4/28/23 | — | (1,688) |
| USD | 102,714 | GBP | 85,332 | HSBC Bank USA, N.A. | 4/28/23 | — | (2,604) |
| USD | 134,268 | GBP | 112,440 | Standard Chartered Bank | 4/28/23 | — | (4,508) |
| USD | 4,076,693 | GBP | 3,292,152 | State Street Bank and Trust Company | 4/28/23 | 13,468 | — |
| USD | 294,970 | GBP | 238,204 | State Street Bank and Trust Company | 4/28/23 | 974 | — |
| USD | 45,880,178 | EUR | 42,161,465 | Standard Chartered Bank | 5/3/23 | 81,761 | — |
| USD | 1,248,133 | EUR | 1,177,256 | Bank of America, N.A. | 5/31/23 | — | (32,711) |
| USD | 4,902,328 | EUR | 4,621,216 | State Street Bank and Trust Company | 5/31/23 | — | (125,512) |
| USD | 4,902,156 | EUR | 4,621,216 | State Street Bank and Trust Company | 5/31/23 | — | (125,684) |
| USD | 4,902,002 | EUR | 4,621,216 | State Street Bank and Trust Company | 5/31/23 | — | (125,838) |
| USD | 4,900,889 | EUR | 4,621,217 | State Street Bank and Trust Company | 5/31/23 | — | (126,951) |
| USD | 4,901,955 | EUR | 4,621,216 | The Royal Bank of Scotland PLC | 5/31/23 | — | (125,885) |
| USD | 4,915,877 | GBP | 4,105,273 | State Street Bank and Trust Company | 5/31/23 | — | (154,241) |
| USD | 1,997,889 | EUR | 1,833,973 | Bank of America, N.A. | 6/30/23 | — | (784) |
| USD | 5,553,227 | EUR | 5,100,000 | Goldman Sachs International | 6/30/23 | — | (4,780) |
| USD | 5,555,027 | EUR | 5,100,000 | Standard Chartered Bank | 6/30/23 | — | (2,980) |
| USD | 5,554,814 | EUR | 5,100,000 | Standard Chartered Bank | 6/30/23 | — | (3,193) |
| USD | 5,553,971 | EUR | 5,100,000 | Standard Chartered Bank | 6/30/23 | — | (4,036) |
| USD | 5,553,637 | EUR | 5,100,000 | Standard Chartered Bank | 6/30/23 | — | (4,370) |
| | | | | | | $325,826 | $(1,795,454) |
48
See Notes to Financial Statements.
Eaton Vance
Limited Duration Income Fund
March 31, 2023
Portfolio of Investments — continued
| Futures Contracts |
| Description | Number of
Contracts | Position | Expiration
Date | Notional
Amount | Value/Unrealized
Appreciation
(Depreciation) |
| Interest Rate Futures | | | | | |
| U.S. 2-Year Treasury Note | 90 | Long | 6/30/23 | $ 18,580,781 | $ 187,859 |
| Euro-Bobl | (18) | Short | 6/8/23 | (2,301,135) | (58,184) |
| Euro-Bund | (5) | Short | 6/8/23 | (736,592) | (27,447) |
| Euro-Buxl | (8) | Short | 6/8/23 | (1,222,101) | (67,547) |
| U.S. 5-Year Treasury Note | (75) | Short | 6/30/23 | (8,213,086) | (92,562) |
| U.S. 10-Year Treasury Note | (91) | Short | 6/21/23 | (10,457,891) | (265,210) |
| U.S. 10-Year Ultra Treasury Note | (3) | Short | 6/21/23 | (363,423) | (11,884) |
| U.S. Long Treasury Bond | (2) | Short | 6/21/23 | (262,312) | (11,156) |
| U.S. Ultra-Long Treasury Bond | (34) | Short | 6/21/23 | (4,798,251) | (217,199) |
| | | | | | $ (563,330) |
| Credit Default Swaps - Buy Protection (Centrally Cleared) | |
| Reference Entity | Notional
Amount*
(000's omitted) | Contract
Annual
Fixed Rate** | Termination
Date | Value | Unamortized
Upfront
Receipts
(Payments) | Unrealized
Appreciation
(Depreciation) |
| Mexico | | $1,384 | 1.00%
(pays quarterly)(1) | 6/20/28 | $ 12,122 | $ (26,654) | $ (14,532) |
| Total | | | | | $12,122 | $(26,654) | $(14,532) |
| Credit Default Swaps - Sell Protection (OTC) |
| Reference Entity | Counterparty | Notional
Amount*
(000's omitted) | Contract Annual
Fixed Rate** | Current
Market
Annual
Fixed Rate*** | Termination
Date | Value | Unamortized
Upfront
Receipts
(Payments) | Unrealized
Appreciation
(Depreciation) |
| Mexico | Citibank, N.A. | $ 2,041 | 1.00%
(pays quarterly)(1) | 1.80% | 12/20/31 | $ (115,456) | $ 79,563 | $ (35,893) |
| Total | | $2,041 | | | | $(115,456) | $79,563 | $(35,893) |
| * | If the Fund is the seller of credit protection, the notional amount is the maximum potential amount of future payments the Fund could be required to make if a credit event, as defined in the credit default swap agreement, were to occur. At March 31, 2023, such maximum potential amount for all open credit default swaps in which the Fund is the seller was $2,041,000. |
| ** | The contract annual fixed rate represents the fixed rate of interest received by the Fund (as a seller of protection) or paid by the Fund (as a buyer of protection) on the notional amount of the credit default swap contract. |
| *** | Current market annual fixed rates, utilized in determining the net unrealized appreciation or depreciation as of period end, serve as an indicator of the market’s perception of the current status of the payment/performance risk associated with the credit derivative. The current market annual fixed rate of a particular reference entity reflects the cost, as quoted by the pricing vendor, of selling protection against default of that entity as of period end and may include upfront payments required to be made to enter into the agreement. The higher the fixed rate, the greater the market perceived risk of a credit event involving the reference entity. A rate identified as “Defaulted” indicates a credit event has occurred for the reference entity. |
| (1) | Upfront payment is exchanged with the counterparty as a result of the standardized trading coupon. |
49
See Notes to Financial Statements.
Eaton Vance
Limited Duration Income Fund
March 31, 2023
Portfolio of Investments — continued
| Abbreviations: |
| CMT | – Constant Maturity Treasury |
| COF | – Cost of Funds 11th District |
| DIP | – Debtor In Possession |
| EURIBOR | – Euro Interbank Offered Rate |
| GDP | – Gross Domestic Product |
| LIBOR | – London Interbank Offered Rate |
| OTC | – Over-the-counter |
| PIK | – Payment In Kind |
| REITs | – Real Estate Investment Trusts |
| SOFR | – Secured Overnight Financing Rate |
| SONIA | – Sterling Overnight Interbank Average |
| TBA | – To Be Announced |
| Currency Abbreviations: |
| CAD | – Canadian Dollar |
| EUR | – Euro |
| GBP | – British Pound Sterling |
| USD | – United States Dollar |
50
See Notes to Financial Statements.
Eaton Vance
Limited Duration Income Fund
March 31, 2023
Statement of Assets and Liabilities
| | March 31, 2023 |
| Assets | |
| Unaffiliated investments, at value (identified cost $2,105,878,862) | $ 1,920,394,394 |
| Affiliated investments, at value (identified cost $38,328,059) | 36,000,763 |
| Cash | 4,100,106 |
| Deposits for derivatives collateral: | |
| Futures contracts | 770,557 |
| Centrally cleared derivatives | 471,949 |
| OTC derivatives | 3,550,400 |
| Deposits for forward commitment securities | 257,764 |
| Foreign currency, at value (identified cost $4,245,280) | 4,254,718 |
| Interest receivable | 19,432,978 |
| Interest and dividends receivable from affiliated investments | 169,929 |
| Receivable for investments sold | 6,460,522 |
| Receivable for variation margin on open centrally cleared derivatives | 39,799 |
| Receivable for open forward foreign currency exchange contracts | 325,826 |
| Tax reclaims receivable | 11,023 |
| Prepaid upfront fees on notes payable | 859,506 |
| Prepaid expenses | 8,890 |
| Total assets | $1,997,109,124 |
| Liabilities | |
| Notes payable | $ 314,000,000 |
| Cash collateral due to brokers | 257,764 |
| Payable for investments purchased | 5,549,400 |
| Payable for when-issued/delayed delivery/forward commitment securities | 233,933,603 |
| Payable for variation margin on open futures contracts | 82,432 |
| Payable for open forward foreign currency exchange contracts | 1,795,454 |
| Payable for open swap contracts | 35,893 |
| Upfront receipts on open non-centrally cleared swap contracts | 79,563 |
| Payable to affiliate: | |
| Investment adviser fee | 1,108,963 |
| Accrued expenses | 2,949,473 |
| Total liabilities | $ 559,792,545 |
| Auction preferred shares (8,640 shares outstanding) at liquidation value plus cumulative unpaid dividends | $ 216,138,298 |
| Net assets applicable to common shares | $1,221,178,281 |
| Sources of Net Assets | |
| Common shares, $0.01 par value, unlimited number of shares authorized | $ 1,162,035 |
| Additional paid-in capital | 1,627,248,324 |
| Accumulated loss | (407,232,078) |
| Net assets applicable to common shares | $1,221,178,281 |
| Common Shares Issued and Outstanding | 116,203,460 |
| Net Asset Value Per Common Share | |
| Net assets ÷ common shares issued and outstanding | $ 10.51 |
51
See Notes to Financial Statements.
Eaton Vance
Limited Duration Income Fund
March 31, 2023
| | Year Ended |
| | March 31, 2023 |
| Investment Income | |
| Dividend income (net of foreign taxes withheld of $2,759) | $ 2,407,590 |
| Dividend income from affiliated investments | 1,190,672 |
| Interest and other income | 112,100,778 |
| Interest income from affiliated investments | 608,855 |
| Total investment income | $ 116,307,895 |
| Expenses | |
| Investment adviser fee | $ 14,516,524 |
| Trustees’ fees and expenses | 108,500 |
| Custodian fee | 591,751 |
| Transfer and dividend disbursing agent fees | 18,943 |
| Legal and accounting services | 217,188 |
| Printing and postage | 530,266 |
| Interest expense and fees | 18,103,919 |
| Preferred shares service fee | 226,603 |
| Miscellaneous | 191,904 |
| Total expenses | $ 34,505,598 |
| Deduct: | |
| Waiver and/or reimbursement of expenses by affiliate | $ 64,277 |
| Total expense reductions | $ 64,277 |
| Net expenses | $ 34,441,321 |
| Net investment income | $ 81,866,574 |
| Realized and Unrealized Gain (Loss) | |
| Net realized gain (loss): | |
| Investment transactions | $ (76,551,082) |
| Investment transactions - affiliated investments | 9,203 |
| Futures contracts | 17,022,603 |
| Swap contracts | 31,174 |
| Foreign currency transactions | 193,773 |
| Forward foreign currency exchange contracts | 10,889,728 |
| Net realized loss | $ (48,404,601) |
| Change in unrealized appreciation (depreciation): | |
| Investments | $ (82,036,961) |
| Investments - affiliated investments | (1,157,991) |
| Futures contracts | (5,164,370) |
| Swap contracts | (44,031) |
| Foreign currency | 77,521 |
| Forward foreign currency exchange contracts | (3,665,994) |
| Net change in unrealized appreciation (depreciation) | $ (91,991,826) |
| Net realized and unrealized loss | $(140,396,427) |
| Distributions to preferred shareholders | $ (9,997,733) |
| Net decrease in net assets from operations | $ (68,527,586) |
52
See Notes to Financial Statements.
Eaton Vance
Limited Duration Income Fund
March 31, 2023
Statements of Changes in Net Assets
| | Year Ended March 31, |
| | 2023 | 2022 |
| Increase (Decrease) in Net Assets | | |
| From operations: | | |
| Net investment income | $ 81,866,574 | $ 74,344,411 |
| Net realized gain (loss) | (48,404,601) | 3,126,359 |
| Net change in unrealized appreciation (depreciation) | (91,991,826) | (85,016,408) |
| Distributions to preferred shareholders | (9,997,733) | (344,223) |
| Net decrease in net assets from operations | $ (68,527,586) | $ (7,889,861) |
| Distributions to common shareholders | $ (83,662,686) | $ (79,170,448) |
| Tax return of capital to common shareholders | $ (55,781,466) | $ (60,229,921) |
| Capital share transactions: | | |
| Reinvestment of distributions to common shareholders | $ — | $ 748,152 |
| Net increase in net assets from capital share transactions | $ — | $ 748,152 |
| Net decrease in net assets | $ (207,971,738) | $ (146,542,078) |
| Net Assets Applicable to Common Shares | | |
| At beginning of year | $ 1,429,150,019 | $ 1,575,692,097 |
| At end of year | $1,221,178,281 | $1,429,150,019 |
53
See Notes to Financial Statements.
Eaton Vance
Limited Duration Income Fund
March 31, 2023
| | Year Ended |
| | March 31, 2023 |
| Cash Flows From Operating Activities | |
| Net decrease in net assets from operations | $ (68,527,586) |
| Distributions to preferred shareholders | 9,997,733 |
| Net decrease in net assets from operations excluding distributions to preferred shareholders | $ (58,529,853) |
| Adjustments to reconcile net decrease in net assets from operations to net cash provided by operating activities: | |
| Investments purchased | (3,977,937,671) |
| Investments sold and principal repayments | 4,262,756,423 |
| Decrease in short-term investments, net | 20,186,777 |
| Net amortization/accretion of premium (discount) | 4,863,903 |
| Amortization of prepaid upfront fees on notes payable | 457,978 |
| Increase in interest receivable | (2,669,950) |
| Increase in interest and dividends receivable from affiliated investments | (126,890) |
| Decrease in receivable for variation margin on open centrally cleared derivatives | 74,059 |
| Decrease in receivable for open forward foreign currency exchange contracts | 1,910,404 |
| Increase in tax reclaims receivable | (7,874) |
| Decrease in cash collateral due to broker | (172,236) |
| Decrease in payable for variation margin on open futures contracts | (431,352) |
| Increase in payable for open forward foreign currency exchange contracts | 1,705,893 |
| Increase in payable for open swap contracts | 6,851 |
| Decrease in upfront receipts on open non-centrally cleared swap contracts | (13,649) |
| Decrease in payable to affiliate for investment adviser fee | (288,288) |
| Increase in accrued expenses | 1,337,629 |
| Decrease in unfunded loan commitments | (854,132) |
| Net change in unrealized appreciation (depreciation) from investments | 83,194,952 |
| Net realized loss from investments | 76,541,879 |
| Net cash provided by operating activities | $ 412,004,853 |
| Cash Flows From Financing Activities | |
| Cash distributions paid to common shareholders | $ (139,444,152) |
| Cash distributions paid to preferred shareholders | (9,873,101) |
| Proceeds from notes payable | 120,000,000 |
| Repayments of notes payable | (384,000,000) |
| Net cash used in financing activities | $ (413,317,253) |
| Net decrease in cash and restricted cash* | $ (1,312,400) |
| Cash and restricted cash at beginning of year (including foreign currency) | $ 14,717,894 |
| Cash and restricted cash at end of year (including foreign currency) | $ 13,405,494 |
| Supplemental disclosure of cash flow information: | |
| Cash paid for interest and fees on borrowings | $ 16,606,866 |
| * | Includes net change in unrealized appreciation (depreciation) on foreign currency of $14,392. |
54
See Notes to Financial Statements.
Eaton Vance
Limited Duration Income Fund
March 31, 2023
Statement of Cash Flows — continued
The following table provides a reconciliation of cash and restricted cash reported within the Statement of Assets and Liabilities that sum to the total of such amounts shown on the Statement of Cash Flows.
| | |
| | March 31, 2023 |
| Cash | $ 4,100,106 |
| Deposits for derivatives collateral: | |
| Futures contracts | 770,557 |
| Centrally cleared derivatives | 471,949 |
| OTC derivatives | 3,550,400 |
| Deposits for forward commitment securities | 257,764 |
| Foreign currency | 4,254,718 |
| Total cash and restricted cash as shown on the Statement of Cash Flows | $13,405,494 |
55
See Notes to Financial Statements.
Eaton Vance
Limited Duration Income Fund
March 31, 2023
Selected data for a common share outstanding during the periods stated
| | Year Ended March 31, |
| | 2023 | 2022 | 2021 | 2020 | 2019 |
| Net asset value — Beginning of year (Common shares) | $ 12.300 | $ 13.570 | $ 11.750 | $ 14.450 | $ 14.740 |
| Income (Loss) From Operations | | | | | |
| Net investment income(1) | $ 0.705 | $ 0.640 | $ 0.756 | $ 0.762 | $ 0.826 |
| Net realized and unrealized gain (loss) | (1.209) | (0.707) | 2.271 | (2.390) | (0.267) |
Distributions to preferred shareholders:
From net investment income(1) | (0.086) | (0.003) | (0.007) | (0.055) | (0.066) |
| Discount on redemption and repurchase of auction preferred shares(1) | — | — | — | — | 0.035 |
| Total income (loss) from operations | $ (0.590) | $ (0.070) | $ 3.020 | $ (1.683) | $ 0.528 |
| Less Distributions to Common Shareholders | | | | | |
| From net investment income | $ (0.720) | $ (0.681) | $ (0.789) | $ (0.839) | $ (0.818) |
| Tax return of capital | (0.480) | (0.519) | (0.411) | (0.178) | — |
| Total distributions to common shareholders | $ (1.200) | $ (1.200) | $ (1.200) | $ (1.017) | $ (0.818) |
| Net asset value — End of year (Common shares) | $10.510 | $12.300 | $13.570 | $11.750 | $14.450 |
| Market value — End of year (Common shares) | $ 9.850 | $11.700 | $12.630 | $10.570 | $12.650 |
| Total Investment Return on Net Asset Value(2) | (3.98)% | (0.42)% | 27.62% | (11.69)% | 4.57% (3) |
| Total Investment Return on Market Value(2) | (5.30)% | 1.70% | 32.25% | (9.33)% | 3.70% |
56
See Notes to Financial Statements.
Eaton Vance
Limited Duration Income Fund
March 31, 2023
Financial Highlights — continued
Selected data for a common share outstanding during the periods stated
| | Year Ended March 31, |
| | 2023 | 2022 | 2021 | 2020 | 2019 |
| Ratios/Supplemental Data | | | | | |
| Net assets applicable to common shares, end of year (000’s omitted) | $1,221,178 | $1,429,150 | $1,575,692 | $1,365,197 | $1,678,459 |
| Ratios (as a percentage of average daily net assets applicable to common shares):(4)† | | | | | |
| Expenses excluding interest and fees | 1.29% | 1.24% | 1.33% | 1.29% | 1.31% |
| Interest and fee expense(5) | 1.43% | 0.53% | 0.58% | 1.33% | 1.43% |
| Total expenses | 2.72% (6) | 1.77% | 1.91% | 2.62% | 2.74% |
| Net investment income | 6.47% | 4.83% | 5.73% | 5.33% | 5.71% |
| Portfolio Turnover | 201% (7) | 137% (7) | 57% (7) | 49% | 34% |
| Senior Securities: | | | | | |
| Total notes payable outstanding (in 000’s) | $ 314,000 | $ 578,000 | $ 570,000 | $ 525,000 | $ 595,000 |
| Asset coverage per $1,000 of notes payable(8) | $ 5,577 | $ 3,846 | $ 4,143 | $ 4,012 | $ 4,184 |
| Total preferred shares outstanding | 8,640 | 8,640 | 8,640 | 8,640 | 8,640 |
| Asset coverage per preferred share(9) | $ 82,609 | $ 69,999 | $ 75,118 | $ 71,062 | $ 76,744 |
| Involuntary liquidation preference per preferred share(10) | $ 25,000 | $ 25,000 | $ 25,000 | $ 25,000 | $ 25,000 |
| Approximate market value per preferred share(10) | $ 25,000 | $ 25,000 | $ 25,000 | $ 25,000 | $ 25,000 |
| (1) | Computed using average common shares outstanding. |
| (2) | Returns are historical and are calculated by determining the percentage change in net asset value or market value with all distributions reinvested. Distributions are assumed to be reinvested at prices obtained under the Fund's dividend reinvestment plan. |
| (3) | The total return based on net asset value reflects the impact of the tender and repurchase by the Fund of a portion of its Auction Preferred Shares at 92% of the per share liquidation preference. Absent this transaction, the total return based on net asset value would have been 4.31%. |
| (4) | Ratios do not reflect the effect of dividend payments to preferred shareholders. |
| (5) | Interest and fee expense relates to the notes payable, a portion of which was incurred to partially redeem the Fund’s Auction Preferred Shares (see Note 2). |
| (6) | Includes a reduction by the investment adviser of a portion of its adviser fee due to the Fund's investment in the Liquidity Fund (equal to less than 0.01% of average daily net assets for the year ended March 31, 2023). |
| (7) | Includes the effect of To-Be-Announced (TBA) transactions. |
| (8) | Calculated by subtracting the Fund’s total liabilities (not including the notes payable and preferred shares) from the Fund’s total assets, and dividing the result by the notes payable balance in thousands. |
| (9) | Calculated by subtracting the Fund’s total liabilities (not including the notes payable and preferred shares) from the Fund’s total assets, dividing the result by the sum of the value of the notes payable and liquidation value of the preferred shares, and multiplying the result by the liquidation value of one preferred share. Such amount equates to 330%, 280%, 300%, 284% and 307% at March 31, 2023, 2022, 2021, 2020 and 2019, respectively. |
| (10) | Plus accumulated and unpaid dividends. |
| † | Ratios based on net assets applicable to common shares plus preferred shares and borrowings are presented below. Ratios do not reflect the effect of dividend payments to preferred shareholders. |
| | Year Ended March 31, |
| | 2023 | 2022 | 2021 | 2020 | 2019 |
| Expenses excluding interest and fees | 0.85% | 0.83% | 0.88% | 0.86% | 0.87% |
| Interest and fee expense | 0.94% | 0.36% | 0.38% | 0.89% | 0.95% |
| Total expenses | 1.79% | 1.19% | 1.26% | 1.75% | 1.82% |
| Net investment income | 4.24% | 3.25% | 3.79% | 3.57% | 3.79% |
57
See Notes to Financial Statements.
Eaton Vance
Limited Duration Income Fund
March 31, 2023
Notes to Financial Statements
1 Significant Accounting Policies
Eaton Vance Limited Duration Income Fund (the Fund) is a Massachusetts business trust registered under the Investment Company Act of 1940, as amended (the 1940 Act), as a diversified, closed-end management investment company. The Fund's primary investment objective is to provide a high level
of current income. The Fund may, as a secondary objective, also seek capital appreciation to the extent it is consistent with its primary objective.
The following is a summary of significant accounting policies of the Fund. The policies are in conformity with accounting principles generally accepted in the United States of America (U.S. GAAP). The Fund is an investment company and follows accounting and reporting guidance in the Financial Accounting Standards Board (FASB) Accounting Standards Codification Topic 946.
A Investment Valuation—The following methodologies are used to determine the market value or fair value of investments.
Senior Floating-Rate Loans. Interests in senior floating-rate loans (Senior Loans) are valued generally at the average mean of bid and ask quotations obtained from a third party pricing service. Senior Loans, for which a valuation is not available or deemed unreliable, are fair valued by the investment adviser utilizing one or more of the valuation techniques described below to assess the likelihood that the borrower will make a full repayment of the loan underlying such Senior Loan. If the investment adviser believes that there is a reasonable likelihood of full repayment, the investment adviser will determine fair value using a matrix pricing approach that considers the yield on the Senior Loan relative to yields on other Senior Loans issued by companies of comparable credit quality. If the investment adviser believes there is not a reasonable likelihood of full repayment, the investment adviser will determine fair value using analyses that include, but are not limited to: (i) a comparison of the value of the borrower’s outstanding equity and debt to that of comparable public companies; (ii) a discounted cash flow analysis; or (iii) when the investment adviser believes it is likely that a borrower will be liquidated or sold, an analysis of the terms of such liquidation or sale. In certain cases, the investment adviser will use a combination of analytical methods to determine fair value, such as when only a portion of a borrower’s assets are likely to be sold. In conducting its assessment and analyses for purposes of determining fair value of a Senior Loan, the investment adviser will use its discretion and judgment in considering and appraising relevant factors. Junior Loans (i.e., subordinated loans and second lien loans) are valued in the same manner as Senior Loans.
Debt Obligations. Debt obligations are generally valued on the basis of valuations provided by third party pricing services, as derived from such services’ pricing models. Inputs to the models may include, but are not limited to, reported trades, executable bid and ask prices, broker/dealer quotations, prices or yields of securities with similar characteristics, interest rates, anticipated prepayments, benchmark curves or information pertaining to the issuer, as well as industry and economic events. The pricing services may use a matrix approach, which considers information regarding securities with similar characteristics to determine the valuation for a security. Short-term debt obligations purchased with a remaining maturity of sixty days or less for which a valuation from a third party pricing service is not readily available may be valued at amortized cost, which approximates fair value.
Equity Securities. Equity securities listed on a U.S. securities exchange generally are valued at the last sale or closing price on the day of valuation or, if no sales took place on such date, at the mean between the closing bid and ask prices on the exchange where such securities are principally traded. Equity securities listed on the NASDAQ National Market System are valued at the NASDAQ official closing price. Unlisted or listed securities for which closing sales prices or closing quotations are not available are valued at the mean between the latest available bid and ask prices or, in the case of preferred equity securities that are not listed or traded in the over-the-counter market, by a third party pricing service that uses various techniques that consider factors including, but not limited to, prices or yields of securities with similar characteristics, benchmark yields, broker/dealer quotes, quotes of underlying common stock, issuer spreads, as well as industry and economic events.
Derivatives. Futures contracts are valued at the closing settlement price established by the board of trade or exchange on which they are traded. Forward foreign currency exchange contracts are generally valued at the mean of the average bid and average ask prices that are reported by currency dealers to a third party pricing service at the valuation time. Such third party pricing service valuations are supplied for specific settlement periods and the Fund’s forward foreign currency exchange contracts are valued at an interpolated rate between the closest preceding and subsequent settlement period reported by the third party pricing service. Swaps are normally valued using valuations provided by a third party pricing service. Such pricing service valuations are based on the present value of fixed and projected floating rate cash flows over the term of the swap contract, and in the case of credit default swaps, based on credit spread quotations obtained from broker/dealers and expected default recovery rates determined by the pricing service using proprietary models. Future cash flows on swaps are discounted to their present value using swap rates provided by electronic data services or by broker/dealers.
Foreign Securities and Currencies. Foreign securities and currencies are valued in U.S. dollars, based on foreign currency exchange rate quotations supplied by a third party pricing service. The pricing service uses a proprietary model to determine the exchange rate. Inputs to the model include reported trades and implied bid/ask spreads. The daily valuation of exchange-traded foreign securities generally is determined as of the close of trading on the principal exchange on which such securities trade. Events occurring after the close of trading on foreign exchanges may result in adjustments to the valuation of foreign securities to more accurately reflect their fair value as of the close of regular trading on the New York Stock Exchange. When valuing foreign equity securities that meet certain criteria, the Fund's Trustees have approved the use of a fair value service that values such securities to reflect market trading that occurs after the close of the applicable foreign markets of comparable securities or other instruments that have a strong correlation to the fair-valued securities.
Other. Investments in management investment companies (including money market funds) that do not trade on an exchange are valued at the net asset value as of the close of each business day.
Eaton Vance
Limited Duration Income Fund
March 31, 2023
Notes to Financial Statements — continued
Fair Valuation. In connection with Rule 2a-5 of the 1940 Act, the Trustees have designated the Fund’s investment adviser as its valuation designee. Investments for which valuations or market quotations are not readily available or are deemed unreliable are valued by the investment adviser, as valuation designee, at fair value using methods that most fairly reflect the security’s “fair value”, which is the amount that the Fund might reasonably expect to receive for the security upon its current sale in the ordinary course. Each such determination is based on a consideration of relevant factors, which are likely to vary from one pricing context to another. These factors may include, but are not limited to, the type of security, the existence of any contractual restrictions on the security’s disposition, the price and extent of public trading in similar securities of the issuer or of comparable companies or entities, quotations or relevant information obtained from broker/dealers or other market participants, information obtained from the issuer, analysts, and/or the appropriate stock exchange (for exchange-traded securities), an analysis of the company’s or entity’s financial statements, and an evaluation of the forces that influence the issuer and the market(s) in which the security is purchased and sold.
B Investment Transactions—Investment transactions for financial statement purposes are accounted for on a trade date basis. Realized gains and losses on investments sold are determined on the basis of identified cost.
C Income—Interest income is recorded on the basis of interest accrued, adjusted for amortization of premium or accretion of discount. Fees associated with loan amendments are recognized immediately. Dividend income is recorded on the ex-dividend date for dividends received in cash and/or securities. Withholding taxes on foreign interest have been provided for in accordance with the Fund’s understanding of the applicable countries’ tax rules and rates. Distributions from investment companies are recorded as dividend income, capital gains or return of capital based on the nature of the distribution.
D Federal Taxes—The Fund's policy is to comply with the provisions of the Internal Revenue Code applicable to regulated investment companies and to distribute to shareholders each year substantially all of its net investment income, and all or substantially all of its net realized capital gains. Accordingly, no provision for federal income or excise tax is necessary.
As of March 31, 2023, the Fund had no uncertain tax positions that would require financial statement recognition, de-recognition, or disclosure. The Fund files a U.S. federal income tax return annually after its fiscal year-end, which is subject to examination by the Internal Revenue Service for a period of three years from the date of filing.
E Foreign Currency Translation—Investment valuations, other assets, and liabilities initially expressed in foreign currencies are translated each business day into U.S. dollars based upon current exchange rates. Purchases and sales of foreign investment securities and income and expenses denominated in foreign currencies are translated into U.S. dollars based upon currency exchange rates in effect on the respective dates of such transactions. Recognized gains or losses on investment transactions attributable to changes in foreign currency exchange rates are recorded for financial statement purposes as net realized gains and losses on investments. That portion of unrealized gains and losses on investments that results from fluctuations in foreign currency exchange rates is not separately disclosed.
F Unfunded Loan Commitments—The Fund may enter into certain loan agreements all or a portion of which may be unfunded. The Fund is obligated to fund these commitments at the borrower's discretion. These commitments are disclosed in the accompanying Portfolio of Investments. At March 31, 2023, the Fund had sufficient cash and/or securities to cover these commitments.
G Use of Estimates—The preparation of the financial statements in conformity with U.S. GAAP requires management to make estimates and assumptions that affect the reported amounts of assets and liabilities at the date of the financial statements and the reported amounts of income and expense during the reporting period. Actual results could differ from those estimates.
H Indemnifications—Under the Fund’s organizational documents, its officers and Trustees may be indemnified against certain liabilities and expenses arising out of the performance of their duties to the Fund. Under Massachusetts law, if certain conditions prevail, shareholders of a Massachusetts business trust (such as the Fund) could be deemed to have personal liability for the obligations of the Fund. However, the Fund’s Declaration of Trust contains an express disclaimer of liability on the part of Fund shareholders and the By-laws provide that the Fund shall assume, upon request by the shareholder, the defense on behalf of any Fund shareholders. Moreover, the By-laws also provide for indemnification out of Fund property of any shareholder held personally liable solely by reason of being or having been a shareholder for all loss or expense arising from such liability. Additionally, in the normal course of business, the Fund enters into agreements with service providers that may contain indemnification clauses. The Fund’s maximum exposure under these arrangements is unknown as this would involve future claims that may be made against the Fund that have not yet occurred.
I Futures Contracts—Upon entering into a futures contract, the Fund is required to deposit with the broker, either in cash or securities, an amount equal to a certain percentage of the contract amount (initial margin). Subsequent payments, known as variation margin, are made or received by the Fund each business day, depending on the daily fluctuations in the value of the underlying security, and are recorded as unrealized gains or losses by the Fund. Gains (losses) are realized upon the expiration or closing of the futures contracts. Should market conditions change unexpectedly, the Fund may not achieve the anticipated benefits of the futures contracts and may realize a loss. Futures contracts have minimal counterparty risk as they are exchange traded and the clearinghouse for the exchange is substituted as the counterparty, guaranteeing counterparty performance.
J Forward Foreign Currency Exchange Contracts—The Fund may enter into forward foreign currency exchange contracts for the purchase or sale of a specific foreign currency at a fixed price on a future date. The forward foreign currency exchange contracts are adjusted by the daily exchange rate of the underlying currency and any gains or losses are recorded as unrealized until such time as the contracts have been closed. While forward foreign currency
Eaton Vance
Limited Duration Income Fund
March 31, 2023
Notes to Financial Statements — continued
exchange contracts are privately negotiated agreements between the Fund and a counterparty, certain contracts may be “centrally cleared”, whereby all payments made or received by the Fund pursuant to the contract are with a central clearing party (CCP) rather than the original counterparty. The CCP guarantees the performance of the original parties to the contract. Upon entering into centrally cleared contracts, the Fund is required to deposit with the CCP, either in cash or securities, an amount of initial margin determined by the CCP, which is subject to adjustment. For centrally cleared contracts, the daily change in valuation is recorded as a receivable or payable for variation margin and settled in cash with the CCP daily. Risks may arise upon entering these contracts from the potential inability of counterparties to meet the terms of their contracts and from movements in the value of a foreign currency relative to the U.S. dollar. In the case of centrally cleared contracts, counterparty risk is minimal due to protections provided by the CCP.
K Interest Rate Swaps—Swap contracts are privately negotiated agreements between the Fund and a counterparty. Certain swap contracts may be centrally cleared. Pursuant to interest rate swap agreements, the Fund either makes floating-rate payments to the counterparty (or CCP in the case of centrally cleared swaps) based on a benchmark interest rate in exchange for fixed-rate payments or the Fund makes fixed-rate payments to the counterparty (or CCP in the case of a centrally cleared swap) in exchange for payments on a floating benchmark interest rate. Payments received or made, including amortization of upfront payments/receipts, if any (which are amortized over the life of the swap contract), are recorded as realized gains or losses. During the term of the outstanding swap agreement, changes in the underlying value of the swap are recorded as unrealized gains or losses. For centrally cleared swaps, the daily change in valuation is recorded as a receivable or payable for variation margin and settled in cash with the CCP daily. The value of the swap is determined by changes in the relationship between two rates of interest. The Fund is exposed to credit loss in the event of non-performance by the swap counterparty. In the case of centrally cleared swaps, counterparty risk is minimal due to protections provided by the CCP. Risk may also arise from movements in interest rates.
L Credit Default Swaps—When the Fund is the buyer of a credit default swap contract, the Fund is entitled to receive the par (or other agreed-upon) value of a referenced debt obligation (or basket of debt obligations) from the counterparty (or CCP in the case of a centrally cleared swap) to the contract if a credit event by a third party, such as a U.S. or foreign corporate issuer or sovereign issuer, on the debt obligation occurs. In return, the Fund pays the counterparty a periodic stream of payments over the term of the contract provided that no credit event has occurred. If no credit event occurs, the Fund would have spent the stream of payments and received no proceeds from the contract. When the Fund is the seller of a credit default swap contract, it receives the stream of payments, but is obligated to pay to the buyer of the protection an amount up to the notional amount of the swap and in certain instances take delivery of securities of the reference entity upon the occurrence of a credit event, as defined under the terms of that particular swap agreement. Credit events are contract specific but may include bankruptcy, failure to pay, restructuring, obligation acceleration and repudiation/moratorium. If the Fund is a seller of protection and a credit event occurs, the maximum potential amount of future payments that the Fund could be required to make would be an amount equal to the notional amount of the agreement. This potential amount would be partially offset by any recovery value of the respective referenced obligation, or net amount received from the settlement of a buy protection credit default swap agreement entered into by the Fund for the same referenced obligation. As the seller, the Fund may create economic leverage to its portfolio because, in addition to its total net assets, the Fund is subject to investment exposure on the notional amount of the swap. The interest fee paid or received on the swap contract, which is based on a specified interest rate on a fixed notional amount, is accrued daily as a component of unrealized appreciation (depreciation) and is recorded as realized gain upon receipt or realized loss upon payment. The Fund also records an increase or decrease to unrealized appreciation (depreciation) in an amount equal to the daily valuation. For centrally cleared swaps, the daily change in valuation is recorded as a receivable or payable for variation margin and settled in cash with the CCP daily. All upfront payments and receipts, if any, are amortized over the life of the swap contract as realized gains or losses. Those upfront payments or receipts for non-centrally cleared swaps are recorded as other assets or other liabilities, respectively, net of amortization. For financial reporting purposes, unamortized upfront payments or receipts, if any, are netted with unrealized appreciation or depreciation on swap contracts to determine the market value of swaps as presented in Notes 7 and 10. These transactions involve certain risks, including the risk that the seller may be unable to fulfill the transaction. In the case of centrally cleared swaps, counterparty risk is minimal due to protections provided by the CCP.
M When-Issued Securities and Delayed Delivery Transactions—The Fund may purchase securities on a delayed delivery, when-issued or forward commitment basis, including TBA (To Be Announced) securities. Payment and delivery may take place after the customary settlement period for that security. At the time the transaction is negotiated, the price of the security that will be delivered is fixed. Securities purchased on a delayed delivery, when-issued or forward commitment basis are marked-to-market daily and begin earning interest on settlement date. Such security purchases are subject to the risk that when delivered they will be worth less than the agreed upon payment price. Losses may also arise if the counterparty does not perform under the contract. A forward purchase commitment may also be closed by entering into an offsetting commitment. If an offsetting commitment is entered into, the Fund will realize a gain or loss on investments based on the price established when the Fund entered into the commitment.
N Stripped Mortgage-Backed Securities—The Fund may invest in Interest Only (IO) and Principal Only (PO) securities, a form of stripped mortgage-backed securities, whereby the IO security receives all the interest and the PO security receives all the principal on a pool of mortgage assets. The yield to maturity on an IO security is extremely sensitive to the rate of principal payments (including prepayments) on the related underlying mortgage assets, and a rapid rate of principal payments may have a material adverse effect on the yield to maturity from these securities. If the underlying mortgages experience greater than anticipated prepayments of principal, the Fund may fail to recoup its initial investment in an IO security. The market value of IO and PO securities can be unusually volatile due to changes in interest rates.
Eaton Vance
Limited Duration Income Fund
March 31, 2023
Notes to Financial Statements — continued
2 Auction Preferred Shares
The Fund issued Auction Preferred Shares (APS) on July 25, 2003 in a public offering. Dividends on the APS, which accrue daily, are cumulative at rates which are reset every seven days by an auction, unless a special dividend period has been set. Series of APS are identical in all respects except for the reset dates of the dividend rates. If the APS auctions do not successfully clear, the dividend payment rate over the next period for the APS holders is set at a specified maximum applicable rate until such time as the APS auctions are successful. Auctions have not cleared since February 13, 2008 and the rate since that date has been the maximum applicable rate (see Note 3). The maximum applicable rate on the APS is 160% of the “AA” Financial Composite Commercial Paper Rate at the date of the auction. The stated spread over the reference benchmark rate is determined based on the credit rating of the APS.
The number of APS issued and outstanding at March 31, 2023 are as follows:
| | APS Issued and
Outstanding |
| Series A | 1,728 |
| Series B | 1,728 |
| Series C | 1,728 |
| Series D | 1,728 |
| Series E | 1,728 |
The APS are redeemable at the option of the Fund at a redemption price equal to $25,000 per share, plus accumulated and unpaid dividends, on any dividend payment date. The APS are also subject to mandatory redemption at a redemption price equal to $25,000 per share, plus accumulated and unpaid dividends, if the Fund is in default for an extended period on its asset maintenance requirements with respect to the APS. If the dividends on the APS remain unpaid in an amount equal to two full years’ dividends, the holders of the APS as a class have the right to elect a majority of the Board of Trustees. In general, the holders of the APS and the common shares have equal voting rights of one vote per share, except that the holders of the APS, as a separate class, have the right to elect at least two members of the Board of Trustees. The APS have a liquidation preference of $25,000 per share, plus accumulated and unpaid dividends. The Fund is required to maintain certain asset coverage with respect to the APS as defined in the Fund's By-Laws and the 1940 Act. The Fund pays an annual fee up to 0.15% of the liquidation value of the APS to broker/dealers as a service fee if the auctions are unsuccessful; otherwise, the annual fee is 0.25%.
3 Distributions to Shareholders and Income Tax Information
The Fund intends to make monthly distributions of net investment income to common shareholders, after payment of any dividends on any outstanding APS. In addition, at least annually, the Fund intends to distribute all or substantially all of its net realized capital gains. Distributions to common shareholders are recorded on the ex-dividend date. Distributions to preferred shareholders are recorded daily and are payable at the end of each dividend period. The dividend rates for the APS at March 31, 2023, and the amount of dividends accrued (including capital gains, if any) to APS shareholders, average APS dividend rates, and dividend rate ranges for the year then ended were as follows:
| | APS Dividend
Rates at
March 31, 2023 | Dividends
Accrued to
APS
Shareholders | Average
APS
Dividend
Rates | Dividend
Rate
Ranges
(%) |
| Series A | 7.73% | $1,990,056 | 4.61% | 0.56-7.73 |
| Series B | 7.73 | 1,999,901 | 4.63 | 0.66-7.73 |
| Series C | 7.73 | 1,999,548 | 4.63 | 0.66-7.73 |
| Series D | 7.74 | 2,018,870 | 4.67 | 0.63-7.74 |
| Series E | 7.74 | 1,989,358 | 4.60 | 0.61-7.74 |
Beginning February 13, 2008 and consistent with the patterns in the broader market for auction-rate securities, the Fund's APS auctions were unsuccessful in clearing due to an imbalance of sell orders over bids to buy the APS. As a result, the dividend rates of the APS were reset to the maximum applicable rates. The table above reflects such maximum dividend rate for each series as of March 31, 2023.
Eaton Vance
Limited Duration Income Fund
March 31, 2023
Notes to Financial Statements — continued
Distributions to shareholders are determined in accordance with income tax regulations, which may differ from U.S. GAAP. As required by U.S. GAAP, only distributions in excess of tax basis earnings and profits are reported in the financial statements as a return of capital. Permanent differences between book and tax accounting relating to distributions are reclassified to paid-in capital. For tax purposes, distributions from short-term capital gains are considered to be from ordinary income.
The tax character of distributions declared for the years ended March 31, 2023 and March 31, 2022 was as follows:
| | Year Ended March 31, |
| | 2023 | 2022 |
| Ordinary income | $93,660,419 | $79,514,671 |
| Tax return of capital | $55,781,466 | $60,229,921 |
During the year ended March 31, 2023, accumulated loss was decreased by $2,326 and paid-in capital was decreased by $2,326 due to differences between book and tax accounting for investments in swap contracts. These reclassifications had no effect on the net assets or net asset value per share of the Fund.
As of March 31, 2023, the components of distributable earnings (accumulated loss) on a tax basis were as follows:
| Deferred capital losses | $ (219,516,627) |
| Late year ordinary losses | (2,077,548) |
| Net unrealized depreciation | (185,637,903) |
| Accumulated loss | $(407,232,078) |
At March 31, 2023, the Fund, for federal income tax purposes, had deferred capital losses of $219,516,627 which would reduce its taxable income arising from future net realized gains on investment transactions, if any, to the extent permitted by the Internal Revenue Code, and thus would reduce the amount of distributions to shareholders, which would otherwise be necessary to relieve the Fund of any liability for federal income or excise tax. The deferred capital losses are treated as arising on the first day of the Fund’s next taxable year and retain the same short-term or long-term character as when originally deferred. Of the deferred capital losses at March 31, 2023, $54,851,996 are short-term and $164,664,631 are long-term.
Additionally, at March 31, 2023, the Fund had a late year ordinary loss of $2,077,548 which it has elected to defer to the following taxable year pursuant to income tax regulations. Late year ordinary losses represent certain specified losses realized in that portion of a taxable year after October 31 that are treated as ordinary for tax purposes plus ordinary losses attributable to that portion of a taxable year after December 31.
The cost and unrealized appreciation (depreciation) of investments, including open derivative contracts, of the Fund at March 31, 2023, as determined on a federal income tax basis, were as follows:
| Aggregate cost | $2,141,869,252 |
| Gross unrealized appreciation | $ 15,296,090 |
| Gross unrealized depreciation | (200,770,185) |
| Net unrealized depreciation | $ (185,474,095) |
4 Investment Adviser Fee and Other Transactions with Affiliates
The investment adviser fee is earned by Eaton Vance Management (EVM), an indirect, wholly-owned subsidiary of Morgan Stanley, as compensation for investment advisory services rendered to the Fund. The fee is computed at an annual rate of 0.75% of the Fund’s average weekly gross assets and is payable monthly. Gross assets are calculated by deducting accrued liabilities of the Fund except the principal amount of any indebtedness for money borrowed, including debt securities issued by the Fund, and the amount of any outstanding preferred shares issued by the Fund. Accrued liabilities are expenses incurred in the normal course of operations. For the year ended March 31, 2023, the investment adviser fee amounted to $14,516,524. EVM also serves as administrator of the Fund, but receives no compensation.
Eaton Vance
Limited Duration Income Fund
March 31, 2023
Notes to Financial Statements — continued
Effective April 26, 2022, the Fund may invest in a money market fund, the Institutional Class of the Morgan Stanley Institutional Liquidity Funds - Government Portfolio (the “Liquidity Fund”), an open-end management investment company managed by Morgan Stanley Investment Management Inc., a wholly-owned subsidiary of Morgan Stanley. The investment adviser fee paid by the Fund is reduced by an amount equal to its pro-rata share of the advisory and administration fees paid by the Fund due to its investment in the Liquidity Fund. For the year ended March 31, 2023, the investment adviser fee paid was reduced by $64,277 relating to the Fund’s investment in the Liquidity Fund. Prior to April 26, 2022, the Fund may have invested its cash in Eaton Vance Cash Reserves Fund, LLC (Cash Reserves Fund), an affiliated investment company managed by EVM. EVM did not receive a fee for advisory services provided to Cash Reserves Fund.
Trustees and officers of the Fund who are members of EVM’s organization receive remuneration for their services to the Fund out of the investment adviser fee. Trustees of the Fund who are not affiliated with EVM may elect to defer receipt of all or a percentage of their annual fees in accordance with the terms of the Trustees Deferred Compensation Plan. For the year ended March 31, 2023, no significant amounts have been deferred. Certain officers and Trustees of the Fund are officers of EVM.
5 Purchases and Sales of Investments
Purchases and sales of investments, other than short-term obligations and including maturities, paydowns, principal repayments on Senior Loans and TBA transactions, for the year ended March 31, 2023 were as follows:
| | Purchases | Sales |
| Investments (non-U.S. Government) | $ 341,643,889 | $ 486,396,699 |
| U.S. Government and Agency Securities | 3,761,995,888 | 3,763,894,812 |
| | $4,103,639,777 | $4,250,291,511 |
6 Common Shares of Beneficial Interest
The Fund may issue common shares pursuant to its dividend reinvestment plan. There were no common shares issued by the Fund for the year ended March 31, 2023. Common shares issued by the Fund pursuant to its dividend reinvestment plan for the year ended March 31, 2022 were 56,442.
In November 2013, the Board of Trustees initially approved a share repurchase program for the Fund. Pursuant to the reauthorization of the share repurchase program by the Board of Trustees in March 31, 2019, the Fund is authorized to repurchase up to 10% of its common shares outstanding as of the last day of the prior calendar year at market prices when shares are trading at a discount to net asset value. The share repurchase program does not obligate the Fund to purchase a specific amount of shares. There were no repurchases of common shares by the Fund for the years ended March 31, 2023 and March 31, 2022.
7 Financial Instruments
The Fund may trade in financial instruments with off-balance sheet risk in the normal course of its investing activities. These financial instruments may include forward foreign currency exchange contracts, futures contracts and swap contracts and may involve, to a varying degree, elements of risk in excess of the amounts recognized for financial statement purposes. The notional or contractual amounts of these instruments represent the investment the Fund has in particular classes of financial instruments and do not necessarily represent the amounts potentially subject to risk. The measurement of the risks associated with these instruments is meaningful only when all related and offsetting transactions are considered. A summary of obligations under these financial instruments at March 31, 2023 is included in the Portfolio of Investments. At March 31, 2023, the Fund had sufficient cash and/or securities to cover commitments under these contracts.
In the normal course of pursuing its investment objectives, the Fund is subject to the following risks:
Credit Risk: The Fund enters into credit default swap contracts to enhance total return and/or as a substitute for the purchase of securities.
Foreign Exchange Risk: The Fund holds foreign currency denominated investments. The value of these investments and related receivables and payables may change due to future changes in foreign currency exchange rates. To hedge against this risk, the Fund enters into forward foreign currency exchange contracts.
Interest Rate Risk: The Fund utilizes various interest rate derivatives including futures contracts to manage the duration of its portfolio and to hedge against fluctuations in securities prices due to interest rates.
Eaton Vance
Limited Duration Income Fund
March 31, 2023
Notes to Financial Statements — continued
The Fund enters into over-the-counter (OTC) derivatives that may contain provisions whereby the counterparty may terminate the contract under certain conditions, including but not limited to a decline in the Fund's net assets below a certain level over a certain period of time, which would trigger a payment by the Fund for those derivatives in a liability position. At March 31, 2023, the fair value of derivatives with credit-related contingent features in a net liability position was $1,910,910. The aggregate fair value of assets pledged as collateral by the Fund for such liability was $3,784,911 at March 31, 2023.
The OTC derivatives in which the Fund invests are subject to the risk that the counterparty to the contract fails to perform its obligations under the contract. To mitigate this risk, the Fund has entered into an International Swaps and Derivatives Association, Inc. Master Agreement (“ISDA Master Agreement”) or similar agreement with substantially all its derivative counterparties. An ISDA Master Agreement is a bilateral agreement between the Fund and a counterparty that governs certain OTC derivatives and typically contains, among other things, set-off provisions in the event of a default and/or termination event as defined under the relevant ISDA Master Agreement. Under an ISDA Master Agreement, the Fund may, under certain circumstances, offset with the counterparty certain derivative financial instruments’ payables and/or receivables with collateral held and/or posted and create one single net payment. The provisions of the ISDA Master Agreement typically permit a single net payment in the event of default including the bankruptcy or insolvency of the counterparty. However, bankruptcy or insolvency laws of a particular jurisdiction may impose restrictions on or prohibitions against the right of offset in bankruptcy or insolvency. Certain ISDA Master Agreements allow counterparties to OTC derivatives to terminate derivative contracts prior to maturity in the event the Fund’s net assets decline by a stated percentage or the Fund fails to meet the terms of its ISDA Master Agreements, which would cause the counterparty to accelerate payment by the Fund of any net liability owed to it.
The collateral requirements for derivatives traded under an ISDA Master Agreement are governed by a Credit Support Annex to the ISDA Master Agreement. Collateral requirements are determined at the close of business each day and are typically based on changes in market values for each transaction under an ISDA Master Agreement and netted into one amount for such agreement. Generally, the amount of collateral due from or to a counterparty is subject to a minimum transfer threshold amount before a transfer is required, which may vary by counterparty. Collateral pledged for the benefit of the Fund and/or counterparty is held in segregated accounts by the Fund’s custodian and cannot be sold, re-pledged, assigned or otherwise used while pledged. The portion of such collateral representing cash, if any, is reflected as deposits for derivatives collateral and, in the case of cash pledged by a counterparty for the benefit of the Fund, a corresponding liability on the Statement of Assets and Liabilities. Securities pledged by the Fund as collateral, if any, are identified as such in the Portfolio of Investments. The carrying amount of the liability for cash collateral due to brokers at March 31, 2023 approximated its fair value. If measured at fair value, such liability would have been considered as Level 2 in the fair value hierarchy (see Note 10) at March 31, 2023.
The fair value of open derivative instruments (not considered to be hedging instruments for accounting disclosure purposes) by risk exposure at March 31, 2023 was as follows:
| | Fair Value |
| Statement of Assets and Liabilities Caption | Credit | Foreign
Exchange | Interest
Rate | Total |
| Accumulated loss | $ 12,122* | $ — | $ 187,859* | $ 199,981 |
| Receivable for open forward foreign currency exchange contracts | — | 325,826 | — | 325,826 |
| Total Asset Derivatives | $ 12,122 | $ 325,826 | $ 187,859 | $ 525,807 |
| Derivatives not subject to master netting or similar agreements | $ 12,122 | $ — | $ 187,859 | $ 199,981 |
| Total Asset Derivatives subject to master netting or similar agreements | $ — | $ 325,826 | $ — | $ 325,826 |
| Accumulated loss | $ — | $ (90,760) | $ (751,189) | $ (841,949) |
| Payable for open forward foreign currency exchange contracts | — | (1,795,454) | — | (1,795,454) |
| Payable for open swap contracts; Upfront receipts on open non-centrally cleared swap contracts | (115,456) | — | — | (115,456) |
| Total Liability Derivatives | $(115,456) | $(1,886,214) | $(751,189) | $(2,752,859) |
| Derivatives not subject to master netting or similar agreements | $ — | $ (90,760) | $(751,189) | $ (841,949) |
| Total Liability Derivatives subject to master netting or similar agreements | $(115,456) | $(1,795,454) | $ — | $(1,910,910) |
| * | For futures contracts and centrally cleared derivatives, amount represents value as shown in the Portfolio of Investments. Only the current day’s variation margin on open futures contracts and centrally cleared derivatives is reported within the Statement of Assets and Liabilities as Receivable or Payable for variation margin on open futures contracts and centrally cleared derivatives, as applicable. |
Eaton Vance
Limited Duration Income Fund
March 31, 2023
Notes to Financial Statements — continued
The Fund's derivative assets and liabilities at fair value by risk, which are reported gross in the Statement of Assets and Liabilities, are presented in the table above. The following tables present the Fund's derivative assets and liabilities by counterparty, net of amounts available for offset under a master netting agreement and net of the related collateral received by the Fund for such assets and pledged by the Fund for such liabilities as of March 31, 2023.
| Counterparty | Derivative
Assets Subject to
Master Netting
Agreement | Derivatives
Available
for Offset | Non-cash
Collateral
Received(a) | Cash
Collateral
Received(a) | Net Amount
of Derivative
Assets(b) | Total Cash
Collateral
Received |
| Bank of America, N.A. | $ 9,991 | $ (9,991) | $ — | $ — | $ — | $ — |
| Citibank, N.A. | 204,684 | (128,099) | — | — | 76,585 | — |
| Goldman Sachs International | 1,504 | (1,504) | — | — | — | — |
| HSBC Bank USA, N.A. | 5,456 | (5,456) | — | — | — | — |
| JPMorgan Chase Bank, N.A. | 51 | — | — | — | 51 | — |
| Standard Chartered Bank | 81,761 | (81,761) | — | — | — | — |
| State Street Bank and Trust Company | 14,957 | (14,957) | — | — | — | — |
| UBS AG | 7,422 | — | — | — | 7,422 | — |
| | $325,826 | $(241,768) | $ — | $ — | $84,058 | $ — |
| Counterparty | Derivative
Liabilities Subject to
Master Netting
Agreement | Derivatives
Available
for Offset | Non-cash
Collateral
Pledged(a) | Cash
Collateral
Pledged(a) | Net Amount
of Derivative
Liabilities(c) | Total Cash
Collateral
Pledged |
| Bank of America, N.A. | $ (38,301) | $ 9,991 | $ — | $ — | $ (28,310) | $ — |
| Citibank, N.A. | (128,099) | 128,099 | — | — | — | 1,082,400 |
| Goldman Sachs International | (4,780) | 1,504 | — | — | (3,276) | — |
| HSBC Bank USA, N.A. | (7,916) | 5,456 | — | — | (2,460) | — |
| Standard Chartered Bank | (943,194) | 81,761 | 4,595 | 856,838 | — | 1,335,000 |
| State Street Bank and Trust Company | (658,226) | 14,957 | 136,861 | 506,408 | — | 1,133,000 |
| The Royal Bank of Scotland PLC | (130,394) | — | — | — | (130,394) | — |
| | $(1,910,910) | $241,768 | $141,456 | $1,363,246 | $(164,440) | $3,550,400 |
| Total — Deposits for derivatives collateral — OTC derivatives | | | | $3,550,400 |
| (a) | In some instances, the total collateral received and/or pledged may be more than the amount shown due to overcollateralization. |
| (b) | Net amount represents the net amount due from the counterparty in the event of default. |
| (c) | Net amount represents the net amount payable to the counterparty in the event of default. |
Eaton Vance
Limited Duration Income Fund
March 31, 2023
Notes to Financial Statements — continued
The effect of derivative instruments (not considered to be hedging instruments for accounting disclosure purposes) on the Statement of Operations by risk exposure for the year ended March 31, 2023 was as follows:
| Statement of Operations Caption | Credit | Foreign
Exchange | Interest
Rate | Total |
| Net realized gain (loss): | | | | |
| Futures contracts | $ — | $ — | $ 17,022,603 | $ 17,022,603 |
| Swap contracts | 31,174 | — | — | 31,174 |
| Forward foreign currency exchange contracts | — | 10,889,728 | — | 10,889,728 |
| Total | $ 31,174 | $10,889,728 | $17,022,603 | $27,943,505 |
| Change in unrealized appreciation (depreciation): | | | | |
| Futures contracts | $ — | $ — | $ (5,164,370) | $ (5,164,370) |
| Swap contracts | (44,031) | — | — | (44,031) |
| Forward foreign currency exchange contracts | — | (3,665,994) | — | (3,665,994) |
| Total | $(44,031) | $ (3,665,994) | $ (5,164,370) | $ (8,874,395) |
The average notional cost of futures contracts and average notional amounts of other derivative contracts outstanding during the year ended March 31, 2023, which are indicative of the volume of these derivative types, were approximately as follows:
Futures
Contracts — Long | Futures
Contracts — Short | Forward
Foreign Currency
Exchange Contracts* | Swap
Contracts |
| $4,504,000 | $148,991,000 | $216,358,000 | $3,732,000 |
| * | The average notional amount of forward foreign currency exchange contracts is based on the absolute value of notional amounts of currency purchased and currency sold. |
8 Credit Agreement
The Fund has entered into a Credit Agreement, as amended (the Agreement) with major financial institutions to borrow up to $800 million. Borrowings under the Agreement are secured by the assets of the Fund. Effective December 16, 2022, interest is charged at a rate above either the Secured Overnight Financing Rate (SOFR) or the Federal Funds rate and is payable monthly. Prior to December 16, 2022, interest was charged at a rate above the London Interbank Offered Rate (LIBOR) and was payable monthly. Under the terms of the Agreement, in effect through December 14, 2023, the Fund pays a facility fee of 0.25% per annum on the borrowing limit. In connection with the renewal of the Agreement on December 17, 2021, the Fund paid an upfront fee of $1,440,000 which is being amortized to interest expense over a period of two years through December 2023. The unamortized balance at March 31, 2023 is approximately $860,000 and is included in prepaid upfront fees on notes payable on the Statement of Assets and Liabilities. The Fund is required to maintain certain net asset levels during the term of the Agreement. At March 31, 2023, the Fund had borrowings outstanding under the Agreement of $314,000,000 at an annual interest rate of 5.78%. Based on the short-term nature of the borrowings under the Agreement and the variable interest rate, the carrying amount of the borrowings at March 31, 2023 approximated its fair value. If measured at fair value, borrowings under the Agreement would have been considered as Level 2 in the fair value hierarchy (see Note 10) at March 31, 2023. Facility fees for the year ended March 31, 2023 totaled $2,027,779 and are included in interest expense and fees on the Statement of Operations. For the year ended March 31, 2023, the average borrowings under the Agreement and the average interest rate (excluding fees) were $448,295,890 and 3.47%, respectively.
Eaton Vance
Limited Duration Income Fund
March 31, 2023
Notes to Financial Statements — continued
9 Affiliated Investments
At March 31, 2023, the value of the Fund's investment in issuers and funds that may be deemed to be affiliated was $36,000,763, which represents 2.9% of the Fund's net assets applicable to common shares. Transactions in such investments by the Fund for the year ended March 31, 2023 were as follows:
| Name | Value,
beginning
of period | Purchases | Sales
proceeds | Net
realized
gain (loss) | Change in
unrealized
appreciation
(depreciation) | Value, end
of period | Interest/
Dividend
income | Principal amount/
Units/Shares, end
of period |
| Commercial Mortgage-Backed Securities | | | | | | | | |
| Morgan Stanley Bank of America Merrill Lynch Trust: | | | | | | | | |
| Series 2014-C16, Class B, 4.301%, 6/15/47 | $ — | $ 330,557 | $ — | $ — | $ 11,994 | $ 342,690 | $ 1,830 | $ 363,000 |
| Series 2015-C23, Class D, 4.14%, 7/15/50 | 1,866,948 | 572,353 | — | — | (239,735) | 2,054,435 | 103,323 | 2,670,000 |
| Series 2016-C29, Class D, 3.00%, 5/15/49 | 2,984,932 | — | — | — | (488,327) | 2,540,356 | 128,197 | 3,577,365 |
| Series 2016-C32, Class D, 3.396%, 12/15/49 | 1,236,954 | — | — | — | (241,291) | 1,054,795 | 69,090 | 1,600,000 |
| Morgan Stanley Capital I Trust: | | | | | | | | |
| Series 2016-UBS12, Class D, 3.312%, 12/15/49 | 2,644,734 | — | — | — | (171,757) | 2,198,211 | 183,125 | 4,488,667 |
| Series 2017-CLS, Class F, 5.418%, (1 mo. USD LIBOR + 2.60%), 11/15/34 | 562,594 | — | (569,000) | 4,129 | 2,072 | — | 13,176 | — |
| Series 2019-BPR, Class C, 7.984%, (1 mo. USD LIBOR + 3.30%), 5/15/36 | 1,769,714 | — | — | — | (26,561) | 1,743,153 | 110,114 | 1,845,000 |
| Short-Term Investments |
| Cash Reserves Fund | 46,252,658 | 45,303,626 | (91,556,972) | 5,074 | (4,386) | — | 317 | — |
| Liquidity Fund | — | 905,205,572 | (879,138,449) | — | — | 26,067,123 | 1,190,355 | 26,067,123 |
| Total | | | | $9,203 | $(1,157,991) | $36,000,763 | $1,799,527 | |
10 Fair Value Measurements
Under generally accepted accounting principles for fair value measurements, a three-tier hierarchy to prioritize the assumptions, referred to as inputs, is used in valuation techniques to measure fair value. The three-tier hierarchy of inputs is summarized in the three broad levels listed below.
| • | Level 1 – quoted prices in active markets for identical investments |
| • | Level 2 – other significant observable inputs (including quoted prices for similar investments, interest rates, prepayment speeds, credit risk, etc.) |
| • | Level 3 – significant unobservable inputs (including a fund's own assumptions in determining the fair value of investments) |
In cases where the inputs used to measure fair value fall in different levels of the fair value hierarchy, the level disclosed is determined based on the lowest level input that is significant to the fair value measurement in its entirety. The inputs or methodology used for valuing securities are not necessarily an indication of the risk associated with investing in those securities.
Eaton Vance
Limited Duration Income Fund
March 31, 2023
Notes to Financial Statements — continued
At March 31, 2023, the hierarchy of inputs used in valuing the Fund's investments and open derivative instruments, which are carried at value, were as follows:
| Asset Description | Level 1 | Level 2 | Level 3* | Total |
| Asset-Backed Securities | $ — | $ 96,033,494 | $ — | $ 96,033,494 |
| Closed-End Funds | 19,084,409 | — | — | 19,084,409 |
| Collateralized Mortgage Obligations | — | 84,606,269 | — | 84,606,269 |
| Commercial Mortgage-Backed Securities | — | 76,525,693 | — | 76,525,693 |
| Common Stocks | 685,344 | 2,424,932 | 623,736 | 3,734,012 |
| Convertible Bonds | — | 1,555,730 | — | 1,555,730 |
| Convertible Preferred Stocks | — | 1,831 | ��� — | 1,831 |
| Corporate Bonds | — | 660,549,511 | — | 660,549,511 |
| Preferred Stocks | — | 1,059,263 | 0 | 1,059,263 |
| Senior Floating-Rate Loans (Less Unfunded Loan Commitments) | — | 568,741,939 | 426,706 | 569,168,645 |
| Sovereign Government Bonds | — | 45,017,513 | — | 45,017,513 |
| Sovereign Loans | — | 6,525,480 | — | 6,525,480 |
| U.S. Government Agency Mortgage-Backed Securities | — | 365,932,127 | — | 365,932,127 |
| Warrants | — | 0 | 0 | 0 |
| Miscellaneous | — | 34,580 | 0 | 34,580 |
| Short-Term Investments: | | | | |
| Affiliated Fund | 26,067,123 | — | — | 26,067,123 |
| U.S. Treasury Obligations | — | 499,477 | — | 499,477 |
| Total Investments | $ 45,836,876 | $ 1,909,507,839 | $ 1,050,442 | $ 1,956,395,157 |
| Forward Foreign Currency Exchange Contracts | $ — | $ 325,826 | $ — | $ 325,826 |
| Futures Contracts | 187,859 | — | — | 187,859 |
| Swap Contracts | — | 12,122 | — | 12,122 |
| Total | $ 46,024,735 | $ 1,909,845,787 | $ 1,050,442 | $ 1,956,920,964 |
| Liability Description | | | | |
| Forward Foreign Currency Exchange Contracts | $ — | $ (1,886,214) | $ — | $ (1,886,214) |
| Futures Contracts | (751,189) | — | — | (751,189) |
| Swap Contracts | — | (115,456) | — | (115,456) |
| Total | $ (751,189) | $ (2,001,670) | $ — | $ (2,752,859) |
| * | None of the unobservable inputs for Level 3 assets, individually or collectively, had a material impact on the Fund. |
Level 3 investments at the beginning and/or end of the period in relation to net assets were not significant and accordingly, a reconciliation of Level 3 assets for the year ended March 31, 2023 is not presented.
Eaton Vance
Limited Duration Income Fund
March 31, 2023
Notes to Financial Statements — continued
11 Risks and Uncertainties
Risks Associated with Foreign Investments
Foreign investments can be adversely affected by political, economic and market developments abroad, including the imposition of economic and other sanctions by the United States or another country. There may be less publicly available information about foreign issuers because they may not be subject to reporting practices, requirements or regulations comparable to those to which United States companies are subject. Foreign markets may be smaller, less liquid and more volatile than the major markets in the United States. Trading in foreign markets typically involves higher expense than trading in the United States. The Fund may have difficulties enforcing its legal or contractual rights in a foreign country. Securities that trade or are denominated in currencies other than the U.S. dollar may be adversely affected by fluctuations in currency exchange rates.
LIBOR Transition Risk
Certain instruments held by the Fund may pay an interest rate based on the London Interbank Offered Rate (“LIBOR”), which is the average offered rate for various maturities of short-term loans between certain major international banks. LIBOR is used throughout global banking and financial industries to determine interest rates for a variety of financial instruments (such as debt instruments and derivatives) and borrowing arrangements. The ICE Benchmark Administration Limited, the administrator of LIBOR, ceased publishing certain LIBOR settings on December 31, 2021, and is expected to cease publishing the remaining LIBOR settings on June 30, 2023. Although the transition process away from LIBOR has become increasingly well-defined, the impact on certain debt securities, derivatives and other financial instruments that utilize LIBOR remains uncertain. The phase-out of LIBOR may result in, among other things, increased volatility or illiquidity in markets for instruments based on LIBOR and changes in the value of such instruments.
Pandemic Risk
An outbreak of respiratory disease caused by a novel coronavirus was first detected in China in late 2019 and subsequently spread internationally. This coronavirus has resulted in closing borders, enhanced health screenings, changes to healthcare service preparation and delivery, quarantines, cancellations, disruptions to supply chains and customer activity, as well as general concern and uncertainty. Health crises caused by outbreaks of disease, such as the coronavirus outbreak, may exacerbate other pre-existing political, social and economic risks and disrupt normal market conditions and operations. The impact of this outbreak has negatively affected the worldwide economy, as well as the economies of individual countries and industries, and could continue to affect the market in significant and unforeseen ways. Other epidemics and pandemics that may arise in the future may have similar effects. Any such impact could adversely affect the Fund's performance, or the performance of the securities in which the Fund invests.
12 Additional Information
On August 27, 2020, the Fund’s Board of Trustees (the “Board”) received a shareholder demand letter from counsel to Saba Capital Master Fund, Ltd., a hedge fund (“Saba”). Saba also filed claims against the Fund in a lawsuit in Suffolk County Superior Court in Massachusetts asserting breach of contract and fiduciary duty by the Fund and certain of its affiliates, the Fund’s adviser, and the Board, following the implementation by the Fund of by-law amendments that (i) require trustee nominees in contested elections to obtain affirmative votes of a majority of eligible shares in order to be elected and (ii) establish certain requirements related to shares obtained in “control share” acquisitions. With respect to the Fund, Saba seeks rescission of these by-law provisions and certain related relief. On March 31, 2021, the court allowed in part and denied in part a motion to dismiss Saba’s claims. Discovery is complete. On January 23, 2023, in ruling on the parties' cross-motions for partial summary judgment, the court dismissed Saba's claims for breach of fiduciary duty against the Board, while holding that the control share by-law amendment violated Section 18(i) of the 1940 Act. Additional claims and defenses will be addressed at trial. While management of the Fund is unable to predict the outcome of this matter, it does not believe the outcome would result in the payment of any monetary damages by the Fund.
Eaton Vance
Limited Duration Income Fund
March 31, 2023
Report of Independent Registered Public Accounting Firm
To the Trustees and Shareholders of Eaton Vance Limited Duration Income Fund:
Opinion on the Financial Statements and Financial Highlights
We have audited the accompanying statement of assets and liabilities of Eaton Vance Limited Duration Income Fund (the “Fund”), including the portfolio of investments, as of March 31, 2023, the related statements of operations and cash flows for the year then ended, the statements of changes in net assets for each of the two years in the period then ended, the financial highlights for each of the five years in the period then ended, and the related notes. In our opinion, the financial statements and financial highlights present fairly, in all material respects, the financial position of the Fund as of March 31, 2023, the results of its operations and its cash flows for the year then ended, the changes in its net assets for each of the two years in the period then ended, and the financial highlights for each of the five years in the period then ended in conformity with accounting principles generally accepted in the United States of America.
Basis for Opinion
These financial statements and financial highlights are the responsibility of the Fund’s management. Our responsibility is to express an opinion on the Fund's financial statements and financial highlights based on our audits. We are a public accounting firm registered with the Public Company Accounting Oversight Board (United States) (PCAOB) and are required to be independent with respect to the Fund in accordance with the U.S. federal securities laws and the applicable rules and regulations of the Securities and Exchange Commission and the PCAOB.
We conducted our audits in accordance with the standards of the PCAOB. Those standards require that we plan and perform the audit to obtain reasonable assurance about whether the financial statements and financial highlights are free of material misstatement, whether due to error or fraud. The Fund is not required to have, nor were we engaged to perform, an audit of its internal control over financial reporting. As part of our audits, we are required to obtain an understanding of internal control over financial reporting but not for the purpose of expressing an opinion on the effectiveness of the Fund’s internal control over financial reporting. Accordingly, we express no such opinion.
Our audits included performing procedures to assess the risks of material misstatement of the financial statements and financial highlights, whether due to error or fraud, and performing procedures that respond to those risks. Such procedures included examining, on a test basis, evidence regarding the amounts and disclosures in the financial statements and financial highlights. Our audits also included evaluating the accounting principles used and significant estimates made by management, as well as evaluating the overall presentation of the financial statements and financial highlights. Our procedures included confirmation of securities and senior loans owned as of March 31, 2023, by correspondence with the custodian, brokers and selling or agent banks; when replies were not received from brokers and selling or agent banks, we performed other auditing procedures. We believe that our audits provide a reasonable basis for our opinion.
/s/ Deloitte & Touche LLP
Boston, Massachusetts
May 18, 2023
We have served as the auditor of one or more Eaton Vance investment companies since 1959.
Eaton Vance
Limited Duration Income Fund
March 31, 2023
Federal Tax Information (Unaudited)
The Form 1099-DIV you receive in February 2024 will show the tax status of all distributions paid to your account in calendar year 2023. Shareholders are advised to consult their own tax adviser with respect to the tax consequences of their investment in the Fund. As required by the Internal Revenue Code and/or regulations, shareholders must be notified regarding the status of qualified dividend income for individuals and 163(j) interest dividends.
Qualified Dividend Income. For the fiscal year ended March 31, 2023, the Fund designates approximately $196,830, or up to the maximum amount of such dividends allowable pursuant to the Internal Revenue Code, as qualified dividend income eligible for the reduced tax rate of 15%.
163(j) Interest Dividends. For the fiscal year ended March 31, 2023, the Fund designates 51.29% of distributions from net investment income as a 163(j) interest dividend.
Eaton Vance
Limited Duration Income Fund
March 31, 2023
Annual Meeting of Shareholders (Unaudited)
The Fund held its Annual Meeting of Shareholders on January 12, 2023. The following action was taken by the shareholders:
Proposal 1(a): The election of Thomas E. Faust Jr., Mark R. Fetting, Keith Quinton and Nancy A. Wiser as Class II Trustees of the Fund for a three-year term expiring in 2026.
The following votes were cast by the Fund's common and APS shareholders, voting together as a single class:
| | | | Number of Shares |
| Nominees for Trustee | | | For | Withheld |
| Thomas E. Faust Jr. | | | 83,690,282 | 2,562,835 |
| Mark R. Fetting | | | 83,811,249 | 2,441,868 |
| Keith Quinton | | | 83,741,927 | 2,511,190 |
The following votes were cast by the Fund’s APS shareholders, voting separately as a single class:
| | | | Number of Shares |
| Nominees for Trustee | | | For | Withheld |
| Nancy A. Wiser | | | 7,511 | 1,017 |
Eaton Vance
Limited Duration Income Fund
March 31, 2023
Dividend Reinvestment Plan
The Fund offers a dividend reinvestment plan (Plan) pursuant to which shareholders may elect to have distributions automatically reinvested in common shares (Shares) of the Fund. You may elect to participate in the Plan by completing the Dividend Reinvestment Plan Application Form. If you do not participate, you will receive all distributions in cash paid by check mailed directly to you by American Stock Transfer & Trust Company, LLC (AST) as dividend paying agent. On the distribution payment date, if the NAV per Share is equal to or less than the market price per Share plus estimated brokerage commissions, then new Shares will be issued. The number of Shares shall be determined by the greater of the NAV per Share or 95% of the market price. Otherwise, Shares generally will be purchased on the open market by AST, the Plan agent (Agent). Distributions subject to income tax (if any) are taxable whether or not Shares are reinvested.
If your Shares are in the name of a brokerage firm, bank, or other nominee, you can ask the firm or nominee to participate in the Plan on your behalf. If the nominee does not offer the Plan, you will need to request that the Fund’s transfer agent re-register your Shares in your name or you will not be able to participate.
The Agent’s service fee for handling distributions will be paid by the Fund. Plan participants will be charged their pro-rata share of brokerage commissions on all open-market purchases.
Plan participants may withdraw from the Plan at any time by writing to the Agent at the address noted on the following page. If you withdraw, you will receive Shares in your name for all Shares credited to your account under the Plan. If a participant elects by written notice to the Agent to sell part or all of his or her Shares and remit the proceeds, the Agent is authorized to deduct a $5.00 fee plus brokerage commissions from the proceeds.
If you wish to participate in the Plan and your Shares are held in your own name, you may complete the form on the following page and deliver it to the Agent. Any inquiries regarding the Plan can be directed to the Agent at 1-866-439-6787.
Eaton Vance
Limited Duration Income Fund
March 31, 2023
Application for Participation in Dividend Reinvestment Plan
This form is for shareholders who hold their common shares in their own names. If your common shares are held in the name of a brokerage firm, bank, or other nominee, you should contact your nominee to see if it will participate in the Plan on your behalf. If you wish to participate in the Plan, but your brokerage firm, bank, or nominee is unable to participate on your behalf, you should request that your common shares be re-registered in your own name which will enable your participation in the Plan.
The following authorization and appointment is given with the understanding that I may terminate it at any time by terminating my participation in the Plan as provided in the terms and conditions of the Plan.
|
| Please print exact name on account | |
| |
| Shareholder signature | Date |
| |
| Shareholder signature | Date |
| Please sign exactly as your common shares are registered. All persons whose names appear on the share certificate must sign. |
YOU SHOULD NOT RETURN THIS FORM IF YOU WISH TO RECEIVE YOUR DISTRIBUTIONS IN CASH. THIS IS NOT A PROXY.
This authorization form, when signed, should be mailed to the following address:
Eaton Vance Limited Duration Income Fund
c/o American Stock Transfer & Trust Company, LLC
P.O. Box 922
Wall Street Station
New York, NY 10269-0560
Eaton Vance
Limited Duration Income Fund
March 31, 2023
Management and Organization
Fund Management. The Board of Trustees of the Fund (the “Board”) is responsible for the overall management and supervision of the affairs of the Fund. The Board members and officers of the Fund are listed below. Except as indicated, each individual has held the office shown or other offices in the same company for the last five years. Each Trustee holds office until the annual meeting for the year in which his or her term expires and until his or her successor is elected and qualified, subject to a prior death, resignation, retirement, disqualification or removal. Under the terms of the Fund’s current Trustee retirement policy, an Independent Trustee must retire and resign as a Trustee on the earlier of: (i) the first day of July following his or her 74th birthday; or (ii), with limited exception, December 31st of the 20th year in which he or she has served as a Trustee. However, if such retirement and resignation would cause the Fund to be out of compliance with Section 16 of the 1940 Act or any other regulations or guidance of the Securities and Exchange Commission, then such retirement and resignation will not become effective until such time as action has been taken for the Fund to be in compliance therewith. The “noninterested Trustees” consist of those Trustees who are not “interested persons” of the Fund, as that term is defined under the 1940 Act. The business address of each Board member and officer is Two International Place, Boston, Massachusetts 02110. As used below, “BMR” refers to Boston Management and Research, “EVC” refers to Eaton Vance Corp., “EV” refers to EV LLC, “EVM” refers to Eaton Vance Management and “EVD” refers to Eaton Vance Distributors, Inc. EV is the trustee of each of EVM and BMR. Effective March 1, 2021, each of EVM, BMR, EVD and EV are indirect, wholly-owned subsidiaries of Morgan Stanley. Each officer affiliated with EVM may hold a position with other EVM affiliates that is comparable to his or her position with EVM listed below. Each Trustee oversees 129 funds in the Eaton Vance fund complex (including both funds and portfolios in a hub and spoke structure).
| Name and Year of Birth | Fund
Position(s) | Length of Service | Principal Occupation(s) and Other Directorships
During Past Five Years and Other Relevant Experience |
| Interested Trustees |
Thomas E. Faust Jr.
1958 | Class II
Trustee | Until 2026.
3 years.
Since 2007. | Chairman of Morgan Stanley Investment Management, Inc. (MSIM), member of the Board of Managers and President of EV (since 2021), Chief Executive Officer of EVM and BMR. Formerly, Chairman, Chief Executive Officer (2007-2021) and President (2006-2021) of EVC and Director of EVD (2007-2022). Mr. Faust is an interested person because of his positions with MSIM, BMR, EVM and EV, which are affiliates of the Fund. Mr. Faust has apprised the Board of Trustees that he intends to retire as a Trustee of all Eaton Vance Funds effective on or about August 3, 2023.
Other Directorships. Formerly, Director of EVC (2007-2021) and Hexavest Inc. (investment management firm) (2012-2021). |
Anchal Pachnanda(1)
1980 | Class I
Trustee | Until 2025.
3 years.
Since 2023. | Co-Head of Strategy of MSIM (since 2019). Formerly, Head of Strategy of MSIM (2017-2019). Ms. Pachnanda is an interested person because of her position with MSIM, which is an affiliate of the Fund.
Other Directorships. None. |
| Noninterested Trustees |
Alan C. Bowser(2)
1962 | Class III
Trustee | Until 2024.
3 years.
Since 2023. | Formerly, Chief Diversity Officer, Partner and a member of the Operating Committee, and formerly served as Senior Advisor on Diversity and Inclusion for the firm’s chief executive officer, Co-Head of the Americas Region, and Senior Client Advisor of Bridgewater Associates, an asset management firm (2011- 2023).
Other Directorships. None. |
Mark R. Fetting
1954 | Class II
Trustee | Until 2026.
3 years.
Since 2016. | Private investor. Formerly held various positions at Legg Mason, Inc. (investment management firm) (2000-2012), including President, Chief Executive Officer, Director and Chairman (2008-2012), Senior Executive Vice President (2004-2008) and Executive Vice President (2001-2004). Formerly, President of Legg Mason family of funds (2001-2008). Formerly, Division President and Senior Officer of Prudential Financial Group, Inc. and related companies (investment management firm) (1991-2000).
Other Directorships. None. |
Cynthia E. Frost
1961 | Class I
Trustee | Until 2025.
3 years.
Since 2014. | Private investor. Formerly, Chief Investment Officer of Brown University (university endowment) (2000-2012). Formerly, Portfolio Strategist for Duke Management Company (university endowment manager) (1995-2000). Formerly, Managing Director, Cambridge Associates (investment consulting company) (1989-1995). Formerly, Consultant, Bain and Company (management consulting firm) (1987-1989). Formerly, Senior Equity Analyst, BA Investment Management Company (1983-1985).
Other Directorships. None. |
Eaton Vance
Limited Duration Income Fund
March 31, 2023
Management and Organization — continued
| Name and Year of Birth | Fund
Position(s) | Length of Service | Principal Occupation(s) and Other Directorships
During Past Five Years and Other Relevant Experience |
| Noninterested Trustees (continued) |
George J. Gorman(3)
1952 | Chairperson
of the Board
and Class III
Trustee | Until 2024.
3 years. Chairperson of the Board since 2021 and Trustee since 2014. | Principal at George J. Gorman LLC (consulting firm). Formerly, Senior Partner at Ernst & Young LLP (a registered public accounting firm) (1974-2009).
Other Directorships. None. |
Valerie A. Mosley
1960 | Class I
Trustee | Until 2025.
3 years.
Since 2014. | Chairwoman and Chief Executive Officer of Valmo Ventures (a consulting and investment firm). Founder of Upward Wealth, Inc., dba BrightUp, a fintech platform. Formerly, Partner and Senior Vice President, Portfolio Manager and Investment Strategist at Wellington Management Company, LLP (investment management firm) (1992-2012). Formerly, Chief Investment Officer, PG Corbin Asset Management (1990-1992). Formerly worked in institutional corporate bond sales at Kidder Peabody (1986-1990).
Other Directorships. Director of DraftKings, Inc. (digital sports entertainment and gaming company) (since September 2020). Director of Envestnet, Inc. (provider of intelligent systems for wealth management and financial wellness) (since 2018). Formerly, Director of Dynex Capital, Inc. (mortgage REIT) (2013-2020) and Director of Groupon, Inc. (e-commerce provider) (2020-2022). |
Keith Quinton
1958 | Class II
Trustee | Until 2026.
3 years.
Since 2018. | Private investor, researcher and lecturer. Formerly, Independent Investment Committee Member at New Hampshire Retirement System (2017-2021). Formerly, Portfolio Manager and Senior Quantitative Analyst at Fidelity Investments (investment management firm) (2001-2014).
Other Directorships. Formerly, Director (2016-2021) and Chairman (2019-2021) of New Hampshire Municipal Bond Bank. |
Marcus L. Smith
1966 | Class III
Trustee | Until 2024.
3 years.
Since 2018. | Private investor and independent corporate director. Formerly, Chief Investment Officer, Canada (2012-2017), Chief Investment Officer, Asia (2010-2012), Director of Asian Research (2004-2010) and portfolio manager (2001-2017) at MFS Investment Management (investment management firm).
Other Directorships. Director of First Industrial Realty Trust, Inc. (an industrial REIT) (since 2021). Director of MSCI Inc. (global provider of investment decision support tools) (since 2017). Formerly, Director of DCT Industrial Trust Inc. (logistics real estate company) (2017-2018). |
Susan J. Sutherland
1957 | Class III
Trustee | Until 2024.
3 years.
Since 2015. | Private investor. Director of Ascot Group Limited and certain of its subsidiaries (insurance and reinsurance) (since 2017). Formerly, Director of Hagerty Holding Corp. (insurance) (2015-2018) and Montpelier Re Holdings Ltd. (insurance and reinsurance) (2013-2015). Formerly, Associate, Counsel and Partner at Skadden, Arps, Slate, Meagher & Flom LLP (law firm) (1982-2013).
Other Directorships. Formerly, Director of Kairos Acquisition Corp. (insurance/InsurTech acquisition company) (2021-2023). |
Scott E. Wennerholm
1959 | Class I
Trustee | Until 2025.
3 years.
Since 2016. | Private investor. Formerly, Trustee at Wheelock College (postsecondary institution) (2012-2018). Formerly, Consultant at GF Parish Group (executive recruiting firm) (2016-2017). Formerly, Chief Operating Officer and Executive Vice President at BNY Mellon Asset Management (investment management firm) (2005-2011). Formerly, Chief Operating Officer and Chief Financial Officer at Natixis Global Asset Management (investment management firm) (1997-2004). Formerly, Vice President at Fidelity Investments Institutional Services (investment management firm) (1994-1997).
Other Directorships. None. |
Nancy A. Wiser(3)
1967 | Class II
Trustee | Until 2026.
3 years.
Since 2022. | Formerly, Executive Vice President and the Global Head of Operations at Wells Fargo Asset Management (2011-2021).
Other Directorships. None. |
| Name and Year of Birth | Fund
Position(s) | Length of Service | Principal Occupation(s)
During Past Five Years |
| Principal Officers who are not Trustees |
Eric A. Stein
1980 | President | Since 2020 | Vice President and Chief Investment Officer, Fixed Income of EVM and BMR. Prior to November 1, 2020, Mr. Stein was a co-Director of Eaton Vance’s Global Income Investments. Also Vice President of Calvert Research and Management (“CRM”). |
Eaton Vance
Limited Duration Income Fund
March 31, 2023
Management and Organization — continued
| Name and Year of Birth | Fund
Position(s) | Length of Service | Principal Occupation(s)
During Past Five Years |
| Principal Officers who are not Trustees (continued) |
Deidre E. Walsh
1971 | Vice President and
Chief
Legal Officer | Since 2009 | Vice President of EVM and BMR. Also Vice President of CRM. |
James F. Kirchner
1967 | Treasurer | Since 2007 | Vice President of EVM and BMR. Also Vice President of CRM. |
Nicholas S. Di Lorenzo
1987 | Secretary | Since 2022 | Formerly, associate (2012-2021) and counsel (2022) at Dechert LLP. |
Richard F. Froio
1968 | Chief Compliance
Officer | Since 2017 | Vice President of EVM and BMR since 2017. Formerly, Deputy Chief Compliance Officer (Adviser/Funds) and Chief Compliance Officer (Distribution) at PIMCO (2012-2017) and Managing Director at BlackRock/Barclays Global Investors (2009-2012). |
(1) Ms. Pachnanda began serving as Trustee effective April 1, 2023.
(2) Mr. Bowser began serving as Trustee effective January 4, 2023.
(3) Preferred shares Trustee.
| FACTS | WHAT DOES EATON VANCE DO WITH YOUR
PERSONAL INFORMATION? |
| Why? | Financial companies choose how they share your personal information. Federal law gives consumers the right to limit some but not all sharing. Federal law also requires us to tell you how we collect, share, and protect your personal information. Please read this notice carefully to understand what we do. |
| |
| What? | The types of personal information we collect and share depend on the product or service you have with us. This information can include:■ Social Security number and income
■ investment experience and risk tolerance
■ checking account number and wire transfer instructions |
| |
| How? | All financial companies need to share customers’ personal information to run their everyday business. In the section below, we list the reasons financial companies can share their customers’ personal information; the reasons Eaton Vance chooses to share; and whether you can limit this sharing. |
Reasons we can share your
personal information | Does Eaton Vance
share? | Can you limit
this sharing? |
| For our everyday business purposes — such as to process your transactions, maintain your account(s), respond to court orders and legal investigations, or report to credit bureaus | Yes | No |
| For our marketing purposes — to offer our products and services to you | Yes | No |
| For joint marketing with other financial companies | No | We don’t share |
| For our investment management affiliates’ everyday business purposes — information about your transactions, experiences, and creditworthiness | Yes | Yes |
| For our affiliates’ everyday business purposes — information about your transactions and experiences | Yes | No |
| For our affiliates’ everyday business purposes — information about your creditworthiness | No | We don’t share |
| For our investment management affiliates to market to you | Yes | Yes |
| For our affiliates to market to you | No | We don’t share |
| For nonaffiliates to market to you | No | We don’t share |
To limit our
sharing | Call toll-free 1-800-262-1122 or email: EVPrivacy@eatonvance.comPlease note:If you are a new customer, we can begin sharing your information 30 days from the date we sent this notice. When you are no longer our customer, we continue to share your information as described in this notice. However, you can contact us at any time to limit our sharing. |
| Questions? | Call toll-free 1-800-262-1122 or email: EVPrivacy@eatonvance.com |
| Privacy Notice — continued | April 2021 |
| Who we are |
| Who is providing this notice? | Eaton Vance Management, Eaton Vance Distributors, Inc., Eaton Vance Trust Company, Eaton Vance Management (International) Limited, Eaton Vance Advisers International Ltd., Eaton Vance Global Advisors Limited, Eaton Vance Management’s Real Estate Investment Group, Boston Management and Research, Calvert Research and Management, Eaton Vance and Calvert Fund Families and our investment advisory affiliates (“Eaton Vance”) (see Investment Management Affiliates definition below) |
| What we do |
How does Eaton Vance
protect my personal
information? | To protect your personal information from unauthorized access and use, we use security measures that comply with federal law. These measures include computer safeguards and secured files and buildings. We have policies governing the proper handling of customer information by personnel and requiring third parties that provide support to adhere to appropriate security standards with respect to such information. |
How does Eaton Vance
collect my personal
information? | We collect your personal information, for example, when you■ open an account or make deposits or withdrawals from your account
■ buy securities from us or make a wire transfer
■ give us your contact informationWe also collect your personal information from others, such as credit bureaus, affiliates, or other companies. |
| Why can’t I limit all sharing? | Federal law gives you the right to limit only■ sharing for affiliates’ everyday business purposes — information about your creditworthiness
■ affiliates from using your information to market to you
■ sharing for nonaffiliates to market to youState laws and individual companies may give you additional rights to limit sharing. See below for more on your rights under state law. |
| Definitions |
Investment Management
Affiliates | Eaton Vance Investment Management Affiliates include registered investment advisers, registered broker- dealers, and registered and unregistered funds. Investment Management Affiliates does not include entities associated with Morgan Stanley Wealth Management, such as Morgan Stanley Smith Barney LLC and Morgan Stanley & Co. |
| Affiliates | Companies related by common ownership or control. They can be financial and nonfinancial companies.■ Our affiliates include companies with a Morgan Stanley name and financial companies such as Morgan Stanley Smith Barney LLC and Morgan Stanley & Co. |
| Nonaffiliates | Companies not related by common ownership or control. They can be financial and nonfinancial companies.■ Eaton Vance does not share with nonaffiliates so they can market to you. |
| Joint marketing | A formal agreement between nonaffiliated financial companies that together market financial products or services to you.■ Eaton Vance doesn’t jointly market. |
| Other important information |
| Vermont: Except as permitted by law, we will not share personal information we collect about Vermont residents with Nonaffiliates unless you provide us with your written consent to share such information.California: Except as permitted by law, we will not share personal information we collect about California residents with Nonaffiliates and we will limit sharing such personal information with our Affiliates to comply with California privacy laws that apply to us. |
Eaton Vance
Limited Duration Income Fund
March 31, 2023
Potential Conflicts of Interest
As a diversified global financial services firm, Morgan Stanley engages in a broad spectrum of activities, including financial advisory services, investment management activities, lending, commercial banking, sponsoring and managing private investment funds, engaging in broker-dealer transactions and principal securities, commodities and foreign exchange transactions, research publication and other activities. In the ordinary course of its business, Morgan Stanley is a full-service investment banking and financial services firm and therefore engages in activities where Morgan Stanley’s interests or the interests of its clients may conflict with the interests of a Fund or Portfolio, if applicable, (collectively for the purposes of this section, “Fund” or “Funds”). Morgan Stanley advises clients and sponsors, manages or advises other investment funds and investment programs, accounts and businesses (collectively, together with the Morgan Stanley funds, any new or successor funds, programs, accounts or businesses (other than funds, programs, accounts or businesses sponsored, managed, or advised by former direct or indirect subsidiaries of Eaton Vance Corp. (“Eaton Vance Investment Accounts”)), the ‘‘MS Investment Accounts, and, together with the Eaton Vance Investment Accounts, the “Affiliated Investment Accounts’’) with a wide variety of investment objectives that in some instances may overlap or conflict with a Fund’s investment objectives and present conflicts of interest. In addition, Morgan Stanley or the investment adviser may also from time to time create new or successor Affiliated Investment Accounts that may compete with a Fund and present similar conflicts of interest. The discussion below enumerates certain actual, apparent and potential conflicts of interest. There is no assurance that conflicts of interest will be resolved in favor of Fund shareholders and, in fact, they may not be. Conflicts of interest not described below may also exist.
The discussions below with respect to actual, apparent and potential conflicts of interest also may be applicable to or arise from the MS Investment Accounts whether or not specifically identified.
Material Non-public and Other Information. It is expected that confidential or material non-public information regarding an investment or potential investment opportunity may become available to the investment adviser. If such information becomes available, the investment adviser may be precluded (including by applicable law or internal policies or procedures) from pursuing an investment or disposition opportunity with respect to such investment or investment opportunity. The investment adviser may also from time to time be subject to contractual ‘‘stand-still’’ obligations and/or confidentiality obligations that may restrict its ability to trade in certain investments on a Fund’s behalf. In addition, the investment adviser may be precluded from disclosing such information to an investment team, even in circumstances in which the information would be beneficial if disclosed. Therefore, the investment team may not be provided access to material non-public information in the possession of Morgan Stanley that might be relevant to an investment decision to be made on behalf of a Fund, and the investment team may initiate a transaction or sell an investment that, if such information had been known to it, may not have been undertaken. In addition, certain members of the investment team may be recused from certain investment-related discussions so that such members do not receive information that would limit their ability to perform functions of their employment with the investment adviser or its affiliates unrelated to that of a Fund. Furthermore, access to certain parts of Morgan Stanley may be subject to third party confidentiality obligations and to information barriers established by Morgan Stanley in order to manage potential conflicts of interest and regulatory restrictions, including without limitation joint transaction restrictions pursuant to the 1940 Act. Accordingly, the investment adviser’s ability to source investments from other business units within Morgan Stanley may be limited and there can be no assurance that the investment adviser will be able to source any investments from any one or more parts of the Morgan Stanley network.
The investment adviser may restrict its investment decisions and activities on behalf of the Funds in various circumstances, including because of applicable regulatory requirements or information held by the investment adviser or Morgan Stanley. The investment adviser might not engage in transactions or other activities for, or enforce certain rights in favor of, a Fund due to Morgan Stanley’s activities outside the Funds. In instances where trading of an investment is restricted, the investment adviser may not be able to purchase or sell such investment on behalf of a Fund, resulting in the Fund’s inability to participate in certain desirable transactions. This inability to buy or sell an investment could have an adverse effect on a Fund’s portfolio due to, among other things, changes in an investment’s value during the period its trading is restricted. Also, in situations where the investment adviser is required to aggregate its positions with those of other Morgan Stanley business units for position limit calculations, the investment adviser may have to refrain from making investments due to the positions held by other Morgan Stanley business units or their clients. There may be other situations where the investment adviser refrains from making an investment due to additional disclosure obligations, regulatory requirements, policies, and reputational risk, or the investment adviser may limit purchases or sales of securities in respect of which Morgan Stanley is engaged in an underwriting or other distribution capacity.
Morgan Stanley has established certain information barriers and other policies to address the sharing of information between different businesses within Morgan Stanley. As a result of information barriers, the investment adviser generally will not have access, or will have limited access, to certain information and personnel in other areas of Morgan Stanley relating to business transactions for clients (including transactions in investing, banking, prime brokerage and certain other areas), and generally will not manage the Funds with the benefit of the information held by such other areas. Morgan Stanley, due to its access to and knowledge of funds, markets and securities based on its prime brokerage and other businesses, may make decisions based on information or take (or refrain from taking) actions with respect to interests in investments of the kind held (directly or indirectly) by the Funds in a manner that may be adverse to the Funds, and will not have any obligation or other duty to share information with the investment adviser.
In limited circumstances, however, including for purposes of managing business and reputational risk, and subject to policies and procedures and any applicable regulations, Morgan Stanley personnel, including personnel of the investment adviser, on one side of an information barrier may have access to information and personnel on the other side of the information barrier through “wall crossings.” The investment adviser faces conflicts of interest in determining whether to engage in such wall crossings. Information obtained in connection with such wall crossings may limit or restrict the ability of the investment adviser to engage in or otherwise effect transactions on behalf of the Funds (including purchasing or selling securities that the investment adviser may otherwise have purchased or sold for a Fund in the absence of a wall crossing). In managing conflicts of interest that arise because of the foregoing, the investment adviser generally will be subject to fiduciary requirements. The investment adviser may also implement internal information barriers or ethical walls, and the conflicts described herein with respect to information barriers and otherwise with respect to Morgan Stanley and the
Eaton Vance
Limited Duration Income Fund
March 31, 2023
Potential Conflicts of Interest — continued
investment adviser will also apply internally within the investment adviser. As a result, a Fund may not be permitted to transact in (e.g., dispose of a security in whole or in part) during periods when it otherwise would have been able to do so, which could adversely affect a Fund. Other investors in the security that are not subject to such restrictions may be able to transact in the security during such periods. There may also be circumstances in which, as a result of information held by certain portfolio management teams in the investment adviser, the investment adviser limits an activity or transaction for a Fund, including if the Fund is managed by a portfolio management team other than the team holding such information.
Investments by Morgan Stanley and its Affiliated Investment Accounts. In serving in multiple capacities to Affiliated Investment Accounts, Morgan Stanley, including the investment adviser and its investment teams, may have obligations to other clients or investors in Affiliated Investment Accounts, the fulfillment of which may not be in the best interests of a Fund or its shareholders. A Fund’s investment objectives may overlap with the investment objectives of certain Affiliated Investment Accounts. As a result, the members of an investment team may face conflicts in the allocation of investment opportunities among a Fund and other investment funds, programs, accounts and businesses advised by or affiliated with the investment adviser. Certain Affiliated Investment Accounts may provide for higher management or incentive fees or greater expense reimbursements or overhead allocations, all of which may contribute to this conflict of interest and create an incentive for the investment adviser to favor such other accounts.
Morgan Stanley currently invests and plans to continue to invest on its own behalf and on behalf of its Affiliated Investment Accounts in a wide variety of investment opportunities globally. Morgan Stanley and its Affiliated Investment Accounts, to the extent consistent with applicable law and policies and procedures, will be permitted to invest in investment opportunities without making such opportunities available to a Fund beforehand. Subject to the foregoing, Morgan Stanley may offer investments that fall into the investment objectives of an Affiliated Investment Account to such account or make such investment on its own behalf, even though such investment also falls within a Fund’s investment objectives. A Fund may invest in opportunities that Morgan Stanley and/or one or more Affiliated Investment Accounts has declined, and vice versa. All of the foregoing may reduce the number of investment opportunities available to a Fund and may create conflicts of interest in allocating investment opportunities. Investors should note that the conflicts inherent in making such allocation decisions may not always be resolved to a Fund’s advantage. There can be no assurance that a Fund will have an opportunity to participate in certain opportunities that fall within their investment objectives.
To seek to reduce potential conflicts of interest and to attempt to allocate such investment opportunities in a fair and equitable manner, the investment adviser has implemented allocation policies and procedures. These policies and procedures are intended to give all clients of the investment adviser, including the Funds, fair access to investment opportunities consistent with the requirements of organizational documents, investment strategies, applicable laws and regulations, and the fiduciary duties of the investment adviser. Each client of the investment adviser that is subject to the allocation policies and procedures, including each Fund, is assigned an investment team and portfolio manager(s) by the investment adviser. The investment team and portfolio managers review investment opportunities and will decide with respect to the allocation of each opportunity considering various factors and in accordance with the allocation policies and procedures. The allocation policies and procedures are subject to change. Investors should note that the conflicts inherent in making such allocation decisions may not always be resolved to the advantage of a Fund.
It is possible that Morgan Stanley or an Affiliated Investment Account, including another Eaton Vance fund, will invest in or advise a company that is or becomes a competitor of a company of which a Fund holds an investment. Such investment could create a conflict between the Fund, on the one hand, and Morgan Stanley or the Affiliated Investment Account, on the other hand. In such a situation, Morgan Stanley may also have a conflict in the allocation of its own resources to the portfolio investment. Furthermore, certain Affiliated Investment Accounts will be focused primarily on investing in other funds which may have strategies that overlap and/or directly conflict and compete with a Fund.
In addition, certain investment professionals who are involved in a Fund’s activities remain responsible for the investment activities of other Affiliated Investment Accounts managed by the investment adviser and its affiliates, and they will devote time to the management of such investments and other newly created Affiliated Investment Accounts (whether in the form of funds, separate accounts or other vehicles), as well as their own investments. In addition, in connection with the management of investments for other Affiliated Investment Accounts, members of Morgan Stanley and its affiliates may serve on the boards of directors of or advise companies which may compete with a Fund’s portfolio investments. Moreover, these Affiliated Investment Accounts managed by Morgan Stanley and its affiliates may pursue investment opportunities that may also be suitable for a Fund.
It should be noted that Morgan Stanley may, directly or indirectly, make large investments in certain of its Affiliated Investment Accounts, and accordingly Morgan Stanley’s investment in a Fund may not be a determining factor in the outcome of any of the foregoing conflicts. Nothing herein restricts or in any way limits the activities of Morgan Stanley, including its ability to buy or sell interests in, or provide financing to, equity and/or debt instruments, funds or portfolio companies, for its own accounts or for the accounts of Affiliated Investment Accounts or other investment funds or clients in accordance with applicable law.
Different clients of the investment adviser, including a Fund, may invest in different classes of securities of the same issuer, depending on the respective clients’ investment objectives and policies. As a result, the investment adviser and its affiliates, at times, will seek to satisfy fiduciary obligations to certain clients owning one class of securities of a particular issuer by pursuing or enforcing rights on behalf of those clients with respect to such class of securities, and those activities may have an adverse effect on another client which owns a different class of securities of such issuer. For example, if one client holds debt securities of an issuer and another client holds equity securities of the same issuer, if the issuer experiences financial or operational challenges, the investment adviser and its affiliates may seek a liquidation of the issuer on behalf of the client that holds the debt securities, whereas the client holding the
Eaton Vance
Limited Duration Income Fund
March 31, 2023
Potential Conflicts of Interest — continued
equity securities may benefit from a reorganization of the issuer. Thus, in such situations, the actions taken by the investment adviser or its affiliates on behalf of one client can negatively impact securities held by another client. These conflicts also exist as between the investment adviser’s clients, including the Funds, and the Affiliated Investment Accounts managed by Morgan Stanley.
The investment adviser and its affiliates may give advice and recommend securities to other clients which may differ from advice given to, or securities recommended or bought for, a Fund even though such other clients’ investment objectives may be similar to those of the Fund.
The investment adviser and its affiliates manage long and short portfolios. The simultaneous management of long and short portfolios creates conflicts of interest in portfolio management and trading in that opposite directional positions may be taken in client accounts, including client accounts managed by the same investment team, and creates risks such as: (i) the risk that short sale activity could adversely affect the market value of long positions in one or more portfolios (and vice versa) and (ii) the risks associated with the trading desk receiving opposing orders in the same security simultaneously. The investment adviser and its affiliates have adopted policies and procedures that are reasonably designed to mitigate these conflicts. In certain circumstances, the investment adviser invests on behalf of itself in securities and other instruments that would be appropriate for, held by, or may fall within the investment guidelines of its clients, including a Fund. At times, the investment adviser may give advice or take action for its own accounts that differs from, conflicts with, or is adverse to advice given or action taken for any client.
From time to time, conflicts also arise due to the fact that certain securities or instruments may be held in some client accounts, including a Fund, but not in others, or that client accounts may have different levels of holdings in certain securities or instruments. In addition, due to differences in the investment strategies or restrictions among client accounts, the investment adviser may take action with respect to one account that differs from the action taken with respect to another account. In some cases, a client account may compensate the investment adviser based on the performance of the securities held by that account. The existence of such a performance based fee may create additional conflicts of interest for the investment adviser in the allocation of management time, resources and investment opportunities. The investment adviser has adopted several policies and procedures designed to address these potential conflicts including a code of ethics and policies that govern the investment adviser’s trading practices, including, among other things, the aggregation and allocation of trades among clients, brokerage allocations, cross trades and best execution.
In addition, at times an investment adviser investment team will give advice or take action with respect to the investments of one or more clients that is not given or taken with respect to other clients with similar investment programs, objectives, and strategies. Accordingly, clients with similar strategies will not always hold the same securities or instruments or achieve the same performance. The investment adviser’s investment teams also advise clients with conflicting programs, objectives or strategies. These conflicts also exist as between the investment adviser’s clients, including the Funds, and the Affiliated Investment Accounts managed by Morgan Stanley.
The investment adviser maintains separate trading desks by investment team and generally based on asset class, including two trading desks trading equity securities. These trading desks operate independently of one another. The two equity trading desks do not share information. The separate equity trading desks may result in one desk competing against the other desk when implementing buy and sell transactions, possibly causing certain accounts to pay more or receive less for a security than other accounts. In addition, Morgan Stanley and its affiliates maintain separate trading desks that operate independently of each other and do not share trading information with the investment adviser. These trading desks may compete against the investment adviser trading desks when implementing buy and sell transactions, possibly causing certain Affiliated Investment Accounts to pay more or receive less for a security than other Affiliated Investment Accounts.
Investments by Separate Investment Departments. The entities and individuals that provide investment-related services for the Fund and certain other Eaton Vance Investment Accounts (the “Eaton Vance Investment Department”) may be different from the entities and individuals that provide investment-related services to MS Investment Accounts (the “MS Investment Department and, together with the Eaton Vance Investment Department, the “Investment Departments”). Although Morgan Stanley has implemented information barriers between the Investment Departments in accordance with internal policies and procedures, each Investment Department may engage in discussions and share information and resources with the other Investment Department on certain investment-related matters. The sharing of information and resources between the Investment Departments is designed to further increase the knowledge and effectiveness of each Investment Department. Because each Investment Department generally makes investment decisions and executes trades independently of the other, the quality and price of execution, and the performance of investments and accounts, can be expected to vary. In addition, each Investment Department may use different trading systems and technology and may employ differing investment and trading strategies. As a result, a MS Investment Account could trade in advance of the Fund (and vice versa), might complete trades more quickly and efficiently than the Fund, and/or achieve different execution than the Fund on the same or similar investments made contemporaneously, even when the Investment Departments shared research and viewpoints that led to that investment decision. Any sharing of information or resources between the Investment Department servicing the Fund and the MS Investment Department may result, from time to time, in the Fund simultaneously or contemporaneously seeking to engage in the same or similar transactions as an account serviced by the other Investment Department and for which there are limited buyers or sellers on specific securities, which could result in less favorable execution for the Fund than such account. The Eaton Vance Investment Department will not knowingly or intentionally cause the Fund to engage in a cross trade with an account serviced by the MS Investment Department, however, subject to applicable law and internal policies and procedures, the Fund may conduct cross trades with other accounts serviced by the Eaton Vance Investment Department. Although the Eaton Vance Investment Department may aggregate the Fund’s trades with trades of other accounts serviced by the Eaton Vance Investment Department, subject to applicable law and internal policies and procedures, there will be no aggregation or coordination of trades with accounts serviced by the MS Investment Department, even when both Investment Departments are seeking to acquire or dispose of the same investments contemporaneously.
Eaton Vance
Limited Duration Income Fund
March 31, 2023
Potential Conflicts of Interest — continued
Payments to Broker-Dealers and Other Financial Intermediaries. The investment adviser and/or EVD may pay compensation, out of their own funds and not as an expense of the Funds, to certain financial intermediaries (which may include affiliates of the investment adviser and EVD), including recordkeepers and administrators of various deferred compensation plans, in connection with the sale, distribution, marketing and retention of shares of the Funds and/or shareholder servicing. For example, the investment adviser or EVD may pay additional compensation to a financial intermediary for, among other things, promoting the sale and distribution of Fund shares, providing access to various programs, mutual fund platforms or preferred or recommended mutual fund lists that may be offered by a financial intermediary, granting EVD access to a financial intermediary’s financial advisors and consultants, providing assistance in the ongoing education and training of a financial intermediary’s financial personnel, furnishing marketing support, maintaining share balances and/or for sub-accounting, recordkeeping, administrative, shareholder or transaction processing services. Such payments are in addition to any distribution fees, shareholder servicing fees and/or transfer agency fees that may be payable by the Funds. The additional payments may be based on various factors, including level of sales (based on gross or net sales or some specified minimum sales or some other similar criteria related to sales of the Funds and/or some or all other Eaton Vance funds), amount of assets invested by the financial intermediary’s customers (which could include current or aged assets of the Funds and/or some or all other Eaton Vance funds), a Fund’s advisory fee, some other agreed upon amount or other measures as determined from time to time by the investment adviser and/or EVD. The amount of these payments may be different for different financial intermediaries.
The prospect of receiving, or the receipt of, additional compensation, as described above, by financial intermediaries may provide such financial intermediaries and their financial advisors and other salespersons with an incentive to favor sales of shares of the Funds over other investment options with respect to which these financial intermediaries do not receive additional compensation (or receive lower levels of additional compensation). These payment arrangements, however, will not change the price that an investor pays for shares of the Funds or the amount that the Funds receive to invest on behalf of an investor. Investors may wish to take such payment arrangements into account when considering and evaluating any recommendations relating to Fund shares and should review carefully any disclosures provided by financial intermediaries as to their compensation. In addition, in certain circumstances, the investment adviser may restrict, limit or reduce the amount of a Fund’s investment, or restrict the type of governance or voting rights it acquires or exercises, where the Fund (potentially together with Morgan Stanley) exceeds a certain ownership interest, or possesses certain degrees of voting or control or has other interests.
Morgan Stanley Trading and Principal Investing Activities. Notwithstanding anything to the contrary herein, Morgan Stanley will generally conduct its sales and trading businesses, publish research and analysis, and render investment advice without regard for a Fund’s holdings, although these activities could have an adverse impact on the value of one or more of the Fund’s investments, or could cause Morgan Stanley to have an interest in one or more portfolio investments that is different from, and potentially adverse to that of a Fund. Furthermore, from time to time, the investment adviser or its affiliates may invest “seed” capital in a Fund, typically to enable the Fund to commence investment operations and/or achieve sufficient scale. The investment adviser and its affiliates may hedge such seed capital exposure by investing in derivatives or other instruments expected to produce offsetting exposure. Such hedging transactions, if any, would occur outside of a Fund.
Morgan Stanley’s sales and trading, financing and principal investing businesses (whether or not specifically identified as such, and including Morgan Stanley’s trading and principal investing businesses) will not be required to offer any investment opportunities to a Fund. These businesses may encompass, among other things, principal trading activities as well as principal investing.
Morgan Stanley’s sales and trading, financing and principal investing businesses have acquired or invested in, and in the future may acquire or invest in, minority and/or majority control positions in equity or debt instruments of diverse public and/or private companies. Such activities may put Morgan Stanley in a position to exercise contractual, voting or creditor rights, or management or other control with respect to securities or loans of portfolio investments or other issuers, and in these instances Morgan Stanley may, in its discretion and subject to applicable law, act to protect its own interests or interests of clients, and not a Fund’s interests.
Subject to the limitations of applicable law, a Fund may purchase from or sell assets to, or make investments in, companies in which Morgan Stanley has or may acquire an interest, including as an owner, creditor or counterparty.
Morgan Stanley’s Investment Banking and Other Commercial Activities. Morgan Stanley advises clients on a variety of mergers, acquisitions, restructuring, bankruptcy and financing transactions. Morgan Stanley may act as an advisor to clients, including other investment funds that may compete with a Fund and with respect to investments that a Fund may hold. Morgan Stanley may give advice and take action with respect to any of its clients or proprietary accounts that may differ from the advice given, or may involve an action of a different timing or nature than the action taken, by a Fund. Morgan Stanley may give advice and provide recommendations to persons competing with a Fund and/or any of a Fund’s investments that are contrary to the Fund’s best interests and/or the best interests of any of its investments.
Morgan Stanley could be engaged in financial advising, whether on the buy-side or sell-side, or in financing or lending assignments that could result in Morgan Stanley’s determining in its discretion or being required to act exclusively on behalf of one or more third parties, which could limit a Fund’s ability to transact with respect to one or more existing or potential investments. Morgan Stanley may have relationships with third-party funds, companies or investors who may have invested in or may look to invest in portfolio companies, and there could be conflicts between a Fund’s best interests, on the one hand, and the interests of a Morgan Stanley client or counterparty, on the other hand.
Eaton Vance
Limited Duration Income Fund
March 31, 2023
Potential Conflicts of Interest — continued
To the extent that Morgan Stanley advises creditor or debtor companies in the financial restructuring of companies either prior to or after filing for protection under Chapter 11 of the U.S. Bankruptcy Code or similar laws in other jurisdictions, the investment adviser’s flexibility in making investments in such restructurings on a Fund’s behalf may be limited.
Morgan Stanley could provide investment banking services to competitors of portfolio companies, as well as to private equity and/or private credit funds; such activities may present Morgan Stanley with a conflict of interest vis-a-vis a Fund’s investment and may also result in a conflict in respect of the allocation of investment banking resources to portfolio companies.
To the extent permitted by applicable law, Morgan Stanley may provide a broad range of financial services to companies in which a Fund invests, including strategic and financial advisory services, interim acquisition financing and other lending and underwriting or placement of securities, and Morgan Stanley generally will be paid fees (that may include warrants or other securities) for such services. Morgan Stanley will not share any of the foregoing interest, fees and other compensation received by it (including, for the avoidance of doubt, amounts received by the investment adviser) with a Fund, and any advisory fees payable will not be reduced thereby.
Morgan Stanley may be engaged to act as a financial advisor to a company in connection with the sale of such company, or subsidiaries or divisions thereof, may represent potential buyers of businesses through its mergers and acquisition activities and may provide lending and other related financing services in connection with such transactions. Morgan Stanley’s compensation for such activities is usually based upon realized consideration and is usually contingent, in substantial part, upon the closing of the transaction. Under these circumstances, a Fund may be precluded from participating in a transaction with or relating to the company being sold or participating in any financing activity related to merger or acquisition.
The involvement or presence of Morgan Stanley in the investment banking and other commercial activities described above (or the financial markets more broadly) may restrict or otherwise limit investment opportunities that may otherwise be available to the Funds. For example, issuers may hire and compensate Morgan Stanley to provide underwriting, financial advisory, placement agency, brokerage services or other services and, because of limitations imposed by applicable law and regulation, a Fund may be prohibited from buying or selling securities issued by those issuers or participating in related transactions or otherwise limited in its ability to engage in such investments.
The investment adviser believes that the nature and range of clients to whom Morgan Stanley and its subsidiaries render investment banking and other services is such that it would be inadvisable to exclude these companies from the Fund’s portfolio.
Morgan Stanley’s Marketing Activities. Morgan Stanley is engaged in the business of underwriting, syndicating, brokering, administering, servicing, arranging and advising on the distribution of a wide variety of securities and other investments in which a Fund may invest. Subject to the restrictions of the 1940 Act, including Sections 10(f) and 17(e) thereof, a Fund may invest in transactions in which Morgan Stanley acts as underwriter, placement agent, syndicator, broker, administrative agent, servicer, advisor, arranger or structuring agent and receives fees or other compensation from the sponsors of such products or securities. Any fees earned by Morgan Stanley in such capacity will not be shared with the investment adviser or the Funds. Certain conflicts of interest, in addition to the receipt of fees or other compensation, would be inherent in these transactions. Moreover, the interests of one of Morgan Stanley’s clients with respect to an issuer of securities in which a Fund has an investment may be adverse to the investment adviser’s or a Fund’s best interests. In conducting the foregoing activities, Morgan Stanley will be acting for its other clients and will have no obligation to act in the investment adviser’s or a Fund’s best interests.
Client Relationships. Morgan Stanley has existing and potential relationships with a significant number of corporations, institutions and individuals. In providing services to its clients, Morgan Stanley may face conflicts of interest with respect to activities recommended to or performed for such clients, on the one hand, and a Fund, its shareholders or the entities in which the Fund invests, on the other hand. In addition, these client relationships may present conflicts of interest in determining whether to offer certain investment opportunities to a Fund.
In acting as principal or in providing advisory and other services to its other clients, Morgan Stanley may engage in or recommend activities with respect to a particular matter that conflict with or are different from activities engaged in or recommended by the investment adviser on a Fund’s behalf.
Principal Investments. To the extent permitted by applicable law, there may be situations in which a Fund’s interests may conflict with the interests of one or more general accounts of Morgan Stanley and its affiliates or accounts managed by Morgan Stanley or its affiliates. This may occur because these accounts hold public and private debt and equity securities of many issuers which may be or become portfolio companies, or from whom portfolio companies may be acquired.
Transactions with Portfolio Companies of Affiliated Investment Accounts. The companies in which a Fund may invest may be counterparties to or participants in agreements, transactions or other arrangements with portfolio companies or other entities of portfolio investments of Affiliated Investment Accounts (for example, a company in which a Fund invests may retain a company in which an Affiliated Investment Account invests to provide services or may acquire an asset from such company or vice versa). Certain of these agreements, transactions and arrangements involve fees, servicing payments, rebates and/or other benefits to Morgan Stanley or its affiliates. For example, portfolio entities may, including at the encouragement of Morgan Stanley, enter into agreements regarding group procurement and/or vendor discounts. Morgan Stanley and its affiliates may also participate in these agreements and may realize better pricing or discounts as a result of the participation of portfolio entities. To the extent permitted by applicable law, certain of these agreements may provide for commissions or similar payments and/or discounts or rebates to be paid to a portfolio entity of an Affiliated Investment Account, and such payments or discounts or rebates may also be made directly to Morgan Stanley or its affiliates. Under these arrangements, a particular
Eaton Vance
Limited Duration Income Fund
March 31, 2023
Potential Conflicts of Interest — continued
portfolio company or other entity may benefit to a greater degree than the other participants, and the funds, investment vehicles and accounts (which may or may not include a Fund) that own an interest in such entity will receive a greater relative benefit from the arrangements than the Eaton Vance funds, investment vehicles or accounts that do not own an interest therein. Fees and compensation received by portfolio companies of Affiliated Investment Accounts in relation to the foregoing will not be shared with a Fund or offset advisory fees payable.
Investments in Portfolio Investments of Other Funds. To the extent permitted by applicable law, when a Fund invests in certain companies or other entities, other funds affiliated with the investment adviser may have made or may be making an investment in such companies or other entities. Other funds that have been or may be managed by the investment adviser may invest in the companies or other entities in which a Fund has made an investment. Under such circumstances, a Fund and such other funds may have conflicts of interest (e.g., over the terms, exit strategies and related matters, including the exercise of remedies of their respective investments). If the interests held by a Fund are different from (or take priority over) those held by such other funds, the investment adviser may be required to make a selection at the time of conflicts between the interests held by such other funds and the interests held by a Fund.
Allocation of Expenses. Expenses may be incurred that are attributable to a Fund and one or more other Affiliated Investment Accounts (including in connection with issuers in which a Fund and such other Affiliated Investment Accounts have overlapping investments). The allocation of such expenses among such entities raises potential conflicts of interest. The investment adviser and its affiliates intend to allocate such common expenses among a Fund and any such other Affiliated Investment Accounts on a pro rata basis or in such other manner as the investment adviser deems to be fair and equitable or in such other manner as may be required by applicable law.
Temporary Investments. To more efficiently invest short-term cash balances held by a Fund, the investment adviser may invest such balances on an overnight “sweep” basis in shares of one or more money market funds or other short-term vehicles. It is anticipated that the investment adviser to these money market funds or other short-term vehicles may be the investment adviser (or an affiliate) to the extent permitted by applicable law, including Rule 12d1-1 under the 1940 Act.
Transactions with Affiliates. The investment adviser and any investment sub-adviser might purchase securities from underwriters or placement agents in which a Morgan Stanley affiliate is a member of a syndicate or selling group, as a result of which an affiliate might benefit from the purchase through receipt of a fee or otherwise. Neither the investment adviser nor any investment sub-adviser will purchase securities on behalf of a Fund from an affiliate that is acting as a manager of a syndicate or selling group. Purchases by the investment adviser on behalf of a Fund from an affiliate acting as a placement agent must meet the requirements of applicable law. Furthermore, Morgan Stanley may face conflicts of interest when the Funds use service providers affiliated with Morgan Stanley because Morgan Stanley receives greater overall fees when they are used.
General Process for Potential Conflicts. All of the transactions described above involve the potential for conflicts of interest between the investment adviser, related persons of the investment adviser and/or their clients. The Advisers Act, the 1940 Act and ERISA impose certain requirements designed to decrease the possibility of conflicts of interest between an investment adviser and its clients. In some cases, transactions may be permitted subject to fulfillment of certain conditions. Certain other transactions may be prohibited. In addition, the investment adviser has instituted policies and procedures designed to prevent conflicts of interest from arising and, when they do arise, to ensure that it effects transactions for clients in a manner that is consistent with its fiduciary duty to its clients and in accordance with applicable law. The investment adviser seeks to ensure that potential or actual conflicts of interest are appropriately resolved taking into consideration the overriding best interests of the client.
Delivery of Shareholder Documents. The Securities and Exchange Commission (SEC) permits funds to deliver only one copy of shareholder documents, including prospectuses, proxy statements and shareholder reports, to fund investors with multiple accounts at the same residential or post office box address. This practice is often called “householding” and it helps eliminate duplicate mailings to shareholders. American Stock Transfer & Trust Company, LLC (“AST”), the closed-end funds transfer agent, or your financial intermediary, may household the mailing of your documents indefinitely unless you instruct AST, or your financial intermediary, otherwise. If you would prefer that your Eaton Vance documents not be householded, please contact AST or your financial intermediary. Your instructions that householding not apply to delivery of your Eaton Vance documents will typically be effective within 30 days of receipt by AST or your financial intermediary.
Portfolio Holdings. Each Eaton Vance Fund and its underlying Portfolio(s) (if applicable) files a schedule of portfolio holdings on Part F to Form N-PORT with the SEC. Certain information filed on Form N-PORT may be viewed on the Eaton Vance website at www.eatonvance.com, by calling Eaton Vance at 1-800-262-1122 or in the EDGAR database on the SEC’s website at www.sec.gov.
Proxy Voting. From time to time, funds are required to vote proxies related to the securities held by the funds. The Eaton Vance Funds or their underlying Portfolios (if applicable) vote proxies according to a set of policies and procedures approved by the Funds’ and Portfolios’ Boards. You may obtain a description of these policies and procedures and information on how the Funds or Portfolios voted proxies relating to portfolio securities during the most recent 12-month period ended June 30, without charge, upon request, by calling 1-800-262-1122 and by accessing the SEC’s website at www.sec.gov.
Share Repurchase Program. The Fund's Board of Trustees has approved a share repurchase program authorizing the Fund to repurchase up to 10% of its common shares outstanding as of the last day of the prior calendar year in open-market transactions at a discount to net asset value. The repurchase program does not obligate the Fund to purchase a specific amount of shares. The Fund's repurchase activity, including the number of shares purchased, average price and average discount to net asset value, is disclosed in the Fund's annual and semi-annual reports to shareholders.
Additional Notice to Shareholders. If applicable, a Fund may also redeem or purchase its outstanding preferred shares in order to maintain compliance with regulatory requirements, borrowing or rating agency requirements or for other purposes as it deems appropriate or necessary.
Closed-End Fund Information. Eaton Vance closed-end funds make fund performance data and certain information about portfolio characteristics available on the Eaton Vance website shortly after the end of each month. Other information about the funds is available on the website. The funds’ net asset value per share is readily accessible on the Eaton Vance website. Portfolio holdings for the most recent month-end are also posted to the website approximately 30 days following the end of the month. This information is available at www.eatonvance.com on the fund information pages under “Closed-End Funds & Term Trusts.”
This Page Intentionally Left Blank
This Page Intentionally Left Blank
Investment Adviser and Administrator
Eaton Vance Management
Two International Place
Boston, MA 02110
Custodian
State Street Bank and Trust Company
One Congress Street, Suite 1
Boston, MA 02114-2016
Transfer Agent
American Stock Transfer & Trust Company, LLC
6201 15th Avenue
Brooklyn, NY 11219
Independent Registered Public Accounting Firm
Deloitte & Touche LLP
200 Berkeley Street
Boston, MA 02116-5022
Fund Offices
Two International Place
Boston, MA 02110
Item 2. Code of Ethics
The registrant (sometimes referred to as the “Fund”) has adopted a code of ethics applicable to its Principal Executive Officer, Principal Financial Officer and Principal Accounting Officer. The registrant undertakes to provide a copy of such code of ethics to any person upon request, without charge, by calling 1-800-262-1122. The registrant has not amended the code of ethics as described in Form N-CSR during the period. The registrant has not granted any waiver, including an implicit waiver, from a provision of the code of ethics as described in Form N-CSR during the period covered by this report.
Item 3. Audit Committee Financial Expert
The registrant’s Board of Trustees (the “Board”) has designated George J. Gorman and Scott E. Wennerholm, each an independent trustee, as audit committee financial experts. Mr. Gorman is a certified public accountant who is the Principal at George J. Gorman LLC (a consulting firm). Previously, Mr. Gorman served in various
capacities at Ernst & Young LLP (a registered public accounting firm), including as Senior Partner. Mr. Gorman also has experience serving as an independent trustee and audit committee financial expert of other mutual fund complexes. Mr. Wennerholm is a private investor. Previously, Mr. Wennerholm served as a Trustee at Wheelock College (postsecondary institution), as a Consultant at GF Parish Group (executive recruiting firm), Chief Operating Officer and Executive Vice President at BNY Mellon Asset Management (investment management firm), Chief Operating Officer and Chief Financial Officer at Natixis Global Asset Management (investment management firm), and Vice President at Fidelity Investments Institutional Services (investment management firm).
Item 4. Principal Accountant Fees and Services
(a) –(d)
The following table presents the aggregate fees billed to the registrant for the registrant’s fiscal years ended March 31, 2022 and March 31, 2023 by the registrant’s principal accountant, Deloitte & Touche LLP (“D&T”), for professional services rendered for the audit of the registrant’s annual financial statements and fees billed for other services rendered by D&T during such periods.
| | | | | | | | |
Fiscal Years Ended | | 3/31/22 | | | 3/31/23 | |
Audit Fees | | $ | 127,600 | | | $ | 131,600 | |
Audit-Related Fees(1) | | $ | 0 | | | $ | 0 | |
Tax Fees(2) | | $ | 19,982 | | | $ | 350 | |
All Other Fees(3) | | $ | 0 | | | $ | 0 | |
| | | | | | | | |
Total | | $ | 147,582 | | | $ | 131,950 | |
| | | | | | | | |
| (1) | Audit-related fees consist of the aggregate fees billed for assurance and related services that are reasonably related to the performance of the audit of financial statements and are not reported under the category of audit fees. |
| (2) | Tax fees consist of the aggregate fees billed for professional services rendered by the principal accountant relating to tax compliance, tax advice, and tax planning and specifically include fees for tax return preparation and other related tax compliance/planning matters. |
| (3) | All other fees consist of the aggregate fees billed for products and services provided by the principal accountant other than audit, audit-related, and tax services. |
(e)(1) The registrant’s audit committee has adopted policies and procedures relating to the pre-approval of services provided by the registrant’s principal accountant (the “Pre-Approval Policies”). The Pre-Approval Policies establish a framework intended to assist the audit committee in the proper discharge of its pre-approval responsibilities. As a general matter, the Pre-Approval Policies (i) specify certain types of audit, audit-related, tax, and other services determined to be pre-approved by the audit committee; and (ii) delineate specific procedures governing the mechanics of the pre-approval process, including the approval and monitoring of audit and non-audit service fees. Unless a service is specifically pre-approved under the Pre-Approval Policies, it must be separately pre-approved by the audit committee.
The Pre-Approval Policies and the types of audit and non-audit services pre-approved therein must be reviewed and ratified by the registrant’s audit committee at least annually. The registrant’s audit committee maintains full responsibility for the appointment, compensation, and oversight of the work of the registrant’s principal accountant.
(e)(2) No services described in paragraphs (b)-(d) above were approved by the registrant’s audit committee pursuant to the “de minimis exception” set forth in Rule 2-01(c)(7)(i)(C) of Regulation S-X.
(f) Not applicable.
(g) The following table presents (i) the aggregate non-audit fees (i.e., fees for audit-related, tax, and other services) billed to the registrant by D&T for the registrant’s fiscal years ended March 31, 2022 and March 31, 2023; and (ii) the aggregate non-audit fees (i.e., fees for audit-related, tax, and other services) billed to the Eaton Vance organization by D&T for the same time periods.
| | | | | | | | |
Fiscal Years Ended | | 3/31/22 | | | 3/31/23 | |
Registrant | | $ | 19,982 | | | $ | 350 | |
Eaton Vance(1) | | $ | 51,800 | | | $ | 52,836 | |
| (1) | The Investment Adviser to the registrant, as well as any of its affiliates that provide ongoing services to the registrant, are subsidiaries of Morgan Stanley. |
(h) The registrant’s audit committee has considered whether the provision by the registrant’s principal accountant of non-audit services to the registrant’s investment adviser and any entity controlling, controlled by, or under common control with the adviser that provides ongoing services to the registrant that were not pre-approved pursuant to Rule 2-01(c)(7)(ii) of Regulation S-X is compatible with maintaining the principal accountant’s independence.
(i) Not applicable.
(j) Not applicable.
Item 5. Audit Committee of Listed Registrants
The registrant has a separately-designated standing audit committee established in accordance with Section 3(a)(58)(A) of the Securities and Exchange Act of 1934, as amended. George J. Gorman, Keith Quinton, Scott E. Wennerholm (Chair), and Nancy A. Wiser are the members of the registrant’s audit committee.
Item 6. Schedule of Investments
Please see schedule of investments contained in the Report to Stockholders included under Item 1 of this Form N-CSR.
Item 7. Disclosure of Proxy Voting Policies and Procedures for Closed-End Management Investment Companies
The Board of the Fund has adopted a proxy voting policy and procedure (the “Fund Policy”), pursuant to which the trustees have delegated proxy voting responsibility to the Fund’s investment adviser and adopted the investment adviser’s proxy voting policies and procedures (the “Policies”) which are described below. The trustees will review the Policies annually. In the event that a conflict of interest arises between the Fund’s shareholders and the investment adviser, the administrator, or any of their affiliates or any affiliate of the Fund, the investment adviser will generally refrain from voting the proxies related to the companies giving rise to such conflict until it consults with the Board, or any committee, sub-committee or group of independent trustees identified by the Board, which will instruct the investment adviser on the appropriate course of action. If the Board Members are unable to meet and the failure to vote a proxy would have a material adverse impact on the Fund, the investment adviser may vote such proxy, provided that it discloses the existence of the material conflict to the Chairperson of the Fund’s Board as soon as practicable and to the Board at its next meeting.
The Policies are designed to promote accountability of a company’s management to its shareholders and to align the interests of management with those shareholders. An independent proxy voting service (“Agent”), currently Institutional Shareholder Services, Inc., has been retained to assist in the voting of proxies through the provision of vote analysis, implementation and recordkeeping and disclosure services. The investment adviser will generally vote proxies through the Agent. The Agent is required to vote all proxies in accordance with customized proxy voting guidelines (the “Guidelines”) and/or refer them back to the investment adviser pursuant to the Policies.
The Agent is required to establish and maintain adequate internal controls and policies in connection with the provision of proxy voting services, including methods to reasonably ensure that its analysis and recommendations are not influenced by a conflict of interest. The Guidelines include voting guidelines for matters relating to, among other things, the election of directors, approval of independent auditors, executive compensation, corporate structure and anti-takeover defenses. The investment adviser may cause the Fund to abstain from voting from time to time where it determines that the costs associated with voting a proxy outweigh the benefits derived from exercising the right to vote or it is unable to access or access timely ballots or other proxy information, among other stated reasons. The Agent will refer Fund proxies to the investment adviser for instructions under circumstances where, among others: (1) the application of the Guidelines is unclear; (2) a particular proxy question is not covered by the Guidelines; or (3) the Guidelines require input from the investment adviser. When a proxy voting issue has been referred to the investment adviser, the analyst (or portfolio manager if applicable) covering the company subject to the proxy proposal determines the final vote (or decision not to vote) and the investment adviser’s Proxy Administrator (described below) instructs the Agent to vote accordingly for securities held by the Fund. Where more than one analyst covers a particular company and the recommendations of such analysts voting a proposal conflict, the investment adviser’s Global Proxy Group (described below) will review such recommendations and any other available information related to the proposal and determine the manner in which it should be voted, which may result in different recommendations for the Fund that may differ from other clients of the investment adviser.
The investment adviser has appointed a Proxy Administrator to assist in the coordination of the voting of client proxies (including the Fund’s) in accordance with the Guidelines and the Policies. The investment adviser and its affiliates have also established a Global Proxy Group. The Global Proxy Group develops the investment adviser’s positions on all major corporate issues, creates the Guidelines and oversees the proxy voting process. The Proxy Administrator maintains a record of all proxy questions that have been referred by the Agent, all applicable recommendations, analysis and research received and any resolution of the matter. Before instructing the Agent to vote contrary to the Guidelines or the recommendation of the Agent, the Proxy Administrator will provide the Global Proxy Group with the Agent’s recommendation for the proposal along with any other relevant materials, including the basis for the analyst’s recommendation. The Proxy Administrator will then instruct the Agent to vote the proxy in the manner determined by the Global Proxy Group. A similar process will be followed if the Agent has a conflict of interest with respect to a proxy. The investment adviser will report to the Fund’s Board any votes cast contrary to the Guidelines or Agent recommendations, as applicable, no less than annually.
The investment adviser’s Global Proxy Group is responsible for monitoring and resolving possible material conflicts with respect to proxy voting. Because the Guidelines are predetermined and designed to be in the best interests of shareholders, application of the Guidelines to vote client proxies should, in most cases, adequately address any possible conflict of interest. The investment adviser will monitor situations that may result in a conflict of interest between any of its clients and the investment adviser or any of its affiliates by maintaining a list of significant existing and prospective corporate clients. The Proxy Administrator will compare such list with the names of companies of which he or she has been referred a proxy statement (the “Proxy Companies”). If a company on the list is also a Proxy Company, the Proxy Administrator will report that fact to the Global
Proxy Group. If the Proxy Administrator intends to instruct the Agent to vote in a manner inconsistent with the Guidelines, the Global Proxy Group will first determine, in consultation with legal counsel if necessary, whether a material conflict exists. If it is determined that a material conflict exists, the investment adviser will seek instruction on how the proxy should be voted from the Fund’s Board, or any committee or subcommittee identified by the Board. If a matter is referred to the Global Proxy Group, the decision made and basis for the decision will be documented by the Proxy Administrator and/or Global Proxy Group.
Information on how the Fund voted proxies relating to portfolio securities during the most recent 12 month period ended June 30 is available (1) without charge, upon request, by calling 1-800-262-1122, and (2) on the Securities and Exchange Commission’s website at http://www.sec.gov.
Item 8. Portfolio Managers of Closed-End Management Investment Companies
Eaton Vance Management (“EVM” or “Eaton Vance”) is the investment adviser of the Fund. Catherine C. McDermott, Kelley Gerrity, Eric A. Stein and Andrew Szczurowski comprise the investment team responsible for the overall management of the Fund’s investments.
Ms. McDermott is a Vice President of EVM and has been a portfolio manager of the Fund since January 2008. Ms. Gerrity is a Vice President of EVM and has been a portfolio manager of the Fund since March 2019. Mr. Stein is a Vice President and Chief Investment Officer, Fixed Income of EVM, has been a portfolio manager of the Fund since December 2012. Mr. Szczurowski is a Vice President of EVM and has been a portfolio manager of the Fund since November 2011. Mmes. Gerrity and McDermott and Messrs. Stein and Szczurowski have managed other Eaton Vance portfolios for more than five years. This information is provided as of the date of filing this report.
The following table shows, as of the Fund’s most recent fiscal year end, the number of accounts each portfolio manager managed in each of the listed categories and the total assets (in millions of dollars) in the accounts managed within each category. The table also shows the number of accounts with respect to which the advisory fee is based on the performance of the account, if any, and the total assets (in millions of dollars) in those accounts.
| | | | | | | | | | | | | | | | |
| | | Number of
All
Accounts | | | Total Assets of
All
Accounts | | | Number of
Accounts
Paying a
Performance Fee | | | Total Assets
of Accounts Paying
a Performance Fee | |
Kelley Gerrity(1) | | | | | | | | | | | | | | | | |
Registered Investment Companies | | | 7 | | | | $10,614.9 | | | | 0 | | | | $0 | |
Other Pooled Investment Vehicles | | | 1 | | | | $22.9 | | | | 0 | | | | $0 | |
Other Accounts | | | 0 | | | | $0 | | | | 0 | | | | $0 | |
Catherine C. McDermott | | | | | | | | | | | | | | | | |
Registered Investment Companies | | | 6 | | | | $3,695.8 | | | | 0 | | | | $0 | |
Other Pooled Investment Vehicles | | | 0 | | | | $0 | | | | 0 | | | | $0 | |
Other Accounts | | | 0 | | | | $0 | | | | 0 | | | | $0 | |
Eric A. Stein(1) | | | | | | | | | | | | | | | | |
Registered Investment Companies | | | 3 | | | | $5,745.1 | | | | 0 | | | | $0 | |
Other Pooled Investment Vehicles | | | 1 | | | | $64.5 | | | | 0 | | | | $0 | |
Other Accounts | | | 0 | | | | $0 | | | | 0 | | | | $0 | |
Andrew Szczurowski(1) | | | | | | | | | | | | | | | | |
Registered Investment Companies | | | 6 | | | | $12,785.1 | | | | 0 | | | | $0 | |
Other Pooled Investment Vehicles | | | 1 | | | | $64.5 | | | | 0 | | | | $0 | |
Other Accounts | | | 0 | | | | $0 | | | | 0 | | | | $0 | |
| (1) | This portfolio manager serves as portfolio manager of one or more registered investment companies and/or pooled investment vehicles that invest or may invest in one or more underlying registered investment companies and/or separate pooled investment vehicles in the Eaton Vance family of funds. The underlying investment companies may be managed by this portfolio manager or another portfolio manager. |
The following table shows the dollar range of Fund shares beneficially owned by each portfolio manager as of the Fund’s most recent fiscal year end.
| | |
Portfolio Manager | | Dollar Range of Equity Securities
Beneficially Owned in the Fund |
Kelley Gerrity | | None |
Catherine C. McDermott | | None |
Eric A. Stein | | $1 - $10,000 |
Andrew Szczurowski | | $10,001 - $50,000 |
Potential for Conflicts of Interest. It is possible that conflicts of interest may arise in connection with a portfolio manager’s management of the Fund’s investments on the one hand and the investments of other accounts for which a portfolio manager is responsible on the other. For example, a portfolio manager may have conflicts of interest in allocating management time, resources and investment opportunities among the Fund and other accounts he or she advises. In addition, due to differences in the investment strategies or restrictions between the Fund and the other accounts, the portfolio manager may take action with respect to another account that differs from the action taken with respect to the Fund. In some cases, another account managed by a portfolio manager may compensate the investment adviser based on the performance of the securities held by that account. The existence of such a performance based fee may create additional conflicts of interest for the portfolio manager in the allocation of management time, resources and investment opportunities. Whenever conflicts of interest arise, the portfolio manager will endeavor to exercise his or her discretion in a manner that he or she believes is equitable to all interested persons. EVM has adopted several policies and procedures designed to address these potential conflicts including a code of ethics and policies that govern the investment adviser’s trading practices, including among other things the aggregation and allocation of trades among clients, brokerage allocations, cross trades and best execution.
Compensation Structure for EVM
The compensation structure of Eaton Vance and its affiliates that are investment advisers (for purposes of this section “Eaton Vance”) is based on a total reward system of base salary and incentive compensation, which is paid either in the form of cash bonus, or for employees meeting the specified deferred compensation eligibility threshold, partially as a cash bonus and partially as mandatory deferred compensation. Deferred compensation granted to Eaton Vance employees is generally granted as a mix of deferred cash awards under the Investment Management Alignment Plan (IMAP) and equity-based awards in the form of stock units. The portion of incentive compensation granted in the form of a deferred compensation award and the terms of such awards are determined annually by the Compensation, Management Development and Succession Committee of the Board of Directors of Eaton Vance’s parent company, Morgan Stanley.
Base salary compensation. Generally, portfolio managers and research analysts receive base salary compensation based on the level of their position with the adviser.
Incentive compensation. In addition to base compensation, portfolio managers and research analysts may receive discretionary year-end compensation. Incentive compensation may include:
| | • | | A mandatory program that defers a portion of incentive compensation into restricted stock units or other awards based on Morgan Stanley common stock or other plans that are subject to vesting and other conditions. |
| | • | | IMAP is a cash-based deferred compensation plan designed to increase the alignment of participants’ interests with the interests of clients. For eligible employees, a portion of their deferred compensation is mandatorily deferred into IMAP on an annual basis. Awards granted under IMAP are notionally invested in referenced funds available pursuant to the plan, which are funds advised |
| | by MSIM and its affiliates including Eaton Vance. Portfolio managers are required to notionally invest a minimum of 40% of their account balance in the designated funds that they manage and are included in the IMAP notional investment fund menu. |
| | • | | Deferred compensation awards are typically subject to vesting over a multi-year period and are subject to cancellation through the payment date for competition, cause (i.e., any act or omission that constitutes a breach of obligation to the Funds, including failure to comply with internal compliance, ethics or risk management standards, and failure or refusal to perform duties satisfactorily, including supervisory and management duties), disclosure of proprietary information, and solicitation of employees or clients. Awards are also subject to clawback through the payment date if an employee’s act or omission (including with respect to direct supervisory responsibilities) causes a restatement of the firm’s consolidated financial results, constitutes a violation of the firm’s global risk management principles, policies and standards, or causes a loss of revenue associated with a position on which the employee was paid and the employee operated outside of internal control policies. |
Eaton Vance compensates employees based on principles of pay-for-performance, market competitiveness and risk management. Eligibility for, and the amount of any, discretionary compensation is subject to a multi-dimensional process. Specifically, consideration is given to one or more of the following factors, which can vary by portfolio management team and circumstances:
| | • | | Revenue and profitability of the business and/or each fund/account managed by the portfolio manager |
| | • | | Individual contribution and performance |
| | • | | Contribution to client objectives |
| | • | | Revenue and profitability of the firm |
| | • | | Return on equity and risk factors of both the business units and Morgan Stanley |
| | • | | Assets managed by the portfolio manager |
| | • | | External market conditions |
| | • | | New business development and business sustainability |
| | • | | Team, product and/or Eaton Vance performance |
| | • | | The pre-tax investment performance of the funds/accounts managed by the portfolio manager(1) (which may, in certain cases, be measured against the applicable benchmark(s) and/or peer group(s) over one, three and five-year periods),(2) provided that for funds that are tax-managed or otherwise have an objective of after-tax returns, performance net of taxes will be considered |
Further, the firm’s Global Incentive Compensation Discretion Policy requires compensation managers to consider only legitimate, business related factors when exercising discretion in determining variable incentive compensation, including adherence to Morgan Stanley’s core values, conduct, disciplinary actions in the current performance year, risk management and risk outcomes.
| (1) | Generally, this is total return performance, provided that consideration may also be given to relative risk-adjusted performance. |
| (2) | When a fund’s peer group as determined by Lipper or Morningstar is deemed by the relevant Eaton Vance Chief Investment Officer, or in the case of the sub-advised Funds, the Director of Product Development and Sub-Advised Funds, not to provide a fair comparison, performance may instead be evaluated primarily against a custom peer group or market index. |
Item 9. Purchases of Equity Securities by Closed-End Management Investment Company and Affiliated Purchasers
REGISTRANT PURCHASES OF EQUITY SECURITIES
| | | | | | | | |
Period* | | Total Number of
Shares Purchased | | Average Price
Paid per Share | | Total Number of
Shares Purchased
as Part of Publicly
Announced
Programs | | Maximum
Number of
Shares that May
Yet Be
Purchased Under
the Programs |
April 2022 | | — | | — | | — | | 10,354,702 |
May 2022 | | — | | — | | — | | 10,354,702 |
June 2022 | | — | | — | | — | | 10,354,702 |
July 2022 | | — | | — | | — | | 10,354,702 |
August 2022 | | — | | — | | — | | 10,354,702 |
September 2022 | | — | | — | | — | | 10,354,702 |
October 2022 | | — | | — | | — | | 10,354,702 |
November 2022 | | — | | — | | — | | 10,354,702 |
December 2022 | | — | | — | | — | | 10,354,702 |
January 2023 | | — | | — | | — | | 10,354,702 |
February 2023 | | — | | — | | — | | 10,354,702 |
March 2023 | | — | | — | | — | | 10,354,702 |
Total | | — | | — | | — | | |
| * | On November 11, 2013, the Fund’s Board of Trustees approved a share repurchase program authorizing the Fund to repurchase up to 10% of its then currently outstanding common shares in open-market transactions at a discount to net asset value. The repurchase program was announced on November 15, 2013. |
Item 10. Submission of Matters to a Vote of Security Holders
No material changes.
Item 11. Controls and Procedures
(a) It is the conclusion of the registrant’s principal executive officer and principal financial officer that the effectiveness of the registrant’s current disclosure controls and procedures (such disclosure controls and procedures having been evaluated within 90 days of the date of this filing) provide reasonable assurance that the information required to be disclosed by the registrant has been recorded, processed, summarized and reported within the time period specified in the Commission’s rules and forms and that the information required to be disclosed by the registrant has been accumulated and communicated to the registrant’s principal executive officer and principal financial officer in order to allow timely decisions regarding required disclosure.
(b) There have been no changes in the registrant’s internal controls over financial reporting during the second fiscal quarter of the period covered by this report that has materially affected, or is reasonably likely to materially affect, the registrant’s internal control over financial reporting.
Item 12. Disclosure of Securities Lending Activities for Closed-End Management Investment Companies
No activity to report for the registrant’s most recent fiscal year end.
Item 13. Exhibits
Signatures
Pursuant to the requirements of the Securities Exchange Act of 1934 and the Investment Company Act of 1940, the registrant has duly caused this report to be signed on its behalf by the undersigned, thereunto duly authorized.
| | |
| Eaton Vance Limited Duration Income Fund |
| |
| By: | | /s/ Eric A. Stein |
| | Eric A. Stein |
| | President |
| |
| Date: | | May 22, 2023 |
Pursuant to the requirements of the Securities Exchange Act of 1934 and the Investment Company Act of 1940, this report has been signed below by the following persons on behalf of the registrant and in the capacities and on the dates indicated.
| | |
| |
| By: | | /s/ James F. Kirchner |
| | James F. Kirchner |
| | Treasurer |
| |
| Date: | | May 22, 2023 |
| |
| By: | | /s/ Eric A. Stein |
| | Eric A. Stein |
| | President |
| |
| Date: | | May 22, 2023 |