| UNITED STATES |
| SECURITIES AND EXCHANGE COMMISSION |
| Washington, D.C. 20549 |
| FORM N-CSR |
| CERTIFIED SHAREHOLDER REPORT OF REGISTERED MANAGEMENT |
| INVESTMENT COMPANIES |
| Investment Company Act file number 811-21327 |
| DREYFUS PREMIER MANAGER FUNDS II |
| Dreyfus Premier Balanced Opportunity Fund |
| Dreyfus Premier Blue Chip Fund |
| Dreyfus Premier Select Fund |
| (Exact name of Registrant as specified in charter) |
| c/o The Dreyfus Corporation |
| 200 Park Avenue |
| New York, New York 10166 |
| (Address of principal executive offices) (Zip code) |
| Mark N. Jacobs, Esq. |
| 200 Park Avenue |
| New York, New York 10166 |
| (Name and address of agent for service) |
| Registrant's telephone number, including area code: (212) 922-6000 |
| Date of fiscal year end: | 11/30 | |
| Date of reporting period: | 11/30/06 |
FORM N-CSR
Item 1. Reports to Stockholders.
| Dreyfus Premier Balanced Opportunity Fund |
ANNUAL REPORT November 30, 2006
Save time. Save paper. View your next shareholder report online as soon as it’s available. Log into www.dreyfus.com and sign up for Dreyfus eCommunications. It’s simple and only takes a few minutes.
The views expressed in this report reflect those of the portfolio manager only through the end of the period covered and do not necessarily represent the views of Dreyfus or any other person in the Dreyfus organization. Any such views are subject to change at any time based upon market or other conditions and Dreyfus disclaims any responsibility to update such views.These views may not be relied on as investment advice and, because investment decisions for a Dreyfus fund are based on numerous factors, may not be relied on as an indication of trading intent on behalf of any Dreyfus fund.
Not FDIC-Insured • Not Bank-Guaranteed • May Lose Value
| Contents | ||
| THE FUND | ||
| 2 | A Letter from the CEO | |
| 3 | Discussion of Fund Performance | |
| 6 | Fund Performance | |
| 8 | Understanding Your Fund’s Expenses | |
| 9 | Comparing Your Fund’s Expenses | |
| With Those of Other Funds | ||
| 10 | Statement of Investments | |
| 16 | Statement of Assets and Liabilities | |
| 18 | Statement of Operations | |
| 19 | Statement of Changes in Net Assets | |
| 22 | Financial Highlights | |
| 29 | Notes to Financial Statements | |
| 40 | Report of Independent Registered | |
| Public Accounting Firm | ||
| 41 | Important Tax Information | |
| 41 | Proxy Results | |
| 42 | Board Members Information | |
| 45 | Officers of the Fund | |
| FOR MORE INFORMATION | ||
| Back Cover | ||
| Dreyfus Premier Balanced Opportunity Fund |
The Fund

| A LETTER FROM THE CEO |
| Dear Shareholder: |
We are pleased to present this annual report for Dreyfus Premier Balanced Opportunity Fund, covering the 12-month period from December 1, 2005, through November 30, 2006.
Although reports of declining housing prices have raised some economic concerns, we believe that neither a domestic recession nor a major shortfall in global growth is likely. Stimulative monetary policies over the last several years have left a legacy of ample financial liquidity worldwide, which should continue to support global economic growth. Indeed, while U.S. monetary policy has tightened to the borderline between a neutral policy and a restrictive policy, most foreign monetary policies have tightened only from stimulative to neutral, leaving room for further expansion.
The financial markets seem to agree with the view that a gradual economic slowdown is more likely than a recession, as evidenced by ongoing strength in equities and corporate bonds.Although smaller-cap stocks generally continued to outperform their large-cap counterparts over the reporting period, we have begun to see signs that investors expecting generally slower profit growth have turned toward larger companies with the ability to sustain profitability in a slower economic environment.This pattern is consistent with previous mid-cycle slowdowns. Of course, there is no guarantee how the markets will perform, and we encourage you to discuss the implications of these and other matters with your financial advisor.
For information about how the fund performed during the reporting period, as well as market perspectives, we have provided a Discussion of Fund Performance given by the fund’s portfolio manager.
Thank you for your continued confidence and support.

| Thomas F. Eggers Chief Executive Officer The Dreyfus Corporation December 15, 2006 |
| 2 |

DISCUSSION OF FUND PERFORMANCE
Thomas G. Plumb, Primary Portfolio Manager
Wisconsin Capital Management, LLC, Sub-Investment Adviser
How did Dreyfus Premier Balanced Opportunity Fund perform relative to its benchmarks?
For the 12-month period ended November 30, 2006, the fund produced total returns of 8.96% for Class A shares, 8.11% for Class B shares, 8.14% for Class C shares, 9.25% for Class J shares, 9.12% for Class R shares, 8.65% for Class T shares and 9.11% for Class Z shares.1 In comparison, the fund’s benchmarks, the Standard & Poor’s Composite Stock Price Index (“S&P 500 Index”) and the Lehman Brothers Intermediate Government/Credit Bond Index, achieved total returns of 14.22% and 5.16%, respectively, for the same period.2
Stocks and bonds rallied over the reporting period’s second half as short-term interest rates stabilized and prospects improved for an economic “soft landing.” Our duration management and security selection strategies helped the fund’s bond portfolio outperform its benchmark, but the stock portfolio lagged industry averages when our shift in focus to larger companies proved to be somewhat premature. Overall, the fund’s performance during the reporting period was roughly in line with the ten year average return of 9.15% generated by the Class J shares using this balanced approach and management team.
What is the fund’s investment approach?
The fund seeks high total return, including capital appreciation and current income, through investments in a diversified mix of stocks and fixed-income securities. When allocating assets, we assess the relative return and risk of each asset class, and we analyze factors such as general economic conditions, anticipated changes in interest rates and the outlook for stocks generally.
When choosing stocks, we look for companies possessing most of the following characteristics: leading market positions, high barriers to market entry and other competitive or technological advantages, high returns on equity and assets, good growth prospects, strong management and relatively low debt burdens.The fund’s equity portfolio may
The Fund 3
| DISCUSSION OF FUND PERFORMANCE (continued) |
include large-company stocks, small-company stocks, growth stocks and value stocks.This flexible approach to equity investing enables the fund to invest wherever we believe opportunities exist.
The fund normally invests at least 25% of its assets in fixed-income senior securities, and may invest up to 5% of its total assets in securities rated below investment grade.The dollar-weighted average maturity of the fund’s fixed-income portfolio normally will not exceed 10 years.
What other factors influenced the fund’s performance?
Early in the reporting period, robust economic growth and low inflation helped support stock and bond prices. Many companies posted better-than-expected earnings, and investors continued to favor smaller, lower-quality companies that they believed could achieve high growth rates. As a result, many large, well-established companies remained out of favor, and their valuations fell well below historical averages. Meanwhile, relatively low inflation expectations enabled bond prices to remain remarkably resilient even as short-term interest rates climbed.
In May 2006, surging oil prices and hawkish comments from members of the Federal Reserve Board (the “Fed”) caused investors to revise upward their interest-rate forecasts, sparking corrections in the stock and bond markets. However, investor sentiment improved over the summer and early fall, when the economy slowed and the Fed refrained from further interest rate hikes. As economic conditions changed, the stock and bond markets rallied.
In this environment, we allocated roughly 60% of the fund’s assets to stocks and about 40% to bonds.However,we began to intensify our focus on stocks at the upper end of the capitalization range, where valuations appeared particularly attractive. Nonetheless, smaller stocks continued to outperform their “mega-cap” counterparts through August, causing the fund’s equity returns to lag its benchmark for the reporting period overall. In addition, a handful of holdings in the public education, software services and mortgage banking industries did not make as much progress in their turnarounds as we expected.
These disappointments were largely offset by better results in other areas. Sporting goods retailer Cabela’s continued to impress investors with its expansion plans. Software giant Microsoft gained value with the intro-
| 4 |
duction of several new products. Large pharmaceutical companies, such as Pfizer and Merck & Co., rebounded as litigation concerns eased. Mortgage agency Fannie Mae rallied when interest rates stabilized.And large integrated energy producers ExxonMobil and Chevron gained strength late in the reporting period as commodity prices moderated and investors turned to higher-quality companies.
We reduced the average duration of the fund’s bond portfolio early in the reporting period, which helped protect it from bouts of heightened market volatility. In addition, competitive levels of income from short-term corporate bonds contributed positively to total return.
What is the fund’s current strategy?
As the U.S.economy slows,we have maintained our focus on large companies in non-cyclical industries, including some of the world’s better known brand names. Many of these holdings are attractively valued and derive a substantial amount of revenue from overseas markets, which could help protect the fund in the event of an unexpectedly severe U.S. economic slowdown. Among bonds, we have maintained a relatively short average duration in anticipation of stable long-term yields, even if short-term rates begin to fall.
| December 15, 2006 |
| 1 | Total return includes reinvestment of dividends and any capital gains paid, and does not take into | |
| consideration the maximum initial sales charges in the case of Class A and Class T shares, or the | ||
| applicable contingent deferred sales charges imposed on redemptions in the case of Class B and | ||
| Class C shares. Had these charges been reflected, returns would have been lower. Past performance | ||
| is no guarantee of future results. Share price and investment return fluctuate such that upon | ||
| redemption, fund shares may be worth more or less than their original cost. Return figures | ||
| provided reflect the absorption of certain fund expenses by The Dreyfus Corporation pursuant to | ||
| an agreement in effect through March 31, 2007, at which time it may be extended, terminated or | ||
| modified. Had these expenses not been absorbed, the fund’s Class Z return would have been | ||
| lower. Class J shares are closed to new investors. | ||
| 2 | SOURCE: LIPPER INC. — Reflects reinvestment of dividends and, where applicable, capital | |
| gain distributions.The Standard & Poor’s 500 Composite Stock Price Index is a widely accepted, | ||
| unmanaged index of U.S. stock market performance.The Lehman Brothers Intermediate | ||
| Government/Credit Bond Index is a widely accepted, unmanaged index of government and | ||
| corporate bond market performance composed of U.S. Government,Treasury and Agency securities, | ||
| fixed-income securities and nonconvertible investment-grade corporate debt, with an average | ||
| maturity of 1-10 years. |
The Fund 5
| FUND PERFORMANCE |
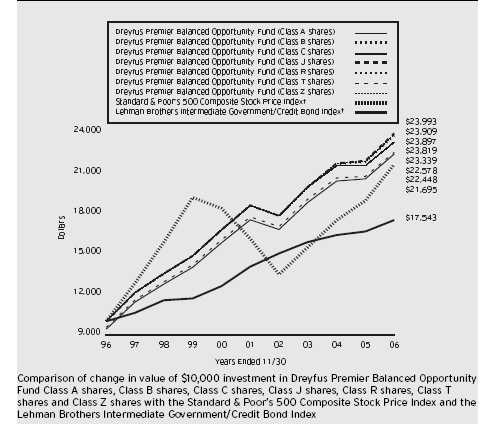
† Source: Lipper Inc.
Past performance is not predictive of future performance.
The above graph compares a $10,000 investment made in Class A, Class B, Class C, Class R, Class T, Class Z and Class J shares of Dreyfus Premier Balanced Opportunity Fund on 11/30/96 to a $10,000 investment made in both the Standard & Poor’s 500 Composite Stock Price Index (the “S&P 500 Index”) and the Lehman Brothers Intermediate Government/Credit Bond Index (the “Lehman Index”) on that date. All dividends and capital gain distributions are reinvested.
On January 30, 2004, Dreyfus Premier Balanced Opportunity Fund (the “fund”) commenced operations after all of the assets of another mutual fund advised by the fund’s sub-investment adviser were transferred to the fund in exchange for Class J shares of the fund in a tax-free reorganization. Class B, J and Z shares are closed to new investors.The fund offers Class A, C, R and T shares, which are subject to different sales charges and expenses.The performance figures for Class A, Class B, Class C, Class R, Class T and Class Z shares in the line graph above include the performance of the predecessor fund and reflect current sales loads and distribution expenses in effect since the reorganization date.
The fund’s performance shown in the line graph takes into account the maximum initial sales charges on Class A and Class T shares and all other applicable fees and expenses on all classes.The S&P 500 Index is a widely accepted, unmanaged index of U.S. stock market performance.The Lehman Index is a widely accepted, unmanaged index of government and corporate bond market performance composed of U.S. government,Treasury and agency securities, fixed-income securities and nonconvertible investment-grade corporate debt, with an average maturity of 1-10 years.The indices do not take into account charges, fees and other expenses. Further information relating to fund performance, including expense reimbursements, if applicable, is contained in the Financial Highlights section of the prospectus and elsewhere in this report.
6
| Average Annual Total Returns as of 11/30/06 | ||||||
| 1 Year | 5 Years | 10 Years | ||||
| Class A shares | ||||||
| with maximum sales charge (5.75%) | 2.69% | 3.81% | 8.42% | |||
| without sales charge | 8.96% | 5.05% | 9.07% | |||
| Class B shares | ||||||
| with applicable redemption charge † | 4.11% | 4.25% | 9.07% | |||
| without redemption | 8.11% | 4.58% | 9.07% | |||
| Class C shares | ||||||
| with applicable redemption charge †† | 7.14% | 4.62% | 8.85% | |||
| without redemption | 8.14% | 4.62% | 8.85% | |||
| Class J shares | 9.25% | 5.21% | 9.15% | |||
| Class R shares | 9.12% | 5.13% | 9.11% | |||
| Class T shares | ||||||
| with applicable sales charge (4.5%) | 3.76% | 3.93% | 8.49% | |||
| without sales charge | 8.65% | 4.90% | 8.99% | |||
| Class Z shares | 9.11% | 5.12% | 9.10% | |||
Past performance is not predictive of future performance.The fund’s performance shown in the graph and table does not reflect the deduction of taxes that a shareholder would pay on fund distributions or the redemption of fund shares.The performance figures for Class A, Class B, Class C, Class R, Class T and Class Z shares shown in the table include the performance of the predecessor fund and reflect current sales loads and distribution expenses in effect since the reorganization date. Performance for Class B shares assumes the conversion of Class B shares to Class A shares at the end of the sixth year following the date of purchase.
| † The maximum contingent deferred sales charge for Class B shares is 4%. After six years Class B shares convert to Class A shares. ††The maximum contingent deferred sales charge for Class C shares is 1% for shares redeemed within one year of the date of purchase. |
| The Fund 7 |
UNDERSTANDING YOUR FUND’S EXPENSES (Unaudited)
As a mutual fund investor, you pay ongoing expenses, such as management fees and other expenses. Using the information below, you can estimate how these expenses affect your investment and compare them with the expenses of other funds.You also may pay one-time transaction expenses, including sales charges (loads) and redemption fees, which are not shown in this section and would have resulted in higher total expenses. For more information, see your fund’s prospectus or talk to your financial adviser.
Review your fund’s expenses
The table below shows the expenses you would have paid on a $1,000 investment in Dreyfus Premier Balanced Opportunity Fund from June 1, 2006 to November 30, 2006. It also shows how much a $1,000 investment would be worth at the close of the period assuming actual returns and expenses.
| Expenses and Value of a $1,000 Investment | ||||||
| assuming actual returns for the six months ended November 30, 2006 | ||||||
| Expenses paid | Ending value | |||||
| per $1,000 † | (after expenses) | |||||
| Class A | $ | 6.33 | 1,068.90 | |||
| Class B | $10.40 | 1,064.70 | ||||
| Class C | $10.20 | 1,065.10 | ||||
| Class R | $ | 5.19 | 1,070.00 | |||
| Class T | $ | 7.72 | 1,067.40 | |||
| Class J | $ | 5.03 | 1,070.30 | |||
| Class Z | $ | 5.50 | 1,070.00 | |||
† Expenses are equal to the fund’s annualized expense ratio of 1.22% for Class A, 2.01% for Class B, 1.97% for Class C, 1.00% for Class R, 1.49% for Class T, ..97% for Class J and 1.06% for Class Z, multiplied by the average account value over the period, multiplied by 183/365 (to reflect the one-half year period).
| 8 |
COMPARING YOUR FUND’S EXPENSES WITH THOSE OF OTHER FUNDS (Unaudited)
Using the SEC’s method to compare expenses
The Securities and Exchange Commission (SEC) has established guidelines to help investors assess fund expenses. Per these guidelines, the table below shows your fund’s expenses based on a $1,000 investment, assuming a hypothetical 5% annualized return. You can use this information to compare the ongoing expenses (but not transaction expenses or total cost) of investing in the fund with those of other funds.All mutual fund shareholder reports will provide this information to help you make this comparison. Please note that you cannot use this information to estimate your actual ending account balance and expenses paid during the period.
Expenses and Value of a $1,000 Investment assuming a hypothetical 5% annualized return for the six months ended November 30, 2006
| Expenses paid | Ending value | |||||
| per $1,000 † | (after expenses) | |||||
| Class A | $ | 6.17 | 1,018.95 | |||
| Class B | $10.15 | 1,014.99 | ||||
| Class C | $ | 9.95 | 1,015.19 | |||
| Class R | $ | 5.06 | 1,020.05 | |||
| Class T | $ | 7.54 | 1,017.60 | |||
| Class J | $ | 4.91 | 1,020.21 | |||
| Class Z | $ | 5.37 | 1,019.75 | |||
† Expenses are equal to the fund’s annualized expense ratio of 1.22% for Class A, 2.01% for Class B, 1.97% for Class C, 1.00% for Class R, 1.49% for Class T, ..97% for Class J and 1.06% for Class Z, multiplied by the average account value over the period, multiplied by 183/365 (to reflect the one-half year period).
| The Fund 9 |
| STATEMENT OF INVESTMENTS November 30, 2006 |
| Common Stocks—70.0% | Shares | Value ($) | ||||
| Consumer Discretionary—11.7% | ||||||
| Apollo Group, Cl. A | 195,000 a | 7,564,050 | ||||
| Cabela’s | 720,000 a,b | 17,438,400 | ||||
| Career Education | 580,000 a,b | 14,645,000 | ||||
| Corinthian Colleges | 1,725,000 a,b | 22,252,500 | ||||
| Cost Plus | 587,300 a,b | 6,325,221 | ||||
| Home Depot | 260,000 | 9,872,200 | ||||
| Interpublic Group of Cos. | 300,000 a,b | 3,591,000 | ||||
| Kohl’s | 120,000 a | 8,352,000 | ||||
| 90,040,371 | ||||||
| Consumer Staples—4.6% | ||||||
| Coca-Cola | 250,000 b | 11,707,500 | ||||
| Nestle, ADR | 125,000 | 11,035,000 | ||||
| Wal-Mart Stores | 265,000 | 12,216,500 | ||||
| 34,959,000 | ||||||
| Energy—5.0% | ||||||
| Chevron | 265,000 | 19,164,800 | ||||
| Exxon Mobil | 255,000 | 19,586,550 | ||||
| 38,751,350 | ||||||
| Financial—15.1% | ||||||
| American International Group | 285,000 | 20,041,200 | ||||
| Bank of America | 290,000 | 15,616,500 | ||||
| Berkshire Hathaway, Cl. A | 125 a | 13,387,500 | ||||
| Citigroup | 310,000 | 15,372,900 | ||||
| Doral Financial | 1,300,000 | 5,265,000 | ||||
| Fannie Mae | 273,700 | 15,609,111 | ||||
| Freddie Mac | 97,200 | 6,527,952 | ||||
| JPMorgan Chase & Co. | 345,000 | 15,966,600 | ||||
| Marsh & McLennan Cos. | 265,000 | 8,326,300 | ||||
| 116,113,063 | ||||||
| Health Care—14.6% | ||||||
| Bausch & Lomb | 150,000 b | 7,263,000 | ||||
| Cardinal Health | 300,000 | 19,386,000 | ||||
| Johnson & Johnson | 175,000 | 11,534,250 | ||||
| Medtronic | 333,000 | 17,359,290 | ||||
| Merck & Co. | 175,000 | 7,789,250 | ||||
| Pfizer | 900,000 | 24,741,000 |
10
| Common Stocks (continued) | Shares | Value ($) | ||
| Health Care (continued) | ||||
| Wright Medical Group | 50,383 a,b | 1,205,665 | ||
| Wyeth | 187,500 | 9,052,500 | ||
| Zimmer Holdings | 195,000 a | 14,227,200 | ||
| 112,558,155 | ||||
| Industrial—4.3% | ||||
| General Electric | 450,000 | 15,876,000 | ||
| Tyco International | 570,000 | 17,265,300 | ||
| 33,141,300 | ||||
| Information Technology—14.7% | ||||
| BISYS Group | 550,000 a | 6,594,500 | ||
| Dell | 250,000 a | 6,810,000 | ||
| Electronic Data Systems | 565,000 | 15,334,100 | ||
| First Data | 350,000 | 8,837,500 | ||
| Fiserv | 290,000 a | 14,821,900 | ||
| Hewitt Associates, Cl. A | 570,000 a | 14,478,000 | ||
| Microchip Technology | 285,000 | 9,721,350 | ||
| Microsoft | 950,000 | 27,863,500 | ||
| Western Union | 360,000 a | 8,208,000 | ||
| 112,668,850 | ||||
| Total Common Stocks | ||||
| (cost $454,423,255) | 538,232,089 | |||
| Preferred Stocks—2.6% | ||||
| Consumer Discretionary—.5% | ||||
| General Motors, | ||||
| Cum., $1.84 | 220,000 | 4,283,136 | ||
| Financial—1.3% | ||||
| Citigroup Capital VII, | ||||
| Cum., $1.78 | 300,000 | 7,546,890 | ||
| GMAC, | ||||
| Cum., $1.83 | 100,000 | 2,434,000 | ||
| 9,980,890 | ||||
| Telecommunication Services—.8% | ||||
| Verizon South, | ||||
| Ser. F, Cum. $1.75 | 235,000 | 5,941,106 | ||
| Total Preferred Stocks | ||||
| (cost $20,764,792) | 20,205,132 | |||
The Fund 11
| STATEMENT OF INVESTMENTS (continued) |
| Coupon | Maturity | Principal | ||||||
| Bonds and Notes—26.7% | Rate (%) | Date | Amount ($) | Value ($) | ||||
| Consumer Discretionary—2.6% | ||||||||
| Ford Motor, | ||||||||
| Notes | 7.25 | 10/1/08 | 500,000 | 503,125 | ||||
| Johnson Controls, | ||||||||
| Sr. Notes | 5.25 | 1/15/11 | 2,000,000 | 1,999,516 | ||||
| Johnson Controls, | ||||||||
| Notes | 6.30 | 2/1/08 | 2,000,000 | 2,009,506 | ||||
| Tribune, | ||||||||
| Unscd. Notes | 4.88 | 8/15/10 | 5,000,000 | 4,823,555 | ||||
| Wal-Mart Stores, | ||||||||
| Sr. Notes | 6.88 | 8/10/09 | 10,000,000 | 10,496,380 | ||||
| 19,832,082 | ||||||||
| Consumer Staples—.6% | ||||||||
| H.J. Heinz, | ||||||||
| Notes | 6.00 | 3/15/08 | 5,000,000 b | 5,021,400 | ||||
| Energy—.9% | ||||||||
| Marathon Oil, | ||||||||
| Notes | 5.38 | 6/1/07 | 5,000,000 | 4,999,455 | ||||
| Varco International, | ||||||||
| Gtd. Notes | 7.50 | 2/15/08 | 2,000,000 | 2,044,218 | ||||
| 7,043,673 | ||||||||
| Financial—9.7% | ||||||||
| Bank of America, | ||||||||
| Sr. Notes | 4.38 | 12/1/10 | 665,000 b | 651,644 | ||||
| Bank of America, | ||||||||
| Sub. Notes | 7.13 | 3/1/09 | 3,200,000 | 3,337,878 | ||||
| Bear Stearns Cos., | ||||||||
| Sr. Unsub. Notes, Ser. INC1 | 3.50 | 2/15/09 | 1,182,000 | 1,133,326 | ||||
| Caterpillar Financial Services, | ||||||||
| Notes, Ser. F | 3.70 | 8/15/08 | 5,000,000 | 4,886,075 | ||||
| Citicorp, | ||||||||
| Sub. Notes, Ser. F | 6.38 | 11/15/08 | 5,000,000 | 5,119,730 | ||||
| Ford Motor Credit, | ||||||||
| Notes | 5.59 | 3/13/07 | 55,000 c | 54,678 | ||||
| Ford Motor Credit, | ||||||||
| Notes | 6.19 | 9/28/07 | 160,000 c | 159,452 | ||||
| General Electric Capital, | ||||||||
| Notes, Ser. A | 6.13 | 2/22/11 | 10,000,000 b | 10,441,010 | ||||
| GMAC, | ||||||||
| Notes | 6.13 | 2/1/07 | 74,000 b | 74,034 | ||||
12
| Coupon | Maturity | Principal | ||||||
| Bonds and Notes (continued) | Rate (%) | Date | Amount ($) | Value ($) | ||||
| Financial (continued) | ||||||||
| GMAC, | ||||||||
| Bonds | 6.15 | 4/5/07 | 2,000,000 b | 2,000,404 | ||||
| GMAC, | ||||||||
| Notes | 6.75 | 12/1/14 | 203,000 b | 208,480 | ||||
| GMAC, | ||||||||
| Notes, Ser. SMN | 7.20 | 12/15/06 | 2,000,000 | 2,001,106 | ||||
| Goldman Sachs Group, | ||||||||
| Notes | 7.35 | 10/1/09 | 10,000,000 | 10,626,030 | ||||
| HSBC Finance, | ||||||||
| Sr. Unscd. Notes, Ser. NOtz | 5.15 | 9/15/08 | 5,000,000 | 5,002,665 | ||||
| International Lease Finance, | ||||||||
| Notes, Ser. O | 4.55 | 10/15/09 | 4,000,000 | 3,937,192 | ||||
| International Lease Finance, | ||||||||
| Unsub. Notes | 4.75 | 7/1/09 | 10,015,000 b | 9,950,554 | ||||
| JPM Capital Trust I, | ||||||||
| Gtd. Cap. Secs. | 7.54 | 1/15/27 | 1,500,000 | 1,555,767 | ||||
| Marsh & McLennan Cos., | ||||||||
| Sr. Notes | 7.13 | 6/15/09 | 5,000,000 | 5,203,235 | ||||
| Textron Financial, | ||||||||
| Notes | 5.50 | 9/16/09 | 2,000,000 | 2,008,198 | ||||
| UBS/Stamford, CT., | ||||||||
| Sr. Unsub. Notes | 5.40 | 11/28/07 | 5,000,000 | 4,994,910 | ||||
| Wells Fargo Bank N.A., | ||||||||
| Sub. Notes | 7.55 | 6/21/10 | 1,000,000 | 1,082,292 | ||||
| 74,428,660 | ||||||||
| Health Care—1.0% | ||||||||
| Pharmacia, | ||||||||
| Notes | 5.88 | 12/1/08 | 7,500,000 | 7,615,035 | ||||
| Industrial—2.0% | ||||||||
| Cardinal Health, | ||||||||
| Notes | 6.25 | 7/15/08 | 4,000,000 | 4,057,032 | ||||
| Cardinal Health, | ||||||||
| Notes | 6.75 | 2/15/11 | 10,925,000 | 11,552,619 | ||||
| U.S. Air, | ||||||||
| Enhanced Equip. Notes, Ser. CL C | 8.93 | 10/15/09 | 114,798 d,e | 11 | ||||
| 15,609,662 | ||||||||
| Information Technology—.8% | ||||||||
| First Data, | ||||||||
| Notes | 3.90 | 10/1/09 | 5,000,000 | 4,867,525 |
The Fund 13
| STATEMENT OF INVESTMENTS (continued) |
| Coupon | Maturity | Principal | ||||||
| Bonds and Notes (continued) | Rate (%) | Date | Amount ($) | Value ($) | ||||
| Information Technology (continued) | ||||||||
| Oracle, | ||||||||
| Sr. Notes | 6.91 | 2/15/07 | 945,000 | 947,352 | ||||
| 5,814,877 | ||||||||
| Materials—.2% | ||||||||
| Chevron Phillips Chemical, | ||||||||
| Notes | 5.38 | 6/15/07 | 1,500,000 | 1,498,889 | ||||
| Telecommunication Services—2.4% | ||||||||
| AT & T Wireless Services, | ||||||||
| Sr. Notes | 7.88 | 3/1/11 | 8,000,000 | 8,821,032 | ||||
| GTE North, | ||||||||
| Debs., Ser. D | 6.90 | 11/1/08 | 7,000,000 | 7,199,234 | ||||
| GTE Northwest, | ||||||||
| Debs., Ser. C | 6.30 | 6/1/10 | 1,055,000 | 1,083,944 | ||||
| Pacific Bell, | ||||||||
| Notes | 6.13 | 2/15/08 | 1,000,000 b | 1,009,379 | ||||
| 18,113,589 | ||||||||
| U.S. Government Agencies—5.2% | ||||||||
| Federal Home Loan Banks, | ||||||||
| Bonds | 4.50 | 7/12/10 | 10,300,000 c | 10,234,729 | ||||
| Federal Home Loan Banks, | ||||||||
| Bonds | 5.25 | 9/29/14 | 10,000,000 c | 9,933,780 | ||||
| Federal Home Loan Mortgage Corp., | ||||||||
| Notes | 3.75 | 4/15/07 | 6,000,000 | 5,968,674 | ||||
| Federal Home Loan Mortgage Corp., | ||||||||
| Notes | 4.75 | 12/8/10 | 5,000,000 | 5,004,400 | ||||
| Federal National Mortgage | ||||||||
| Association, Notes, Ser. 1 | 5.00 | 7/27/15 | 8,675,000 c | 8,590,696 | ||||
| 39,732,279 | ||||||||
| U.S. Government Agencies/ | ||||||||
| Mortgage-Backed—.0% | ||||||||
| Federal Home Loan Mortgage Corp.; | ||||||||
| 5.50%, 9/1/34 | 27,028 | 26,989 | ||||||
| Federal National Mortgage Association: | ||||||||
| 5.50%, 9/1/34 | 108,450 | 108,269 | ||||||
| 6.00%, 5/1/33 | 105,691 | 107,104 | ||||||
| 8.00%, 3/1/30 | 1,457 | 1,540 | ||||||
| 243,902 | ||||||||
| U.S. Government Securities—1.1% | ||||||||
| U.S. Treasury Notes | 4.63 | 2/29/08 | 4,000,000 b | 3,993,908 | ||||
14
| Coupon | Maturity | Principal | ||||||
| Bonds and Notes (continued) | Rate (%) | Date | Amount ($) | Value ($) | ||||
| U.S. Government Securities (continued) | ||||||||
| U.S. Treasury Notes | 6.13 | 8/15/07 | 4,500,000 b | 4,536,387 | ||||
| 8,530,295 | ||||||||
| Utilities—.2% | ||||||||
| Wisconsin Power & Light, | ||||||||
| Notes | 7.00 | 6/15/07 | 1,500,000 | 1,513,175 | ||||
| Total Bonds and Notes | ||||||||
| (cost $206,379,332) | 204,997,518 | |||||||
| Total Unaffiliated | ||||||||
| (cost $681,567,379) | 763,434,739 | |||||||
| Investment of Cash Collateral | ||||||||
| for Securities Loaned—6.8% | Shares | Value ($) | ||||||
| Registered Investment Company; | ||||||||
| Dreyfus Institutional Cash | ||||||||
| Advantage Plus Fund | ||||||||
| (cost $51,967,530) | 51,967,530 f | 51,967,530 | ||||||
| Total Investments (cost $733,534,909) | 106.1% | 815,402,269 | ||||||
| Liabilities, Less Cash and Receivables | (6.1%) | (46,855,646) | ||||||
| Net Assets | 100.0% | 768,546,623 | ||||||
| ADR—American Depository Receipts |
| a Non-income producing security. |
| b All or a portion of these securities are on loan. At November 30, 2006, the total market value of the fund’s securities |
| on loan is $49,836,695 and the total market value of the collateral held by the fund is $51,967,530. |
| c Variable rate security—interest rate subject to periodic change. |
| d Non-income producing—security in default. |
| e The value of this security has been determined in good faith under the direction of the Board of Trustees. |
| f Investment in affiliated money market mutual fund. |
| Portfolio Summary | (Unaudited) † | |||||
| Value (%) | Value (%) | |||||
| Corporate Bonds | 20.4 | U.S. Government & Agencies | 6.3 | |||
| Financial | 16.4 | Energy | 5.0 | |||
| Information Technology | 14.7 | Consumer Staples | 4.6 | |||
| Health Care | 14.6 | Industrial | 4.3 | |||
| Consumer Discretionary | 12.2 | Telecommunication Services | .8 | |||
| Money Market Investment | 6.8 | 106.1 | ||||
| † Based on net assets. |
| See notes to financial statements. |
The Fund 15
STATEMENT OF ASSETS AND LIABILITIES
November 30, 2006
| Cost | Value | |||
| Assets ($): | ||||
| Investments in securities—See Statement of | ||||
| Investments (including securities on loan, | ||||
| valued at $49,836,695)—Note 1(b): | ||||
| Unaffiliated issuers | 681,567,379 | 763,434,739 | ||
| Affiliated issuers | 51,967,530 | 51,967,530 | ||
| Dividends and interest receivable | 4,423,647 | |||
| Receivable for investment securities sold | 2,693,513 | |||
| Receivable for shares of Beneficial Interest subscribed | 119,450 | |||
| Prepaid expenses | 61,814 | |||
| 822,700,693 | ||||
| Liabilities ($): | ||||
| Due to The Dreyfus Corporation and affiliates—Note 3(c) | 851,553 | |||
| Cash overdraft due to Custodian | 224,663 | |||
| Liability for securities on loan—Note 1(b) | 51,967,530 | |||
| Payable for shares of Beneficial Interest redeemed | 787,277 | |||
| Interest payable—Note 2 | 40 | |||
| Accrued expenses | 323,007 | |||
| 54,154,070 | ||||
| Net Assets ($) | 768,546,623 | |||
| Composition of Net Assets ($): | ||||
| Paid-in capital | 688,945,847 | |||
| Accumulated undistributed investment income—net | 9,131,937 | |||
| Accumulated net realized gain (loss) on investments | (11,398,521) | |||
| Accumulated net unrealized appreciation | ||||
| (depreciation) on investments | 81,867,360 | |||
| Net Assets ($) | 768,546,623 | |||
| 16 |
| Net Asset Value Per Share | ||
| Class A | ||
| Net Assets ($) | 215,342,003 | |
| Shares Outstanding | 10,564,808 | |
| Net Asset Value Per Share ($) | 20.38 | |
| Class B | ||
| Net Assets ($) | 169,512,736 | |
| Shares Outstanding | 8,414,974 | |
| Net Asset Value Per Share ($) | 20.14 | |
| Class C | ||
| Net Assets ($) | 119,851,459 | |
| Shares Outstanding | 5,935,748 | |
| Net Asset Value Per Share ($) | 20.19 | |
| Class R | ||
| Net Assets ($) | 741,115 | |
| Shares Outstanding | 36,339 | |
| Net Asset Value Per Share ($) | 20.39 | |
| Class T | ||
| Net Assets ($) | 2,357,083 | |
| Shares Outstanding | 115,995 | |
| Net Asset Value Per Share ($) | 20.32 | |
| Class J | ||
| Net Assets ($) | 174,819,662 | |
| Shares Outstanding | 8,541,264 | |
| Net Asset Value Per Share ($) | 20.47 | |
| Class Z | ||
| Net Assets ($) | 85,922,565 | |
| Shares Outstanding | 4,214,083 | |
| Net Asset Value Per Share ($) | 20.39 | |
| See notes to financial statements. |
The Fund 17
| STATEMENT OF OPERATIONS Year Ended November 30, 2006 |
| Investment Income ($): | ||
| Income: | ||
| Dividends (net of $73,960 foreign taxes withheld at source): | ||
| Unaffiliated issuers | 10,158,268 | |
| Affiliated issuers | 171,871 | |
| Interest | 10,972,127 | |
| Income on securities lending | 826,537 | |
| Total Income | 22,128,803 | |
| Expenses: | ||
| Management fee—Note 3(a) | 6,682,561 | |
| Shareholder servicing costs—Note 3(c) | 2,454,620 | |
| Distribution fees—Note 3(b) | 2,363,473 | |
| Prospectus and shareholders’ reports | 128,694 | |
| Registration fees | 112,695 | |
| Professional fees | 110,513 | |
| Custodian fees—Note 3(c) | 64,474 | |
| Trustees’ fees and expenses—Note 3(d) | 18,790 | |
| Interest expense—Note 2 | 13,044 | |
| Loan commitment fees—Note 2 | 6,200 | |
| Miscellaneous | 48,825 | |
| Total Expenses | 12,003,889 | |
| Less—reduction in expenses due to | ||
| undertaking—Note 3(a) | (71,371) | |
| Net Expenses | 11,932,518 | |
| Investment Income—Net | 10,196,285 | |
| Realized and Unrealized Gain (Loss) on Investments—Note 4 ($): | ||
| Net realized gain (loss) on investments | 2,583,451 | |
| Net change in unrealized appreciation (depreciation) on investments | 55,131,456 | |
| Net Realized and Unrealized Gain (Loss) on Investments | 57,714,907 | |
| Net Increase in Net Assets Resulting from Operations | 67,911,192 | |
| See notes to financial statements. |
| 18 |
STATEMENT OF CHANGES IN NET ASSETS
| Year Ended November 30, | ||||
| 2006 | 2005 a | |||
| Operations ($): | ||||
| Investment income—net | 10,196,285 | 11,446,080 | ||
| Net realized gain (loss) on investments | 2,583,451 | 17,777,196 | ||
| Net change in unrealized appreciation | ||||
| (depreciation) on investments | 55,131,456 | (27,035,893) | ||
| Net Increase (Decrease) in Net Assets | ||||
| Resulting from Operations | 67,911,192 | 2,187,383 | ||
| Dividends to Shareholders from ($): | ||||
| Investment income—net: | ||||
| Class A shares | (4,136,174) | (2,229,931) | ||
| Class B shares | (1,528,756) | (876,835) | ||
| Class C shares | (1,266,774) | (741,637) | ||
| Class R shares | (13,217) | (6,234) | ||
| Class T shares | (35,190) | (22,966) | ||
| Class J shares | (3,380,607) | (2,611,167) | ||
| Class Z shares | (1,649,529) | (1,311,701) | ||
| Net realized gain on investments: | ||||
| Class A shares | (2,190,107) | (1,382,746) | ||
| Class B shares | (1,522,455) | (876,085) | ||
| Class C shares | (1,267,277) | (781,129) | ||
| Class R shares | (6,187) | (3,423) | ||
| Class T shares | (23,345) | (16,814) | ||
| Class J shares | (1,586,403) | (1,468,545) | ||
| Class Z shares | (800,174) | (712,974) | ||
| Total Dividends | (19,406,195) | (13,042,187) | ||
| Beneficial Interest Transactions ($): | ||||
| Net proceeds from shares sold: | ||||
| Class A shares | 43,958,717 | 147,734,140 | ||
| Class B shares | 10,751,833 | 77,739,605 | ||
| Class C shares | 10,594,030 | 69,755,064 | ||
| Class R shares | 221,868 | 691,063 | ||
| Class T shares | 56,819 | 1,012,225 | ||
| Class J shares | 12,660,887 | 23,049,984 | ||
| Class Z shares | 3,995,680 | 5,709,639 | ||
| Net assets received in connection with | ||||
| reorganization—Note 1: | ||||
| Class Z shares | — | 120,745,007 | ||
The Fund 19
| STATEMENT OF CHANGES IN NET ASSETS (continued) |
| Year Ended November 30, | ||||
| 2006 | 2005 a | |||
| Beneficial Interest Transactions ($) (continued): | ||||
| Dividends reinvested: | ||||
| Class A shares | 5,763,355 | 3,339,248 | ||
| Class B shares | 2,753,858 | 1,559,230 | ||
| Class C shares | 2,089,763 | 1,214,793 | ||
| Class R shares | 15,134 | 5,248 | ||
| Class T shares | 55,570 | 38,141 | ||
| Class J shares | 4,840,365 | 3,586,646 | ||
| Class Z shares | 2,403,351 | 1,984,199 | ||
| Cost of shares redeemed: | ||||
| Class A shares | (123,049,329) | (88,723,713) | ||
| Class B shares | (40,782,727) | (25,583,996) | ||
| Class C shares | (58,515,156) | (32,639,622) | ||
| Class R shares | (294,625) | (351,960) | ||
| Class T shares | (822,352) | (610,617) | ||
| Class J shares | (58,606,580) | (65,232,098) | ||
| Class Z shares | (26,099,802) | (25,495,578) | ||
| Increase (Decrease) in Net Assets | ||||
| from Beneficial Interest Transactions | (208,009,341) | 219,526,648 | ||
| Total Increase (Decrease) in Net Assets | (159,504,344) | 208,671,844 | ||
| Net Assets ($): | ||||
| Beginning of Period | 928,050,967 | 719,379,123 | ||
| End of Period | 768,546,623 | 928,050,967 | ||
| Undistributed investment income—net | 9,131,937 | 10,744,434 | ||
| 20 |
| Year Ended November 30, | ||||
| 2006 | 2005 a | |||
| Capital Share Transactions: | ||||
| Class A b | ||||
| Shares sold | 2,277,810 | 7,679,008 | ||
| Shares issued for dividends reinvested | 306,496 | 170,630 | ||
| Shares redeemed | (6,371,316) | (4,634,047) | ||
| Net Increase (Decrease) in Shares Outstanding | (3,787,010) | 3,215,591 | ||
| Class B b | ||||
| Shares sold | 563,748 | 4,073,635 | ||
| Shares issued for dividends reinvested | 146,798 | 80,002 | ||
| Shares redeemed | (2,133,912) | (1,345,637) | ||
| Net Increase (Decrease) in Shares Outstanding | (1,423,366) | 2,808,000 | ||
| Class C | ||||
| Shares sold | 553,874 | 3,646,655 | ||
| Shares issued for dividends reinvested | 111,355 | 62,233 | ||
| Shares redeemed | (3,054,759) | (1,717,021) | ||
| Net Increase (Decrease) in Shares Outstanding | (2,389,530) | 1,991,867 | ||
| Class R | ||||
| Shares sold | 11,521 | 35,922 | ||
| Shares issued for dividends reinvested | 805 | 268 | ||
| Shares redeemed | (15,373) | (18,362) | ||
| Net Increase (Decrease) in Shares Outstanding | (3,047) | 17,828 | ||
| Class T | ||||
| Shares sold | 2,945 | 52,386 | ||
| Shares issued for dividends reinvested | 2,954 | 1,950 | ||
| Shares redeemed | (42,584) | (31,847) | ||
| Net Increase (Decrease) in Shares Outstanding | (36,685) | 22,489 | ||
| Class J | ||||
| Shares sold | 654,408 | 1,197,567 | ||
| Shares issued for dividends reinvested | 256,789 | 182,992 | ||
| Shares redeemed | (3,030,569) | (3,391,993) | ||
| Net Increase (Decrease) in Shares Outstanding | (2,119,372) | (2,011,434) | ||
| Class Z | ||||
| Shares sold | 207,035 | 297,734 | ||
| Shares issued in connection with reorganization—Note 1 | — | 6,160,460 | ||
| Shares issued for dividends reinvested | 127,829 | 101,493 | ||
| Shares redeemed | (1,353,306) | (1,327,162) | ||
| Net Increase (Decrease) in Shares Outstanding | (1,018,442) | 5,232,525 | ||
| a | Effective December 18, 2004 (commencement of initial offering) to November 30, 2005, for Class Z shares. | |
| b | During the period ended November 30, 2006, 176,176 Class B shares representing $3,374,981 were | |
| automatically converted to 174,793 Class A shares and during the period ended November 30, 2005, 159,663 | ||
| Class B shares representing $3,039,123 were automatically converted to 158,489 Class A shares. | ||
| See notes to financial statements. | ||
The Fund 21
| FINANCIAL HIGHLIGHTS |
The following tables describe the performance for each share class for the fiscal periods indicated. All information (except portfolio turnover rate) reflects financial results for a single fund share.Total return shows how much your investment in the fund would have increased (or decreased) during each period, assuming you had reinvested all dividends and distributions.These figures have been derived from the fund’s financial statements.
| Year Ended November 30, | ||||||
| Class A Shares | 2006 | 2005 | 2004 a | |||
| Per Share Data ($): | ||||||
| Net asset value, beginning of period | 19.15 | 19.30 | 18.86 | |||
| Investment Operations: | ||||||
| Investment income—net b | .28 | .28 | .28 | |||
| Net realized and unrealized | ||||||
| gain (loss) on investments | 1.40 | (.12) | .16 | |||
| Total from Investment Operations | 1.68 | .16 | .44 | |||
| Distributions: | ||||||
| Dividends from investment income—net | (.29) | (.19) | — | |||
| Dividends from net realized gain on investments | (.16) | (.12) | — | |||
| Total Distributions | (.45) | (.31) | — | |||
| Net asset value, end of period | 20.38 | 19.15 | 19.30 | |||
| Total Return (%) c | 8.96 | .77 | 2.33d | |||
| Ratios/Supplemental Data (%): | ||||||
| Ratio of total expenses to average net assets | 1.21 | 1.21 | 1.03d | |||
| Ratio of net expenses to average net assets | 1.21 | 1.21 | 1.03d | |||
| Ratio of net investment income | ||||||
| to average net assets | 1.44 | 1.43 | 1.52d | |||
| Portfolio Turnover Rate | 33.30 | 39.39 | 32.41 | |||
| Net Assets, end of period ($ X 1,000) | 215,342 | 274,871 | 214,949 | |||
| a | From February 2, 2004 (commencement of operations) to November 30, 2004. | |
| b | Based on average shares outstanding at each month end. | |
| c | Exclusive of sales charge. | |
| d | Not annualized. | |
| See notes to financial statements. | ||
| 22 |
| Year Ended November 30, | ||||||
| Class B Shares | 2006 | 2005 | 2004 a | |||
| Per Share Data ($): | ||||||
| Net asset value, beginning of period | 18.94 | 19.17 | 18.86 | |||
| Investment Operations: | ||||||
| Investment income—net b | .12 | .12 | .15 | |||
| Net realized and unrealized | ||||||
| gain (loss) on investments | 1.40 | (.11) | .16 | |||
| Total from Investment Operations | 1.52 | .01 | .31 | |||
| Distributions: | ||||||
| Dividends from investment income—net | (.16) | (.12) | — | |||
| Dividends from net realized gain on investments | (.16) | (.12) | — | |||
| Total Distributions | (.32) | (.24) | — | |||
| Net asset value, end of period | 20.14 | 18.94 | 19.17 | |||
| Total Return (%) c | 8.11 | (.02) | 1.64d | |||
| Ratios/Supplemental Data (%): | ||||||
| Ratio of total expenses to average net assets | 2.01 | 2.00 | 1.70d | |||
| Ratio of net expenses to average net assets | 2.01 | 2.00 | 1.70d | |||
| Ratio of net investment income | ||||||
| to average net assets | .65 | .64 | .83d | |||
| Portfolio Turnover Rate | 33.30 | 39.39 | 32.41 | |||
| Net Assets, end of period ($ X 1,000) | 169,513 | 186,377 | 134,791 | |||
| a | From February 2, 2004 (commencement of operations) to November 30, 2004. | |
| b | Based on average shares outstanding at each month end. | |
| c | Exclusive of sales charge. | |
| d | Not annualized. | |
| See notes to financial statements. | ||
The Fund 23
| FINANCIAL HIGHLIGHTS (continued) |
| Year Ended November 30, | ||||||
| Class C Shares | 2006 | 2005 | 2004 a | |||
| Per Share Data ($): | ||||||
| Net asset value, beginning of period | 18.98 | 19.19 | 18.86 | |||
| Investment Operations: | ||||||
| Investment income—net b | .13 | .13 | .16 | |||
| Net realized and unrealized | ||||||
| gain (loss) on investments | 1.40 | (.11) | .17 | |||
| Total from Investment Operations | 1.53 | .02 | .33 | |||
| Distributions: | ||||||
| Dividends from investment income—net | (.16) | (.11) | — | |||
| Dividends from net realized gain on investments | (.16) | (.12) | — | |||
| Total Distributions | (.32) | (.23) | — | |||
| Net asset value, end of period | 20.19 | 18.98 | 19.19 | |||
| Total Return (%) c | 8.14 | .06 | 1.75d | |||
| Ratios/Supplemental Data (%): | ||||||
| Ratio of total expenses to average net assets | 1.95 | 1.94 | 1.64d | |||
| Ratio of net expenses to average net assets | 1.95 | 1.94 | 1.64d | |||
| Ratio of net investment income | ||||||
| to average net assets | .70 | .70 | .84d | |||
| Portfolio Turnover Rate | 33.30 | 39.39 | 32.41 | |||
| Net Assets, end of period ($ X 1,000) | 119,851 | 157,982 | 121,545 | |||
| a | From February 2, 2004 (commencement of operations) to November 30, 2004. | |
| b | Based on average shares outstanding at each month end. | |
| c | Exclusive of sales charge. | |
| d | Not annualized. | |
| See notes to financial statements. | ||
| 24 |
| Year Ended November 30, | ||||||
| Class R Shares | 2006 | 2005 | 2004 a | |||
| Per Share Data ($): | ||||||
| Net asset value, beginning of period | 19.17 | 19.31 | 18.86 | |||
| Investment Operations: | ||||||
| Investment income—net b | .31 | .32 | .35 | |||
| Net realized and unrealized | ||||||
| gain (loss) on investments | 1.40 | (.13) | .10 | |||
| Total from Investment Operations | 1.71 | .19 | .45 | |||
| Distributions: | ||||||
| Dividends from investment income—net | (.33) | (.21) | — | |||
| Dividends from net realized gain on investments | (.16) | (.12) | — | |||
| Total Distributions | (.49) | (.33) | — | |||
| Net asset value, end of period | 20.39 | 19.17 | 19.31 | |||
| Total Return (%) | 9.12 | .95 | 2.38c | |||
| Ratios/Supplemental Data (%): | ||||||
| Ratio of total expenses to average net assets | 1.07 | 1.00 | .97c | |||
| Ratio of net expenses to average net assets | 1.07 | 1.00 | .97c | |||
| Ratio of net investment income | ||||||
| to average net assets | 1.59 | 1.64 | 2.11c | |||
| Portfolio Turnover Rate | 33.30 | 39.39 | 32.41 | |||
| Net Assets, end of period ($ X 1,000) | 741 | 755 | 416 | |||
| a | From February 2, 2004 (commencement of operations) to November 30, 2004. | |
| b | Based on average shares outstanding at each month end. | |
| c | Not annualized. | |
| See notes to financial statements. | ||
The Fund 25
| FINANCIAL HIGHLIGHTS (continued) |
| Year Ended November 30, | ||||||
| Class T Shares | 2006 | 2005 | 2004 a | |||
| Per Share Data ($): | ||||||
| Net asset value, beginning of period | 19.09 | 19.26 | 18.86 | |||
| Investment Operations: | ||||||
| Investment income—net b | .22 | .22 | .23 | |||
| Net realized and unrealized | ||||||
| gain (loss) on investments | 1.40 | (.11) | .17 | |||
| Total from Investment Operations | 1.62 | .11 | .40 | |||
| Distributions: | ||||||
| Dividends from investment income—net | (.23) | (.16) | — | |||
| Dividends from net realized gain on investments | (.16) | (.12) | — | |||
| Total Distributions | (.39) | (.28) | — | |||
| Net asset value, end of period | 20.32 | 19.09 | 19.26 | |||
| Total Return (%) c | 8.65 | .52 | 2.12d | |||
| Ratios/Supplemental Data (%): | ||||||
| Ratio of total expenses to average net assets | 1.51 | 1.49 | 1.26d | |||
| Ratio of net expenses to average net assets | 1.51 | 1.49 | 1.26d | |||
| Ratio of net investment income | ||||||
| to average net assets | 1.14 | 1.15 | 1.19d | |||
| Portfolio Turnover Rate | 33.30 | 39.39 | 32.41 | |||
| Net Assets, end of period ($ X 1,000) | 2,357 | 2,915 | 2,508 | |||
| a | From February 2, 2004 (commencement of operations) to November 30, 2004. | |
| b | Based on average shares outstanding at each month end. | |
| c | Exclusive of sales charge. | |
| d | Not annualized. | |
| See notes to financial statements. | ||
| 26 |
| Year Ended November 30, | ||||||||||
| Class J Shares | 2006 | 2005 | 2004 a | 2003 | 2002 | |||||
| Per Share Data ($): | ||||||||||
| Net asset value, beginning of period | 19.22 | 19.35 | 18.05 | 16.37 | 18.66 | |||||
| Investment Operations: | ||||||||||
| Investment income—net | .33b | .31b | .34b | .25 | .26 | |||||
| Net realized and unrealized | ||||||||||
| gain (loss) on investments | 1.41 | (.11) | 1.21 | 1.69 | (.98) | |||||
| Total from Investment Operations | 1.74 | .20 | 1.55 | 1.94 | (.72) | |||||
| Distributions: | ||||||||||
| Dividends from investment income—net | (.33) | (.21) | (.25) | (.26) | (.26) | |||||
| Dividends from net realized | ||||||||||
| gain on investments | (.16) | (.12) | — | — | (1.31) | |||||
| Total Distributions | (.49) | (.33) | (.25) | (.26) | (1.57) | |||||
| Net asset value, end of period | 20.47 | 19.22 | 19.35 | 18.05 | 16.37 | |||||
| Total Return (%) | 9.25 | .97 | 8.69 | 12.05 | (4.07) | |||||
| Ratios/Supplemental Data (%): | ||||||||||
| Ratio of total expenses | ||||||||||
| to average net assets | .96 | 1.02 | .95 | 1.08 | 1.11 | |||||
| Ratio of net expenses | ||||||||||
| to average net assets | .96 | 1.01 | .95 | 1.07 | 1.10 | |||||
| Ratio of net investment income | ||||||||||
| to average net assets | 1.69 | 1.62 | 1.79 | 1.90 | 1.91 | |||||
| Portfolio Turnover Rate | 33.30 | 39.39 | 32.41 | 41.73 | 79.24 | |||||
| Net Assets, end of period ($ X 1,000) | 174,820 | 204,901 | 245,171 | 216,991 | 138,027 | |||||
a The fund commenced offering six classes of shares on February 2, 2004.The existing shares were redesignated Class J shares. b Based on average shares outstanding at each month end.
See notes to financial statements.
The Fund 27
| FINANCIAL HIGHLIGHTS (continued) |
| Year Ended November 30, | ||||
| Class Z Shares | 2006 | 2005 a | ||
| Per Share Data ($): | ||||
| Net asset value, beginning of period | 19.16 | 19.60 | ||
| Investment Operations: | ||||
| Investment income—net b | .30 | .29 | ||
| Net realized and unrealized | ||||
| gain (loss) on investments | 1.41 | (.40) | ||
| Total from Investment Operations | 1.71 | (.11) | ||
| Distributions: | ||||
| Dividends from investment income—net | (.32) | (.21) | ||
| Dividends from net realized gain on investments | (.16) | (.12) | ||
| Total Distributions | (.48) | (.33) | ||
| Net asset value, end of period | 20.39 | 19.16 | ||
| Total Return (%) | 9.11 | (.59)c | ||
| Ratios/Supplemental Data (%): | ||||
| Ratio of total expenses to average net assets | 1.15 | 1.15c | ||
| Ratio of net expenses to average net assets | 1.07 | 1.02c | ||
| Ratio of net investment income | ||||
| to average net assets | 1.58 | 1.51c | ||
| Portfolio Turnover Rate | 33.30 | 39.39 | ||
| Net Assets, end of period ($ X 1,000) | 85,923 | 100,250 | ||
| a | From December 18, 2004 (commencement of initial offering) to November 30, 2005. | |
| b | Based on average shares outstanding at each month end. | |
| c | Not annualized. | |
| See notes to financial statements. | ||
| 28 |
NOTES TO FINANCIAL STATEMENTS
NOTE 1—Significant Accounting Policies:
Dreyfus Premier Balanced Opportunity Fund (the “fund”) is a separate diversified series of Dreyfus Premier Manager Funds II (the “Company”), which is registered under the Investment Company Act of 1940, as amended (the “Act”), as an open-end management investment company and operates as a series company currently offering three series, including the fund.The fund’s investment objective seeks a high total return through a combination of capital appreciation and current income.The Dreyfus Corporation (the “Manager” or “Dreyfus”) serves as the fund’s investment adviser. Dreyfus is a wholly-owned subsidiary of Mellon Financial Corporation (“Mellon Financial”). Wisconsin Capital Management, Inc. (“Wisconsin Capital”) serves as the fund’s sub-investment adviser.
On December 4, 2006, Mellon Financial and The Bank of New York Company, Inc. announced that they had entered into a definitive agreement to merge. The new company will be called The Bank of New York Mellon Corporation. As part of this transaction, Dreyfus would become a wholly-owned subsidiary of The Bank of New York Mellon Corporation.The transaction is subject to certain regulatory approvals and the approval of The Bank of New York Company, Inc.’s and Mellon Financial’s shareholders, as well as other customary conditions to closing. Subject to such approvals and the satisfaction of the other conditions, Mellon Financial and The Bank of New York Company, Inc. expect the transaction to be completed in the third quarter of 2007.
As of the close of business on December 17, 2004, pursuant to an Agreement and Plan of Reorganization previously approved by the fund’s Board of Trustees, all of the assets, subject to the liabilities, of Dreyfus Balanced Fund, Inc. were transferred to the fund. Shareholders of Dreyfus Balanced Fund, Inc. received Class Z shares of the fund, in an amount equal to the aggregate net asset value of their investment in Dreyfus Balanced Fund, Inc. at the time of the exchange.The net asset value of the fund’s Class Z shares at the close of business on December 17, 2004, after the reorganization, was $19.60 per share, and a total of
The Fund 29
| NOTES TO FINANCIAL STATEMENTS (continued) |
6,160,460 Class Z shares representing net assets of $120,745,007 (including $13,596,353 net unrealized appreciation on investments, were issued to Dreyfus Balanced Fund, Inc. shareholders in the exchange.The exchange was a tax-free event to shareholders.
Dreyfus Service Corporation (the “Distributor”), a wholly-owned subsidiary of Dreyfus, is the Distributor of the fund’s shares.The fund is authorized to issue an unlimited number of $.001 par value shares of Beneficial Interest in each of the following classes of shares: Class A, Class B, Class C, Class R, Class T, Class J and Class Z shares. Class A and Class T shares are subject to a sales charge imposed at the time of purchase. Class B shares are subject to a contingent deferred sales charge (“CDSC”) imposed on Class B share redemptions made within six years of purchase and automatically convert to Class A shares after six years. Class C shares are subject to a CDSC imposed on Class C shares redeemed within one year of purchase. Class R, Class J and Class Z shares are sold at NAV per share. Class R shares are sold only to institutional investors and Class J and Class Z shares are closed to new investors. Other differences between the classes include the services offered to and the expenses borne by each class. Income, expenses (other than expenses attributable to a specific class), and realized and unrealized gains or losses on investments are allocated to each class of shares based on its relative net assets.
Effective March 1, 2006, Class A shares of the fund may be purchased at net asset value (“NAV”) without payment of a sales charge:
- By qualified investors who (i) purchase Class A shares directly through the Distributor, and (ii) have, or whose spouse or minor children have, beneficially owned shares and continuously maintained an open account directly through the Distributor in a Dreyfus-managed fund, including the fund, or a Founders Asset Management LLC
(“Founders”) managed fund since on or before February 28, 2006. Founders is a wholly-owned subsidiary of the Distributor. - With the cash proceeds from an investor’s exercise of employment- related stock options, whether invested in the fund directly or indi- rectly through an exchange from a Dreyfus-managed money market
| 30 |
- fund, provided that the proceeds are processed through an entity that has entered into an agreement with the Distributor specifically relat- ing to processing stock options. Upon establishing the account in the fund or the Dreyfus-managed money market fund, the investor and the investor’s spouse and minor children become eligible to purchase Class A shares of the fund at NAV, whether or not using the proceeds of the employment-related stock options.
- By members of qualified affinity groups who purchase Class A shares directly through the Distributor, provided that the qualified affinity group has entered into an affinity agreement with the Distributor.
Effective March 1, 2006, Class A and Class T shares of the fund may be purchased at NAV without payment of a sales charge:
- For Dreyfus-sponsored IRA “Rollover Accounts” with the distrib- ution proceeds from qualified and non-qualified retirement plans or a Dreyfus-sponsored 403(b)(7) plan, provided that, in the case of a qualified or non-qualified retirement plan, the rollover is processed through an entity that has entered into an agreement with the Distributor specifically relating to processing rollovers. Upon estab- lishing the Dreyfus-sponsored IRA rollover account in the fund, the shareholder becomes eligible to make subsequent purchases of Class A or Class T shares of the fund at NAV in such account.
Effective June 1, 2006, the fund no longer offers Class B shares, except in connection with dividend reinvestment and permitted exchanges of Class B shares.
The Company accounts separately for the assets, liabilities and operations of each series. Expenses directly attributable to each series are charged to that series’ operations; expenses which are applicable to all series are allocated among them on a pro rata basis.
The fund’s financial statements are prepared in accordance with U.S. generally accepted accounting principles, which requires the use of management estimates and assumptions. Actual results could differ from those estimates.
The Fund 31
| NOTES TO FINANCIAL STATEMENTS (continued) |
In the normal course of business, the fund may enter into contracts and agreements that contain a variety of representations and warranties, which provide general indemnifications. The maximum exposure to the fund under these arrangements is unknown, as this would involve future claims that may be made against the fund that have not yet occurred. However, based on experience, the fund expects the risks of loss to be remote.
(a) Portfolio valuation: Investments in securities are valued at the last sales price on the securities exchange or national securities market on which such securities are primarily traded. Securities listed on the National Market System for which market quotations are available are valued at the official closing price or, if there is no official closing price that day, at the last sales price. Securities not listed on an exchange or the national securities market, or securities for which there were no transactions, are valued at the average of the most recent bid and asked prices, except for open short positions, where the asked price is used for valuation purposes. Bid price is used when no asked price is available. Investments in registered investment companies are valued at their NAV.When market quotations or official closing prices are not readily available, or are determined not to reflect accurately fair value, such as when the value of a security has been significantly affected by events after the close of the exchange or market on which the security is principally traded (for example, a foreign exchange or market), but before the fund calculates its NAV, the fund may value these investments at fair value as determined in accordance with the procedures approved by the Board of Trustees. Fair valuing of securities may be determined with the assistance of a pricing service using calculations based on indices of domestic securities and other appropriate indicators, such as prices of relevant ADR’s and futures contracts.
Debt securities (excluding short-term investments other than U.S. Treasury Bills) are valued each business day by an independent pricing service (the “Service”) approved by the Board of Trustees. Investments for which quoted bid prices are readily available and are representative
| 32 |
of the bid side of the market in the judgment of the Service are valued at the mean between the quoted bid prices (as obtained by the Service from dealers in such securities) and asked prices (as calculated by the Service based upon its evaluation of the market for such securities). Other debt securities are valued as determined by the Service, based on methods which include consideration of: yields or prices of securities of comparable quality, coupon, maturity and type; indications as to values from dealers; and general market conditions. Securities for which there are no such valuations are valued at fair value as determined in good faith under the direction of the Board of Trustees. Restricted securities, as well as securities or other assets for which recent market quotations are not readily available, that are not valued by a pricing service approved by the Board of Trustees, or are determined by the fund not to reflect accurately fair value (such as when an event occurs after the close of the exchange on which the security is principally traded and that is determined by the fund to have changed the value of the security), are valued at fair value as determined in good faith under the direction of the Board of Trustees.The factors that may be considered when fair valuing a security include fundamental analytical data, the nature and duration of restrictions on disposition, an evaluation of the forces that influence the market in which the securities are purchased and sold and public trading in similar securities of the issuer or comparable issuers. Short-term investments, excluding U.S.Treasury Bills, are carried at amortized cost, which approximates value.
On September 20, 2006, the Financial Accounting Standards Board (FASB) released Statement of Financial Accounting Standards No. 157 “Fair Value Measurements” (“FAS 157”). FAS 157 establishes an authoritative definition of fair value, sets out a framework for measuring fair value, and requires additional disclosures about fair-value measurements. The application of FAS 157 is required for fiscal years beginning after November 15, 2007 and interim periods within those fiscal years. Management does not believe that the application of this standard will have a material impact on the financial statements of the fund.
The Fund 33
| NOTES TO FINANCIAL STATEMENTS (continued) |
(b) Securities transactions and investment income: Securities transactions are recorded on a trade date basis. Realized gain and loss from securities transactions are recorded on the identified cost basis. Dividend income is recognized on the ex-dividend date and interest income is determined on the basis of coupon interest accrued, adjusted for accretion of discount and amortization of premium on debt securities.
The fund has an arrangement with the custodian bank, Mellon Bank, N.A., whereby the fund receives earnings credits from the custodian when positive cash balances are maintained, which are used to offset custody fees. For financial reporting purposes, the fund includes net earnings credits, if any, as an expense offset in the Statement of Operations.
Pursuant to a securities lending agreement with Mellon Bank, N.A., an affiliate of Dreyfus, the fund may lend securities to qualified institutions. It is the fund’s policy that at origination all loans are secured by collateral of at least 102% of the value of U.S. securities loaned and 105% of the value of foreign securities loaned. It is the fund’s policy that collateral equivalent to at least 100% of the market value of securities on loan is maintained at all times. Cash collateral is invested in certain money market mutual funds managed by Dreyfus.The fund is entitled to receive all income on securities loaned, in addition to income earned as a result of the lending transaction. Although each security loaned is fully collateralized, the fund bears the risk of delay in recovery of, or loss of rights in, the securities loaned should a borrower fail to return the securities in a timely manner. During the period ended November 30, 2006, pursuant to the securities lending agreement, Mellon Bank, N.A. earned revenues of $354,230 from the fund.
(c) Affiliated issuers: Investments in other investment companies advised by Dreyfus are defined as “affiliated” in the Act.
(d) Dividends to shareholders: Dividends are recorded on the ex-dividend date. Dividends from investment income-net and dividends from net realized capital gain, if any, are normally declared and paid annually, but the fund may make distributions on a more frequent basis to comply with the distribution requirements of the Internal Revenue Code of 1986, as amended (the “Code”).To the extent that net real-
| 34 |
ized capital gain can be offset by capital loss carryovers, it is the policy of the fund not to distribute such gain. Income and capital gain distributions are determined in accordance with income tax regulations, which may differ from U.S. generally accepted accounting principles.
(e) Federal income taxes: It is the policy of the fund to continue to qualify as a regulated investment company, if such qualification is in the best interests of its shareholders, by complying with the applicable provisions of the Code, and to make distributions of taxable income sufficient to relieve it from substantially all federal income and excise taxes. Accordingly, no provision for income tax is required.
In July 2006, the Financial Accounting Standards Board issued Interpretation No. 48,“Accounting for Uncertainty in Income Taxes -an Interpretation of FASB Statement No. 109” (the “Interpretation”). The Interpretation establishes for all entities, including pass-through entities such as the Fund, a minimum threshold for financial statement recognition of the benefit of positions taken in filing tax returns (including whether an entity is taxable in a particular jurisdiction), and requires certain expanded tax disclosures. Adoption of FIN 48 is required for fiscal years beginning after December 15, 2006 and is to be applied to all open tax years as of the effective date. Management does not believe that the application of this standard will have a material impact on the financial statements of the fund.
At November 30, 2006, the components of accumulated earnings on a tax basis were as follows: undistributed ordinary income $9,196,268, accumulated capital losses $8,266,602 and unrealized appreciation $78,671,110.
The fund has an accumulated capital loss carryover of $8,266,602, which can be utilized in subsequent years subject to an annual limitation due to the fund’s merger with Dreyfus Balanced Fund, Inc. If not applied, $2,899,433 of the carryover expires in fiscal 2010 and $5,367,169 expires in fiscal 2011.
The tax character of distributions paid to shareholders during the fiscal periods ended November 30, 2006 and November 30, 2005, were as
The Fund 35
| NOTES TO FINANCIAL STATEMENTS (continued) |
follows: ordinary income $12,015,614 and $7,800,471 and long-term capital gains $7,390,581 and $5,241,716, respectively.
During the period ended November 30, 2006, as a result of permanent book to tax differences, primarily due to the tax treatment for amortization adjustments on treasury inflation protected securities, reclass of dividends and paydown gains and losses on mortgage backed securities, the fund increased accumulated undistributed investment income-net by $201,465 and decreased accumulated net realized gain (loss) on investments by the same amount. Net assets were not affected by this reclassification.
| NOTE 2—Bank Line of Credit: |
The fund participates with other Dreyfus-managed funds in a $350 million redemption credit facility (the “Facility”) to be utilized for temporary or emergency purposes, including the financing of redemptions. In connection therewith, the fund has agreed to pay commitment fees on its pro rata portion of the Facility. Interest is charged to the fund based on prevailing market rates in effect at the time of borrowing.
The average daily amount of borrowings outstanding under the Facility during the period ended November 30, 2006 was approximately $252,200, with a related weighted average annualized interest rate of 5.17% .
NOTE 3—Management Fee, Sub-Investment Advisory Fee and Other Transactions With Affiliates:
(a) Pursuant to a Management Agreement (“Agreement”) with Dreyfus, the management fee is computed at the annual rate of .80% of the value of the fund’s average daily net assets and is payable monthly. Dreyfus has contractually agreed, from December 1, 2005 through March 31, 2007, to waive receipt of its fees and/or assume the expenses of the fund,so that annual fund operating expenses for Class J, exclusive of taxes, interest, brokerage commissions,commitment fees and extraordinary expenses,do not exceed 1.11% . Dreyfus has contractually agreed from December 1,
| 36 |
2005 through March 31, 2007, to waive receipt of its fees and/or assume the expenses of the fund, so that annual fund operating expenses for Class Z, exclusive of expenses as described above, do not exceed 1.08% . The reduction in expenses for Class Z shares, pursuant to the undertaking, amounted to $71,371 during the period ended November 30, 2006.
Pursuant to a Sub-Investment Advisory Agreement between Dreyfus and Wisconsin Capital, Dreyfus has agreed to pay Wisconsin Capital a monthly fee in the amount of 100% of the management fee paid by the fund to Dreyfus for such month, less certain fees waived or expenses paid or reimbursed by Dreyfus, on the fund’s assets attributable to accounts of shareholders who have an adviser-client relationship with Wisconsin Capital, plus, with respect to all other assets of the fund, an annual fee of .30% of the value of the fund’s average daily net assets up to $300 million and .25% of the value of the fund’s average daily net assets in excess of $300 million, payable monthly.
During the period ended November 30, 2006, the fund was advised that the Distributor retained $116,166 and $312 from commissions earned on sales of the fund’s Class A and Class T shares, respectively, and $651,036 and $44,249 from CDSC on redemptions of the fund’s Class B and Class C shares, respectively.
(b) Under the Distribution Plan (the “Plan”) adopted pursuant to Rule 12b-1 under the Act, Class B, Class C and Class T shares pay the Distributor for distributing their shares at an annual rate of .75% of the value of their average daily net assets of Class B and Class C shares and .25% of the value of the average daily net assets of Class T shares. During the period ended November 30, 2006, Class B, Class C and Class T shares were charged $1,326,440, $1,030,443 and $6,590, respectively, pursuant to the Plan.
(c) Under the Shareholder Services Plan, Class A, Class B, Class C and Class T shares pay the Distributor at an annual rate of .25% of the value of their average daily net assets for the provision of certain services.The services provided may include personal services relating to shareholder
The Fund 37
| NOTES TO FINANCIAL STATEMENTS (continued) |
accounts, such as answering shareholder inquiries regarding the fund and providing reports and other information, and services related to the maintenance of shareholder accounts.The Distributor may make payments to Service Agents (a securities dealer, financial institution or other industry professional) in respect of these services.The Distributor determines the amounts to be paid to Service Agents. During the period ended November 30, 2006, Class A, Class B, Class C and Class T shares were charged $606,325, $442,147, $343,481 and $6,590, respectively, pursuant to the Shareholder Services Plan.
Under the Shareholder Services Plan, Class Z shares reimburse the Distributor an amount not to exceed an annual rate of .25% of the value of Class Z shares’ average daily net assets for certain allocated expenses of providing personal services and/or maintaining shareholder accounts.The services provided may include personal services relating to shareholder accounts, such as answering shareholder inquiries regarding Class Z shares and providing reports and other information, and services related to the maintenance of shareholder accounts. During the period ended November 30, 2006, Class Z shares were charged $83,326, pursuant to the Shareholder Services Plan.
The fund compensates Dreyfus Transfer, Inc., a wholly-owned subsidiary of Dreyfus, under a transfer agency agreement for providing personnel and facilities to perform transfer agency services for the fund. During the period ended November 30, 2006, the fund was charged $351,616 pursuant to the transfer agency agreement.
The fund compensates Mellon Bank, N.A., an affiliate of Dreyfus, under a custody agreement for providing custodial services for the fund. During the period ended November 30, 2006, the fund was charged $64,474 pursuant to the custody agreement.
During the period ended November 30, 2006, the fund was charged $4,184 for services performed by the Chief Compliance Officer, which is included in miscellaneous expenses.
| 38 |
The components of Due to The Dreyfus Corporation and affiliates in the Statement of Assets and Liabilities consist of: management fees $506,672, Rule 12b-1 distribution plan fees $179,053, shareholder services plan fees $104,638 custodian fees $10,259, chief compliance officer fees $1,704 and transfer agency per account fees $52,819, which are offset against an expense reimbursement currently in effect in the amount of $3,592.
(d) Each Board member also serves as a Board member of other funds within the Dreyfus complex. Annual retainer fees and attendance fees are allocated to each fund based on net assets.
(e) Pursuant to an exemptive order from the SEC, the fund may invest its available cash balances in affiliated money market mutual funds. Management fees of the underlying money market mutual funds have been waived by Dreyfus.
NOTE 4—Securities Transactions:
The aggregate amount of purchases and sales (including paydowns) of investment securities, excluding short-term securities, during the period ended November 30, 2006, amounted to $277,081,099 and $488,998,919, respectively.
At November 30, 2006, the cost of investments for federal income tax purposes was $736,731,159; accordingly, accumulated net unrealized appreciation on investments was $78,671,110, consisting of $96,826,265 gross unrealized appreciation and $18,155,155 gross unrealized depreciation.
The Fund 39
REPORT OF INDEPENDENT REGISTERED PUBLIC ACCOUNTING FIRM
To the Trustees and Shareholders of
Dreyfus Premier Balanced Opportunity Fund
In our opinion, the accompanying statement of assets and liabilities, including the statement of investments, and the related statements of operations and of changes in net assets and the financial highlights present fairly, in all material respects, the financial position of Dreyfus Premier Balanced Opportunity Fund (the “Fund”) (one of the series constituting Dreyfus Premier Manager Funds II) at November 30, 2006, the results of its operations for the year then ended, the changes in its net assets for each of the two years in the period then ended and the financial highlights for each of the periods presented, in conformity with accounting principles generally accepted in the United States of America. These financial statements and financial highlights (hereafter referred to as “financial statements”) are the responsibility of the Fund’s management. Our responsibility is to express an opinion on these financial statements based on our audits. We conducted our audits of these financial statements in accordance with the standards of the Public Company Accounting Oversight Board (United States).Those standards require that we plan and perform the audit to obtain reasonable assurance about whether the financial statements are free of material misstate-ment.An audit includes examining, on a test basis, evidence supporting the amounts and disclosures in the financial statements, assessing the accounting principles used and significant estimates made by management, and evaluating the overall financial statement presentation. We believe that our audits, which included confirmation of securities at November 30, 2006 by correspondence with the custodian, provide a reasonable basis for our opinion.
| PricewaterhouseCoopers LLP New York, New York January 19, 2007 |
| 40 |
IMPORTANT TAX INFORMATION (Unaudited)
For federal tax purposes, the fund hereby designates $.1520 per share as a long-term capital gain distribution paid on December 30, 2005, and also designates $.0036 per share as a long-term capital gain distribution paid on June 29, 2006.The fund also hereby designates 94.46% of the ordinary dividends paid during the fiscal year ended November 30, 2006 as qualifying for the corporate dividends received deduction. For the fiscal year ended November 30, 2006, certain dividends paid by the fund may be subject to a maximum tax rate of 15%, as provided for by the Jobs and Growth Tax Relief Reconciliation Act of 2003. Of the distributions paid during the fiscal year, $4,839,670 represents the maximum amount that may be considered qualified dividend income. Shareholders will receive notification in January 2007 of the percentage applicable to the preparation of their 2006 income tax returns.
| PROXY RESULTS (Unaudited) |
Dreyfus Premier Manager Funds II held a special meeting of shareholders on June 29, 2006.The proposal considered at the meeting, and the results, are as follows:
| Shares | ||||||
| Votes For | Authority Withheld | |||||
| To elect additional Board Members: | ||||||
| Peggy C. Davis † | 33,714,880 | 433,244 | ||||
| James F. Henry † | 33,767,904 | 380,219 | ||||
| Dr. Martin Peretz † | 33,707,382 | 440,742 |
† Each will serve as an Independent Board member of the fund commencing, subject to the discretion of the Board, on or about January 1, 2007.
In addition Joseph S. DiMartino, David P. Feldman, Ehud Houminer, Gloria Messinger, and Anne Wexler continue as Board members of the fund.
The Fund 41
BOARD MEMBERS INFORMATION (Unaudited)
| Joseph S. DiMartino (63) Chairman of the Board (2003) |
| Principal Occupation During Past 5 Years: • Corporate Director and Trustee |
| Other Board Memberships and Affiliations: |
- The Muscular Dystrophy Association, Director
- Century Business Services, Inc., a provider of outsourcing functions for small and medium size companies, Director
- The Newark Group, a provider of a national market of paper recovery facilities, paperboard mills and paperboard converting plants, Director
- Sunair Services Corporation, engaging in the design, manufacture and sale of high frequency systems for long-range voice and data communications, as well as providing certain outdoor-related services to homes and businesses, Director
No. of Portfolios for which Board Member Serves: 190 ———————
Peggy C. Davis (63) Board Member (2006)
| Principal Occupation During Past 5 Years: |
- Shad Professor of Law, New York University School of Law (1983-present)
- Writer and teacher in the fields of evidence, constitutional theory, family law, social sciences and the law, legal process and professional methodology and training
No. of Portfolios for which Board Member Serves: 71 ———————
David P. Feldman (67) Board Member (2003)
| Principal Occupation During Past 5 Years: • Corporate Director and Trustee |
| Other Board Memberships and Affiliations: |
- BBH Mutual Funds Group (11 funds), Director
- The Jeffrey Company, a private investment company, Director
- QMED, a medical device company, Director
| No. of Portfolios for which Board Member Serves: 57 |
| 42 |
| James F. Henry (75) Board Member (2006) |
| Principal Occupation During Past 5 Years: |
- President,The International Institute for Conflict Prevention and Resolution, a non-profit organization principally engaged in the development of alternatives to business litigation (Retired 2003)
- Advisor to The Elaw Forum, a consultant on managing corporate legal costs
- Advisor to John Jay Homestead (the restored home of the first U.S. Chief Justice)
- Individual Trustee of several trusts
| Other Board Memberships and Affiliations: |
- Director, advisor and mediator involved in several non-profit organizations, primarily engaged in domestic and international dispute resolution, and historic preservation
No. of Portfolios for which Board Member Serves: 48 ———————
Ehud Houminer (66) Board Member (2003)
Principal Occupation During Past 5 Years:
• Executive-in-Residence at the Columbia Business School, Columbia University
| Other Board Memberships and Affiliations: |
- Avnet Inc., an electronics distributor, Director
- International Advisory Board to the MBA Program School of Management, Ben Gurion University, Chairman
- Explore Charter School, Brooklyn, NY, Chairman
No. of Portfolios for which Board Member Serves: 76 ———————
Dr. Paul A. Marks (80) Board Member (2006)
| Principal Occupation During Past 5 Years: |
- President, Emeritus (2000-present) and President and Chief Executive Officer of Memorial Sloan-Kettering Cancer Center (Retired 1999)
| Other Board Memberships and Affiliations: |
- Pfizer, Inc., Director-Emeritus
- Lazard Freres & Company, LLC, Senior Adviser
- Armgo-Start-Up Biotech; Board of Directors
- Nanoviricide, Scientific Advisory Board
- PTC, Scientific Advisory Board
- IKONYSIS, Scientific Advisory Board
| No. of Portfolios for which Board Member Serves: 48 |
The Fund 43
BOARD MEMBERS INFORMATION (Unaudited) (continued)
| Gloria Messinger (77) Board Member (2003) |
| Principal Occupation During Past 5 Years: |
- Arbitrator for American Arbitration Association and National Association of Securities Dealers, Inc.
- Consultant in Intellectual Property
| Other Board Memberships and Affiliations: |
- Theater for a New Audience, Inc., Director
- Brooklyn Philharmonic, Director
No. of Portfolios for which Board Member Serves: 48 ———————
Dr. Martin Peretz (67) Board Member (2006)
| Principal Occupation During Past 5 Years: |
- Editor-in-Chief of The New Republic Magazine
- Lecturer in Social Studies at Harvard University (1965-2002)
- Director of TheStreet.com, a financial information service on the web
| Other Board Memberships and Affiliations: |
- American Council of Trustees and Alumni, Director
- Pershing Square Capital Management, Adviser
- Montefiore Ventures, General Partner
- Harvard Center for Blood Research,Trustee
- Bard College,Trustee
- Board of Overseers of YIVO Institute for Jewish Research, Chairman
No. of Portfolios for which Board Member Serves: 48 ———————
Anne Wexler (76) Board Member (2003)
| Principal Occupation During Past 5 Years: |
- Chairman of the Wexler & Walker Public Policy Associates, consultants specializing in government relations and public affairs
| Other Board Memberships and Affiliations: |
- Wilshire Mutual Funds (5 funds), Director
- Methanex Corporation, a methanol producing company, Director
- Member of the Council of Foreign Relations
- Member of the National Park Foundation
No. of Portfolios for which Board Member Serves: 57 ———————
Once elected all Board Members serve for an indefinite term, but achieve Emeritus status upon reaching age 80.The address of the Board Members and Officers is in c/o The Dreyfus Corporation, 200 Park Avenue, New York, New York 10166. Additional information about the Board Members is available in the fund’s Statement of Additional Information which can be obtained from Dreyfus free of charge by calling this toll free number: 1-800-554-4611.
John M. Fraser, Jr., Emeritus Board Member T. John Szarkowski, Emeritus Board Member
| 44 |
OFFICERS OF THE FUND (Unaudited)
| J. DAVID OFFICER, President since | JOSEPH M. CHIOFFI, Vice President and | |
| December 2006. | Assistant Secretary since August 2005. | |
| Chief Operating Officer,Vice Chairman and a | Associate General Counsel of the Manager, | |
| director of the Manager, and an officer of 90 | and an officer of 91 investment companies | |
| investment companies (comprised of 190 | (comprised of 206 portfolios) managed by the | |
| portfolios) managed by the Manager. He is 58 | Manager. He is 45 years old and has been an | |
| years old and has been an employee of the | employee of the Manager since June 2000. | |
| Manager since April 1, 1998. | JANETTE E. FARRAGHER, Vice President | |
| MARK N. JACOBS, Vice President since | and Assistant Secretary since | |
| September 2003. | August 2005. | |
| Executive Vice President, Secretary and | Associate General Counsel of the Manager, | |
| General Counsel of the Manager, and an | and an officer of 91 investment companies | |
| officer of 91 investment companies (comprised | (comprised of 206 portfolios) managed by the | |
| of 206 portfolios) managed by the Manager. | Manager. She is 43 years old and has been an | |
| He is 60 years old and has been an employee | employee of the Manager since February 1984. | |
| of the Manager since June 1977. | JOHN B. HAMMALIAN, Vice President and | |
| MICHAEL A. ROSENBERG, Vice President | Assistant Secretary since August 2005. | |
| and Secretary since August 2005. | Associate General Counsel of the Manager, | |
| Associate General Counsel of the Manager, | and an officer of 91 investment companies | |
| and an officer of 91 investment companies | (comprised of 206 portfolios) managed by the | |
| (comprised of 206 portfolios) managed by the | Manager. He is 43 years old and has been an | |
| Manager. He is 46 years old and has been an | employee of the Manager since February 1991. | |
| employee of the Manager since October 1991. | ROBERT R. MULLERY, Vice President and | |
| JAMES BITETTO, Vice President and | Assistant Secretary since August 2005. | |
| Assistant Secretary since August 2005. | Associate General Counsel of the Manager, | |
| Associate General Counsel and Assistant | and an officer of 91 investment companies | |
| Secretary of the Manager, and an officer of 91 | (comprised of 206 portfolios) managed by the | |
| investment companies (comprised of 206 | Manager. He is 54 years old and has been an | |
| portfolios) managed by the Manager. He is 40 | employee of the Manager since May 1986. | |
| years old and has been an employee of the | JEFF PRUSNOFSKY, Vice President and | |
| Manager since December 1996. | Assistant Secretary since August 2005. | |
| JONI LACKS CHARATAN, Vice President | Associate General Counsel of the Manager, | |
| and Assistant Secretary since | and an officer of 91 investment companies | |
| August 2005. | (comprised of 206 portfolios) managed by the | |
| Associate General Counsel of the Manager, | Manager. He is 41 years old and has been an | |
| and an officer of 91 investment companies | employee of the Manager since October 1990. | |
| (comprised of 206 portfolios) managed by the | ||
| Manager. She is 51 years old and has been an | ||
| employee of the Manager since October 1988. | ||
The Fund 45
OFFICERS OF THE FUND (Unaudited) (continued)
| JAMES WINDELS, Treasurer since | JOSEPH W. CONNOLLY, Chief Compliance | |
| September 2003. | Officer since October 2004. | |
| Director – Mutual Fund Accounting of the | Chief Compliance Officer of the Manager and | |
| Manager, and an officer of 91 investment | The Dreyfus Family of Funds (91 investment | |
| companies (comprised of 206 portfolios) | companies, comprised of 206 portfolios). From | |
| managed by the Manager. He is 48 years old | November 2001 through March 2004, Mr. | |
| and has been an employee of the Manager | Connolly was first Vice-President, Mutual | |
| since April 1985. | Fund Servicing for Mellon Global Securities | |
| ERIK D. NAVILOFF, Assistant Treasurer | Services. In that capacity, Mr. Connolly was | |
| since August 2005. | responsible for managing Mellon’s Custody, | |
| Fund Accounting and Fund Administration | ||
| Senior Accounting Manager – Taxable Fixed | services to third-party mutual fund clients. He | |
| Income Funds of the Manager, and an officer | is 49 years old and has served in various | |
| of 91 investment companies (comprised of 206 | capacities with the Manager since 1980, | |
| portfolios) managed by the Manager. He is 38 | including manager of the firm’s Fund | |
| years old and has been an employee of the | Accounting Department from 1997 through | |
| Manager since November 1992. | October 2001. | |
| ROBERT ROBOL, Assistant Treasurer | WILLIAM GERMENIS, Anti-Money | |
| since August 2005. | Laundering Compliance Officer since | |
| Senior Accounting Manager – Money Market | September 2003. | |
| and Municipal Bond Funds of the Manager, | Vice President and Anti-Money Laundering | |
| and an officer of 91 investment companies | Compliance Officer of the Distributor, and the | |
| (comprised of 206 portfolios) managed by the | Anti-Money Laundering Compliance Officer | |
| Manager. He is 42 years old and has been an | of 87 investment companies (comprised of 202 | |
| employee of the Manager since October 1988. | portfolios) managed by the Manager. He is 36 | |
| ROBERT SVAGNA, Assistant Treasurer | years old and has been an employee of the | |
| since September 2003. | Distributor since October 1998. | |
| Senior Accounting Manager – Equity Funds of | ||
| the Manager, and an officer of 91 investment | ||
| companies (comprised of 206 portfolios) | ||
| managed by the Manager. He is 39 years old | ||
| and has been an employee of the Manager | ||
| since November 1990. | ||
| GAVIN C. REILLY, Assistant Treasurer | ||
| since December 2005. | ||
| Tax Manager of the Investment Accounting | ||
| and Support Department of the Manager, and | ||
| an officer of 91 investment companies | ||
| (comprised of 206 portfolios) managed by the | ||
| Manager. He is 38 years old and has been an | ||
| employee of the Manager since April 1991. | ||
46
NOTES
For More Information
| Dreyfus Premier | Custodian | |
| Balanced Opportunity Fund | ||
| Mellon Bank, N.A. | ||
| 200 Park Avenue | ||
| One Mellon Bank Center | ||
| New York, NY 10166 | ||
| Pittsburgh, PA 15258 | ||
| Investment Adviser | Transfer Agent & | |
| The Dreyfus Corporation | Dividend Disbursing Agent | |
| 200 Park Avenue | ||
| Dreyfus Transfer, Inc. | ||
| New York, NY 10166 | ||
| 200 Park Avenue | ||
| Sub-Investment Adviser | New York, NY 10166 | |
| Wisconsin Capital Management, LLC | Distributor | |
| 1200 John Q. Hammons Drive | ||
| Dreyfus Service Corporation | ||
| Madison,WI 53717 | ||
| 200 Park Avenue | ||
| New York, NY 10166 | ||
Telephone Call your financial representative or 1-800-554-4611
| The Dreyfus Premier Family of Funds | ||
| 144 Glenn Curtiss Boulevard, Uniondale, NY 11556-0144 |
The fund files its complete schedule of portfolio holdings with the Securities and Exchange Commission (“SEC”) for the first and third quarters of each fiscal year on Form N-Q. The fund’s Forms N-Q are available on the SEC’s website at http://www.sec.gov and may be reviewed and copied at the SEC’s Public Reference Room in Washington, DC. Information on the operation of the Public Reference Room may be obtained by calling 1-202-551-8090.
A description of the policies and procedures that the fund uses to determine how to vote proxies relating to portfolio securities, and information regarding how the fund voted these proxies for the 12-month period ended June 30, 2006, is available at http://www.dreyfus.com and on the SEC’s website at http://www.sec.gov. The description of the policies and procedures is also available without charge, upon request, by calling 1-800-645-6561.
© 2007 Dreyfus Service Corporation

Premier Blue Chip
| Dreyfus Premier Select Fund |
ANNUAL REPORT November 30, 2006
Save time. Save paper. View your next shareholder report online as soon as it’s available. Log into www.dreyfus.com and sign up for Dreyfus eCommunications. It’s simple and only takes a few minutes.
The views expressed in this report reflect those of the portfolio manager only through the end of the period covered and do not necessarily represent the views of Dreyfus or any other person in the Dreyfus organization. Any such views are subject to change at any time based upon market or other conditions and Dreyfus disclaims any responsibility to update such views.These views may not be relied on as investment advice and, because investment decisions for a Dreyfus fund are based on numerous factors, may not be relied on as an indication of trading intent on behalf of any Dreyfus fund.
Not FDIC-Insured • Not Bank-Guaranteed • May Lose Value
| Contents | ||
| THE FUND | ||
| 2 | A Letter from the CEO | |
| 3 | Discussion of Fund Performance | |
| 6 | Fund Performance | |
| 8 | Understanding Your Fund’s Expenses | |
| 8 | Comparing Your Fund’s Expenses | |
| With Those of Other Funds | ||
| 9 | Statement of Investments | |
| 11 | Statement of Assets and Liabilities | |
| 12 | Statement of Operations | |
| 13 | Statement of Changes in Net Assets | |
| 16 | Financial Highlights | |
| 22 | Notes to Financial Statements | |
| 32 | Report of Independent Registered | |
| Public Accounting Firm | ||
| 33 | Important Tax Information | |
| 33 | Proxy Results | |
| 34 | Board Members Information | |
| 37 | Officers of the Fund | |
| FOR MORE INFORMATION | ||
| Back Cover | ||
| Dreyfus Premier Select Fund |
The Fund

A LETTER FROM THE CEO
Dear Shareholder:
We are pleased to present this annual report for Dreyfus Premier Select Fund, covering the 12-month period from December 1, 2005, through November 30, 2006.
Although reports of declining housing prices have raised some economic concerns, we believe that neither a domestic recession nor a major shortfall in global growth is likely. Stimulative monetary policies over the last several years have left a legacy of ample financial liquidity worldwide, which should continue to support global economic growth. Indeed, while U.S. monetary policy has tightened to the borderline between a neutral policy and a restrictive policy, most foreign monetary policies have tightened only from stimulative to neutral, leaving room for further expansion.
The financial markets seem to agree with the view that a gradual economic slowdown is more likely than a recession, as evidenced by recent strength in stock prices. Although smaller-cap stocks generally continued to outperform their large-cap counterparts over the reporting period, we have seen evidence that investors continue to turn toward larger companies with the ability to sustain profitability in a slower economic environment.This pattern is consistent with previous mid-cycle slowdowns. Of course, there is no guarantee how the markets will perform, and we encourage you to discuss the implications of these and other matters with your financial advisor.
For information about how the fund performed during the reporting period, as well as market perspectives, we have provided a Discussion of Fund Performance given by the fund’s portfolio manager.
Thank you for your continued confidence and support.
| Thomas F. Eggers Chief Executive Officer The Dreyfus Corporation December 15, 2006 |
| 2 |

DISCUSSION OF FUND PERFORMANCE
Clint A. Oppermann, Primary Portfolio Manager
Wisconsin Capital Management, LLC, Sub-Investment Adviser
How did Dreyfus Premier Select Fund perform relative to its benchmark?
For the 12-month period ended November 30, 2006, the fund produced total returns of 10.37% for Class A shares, 9.55% for Class B shares, 9.51% for Class C shares, 10.69% for Class J shares, 10.47% for Class R shares and 10.06% for Class T shares.1 In comparison, the fund’s benchmark, the Standard & Poor’s Composite Stock Price Index (“S&P 500 Index”), achieved a total return of 14.22% for the same period.2
After producing generally lackluster returns over the first half of the reporting period, stocks rallied during the second half of the reporting period as short-term interest rates stabilized and prospects improved for an economic “soft landing.” However, the fund’s returns lagged its benchmark, primarily due to its relatively heavy exposure to stocks of very large companies, which generally underperformed smaller stocks until later in the reporting period, as well as the underperformance of a few midcap holdings that have not yet experienced the catalysts for growth that we believe will drive their stock prices higher.
What is the fund’s investment approach?
The fund seeks a high level of long-term capital appreciation by investing the common stocks of approximately 20 to 40 companies that we believe are undervalued and have the potential for growth. When selecting investments, we use a proprietary statistical model to analyze the quality of individual companies, including their market valuations relative to intrinsic business value.The fund typically invests in average or higher-quality companies when their shares are trading at substantial discounts to our estimates of their intrinsic values. We also look for companies with good growth prospects, leading market positions, consistent operating histories, capable managements, competitive or technological advantages, attractive returns on equity and assets, and relatively low debt burdens.
| The Fund 3 |
| DISCUSSION OF FUND PERFORMANCE (continued) |
What other factors influenced the fund’s performance?
Although we choose investments using a “bottom-up” security selection process, the fund was affected by a number of macroeconomic trends. Early in the reporting period, robust economic growth and relatively low inflation generally helped support stock prices, enabling them to weather adverse influences such as rising short-term interest rates and volatile commodity prices. Many U.S. companies posted better-than-expected earnings, and investors continued to favor smaller, lower quality companies that they believed had the potential to achieve high growth rates.As a result, large, well-established companies generally languished, and their valuations continued to fall well below historical averages.
In the spring of 2006, surging oil prices, tight labor markets and hawkish comments from members of the Federal Reserve Board (the “Fed”) caused investors to revise upward their interest-rate expectations, sparking sharp corrections in most sectors of the stock market. However, market conditions improved over the summer and early fall, when energy prices fell sharply, employment gains moderated and the Fed refrained from further interest rate hikes, leaving the overnight federal funds rate unchanged at 5.25% . As the economy slowed, investors began to turn toward higher-quality companies with track records of consistent earnings under a variety of economic conditions.
As valuations of very large companies fell to levels we considered compelling, we began to increase the fund’s holdings of “mega-cap” companies at the upper end of the market’s capitalization range. While these corporate giants began to produce better relative results late in the reporting period, they continued to lag their small- and midcap counterparts through August. In addition, a handful of the fund’s midcap holdings — most notably public education provider Career Education and Puerto Rico-based mortgage bank Doral Financial — did not make as much progress in their turnarounds as we had hoped, causing the fund’s returns to trail the S&P 500 Index for the reporting period overall.
These disappointments were largely offset by better results in other areas. Large pharmaceutical companies, such as Pfizer and Merck &
| 4 |
Co., rebounded from earlier weakness as litigation concerns eased and new product pipelines improved. Sporting goods retailer Cabela’s continued to impress investors with its loyal customers and expansion plans, and the stock now ranks as one of the fund’s larger holdings. Leading advertising conglomerate Interpublic Group appeared poised for a turnaround after its agencies won a number of new accounts.And mortgage agency Fannie Mae rallied when interest rates stabilized.
What is the fund’s current strategy?
Recent economic data have indicated that the rate of U.S. economic growth has continued to moderate with relatively little risk of recession. This suggests to us that the Fed is likely neither to raise nor reduce short-term interest rates over the next several months. Accordingly, we have maintained our focus on large companies in non-cyclical industries, including some of the world’s better known brand names. Many of these holdings remain attractively valued and derive a substantial amount of revenue from overseas markets, which could help protect the fund in the event of an unexpectedly severe economic slowdown. Of course, we are prepared to adjust our strategies as economic and market conditions evolve.
| December 15, 2006 |
| 1 | Total return includes reinvestment of dividends and any capital gains paid, and does not take into | |
| consideration the maximum initial sales charges in the case of Class A and Class T shares, or the | ||
| applicable contingent deferred sales charges imposed on redemptions in the case of Class B and | ||
| Class C shares. Had these charges been reflected, returns would have been lower. Past performance | ||
| is no guarantee of future results. Share price and investment return fluctuate such that upon | ||
| redemption, fund shares may be worth more or less than their original cost. Return figure provided | ||
| for Class J shares reflects the absorption of certain expenses by The Dreyfus Corporation pursuant | ||
| to an agreement in effect through February 25, 2007, at which time it may be extended, | ||
| terminated or modified. Had these expenses not been absorbed, the fund’s Class J shares return | ||
| would have been lower. Class J shares are closed to new investors. Return figures provided for | ||
| Class A, B, C, R, and T shares reflect the absorption of certain fund expenses by The Dreyfus | ||
| Corporation pursuant to an undertaking in effect that may be extended, terminated or modified at | ||
| any time. Had these expenses not been absorbed, the fund’s returns would have been lower. | ||
| 2 | SOURCE: LIPPER INC. — Reflects reinvestment of dividends and, where applicable, capital | |
| gain distributions.The Standard & Poor’s 500 Composite Stock Price Index is a widely accepted, | ||
| unmanaged index of U.S. stock market performance. |
The Fund 5
| FUND PERFORMANCE |
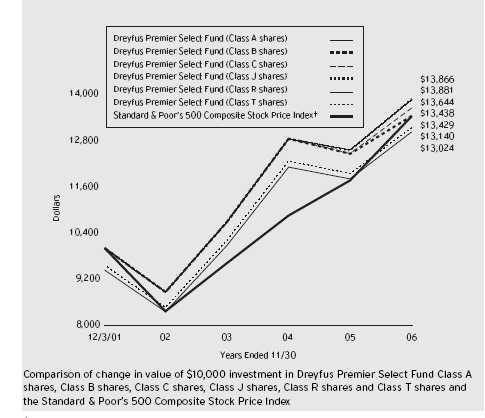
| † Source: Lipper Inc. |
| Past performance is not predictive of future performance. |
| The above graph compares a $10,000 investment made in Class A, Class B, Class C, Class R, Class T and |
| Class J shares of Dreyfus Premier Select Fund on 12/3/01 (inception date) to a $10,000 investment made in the |
| Standard & Poor’s 500 Composite Stock Price Index (the “Index”) on that date. All dividends and capital gain |
| distributions are reinvested. |
| As of the close of business on February 25, 2005, Dreyfus Premier Select Fund (the “fund”) commenced operations after |
| all of the assets of another mutual fund advised by the fund’s sub-investment adviser,Thompson Plumb Select Fund |
| (“predecessor fund”), were transferred to the fund in exchange for Class J shares of the fund in a tax-free reorganization. |
| Class J shares are closed to new investors. On that date, the fund began to offer Class A, B, C, R and T shares, which |
| are subject to sales charges and additional expenses that the Class J shares are not.The performance figures for Class A, |
| Class B, Class C, Class R and Class T shares in the line graph above include the performance of the predecessor fund |
| from December 3, 2001, to February 25, 2005, and are adjusted to reflect the applicable sales loads and expenses. |
| The fund’s performance shown in the line graph takes into account the maximum initial sales charges on Class A and |
| Class T shares, the applicable contingent deferred sales charge on Class B shares and all other applicable fees and |
| expenses on all classes.The S&P 500 Index is a widely accepted, unmanaged index of U.S. stock market performance. |
| The index does not take into account charges, fees and other expenses. Further information relating to fund performance, |
| including expense reimbursements, if applicable, is contained in the Financial Highlights section of the prospectus and |
| elsewhere in this report. |

| Average Annual Total Returns as of 11/30/06 | ||||||
| Inception | From | |||||
| Date | 1 Year | Inception | ||||
| Class A shares | ||||||
| with maximum sales charge (5.75%) | 12/3/01 | 4.00% | 5.44% | |||
| without sales charge | 12/3/01 | 10.37% | 6.70% | |||
| Class B shares | ||||||
| with applicable redemption charge † | 12/3/01 | 5.55% | 6.10% | |||
| without redemption | 12/3/01 | 9.55% | 6.42% | |||
| Class C shares | ||||||
| with applicable redemption charge †† | 12/3/01 | 8.51% | 6.42% | |||
| without redemption | 12/3/01 | 9.51% | 6.42% | |||
| Class J shares | 12/3/01 | 10.69% | 6.79% | |||
| Class R shares | 12/3/01 | 10.47% | 6.77% | |||
| Class T shares | ||||||
| with applicable sales charge (4.5%) | 12/3/01 | 5.08% | 5.63% | |||
| without sales charge | 12/3/01 | 10.06% | 6.60% | |||
Past performance is not predictive of future performance.The fund’s performance shown in the graph and table does not reflect the deduction of taxes that a shareholder would pay on fund distributions or the redemption of fund shares.The performance figures for Class A, Class B, Class C, Class R and Class T shares shown in the table include the performance of the predecessor fund from December 3, 2001, to February 25, 2005, and are adjusted to reflect the applicable sales loads and expenses.
| † The maximum contingent deferred sales charge for Class B shares is 4%. After six years Class B shares convert to Class A shares. The maximum contingent deferred sales charge for Class C shares is 1% for shares redeemed within one year of the date of purchase. |
| The Fund 7 |
U N D E R S TA N D I N G YO U R F U N D ’ S E X P E N S E S ( U n a u d i t e d )
As a mutual fund investor, you pay ongoing expenses, such as management fees and other expenses. Using the information below, you can estimate how these expenses affect your investment and compare them with the expenses of other funds.You also may pay one-time transaction expenses, including sales charges (loads) and redemption fees, which are not shown in this section and would have resulted in higher total expenses. For more information, see your fund’s prospectus or talk to your financial adviser.
Review your fund’s expenses
The table below shows the expenses you would have paid on a $1,000 investment in Dreyfus Premier Select Fund from June 1, 2006 to November 30, 2006. It also shows how much a $1,000 investment would be worth at the close of the period, assuming actual returns and expenses.
Expenses and Value of a $1,000 Investment assuming actual returns for the six months ended November 30, 2006
| Class A | Class B | Class C | Class R | Class T | Class J | |||||||
| Expenses paid | ||||||||||||
| per $1,000 † | $ 7.92 | $ 11.88 | $ 11.88 | $ 6.73 | $ 9.31 | $ 6.63 | ||||||
| Ending value | ||||||||||||
| (after expenses) | $1,064.10 | $1,060.50 | $1,060.40 | $1,065.70 | $1,062.60 | $1,065.70 |
COMPARING YOUR FUND’S EXPENSES WITH THOSE OF OTHER FUNDS (Unaudited)
Using the SEC’s method to compare expenses
The Securities and Exchange Commission (SEC) has established guidelines to help investors assess fund expenses. Per these guidelines, the table below shows your fund’s expenses based on a $1,000 investment, assuming a hypothetical 5% annualized return. You can use this information to compare the ongoing expenses (but not transaction expenses or total cost) of investing in the fund with those of other funds.All mutual fund shareholder reports will provide this information to help you make this comparison. Please note that you cannot use this information to estimate your actual ending account balance and expenses paid during the period.
Expenses and Value of a $1,000 Investment assuming a hypothetical 5% annualized return for the six months ended November 30, 2006
| Class A | Class B | Class C | Class R | Class T | Class J | |||||||
| Expenses paid | ||||||||||||
| per $1,000 † | $ 7.74 | $ 11.61 | $ 11.61 | $ 6.58 | $ 9.10 | $ 6.48 | ||||||
| Ending value | ||||||||||||
| (after expenses) | $1,017.40 | $1,013.54 | $1,013.54 | $1,018.55 | $1,016.04 | $1,018.65 |
† Expenses are equal to the fund’s annualized expense ratio of 1.53% for Class A shares, 2.30% for Class B shares, 2.30% for Class C shares, 1.30% for Class R, 1.80% for Class T and 1.28% for Class J; multiplied by the average account value over the period, multiplied by 183/365(to reflect the one-half year period).
| 8 |
| STATEMENT OF INVESTMENTS November 30, 2006 |
| Common Stocks—99.9% | Shares | Value ($) | ||||
| Consumer Discretionary—18.2% | ||||||
| Cabela’s | 53,000 a,b | 1,283,660 | ||||
| Cost Plus | 156,000 b | 1,680,120 | ||||
| Home Depot | 18,000 | 683,460 | ||||
| Interpublic Group of Cos. | 125,000 a,b | 1,496,250 | ||||
| 5,143,490 | ||||||
| Consumer Services—18.6% | ||||||
| Apollo Group, Cl. A | 34,000 b | 1,318,860 | ||||
| Career Education | 80,000 b | 2,020,000 | ||||
| Corinthian Colleges | 150,000 b | 1,935,000 | ||||
| 5,273,860 | ||||||
| Consumer Staples—3.6% | ||||||
| Coca-Cola | 21,500 | 1,006,845 | ||||
| Financial—21.4% | ||||||
| American International Group | 19,000 | 1,336,080 | ||||
| Berkshire Hathaway, Cl. A | 13 b | 1,392,300 | ||||
| Doral Financial | 135,000 | 546,750 | ||||
| Fannie Mae | 23,000 | 1,311,690 | ||||
| Marsh & McLennan Cos. | 47,000 | 1,476,740 | ||||
| 6,063,560 | ||||||
| Health Care—16.0% | ||||||
| Bausch & Lomb | 19,500 | 944,190 | ||||
| Cardinal Health | 9,500 | 613,890 | ||||
| Johnson & Johnson | 11,000 | 725,010 | ||||
| Pfizer | 60,000 | 1,649,400 | ||||
| Wright Medical Group | 25,000 b | 598,250 | ||||
| 4,530,740 | ||||||
| Industrial—2.1% | ||||||
| Tyco International | 20,000 | 605,800 | ||||
| Information Technology—20.0% | ||||||
| BISYS Group | 100,000 b | 1,199,000 | ||||
| Dell | 30,000 b | 817,200 | ||||
| Electronic Data Systems | 32,000 | 868,480 | ||||
| Hewitt Associates, Cl. A | 43,000 b | 1,092,200 | ||||
| Microsoft | 57,000 | 1,671,810 | ||||
| 5,648,690 | ||||||
| Total Common Stocks | ||||||
| (cost $24,862,517) | 28,272,985 |
The Fund 9
| STATEMENT OF INVESTMENTS (continued) |
| Investment of Cash Collateral | ||||
| for Securities Loaned—10.0% | Shares | Value ($) | ||
| Registered Investment Company; | ||||
| Dreyfus Institutional Cash | ||||
| Advantage Plus Fund | ||||
| (cost $2,828,800) | 2,828,800 c | 2,828,800 | ||
| Total Investments (cost $27,691,317) | 109.9% | 31,101,785 | ||
| Liabilities, Less Cash and Receivables | (9.9%) | (2,805,688) | ||
| Net Assets | 100.0% | 28,296,097 |
| a All or a portion of these securities are on loan. At November 30, 2006, the total market value of the fund’s securities |
| on loan is $2,617,636 and the total market value of the collateral held by the fund is $2,828,800. |
| b Non-income producing security. |
| c Investment in affiliated money market mutual fund. |
| Portfolio Summary | (Unaudited) † | |||||
| Value (%) | Value (%) | |||||
| Financial | 21.4 | Money Market Investments | 10.0 | |||
| Information Technology | 20.0 | Consumer Staples | 3.6 | |||
| Consumer Services | 18.6 | Industrial | 2.1 | |||
| Consumer Discretionary | 18.2 | |||||
| Health Care | 16.0 | 109.9 | ||||
| † Based on net assets. |
| See notes to financial statements. |
| 10 |
STATEMENT OF ASSETS AND LIABILITIES
November 30, 2006
| Cost | Value | |||
| Assets ($): | ||||
| Investments in securities—See Statement of Investments | ||||
| (including securities on loan, valued at $2,617,636)—Note 1(b): | ||||
| Unaffiliated issuers | 24,862,517 | 28,272,985 | ||
| Affiliated issuers | 2,828,800 | 2,828,800 | ||
| Cash | 31,452 | |||
| Receivable for investment securities sold | 351,251 | |||
| Dividends and interest receivable | 45,825 | |||
| Receivable for shares of Beneficial Interest subscribed | 911 | |||
| Prepaid expenses | 19,712 | |||
| 31,550,936 | ||||
| Liabilities ($): | ||||
| Due to The Dreyfus Corporation and affiliates—Note 3(c) | 20,705 | |||||||||||
| Liability for securities on loan—Note 1(b) | 2,828,800 | |||||||||||
| Payable for investment securities purchased | 343,293 | |||||||||||
| Payable for shares of Beneficial Interest redeemed | 1,300 | |||||||||||
| Accrued expenses | 60,741 | |||||||||||
| 3,254,839 | ||||||||||||
| Net Assets ($) | 28,296,097 | |||||||||||
| Composition of Net Assets ($): | ||||||||||||
| Paid-in capital | 24,064,718 | |||||||||||
| Accumulated net realized gain (loss) on investments | 820,911 | |||||||||||
| Accumulated net unrealized appreciation | ||||||||||||
| (depreciation) on investments | 3,410,468 | |||||||||||
| Net Assets ($) | 28,296,097 | |||||||||||
| Net Asset Value Per Share | ||||||||||||
| Class A | Class B | Class C | Class R | Class T | Class J | |||||||
| Net Assets ($) | 1,337,911 | 20,860 | 1,047 | 1,064 | 5,256 | 26,929,959 | ||||||
| Shares Outstanding | 106,089 | 1,676 | 84 | 84.110 | 418.440 | 2,127,070 | ||||||
| Net Asset Value | ||||||||||||
| Per Share ($) | 12.61 | 12.45 | 12.46 | 12.65 | 12.56 | 12.66 | ||||||
| See notes to financial statements. | ||||||||||||
The Fund 11
| STATEMENT OF OPERATIONS Year Ended November 30, 2006 |
| Investment Income ($): | ||
| Income: | ||
| Cash dividends (net of $2,024 foreign taxes withheld at source): | ||
| Uffiliated issuers | 306,403 | |
| Affiliated issuers | 3,340 | |
| Income from securities lending | 46,410 | |
| Total Income | 356,153 | |
| Expenses: | ||
| Investment advisory fee—Note 3(a) | 236,436 | |
| Registration fees | 84,156 | |
| Auditing fees | 52,023 | |
| Prospectus and shareholders’ reports | 20,514 | |
| Shareholder servicing costs—Note 3(c) | 17,573 | |
| Custodian fees—Note 3(c) | 3,597 | |
| Trustees’ fees and expenses—Note 3(d) | 1,493 | |
| Legal fees | 1,158 | |
| Interest expense—Note 2 | 829 | |
| Loan commitment fees—Note 2 | 563 | |
| Distribution fees—Note 3(b) | 167 | |
| Miscellaneous | 12,629 | |
| Total Expenses | 431,138 | |
| Less—reduction in expenses | ||
| due to undertaking—Note 3(a) | (47,229) | |
| Net Expenses | 383,909 | |
| Investment (Loss)—Net | (27,756) | |
| Realized and Unrealized Gain (Loss) on Investments—Note 4 ($): | ||
| Net realized gain (loss) on investments | 904,493 | |
| Net change in unrealized appreciation (depreciation) on investments | 2,062,842 | |
| Net Realized and Unrealized Gain (Loss) on Investments | 2,967,335 | |
| Net Increase in Net Assets Resulting from Operations | 2,939,579 | |
| See notes to financial statements. |
| 12 |
STATEMENT OF CHANGES IN NET ASSETS
| Year Ended November 30, | ||||
| 2006 | 2005 a | |||
| Operations ($): | ||||
| Investment income (loss)—net | (27,756) | 72,565 | ||
| Net realized gain (loss) on investments | 904,493 | 2,044,171 | ||
| Net change in unrealized appreciation | ||||
| (depreciation) on investments | 2,062,842 | (2,978,035) | ||
| Net Increase (Decrease) in Net Assets | ||||
| Resulting from Operations | 2,939,579 | (861,299) | ||
| Dividends to Shareholders from ($): | ||||
| Investment income—net: | ||||
| Class A shares | (804) | — | ||
| Class B shares | (6) | — | ||
| Class R shares | (2) | — | ||
| Class T shares | (3) | — | ||
| Class J shares | (54,366) | (101,559) | ||
| Net realized gain on investments: | ||||
| Class A shares | (46,783) | — | ||
| Class B shares | (1,273) | — | ||
| Class C shares | (64) | — | ||
| Class R shares | (64) | — | ||
| Class T shares | (318) | — | ||
| Class J shares | (2,011,548) | (194,121) | ||
| Total Dividends | (2,115,231) | (295,680) | ||
| Beneficial Interest Transactions ($): | ||||
| Net proceeds from shares sold: | ||||
| Class A shares | 1,100,638 | 678,104 | ||
| Class B shares | 263 | 18,830 | ||
| Class C shares | — | 1,000 | ||
| Class R shares | 6,000 | 1,000 | ||
| Class T shares | — | 5,000 | ||
| Class J shares | 1,336,667 | 10,222,919 | ||
| The Fund 13 |
| STATEMENT OF CHANGES IN NET ASSETS (continued) |
| Year Ended November 30, | ||||
| 2006 | 2005 a | |||
| Beneficial Interest Transactions ($) (continued): | ||||
| Dividends reinvested: | ||||
| Class A shares | 46,104 | — | ||
| Class B shares | 1,279 | — | ||
| Class C shares | 64 | — | ||
| Class R shares | 65 | — | ||
| Class T shares | 321 | — | ||
| Class J shares | 2,053,847 | 262,920 | ||
| Cost of shares redeemed: | ||||
| Class A shares | (498,456) | (721) | ||
| Class R shares | (5,899) | — | ||
| Class J shares | (7,870,508) | (10,522,036) | ||
| Increase (Decrease) in Net Assets | ||||
| from Beneficial Interest Transactions | (3,829,615) | 667,016 | ||
| Total Increase (Decrease) in Net Assets | (3,005,267) | (489,963) | ||
| Net Assets ($): | ||||
| Beginning of Period | 31,301,364 | 31,791,327 | ||
| End of Period | 28,296,097 | 31,301,364 | ||
| Undistributed investment income—net | — | 54,556 | ||
| 14 |
| Year Ended November 30, | ||||
| 2006 | 2005 a | |||
| Capital Share Transactions: | ||||
| Class A | ||||
| Shares sold | 90,733 | 53,712 | ||
| Shares issued for dividends reinvested | 4,021 | — | ||
| Shares redeemed | (42,320) | (57) | ||
| Net Increase (Decrease) in Shares Outstanding | 52,434 | 53,655 | ||
| Class B | ||||
| Shares sold | 22 | 1,542 | ||
| Shares issued for dividends reinvested | 112 | — | ||
| Net Increase (Decrease) in Shares Outstanding | 134 | 1,542 | ||
| Class C | ||||
| Shares sold | — | 78 | ||
| Shares issued for dividends reinvested | 6 | — | ||
| Net Increase (Decrease) in Shares Outstanding | 6 | 78 | ||
| Class R | ||||
| Shares sold | 480 | 78 | ||
| Shares issued for dividends reinvested | 6 | — | ||
| Shares redeemed | (480) | — | ||
| Net Increase (Decrease) in Shares Outstanding | 6 | 78 | ||
| Class T | ||||
| Shares sold | — | 390 | ||
| Shares issued for dividends reinvested | 28 | — | ||
| Net Increase (Decrease) in Shares Outstanding | 28 | 390 | ||
| Class J | ||||
| Shares sold | 111,764 | 797,178 | ||
| Shares issued for dividends reinvested | 178,751 | 20,240 | ||
| Shares redeemed | (658,415) | (829,841) | ||
| Net Increase (Decrease) in Shares Outstanding | (367,900) | (12,423) | ||
a The fund commenced offering six classes of shares on February 25, 2005.The existing shares were redesignated Class J shares and the fund added Class A, Class B, Class C, Class R and Class T shares.
See notes to financial statements.
| The Fund 15 |
| FINANCIAL HIGHLIGHTS |
The following tables describe the performance for each share class for the fiscal periods indicated.All information (excluding portfolio turnover rate) reflects financial results for a single fund share.Total return shows how much your investment in the fund would have increased (or decreased) during each period, assuming you had reinvested all dividends and distributions.These figures have been derived from the fund’s financial statements.
| Year Ended November 30, | ||||||
| Class A Shares | 2006 | 2005 a | ||||
| Per Share Data ($): | ||||||
| Net asset value, beginning of period | 12.25 | 12.75 | ||||
| Investment Operations: | ||||||
| Investment income (loss)—net b | (.03) | .01 | ||||
| Net realized and unrealized | ||||||
| gain (loss) on investments | 1.21 | (.51) | ||||
| Total from Investment Operations | 1.18 | (.50) | ||||
| Distributions: | ||||||
| Dividends from investment income—net | (.01) | — | ||||
| Dividends from net realized | ||||||
| gain on investments | (.81) | — | ||||
| Total Distributions | (.82) | — | ||||
| Net asset value, end of period | 12.61 | 12.25 | ||||
| Total Return (%) c | 10.37 | (3.92)d | ||||
| Ratios/Supplemental Data (%): | ||||||
| Ratio of total expenses to average net assets | 1.73 | 1.54d | ||||
| Ratio of net expenses to average net assets | 1.54 | 1.16d | ||||
| Ratio of net investment income (loss) | ||||||
| to average net assets | (.27) | .05d | ||||
| Portfolio Turnover Rate | 35.40 | 35.26 | ||||
| Net Assets, end of period ($ x 1,000) | 1,338 | 657 | ||||
| a | From February 25, 2005 (commencement of operations) to November 30, 2005. | |||||
| b | Based on average shares outstanding at each month end. | |||||
| c | Exclusive of sales charge. | |||||
| d | Not Annualized | |||||
| See notes to financial statements. | ||||||
| 16 |
| Year Ended November 30, | ||||||
| Class B Shares | 2006 | 2005 a | ||||
| Per Share Data ($): | ||||||
| Net asset value, beginning of period | 12.18 | 12.75 | ||||
| Investment Operations: | ||||||
| Investment income (loss)—net b | (.13) | .01 | ||||
| Net realized and unrealized | ||||||
| gain (loss) on investments | 1.21 | (.58) | ||||
| Total from Investment Operations | 1.08 | (.57) | ||||
| Distributions: | ||||||
| Dividends from net realized | ||||||
| gain on investments | (.81) | — | ||||
| Net asset value, end of period | 12.45 | 12.18 | ||||
| Total Return (%) c | 9.55 | (4.47)d | ||||
| Ratios/Supplemental Data (%): | ||||||
| Ratio of total expenses to average net assets | 2.73 | 2.86d | ||||
| Ratio of net expenses to average net assets | 2.30 | 1.90d | ||||
| Ratio of net investment income (loss) | ||||||
| to average net assets | (1.08) | .07d | ||||
| Portfolio Turnover Rate | 35.40 | 35.26 | ||||
| Net Assets, end of period ($ x 1,000) | 21 | 19 | ||||
| a | From February 25, 2005 (commencement of operations) to November 30, 2005. | |||||
| b | Based on average shares outstanding at each month end. | |||||
| c | Exclusive of sales charge. | |||||
| d | Not Annualized | |||||
| See notes to financial statements. | ||||||
| The Fund 17 |
| FINANCIAL HIGHLIGHTS (continued) |
| Year Ended November 30, | ||||||
| Class C Shares | 2006 | 2005 a | ||||
| Per Share Data ($): | ||||||
| Net asset value, beginning of period | 12.18 | 12.75 | ||||
| Investment Operations: | ||||||
| Investment (loss)—net b | (.13) | (.07) | ||||
| Net realized and unrealized | ||||||
| gain (loss) on investments | 1.22 | (.50) | ||||
| Total from Investment Operations | 1.09 | (.57) | ||||
| Distributions: | ||||||
| Dividends from net realized | ||||||
| gain on investments | (.81) | — | ||||
| Net asset value, end of period | 12.46 | 12.18 | ||||
| Total Return (%) c | 9.51 | (4.47)d | ||||
| Ratios/Supplemental Data (%): | ||||||
| Ratio of total expenses to average net assets | 4.12 | 3.25d | ||||
| Ratio of net expenses to average net assets | 2.30 | 1.74d | ||||
| Ratio of net investment (loss) | ||||||
| to average net assets | (1.07) | (.52)d | ||||
| Portfolio Turnover Rate | 35.40 | 35.26 | ||||
| Net Assets, end of period ($ x 1,000) | 1 | 1 | ||||
| a | From February 25, 2005 (commencement of operations) to November 30, 2005. | |||||
| b | Based on average shares outstanding at each month end. | |||||
| c | Exclusive of sales charge. | |||||
| d | Not Annualized | |||||
| See notes to financial statements. | ||||||
| 18 |
| Year Ended November 30, | ||||||
| Class R Shares | 2006 | 2005 a | ||||
| Per Share Data ($): | ||||||
| Net asset value, beginning of period | 12.28 | 12.75 | ||||
| Investment Operations: | ||||||
| Investment income (loss)—net b | (.01) | .03 | ||||
| Net realized and unrealized | ||||||
| gain (loss) on investments | 1.21 | (.50) | ||||
| Total from Investment Operations | 1.20 | (.47) | ||||
| Distributions: | ||||||
| Dividends from investment income—net | (.02) | — | ||||
| Dividends from net realized | ||||||
| gain on investments | (.81) | — | ||||
| Total Distributions | (.83) | — | ||||
| Net asset value, end of period | 12.65 | 12.28 | ||||
| Total Return (%) | 10.47 | (3.69)c | ||||
| Ratios/Supplemental Data (%): | ||||||
| Ratio of total expenses to average net assets | 2.64 | 2.28c | ||||
| Ratio of net expenses to average net assets | 1.30 | .97c | ||||
| Ratio of net investment income (loss) | ||||||
| to average net assets | (.12) | .25c | ||||
| Portfolio Turnover Rate | 35.40 | 35.26 | ||||
| Net Assets, end of period ($ x 1,000) | 1 | 1 | ||||
| a | From February 25, 2005 (commencement of operations) to November 30, 2005. | |||||
| b | Based on average shares outstanding at each month end. | |||||
| c | Not annualized. | |||||
| See notes to financial statements. | ||||||
| The Fund 19 |
| FINANCIAL HIGHLIGHTS (continued) |
| Year Ended November 30, | ||||||
| Class T Shares | 2006 | 2005 a | ||||
| Per Share Data ($): | ||||||
| Net asset value, beginning of period | 12.23 | 12.75 | ||||
| Investment Operations: | ||||||
| Investment (loss)—net b | (.07) | (.03) | ||||
| Net realized and unrealized | ||||||
| gain (loss) on investments | 1.22 | (.49) | ||||
| Total from Investment Operations | 1.15 | (.52) | ||||
| Distributions: | ||||||
| Dividends from investment income—net | (.01) | — | ||||
| Dividends from net realized | ||||||
| gain on investments | (.81) | — | ||||
| Total Distributions | (.82) | — | ||||
| Net asset value, end of period | 12.56 | 12.23 | ||||
| Total Return (%) c | 10.06 | (4.08)d | ||||
| Ratios/Supplemental Data (%): | ||||||
| Ratio of total expenses to average net assets | 2.65 | 2.37d | ||||
| Ratio of net expenses to average net assets | 1.81 | 1.38d | ||||
| Ratio of net investment (loss) | ||||||
| to average net assets | (.59) | (.20)d | ||||
| Portfolio Turnover Rate | 35.40 | 35.26 | ||||
| Net Assets, end of period ($ X 1,000) | 5 | 5 | ||||
| a | From February 25, 2005 (commencement of operations) to November 30, 2005. | |||||
| b | Based on average shares outstanding at each month end. | |||||
| c | Exclusive of sales charge. | |||||
| d | Not Annualized | |||||
| See notes to financial statements. | ||||||
| 20 |
| Year Ended November 30, | ||||||||||
| Class J Shares | 2006 | 2005 a | 2004 | 2003 | 2002 b | |||||
| Per Share Data ($): | ||||||||||
| Net asset value, beginning of period | 12.27 | 12.68 | 10.61 | 8.85 | 10.00 | |||||
| Investment Operations: | ||||||||||
| Investment income (loss)—net | (.01)c | .03c | .03 | .08 | .05 | |||||
| Net realized and unrealized | ||||||||||
| gain (loss) on investments | 1.23 | (.32) | 2.11 | 1.74 | (1.20) | |||||
| Total from Investment Operations | 1.22 | (.29) | 2.14 | 1.82 | (1.15) | |||||
| Distributions: | ||||||||||
| Dividends from investment income—net | (.02) | (.04) | (.07) | (.06) | — | |||||
| Dividends from net realized | ||||||||||
| gain on investments | (.81) | (.08) | — | — | — | |||||
| Total Distributions | (.83) | (.12) | (.07) | (.06) | — | |||||
| Net asset value, end of period | 12.66 | 12.27 | 12.68 | 10.61 | 8.85 | |||||
| Total Return (%) | 10.69 | (2.37) | 20.26 | 20.69 | (11.50)d | |||||
| Ratios/Supplemental Data (%): | ||||||||||
| Ratio of total expenses | ||||||||||
| to average net assets | 1.45 | 1.49 | 1.62 | 1.70 | 1.74e | |||||
| Ratio of net expenses | ||||||||||
| to average net assets | 1.29 | 1.28 | 1.30 | 1.30 | 1.30e | |||||
| Ratio of net investment income (loss) | ||||||||||
| to average net assets | (.09) | .21 | .37 | .89 | .69e | |||||
| Portfolio Turnover Rate | 35.40 | 35.26 | 75.79 | 60.27 | 66.24d | |||||
| Net Assets, end of period ($ x 1,000) | 26,930 | 30,619 | 31,800 | 22,500 | 17,800 | |||||
| a | The fund commenced offering six classes of shares on February 25, 2005.The existing shares were redesignated | |
| Class J shares. | ||
| b | From December 3, 2001 (commencement of operations) through November 30, 2002. | |
| c | Based on average shares outstanding at each month end. | |
| d | Not annualized. | |
| e | Annualized | |
| See notes to financial statements. | ||
| The Fund 21 |
NOTES TO FINANCIAL STATEMENTS
NOTE 1—Significant Accounting Policies:
Dreyfus Premier Select Fund (the “fund”) is a separate diversified series of Dreyfus Premier Manager Funds II (the “Company”), which is registered under the Investment Company Act of 1940, as amended (the “Act”), as an open-end management investment company and operates as a series company currently offering three series, including the fund. The fund’s investment objective seeks high level of long-term capital appreciation. The Dreyfus Corporation (the “Manager” or “Dreyfus”) serves as the fund’s investment adviser. Dreyfus is a wholly-owned subsidiary of Mellon Financial Corporation (“Mellon Financial”). Wisconsin Capital Management, Inc. (“Wisconsin Capital”), serves as the fund’s sub-investment adviser.
On December 4, 2006, Mellon Financial and The Bank of New York Company, Inc. announced that they had entered into a definitive agreement to merge. The new company will be called The Bank of New York Mellon Corporation. As part of this transaction, Dreyfus would become a wholly-owned subsidiary of The Bank of New York Mellon Corporation.The transaction is subject to certain regulatory approvals and the approval of The Bank of New York Company, Inc.’s and Mellon Financial’s shareholders, as well as other customary conditions to closing. Subject to such approvals and the satisfaction of the other conditions, Mellon Financial and The Bank of New York Company, Inc. expect the transaction to be completed in the third quarter of 2007.
On February 25, 2005, pursuant to an Agreement and Plan of Reorganization previously approved by the Company’s Board, all of the assets, subject to the liabilities, of Thompson Plumb Select Fund, a series of Thompson Plumb Funds, Inc., were transferred to Dreyfus Premier Select Fund in exchange for shares of Beneficial Interest of Dreyfus Premier Select Fund’s Class J shares of equal value on the close of business on February 25, 2005. Holders of Thompson Plumb Select Fund received Dreyfus Premier Select Fund, Class J shares, in an amount equal to the aggregate net asset value of their investment in Thompson Plumb Select Fund at the time of the exchange.The net asset value of
| 22 |
Dreyfus Premier Select Fund’s Class J shares on February 25, 2005, before and after the reorganization, was $12.75 per share and a total of 2,780,028 Class J shares representing net assets of $35,432,302 (including $3,782,369 net unrealized appreciation on investments) were issued to Thompson Plumb Select Fund’s shareholders in the exchange.The exchange was a tax-free event to shareholders.The fund is designed to have the same investment objective and substantially similar investment policies and strategies as the Thompson Plumb Select Fund. Class J shares are closed to new investors.
Dreyfus Service Corporation (the “Distributor”), a wholly-owned subsidiary of Dreyfus, is the Distributor of the fund’s shares. The fund is authorized to issue an unlimited number of $.001 par value shares of Beneficial Interest in each of the following classes of shares: Class A, Class B, Class C, Class R, Class T and Class J shares. Class A and Class T shares are subject to a sales charge imposed at the time of purchase. Class B shares are subject to a contingent deferred sales charge (“CDSC”) imposed on Class B share redemptions made within six years of purchase and automatically convert to Class A shares after six years. Class C shares are subject to a CDSC imposed on Class C shares redeemed within one year of purchase and Class R shares are sold at net asset value per share only to institutional investors. Class J shares were created in connection with the reorganization of the Thompson Plumb Select Fund and are closed to new investors. Other differences between the classes include the services offered to and the expenses borne by each class. Income, expenses (other than expenses attributable to a specific class), and realized and unrealized gains or losses on investments are allocated to each class of shares based on its relative net assets.
Effective March 1, 2006, Class A shares of the fund may be purchased at net asset value (“NAV”) without payment of a sales charge:
- By qualified investors who (i) purchase Class A shares directly through the Distributor, and (ii) have, or whose spouse or minor children have, beneficially owned shares and continuously maintained an open account directly through the Distributor in a Dreyfus-managed fund,
| The Fund 23 |
| NOTES TO FINANCIAL STATEMENTS (continued) |
- including the fund, or a Founders Asset Management LLC (“Founders”) managed fund since on or before February 28, 2006. Founders is a wholly-owned subsidiary of the Distributor.
- With the cash proceeds from an investor’s exercise of employment- related stock options, whether invested in the fund directly or indi- rectly through an exchange from a Dreyfus-managed money market fund, provided that the proceeds are processed through an entity that has entered into an agreement with the Distributor specifically relat- ing to processing stock options. Upon establishing the account in the fund or the Dreyfus-managed money market fund, the investor and the investor’s spouse and minor children become eligible to purchase Class A shares of the fund at NAV, whether or not using the proceeds of the employment-related stock options.
- By members of qualified affinity groups who purchase Class A shares directly through the Distributor, provided that the qualified affinity group has entered into an affinity agreement with the Distributor.
Effective March 1, 2006, Class A and Class T shares of the fund may be purchased at NAV without payment of a sales charge:
- For Dreyfus-sponsored IRA “Rollover Accounts” with the distribution proceeds from qualified and non-qualified retirement plans or a Dreyfus-sponsored 403(b)(7) plan, provided that, in the case of a qualified or non-qualified retirement plan, the rollover is processed through an entity that has entered into an agreement with the Distributor specifically relating to processing rollovers. Upon estab- lishing the Dreyfus-sponsored IRA rollover account in the fund, the shareholder becomes eligible to make subsequent purchases of Class A or Class T shares of the fund at NAV in such account.
Effective June 1, 2006, the fund no longer offers Class B shares, except in connection with dividend reinvestment and permitted exchanges of Class B shares.
As of November 30, 2006, MBC Investments Corp., an indirect subsidiary of Mellon Financial, held 84 shares of each of the following Class B, Class C, Class R and Class T shares of the fund.
| 24 |
The Company accounts separately for the assets, liabilities and operations of each series. Expenses directly attributable to each series are charged to that series’ operations; expenses which are applicable to all series are allocated among them on a pro rata basis.
The fund’s financial statements are prepared in accordance with U.S. generally accepted accounting principles, which require the use of management estimates and assumptions. Actual results could differ from those estimates.
In the normal course of business, the fund enters into contracts and agreements that contain a variety of representations and warranties, which provide general indemnifications. The maximum exposure to the fund under these arrangements is unknown, as this would involve future claims that may be made against the fund that have not yet occurred. However, based on experience, the fund expects the risks of the loss to be remote.
(a) Portfolio valuation: Investments in securities are valued at the last sales price on the securities exchange or national securities market on which such securities are primarily traded. Securities listed on the National Market System for which market quotations are available are valued at the official closing price or, if there is no official closing price that day, at the last sales price. Securities not listed on an exchange or the national securities market, or securities for which there were no transactions, are valued at the average of the most recent bid and asked prices, except for open short positions, where the asked price is used for valuation purposes. Investments in registered investment companies are valued at their net asset value. Bid price is used when no asked price is available.When market quotations or official closing prices are not readily available, or are determined not to reflect accurately fair value, such as when the value of a security has been significantly affected by events after the close of the exchange or market on which the security is principally traded (for example, a foreign exchange or market), but before the fund calculates its net asset value, the fund may value these investments at fair value as determined in accordance with
| The Fund 25 |
| NOTES TO FINANCIAL STATEMENTS (continued) |
the procedures approved by the Board of Trustees. Fair valuing of securities may be determined with the assistance of a pricing service using calculations based on indices of domestic securities and other appropriate indicators, such as prices of relevant ADR’s and futures contracts. For other securities that are fair valued by the Board of Trustees, certain factors may be considered such as: fundamental analytical data, the nature and duration of restrictions on disposition, an evaluation of the forces that influence the market in which the securities are purchased and sold and public trading in similar securities of the issuer or comparable issuers. Financial futures are valued at the last sales price on the principal exchange.
On September 20, 2006, the Financial Accounting Standards Board (FASB) released Statement of Financial Accounting Standards No. 157 “Fair Value Measurements” (“FAS 157”). FAS 157 establishes an authoritative definition of fair value, sets out a framework for measuring fair value, and requires additional disclosures about fair-value measurements. The application of FAS 157 is required for fiscal years beginning after November 15, 2007 and interim periods within those fiscal years. Management does not believe that the application of this standard will have a material impact on the financial statements of the fund.
(b) Securities transactions and investment income: Securities transactions are recorded on a trade date basis. Realized gain and loss from securities transactions are recorded on the identified cost basis. Dividend income is recognized on the ex-dividend date and interest income is determined on the basis of coupon interest accrued, adjusted for accretion of discount and amortization of premium on debt securities.
The fund has an arrangement with the custodian bank, Mellon Bank, N.A., whereby the fund receives earnings credits from the custodian when positive cash balances are maintained, which are used to offset custody fees. For financial reporting purposes, the fund includes net earnings credits, if any, as an expense offset in the Statement of Operations.
Pursuant to a securities lending agreement with Mellon Bank, N.A., an affiliate of the Manager, the fund may lend securities to qualified insti-
| 26 |
tutions. It is the fund’s policy that at origination all loans are secured by collateral of at least 102% of the value of U.S. securities loaned and 105% of the value of foreign securities loaned. It is the fund’s policy that collateral equivalent to at least 100% of the market value of securities on loan is maintained at all times. Cash collateral is invested in certain money market mutual funds managed by the Manager. The fund is entitled to receive all income on securities loaned, in addition to income earned as a result of the lending transaction. Although each security loaned is fully collateralized, the fund bears the risk of delay in recovery of, or loss of rights in, the securities loaned should a borrower fail to return the securities in a timely manner. During the period ended November 30, 2006, pursuant to the securities lending agreement, Mellon Bank, N.A. earned revenues of $19,890 from the fund.
(c) Affiliated issuers: Investments in other investment companies advised by the Manager are defined as “affiliated” in the Act.
(d) Dividends to shareholders: Dividends are recorded on the ex-dividend date. Dividends from investment income-net and dividends from net realized capital gain, if any, are normally declared and paid annually, but the fund may make distributions on a more frequent basis to comply with the distribution requirements of the Internal Revenue Code of 1986, as amended (the “Code”).To the extent that net realized capital gain can be offset by capital loss carryovers, if any, it is the policy of the fund not to distribute such gain. Income and capital gain distributions are determined in accordance with income tax regulations, which may differ from U.S. generally accepted accounting principles.
(e) Federal income taxes: It is the policy of the fund to continue to qualify as a regulated investment company, if such qualification is in the best interests of its shareholders, by complying with the applicable provisions of the Code, and to make distributions of taxable income sufficient to relieve it from substantially all federal income and excise taxes.
In July 2006, the Financial Accounting Standards Board issued Interpretation No. 48,“Accounting for Uncertainty in Income Taxes -an Interpretation of FASB Statement No. 109” (the “Interpretation”).
| The Fund 27 |
| NOTES TO FINANCIAL STATEMENTS (continued) |
The Interpretation establishes for all entities, including pass-through entities such as the Fund, a minimum threshold for financial statement recognition of the benefit of positions taken in filing tax returns (including whether an entity is taxable in a particular jurisdiction), and requires certain expanded tax disclosures. Adoption of FIN 48 is required for fiscal years beginning after December 15, 2006 and is to be applied to all open tax years as of the effective date. Management does not believe that the application of this standard will have a material impact on the financial statements of the fund.
At November 30, 2006, the components of accumulated earnings on a tax basis were as follows: undistributed ordinary income $251,307, undistributed capital gains $846,320 and unrealized appreciation $3,355,441. In addition, the fund had $221,689 of capital losses realized after October 31, 2006, which were deferred for tax purposes to the first day of the following fiscal year.
The tax character of distributions paid to shareholders during the fiscal periods ended November 30, 2006 and November 30, 2005, were as follows: ordinary income $925,767 and $101,471 and long-term capital gains $1,189,464 and $194,209, respectively.
During the period ended November 30, 2006, as a result of permanent book to tax differences, primarily due to the tax treatment of net operating losses, the fund increased accumulated undistributed investment income-net by $28,381 and decreased accumulated net realized gain (loss) on investments by the same amount. Net assets were not affected by this reclassification.
| NOTE 2—Bank Line of Credit: |
The fund participates with other Dreyfus-managed funds in a $350 million redemption credit facility (the “Facility”) to be utilized for temporary or emergency purposes, including the financing of redemptions. In connection therewith, the fund has agreed to pay commitment fees on its pro rata portion of the Facility. Interest is charged to the fund based on prevailing market rates in effect at the time of borrowing.
| 28 |
The average daily amount of borrowings outstanding under the Facility during the period ended November 30, 2006, was $15,700, with a related weighted average annualized interest rate of 5.27% .
NOTE 3—Management Fee, Sub-Investment Advisory Fee and Other Transactions With Affiliates:
(a) Pursuant to a Management Agreement (“Agreement”) with Dreyfus, the management fee is computed at the annual rate of .80% of the value of the fund’s average daily net assets and is payable monthly. Dreyfus has contractually agreed, from December 1, 2005 until February 25, 2007, to waive receipt of its fees and/or assume the expenses of the fund, so that annual fund operating expenses for Class J shares, exclusive of taxes, interest, brokerage commissions, commitment fees and extraordinary expenses, do not exceed 1.30% . Dreyfus had undertaken from December 1, 2005 through November 30, 2006, for Class A, Class B, Class C, Class R and Class T shares, to reduce the management fee paid by the fund, if the aggregate expenses, exclusive of taxes, brokerage fee, interest on borrowings, commitment fees, Rule 12b-1 distribution plan fees,shareholder services plan fees and extraordinary expenses,exceed an annual rate of 1.30% of the value of their average daily net assets.The reduction in expenses, pursuant to the undertakings, amounted to $47,229 during the period ended November 30, 2006.
Pursuant to a Sub-Investment Advisory Agreement between Dreyfus and Wisconsin Capital, Dreyfus has agreed to pay Wisconsin Capital a monthly fee in the amount of 100% of the management fee paid by the fund to Dreyfus for such month,less certain fees waived or expenses paid or reimbursed by Dreyfus, on the fund’s assets attributable to accounts of shareholders who have an adviser-client relationship with Wisconsin Capital (including the accounts of all shareholders of Thompson Plumb Select Fund as of the reorganization date who continue as shareholders of the fund following the reorganization of Thompson Plumb Select Fund), plus, with respect to all other assets of the fund, .50% of the net management fee paid to the manager on such net assets.
| The Fund 29 |
| NOTES TO FINANCIAL STATEMENTS (continued) |
During the period ended November 30, 2006, the fund was advised that the Distributor retained $999 from commissions earned on sales of the fund’s Class A shares.
(b) Under the Distribution Plan (the “Plan”) adopted pursuant to Rule 12b-1 under the Act, Class B, Class C and Class T shares pay the Distributor for distributing their shares at an annual rate of .75 % of the value of their average daily net assets of Class B and Class C shares and .25% of the value of the average daily net assets of Class T shares. During the period ended November 30, 2006, Class B, Class C and Class T shares were charged $148, $7 and $12, respectively, pursuant to the Plan.
(c) Under the Shareholder Services Plan, Class A, Class B, Class C and Class T shares pay the Distributor at an annual rate of .25% of the value of their average daily net assets for the provision of certain services.The services provided may include personal services relating to shareholder accounts, such as answering shareholder inquiries regarding the fund and providing reports and other information, and services related to the maintenance of shareholder accounts.The Distributor may make payments to Service Agents (a securities dealer, financial institution or other industry professional) in respect of these services.The Distributor determines the amounts to be paid to Service Agents. During the period ended November 30, 2006, Class A, Class B, Class C and Class T shares were charged $2,935, $49, $3 and $12, respectively, pursuant to the Shareholder Services Plan.
The fund compensates Dreyfus Transfer, Inc., a wholly-owned subsidiary of Dreyfus, under a transfer agency agreement for providing personnel and facilities to perform transfer agency services for Class A, Class B, Class C, Class R and Class T shares of the fund. During the period ended November 30, 2006, the fund was charged $14,574 pursuant to the transfer agency agreement.
The fund compensates Mellon Bank, N.A., an affiliate of Dreyfus, under a custody agreement for providing custodial services for the fund. During the period ended November 30, 2006, the fund was charged $3,597 pursuant to the custody agreement.
| 30 |
During the period ended November 30, 2006, the fund was charged $4,184 for services performed by the Chief Compliance Officer.
The components of Due to The Dreyfus Corporation and affiliates in the Statement of Assets and Liabilities consist of:investment advisory fees $18,666,Rule 12b-1 distribution plan fees $14,shareholder services plan fees $278, custodian fees $433, chief compliance officer fees $1,704 and transfer agency per account fees $1,478, which are offset against an expense reimbursement currently in effect in the amount of $1,868.
(d) Each Board member also serves as a Board member of other funds within the Dreyfus complex. Annual retainer fees and attendance fees are allocated to each fund based on net assets.
(e) Pursuant to an exemptive order from the SEC, the fund may invest its available cash balances in affiliated money market mutual funds. Management fees of the underlying money market mutual funds have been waived by Dreyfus.
NOTE 4—Securities Transactions:
The aggregate amount of purchases and sales of investment securities, excluding short-term securities, during the period ended November 30, 2006, amounted to $10,502,533 and $16,367,774, respectively.
At November 30, 2006, the cost of investments for federal income tax purposes was $27,746,344; accordingly, accumulated net unrealized appreciation on investments was $3,355,441, consisting of $4,003,480 gross unrealized appreciation and $648,039 gross unrealized depreciation.
| The Fund 31 |
| REPORT OF INDEPENDENT REGISTERED PUBLIC ACCOUNTING FIRM |
| To the Trustees and Shareholders of Dreyfus Premier Select Fund |
In our opinion, the accompanying statement of assets and liabilities, including the statement of investments, and the related statements of operations and of changes in net assets and the financial highlights present fairly, in all material respects, the financial position of Dreyfus Premier Select Fund (the “Fund”) (one of the series constituting Dreyfus Premier Manager Funds II) as of November 30, 2006, the results of its operations for the year then ended, the changes in its net assets for each of the two years in the period then ended and the financial highlights for each of the periods presented, in conformity with accounting principles generally accepted in the United States of America. These financial statements and financial highlights (hereafter referred to as “financial statements”) are the responsibility of the Fund’s management. Our responsibility is to express an opinion on these financial statements based on our audits. We conducted our audits of these financial statements in accordance with the standards of the Public Company Accounting Oversight Board (United States). Those standards require that we plan and perform the audit to obtain reasonable assurance about whether the financial statements are free of material misstatement. An audit includes examining, on a test basis, evidence supporting the amounts and disclosures in the financial statements, assessing the accounting principles used and significant estimates made by management, and evaluating the overall financial statement presentation. We believe that our audits, which included confirmation of securities at November 30, 2006 by correspondence with the custodian and brokers, provide a reasonable basis for our opinion.
| PricewaterhouseCoopers LLP |
| New York, New York |
| January 19, 2007 |
| 32 |
IMPORTANT TAX INFORMATION (Unaudited)
For federal tax purposes, the fund hereby designates $.4700 per share as a long-term capital gain distribution paid on December 30, 2005. The fund also hereby designates 40.56% of the ordinary dividends paid during the fiscal year ended November 30, 2006 as qualifying for the corporate dividends received deduction. For the fiscal year ended November 30, 2006, certain dividends paid by the fund may be subject to a maximum tax rate of 15%, as provided for by the Jobs and Growth Tax Relief Reconciliation Act of 2003. Of the distributions paid during the fiscal year, $281,257 represents the maximum amount that may be considered qualified dividend income. Shareholders will receive notification in January 2007 of the percentage applicable to the preparation of their 2006 income tax returns.
| PROXY RESULTS (Unaudited) |
Dreyfus Premier Manager Funds II held a special meeting of shareholders on June 29, 2006.The proposal considered at the meeting, and the results, are as follows:
| Shares | ||||||
| Votes For | Authority Withheld | |||||
| To elect additional Board Members: | ||||||
| Peggy C. Davis † | 33,714,880 | 433,244 | ||||
| James F. Henry † | 33,767,904 | 380,219 | ||||
| Dr. Martin Peretz † | 33,707,382 | 440,742 |
† Each will serve as an Independent Board member of the fund commencing, subject to the discretion of the Board, on or about January 1, 2007.
In addition Joseph S. DiMartino, David P. Feldman, Ehud Houminer, Gloria Messinger, and Anne Wexler continue as Board members of the fund.
| The Fund 33 |
BOARD MEMBERS INFORMATION (Unaudited)
| Joseph S. DiMartino (63) Chairman of the Board (2003) |
| Principal Occupation During Past 5 Years: • Corporate Director and Trustee |
| Other Board Memberships and Affiliations: |
- The Muscular Dystrophy Association, Director
- Century Business Services, Inc., a provider of outsourcing functions for small and medium size companies, Director
- The Newark Group, a provider of a national market of paper recovery facilities, paperboard mills and paperboard converting plants, Director
- Sunair Services Corporation, engaging in the design, manufacture and sale of high frequency systems for long-range voice and data communications, as well as providing certain outdoor-related services to homes and businesses, Director
No. of Portfolios for which Board Member Serves: 190 ———————
Peggy C. Davis (63) Board Member (2006)
| Principal Occupation During Past 5 Years: |
- Shad Professor of Law, New York University School of Law (1983-present)
- Writer and teacher in the fields of evidence, constitutional theory, family law, social sciences and the law, legal process and professional methodology and training
No. of Portfolios for which Board Member Serves: 71 ———————
David P. Feldman (67) Board Member (2003)
| Principal Occupation During Past 5 Years: • Corporate Director and Trustee |
| Other Board Memberships and Affiliations: |
- BBH Mutual Funds Group (11 funds), Director
- The Jeffrey Company, a private investment company, Director
- QMED, a medical device company, Director
| No. of Portfolios for which Board Member Serves: 57 |
| 34 |
| James F. Henry (75) Board Member (2006) |
| Principal Occupation During Past 5 Years: |
- President,The International Institute for Conflict Prevention and Resolution, a non-profit organization principally engaged in the development of alternatives to business litigation (Retired 2003)
- Advisor to The Elaw Forum, a consultant on managing corporate legal costs
- Advisor to John Jay Homestead (the restored home of the first U.S. Chief Justice)
- Individual Trustee of several trusts
| Other Board Memberships and Affiliations: |
- Director, advisor and mediator involved in several non-profit organizations, primarily engaged in domestic and international dispute resolution, and historic preservation
No. of Portfolios for which Board Member Serves: 48 ———————
Ehud Houminer (66) Board Member (2003)
Principal Occupation During Past 5 Years:
• Executive-in-Residence at the Columbia Business School, Columbia University
| Other Board Memberships and Affiliations: |
- Avnet Inc., an electronics distributor, Director
- International Advisory Board to the MBA Program School of Management, Ben Gurion University, Chairman
- Explore Charter School, Brooklyn, NY, Chairman
No. of Portfolios for which Board Member Serves: 76 ———————
Dr. Paul A. Marks (80) Board Member (2006)
| Principal Occupation During Past 5 Years: |
- President, Emeritus (2000-present) and President and Chief Executive Officer of Memorial Sloan-Kettering Cancer Center (Retired 1999)
| Other Board Memberships and Affiliations: |
- Pfizer, Inc., Director-Emeritus
- Lazard Freres & Company, LLC, Senior Adviser
- Armgo-Start-Up Biotech; Board of Directors
- Nanoviricide, Scientific Advisory Board
- PTC, Scientific Advisory Board
- IKONYSIS, Scientific Advisory Board
| No. of Portfolios for which Board Member Serves: 48 |
| The Fund 35 |
BOARD MEMBERS INFORMATION (Unaudited) (continued)
| Gloria Messinger (77) Board Member (2003) |
| Principal Occupation During Past 5 Years: |
- Arbitrator for American Arbitration Association and National Association of Securities Dealers, Inc.
- Consultant in Intellectual Property
| Other Board Memberships and Affiliations: |
- Theater for a New Audience, Inc., Director
- Brooklyn Philharmonic, Director
No. of Portfolios for which Board Member Serves: 48 ———————
Dr. Martin Peretz (67) Board Member (2006)
| Principal Occupation During Past 5 Years: |
- Editor-in-Chief of The New Republic Magazine
- Lecturer in Social Studies at Harvard University (1965-2002)
- Director of TheStreet.com, a financial information service on the web
| Other Board Memberships and Affiliations: |
- American Council of Trustees and Alumni, Director
- Pershing Square Capital Management, Adviser
- Montefiore Ventures, General Partner
- Harvard Center for Blood Research,Trustee
- Bard College,Trustee
- Board of Overseers of YIVO Institute for Jewish Research, Chairman
No. of Portfolios for which Board Member Serves: 48 ———————
Anne Wexler (76) Board Member (2003)
| Principal Occupation During Past 5 Years: |
- Chairman of the Wexler & Walker Public Policy Associates, consultants specializing in government relations and public affairs
| Other Board Memberships and Affiliations: |
- Wilshire Mutual Funds (5 funds), Director
- Methanex Corporation, a methanol producing company, Director
- Member of the Council of Foreign Relations
- Member of the National Park Foundation
No. of Portfolios for which Board Member Serves: 57 ———————
Once elected all Board Members serve for an indefinite term, but achieve Emeritus status upon reaching age 80.The address of the Board Members and Officers is in c/o The Dreyfus Corporation, 200 Park Avenue, New York, New York 10166. Additional information about the Board Members is available in the fund’s Statement of Additional Information which can be obtained from Dreyfus free of charge by calling this toll free number: 1-800-554-4611.
John M. Fraser, Jr., Emeritus Board Member T. John Szarkowski, Emeritus Board Member
| 36 |
OFFICERS OF THE FUND (Unaudited)
| J. DAVID OFFICER, President since | JOSEPH M. CHIOFFI, Vice President and | |
| December 2006. | Assistant Secretary since August 2005. | |
| Chief Operating Officer,Vice Chairman and a | Associate General Counsel of the Manager, | |
| director of the Manager, and an officer of 90 | and an officer of 91 investment companies | |
| investment companies (comprised of 190 | (comprised of 206 portfolios) managed by the | |
| portfolios) managed by the Manager. He is 58 | Manager. He is 45 years old and has been an | |
| years old and has been an employee of the | employee of the Manager since June 2000. | |
| Manager since April 1, 1998. | JANETTE E. FARRAGHER, Vice President | |
| MARK N. JACOBS, Vice President since | and Assistant Secretary since | |
| September 2003. | August 2005. | |
| Executive Vice President, Secretary and | Associate General Counsel of the Manager, | |
| General Counsel of the Manager, and an | and an officer of 91 investment companies | |
| officer of 91 investment companies (comprised | (comprised of 206 portfolios) managed by the | |
| of 206 portfolios) managed by the Manager. | Manager. She is 43 years old and has been an | |
| He is 60 years old and has been an employee | employee of the Manager since February 1984. | |
| of the Manager since June 1977. | JOHN B. HAMMALIAN, Vice President and | |
| MICHAEL A. ROSENBERG, Vice President | Assistant Secretary since August 2005. | |
| and Secretary since August 2005. | Associate General Counsel of the Manager, | |
| Associate General Counsel of the Manager, | and an officer of 91 investment companies | |
| and an officer of 91 investment companies | (comprised of 206 portfolios) managed by the | |
| (comprised of 206 portfolios) managed by the | Manager. He is 43 years old and has been an | |
| Manager. He is 46 years old and has been an | employee of the Manager since February 1991. | |
| employee of the Manager since October 1991. | ROBERT R. MULLERY, Vice President and | |
| JAMES BITETTO, Vice President and | Assistant Secretary since August 2005. | |
| Assistant Secretary since August 2005. | Associate General Counsel of the Manager, | |
| Associate General Counsel and Assistant | and an officer of 91 investment companies | |
| Secretary of the Manager, and an officer of 91 | (comprised of 206 portfolios) managed by the | |
| investment companies (comprised of 206 | Manager. He is 54 years old and has been an | |
| portfolios) managed by the Manager. He is 40 | employee of the Manager since May 1986. | |
| years old and has been an employee of the | JEFF PRUSNOFSKY, Vice President and | |
| Manager since December 1996. | Assistant Secretary since August 2005. | |
| JONI LACKS CHARATAN, Vice President | Associate General Counsel of the Manager, | |
| and Assistant Secretary since | and an officer of 91 investment companies | |
| August 2005. | (comprised of 206 portfolios) managed by the | |
| Associate General Counsel of the Manager, | Manager. He is 41 years old and has been an | |
| and an officer of 91 investment companies | employee of the Manager since October 1990. | |
| (comprised of 206 portfolios) managed by the | ||
| Manager. She is 51 years old and has been an | ||
| employee of the Manager since October 1988. | ||
The Fund 37
OFFICERS OF THE FUND (Unaudited) (continued)
| JAMES WINDELS, Treasurer since | JOSEPH W. CONNOLLY, Chief Compliance | |
| September 2003. | Officer since October 2004. | |
| Director – Mutual Fund Accounting of the | Chief Compliance Officer of the Manager and | |
| Manager, and an officer of 91 investment | The Dreyfus Family of Funds (91 investment | |
| companies (comprised of 206 portfolios) | companies, comprised of 206 portfolios). From | |
| managed by the Manager. He is 48 years old | November 2001 through March 2004, Mr. | |
| and has been an employee of the Manager | Connolly was first Vice-President, Mutual | |
| since April 1985. | Fund Servicing for Mellon Global Securities | |
| ERIK D. NAVILOFF, Assistant Treasurer | Services. In that capacity, Mr. Connolly was | |
| since August 2005. | responsible for managing Mellon’s Custody, | |
| Fund Accounting and Fund Administration | ||
| Senior Accounting Manager – Taxable Fixed | services to third-party mutual fund clients. He | |
| Income Funds of the Manager, and an officer | is 49 years old and has served in various | |
| of 91 investment companies (comprised of 206 | capacities with the Manager since 1980, | |
| portfolios) managed by the Manager. He is 38 | including manager of the firm’s Fund | |
| years old and has been an employee of the | Accounting Department from 1997 through | |
| Manager since November 1992. | October 2001. | |
| ROBERT ROBOL, Assistant Treasurer | WILLIAM GERMENIS, Anti-Money | |
| since August 2005. | Laundering Compliance Officer since | |
| Senior Accounting Manager – Money Market | September 2003. | |
| and Municipal Bond Funds of the Manager, | Vice President and Anti-Money Laundering | |
| and an officer of 91 investment companies | Compliance Officer of the Distributor, and the | |
| (comprised of 206 portfolios) managed by the | Anti-Money Laundering Compliance Officer | |
| Manager. He is 42 years old and has been an | of 87 investment companies (comprised of 202 | |
| employee of the Manager since October 1988. | portfolios) managed by the Manager. He is 36 | |
| ROBERT SVAGNA, Assistant Treasurer | years old and has been an employee of the | |
| since September 2003. | Distributor since October 1998. | |
| Senior Accounting Manager – Equity Funds of | ||
| the Manager, and an officer of 91 investment | ||
| companies (comprised of 206 portfolios) | ||
| managed by the Manager. He is 39 years old | ||
| and has been an employee of the Manager | ||
| since November 1990. | ||
| GAVIN C. REILLY, Assistant Treasurer | ||
| since December 2005. | ||
| Tax Manager of the Investment Accounting | ||
| and Support Department of the Manager, and | ||
| an officer of 91 investment companies | ||
| (comprised of 206 portfolios) managed by the | ||
| Manager. He is 38 years old and has been an | ||
| employee of the Manager since April 1991. | ||
38
NOTES
For More Information
| Dreyfus Premier | Custodian | |
| Select Fund | ||
| Mellon Bank, N.A. | ||
| 200 Park Avenue | ||
| One Mellon Bank Center | ||
| New York, NY 10166 | ||
| Pittsburgh, PA 15258 | ||
| Investment Adviser | Transfer Agent & | |
| The Dreyfus Corporation | Dividend Disbursing Agent | |
| 200 Park Avenue | ||
| Dreyfus Transfer, Inc. | ||
| New York, NY 10166 | ||
| 200 Park Avenue | ||
| Sub-Investment Adviser | New York, NY 10166 | |
| Wisconsin Capital Management, LLC | Distributor | |
| 1200 John Q. Hammons Drive | ||
| Dreyfus Service Corporation | ||
| Madison,WI 53717 | ||
| 200 Park Avenue | ||
| New York, NY 10166 | ||
Telephone Call your financial representative or 1-800-554-4611
| The Dreyfus Premier Family of Funds | ||
| 144 Glenn Curtiss Boulevard, Uniondale, NY 11556-0144 |
The fund files its complete schedule of portfolio holdings with the Securities and Exchange Commission (“SEC”) for the first and third quarters of each fiscal year on Form N-Q. The fund’s Forms N-Q are available on the SEC’s website at http://www.sec.gov and may be reviewed and copied at the SEC’s Public Reference Room in Washington, DC. Information on the operation of the Public Reference Room may be obtained by calling 1-202-551-8090.
A description of the policies and procedures that the fund uses to determine how to vote proxies relating to portfolio securities, and information regarding how the fund voted these proxies for the 12-month period ended June 30, 2006, is available at http://www.dreyfus.com and on the SEC’s website at http://www.sec.gov. The description of the policies and procedures is also available without charge, upon request, by calling 1-800-645-6561.
© 2007 Dreyfus Service Corporation

| Dreyfus Premier Blue Chip Fund |
ANNUAL REPORT November 30, 2006
Save time. Save paper. View your next shareholder report online as soon as it’s available. Log into www.dreyfus.com and sign up for Dreyfus eCommunications. It’s simple and only takes a few minutes.
The views expressed in this report reflect those of the portfolio manager only through the end of the period covered and do not necessarily represent the views of Dreyfus or any other person in the Dreyfus organization. Any such views are subject to change at any time based upon market or other conditions and Dreyfus disclaims any responsibility to update such views.These views may not be relied on as investment advice and, because investment decisions for a Dreyfus fund are based on numerous factors, may not be relied on as an indication of trading intent on behalf of any Dreyfus fund.
Not FDIC-Insured • Not Bank-Guaranteed • May Lose Value
| Contents | ||
| THE FUND | ||
| 2 | A Letter from the CEO | |
| 3 | Discussion of Fund Performance | |
| 6 | Fund Performance | |
| 8 | Understanding Your Fund’s Expenses | |
| 8 | Comparing Your Fund’s Expenses | |
| With Those of Other Funds | ||
| 9 | Statement of Investments | |
| 12 | Statement of Assets and Liabilities | |
| 13 | Statement of Operations | |
| 14 | Statement of Changes in Net Assets | |
| 17 | Financial Highlights | |
| 23 | Notes to Financial Statements | |
| 33 | Report of Independent Registered | |
| Public Accounting Firm | ||
| 34 | Important Tax Information | |
| 34 | Proxy Results | |
| 35 | Board Members Information | |
| 38 | Officers of the Fund | |
| FOR MORE INFORMATION | ||
| Back Cover | ||
| Dreyfus Premier |
| Blue Chip Fund |
The Fund

A LETTER FROM THE CEO
Dear Shareholder:
We are pleased to present this annual report for Dreyfus Premier Blue Chip Fund, covering the 12-month period from December 1, 2005, through November 30, 2006.
Although reports of declining housing prices have raised some economic concerns, we believe that neither a domestic recession nor a major shortfall in global growth is likely. Stimulative monetary policies over the last several years have left a legacy of ample financial liquidity worldwide, which should continue to support global economic growth. Indeed, while U.S. monetary policy has tightened to the borderline between a neutral policy and a restrictive policy, most foreign monetary policies have tightened only from stimulative to neutral, leaving room for further expansion.
The financial markets seem to agree with the view that a gradual economic slowdown is more likely than a recession, as evidenced by recent strength in stock prices. Although smaller-cap stocks generally continued to outperform their large-cap counterparts over the reporting period, we have seen evidence that investors continue to turn toward larger companies with the ability to sustain profitability in a slower economic environment.This pattern is consistent with previous mid-cycle slowdowns. Of course, there is no guarantee how the markets will perform, and we encourage you to discuss the implications of these and other matters with your financial advisor.
For information about how the fund performed during the reporting period, as well as market perspectives, we have provided a Discussion of Fund Performance given by the fund’s portfolio managers.
Thank you for your continued confidence and support.
| Thomas F. Eggers Chief Executive Officer The Dreyfus Corporation December 15, 2006 |
| 2 |

DISCUSSION OF FUND PERFORMANCE
David B. Duchow and Timothy R. O’Brien, Primary Portfolio Managers
Wisconsin Capital Management, LLC, Sub-Investment Adviser
How did Dreyfus Premier Blue Chip Fund perform relative to its benchmarks?
For the 12-month period ended November 30, 2006, the fund produced total returns of 10.13% for Class A shares, 9.30% for Class B shares, 9.50% for Class C shares, 10.30% for Class J shares, 10.24% for Class R shares and 9.89% for Class T shares.1 In comparison, the fund’s benchmark, the Standard & Poor’s Composite Stock Price Index (“S&P 500 Index”), achieved a total return of 14.22% for the same period.2
After producing generally lackluster returns over the first half of the reporting period, stocks rallied over the second half as short-term interest rates stabilized and prospects improved for an economic “soft landing.” However, the fund’s returns lagged industry averages, primarily due to its focus on stocks of very large companies, which generally underperformed smaller stocks until later in the reporting period.
What is the fund’s investment approach?
The fund seeks long-term growth of capital and income by investing in “blue chip” companies. We expect that capital growth will be accompanied by dividend income and growth of dividend income over time. When selecting investments, we look for higher quality companies when their shares are trading at substantial discounts to our estimates of their intrinsic value. We also look for companies with, among other things, leading market positions, competitive or technological advantages, high returns on equity and capital, good growth prospects, strong management and solid balance sheets. The fund seeks competitive after-tax returns by holding securities for the long term, which may give the fund greater tax efficiency.3
What other factors influenced the fund’s performance?
Over the opening months of the reporting period, robust economic growth and relatively low inflation helped support stock prices,
The Fund 3
| DISCUSSION OF FUND PERFORMANCE (continued) |
enabling them to weather adverse influences such as rising interest rates and volatile commodity prices. Many U.S. companies posted better-than-expected earnings, and investors continued to favor smaller, lower-quality companies that they believed had the potential to achieve high growth rates. As a result, large, well-established companies generally languished, and their valuations continued to fall well below historical averages.
In the spring of 2006, surging oil prices, tight labor markets and hawkish comments from members of the Federal Reserve Board (the “Fed”) caused investors to revise upward their interest-rate expectations, sparking sharp corrections in most sectors of the stock market. However, market conditions improved over the summer and early fall, when energy prices fell sharply, employment gains moderated and the Fed refrained from further interest rate hikes, leaving the overnight federal funds rate unchanged at 5.25% . As the economy slowed, investors became more risk-averse, and they began to turn toward higher-quality companies with track records of consistent earnings.
As valuations of very large companies fell to levels we considered compelling, we began to shift our focus toward stocks at the upper end of the market’s capitalization range.While these corporate giants began to produce better relative results late in the reporting period, they continued to lag their small- and midcap counterparts through August, causing the fund’s returns to trail the S&P 500 Index for the reporting period overall. In addition, a handful of the fund’s midcap holdings in the public education, software services and mortgage banking industries did not make as much progress in their turnarounds as we hoped, detracting from the fund’s relative performance.
These disappointments were largely offset by better results in other areas. Software giant Microsoft began to gain value with the introduction of major new products in key businesses. Large pharmaceutical companies, such as Pfizer and Merck & Co., rebounded from earlier weakness as litigation concerns eased and new product pipelines improved. Sporting goods retailer Cabela’s continued to impress investors with its loyal customers and expansion plans,and the stock now ranks as one of the fund’s larger holdings. Mortgage agency Fannie Mae rallied when interest rates
| 4 |
stabilized. And large integrated energy producers ExxonMobil and Chevron gained strength late in the reporting period as commodity prices moderated and investors turned to higher-quality companies.
What is the fund’s current strategy?
Recent economic data have indicated that the rate of U.S. economic growth has continued to moderate with relatively little risk of reces-sion.This suggests to us that the Fed is likely to neither raise nor reduce short-term interest rates over the next several months.Accordingly, we have maintained our focus on large companies in non-cyclical industries, including some of the world’s better known brand names. Many of these holdings remain attractively valued and derive a substantial amount of revenue from overseas markets, which could help protect the fund in the event of an unexpectedly severe U.S. economic slowdown. Of course, we are prepared to adjust our strategies as economic and market conditions evolve.
| December 15, 2006 |
| 1 | Total return includes reinvestment of dividends and any capital gains paid, and does not take into | |
| consideration the maximum initial sales charges in the case of Class A and Class T shares, or the | ||
| applicable contingent deferred sales charges imposed on redemptions in the case of Class B and | ||
| Class C shares. Had these charges been reflected, returns would have been lower. Past performance | ||
| is no guarantee of future results. Share price and investment return fluctuate such that upon | ||
| redemption, fund shares may be worth more or less than their original cost. Return figure provided | ||
| for Class J shares reflects the absorption of certain expenses by The Dreyfus Corporation pursuant | ||
| to an agreement in effect through February 25, 2007, at which time it may be extended, | ||
| terminated or modified. Had these expenses not been absorbed, the fund’s Class J shares return | ||
| would have been lower. Class J shares are closed to new investors. Return figures provided for | ||
| Class A, B, C, R, and T shares reflect the absorption of certain fund expenses by The Dreyfus | ||
| Corporation pursuant to an undertaking in effect that may be extended, terminated or modified at | ||
| any time. Had these expenses not been absorbed, the fund’s returns would have been lower. | ||
| 2 | SOURCE: LIPPER INC. — Reflects reinvestment of dividends and, where applicable, capital | |
| gain distributions.The Standard & Poor’s 500 Composite Stock Price Index is a widely accepted, | ||
| unmanaged index of U.S. stock market performance. | ||
| 3 | Achieving tax efficiency is not a part of the fund’s investment objective, and there can be no | |
| guarantee that the fund will achieve any particular level of taxable distributions in future years. In | ||
| periods when the manager has to sell significant amounts of securities (e.g., during periods of | ||
| significant net redemptions or changes in index components) funds can be expected to be less tax | ||
| efficient than during periods of more stable market conditions and asset flows. |
The Fund 5
| FUND PERFORMANCE |
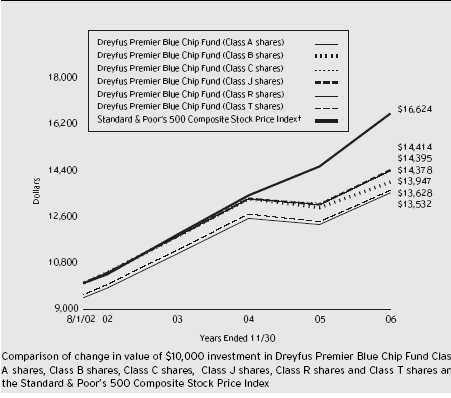
| † Source: Lipper Inc. Past performance is not predictive of future performance. The above graph compares a $10,000 investment made in Class A, Class B, Class C, Class R, Class T and Class J shares of Dreyfus Premier Blue Chip Fund on 8/1/02 (inception date) to a $10,000 investment made in the Standard & Poor’s 500 Composite Stock Price Index (the “Index”) on that date. All dividends and capital gain distributions are reinvested. As of the close of business on February 25, 2005, Dreyfus Premier Blue Chip Fund (the “fund”) commenced operations after all of the assets of another mutual fund advised by the fund's sub-investment adviser,Thompson Plumb Blue Chip Fund (“predecessor fund”), were transferred to the fund in exchange for Class J shares of the fund in a tax- free reorganization. Class J shares are closed to new investors. On that date, the fund began to offer Class A, B, C, R and T shares, which are subject to sales charges and additional expenses that the Class J shares are not.The performance figures for Class A, Class B, Class C, Class R and Class T shares in the line graph above include the performance of the predecessor fund from August 1, 2002, to February 25, 2005, and are adjusted to reflect the applicable sales loads and expenses. The fund’s performance shown in the line graph takes into account the maximum initial sales charges on Class A and Class T shares, the applicable contingent deferred sales charge on Class B shares and all other applicable fees and expenses on all classes.The S&P 500 Index is a widely accepted, unmanaged index of U.S. stock market performance. The index does not take into account charges, fees and other expenses. Further information relating to fund performance, including expense reimbursements, if applicable, is contained in the Financial Highlights section of the prospectus and elsewhere in this report. |
6
| Average Annual Total Returns as of 11/30/06 | ||||||
| Inception | From | |||||
| Date | 1 Year | Inception | ||||
| Class A shares | ||||||
| with maximum sales charge (5.75%) | 8/1/02 | 3.81% | 7.24% | |||
| without sales charge | 8/1/02 | 10.13% | 8.71% | |||
| Class B shares | ||||||
| with applicable redemption charge † | 8/1/02 | 5.30% | 7.99% | |||
| without redemption | 8/1/02 | 9.30% | 8.34% | |||
| Class C shares | ||||||
| with applicable redemption charge †† | 8/1/02 | 8.50% | 8.75% | |||
| without redemption | 8/1/02 | 9.50% | 8.75% | |||
| Class J shares | 8/1/02 | 10.30% | 8.81% | |||
| Class R shares | 8/1/02 | 10.24% | 8.78% | |||
| Class T shares | ||||||
| with applicable sales charge (4.5%) | 8/1/02 | 4.91% | 7.41% | |||
| without sales charge | 8/1/02 | 9.89% | 8.56% | |||
Past performance is not predictive of future performance.The fund’s performance shown in the graph and table does not reflect the deduction of taxes that a shareholder would pay on fund distributions or the redemption of fund shares.The performance figures for Class A, Class B, Class C, Class R and Class T shares shown in the table include the performance of the predecessor fund from August 1, 2002, to February 25, 2005, and are adjusted to reflect the applicable sales loads and expenses.
| † | The maximum contingent deferred sales charge for Class B shares is 4%. After six years Class B shares convert to | |
| Class A shares. | ||
| †† | The maximum contingent deferred sales charge for Class C shares is 1% for shares redeemed within one year of the | |
| date of purchase. |
The Fund 7
U N D E R S TA N D I N G YO U R F U N D ’ S E X P E N S E S ( U n a u d i t e d )
As a mutual fund investor, you pay ongoing expenses, such as management fees and other expenses. Using the information below, you can estimate how these expenses affect your investment and compare them with the expenses of other funds.You also may pay one-time transaction expenses, including sales charges (loads) and redemption fees, which are not shown in this section and would have resulted in higher total expenses. For more information, see your fund’s prospectus or talk to your financial adviser.
Review your fund’s expenses
The table below shows the expenses you would have paid on a $1,000 investment in Dreyfus Premier Blue Chip Fund from June 1, 2006 to November 30, 2006. It also shows how much a $1,000 investment would be worth at the close of the period, assuming actual returns and expenses.
Expenses and Value of a $1,000 Investment assuming actual returns for the six months ended November 30, 2006
| Class A | Class B | Class C | Class R | Class T | Class J | |||||||
| Expenses paid | ||||||||||||
| per $1,000 † | $ 7.50 | $ 11.38 | $ 11.38 | $ 6.20 | $ 8.43 | $ 6.04 | ||||||
| Ending value | ||||||||||||
| (after expenses) | $1,076.90 | $1,072.60 | $1,063.70 | $1,077.50 | $1,075.50 | $1,078.40 |
COMPARING YOUR FUND’S EXPENSES WITH THOSE OF OTHER FUNDS (Unaudited)
Using the SEC’s method to compare expenses
The Securities and Exchange Commission (SEC) has established guidelines to help investors assess fund expenses. Per these guidelines, the table below shows your fund’s expenses based on a $1,000 investment, assuming a hypothetical 5% annualized return. You can use this information to compare the ongoing expenses (but not transaction expenses or total cost) of investing in the fund with those of other funds.All mutual fund shareholder reports will provide this information to help you make this comparison. Please note that you cannot use this information to estimate your actual ending account balance and expenses paid during the period.
Expenses and Value of a $1,000 Investment assuming a hypothetical 5% annualized return for the six months ended November 30, 2006
| Class A | Class B | Class C | Class R | Class T | Class J | |||||||
| Expenses paid | ||||||||||||
| per $1,000 † | $ 7.28 | $ 11.06 | $ 11.11 | $ 6.02 | $ 8.19 | $ 5.87 | ||||||
| Ending value | ||||||||||||
| (after expenses) | $1,017.85 | $1,014.09 | $1,014.04 | $1,019.10 | $1,016.95 | $1,019.25 |
† Expenses are equal to the fund’s annualized expense ratio of 1.44% for Class A, 2.19% for Class B, 2.20% for Class C, 1.19% for Class R, 1.62% for Class T and 1.16% Class J; multiplied by the average account value over the period, multiplied by 183/365 (to reflect the one-half year period).
| 8 |
| STATEMENT OF INVESTMENTS November 30, 2006 |
| Common Stocks—99.8% | Shares | Value ($) | ||||
| Consumer Discretionary—22.5% | ||||||
| Apollo Group, Cl. A | 7,000 a | 271,530 | ||||
| Cabela’s | 35,000 a | 847,700 | ||||
| Career Education | 35,100 a | 886,275 | ||||
| Corinthian Colleges | 95,000 a | 1,225,500 | ||||
| Cost Plus | 26,000 a | 280,020 | ||||
| Home Depot | 12,000 | 455,640 | ||||
| Interpublic Group of Cos. | 70,000 a,b | 837,900 | ||||
| Kohl’s | 5,600 a | 389,760 | ||||
| Viacom, Cl. B | 6,400 a | 240,064 | ||||
| Wyndham Worldwide | 7,440 a | 236,146 | ||||
| 5,670,535 | ||||||
| Consumer Staples—8.2% | ||||||
| Coca-Cola | 21,500 | 1,006,845 | ||||
| Nestle, ADR | 3,500 | 308,980 | ||||
| Wal-Mart Stores | 16,000 | 737,600 | ||||
| 2,053,425 | ||||||
| Energy—2.2% | ||||||
| Chevron | 3,800 | 274,816 | ||||
| Exxon Mobil | 3,500 | 268,835 | ||||
| 543,651 | ||||||
| Financial—23.3% | ||||||
| American International Group | 15,900 | 1,118,088 | ||||
| Bank of America | 9,000 | 484,650 | ||||
| Berkshire Hathaway, Cl. B | 290 a | 1,030,950 | ||||
| Citigroup | 5,000 | 247,950 | ||||
| Doral Financial | 57,600 | 233,280 | ||||
| Fannie Mae | 15,000 | 855,450 | ||||
| Freddie Mac | 3,000 | 201,480 | ||||
| JPMorgan Chase & Co. | 8,000 | 370,240 | ||||
| Marsh & McLennan Cos. | 34,500 | 1,083,990 | ||||
| Realogy | 9,300 a | 242,637 | ||||
| 5,868,715 |
The Fund 9
| STATEMENT OF INVESTMENTS (continued) |
| Common Stocks (continued) | Shares | Value ($) | ||
| Health Care—19.2% | ||||
| Bausch & Lomb | 11,900 | 576,198 | ||
| Cardinal Health | 12,700 | 820,674 | ||
| Johnson & Johnson | 8,000 | 527,280 | ||
| Medtronic | 6,300 | 328,419 | ||
| Merck & Co. | 10,000 | 445,100 | ||
| Pfizer | 44,800 | 1,231,552 | ||
| Wright Medical Group | 16,300 a | 390,059 | ||
| Wyeth | 6,300 | 304,164 | ||
| Zimmer Holdings | 3,000 a | 218,880 | ||
| 4,842,326 | ||||
| Industrial—4.8% | ||||
| Avis Budget Group | 3,720 | 76,111 | ||
| General Electric | 8,800 | 310,464 | ||
| Tyco International | 27,000 | 817,830 | ||
| 1,204,405 | ||||
| Information Technology—19.6% | ||||
| BISYS Group | 61,600 a | 738,584 | ||
| Dell | 13,000 a | 354,120 | ||
| Electronic Data Systems | 29,800 | 808,772 | ||
| First Data | 13,000 | 328,250 | ||
| Hewitt Associates, Cl. A | 31,400 a | 797,560 | ||
| Microsoft | 55,000 | 1,613,150 | ||
| Western Union | 13,000 a | 296,400 | ||
| 4,936,836 | ||||
| Total Common Stocks | ||||
| (cost $21,940,809) | 25,119,893 |
| 10 |
| Investment of Cash Collateral | ||||
| for Securities Loaned—3.6% | Shares | Value ($) | ||
| Registered Investment Company; | ||||
| Dreyfus Institutional Cash | ||||
| Advantage Plus Fund | ||||
| (cost $910,000) | 910,000 c | 910,000 | ||
| Total Investments (cost $22,850,809) | 103.4% | 26,029,893 | ||
| Liabilities, Less Cash and Receivables | (3.4%) | (849,782) | ||
| Net Assets | 100.0% | 25,180,111 |
| ADR—American Depository Receipts |
| a Non-income producing security. |
| b All or a portion of these securities are on loan. At November 30, 2006, the total market value of the fund’s securities |
| on loan is $837,900 and the total market value of the collateral held by the fund is $910,000. |
| c Investment in affiliated money market mutual fund. |
| Portfolio Summary | (Unaudited) † | |||||
| Value (%) | Value (%) | |||||
| Financial | 23.3 | Industrial | 4.8 | |||
| Consumer Discretionary | 22.5 | Money Market Investment | 3.6 | |||
| Information Technology | 19.6 | Energy | 2.2 | |||
| Health Care | 19.2 | |||||
| Consumer Staples | 8.2 | 103.4 | ||||
| † Based on net assets. | ||||||
| See notes to financial statements. | ||||||
The Fund 11
STATEMENT OF ASSETS AND LIABILITIES
November 30, 2006
| Cost | Value | |||||||||||
| Assets ($): | ||||||||||||
| Investments in securities—See Statement of | ||||||||||||
| Investments (including securities on loan, | ||||||||||||
| valued at $837,900)—Note 1(b): | ||||||||||||
| Unaffiliated issuers | 21,940,809 | 25,119,893 | ||||||||||
| Affiliated issuers | 910,000 | 910,000 | ||||||||||
| Cash | 55,185 | |||||||||||
| Dividends and interest receivable | 46,155 | |||||||||||
| Receivable for shares of Beneficial Interest subscribed | 9,678 | |||||||||||
| Prepaid expenses | 20,447 | |||||||||||
| 26,161,358 | ||||||||||||
| Liabilities ($): | ||||||||||||
| Due to The Dreyfus Corporation and affiliates—Note 3(c) | 10,569 | |||||||||||
| Liability for securities on loan—Note 1(b) | 910,000 | |||||||||||
| Payable for shares of Beneficial Interest redeemed | 4,320 | |||||||||||
| Interest payable—Note 2 | 93 | |||||||||||
| Accrued expenses | 56,265 | |||||||||||
| 981,247 | ||||||||||||
| Net Assets ($) | 25,180,111 | |||||||||||
| Composition of Net Assets ($): | ||||||||||||
| Paid-in capital | 21,223,090 | |||||||||||
| Accumulated undistributed investment income—net | 55,283 | |||||||||||
| Accumulated net realized gain (loss) on investments | 722,654 | |||||||||||
| Accumulated net unrealized appreciation | ||||||||||||
| (depreciation) on investments | 3,179,084 | |||||||||||
| Net Assets ($) | 25,180,111 | |||||||||||
| Net Asset Value Per Share | ||||||||||||
| Class A | Class B | Class C | Class R | Class T | Class J | |||||||
| Net Assets ($) | 939,364 | 27,259 | 21,920 | 30,260 | 1,060.24 | 24,160,248 | ||||||
| Shares Outstanding | 71,329 | 2,097 | 1,661 | 2,291 | 80.890 | 1,828,922 | ||||||
| Net Asset Value | ||||||||||||
| Per Share ($) | 13.17 | 13.00 | 13.20 | 13.21 | 13.11 | 13.21 | ||||||
| See notes to financial statements. |
| 12 |
| STATEMENT OF OPERATIONS Year Ended November 30, 2006 |
| Investment Income ($): | ||
| Income: | ||
| Dividends (net of $2,594 foreign taxes withheld at source): | ||
| Unaffiliated issuers | 342,963 | |
| Affiliated issuers | 3,492 | |
| Income from securities lending | 29,168 | |
| Total Income | 375,623 | |
| Expenses: | ||
| Management fee—Note 3(a) | 196,439 | |
| Registration fees | 84,653 | |
| Auditing fees | 48,550 | |
| Prospectus and shareholders’ reports | 19,159 | |
| Shareholder servicing costs—Note 3(c) | 11,478 | |
| Custodian fees—Note 3(c) | 3,950 | |
| Interest expense—Note 2 | 1,709 | |
| Legal fees | 1,556 | |
| Trustees’ fees and expenses—Note 3(d) | 1,433 | |
| Distribution fees—Note 3(b) | 529 | |
| Loan commitment fees—Note 2 | 519 | |
| Miscellaneous | 11,207 | |
| Total Expenses | 381,182 | |
| Less—reduction in expenses due to undertaking—Note 3(a) | (62,713) | |
| Net Expenses | 318,469 | |
| Investment Income—Net | 57,154 | |
| Realized and Unrealized Gain (Loss) on Investments—Note 4 ($): | ||
| Net realized gain (loss) on investments | 781,893 | |
| Net change in unrealized appreciation (depreciation) on investments | 1,675,772 | |
| Net Realized and Unrealized Gain (Loss) on Investments | 2,457,665 | |
| Net Increase in Net Assets Resulting from Operations | 2,514,819 | |
| See notes to financial statements. |
The Fund 13
STATEMENT OF CHANGES IN NET ASSETS
| Year Ended November 30, | ||||
| 2006 | 2005 a | |||
| Operations ($): | ||||
| Investment income—net | 57,154 | 126,085 | ||
| Net realized gain (loss) on investments | 781,893 | 1,073,101 | ||
| Net change in unrealized appreciation | ||||
| (depreciation) on investments | 1,675,772 | (1,806,313) | ||
| Net Increase (Decrease) in Net Assets | ||||
| Resulting from Operations | 2,514,819 | (607,127) | ||
| Dividends to Shareholders from ($):�� | ||||
| Investment income—net: | ||||
| Class A shares | (2,286) | — | ||
| Class B shares | (48) | — | ||
| Class C shares | (71) | — | ||
| Class J shares | (119,610) | (201,887) | ||
| Class R shares | (3) | — | ||
| Class T shares | (2) | — | ||
| Net realized gain on investments: | ||||
| Class A shares | (27,039) | — | ||
| Class B shares | (1,536) | — | ||
| Class C shares | (804) | — | ||
| Class J shares | (1,094,548) | (864,523) | ||
| Class R shares | (42) | — | ||
| Class T shares | (38) | — | ||
| Total Dividends | (1,246,027) | (1,066,410) | ||
| Beneficial Interest Transactions ($): | ||||
| Net proceeds from shares sold: | ||||
| Class A shares | 532,515 | 675,769 | ||
| Class B shares | 17,014 | 39,932 | ||
| Class C shares | 12,000 | 20,020 | ||
| Class J shares | 1,150,687 | 6,719,241 | ||
| Class R shares | 38,208 | 1,096 | ||
| Class T shares | — | 1,000 | ||
| 14 |
| Year Ended November 30, | ||||
| 2006 | 2005 a | |||
| Beneficial Interest Transactions ($) (continued): | ||||
| Dividends reinvested: | ||||
| Class A shares | 29,325 | — | ||
| Class B shares | 1,473 | — | ||
| Class C shares | 41 | — | ||
| Class J shares | 1,211,524 | 982,799 | ||
| Class R shares | 45 | — | ||
| Class T shares | 40 | — | ||
| Cost of shares redeemed: | ||||
| Class A shares | (309,353) | (24,127) | ||
| Class B shares | (31,850) | — | ||
| Class C shares | (12,801) | — | ||
| Class J shares | (7,994,043) | (6,684,159) | ||
| Class R shares | (9,634) | — | ||
| Increase (Decrease) in Net Assets | ||||
| from Beneficial Interest Transactions | (5,364,809) | 1,731,571 | ||
| Total Increase (Decrease) in Net Assets | (4,096,017) | 58,034 | ||
| Net Assets ($): | ||||
| Beginning of Period | 29,276,128 | 29,218,094 | ||
| End of Period | 25,180,111 | 29,276,128 | ||
| Undistributed investment income—net | 55,283 | 120,149 | ||
The Fund 15
| STATEMENT OF CHANGES IN NET ASSETS (continued) |
| Year Ended November 30, | ||||
| 2006 | 2005 a | |||
| Capital Share Transactions: | ||||
| Class A b | ||||
| Shares sold | 42,334 | 53,675 | ||
| Shares issued for dividends reinvested | 2,432 | — | ||
| Shares redeemed | (25,214) | (1,898) | ||
| Net Increase (Decrease) in Shares Outstanding | 19,552 | 51,777 | ||
| Class B b | ||||
| Shares sold | 1,388 | 3,168 | ||
| Shares issued for dividends reinvested | 123 | — | ||
| Shares redeemed | (2,582) | — | ||
| Net Increase (Decrease) in Shares Outstanding | (1,071) | 3,168 | ||
| Class C | ||||
| Shares sold | 966 | 1,657 | ||
| Shares issued for dividends reinvested | 3 | — | ||
| Shares redeemed | (965) | — | ||
| Net Increase (Decrease) in Shares Outstanding | 4 | 1,657 | ||
| Class R | ||||
| Shares sold | 3,033 | 85 | ||
| Shares issued for dividends reinvested | 4 | — | ||
| Shares redeemed | (831) | — | ||
| Net Increase (Decrease) in Shares Outstanding | 2,206 | 85 | ||
| Class T | ||||
| Shares sold | — | 78 | ||
| Shares issued for dividends reinvested | 3 | — | ||
| Shares redeemed | — | — | ||
| Net Increase (Decrease) in Shares Outstanding | 3 | 78 | ||
| Class J | ||||
| Shares sold | 92,804 | 519,276 | ||
| Shares issued for dividends reinvested | 100,292 | 74,966 | ||
| Shares redeemed | (647,558) | (525,621) | ||
| Net Increase (Decrease) in Shares Outstanding | (454,462) | 68,621 | ||
| a | The fund commenced offering six classes of shares on February 25, 2005.The existing shares were redesignated | |
| Class J shares and the fund added Class A, Class B, Class C, Class R and Class T shares. | ||
| b | During the period ended November 30, 2006, 558 Class B shares representing $6,940 were automatically | |
| converted to 554 Class A shares. | ||
| See notes to financial statements. | ||
| 16 |
| FINANCIAL HIGHLIGHTS |
The following tables describe the performance for each share class for the fiscal periods indicated.All information (except portfolio turnover rate) reflects financial results for a single fund share.Total return shows how much your investment in the fund would have increased (or decreased) during each period, assuming you had reinvested all dividends and distributions.These figures have been derived from the fund’s financial statements.
| Year Ended November 30 | ||||
| Class A Shares | 2006 | 2005 a | ||
| Per Share Data ($): | ||||
| Net asset value, beginning of period | 12.48 | 12.89 | ||
| Investment Operations: | ||||
| Investment income—net b | .01 | .02 | ||
| Net realized and unrealized | ||||
| gain (loss) on investments | 1.21 | (.43) | ||
| Total from Investment Operations | 1.22 | (.41) | ||
| Distributions: | ||||
| Dividends from investment income—net | (.04) | — | ||
| Dividends from net realized gain on investments | (.49) | — | ||
| Total Distributions | (.53) | — | ||
| Net asset value, end of period | 13.17 | 12.48 | ||
| Total Return (%) d | 10.13 | (3.18)c | ||
| Ratios/Supplemental Data (%): | ||||
| Ratio of total expenses to average net assets | 1.71 | 1.54c | ||
| Ratio of net expenses to average net assets | 1.37 | 1.12c | ||
| Ratio of net investment income | ||||
| to average net assets | .10 | .15c | ||
| Portfolio Turnover Rate | 23.40 | 37.31 | ||
| Net Assets, end of period ($ x 1,000) | 939 | 646 | ||
| a | From February 25, 2005 (commencement of operations) through November 30, 2005. | |
| b | Based on average shares outstanding at each month end. | |
| c | Not annualized. | |
| d | Exclusive of sales charge. | |
| See notes to financial statements. | ||
The Fund 17
| FINANCIAL HIGHLIGHTS (continued) |
| Year Ended November 30 | ||||
| Class B Shares | 2006 | 2005 a | ||
| Per Share Data ($): | ||||
| Net asset value, beginning of period | 12.39 | 12.89 | ||
| Investment Operations: | ||||
| Investment (loss)—net b | (.09) | (.04) | ||
| Net realized and unrealized | ||||
| gain (loss) on investments | 1.21 | (.46) | ||
| Total from Investment Operations | 1.12 | (.50) | ||
| Distributions: | ||||
| Dividends from investment income—net | (.02) | — | ||
| Dividends from net realized | ||||
| gain on investments | (.49) | — | ||
| Total Distributions | (.51) | — | ||
| Net asset value, end of period | 13.00 | 12.39 | ||
| Total Return (%) d | 9.30 | (3.88)c | ||
| Ratios/Supplemental Data (%): | ||||
| Ratio of total expenses to average net assets | 2.80 | 2.45c | ||
| Ratio of net expenses to average net assets | 2.13 | 1.73c | ||
| Ratio of net investment (loss) | ||||
| to average net assets | (.69) | (.39)c | ||
| Portfolio Turnover Rate | 23.40 | 37.31 | ||
| Net Assets, end of period ($ x 1,000) | 27 | 39 | ||
| a | From February 25, 2005 (commencement of operations) through November 30, 2005. | |
| b | Based on average shares outstanding at each month end. | |
| c | Not annualized. | |
| d | Exclusive of sales charge. | |
| See notes to financial statements. | ||
| 18 |
| Year Ended November 30 | ||||
| Class C Shares | 2006 | 2005 a | ||
| Per Share Data ($): | ||||
| Net asset value, beginning of period | 12.57 | 12.89 | ||
| Investment Operations: | ||||
| Investment income (loss)—net b | (.09) | .02 | ||
| Net realized and unrealized | ||||
| gain (loss) on investments | 1.25 | (.34) | ||
| Total from Investment Operations | 1.16 | (.32) | ||
| Distributions: | ||||
| Dividends from investment income—net | (.04) | — | ||
| Dividends from net realized | ||||
| gain on investments | (.49) | — | ||
| Total Distributions | (.53) | — | ||
| Net asset value, end of period | 13.20 | 12.57 | ||
| Total Return (%) d | 9.50 | (2.48)c | ||
| Ratios/Supplemental Data (%): | ||||
| Ratio of total expenses to average net assets | 2.62 | 2.99c | ||
| Ratio of net expenses to average net assets | 2.21 | 1.39c | ||
| Ratio of net investment income (loss) | ||||
| to average net assets | (.75) | .29c | ||
| Portfolio Turnover Rate | 23.40 | 37.31 | ||
| Net Assets, end of period ($ x 1,000) | 22 | 21 | ||
| a | From February 25, 2005 (commencement of operations) through November 30, 2005. | |
| b | Based on average shares outstanding at each month end. | |
| c | Not annualized. | |
| d | Exclusive of sales charge. | |
| See notes to financial statements. | ||
The Fund 19
| FINANCIAL HIGHLIGHTS (continued) |
| Year Ended November 30 | ||||
| Class R Shares | 2006 | 2005 a | ||
| Per Share Data ($): | ||||
| Net asset value, beginning of period | 12.50 | 12.89 | ||
| Investment Operations: | ||||
| Investment income—net b | .06 | .03 | ||
| Net realized and unrealized | ||||
| gain (loss) on investments | 1.18 | (.42) | ||
| Total from Investment Operations | 1.24 | (.39) | ||
| Distributions: | ||||
| Dividends from investment income—net | (.04) | — | ||
| Dividends from net realized | ||||
| gain on investments | (.49) | — | ||
| Total Distributions | (.53) | — | ||
| Net asset value, end of period | 13.21 | 12.50 | ||
| Total Return (%) | 10.24 | (3.03)c | ||
| Ratios/Supplemental Data (%): | ||||
| Ratio of total expenses to average net assets | 2.19 | 4.35c | ||
| Ratio of net expenses to average net assets | 1.20 | .99c | ||
| Ratio of net investment income | ||||
| to average net assets | .49 | .25c | ||
| Portfolio Turnover Rate | 23.40 | 37.31 | ||
| Net Assets, end of period ($ x 1,000) | 30 | 1 | ||
| a | From February 25, 2005 (commencement of operations) through November 30, 2005. | |
| b | Based on average shares outstanding at each month end. | |
| c | Not annualized. | |
| See notes to financial statements. | ||
20
| Year Ended November 30 | ||||
| Class T Shares | 2006 | 2005 a | ||
| Per Share Data ($): | ||||
| Net asset value, beginning of period | 12.44 | 12.89 | ||
| Investment Operations: | ||||
| Investment (loss)—net b | (.02) | (.03) | ||
| Net realized and unrealized | ||||
| gain (loss) on investments | 1.21 | (.42) | ||
| Total from Investment Operations | 1.19 | (.45) | ||
| Distributions: | ||||
| Dividends from investment income—net | (.03) | — | ||
| Dividends from net realized | ||||
| gain on investments | (.49) | — | ||
| Total Distributions | (.52) | — | ||
| Net asset value, end of period | 13.11 | 12.44 | ||
| Total Return (%) d | 9.89 | (3.57)c | ||
| Ratios/Supplemental Data (%): | ||||
| Ratio of total expenses to average net assets | 3.31 | 2.85c | ||
| Ratio of net expenses to average net assets | 1.59 | 1.50c | ||
| Ratio of net investment (loss) | ||||
| to average net assets | (.12) | (.26)c | ||
| Portfolio Turnover Rate | 23.40 | 37.31 | ||
| Net Assets, end of period ($ X 1,000) | 1 | 1 | ||
| a | From February 25, 2005 (commencement of operations) through November 30, 2005. | |
| b | Based on average shares outstanding at each month end. | |
| c | Not annualized. | |
| d | Exclusive of sales charge. | |
| See notes to financial statements. | ||
The Fund 21
| FINANCIAL HIGHLIGHTS (continued) |
| Year Ended November 30, | ||||||||||
| Class J Shares | 2006 | 2005 a | 2004 | 2003 | 2002 b | |||||
| Per Share Data ($): | ||||||||||
| Net asset value, beginning of period | 12.51 | 13.19 | 11.79 | 10.40 | 10.00 | |||||
| Investment Operations: | ||||||||||
| Investment income—net | .03c | .05c | .10 | .05 | .03 | |||||
| Net realized and unrealized | ||||||||||
| gain (loss) on investments | 1.21 | (.25) | 1.36 | 1.37 | .37 | |||||
| Total from Investment Operations | 1.24 | (.20) | 1.46 | 1.42 | .40 | |||||
| Distributions: | ||||||||||
| Dividends from investment income—net | (.05) | (.09) | (.06) | (.03) | — | |||||
| Dividends from net realized | ||||||||||
| gain on investments | (.49) | (.39) | — | — | — | |||||
| Total Distributions | (.54) | (.48) | (.06) | (.03) | — | |||||
| Net asset value, end of period | 13.21 | 12.51 | 13.19 | 11.79 | 10.40 | |||||
| Total Return (%) | 10.30 | (1.72) | 12.40 | 13.74 | 4.00d | |||||
| Ratios/Supplemental Data (%): | ||||||||||
| Ratio of total expenses | ||||||||||
| to average net assets | 1.44 | 1.47 | 1.70 | 2.18 | 3.36e | |||||
| Ratio of net expenses | ||||||||||
| to average net assets | 1.20 | 1.19 | 1.20 | 1.20 | 1.20e | |||||
| Ratio of net investment income | ||||||||||
| to average net assets | .23 | .40 | .88 | .76 | 1.02e | |||||
| Portfolio Turnover Rate | 23.40 | 37.31 | 23.64 | 21.30 | 5.98d | |||||
| Net Assets, end of period ($ x 1,000) | 24,160 | 28,568 | 29,200 | 16,100 | 6,100 | |||||
| a | The fund commenced offering six classes of shares on February 25, 2005.The existing shares were redesignated | |
| Class J shares. | ||
| b | From August 1, 2002 (commencement of operations) through November 30, 2002. | |
| c | Based on average shares outstanding at each month end. | |
| d | Not annualized. | |
| e | Annualized. | |
| See notes to financial statements. | ||
| 22 |
NOTES TO FINANCIAL STATEMENTS
NOTE 1—Significant Accounting Policies:
Dreyfus Premier Blue Chip Fund (the “fund”) is a separate diversified series of Dreyfus Premier Manager Funds II (the “Company”), which is registered under the Investment Company Act of 1940, as amended (the “Act”), as an open-end management investment company and operates as a series company currently offering three series, including the fund.The fund’s investment objective seeks a long-term growth of capital and income.The Dreyfus Corporation (“Dreyfus”) serves as the fund’s investment adviser. Dreyfus is a wholly-owned subsidiary of Mellon Financial Corporation (“Mellon Financial”).Wisconsin Capital Management, Inc. (“Wisconsin Capital”), serves as the fund’s sub-investment adviser.
On December 4, 2006, Mellon Financial and The Bank of New York Company, Inc. announced that they had entered into a definitive agreement to merge. The new company will be called The Bank of New York Mellon Corporation. As part of this transaction, Dreyfus would become a wholly-owned subsidiary of The Bank of New York Mellon Corporation.The transaction is subject to certain regulatory approvals and the approval of The Bank of New York Company, Inc.’s and Mellon Financial’s shareholders, as well as other customary conditions to closing. Subject to such approvals and the satisfaction of the other conditions, Mellon Financial and The Bank of New York Company, Inc. expect the transaction to be completed in the third quarter of 2007.
On February 25, 2005, pursuant to an Agreement and Plan of Reorganization previously approved by the Company’s Board, all of the assets, subject to the liabilities, of Thompson Plumb Blue Chip Fund, a series of Thompson Plumb Funds, Inc., were transferred to Dreyfus Premier Blue Chip Fund in exchange for shares of Beneficial Interest of Dreyfus Premier Blue Chip Fund’s Class J shares of equal value on the close of business on February 25, 2005. Holders of Thompson Plumb Blue Chip Fund received Dreyfus Premier Blue Chip Fund, Class J shares, in an amount equal to the aggregate net asset value of their investment in Thompson Plumb Blue Chip Fund
The Fund 23
| NOTES TO FINANCIAL STATEMENTS (continued) |
at the time of the exchange. The net asset value of Dreyfus Premier Blue Chip Fund’s Class J shares on February 25, 2005, before and after the reorganization, was $12.89 per share and a total of 2,503,409 Class J shares representing net assets of $32,260,194 (including $2,968,698 net unrealized appreciation on investments) were issued to Thompson Plumb Blue Chip Fund’s shareholders in the exchange.The exchange was a tax-free event to shareholders.The fund is designed to have the same investment objective and substantially similar investment policies and strategies as the Thompson Plumb Blue Chip Fund. Class J shares are closed to new investors.
Dreyfus Service Corporation (the “Distributor”), a wholly-owned subsidiary of Dreyfus, is the Distributor of the fund’s shares. The fund is authorized to issue an unlimited number of $.001 par value shares of Beneficial Interest in each of the following classes of shares:Class A,Class B, Class C, Class R, Class T and Class J shares. Class A and Class T shares are subject to a sales charge imposed at the time of purchase. Class B shares are subject to a contingent deferred sales charge (“CDSC”) imposed on Class B share redemptions made within six years of purchase and automatically convert to Class A shares after six years. Class C shares are subject to a CDSC imposed on Class C shares redeemed within one year of purchase and Class R shares are sold at net asset value per share only to institutional investors. Class J shares were created in connection with the reorganization of the Thompson Plumb Blue Chip Fund and are closed to new investors. Other differences between the classes include the services offered to and the expenses borne by each class. Income, expenses (other than expenses attributable to a specific class), and realized and unrealized gains or losses on investments are allocated to each class of shares based on its relative net assets.
Effective March 1, 2006, Class A shares of the fund may be purchased at net asset value (“NAV”) without payment of a sales charge:
- By qualified investors who (i) purchase Class A shares directly through the Distributor, and (ii) have, or whose spouse or minor children have, beneficially owned shares and continuously maintained an open account directly through the Distributor in a Dreyfus-managed fund,
| 24 |
- including the fund, or a Founders Asset Management LLC (“Founders”) fund since on or before February 28, 2006. Founders is a wholly-owned subsidiary of the Distributor.
- With the cash proceeds from an investor’s exercise of employment- related stock options, whether invested in the fund directly or indi- rectly through an exchange from a Dreyfus-managed money market fund, provided that the proceeds are processed through an entity that has entered into an agreement with the Distributor specifically relat- ing to processing stock options. Upon establishing the account in the fund or the Dreyfus-managed money market fund, the investor and the investor’s spouse and minor children become eligible to purchase Class A shares of the fund at NAV, whether or not using the proceeds of the employment-related stock options.
- By members of qualified affinity groups who purchase Class A shares directly through the Distributor, provided that the qualified affinity group has entered into an affinity agreement with the Distributor.
Effective March 1, 2006, Class A and Class T shares of the fund may be purchased at NAV without payment of a sales charge:
- For Dreyfus-sponsored IRA “Rollover Accounts” with the distrib- ution proceeds from qualified and non-qualified retirement plans or a Dreyfus-sponsored 403(b)(7) plan, provided that, in the case of a qualified or non-qualified retirement plan, the rollover is processed through an entity that has entered into an agreement with the Distributor specifically relating to processing rollovers. Upon estab- lishing the Dreyfus-sponsored IRA rollover account in the fund, the shareholder becomes eligible to make subsequent purchases of Class A or Class T shares of the fund at NAV in such account.
Effective June 1, 2006, the fund no longer offers Class B shares, except in connection with dividend reinvestment and permitted exchanges of Class B shares.
As of November 30, 2006, MBC Investments Corp., an indirect subsidiary of Mellon Financial, held 81 shares of the following Class T shares of the fund.
The Fund 25
| NOTES TO FINANCIAL STATEMENTS (continued) |
The Company accounts separately for the assets, liabilities and operations of each series. Expenses directly attributable to each series are charged to that series’ operations; expenses which are applicable to all series are allocated among them on a pro rata basis.
The fund’s financial statements are prepared in accordance with U.S. generally accepted accounting principles, which requires the use of management estimates and assumptions. Actual results could differ from those estimates.
In the normal course of business, the fund may enter into contracts and agreements that contain a variety of representations and warranties, which provide general indemnifications.The maximum exposure to the fund under these arrangements is unknown, as this would involve future claims that may be made against the fund that have not yet occurred. However, based on experience, the fund expects the risks of loss to be remote.
(a) Portfolio valuation: Investments in securities are valued at the last sales price on the securities exchange or national securities market on which such securities are primarily traded. Securities listed on the National Market System for which market quotations are available are, valued at the official closing price or, if there is no official closing price that day, at the last sales price. Securities not listed on an exchange or the national securities market, or securities for which there were no transactions, are valued at the average of the most recent bid and asked prices, except for open short positions, where the asked price is used for valuation purposes. Bid price is used when no asked price is available. Investments in registered investment companies are valued at their NAV.When market quotations or official closing prices are not readily available, or are determined not to reflect accurately fair value, such as when the value of a security has been significantly affected by events after the close of the exchange or market on which the security is principally traded (for example, a foreign exchange or market), but before the fund calculates its NAV, the fund may value these investments at fair
| 26 |
value as determined in accordance with the procedures approved by the Board of Trustees. Fair valuing of securities may be determined with the assistance of a pricing service using calculations based on indices of domestic securities and other appropriate indicators, such as prices of relevant ADR’s and futures contracts. For other securities that are fair valued by the Board of Trustees, certain factors may be considered such as: fundamental analytical data, the nature and duration of restrictions on disposition, an evaluation of the forces that influence the market in which the securities are purchased and sold and public trading in similar securities of the issuer or comparable issuers. Financial futures are valued at the last sales price on the principal exchange.
On September 20, 2006, the Financial Accounting Standards Board (FASB) released Statement of Financial Accounting Standards No. 157 “Fair Value Measurements” (“FAS 157”). FAS 157 establishes an authoritative definition of fair value, sets out a framework for measuring fair value, and requires additional disclosures about fair-value measurements. The application of FAS 157 is required for fiscal years beginning after November 15, 2007 and interim periods within those fiscal years. Management does not believe that the application of this standard will have a material impact on the financial statements of the fund.
(b) Securities transactions and investment income: Securities transactions are recorded on a trade date basis. Realized gain and loss from securities transactions are recorded on the identified cost basis. Dividend income is recognized on the ex-dividend date and interest income is determined on the basis of coupon interest accrued, adjusted for accretion of discount and amortization of premium on debt securities.
The fund has an arrangement with the custodian bank, Mellon Bank, N.A., whereby the fund receives earnings credits from the custodian when positive cash balances are maintained,which are used to offset custody fees. For financial reporting purposes, the fund includes net earnings credits, if any, as an expense offset in the Statement of Operations.
The Fund 27
| NOTES TO FINANCIAL STATEMENTS (continued) |
Pursuant to a securities lending agreement with Mellon Global Securities Lending, an affiliate of Dreyfus or the Manager, the fund may lend securities to qualified institutions. It is the fund’s policy that at originations all loans are secured by collateral of at least 102% of the value of U.S. securities loaned and 105% of the value of foreign securities loaned. It is the fund’s policy that collateral equivalent to at least 100% of the market value of securities on loan is maintained at all times. Cash collateral is invested in certain money market mutual funds managed by the Manager.The fund is entitled to receive all income on securities loaned, in addition to income earned as a result of the lending transaction. Although each security loaned is fully collateralized, the fund bears the risk of delay in recovery of, or loss of rights in, the securities loaned should a borrower fail to return the securities in a timely manner. During the period ended November 30, 2006, pursuant to the securities lending agreement, Mellon Bank, N.A. earned revenues of $12,501 from the fund.
(c) Affiliated issuers: Investments in other investment companies advised by Dreyfus are defined as “affiliated” in the Act.
(d) Dividends to shareholders: Dividends are recorded on the ex-dividend date. Dividends from investment income-net and dividends from net realized capital gain, if any, are normally declared and paid annually, but the fund may make distributions on a more frequent basis to comply with the distribution requirements of the Internal Revenue Code of 1986, as amended (the “Code”).To the extent that net realized capital gain can be offset by capital loss carryovers, if any, it is the policy of the fund not to distribute such gain. Income and capital gain distributions are determined in accordance with income tax regulations, which may differ from U.S. generally accepted accounting principles.
(e) Federal income taxes: It is the policy of the fund to continue to qualify as a regulated investment company, if such qualification is in the best interests of its shareholders, by complying with the applicable provisions of the Code, and to make distributions of taxable income sufficient to relieve it from substantially all federal income and excise taxes.
| 28 |
In July 2006, the Financial Accounting Standards Board issued Interpretation No. 48,“Accounting for Uncertainty in Income Taxes -an Interpretation of FASB Statement No. 109” (the “Interpretation”). The Interpretation establishes for all entities, including pass-through entities such as the Fund, a minimum threshold for financial statement recognition of the benefit of positions taken in filing tax returns (including whether an entity is taxable in a particular jurisdiction), and requires certain expanded tax disclosures. Adoption of FIN 48 is required for fiscal years beginning after December 15, 2006 and is to be applied to all open tax years as of the effective date. Management does not believe that the application of this standard will have a material impact on the financial statements of the fund.
At November 30, 2006, the components of accumulated earnings on a tax basis were as follows: undistributed ordinary income $158,508, undistributed capital gains $702,919 and unrealized appreciation $3,095,594.
The tax character of distributions paid to shareholders during the fiscal periods ended November 30, 2006 and November 30, 2005, were as follows: ordinary income $154,465 and $238,002 and long-term capital gains $1,091,562 and $828,408, respectively.
| NOTE 2—Bank Line of Credit: |
The fund participates with other Dreyfus-managed funds in a $350 million redemption credit facility (the “Facility”) to be utilized for temporary or emergency purposes, including the financing of redemptions. In connection therewith, the fund has agreed to pay commitment fees on its pro rata portion of the Facility. Interest is charged to the fund based on prevailing market rates in effect at the time of borrowing.
The average daily amount of borrowings outstanding under the Facility during the period ended November 30, 2006 was approximately $31,200, with a related weighted average annualized interest rate of 5.49% .
The Fund 29
| NOTES TO FINANCIAL STATEMENTS (continued) |
NOTE 3—Management Fee, Sub-Investment Advisory Fee and Other Transactions With Affiliates:
(a) Pursuant to an Management Agreement (“Agreement”) with Dreyfus, the management fee is computed at the annual rate of .75% of the value of the fund’s average daily net assets and is payable monthly. Dreyfus has contractually agreed, from December 1, 2005 until February 25, 2007, to waive receipt of its fees and/or assume the expenses of the fund, so that annual fund operating expenses for Class J shares, exclusive of taxes, interest, brokerage commissions, commitment fees and extraordinary expenses, do not exceed 1.20% . Dreyfus had undertaken from December 1, 2005 through November 30, 2006, for Class A, Class B, Class C, Class R and Class T shares, to reduce the management fee paid by the fund, if the aggregate expenses, exclusive of taxes, brokerage fee, interest on borrowings, commitment fees, Rule 12b-1 distribution plan fees, shareholder services plan fees and extraordinary expenses, exceed an annual rate of 1.20% of the value of their average daily net assets. The reduction in expenses, pursuant to the undertakings, amounted to $62,713 during the period ended November 30, 2006.
Pursuant to a Sub-Investment Advisory Agreement between Dreyfus and Wisconsin Capital, Dreyfus has agreed to pay Wisconsin Capital a monthly fee in the amount of 100% of the management fee paid by the fund to Dreyfus for such month,less certain fees waived or expenses paid or reimbursed by Dreyfus, on the fund’s assets attributable to accounts of shareholders who have an adviser-client relationship with Wisconsin Capital (including the accounts of all shareholders of Thompson Plumb Blue Chip Fund as of the reorganization date who continue as shareholders of the fund following the reorganization of Thompson Plumb Blue Chip Fund), plus, with respect to all other assets of the fund, 50% of the net management fee paid to the manager on such net assets.
During the period ended November 30, 2006, the Fund was advised that the Distributor retained $1,538 from commission earned on sales of the fund’s Class A shares.
| 30 |
(b) Under the Distribution Plan (the “Plan”) adopted pursuant to Rule 12b-1 under the Act, Class B, Class C and Class T shares pay the Distributor for distributing their shares at an annual rate of .75% of the value of their average daily net assets of Class B and Class C shares and .25% of the value of the average daily net assets of Class T shares. During the period ended November 30, 2006, Class B, Class C and Class T shares were charged $327, $200 and $2, respectively, pursuant to the Plan.
(c) Under the Shareholder Services Plan, Class A, Class B, Class C and Class T shares pay the Distributor at an annual rate of .25% of the value of their average daily net assets for the provision of certain services.The services provided may include personal services relating to shareholder accounts, such as answering shareholder inquiries regarding the fund and providing reports and other information, and services related to the maintenance of shareholder accounts.The Distributor may make payments to Service Agents (a securities dealer, financial institution or other industry professional) in respect of these services.The Distributor determines the amounts to be paid to Service Agents. During the period ended November 30, 2006, Class A, Class B, Class C and Class T shares were charged $2,052, $109, $67 and $2, respectively, pursuant to the Shareholder Services Plan.
The fund compensates Dreyfus Transfer, Inc., a wholly-owned subsidiary of Dreyfus, under a transfer agency agreement for providing personnel and facilities to perform transfer agency services for Class A, Class B, Class C, Class R and Class T shares of the fund. During the period ended November 30, 2006, the fund was charged $4,790 pursuant to the transfer agency agreement.
The fund compensates Mellon Bank, N.A., an affiliate of Dreyfus, under a custody agreement for providing custodial services for the fund. During the period ended November 30, 2006, the fund was charged $3,950 pursuant to the custody agreement.
The Fund 31
| NOTES TO FINANCIAL STATEMENTS (continued) |
During the period ended November 30, 2006, the fund was charged $4,184 for services performed by the Chief Compliance Officer which is included in miscellaneous expenses.
The components of Due to The Dreyfus Corporation and affiliates in the Statement of Assets and Liabilities consist of: management fees $15,405,Rule 12b-1 distribution plan fees $36, shareholder services plan fees $195, custodian fees $542, chief compliance officer fees $1,704 and transfer agency per account fees $783 which are offset against an expense reimbursement currently in effect in the amount of $8,096.
(d) Each Board member also serves as a Board member of other funds within the Dreyfus complex. Annual retainer fees and attendance fees are allocated to each fund based on net assets.
(e) Pursuant to an exemptive order from the SEC, the fund may invest its available cash balances in affiliated money market mutual funds. Management fees of the underlying money market mutual funds have been waived by Dreyfus.
| NOTE 4—Securities Transactions: |
The aggregate amount of purchases and sales of investment securities, excluding short-term securities, during the period ended November 30, 2006, amounted to $6,150,189 and $12,530,597, respectively.
At November 30, 2006, the cost of investments for federal income tax purposes was $22,934,299; accordingly, accumulated net unrealized appreciation on investments was $3,095,594, consisting of $3,961,401 gross unrealized appreciation and $865,807 gross unrealized depreciation.
| 32 |
| REPORT OF INDEPENDENT REGISTERED PUBLIC ACCOUNTING FIRM |
| To the Trustees and Shareholders of Dreyfus Premier Blue Chip Fund |
In our opinion, the accompanying statement of assets and liabilities, including the statement of investments, and the related statements of operations and of changes in net assets and the financial highlights present fairly, in all material respects, the financial position of Dreyfus Premier Blue Chip Fund (the “Fund”) (one of the series constituting Dreyfus Premier Manager Funds II) at November 30, 2006, the results of its operations for the year then ended, the changes in its net assets for each of the two years in the period then ended and the financial highlights for each of the periods presented, in conformity with accounting principles generally accepted in the United States of America. These financial statements and financial highlights (hereafter referred to as “financial statements”) are the responsibility of the Fund’s management. Our responsibility is to express an opinion on these financial statements based on our audits. We conducted our audits of these financial statements in accordance with the standards of the Public Company Accounting Oversight Board (United States). Those standards require that we plan and perform the audit to obtain reasonable assurance about whether the financial statements are free of material misstatement. An audit includes examining, on a test basis, evidence supporting the amounts and disclosures in the financial statements, assessing the accounting principles used and significant estimates made by management, and evaluating the overall financial statement presentation. We believe that our audits, which included confirmation of securities at November 30, 2006 by correspondence with the custodian, provide a reasonable basis for our opinion.
| PricewaterhouseCoopers LLP |
| New York, New York |
| January 19, 2007 |
The Fund 33
IMPORTANT TAX INFORMATION (Unaudited)
For federal tax purposes, the fund hereby designates $.4710 per share as a long-term capital gain distribution paid on December 30, 2005. The fund also hereby designates 100% of the ordinary dividends paid during the fiscal year ended November 30, 2006 as qualifying for the corporate dividends received deduction. For the fiscal year ended November 30, 2006, certain dividends paid by the fund may be subject to a maximum tax rate of 15%, as provided for by the Jobs and Growth Tax Relief Reconciliation Act of 2003. Of the distributions paid during the fiscal year, $154,465 represents the maximum amount that may be considered qualified dividend income. Shareholders will receive notification in January 2007 of the percentage applicable to the preparation of their 2006 income tax returns.
| PROXY RESULTS (Unaudited) |
Dreyfus Premier Manager Funds II held a special meeting of shareholders on June 29, 2006.The proposal considered at the meeting, and the results, are as follows:
| Shares | ||||||
| Votes For | Authority Withheld | |||||
| To elect additional Board Members: | ||||||
| Peggy C. Davis † | 33,714,880 | 433,244 | ||||
| James F. Henry † | 33,767,904 | 380,219 | ||||
| Dr. Martin Peretz † | 33,707,382 | 440,742 |
† Each will serve as an Independent Board member of the fund commencing, subject to the discretion of the Board, on or about January 1, 2007.
In addition Joseph S. DiMartino, David P. Feldman, Ehud Houminer, Gloria Messinger, and Anne Wexler continue as Board members of the fund.
| 34 |
BOARD MEMBERS INFORMATION (Unaudited)
| Joseph S. DiMartino (63) Chairman of the Board (2003) |
| Principal Occupation During Past 5 Years: • Corporate Director and Trustee |
| Other Board Memberships and Affiliations: |
- The Muscular Dystrophy Association, Director
- Century Business Services, Inc., a provider of outsourcing functions for small and medium size companies, Director
- The Newark Group, a provider of a national market of paper recovery facilities, paperboard mills and paperboard converting plants, Director
- Sunair Services Corporation, engaging in the design, manufacture and sale of high frequency systems for long-range voice and data communications, as well as providing certain outdoor-related services to homes and businesses, Director
No. of Portfolios for which Board Member Serves: 190 ———————
Peggy C. Davis (63) Board Member (2006)
| Principal Occupation During Past 5 Years: |
- Shad Professor of Law, New York University School of Law (1983-present)
- Writer and teacher in the fields of evidence, constitutional theory, family law, social sciences and the law, legal process and professional methodology and training
No. of Portfolios for which Board Member Serves: 71 ———————
David P. Feldman (67) Board Member (2003)
| Principal Occupation During Past 5 Years: • Corporate Director and Trustee |
| Other Board Memberships and Affiliations: |
- BBH Mutual Funds Group (11 funds), Director
- The Jeffrey Company, a private investment company, Director
- QMED, a medical device company, Director
| No. of Portfolios for which Board Member Serves: 57 |
The Fund 35
BOARD MEMBERS INFORMATION (Unaudited) (continued)
| James F. Henry (75) Board Member (2006) |
| Principal Occupation During Past 5 Years: |
- President,The International Institute for Conflict Prevention and Resolution, a non-profit organization principally engaged in the development of alternatives to business litigation (Retired 2003)
- Advisor to The Elaw Forum, a consultant on managing corporate legal costs
- Advisor to John Jay Homestead (the restored home of the first U.S. Chief Justice)
- Individual Trustee of several trusts
| Other Board Memberships and Affiliations: |
- Director, advisor and mediator involved in several non-profit organizations, primarily engaged in domestic and international dispute resolution, and historic preservation
No. of Portfolios for which Board Member Serves: 48 ———————
Ehud Houminer (66) Board Member (2003)
Principal Occupation During Past 5 Years:
• Executive-in-Residence at the Columbia Business School, Columbia University
| Other Board Memberships and Affiliations: |
- Avnet Inc., an electronics distributor, Director
- International Advisory Board to the MBA Program School of Management, Ben Gurion University, Chairman
- Explore Charter School, Brooklyn, NY, Chairman
No. of Portfolios for which Board Member Serves: 76 ———————
Dr. Paul A. Marks (80) Board Member (2006)
| Principal Occupation During Past 5 Years: |
- President, Emeritus (2000-present) and President and Chief Executive Officer of Memorial Sloan-Kettering Cancer Center (Retired 1999)
| Other Board Memberships and Affiliations: |
- Pfizer, Inc., Director-Emeritus
- Lazard Freres & Company, LLC, Senior Adviser
- Armgo-Start-Up Biotech; Board of Directors
- Nanoviricide, Scientific Advisory Board
- PTC, Scientific Advisory Board
- IKONYSIS, Scientific Advisory Board
No. of Portfolios for which Board Member Serves: 48
| 36 |
| Gloria Messinger (77) Board Member (2003) |
| Principal Occupation During Past 5 Years: |
- Arbitrator for American Arbitration Association and National Association of Securities Dealers, Inc.
- Consultant in Intellectual Property
| Other Board Memberships and Affiliations: |
- Theater for a New Audience, Inc., Director
- Brooklyn Philharmonic, Director
No. of Portfolios for which Board Member Serves: 48 ———————
Dr. Martin Peretz (67) Board Member (2006)
| Principal Occupation During Past 5 Years: |
- Editor-in-Chief of The New Republic Magazine
- Lecturer in Social Studies at Harvard University (1965-2002)
- Director of TheStreet.com, a financial information service on the web
| Other Board Memberships and Affiliations: |
- American Council of Trustees and Alumni, Director
- Pershing Square Capital Management, Adviser
- Montefiore Ventures, General Partner
- Harvard Center for Blood Research,Trustee
- Bard College,Trustee
- Board of Overseers of YIVO Institute for Jewish Research, Chairman
No. of Portfolios for which Board Member Serves: 48 ———————
Anne Wexler (76) Board Member (2003)
| Principal Occupation During Past 5 Years: |
- Chairman of the Wexler & Walker Public Policy Associates, consultants specializing in government relations and public affairs
| Other Board Memberships and Affiliations: |
- Wilshire Mutual Funds (5 funds), Director
- Methanex Corporation, a methanol producing company, Director
- Member of the Council of Foreign Relations
- Member of the National Park Foundation
No. of Portfolios for which Board Member Serves: 57 ———————
Once elected all Board Members serve for an indefinite term, but achieve Emeritus status upon reaching age 80.The address of the Board Members and Officers is in c/o The Dreyfus Corporation, 200 Park Avenue, New York, New York 10166. Additional information about the Board Members is available in the fund’s Statement of Additional Information which can be obtained from Dreyfus free of charge by calling this toll free number: 1-800-554-4611.
John M. Fraser, Jr., Emeritus Board Member T. John Szarkowski, Emeritus Board Member
The Fund 37
OFFICERS OF THE FUND (Unaudited)
| J. DAVID OFFICER, President since | JOSEPH M. CHIOFFI, Vice President and | |
| December 2006. | Assistant Secretary since August 2005. | |
| Chief Operating Officer,Vice Chairman and a | Associate General Counsel of the Manager, | |
| director of the Manager, and an officer of 90 | and an officer of 91 investment companies | |
| investment companies (comprised of 190 | (comprised of 206 portfolios) managed by the | |
| portfolios) managed by the Manager. He is 58 | Manager. He is 45 years old and has been an | |
| years old and has been an employee of the | employee of the Manager since June 2000. | |
| Manager since April 1, 1998. | JANETTE E. FARRAGHER, Vice President | |
| MARK N. JACOBS, Vice President since | and Assistant Secretary since | |
| September 2003. | August 2005. | |
| Executive Vice President, Secretary and | Associate General Counsel of the Manager, | |
| General Counsel of the Manager, and an | and an officer of 91 investment companies | |
| officer of 91 investment companies (comprised | (comprised of 206 portfolios) managed by the | |
| of 206 portfolios) managed by the Manager. | Manager. She is 43 years old and has been an | |
| He is 60 years old and has been an employee | employee of the Manager since February 1984. | |
| of the Manager since June 1977. | JOHN B. HAMMALIAN, Vice President and | |
| MICHAEL A. ROSENBERG, Vice President | Assistant Secretary since August 2005. | |
| and Secretary since August 2005. | Associate General Counsel of the Manager, | |
| Associate General Counsel of the Manager, | and an officer of 91 investment companies | |
| and an officer of 91 investment companies | (comprised of 206 portfolios) managed by the | |
| (comprised of 206 portfolios) managed by the | Manager. He is 43 years old and has been an | |
| Manager. He is 46 years old and has been an | employee of the Manager since February 1991. | |
| employee of the Manager since October 1991. | ROBERT R. MULLERY, Vice President and | |
| JAMES BITETTO, Vice President and | Assistant Secretary since August 2005. | |
| Assistant Secretary since August 2005. | Associate General Counsel of the Manager, | |
| Associate General Counsel and Assistant | and an officer of 91 investment companies | |
| Secretary of the Manager, and an officer of 91 | (comprised of 206 portfolios) managed by the | |
| investment companies (comprised of 206 | Manager. He is 54 years old and has been an | |
| portfolios) managed by the Manager. He is 40 | employee of the Manager since May 1986. | |
| years old and has been an employee of the | JEFF PRUSNOFSKY, Vice President and | |
| Manager since December 1996. | Assistant Secretary since August 2005. | |
| JONI LACKS CHARATAN, Vice President | Associate General Counsel of the Manager, | |
| and Assistant Secretary since | and an officer of 91 investment companies | |
| August 2005. | (comprised of 206 portfolios) managed by the | |
| Associate General Counsel of the Manager, | Manager. He is 41 years old and has been an | |
| and an officer of 91 investment companies | employee of the Manager since October 1990. | |
| (comprised of 206 portfolios) managed by the | ||
| Manager. She is 51 years old and has been an | ||
| employee of the Manager since October 1988. | ||
38
| JAMES WINDELS, Treasurer since | JOSEPH W. CONNOLLY, Chief Compliance | |
| September 2003. | Officer since October 2004. | |
| Director – Mutual Fund Accounting of the | Chief Compliance Officer of the Manager and | |
| Manager, and an officer of 91 investment | The Dreyfus Family of Funds (91 investment | |
| companies (comprised of 206 portfolios) | companies, comprised of 206 portfolios). From | |
| managed by the Manager. He is 48 years old | November 2001 through March 2004, Mr. | |
| and has been an employee of the Manager | Connolly was first Vice-President, Mutual | |
| since April 1985. | Fund Servicing for Mellon Global Securities | |
| ERIK D. NAVILOFF, Assistant Treasurer | Services. In that capacity, Mr. Connolly was | |
| since August 2005. | responsible for managing Mellon’s Custody, | |
| Fund Accounting and Fund Administration | ||
| Senior Accounting Manager – Taxable Fixed | services to third-party mutual fund clients. He | |
| Income Funds of the Manager, and an officer | is 49 years old and has served in various | |
| of 91 investment companies (comprised of 206 | capacities with the Manager since 1980, | |
| portfolios) managed by the Manager. He is 38 | including manager of the firm’s Fund | |
| years old and has been an employee of the | Accounting Department from 1997 through | |
| Manager since November 1992. | October 2001. | |
| ROBERT ROBOL, Assistant Treasurer | WILLIAM GERMENIS, Anti-Money | |
| since August 2005. | Laundering Compliance Officer since | |
| Senior Accounting Manager – Money Market | September 2003. | |
| and Municipal Bond Funds of the Manager, | Vice President and Anti-Money Laundering | |
| and an officer of 91 investment companies | Compliance Officer of the Distributor, and the | |
| (comprised of 206 portfolios) managed by the | Anti-Money Laundering Compliance Officer | |
| Manager. He is 42 years old and has been an | of 87 investment companies (comprised of 202 | |
| employee of the Manager since October 1988. | portfolios) managed by the Manager. He is 36 | |
| ROBERT SVAGNA, Assistant Treasurer | years old and has been an employee of the | |
| since September 2003. | Distributor since October 1998. | |
| Senior Accounting Manager – Equity Funds of | ||
| the Manager, and an officer of 91 investment | ||
| companies (comprised of 206 portfolios) | ||
| managed by the Manager. He is 39 years old | ||
| and has been an employee of the Manager | ||
| since November 1990. | ||
| GAVIN C. REILLY, Assistant Treasurer | ||
| since December 2005. | ||
| Tax Manager of the Investment Accounting | ||
| and Support Department of the Manager, and | ||
| an officer of 91 investment companies | ||
| (comprised of 206 portfolios) managed by the | ||
| Manager. He is 38 years old and has been an | ||
| employee of the Manager since April 1991. | ||
The Fund 39
NOTES
For More Information
| Dreyfus Premier | Custodian | |
| Blue Chip Fund | ||
| Mellon Bank, N.A. | ||
| 200 Park Avenue | ||
| One Mellon Bank Center | ||
| New York, NY 10166 | ||
| Pittsburgh, PA 15258 | ||
| Investment Adviser | Transfer Agent & | |
| The Dreyfus Corporation | Dividend Disbursing Agent | |
| 200 Park Avenue | ||
| Dreyfus Transfer, Inc. | ||
| New York, NY 10166 | ||
| 200 Park Avenue | ||
| Sub-Investment Adviser | New York, NY 10166 | |
| Wisconsin Capital Management, LLC | Distributor | |
| 1200 John Q. Hammons Drive | ||
| Dreyfus Service Corporation | ||
| Madison,WI 53717 | ||
| 200 Park Avenue | ||
| New York, NY 10166 | ||
Telephone Call your financial representative or 1-800-554-4611
| The Dreyfus Premier Family of Funds | ||
| 144 Glenn Curtiss Boulevard, Uniondale, NY 11556-0144 |
The fund files its complete schedule of portfolio holdings with the Securities and Exchange Commission (“SEC”) for the first and third quarters of each fiscal year on Form N-Q. The fund’s Forms N-Q are available on the SEC’s website at http://www.sec.gov and may be reviewed and copied at the SEC’s Public Reference Room in Washington, DC. Information on the operation of the Public Reference Room may be obtained by calling 1-202-551-8090.
A description of the policies and procedures that the fund uses to determine how to vote proxies relating to portfolio securities, and information regarding how the fund voted these proxies for the 12-month period ended June 30, 2006, is available at http://www.dreyfus.com and on the SEC’s website at http://www.sec.gov. The description of the policies and procedures is also available without charge, upon request, by calling 1-800-645-6561.
© 2007 Dreyfus Service Corporation

Item 2. Code of Ethics.
The Registrant has adopted a code of ethics that applies to the Registrant's principal executive officer, principal financial officer, principal accounting officer or controller, or persons performing similar functions. There have been no amendments to, or waivers in connection with, the Code of Ethics during the period covered by this Report.
Item 3. Audit Committee Financial Expert.
The Registrant's Board has determined that David P. Feldman, a member of the Audit Committee of the Board, is an audit committee financial expert as defined by the Securities and Exchange Commission (the "SEC"). David P. Feldman is "independent" as defined by the SEC for purposes of audit committee financial expert determinations.
Item 4. Principal Accountant Fees and Services
(a) Audit Fees. The aggregate fees billed for each of the last two fiscal years (the "Reporting Periods") for professional services rendered by the Registrant's principal accountant (the "Auditor") for the audit of the Registrant's annual financial statements, or services that are normally provided by the Auditor in connection with the statutory and regulatory filings or engagements for the Reporting Periods, were $132,000 in 2005 and $138,000 in 2006.
(b) Audit-Related Fees. The aggregate fees billed in the Reporting Periods for assurance and related services by the Auditor that are reasonably related to the performance of the audit of the Registrant's financial statements and are not reported under paragraph (a) of this Item 4 were $0 in 2005 and $0 in 2006.
The aggregate fees billed in the Reporting Periods for non-audit assurance and related services by the Auditor to the Registrant's investment adviser (not including any sub-investment adviser whose role is primarily portfolio management and is subcontracted with or overseen by another investment adviser), and any entity controlling, controlled by or under common control with the investment adviser that provides ongoing services to the Registrant ("Service Affiliates"), that were reasonably related to the performance of the annual audit of the Service Affiliate, which required pre-approval by the Audit Committee were $0 in 2005 and $0 in 2006.
Note: For the second paragraph in each of (b) through (d) of this Item 4, certain of such services were not pre-approved prior to May 6, 2003, when such services were required to be pre-approved. On and after May 6, 2003, 100% of all services provided by the Auditor were pre-approved as required. For comparative purposes, the fees shown assume that all such services were pre-approved, including services that were not pre-approved prior to the compliance date of the pre-approval requirement.
(c) Tax Fees. The aggregate fees billed in the Reporting Periods for professional services rendered by the Auditor for tax compliance, tax advice and tax planning ("Tax Services") were $3,000 in 2005 and $9,900 in 2006. These services consisted of (i) review or preparation of U.S. federal, state, local and excise tax returns; (ii) U.S. federal, state and local tax planning, advice and assistance regarding statutory, regulatory or administrative developments, (iii) tax advice regarding tax qualification matters and/or treatment of various
| -2- |
financial instruments held or proposed to be acquired or held, and (iv) determination of Passive Foreign Investment Companies (as applicable).
The aggregate fees billed in the Reporting Periods for Tax Services by the Auditor to Service Affiliates which required pre-approval by the Audit Committee were $0 in 2005 and $0 in 2006.
(d) All Other Fees. The aggregate fees billed in the Reporting Periods for products and services provided by the Auditor, other than the services reported in paragraphs (a) through (c) of this Item, were $0 in 2005 and $0 in 2006.
The aggregate fees billed in the Reporting Periods for Non-Audit Services by the Auditor to Service Affiliates, other than the services reported in paragraphs (b) through (c) of this Item, which required pre-approval by the Audit Committee were $0 in 2005 and $0 in 2006.
Audit Committee Pre-Approval Policies and Procedures. The Registrant's Audit Committee has established policies and procedures (the "Policy") for pre-approval (within specified fee limits) of the Auditor's engagements for non-audit services to the Registrant and Service Affiliates without specific case-by-case consideration. Pre-approval considerations include whether the proposed services are compatible with maintaining the Auditor's independence. Pre-approvals pursuant to the Policy are considered annually.
Non-Audit Fees. The aggregate non-audit fees billed by the Auditor for services rendered to the Registrant, and rendered to Service Affiliates, for the Reporting Periods were $75,000 in 2005 and $90,000 in 2006.
Auditor Independence. The Registrant's Audit Committee has considered whether the provision of non-audit services that were rendered to Service Affiliates which were not pre-approved (not requiring pre-approval) is compatible with maintaining the Auditor's independence.
| Item 5. | Audit Committee of Listed Registrants. | |
| Not applicable. | ||
| Item 6. | Schedule of Investments. | |
| Not applicable. | ||
| Item 7. | Disclosure of Proxy Voting Policies and Procedures for Closed-End Management | |
| Investment Companies. | ||
| Not applicable. | ||
| Item 8. | Portfolio Managers of Closed-End Management Investment Companies. | |
| Not applicable. | ||
| Item 9. | Purchases of Equity Securities by Closed-End Management Investment Companies and | |
| Affiliated Purchasers. | ||
| Not applicable. | ||
| Item 10. | Submission of Matters to a Vote of Security Holders. |
| -3- |
The Registrant has a Nominating Committee (the "Committee"), which is responsible for selecting and nominating persons for election or appointment by the Registrant's Board as Board members. The Committee has adopted a Nominating Committee Charter (the "Charter"). Pursuant to the Charter, the Committee will consider recommendations for nominees from shareholders submitted to the Secretary of the Registrant, c/o The Dreyfus Corporation Legal Department, 200 Park Avenue, 8th Floor East, New York, New York 10166. A nomination submission must include information regarding the recommended nominee as specified in the Charter. This information includes all information relating to a recommended nominee that is required to be disclosed in solicitations or proxy statements for the election of Board members, as well as information sufficient to evaluate the factors to be considered by the Committee, including character and integrity, business and professional experience, and whether the person has the ability to apply sound and independent business judgment and would act in the interests of the Registrant and its shareholders.
Nomination submissions are required to be accompanied by a written consent of the individual to stand for election if nominated by the Board and to serve if elected by the shareholders, and such additional information must be provided regarding the recommended nominee as reasonably requested by the Committee.
Item 11. Controls and Procedures.
(a) The Registrant's principal executive and principal financial officers have concluded, based on their evaluation of the Registrant's disclosure controls and procedures as of a date within 90 days of the filing date of this report, that the Registrant's disclosure controls and procedures are reasonably designed to ensure that information required to be disclosed by the Registrant on Form N-CSR is recorded, processed, summarized and reported within the required time periods and that information required to be disclosed by the Registrant in the reports that it files or submits on Form N-CSR is accumulated and communicated to the Registrant's management, including its principal executive and principal financial officers, as appropriate to allow timely decisions regarding required disclosure.
(b) There were no changes to the Registrant's internal control over financial reporting that occurred during the second fiscal quarter of the period covered by this report that have materially affected, or are reasonably likely to materially affect, the Registrant's internal control over financial reporting.
| Item 12. Exhibits. | ||
| (a)(1) | Code of ethics referred to in Item 2. | |
| (a)(2) | Certifications of principal executive and principal financial officers as required by Rule 30a-2(a) | |
| under the Investment Company Act of 1940. | ||
| (a)(3) | Not applicable. | |
| (b) | Certification of principal executive and principal financial officers as required by Rule 30a-2(b) | |
| under the Investment Company Act of 1940. | ||
| -4- |
| SIGNATURES |
Pursuant to the requirements of the Securities Exchange Act of 1934 and the Investment Company Act of 1940, the Registrant has duly caused this Report to be signed on its behalf by the undersigned, thereunto duly authorized.
DREYFUS PREMIER MANAGER FUNDS II

Pursuant to the requirements of the Securities Exchange Act of 1934 and the Investment Company Act of 1940, this Report has been signed below by the following persons on behalf of the Registrant and in the capacities and on the dates indicated.
EXHIBIT INDEX
(a)(1) Code of ethics referred to in Item 2.
(a)(2) Certifications of principal executive and principal financial officers as required by Rule 30a-2(a) under the Investment Company Act of 1940. (EX-99.CERT)
(b) Certification of principal executive and principal financial officers as required by Rule 30a-2(b) under the Investment Company Act of 1940. (EX-99.906CERT)
| -5- |