UNITED STATES
SECURITIES AND EXCHANGE COMMISSION
Washington, D.C. 20549
FORM N-CSR
CERTIFIED SHAREHOLDER REPORT OF REGISTERED MANAGEMENT
INVESTMENT COMPANIES
Investment Company Act file number 811- 21327
Dreyfus Premier Manager Funds II
(Exact name of Registrant as specified in charter)
c/o The Dreyfus Corporation
200 Park Avenue
New York, New York 10166
(Address of principal executive offices) (Zip code)
Michael A. Rosenberg, Esq.
200 Park Avenue
New York, New York 10166
(Name and address of agent for service)
Registrant's telephone number, including area code: (212) 922-6000
| Date of fiscal year end: | 11/30 | |
| Date of reporting period: | 11/30/07 |
FORM N-CSR
| Item 1. | Reports to Stockholders. |
Dreyfus Premier
Balanced Opportunity Fund
ANNUAL REPORT November 30, 2007
Save time. Save paper. View your next shareholder report online as soon as it’s available. Log into www.dreyfus.com and sign up for Dreyfus eCommunications. It’s simple and only takes a few minutes.
The views expressed in this report reflect those of the portfolio manager only through the end of the period covered and do not necessarily represent the views of Dreyfus or any other person in the Dreyfus organization. Any such views are subject to change at any time based upon market or other conditions and Dreyfus disclaims any responsibility to update such views.These views may not be relied on as investment advice and, because investment decisions for a Dreyfus fund are based on numerous factors, may not be relied on as an indication of trading intent on behalf of any Dreyfus fund.
Not FDIC-Insured • Not Bank-Guaranteed • May Lose Value
| Contents | ||
| THE FUND | ||
| 2 | A Letter from the CEO | |
| 3 | Discussion of Fund Performance | |
| 6 | Fund Performance | |
| 8 | Understanding Your Fund’s Expenses | |
| 9 | Comparing Your Fund’s Expenses | |
| With Those of Other Funds | ||
| 10 | Statement of Investments | |
| 24 | Statement of Assets and Liabilities | |
| 26 | Statement of Operations | |
| 27 | Statement of Changes in Net Assets | |
| 30 | Financial Highlights | |
| 37 | Notes to Financial Statements | |
| 47 | Report of Independent Registered | |
| Public Accounting Firm | ||
| 48 | Important Tax Information | |
| 49 | Board Members Information | |
| 52 | Officers of the Fund | |
| FOR MORE INFORMATION | ||
| Back Cover | ||
| Dreyfus Premier Balanced Opportunity Fund |
| The | Fund |

LETTER FROM THE CEO
Dear Shareholder:
We are pleased to present this annual report for Dreyfus Premier Balanced Opportunity Fund, covering the 12-month period from December 1, 2006, through November 30, 2007.
Volatility has returned to the U.S. stock and bond markets. The past few months have been filled with greater swings in security valuations compared to the past several years, as the economic cycle matured and a credit crisis stemming from the sub-prime mortgage sector of the bond market has drastically affected other areas of the financial markets. A high degree of leverage within parts of the financial system has made these price fluctuations more intense than they otherwise might have been. In the ensuing “flight to quality” among investors, U.S.Treasury bonds fared relatively well, while riskier fixed-income and equity securities generally languished, offsetting some of the gains achieved earlier in the reporting period.
In our view, these developments signaled a shift to a new phase of the credit cycle, including more prudent mortgage requirements and a normalization of credit terms for other loans after a sustained period of low compensation for investment risk. Although we expect slower financial conditions in 2008, lower short-term interest rates from the Federal Reserve Board may help forestall a technical recession. In addition, turning points such as this may be a good time to review your portfolio with your financial advisor, who can help you perhaps reposition your investments for a changing market environment.
For information about how the fund performed during the reporting period, as well as market perspectives, we have provided a Discussion of Fund Performance given by the fund’s Portfolio Managers.
Thank you for your continued confidence and support.

| Thomas F. Eggers Chief Executive Officer The Dreyfus Corporation December 17, 2007 |
2

DISCUSSION OF FUND PERFORMANCE
For the period of December 1, 2006, through November 30, 2007, as provided by Keith Stransky, Sean P. Fitzgibbon, Brian C. Ferguson, Catherine A. Powers and Kent J.Wosepka, Portfolio Managers
Fund and Market Performance Overview
While stocks and bonds generally rallied during the first half of the reporting period, the financial markets encountered heightened volatility over the second half as intensifying credit and economic concerns caused equity and fixed-income investors to reassess their attitudes toward risk. The fund’s returns were lower than its benchmarks, primarily due to weakness among its holdings of corporate- and asset-backed bonds.
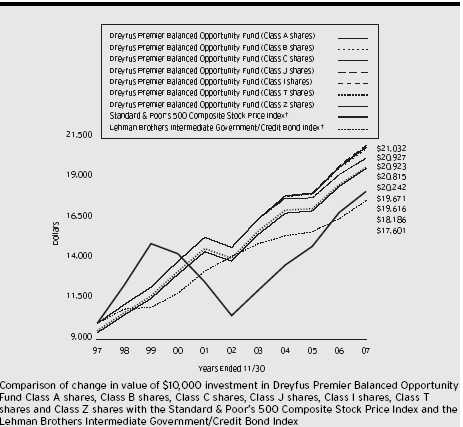
For the 12-month period ended November 30, 2007, Dreyfus Premier Balanced Opportunity Fund’s Class A shares produced a total return of 6.08%, Class B shares returned 5.30%, Class C shares returned 5.29%, Class J shares returned 6.41%, Class I shares returned 6.23%, Class T shares returned 5.79%, and Class Z shares returned 6.31% .1 In comparison, the fund’s benchmarks, the Standard & Poor’s 500 Composite Stock Price Index (“S&P 500 Index”) and the Lehman Brothers Intermediate Government/Credit Bond Index, achieved total returns of 7.72% and 6.68%, respectively, for the same period.2
The Fund’s Investment Approach
The fund seeks high total return,including capital appreciation and current income, through a diversified mix of stocks and fixed-income securities. When allocating assets, the fund’s asset allocation manager assesses the relative return and risk of each asset class, general economic conditions, anticipated changes in interest rates and the general outlook for stocks.
The fund’s equity portfolio managers create a broadly diversified equity portfolio that includes a blend of growth and value stocks. Using quantitative and fundamental research, we look for companies with leading market positions, competitive or technological advantages, high returns on equity and assets, good growth prospects, attractive valuations and strong management teams.
The fund normally invests between 25% and 50% of its assets in fixed-income securities that, at the time of purchase, are rated investment grade or the non-rated equivalent as determined by Dreyfus.We may invest up to 5% of the fixed-income portfolio in securities rated below investment grade and up to 10% in bonds from foreign issuers.
The Fund 3
D I S C U S S I O N O F F U N D P E R F O R M A N C E (continued)
Earnings and Global Economy Supported Stock Prices
Stocks generally advanced during the reporting period as robust corporate earnings more than offset the negative effects of economic concerns and a credit crunch that originated in the bond market’s sub-prime mortgage sector. In addition, a robust global economy spurred demand for products and services from U.S.-based exporters. Low interest rates and sustainable growth overseas will help keep a floor on prices. Despite the recent turmoil in the markets, the fund remained slightly overweighted in equity relative to the benchmark’s 60% policy norm.
Our security selection strategy proved to be particularly effective in the consumer discretionary sector, which fared relatively poorly for the benchmark but helped boost the fund’s return.The fund’s media holdings fared well as we did not invest in cable operator Comcast or media conglomerate Time Warner, which suffered from competitive pressures. The fund also benefited from its position in McDonald’s, which posted improved same-store sales. The fund avoided weakness in The Home Depot and other housing-related retailers, while benefitting from apparel discounters such as The TJX Companies, Inc., parent of T.J. Maxx and Marshalls.
Our stock selection strategy also bolstered returns in the information technology sector, where Research in Motion enjoyed rising sales of its Blackberry handheld device and Hewlett-Packard captured a larger share of the rebounding personal computer market. Research in Motion was sold during the reporting period. Good timing in the purchase and sale of shares of Cisco Systems also contributed positively to the fund’s performance. In other areas, materials producer The Mosaic Company benefited from rising demand for fertilizer, particularly from growers of corn used to make ethanol.
An overweighted position in the financials sector produced disappointing results when mortgage-related holdings such as Fannie Mae, Freddie Mac and PMI Group were hard-hit by the credit crisis. Better results from trust banks and securities exchanges were not enough to offset mortgage-related weakness.
Fixed-Income Results Constrained by Credit Concerns
While U.S.Treasury securities gained value during a “flight to quality,” the credit crunch led to declines in higher-yielding fixed-income sectors. Returns from the fund’s bond portfolio trailed its benchmark,
4
primarily due to underweighted exposure to U.S. Treasury securities and lagging performance in other areas.
We had adopted a defensive investment posture with regard to investment-grade corporate securities, including an emphasis on bonds from financial services companies that tend to be less vulnerable to the risks of leveraged buyouts. However, this focus detracted from performance during the credit crisis. On a more positive note, underweighted exposure to mortgage-backed securities helped shield the fund from much of the sector’s weakness.The fund also benefited from its bias toward intermediate maturities given the yield curve steepened as the Fed began lowering interest rates toward the end of the reporting period. Yield spreads have widened but are still tight; therefore, there is little reward for taking on more risk.
Finding Opportunities in Changing Markets
While we remain optimistic regarding current equity valuations and the outlook for corporate earnings, we have adopted a cautious posture over the near term due to deteriorating domestic economic conditions. Accordingly, we have intensified our focus on large U.S. companies with a global presence. In the bond portfolio, we recently have identified opportunities to purchase higher yielding fixed-income securities at more attractive valuations, but we intend to remain cautious until the economic outlook becomes clearer.
December 17, 2007
| 1 | Total return includes reinvestment of dividends and any capital gains paid, and does not take into | |
| consideration the maximum initial sales charges in the case of Class A and Class T shares, or the | ||
| applicable contingent deferred sales charges imposed on redemptions in the case of Class B and | ||
| Class C shares. Had these charges been reflected, returns would have been lower. Past performance | ||
| is no guarantee of future results. Share price and investment return fluctuate such that upon | ||
| redemption, fund shares may be worth more or less than their original cost. Return figures | ||
| provided reflect the absorption of certain fund expenses by The Dreyfus Corporation pursuant to | ||
| an agreement in effect through November 30, 2008, at which time it may be extended, | ||
| terminated or modified. Had these expenses not been absorbed, the fund’s returns would have been | ||
| lower. Class J shares are closed to new investors. | ||
| 2 | SOURCE: LIPPER INC. — Reflects reinvestment of dividends and, where applicable, capital | |
| gain distributions.The Standard & Poor’s 500 Composite Stock Price Index is a widely accepted, | ||
| unmanaged index of U.S. stock market performance.The Lehman Brothers Intermediate | ||
| Government/Credit Bond Index is a widely accepted, unmanaged index of government and | ||
| corporate bond market performance composed of U.S. Government,Treasury and Agency securities, | ||
| fixed-income securities and nonconvertible investment-grade corporate debt, with an average | ||
| maturity of 1-10 years. |
The Fund 5
FUND PERFORMANCE
† Source: Lipper Inc.
Past performance is not predictive of future performance.
The above graph compares a $10,000 investment made in Class A, Class B, Class C, Class I, Class T, Class Z and Class J shares of Dreyfus Premier Balanced Opportunity Fund on 11/30/97 to a $10,000 investment made in both the Standard & Poor’s 500 Composite Stock Price Index (the “S&P 500 Index”) and the Lehman Brothers Intermediate Government/Credit Bond Index (the “Lehman Index”) on that date.All dividends and capital gain distributions are reinvested.
On January 30, 2004, Dreyfus Premier Balanced Opportunity Fund (the “fund”) commenced operations after all of the assets of another mutual fund advised by the fund's sub-investment adviser were transferred to the fund in exchange for Class J shares of the fund in a tax-free reorganization. Class B, J and Z shares are closed to new investors.The fund offers Class A, C, I and T shares, which are subject to different sales charges and expenses.The performance figures for Class A, Class B, Class C, Class I, Class T and Class Z shares in the line graph above include the performance of the predecessor fund and reflect current sales loads and distribution expenses in effect since the reorganization date.
The fund’s performance shown in the line graph takes into account the maximum initial sales charges on Class A and Class T shares and all other applicable fees and expenses on all classes.The S&P 500 Index is a widely accepted, unmanaged index of U.S. stock market performance.The Lehman Index is a widely accepted, unmanaged index of government and corporate bond market performance composed of U.S. government,Treasury and agency securities, fixed-income securities and nonconvertible investment-grade corporate debt, with an average maturity of 1-10 years. Unlike a mutual fund, the indices are not subject to charges, fees and other expenses. Investors cannot invest directly in any index. Further information relating to fund performance, including expense reimbursements, if applicable, is contained in the Financial Highlights section of the prospectus and elsewhere in this report.
6
| Average Annual Total Returns as of 11/30/07 | ||||||
| 1 Year | 5 Years | 10 Years | ||||
| Class A shares | ||||||
| with maximum sales charge (5.75%) | 0.00% | 5.92% | 6.97% | |||
| without sales charge | 6.08% | 7.19% | 7.61% | |||
| Class B shares | ||||||
| with applicable redemption charge † | 1.30% | 6.24% | 7.61% | |||
| without redemption | 5.30% | 6.55% | 7.61% | |||
| Class C shares | ||||||
| with applicable redemption charge †† | 4.29% | 6.59% | 7.31% | |||
| without redemption | 5.29% | 6.59% | 7.31% | |||
| Class J shares | 6.41% | 7.41% | 7.72% | |||
| Class I shares | 6.23% | 7.30% | 7.66% | |||
| Class T shares | ||||||
| with applicable sales charge (4.5%) | 1.01% | 5.99% | 7.00% | |||
| without sales charge | 5.79% | 6.97% | 7.50% | |||
| Class Z shares | 6.31% | 7.30% | 7.66% | |||
| Past performance is not predictive of future performance.The fund’s performance shown in the graph and table does not | ||
| reflect the deduction of taxes that a shareholder would pay on fund distributions or the redemption of fund shares.The | ||
| performance figures for Class A, Class B, Class C, Class I, Class T and Class Z shares shown in the table include the | ||
| performance of the predecessor fund and reflect current sales loads and distribution expenses in effect since the | ||
| reorganization date. Performance for Class B shares assumes the conversion of Class B shares to Class A shares at the | ||
| end of the sixth year following the date of purchase. | ||
| † | The maximum contingent deferred sales charge for Class B shares is 4%.After six years Class B shares convert to | |
| Class A shares. | ||
| †† | The maximum contingent deferred sales charge for Class C shares is 1% for shares redeemed within one year of the | |
| date of purchase. | ||
The Fund 7
UNDERSTANDING YOUR FUND’S EXPENSES (Unaudited)
As a mutual fund investor, you pay ongoing expenses, such as management fees and other expenses. Using the information below, you can estimate how these expenses affect your investment and compare them with the expenses of other funds.You also may pay one-time transaction expenses, including sales charges (loads) and redemption fees, which are not shown in this section and would have resulted in higher total expenses. For more information, see your fund’s prospectus or talk to your financial adviser.
Review your fund’s expenses
The table below shows the expenses you would have paid on a $1,000 investment in Dreyfus Premier Balanced Opportunity Fund from June 1, 2007 to November 30, 2007. It also shows how much a $1,000 investment would be worth at the close of the period assuming actual returns and expenses.
| Expenses and Value of a $1,000 Investment | ||||
| assuming actual returns for the six months ended November 30, 2007 | ||||
| Expenses paid | Ending value | |||
| per $1,000 † | (after expenses) | |||
| Class A | $5.96 | $997.60 | ||
| Class B | $9.90 | $993.90 | ||
| Class C | $9.55 | $993.90 | ||
| Class I | $5.56 | $998.10 | ||
| Class T | $7.60 | $995.80 | ||
| Class J | $4.31 | $999.50 | ||
| Class Z | $4.61 | $998.60 | ||
| † Expenses are equal to the fund’s annualized expense ratio of 1.19% for Class A, 1.98% for Class B, 1.91% for |
| Class C, 1.11% for Class I, 1.52% for Class T, .86% for Class J and .92% for Class Z, multiplied by the |
| average account value over the period, multiplied by 183/365 (to reflect the one-half year period). |
8
| COMPARING YOUR FUND’S EXPENSES WITH THOSE OF OTHER FUNDS (Unaudited) |
Using the SEC’s method to compare expenses
The Securities and Exchange Commission (SEC) has established guidelines to help investors assess fund expenses. Per these guidelines, the table below shows your fund’s expenses based on a $1,000 investment, assuming a hypothetical 5% annualized return. You can use this information to compare the ongoing expenses (but not transaction expenses or total cost) of investing in the fund with those of other funds.All mutual fund shareholder reports will provide this information to help you make this comparison. Please note that you cannot use this information to estimate your actual ending account balance and expenses paid during the period.
| Expenses and Value of a $1,000 Investment assuming a hypothetical 5% annualized return for the six months ended November 30, 2007 |
| Expenses paid | Ending value | |||||
| per $1,000 † | (after expenses) | |||||
| Class A | $ 6.02 | $1,019.10 | ||||
| Class B | $10.00 | $1,015.14 | ||||
| Class C | $ 9.65 | $1,015.49 | ||||
| Class I | $ 5.62 | $1,019.50 | ||||
| Class T | $ 7.69 | $1,017.45 | ||||
| Class J | $ 4.36 | $1,020.76 | ||||
| Class Z | $ 4.66 | $1,020.46 | ||||
| † Expenses are equal to the fund’s annualized expense ratio of 1.19% for Class A, 1.98% for Class B, 1.91% for |
| Class C, 1.11% for Class I, 1.52% for Class T, .86% for Class J and .92% for Class Z, multiplied by the |
| average account value over the period, multiplied by 183/365 (to reflect the one-half year period). |
The Fund 9
| STATEMENT OF INVESTMENTS N o v e m b e r 3 0 , 2 0 0 7 |
| Common Stocks—65.7% | Shares | Value ($) | ||
| Consumer Discretionary—5.0% | ||||
| Best Buy | 29,060 a | 1,483,513 | ||
| Centex | 19,130 | 399,051 | ||
| DIRECTV Group | 47,400 b | 1,178,838 | ||
| Gap | 116,710 | 2,380,884 | ||
| Johnson Controls | 52,860 | 2,041,453 | ||
| Liberty Global, Ser. C | 21,210 b | 811,283 | ||
| Lowe’s Cos. | 24,970 | 609,518 | ||
| McDonald’s | 67,010 | 3,918,075 | ||
| News, Cl. A | 116,570 | 2,456,130 | ||
| NVR | 870 a,b | 428,040 | ||
| Omnicom Group | 89,790 | 4,377,263 | ||
| Ross Stores | 24,270 | 640,243 | ||
| TJX Cos. | 72,830 | 2,136,832 | ||
| Toll Brothers | 22,230 a,b | 459,494 | ||
| Viacom, Cl. B | 21,090 b | 886,202 | ||
| Walt Disney | 59,560 | 1,974,414 | ||
| 26,181,233 | ||||
| Consumer Staples—7.5% | ||||
| Altria Group | 101,990 | 7,910,344 | ||
| Cadbury Schweppes, ADR | 24,730 | 1,275,326 | ||
| Coca-Cola | 27,260 | 1,692,846 | ||
| Coca-Cola Enterprises | 121,340 | 3,151,200 | ||
| Colgate-Palmolive | 9,880 | 791,190 | ||
| ConAgra Foods | 86,450 | 2,162,979 | ||
| CVS | 58,950 | 2,363,305 | ||
| Dean Foods | 33,270 | 829,754 | ||
| Estee Lauder Cos., Cl. A | 9,960 | 447,005 | ||
| Kraft Foods, Cl. A | 60,670 | 2,096,149 | ||
| Kroger | 79,670 | 2,290,513 | ||
| Molson Coors Brewing, Cl. B | 15,830 | 852,287 | ||
| PepsiCo | 29,570 | 2,282,213 | ||
| Procter & Gamble | 47,100 | 3,485,400 | ||
| Smithfield Foods | 29,740 b | 893,687 | ||
| SUPERVALU | 44,710 | 1,872,008 | ||
| Wal-Mart Stores | 95,460 | 4,572,534 | ||
| 38,968,740 |
10
| Common Stocks (continued) | Shares | Value ($) | ||||
| Energy—8.7% | ||||||
| Anadarko Petroleum | 10,660 | 603,356 | ||||
| Cameron International | 13,790 b | 1,285,641 | ||||
| Chesapeake Energy | 90,270 a | 3,416,719 | ||||
| Chevron | 95,340 | 8,367,992 | ||||
| ConocoPhillips | 75,010 | 6,003,800 | ||||
| Devon Energy | 45,640 | 3,779,448 | ||||
| El Paso | 77,120 a | 1,240,090 | ||||
| ENSCO International | 30,180 | 1,625,193 | ||||
| EOG Resources | 22,350 | 1,850,133 | ||||
| Exxon Mobil | 10,010 | 892,492 | ||||
| Hess | 22,470 | 1,600,313 | ||||
| Marathon Oil | 47,710 | 2,666,989 | ||||
| Nabors Industries | 40,050 a,b | 1,077,345 | ||||
| National Oilwell Varco | 35,880 b | 2,445,222 | ||||
| Occidental Petroleum | 47,160 | 3,290,353 | ||||
| Valero Energy | 18,550 | 1,207,049 | ||||
| XTO Energy | 62,150 | 3,842,113 | ||||
| 45,194,248 | ||||||
| Exchange Traded Funds—.5% | ||||||
| iShares Russell 1000 Value Index Fund | 15,040 a | 1,231,776 | ||||
| Standard & Poor’s Depository | ||||||
| Receipts (Tr. Ser. 1) | 9,950 a | 1,479,167 | ||||
| 2,710,943 | ||||||
| Financial—13.6% | ||||||
| American Express | 46,790 | 2,759,674 | ||||
| American International Group | 55,390 | 3,219,820 | ||||
| AON | 20,350 a | 1,016,889 | ||||
| Bank of America | 80,850 | 3,729,610 | ||||
| Capital One Financial | 13,820 a | 736,744 | ||||
| Chubb | 75,060 | 4,094,523 | ||||
| CIT Group | 24,810 | 659,946 | ||||
| Citigroup | 147,170 | 4,900,761 | ||||
| CME Group | 3,410 | 2,245,826 | ||||
| Fannie Mae | 32,560 a | 1,250,955 | ||||
| First American | 9,310 | 318,216 | ||||
| Freddie Mac | 10,410 a | 365,079 |
The Fund 11
S TAT E M E N T O F I N V E S T M E N T S (continued)
| Common Stocks (continued) | Shares | Value ($) | ||
| Financial (continued) | ||||
| Genworth Financial, Cl. A | 49,720 | 1,304,653 | ||
| Goldman Sachs Group | 23,300 | 5,280,712 | ||
| Interactive Brokers Group, Cl. A | 51,690 b | 1,519,686 | ||
| JPMorgan Chase & Co. | 187,610 | 8,558,768 | ||
| Lehman Brothers Holdings | 25,600 a | 1,603,328 | ||
| Lincoln National | 22,140 a | 1,363,160 | ||
| MBIA | 11,070 a | 404,166 | ||
| Merrill Lynch & Co. | 33,970 | 2,036,162 | ||
| MetLife | 57,260 a | 3,755,683 | ||
| MGIC Investment | 16,440 a | 386,669 | ||
| Morgan Stanley | 57,060 | 3,008,203 | ||
| Northern Trust | 25,260 | 2,045,807 | ||
| PMI Group | 29,400 a | 388,962 | ||
| PNC Financial Services Group | 26,950 | 1,973,010 | ||
| Principal Financial Group | 16,950 a | 1,110,056 | ||
| State Street | 25,560 | 2,041,988 | ||
| T. Rowe Price Group | 35,150 | 2,161,022 | ||
| Wachovia | 97,300 a | 4,183,900 | ||
| Wells Fargo & Co. | 74,130 | 2,404,036 | ||
| 70,828,014 | ||||
| Health Care—7.5% | ||||
| Abbott Laboratories | 45,420 | 2,612,104 | ||
| Aetna | 16,380 | 915,314 | ||
| Amgen | 22,250 b | 1,229,312 | ||
| Baxter International | 78,620 | 4,706,979 | ||
| Becton, Dickinson & Co. | 11,710 | 968,768 | ||
| CIGNA | 28,520 | 1,528,957 | ||
| Covidien | 9,815 | 393,679 | ||
| Hospira | 54,750 b | 2,370,675 | ||
| Johnson & Johnson | 50,810 | 3,441,869 | ||
| Merck & Co. | 103,560 | 6,147,322 | ||
| Pfizer | 58,310 | 1,385,446 | ||
| Schering-Plough | 173,140 | 5,419,282 | ||
| St. Jude Medical | 22,200 b | 882,450 | ||
| Thermo Fisher Scientific | 65,420 b | 3,770,809 | ||
| Wyeth | 64,300 | 3,157,130 | ||
| 38,930,096 |
12
| Common Stocks (continued) | Shares | Value ($) | ||
| Industrial—6.3% | ||||
| Allied Waste Industries | 72,250 b | 824,372 | ||
| Deere & Co. | 5,910 | 1,015,338 | ||
| Dover | 50,170 | 2,321,868 | ||
| Eaton | 40,940 | 3,656,351 | ||
| Emerson Electric | 80,000 | 4,561,600 | ||
| General Dynamics | 9,940 | 882,473 | ||
| General Electric | 124,350 | 4,761,362 | ||
| Goodrich | 21,900 | 1,561,251 | ||
| Honeywell International | 28,810 | 1,631,222 | ||
| L-3 Communications Holdings | 11,750 | 1,300,138 | ||
| Lockheed Martin | 7,100 | 785,757 | ||
| Raytheon | 30,550 | 1,889,518 | ||
| Textron | 57,830 | 3,993,162 | ||
| Tyco International | 9,815 | 393,876 | ||
| Union Pacific | 7,910 | 997,767 | ||
| US Airways Group | 15,180 a,b | 315,289 | ||
| Waste Management | 46,750 | 1,604,460 | ||
| 32,495,804 | ||||
| Information Technology—7.7% | ||||
| Amphenol, Cl. A | 19,550 | 847,492 | ||
| Apple | 20,020 b | 3,648,044 | ||
| Cisco Systems | 169,580 b | 4,751,631 | ||
| EMC | 83,670 b | 1,612,321 | ||
| Google, Cl. A | 4,480 b | 3,104,640 | ||
| Hewlett-Packard | 104,800 | 5,361,568 | ||
| Intel | 145,060 | 3,783,165 | ||
| McAfee | 58,270 b | 2,269,617 | ||
| Microsoft | 222,960 | 7,491,456 | ||
| NCR | 50,490 b | 1,208,731 | ||
| Oracle | 80,370 b | 1,621,867 | ||
| QUALCOMM | 68,700 | 2,801,586 | ||
| Teradata | 50,490 b | 1,310,720 | ||
| Western Union | 1 | 23 | ||
| 39,812,861 | ||||
| Materials—2.3% | ||||
| Air Products & Chemicals | 31,440 | 3,113,817 | ||
| Allegheny Technologies | 25,050 | 2,448,637 |
The Fund 13
S TAT E M E N T O F I N V E S T M E N T S (continued)
| Common Stocks (continued) | Shares | Value ($) | ||
| Materials (continued) | ||||
| Celanese, Ser. A | 45,000 | 1,785,600 | ||
| Dow Chemical | 19,640 | 823,702 | ||
| Freeport-McMoRan Copper & Gold | 12,170 | 1,203,978 | ||
| Mosaic | 5,670 a,b | 392,081 | ||
| Rohm & Haas | 23,700 a | 1,288,569 | ||
| Smurfit-Stone Container | 75,050 a,b | 826,301 | ||
| 11,882,685 | ||||
| Telecommunication Services—3.2% | ||||
| AT & T | 247,350 | 9,451,243 | ||
| Verizon Communications | 160,860 | 6,950,761 | ||
| 16,402,004 | ||||
| Utilities—3.4% | ||||
| Constellation Energy Group | 16,390 | 1,642,442 | ||
| Entergy | 16,220 | 1,938,939 | ||
| Exelon | 17,670 | 1,432,507 | ||
| FPL Group | 13,690 | 955,014 | ||
| Mirant | 25,640 a,b | 989,448 | ||
| NRG Energy | 57,880 a,b | 2,453,533 | ||
| PG & E | 43,050 | 1,991,924 | ||
| Questar | 32,470 | 1,735,522 | ||
| Sempra Energy | 56,580 | 3,543,040 | ||
| Southern | 30,660 a | 1,153,429 | ||
| 17,835,798 | ||||
| Total Common Stocks | ||||
| (cost $314,984,955) | 341,242,426 | |||
| Coupon | Maturity | Principal | ||||||
| Bonds and Notes—33.7% | Rate (%) | Date | Amount ($) | Value ($) | ||||
| Asset-Backed Ctfs./ | ||||||||
| Auto Receivables—.5% | ||||||||
| Americredit Prime Automobile | ||||||||
| Receivables, Ser. 2007-1, Cl. B | 5.35 | 9/9/13 | 210,000 | 210,865 | ||||
| Americredit Prime Automobile | ||||||||
| Receivables, Ser. 2007-1, Cl. C | 5.43 | 2/10/14 | 230,000 | 226,399 | ||||
| Capital One Auto Finance Trust, | ||||||||
| Ser. 2007-C, Cl. A3A | 5.13 | 4/16/12 | 960,000 | 958,219 | ||||
| Ford Credit Auto Owner Trust, | ||||||||
| Ser. 2007-A, Cl. C | 5.80 | 2/15/13 | 170,000 | 165,514 |
14
| Coupon | Maturity | Principal | ||||||||
| Bonds and Notes (continued) | Rate (%) | Date | Amount ($) | Value ($) | ||||||
| Asset-Backed Ctfs./ | ||||||||||
| Auto Receivables (continued) | ||||||||||
| Hyundai Auto Receivables Trust, | ||||||||||
| Ser. 2007-A, Cl. A3A | 5.04 | 1/17/12 | 335,000 | 336,258 | ||||||
| Wachovia Automobile Loan Owner | ||||||||||
| Trust, Ser. 2007-1, Cl. D | 5.65 | 2/20/13 | 735,000 | 689,651 | ||||||
| 2,586,906 | ||||||||||
| Asset-Backed Ctfs./ | ||||||||||
| Home Equity Loans—.0% | ||||||||||
| Citicorp Residential Mortgage | ||||||||||
| Securities, Ser. 2007-2, Cl. M8 | 7.00 | 6/25/37 | 115,000 c | 21,407 | ||||||
| Citicorp Residential Mortgage | ||||||||||
| Securities, Ser. 2007-2, Cl. M9 | 7.00 | 6/25/37 | 305,000 c | 45,750 | ||||||
| 67,157 | ||||||||||
| Commercial Mortgage | ||||||||||
| Pass-Through Ctfs.—2.7% | ||||||||||
| Banc of America Commercial | ||||||||||
| Mortgage, Ser. 2003-1, Cl. A1 | 3.88 | 9/11/36 | 976,162 | 956,911 | ||||||
| Banc of America Commercial | ||||||||||
| Mortgage, Ser. 2002-2, Cl. A3 | 5.12 | 7/11/43 | 225,000 | 225,810 | ||||||
| Bear Stearns Commercial | ||||||||||
| Mortgage Securities, | ||||||||||
| Ser. 2003-T12, Cl. A3 | 4.24 | 8/13/39 | 595,000 c | 586,247 | ||||||
| Crown Castle Towers, | ||||||||||
| Ser. 2006-1A, Cl. B | 5.36 | 11/15/36 | 250,000 d | 250,048 | ||||||
| Crown Castle Towers, | ||||||||||
| Ser. 2006-1A, Cl. C | 5.47 | 11/15/36 | 665,000 d | 656,195 | ||||||
| Crown Castle Towers, | ||||||||||
| Ser. 2006-1A, Cl. D | 5.77 | 11/15/36 | 730,000 d | 716,926 | ||||||
| CS First Boston Mortgage | ||||||||||
| Securities, Ser. 2005-C3, Cl. A2 | 4.51 | 7/15/37 | 1,000,000 | 992,028 | ||||||
| GMAC Commercial Mortgage | ||||||||||
| Securities, Ser. 2003-C3, Cl. A3 | 4.65 | 4/10/40 | 2,000,000 | 1,984,177 | ||||||
| Goldman Sachs Mortgage Securities | ||||||||||
| Corporation II, Ser. 2007-EOP, Cl. E | 5.12 | 3/6/20 | 475,000 c,d | 454,638 | ||||||
| Goldman Sachs Mortgage Securities | ||||||||||
| Corporation II, Ser. 2007-EOP, Cl. K | 5.73 | 3/6/20 | 275,000 c,d | 250,129 | ||||||
| J.P. Morgan Chase Commercial | ||||||||||
| Mortgage Securities, | ||||||||||
| Ser. 2004-C1, Cl. A2 | 4.30 | 1/15/38 | 895,000 | 876,068 | ||||||
The Fund 15
S TAT E M E N T O F I N V E S T M E N T S (continued)
| Coupon | Maturity | Principal | ||||||
| Bonds and Notes (continued) | Rate (%) | Date | Amount ($) | Value ($) | ||||
| Commercial Mortgage | ||||||||
| Pass-Through Ctfs. (continued) | ||||||||
| LB-UBS Commercial Mortgage Trust, | ||||||||
| Ser. 2001-C3, Cl. A2 | 6.37 | 12/15/28 | 785,000 | 821,375 | ||||
| Merrill Lynch Mortgage Trust, | ||||||||
| Ser. 2002-MW1, Cl. A4 | 5.62 | 7/12/34 | 2,290,000 | 2,338,594 | ||||
| Morgan Stanley Capital I, | ||||||||
| Ser. 2006-HQ9, Cl. A3 | 5.71 | 7/12/44 | 1,550,000 | 1,583,289 | ||||
| Morgan Stanley Capital I, | ||||||||
| Ser. 2007-T27, Cl. A2 | 5.80 | 6/13/42 | 425,000 c | 435,348 | ||||
| SBA CMBS Trust, | ||||||||
| Ser. 2006-1A, Cl. D | 5.85 | 11/15/36 | 261,000 d | 254,084 | ||||
| Sovereign Commercial Mortgage | ||||||||
| Securities Trust, | ||||||||
| Ser. 2007-C1, Cl. D | 5.83 | 7/22/30 | 320,000 c,d | 279,072 | ||||
| TIAA Seasoned Commercial Mortgage | ||||||||
| Trust, Ser. 2007-C4, Cl. A3 | 6.10 | 8/15/39 | 350,000 c | 361,670 | ||||
| 14,022,609 | ||||||||
| Consumer Discretionary—.2% | ||||||||
| Federated Retail Holdings, | ||||||||
| Gtd. Bonds | 5.35 | 3/15/12 | 475,000 | 463,368 | ||||
| Kellogg, | ||||||||
| Sr. Unsub. Notes | 5.13 | 12/3/12 | 460,000 | 463,999 | ||||
| Kraft Foods, | ||||||||
| Sr. Unscd. Notes | 6.00 | 2/11/13 | 105,000 | 108,942 | ||||
| Lowe’s Companies, | ||||||||
| Sr. Unscd. Notes | 5.60 | 9/15/12 | 110,000 | 113,522 | ||||
| 1,149,831 | ||||||||
| Energy—.2% | ||||||||
| ConocoPhillips Canada, | ||||||||
| Gtd. Notes | 5.30 | 4/15/12 | 460,000 | 474,123 | ||||
| Pemex Project Funding Master | ||||||||
| Trust, Gtd. Notes | 5.75 | 3/1/18 | 410,000 d | 414,910 | ||||
| 889,033 | ||||||||
| Financial—7.4% | ||||||||
| Aegon Funding, | ||||||||
| Gtd. Notes | 5.75 | 12/15/20 | 900,000 | 946,578 | ||||
| Allstate, | ||||||||
| Jr. Sub. Debs. | 6.50 | 5/15/57 | 225,000 a,c | 212,825 | ||||
16
| Coupon | Maturity | Principal | ||||||
| Bonds and Notes (continued) | Rate (%) | Date | Amount ($) | Value ($) | ||||
| Financial (continued) | ||||||||
| American International Group, | ||||||||
| Notes | 5.38 | 10/18/11 | 465,000 | 476,500 | ||||
| Ameriprise Financial, | ||||||||
| Jr. Sub. Notes | 7.52 | 6/1/66 | 225,000 c | 225,345 | ||||
| Amvescap, | ||||||||
| Sr. Unscd. Notes | 5.38 | 12/15/14 | 310,000 | 297,039 | ||||
| Bank of America, | ||||||||
| Sr. Notes | 4.38 | 12/1/10 | 665,000 | 664,783 | ||||
| Boeing Capital, | ||||||||
| Sr. Notes | 7.38 | 9/27/10 | 580,000 | 634,508 | ||||
| Boston Properties, | ||||||||
| Sr. Unscd. Notes | 5.63 | 4/15/15 | 925,000 | 910,998 | ||||
| Capmark Financial Group, | ||||||||
| Gtd. Notes | 5.88 | 5/10/12 | 720,000 d | 558,628 | ||||
| Chuo Mitsui Trust & Banking, | ||||||||
| Sub. Notes | 5.51 | 12/29/49 | 600,000 c,d | 550,965 | ||||
| Citigroup, | ||||||||
| Sr. Unscd. Notes | 5.30 | 10/17/12 | 445,000 | 449,616 | ||||
| Colonial Bank, | ||||||||
| Sub. Notes | 6.38 | 12/1/15 | 585,000 | 578,872 | ||||
| Countrywide Financial, | ||||||||
| Gtd. Notes | 5.80 | 6/7/12 | 420,000 | 315,207 | ||||
| Credit Suisse First Boston USA, | ||||||||
| Gtd. Notes | 4.13 | 1/15/10 | 2,000,000 | 1,991,138 | ||||
| Credit Suisse Guernsey, | ||||||||
| Jr. Sub. Notes | 5.86 | 5/29/49 | 556,000 c | 498,782 | ||||
| Erac USA Finance, | ||||||||
| Gtd. Notes | 7.00 | 10/15/37 | 480,000 d | 480,395 | ||||
| ERP Operating, | ||||||||
| Notes | 4.75 | 6/15/09 | 290,000 | 290,461 | ||||
| ERP Operating, | ||||||||
| Notes | 5.25 | 9/15/14 | 725,000 | 709,176 | ||||
| Federal Realty Investment Trust, | ||||||||
| Sr. Unscd. Bonds | 5.65 | 6/1/16 | 550,000 | 542,892 | ||||
| First Union, | ||||||||
| Sub. Notes | 6.38 | 1/15/09 | 440,000 | 447,645 | ||||
| General Electric Capital, | ||||||||
| Sr. Unscd. Notes | 5.25 | 10/19/12 | 1,880,000 | 1,928,741 |
The Fund 17
S TAT E M E N T O F I N V E S T M E N T S (continued)
| Coupon | Maturity | Principal | ||||||
| Bonds and Notes (continued) | Rate (%) | Date | Amount ($) | Value ($) | ||||
| Financial (continued) | ||||||||
| Goldman Sachs Capital II, | ||||||||
| Gtd. Bonds | 5.79 | 12/29/49 | 475,000 c | 424,733 | ||||
| Goldman Sachs Group, | ||||||||
| Sub. Notes | 5.63 | 1/15/17 | 400,000 | 389,928 | ||||
| HSBC Finance Capital Trust IX, | ||||||||
| Gtd. Notes | 5.91 | 11/30/35 | 900,000 c | 816,575 | ||||
| Janus Capital Group, | ||||||||
| Notes | 6.25 | 6/15/12 | 425,000 | 445,048 | ||||
| Jefferies Group, | ||||||||
| Sr. Unscd. Debs. | 6.25 | 1/15/36 | 625,000 | 556,844 | ||||
| Jefferies Group, | ||||||||
| Sr. Unscd. Notes | 7.75 | 3/15/12 | 550,000 | 599,419 | ||||
| JPMorgan Chase & Co., | ||||||||
| Sub. Notes | 5.13 | 9/15/14 | 1,200,000 | 1,182,916 | ||||
| Kaupthing Bank, | ||||||||
| Sub. Notes | 7.13 | 5/19/16 | 275,000 d | 267,894 | ||||
| Lehman Brothers Holdings, | ||||||||
| Sr. Notes | 5.08 | 8/21/09 | 600,000 c | 589,106 | ||||
| Liberty Property, | ||||||||
| Sr. Unscd. Notes | 5.50 | 12/15/16 | 250,000 | 238,406 | ||||
| M&T Bank, | ||||||||
| Sr. Unscd. Bonds | 5.38 | 5/24/12 | 595,000 | 594,788 | ||||
| Mack-Cali Realty, | ||||||||
| Sr. Unscd. Notes | 5.80 | 1/15/16 | 925,000 | 929,386 | ||||
| Marshall & Ilsley, | ||||||||
| Sr. Unscd. Notes | 5.63 | 8/17/09 | 955,000 | 972,780 | ||||
| Merrill Lynch, | ||||||||
| Sub. Notes | 5.70 | 5/2/17 | 765,000 | 729,131 | ||||
| MetLife, | ||||||||
| Sr. Unscd. Notes | 6.13 | 12/1/11 | 430,000 | 454,680 | ||||
| Morgan Stanley, | ||||||||
| Sr. Unscd. Notes | 5.75 | 8/31/12 | 1,010,000 | 1,031,373 | ||||
| Morgan Stanley, | ||||||||
| Sr. Unscd. Notes | 5.75 | 10/18/16 | 785,000 | 774,462 | ||||
| MUFG Capital Finance 1, | ||||||||
| Bank Gtd. Bonds | 6.35 | 7/29/49 | 1,200,000 c | 1,154,005 | ||||
| Northern Rock, | ||||||||
| Sub. Notes | 6.59 | 6/29/49 | 240,000 a,c,d | 146,622 |
18
| Coupon | Maturity | Principal | ||||||
| Bonds and Notes (continued) | Rate (%) | Date | Amount ($) | Value ($) | ||||
| Financial (continued) | ||||||||
| Pricoa Global Funding, | ||||||||
| Notes | 4.63 | 6/25/12 | 1,000,000 d | 1,009,144 | ||||
| Royal Bank of Scotland Group, | ||||||||
| Jr. Sub. Bonds | 6.99 | 10/29/49 | 1,345,000 c,d | 1,325,995 | ||||
| Shinsei Finance Cayman, | ||||||||
| Jr. Sub. Bonds | 6.42 | 1/29/49 | 600,000 c,d | 527,714 | ||||
| Simon Property Group, | ||||||||
| Unscd. Notes | 5.75 | 5/1/12 | 1,175,000 | 1,203,105 | ||||
| SMFG Preferred Capital, | ||||||||
| Sub. Bonds | 6.08 | 1/29/49 | 900,000 c,d | 830,295 | ||||
| SunTrust Preferred Capital I, | ||||||||
| Bank Gtd. Notes | 5.85 | 12/31/49 | 700,000 c | 656,152 | ||||
| Wachovia, | ||||||||
| Sub. Notes | 4.88 | 2/15/14 | 2,490,000 | 2,398,517 | ||||
| Wells Fargo Bank, | ||||||||
| Sub. Notes | 7.55 | 6/21/10 | 2,510,000 | 2,702,826 | ||||
| Zions Bancorporation, | ||||||||
| Sub. Notes | 5.50 | 11/16/15 | 700,000 | 677,988 | ||||
| Zions Bancorporation, | ||||||||
| Sub. Notes | 6.00 | 9/15/15 | 1,150,000 | 1,193,758 | ||||
| 38,534,684 | ||||||||
| Foreign/Governmental—.2% | ||||||||
| Republic of South Africa, | ||||||||
| Notes | 5.88 | 5/30/22 | 365,000 | 367,227 | ||||
| United Mexican States, | ||||||||
| Notes, Ser. A | 6.75 | 9/27/34 | 450,000 | 504,675 | ||||
| 871,902 | ||||||||
| Health Care—.1% | ||||||||
| American Home Products, | ||||||||
| Unscd. Notes | 6.95 | 3/15/11 | 475,000 c | 509,838 | ||||
| Teva Pharmaceutical Finance, | ||||||||
| Gtd. Notes | 6.15 | 2/1/36 | 240,000 | 239,880 | ||||
| 749,718 | ||||||||
| Industrial—.4% | ||||||||
| Atlas Copco, | ||||||||
| Bonds | 5.60 | 5/22/17 | 240,000 d | 243,639 | ||||
| Northrop Grumman, | ||||||||
| Gtd. Notes | 7.13 | 2/15/11 | 450,000 | 487,732 |
The Fund 19
S TAT E M E N T O F I N V E S T M E N T S (continued)
| Coupon | Maturity | Principal | ||||||
| Bonds and Notes (continued) | Rate (%) | Date | Amount ($) | Value ($) | ||||
| Industrial (continued) | ||||||||
| Raytheon, | ||||||||
| Sr. Unscd. Notes | 5.50 | 11/15/12 | 475,000 | 496,831 | ||||
| Rohm & Haas, | ||||||||
| Unsub. Notes | 5.60 | 3/15/13 | 145,000 | 151,055 | ||||
| Waste Management, | ||||||||
| Gtd. Notes | 7.38 | 5/15/29 | 285,000 | 319,128 | ||||
| Wellpoint, | ||||||||
| Sr. Unsub. Notes | 5.88 | 6/15/17 | 300,000 | 301,731 | ||||
| 2,000,116 | ||||||||
| Media & Telecommunications—1.0% | ||||||||
| AOL Time Warner, | ||||||||
| Gtd. Notes | 6.75 | 4/15/11 | 535,000 | 558,719 | ||||
| Comcast, | ||||||||
| Gtd. Notes | 6.50 | 11/15/35 | 435,000 | 435,927 | ||||
| France Telecom, | ||||||||
| Sr. Unsub. Notes | 8.50 | 3/1/31 | 375,000 c | 498,401 | ||||
| KPN, | ||||||||
| Sr. Unsub. Bonds | 8.38 | 10/1/30 | 275,000 | 330,890 | ||||
| News America, | ||||||||
| Notes | 5.30 | 12/15/14 | 500,000 | 499,736 | ||||
| Pacific Bell, | ||||||||
| Notes | 6.13 | 2/15/08 | 1,000,000 | 1,001,723 | ||||
| Telefonica Emisiones, | ||||||||
| Gtd. Notes | 5.98 | 6/20/11 | 475,000 | 489,366 | ||||
| Time Warner Cable, | ||||||||
| Gtd. Notes | 5.85 | 5/1/17 | 635,000 | 628,501 | ||||
| Verizon Communications, | ||||||||
| Sr. Notes | 5.85 | 9/15/35 | 500,000 | 501,111 | ||||
| 4,944,374 | ||||||||
| Real Estate Investment Trusts—.3% | ||||||||
| Avalonbay Communities, | ||||||||
| Sr. Unscd. Notes | 6.63 | 9/15/11 | 260,000 | 276,084 | ||||
| Duke Realty, | ||||||||
| Sr. Notes | 5.88 | 8/15/12 | 980,000 | 1,015,829 | ||||
| Regency Centers, | ||||||||
| Gtd. Notes | 5.88 | 6/15/17 | 400,000 | 393,240 | ||||
| 1,685,153 | ||||||||
20
| Coupon | Maturity | Principal | ||||||
| Bonds and Notes (continued) | Rate (%) | Date | Amount ($) | Value ($) | ||||
| State/Territory Gen Oblg—.3% |
| Delaware Housing Authority, | ||||||||
| SFMR | 5.80 | 7/1/16 | 345,000 | 353,749 | ||||
| Tobacco Settlement Finance | ||||||||
| Authority of West Virginia, | ||||||||
| Tobacco Settlement | ||||||||
| Asset-Backed Bonds | 7.47 | 6/1/47 | 1,070,000 | 1,065,538 | ||||
| 1,419,287 | ||||||||
| U.S. Government Agencies—3.1% | ||||||||
| Federal Home Loan Mortgage Corp., | ||||||||
| Notes | 5.13 | 7/15/12 | 5,130,000 | 5,383,525 | ||||
| Federal National Mortgage | ||||||||
| Association, Notes | 4.75 | 3/12/10 | 10,370,000 | 10,610,345 | ||||
| 15,993,870 | ||||||||
| U.S. Government Agencies/ | ||||||||
| Mortgage-Backed—13.6% | ||||||||
| Federal Home Loan Mortgage Corp.: | ||||||||
| 5.50%, 4/1/22—3/1/37 | 6,156,809 | 6,180,890 | ||||||
| 6.00%, 9/1/37 | 7,244,792 | 7,356,159 | ||||||
| Federal National Mortgage Association: | ||||||||
| 4.50%, 1/1/21 | 5,750,774 | 5,661,625 | ||||||
| 5.00%, 8/1/20—2/1/37 | 14,237,551 | 14,001,862 | ||||||
| 5.50%, 9/1/34—10/1/36 | 12,784,718 | 12,812,711 | ||||||
| 6.00%, 4/1/22—7/1/37 | 11,438,915 | 11,638,786 | ||||||
| 8.00%, 3/1/30 | 1,145 | 1,223 | ||||||
| Government National Mortgage Association I: | ||||||||
| Ser. 2006-19, Cl. A, 3.39%, 6/16/30 | 3,010,806 | 2,943,282 | ||||||
| Ser. 2004-103, Cl. A, 3.88%, 12/16/19 | 5,405,625 | 5,336,392 | ||||||
| Ser. 2007-52, Cl. A, 4.05%, 10/16/25 | 590,428 | 583,015 | ||||||
| Ser. 2006-66, Cl. A, 4.09%, 1/16/30 | 878,387 | 867,524 | ||||||
| Ser. 2007-34, Cl. A 4.27%, 11/16/26 | 2,987,860 | 2,961,175 | ||||||
| 70,344,644 | ||||||||
| U.S. Government Securities—3.0% | ||||||||
| U.S. Treasury Bonds | 4.50 | 2/15/36 | 7,881,000 a | 7,993,060 | ||||
| U.S. Treasury Notes | 4.13 | 8/31/12 | 2,585,000 a | 2,663,157 | ||||
| U.S. Treasury Notes | 4.50 | 5/15/17 | 4,340,000 a | 4,519,706 | ||||
| U.S. Treasury Notes | 4.75 | 8/15/17 | 370,000 a | 392,749 | ||||
| 15,568,672 | ||||||||
The Fund 21
S TAT E M E N T O F I N V E S T M E N T S (continued)
| Coupon | Maturity | Principal | ||||||
| Bonds and Notes (continued) | Rate (%) | Date | Amount ($) | Value ($) | ||||
| Utilities—.7% | ||||||||
| Appalachian Power, | ||||||||
| Sr. Unscd. Notes, Ser. O | 5.65 | 8/15/12 | 225,000 | 229,714 | ||||
| Cleveland Electric Illumination, | ||||||||
| Sr. Unscd. Notes | 5.70 | 4/1/17 | 725,000 | 715,004 | ||||
| Consolidated Edison, | ||||||||
| Debs., Ser. 07-A | 6.30 | 8/15/37 | 495,000 | 509,623 | ||||
| Enel Finance International, | ||||||||
| Gtd. Notes | 5.70 | 1/15/13 | 185,000 d | 188,761 | ||||
| Midamerican Energy Holdings, | ||||||||
| Sr. Unscd. Bonds | 6.50 | 9/15/37 | 475,000 | 495,322 | ||||
| National Grid, | ||||||||
| Sr. Unscd. Notes | 6.30 | 8/1/16 | 550,000 | 572,516 | ||||
| NiSource Finance, | ||||||||
| Gtd. Notes | 5.25 | 9/15/17 | 500,000 | 477,390 | ||||
| Southern, | ||||||||
| Sr. Unsub. Notes, Ser. A | 5.30 | 1/15/12 | 670,000 | 682,579 | ||||
| 3,870,909 | ||||||||
| Total Bonds and Notes | ||||||||
| (cost $173,096,864) | 174,698,865 | |||||||
| Other Investment—1.1% | Shares | Value ($) | ||||||
| Registered Investment Company; | ||||||||
| Dreyfus Institutional Preferred | ||||||||
| Plus Money Market Fund | ||||||||
| (cost $5,723,000) | 5,723,000 e | 5,723,000 | ||||||
22
| Investment of Cash Collateral | ||||
| for Securities Loaned—8.0% | Shares | Value ($) | ||
| Registered Investment Company; | ||||
| Dreyfus Institutional Cash | ||||
| Advantage Plus Fund | ||||
| (cost $41,477,200) | 41,477,200 e | 41,477,200 | ||
| Total Investments (cost $535,282,019) | 108.5% | 563,141,491 | ||
| Liabilities, Less Cash and Receivables | (8.5%) | (44,287,169) | ||
| Net Assets | 100.0% | 518,854,322 | ||
| ADR—American Depository Receipts |
| a All or a portion of these securities are on loan.At November 30, 2007, the total market value of the fund’s securities |
| on loan is $43,704,264 and the total market value of the collateral held by the fund is $44,329,799, consisting of |
| cash collateral of $41,477,200 and U.S. Government and Agency securities valued at $2,852,599. |
| b Non-income producing security. |
| c Variable rate security—interest rate subject to periodic change. |
| d Securities exempt from registration under Rule 144A of the Securities Act of 1933.These securities may be resold in |
| transactions exempt from registration, normally to qualified institutional buyers.At November 30, 2007, these |
| securities amounted to $9,406,054 or 1.8% of net assets. |
| e Investment in affiliated money market mutual fund. |
| Portfolio Summary (Unaudited) † | ||||||
| Value (%) | Value (%) | |||||
| U.S. Government & Agencies | 19.7 | Consumer Discretionary | 5.0 | |||
| Financial | 13.6 | Utilities | 3.4 | |||
| Corporate Bonds | 10.3 | Telecommunication Services | 3.2 | |||
| Money Market Investments | 9.1 | Asset/Mortgage-Backed | 3.2 | |||
| Energy | 8.7 | Materials | 2.3 | |||
| Information Technology | 7.7 | Exchange Traded Funds | .5 | |||
| Health Care | 7.5 | State/Government General Obligations | .3 | |||
| Consumer Staples | 7.5 | Foreign/Governmental | .2 | |||
| Industrial | 6.3 | 108.5 | ||||
| † Based on net assets. |
| See notes to financial statements. |
The Fund 23
| STATEMENT OF ASSETS AND LIABILITIES N o v e m b e r 3 0 , 2 0 0 7 |
| Cost | Value | |||
| Assets ($): | ||||
| Investments in securities—See Statement | ||||
| of Investments (including securities on loan, | ||||
| valued at $43,704,264—Note 1(b): | ||||
| Unaffiliated issuers | 488,081,819 | 515,941,291 | ||
| Affiliated issuers | 47,200,200 | 47,200,200 | ||
| Receivable for investment securities sold | 3,576,125 | |||
| Dividends and interest receivable | 2,199,144 | |||
| Receivable for shares of Beneficial Interest subscribed | 41,008 | |||
| Prepaid expenses | 58,481 | |||
| 569,016,249 | ||||
| Liabilities ($): | ||||
| Due to The Dreyfus Corporation and affiliates—Note 3(c) | 583,277 | |||
| Cash overdraft due to Custodian | 478,986 | |||
| Liability for securities on loan—Note 1(b) | 41,477,200 | |||
| Payable for investment securities purchased | 6,696,167 | |||
| Payable for shares of Beneficial Interest redeemed | 579,044 | |||
| Interest payable—Note 2 | 44,960 | |||
| Accrued expenses | 302,293 | |||
| 50,161,927 | ||||
| Net Assets ($) | 518,854,322 | |||
| Composition of Net Assets ($): | ||||
| Paid-in capital | 410,721,000 | |||
| Accumulated undistributed investment income—net | 7,266,375 | |||
| Accumulated net realized gain (loss) on investments | 73,007,475 | |||
| Accumulated net unrealized appreciation | ||||
| (depreciation) on investments | 27,859,472 | |||
| Net Assets ($) | 518,854,322 | |||
24
| Net Asset Value Per Share | ||
| Class A | ||
| Net Assets ($) | 151,796,034 | |
| Shares Outstanding | 7,132,267 | |
| Net Asset Value Per Share ($) | 21.28 | |
| Class B | ||
| Net Assets ($) | 147,807,167 | |
| Shares Outstanding | 7,026,524 | |
| Net Asset Value Per Share ($) | 21.04 | |
| Class C | ||
| Net Assets ($) | 85,800,656 | |
| Shares Outstanding | 4,065,467 | |
| Net Asset Value Per Share ($) | 21.10 | |
| Class I | ||
| Net Assets ($) | 711,391 | |
| Shares Outstanding | 33,429 | |
| Net Asset Value Per Share ($) | 21.28 | |
| Class T | ||
| Net Assets ($) | 1,650,135 | |
| Shares Outstanding | 77,724 | |
| Net Asset Value Per Share ($) | 21.23 | |
| Class J | ||
| Net Assets ($) | 54,149,483 | |
| Shares Outstanding | 2,532,480 | |
| Net Asset Value Per Share ($) | 21.38 | |
| Class Z | ||
| Net Assets ($) | 76,939,456 | |
| Shares Outstanding | 3,611,587 | |
| Net Asset Value Per Share ($) | 21.30 | |
See notes to financial statements.
The Fund 25
| STATEMENT OF OPERATIONS Ye a r E n d e d N o v e m b e r 3 0 , 2 0 0 7 |
| Investment Income ($): | ||
| Income: | ||
| Interest | 9,554,699 | |
| Dividends (net of $6,897 foreign taxes withheld at source): | ||
| Unaffiliated issuers | 7,113,290 | |
| Affiliated issuers | 606,677 | |
| Income from securities lending | 147,634 | |
| Total Income | 17,422,300 | |
| Expenses: | ||
| Management fee—Note 3(a) | 5,112,937 | |
| Distribution fees—Note 3(b) | 1,968,651 | |
| Shareholder servicing costs—Note 3(c) | 1,934,835 | |
| Professional fees | 89,742 | |
| Prospectus and shareholders’ reports | 74,721 | |
| Registration fees | 73,052 | |
| Interest expense—Note 2 | 58,075 | |
| Custodian fees—Note 3(c) | 53,765 | |
| Trustees’ fees and expenses—Note 3(d) | 36,210 | |
| Loan commitment fees—Note 2 | 8,376 | |
| Miscellaneous | 48,270 | |
| Total Expenses | 9,458,634 | |
| Less—reduction in expenses due to undertakings—Note 3(a) | (90,977) | |
| Less—reduction in management fees | ||
| due to undertakings—Note 3(a) | (439,257) | |
| Net Expenses | 8,928,400 | |
| Investment Income—Net | 8,493,900 | |
| Realized and Unrealized Gain (Loss) on Investments—Note 4 ($): | ||
| Net realized gain (loss) on investments | 84,355,183 | |
| Net unrealized appreciation (depreciation) on investments | (54,007,888) | |
| Net Realized and Unrealized Gain (Loss) on Investments | 30,347,295 | |
| Net Increase in Net Assets Resulting from Operations | 38,841,195 | |
See notes to financial statements.
26
STATEMENT OF CHANGES IN NET ASSETS
| Year Ended November 30, | ||||
| 2007 a | 2006 | |||
| Operations ($): | ||||
| Investment income—net | 8,493,900 | 10,196,285 | ||
| Net realized gain (loss) on investments | 84,355,183 | 2,583,451 | ||
| Net unrealized appreciation | ||||
| (depreciation) on investments | (54,007,888) | 55,131,456 | ||
| Net Increase (Decrease) in Net Assets | ||||
| Resulting from Operations | 38,841,195 | 67,911,192 | ||
| Dividends to Shareholders from ($): | ||||
| Investment income—net: | ||||
| Class A shares | (3,361,569) | (4,136,174) | ||
| Class B shares | (1,333,297) | (1,528,756) | ||
| Class C shares | (876,167) | (1,266,774) | ||
| Class I shares | (12,813) | (13,217) | ||
| Class T shares | (28,473) | (35,190) | ||
| Class J shares | (3,215,600) | (3,380,607) | ||
| Class Z shares | (1,480,730) | (1,649,529) | ||
| Net realized gain on investments: | ||||
| Class A shares | — | (2,190,107) | ||
| Class B shares | — | (1,522,455) | ||
| Class C shares | — | (1,267,277) | ||
| Class I shares | — | (6,187) | ||
| Class T shares | — | (23,345) | ||
| Class J shares | — | (1,586,403) | ||
| Class Z shares | — | (800,174) | ||
| Total Dividends | (10,308,649) | (19,406,195) | ||
| Beneficial Interest Transactions ($): | ||||
| Net proceeds from shares sold: | ||||
| Class A shares | 21,595,146 | 43,958,717 | ||
| Class B shares | 1,228,572 | 10,751,833 | ||
| Class C shares | 3,213,048 | 10,594,030 | ||
| Class I shares | 135,571 | 221,868 | ||
| Class T shares | 241,521 | 56,819 | ||
| Class J shares | 6,995,588 | 12,660,887 | ||
| Class Z shares | 3,126,160 | 3,995,680 | ||
The Fund 27
S TAT E M E N T O F C H A N G E S I N N E T A S S E T S (continued)
| Year Ended November 30, | ||||
| 2007 a | 2006 | |||
| Beneficial Interest Transactions ($) (continued): | ||||
| Dividends reinvested: | ||||
| Class A shares | 2,991,998 | 5,763,355 | ||
| Class B shares | 1,214,920 | 2,753,858 | ||
| Class C shares | 729,273 | 2,089,763 | ||
| Class I shares | 11,291 | 15,134 | ||
| Class T shares | 26,709 | 55,570 | ||
| Class J shares | 2,448,500 | 4,840,365 | ||
| Class Z shares | 1,455,485 | 2,403,351 | ||
| Cost of shares redeemed: | ||||
| Class A shares | (96,448,604) | (123,049,329) | ||
| Class B shares | (31,163,023) | (40,782,727) | ||
| Class C shares | (42,605,880) | (58,515,156) | ||
| Class I shares | (206,292) | (294,625) | ||
| Class T shares | (1,070,503) | (822,352) | ||
| Class J shares | (134,979,666) | (58,606,580) | ||
| Class Z shares | (17,164,661) | (26,099,802) | ||
| Increase (Decrease) in Net Assets from | ||||
| Beneficial Interest Transactions | (278,224,847) | (208,009,341) | ||
| Total Increase (Decrease) in Net Assets | (249,692,301) | (159,504,344) | ||
| Net Assets ($): | ||||
| Beginning of Period | 768,546,623 | 928,050,967 | ||
| End of Period | 518,854,322 | 768,546,623 | ||
| Undistributed investment income—net | 7,266,375 | 9,131,937 | ||
28
| Year Ended November 30, | ||||
| 2007 a | 2006 | |||
| Capital Share Transactions: | ||||
| Class Ab | ||||
| Shares sold | 1,042,005 | 2,277,810 | ||
| Shares issued for dividends reinvested | 147,758 | 306,496 | ||
| Shares redeemed | (4,622,304) | (6,371,316) | ||
| Net Increase (Decrease) in Shares Outstanding | (3,432,541) | (3,787,010) | ||
| Class B b | ||||
| Shares sold | 59,912 | 563,748 | ||
| Shares issued for dividends reinvested | 60,264 | 146,798 | ||
| Shares redeemed | (1,508,626) | (2,133,912) | ||
| Net Increase (Decrease) in Shares Outstanding | (1,388,450) | (1,423,366) | ||
| Class C | ||||
| Shares sold | 155,835 | 553,874 | ||
| Shares issued for dividends reinvested | 36,064 | 111,355 | ||
| Shares redeemed | (2,062,180) | (3,054,759) | ||
| Net Increase (Decrease) in Shares Outstanding | (1,870,281) | (2,389,530) | ||
| Class I | ||||
| Shares sold | 6,529 | 11,521 | ||
| Shares issued for dividends reinvested | 558 | 805 | ||
| Shares redeemed | (9,997) | (15,373) | ||
| Net Increase (Decrease) in Shares Outstanding | (2,910) | (3,047) | ||
| Class T | ||||
| Shares sold | 11,326 | 2,945 | ||
| Shares issued for dividends reinvested | 1,317 | 2,954 | ||
| Shares redeemed | (50,914) | (42,584) | ||
| Net Increase (Decrease) in Shares Outstanding | (38,271) | (36,685) | ||
| Class J | ||||
| Shares sold | 336,736 | 654,408 | ||
| Shares issued for dividends reinvested | 120,735 | 256,789 | ||
| Shares redeemed | (6,466,255) | (3,030,569) | ||
| Net Increase (Decrease) in Shares Outstanding | (6,008,784) | (2,119,372) | ||
| Class Z | ||||
| Shares sold | 150,310 | 207,035 | ||
| Shares issued for dividends reinvested | 71,947 | 127,829 | ||
| Shares redeemed | (824,753) | (1,353,306) | ||
| Net Increase (Decrease) in Shares Outstanding | (602,496) | (1,018,442) | ||
| a | Effective June 1, 2007, Class R shares were redesignated as Class I shares. | |
| b | During the period ended November 30, 2007, 205,307 Class B shares representing $4,309,745 were | |
| automatically converted to 206,660 Class A shares and during the period ended November 30, 2006, 176,176 | ||
| Class B shares representing $3,374,981 were automatically converted to 174,793 Class A shares. | ||
| See notes to financial statements. | ||
The Fund 29
FINANCIAL HIGHLIGHTS
The following tables describe the performance for each share class for the fiscal periods indicated. All information (except portfolio turnover rate) reflects financial results for a single fund share.Total return shows how much your investment in the fund would have increased (or decreased) during each period, assuming you had reinvested all dividends and distributions.These figures have been derived from the fund’s financial statements.
| Year Ended November 30, | ||||||||
| Class A Shares | 2007 | 2006 | 2005 | 2004 a | ||||
| Per Share Data ($): | ||||||||
| Net asset value, beginning of period | 20.38 | 19.15 | 19.30 | 18.86 | ||||
| Investment Operations: | ||||||||
| Investment income—net b | .33 | .28 | .28 | .28 | ||||
| Net realized and unrealized | ||||||||
| gain (loss) on investments | .89 | 1.40 | (.12) | .16 | ||||
| Total from Investment Operations | 1.22 | 1.68 | .16 | .44 | ||||
| Distributions: | ||||||||
| Dividends from investment income—net | (.32) | (.29) | (.19) | — | ||||
| Dividends from net realized | ||||||||
| gain on investments | — | (.16) | (.12) | — | ||||
| Total Distributions | (.32) | (.45) | (.31) | — | ||||
| Net asset value, end of period | 21.28 | 20.38 | 19.15 | 19.30 | ||||
| Total Return (%) c | 6.08 | 8.96 | .77 | 2.33d | ||||
| Ratios/Supplemental Data (%): | ||||||||
| Ratio of total expenses | ||||||||
| to average net assets | 1.23 | 1.21 | 1.21 | 1.03d | ||||
| Ratio of net expenses | ||||||||
| to average net assets | 1.16 | 1.21 | 1.21 | 1.03d | ||||
| Ratio of net investment income | ||||||||
| to average net assets | 1.57 | 1.44 | 1.43 | 1.52d | ||||
| Portfolio Turnover Rate | 168.94e | 33.30 | 39.39 | 32.41 | ||||
| Net Assets, end of period ($ X 1,000) | 151,796 | 215,342 | 274,871 | 214,949 | ||||
| a | From February 2, 2004 (commencement of operations) to November 30, 2004. | |
| b | Based on average shares outstanding at each month end. | |
| c | Exclusive of sales charge. | |
| d | Not annualized. | |
| e | The portfolio turnover rate excluding mortgage dollar roll transactions for the period ended November 30, 2007 was | |
| 162.34%. | ||
| See notes to financial statements. | ||
30
| Year Ended November 30, | ||||||||
| Class B Shares | 2007 | 2006 | 2005 | 2004a | ||||
| Per Share Data ($): | ||||||||
| Net asset value, beginning of period | 20.14 | 18.94 | 19.17 | 18.86 | ||||
| Investment Operations: | ||||||||
| Investment income—net b | .17 | .12 | .12 | .15 | ||||
| Net realized and unrealized | ||||||||
| gain (loss) on investments | .89 | 1.40 | (.11) | .16 | ||||
| Total from Investment Operations | 1.06 | 1.52 | .01 | .31 | ||||
| Distributions: | ||||||||
| Dividends from investment income—net | (.16) | (.16) | (.12) | — | ||||
| Dividends from net realized | ||||||||
| gain on investments | — | (.16) | (.12) | — | ||||
| Total Distributions | (.16) | (.32) | (.24) | — | ||||
| Net asset value, end of period | 21.04 | 20.14 | 18.94 | 19.17 | ||||
| Total Return (%) c | 5.30 | 8.11 | (.02) | 1.64d | ||||
| Ratios/Supplemental Data (%): | ||||||||
| Ratio of total expenses | ||||||||
| to average net assets | 2.02 | 2.01 | 2.00 | 1.70d | ||||
| Ratio of net expenses | ||||||||
| to average net assets | 1.94 | 2.01 | 2.00 | 1.70d | ||||
| Ratio of net investment income | ||||||||
| to average net assets | .81 | .65 | .64 | .83d | ||||
| Portfolio Turnover Rate | 168.94e | 33.30 | 39.39 | 32.41 | ||||
| Net Assets, end of period ($ X 1,000) | 147,807 | 169,513 | 186,377 | 134,791 | ||||
| a | From February 2, 2004 (commencement of operations) to November 30, 2004. | |
| b | Based on average shares outstanding at each month end. | |
| c | Exclusive of sales charge. | |
| d | Not annualized. | |
| e | The portfolio turnover rate excluding mortgage dollar roll transactions for the period ended November 30, 2007 was | |
| 162.34%. | ||
| See notes to financial statements. | ||
The Fund 31
F I N A N C I A L H I G H L I G H T S (continued)
| Year Ended November 30, | ||||||||
| Class C Shares | 2007 | 2006 | 2005 | 2004 a | ||||
| Per Share Data ($): | ||||||||
| Net asset value, beginning of period | 20.19 | 18.98 | 19.19 | 18.86 | ||||
| Investment Operations: | ||||||||
| Investment income—net b | .17 | .13 | .13 | .16 | ||||
| Net realized and unrealized | ||||||||
| gain (loss) on investments | .89 | 1.40 | (.11) | .17 | ||||
| Total from Investment Operations | 1.06 | 1.53 | .02 | .33 | ||||
| Distributions: | ||||||||
| Dividends from investment income—net | (.15) | (.16) | (.11) | — | ||||
| Dividends from net realized | ||||||||
| gain on investments | — | (.16) | (.12) | — | ||||
| Total Distributions | (.15) | (.32) | (.23) | — | ||||
| Net asset value, end of period | 21.10 | 20.19 | 18.98 | 19.19 | ||||
| Total Return (%) c | 5.29 | 8.14 | .06 | 1.75d | ||||
| Ratios/Supplemental Data (%): | ||||||||
| Ratio of total expenses | ||||||||
| to average net assets | 1.97 | 1.95 | 1.94 | 1.64d | ||||
| Ratio of net expenses | ||||||||
| to average net assets | 1.90 | 1.95 | 1.94 | 1.64d | ||||
| Ratio of net investment income | ||||||||
| to average net assets | .84 | .70 | .70 | .84d | ||||
| Portfolio Turnover Rate | 168.94e | 33.30 | 39.39 | 32.41 | ||||
| Net Assets, end of period ($ X 1,000) | 85,801 | 119,851 | 157,982 | 121,545 | ||||
| a | From February 2, 2004 (commencement of operations) to November 30, 2004. | |
| b | Based on average shares outstanding at each month end. | |
| c | Exclusive of sales charge. | |
| d | Not annualized. | |
| e | The portfolio turnover rate excluding mortgage dollar roll transactions for the period ended November 30, 2007 was | |
| 162.34%. | ||
| See notes to financial statements. | ||
32
| Year Ended November 30, | ||||||||
| Class I Shares | 2007 a | 2006 | 2005 | 2004 b | ||||
| Per Share Data ($): | ||||||||
| Net asset value, beginning of period | 20.39 | 19.17 | 19.31 | 18.86 | ||||
| Investment Operations: | ||||||||
| Investment income—net c | .36 | .31 | .32 | .35 | ||||
| Net realized and unrealized | ||||||||
| gain (loss) on investments | .89 | 1.40 | (.13) | .10 | ||||
| Total from Investment Operations | 1.25 | 1.71 | .19 | .45 | ||||
| Distributions: | ||||||||
| Dividends from investment income—net | (.36) | (.33) | (.21) | — | ||||
| Dividends from net realized | ||||||||
| gain on investments | — | (.16) | (.12) | — | ||||
| Total Distributions | (.36) | (.49) | (.33) | — | ||||
| Net asset value, end of period | 21.28 | 20.39 | 19.17 | 19.31 | ||||
| Total Return (%) | 6.23 | 9.12 | .95 | 2.38d | ||||
| Ratios/Supplemental Data (%): | ||||||||
| Ratio of total expenses | ||||||||
| to average net assets | 1.12 | 1.07 | 1.00 | .97d | ||||
| Ratio of net expenses | ||||||||
| to average net assets | 1.04 | 1.07 | 1.00 | .97d | ||||
| Ratio of net investment income | ||||||||
| to average net assets | 1.72 | 1.59 | 1.64 | 2.11d | ||||
| Portfolio Turnover Rate | 168.94e | 33.30 | 39.39 | 32.41 | ||||
| Net Assets, end of period ($ X 1,000) | 711 | 741 | 755 | 416 | ||||
| a | Effective June 1, 2007, Class R shares were redesignated as Class I shares. | |
| b | From February 2, 2004 (commencement of operations) to November 30, 2004. | |
| c | Based on average shares outstanding at each month end. | |
| d | Not annualized. | |
| e | The portfolio turnover rate excluding mortgage dollar roll transactions for the period ended November 30, 2007 was | |
| 162.34%. | ||
| See notes to financial statements. | ||
The Fund 33
F I N A N C I A L H I G H L I G H T S (continued)
| Year Ended November 30, | ||||||||
| Class T Shares | 2007 | 2006 | 2005 | 2004 a | ||||
| Per Share Data ($): | ||||||||
| Net asset value, beginning of period | 20.32 | 19.09 | 19.26 | 18.86 | ||||
| Investment Operations: | ||||||||
| Investment income—net b | .27 | .22 | .22 | .23 | ||||
| Net realized and unrealized | ||||||||
| gain (loss) on investments | .89 | 1.40 | (.11) | .17 | ||||
| Total from Investment Operations | 1.16 | 1.62 | .11 | .40 | ||||
| Distributions: | ||||||||
| Dividends from investment income—net | (.25) | (.23) | (.16) | — | ||||
| Dividends from net realized | ||||||||
| gain on investments | — | (.16) | (.12) | — | ||||
| Total Distributions | (.25) | (.39) | (.28) | — | ||||
| Net asset value, end of period | 21.23 | 20.32 | 19.09 | 19.26 | ||||
| Total Return (%) c | 5.79 | 8.65 | .52 | 2.12d | ||||
| Ratios/Supplemental Data (%): | ||||||||
| Ratio of total expenses | ||||||||
| to average net assets | 1.52 | 1.51 | 1.49 | 1.26d | ||||
| Ratio of net expenses | ||||||||
| to average net assets | 1.45 | 1.51 | 1.49 | 1.26d | ||||
| Ratio of net investment income | ||||||||
| to average net assets | 1.28 | 1.14 | 1.15 | 1.19d | ||||
| Portfolio Turnover Rate | 168.94e | 33.30 | 39.39 | 32.41 | ||||
| Net Assets, end of period ($ X 1,000) | 1,650 | 2,357 | 2,915 | 2,508 | ||||
| a | From February 2, 2004 (commencement of operations) to November 30, 2004. | |
| b | Based on average shares outstanding at each month end. | |
| c | Exclusive of sales charge. | |
| d | Not annualized. | |
| e | The portfolio turnover rate excluding mortgage dollar roll transactions for the period ended November 30, 2007 was | |
| 162.34%. | ||
| See notes to financial statements. | ||
34
| Year Ended November 30, | ||||||||||
| Class J Shares | 2007 | 2006 | 2005 | 2004 a | 2003 | |||||
| Per Share Data ($): | ||||||||||
| Net asset value, beginning of period | 20.47 | 19.22 | 19.35 | 18.05 | 16.37 | |||||
| Investment Operations: | ||||||||||
| Investment income—net | .36b | .33b | .31b | .34b | .25 | |||||
| Net realized and unrealized | ||||||||||
| gain (loss) on investments | .93 | 1.41 | (.11) | 1.21 | 1.69 | |||||
| Total from Investment Operations | 1.29 | 1.74 | .20 | 1.55 | 1.94 | |||||
| Distributions: | ||||||||||
| Dividends from investment income—net | (.38) | (.33) | (.21) | (.25) | (.26) | |||||
| Dividends from net realized | ||||||||||
| gain on investments | — | (.16) | (.12) | — | — | |||||
| Total Distributions | (.38) | (.49) | (.33) | (.25) | (.26) | |||||
| Net asset value, end of period | 21.38 | 20.47 | 19.22 | 19.35 | 18.05 | |||||
| Total Return (%) | 6.41 | 9.25 | .97 | 8.69 | 12.05 | |||||
| Ratios/Supplemental Data (%): | ||||||||||
| Ratio of total expenses | ||||||||||
| to average net assets | .91 | .96 | 1.02 | .95 | 1.08 | |||||
| Ratio of net expenses | ||||||||||
| to average net assets | .87 | .96 | 1.01 | .95 | 1.07 | |||||
| Ratio of net investment income | ||||||||||
| to average net assets | 1.77 | 1.69 | 1.62 | 1.79 | 1.90 | |||||
| Portfolio Turnover Rate | 168.94c | 33.30 | 39.39 | 32.41 | 41.73 | |||||
| Net Assets, end of period ($ X 1,000) | 54,149 | 174,820 | 204,901 | 245,171 | 216,991 | |||||
| a | The fund commenced offering six classes of shares on February 2, 2004.The existing shares were redesignated Class | |
| J shares. | ||
| b | Based on average shares outstanding at each month end. | |
| c | The portfolio turnover rate excluding mortgage dollar roll transactions for the period ended November 30, 2007 was | |
| 162.34%. | ||
| See notes to financial statements. | ||
The Fund 35
F I N A N C I A L H I G H L I G H T S (continued)
| Year Ended November 30, | ||||||
| Class Z Shares | 2007 | 2006 | 2005 a | |||
| Per Share Data ($): | ||||||
| Net asset value, beginning of period | 20.39 | 19.16 | 19.60 | |||
| Investment Operations: | ||||||
| Investment income—net b | .38 | .30 | .29 | |||
| Net realized and unrealized | ||||||
| gain (loss) on investments | .89 | 1.41 | (.40) | |||
| Total from Investment Operations | 1.27 | 1.71 | (.11) | |||
| Distributions: | ||||||
| Dividends from investment income—net | (.36) | (.32) | (.21) | |||
| Dividends from net realized gain on investments | — | (.16) | (.12) | |||
| Total Distributions | (.36) | (.48) | (.33) | |||
| Net asset value, end of period | 21.30 | 20.39 | 19.16 | |||
| Total Return (%) | 6.31 | 9.11 | (.59)c | |||
| Ratios/Supplemental Data (%): | ||||||
| Ratio of total expenses to average net assets | 1.12 | 1.15 | 1.15c | |||
| Ratio of net expenses to average net assets | .93 | 1.07 | 1.02c | |||
| Ratio of net investment income | ||||||
| to average net assets | 1.83 | 1.58 | 1.51c | |||
| Portfolio Turnover Rate | 168.94d | 33.30 | 39.39 | |||
| Net Assets, end of period ($ X 1,000) | 76,939 | 85,923 | 100,250 | |||
| a | From December 18, 2004 (commencement of initial offering) to November 30, 2005. | |
| b | Based on average shares outstanding at each month end. | |
| c | Not annualized. | |
| d | The portfolio turnover rate excluding mortgage dollar roll transactions for the period ended November 30, 2007 | |
| was 162.34%. | ||
| See notes to financial statements. | ||
36
NOTES TO FINANCIAL STATEMENTS
NOTE 1—Significant Accounting Policies:
Dreyfus Premier Balanced Opportunity Fund (the “fund”) is a separate diversified series of Dreyfus Premier Manager Funds II (the “Company”), which is registered under the Investment Company Act of 1940, as amended (the “Act”), as an open-end management investment company and operates as a series company currently offering the fund as its only series.The fund’s investment objective is to seek a high total return through a combination of capital appreciation and current income. The Dreyfus Corporation (the “Manager” or “Dreyfus”) serves as the fund’s investment adviser.
On July 1, 2007, Mellon Financial Corporation (‘Mellon Financial”) and The Bank of New York Company, Inc. merged, forming The Bank of New York Mellon Corporation (“BNY Mellon”). As part of this transaction, Dreyfus became a wholly-owned subsidiary of BNY Mellon.
The fund’s Board of Trustees approved the redesignation of the fund’s Class R shares as Class I shares, effective June 1, 2007. The eligibility requirements for Class I shares remained the same as for Class R shares.
MBSC Securities Corporation (the “Distributor”), a wholly-owned subsidiary of the Manager, is the Distributor of the fund’s shares.The fund is authorized to issue an unlimited number of $.001 par value shares of Beneficial Interest in each of the following classes of shares: Class A, Class B, Class C, Class I, Class T, Class J and Class Z shares. Class A and Class T shares are subject to a sales charge imposed at the time of purchase. Class B shares are subject to a contingent deferred sales charge (“CDSC”) imposed on Class B share redemptions made within six years of purchase and automatically convert to Class A shares after six years.The fund does not offer Class B shares, except in connection with dividend reinvestment and permitted exchanges of Class B shares. Class C shares are subject to a CDSC imposed on Class C shares redeemed within one year of purchase. Class I, Class J and Class Z shares are sold at net asset value per share. Class I shares are sold only to institutional investors and Class J and Class Z shares are
The Fund 37
N O T E S T O F I N A N C I A L S TAT E M E N T S (continued)
closed to new investors. Other differences between the classes include the services offered to and the expenses borne by each class, the allocation of certain transfer agency costs and certain voting rights. Income, expenses (other than expenses attributable to a specific class), and realized and unrealized gains or losses on investments are allocated to each class of shares based on its relative net assets.
The Company accounts separately for the assets, liabilities and operations of each series. Expenses directly attributable to each series are charged to that series’ operations; expenses which are applicable to all series are allocated among them on a pro rata basis.
The fund’s financial statements are prepared in accordance with U.S. generally accepted accounting principles, which requires the use of management estimates and assumptions. Actual results could differ from those estimates.
The fund enters into contracts that contain a variety of indemnifications. The fund’s maximum exposure under these arrangements is unknown.The fund does not anticipate recognizing any loss related to these arrangements.
(a) Portfolio valuation: Investments in securities are valued at the last sales price on the securities exchange or national securities market on which such securities are primarily traded. Securities listed on the National Market System for which market quotations are available are valued at the official closing price or, if there is no official closing price that day, at the last sales price. Securities not listed on an exchange or the national securities market, or securities for which there were no transactions, are valued at the average of the most recent bid and asked prices, except for open short positions, where the asked price is used for valuation purposes. Bid price is used when no asked price is available. Registered open-end investment companies that are not traded on an exchange are valued at their net asset value.When market quotations or official closing prices are not readily available, or are determined not to reflect accurately fair value, such as when the value of a security has been significantly affected by events after the close of the exchange or market
38
on which the security is principally traded (for example, a foreign exchange or market), but before the fund calculates its net asset value, the fund may value these investments at fair value as determined in accordance with the procedures approved by the Board of Trustees. Fair valuing of securities may be determined with the assistance of a pricing service using calculations based on indices of domestic securities and other appropriate indicators, such as prices of relevant ADR’s and futures contracts. For other securities that are fair valued by the Board of Trustees, certain factors may be considered such as: fundamental analytical data, the nature and duration of restrictions on disposition, an evaluation of the forces that influence the market in which the securities are purchased and sold and public trading in similar securities of the issuer or comparable issuers. Financial futures are valued at the last sales price.
Debt securities excluding short-term investments (other than U.S. Treasury Bills) are valued each business day by an independent pricing service (the “Service”) approved by the Board of Trustees. Investments for which quoted bid prices are readily available and are representative of the bid side of the market in the judgment of the Service are valued at the mean between the quoted bid prices (as obtained by the Service from dealers in such securities) and asked prices (as calculated by the Service based upon its evaluation of the market for such securities). Other debt securities are valued as determined by the Service, based on methods which include consideration of: yields or prices of securities of comparable quality, coupon, maturity and type; indications as to values from dealers; and general market conditions. Restricted securities, as well as securities or other assets for which recent market quotations are not readily available, that are not valued by a pricing service approved by the Board of Trustees, or are determined by the fund not to reflect accurately fair value, are valued at fair value as determined in good faith under the direction of the Board of Trustees.The factors that may be considered when fair valuing a security include fundamental analytical data, the nature and duration of restrictions on disposition, an evaluation of the forces that influence the market in which the securities are purchased and sold and public
The Fund 39
N O T E S T O F I N A N C I A L S TAT E M E N T S (continued)
trading in similar securities of the issuer or comparable issuers. Short-term investments, excluding U.S. Treasury Bills, are carried at amortized cost, which approximates value.
The Financial Accounting Standards Board (“FASB”) released Statement of Financial Accounting Standards No. 157 “Fair Value Measurements” (“FAS 157”). FAS 157 establishes an authoritative definition of fair value, sets out a framework for measuring fair value, and requires additional disclosures about fair-value measurements. The application of FAS 157 is required for fiscal years beginning after November 15, 2007 and interim periods within those fiscal years. Management does not believe that the application of this standard will have a material impact on the financial statements of the fund.
(b) Securities transactions and investment income: Securities transactions are recorded on a trade date basis. Realized gains and losses from securities transactions are recorded on the identified cost basis. Dividend income is recognized on the ex-dividend date and interest income, including, where applicable, accretion of discount and amortization of premium on investments, is recognized on the accrual basis.
The fund has an arrangement with the custodian bank whereby the fund receives earnings credits from the custodian when positive cash balances are maintained, which are used to offset custody fees. For financial reporting purposes, the fund includes net earnings credits, if any, as an expense offset in the Statement of Operations.
Pursuant to a securities lending agreement with Mellon Bank, N.A. (“Mellon Bank”), an affiliate of the Manager, the fund may lend securities to qualified institutions. It is the fund’s policy, that at origination, all loans are secured by collateral of at least 102% of the value of U.S. securities loaned and 105% of the value of foreign securities loaned. Collateral equivalent to at least 100% of the market value of securities on loan is maintained at all times. Cash collateral is invested in certain money market mutual funds managed by the Manager. The fund is entitled to receive all income on securities loaned, in addition to income earned as a result of the lending transaction. Although each
40
security loaned is fully collateralized, the fund bears the risk of delay in recovery of, or loss of rights in, the securities loaned should a borrower fail to return the securities in a timely manner. During the period ended November 30, 2007, Mellon Bank earned $63,272 from lending fund portfolio securities, pursuant to the securities lending agreement.
(c) Affiliated issuers: Investments in other investment companies advised by the Manager are defined as “affiliated” in the Act.
(d) Dividends to shareholders: Dividends are recorded on the ex-dividend date. Dividends from investment income-net and dividends from net realized capital gains, if any, are normally declared and paid annually, but the fund may make distributions on a more frequent basis to comply with the distribution requirements of the Internal Revenue Code of 1986, as amended (the “Code”).To the extent that net realized capital gains can be offset by capital loss carryovers, if any, it is the policy of the fund not to distribute such gains. Income and capital gain distributions are determined in accordance with income tax regulations, which may differ from U.S. generally accepted accounting principles.
(e) Federal income taxes: It is the policy of the fund to continue to qualify as a regulated investment company, if such qualification is in the best interests of its shareholders, by complying with the applicable provisions of the Code, and to make distributions of taxable income sufficient to relieve it from substantially all federal income and excise taxes. Accordingly, no provision for income tax is required.
The FASB released FASB Interpretation No. 48 “Accounting for Uncertainty in Income Taxes” (FIN 48). FIN 48 provides guidance for how uncertain tax positions should be recognized, measured, presented and disclosed in the financial statements. FIN 48 requires the evaluation of tax positions taken or expected to be taken in the course of preparing the fund’s tax returns to determine whether the tax positions are “more-likely-than-not” of being sustained by the applicable tax authority. Tax positions not deemed to meet the more-likely-than-not threshold would be recorded as a tax benefit or expense in the current year. Adoption
The Fund 41
N O T E S T O F I N A N C I A L S TAT E M E N T S (continued)
of FIN 48 is required for fiscal years beginning after December 15, 2006 and is to be applied to all open tax years as of the effective date. Management does not believe that the application of this standard will have a material impact on the financial statements of the fund.
At November 30, 2007, the components of accumulated earnings on a tax basis were as follows: undistributed ordinary income $12,107,800, undistributed capital gains $70,428,519 and unrealized appreciation $26,255,143. In addition, the fund had $658,140 of capital losses realized after October 31, 2007 which were deferred for tax purposes to the first day of the following fiscal year.
The tax characters of distributions paid to shareholders during the fiscal periods ended November 30, 2007 and November 30, 2006 were as follows: ordinary income $10,308,649 and $12,015,614 and long-term capital gains $0 and $7,390,581, respectively.
During the period ended November 30, 2007, as a result of permanent book to tax differences, primarily due to the tax treatment for paydown gains and losses on mortgage-backed securities, the fund decreased accumulated undistributed investment income-net by $50,813 and increased accumulated net realized gain (loss) on investments by the same amount. Net assets and net asset value per share were not affected by this reclassification.
NOTE 2—Bank Line of Credit:
The fund participates with other Dreyfus-managed funds in a $350 million redemption credit facility (the “Facility”) to be utilized for temporary or emergency purposes, including the financing of redemptions. In connection therewith, the fund has agreed to pay commitment fees on its pro rata portion of the Facility. Interest is charged to the fund based on prevailing market rates in effect at the time of borrowing.
The average daily amount of borrowings outstanding under the Facility during the period ended November 30, 2007 was approximately $1,038,100, with a related weighted average annualized interest rate of 5.59% .
42
NOTE 3—Management Fee, Sub-Investment Advisory Fee and Other Transactions With Affiliates:
(a) Pursuant to a Management Agreement (“Agreement”) with the Manager, the management fee is computed at the annual rate of .80% of the value of the fund’s average daily net assets and is payable monthly. Dreyfus has contractually agreed, from December 1, 2006 through November 30, 2007, to waive receipt of its fees and/or assume the expenses of the fund, so that annual fund operating expenses for Class J, exclusive of taxes, interest, brokerage commissions, commitment fees and extraordinary expenses, do not exceed 1.11% . The Manager has contractually agreed from December 1, 2006 through November 30, 2007, to waive receipt of its fees and/or assume the expenses of the fund, so that annual fund operating expenses for Class Z, exclusive of expenses as described above, do not exceed 1.08% . The reduction in expenses for Class Z shares, pursuant to the undertaking, amounted to $90,977 during the period ended November 30, 2007.
Effective March 8, 2007, the Manager has agreed to waive receipt of a portion of the fund’s management fee, in the amount of .10% of the value of the fund’s average daily net assets until November 30, 2008. The reduction in management fee, pursuant to the undertaking, amounted to $439,257 during the period ended November 30, 2007.
Pursuant to a Sub-Investment Advisory Agreement that expired on March 30, 2007 between the Manager and Wisconsin Capital Management, LLC (“Wisconsin Capital”), the Manager paid Wisconsin Capital, the fund’s former sub-advisor, a monthly fee in the amount of 100% of the management fee paid by the fund to the Manager for such month, less certain fees waived or expenses paid or reimbursed by the Manager, on the fund’s assets attributable to accounts of shareholders who have an adviser-client relationship with Wisconsin Capital,plus,with respect to all other assets of the fund, an annual fee of .30% of the value of the fund’s average daily net assets up to $300 million and .25% of the value of the fund’s average daily net assets in excess of $300 million, payable monthly.
The Fund 43
N O T E S T O F I N A N C I A L S TAT E M E N T S (continued)
During the period ended November 30, 2007, the Distributor retained $27,953 and $1,130 from commissions earned on sales of the fund’s Class A and Class T shares, respectively, and $464,255 and $8,817 from CDSC on redemptions of the fund’s Class B and Class C shares, respectively.
(b) Under the Distribution Plan (the “Plan”) adopted pursuant to Rule 12b-1 under the Act, Class B, Class C and Class T shares pay the Distributor for distributing their shares at an annual rate of .75% of the value of their average daily net assets of Class B and Class C shares and .25% of the value of the average daily net assets of Class T shares. During the period ended November 30, 2007, Class B, Class C and Class T shares were charged $1,198,097, $765,522 and $5,032, respectively, pursuant to the Plan.
(c) Under the Shareholder Services Plan, Class A, Class B, Class C and Class T shares pay the Distributor at an annual rate of .25% of the value of their average daily net assets for the provision of certain services. The services provided may include personal services relating to shareholder accounts, such as answering shareholder inquiries regarding the fund and providing reports and other information, and services related to the maintenance of shareholder accounts. The Distributor may make payments to Service Agents (a securities dealer, financial institution or other industry professional) in respect of these services. The Distributor determines the amounts to be paid to Service Agents. During the period ended November 30, 2007, Class A, Class B, Class C and Class T shares were charged $469,967, $399,366, $255,174 and $5,032, respectively, pursuant to the Shareholder Services Plan.
Under the Shareholder Services Plan, Class Z shares reimburse the Distributor an amount not to exceed an annual rate of .25% of the value of Class Z shares’ average daily net assets for certain allocated expenses of providing personal services and/or maintaining shareholder accounts.The services provided may include personal services relating to shareholder accounts, such as answering shareholder inquiries regarding Class Z shares and providing reports and other
44
information, and services related to the maintenance of shareholder accounts. During the period ended November 30, 2007, Class Z shares were charged $42,000, pursuant to the Shareholder Services Plan.
The fund compensates Dreyfus Transfer, Inc., a wholly-owned subsidiary of the Manager, under a transfer agency agreement for providing personnel and facilities to perform transfer agency services for the fund. During the period ended November 30, 2007, the fund was charged $302,510 pursuant to the transfer agency agreement.
The fund compensates Mellon Bank, an affiliate of the Manager, under a custody agreement for providing custodial services for the fund. During the period ended November 30, 2007, the fund was charged $53,765 pursuant to the custody agreement.
During the period ended November 30, 2007, the fund was charged $4,740 for services performed by the Chief Compliance Officer.
The components of “Due to The Dreyfus Corporation and affiliates” in the Statement of Assets and Liabilities consist of: management fees $343,277, Rule 12b-1 distribution plan fees $144,195, shareholder services plan fees $80,057, custodian fees $8,779, chief compliance officer fees $3,214 and transfer agency per account fees $49,740, which are offset against an expense reimbursement currently in effect in the amount of $45,985.
(d) Each Board member also serves as a Board member of other funds within the Dreyfus complex. Annual retainer fees and attendance fees are allocated to each fund based on net assets.
NOTE 4—Securities Transactions:
The aggregate amount of purchases and sales (including paydowns) of investment securities, excluding short-term securities, during the period ended November 30, 2007, amounted to $1,072,449,944 and $1,349,327,886, respectively, of which $41,857,431 in purchases and $41,866,958 in sales were from mortgage dollar roll transactions.
The Fund 45
N O T E S T O F I N A N C I A L S TAT E M E N T S (continued)
A mortgage dollar roll transaction involves a sale by the fund of mortgage related securities that it holds with an agreement by the fund to repurchase similar securities at an agreed upon price and date. The securities purchased will bear the same interest rate as those sold, but generally will be collateralized by pools of mortgages with different prepayment histories than those securities sold.
At November 30, 2007, the cost of investments for federal income tax purposes was $536,886,348; accordingly, accumulated net unrealized appreciation on investments was $26,255,143, consisting of $41,816,562 gross unrealized appreciation and $15,561,419 gross unrealized depreciation.
| NOTE 5—Change in Independent Registered Public Accounting Firm: |
PricewaterhouseCoopers LLP ("PWC"), 300 Madison Avenue, 28th Floor, New York, New York 10017, an independent registered public accounting firm, was the independent registered public accounting firm for the fund for the fiscal year ended November 30, 2006.At a meeting held on December 5, 2006, the Audit Committee and the Board of Trustees of the Company engaged Ernst & Young LLP to replace PWC as the independent registered public accounting firm for the Company, effective upon the completion of services related to the audit of the 2006 financial statements of the Company.
During the Company’s past four fiscal years and any subsequent interim period: (i) no report on the Company’s financial statements contained an adverse opinion or a disclaimer of opinion, or was qualified or modified as to uncertainty, audit scope, or accounting principles; and (ii) there were no “disagreements” (as such term is used in Item 304 of Regulation S-K) with PWC on any matter of accounting principles or practices, financial statement disclosure, or auditing scope or procedure, which disagreement(s), if not resolved to the satisfaction of PWC, would have caused it to make reference to the subject matter of the disagreement(s) in connection with its report.
46
| REPORT OF INDEPENDENT REGISTERED PUBLIC ACCOUNTING FIRM |
| Shareholders and Board of Trustees Dreyfus Premier Balanced Opportunity Fund |
We have audited the accompanying statement of assets and liabilities, including the statement of investments, of Dreyfus Premier Balanced Opportunity Fund (one of the funds comprising Dreyfus Premier Manager Funds II), as of November 30, 2007, and the related statement of operations, the statement of changes in net assets and financial highlights for the year then ended.These financial statements and financial highlights are the responsibility of the Fund’s management. Our responsibility is to express an opinion on these financial statements and financial highlights based on our audit.The statement of changes in net assets of Dreyfus Premier Balanced Opportunity Fund for the year ended November 30, 2006 and the financial highlights for each of the indicated periods through November 30, 2006 were audited by other auditors whose report dated January 19, 2007, expressed an unqualified opinion on the statement and financial highlights.
We conducted our audit in accordance with the standards of the Public Company Accounting Oversight Board (United States).Those standards require that we plan and perform the audit to obtain reasonable assurance about whether the financial statements and financial highlights are free of material misstatement.We were not engaged to perform an audit of the Fund’s internal control over financial reporting. Our audit included consideration of internal control over financial reporting as a basis for designing audit procedures that are appropriate in the circumstances,but not for the purpose of expressing an opinion on the effectiveness of the Fund’s internal control over financial reporting.Accordingly, we express no such opinion.An audit also includes examining, on a test basis, evidence supporting the amounts and disclosures in the financial statements and financial highlights, assessing the accounting principles used and significant estimates made by management, and evaluating the overall financial statement presentation. Our procedures included confirmation of securities as of November 30, 2007 by correspondence with the custodian and oth-ers.We believe that our audit provides a reasonable basis for our opinion.
In our opinion, the financial statements and financial highlights referred to above present fairly, in all material respects, the financial position of Dreyfus Premier Balanced Opportunity Fund at November 30, 2007, and the results of its operations, the changes in its net assets and the financial highlights for the year then ended, in conformity with accounting principles generally accepted in the United States.

| New York, New York January 17, 2008 |
The Fund 47
IMPORTANT TAX INFORMATION ( U n a u d i t e d )
For federal tax purposes, the fund hereby designates 88.98% of the ordinary dividends paid during the fiscal year ended November 30, 2007 as qualifying for the corporate dividends received deduction. For the fiscal year ended November 30, 2007, certain dividends paid by the fund may be subject to a maximum tax rate of 15%, as provided for by the Jobs and Growth Tax Relief Reconciliation Act of 2003. Of the distributions paid during the fiscal year, $1,112,382 represents the maximum amount that may be considered qualified dividend income. Shareholders will receive notification in January 2008 of the percentage applicable to the preparation of their 2007 income tax returns.
48
BOARD MEMBERS INFORMATION ( U n a u d i t e d )
| Joseph S. DiMartino (64) Chairman of the Board (2003) |
| Principal Occupation During Past 5 Years: • Corporate Director and Trustee |
| Other Board Memberships and Affiliations: |
- The Muscular Dystrophy Association, Director
- Century Business Services, Inc., a provider of outsourcing functions for small and medium size companies, Director
- The Newark Group, a provider of a national market of paper recovery facilities, paperboard mills and paperboard converting plants, Director
- Sunair Services Corporation, a provider of certain outdoor-related services to homes and businesses, Director
No. of Portfolios for which Board Member Serves: 164
———————
Peggy C. Davis (64) Board Member (2006)
| Principal Occupation During Past 5 Years: |
- Shad Professor of Law, New York University School of Law (1983-present)
- Writer and teacher in the fields of evidence, constitutional theory, family law, social sciences and the law, legal process and professional methodology and training
| No. of Portfolios for which Board Member Serves: 63 |
———————
| David P. Feldman (68) Board Member (2003) |
| Principal Occupation During Past 5 Years: • Corporate Director and Trustee |
| Other Board Memberships and Affiliations: |
- BBH Mutual Funds Group (11 funds), Director
- The Jeffrey Company, a private investment company, Director
| No. of Portfolios for which Board Member Serves: 50 |
The Fund 49
B O A R D M E M B E R S I N F O R M AT I O N ( U n a u d i t e d ) (continued)
| James F. Henry (76) Board Member (2006) |
| Principal Occupation During Past 5 Years: |
- President,The International Institute for Conflict Prevention and Resolution, a non-profit organization principally engaged in the development of alternatives to business litigation (Retired 2003)
- Advisor to The Elaw Forum, a consultant on managing corporate legal costs
- Advisor to John Jay Homestead (the restored home of the first U.S. Chief Justice)
- Individual Trustee of several trusts
| Other Board Memberships and Affiliations: |
- Director, advisor and mediator involved in several non-profit organizations, primarily engaged in domestic and international dispute resolution, and historic preservation
| No. of Portfolios for which Board Member Serves: 40 |
———————
Ehud Houminer (67) Board Member (2003)
Principal Occupation During Past 5 Years:
• Executive-in-Residence at the Columbia Business School, Columbia University
| Other Board Memberships and Affiliations: |
- Avnet Inc., an electronics distributor, Director
- International Advisory Board to the MBA Program School of Management, Ben Gurion University, Chairman
No. of Portfolios for which Board Member Serves: 67
———————
Gloria Messinger (78) Board Member (2003)
| Principal Occupation During Past 5 Years: |
- Arbitrator for American Arbitration Association and National Association of Securities Dealers, Inc.
- Consultant in Intellectual Property
| Other Board Memberships and Affiliations: |
- Theater for a New Audience, Inc., Director
- Brooklyn Philharmonic, Director
| No. of Portfolios for which Board Member Serves: 40 |
50
| Dr. Martin Peretz (68) Board Member (2006) |
| Principal Occupation During Past 5 Years: |
- Editor-in-Chief of The New Republic Magazine
- Lecturer in Social Studies at Harvard University (1965-2002)
- Director of TheStreet.com, a financial information service on the web
| Other Board Memberships and Affiliations: |
- American Council of Trustees and Alumni, Director
- Pershing Square Capital Management, Advisor
- Montefiore Ventures, General Partner
- Harvard Center for Blood Research,Trustee
- Bard College,Trustee
- Board of Overseers of YIVO Institute for Jewish Research, Chairman
No. of Portfolios for which Board Member Serves: 40
———————
Anne Wexler (77) Board Member (2003)
| Principal Occupation During Past 5 Years: |
- Chairman of the Wexler & Walker Public Policy Associates, consultants specializing in government relations and public affairs from January 1981 to present
| Other Board Memberships and Affiliations: |
- Wilshire Mutual Funds (5 funds), Director
- The Community Foundation for the National Capital Region, Director
- Member of the Council of Foreign Relations
- Member of the National Park Foundation
| No. of Portfolios for which Board Member Serves: 50 |
———————
Once elected all Board Members serve for an indefinite term, but achieve Emeritus status upon reaching age 80.The address of the Board Members and Officers is in c/o The Dreyfus Corporation, 200 Park Avenue, New York, New York 10166.Additional information about the Board Members is available in the fund’s Statement of Additional Information which can be obtained from Dreyfus free of charge by calling this toll free number: 1-800-554-4611.
John M. Fraser, Jr., Emeritus Board Member Dr. Paul A. Marks, Emeritus Board Member
The Fund 51
OFFICERS OF THE FUND ( U n a u d i t e d )

52

The Fund 53
For More Information
Telephone Call your financial representative or 1-800-554-4611
| The Dreyfus Premier Family of Funds | ||
| 144 Glenn Curtiss Boulevard, Uniondale, NY 11556-0144 |
The fund files its complete schedule of portfolio holdings with the Securities and Exchange Commission (“SEC”) for the first and third quarters of each fiscal year on Form N-Q. The fund’s Forms N-Q are available on the SEC’s website at http://www.sec.gov and may be reviewed and copied at the SEC’s Public Reference Room in Washington, DC. Information on the operation of the Public Reference Room may be obtained by calling 1-202-551-8090.
A description of the policies and procedures that the fund uses to determine how to vote proxies relating to portfolio securities, and information regarding how the fund voted these proxies for the 12-month period ended June 30, 2007, is available at http://www.dreyfus.com and on the SEC’s website at http://www.sec.gov. The description of the policies and procedures is also available without charge, upon request, by calling 1-800-645-6561.
© 2008 MBSC Securities Corporation

| Item 2. | Code of Ethics. |
The Registrant has adopted a code of ethics that applies to the Registrant's principal executive officer, principal financial officer, principal accounting officer or controller, or persons performing similar functions. There have been no amendments to, or waivers in connection with, the Code of Ethics during the period covered by this Report.
| Item 3. | Audit Committee Financial Expert. |
The Registrant's Board has determined that David P. Feldman, a member of the Audit Committee of the Board, is an audit committee financial expert as defined by the Securities and Exchange Commission (the "SEC"). Mr. Feldman is "independent" as defined by the SEC for purposes of audit committee financial expert determinations.
| Item 4. | Principal Accountant Fees and Services |
(a) Audit Fees. The aggregate fees billed for each of the last two fiscal years (the "Reporting Periods") for professional services rendered by the Registrant's principal accountant (the "Auditor") for the audit of the Registrant's annual financial statements, or services that are normally provided by the Auditor in connection with the statutory and regulatory filings or engagements for the Reporting Periods, were $138,000 in 2006 and $47,000 in 2007 with respect to PricewaterhouseCoopers LLP (“PWC”), the Registrant’s previous Auditor, and $51,122 in 2007 with respect to Ernst & Young LLP (“E&Y”), the Registrant’s current Auditor.
(b) Audit-Related Fees. The aggregate fees billed in the Reporting Periods for assurance and related services by the Auditor that are reasonably related to the performance of the audit of the Registrant's financial statements and are not reported under paragraph (a) of this Item 4 were $0 in 2006 and $0 in 2007.
The aggregate fees billed in the Reporting Periods for non-audit assurance and related services by the Auditor to the Registrant's investment adviser (not including any sub-investment adviser whose role is primarily portfolio management and is subcontracted with or overseen by another investment adviser), and any entity controlling, controlled by or under common control with the investment adviser that provides ongoing services to the Registrant ("Service Affiliates"), that were reasonably related to the performance of the annual audit of the Service Affiliate, which required pre-approval by the Audit Committee were $0 in 2006 and $0 in 2007.
Note: For the second paragraph in each of (b) through (d) of this Item 4, certain of such services were not pre-approved prior to May 6, 2003, when such services were required to be pre-approved. On and after May 6, 2003, 100% of all services provided by the Auditor were pre-approved as required. For comparative purposes, the fees shown assume that all such services were pre-approved, including services that were not pre-approved prior to the compliance date of the pre-approval requirement.
(c) Tax Fees. The aggregate fees billed in the Reporting Periods for professional services rendered by the Auditor for tax compliance, tax advice and tax planning ("Tax Services") were $9,900 in 2006 and $2,800 in 2007 with respect to PWC. These services consisted of (i) review or preparation of U.S. federal, state, local and excise tax returns; (ii) U.S. federal, state and local tax planning, advice and assistance regarding statutory, regulatory or administrative developments, (iii) tax advice regarding tax qualification matters
-2-
and/or treatment of various financial instruments held or proposed to be acquired or held, and (iv) determination of Passive Foreign Investment Companies (as applicable).
The aggregate fees billed in the Reporting Periods for Tax Services by the Auditor to Service Affiliates which required pre-approval by the Audit Committee were $0 in 2006 and $0 in 2007.
(d) All Other Fees. The aggregate fees billed in the Reporting Periods for products and services provided by the Auditor, other than the services reported in paragraphs (a) through (c) of this Item, were $0 in 2006 and $0 in 2007.
The aggregate fees billed in the Reporting Periods for Non-Audit Services by the Auditor to Service Affiliates, other than the services reported in paragraphs (b) through (c) of this Item, which required pre-approval by the Audit Committee were $0 in 2006 and $0 in 2007.
Audit Committee Pre-Approval Policies and Procedures. The Registrant's Audit Committee has established policies and procedures (the "Policy") for pre-approval (within specified fee limits) of the Auditor's engagements for non-audit services to the Registrant and Service Affiliates without specific case-by-case consideration. Pre-approval considerations include whether the proposed services are compatible with maintaining the Auditor's independence. Pre-approvals pursuant to the Policy are considered annually.
Non-Audit Fees. The aggregate non-audit fees billed by the Auditor for services rendered to the Registrant, and rendered to Service Affiliates, for the Reporting Periods were $90,000 in 2006 with respect to PWC and $1,890,737 in 2007 with respect to E&Y.
Auditor Independence. The Registrant's Audit Committee has considered whether the provision of non-audit services that were rendered to Service Affiliates which were not pre-approved (not requiring pre-approval) is compatible with maintaining the Auditor's independence.
| Item 5. | Audit Committee of Listed Registrants. | |
| Not applicable. | ||
| Item 6. | Schedule of Investments. | |
| Not applicable. | ||
| Item 7. | Disclosure of Proxy Voting Policies and Procedures for Closed-End Management | |
| Investment Companies. | ||
| Not applicable. | ||
| Item 8. | Portfolio Managers of Closed-End Management Investment Companies. | |
| Not applicable. | ||
| Item 9. | Purchases of Equity Securities by Closed-End Management Investment Companies and | |
| Affiliated Purchasers. | ||
| Not applicable. | ||
| Item 10. | Submission of Matters to a Vote of Security Holders. |
-3-
The Registrant has a Nominating Committee (the "Committee"), which is responsible for selecting and nominating persons for election or appointment by the Registrant's Board as Board members. The Committee has adopted a Nominating Committee Charter (the "Charter"). Pursuant to the Charter, the Committee will consider recommendations for nominees from shareholders submitted to the Secretary of the Registrant, c/o The Dreyfus Corporation Legal Department, 200 Park Avenue, 8th Floor East, New York, New York 10166. A nomination submission must include information regarding the recommended nominee as specified in the Charter. This information includes all information relating to a recommended nominee that is required to be disclosed in solicitations or proxy statements for the election of Board members, as well as information sufficient to evaluate the factors to be considered by the Committee, including character and integrity, business and professional experience, and whether the person has the ability to apply sound and independent business judgment and would act in the interests of the Registrant and its shareholders.
Nomination submissions are required to be accompanied by a written consent of the individual to stand for election if nominated by the Board and to serve if elected by the shareholders, and such additional information must be provided regarding the recommended nominee as reasonably requested by the Committee.
| Item 11. | Controls and Procedures. |
(a) The Registrant's principal executive and principal financial officers have concluded, based on their evaluation of the Registrant's disclosure controls and procedures as of a date within 90 days of the filing date of this report, that the Registrant's disclosure controls and procedures are reasonably designed to ensure that information required to be disclosed by the Registrant on Form N-CSR is recorded, processed, summarized and reported within the required time periods and that information required to be disclosed by the Registrant in the reports that it files or submits on Form N-CSR is accumulated and communicated to the Registrant's management, including its principal executive and principal financial officers, as appropriate to allow timely decisions regarding required disclosure.
(b) There were no changes to the Registrant's internal control over financial reporting that occurred during the second fiscal quarter of the period covered by this report that have materially affected, or are reasonably likely to materially affect, the Registrant's internal control over financial reporting.
Item 12.
| Exhibits. |
| (a)(1) | Code of ethics referred to in Item 2. | |
| (a)(2) | Certifications of principal executive and principal financial officers as required by Rule 30a-2(a) | |
| under the Investment Company Act of 1940. | ||
| (a)(3) | Not applicable. | |
| (b) | Certification of principal executive and principal financial officers as required by Rule 30a-2(b) | |
| under the Investment Company Act of 1940. | ||
-4-
SIGNATURES
Pursuant to the requirements of the Securities Exchange Act of 1934 and the Investment Company Act of 1940, the Registrant has duly caused this Report to be signed on its behalf by the undersigned, thereunto duly authorized.
Dreyfus Premier Manager Funds II

Pursuant to the requirements of the Securities Exchange Act of 1934 and the Investment Company Act of 1940, this Report has been signed below by the following persons on behalf of the Registrant and in the capacities and on the dates indicated.

EXHIBIT INDEX
| (a)(1) | Code of ethics referred to in Item 2. | |
| (a)(2) | Certifications of principal executive and principal financial officers as required by Rule 30a- | |
| 2(a) under the Investment Company Act of 1940. (EX-99.CERT) | ||
| (b) | Certification of principal executive and principal financial officers as required by Rule 30a- | |
| 2(b) under the Investment Company Act of 1940. (EX-99.906CERT) | ||
-5-
Exhibit (a)(1)
[INSERT CODE OF ETHICS]
-6-