| UNITED STATES SECURITIES AND EXCHANGE COMMISSION Washington, D.C. 20549 |
| FORM N-CSR |
| CERTIFIED SHAREHOLDER REPORT OF REGISTERED MANAGEMENT INVESTMENT COMPANIES |
| Investment Company Act file number | 811-21327 |
| Dreyfus Manager Funds II (Exact name of Registrant as specified in charter) |
| c/o The Dreyfus Corporation 200 Park Avenue New York, New York 10166 (Address of principal executive offices) (Zip code) |
| Michael A. Rosenberg, Esq. 200 Park Avenue New York, New York 10166 (Name and address of agent for service) |
| Registrant's telephone number, including area code: | (212) 922-6000 |
| Date of fiscal year end: | 11/30 | |
| Date of reporting period: | 11/30/08 |
| FORM N-CSR |
| Item 1. | Reports to Stockholders. |
| Dreyfus |
| Balanced Opportunity Fund |
ANNUAL REPORT November 30, 2008
Save time. Save paper. View your next shareholder report online as soon as it’s available. Log into www.dreyfus.com and sign up for Dreyfus eCommunications. It’s simple and only takes a few minutes.
The views expressed in this report reflect those of the portfolio manager only through the end of the period covered and do not necessarily represent the views of Dreyfus or any other person in the Dreyfus organization. Any such views are subject to change at any time based upon market or other conditions and Dreyfus disclaims any responsibility to update such views.These views may not be relied on as investment advice and, because investment decisions for a Dreyfus fund are based on numerous factors, may not be relied on as an indication of trading intent on behalf of any Dreyfus fund.

| Contents | |
| THE FUND | |
| 2 | A Letter from the CEO |
| 3 | Discussion of Fund Performance |
| 6 | Fund Performance |
| 8 | Understanding Your Fund’s Expenses |
| 9 | Comparing Your Fund’s Expenses With Those of Other Funds |
| 10 | Statement of Investments |
| 24 | Statement of Assets and Liabilities |
| 26 | Statement of Operations |
| 27 | Statement of Changes in Net Assets |
| 30 | Financial Highlights |
| 37 | Notes to Financial Statements |
| 49 | Report of Independent Registered Public Accounting Firm |
| 50 | Important Tax Information |
| 51 | Board Members Information |
| 54 | Officers of the Fund |
| FOR MORE INFORMATION | |
| Back Cover | |
| The Fund |
| Dreyfus Balanced Opportunity Fund |

| LETTER FROM THE CEO Dear Shareholder: |
We present to you this annual report for Dreyfus Balanced Opportunity Fund, covering the 12-month period from December 1, 2007, through November 30, 2008.
The U.S. and global economies suffered during the reporting period amid a financial crisis that roiled the stock and bond markets.According to our Chief Economist, four key elements fueled the crisis: a sharp decline in home prices; high leverage and an ambiguous private/public status at mortgage agencies Fannie Mae and Freddie Mac; high leverage among financial institutions, especially investment banks; and regulatory policies and behaviors that exacerbated financial stresses. The governments and central banks of major industrialized nations have responded with massive interventions, including nationalizing some troubled financial institutions, providing loans to others and guaranteeing certain financial instruments. However, the U.S. and global financial systems remain fragile, and economic weakness is likely to persist.
In our view, today’s investment environment is rife with near-term challenges and long-term opportunities. Now more than ever, it is important to ensure that your investments are aligned with your current needs, future goals and attitudes toward risk.We urge you to speak regularly with your financial advisor, who can recommend the course of action that is right for you.
For information about how the fund performed during the reporting period, as well as market perspectives, we have provided a Discussion of Fund Performance given by the fund’s Portfolio Managers.
Thank you for your continued confidence and support.

| Jonathan R. Baum Chief Executive Officer The Dreyfus Corporation December 15, 2008 |
2

DISCUSSION OF FUND PERFORMANCE
For the period of December 1, 2007, through November 30, 2008, as provided by Keith Stransky, Sean P. Fitzgibbon, Brian C. Ferguson, David Bowser and Peter Vaream, Portfolio Managers
Fund and Market Performance Overview
For the 12-month period ended November 30, 2008, Dreyfus Balanced Opportunity Fund’s Class A shares produced a total return of –29.77%, Class B shares returned –30.31%, Class C shares returned –30.22%, Class J shares returned –29.53%, Class I shares returned –29.57%, ClassT shares returned –29.92% and Class Z shares returned –29.61% .1 In comparison, the fund’s benchmarks, the Standard & Poor’s 500 Composite Stock Price Index (“S&P 500 Index”) and the Barclays Capital Intermediate Government/Credit Bond Index, achieved total returns of –38.08% and 2.34%, respectively, for the same period.2
Stocks declined sharply over the second half of the reporting period due to a global economic downturn and an intensifying financial crisis. In contrast, bonds held up relatively well as investors flocked to the traditional safe havens of U.S. government securities, offsetting weakness in other bond market sectors.Although the fund was affected by tumbling stock prices, its fixed-income holdings cushioned the decline to a degree.
The Fund’s Investment Approach
The fund seeks high total return, including capital appreciation and current income, through a diversified mix of stocks and fixed-income securities. When allocating assets, the fund’s asset allocation manager assesses the relative return and risk of each asset class, general economic conditions, anticipated future changes in interest rates and the general outlook for stocks.
The fund’s equity portfolio managers create a broadly diversified equity portfolio that includes a blend of growth and value stocks. Using quantitative and fundamental research, we look for companies with leading market positions, competitive or technological advantages, high returns on equity and assets, good growth prospects, attractive valuations and strong management teams.
The Fund 3
| DISCUSSION OF FUND PERFORMANCE (continued) |
The fund normally invests between 25% and 50% of its assets in fixed-income securities that, at the time of purchase, are rated investment grade or the non-rated equivalent as determined by Dreyfus.We may invest up to 5% of the fixed-income portfolio in securities rated below investment grade and up to 10% in bonds from foreign issuers.
Financial Crisis and Economic Slowdown Intensified
During the reporting period, the financial markets endured the most extreme market volatility in decades. An ongoing credit crisis mushroomed over the summer of 2008, and major U.S. financial institutions that had been hit hard by losses in credit markets teetered on the edge of insolvency. Some received massive capital infusions from the federal government and some were acquired by former rivals at fire-sale prices. As the situation worsened, banks became reluctant to lend, in some cases even to their most trusted customers. Investors grew more cautious, flocking to the traditional safe haven of U.S.Treasury securities and fleeing asset classes they considered risky, including U.S. stocks, corporate bonds and mortgage-backed securities.
Meanwhile, the U.S. economic slowdown was further exacerbated by declining housing prices and rising unemployment.Consumer and business spending fell, reducing the earnings outlook for most companies. Previously soaring commodity prices, including energy, fell sharply as demand waned.
Difficult Environment for Stock Picking
The fund’s growth and value-oriented equity strategies struggled to add value in this challenging market environment, as stocks appeared to be punished indiscriminately, regardless of their underlying business fundamentals. For example, the fund’s investments in the consumer staples sector, traditionally an area of relative stability during downturns, lagged market averages due partly to an underweighted position in household goods seller Procter & Gamble, which did not meet our growth criteria but held up well in the “flight to quality.” Similarly, the fund did not own brewer Anheuser-Busch due to valuation concerns, but the stock advanced after receiving a take-over offer. In the materials sector, relatively heavy exposure to chemical producers, such as fertilizer maker Mosaic, hurt relative performance when commodity prices plummeted. Metals-and-mining companies, such as Freeport McMoRan Copper & Gold, also fell sharply along with commodity prices.
4
The fund’s equity portion fared better in other areas compared to the benchmark.Strong selections among specialty retailers and underweighted exposure to semiconductor manufacturers and Internet companies helped boost relative performance in the consumer discretionary and information technology sectors, respectfully. In the financials sector, the fund successfully avoided many of the companies at the epicenter of the financial crisis.
In the fund’s bond portfolio, relatively light holdings of U.S. Treasury securities and overweighted positions in corporate bonds, commercial mortgage-backed securities and asset-backed securities weighed on relative performance despite sound credit fundamentals for most holdings. The fund’s interest-rate strategies contributed positively to relative performance as yield differences widened along the market’s maturity range.A modestly long average duration helped the fund participate more fully in the benefits of falling interest rates.
Anticipating a Return to Fundamentals
As of the reporting period’s end, the fund’s equity strategies have identified stocks that we believe to have been punished too severely in the downturn, particularly among fundamentally sound companies in the financials and consumer discretionary sectors. Among bonds, we have maintained an emphasis on market sectors that we believe are poised to rebound strongly in an eventual economic recovery.
December 15, 2008
| 1 | Total return includes reinvestment of dividends and any capital gains paid, and does not take into | |
| consideration the maximum initial sales charges in the case of Class A and Class T shares, or the | ||
| applicable contingent deferred sales charges imposed on redemptions in the case of Class B and | ||
| Class C shares. Had these charges been reflected, returns would have been lower. Past performance | ||
| is no guarantee of future results. Share price and investment return fluctuate such that upon | ||
| redemption, fund shares may be worth more or less than their original cost. | ||
| Part of the fund’s recent performance is attributable to positive returns from its initial public | ||
| offering (IPO) investments. There can be no guarantee that IPOs will have or continue to | ||
| have a positive effect on fund performance. | ||
| 2 | SOURCE: LIPPER INC. — Reflects reinvestment of dividends and, where applicable, capital | |
| gain distributions.The Standard & Poor’s 500 Composite Stock Price Index is a widely accepted, | ||
| unmanaged index of U.S. stock market performance.The Barclays Capital Intermediate | ||
| Government/Credit Bond Index is a widely accepted, unmanaged index of government and | ||
| corporate bond market performance composed of U.S. Government,Treasury and Agency securities, | ||
| fixed-income securities and nonconvertible investment-grade corporate debt, with an average | ||
| maturity of 1-10 years. |
The Fund 5
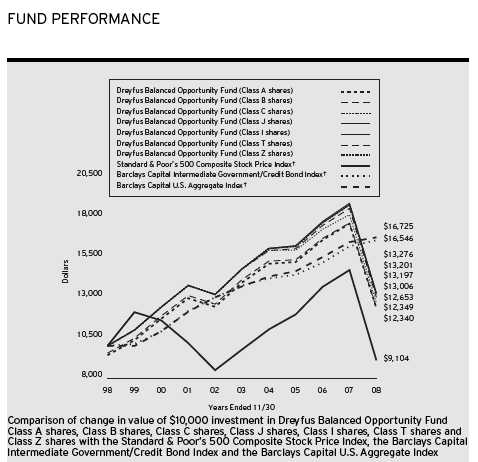
† Source: Lipper Inc.
Past performance is not predictive of future performance.
Part of the fund’s recent performance is attributable to positive returns from its initial public offering (IPO) investments. There can be no guarantee that IPOs will have or continue to have a positive effect on fund performance.
The above graph compares a $10,000 investment made in Class A, Class B, Class C, Class J, Class I, Class T and Class Z shares of Dreyfus Balanced Opportunity Fund on 11/30/98 to a $10,000 investment made in the Standard & Poor’s 500 Composite Stock Price Index (the “S&P 500 Index”), the Barclays Capital U.S. Aggregate Index (the “Barclays Aggregate Index”) and the Barclays Capital Intermediate Government/Credit Bond Index (the “Barclays Capital Intermediate Index”) on that date. All dividends and capital gain distributions are reinvested.
On January 30, 2004, Dreyfus Balanced Opportunity Fund (the “fund”) commenced operations after all of the assets of another mutual fund advised by the fund's sub-investment adviser were transferred to the fund in exchange for Class J shares of the fund in a tax-free reorganization. Class B, J and Z shares are closed to new investors.The fund offers Class A, C, I and T shares, which are subject to different sales charges and expenses.The performance figures for Class A, Class B, Class C, Class I, Class T and Class Z shares in the line graph above include the performance of the predecessor fund and reflect current sales loads and distribution expenses in effect since the reorganization date.
The fund’s performance shown in the line graph takes into account the maximum initial sales charges on Class A and Class T shares and all other applicable fees and expenses on all classes.The S&P 500 Index is a widely accepted, unmanaged index of U.S. stock market performance.The Barclays Capital U.S. Aggregate Index is a widely accepted, unmanaged index of corporate, U.S. government and U.S. government agency debt instruments, mortgage-backed securities, and asset-backed securities with an average maturity of 1-10 years.The Barclays Capital Intermediate Government/Credit Bond Index is a widely accepted, unmanaged index of government and corporate bond market performance composed of U.S. government,Treasury and agency securities, fixed-income securities and nonconvertible investment-grade credit debt, with an average maturity of 1-10- years. Unlike a mutual fund, the indices are not subject to charges, fees and other expenses. Investors cannot invest directly in any index. Further information relating to fund performance, including expense reimbursements, if applicable, is contained in the Financial Highlights section of the prospectus and elsewhere in this report.
6
| Average Annual Total Returns as of 11/30/08 | ||||||
| 1 Year | 5 Years | 10 Years | ||||
| Class A shares | ||||||
| with maximum sales charge (5.75%) | (33.82)% | (3.52)% | 2.13% | |||
| without sales charge | (29.77)% | (2.38)% | 2.73% | |||
| Class B shares | ||||||
| with applicable redemption charge † | (32.65)% | (3.42)% | 2.66% | |||
| without redemption | (30.31)% | (3.11)% | 2.66% | |||
| Class C shares | ||||||
| with applicable redemption charge †† | (30.81)% | (3.04)% | 2.38% | |||
| without redemption | (30.22)% | (3.04)% | 2.38% | |||
| Class J shares | (29.53)% | (2.11)% | 2.87% | |||
| Class I shares | (29.57)% | (2.22)% | 2.82% | |||
| Class T shares | ||||||
| with applicable sales charge (4.5%) | (33.07)% | (3.51)% | 2.13% | |||
| without sales charge | (29.92)% | (2.62)% | 2.61% | |||
| Class Z shares | (29.61)% | (2.22)% | 2.81% | |||
Past performance is not predictive of future performance.The fund’s performance shown in the graph and table does not reflect the deduction of taxes that a shareholder would pay on fund distributions or the redemption of fund shares.The performance figures for Class A, Class B, Class C, Class I, Class T and Class Z shares shown in the table include the performance of the predecessor fund and reflect current sales loads and distribution expenses in effect since the reorganization date. Performance for Class B shares assumes the conversion of Class B shares to Class A shares at the end of the sixth year following the date of purchase.
| † The maximum contingent deferred sales charge for Class B shares is 4%. After six years Class B shares convert to |
| Class A shares. |
| †† | The maximum contingent deferred sales charge for Class C shares is 1% for shares redeemed within one year of the | |
| date of purchase. |
The Fund 7
UNDERSTANDING YOUR FUND’S EXPENSES (Unaudited)
As a mutual fund investor, you pay ongoing expenses, such as management fees and other expenses. Using the information below, you can estimate how these expenses affect your investment and compare them with the expenses of other funds.You also may pay one-time transaction expenses, including sales charges (loads) and redemption fees, which are not shown in this section and would have resulted in higher total expenses. For more information, see your fund’s prospectus or talk to your financial adviser.
Review your fund’s expenses
The table below shows the expenses you would have paid on a $1,000 investment in Dreyfus Balanced Opportunity Fund from June 1, 2008 to November 30, 2008. It also shows how much a $1,000 investment would be worth at the close of the period assuming actual returns and expenses.
| Expenses and Value of a $1,000 Investment assuming actual returns for the six months ended November 30, 2008 |
| Expenses paid | Ending value | |||
| per $1,000† | (after expenses) | |||
| Class A | $5.19 | $716.10 | ||
| Class B | $8.44 | $713.60 | ||
| Class C | $8.23 | $713.90 | ||
| Class J | $3.86 | $717.50 | ||
| Class I | $4.34 | $717.10 | ||
| Class T | $6.22 | $715.50 | ||
| Class Z | $4.12 | $717.30 |
| † Expenses are equal to the fund’s annualized expense ratio of 1.21% for Class A, 1.97% for Class B, 1.92% for |
| Class C, .90% for Class J, 1.01% for Class I, 1.45% for Class T and .96% for Class Z, multiplied by the |
| average account value over the period, multiplied by 183/366 (to reflect the one-half year period). |
8
| COMPARING YOUR FUND’S EXPENSES WITH THOSE OF OTHER FUNDS (Unaudited) |
Using the SEC’s method to compare expenses
The Securities and Exchange Commission (SEC) has established guidelines to help investors assess fund expenses. Per these guidelines, the table below shows your fund’s expenses based on a $1,000 investment, assuming a hypothetical 5% annualized return. You can use this information to compare the ongoing expenses (but not transaction expenses or total cost) of investing in the fund with those of other funds.All mutual fund shareholder reports will provide this information to help you make this comparison. Please note that you cannot use this information to estimate your actual ending account balance and expenses paid during the period.
| Expenses and Value of a $1,000 Investment assuming a hypothetical 5% annualized return for the six months ended November 30, 2008 |
| Expenses paid | Ending value | |||
| per $1,000† | (after expenses) | |||
| Class A | $6.11 | $1,018.95 | ||
| Class B | $9.92 | $1,015.15 | ||
| Class C | $9.67 | $1,015.40 | ||
| Class J | $4.55 | $1,020.50 | ||
| Class I | $5.10 | $1,019.95 | ||
| Class T | $7.31 | $1,017.75 | ||
| Class Z | $4.85 | $1,020.20 |
| † Expenses are equal to the fund’s annualized expense ratio of 1.21% for Class A, 1.97% for Class B, 1.92% for |
| Class C, .90% for Class J, 1.01% for Class I, 1.45% for Class T and .96% for Class Z, multiplied by the |
| average account value over the period, multiplied by 183/366 (to reflect the one-half year period). |
The Fund 9
| STATEMENT OF INVESTMENTS November 30, 2008 |
| Common Stocks—68.0% | Shares | Value ($) | ||
| Consumer Discretionary—7.1% | ||||
| Coach | 30,690 a | 549,351 | ||
| Darden Restaurants | 23,245 | 425,151 | ||
| Family Dollar Stores | 36,200 | 1,005,636 | ||
| Gap | 100,350 | 1,306,557 | ||
| Home Depot | 96,910 | 2,239,590 | ||
| Johnson Controls | 19,830 | 350,198 | ||
| Lowe’s Cos. | 45,530 | 940,650 | ||
| McDonald’s | 38,230 | 2,246,012 | ||
| Newell Rubbermaid | 64,900 | 867,064 | ||
| News, Cl. A | 239,450 | 1,891,655 | ||
| NVR | 1,120 a,b | 486,360 | ||
| O’Reilly Automotive | 21,020 a | 547,991 | ||
| OfficeMax | 49,550 | 270,048 | ||
| Omnicom Group | 60,410 | 1,708,999 | ||
| Ross Stores | 53,990 | 1,430,735 | ||
| Time Warner | 205,210 | 1,857,151 | ||
| TJX Cos. | 22,310 | 509,114 | ||
| Toll Brothers | 33,270 a,b | 663,071 | ||
| 19,295,333 | ||||
| Consumer Staples—8.6% | ||||
| Cadbury, ADR | 15,126 | 514,133 | ||
| Coca-Cola Enterprises | 80,690 | 740,734 | ||
| Colgate-Palmolive | 26,910 | 1,751,034 | ||
| CVS Caremark | 129,720 | 3,752,800 | ||
| Dean Foods | 97,760 a,b | 1,423,386 | ||
| Dr. Pepper Snapple Group | 26,867 a | 433,633 | ||
| Estee Lauder, Cl. A | 54,220 | 1,512,738 | ||
| Kimberly-Clark | 7,220 | 417,244 | ||
| Kraft Foods, Cl. A | 69,090 | 1,879,939 | ||
| Kroger | 39,410 | 1,090,081 | ||
| Molson Coors Brewing, Cl. B | 33,620 | 1,495,081 | ||
| PepsiCo | 19,610 | 1,111,887 | ||
| Philip Morris International | 77,880 | 3,283,421 | ||
| Smithfield Foods | 22,840 a,b | 155,540 | ||
| Wal-Mart Stores | 69,110 | 3,861,867 | ||
| 23,423,518 |
10
| Common Stocks (continued) | Shares | Value ($) | ||
| Energy—9.3% | ||||
| Anadarko Petroleum | 15,010 | 616,160 | ||
| Cameron International | 34,370 a | 725,207 | ||
| Chevron | 101,760 | 8,040,058 | ||
| ConocoPhillips | 50,870 | 2,671,692 | ||
| Devon Energy | 19,750 | 1,428,715 | ||
| ENSCO International | 8,350 | 270,623 | ||
| EOG Resources | 23,770 | 2,020,925 | ||
| Marathon Oil | 55,540 | 1,454,037 | ||
| Nabors Industries | 28,230 a | 409,335 | ||
| National Oilwell Varco | 11,570 a | 327,315 | ||
| Occidental Petroleum | 62,040 | 3,358,846 | ||
| Valero Energy | 11,640 | 213,594 | ||
| Williams | 28,830 | 467,623 | ||
| XTO Energy | 84,967 | 3,249,138 | ||
| 25,253,268 | ||||
| Exchange Traded Funds—1.2% | ||||
| Standard & Poor’s Depository | ||||
| Receipts (Tr. Ser. 1) | 35,170 b | 3,168,465 | ||
| Financial—13.3% | ||||
| Ameriprise Financial | 19,890 | 367,169 | ||
| AON | 29,560 | 1,339,068 | ||
| Arch Capital Group | 3,400 a | 230,486 | ||
| Bank of America | 235,180 | 3,821,675 | ||
| Capital One Financial | 11,310 b | 389,177 | ||
| Charles Schwab | 41,570 | 761,978 | ||
| Chubb | 74,800 | 3,841,728 | ||
| Discover Financial Services | 39,570 | 404,801 | ||
| Fidelity National Financial, Cl. A | 35,590 | 438,825 | ||
| Fifth Third Bancorp | 89,870 b | 859,157 | ||
| First American | 15,500 | 372,310 | ||
| First Horizon National | 66,800 b | 714,092 | ||
| Franklin Resources | 22,410 | 1,361,407 | ||
| Goldman Sachs Group | 5,070 | 400,479 | ||
| JPMorgan Chase & Co. | 177,390 | 5,616,167 | ||
| KeyCorp | 71,270 | 668,513 | ||
| Marsh & McLennan Cos. | 29,030 | 740,265 |
The Fund 11
| STATEMENT OF INVESTMENTS (continued) |
| Common Stocks (continued) | Shares | Value ($) | ||
| Financial (continued) | ||||
| MetLife | 68,538 b | 1,971,143 | ||
| Moody’s | 38,910 b | 844,736 | ||
| National City | 64,390 | 129,424 | ||
| Northern Trust | 20,150 | 924,684 | ||
| PartnerRe | 3,480 b | 243,461 | ||
| PNC Financial Services Group | 35,850 | 1,891,805 | ||
| RenaissanceRe Holdings | 5,300 | 249,789 | ||
| TD Ameritrade Holding | 38,920 a | 517,636 | ||
| Travelers Cos. | 17,650 | 770,423 | ||
| U.S. Bancorp | 65,290 | 1,761,524 | ||
| Wachovia | 43,630 b | 245,201 | ||
| Wells Fargo & Co. | 144,680 | 4,179,805 | ||
| 36,056,928 | ||||
| Health Care—9.4% | ||||
| Abbott Laboratories | 41,980 | 2,199,332 | ||
| Aetna | 34,790 | 759,118 | ||
| Amgen | 53,780 a | 2,986,941 | ||
| Baxter International | 55,470 | 2,934,363 | ||
| Covidien | 35,525 | 1,309,096 | ||
| Hospira | 33,150 a | 995,494 | ||
| Johnson & Johnson | 24,100 | 1,411,778 | ||
| Laboratory Corp. of America Holdings | 11,060 a,b | 700,762 | ||
| Life Technologies | 18,720 a,b | 488,592 | ||
| Merck & Co. | 31,750 | 848,360 | ||
| Novartis, ADR | 22,860 | 1,072,591 | ||
| Pfizer | 189,200 | 3,108,556 | ||
| Schering-Plough | 53,200 | 894,292 | ||
| St. Jude Medical | 20,830 a | 583,865 | ||
| Thermo Fisher Scientific | 41,510 a | 1,481,077 | ||
| Vertex Pharmaceuticals | 23,680 a | 582,291 | ||
| Wyeth | 87,960 | 3,167,440 | ||
| 25,523,948 | ||||
| Industrial—6.0% | ||||
| Allied Waste Industries | 67,780 a | 727,957 | ||
| Delta Air Lines | 136,310 a,b | 1,200,891 | ||
| Dover | 22,920 | 683,704 | ||
| Eaton | 10,620 | 492,131 |
12
| Common Stocks (continued) | Shares | Value ($) | ||
| Industrial (continued) | ||||
| Emerson Electric | 33,680 | 1,208,775 | ||
| FedEx | 10,610 | 749,596 | ||
| General Electric | 94,480 | 1,622,222 | ||
| Goodrich | 20,540 | 691,171 | ||
| Honeywell International | 27,190 | 757,513 | ||
| L-3 Communications Holdings | 11,030 | 740,885 | ||
| Lockheed Martin | 28,200 | 2,174,502 | ||
| Raytheon | 30,420 | 1,484,496 | ||
| Textron | 22,580 | 343,893 | ||
| Tyco International | 42,385 | 885,846 | ||
| Union Pacific | 12,850 | 643,014 | ||
| Waste Management | 68,310 | 1,994,652 | ||
| 16,401,248 | ||||
| Information Technology—7.2% | ||||
| Accenture, Cl. A | 16,190 | 501,566 | ||
| Adobe Systems | 28,750 a | 665,850 | ||
| Alliance Data Systems | 17,210 a,b | 745,365 | ||
| Amphenol, Cl. A | 18,340 | 425,855 | ||
| Apple | 15,570 a | 1,442,872 | ||
| Cisco Systems | 212,770 a | 3,519,216 | ||
| Global Payments | 11,690 | 422,827 | ||
| Hewlett-Packard | 26,290 | 927,511 | ||
| Intel | 97,820 | 1,349,916 | ||
| Juniper Networks | 42,300 a | 735,174 | ||
| Lam Research | 24,710 a | 499,142 | ||
| McAfee | 27,770 a | 842,264 | ||
| Microsoft | 151,520 | 3,063,734 | ||
| Nokia, ADR | 19,660 | 278,582 | ||
| Oracle | 75,410 a | 1,213,347 | ||
| QUALCOMM | 65,370 | 2,194,471 | ||
| Visa, Cl. A | 14,150 | 743,724 | ||
| 19,571,416 | ||||
| Materials—1.2% | ||||
| Air Products & Chemicals | 8,910 | 425,542 | ||
| Freeport-McMoRan Copper & Gold | 29,710 | 712,743 | ||
| International Paper | 31,670 | 394,291 | ||
| Mosaic | 6,560 | 199,096 |
The Fund 13
| STATEMENT OF INVESTMENTS (continued) |
| Common Stocks (continued) | Shares | Value ($) | ||||||
| Materials (continued) | ||||||||
| Packaging Corp. of America | 20,590 b | 307,409 | ||||||
| Pactiv | 53,680 a | 1,341,463 | ||||||
| 3,380,544 | ||||||||
| Telecommunication Services—.8% | ||||||||
| AT & T | 71,610 | 2,045,182 | ||||||
| Utilities—3.9% | ||||||||
| American Electric Power | 45,220 | 1,414,934 | ||||||
| Entergy | 20,830 | 1,772,633 | ||||||
| Exelon | 28,010 | 1,574,442 | ||||||
| FPL Group | 21,960 | 1,070,770 | ||||||
| NRG Energy | 43,440 a,b | 1,029,094 | ||||||
| PG & E | 40,390 | 1,536,436 | ||||||
| Questar | 29,630 | 953,790 | ||||||
| Sempra Energy | 27,260 | 1,272,224 | ||||||
| 10,624,323 | ||||||||
| Total Common Stocks | ||||||||
| (cost $247,192,780) | 184,744,173 | |||||||
| Coupon | Maturity | Principal | ||||||
| Bonds and Notes—30.1% | Rate (%) | Date | Amount ($) | Value ($) | ||||
| Asset-Backed Ctfs./ | ||||||||
| Auto Receivables—.9% | ||||||||
| AmeriCredit Automobile Receivables | ||||||||
| Trust, Ser. 2005-DA, Cl. A3 | 4.87 | 12/6/10 | 38,600 | 37,562 | ||||
| Americredit Prime Automobile | ||||||||
| Receivables, Ser. 2007-1, Cl. B | 5.35 | 9/9/13 | 210,000 | 171,924 | ||||
| Americredit Prime Automobile | ||||||||
| Receivables, Ser. 2007-1, Cl. C | 5.43 | 2/10/14 | 230,000 | 169,610 | ||||
| Capital One Auto Finance Trust, | ||||||||
| Ser. 2006-C, Cl. A3A | 5.07 | 7/15/11 | 148,216 | 142,221 | ||||
| Capital One Auto Finance Trust, | ||||||||
| Ser. 2007-C, Cl. A3A | 5.13 | 4/16/12 | 960,000 | 861,135 | ||||
| Capital One Auto Finance Trust, | ||||||||
| Ser. 2007-C, Cl. A2A | 5.29 | 5/17/10 | 186,475 | 185,463 | ||||
| Capital One Auto Finance Trust, | ||||||||
| Ser. 2006-A, Cl. A3 | 5.33 | 11/15/10 | 56,422 | 56,080 | ||||
| Ford Credit Auto Owner Trust, | ||||||||
| Ser. 2007-A, Cl. C | 5.80 | 2/15/13 | 170,000 | 118,316 | ||||
| Hyundai Auto Receivables Trust, | ||||||||
| Ser. 2007-A, Cl. A3A | 5.04 | 1/17/12 | 335,000 | 327,065 |
14
| Coupon | Maturity | Principal | |||||||
| Bonds and Notes (continued) | Rate (%) | Date | Amount ($) | Value ($) | |||||
| Asset-Backed Ctfs./ | |||||||||
| Auto Receivables (continued) | |||||||||
| Wachovia Auto Loan Owner Trust, | |||||||||
| Ser. 2007-1, Cl. D | 5.65 | 2/20/13 | 735,000 | 377,966 | |||||
| 2,447,342 | |||||||||
| Asset-Backed Ctfs./ | |||||||||
| Home Equity Loans—.3% | |||||||||
| Bear Stearns Asset Backed | |||||||||
| Securities Trust, | |||||||||
| Ser. 2005-EC1, Cl. A2 | 1.64 | 11/25/35 | 329,510 | c | 309,359 | ||||
| JP Morgan Mortgage Acquisition, | |||||||||
| Ser. 2005-FRE1, Cl. A2F2 | 5.22 | 10/25/35 | 82,616 | c | 81,545 | ||||
| Residential Asset Securities, | |||||||||
| Ser. 2005-EMX4, Cl. A2 | 1.65 | 11/25/35 | 422,602 | c | 380,704 | ||||
| 771,608 | |||||||||
| Commercial Mortgage | |||||||||
| Pass-Through Ctfs.—2.8% | |||||||||
| Banc of America Commercial | |||||||||
| Mortgage, Ser. 2003-1, Cl. A1 | 3.88 | 9/11/36 | 770,385 | 709,218 | |||||
| Banc of America Commercial | |||||||||
| Mortgage, Ser. 2002-2, Cl. A3 | 5.12 | 7/11/43 | 225,000 | 196,433 | |||||
| Bear Stearns Commercial Mortgage | |||||||||
| Securities, Ser. 2003-T12, Cl. A3 | 4.24 | 8/13/39 | 595,000 | c | 560,460 | ||||
| Crown Castle Towers, | |||||||||
| Ser. 2006-1A, Cl. AFX | 5.24 | 11/15/36 | 875,000 | d | 729,820 | ||||
| Crown Castle Towers, | |||||||||
| Ser. 2006-1A, Cl. B | 5.36 | 11/15/36 | 250,000 | d | 195,005 | ||||
| Crown Castle Towers, | |||||||||
| Ser. 2006-1A, Cl. C | 5.47 | 11/15/36 | 665,000 | d | 497,952 | ||||
| Crown Castle Towers, | |||||||||
| Ser. 2006-1A, Cl. D | 5.77 | 11/15/36 | 730,000 | d | 512,314 | ||||
| CS First Boston Mortgage | |||||||||
| Securities, Ser. 2005-C3, Cl. A2 | 4.51 | 7/15/37 | 1,000,000 | 911,581 | |||||
| CS First Boston Mortgage | |||||||||
| Securities, Ser. 2005-C4, Cl. A2 | 5.02 | 8/15/38 | 175,000 | 159,305 | |||||
| CS First Boston Mortgage | |||||||||
| Securities, Ser. 2005-C5, Cl. A4 | 5.10 | 8/15/38 | 660,000 | c | 487,297 | ||||
| Goldman Sachs Mortgage Securities | |||||||||
| Corporation II, Ser. 2007-EOP, Cl. E | 2.62 | 3/6/20 | 475,000 | c,d | 278,591 | ||||
| Goldman Sachs Mortgage Securities | |||||||||
| Corporation II, Ser. 2007-EOP, Cl. K | 3.23 | 3/6/20 | 275,000 | c,d | 146,830 |
The Fund 15
| STATEMENT OF INVESTMENTS (continued) |
| Coupon | Maturity | Principal | |||||||
| Bonds and Notes (continued) | Rate (%) | Date | Amount ($) | Value ($) | |||||
| Commercial Mortgage | |||||||||
| Pass-Through Ctfs. (continued) | |||||||||
| JP Morgan Chase Commercial | |||||||||
| Mortgage Securities, | |||||||||
| Ser. 2004-C1, Cl. A2 | 4.30 | 1/15/38 | 895,000 | 788,539 | |||||
| LB-UBS Commercial Mortgage Trust, | |||||||||
| Ser. 2001-C3, Cl. A2 | 6.36 | 12/15/28 | 785,000 | 728,146 | |||||
| SBA CMBS Trust, | |||||||||
| Ser. 2006-1A, Cl. D | 5.85 | 11/15/36 | 261,000 | d | 194,784 | ||||
| Sovereign Commercial Mortgage | |||||||||
| Securities Trust, | |||||||||
| Ser. 2007-C1, Cl. D | 5.84 | 7/22/30 | 320,000 | c,d | 44,112 | ||||
| TIAA Seasoned Commercial Mortgage | |||||||||
| Trust, Ser. 2007-C4, Cl. A3 | 6.09 | 8/15/39 | 350,000 | c | 267,437 | ||||
| Wachovia Bank Commercial Mortgage | |||||||||
| Trust, Ser. 2005-C19, Cl. A5 | 4.66 | 5/15/44 | 210,000 | 172,056 | |||||
| 7,579,880 | |||||||||
| Computers—.2% | |||||||||
| International Business Machines, | |||||||||
| Sr. Unscd. Notes | 5.70 | 9/14/17 | 650,000 | 622,455 | |||||
| Consumer Staples—.3% | |||||||||
| Delhaize Group, | |||||||||
| Sr. Unscd. Notes | 6.50 | 6/15/17 | 320,000 | 287,333 | |||||
| Kraft Foods, | |||||||||
| Sr. Unscd. Notes | 6.00 | 2/11/13 | 105,000 | 102,808 | |||||
| Kroger, | |||||||||
| Gtd. Notes | 6.15 | 1/15/20 | 365,000 | 327,355 | |||||
| 717,496 | |||||||||
| Diversified Financial | |||||||||
| Services—4.7% | |||||||||
| Allstate, | |||||||||
| Jr. Sub. Debs. | 6.50 | 5/15/67 | 225,000 | c | 126,601 | ||||
| Ameriprise Financial, | |||||||||
| Jr. Sub. Notes | 7.52 | 6/1/66 | 590,000 | c | 267,453 | ||||
| Amvescap, | |||||||||
| Gtd. Notes | 5.38 | 12/15/14 | 310,000 | 200,752 | |||||
| Bank of America, | |||||||||
| Jr. Sub. Bonds | 8.00 | 12/29/49 | 750,000 | c | 521,599 | ||||
| Barclays Bank, | |||||||||
| Jr. Sub. Bonds | 5.93 | 9/29/49 | 500,000 | c,d | 285,300 |
16
| Coupon | Maturity | Principal | |||||||
| Bonds and Notes (continued) | Rate (%) | Date | Amount ($) | Value ($) | |||||
| Diversified Financial | |||||||||
| Services (continued) | |||||||||
| Barclays Bank, | |||||||||
| Sub. Bonds | 7.70 | 4/29/49 | 385,000 | c,d | 294,036 | ||||
| Capmark Financial Group, | |||||||||
| Gtd. Notes | 5.88 | 5/10/12 | 720,000 | 212,635 | |||||
| Chuo Mitsui Trust & Banking, | |||||||||
| Jr. Sub. Notes | 5.51 | 12/29/49 | 600,000 | c,d | 413,495 | ||||
| Citigroup, | |||||||||
| Sr. Unscd. Notes | 5.85 | 7/2/13 | 345,000 | 315,595 | |||||
| Citigroup, | |||||||||
| Sr. Sub. Bonds | 6.00 | 10/31/33 | 90,000 | 68,304 | |||||
| Citigroup, | |||||||||
| Sr. Unscd. Notes | 6.13 | 5/15/18 | 1,385,000 | 1,268,069 | |||||
| ConocoPhillips Canada, | |||||||||
| Gtd. Notes | 5.30 | 4/15/12 | 460,000 | 457,870 | |||||
| ERAC USA Finance, | |||||||||
| Gtd. Notes | 7.00 | 10/15/37 | 685,000 | d | 411,374 | ||||
| Goldman Sachs Capital II, | |||||||||
| Gtd. Bonds | 5.79 | 12/29/49 | 475,000 | c | 178,485 | ||||
| Goldman Sachs Group, | |||||||||
| Sub. Notes | 5.63 | 1/15/17 | 400,000 | 299,460 | |||||
| Goldman Sachs Group, | |||||||||
| Sub. Notes | 6.75 | 10/1/37 | 240,000 | 154,219 | |||||
| International Lease Finance, | |||||||||
| Sr. Unscd. Notes | 6.38 | 3/25/13 | 230,000 | 156,679 | |||||
| Jackson National Life Global, | |||||||||
| Sr. Scd. Notes | 5.38 | 5/8/13 | 250,000 | d | 221,078 | ||||
| Janus Capital Group, | |||||||||
| Sr. Unscd. Notes | 6.25 | 6/15/12 | 425,000 | 337,015 | |||||
| Jefferies Group, | |||||||||
| Sr. Unscd. Debs | 6.25 | 1/15/36 | 625,000 | 388,641 | |||||
| Jefferies Group, | |||||||||
| Sr. Unscd. Notes | 7.75 | 3/15/12 | 550,000 | 515,158 | |||||
| JPMorgan Chase & Co., | |||||||||
| Sr. Unscd. Notes | 6.40 | 5/15/38 | 400,000 | 393,475 | |||||
| Marshall & Ilsley, | |||||||||
| Sr. Unscd. Notes | 5.63 | 8/17/09 | 955,000 | 885,593 | |||||
| MUFG Capital Finance I, | |||||||||
| Bank Gtd. Bonds | 6.35 | 7/29/49 | 910,000 | c | 661,147 |
The Fund 17
| STATEMENT OF INVESTMENTS (continued) |
| Coupon | Maturity | Principal | |||||||
| Bonds and Notes (continued) | Rate (%) | Date | Amount ($) | Value ($) | |||||
| Diversified Financial | |||||||||
| Services (continued) | |||||||||
| NYSE Euronext, | |||||||||
| Sr. Unscd. Notes | 4.80 | 6/28/13 | 290,000 | 270,037 | |||||
| Pacific Life Global Funding, | |||||||||
| Notes | 5.15 | 4/15/13 | 600,000 | d | 558,341 | ||||
| Pearson Dollar Finance Two, | |||||||||
| Gtd. Notes | 6.25 | 5/6/18 | 395,000 | b,d | 345,337 | ||||
| Royal Bank of Scotland Group, | |||||||||
| Jr. Sub. Bonds | 6.99 | 10/29/49 | 735,000 | c,d | 405,804 | ||||
| Shinsei Finance II, | |||||||||
| Unscd. Bonds | 7.16 | 7/29/49 | 600,000 | c,d | 124,125 | ||||
| SMFG Preferred Capital, | |||||||||
| Sub. Bonds | 6.08 | 1/29/49 | 188,000 | c,d | 131,128 | ||||
| SunTrust Preferred Capital I, | |||||||||
| Bank Gtd. Notes | 5.85 | 12/31/49 | 700,000 | c | 315,178 | ||||
| UBS AG Stamford CT, | |||||||||
| Sr. Unscd. Notes | 5.75 | 4/25/18 | 400,000 | 339,964 | |||||
| Wachovia, | |||||||||
| Sub. Notes | 6.38 | 1/15/09 | 280,000 | 277,922 | |||||
| Wells Fargo Capital XIII, | |||||||||
| Bank Gtd. Secs. | 7.70 | 12/29/49 | 1,155,000 | c | 937,778 | ||||
| 12,739,647 | |||||||||
| Energy—.2% | |||||||||
| Duke Energy Carolinas, | |||||||||
| First Mortgage Bonds | 5.25 | 1/15/18 | 95,000 | b | 90,116 | ||||
| Nevada Power, | |||||||||
| Mortgage Notes | 6.50 | 8/1/18 | 215,000 | 197,132 | |||||
| Transocean, | |||||||||
| Sr. Unscd. Notes | 6.00 | 3/15/18 | 190,000 | 168,493 | |||||
| 455,741 | |||||||||
| Health Care—.1% | |||||||||
| Teva Pharmaceutical Finance, | |||||||||
| Gtd. Notes | 6.15 | 2/1/36 | 240,000 | 206,853 | |||||
| Wellpoint, | |||||||||
| Sr. Unscd. Notes | 5.88 | 6/15/17 | 240,000 | 206,417 | |||||
| 413,270 | |||||||||
| Industrial—.2% | |||||||||
| Atlas Copco, | |||||||||
| Sr. Unscd. Bonds | 5.60 | 5/22/17 | 240,000 | d | 223,889 |
18
| Coupon | Maturity | Principal | |||||||
| Bonds and Notes (continued) | Rate (%) | Date | Amount ($) | Value ($) | |||||
| Industrial (continued) | |||||||||
| Waste Management, | |||||||||
| Gtd. Notes | 7.38 | 5/15/29 | 285,000 | 225,568 | |||||
| WEA Finance, | |||||||||
| Sr. Notes | 7.13 | 4/15/18 | 395,000 | d | 270,308 | ||||
| 719,765 | |||||||||
| Manufacturing—.1% | |||||||||
| Siemens Financieringsmat, | |||||||||
| Gtd. Notes | 5.75 | 10/17/16 | 400,000 | d | 378,433 | ||||
| Media & Telecommunications—1.3% | |||||||||
| British Sky Broadcasting, | |||||||||
| Gtd. Notes | 6.10 | 2/15/18 | 215,000 | d | 174,892 | ||||
| BSKYB Finance UK, | |||||||||
| Gtd. Notes | 6.50 | 10/15/35 | 400,000 | d | 279,240 | ||||
| Comcast, | |||||||||
| Gtd. Notes | 6.50 | 11/15/35 | 435,000 | 346,219 | |||||
| Cox Communications, | |||||||||
| Notes | 6.25 | 6/1/18 | 355,000 | d | 305,007 | ||||
| KPN, | |||||||||
| Sr. Unscd. Notes | 8.00 | 10/1/10 | 150,000 | 149,503 | |||||
| KPN, | |||||||||
| Sr. Unscd. Bonds | 8.38 | 10/1/30 | 125,000 | 112,881 | |||||
| News America, | |||||||||
| Gtd. Notes | 6.65 | 11/15/37 | 570,000 | 458,324 | |||||
| Telecom Italia Capital, | |||||||||
| Gtd. Notes | 5.25 | 11/15/13 | 375,000 | 285,292 | |||||
| Telefonica Emisiones, | |||||||||
| Gtd. Notes | 5.98 | 6/20/11 | 475,000 | 454,584 | |||||
| Time Warner Cable, | |||||||||
| Gtd. Notes | 5.85 | 5/1/17 | 635,000 | 533,949 | |||||
| Verizon Communications, | |||||||||
| Sr. Unscd. Notes | 5.85 | 9/15/35 | 500,000 | 382,972 | |||||
| Verizon Communications, | |||||||||
| Sr. Unscd. Notes | 6.10 | 4/15/18 | 80,000 | 69,917 | |||||
| Verizon Communications, | |||||||||
| Sr. Unscd. Notes | 8.95 | 3/1/39 | 135,000 | 138,875 | |||||
| 3,691,655 | |||||||||
| Municipal Obligations—.1% | |||||||||
| Clark County School District, | |||||||||
| GO, Ser. F (Insured: FSA) | 5.50 | 12/15/11 | 60,000 | e | 65,927 |
The Fund 19
| STATEMENT OF INVESTMENTS (continued) |
| Coupon | Maturity | Principal | |||||||
| Bonds and Notes (continued) | Rate (%) | Date | Amount ($) | Value ($) | |||||
| Municipal Obligations (continued) | |||||||||
| Clark County School District, | |||||||||
| GO, Ser. F (Insured; FSA) | 5.50 | 12/15/11 | 45,000 | e | 49,445 | ||||
| Cypress-Fairbanks Independent | |||||||||
| School District, GO, Ser. A | |||||||||
| (Schoolhouse) (Insured; PSF-GTD) | 5.25 | 2/15/10 | 40,000 | e | 41,737 | ||||
| Williamson County, | |||||||||
| GO, Ser. A (Insured; FSA) | 6.00 | 8/15/10 | 30,000 | e | 32,057 | ||||
| 189,166 | |||||||||
| Office And Business Equipment��.1% | |||||||||
| Xerox, | |||||||||
| Sr. Unscd. Notes | 5.50 | 5/15/12 | 75,000 | 59,963 | |||||
| Xerox, | |||||||||
| Sr. Unscd. Notes | 5.65 | 5/15/13 | 105,000 | 82,092 | |||||
| 142,055 | |||||||||
| Real Estate Investment Trusts—1.0% | |||||||||
| Avalonbay Communities, | |||||||||
| Sr. Unscd. Notes | 6.63 | 9/15/11 | 260,000 | 209,507 | |||||
| Boston Properties, | |||||||||
| Sr. Unscd. Notes | 5.63 | 4/15/15 | 925,000 | 651,453 | |||||
| Duke Realty, | |||||||||
| Sr. Unscd. Notes | 5.88 | 8/15/12 | 405,000 | 309,013 | |||||
| Federal Realty Investment Trust, | |||||||||
| Sr. Unscd. Bonds | 5.65 | 6/1/16 | 550,000 | 346,054 | |||||
| Liberty Property, | |||||||||
| Sr. Unscd. Notes | 5.50 | 12/15/16 | 250,000 | 165,358 | |||||
| Prologis, | |||||||||
| Sr. Unscd. Notes | 6.63 | 5/15/18 | 390,000 | 157,293 | |||||
| Regency Centers, | |||||||||
| Gtd. Notes | 5.88 | 6/15/17 | 400,000 | 264,626 | |||||
| Simon Property Group, | |||||||||
| Sr. Unscd. Notes | 5.75 | 5/1/12 | 825,000 | 644,717 | |||||
| 2,748,021 | |||||||||
| Retailing—.1% | |||||||||
| Home Depot, | |||||||||
| Sr. Unscd. Notes | 5.25 | 12/16/13 | 140,000 | 121,781 | |||||
| Lowe’s Companies, | |||||||||
| Sr. Unscd. Notes | 5.60 | 9/15/12 | 110,000 | 110,615 | |||||
| 232,396 |
20
The Fund 21
| STATEMENT OF INVESTMENTS (continued) |

22
| Investment of Cash Collateral | ||||
| for Securities Loaned—4.2% | Shares | Value ($) | ||
| Registered Investment Company; | ||||
| Dreyfus Institutional Cash Advantage Plus Fund | ||||
| (cost $11,346,722) | 11,346,722 h | 11,346,722 | ||
| Total Investments (cost $353,593,319) | 103.8% | 281,973,523 | ||
| Liabilities, Less Cash and Receivables | (3.8%) | (10,357,243) | ||
| Net Assets | 100.0% | 271,616,280 |
| ADR—American Depository Receipts FSA—Financial Security Assurance GO—General Obligation PSF-GTD—Permanent School Fund Guaranteed SFMR—Single Family Mortgage Revenue |
| a Non-income producing security. |
| b All or a portion of these securities are on loan. At November 30, 2008, the total market value of the fund’s securities |
| on loan is $11,256,611 and the total market value of the collateral held by the fund is $11,346,722. |
| c Variable rate security—interest rate subject to periodic change. |
| d Securities exempt from registration under Rule 144A of the Securities Act of 1933.These securities may be resold in |
| transactions exempt from registration, normally to qualified institutional buyers. At November 30, 2008, these |
| securities amounted to $8,269,170 or 3.0% of net assets. |
| e These securities are prerefunded; the date shown represents the prerefunded date. Bonds which are prerefunded are |
| collateralized by U.S. Government securities which are held in escrow and are used to pay principal and interest on |
| the municipal issue and to retire the bonds in full at the earliest refunding date. |
| f On September 7, 2008, the Federal Housing Finance Agency (FHFA) placed Federal National Mortgage Association |
| and Federal Home Loan Mortgage Corporation into conservatorship with FHFA as the conservator.As such, the |
| FHFA will oversee the continuing affairs of these companies. |
| g Security issued with a zero coupon. Income is recognized through the accretion of discount. |
| h Investment in affiliated money market mutual fund. |
| Portfolio Summary (Unaudited)† | ||||||
| Value (%) | Value (%) | |||||
| U.S. Government & Agencies | 15.6 | Equities (continued): | ||||
| Corporate Bonds | 10.0 | Consumer Staples | 8.6 | |||
| Money Market Investments | 5.7 | Information Technology | 7.2 | |||
| Asset/Mortgage-Backed | 4.0 | Consumer Discretionary | 7.1 | |||
| State/Government | Industrial | 6.0 | ||||
| General Obligations | .5 | Utilities | 3.9 | |||
| Equities: | Materials | 1.2 | ||||
| Financial | 13.3 | Exchange Traded Funds | 1.2 | |||
| Health Care | 9.4 | Telecommunication Services | .8 | |||
| Energy | 9.3 | 103.8 | ||||
† Based on net assets.
See notes to financial statements.
The Fund 23
| STATEMENT OF ASSETS AND LIABILITIES November 30, 2008 |
| Cost | Value | |||
| Assets ($): | ||||
| Investments in securities—See Statement of Investments (including | ||||
| securities on loan, valued at $11,256,611)—Note 1(b): | ||||
| Unaffiliated issuers | 338,177,597 | 266,557,801 | ||
| Affiliated issuers | 15,415,722 | 15,415,722 | ||
| Receivable for investment securities sold | 2,542,977 | |||
| Dividends and interest receivable | 1,326,460 | |||
| Receivable for shares of Beneficial Interest subscribed | 16,713 | |||
| Prepaid expenses | 56,386 | |||
| 285,916,059 | ||||
| Liabilities ($): | ||||
| Due to The Dreyfus Corporation and affiliates—Note 3(c) | 340,368 | |||
| Cash overdraft due to Custodian | 247,484 | |||
| Liability for securities on loan—Note 1(b) | 11,346,722 | |||
| Payable for investment securities purchased | 2,032,560 | |||
| Payable for shares of Beneficial Interest redeemed | 127,872 | |||
| Interest payable—Note 2 | 38,387 | |||
| Accrued expenses | 166,386 | |||
| 14,299,779 | ||||
| Net Assets ($) | 271,616,280 | |||
| Composition of Net Assets ($): | ||||
| Paid-in capital | 373,485,673 | |||
| Accumulated undistributed investment income—net | 6,403,935 | |||
| Accumulated net realized gain (loss) on investments | (36,653,532) | |||
| Accumulated net unrealized appreciation | ||||
| (depreciation) on investments | (71,619,796) | |||
| Net Assets ($) | 271,616,280 |
24
| Net Asset Value Per Share | ||
| Class A | ||
| Net Assets ($) | 73,440,576 | |
| Shares Outstanding | 5,891,639 | |
| Net Asset Value Per Share ($) | 12.47 | |
| Class B | ||
| Net Assets ($) | 80,893,031 | |
| Shares Outstanding | 6,569,926 | |
| Net Asset Value Per Share ($) | 12.31 | |
| Class C | ||
| Net Assets ($) | 44,223,943 | |
| Shares Outstanding | 3,573,128 | |
| Net Asset Value Per Share ($) | 12.38 | |
| Class J | ||
| Net Assets ($) | 27,177,882 | |
| Shares Outstanding | 2,170,745 | |
| Net Asset Value Per Share ($) | 12.52 | |
| Class I | ||
| Net Assets ($) | 274,306 | |
| Shares Outstanding | 22,005 | |
| Net Asset Value Per Share ($) | 12.47 | |
| Class T | ||
| Net Assets ($) | 838,460 | |
| Shares Outstanding | 67,341 | |
| Net Asset Value Per Share ($) | 12.45 | |
| Class Z | ||
| Net Assets ($) | 44,768,082 | |
| Shares Outstanding | 3,592,199 | |
| Net Asset Value Per Share ($) | 12.46 | |
| See notes to financial statements. | ||
The Fund 25
| STATEMENT OF OPERATIONS Year Ended November 30, 2008 |
| Investment Income ($): | ||
| Income: | ||
| Interest | 7,098,419 | |
| Dividends: | ||
| Unaffiliated issuers | 5,729,406 | |
| Affiliated issuers | 216,642 | |
| Income from securities lending | 202,568 | |
| Total Income | 13,247,035 | |
| Expenses: | ||
| Management fee—Note 3(a) | 3,289,031 | |
| Distribution fees—Note 3(b) | 1,399,178 | |
| Shareholder servicing costs—Note 3(c) | 1,361,672 | |
| Professional fees | 89,296 | |
| Registration fees | 87,180 | |
| Prospectus and shareholders’ reports | 76,582 | |
| Custodian fees—Note 3(c) | 69,703 | |
| Trustees’ fees and expenses—Note 3(d) | 26,278 | |
| Interest expense—Note 2 | 2,883 | |
| Loan commitment fees—Note 2 | 2,019 | |
| Miscellaneous | 25,109 | |
| Total Expenses | 6,428,931 | |
| Less—reduction in management fee | ||
| due to undertaking—Note 3(a) | (411,248) | |
| Less—reduction in fees due to | ||
| earnings credits—Note 1(b) | (30,268) | |
| Net Expenses | 5,987,415 | |
| Investment Income—Net | 7,259,620 | |
| Realized and Unrealized Gain (Loss) on Investments—Note 4 ($): | ||
| Net realized gain (loss) on investments | (34,501,709) | |
| Net unrealized appreciation (depreciation) on investments | (99,479,268) | |
| Net Realized and Unrealized Gain (Loss) on Investments | (133,980,977) | |
| Net (Decrease) in Net Assets Resulting from Operations | (126,721,357) | |
| See notes to financial statements. | ||
26
STATEMENT OF CHANGES IN NET ASSETS
| Year Ended November 30, | ||||
| 2008 | 2007a | |||
| Operations ($): | ||||
| Investment income—net | 7,259,620 | 8,493,900 | ||
| Net realized gain (loss) on investments | (34,501,709) | 84,355,183 | ||
| Net unrealized appreciation | ||||
| (depreciation) on investments | (99,479,268) | (54,007,888) | ||
| Net Increase (Decrease) in Net Assets | ||||
| Resulting from Operations | (126,721,357) | 38,841,195 | ||
| Dividends to Shareholders from ($): | ||||
| Investment income—net: | ||||
| Class A Shares | (2,728,613) | (3,361,569) | ||
| Class B Shares | (1,591,459) | (1,333,297) | ||
| Class C Shares | (848,386) | (876,167) | ||
| Class J Shares | (1,168,014) | (3,215,600) | ||
| Class I Shares | (14,037) | (12,813) | ||
| Class T Shares | (24,047) | (28,473) | ||
| Class Z Shares | (1,629,088) | (1,480,730) | ||
| Net realized gain on investments: | ||||
| Class A Shares | (21,725,028) | — | ||
| Class B Shares | (21,800,898) | — | ||
| Class C Shares | (12,436,388) | — | ||
| Class J Shares | (7,795,872) | — | ||
| Class I Shares | (101,927) | — | ||
| Class T Shares | (235,001) | — | ||
| Class Z Shares | (11,182,600) | — | ||
| Total Dividends | (83,281,358) | (10,308,649) | ||
| Beneficial Interest Transactions ($): | ||||
| Net proceeds from shares sold: | ||||
| Class A Shares | 11,168,617 | 21,595,146 | ||
| Class B Shares | 1,394,309 | 1,228,572 | ||
| Class C Shares | 3,451,970 | 3,213,048 | ||
| Class J Shares | 10,706,195 | 6,995,588 | ||
| Class I Shares | 85,776 | 135,571 | ||
| Class T Shares | 45,221 | 241,521 | ||
| Class Z Shares | 2,387,437 | 3,126,160 | ||
The Fund 27
STATEMENT OF CHANGES IN NET ASSETS (continued)
| Year Ended November 30, | ||||
| 2008 | 2007a | |||
| Beneficial Interest Transactions ($) (continued): | ||||
| Dividends reinvested: | ||||
| Class A Shares | 22,836,730 | 2,991,998 | ||
| Class B Shares | 21,628,634 | 1,214,920 | ||
| Class C Shares | 11,078,843 | 729,273 | ||
| Class J Shares | 8,348,068 | 2,448,500 | ||
| Class I Shares | 105,925 | 11,291 | ||
| Class T Shares | 239,651 | 26,709 | ||
| Class Z Shares | 12,601,055 | 1,455,485 | ||
| Cost of shares redeemed: | ||||
| Class A Shares | (52,897,104) | (96,448,604) | ||
| Class B Shares | (28,335,944) | (31,163,023) | ||
| Class C Shares | (22,008,868) | (42,605,880) | ||
| Class J Shares | (24,824,409) | (134,979,666) | ||
| Class I Shares | (378,453) | (206,292) | ||
| Class T Shares | (427,734) | (1,070,503) | ||
| Class Z Shares | (14,441,246) | (17,164,661) | ||
| Increase (Decrease) in Net Assets from | ||||
| Beneficial Interest Transactions | (37,235,327) | (278,224,847) | ||
| Total Increase (Decrease) in Net Assets | (247,238,042) | (249,692,301) | ||
| Net Assets ($): | ||||
| Beginning of Period | 518,854,322 | 768,546,623 | ||
| End of Period | 271,616,280 | 518,854,322 | ||
| Undistributed investment income—net | 6,403,935 | 7,266,375 | ||
28
| Year Ended November 30, | ||||
| 2008 | 2007a | |||
| Capital Share Transactions: | ||||
| Class Ab | ||||
| Shares sold | 662,062 | 1,042,005 | ||
| Shares issued for dividends reinvested | 1,288,799 | 147,758 | ||
| Shares redeemed | (3,191,489) | (4,622,304) | ||
| Net Increase (Decrease) in Shares Outstanding | (1,240,628) | (3,432,541) | ||
| Class Bb | ||||
| Shares sold | 81,101 | 59,912 | ||
| Shares issued for dividends reinvested | 1,227,444 | 60,264 | ||
| Shares redeemed | (1,765,143) | (1,508,626) | ||
| Net Increase (Decrease) in Shares Outstanding | (456,598) | (1,388,450) | ||
| Class C | ||||
| Shares sold | 212,503 | 155,835 | ||
| Shares issued for dividends reinvested | 625,887 | 36,064 | ||
| Shares redeemed | (1,330,729) | (2,062,180) | ||
| Net Increase (Decrease) in Shares Outstanding | (492,339) | (1,870,281) | ||
| Class J | ||||
| Shares sold | 628,108 | 336,736 | ||
| Shares issued for dividends reinvested | 470,579 | 120,735 | ||
| Shares redeemed | (1,460,422) | (6,466,255) | ||
| Net Increase (Decrease) in Shares Outstanding | (361,735) | (6,008,784) | ||
| Class I | ||||
| Shares sold | 5,067 | 6,529 | ||
| Shares issued for dividends reinvested | 5,991 | 558 | ||
| Shares redeemed | (22,482) | (9,997) | ||
| Net Increase (Decrease) in Shares Outstanding | (11,424) | (2,910) | ||
| Class T | ||||
| Shares sold | 2,796 | 11,326 | ||
| Shares issued for dividends reinvested | 13,517 | 1,317 | ||
| Shares redeemed | (26,696) | (50,914) | ||
| Net Increase (Decrease) in Shares Outstanding | (10,383) | (38,271) | ||
| Class Z | ||||
| Shares sold | 146,818 | 150,310 | ||
| Shares issued for dividends reinvested | 713,133 | 71,947 | ||
| Shares redeemed | (879,339)�� | (824,753) | ||
| Net Increase (Decrease) in Shares Outstanding | (19,388) | (602,496) | ||
| a Effective June 1, 2007, Class R shares were redesignated as Class I shares. |
| b During the period ended November 30, 2008, 157,727 Class B shares representing $2,654,069 were |
| automatically converted to 156,400 Class A shares and during the period ended November 30, 2007, 205,307 |
| Class B shares representing $4,309,745 were automatically converted to 206,660 Class A shares. |
| See notes to financial statements. |
The Fund 29
FINANCIAL HIGHLIGHTS
The following tables describe the performance for each share class for the fiscal periods indicated. All information (except portfolio turnover rate) reflects financial results for a single fund share.Total return shows how much your investment in the fund would have increased (or decreased) during each period, assuming you had reinvested all dividends and distributions.These figures have been derived from the fund’s financial statements.
| Year Ended November 30, | ||||||||||
| Class A Shares | 2008 | 2007 | 2006 | 2005 | 2004a | |||||
| Per Share Data ($): | ||||||||||
| Net asset value, beginning of period | 21.28 | 20.38 | 19.15 | 19.30 | 18.86 | |||||
| Investment Operations: | ||||||||||
| Investment income—netb | .34 | .33 | .28 | .28 | .28 | |||||
| Net realized and unrealized | ||||||||||
| gain (loss) on investments | (5.62) | .89 | 1.40 | (.12) | .16 | |||||
| Total from Investment Operations | (5.28) | 1.22 | 1.68 | .16 | .44 | |||||
| Distributions: | ||||||||||
| Dividends from investment income—net | (.39) | (.32) | (.29) | (.19) | — | |||||
| Dividends from net realized | ||||||||||
| gain on investments | (3.14) | — | (.16) | (.12) | — | |||||
| Total Distributions | (3.53) | (.32) | (.45) | (.31) | — | |||||
| Net asset value, end of period | 12.47 | 21.28 | 20.38 | 19.15 | 19.30 | |||||
| Total Return (%)c | (29.77) | 6.08 | 8.96 | .77 | 2.33d | |||||
| Ratios/Supplemental Data (%): | ||||||||||
| Ratio of total expenses | ||||||||||
| to average net assets | 1.29 | 1.23 | 1.21 | 1.21 | 1.03d | |||||
| Ratio of net expenses | ||||||||||
| to average net assets | 1.18 | 1.16 | 1.21e | 1.21e | 1.03d,e | |||||
| Ratio of net investment income | ||||||||||
| to average net assets | 2.04 | 1.57 | 1.44 | 1.43 | 1.52d | |||||
| Portfolio Turnover Rate | 138.66 | 168.94f | 33.30 | 39.39 | 32.41 | |||||
| Net Assets, end of period ($ x 1,000) | 73,441 | 151,796 | 215,342 | 274,871 | 214,949 | |||||
| a From February 2, 2004 (commencement of operations) to November 30, 2004. |
| b Based on average shares outstanding at each month end. |
| c Exclusive of sales charge. |
| d Not annualized. |
| e Expense waivers and/or reimbursements amounted to less than .01%. |
| f The portfolio turnover rate excluding mortgage dollar roll transactions for the period ended November 30, 2007 |
| was 162.34%. |
| See notes to financial statements. |
30
| Year Ended November 30, | ||||||||||
| Class B Shares | 2008 | 2007 | 2006 | 2005 | 2004a | |||||
| Per Share Data ($): | ||||||||||
| Net asset value, beginning of period | 21.04 | 20.14 | 18.94 | 19.17 | 18.86 | |||||
| Investment Operations: | ||||||||||
| Investment income—netb | .21 | .17 | .12 | .12 | .15 | |||||
| Net realized and unrealized | ||||||||||
| gain (loss) on investments | (5.57) | .89 | 1.40 | (.11) | .16 | |||||
| Total from Investment Operations | (5.36) | 1.06 | 1.52 | .01 | .31 | |||||
| Distributions: | ||||||||||
| Dividends from investment income—net | (.23) | (.16) | (.16) | (.12) | — | |||||
| Dividends from net realized | ||||||||||
| gain on investments | (3.14) | — | (.16) | (.12) | — | |||||
| Total Distributions | (3.37) | (.16) | (.32) | (.24) | — | |||||
| Net asset value, end of period | 12.31 | 21.04 | 20.14 | 18.94 | 19.17 | |||||
| Total Return (%)c | (30.31) | 5.30 | 8.11 | (.02) | 1.64d | |||||
| Ratios/Supplemental Data (%): | ||||||||||
| Ratio of total expenses | ||||||||||
| to average net assets | 2.05 | 2.02 | 2.01 | 2.00 | 1.70d | |||||
| Ratio of net expenses | ||||||||||
| to average net assets | 1.95 | 1.94 | 2.01e | 2.00e | 1.70d,e | |||||
| Ratio of net investment income | ||||||||||
| to average net assets | 1.28 | .81 | .65 | .64 | .83d | |||||
| Portfolio Turnover Rate | 138.66 | 168.94f | 33.30 | 39.39 | 32.41 | |||||
| Net Assets, end of period ($ x 1,000) | 80,893 | 147,807 | 169,513 | 186,377 | 134,791 | |||||
| a From February 2, 2004 (commencement of operations) to November 30, 2004. |
| b Based on average shares outstanding at each month end. |
| c Exclusive of sales charge. |
| d Not annualized. |
| e Expense waivers and/or reimbursements amounted to less than .01%. |
| f The portfolio turnover rate excluding mortgage dollar roll transactions for the period ended November 30, 2007 |
| was 162.34%. |
| See notes to financial statements. |
The Fund 31
| FINANCIAL HIGHLIGHTS (continued) |
| Year Ended November 30, | ||||||||||
| Class C Shares | 2008 | 2007 | 2006 | 2005 | 2004a | |||||
| Per Share Data ($): | ||||||||||
| Net asset value, beginning of period | 21.10 | 20.19 | 18.98 | 19.19 | 18.86 | |||||
| Investment Operations: | ||||||||||
| Investment income—netb | .22 | .17 | .13 | .13 | .16 | |||||
| Net realized and unrealized | ||||||||||
| gain (loss) on investments | (5.59) | .89 | 1.40 | (.11) | .17 | |||||
| Total from Investment Operations | (5.37) | 1.06 | 1.53 | .02 | .33 | |||||
| Distributions: | ||||||||||
| Dividends from investment income—net | (.21) | (.15) | (.16) | (.11) | — | |||||
| Dividends from net realized | ||||||||||
| gain on investments | (3.14) | — | (.16) | (.12) | — | |||||
| Total Distributions | (3.35) | (.15) | (.32) | (.23) | — | |||||
| Net asset value, end of period | 12.38 | 21.10 | 20.19 | 18.98 | 19.19 | |||||
| Total Return (%)c | (30.22) | 5.29 | 8.14 | .06 | 1.75d | |||||
| Ratios/Supplemental Data (%): | ||||||||||
| Ratio of total expenses | ||||||||||
| to average net assets | 2.01 | 1.97 | 1.95 | 1.94 | 1.64d | |||||
| Ratio of net expenses | ||||||||||
| to average net assets | 1.90 | 1.90 | 1.95e | 1.94e | 1.64d,e | |||||
| Ratio of net investment income | ||||||||||
| to average net assets | 1.32 | .84 | .70 | .70 | .84d | |||||
| Portfolio Turnover Rate | 138.66 | 168.94f | 33.30 | 39.39 | 32.41 | |||||
| Net Assets, end of period ($ x 1,000) | 44,224 | 85,801 | 119,851 | 157,982 | 121,545 | |||||
| a From February 2, 2004 (commencement of operations) to November 30, 2004. |
| b Based on average shares outstanding at each month end. |
| c Exclusive of sales charge. |
| d Not annualized. |
| e Expense waivers and/or reimbursements amounted to less than .01%. |
| f The portfolio turnover rate excluding mortgage dollar roll transactions for the period ended November 30, 2007 |
| was 162.34%. |
| See notes to financial statements. |
32
| Year Ended November 30, | ||||||||||
| Class J Shares | 2008 | 2007 | 2006 | 2005 | 2004a | |||||
| Per Share Data ($): | ||||||||||
| Net asset value, beginning of period | 21.38 | 20.47 | 19.22 | 19.35 | 18.05 | |||||
| Investment Operations: | ||||||||||
| Investment income—netb | .40 | .36 | .33 | .31 | .34 | |||||
| Net realized and unrealized | ||||||||||
| gain (loss) on investments | (5.65) | .93 | 1.41 | (.11) | 1.21 | |||||
| Total from Investment Operations | (5.25) | 1.29 | 1.74 | .20 | 1.55 | |||||
| Distributions: | ||||||||||
| Dividends from investment income—net | (.47) | (.38) | (.33) | (.21) | (.25) | |||||
| Dividends from net realized | ||||||||||
| gain on investments | (3.14) | — | (.16) | (.12) | — | |||||
| Total Distributions | (3.61) | (.38) | (.49) | (.33) | (.25) | |||||
| Net asset value, end of period | 12.52 | 21.38 | 20.47 | 19.22 | 19.35 | |||||
| Total Return (%) | (29.53) | 6.41 | 9.25 | .97 | 8.69 | |||||
| Ratios/Supplemental Data (%): | ||||||||||
| Ratio of total expenses | ||||||||||
| to average net assets | .99 | .91 | .96 | 1.02 | .95 | |||||
| Ratio of net expenses | ||||||||||
| to average net assets | .88 | .87 | .96c | 1.01 | .95c | |||||
| Ratio of net investment income | ||||||||||
| to average net assets | 2.34 | 1.77 | 1.69 | 1.62 | 1.79 | |||||
| Portfolio Turnover Rate | 138.66 | 168.94d | 33.30 | 39.39 | 32.41 | |||||
| Net Assets, end of period ($ x 1,000) | 27,178 | 54,149 | 174,820 | 204,901 | 245,171 | |||||
| a The fund commenced offering six classes of shares on February 2, 2004.The existing shares were redesignated as |
| Class J shares. |
| b Based on average shares outstanding at each month end. |
| c Expense waivers and/or reimbursements amounted to less than .01%. |
| d The portfolio turnover rate excluding mortgage dollar roll transactions for the period ended November 30, 2007 |
| was 162.34%. |
| See notes to financial statements. |
The Fund 33
| FINANCIAL HIGHLIGHTS (continued) |
| Year Ended November 30, | ||||||||||
| Class I Shares | 2008 | 2007a | 2006 | 2005 | 2004b | |||||
| Per Share Data ($): | ||||||||||
| Net asset value, beginning of period | 21.28 | 20.39 | 19.17 | 19.31 | 18.86 | |||||
| Investment Operations: | ||||||||||
| Investment income—netc | .37 | .36 | .31 | .32 | .35 | |||||
| Net realized and unrealized | ||||||||||
| gain (loss) on investments | (5.61) | .89 | 1.40 | (.13) | .10 | |||||
| Total from Investment Operations | (5.24) | 1.25 | 1.71 | .19 | .45 | |||||
| Distributions: | ||||||||||
| Dividends from investment income—net | (.43) | (.36) | (.33) | (.21) | — | |||||
| Dividends from net realized | ||||||||||
| gain on investments | (3.14) | — | (.16) | (.12) | — | |||||
| Total Distributions | (3.57) | (.36) | (.49) | (.33) | — | |||||
| Net asset value, end of period | 12.47 | 21.28 | 20.39 | 19.17 | 19.31 | |||||
| Total Return (%) | (29.57) | 6.23 | 9.12 | .95 | 2.38d | |||||
| Ratios/Supplemental Data (%): | ||||||||||
| Ratio of total expenses | ||||||||||
| to average net assets | 1.07 | 1.12 | 1.07 | 1.00 | .97d | |||||
| Ratio of net expenses | ||||||||||
| to average net assets | .96 | 1.04 | 1.07e | 1.00e | .97d,e | |||||
| Ratio of net investment income | ||||||||||
| to average net assets | 2.25 | 1.72 | 1.59 | 1.64 | 2.11d | |||||
| Portfolio Turnover Rate | 138.66 | 168.94f | 33.30 | 39.39 | 32.41 | |||||
| Net Assets, end of period ($ x 1,000) | 274 | 711 | 741 | 755 | 416 | |||||
| a Effective June 1, 2007, Class R shares were redesignated as Class I shares. |
| b From February 2, 2004 (commencement of operations) to November 30, 2004. |
| c Based on average shares outstanding at each month end. |
| d Not annualized. |
| e Expense waivers and/or reimbursements amounted to less than .01%. |
| f The portfolio turnover rate excluding mortgage dollar roll transactions for the period ended November 30, 2007 |
| was 162.34%. |
| See notes to financial statements. |
34
| Year Ended November 30, | ||||||||||
| Class T Shares | 2008 | 2007 | 2006 | 2005 | 2004a | |||||
| Per Share Data ($): | ||||||||||
| Net asset value, beginning of period | 21.23 | 20.32 | 19.09 | 19.26 | 18.86 | |||||
| Investment Operations: | ||||||||||
| Investment income—netb | .30 | .27 | .22 | .22 | .23 | |||||
| Net realized and unrealized | ||||||||||
| gain (loss) on investments | (5.62) | .89 | 1.40 | (.11) | .17 | |||||
| Total from Investment Operations | (5.32) | 1.16 | 1.62 | .11 | .40 | |||||
| Distributions: | ||||||||||
| Dividends from investment income—net | (.32) | (.25) | (.23) | (.16) | — | |||||
| Dividends from net realized | ||||||||||
| gain on investments | (3.14) | — | (.16) | (.12) | — | |||||
| Total Distributions | (3.46) | (.25) | (.39) | (.28) | — | |||||
| Net asset value, end of period | 12.45 | 21.23 | 20.32 | 19.09 | 19.26 | |||||
| Total Return (%)c | (29.92) | 5.79 | 8.65 | .52 | 2.12d | |||||
| Ratios/Supplemental Data (%): | ||||||||||
| Ratio of total expenses | ||||||||||
| to average net assets | 1.51 | 1.52 | 1.51 | 1.49 | 1.26d | |||||
| Ratio of net expenses | ||||||||||
| to average net assets | 1.41 | 1.45 | 1.51e | 1.49e | 1.26d,e | |||||
| Ratio of net investment income | ||||||||||
| to average net assets | 1.81 | 1.28 | 1.14 | 1.15 | 1.19d | |||||
| Portfolio Turnover Rate | 138.66 | 168.94f | 33.30 | 39.39 | 32.41 | |||||
| Net Assets, end of period ($ x 1,000) | 838 | 1,650 | 2,357 | 2,915 | 2,508 | |||||
| a From February 2, 2004 (commencement of operations) to November 30, 2004. |
| b Based on average shares outstanding at each month end. |
| c Exclusive of sales charge. |
| d Not annualized. |
| e Expense waivers and/or reimbursements amounted to less than .01%. |
| f The portfolio turnover rate excluding mortgage dollar roll transactions for the period ended November 30, 2007 |
| was 162.34%. |
| See notes to financial statements. |
The Fund 35
| FINANCIAL HIGHLIGHTS (continued) |
| Year Ended November 30, | ||||||||
| Class Z Shares | 2008 | 2007 | 2006 | 2005a | ||||
| Per Share Data ($): | ||||||||
| Net asset value, beginning of period | 21.30 | 20.39 | 19.16 | 19.60 | ||||
| Investment Operations: | ||||||||
| Investment income—netb | .37 | .38 | .30 | .29 | ||||
| Net realized and unrealized | ||||||||
| gain (loss) on investments | (5.61) | .89 | 1.41 | (.40) | ||||
| Total from Investment Operations | (5.24) | 1.27 | 1.71 | (.11) | ||||
| Distributions: | ||||||||
| Dividends from investment income—net | (.46) | (.36) | (.32) | (.21) | ||||
| Dividends from net realized | ||||||||
| gain on investments | (3.14) | — | (.16) | (.12) | ||||
| Total Distributions | (3.60) | (.36) | (.48) | (.33) | ||||
| Net asset value, end of period | 12.46 | 21.30 | 20.39 | 19.16 | ||||
| Total Return (%) | (29.61) | 6.31 | 9.11 | (.59)c | ||||
| Ratios/Supplemental Data (%): | ||||||||
| Ratio of total expenses to average net assets | 1.09 | 1.12 | 1.15 | 1.15c | ||||
| Ratio of net expenses to average net assets | .98 | .93 | 1.07 | 1.02c | ||||
| Ratio of net investment income | ||||||||
| to average net assets | 2.24 | 1.83 | 1.58 | 1.51c | ||||
| Portfolio Turnover Rate | 138.66 | 168.94d | 33.30 | 39.39 | ||||
| Net Assets, end of period ($ x 1,000) | 44,768 | 76,939 | 85,923 | 100,250 | ||||
| a From December 18, 2004 (commencement of operations) to November 30, 2005. |
| b Based on average shares outstanding at each month end. |
| c Not annualized. |
| d The portfolio turnover rate excluding mortgage dollar roll transactions for the period ended November 30, 2007 |
| was 162.34%. |
| See notes to financial statements. |
36
NOTES TO FINANCIAL STATEMENTS
NOTE 1—Significant Accounting Policies:
Dreyfus Balanced Opportunity Fund (the “fund”) is a separate diversified series of Dreyfus Premier Manager Funds II (the “Company”), which is registered under the Investment Company Act of 1940, as amended (the “Act”), as an open-end management investment company and operates as a series company currently offering the fund as its only series.The fund’s investment objective is to seek a high total return through a combination of capital appreciation and current income.The Dreyfus Corporation (the “Manager” or “Dreyfus”), a wholly-owned subsidiary of The Bank of New York Mellon Corporation (“BNY Mellon”), serves as the fund’s investment adviser.
At a meeting of the fund’s Board of Directors held on July 15, 2008, the Board approved, effective December 1, 2008, a proposal to change the names of the Company and the fund from “Dreyfus Premier Manager Funds II” and “Dreyfus Premier Balanced Opportunity Fund” to “Dreyfus Manager Funds II” and “Dreyfus Balanced Opportunity Fund”, respectively.
Effective July 1, 2008, BNY Mellon has reorganized and consolidated a number of its banking and trust company subsidiaries. As a result of the reorganization, any services previously provided to the fund by Mellon Bank, N.A. or Mellon Trust of New England, N.A. are now provided by The Bank of New York, which has changed its name to The Bank of New York Mellon.
MBSC Securities Corporation (the “Distributor”), a wholly-owned subsidiary of the Manager, is the Distributor of the fund’s shares.The fund is authorized to issue an unlimited number of $.001 par value shares of Beneficial Interest in each of the following classes of shares: Class A, Class B, Class C, Class J, Class I, Class T and Class Z shares. Class A and Class T shares are subject to a sales charge imposed at the time of purchase. Class B shares are subject to a contingent deferred sales charge (“CDSC”) imposed on Class B share redemptions made within six years of purchase and automatically convert to Class A shares after six years.The fund does not offer Class B shares, except in
The Fund 37
| NOTES TO FINANCIAL STATEMENTS (continued) |
connection with dividend reinvestment and permitted exchanges of Class B shares. Class C shares are subject to a CDSC imposed on Class C shares redeemed within one year of purchase. Class I, Class J and Class Z shares are sold at net asset value per share. Class I shares are sold only to institutional investors and Class J and Class Z shares are closed to new investors. Other differences between the classes include the services offered to and the expenses borne by each class, the allocation of certain transfer agency costs and certain voting rights. Income, expenses (other than expenses attributable to a specific class), and realized and unrealized gains or losses on investments are allocated to each class of shares based on its relative net assets.
The Company accounts separately for the assets, liabilities and operations of each series. Expenses directly attributable to each series are charged to that series’ operations; expenses which are applicable to all series are allocated among them on a pro rata basis.
The fund’s financial statements are prepared in accordance with U.S. generally accepted accounting principles, which requires the use of management estimates and assumptions. Actual results could differ from those estimates.
The fund enters into contracts that contain a variety of indemnifications. The fund’s maximum exposure under these arrangements is unknown.The fund does not anticipate recognizing any loss related to these arrangements.
(a) Portfolio valuation: Investments in securities are valued at the last sales price on the securities exchange or national securities market on which such securities are primarily traded. Securities listed on the National Market System for which market quotations are available are valued at the official closing price or, if there is no official closing price that day, at the last sales price. Securities not listed on an exchange or the national securities market, or securities for which there were no transactions, are valued at the average of the most recent bid and asked prices, except for open short positions, where the asked price is used for valuation purposes. Bid price is used when no asked price is available. Registered investment companies that are not traded on an exchange
38
are valued at their net asset value. When market quotations or official closing prices are not readily available, or are determined not to reflect accurately fair value, such as when the value of a security has been significantly affected by events after the close of the exchange or market on which the security is principally traded (for example, a foreign exchange or market),but before the fund calculates its net asset value,the fund may value these investments at fair value as determined in accordance with the procedures approved by the Board of Trustees. Fair valuing of securities may be determined with the assistance of a pricing service using calculations based on indices of domestic securities and other appropriate indicators, such as prices of relevant ADRs and futures contracts. For other securities that are fair valued by the Board of Trustees, certain factors may be considered such as: fundamental analytical data, the nature and duration of restrictions on disposition, an evaluation of the forces that influence the market in which the securities are purchased and sold and public trading in similar securities of the issuer or comparable issuers. Financial futures are valued at the last sales price.
Debt securities excluding short-term investments (other than U.S. Treasury Bills) are valued each business day by an independent pricing service (the “Service”) approved by the Board of Trustees. Investments for which quoted bid prices are readily available and are representative of the bid side of the market in the judgment of the Service are valued at the mean between the quoted bid prices (as obtained by the Service from dealers in such securities) and asked prices (as calculated by the Service based upon its evaluation of the market for such securities). Other debt securities are valued as determined by the Service, based on methods which include consideration of: yields or prices of securities of comparable quality, coupon, maturity and type; indications as to values from dealers; and general market conditions. Restricted securities, as well as securities or other assets for which recent market quotations are not readily available, that are not valued by a pricing service approved by the Board of Trustees, or are determined by the fund not to reflect accurately fair value, are valued at fair value as determined in good faith under the direction of the Board ofTrustees.The factors that
The Fund 39
| NOTES TO FINANCIAL STATEMENTS (continued) |
may be considered when fair valuing a security include fundamental analytical data, the nature and duration of restrictions on disposition, an evaluation of the forces that influence the market in which the securities are purchased and sold and public trading in similar securities of the issuer or comparable issuers. Short-term investments, excluding U.S. Treasury Bills, are carried at amortized cost, which approximates value.
The fund adopted Statement of Financial Accounting Standards No. 157 “FairValue Measurements” (“FAS 157”). FAS 157 establishes an authoritative definition of fair value, sets out a framework for measuring fair value, and requires additional disclosures about fair-value measurements.
Various inputs are used in determining the value of the fund’s investments relating to FAS 157.These inputs are summarized in the three broad levels listed below.
| Level 1—quoted prices in active markets for identical securities. |
| Level 2—other significant observable inputs (including quoted |
| prices for similar securities, interest rates, prepayment speeds, credit |
| risk, etc.). |
| Level 3—significant unobservable inputs (including the fund’s own |
| assumptions in determining the fair value of investments). |
The inputs or methodology used for valuing securities are not necessarily an indication of the risk associated with investing in those securities.
The following is a summary of the inputs used as of November 30, 2008 in valuing the fund’s investments carried at fair value:
| Investments in | Other Financial | |||
| Valuation Inputs | Securities ($) | Instruments ($)† | ||
| Level 1—Quoted Prices | 200,159,895 | 0 | ||
| Level 2—Other Significant | ||||
| Observable Inputs | 81,813,628 | 0 | ||
| Level 3—Significant | ||||
| Unobservable Inputs | 0 | 0 | ||
| Total | 281,973,523 | 0 |
| † | Other financial instruments include derivative instruments such as futures, forward currency | |
| exchange contracts and swap contracts, which are valued at the unrealized appreciation | ||
| (depreciation) on the instrument. |
40
(b) Securities transactions and investment income: Securities transactions are recorded on a trade date basis. Realized gains and losses from securities transactions are recorded on the identified cost basis. Dividend income is recognized on the ex-dividend date and interest income, including, where applicable, accretion of discount and amortization of premium on investments, is recognized on the accrual basis.
The fund has arrangements with the custodian and cash management banks whereby the fund may receive earnings credits when positive cash balances are maintained, which are used to offset custody and cash management fees. For financial reporting purposes, the fund includes net earnings credits as an expense offset in the Statement of Operations.
Pursuant to a securities lending agreement with The Bank of New York Mellon, a subsidiary of BNY Mellon and an affiliate of Dreyfus, the fund may lend securities to qualified institutions. It is the fund’s policy that, at origination, all loans are secured by collateral of at least 102% of the value of U.S. securities loaned and 105% of the value of foreign securities loaned. Collateral equivalent to at least 100% of the market value of securities on loan is maintained at all times. Collateral is either in the form of cash, which can be invested in certain money market mutual funds managed by the Manager, U.S. Government and Agency securities or letters of credit.The fund is entitled to receive all income on securities loaned, in addition to income earned as a result of the lending transaction. Although each security loaned is fully collateralized, the fund bears the risk of delay in recovery of, or loss of rights in, the securities loaned should a borrower fail to return the securities in a timely manner. During the period ended November 30, 2008, The Bank of New York Mellon earned $86,815 from lending fund portfolio securities, pursuant to the securities lending agreement.
(c) Affiliated issuers: Investments in other investment companies advised by the Manager are defined as “affiliated” in the Act.
(d) Dividends to shareholders: Dividends are recorded on the ex-dividend date. Dividends from investment income-net and dividends from net realized capital gains are normally declared and paid annually, but
The Fund 41
| NOTES TO FINANCIAL STATEMENTS (continued) |
the fund may make distributions on a more frequent basis to comply with the distribution requirements of the Internal Revenue Code of 1986, as amended (the “Code”).To the extent that net realized capital gains can be offset by capital loss carryovers, it is the policy of the fund not to distribute such gains. Income and capital gain distributions are determined in accordance with income tax regulations, which may differ from U.S. generally accepted accounting principles.
(e) Federal income taxes: It is the policy of the fund to continue to qualify as a regulated investment company, if such qualification is in the best interests of its shareholders, by complying with the applicable provisions of the Code, and to make distributions of taxable income sufficient to relieve it from substantially all federal income and excise taxes.
The fund adopted Financial Accounting Standards Board (“FASB”) Interpretation No. 48 “Accounting for Uncertainty in Income Taxes” (“FIN 48”). FIN 48 provides guidance for how uncertain tax positions should be recognized, measured, presented and disclosed in the financial statements. FIN 48 requires the evaluation of tax positions taken or expected to be taken in the course of preparing the fund’s tax returns to determine whether the tax positions are “more-likely-than-not” of being sustained by the applicable tax authority. Liability for tax positions not deemed to meet the more-likely-than-not threshold would be recorded as a tax expense in the current year.The adoption of FIN 48 had no impact on the operations of the fund for the period ended November 30, 2008.
As of and during the period ended November 30, 2008, the fund did not have any liabilities for any unrecognized tax positions. The fund recognizes interest and penalties, if any, related to unrecognized tax positions as income tax expense in the Statement of Operations. During the period, the fund did not incur any interest or penalties.
Each of the tax years in the four-year period ended November 30, 2008 remains subject to examination by the Internal Revenue Service and state taxing authorities.
42
At November 30, 2008, the components of accumulated earnings on a tax basis were as follows: undistributed ordinary income $6,403,935, accumulated capital losses $21,571,561 and unrealized depreciation $75,256,766. In addition, the fund had $11,445,001 of capital losses realized after October 31, 2008, which were deferred for tax purposes to the first day of the following year.
The accumulated capital loss carryover is available for federal income tax purposes to be applied against future net securities profits, if any, realized subsequent to November 30, 2008. If not applied, the carryover expires in fiscal 2016.
The tax character of distributions paid to shareholders during the fiscal periods ended November 30, 2008 and November 30, 2007 were as follows: ordinary income $12,852,838 and $10,308,649 and long-term capital gains $70,428,520 and $0, respectively.
During the period ended November 30, 2008, as a result of permanent book to tax differences, primarily due to the tax treatment for pay-down gains and losses on mortgage-backed securities and dividend reclassification, the fund decreased accumulated undistributed investment income-net by $118,416 and increased accumulated net realized gain (loss) on investments by the same amount. Net assets and net asset value per share were not affected by this reclassification.
NOTE 2—Bank Lines of Credit:
Prior to October 15, 2008, the fund participated with other Dreyfus-managed funds in a $350 million redemption credit facility. Effective October 15, 2008, the fund participates with other Dreyfus-managed funds in a $145 million redemption credit facility (the “Facility”) to be utilized for temporary or emergency purposes, including the financing of redemptions. In connection therewith, the fund has agreed to pay commitment fees on its pro rata portion of the Facility. Interest is charged to the fund based on prevailing market rates in effect at the time of borrowing.
The Fund 43
| NOTES TO FINANCIAL STATEMENTS (continued) |
The average daily amount of borrowings outstanding under the Facilities during the period ended November 30, 2008, was $99,200 with a related weighted average annualized interest rate of 2.91% .
NOTE 3—Management Fee and Other Transactions With Affiliates:
(a) Pursuant to a Management Agreement (“Agreement”) with the Manager, the management fee is computed at the annual rate of .80% of the value of the fund’s average daily net assets and is payable monthly. The Manager had agreed from December 1, 2007 through November 30, 2008 to waive receipt of a portion of the fund’s management fee in the amount of .10% of the value of the fund’s average daily net assets. The reduction in management fee, pursuant to the undertaking, amounted to $411,248 during the period ended November 30, 2008.
During the period ended November 30, 2008, the Distributor retained $14,746 and $37 from commissions earned on sales of the fund’s Class A and ClassT shares,respectively,and $407,535 and $5,587 from CDSCs on redemptions of the fund’s Class B and Class C shares, respectively.
(b) Under the Distribution Plan (the “Plan”) adopted pursuant to Rule 12b-1 under the Act, Class B, Class C and Class T shares pay the Distributor for distributing their shares at an annual rate of .75% of the value of the average daily net assets of Class B and Class C shares and .25% of the value of the average daily net assets of Class T shares. During the period ended November 30, 2008, Class B, Class C and Class T shares were charged $898,602, $497,328 and $3,248, respectively, pursuant to the Plan.
(c) Under the Shareholder Services Plan (“Shareholder Services Plan”), Class A, Class B, Class C and Class T shares pay the Distributor at an annual rate of .25% of the value of their average daily net assets for the provision of certain services.The services provided may include personal services relating to shareholder accounts, such as answering shareholder inquiries regarding the fund and providing reports and other information, and services related to the maintenance of share-
44
holder accounts. The Distributor may make payments to Service Agents (a securities dealer, financial institution or other industry professional) in respect of these services.The Distributor determines the amounts to be paid to Service Agents. During the period ended November 30, 2008, Class A, Class B, Class C and Class T shares were charged $288,167, $299,534, $165,776 and $3,248, respectively, pursuant to the Shareholder Services Plan.
Under the Shareholder Services Plan with respect to Class Z (“Class Z Shareholder Services Plan”), Class Z shares reimburse the Distributor an amount not to exceed an annual rate of .25% of the value of Class Z shares’ average daily net assets for certain allocated expenses of providing personal services and/or maintaining shareholder accounts.The services provided may include personal services relating to shareholder accounts, such as answering shareholder inquiries regarding Class Z shares and providing reports and other information, and services related to the maintenance of shareholder accounts. During the period ended November 30, 2008, Class Z shares were charged $27,038 pursuant to the Class Z Shareholder Services Plan.
The fund compensates Dreyfus Transfer, Inc., a wholly-owned subsidiary of the Manager, under a transfer agency agreement for providing personnel and facilities to perform transfer agency services for the fund. During the period ended November 30, 2008, the fund was charged $249,480 pursuant to the transfer agency agreement.
The fund compensates The Bank of New York Mellon under a cash management agreement for performing cash management services related to fund subscriptions and redemptions. During the period ended November 30, 2008, the fund was charged $30,268 pursuant to the cash management agreement.
The fund compensates The Bank of New York Mellon under a custody agreement for providing custodial services for the fund. During the period ended November 30, 2008, the fund was charged $69,703 pursuant to the custody agreement.
The Fund 45
| NOTES TO FINANCIAL STATEMENTS (continued) |
During the period ended November 30, 2008, the fund was charged $6,086 for services performed by the Chief Compliance Officer.
The components of “Due to The Dreyfus Corporation and affiliates” in the Statement of Assets and Liabilities consist of: management fees $178,448, Rule 12b-1 distribution plan fees $77,152, shareholder services plan fees $40,975, custodian fees $24,688, chief compliance officer fees $2,466 and transfer agency per account fees $38,945, which are offset against an expense reimbursement currently in effect in the amount of $22,306.
(d) Each Board member also serves as a Board member of other funds within the Dreyfus complex. Annual retainer fees and attendance fees are allocated to each fund based on net assets.
NOTE 4—Securities Transactions:
The aggregate amount of purchases and sales (including paydowns) of investment securities, excluding short-term securities, during the period ended November 30, 2008, amounted to $570,689,245 and $686,025,302, respectively.
At November 30, 2008, the cost of investments for federal income tax purposes was $357,230,289; accordingly, accumulated net unrealized depreciation on investments was $75,256,766, consisting of $3,442,409 gross unrealized appreciation and $78,699,175 gross unrealized depreciation.
In March 2008, the FASB released Statement of Financial Accounting Standards No. 161, “Disclosures about Derivative Instruments and Hedging Activities” (“FAS 161”). FAS 161 requires qualitative disclosures about objectives and strategies for using derivatives, quantitative disclosures about fair value amounts of gains and losses on derivative instruments, and disclosures about credit-risk-related contingent fea-
46
tures in derivative agreements.The application of FAS 161 is required for fiscal years and interim periods beginning after November 15, 2008. At this time, management is evaluating the implications of FAS 161 and its impact on the financial statements and the accompanying notes has not yet been determined.
NOTE 5—Subsequent Event:
Effective on or about February 4, 2009 (the “Effective Date”), the fund will issue to each holder of its Class T shares, in exchange for said shares, Class A shares of the fund having an aggregate net asset value equal to the aggregate net asset value of the shareholder’s Class T shares.Thereafter, the fund will no longer offer Class T shares.
Effective on or about December 3, 2008, no investments for new accounts were permitted in Class T of the fund, except that participants in certain group retirement plans were able to open a new account in Class T of the fund, provided that the fund was established as an investment option under the plans before December 3, 2008. After the Effective Date, subsequent investments in the fund’s Class A shares made by holders of the fund’s Class T shares who received Class A shares of the fund in exchange for their Class T shares will be subject to the front-end sales load schedule currently in effect for Class T shares. Otherwise, all other Class A share attributes will be in effect.
NOTE 6—Plan of Reorganization:
(a) At a meeting on July 15, 2008, the Board of Trustees approved an Agreement and Plan of Reorganization between the fund and Dreyfus Balanced Fund (the “Acquired Fund”), providing for the Acquired fund to merge into the fund as part of a tax-free reorganization.The merger, which was approved by the Acquired Fund’s shareholders on
The Fund 47
| NOTES TO FINANCIAL STATEMENTS (continued) |
November 19, 2008, occurred on January 8, 2009. On that date, the Acquired Fund’s Class A, Class B, Class C, Class I and Class T shares merged into Class A, Class B, Class C, Class I and Class T shares of the fund. On the merger date, the Acquired Fund exchanged all of its assets at net asset value, subject to liabilities, for an equivalent value of shares of the fund. Such shares were distributed pro rata to shareholders of the Acquired Fund so that each shareholder received a number of shares of the fund equal to the aggregate net asset value of the shareholder’s Acquired Fund’s shares.
(b)The Manager has contractually agreed from January 8, 2009 through January 8, 2010, one year after the reorganization, to waive receipt of its fees and/or assume the expenses of the fund, so that the net operating expenses of the fund’s Class A, B, C, I and T shares (excluding taxes, interest, brokerage commissions, commitment fees on borrowings and extraordinary expenses) do not exceed 1.11%, 1.86%, 1.86%, .85% and 1.36%, respectively, of such class’ average daily net assets.
48
| REPORT OF INDEPENDENT REGISTERED PUBLIC ACCOUNTING FIRM |
| Shareholders and Board of Trustees Dreyfus Balanced Opportunity Fund |
We have audited the accompanying statement of assets and liabilities, including the statement of investments,of Dreyfus Balanced Opportunity Fund (formerly, Dreyfus Premier Balanced Opportunity Fund) (the sole series comprising Dreyfus Premier Manager Funds II), as of November 30, 2008, and the related statement of operations for the year then ended, and the statement of changes in net assets and financial highlights for each of the two years in the period then ended.These financial statements and financial highlights are the responsibility of the Fund’s management. Our responsibility is to express an opinion on these financial statements and financial highlights based on our audits.The financial highlights for the years ended November 30, 2006, 2005 and 2004, were audited by other auditors whose report dated January 19, 2007, expressed an unqualified opinion on such financial highlights.
We conducted our audits in accordance with the standards of the Public Company Accounting Oversight Board (United States).Those standards require that we plan and perform the audit to obtain reasonable assurance about whether the financial statements and financial highlights are free of material misstatement.We were not engaged to perform an audit of the Fund’s internal control over financial reporting. Our audits included consideration of internal control over financial reporting as a basis for designing audit procedures that are appropriate in the circumstances, but not for the purpose of expressing an opinion on the effectiveness of the Fund’s internal control over financial reporting. Accordingly, we express no such opinion. An audit also includes examining, on a test basis, evidence supporting the amounts and disclosures in the financial statements and financial highlights, assessing the accounting principles used and significant estimates made by management, and evaluating the overall financial statement presentation. Our procedures included confirmation of securities owned as of November 30, 2008 by correspondence with the custodian and others. We believe that our audits provide a reasonable basis for our opinion. In our opinion, the 2008 and 2007 financial statements and financial highlights referred to above present fairly, in all material respects, the financial position of Dreyfus Balanced Opportunity Fund at November 30, 2008, the results of its operations for the year then ended and the changes in its net assets and the financial highlights for each of the two years in the period then ended, in conformity with U.S. generally accepted accounting principles.
| New York, New York January 20, 2009 |
The Fund 49
IMPORTANT TAX INFORMATION (Unaudited)
For federal tax purposes the fund hereby designates 49.33% of the ordinary dividends paid during the fiscal year ended November 30, 2008 as qualifying for the corporate dividends received deduction. Also certain dividends paid by the Fund may be subject to a maximum tax rate of 15%, as provided for by the Jobs and Growth Tax Relief Reconciliation Act of 2003. Of the distributions paid during the fiscal year, $745,038 represents the maximum amount that may be considered qualified dividend income. Shareholders will receive notification in January 2009 of the percentage applicable to the preparation of their 2008 income tax returns.Also, the Fund hereby designates $2.9350 per share as a long-term capital gain distribution and $.2020 per share as a short-term capital gain distribution paid on December 31, 2007.
50
BOARD MEMBERS INFORMATION (Unaudited)

| The Fund 51 |
BOARD MEMBERS INFORMATION (Unaudited) (continued)
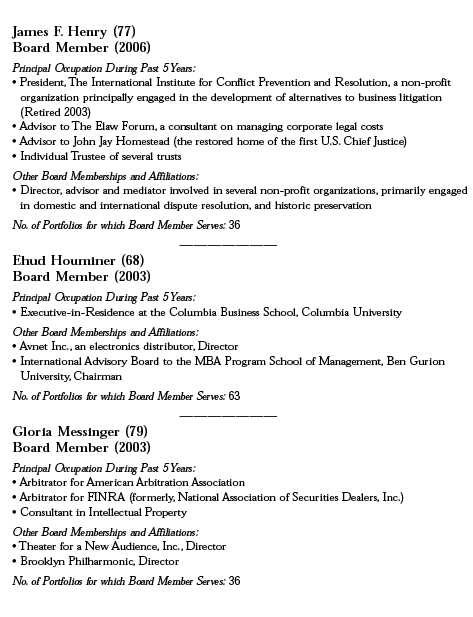
52

The Fund 53
OFFICERS OF THE FUND (Unaudited)
J. DAVID OFFICER, President since December 2006.
Chief Operating Officer,Vice Chairman and a Director of the Manager, and an officer of 77 investment companies (comprised of 180 portfolios) managed by the Manager. He is 60 years old and has been an employee of the Manager since April 1998.
PHILLIP N. MAISANO, Executive Vice President since July 2007.
Chief Investment Officer,Vice Chair and a director of the Manager, and an officer of 77 investment companies (comprised of 180 portfolios) managed by the Manager. Mr. Maisano also is an officer and/or Board member of certain other investment management subsidiaries of The Bank of New York Mellon Corporation, each of which is an affiliate of the Manager. He is 61 years old and has been an employee of the Manager since November 2006. Prior to joining the Manager, Mr. Maisano served as Chairman and Chief Executive Officer of EACM Advisors, an affiliate of the Manager, since August 2004, and served as Chief Executive Officer of Evaluation Associates, a leading institutional investment consulting firm, from 1988 until 2004.
MICHAEL A. ROSENBERG, Vice President and Secretary since August 2005.
Assistant General Counsel of BNY Mellon, and an officer of 78 investment companies (comprised of 201 portfolios) managed by the Manager. He is 48 years old and has been an employee of the Manager since October 1991.
JAMES BITETTO, Vice President and Assistant Secretary since August 2005.
Senior Counsel of BNY Mellon and Secretary of the Manager, and an officer of 78 investment companies (comprised of 201 portfolios) managed by the Manager. He is 42 years old and has been an employee of the Manager since December 1996.
JONI LACKS CHARATAN, Vice President and Assistant Secretary since August 2005.
Senior Counsel of BNY Mellon, and an officer of 78 investment companies (comprised of 201 portfolios) managed by the Manager. She is 53 years old and has been an employee of the Manager since October 1988.
JOSEPH M. CHIOFFI, Vice President and Assistant Secretary since August 2005.
Senior Counsel of BNY Mellon, and an officer of 78 investment companies (comprised of 201 portfolios) managed by the Manager. He is 47 years old and has been an employee of the Manager since June 2000.
JANETTE E. FARRAGHER, Vice President and Assistant Secretary since August 2005.
Assistant General Counsel of BNY Mellon, and an officer of 78 investment companies (comprised of 201 portfolios) managed by the Manager. She is 46 years old and has been an employee of the Manager since February 1984.
JOHN B. HAMMALIAN, Vice President and Assistant Secretary since August 2005.
Managing Counsel of BNY Mellon, and an officer of 78 investment companies (comprised of 201 portfolios) managed by the Manager. He is 45 years old and has been an employee of the Manager since February 1991.
ROBERT R. MULLERY, Vice President and Assistant Secretary since August 2005.
Managing Counsel of BNY Mellon, and an officer of 78 investment companies (comprised of 201 portfolios) managed by the Manager. He is 56 years old and has been an employee of the Manager since May 1986.
54
JEFF PRUSNOFSKY, Vice President and Assistant Secretary since August 2005.
Managing Counsel of BNY Mellon, and an officer of 78 investment companies (comprised of 201 portfolios) managed by the Manager. He is 43 years old and has been an employee of the Manager since October 1990.
JAMES WINDELS, Treasurer since September 2003.
Director – Mutual Fund Accounting of the Manager, and an officer of 78 investment companies (comprised of 201 portfolios) managed by the Manager. He is 49 years old and has been an employee of the Manager since April 1985.
RICHARD CASSARO, Assistant Treasurer since January 2008.
Senior Accounting Manager – Money Market and Municipal Bond Funds of the Manager, and an officer of 78 investment companies (comprised of 201 portfolios) managed by the Manager. He is 49 years old and has been an employee of the Manager since September 1982.
GAVIN C. REILLY, Assistant Treasurer since December 2005.
Tax Manager of the Investment Accounting and Support Department of the Manager, and an officer of 78 investment companies (comprised of 201 portfolios) managed by the Manager. He is 40 years old and has been an employee of the Manager since April 1991.
ROBERT ROBOL, Assistant Treasurer since August 2005.
Senior Accounting Manager – Fixed Income Funds of the Manager, and an officer of 78 investment companies (comprised of 201 portfolios) managed by the Manager. He is 44 years old and has been an employee of the Manager since October 1988.
ROBERT SALVIOLO, Assistant Treasurer since May 2007.
Senior Accounting Manager – Equity Funds of the Manager, and an officer of 78 investment companies (comprised of 201 portfolios) managed by the Manager. He is 41 years old and has been an employee of the Manager since June 1989.
ROBERT SVAGNA, Assistant Treasurer since September 2003.
Senior Accounting Manager – Equity Funds of the Manager, and an officer of 78 investment companies (comprised of 201 portfolios) managed by the Manager. He is 41 years old and has been an employee of the Manager since November 1990.
JOSEPH W. CONNOLLY, Chief Compliance Officer since October 2004.
Chief Compliance Officer of the Manager and The Dreyfus Family of Funds (78 investment companies, comprised of 201 portfolios). From November 2001 through March 2004, Mr. Connolly was first Vice-President, Mutual Fund Servicing for Mellon Global Securities Services. In that capacity, Mr. Connolly was responsible for managing Mellon’s Custody, Fund Accounting and Fund Administration services to third-party mutual fund clients. He is 51 years old and has served in various capacities with the Manager since 1980, including manager of the firm’s Fund Accounting Department from 1997 through October 2001.
WILLIAM GERMENIS, Anti-Money Laundering Compliance Officer since September 2003.
Vice President and Anti-Money Laundering Compliance Officer of the Distributor, and the Anti-Money Laundering Compliance Officer of 74 investment companies (comprised of 197 portfolios) managed by the Manager. He is 38 years old and has been an employee of the Distributor since October 1998.
The Fund 55
NOTES
For More Information
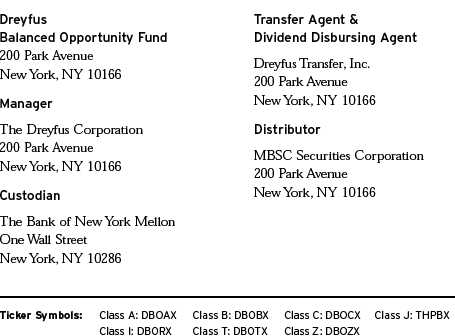
Telephone Call your financial representative or 1-800-554-4611
Mail The Dreyfus Family of Funds, 144 Glenn Curtiss Boulevard, Uniondale, NY 11556-0144
The fund files its complete schedule of portfolio holdings with the Securities and Exchange Commission (“SEC”) for the first and third quarters of each fiscal year on Form N-Q. The fund’s Forms N-Q are available on the SEC’s website at http://www.sec.gov and may be reviewed and copied at the SEC’s Public Reference Room in Washington, DC. Information on the operation of the Public Reference Room may be obtained by calling 1-800-SEC-0330.
A description of the policies and procedures that the fund uses to determine how to vote proxies relating to portfolio securities, and information regarding how the fund voted these proxies for the 12-month period ended June 30, 2008, is available at http://www.dreyfus.com and on the SEC’s website at http://www.sec.gov. The description of the policies and procedures is also available without charge, upon request, by calling 1-800-645-6561.

| Item 2. | Code of Ethics. |
The Registrant has adopted a code of ethics that applies to the Registrant's principal executive officer, principal financial officer, principal accounting officer or controller, or persons performing similar functions. There have been no amendments to, or waivers in connection with, the Code of Ethics during the period covered by this Report.
| Item 3. | Audit Committee Financial Expert. |
The Registrant's Board has determined that David P. Feldman, a member of the Audit Committee of the Board, is an audit committee financial expert as defined by the Securities and Exchange Commission (the "SEC"). Mr. Feldman is "independent" as defined by the SEC for purposes of audit committee financial expert determinations.
| Item 4. | Principal Accountant Fees and Services. |
(a) Audit Fees. The aggregate fees billed for each of the last two fiscal years (the "Reporting Periods") for professional services rendered by the Registrant's principal accountant (the "Auditor") for the audit of the Registrant's annual financial statements or services that are normally provided by the Auditor in connection with the statutory and regulatory filings or engagements for the Reporting Periods, were $47,000 in 2007 with respect to PricewaterhouseCoopers LLP (“PWC”), the Registrant’s previous Auditor, and $51,122 in 2007 with respect to Ernst & Young LLP (“E&Y”), the Registrant’s current Auditor, and $47,380 in 2008.
(b) Audit-Related Fees. The aggregate fees billed in the Reporting Periods for assurance and related services by the Auditor that are reasonably related to the performance of the audit of the Registrant's financial statements and are not reported under paragraph (a) of this Item 4 were $0 in 2007 and $10,398 in 2008.
The aggregate fees billed in the Reporting Periods for non-audit assurance and related services by the Auditor to the Registrant's investment adviser (not including any sub-investment adviser whose role is primarily portfolio management and is subcontracted with or overseen by another investment adviser), and any entity controlling, controlled by or under common control with the investment adviser that provides ongoing services to the Registrant ("Service Affiliates"), that were reasonably related to the performance of the annual audit of the Service Affiliate, which required pre-approval by the Audit Committee were $0 in 2007 and $0 in 2008.
Note: For the second paragraph in each of (b) through (d) of this Item 4, certain of such services were not pre-approved prior to May 6, 2003, when such services were required to be pre-approved. On and after May 6, 2003, 100% of all services provided by the Auditor were pre-approved as required. For comparative purposes, the fees shown assume that all such services were pre-approved, including services that were not pre-approved prior to the compliance date of the pre-approval requirement.
(c) Tax Fees. The aggregate fees billed in the Reporting Periods for professional services rendered by the Auditor for tax compliance, tax advice, and tax planning ("Tax Services") were $2,800 in 2007 with respect to PWC and $3,607 in 2008 with respect to E&Y. These services consisted of: (i) review or preparation of U.S. federal, state, local and excise tax returns; (ii) U.S. federal, state and local tax planning, advice and assistance regarding statutory, regulatory or administrative developments; (iii) tax advice regarding tax qualification matters and/or treatment of various financial instruments held or proposed to be acquired or held. The aggregate fees billed in the Reporting Periods for Tax Services by the Auditor to Service Affiliates, which required pre-approval by the Audit Committee were $0 in 2007 and $0 in 2008.
(d) All Other Fees. The aggregate fees billed in the Reporting Periods for products and services provided by the Auditor, other than the services reported in paragraphs (a) through (c) of this Item, were $0 in 2007 and $194 in 2008. [These services consisted of a review of the Registrant's anti-money laundering program].
The aggregate fees billed in the Reporting Periods for Non-Audit Services by the Auditor to Service Affiliates, other than the services reported in paragraphs (b) through (c) of this Item, which required pre-approval by the Audit Committee, were $0 in 2007 and $0 in 2008.
Audit Committee Pre-Approval Policies and Procedures. The Registrant's Audit Committee has established policies and procedures (the "Policy") for pre-approval (within specified fee limits) of the Auditor's engagements for non-audit services to the Registrant and Service Affiliates without specific case-by-case consideration. Pre-approval considerations include whether the proposed services are compatible with maintaining the Auditor's independence. Pre-approvals pursuant to the Policy are considered annually.
Non-Audit Fees. The aggregate non-audit fees billed by the Auditor for services rendered to the Registrant, and rendered to Service Affiliates, for the Reporting Periods were $1,890,737 in 2007 and $9,452,992 in 2008, both with respect to E&Y.
Auditor Independence. The Registrant's Audit Committee has considered whether the provision of non-audit services that were rendered to Service Affiliates, which were not pre-approved (not requiring pre-approval), is compatible with maintaining the Auditor's independence.
| Item 5. | Audit Committee of Listed Registrants. | |
| Not applicable. [CLOSED-END FUNDS ONLY] | ||
| Item 6. | Investments. | |
| (a) | Not applicable. | |
| Item 7. | Disclosure of Proxy Voting Policies and Procedures for Closed-End Management | |
| Investment Companies. | ||
| Not applicable. [CLOSED-END FUNDS ONLY] | ||
| Item 8. | Portfolio Managers of Closed-End Management Investment Companies. | |
| Not applicable. [CLOSED-END FUNDS ONLY, beginning with reports for periods ended | ||
| on and after December 31, 2005] | ||
| Item 9. | Purchases of Equity Securities by Closed-End Management Investment Companies and | |
| Affiliated Purchasers. | ||
| Not applicable. [CLOSED-END FUNDS ONLY] | ||
| Item 10. | Submission of Matters to a Vote of Security Holders. |
The Registrant has a Nominating Committee (the "Committee"), which is responsible for selecting and nominating persons for election or appointment by the Registrant's Board as Board members. The Committee has adopted a Nominating Committee Charter (the "Charter"). Pursuant to the Charter, the Committee will consider recommendations for nominees from shareholders submitted to the Secretary of the
Registrant, c/o The Dreyfus Corporation Legal Department, 200 Park Avenue, 8th Floor East, New York, New York 10166. A nomination submission must include information regarding the recommended nominee as specified in the Charter. This information includes all information relating to a recommended nominee that is required to be disclosed in solicitations or proxy statements for the election of Board members, as well as information sufficient to evaluate the factors to be considered by the Committee, including character and integrity, business and professional experience, and whether the person has the ability to apply sound and independent business judgment and would act in the interests of the Registrant and its shareholders. Nomination submissions are required to be accompanied by a written consent of the individual to stand for election if nominated by the Board and to serve if elected by the shareholders, and such additional information must be provided regarding the recommended nominee as reasonably requested by the Committee.
| Item 11. | Controls and Procedures. |
(a) The Registrant's principal executive and principal financial officers have concluded, based on their evaluation of the Registrant's disclosure controls and procedures as of a date within 90 days of the filing date of this report, that the Registrant's disclosure controls and procedures are reasonably designed to ensure that information required to be disclosed by the Registrant on Form N-CSR is recorded, processed, summarized and reported within the required time periods and that information required to be disclosed by the Registrant in the reports that it files or submits on Form N-CSR is accumulated and communicated to the Registrant's management, including its principal executive and principal financial officers, as appropriate to allow timely decisions regarding required disclosure.
(b) There were no changes to the Registrant's internal control over financial reporting that occurred during the second fiscal quarter of the period covered by this report that have materially affected, or are reasonably likely to materially affect, the Registrant's internal control over financial reporting.
| Item 12. | Exhibits. |
(a)(1) Code of ethics referred to in Item 2.
(a)(2) Certifications of principal executive and principal financial officers as required by Rule 30a-2(a) under the Investment Company Act of 1940.
(a)(3) Not applicable.
(b) Certification of principal executive and principal financial officers as required by Rule 30a-2(b) under the Investment Company Act of 1940.
| SIGNATURES |
Pursuant to the requirements of the Securities Exchange Act of 1934 and the Investment Company Act of 1940, the Registrant has duly caused this Report to be signed on its behalf by the undersigned, thereunto duly authorized.
Dreyfus Manager Funds II
| By: | /s/ J. David Officer | |
| J. David Officer, | ||
| President | ||
| Date: | January 26, 2009 | |
Pursuant to the requirements of the Securities Exchange Act of 1934 and the Investment Company Act of 1940, this Report has been signed below by the following persons on behalf of the Registrant and in the capacities and on the dates indicated.
| By: | /s/ J. David Officer | |
| J. David Officer, | ||
| President | ||
| Date: | January 26, 2009 | |
| By: | /s/ James Windels | |
| James Windels, | ||
| Treasurer | ||
| Date: | January 26, 2009 | |
| EXHIBIT INDEX |
(a)(1) Code of ethics referred to in Item 2.
(a)(2) Certifications of principal executive and principal financial officers as required by Rule 30a-2(a) under the Investment Company Act of 1940. (EX-99.CERT)
(b) Certification of principal executive and principal financial officers as required by Rule 30a-2(b) under the Investment Company Act of 1940. (EX-99.906CERT)