UNITED STATES
SECURITIES AND EXCHANGE COMMISSION
Washington, D.C. 20549
FORM N-CSR
CERTIFIED SHAREHOLDER REPORT OF REGISTERED MANAGEMENT
INVESTMENT COMPANIES
Investment Company Act file number 811-21327
Dreyfus Manager Funds II
(Exact name of Registrant as specified in charter)
c/o The Dreyfus Corporation
200 Park Avenue
New York, New York 10166
(Address of principal executive offices) (Zip code)
Michael A. Rosenberg, Esq.
200 Park Avenue
New York, New York 10166
(Name and address of agent for service)
Registrant's telephone number, including area code: (212) 922-6000
Date of fiscal year end: 11/30
Date of reporting period: 11/30/09
FORM N-CSR
Item 1. Reports to Stockholders.
Save time. Save paper. View your next shareholder report online as soon as it’s available. Log into www.dreyfus.com and sign up for Dreyfus eCommunications. It’s simple and only takes a few minutes.
The views expressed in this report reflect those of the portfolio manager only through the end of the period covered and do not necessarily represent the views of Dreyfus or any other person in the Dreyfus organization. Any such views are subject to change at any time based upon market or other conditions and Dreyfus disclaims any responsibility to update such views.These views may not be relied on as investment advice and, because investment decisions for a Dreyfus fund are based on numerous factors, may not be relied on as an indication of trading intent on behalf of any Dreyfus fund.
Not FDIC-Insured • Not Bank-Guaranteed • May Lose Value
Contents | |
THE FUND | |
| 2 | A Letter from the Chairman and CEO |
| 3 | Discussion of Fund Performance |
| 6 | Fund Performance |
| 8 | Understanding Your Fund’s Expenses |
| 9 | Comparing Your Fund’s Expenses With Those of Other Funds |
| 10 | Statement of Investments |
| 26 | Statement of Assets and Liabilities |
| 28 | Statement of Operations |
| 29 | Statement of Changes in Net Assets |
| 33 | Financial Highlights |
| 39 | Notes to Financial Statements |
| 52 | Report of Independent Registered Public Accounting Firm |
| 53 | Important Tax Information |
| 54 | Board Members Information |
| 56 | Officers of the Fund |
FOR MORE INFORMATION | |
Back Cover |
The Fund
Dreyfus
Balanced Opportunity Fund

A LETTER FROM THE CHAIRMAN AND CEO
Dear Shareholder:
We are pleased to present this annual report for Dreyfus Balanced Opportunity Fund, covering the 12-month period from December 1, 2008, through November 30, 2009.
Evidence has continued to accumulate that the global recession is over and sustained economic recoveries have begun in the United States and worldwide. Central bank liquidity actions, accommodative monetary policies and economic stimulus programs in many different countries succeeded in calming the financial crisis, ending the recession and sparking the beginning of a global expansion.As 2009 draws to a close, economic policy remains stimulative in nearly every country in the world, and we expect these simultaneous stimuli to support a sustained but moderate global expansion in 2010.
The recovering economy has so far had a salutary impact on the U.S. stock market, as stock prices and commodity prices have risen in anticipation of renewed demand from consumers and businesses. However, for most of the reporting period, lower-quality securities led the market’s advance as investors sought bargains in the wake of economic and market turbulence. Only recently have we seen evidence that investors are focusing more intently on longer term fundamentals, suggesting to us that market leadership in 2010 may shift to higher-quality stocks and more seasoned investment managers.As always, your financial advisor can help you prepare for the challenges and opportunities that lie ahead.
For information about how the fund performed during the reporting period, as well as market perspectives, we have provided a Discussion of Fund Performance.
Thank you for your continued confidence and support.
Jonathan R. Baum
Chairman and Chief Executive Officer
The Dreyfus Corporation
December 15, 2009
2

DISCUSSION OF FUND PERFORMANCE
For the reporting period of December 1, 2008, through November 30, 2009, as provided by Keith Stransky, Brian Ferguson, Sean Fitzgibbon, David Bowser and Peter Vaream, Portfolio Managers
Fund and Market Performance Overview
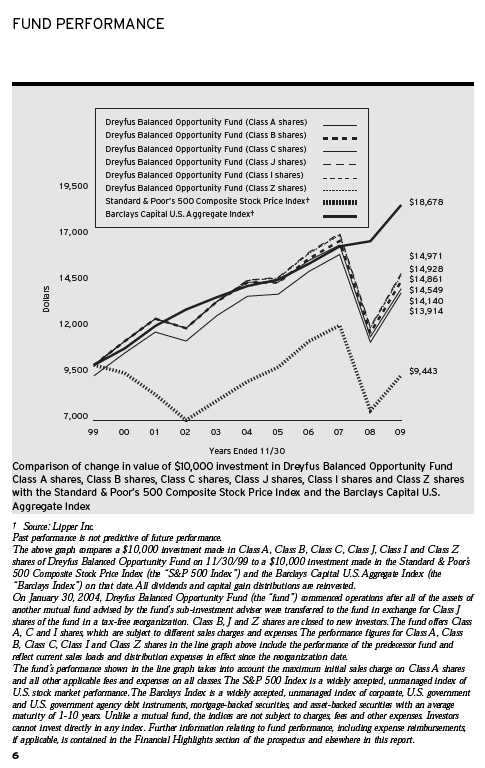
For the 12-month period ended November 30, 2009, Dreyfus Balanced Opportunity Fund’s Class A shares produced a total return of 23.77%, Class B shares returned 22.58%, Class C shares returned 22.68%, Class I shares returned 24.15%, Class J shares returned 23.81% and Class Z shares returned 23.63%.1 In comparison, the fund’s benchmark, a blended index composed of 60% Standard & Poor’s 500 Composite Stock Price Index (“S&P 500 Index”) and 40% Barclays Capital U.S. Aggregate Bond Index, produced a 19.88% total return for the same period.2 Separately, the S&P 500 Index and the Barclays Capital U.S. Aggregate Index produced total returns of 25.38% and 11.63%, respectively, for the same period.
After contracting sharply early in the reporting period, the U.S. economy returned to growth during the third quarter of 2009. Stocks and higher yielding sectors of the bond market bounced back robustly as investors anticipated an improved environment for businesses and consumers.The fund’s stock and bond portfolios each produced higher returns than their benchmarks. The fund’s equity investments benefited from favorable stock selections in the consumer staples, materials and energy sectors, and the bond portion was bolstered by an emphasis on investment-grade corporate bonds, rather than Treasuries, which lagged.
The Fund’s Investment Approach
The fund seeks high total return, including capital appreciation and current income, through a diversified mix of stocks and fixed-income securities. When allocating assets, the fund’s asset allocation manager assesses the relative return and risk of each asset class, general economic conditions, anticipated future changes in interest rates and the general outlook for stocks.
The fund’s equity portfolio managers create a broadly diversified equity portfolio that includes a blend of growth and value stocks. Using quantitative and fundamental research, we look for companies with leading
The Fund 3
DISCUSSION OF FUND PERFORMANCE (continued)
market positions, competitive or technological advantages, high returns on equity and assets, good growth prospects, attractive valuations and strong management teams.
The fund normally invests between 25% and 50% of its assets in fixed-income securities that, at the time of purchase, are rated investment grade or the non-rated equivalent as determined by Dreyfus.We may invest up to 5% of the fixed-income portfolio in securities rated below investment grade and up to 10% in bonds from foreign issuers.
Strong Market Rallies More Than Offset Earlier Losses
The global financial crisis that roiled credit markets and drove the U.S. economy into recession continued to wreak economic havoc though the first quarter of 2009.The U.S. unemployment rate climbed, housing markets struggled and consumer confidence plunged. Stocks and several bond market sectors were battered by these conditions, while traditional safe havens such as U.S.Treasury securities gained value.
The U.S. government and the Federal Reserve Board (the “Fed”) took aggressive action to address these developments.The federal government enacted a massive stimulus package and rescued several troubled corporations, while the Fed injected liquidity into the banking system and cut short-term interest rates to unprecedented lows.These measures boosted investor confidence, sparking sustained market rallies that began in March 2009 and generally persisted through the reporting period’s end. The rally was particularly robust among lower-quality stocks and bonds that had been severely punished during the downturn.
Security Selections Supported Relative Performance
The fund’s stock selection strategy helped cushion declines during the downturn and participate fully in the subsequent rally. Several of the better performers were consumer staples holdings. Dairy producer Dean Foods benefited from falling milk and energy prices, prompting us to sell the position after it had gained substantial value. Bottler Coca-Cola Enterprises more than doubled in value after renegotiating its agreement with The Coca-Cola Co.The fund did not hold household goods giant Procter & Gamble and avoided its weakness as investors turned away from traditionally defensive stocks.
In the materials sector, mining company Freeport McMoRan Copper & Gold and chemicals producer Celanese advanced in anticipation of a
4
global economic recovery, while fertilizer producer Mosaic benefited from holding firm on its pricing. Finally, in the energy sector, underweighted exposure to ExxonMobil helped support relative performance. Instead, the fund held stronger performing exploration-and-production companies, such as Occidental Petroleum and Newfield Exploration.
The fund’s fixed-income investments benefited from overweighted exposure to investment-grade corporate bonds as well as high-quality commercial mortgage-backed securities and asset-backed securities. These market sectors rebounded strongly after declining sharply over the second half of 2008. Among corporate bonds, holdings in the media, cable television and electric utility industries fared particularly well.Although interest-rate strategies detracted modestly from relative performance, it was not enough to offset the success of our sector allocation and security selection strategies.
Positioned for Gradual Recovery
We remain cautiously optimistic regarding the prospects for both stocks and bonds. We have focused on higher-quality stocks that appear undervalued relative to their usual earnings power, and where we see potential catalysts for future growth. Our fixed-income investments have continued to emphasize investment-grade corporate bonds and high-quality commercial mortgages. In our judgment, these strategies position the fund for gains if, as we expect, investors increasingly turn toward higher-quality investments amid a subpar economic recovery.
December 15, 2009
| 1 | Total return includes reinvestment of dividends and any capital gains paid, and does not take into consideration the maximum initial sales charge in the case of Class A shares, or the applicable contingent deferred sales charges imposed on redemptions in the case of Class B and Class C shares. |
Had these charges been reflected, returns would have been lower. Past performance is no guarantee of future results. Share price and investment return fluctuate such that upon redemption, fund shares may be worth more or less than their original cost. Return figures for Classes A, B, C and I shares provided reflect the absorption of certain fund expenses by The Dreyfus Corporation pursuant to an undertaking in effect through March 31, 2010, at which time it may be extended, terminated or modified. Had these expenses not been absorbed, the fund’s returns would have been lower. | |
| 2 | SOURCE: LIPPER INC. — Reflects reinvestment of dividends and, where applicable, capital gain distributions.The Standard & Poor’s 500 Composite Stock Price Index is a widely accepted, unmanaged index of U.S. stock market performance.The Barclays Capital U.S.Aggregate Bond Index is a widely accepted, unmanaged total return index of corporate, U.S. government and U.S. government agency debt instruments, mortgage-backed securities and asset-backed securities with an average maturity of 1-10 years. |
The Fund 5
| Average Annual Total Returns as of 11/30/09 | ||||||
| 1 | Year | 5 Years | 10 Years | |||
| Class A shares | ||||||
| with maximum sales charge (5.75%) | 16.65 | % | –0.94 | % | 3.36 | % |
| without sales charge | 23.77 | % | 0.25 | % | 3.97 | % |
| Class B shares | ||||||
| with applicable redemption charge † | 18.58 | % | –0.88 | % | 3.82 | % |
| without redemption | 22.58 | % | –0.56 | % | 3.82 | % |
| Class C shares | ||||||
| with applicable redemption charge †† | 21.68 | % | –0.50 | % | 3.53 | % |
| without redemption | 22.68 | % | –0.50 | % | 3.53 | % |
| Class J shares | 23.81 | % | 0.48 | % | 4.12 | % |
| Class I shares | 24.15 | % | 0.46 | % | 4.09 | % |
| Class Z shares | 23.63 | % | 0.33 | % | 4.04 | % |
Past performance is not predictive of future performance.The fund’s performance shown in the graph and table does not reflect the deduction of taxes that a shareholder would pay on fund distributions or the redemption of fund shares.The performance figures for Class A, Class B, Class C, Class I and Class Z shares shown in the table include the performance of the predecessor fund and reflect current sales loads and distribution expenses in effect since the reorganization date. Performance for Class B shares assumes the conversion of Class B shares to Class A shares at the end of the sixth year following the date of purchase.
† The maximum contingent deferred sales charge for Class B shares is 4%.After six years Class B shares convert to Class A shares.
The maximum contingent deferred sales charge for Class C shares is 1% for shares redeemed within one year of the date of purchase.
The Fund 7
UNDERSTANDING YOUR FUND’S EXPENSES (Unaudited)
As a mutual fund investor, you pay ongoing expenses, such as management fees and other expenses. Using the information below, you can estimate how these expenses affect your investment and compare them with the expenses of other funds.You also may pay one-time transaction expenses, including sales charges (loads) and redemption fees, which are not shown in this section and would have resulted in higher total expenses. For more information, see your fund’s prospectus or talk to your financial adviser.
Review your fund’s expenses
The table below shows the expenses you would have paid on a $1,000 investment in Dreyfus Balanced Opportunity Fund from June 1, 2009 to November 30, 2009. It also shows how much a $1,000 investment would be worth at the close of the period assuming actual returns and expenses.
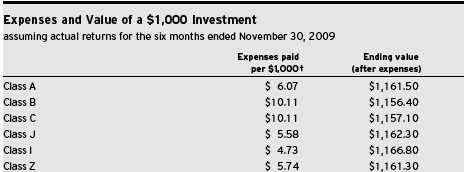
† Expenses are equal to the fund’s annualized expense ratio of 1.12% for Class A, 1.87% for Class B, 1.87% for Class C, 1.03% for Class J, .87% for Class I and 1.06% for Class Z, multiplied by the average account value over the period, multiplied by 183/365 (to reflect the one-half year period).
8
COMPARING YOUR FUND’S EXPENSES
WITH THOSE OF OTHER FUNDS (Unaudited)
Using the SEC’s method to compare expenses
The Securities and Exchange Commission (SEC) has established guidelines to help investors assess fund expenses. Per these guidelines, the table below shows your fund’s expenses based on a $1,000 investment, assuming a hypothetical 5% annualized return. You can use this information to compare the ongoing expenses (but not transaction expenses or total cost) of investing in the fund with those of other funds.All mutual fund shareholder reports will provide this information to help you make this comparison. Please note that you cannot use this information to estimate your actual ending account balance and expenses paid during the period.
† Expenses are equal to the fund’s annualized expense ratio of 1.12% for Class A, 1.87% for Class B, 1.87% for Class C, 1.03% for Class J, .87% for Class I and 1.06% for Class Z, multiplied by the average account value over the period, multiplied by 183/365 (to reflect the one-half year period).
The Fund 9
STATEMENT OF INVESTMENTS
November 30, 2009
| Coupon | Maturity | Principal | |||
| Bonds and Notes—31.0% | Rate (%) | Date | Amount ($) | Value ($) | |
| Asset—Backed Certificates—.0% | |||||
| Securitized Asset Backed | |||||
| Receivables, Ser. 2005-FR2, Cl. M1 | 0.68 | 3/25/35 | 73,215 | a | 70,112 |
| Asset-Backed Ctfs./ | |||||
| Auto Receivables—.5% | |||||
| Americredit Automobile Receivables | |||||
| Trust, Ser. 2008-AF, Cl. A2A | 4.47 | 1/12/12 | 32,574 | 32,827 | |
| Americredit Automobile Receivables | |||||
| Trust, Ser. 2007-DF, Cl. A3A | 5.49 | 7/6/12 | 219,539 | 222,942 | |
| Americredit Prime Automobile | |||||
| Receivables, Ser. 2007-1, Cl. B | 5.35 | 9/9/13 | 210,000 | 216,648 | |
| Capital Auto Receivables Asset | |||||
| Trust, Ser. 2007-SN2, Cl. A4 | 1.27 | 5/16/11 | 510,000 | a,b | 511,224 |
| Capital One Auto Finance Trust, | |||||
| Ser. 2007-A, Cl. A3B | 0.24 | 8/15/11 | 686 | a | 686 |
| Capital One Auto Finance Trust, | |||||
| Ser. 2007-C, Cl. A3A | 5.13 | 4/16/12 | 527,836 | 538,956 | |
| Ford Credit Auto Owner Trust, | |||||
| Ser. 2006-C, Cl. C | 5.47 | 9/15/12 | 100,000 | 105,691 | |
| Triad Auto Receivables Owner | |||||
| Trust, Ser. 2006-B, Cl. A3 | 5.41 | 8/12/11 | 119,687 | 120,191 | |
| 1,749,165 | |||||
| Asset-Backed Ctfs./Credit Cards—.1% | |||||
| Citibank Credit Card Issuance | |||||
| Trust, Ser. 2006-C4, Cl. C4 | 0.46 | 1/9/12 | 200,000 | a | 198,938 |
| Asset-Backed Ctfs./ | |||||
| Home Equity Loans—.3% | |||||
| Ameriquest Mortgage Securities, | |||||
| Ser. 2003-11, Cl. AF6 | 5.14 | 1/25/34 | 144,139 | a | 136,603 |
| Bear Stearns Asset Backed | |||||
| Securities Trust, | |||||
| Ser. 2005-EC1, Cl. A2 | 0.49 | 11/25/35 | 147,761 | a | 140,069 |
| Bear Stearns Asset Backed | |||||
| Securities Trust, | |||||
| Ser. 2005-HE7, Cl. M1 | 0.76 | 7/25/35 | 315,000 | a | 291,851 |
| Citigroup Mortgage Loan Trust, | |||||
| Ser. 2005-HE1, Cl. M1 | 0.67 | 5/25/35 | 102,963 | a | 100,762 |
| Home Equity Asset Trust, | |||||
| Ser. 2005-2, Cl. M1 | 0.69 | 7/25/35 | 94,997 | a | 91,858 |
10
| Coupon | Maturity | Principal | |||
| Bonds and Notes (continued) | Rate (%) | Date | Amount ($) | Value ($) | |
| Asset-Backed Ctfs./ | |||||
| Home Equity Loans (continued) | |||||
| Mastr Asset Backed Securities | |||||
| Trust, Ser. 2006-AM1, Cl. A2 | 0.37 | 1/25/36 | 13,505 | a | 12,946 |
| Residential Asset Securities, | |||||
| Ser. 2005-EMX4, Cl. A2 | 0.50 | 11/25/35 | 304,100 | a | 277,012 |
| 1,051,101 | |||||
| Asset-Backed Ctfs./ | |||||
| Manufactured Housing—.0% | |||||
| Green Tree Financial, | |||||
| Ser. 1994-7, Cl. M1 | 9.25 | 3/15/20 | 24,606 | 24,673 | |
| Chemicals—.1% | |||||
| Lubrizol, | |||||
| Sr. Unscd. Notes | 8.88 | 2/1/19 | 195,000 | 246,272 | |
| Commercial Mortgage | |||||
| Pass-Through Ctfs.—2.6% | |||||
| Banc of America Commercial | |||||
| Mortgage, Ser. 2003-1, Cl. A1 | 3.88 | 9/11/36 | 455,623 | 461,360 | |
| Bear Stearns Commercial Mortgage | |||||
| Securities, Ser. 2003-T12, Cl. A3 | 4.24 | 8/13/39 | 513,696 | a | 516,439 |
| Bear Stearns Commercial Mortgage | |||||
| Securities, Ser. 2007-T26, Cl. A4 | 5.47 | 1/12/45 | 335,000 | a | 317,578 |
| Bear Stearns Commercial Mortgage | |||||
| Securities, Ser. 2006-PW12, | |||||
| Cl. AAB | 5.88 | 9/11/38 | 100,000 | a | 104,011 |
| Crown Castle Towers, | |||||
| Ser. 2006-1A, Cl. AFX | 5.24 | 11/15/36 | 1,050,000 | b | 1,086,750 |
| Crown Castle Towers, | |||||
| Ser. 2006-1A, Cl. B | 5.36 | 11/15/36 | 250,000 | b | 252,773 |
| Crown Castle Towers, | |||||
| Ser. 2006-1A, Cl. C | 5.47 | 11/15/36 | 665,000 | b | 679,963 |
| Crown Castle Towers, | |||||
| Ser. 2005-1A, Cl. D | 5.61 | 6/15/35 | 70,000 | b | 71,050 |
| Crown Castle Towers, | |||||
| Ser. 2006-1A, Cl. D | 5.77 | 11/15/36 | 815,000 | b | 835,375 |
| CS First Boston Mortgage | |||||
| Securities, Ser. 2005-C4, Cl. A2 | 5.02 | 8/15/38 | 175,000 | 175,997 | |
| CS First Boston Mortgage | |||||
| Securities, Ser. 2005-C5, Cl. A4 | 5.10 | 8/15/38 | 660,000 | a | 650,028 |
The Fund 11
STATEMENT OF INVESTMENTS (continued)
| Coupon | Maturity | Principal | |||
| Bonds and Notes (continued) | Rate (%) | Date | Amount ($) | Value ($) | |
| Commercial Mortgage | |||||
| Pass-Through Ctfs. (continued) | |||||
| First Union National Bank | |||||
| Commercial Mortgage, | |||||
| Ser. 2001-C2, Cl. A2 | 6.66 | 1/12/43 | 174,868 | 181,685 | |
| Goldman Sachs Mortgage Securities | |||||
| Corporation II, Ser. 2007-EOP, Cl. E | 0.68 | 3/6/20 | 560,000 | a,b | 475,325 |
| Goldman Sachs Mortgage Securities | |||||
| Corporation II, Ser. 2007-EOP, Cl. K | 1.29 | 3/6/20 | 325,000 | a,b | 262,419 |
| LB-UBS Commercial Mortgage Trust, | |||||
| Ser. 2004-C7, Cl. A2 | 3.99 | 10/15/29 | 79,643 | 79,616 | |
| Merrill Lynch Mortgage Trust, | |||||
| Ser. 2005-CKI1, Cl. A2 | 5.38 | 11/12/37 | 45,000 | a | 45,527 |
| Merrill Lynch/Countrywide | |||||
| Commercial Mortgage Trust, | |||||
| Ser. 2006-2, Cl. A4 | 6.10 | 6/12/46 | 25,000 | a | 24,343 |
| Morgan Stanley Capital I, | |||||
| Ser. 2007-HQ11, Cl. A4 | 5.45 | 2/12/44 | 500,000 | a | 428,017 |
| Morgan Stanley Capital I, | |||||
| Ser. 2007-T27, Cl. A4 | 5.80 | 6/11/42 | 220,000 | a | 210,974 |
| Morgan Stanley Capital, | |||||
| Ser. 2005-WMC4, Cl. M2 | 0.68 | 4/25/35 | 109,633 | a | 106,178 |
| SBA CMBS Trust, | |||||
| Ser. 2006-1A, Cl. D | 5.85 | 11/15/36 | 291,000 | b | 296,820 |
| TIAA Seasoned Commercial Mortgage | |||||
| Trust, Ser. 2007-C4, Cl. A3 | 6.07 | 8/15/39 | 415,000 | a | 441,607 |
| Wachovia Bank Commercial Mortgage | |||||
| Trust, Ser. 2005-C16, Cl. A2 | 4.38 | 10/15/41 | 22,048 | 22,275 | |
| Wachovia Bank Commercial Mortgage | |||||
| Trust, Ser. 2007-C34, Cl. A3 | 5.68 | 5/15/46 | 710,000 | 640,692 | |
| 8,366,802 | |||||
| Consumer Staples—.6% | |||||
| Altria Group, | |||||
| Gtd. Notes | 9.70 | 11/10/18 | 385,000 | 477,113 | |
| Anheuser-Busch InBev Worldwide, | |||||
| Gtd. Notes | 8.20 | 1/15/39 | 445,000 | b | 574,837 |
| Diageo Capital, | |||||
| Gtd. Notes | 7.38 | 1/15/14 | 315,000 | 370,770 | |
| Kraft Foods, | |||||
| Sr. Unscd. Notes | 6.00 | 2/11/13 | 105,000 | 114,355 |
12
| Coupon | Maturity | Principal | |||
| Bonds and Notes (continued) | Rate (%) | Date | Amount ($) | Value ($) | |
| Consumer Staples (continued) | |||||
| Kraft Foods, | |||||
| Sr. Unscd. Notes | 6.88 | 2/1/38 | 325,000 | 352,403 | |
| 1,889,478 | |||||
| Diversified Financial Services—2.5% | |||||
| American Express Credit, | |||||
| Sr. Unscd. Notes | 5.13 | 8/25/14 | 195,000 | 207,854 | |
| American Express Credit, | |||||
| Sr. Unscd. Notes, Ser. C | 7.30 | 8/20/13 | 230,000 | 261,475 | |
| Bank of America, | |||||
| Sr. Unscd. Notes | 7.38 | 5/15/14 | 600,000 | 674,161 | |
| Barclays Bank, | |||||
| Sub. Notes | 10.18 | 6/12/21 | 308,000 | b | 411,974 |
| BSKYB Finance UK, | |||||
| Gtd. Notes | 6.50 | 10/15/35 | 400,000 | b | 421,994 |
| Capital One Bank USA, | |||||
| Sub. Notes | 8.80 | 7/15/19 | 250,000 | 296,572 | |
| Capital One Financial, | |||||
| Sr. Unscd. Notes | 6.75 | 9/15/17 | 185,000 | 204,175 | |
| Caterpillar Financial Services, | |||||
| Sr. Unscd. Notes | 7.15 | 2/15/19 | 275,000 | 331,206 | |
| Citigroup, | |||||
| Sr. Unscd. Notes | 5.50 | 4/11/13 | 330,000 | 341,332 | |
| Citigroup, | |||||
| Sr. Unscd. Notes | 6.13 | 5/15/18 | 405,000 | 405,080 | |
| Countrywide Home Loans, | |||||
| Gtd. Notes, Ser. L | 4.00 | 3/22/11 | 40,000 | 40,875 | |
| ERAC USA Finance, | |||||
| Gtd. Notes | 5.60 | 5/1/15 | 90,000 | b | 92,365 |
| ERAC USA Finance, | |||||
| Gtd. Notes | 6.38 | 10/15/17 | 90,000 | b | 93,535 |
| ERAC USA Finance, | |||||
| Gtd. Notes | 7.00 | 10/15/37 | 685,000 | b | 669,144 |
| ERAC USA Finance, | |||||
| Gtd. Notes | 7.95 | 12/15/09 | 50,000 | b | 50,089 |
| General Electric Capital, | |||||
| Sr. Unscd. Notes | 4.38 | 9/21/15 | 520,000 | 535,530 | |
| Goldman Sachs Group, | |||||
| Sub. Notes | 5.63 | 1/15/17 | 400,000 | 414,048 |
The Fund 13
STATEMENT OF INVESTMENTS (continued)
| Coupon | Maturity | Principal | |||
| Bonds and Notes (continued) | Rate (%) | Date | Amount ($) | Value ($) | |
| Diversified Financial | |||||
| Services (continued) | |||||
| Goldman Sachs Group, | |||||
| Sub. Notes | 6.75 | 10/1/37 | 310,000 | 320,078 | |
| Harley-Davidson Funding, | |||||
| Gtd. Notes | 5.75 | 12/15/14 | 475,000 | b | 479,503 |
| Jefferies Group, | |||||
| Sr. Unscd. Debs. | 6.25 | 1/15/36 | 595,000 | 482,931 | |
| Jefferies Group, | |||||
| Sr. Unscd. Notes | 7.75 | 3/15/12 | 184,000 | 199,862 | |
| JPMorgan Chase & Co., | |||||
| Sr. Unscd. Notes | 6.00 | 1/15/18 | 285,000 | 309,445 | |
| M&T Bank, | |||||
| Sr. Unscd. Bonds | 5.38 | 5/24/12 | 105,000 | 109,277 | |
| Morgan Stanley, | |||||
| Sr. Unscd. Notes | 5.30 | 3/1/13 | 30,000 | 32,083 | |
| Morgan Stanley, | |||||
| Sr. Unscd. Notes | 6.60 | 4/1/12 | 95,000 | 103,833 | |
| Pearson Dollar Finance Two, | |||||
| Gtd. Notes | 6.25 | 5/6/18 | 395,000 | b | 423,653 |
| PNC Funding, | |||||
| Gtd. Notes | 6.70 | 6/10/19 | 215,000 | 243,980 | |
| Sovereign Bancorp, | |||||
| Sr. Unscd. Notes | 4.80 | 9/1/10 | 140,000 | a | 143,836 |
| 8,299,890 | |||||
| Foreign/Governmental—.2% | |||||
| Province of Quebec Canada, | |||||
| Unscd. Notes | 4.60 | 5/26/15 | 85,000 | 92,583 | |
| United Mexican States, | |||||
| Sr. Unscd. Notes | 5.63 | 1/15/17 | 420,000 | 450,660 | |
| 543,243 | |||||
| Health Care—.1% | |||||
| Quest Diagnostic, | |||||
| Gtd. Notes | 5.75 | 1/30/40 | 250,000 | 252,629 | |
| Industrial—.4% | |||||
| Allied Waste North America, | |||||
| Gtd. Notes, Ser. B | 7.13 | 5/15/16 | 80,000 | 84,910 | |
| Allied Waste North America, | |||||
| Gtd. Notes | 7.25 | 3/15/15 | 115,000 | 120,594 | |
| Hutchison Whampoa International, | |||||
| Gtd. Notes | 5.75 | 9/11/19 | 305,000 | b | 315,547 |
14
| Coupon | Maturity | Principal | |||
| Bonds and Notes (continued) | Rate (%) | Date | Amount ($) | Value ($) | |
| Industrial (continued) | |||||
| Hutchison Whampoa International, | |||||
| Gtd. Notes | 7.63 | 4/9/19 | 100,000 | b | 116,629 |
| Republic Services, | |||||
| Gtd. Notes | 5.50 | 9/15/19 | 230,000 | b | 241,408 |
| Waste Management, | |||||
| Sr. Unscd. Notes | 7.00 | 7/15/28 | 45,000 | 50,462 | |
| Waste Management, | |||||
| Gtd. Notes | 7.38 | 5/15/29 | 285,000 | 328,717 | |
| 1,258,267 | |||||
| Insurance—.4% | |||||
| ACE INA Holdings, | |||||
| Gtd. Notes | 5.80 | 3/15/18 | 45,000 | 49,618 | |
| Lincoln National, | |||||
| Sr. Unscd. Notes | 8.75 | 7/1/19 | 120,000 | 140,225 | |
| MetLife, | |||||
| Sr. Unscd. Notes | 7.72 | 2/15/19 | 205,000 | 246,239 | |
| Metropolitan Life Global Funding | |||||
| I, Sr. Scd. Notes | 5.13 | 4/10/13 | 250,000 | b | 268,381 |
| Prudential Financial, | |||||
| Sr. Unscd. Notes | 4.75 | 9/17/15 | 390,000 | 397,532 | |
| Prudential Financial, | |||||
| Sr. Unscd. Notes | 6.63 | 12/1/37 | 60,000 | 62,348 | |
| Willis North America, | |||||
| Gtd. Notes | 6.20 | 3/28/17 | 25,000 | 24,901 | |
| Willis North America, | |||||
| Gtd. Notes | 7.00 | 9/29/19 | 245,000 | 250,476 | |
| 1,439,720 | |||||
| Media & Telecommunications—1.6% | |||||
| AT&T, | |||||
| Sr. Unscd. Notes | 6.55 | 2/15/39 | 355,000 | 384,556 | |
| Cellco Partnership/Verizon | |||||
| Wireless Capital, Sr. Unscd. Notes | 5.55 | 2/1/14 | 455,000 | 501,905 | |
| Comcast, | |||||
| Gtd. Notes | 6.30 | 11/15/17 | 80,000 | 88,541 | |
| Comcast, | |||||
| Gtd. Notes | 6.50 | 11/15/35 | 135,000 | 141,894 | |
| Cox Communications, | |||||
| Sr. Unscd. Notes | 6.25 | 6/1/18 | 355,000 | b | 378,952 |
| Discovery Communications, | |||||
| Gtd. Notes | 5.63 | 8/15/19 | 100,000 | 105,576 |
The Fund 15
STATEMENT OF INVESTMENTS (continued)
| Coupon | Maturity | Principal | ||
| Bonds and Notes (continued) | Rate (%) | Date | Amount ($) | Value ($) |
| Media & | ||||
| Telecommunications (continued) | ||||
| News America, | ||||
| Gtd. Notes | 6.65 | 11/15/37 | 570,000 | 603,411 |
| Reed Elsevier Capital, | ||||
| Gtd. Notes | 8.63 | 1/15/19 | 240,000 | 301,548 |
| Telecom Italia Capital, | ||||
| Gtd. Notes | 5.25 | 11/15/13 | 410,000 | 437,792 |
| Telefonica Emisiones, | ||||
| Gtd. Notes | 5.98 | 6/20/11 | 250,000 | 266,633 |
| Time Warner Cable, | ||||
| Gtd. Notes | 5.85 | 5/1/17 | 715,000 | 763,342 |
| Time Warner, | ||||
| Gtd. Notes | 5.88 | 11/15/16 | 694,000 | 760,970 |
| Verizon Communications, | ||||
| Sr. Unscd. Notes | 5.85 | 9/15/35 | 120,000 | 120,866 |
| Verizon Communications, | ||||
| Sr. Unscd. Notes | 6.35 | 4/1/19 | 70,000 | 78,771 |
| Verizon Communications, | ||||
| Sr. Unscd. Notes | 7.35 | 4/1/39 | 165,000 | 196,979 |
| 5,131,736 | ||||
| Office And Business Equipment—.1% | ||||
| Xerox, | ||||
| Sr. Unscd. Notes | 5.50 | 5/15/12 | 75,000 | 79,527 |
| Xerox, | ||||
| Sr. Unscd. Notes | 5.65 | 5/15/13 | 105,000 | 111,814 |
| 191,341 | ||||
| Oil & Gas—.5% | ||||
| EQT, | ||||
| Sr. Unscd. Notes | 8.13 | 6/1/19 | 100,000 | 116,983 |
| Husky Energy, | ||||
| Sr. Unscd. Notes | 7.25 | 12/15/19 | 215,000 | 251,759 |
| Kinder Morgan Energy Partners, | ||||
| Sr. Unscd. Notes | 6.85 | 2/15/20 | 315,000 | 357,984 |
| Marathon Oil, | ||||
| Sr. Unscd. Notes | 7.50 | 2/15/19 | 225,000 | 265,597 |
| Petro-Canada, | ||||
| Sr. Unscd. Notes | 6.80 | 5/15/38 | 320,000 | 353,543 |
| Transocean, | ||||
| Sr. Unscd. Notes | 6.00 | 3/15/18 | 190,000 | 208,190 |
16
| Coupon | Maturity | Principal | |||
| Bonds and Notes (continued) | Rate (%) | Date | Amount ($) | Value ($) | |
| Oil & Gas (continued) | |||||
| Valero Energy, | |||||
| Gtd. Notes | 9.38 | 3/15/19 | 95,000 | 114,892 | |
| 1,668,948 | |||||
| Real Estate—.9% | |||||
| Arden Realty, | |||||
| Gtd. Notes | 5.25 | 3/1/15 | 125,000 | 132,488 | |
| Boston Properties, | |||||
| Sr. Unscd. Notes | 5.63 | 4/15/15 | 245,000 | 256,866 | |
| Federal Realty Investment Trust, | |||||
| Sr. Unscd. Bonds | 5.65 | 6/1/16 | 260,000 | 254,604 | |
| Liberty Property, | |||||
| Sr. Unscd. Notes | 5.50 | 12/15/16 | 135,000 | 128,690 | |
| Mack-Cali Realty, | |||||
| Sr. Unscd. Notes | 5.05 | 4/15/10 | 70,000 | 70,288 | |
| Mack-Cali Realty, | |||||
| Sr. Unscd. Notes | 5.25 | 1/15/12 | 100,000 | 101,448 | |
| National Retail Properties, | |||||
| Sr. Unscd. Notes | 6.15 | 12/15/15 | 50,000 | 48,262 | |
| Regency Centers, | |||||
| Gtd. Notes | 5.25 | 8/1/15 | 20,000 | 19,715 | |
| Regency Centers, | |||||
| Gtd. Notes | 5.88 | 6/15/17 | 415,000 | 398,248 | |
| Simon Property Group, | |||||
| Sr. Unscd. Notes | 5.00 | 3/1/12 | 175,000 | 183,233 | |
| Simon Property Group, | |||||
| Sr. Unscd. Notes | 5.75 | 5/1/12 | 833,000 | 889,277 | |
| WEA Finance, | |||||
| Sr. Notes | 7.13 | 4/15/18 | 295,000 | b | 318,040 |
| 2,801,159 | |||||
| Residential Mortgage | |||||
| Pass-Through Ctfs.—.1% | |||||
| CS First Boston Mortgage | |||||
| Securities, Ser. 2005-6, Cl. 1A2 | 0.51 | 7/25/35 | 263,753 | a | 212,330 |
| Retail—.3% | |||||
| Autozone, | |||||
| Sr. Unscd. Notes | 5.75 | 1/15/15 | 225,000 | 246,611 | |
| CVS Pass-Through Trust, | |||||
| Pass Thru Certificates | 8.35 | 7/10/31 | 198,916 | b | 226,399 |
The Fund 17
STATEMENT OF INVESTMENTS (continued)
| Coupon | Maturity | Principal | |||
| Bonds and Notes (continued) | Rate (%) | Date | Amount ($) | Value ($) | |
| Retail (continued) | |||||
| Home Depot, | |||||
| Sr. Unscd. Notes | 5.88 | 12/16/36 | 212,000 | 209,168 | |
| Staples, | |||||
| Gtd. Notes | 9.75 | 1/15/14 | 170,000 | 205,780 | |
| 887,958 | |||||
| State/Territory | |||||
| General Obligations—.3% | |||||
| State of California Build America | |||||
| Taxable Various Purpose, Bonds | 7.55 | 4/1/39 | 435,000 | 446,941 | |
| Tobacco Settlement Finance | |||||
| Authority of West Virginia, | |||||
| Tobacco Settlement | |||||
| Asset-Backed Bonds | 7.47 | 6/1/47 | 695,000 | 541,808 | |
| 988,749 | |||||
| Transportation—.1% | |||||
| Norfolk Southern, | |||||
| Sr. Unscd. Notes | 5.75 | 4/1/18 | 195,000 | 214,867 | |
| U.S. Government Agencies/ | |||||
| Mortgage-Backed—11.4% | |||||
| Federal Home Loan Mortgage Corp.: | |||||
| 3.50%, 9/1/10 | 23,521 | c | 23,653 | ||
| 4.50%, 1/1/39—2/1/39 | 419,760 | c | 431,113 | ||
| 5.00%, 1/1/23—8/1/39 | 5,929,446 | c | 6,229,789 | ||
| 5.50%, 4/1/22—6/1/39 | 2,817,677 | c | 3,011,360 | ||
| 6.00%, 9/1/37—3/1/38 | 1,276,376 | c | 1,371,079 | ||
| Federal National Mortgage Association: | |||||
| 4.00%, 5/1/10 | 96,606 | c | 97,154 | ||
| 4.50%, 2/1/38—2/1/39 | 5,201,542 | c | 5,348,863 | ||
| 5.00%, 8/1/20—9/1/39 | 7,759,638 | c | 8,187,831 | ||
| 5.50%, 9/1/34—5/1/39 | 6,302,729 | c | 6,716,628 | ||
| 6.00%, 5/1/22—5/1/39 | 2,706,890 | c | 2,907,282 | ||
| 8.00%, 3/1/30 | 313 | c | 360 | ||
| Government National Mortgage Association I: | |||||
| 5.50%, 4/15/33 | 143,029 | 153,439 | |||
| Ser. 2007-34, Cl. A, 4.27%, 11/16/26 | 2,540,512 | 2,615,975 | |||
| 37,094,526 | |||||
| U.S. Government Securities—6.8% | |||||
| U.S. Treasury Bonds | 4.25 | 5/15/39 | 3,186,000 | 3,211,389 | |
| U.S. Treasury Bonds | 7.50 | 11/15/24 | 900,000 | 1,278,282 | |
18
| Coupon | Maturity | Principal | |||
| Bonds and Notes (continued) | Rate (%) | Date | Amount ($) | Value ($) | |
| U.S. Government Securities (continued) | |||||
| U.S. Treasury Notes | 0.88 | 4/30/11 | 12,440,000 | 12,526,023 | |
| U.S. Treasury Notes | 2.50 | 3/31/13 | 2,869,000 | 2,989,814 | |
| U.S. Treasury Notes | 3.50 | 2/15/18 | 2,136,000 | 2,218,603 | |
| 22,224,111 | |||||
| Utilities—1.1% | |||||
| Appalachian Power, | |||||
| Sr. Unscd. Notes, Ser. O | 5.65 | 8/15/12 | 225,000 | 243,826 | |
| Consolidated Edison of NY, | |||||
| Sr. Unscd. Debs., Ser. 06-D | 5.30 | 12/1/16 | 95,000 | 101,123 | |
| Consolidated Edison of NY, | |||||
| Sr. Unscd. Debs., Ser. 07-A | 6.30 | 8/15/37 | 495,000 | 556,664 | |
| Consumers Energy, | |||||
| First Mortgage Bonds | 6.70 | 9/15/19 | 200,000 | 234,045 | |
| Duke Energy Carolinas, | |||||
| First Mortgage Bonds | 5.25 | 1/15/18 | 95,000 | 102,774 | |
| E.ON International Finance, | |||||
| Gtd. Notes | 5.80 | 4/30/18 | 190,000 | b | 209,557 |
| Enel Finance International, | |||||
| Gtd. Notes | 5.70 | 1/15/13 | 185,000 | b | 202,167 |
| Enel Finance International, | |||||
| Gtd. Bonds | 6.25 | 9/15/17 | 735,000 | b | 824,973 |
| FirstEnergy, | |||||
| Sr. Unscd. Notes, Ser. B | 6.45 | 11/15/11 | 2,000 | 2,166 | |
| National Grid, | |||||
| Sr. Unscd. Notes | 6.30 | 8/1/16 | 365,000 | 404,062 | |
| Nevada Power, | |||||
| Mortgage Notes | 6.50 | 8/1/18 | 270,000 | 299,648 | |
| Nevada Power, | |||||
| Mortgage Notes, Ser. R | 6.75 | 7/1/37 | 55,000 | 60,327 | |
| Potomac Electric Power, | |||||
| First Mortgage Bonds | 6.50 | 11/15/37 | 200,000 | 230,746 | |
| Sierra Pacific Power, | |||||
| Mortgage Notes, Ser. P | 6.75 | 7/1/37 | 25,000 | 27,421 | |
| Virginia Electric & Power, | |||||
| Sr. Unscd. Notes | 5.40 | 4/30/18 | 205,000 | 221,875 | |
| 3,721,374 | |||||
| Total Bonds and Notes | |||||
| (cost $96,489,470) | 100,527,389 | ||||
The Fund 19
STATEMENT OF INVESTMENTS (continued)
| Common Stocks—68.8% | Shares | Value ($) | |
| Consumer Discretionary—7.6% | |||
| Autoliv | 30,380 | 1,233,732 | |
| Best Buy | 12,100 | 518,243 | |
| Carnival | 31,423 | d | 1,006,479 |
| Dollar General | 22,600 | 519,800 | |
| Gap | 33,590 | 719,498 | |
| Home Depot | 145,087 | 3,969,580 | |
| Hyatt Hotels, Cl. A | 14,330 | 411,987 | |
| Interpublic Group of Cos. | 76,580 | d | 484,751 |
| Johnson Controls | 40,400 | 1,092,820 | |
| Liberty Media-Starz, Ser. A | 6,330 | d | 302,890 |
| Limited Brands | 81,110 | 1,345,615 | |
| Newell Rubbermaid | 54,930 | 797,034 | |
| News, Cl. A | 205,170 | 2,351,248 | |
| NVR | 1,110 | d | 747,197 |
| Omnicom Group | 55,770 | 2,047,874 | |
| Staples | 34,530 | 805,240 | |
| Target | 30,360 | 1,413,562 | |
| Time Warner | 113,763 | 3,494,799 | |
| Whirlpool | 16,140 | 1,196,942 | |
| 24,459,291 | |||
| Consumer Staples—6.7% | |||
| Clorox | 33,670 | 2,029,291 | |
| Coca-Cola Enterprises | 115,840 | 2,276,256 | |
| Colgate-Palmolive | 5,161 | 434,505 | |
| CVS Caremark | 122,371 | 3,794,725 | |
| Energizer Holdings | 10,120 | d | 570,161 |
| Kellogg | 19,510 | 1,025,836 | |
| Kraft Foods, Cl. A | 24,644 | 655,038 | |
| Kroger | 37,960 | 863,210 | |
| Nestle, ADR | 35,870 | 1,700,955 | |
| PepsiCo | 82,665 | 5,143,416 | |
| Philip Morris International | 46,595 | 2,240,754 | |
| Unilever, ADR | 29,060 | 858,142 | |
| 21,592,289 |
20
| Common Stocks (continued) | Shares | Value ($) | |
| Energy—9.9% | |||
| Alpha Natural Resources | 6,550 | d | 242,350 |
| Anadarko Petroleum | 13,660 | 813,180 | |
| Cameron International | 35,760 | d | 1,351,728 |
| Chevron | 101,098 | 7,889,688 | |
| ConocoPhillips | 69,900 | 3,618,723 | |
| Consol Energy | 5,030 | 230,978 | |
| Devon Energy | 11,130 | 749,605 | |
| ENSCO International | 21,250 | 935,000 | |
| EOG Resources | 11,290 | 976,472 | |
| Hess | 37,124 | 2,151,707 | |
| Marathon Oil | 16,030 | 522,899 | |
| Massey Energy | 7,830 | 294,878 | |
| Newfield Exploration | 25,040 | d | 1,058,691 |
| Occidental Petroleum | 88,960 | 7,187,078 | |
| Peabody Energy | 6,160 | 273,874 | |
| Valero Energy | 31,570 | 501,647 | |
| XTO Energy | 74,097 | 3,144,677 | |
| 31,943,175 | |||
| Exchange Traded Funds—.1% | |||
| Standard & Poor’s Depository | |||
| Receipts (Tr. Ser. 1) | 3,480 | 382,591 | |
| Financial—12.8% | |||
| American Express | 14,900 | 623,267 | |
| Ameriprise Financial | 24,890 | 948,807 | |
| AON | 13,120 | 508,138 | |
| Bank of America | 346,180 | 5,486,953 | |
| BlackRock | 3,566 | 809,767 | |
| Capital One Financial | 7,470 | 286,549 | |
| Charles Schwab | 34,128 | 625,566 | |
| Citigroup | 512,860 | 2,107,855 | |
| Fidelity National Financial, Cl. A | 31,990 | 444,341 | |
| Franklin Resources | 10,120 | 1,093,264 | |
| Genworth Financial, Cl. A | 98,170 | d | 1,057,291 |
| Goldman Sachs Group | 25,470 | 4,321,240 |
The Fund 21
STATEMENT OF INVESTMENTS (continued)
| Common Stocks (continued) | Shares | Value ($) | |
| Financial (continued) | |||
| JPMorgan Chase & Co. | 173,394 | 7,367,511 | |
| Legg Mason | 16,290 | 460,844 | |
| Lincoln National | 39,680 | 909,069 | |
| Marsh & McLennan Cos. | 22,790 | 513,915 | |
| MetLife | 73,097 | 2,499,186 | |
| Morgan Stanley | 95,390 | 3,012,416 | |
| PNC Financial Services Group | 10,080 | 574,661 | |
| Prudential Financial | 17,780 | 886,333 | |
| State Street | 39,880 | 1,647,044 | |
| SunTrust Banks | 24,270 | 573,500 | |
| TD Ameritrade Holding | 24,870 | d | 488,447 |
| Travelers Cos. | 19,450 | 1,018,986 | |
| Wells Fargo & Co. | 116,562 | 3,268,398 | |
| 41,533,348 | |||
| Health Care—9.2% | |||
| Abbott Laboratories | 24,220 | 1,319,748 | |
| Aetna | 16,280 | 473,911 | |
| Alexion Pharmaceuticals | 18,800 | d | 852,580 |
| AmerisourceBergen | 116,380 | 2,873,422 | |
| Amgen | 54,740 | d | 3,084,599 |
| CIGNA | 41,310 | 1,325,225 | |
| Covidien | 19,651 | 920,060 | |
| DaVita | 8,960 | d | 530,790 |
| Gilead Sciences | 21,422 | d | 986,483 |
| Hospira | 14,830 | d | 696,268 |
| King Pharmaceuticals | 66,630 | d | 788,233 |
| McKesson | 16,490 | 1,022,710 | |
| MEDNAX | 9,630 | d | 541,302 |
| Merck & Co. | 91,744 | 3,322,048 | |
| Pfizer | 352,027 | 6,396,331 | |
| Roche Holding, ADR | 14,610 | 597,841 | |
| St. Jude Medical | 19,650 | d | 721,352 |
| Teva Pharmaceutical Industries, ADR | 9,720 | 513,119 | |
| Thermo Fisher Scientific | 10,970 | d | 518,113 |
| Universal Health Services, Cl. B | 13,820 | 772,400 |
22
| Common Stocks (continued) | Shares | Value ($) | |
| Health Care (continued) | |||
| Vertex Pharmaceuticals | 28,920 | d | 1,122,674 |
| WellPoint | 10,840 | d | 585,685 |
| 29,964,894 | |||
| Industrial—6.0% | |||
| Cummins | 15,430 | 692,807 | |
| Dover | 52,193 | 2,133,650 | |
| Eaton | 8,160 | 521,424 | |
| FedEx | 14,871 | 1,255,856 | |
| Fluor | 11,250 | 477,900 | |
| General Electric | 51,250 | 821,025 | |
| Honeywell International | 11,510 | 442,790 | |
| JetBlue Airways | 133,770 | d | 737,073 |
| Norfolk Southern | 54,100 | 2,780,740 | |
| Paccar | 19,540 | 724,543 | |
| Parker Hannifin | 22,890 | 1,235,144 | |
| Raytheon | 41,700 | 2,148,801 | |
| Rockwell Collins | 9,930 | 530,858 | |
| Stanley Works | 11,700 | 568,269 | |
| Textron | 49,550 | 993,478 | |
| Tyco International | 38,855 | 1,393,729 | |
| Union Pacific | 16,373 | 1,035,756 | |
| Waste Management | 26,326 | 864,546 | |
| 19,358,389 | |||
| Information Technology—10.9% | |||
| Apple | 14,691 | d | 2,936,878 |
| BMC Software | 31,720 | d | 1,228,516 |
| Cisco Systems | 206,958 | d | 4,842,817 |
| Computer Sciences | 9,540 | d | 527,657 |
| Dell | 33,320 | d | 470,478 |
| EMC | 109,020 | d | 1,834,807 |
| Flextronics International | 112,590 | d | 796,011 |
| Google, Cl. A | 4,800 | d | 2,798,400 |
| Hewlett-Packard | 88,148 | 4,324,541 | |
| International Business Machines | 21,320 | 2,693,782 | |
| Microsoft | 193,250 | 5,683,483 |
The Fund 23
STATEMENT OF INVESTMENTS (continued)
| Common Stocks (continued) | Shares | Value ($) | |
| Information Technology (continued) | |||
| Motorola | 169,440 | 1,357,214 | |
| NetApp | 30,980 | d | 954,804 |
| Oracle | 15,045 | 332,194 | |
| QUALCOMM | 11,972 | 538,740 | |
| Sybase | 43,810 | d | 1,762,914 |
| Teradata | 26,191 | d | 767,396 |
| Texas Instruments | 19,890 | 503,018 | |
| Vishay Intertechnology | 89,910 | d | 651,848 |
| Western Union | 24,720 | 456,084 | |
| 35,461,582 | |||
| Materials—2.6% | |||
| Air Products & Chemicals | 5,470 | 453,627 | |
| Celanese, Ser. A | 18,010 | 535,978 | |
| CF Industries Holdings | 3,050 | 260,348 | |
| Cliffs Natural Resources | 6,950 | 306,217 | |
| Dow Chemical | 94,260 | 2,618,543 | |
| E.I. du Pont de Nemours & Co. | 37,730 | 1,304,703 | |
| Freeport-McMoRan Copper & Gold | 13,270 | d | 1,098,756 |
| International Paper | 32,040 | 815,418 | |
| Newmont Mining | 10,150 | 544,446 | |
| Owens-Illinois | 16,960 | d | 530,339 |
| 8,468,375 | |||
| Telecommunication Services—.6% | |||
| AT & T | 71,944 | 1,938,171 | |
| Utilities—2.4% | |||
| American Electric Power | 21,470 | 691,119 | |
| Entergy | 17,690 | 1,391,319 | |
| Exelon | 9,700 | 467,346 | |
| FPL Group | 13,320 | 692,240 | |
| Mirant | 36,140 | d | 514,634 |
| NRG Energy | 22,210 | d | 531,707 |
| PG & E | 20,930 | 886,176 | |
| Questar | 31,590 | 1,253,175 | |
| Sempra Energy | 25,280 | 1,343,379 | |
| 7,771,095 | |||
| Total Common Stocks | |||
| (cost $220,756,845) | 222,873,200 |
24
| Other Investment—.2% | Shares | Value ($) | ||
| Registered Investment Company; | ||||
| Dreyfus Institutional Preferred | ||||
| Plus Money Market Fund | ||||
| (cost $656,000) | 656,000 | e | 656,000 | |
| Total Investments (cost $317,902,315) | 100.0 | % | 324,056,589 | |
| Liabilities, Less Cash and Receivables | (.0 | %) | (16,274 | ) |
| Net Assets | 100.0 | % | 324,040,315 | |
ADR—American Depository Receipts
| a | Variable rate security—interest rate subject to periodic change. |
| b | Securities exempt from registration under Rule 144A of the Securities Act of 1933.These securities may be resold in transactions exempt from registration, normally to qualified institutional buyers.At November 30, 2009, these securities had a total market value of $10,790,846 or 3.3% of net assets. |
| c | On September 7, 2008, the Federal Housing Finance Agency (FHFA) placed Federal National Mortgage Association and Federal Home Loan Mortgage Corporation into conservatorship with FHFA as the conservator.As such, the FHFA will oversee the continuing affairs of these companies. |
| d | Non-income producing security. |
| e | Investment in affiliated money market mutual fund. |
| Portfolio Summary (Unaudited)† | |||
| Value (%) | Value (%) | ||
| Common Stocks | 68.8 | State/Territory General Obligations | .3 |
| U.S. Government & Agencies | 18.2 | Foreign/Governmental | .2 |
| Corporate Bonds | 8.7 | Money Market Investments | .2 |
| Asset/Mortgage-Backed | 3.6 | 100.0 | |
| † Based on net assets. | |||
| See notes to financial statements. | |||
The Fund 25
STATEMENT OF ASSETS AND LIABILITIES
November 30, 2009
| Cost | Value | ||
| Assets ($): | |||
| Investments in securities—See Statement of Investments: | |||
| Unaffiliated issuers | 317,246,315 | 323,400,589 | |
| Affiliated issuers | 656,000 | 656,000 | |
| Cash | 7,269 | ||
| Dividends and interest receivable | 1,154,905 | ||
| Receivable for investment securities sold | 125,221 | ||
| Receivable for shares of Beneficial Interest subscribed | 30,021 | ||
| Prepaid expenses | 19,053 | ||
| 325,393,058 | |||
| Liabilities ($): | |||
| Due to The Dreyfus Corporation and affiliates—Note 3(c) | 362,406 | ||
| Payable for shares of Beneficial Interest redeemed | 440,040 | ||
| Payable for investment securities purchased | 332,330 | ||
| Accrued expenses | 217,967 | ||
| 1,352,743 | |||
| Net Assets ($) | 324,040,315 | ||
| Composition of Net Assets ($): | |||
| Paid-in capital | 394,196,169 | ||
| Accumulated undistributed investment income—net | 3,960,143 | ||
| Accumulated net realized gain (loss) on investments | (80,270,271 | ) | |
| Accumulated net unrealized appreciation | |||
| (depreciation) on investments | 6,154,274 | ||
| Net Assets ($) | 324,040,315 |
26
| Net Asset Value Per Share | |
| Class A | |
| Net Assets ($) | 115,444,956 |
| Shares Outstanding | 7,715,314 |
| Net Asset Value Per Share ($) | 14.96 |
| Class B | |
| Net Assets ($) | 82,906,378 |
| Shares Outstanding | 5,604,624 |
| Net Asset Value Per Share ($) | 14.79 |
| Class C | |
| Net Assets ($) | 50,170,194 |
| Shares Outstanding | 3,372,669 |
| Net Asset Value Per Share ($) | 14.88 |
| Class J | |
| Net Assets ($) | 25,858,269 |
| Shares Outstanding | 1,727,516 |
| Net Asset Value Per Share ($) | 14.97 |
| Class I | |
| Net Assets ($) | 2,128,044 |
| Shares Outstanding | 142,141 |
| Net Asset Value Per Share ($) | 14.97 |
| Class Z | |
| Net Assets ($) | 47,532,474 |
| Shares Outstanding | 3,189,741 |
| Net Asset Value Per Share ($) | 14.90 |
| See notes to financial statements. | |
The Fund 27
STATEMENT OF OPERATIONS
Year Ended November 30, 2009
| Investment Income ($): | ||
| Income: | ||
| Interest | 4,712,561 | |
| Cash dividends (net of $30,161 foreign taxes withheld at source): | ||
| Unaffiliated issuers | 4,417,635 | |
| Affiliated issuers | 4,981 | |
| Income from securities lending—Note 1(c) | 30,248 | |
| Total Income | 9,165,425 | |
| Expenses: | ||
| Management fee—Note 3(a) | 2,416,727 | |
| Shareholder servicing costs—Note 3(c) | 1,302,609 | |
| Distribution fees—Note 3(b) | 941,741 | |
| Registration fees | 118,466 | |
| Professional fees | 90,371 | |
| Custodian fees—Note 3(c) | 79,283 | |
| Trustees’ fees and expenses—Note 3(d) | 28,298 | |
| Prospectus and shareholders’ reports | 22,071 | |
| Loan commitment fees—Note 2 | 5,684 | |
| Interest expense—Note 2 | 99 | |
| Miscellaneous | 51,339 | |
| Total Expenses | 5,056,688 | |
| Less—reduction in expenses due to undertaking—Note 3(a) | (664,937 | ) |
| Less—reduction in fees due to earnings credits—Note 1(c) | (46,227 | ) |
| Net Expenses | 4,345,524 | |
| Investment Income—Net | 4,819,901 | |
| Realized and Unrealized Gain (Loss) on Investments—Note 4 ($): | ||
| Net realized gain (loss) on investments | (32,124,281 | ) |
| Net realized gain (loss) on forward foreign currency exchange contracts | (246 | ) |
| Net Realized Gain (Loss) | (32,124,527 | ) |
| Net unrealized appreciation (depreciation) on investments | 89,739,117 | |
| Net Realized and Unrealized Gain (Loss) on Investments | 57,614,590 | |
| Net Increase in Net Assets Resulting from Operations | 62,434,491 | |
| See notes to financial statements. | ||
28
STATEMENT OF CHANGES IN NET ASSETS
| Year Ended November 30, | ||||
| 2009 | a | 2008 | ||
| Operations ($): | ||||
| Investment income—net | 4,819,901 | 7,259,620 | ||
| Net realized gain (loss) on investments | (32,124,527 | ) | (34,501,709 | ) |
| Net unrealized appreciation | ||||
| (depreciation) on investments | 89,739,117 | (99,479,268 | ) | |
| Net Increase (Decrease) in Net Assets | ||||
| Resulting from Operations | 62,434,491 | (126,721,357 | ) | |
| Dividends to Shareholders from ($): | ||||
| Investment income—net: | ||||
| Class A Shares | (2,187,886 | ) | (2,728,613 | ) |
| Class B Shares | (1,608,902 | ) | (1,591,459 | ) |
| Class C Shares | (899,829 | ) | (848,386 | ) |
| Class J Shares | (935,416 | ) | (1,168,014 | ) |
| Class I Shares | (9,419 | ) | (14,037 | ) |
| Class T Shares | (21,466 | ) | (24,047 | ) |
| Class Z Shares | (1,488,886 | ) | (1,629,088 | ) |
| Net realized gain on investments: | ||||
| Class A Shares | — | (21,725,028 | ) | |
| Class B Shares | — | (21,800,898 | ) | |
| Class C Shares | — | (12,436,388 | ) | |
| Class J Shares | — | (7,795,872 | ) | |
| Class I Shares | — | (101,927 | ) | |
| Class T Shares | — | (235,001 | ) | |
| Class Z Shares | — | (11,182,600 | ) | |
| Total Dividends | (7,151,804 | ) | (83,281,358 | ) |
| Beneficial Interest Transactions ($): | ||||
| Net proceeds from shares sold: | ||||
| Class A Shares | 8,909,143 | 11,168,617 | ||
| Class B Shares | 401,373 | 1,394,309 | ||
| Class C Shares | 1,593,852 | 3,451,970 | ||
| Class J Shares | 1,310,842 | 10,706,195 | ||
| Class I Shares | 363,223 | 85,776 | ||
| Class T Shares | 68,864 | 45,221 | ||
| Class Z Shares | 1,727,033 | 2,387,437 | ||
| Net assets received in connection | ||||
| with reorganization—Note 1 | 50,352,911 | — | ||
The Fund 29
STATEMENT OF CHANGES IN NET ASSETS (continued)
| Year Ended November 30, | ||||
| 2009 | a | 2008 | ||
| Beneficial Interest Transactions ($) (continued): | ||||
| Dividends reinvested: | ||||
| Class A Shares | 2,058,923 | 22,836,730 | ||
| Class B Shares | 1,484,399 | 21,628,634 | ||
| Class C Shares | 747,018 | 11,078,843 | ||
| Class J Shares | 884,898 | 8,348,068 | ||
| Class I Shares | 9,388 | 105,925 | ||
| Class T Shares | 16,832 | 239,651 | ||
| Class Z Shares | 1,445,592 | 12,601,055 | ||
| Cost of shares redeemed: | ||||
| Class A Shares | (30,230,746 | ) | (52,897,104 | ) |
| Class B Shares | (16,513,654 | ) | (28,335,944 | ) |
| Class C Shares | (9,972,776 | ) | (22,008,868 | ) |
| Class J Shares | (7,880,750 | ) | (24,824,409 | ) |
| Class I Shares | (399,446 | ) | (378,453 | ) |
| Class T Shares | (946,369 | ) | (427,734 | ) |
| Class Z Shares | (8,289,202 | ) | (14,441,246 | ) |
| Increase (Decrease) in Net Assets from | ||||
| Beneficial Interest Transactions | (2,858,652 | ) | (37,235,327 | ) |
| Total Increase (Decrease) in Net Assets | 52,424,035 | (247,238,042 | ) | |
| Net Assets ($): | ||||
| Beginning of Period | 271,616,280 | 518,854,322 | ||
| End of Period | 324,040,315 | 271,616,280 | ||
| Undistributed investment income—net | 3,960,143 | 6,403,935 | ||
30
| Year Ended November 30, | ||||
| 2009 | a | 2008 | ||
| Capital Share Transactions: | ||||
| Class Ab,c | ||||
| Shares sold | 687,943 | 662,062 | ||
| Shares issued in connection | ||||
| with reorganization—Note 1 | 3,334,487 | — | ||
| Shares issued for dividends reinvested | 166,310 | 1,288,799 | ||
| Shares redeemed | (2,365,065 | ) | (3,191,489 | ) |
| Net Increase (Decrease) in Shares Outstanding | 1,823,675 | (1,240,628 | ) | |
| Class Bb | ||||
| Shares sold | 28,285 | 81,101 | ||
| Shares issued in connection | ||||
| with reorganization—Note 1 | 191,471 | — | ||
| Shares issued for dividends reinvested | 120,204 | 1,227,444 | ||
| Shares redeemed | (1,305,262 | ) | (1,765,143 | ) |
| Net Increase (Decrease) in Shares Outstanding | (965,302 | ) | (456,598 | ) |
| Class C | ||||
| Shares sold | 117,168 | 212,503 | ||
| Shares issued in connection | ||||
| with reorganization—Note 1 | 391,069 | — | ||
| Shares issued for dividends reinvested | 60,191 | 625,887 | ||
| Shares redeemed | (768,887 | ) | (1,330,729 | ) |
| Net Increase (Decrease) in Shares Outstanding | (200,459 | ) | (492,339 | ) |
| Class J | ||||
| Shares sold | 103,149 | 628,108 | ||
| Shares issued for dividends reinvested | 71,420 | 470,579 | ||
| Shares redeemed | (617,798 | ) | (1,460,422 | ) |
| Net Increase (Decrease) in Shares Outstanding | (443,229 | ) | (361,735 | ) |
The Fund 31
STATEMENT OF CHANGES IN NET ASSETS (continued)
| Year Ended November 30, | ||||
| 2009 | a | 2008 | ||
| Capital Share Transactions (continued): | ||||
| Class I | ||||
| Shares sold | 26,494 | 5,067 | ||
| Shares issued in connection | ||||
| with reorganization—Note 1 | 123,934 | — | ||
| Shares issued for dividends reinvested | 760 | 5,991 | ||
| Shares redeemed | (31,052 | ) | (22,482 | ) |
| Net Increase (Decrease) in Shares Outstanding | 120,136 | (11,424 | ) | |
| Class Tc | ||||
| Shares sold | 5,469 | 2,796 | ||
| Shares issued in connection | ||||
| with reorganization—Note 1 | 7,023 | — | ||
| Shares issued for dividends reinvested | 1,356 | 13,517 | ||
| Shares redeemed | (81,189 | ) | (26,696 | ) |
| Net Increase (Decrease) in Shares Outstanding | (67,341 | ) | (10,383 | ) |
| Class Z | ||||
| Shares sold | 136,555 | 146,818 | ||
| Shares issued for dividends reinvested | 117,124 | 713,133 | ||
| Shares redeemed | (656,137 | ) | (879,339 | ) |
| Net Increase (Decrease) in Shares Outstanding | (402,458 | ) | (19,388 | ) |
| a | Effective close of business on February 4, 2009, the fund no longer offers Class T shares. |
| b | During the period ended November 30, 2009, 143,541 Class B shares representing $1,794,416 were automatically converted to 142,492 Class A shares and during the period ended November 30, 2008, 157,727 Class B shares representing $2,654,069 were automatically converted to 156,400 Class A shares. |
| c | On the close of business on February 4, 2009, 74,880 Class T shares representing $869,506 were converted to 74,957 Class A shares. |
See notes to financial statements.
32
FINANCIAL HIGHLIGHTS
The following tables describe the performance for each share class for the fiscal periods indicated.All information (except portfolio turnover rate) reflects financial results for a single fund share.Total return shows how much your investment in the fund would have increased (or decreased) during each period, assuming you had reinvested all dividends and distributions.These figures have been derived from the fund’s financial statements.
| Year Ended November 30, | ||||||||||
| Class A Shares | 2009 | 2008 | 2007 | 2006 | 2005 | |||||
| Per Share Data ($): | ||||||||||
| Net asset value, beginning of period | 12.47 | 21.28 | 20.38 | 19.15 | 19.30 | |||||
| Investment Operations: | ||||||||||
| Investment income—neta | .25 | .34 | .33 | .28 | .28 | |||||
| Net realized and unrealized | ||||||||||
| gain (loss) on investments | 2.62 | (5.62 | ) | .89 | 1.40 | (.12 | ) | |||
| Total from Investment Operations | 2.87 | (5.28 | ) | 1.22 | 1.68 | .16 | ||||
| Distributions: | ||||||||||
| Dividends from investment income—net | (.38 | ) | (.39 | ) | (.32 | ) | (.29 | ) | (.19 | ) |
| Dividends from net realized | ||||||||||
| gain on investments | — | (3.14 | ) | — | (.16 | ) | (.12 | ) | ||
| Total Distributions | (.38 | ) | (3.53 | ) | (.32 | ) | (.45 | ) | (.31 | ) |
| Net asset value, end of period | 14.96 | 12.47 | 21.28 | 20.38 | 19.15 | |||||
| Total Return (%)b | 23.77 | (29.77 | ) | 6.08 | 8.96 | .77 | ||||
| Ratios/Supplemental Data (%): | ||||||||||
| Ratio of total expenses | ||||||||||
| to average net assets | 1.45 | 1.29 | 1.23 | 1.21 | 1.21 | |||||
| Ratio of net expenses | ||||||||||
| to average net assets | 1.12 | 1.18 | 1.16 | 1.21 | c | 1.21 | c | |||
| Ratio of net investment income | ||||||||||
| to average net assets | 1.89 | 2.04 | 1.57 | 1.44 | 1.43 | |||||
| Portfolio Turnover Rate | 134.74 | 138.66 | 168.94 | d | 33.30 | 39.39 | ||||
| Net Assets, end of period ($ x 1,000) | 115,445 | 73,441 | 151,796 | 215,342 | 274,871 | |||||
| a | Based on average shares outstanding at each month end. |
| b | Exclusive of sales charge. |
| c | Expense waivers and/or reimbursements amounted to less than .01%. |
| d | The portfolio turnover rate excluding mortgage dollar roll transactions for the period ended November 30, 2007 was 162.34%. |
See notes to financial statements.
The Fund 33
FINANCIAL HIGHLIGHTS (continued)
| Year Ended November 30, | ||||||||||
| Class B Shares | 2009 | 2008 | 2007 | 2006 | 2005 | |||||
| Per Share Data ($): | ||||||||||
| Net asset value, beginning of period | 12.31 | 21.04 | 20.14 | 18.94 | 19.17 | |||||
| Investment Operations: | ||||||||||
| Investment income—neta | .15 | .21 | .17 | .12 | .12 | |||||
| Net realized and unrealized | ||||||||||
| gain (loss) on investments | 2.58 | (5.57 | ) | .89 | 1.40 | (.11 | ) | |||
| Total from Investment Operations | 2.73 | (5.36 | ) | 1.06 | 1.52 | .01 | ||||
| Distributions: | ||||||||||
| Dividends from investment income—net | (.25 | ) | (.23 | ) | (.16 | ) | (.16 | ) | (.12 | ) |
| Dividends from net realized | ||||||||||
| gain on investments | — | (3.14 | ) | — | (.16 | ) | (.12 | ) | ||
| Total Distributions | (.25 | ) | (3.37 | ) | (.16 | ) | (.32 | ) | (.24 | ) |
| Net asset value, end of period | 14.79 | 12.31 | 21.04 | 20.14 | 18.94 | |||||
| Total Return (%)b | 22.58 | (30.31 | ) | 5.30 | 8.11 | (.02 | ) | |||
| Ratios/Supplemental Data (%): | ||||||||||
| Ratio of total expenses | ||||||||||
| to average net assets | 2.20 | 2.05 | 2.02 | 2.01 | 2.00 | |||||
| Ratio of net expenses | ||||||||||
| to average net assets | 1.89 | 1.95 | 1.94 | 2.01 | c | 2.00 | c | |||
| Ratio of net investment income | ||||||||||
| to average net assets | 1.16 | 1.28 | .81 | .65 | .64 | |||||
| Portfolio Turnover Rate | 134.74 | 138.66 | 168.94 | d | 33.30 | 39.39 | ||||
| Net Assets, end of period ($ x 1,000) | 82,906 | 80,893 | 147,807 | 169,513 | 186,377 | |||||
| a | Based on average shares outstanding at each month end. |
| b | Exclusive of sales charge. |
| c | Expense waivers and/or reimbursements amounted to less than .01%. |
| d | The portfolio turnover rate excluding mortgage dollar roll transactions for the period ended November 30, 2007 was 162.34%. |
See notes to financial statements.
34
| Year Ended November 30, | ||||||||||
| Class C Shares | 2009 | 2008 | 2007 | 2006 | 2005 | |||||
| Per Share Data ($): | ||||||||||
| Net asset value, beginning of period | 12.38 | 21.10 | 20.19 | 18.98 | 19.19 | |||||
| Investment Operations: | ||||||||||
| Investment income—neta | .15 | .22 | .17 | .13 | .13 | |||||
| Net realized and unrealized | ||||||||||
| gain (loss) on investments | 2.61 | (5.59 | ) | .89 | 1.40 | (.11 | ) | |||
| Total from Investment Operations | 2.76 | (5.37 | ) | 1.06 | 1.53 | .02 | ||||
| Distributions: | ||||||||||
| Dividends from investment income—net | (.26 | ) | (.21 | ) | (.15 | ) | (.16 | ) | (.11 | ) |
| Dividends from net realized | ||||||||||
| gain on investments | — | (3.14 | ) | — | (.16 | ) | (.12 | ) | ||
| Total Distributions | (.26 | ) | (3.35 | ) | (.15 | ) | (.32 | ) | (.23 | ) |
| Net asset value, end of period | 14.88 | 12.38 | 21.10 | 20.19 | 18.98 | |||||
| Total Return (%)b | 22.68 | (30.22 | ) | 5.29 | 8.14 | .06 | ||||
| Ratios/Supplemental Data (%): | ||||||||||
| Ratio of total expenses | ||||||||||
| to average net assets | 2.12 | 2.01 | 1.97 | 1.95 | 1.94 | |||||
| Ratio of net expenses | ||||||||||
| to average net assets | 1.88 | 1.90 | 1.90 | 1.95 | c | 1.94 | c | |||
| Ratio of net investment income | ||||||||||
| to average net assets | 1.16 | 1.32 | .84 | .70 | .70 | |||||
| Portfolio Turnover Rate | 134.74 | 138.66 | 168.94 | d | 33.30 | 39.39 | ||||
| Net Assets, end of period ($ x 1,000) | 50,170 | 44,224 | 85,801 | 119,851 | 157,982 | |||||
| a | Based on average shares outstanding at each month end. |
| b | Exclusive of sales charge. |
| c | Expense waivers and/or reimbursements amounted to less than .01%. |
| d | The portfolio turnover rate excluding mortgage dollar roll transactions for the period ended November 30, 2007 was 162.34%. |
See notes to financial statements.
The Fund 35
FINANCIAL HIGHLIGHTS (continued)
| Year Ended November 30, | ||||||||||
| Class J Shares | 2009 | 2008 | 2007 | 2006 | 2005 | |||||
| Per Share Data ($): | ||||||||||
| Net asset value, beginning of period | 12.52 | 21.38 | 20.47 | 19.22 | 19.35 | |||||
| Investment Operations: | ||||||||||
| Investment income—neta | .26 | .40 | .36 | .33 | .31 | |||||
| Net realized and unrealized | ||||||||||
| gain (loss) on investments | 2.63 | (5.65 | ) | .93 | 1.41 | (.11 | ) | |||
| Total from Investment Operations | 2.89 | (5.25 | ) | 1.29 | 1.74 | .20 | ||||
| Distributions: | ||||||||||
| Dividends from investment income—net | (.44 | ) | (.47 | ) | (.38 | ) | (.33 | ) | (.21 | ) |
| Dividends from net realized | ||||||||||
| gain on investments | — | (3.14 | ) | — | (.16 | ) | (.12 | ) | ||
| Total Distributions | (.44 | ) | (3.61 | ) | (.38 | ) | (.49 | ) | (.33 | ) |
| Net asset value, end of period | 14.97 | 12.52 | 21.38 | 20.47 | 19.22 | |||||
| Total Return (%) | 23.81 | (29.53 | ) | 6.41 | 9.25 | .97 | ||||
| Ratios/Supplemental Data (%): | ||||||||||
| Ratio of total expenses | ||||||||||
| to average net assets | 1.06 | .99 | .91 | .96 | 1.02 | |||||
| Ratio of net expenses | ||||||||||
| to average net assets | 1.05 | .88 | .87 | .96 | b | 1.01 | ||||
| Ratio of net investment income | ||||||||||
| to average net assets | 1.99 | 2.34 | 1.77 | 1.69 | 1.62 | |||||
| Portfolio Turnover Rate | 134.74 | 138.66 | 168.94 | c | 33.30 | 39.39 | ||||
| Net Assets, end of period ($ x 1,000) | 25,858 | 27,178 | 54,149 | 174,820 | 204,901 | |||||
| a | Based on average shares outstanding at each month end. |
| b | Expense waivers and/or reimbursements amounted to less than .01%. |
| c | The portfolio turnover rate excluding mortgage dollar roll transactions for the period ended November 30, 2007 was 162.34%. |
See notes to financial statements.
36
| Year Ended November 30, | ||||||||||
| Class I Shares | 2009 | 2008 | 2007 | a | 2006 | 2005 | ||||
| Per Share Data ($): | ||||||||||
| Net asset value, beginning of period | 12.47 | 21.28 | 20.39 | 19.17 | 19.31 | |||||
| Investment Operations: | ||||||||||
| Investment income—netb | .36 | .37 | .36 | .31 | .32 | |||||
| Net realized and unrealized | ||||||||||
| gain (loss) on investments | 2.56 | (5.61 | ) | .89 | 1.40 | (.13 | ) | |||
| Total from Investment Operations | 2.92 | (5.24 | ) | 1.25 | 1.71 | .19 | ||||
| Distributions: | ||||||||||
| Dividends from investment income—net | (.42 | ) | (.43 | ) | (.36 | ) | (.33 | ) | (.21 | ) |
| Dividends from net realized | ||||||||||
| gain on investments | — | (3.14 | ) | — | (.16 | ) | (.12 | ) | ||
| Total Distributions | (.42 | ) | (3.57 | ) | (.36 | ) | (.49 | ) | (.33 | ) |
| Net asset value, end of period | 14.97 | 12.47 | 21.28 | 20.39 | 19.17 | |||||
| Total Return (%) | 24.15 | (29.57 | ) | 6.23 | 9.12 | .95 | ||||
| Ratios/Supplemental Data (%): | ||||||||||
| Ratio of total expenses | ||||||||||
| to average net assets | 1.20 | 1.07 | 1.12 | 1.07 | 1.00 | |||||
| Ratio of net expenses | ||||||||||
| to average net assets | .85 | .96 | 1.04 | 1.07 | c | 1.00 | c | |||
| Ratio of net investment income | ||||||||||
| to average net assets | 2.63 | 2.25 | 1.72 | 1.59 | 1.64 | |||||
| Portfolio Turnover Rate | 134.74 | 138.66 | 168.94 | d | 33.30 | 39.39 | ||||
| Net Assets, end of period ($ x 1,000) | 2,128 | 274 | 711 | 741 | 755 | |||||
| a | Effective June 1, 2007, Class R shares were redesignated as Class I shares. |
| b | Based on average shares outstanding at each month end. |
| c | Expense waivers and/or reimbursements amounted to less than .01%. |
| d | The portfolio turnover rate excluding mortgage dollar roll transactions for the period ended November 30, 2007 was 162.34%. |
See notes to financial statements.
The Fund 37
FINANCIAL HIGHLIGHTS (continued)
| Year Ended November 30, | ||||||||||
| Class Z Shares | 2009 | 2008 | 2007 | 2006 | 2005 | a | ||||
| Per Share Data ($): | ||||||||||
| Net asset value, beginning of period | 12.46 | 21.30 | 20.39 | 19.16 | 19.60 | |||||
| Investment Operations: | ||||||||||
| Investment income—netb | .24 | .37 | .38 | .30 | .29 | |||||
| Net realized and unrealized | ||||||||||
| gain (loss) on investments | 2.62 | (5.61 | ) | .89 | 1.41 | (.40 | ) | |||
| Total from Investment Operations | 2.86 | (5.24 | ) | 1.27 | 1.71 | (.11 | ) | |||
| Distributions: | ||||||||||
| Dividends from investment income—net | (.42 | ) | (.46 | ) | (.36 | ) | (.32 | ) | (.21 | ) |
| Dividends from net realized | ||||||||||
| gain on investments | — | (3.14 | ) | — | (.16 | ) | (.12 | ) | ||
| Total Distributions | (.42 | ) | (3.60 | ) | (.36 | ) | (.48 | ) | (.33 | ) |
| Net asset value, end of period | 14.90 | 12.46 | 21.30 | 20.39 | 19.16 | |||||
| Total Return (%) | 23.63 | (29.61 | ) | 6.31 | 9.11 | (.59 | )c | |||
| Ratios/Supplemental Data (%): | ||||||||||
| Ratio of total expenses | ||||||||||
| to average net assets | 1.18 | 1.09 | 1.12 | 1.15 | 1.15 | c | ||||
| Ratio of net expenses | ||||||||||
| to average net assets | 1.16 | .98 | .93 | 1.07 | 1.02 | c | ||||
| Ratio of net investment income | ||||||||||
| to average net assets | 1.88 | 2.24 | 1.83 | 1.58 | 1.51 | c | ||||
| Portfolio Turnover Rate | 134.74 | 138.66 | 168.94 | d | 33.30 | 39.39 | ||||
| Net Assets, end of period ($ x 1,000) | 47,532 | 44,768 | 76,939 | 85,923 | 100,250 | |||||
| a | From December 18, 2004 (commencement of operations) to November 30, 2005. |
| b | Based on average shares outstanding at each month end. |
| c | Not annualized. |
| d | The portfolio turnover rate excluding mortgage dollar roll transactions for the period ended November 30, 2007 was 162.34%. |
See notes to financial statements.
38
NOTES TO FINANCIAL STATEMENTS
NOTE 1—Significant Accounting Policies:
Dreyfus Balanced Opportunity Fund (the “fund”) is a separate diversified series of Dreyfus Manager Funds II (the “Company”), which is registered under the Investment Company Act of 1940, as amended (the “Act”), as an open-end management investment company and operates as a series company currently offering the fund as its only series. The fund’s investment objective is to seek a high total return through a combination of capital appreciation and current income. The Dreyfus Corporation (the “Manager” or “Dreyfus”), a wholly-owned subsidiary of The Bank of New York Mellon Corporation (“BNY Mellon”), serves as the fund’s investment adviser.
As of the close of business on January 8, 2009, pursuant to an Agreement and Plan of Reorganization previously approved by the fund’s Board of Trustees, all of the assets, subject to liabilities, of Dreyfus Balanced Fund (“Dreyfus Balanced”) were transferred to the fund in exchange for corresponding class of shares of Beneficial Interest of the fund of equal value. Shareholders of Class A, Class B, Class C, Class I and Class T shares of Dreyfus Balanced received Class A, Class B, Class C, Class I and Class T shares of the fund, respectively, in each case in an amount equal to the aggregate net asset value of their investment in Dreyfus Balanced at the time of the exchange.The net asset value of the fund’s shares on the close of business January 8, 2009, after the reorganization was $12.44 for Class A, $12.40 for Class B, $12.46 for Class C, $12.40 for Class I and $12.46 for Class T shares, and a total of 3,334,487 Class A shares, 191,471 Class B shares, 391,069 Class C shares, 123,934 Class I shares and 7,023 Class T shares, representing net assets of $50,352,911 (including $11,965,047 net unrealized depreciation on investments) were issued to shareholders of Dreyfus Balanced in the exchange.The exchange was a tax-free event to the Dreyfus Balanced shareholders.
MBSC Securities Corporation (the “Distributor”), a wholly-owned subsidiary of the Manager, is the Distributor of the fund’s shares. The fund is authorized to issue an unlimited number of $.001 par value
The Fund 39
NOTES TO FINANCIAL STATEMENTS (continued)
shares of Beneficial Interest in each of the following classes of shares: Class A, Class B, Class C, Class I, Class J and Class Z shares. Class A shares are subject to a sales charge imposed at the time of purchase. Class B shares are subject to a contingent deferred sales charge (“CDSC”) imposed on Class B share redemptions made within six years of purchase and automatically convert to Class A shares after six years.The fund does not offer Class B shares, except in connection with dividend reinvestment and permitted exchanges of Class B shares. Class C shares are subject to a CDSC imposed on Class C shares redeemed within one year of purchase. Class I, Class J and Class Z shares are sold at net asset value per share. Class I shares are sold only to institutional investors and Class J and Class Z shares are closed to new investors. Other differences between the classes include the services offered to and the expenses borne by each class, the allocation of certain transfer agency costs and certain voting rights. Income, expenses (other than expenses attributable to a specific class), and realized and unrealized gains or losses on investments are allocated to each class of shares based on its relative net assets.
Effective December 3, 2008, investments for new accounts were no longer permitted in Class T shares of the fund, except that participants in certain group retirement plans were able to open a new account in Class T shares of the fund, provided that the fund was established as an investment option under the plans before December 3, 2008. On February 4, 2009, the fund issued to each holder of its Class T shares, in exchange for said shares, Class A shares of the fund having an aggregate net asset value equal to the aggregate net asset value of the shareholder’s Class T shares. Subsequent investments in the fund’s Class A shares made by prior holders of the fund’s Class T shares who received Class A shares of the fund in exchange for their Class T shares are subject to the front-end sales load schedule that was in effect for Class T shares at the time of the exchange. Otherwise, all other Class A share attributes will be in effect. Effective as of the close of business on February 4, 2009, the fund no longer offers Class T shares.
40
The Financial Accounting Standards Board (“FASB”) Accounting Standards Codification (“ASC”) has become the exclusive reference of authoritative U.S. generally accepted accounting principles (“GAAP”) recognized by the FASB to be applied by nongovernmental entities. Rules and interpretive releases of the Securities and Exchange Commission (“SEC”) under authority of federal laws are also sources of authoritative GAAP for SEC registrants. The ASC has superseded all existing non-SEC accounting and reporting standards. The fund’s financial statements are prepared in accordance with GAAP, which may require the use of management estimates and assumptions.Actual results could differ from those estimates.
The fund enters into contracts that contain a variety of indemnifications. The fund’s maximum exposure under these arrangements is unknown.The fund does not anticipate recognizing any loss related to these arrangements.
(a) Portfolio valuation: Investments in securities are valued at the last sales price on the securities exchange or national securities market on which such securities are primarily traded. Securities listed on the National Market System for which market quotations are available are valued at the official closing price or, if there is no official closing price that day, at the last sales price. Securities not listed on an exchange or the national securities market, or securities for which there were no transactions, are valued at the average of the most recent bid and asked prices, except for open short positions, where the asked price is used for valuation purposes. Bid price is used when no asked price is available. Registered investment companies that are not traded on an exchange are valued at their net asset value. When market quotations or official closing prices are not readily available, or are determined not to reflect accurately fair value, such as when the value of a security has been significantly affected by events after the close of the exchange or market on which the security is principally traded (for example, a foreign exchange or market),but before the fund calculates its net asset value,the fund may
The Fund 41
NOTES TO FINANCIAL STATEMENTS (continued)
value these investments at fair value as determined in accordance with the procedures approved by the Board of Trustees. Fair valuing of securities may be determined with the assistance of a pricing service using calculations based on indices of domestic securities and other appropriate indicators, such as prices of relevant ADRs and futures contracts. For other securities that are fair valued by the Board of Trustees, certain factors may be considered such as: fundamental analytical data, the nature and duration of restrictions on disposition, an evaluation of the forces that influence the market in which the securities are purchased and sold and public trading in similar securities of the issuer or comparable issuers. Financial futures are valued at the last sales price. Investments denominated in foreign currencies are translated to U.S. dollars at the prevailing rates of exchange. Forward foreign currency exchange contracts (“forward contracts”) are valued at the forward rate.
Debt securities excluding short-term investments (other than U.S. Treasury Bills) are valued each business day by an independent pricing service (the “Service”) approved by the Board of Trustees. Investments for which quoted bid prices are readily available and are representative of the bid side of the market in the judgment of the Service are valued at the mean between the quoted bid prices (as obtained by the Service from dealers in such securities) and asked prices (as calculated by the Service based upon its evaluation of the market for such securities). Other debt securities are valued as determined by the Service, based on methods which include consideration of: yields or prices of securities of comparable quality, coupon, maturity and type; indications as to values from dealers; and general market conditions. Restricted securities, as well as securities or other assets for which recent market quotations are not readily available, that are not valued by a pricing service approved by the Board of Trustees, or are determined by the fund not to reflect accurately fair value, are valued at fair value as determined in good faith under the direction of the Board ofTrustees.The factors that may be considered when fair valuing a security include fundamental analytical data, the nature and duration of restrictions on disposition, an
42
evaluation of the forces that influence the market in which the securities are purchased and sold and public trading in similar securities of the issuer or comparable issuers. Short-term investments, excluding U.S. Treasury Bills, are carried at amortized cost, which approximates value.
The fair value of a financial instrument is the amount that would be received to sell an asset or paid to transfer a liability in an orderly transaction between market participants at the measurement date (i.e. the exit price). GAAP establishes a fair value hierarchy that prioritizes the inputs of valuation techniques used to measure fair value.This hierarchy gives the highest priority to unadjusted quoted prices in active markets for identical assets or liabilities (Level 1 measurements) and the lowest priority to unobservable inputs (Level 3 measurements).
Additionally, GAAP provides guidance on determining whether the volume and activity in a market has decreased significantly and whether such a decrease in activity results in transactions that are not orderly. GAAP requires enhanced disclosures around valuation inputs and techniques used during annual and interim periods.
Various inputs are used in determining the value of the fund’s investments relating to fair value measurements. These inputs are summarized in the three broad levels listed below:
Level 1—unadjusted quoted prices in active markets for identical investments.
Level 2—other significant observable inputs (including quoted prices for similar investments, interest rates, prepayment speeds, credit risk, etc.).
Level 3—significant unobservable inputs (including the fund’s own assumptions in determining the fair value of investments).
The inputs or methodology used for valuing securities are not necessarily an indication of the risk associated with investing in those securities.
The Fund 43
NOTES TO FINANCIAL STATEMENTS (continued)
The following is a summary of the inputs used as of November 30, 2009 in valuing the fund’s investments:
| Level 1— | Level 2—Other | Level 3— | ||
| Unadjusted | Significant | Significant | ||
| Quoted | Observable Unobservable | |||
| Prices | Inputs | Inputs | Total | |
| Assets ($) | ||||
| Investments in Securities: | ||||
| Equity Securities— | ||||
| Domestic† | 216,790,809 | — | — | 216,790,809 |
| Equity Securities— | ||||
| Foreign† | 5,699,800 | — | — | 5,699,800 |
| U.S. Treasury | ||||
| Securities | — | 22,224,111 | — | 22,224,111 |
| Asset-Backed | — | 3,093,989 | — | 3,093,989 |
| Corporate Bonds | — | 28,003,639 | — | 28,003,639 |
| Foreign Government | — | 543,243 | — | 543,243 |
| Municipal Bonds | — | 988,749 | — | 988,749 |
| U.S. Government | ||||
| Agencies/ | ||||
| Mortgage-Backed | — | 37,094,526 | — | 37,094,526 |
| Residential | ||||
| Mortgage-Backed | — | 212,330 | — | 212,330 |
| Commercial | ||||
| Mortgage-Backed | — | 8,366,802 | — | 8,366,802 |
| Mutual Funds/ | ||||
| Exchange | ||||
| Traded Funds | 1,038,591 | — | — | 1,038,591 |
† See Statement of Investments for industry classification.
(b) Foreign currency transactions: The fund does not isolate that portion of the results of operations resulting from changes in foreign exchange rates on investments from the fluctuations arising from changes in market prices of securities held. Such fluctuations are included with the net realized and unrealized gain or loss on investments.
Net realized foreign exchange gains or losses arise from sales of foreign currencies, currency gains or losses realized on securities transactions and the difference between the amounts of dividends, interest and foreign withholding taxes recorded on the fund’s books and the U.S. dollar equivalent of the amounts actually received or paid. Net unrealized
44
foreign exchange gains and losses arise from changes in the value of assets and liabilities other than investments resulting from changes in exchange rates. Foreign currency gains and losses on investments are included with net realized and unrealized gain or loss on investments.
(c) Securities transactions and investment income: Securities transactions are recorded on a trade date basis. Realized gains and losses from securities transactions are recorded on the identified cost basis. Dividend income is recognized on the ex-dividend date and interest income, including, where applicable, accretion of discount and amortization of premium on investments, is recognized on the accrual basis.
The fund has arrangements with the custodian and cash management bank whereby the fund may receive earnings credits when positive cash balances are maintained, which are used to offset custody and cash management fees. For financial reporting purposes, the fund includes net earnings credits as an expense offset in the Statement of Operations.
Pursuant to a securities lending agreement with The Bank of New York Mellon, a subsidiary of BNY Mellon and an affiliate of Dreyfus, the fund may lend securities to qualified institutions. It is the fund’s policy that, at origination, all loans are secured by collateral of at least 102% of the value of U.S. securities loaned and 105% of the value of foreign securities loaned. Collateral equivalent to at least 100% of the market value of securities on loan is maintained at all times. Collateral is either in the form of cash, which can be invested in certain money market mutual funds managed by the Manager, U.S. Government and Agency securities or letters of credit.The fund is entitled to receive all income on securities loaned, in addition to income earned as a result of the lending transaction. Although each security loaned is fully collateralized, the fund bears the risk of delay in recovery of, or loss of rights in, the securities loaned should a borrower fail to return the securities in a timely manner. During the period ended November 30, 2009, The Bank of New York Mellon earned $12,963 from lending fund portfolio securities, pursuant to the securities lending agreement.
The Fund 45
NOTES TO FINANCIAL STATEMENTS (continued)
(d) Affiliated issuers: Investments in other investment companies advised by the Manager are defined as “affiliated” in the Act.
(e) Dividends to shareholders: Dividends are recorded on the ex-dividend date. Dividends from investment income-net and dividends from net realized capital gains, if any, are normally declared and paid annually, but the fund may make distributions on a more frequent basis to comply with the distribution requirements of the Internal Revenue Code of 1986, as amended (the “Code”).To the extent that net realized capital gains can be offset by capital loss carryovers, it is the policy of the fund not to distribute such gains. Income and capital gain distributions are determined in accordance with income tax regulations, which may differ from GAAP.
(f) Federal income taxes: It is the policy of the fund to continue to qualify as a regulated investment company, if such qualification is in the best interests of its shareholders, by complying with the applicable provisions of the Code, and to make distributions of taxable income sufficient to relieve it from substantially all federal income and excise taxes.
As of and during the period ended November 30, 2009, the fund did not have any liabilities for any uncertain tax positions.The fund recognizes interest and penalties, if any, related to uncertain tax positions as income tax expense in the Statement of Operations. During the period, the fund did not incur any interest or penalties.
Each of the tax years in the four-year period ended November 30, 2009 remains subject to examination by the Internal Revenue Service and state taxing authorities.
At November 30, 2009, the components of accumulated earnings on a tax basis were as follows: undistributed ordinary income $3,960,143, accumulated capital losses $77,055,604 and unrealized appreciation $3,739,284. In addition, the fund had $799,677 of capital losses realized after October 31, 2009, which were deferred for tax purposes to the first day of the following fiscal year.
The accumulated capital loss carryover is available for federal income tax purposes to be applied against future net securities profits, if any, realized
46
subsequent to November 30, 2009. If not applied, $2,764,375 of the carryover expires in fiscal 2010, $5,034,522 expires in fiscal 2015, $25,356,910 expires in fiscal 2016 and $43,899,797 expires in fiscal 2017. Based on certain provisions in the Code, some of these losses acquired from the fund merger with Dreyfus Balanced are subject to an annual limitation.
The tax character of distributions paid to shareholders during the fiscal periods ended November 30, 2009 and November 30, 2008 were as follows: ordinary income $7,151,804 and $12,852,838 and long-term capital gains $0 and $70,428,520, respectively.
During the period ended November 30, 2009, as a result of permanent book to tax differences, primarily due to the tax treatment for paydown gains and losses on mortgage-backed securities and capital loss carryover and wash sales from fund merger, the fund decreased accumulated undistributed investment income-net by $111,889, decreased accumulated net realized gain (loss) on investments by $11,492,212 and increased paid-in capital by $11,604,101. Net assets and net asset value per share were not affected by this reclassification.
NOTE 2—Bank Lines of Credit:
The fund participated with other Dreyfus-managed funds in a $145 million unsecured credit facility led by Citibank, N.A. and a $300 million unsecured credit facility provided by The Bank of New York Mellon (each, a “Facility”), each to be utilized primarily for temporary or emergency purposes, including the financing of redemptions. Effective October 14, 2009, the $145 million unsecured credit facility with Citibank, N.A., was increased to $215 million and effective December 10, 2009, was further increased to $225 million.The fund continues participation in the $300 million unsecured credit facility provided by The Bank of New York Mellon. In connection therewith, the fund has agreed to pay its pro rata portion of commitment fees for each Facility. Interest is charged to the fund based on rates determined pursuant to the terms of the respective Facility at the time of borrowing.
The Fund 47
NOTES TO FINANCIAL STATEMENTS (continued)
The average amount of borrowings outstanding under the Facilities during the period ended November 30, 2009, was approximately $5,300 with a related weighted average annualized interest rate of 1.87%.
NOTE 3—Management Fee and Other Transactions With Affiliates:
(a) Pursuant to a management agreement (“Agreement”) with the Manager, the management fee is computed at the annual rate of .80% of the value of the fund’s average daily net assets and is payable monthly. The Manager has contractually agreed until March 31, 2010 to waive receipt of its fees and/or assume the expenses, so that the net operating expenses of the fund’s Class A, B, C and I shares (excluding taxes, interest, brokerage commissions, commitment fees on borrowings and extraordinary expenses) do not exceed 1.11%, 1.86%, 1.86% and .85%, respectively, of such class’ average daily net assets. The reduction in expenses, pursuant to the undertaking, amounted to $664,937 during the period ended November 30, 2009.
During the period ended November 30, 2009, the Distributor retained $10,361 from commissions earned on sales of the fund’s Class A shares and $124,874 and $5,209 from CDSCs on redemptions of the fund’s Class B and Class C shares, respectively.
(b) Under the Distribution Plan (the “Plan”) adopted pursuant to Rule 12b-1 under the Act, Class B and Class C shares pay and Class T shares paid the Distributor for distributing their shares at an annual rate of .75% of the value of the average daily net assets of Class B and Class C shares and .25% of the value of the average daily net assets of Class T shares. During the period ended November 30, 2009, Class B, Class C and ClassT shares were charged $589,311, $352,043 and $387, respectively, pursuant to the Plan.
(c) Under the Shareholder Services Plan, Class A, Class B and Class C shares pay and Class T shares paid the Distributor at an annual rate of .25% of the value of their average daily net assets for the provision of certain services. The services provided may include personal services relating to shareholder accounts, such as answering shareholder inquiries regarding the fund and providing reports and other information, and
48
services related to the maintenance of shareholder accounts. The Distributor may make payments to Service Agents (a securities dealer, financial institution or industry professional) in respect of these services. The Distributor determines the amounts to be paid to Service Agents. During the period ended November 30, 2009, Class A, Class B, Class C and Class T shares were charged $262,950, $196,437, $117,348 and $387, respectively, pursuant to the Shareholder Services Plan.
Under the Shareholder Services Plan with respect to Class Z (“Class Z Shareholder Services Plan”), Class Z shares reimburse the Distributor an amount not to exceed an annual rate of ..25% of the value of Class Z shares’ average daily net assets for certain allocated expenses of providing personal services and/or maintaining shareholder accounts.The services provided may include personal services relating to shareholder accounts, such as answering shareholder inquiries regarding Class Z shares and providing reports and other information, and services related to the maintenance of shareholder accounts. During the period ended November 30, 2009, Class Z shares were charged $0 pursuant to the Class Z Shareholder Services Plan.
The fund compensates DreyfusTransfer, Inc., a wholly-owned subsidiary of the Manager, under a transfer agency agreement for providing personnel and facilities to perform transfer agency services for the fund. During the period ended November 30, 2009, the fund was charged $324,409 pursuant to the transfer agency agreement, which is included in Shareholder servicing costs in the Statement of Operations.
The fund compensates The Bank of New York Mellon under a cash management agreement for performing cash management services related to fund subscriptions and redemptions. During the period ended November 30, 2009, the fund was charged $46,227 pursuant to the cash management agreement, which is included in Shareholder servicing costs in the Statement of Operations.These fees were offset by earnings credits pursuant to the cash management agreement.
The fund also compensates The Bank of New York Mellon under a custody agreement for providing custodial services for the fund.
The Fund 49
NOTES TO FINANCIAL STATEMENTS (continued)
During the period ended November 30, 2009, the fund was charged $79,283 pursuant to the custody agreement.
During the period ended November 30, 2009, the fund was charged $6,539 for services performed by the Chief Compliance Officer.
The components of “Due to The Dreyfus Corporation and affiliates” in the Statement of Assets and Liabilities consist of: management fees $213,843, Rule 12b-1 distribution plan fees $82,411, shareholder services plan fees $51,266, custodian fees $15,453, chief compliance officer fees $4,454 and transfer agency per account fees $42,000, which are offset against an expense reimbursement currently in effect in the amount of $47,021.
(d) Each Board member also serves as a Board member of other funds within the Dreyfus complex. Annual retainer fees and attendance fees are allocated to each fund based on net assets.
NOTE 4—Securities Transactions:
The aggregate amount of purchases and sales (including paydowns) of investment securities, excluding short-term securities and forward contracts, during the period ended November 30, 2009, amounted to $393,471,689 and $442,521,630, respectively.
The fund adopted the provisions of ASC Topic 815 “Derivatives and Hedging” which requires qualitative disclosures about objectives and strategies for using derivatives, quantitative disclosures about fair value amounts of gains and losses on derivative instruments and disclosures about credit-risk-related contingent features in derivative agreements. The disclosure requirements distinguish between derivatives which are accounted for as “hedges” and those that do not qualify for hedge accounting. Because investment companies value their derivatives at fair value and recognize changes in fair value through the Statement of Operations, they do not qualify for such accounting. Accordingly, even though a fund’s investments in derivatives may represent economic hedges, they are considered to be non-hedge transactions for purposes of this disclosure.
50
Forward Foreign Currency Exchange Contracts: The fund may enter into forward contracts in order to hedge its exposure to changes in foreign currency exchange rates on its foreign portfolio holdings, to settle foreign currency transactions or as a part of an investment strategy.When executing forward contracts, the fund is obligated to buy or sell a foreign currency at a specified rate on a certain date in the future.With respect to sales of forward contracts, the fund would incur a loss if the value of the contract increases between the date the forward contract is opened and the date the forward contract is closed.The fund realizes a gain if the value of the contract decreases between those dates.With respect to purchases of forward contracts, the fund would incur a loss if the value of the contract decreases between the date the forward contract is opened and the date the forward contract is closed. The fund realizes a gain if the value of the contract increases between those dates.The fund is exposed to foreign currency risk as a result of changes in value of underlying financial instruments. The fund is also exposed to credit risk associated with counterparty nonperformance on these forward contracts, which is typically limited to the unrealized gain on each open contract. There were no open forward contracts at November 30, 2009.
At November 30, 2009, the cost of investments for federal income tax purposes was $320,317,305; accordingly, accumulated net unrealized appreciation on investments was $3,739,284, consisting of $21,744,755 gross unrealized appreciation and $18,005,471 gross unrealized depreciation.
NOTE 5—Subsequent Events Evaluation:
Dreyfus has evaluated the need for disclosures and/or adjustments resulting from subsequent events through January 27, 2010, the date the financial statements were issued. This evaluation did not result in any subsequent events that necessitated disclosures and/or adjustments other than the increase in the Citibank, N.A. Facility to $225 million as noted in Note 2.
The Fund 51
REPORT OF INDEPENDENT REGISTERED
PUBLIC ACCOUNTING FIRM
Shareholders and Board of Trustees
Dreyfus Balanced Opportunity Fund
We have audited the accompanying statement of assets and liabilities, including the statement of investments, of Dreyfus Balanced Opportunity Fund (the sole series comprising Dreyfus Premier Manager Funds II) as of November 30, 2009, and the related statement of operations for the year then ended, the statement of changes in net assets for each of the two years in the period then ended, and financial highlights for each of the three years in the period then ended.These financial statements and financial highlights are the responsibility of the Fund’s management. Our responsibility is to express an opinion on these financial statements and financial highlights based on our audits. The financial highlights for the years ended November 30, 2006 and 2005, were audited by other auditors whose report dated January 19, 2007, expressed an unqualified opinion on such financial highlights.
We conducted our audits in accordance with the standards of the Public Company Accounting Oversight Board (United States).Those standards require that we plan and perform the audit to obtain reasonable assurance about whether the financial statements and financial highlights are free of material misstatement.We were not engaged to perform an audit of the Fund’s internal control over financial reporting. Our audits included consideration of internal control over financial reporting as a basis for designing audit procedures that are appropriate in the circumstances, but not for the purpose of expressing an opinion on the effectiveness of the Fund’s internal control over financial reporting.Accordingly, we express no such opinion. An audit also includes examining, on a test basis, evidence supporting the amounts and disclosures in the financial statements and financial highlights,assessing the accounting principles used and significant estimates made by management,and evaluating the overall financial statement presentation. Our procedures included confirmation of securities owned as of November 30, 2009 by correspondence with the custodian and oth-ers.We believe that our audits provide a reasonable basis for our opinion.
In our opinion, the 2009, 2008 and 2007 financial statements and financial highlights referred to above present fairly, in all material respects, the financial position of Dreyfus Balanced Opportunity Fund at November 30, 2009, the results of its operations for the year then ended, the changes in its net assets for each of the two years in the period then ended and the financial highlights for each of the three years in the period then ended, in conformity with U.S. generally accepted accounting principles.

52
IMPORTANT TAX INFORMATION (Unaudited)
For federal tax purposes the fund hereby designates 76.09% of the ordinary dividends paid during the fiscal year ended November 30, 2009 as qualifying for the corporate dividends received deduction. Also certain dividends paid by the fund may be subject to a maximum tax rate of 15%, as provided for by the Jobs and Growth Tax Relief Reconciliation Act of 2003. Of the distributions paid during the fiscal year, $747,869 represents the maximum amount that may be considered qualified dividend income. Shareholders will receive notification in early 2010 of the percentage applicable to the preparation of their 2009 income tax returns.
The Fund 53

NOTES
Item 2. Code of Ethics.
The Registrant has adopted a code of ethics that applies to the Registrant's principal executive officer, principal financial officer, principal accounting officer or controller, or persons performing similar functions. There have been no amendments to, or waivers in connection with, the Code of Ethics during the period covered by this Report.
Item 3. Audit Committee Financial Expert.
The Registrant's Board has determined that David P. Feldman, a member of the Audit Committee of the Board, is an audit committee financial expert as defined by the Securities and Exchange Commission (the "SEC"). David P. Feldman is "independent" as defined by the SEC for purposes of audit committee financial expert determinations.
Item 4. Principal Accountant Fees and Services.
(a) Audit Fees. The aggregate fees billed for each of the last two fiscal years (the "Reporting Periods") for professional services rendered by the Registrant's principal accountant (the "Auditor") for the audit of the Registrant's annual financial statements or services that are normally provided by the Auditor in connection with the statutory and regulatory filings or engagements for the Reporting Periods, were $47,380 in 2008 and $48,328 in 2009.
(b) Audit-Related Fees. The aggregate fees billed in the Reporting Periods for assurance and related services by the Auditor that are reasonably related to the performance of the audit of the Registrant's financial statements and are not reported under paragraph (a) of this Item 4 were $10,398 in 2008 and $5,276 in 2009.
The aggregate fees billed in the Reporting Periods for non-audit assurance and related services by the Auditor to the Registrant's investment adviser (not including any sub-investment adviser whose role is primarily portfolio management and is subcontracted with or overseen by another investment adviser), and any entity controlling, controlled by or under common control with the investment adviser that provides ongoing services to the Registrant ("Service Affiliates"), that were reasonably related to the performance of the annual audit of the Service Affiliate, which required pre-approval by the Audit Committee were $0 in 2008 and $0 in 2009.
(c) Tax Fees. The aggregate fees billed in the Reporting Periods for professional services rendered by the Auditor for tax compliance, tax advice, and tax planning ("Tax Services") were $3,607 in 2008 and $3,579 in 2009. These services consisted of: (i) review or preparation of U.S. federal, state, local and excise tax returns; (ii) U.S. federal, state and local tax planning, advice and assistance regarding statutory, regulatory or administrative developments; (iii) tax advice regarding tax qualification matters and/or treatment of various financial instruments held or proposed to be acquired or held. The aggregate fees billed in the Reporting Periods for Tax Services by the Auditor to Service Affiliates, which required pre-approval by the Audit Committee were $0 in 2008 and $0 in 2009.
(d) All Other Fees. The aggregate fees billed in the Reporting Periods for products and services provided by the Auditor, other than the services reported in paragraphs (a) through (c) of this Item, were $194 in 2008 and $79 in 2009. [These services consisted of a review of the Registrant's anti-money laundering program].
The aggregate fees billed in the Reporting Periods for Non-Audit Services by the Auditor to Service Affiliates, other than the services reported in paragraphs (b) through (c) of this Item, which required pre-approval by the Audit Committee, were $0 in 2008 and $0 in 2009.
Note: In each of (b) through (d) of this Item 4, 100% of all services provided by the Auditor were pre-approved as required.
Audit Committee Pre-Approval Policies and Procedures. The Registrant's Audit Committee has established policies and procedures (the "Policy") for pre-approval (within specified fee limits) of the Auditor's engagements for non-audit services to the Registrant and Service Affiliates without specific case-by-case consideration. Pre-approval considerations include whether the proposed services are compatible with maintaining the Auditor's independence. Pre-approvals pursuant to the Policy are considered annually.
Non-Audit Fees. The aggregate non-audit fees billed by the Auditor for services rendered to the Registrant, and rendered to Service Affiliates, for the Reporting Periods were $9,452,992 in 2008 and $26,086,988 in 2009.
Auditor Independence. The Registrant's Audit Committee has considered whether the provision of non-audit services that were rendered to Service Affiliates, which were not pre-approved (not requiring pre-approval), is compatible with maintaining the Auditor's independence.
Item 5. Audit Committee of Listed Registrants.
Not applicable. [CLOSED-END FUNDS ONLY]
Item 6. Investments.
(a) Not applicable.
Item 7. Disclosure of Proxy Voting Policies and Procedures for Closed-End Management Investment Companies.
Not applicable. [CLOSED-END FUNDS ONLY]
Item 8. Portfolio Managers of Closed-End Management Investment Companies.
Not applicable. [CLOSED-END FUNDS ONLY, beginning with reports for periods ended on and after December 31, 2005]
Item 9. Purchases of Equity Securities by Closed-End Management Investment Companies and Affiliated Purchasers.
Not applicable. [CLOSED-END FUNDS ONLY]
Item 10. Submission of Matters to a Vote of Security Holders.
There have been no material changes to the procedures applicable to Item 10.
Item 11. Controls and Procedures.
(a) The Registrant's principal executive and principal financial officers have concluded, based on their evaluation of the Registrant's disclosure controls and procedures as of a date within 90 days of the filing date of this report, that the Registrant's disclosure controls and procedures are reasonably designed to ensure that information required to be disclosed by the Registrant on Form N-CSR is recorded, processed, summarized and reported within the required time periods and that information required to be disclosed by the Registrant
in the reports that it files or submits on Form N-CSR is accumulated and communicated to the Registrant's management, including its principal executive and principal financial officers, as appropriate to allow timely decisions regarding required disclosure.
(b) There were no changes to the Registrant's internal control over financial reporting that occurred during the second fiscal quarter of the period covered by this report that have materially affected, or are reasonably likely to materially affect, the Registrant's internal control over financial reporting.
Item 12. Exhibits.
(a)(1) Code of ethics referred to in Item 2.
(a)(2) Certifications of principal executive and principal financial officers as required by Rule 30a-2(a) under the Investment Company Act of 1940.
(a)(3) Not applicable.
(b) Certification of principal executive and principal financial officers as required by Rule 30a-2(b) under the Investment Company Act of 1940.
SIGNATURES
Pursuant to the requirements of the Securities Exchange Act of 1934 and the Investment Company Act of 1940, the Registrant has duly caused this Report to be signed on its behalf by the undersigned, thereunto duly authorized.
Dreyfus Manager Funds II
| By: | /s/ Bradley J. Skapyak |
| Bradley J. Skapyak, | |
| President | |
| Date: | January 19, 2010 |
Pursuant to the requirements of the Securities Exchange Act of 1934 and the Investment Company Act of 1940, this Report has been signed below by the following persons on behalf of the Registrant and in the capacities and on the dates indicated.
| By: | /s/ Bradley J. Skapyak |
| Bradley J. Skapyak, | |
| President | |
| Date: | January 19, 2010 |
| By: | /s/ James Windels |
| James Windels, | |
| Treasurer | |
| Date: | January 19, 2010 |
EXHIBIT INDEX
(a)(1) Code of ethics referred to in Item 2.
(a)(2) Certifications of principal executive and principal financial officers as required by Rule 30a-2(a) under the Investment Company Act of 1940. (EX-99.CERT)
(b) Certification of principal executive and principal financial officers as required by Rule 30a-2(b) under the Investment Company Act of 1940. (EX-99.906CERT)