UNITED STATES
SECURITIES AND EXCHANGE COMMISSION
Washington, D.C. 20549
FORM N-CSR
CERTIFIED SHAREHOLDER REPORT OF REGISTERED MANAGEMENT
INVESTMENT COMPANIES
Investment Company Act file number | 811-27213 | |||||
|
| |||||
| Dreyfus Manager Funds II |
| ||||
| (Exact name of Registrant as specified in charter) |
| ||||
|
|
| ||||
|
c/o The Dreyfus Corporation 200 Park Avenue New York, New York 10166 |
| ||||
| (Address of principal executive offices) (Zip code) |
| ||||
|
|
| ||||
| Michael A. Rosenberg, Esq. 200 Park Avenue New York, New York 10166 |
| ||||
| (Name and address of agent for service) |
| ||||
| ||||||
Registrant's telephone number, including area code: | (212) 922-6000 | |||||
|
| |||||
Date of fiscal year end:
| 11/30 |
| ||||
Date of reporting period: | 11/30/10 |
| ||||
Save time. Save paper. View your next shareholder report online as soon as it’s available. Log into www.dreyfus.com and sign up for Dreyfus eCommunications. It’s simple and only takes a few minutes.
The views expressed in this report reflect those of the portfolio manager only through the end of the period covered and do not necessarily represent the views of Dreyfus or any other person in the Dreyfus organization. Any such views are subject to change at any time based upon market or other conditions and Dreyfus disclaims any responsibility to update such views.These views may not be relied on as investment advice and, because investment decisions for a Dreyfus fund are based on numerous factors, may not be relied on as an indication of trading intent on behalf of any Dreyfus fund.
Not FDIC-Insured • Not Bank-Guaranteed • May Lose Value
Contents | |
THE FUND | |
| 2 | A Letter from the Chairman and CEO |
| 3 | Discussion of Fund Performance |
| 6 | Fund Performance |
| 8 | Understanding Your Fund’s Expenses |
| 9 | Comparing Your Fund’s Expenses With Those of Other Funds |
| 10 | Statement of Investments |
| 26 | Statement of Assets and Liabilities |
| 28 | Statement of Operations |
| 29 | Statement of Changes in Net Assets |
| 33 | Financial Highlights |
| 39 | Notes to Financial Statements |
| 52 | Report of Independent Registered Public Accounting Firm |
| 53 | Important Tax Information |
| 54 | Board Members Information |
| 56 | Officers of the Fund |
FOR MORE INFORMATION | |
Back Cover |
Dreyfus
Balanced Opportunity Fund
The Fund

A LETTER FROM THE CHAIRMAN AND CEO
Dear Shareholder:
We are pleased to present this annual report for Dreyfus Balanced Opportunity Fund, covering the 12-month period from December 1, 2009, through November 30, 2010.
Both stocks and bonds delivered respectable, positive returns over the past year despite periodic bouts of volatility stemming from domestic and global economic uncertainty and events. Although U.S. GDP growth was positive throughout the reporting period, the economic recovery has been milder than historical averages. Stubbornly high levels of unemployment and persistent weakness in the housing market weighed on economic activity while rising corporate earnings and moderate inflation risk have generally been supportive of stock and longer-term bond prices.
We remain cautiously optimistic regarding economic and market prospects in 2011.A weaker U.S. dollar is likely to support exports and limit imports, residential construction appears to set to begin recovering from depressed levels, and employment growth has begun to expand enough to generate solid gains in wage and salary income. Meanwhile, we expect inflationary pressures and short-term interest rates to remain low.As always, we urge you to talk with your financial advisor to review your investment outlook given these recent developments.
For information about how the fund performed during the reporting period, as well as general market perspectives, we provide a Discussion of Fund Performance on the pages that follow.
Thank you for your continued confidence and support.
Jonathan R. Baum
Chairman and Chief Executive Officer
The Dreyfus Corporation
December 15, 2010
2

DISCUSSION OF FUND PERFORMANCE
For the reporting period of December 1, 2009, through November 30, 2010, as provided by Keith Stransky, Brian Ferguson, Sean Fitzgibbon, David Bowser and Peter Vaream, Portfolio Managers
Fund and Market Performance Overview
For the 12-month period ended November 30, 2010, Dreyfus Balanced Opportunity Fund’s Class A shares, Class B shares, Class C shares, Class I shares, Class J shares and Class Z shares produced total returns of 8.38%, 7.55%, 7.50%, 8.64%, 8.50% and 8.43%, respectively.1 In comparison, the fund’s benchmark, a blended index composed of 60% Standard & Poor’s 500 Composite Stock Price Index (“S&P 500 Index”) and 40% Barclays Capital U.S.Aggregate Bond Index, produced an 8.38% total return for the same period.2 Separately, the S&P 500 Index and the Barclays Capital U.S . Aggregate Bond Index produced total returns of 9.96% and 6.02%, respectively, for the same period.
Stocks and bonds generally advanced during the reporting period as the U.S. economy continued to emerge from recession with few signs of rising inflation. The fund produced returns comparable to its benchmark, as both the equity and fixed-income portfolios benefited from their security selection strategies.
The Fund’s Investment Approach
The fund seeks high total return, including capital appreciation and current income, through a diversified mix of stocks and fixed-income securities.When allocating assets, we assess the relative return and risk of each asset class, general economic conditions, anticipated future changes in interest rates and the general outlook for stocks.
Among stocks, we strive to create a broadly diversified portfolio that includes a blend of growth and value stocks. Using quantitative and fundamental research, we look for companies with leading market positions, competitive or technological advantages, high returns on equity and assets, good growth prospects, attractive valuations and strong management teams.
The fund normally invests between 25% and 50% of its assets in fixed-income securities that, at the time of purchase, are rated investment grade (Baa/BBB or higher) or the non-rated equivalent as determined by Dreyfus.We may invest up to 5% of the fixed-income portfolio in securities rated below investment grade (but not lower than B) and up to 10% in bonds from foreign issuers.
Markets Advanced Amid Mixed Economic Data
Stocks generally advanced, retreated, and advanced again as investors reacted to conflicting financial headlines. On one hand, accelerating
| The Fund | 3 |
DISCUSSION OF FUND PERFORMANCE (continued)
industrial activity, rising consumer spending and improved corporate earnings indicated that the economic recovery was sustainable. On the other, high unemployment and foreclosure rates, regulatory uncertainty and the European sovereign debt crisis undermined confidence. Nonetheless, the S&P 500 Index ended the reporting period just below its April peak.
Bonds also fared well, as improving business conditions supported gains in higher yielding market sectors, including corporate bonds. U.S. government securities later advanced when the Federal Reserve Board announced a new round of quantitative easing, driving yields of longer-term U.S.Treasury securities lower.
Opportunistic Positioning Emphasized Risk Management
Throughout the reporting period, the markets experienced extreme volatility, making it difficult to adjust the asset mix in order to take advantage of such rapid shifts.We maintained an overweighted position in equities throughout the year.The fund participated in the early year rally; however, the correction, which began in May and ended in late August, hurt the equity component. The resumption of the rally in September benefited the fund both absolutely and relatively; the equity and bond components performed well. We currently expect to keep equity exposure above the benchmark in an effort to take advantage of the continuing rebound in the stock market. Bonds may experience a correction since yields have fallen so low; therefore, we will continue to underweight this component.
In this environment, the fund’s equity portion outperformed its benchmark in seven of 10 economic sectors.The fund scored its best relative performance in the energy sector, where results were bolstered by limited exposure to companies implicated in the oil spill in the Gulf of Mexico. Underweighted exposure to industry giant ExxonMobil also helped when investors questioned the company’s growth prospects. Instead, we emphasized exploration-and-production companies, such as Newfield Exploration, which rose along with oil prices. In addition, oil producer ConocoPhillips enhanced shareholder value by selling non-core assets and repurchasing shares.
In the industrials sector, the fund benefited from holdings with an ample presence in emerging markets. For example, machinery producer Cummins does considerable business in Asia and Latin America, helping to build their industrial infrastructures.The fund’s investments in the materials sector also advanced more strongly than the benchmark, as holdings such as CF Industries Holdings and Freeport McMoRan Copper & Gold benefited from rising corn and precious metals prices, respectively.
On a more negative note, the financials sector was responsible for the greatest drag on relative returns. Several holdings that we believed offered
4
good long-term recovery prospects—such as Bank of America, Morgan Stanley and JPMorgan Chase & Co.—suffered due to regulatory uncertainty and slowing mergers-and-acquisitions activity. In addition, the fund held no real estate investment trusts, which advanced despite our concerns regarding industry fundamentals.
The fund’s bond portfolio particularly benefited from our security selection strategy among mortgage-backed securities, where a focus on higher coupons fared well when prepayment rates proved lower than most analysts’ expectations. Our interest rate strategies also bolstered relative results, as an emphasis on intermediate-term maturities helped the fund participate more fully in an especially strong segment of the market’s maturity spectrum.
Positioned for Further Recovery
As of the end of the reporting period, we have positioned the fund for continued economic recovery through overweighted exposure to consumer discretionary stocks, where we believe media stocks are poised for gains.We have found fewer opportunities in the information technology sector. Among bonds, we have maintained modestly overweighted exposure to higher yielding market sectors, which we expect to attract investors’ attention in a low interest-rate environment.
December 15, 2010
| Please note, the position in any security highlighted in italicized typeface was sold during the | |
| reporting period. | |
| Equity funds are subject generally to market, market sector, market liquidity, issuer and investment | |
| style risks, among other factors, to varying degrees, all of which are more fully described in the | |
| fund’s prospectus. | |
| Bond funds are subject generally to interest rate, credit, liquidity and market risks, to varying | |
| degrees, all of which are more fully described in the fund’s prospectus. Generally, all other factors | |
| being equal, bond prices are inversely related to interest-rate changes, and rate increases can cause | |
| price declines. | |
| 1 | Total return includes reinvestment of dividends and any capital gains paid, and does not take into |
| consideration the maximum initial sales charge in the case of Class A shares, or the applicable | |
| contingent deferred sales charges imposed on redemptions in the case of Class B and Class C | |
| shares. Had these charges been reflected, returns would have been lower. Past performance is no | |
| guarantee of future results. Share price and investment return fluctuate such that upon redemption, | |
| fund shares may be worth more or less than their original cost. Return figures for Class A, B, C | |
| and I shares provided reflect the absorption of certain fund expenses by The Dreyfus Corporation | |
| pursuant to an undertaking in effect through April 1, 2011, at which time it may be extended, | |
| terminated or modified. Had these expenses not been absorbed, Class A, B, C and I returns | |
| would have been lower. | |
| 2 | SOURCE: LIPPER INC. — Reflects reinvestment of dividends and, where applicable, capital |
| gain distributions.The Standard & Poor’s 500 Composite Stock Price Index is a widely accepted, | |
| unmanaged index of U.S. stock market performance.The Barclays Capital U.S.Aggregate Bond | |
| Index is a widely accepted, unmanaged total return index of corporate, U.S. government and U.S. | |
| government agency debt instruments, mortgage-backed securities and asset-backed securities with an | |
| average maturity of 1-10 years. Investors cannot invest directly in any index. |
| The Fund | 5 |
FUND PERFORMANCE
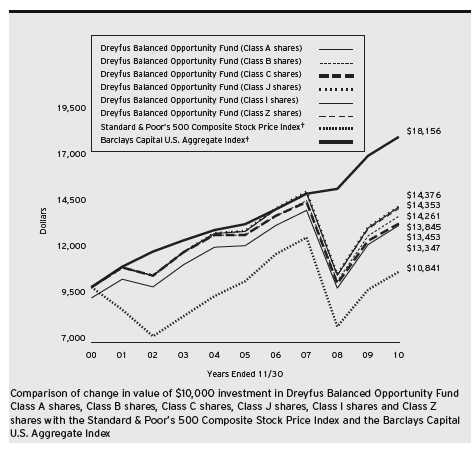
† Source: Lipper Inc.
Past performance is not predictive of future performance.
The above graph compares a $10,000 investment made in Class A, Class B, Class C, Class J, Class I and Class Z shares of Dreyfus Balanced Opportunity Fund on 11/30/00 to a $10,000 investment made in the Standard & Poor’s 500 Composite Stock Price Index (the “S&P 500 Index”) and the Barclays Capital U.S.Aggregate Index (the “Barclays Index”) on that date.All dividends and capital gain distributions are reinvested.
On January 30, 2004, Dreyfus Balanced Opportunity Fund (the “fund”) commenced operations after all of the assets of another mutual fund advised by the fund’s sub-investment adviser were transferred to the fund in exchange for Class J shares of the fund in a tax-free reorganization. Class B, J and Z shares are closed to new investors.The fund offers Class A, C and I shares, which are subject to different sales charges and expenses.The performance figures for Class A, Class B, Class C, Class I and Class Z shares in the line graph above include the performance of the predecessor fund and reflect current sales loads and distribution expenses in effect since the reorganization date.
The fund’s performance shown in the line graph takes into account the maximum initial sales charge on Class A shares and all other applicable fees and expenses on all classes. Performance for Class B shares assumes the conversion of Class B shares to Class A shares at the end of the sixth year following the date of purchase.The S&P 500 Index is a widely accepted, unmanaged index of U.S. stock market performance.The Barclays Index is a widely accepted, unmanaged index of corporate, U.S. government and U.S. government agency debt instruments, mortgage-backed securities, and asset-backed securities with an average maturity of 1-10 years. Unlike a mutual fund, the indices are not subject to charges, fees and other expenses. Investors cannot invest directly in any index. Further information relating to fund performance, including expense reimbursements, if applicable, is contained in the Financial Hi ghlights section of the prospectus and elsewhere in this report.
6
| Average Annual Total Returns as of 11/30/10 | |||
| 1 Year | 5 Years | 10 Years | |
| Class A shares | |||
| with maximum sales charge (5.75%) | 2.16% | 0.52% | 2.93% |
| without sales charge | 8.38% | 1.72% | 3.54% |
| Class B shares | |||
| with applicable redemption charge† | 3.55% | 0.58% | 3.31% |
| without redemption | 7.55% | 0.90% | 3.31% |
| Class C shares | |||
| with applicable redemption charge†† | 6.50% | 0.94% | 3.01% |
| without redemption | 7.50% | 0.94% | 3.01% |
| Class J shares | 8.50% | 1.93% | 3.70% |
| Class I shares | 8.64% | 1.95% | 3.68% |
| Class Z shares | 8.43% | 1.82% | 3.61% |
| Standard & Poor’s 500 | |||
| Composite Stock Price Index | 9.96% | 0.99% | 0.81% |
| Barclays Capital U.S. Aggregate Index | 6.02% | 6.23% | 6.15% |
| Past performance is not predictive of future performance.The fund’s performance shown in the graph and table does not | |
| reflect the deduction of taxes that a shareholder would pay on fund distributions or the redemption of fund shares.The | |
| performance figures for Class A, Class B, Class C, Class I and Class Z shares shown in the table include the | |
| performance of the predecessor fund and reflect current sales loads and distribution expenses in effect since the | |
| reorganization date. | |
| † | The maximum contingent deferred sales charge for Class B shares is 4%.After six years Class B shares convert to |
| Class A shares. | |
| †† | The maximum contingent deferred sales charge for Class C shares is 1% for shares redeemed within one year of the |
| date of purchase. | |
| The Fund | 7 |
UNDERSTANDING YOUR FUND’S EXPENSES (Unaudited)
As a mutual fund investor, you pay ongoing expenses, such as management fees and other expenses. Using the information below, you can estimate how these expenses affect your investment and compare them with the expenses of other funds. You also may pay one-time transaction expenses, including sales charges (loads) and redemption fees, which are not shown in this section and would have resulted in higher total expenses. For more information, see your fund’s prospectus or talk to your financial adviser.
Review your fund’s expenses
The table below shows the expenses you would have paid on a $1,000 investment in Dreyfus Balanced Opportunity Fund from June 1, 2010 to November 30, 2010. It also shows how much a $1,000 investment would be worth at the close of the period, assuming actual returns and expenses.
| Expenses and Value of a $1,000 Investment | |||
| assuming actual returns for the six months ended November 30, 2010 | |||
| Expenses paid | Ending value | ||
| per $1,000† | (after expenses) | ||
| Class A | $ 6.11 | $1,064.80 | |
| Class B | $10.02 | $1,060.60 | |
| Class C | $ 9.97 | $1,061.00 | |
| Class J | $ 5.13 | $1,066.10 | |
| Class I | $ 4.77 | $1,066.10 | |
| Class Z | $ 5.59 | $1,065.80 | |
| † Expenses are equal to the fund’s annualized expense ratio of 1.18% for Class A, 1.94% for Class B, 1.93% for |
| Class C, .99% for Class J, .92% for Class I and 1.08% for Class Z, multiplied by the average account value over |
| the period, multiplied by 183/365 (to reflect the one-half year period). |
8
| COMPARING YOUR FUND’S EXPENSES |
| WITH THOSE OF OTHER FUNDS (Unaudited) |
Using the SEC’s method to compare expenses
The Securities and Exchange Commission (SEC) has established guidelines to help investors assess fund expenses. Per these guidelines, the table below shows your fund’s expenses based on a $1,000 investment, assuming a hypothetical 5% annualized return. You can use this information to compare the ongoing expenses (but not transaction expenses or total cost) of investing in the fund with those of other funds.All mutual fund shareholder reports will provide this information to help you make this comparison. Please note that you cannot use this information to estimate your actual ending account balance and expenses paid during the period.
| Expenses and Value of a $1,000 Investment | ||
| assuming a hypothetical 5% annualized return for the six months ended November 30, 2010 | ||
| Expenses paid | Ending value | |
| per $1,000† | (after expenses) | |
| Class A | $5.97 | $1,019.15 |
| Class B | $9.80 | $1,015.34 |
| Class C | $9.75 | $1,015.39 |
| Class J | $5.01 | $1,020.10 |
| Class I | $4.66 | $1,020.46 |
| Class Z | $5.47 | $1,019.65 |
| † Expenses are equal to the fund’s annualized expense ratio of 1.18% for Class A, 1.94% for Class B, 1.93% for |
| Class C, .99% for Class J, .92% for Class I and 1.08% for Class Z, multiplied by the average account value over |
| the period, multiplied by 183/365 (to reflect the one-half year period). |
| The Fund | 9 |
| STATEMENT OF INVESTMENTS |
| November 30, 2010 |
| Coupon | Maturity | Principal | |||
| Bonds and Notes—28.7% | Rate (%) | Date | Amount ($) | Value ($) | |
| Asset—Backed Certificates—.2% | |||||
| Citicorp Residential Mortgage | |||||
| Securities, Ser. 2006-1, Cl. A3 | 5.71 | 7/25/36 | 165,029 | a | 166,794 |
| CNH Equipment Trust, | |||||
| Ser. 2010-B, Cl. B | 3.12 | 2/15/17 | 395,000 | 393,284 | |
| Morgan Stanley Capital, | |||||
| Ser. 2005-WMC4, Cl. M2 | 0.69 | 4/25/35 | 11,716 | a | 11,707 |
| Securitized Asset Backed | |||||
| Receivables, Ser. 2005-FR2, Cl. M1 | 0.69 | 3/25/35 | 18,471 | a | 18,442 |
| 590,227 | |||||
| Asset-Backed Ctfs./ | |||||
| Auto Receivables—1.0% | |||||
| Ally Auto Receivables Trust, | |||||
| Ser. 2010-1, Cl. B | 3.29 | 3/15/15 | 315,000 | b | 324,592 |
| Americredit Automobile Receivables | |||||
| Trust, Ser. 2010-3, Cl. B | 2.04 | 9/8/15 | 230,000 | 230,109 | |
| Americredit Automobile Receivables | |||||
| Trust, Ser. 2010-1, Cl. B | 3.72 | 11/17/14 | 480,000 | 496,028 | |
| Americredit Automobile Receivables | |||||
| Trust, Ser. 2010-1, Cl. C | 5.19 | 8/17/15 | 275,000 | 288,741 | |
| Americredit Prime Automobile | |||||
| Receivable, Ser. 2007-1, Cl. B | 5.35 | 9/9/13 | 210,000 | 216,459 | |
| Carmax Auto Owner Trust, | |||||
| Ser. 2010-1, Cl. B | 3.75 | 12/15/15 | 75,000 | 77,524 | |
| Ford Credit Auto Owner Trust, | |||||
| Ser. 2010-A, Cl. C | 3.22 | 3/15/16 | 310,000 | 322,193 | |
| Franklin Auto Trust, | |||||
| Ser. 2008-A, Cl. B | 6.10 | 5/20/16 | 235,000 | b | 246,452 |
| Santander Drive Auto Receivables | |||||
| Trust, Ser. 2010-1, Cl. A3 | 1.84 | 11/17/14 | 505,000 | 507,257 | |
| Santander Drive Auto Receivables | |||||
| Trust, Ser. 2010-3, Cl. B | 2.05 | 5/15/15 | 95,000 | 94,983 | |
| Santander Drive Auto Receivables | |||||
| Trust, Ser. 2010-2, Cl. B | 2.24 | 12/15/14 | 100,000 | 100,240 | |
| 2,904,578 | |||||
| Asset-Backed Ctfs./ | |||||
| Home Equity Loans—.2% | |||||
| Ameriquest Mortgage Securities, | |||||
| Ser. 2003-11, Cl. AF6 | 5.14 | 1/25/34 | 125,487 | a | 128,269 |
10
| Coupon | Maturity | Principal | |||
| Bonds and Notes (continued) | Rate (%) | Date | Amount ($) | Value ($) | |
| Asset-Backed Ctfs./ | |||||
| Home Equity Loans (continued) | |||||
| Bear Stearns Asset Backed | |||||
| Securities Trust, | |||||
| Ser. 2005-EC1, Cl. A2 | 0.50 | 11/25/35 | 61,947 | a | 60,758 |
| Bear Stearns Asset Backed | |||||
| Securities Trust, | |||||
| Ser. 2005-HE7, Cl. M1 | 0.77 | 7/25/35 | 235,486 | a | 226,648 |
| Citigroup Mortgage Loan Trust, | |||||
| Ser. 2005-HE1, Cl. M1 | 0.68 | 5/25/35 | 37,847 | a | 37,750 |
| Home Equity Asset Trust, | |||||
| Ser. 2005-2, Cl. M1 | 0.70 | 7/25/35 | 41,785 | a | 41,634 |
| Mastr Asset Backed Securities | |||||
| Trust, Ser. 2006-AM1, Cl. A2 | 0.38 | 1/25/36 | 4,982 | a | 4,927 |
| Residential Asset Securities, | |||||
| Ser. 2005-EMX4, Cl. A2 | 0.51 | 11/25/35 | 179,335 | a | 176,977 |
| 676,963 | |||||
| Commercial Mortgage | |||||
| Pass-Through Ctfs.—2.2% | |||||
| American Tower Trust, | |||||
| Ser. 2007-1A, Cl. AFX | 5.42 | 4/15/37 | 225,000 | b | 246,203 |
| Banc of America Commercial | |||||
| Mortgage, Ser. 2004-6, Cl. A5 | 4.81 | 12/10/42 | 575,000 | 608,532 | |
| Bear Stearns Commercial Mortgage | |||||
| Securities, Ser. 2003-T12, Cl. A3 | 4.24 | 8/13/39 | 335,935 | a | 340,516 |
| Bear Stearns Commercial Mortgage | |||||
| Securities, Ser. 2007-T26, Cl. A4 | 5.47 | 1/12/45 | 335,000 | a | 362,008 |
| Bear Stearns Commercial Mortgage | |||||
| Securities, Ser. 2006-T22, Cl. A4 | 5.68 | 4/12/38 | 275,000 | a | 301,752 |
| Bear Stearns Commercial Mortgage | |||||
| Securities, Ser. 2007-PW17, Cl. AAB | 5.70 | 6/11/50 | 275,000 | 295,161 | |
| Bear Stearns Commercial Mortgage | |||||
| Securities, Ser. 2007-T28, Cl. A4 | 5.74 | 9/11/42 | 175,000 | a | 189,834 |
| Commercial Mortgage Pass-Through | |||||
| Certificates, Ser. 2010-C1, Cl. B | 5.24 | 7/10/46 | 180,000 | a,b | 180,471 |
| Commercial Mortgage Pass-Through | |||||
| Certificates, Ser. 2010-C1, Cl. C | 5.78 | 7/10/46 | 125,000 | a,b | 125,933 |
| Extended Stay America Trust, | |||||
| Ser. 2010-ESHA, Cl. A | 2.95 | 11/5/27 | 455,000 | b | 454,364 |
| The Fund | 11 |
STATEMENT OF INVESTMENTS (continued)
| Coupon | Maturity | Principal | |||
| Bonds and Notes (continued) | Rate (%) | Date | Amount ($) | Value ($) | |
| Commercial Mortgage | |||||
| Pass-Through Ctfs. (continued) | |||||
| First Union National Bank | |||||
| Commercial Mortgage, | |||||
| Ser. 2001-C2, Cl. A2 | 6.66 | 1/12/43 | 48,313 | 48,435 | |
| GS Mortgage Securities Corporation | |||||
| II, Ser. 2007-EOP, Cl. E | 0.69 | 3/6/20 | 560,000 | a,b | 503,190 |
| JP Morgan Chase Commercial | |||||
| Mortgage Securities, | |||||
| Ser. 2006-CB14, Cl. ASB | 5.51 | 12/12/44 | 139,470 | a | 146,664 |
| JP Morgan Chase Commercial | |||||
| Mortgage Securities, | |||||
| Ser. 2009-IWST, Cl. B | 7.15 | 12/5/27 | 100,000 | b | 116,225 |
| JP Morgan Chase Commercial | |||||
| Mortgage Securities, | |||||
| Ser. 2009-IWST, Cl. C | 7.45 | 12/5/27 | 435,000 | a,b | 488,630 |
| JP Morgan Chase Commercial | |||||
| Mortgage Securities, | |||||
| Ser. 2010-CNTR, Cl. B | 5.02 | 8/5/32 | 790,000 | b | 763,931 |
| Merrill Lynch Mortgage Trust, | |||||
| Ser. 2005-CKI1, Cl. A2 | 5.39 | 11/12/37 | 21,904 | a | 21,999 |
| RBSCF Trust, | |||||
| Ser. 2010-MB1, Cl. B | 4.79 | 4/15/24 | 480,000 | a,b | 508,358 |
| RBSCF Trust, | |||||
| Ser. 2010-MB1, Cl. C | 4.82 | 4/15/24 | 125,000 | a,b | 128,509 |
| TIAA Seasoned Commercial Mortgage | |||||
| Trust, Ser. 2007-C4, Cl. A3 | 6.05 | 8/15/39 | 415,000 | a | 457,556 |
| Vornado, | |||||
| Ser. 2010-VN0, Cl. B | 4.74 | 9/13/28 | 150,000 | b | 150,154 |
| Wachovia Bank Commercial Mortgage | |||||
| Trust, Ser. 2005-C16, Cl. A2 | 4.38 | 10/15/41 | 21,490 | 21,984 | |
| 6,460,409 | |||||
| Consumer Staples—.4% | |||||
| Altria Group, | |||||
| Gtd. Notes | 9.70 | 11/10/18 | 320,000 | 430,955 | |
| Anheuser-Busch InBev Worldwide, | |||||
| Gtd. Notes | 8.20 | 1/15/39 | 145,000 | b | 204,861 |
| Anheuser-Busch, | |||||
| Gtd. Notes | 5.05 | 10/15/16 | 90,000 | 100,392 | |
| Diageo Capital, | |||||
| Gtd. Bonds | 4.83 | 7/15/20 | 195,000 | 214,306 |
12
| Coupon | Maturity | Principal | |||
| Bonds and Notes (continued) | Rate (%) | Date | Amount ($) | Value ($) | |
| Consumer Staples (continued) | |||||
| Kraft Foods, | |||||
| Sr. Unscd. Notes | 6.88 | 2/1/38 | 180,000 | 215,395 | |
| 1,165,909 | |||||
| Diversified Financial | |||||
| Services—2.2% | |||||
| American Express Credit, | |||||
| Sr. Unscd. Notes | 5.13 | 8/25/14 | 195,000 | 212,285 | |
| American Express Credit, | |||||
| Sr. Unscd. Notes, Ser. C | 7.30 | 8/20/13 | 230,000 | 260,526 | |
| Ameriprise Financial, | |||||
| Sr. Unscd. Notes | 5.30 | 3/15/20 | 75,000 | 81,184 | |
| Bank of America, | |||||
| Sr. Unscd. Notes | 5.63 | 7/1/20 | 695,000 | 699,981 | |
| Bank of America, | |||||
| Sr. Unscd. Notes | 7.38 | 5/15/14 | 390,000 | 436,111 | |
| Capital One Bank USA, | |||||
| Sub. Notes | 8.80 | 7/15/19 | 250,000 | 311,661 | |
| Capital One Financial, | |||||
| Sr. Unscd. Notes | 6.75 | 9/15/17 | 185,000 | 217,114 | |
| Citigroup, | |||||
| Sr. Unscd. Notes | 5.38 | 8/9/20 | 145,000 | 148,628 | |
| Citigroup, | |||||
| Sr. Unscd. Notes | 5.50 | 4/11/13 | 200,000 | 214,498 | |
| Citigroup, | |||||
| Sr. Unscd. Notes | 6.13 | 5/15/18 | 405,000 | 442,388 | |
| Citigroup, | |||||
| Unscd. Notes | 8.50 | 5/22/19 | 200,000 | 245,286 | |
| Credit Suisse, | |||||
| Sub. Notes | 5.40 | 1/14/20 | 205,000 | 213,007 | |
| ERAC USA Finance, | |||||
| Gtd. Notes | 5.60 | 5/1/15 | 90,000 | b | 100,453 |
| ERAC USA Finance, | |||||
| Gtd. Notes | 6.38 | 10/15/17 | 90,000 | b | 102,974 |
| ERAC USA Finance, | |||||
| Gtd. Notes | 7.00 | 10/15/37 | 300,000 | b | 330,228 |
| General Electric Capital, | |||||
| Sr. Unscd. Notes | 4.38 | 9/21/15 | 395,000 | 420,027 | |
| Harley-Davidson Funding, | |||||
| Gtd. Notes | 5.75 | 12/15/14 | 475,000 | b | 506,802 |
| The Fund | 13 |
STATEMENT OF INVESTMENTS (continued)
| Coupon | Maturity | Principal | |||
| Bonds and Notes (continued) | Rate (%) | Date | Amount ($) | Value ($) | |
| Diversified Financial | |||||
| Services (continued) | |||||
| JPMorgan Chase & Co., | |||||
| Sr. Unscd. Notes | 6.00 | 1/15/18 | 285,000 | 321,756 | |
| Morgan Stanley, | |||||
| Sr. Unscd. Notes | 5.30 | 3/1/13 | 30,000 | 32,223 | |
| Morgan Stanley, | |||||
| Sr. Unscd. Notes | 5.50 | 1/26/20 | 335,000 | 338,115 | |
| Morgan Stanley, | |||||
| Sr. Unscd. Notes | 6.60 | 4/1/12 | 95,000 | 101,666 | |
| Pearson Dollar Finance Two, | |||||
| Gtd. Notes | 6.25 | 5/6/18 | 220,000 | b | 251,976 |
| UBS AG/Stamford, | |||||
| Sr. Unscd. Notes | 4.88 | 8/4/20 | 250,000 | 259,827 | |
| Wells Fargo & Co., | |||||
| Sr. Unscd. Notes | 5.63 | 12/11/17 | 325,000 | 364,901 | |
| 6,613,617 | |||||
| Foreign/Governmental—.4% | |||||
| Province of Quebec Canada, | |||||
| Unscd. Notes | 4.60 | 5/26/15 | 85,000 | 95,442 | |
| Republic of Korea, | |||||
| Sr. Unscd. Notes | 7.13 | 4/16/19 | 100,000 | 123,036 | |
| Republic of Peru, | |||||
| Sr. Unscd. Bonds | 6.55 | 3/14/37 | 445,000 | 509,525 | |
| Russia Foreign Bond, | |||||
| Sr. Unscd. Bonds | 5.00 | 4/29/20 | 480,000 | b,c | 480,960 |
| 1,208,963 | |||||
| Industrial—.3% | |||||
| Allied Waste North America, | |||||
| Gtd. Notes, Ser. B | 7.13 | 5/15/16 | 80,000 | 84,996 | |
| Hutchison Whampoa International, | |||||
| Gtd. Notes | 5.75 | 9/11/19 | 305,000 | b | 332,704 |
| Hutchison Whampoa International, | |||||
| Gtd. Notes | 7.63 | 4/9/19 | 100,000 | b | 121,427 |
| Republic Services, | |||||
| Gtd. Notes | 5.50 | 9/15/19 | 115,000 | 129,021 | |
| Waste Management, | |||||
| Gtd. Notes | 7.38 | 5/15/29 | 170,000 | 198,060 | |
| 866,208 |
14
| Coupon | Maturity | Principal | ||
| Bonds and Notes (continued) | Rate (%) | Date | Amount ($) | Value ($) |
| Insurance—.8% | ||||
| ACE INA Holdings, | ||||
| Gtd. Notes | 5.80 | 3/15/18 | 45,000 | 50,866 |
| Allstate, | ||||
| Sr. Unscd. Debs. | 6.75 | 5/15/18 | 220,000 | 257,168 |
| AON, | ||||
| Sr. Unscd. Notes | 3.50 | 9/30/15 | 165,000 | 167,583 |
| Cincinnati Financial, | ||||
| Sr. Unscd. Notes | 6.13 | 11/1/34 | 37,000 | 35,610 |
| Cincinnati Financial, | ||||
| Sr. Unscd. Debs | 6.92 | 5/15/28 | 159,000 | 167,101 |
| Lincoln National, | ||||
| Sr. Unscd. Notes | 8.75 | 7/1/19 | 205,000 | 258,693 |
| MetLife, | ||||
| Sr. Unscd. Notes | 7.72 | 2/15/19 | 180,000 | 223,952 |
| Principal Financial Group, | ||||
| Gtd. Notes | 8.88 | 5/15/19 | 205,000 | 263,865 |
| Prudential Financial, | ||||
| Sr. Unscd. Notes | 4.75 | 9/17/15 | 260,000 | 281,439 |
| Willis North America, | ||||
| Gtd. Notes | 6.20 | 3/28/17 | 215,000 | 227,680 |
| Willis North America, | ||||
| Gtd. Notes | 7.00 | 9/29/19 | 245,000 | 264,616 |
| 2,198,573 | ||||
| Materials—.3% | ||||
| Arcelormittal, | ||||
| Sr. Unscd. Notes | 5.25 | 8/5/20 | 240,000 | 238,187 |
| Dow Chemical, | ||||
| Sr. Unscd. Notes | 4.25 | 11/15/20 | 110,000 | 107,723 |
| Teck Resources, | ||||
| Sr. Scd. Notes | 10.75 | 5/15/19 | 390,000 | 507,753 |
| 853,663 | ||||
| Media & | ||||
| Telecommunications—1.3% | ||||
| AT&T, | ||||
| Sr. Unscd. Notes | 6.55 | 2/15/39 | 355,000 | 392,823 |
| CBS, | ||||
| Gtd. Notes | 5.90 | 10/15/40 | 65,000 | 62,143 |
| The Fund | 15 |
STATEMENT OF INVESTMENTS (continued)
| Coupon | Maturity | Principal | |||
| Bonds and Notes (continued) | Rate (%) | Date | Amount ($) | Value ($) | |
| Media & | |||||
| Telecommunications (continued) | |||||
| Cellco Partnership/Verizon | |||||
| Wireless Capital, Sr. Unscd. Notes | 5.55 | 2/1/14 | 180,000 | 201,012 | |
| Comcast, | |||||
| Gtd. Notes | 6.30 | 11/15/17 | 80,000 | 94,414 | |
| Comcast, | |||||
| Gtd. Notes | 6.50 | 11/15/35 | 135,000 | 146,081 | |
| Cox Communications, | |||||
| Sr. Unscd. Notes | 6.25 | 6/1/18 | 355,000 | b | 408,489 |
| DirecTV Holdings, | |||||
| Gtd. Notes | 6.00 | 8/15/40 | 370,000 | 368,486 | |
| NBC Universal, | |||||
| Sr. Unscd. Notes | 5.15 | 4/30/20 | 240,000 | b | 256,694 |
| News America, | |||||
| Gtd. Notes | 6.65 | 11/15/37 | 435,000 | 486,681 | |
| Reed Elsevier Capital, | |||||
| Gtd. Notes | 8.63 | 1/15/19 | 240,000 | 313,063 | |
| Telecom Italia Capital, | |||||
| Gtd. Notes | 5.25 | 11/15/13 | 410,000 | 433,735 | |
| Time Warner Cable, | |||||
| Gtd. Notes | 5.85 | 5/1/17 | 265,000 | 303,093 | |
| Time Warner, | |||||
| Gtd. Notes | 5.88 | 11/15/16 | 276,000 | 318,323 | |
| Verizon Communications, | |||||
| Sr. Unscd. Notes | 6.35 | 4/1/19 | 70,000 | 83,908 | |
| 3,868,945 | |||||
| Municipal Bonds—.6% | |||||
| California, | |||||
| GO (Build America Bonds) | |||||
| (Various Purpose) | 7.55 | 4/1/39 | 255,000 | 262,859 | |
| Chicago Transit Authority, | |||||
| Sales Tax Receipts Revenue | |||||
| (Build America Bonds) | 6.20 | 12/1/40 | 315,000 | 291,293 | |
| Illinois, | |||||
| GO | 4.42 | 1/1/15 | 270,000 | 281,035 | |
| Los Angeles Department of Water | |||||
| and Power, Revenue (Build | |||||
| America Bonds) | 5.72 | 7/1/39 | 120,000 | 112,579 | |
| Los Angeles Unified School | |||||
| District, GO (Build America Bonds) | 6.76 | 7/1/34 | 215,000 | 224,445 |
16
| Coupon | Maturity | Principal | ||
| Bonds and Notes (continued) | Rate (%) | Date | Amount ($) | Value ($) |
| Municipal Bonds (continued) | ||||
| Metropolitan Transportation | ||||
| Authority, Dedicated Tax Fund | �� | |||
| Revenue (Build America Bonds) | 6.09 | 11/15/40 | 10,000 | 9,895 |
| Metropolitan Transportation | ||||
| Authority, Revenue (Build | ||||
| America Bonds) | 6.55 | 11/15/31 | 225,000 | 225,920 |
| New Jersey Transportation Trust | ||||
| Fund Authority, (Transportation | ||||
| System) (Build America Bonds) | 6.56 | 12/15/40 | 230,000 | 233,363 |
| New York City, | ||||
| GO (Build America Bonds) | 5.99 | 12/1/36 | 250,000 | 247,238 |
| 1,888,627 | ||||
| Office And Business Equipment—.1% | ||||
| Xerox, | ||||
| Sr. Unscd. Notes | 5.50 | 5/15/12 | 75,000 | 79,302 |
| Xerox, | ||||
| Sr. Unscd. Notes | 5.65 | 5/15/13 | 105,000 | 114,307 |
| 193,609 | ||||
| Oil & Gas—.5% | ||||
| EQT, | ||||
| Sr. Unscd. Notes | 8.13 | 6/1/19 | 225,000 | 271,966 |
| Husky Energy, | ||||
| Sr. Unscd. Notes | 7.25 | 12/15/19 | 125,000 | 151,213 |
| Kinder Morgan Energy Partners, | ||||
| Sr. Unscd. Notes | 6.85 | 2/15/20 | 315,000 | 370,626 |
| Marathon Oil, | ||||
| Sr. Unscd. Notes | 7.50 | 2/15/19 | 76,000 | 96,694 |
| Pemex Project Funding Master | ||||
| Trust, Gtd. Bonds | 6.63 | 6/15/35 | 215,000 | 225,730 |
| Plains All American Pipeline, | ||||
| Gtd. Notes | 5.75 | 1/15/20 | 245,000 | 266,440 |
| Valero Energy, | ||||
| Sr. Unscd. Notes | 6.13 | 2/1/20 | 130,000 | 140,879 |
| 1,523,548 | ||||
| Real Estate—.8% | ||||
| Boston Properties, | ||||
| Sr. Unscd. Notes | 5.63 | 4/15/15 | 245,000 | 272,392 |
| Duke Realty, | ||||
| Sr. Unscd. Notes | 6.75 | 3/15/20 | 45,000 | 50,071 |
| The Fund | 17 |
STATEMENT OF INVESTMENTS (continued)
| Coupon | Maturity | Principal | |||
| Bonds and Notes (continued) | Rate (%) | Date | Amount ($) | Value ($) | |
| Real Estate (continued) | |||||
| Duke Realty, | |||||
| Sr. Unscd. Notes | 8.25 | 8/15/19 | 195,000 | 234,404 | |
| ERP Operating, | |||||
| Sr. Unscd. Notes | 5.75 | 6/15/17 | 100,000 | 111,908 | |
| Federal Realty Investment Trust, | |||||
| Sr. Unscd. Bonds | 5.65 | 6/1/16 | 260,000 | 287,227 | |
| Healthcare Realty Trust, | |||||
| Sr. Unscd. Notes | 5.13 | 4/1/14 | 255,000 | 270,762 | |
| Liberty Property, | |||||
| Sr. Unscd. Notes | 5.50 | 12/15/16 | 135,000 | 149,327 | |
| Mack-Cali Realty, | |||||
| Sr. Unscd. Notes | 5.25 | 1/15/12 | 100,000 | 102,932 | |
| Regency Centers, | |||||
| Gtd. Notes | 5.88 | 6/15/17 | 205,000 | 225,421 | |
| Simon Property Group, | |||||
| Sr. Unscd. Notes | 6.75 | 2/1/40 | 224,000 | 259,176 | |
| WEA Finance, | |||||
| Gtd. Notes | 7.13 | 4/15/18 | 295,000 | b | 345,497 |
| 2,309,117 | |||||
| Residential Mortgage | |||||
| Pass-Through Ctfs.—.1% | |||||
| CS First Boston Mortgage | |||||
| Securities, Ser. 2005-6, Cl. 1A2 | 0.52 | 7/25/35 | 157,786 | a | 149,087 |
| Retail—.3% | |||||
| Autozone, | |||||
| Sr. Unscd. Notes | 5.75 | 1/15/15 | 225,000 | 252,446 | |
| CVS Pass-Through Trust, | |||||
| Pass Thru Certificates | 8.35 | 7/10/31 | 215,025 | b | 265,907 |
| Home Depot, | |||||
| Sr. Unscd. Notes | 5.88 | 12/16/36 | 212,000 | 222,778 | |
| Staples, | |||||
| Gtd. Notes | 9.75 | 1/15/14 | 170,000 | 208,750 | |
| 949,881 | |||||
| U.S. Government Agencies—.9% | |||||
| Federal Home Loan Mortgage Corp., | |||||
| Notes | 4.88 | 6/13/18 | 855,000 | d | 986,712 |
| Federal National Mortgage | |||||
| Association, Notes | 1.63 | 10/26/15 | 1,590,000 | c,d | 1,589,960 |
| 2,576,672 |
18
| Coupon | Maturity | Principal | ||
| Bonds and Notes (continued) | Rate (%) | Date | Amount ($) | Value ($) |
| U.S. Government Agencies/ | ||||
| Mortgage-Backed—9.9% | ||||
| Federal Home Loan Mortgage Corp.: | ||||
| 4.50%, 2/1/39—2/1/40 | 1,489,307 d | 1,556,848 | ||
| 5.00%, 1/1/23—8/1/39 | 4,034,737 d | 4,294,064 | ||
| 5.50%, 4/1/22—7/1/40 | 5,123,067 d | 5,505,326 | ||
| 6.00%, 3/1/38 | 374,224 d | 406,264 | ||
| Federal National Mortgage Association: | ||||
| 4.50%, 2/1/38—2/1/39 | 2,789,097 d | 2,907,407 | ||
| 5.00%, 8/1/20—4/1/40 | 6,542,504 d | 7,002,248 | ||
| 5.50%, 9/1/34—7/1/40 | 5,649,004 d | 6,094,917 | ||
| 6.00%, 5/1/22—5/1/39 | 1,198,601 d | 1,313,292 | ||
| 8.00%, 3/1/30 | 143 d | 168 | ||
| Government National Mortgage Association I: | ||||
| 5.50%, 4/15/33 | 127,800 | 139,726 | ||
| 29,220,260 | ||||
| U.S. Government Securities—5.3% | ||||
| U.S. Treasury Bonds: | ||||
| 3.88%, 8/15/40 | 715,000 | 687,071 | ||
| 4.25%, 5/15/39 | 86,000 | 88,311 | ||
| 5.00%, 5/15/37 | 770,000 | 896,449 | ||
| 5.25%, 11/15/28 | 365,000 | 438,399 | ||
| U.S. Treasury Notes: | ||||
| 1.00%, 7/31/11 | 100,000 | 100,516 | ||
| 1.38%, 9/15/12 | 8,425,000 | 8,566,186 | ||
| 1.88%, 8/31/17 | 970,000 | 957,724 | ||
| 2.38%, 8/31/14 | 620,000 | 651,291 | ||
| 2.63%, 8/15/20 | 1,870,000 | 1,849,254 | ||
| 2.75%, 5/31/17 | 1,400,000 | 1,464,968 | ||
| 15,700,169 | ||||
| Utilities—.9% | ||||
| Consolidated Edison of NY, | ||||
| Sr. Unscd. Debs., Ser. 07-A | 6.30 | 8/15/37 | 370,000 | 429,603 |
| Consumers Energy, | ||||
| First Mortgage Bonds | 6.70 | 9/15/19 | 200,000 | 245,304 |
| Duke Energy Carolinas, | ||||
| First Mortgage Bonds | 5.25 | 1/15/18 | 95,000 | 108,603 |
| Enel Finance International, | ||||
| Gtd. Notes | 5.70 | 1/15/13 | 185,000 b | 198,881 |
| Exelon Generation, | ||||
| Sr. Unscd. Notes | 4.00 | 10/1/20 | 210,000 | 205,478 |
| The Fund | 19 |
STATEMENT OF INVESTMENTS (continued)
| Coupon | Maturity | Principal | ||
| Bonds and Notes (continued) | Rate (%) | Date | Amount ($) | Value ($) |
| Utilities (continued) | ||||
| National Grid, | ||||
| Sr. Unscd. Notes | 6.30 | 8/1/16 | 223,000 | 261,194 |
| Nevada Power, | ||||
| Mortgage Notes | 6.50 | 8/1/18 | 270,000 | 322,601 |
| Nevada Power, | ||||
| Mortgage Notes, Ser. R | 6.75 | 7/1/37 | 55,000 | 64,464 |
| NiSource Finance, | ||||
| Gtd. Notes | 6.40 | 3/15/18 | 230,000 | 262,454 |
| Potomac Electric Power, | ||||
| First Mortgage Bonds | 6.50 | 11/15/37 | 200,000 | 236,511 |
| Sierra Pacific Power, | ||||
| Mortgage Notes, Ser. P | 6.75 | 7/1/37 | 25,000 | 29,030 |
| Virginia Electric & Power, | ||||
| Sr. Unscd. Notes | 5.40 | 4/30/18 | 205,000 | 236,430 |
| 2,600,553 | ||||
| Total Bonds and Notes | ||||
| (cost $81,062,003) | 84,519,578 | |||
| Common Stocks—70.8% | Shares | Value ($) | ||
| Consumer Discretionary—10.0% | ||||
| Abercrombie & Fitch, Cl. A | 10,290 | 517,072 | ||
| Amazon.com | 8,280 e | 1,452,312 | ||
| Autoliv | 11,410 | 837,722 | ||
| Carnival | 48,843 | 2,017,704 | ||
| CBS, Cl. B | 40,050 | 674,442 | ||
| DIRECTV, Cl. A | 34,050 e | 1,414,097 | ||
| Guess? | 10,850 | 512,663 | ||
| Home Depot | 72,457 | 2,188,926 | ||
| Johnson Controls | 42,860 | 1,561,818 | ||
| Lowe’s | 19,680 | 446,736 | ||
| Mattel | 75,970 | 1,963,065 | ||
| Newell Rubbermaid | 155,490 | 2,607,567 | ||
| News, Cl. A | 225,060 | 3,069,818 | ||
| NVR | 620 e | 384,388 | ||
| Omnicom Group | 72,220 | 3,281,677 | ||
| Staples | 22,220 | 489,062 | ||
| Target | 43,430 | 2,472,904 | ||
20
| Common Stocks (continued) | Shares | Value ($) | |
| Consumer Discretionary (continued) | |||
| Time Warner | 68,513 | 2,020,448 | |
| Toll Brothers | 23,750 e | 426,313 | |
| Viacom, Cl. B | 18,700 | 707,421 | |
| Whirlpool | 4,410 | 321,930 | |
| 29,368,085 | |||
| Consumer Staples—5.4% | |||
| Clorox | 10,110 | 624,899 | |
| CVS Caremark | 45,791 | 1,419,521 | |
| Dr. Pepper Snapple Group | 26,060 | 954,578 | |
| Energizer Holdings | 28,190 | e | 1,984,294 |
| Nestle, ADR | 25,600 | 1,401,088 | |
| PepsiCo | 69,655 | 4,501,803 | |
| Philip Morris International | 49,955 | 2,841,940 | |
| Unilever, ADR | 76,930 | 2,150,963 | |
| 15,879,086 | |||
| Energy—10.7% | |||
| Alpha Natural Resources | 19,170 e | 950,065 | |
| Anadarko Petroleum | 40,690 | 2,610,670 | |
| Apache | 10,610 | 1,142,060 | |
| Cameron International | 32,040 | e | 1,541,444 |
| Chevron | 34,164 | 2,766,259 | |
| ENSCO, ADR | 22,900 | 1,085,460 | |
| EOG Resources | 29,870 | 2,656,937 | |
| Exxon Mobil | 10,720 | 745,683 | |
| Halliburton | 53,900 | 2,039,576 | |
| Hess | 40,032 | 2,804,242 | |
| Newfield Exploration | 20,760 | e | 1,387,391 |
| Occidental Petroleum | 76,700 | 6,762,639 | |
| Peabody Energy | 4,830 | 284,052 | |
| QEP Resources | 27,140 | 953,428 | |
| Schlumberger | 39,490 | 3,054,157 | |
| Valero Energy | 35,940 | 700,111 | |
| 31,484,174 | |||
| Exchange Traded Funds—.6% | |||
| Standard & Poor’s Depository | |||
| Receipts S&P 500 ETF Trust | 15,620 | 1,850,814 | |
| The Fund | 21 |
STATEMENT OF INVESTMENTS (continued)
| Common Stocks (continued) | Shares | Value ($) |
| Financial—13.3% | ||
| American Express | 54,720 | 2,364,998 |
| Ameriprise Financial | 21,450 | 1,111,968 |
| AON | 17,720 | 710,926 |
| Bank of America | 360,070 | 3,942,766 |
| Capital One Financial | 51,290 | 1,909,527 |
| Citigroup | 239,250 e | 1,004,850 |
| Comerica | 53,780 | 1,962,432 |
| Fidelity National Financial, Cl. A | 25,160 | 339,660 |
| Franklin Resources | 11,550 | 1,317,740 |
| Genworth Financial, Cl. A | 134,780 e | 1,571,535 |
| Goldman Sachs Group | 11,690 | 1,825,277 |
| Huntington Bancshares | 147,720 | 861,946 |
| JPMorgan Chase & Co. | 157,364 | 5,882,266 |
| Lincoln National | 46,130 | 1,101,584 |
| Marsh & McLennan | 27,990 | 701,989 |
| MetLife | 69,707 | 2,659,322 |
| Morgan Stanley | 57,850 | 1,415,011 |
| PNC Financial Services Group | 11,980 | 645,123 |
| Prudential Financial | 17,680 | 896,022 |
| State Street | 11,240 | 485,568 |
| SunTrust Banks | 40,660 | 949,818 |
| TD Ameritrade Holding | 42,290 | 707,935 |
| Wells Fargo & Co. | 174,162 | 4,738,948 |
| 39,107,211 | ||
| Health Care—7.9% | ||
| AmerisourceBergen | 74,100 | 2,285,985 |
| Amgen | 12,950 e | 682,335 |
| Amylin Pharmaceuticals | 63,090 e | 808,498 |
| Baxter International | 9,170 | 445,204 |
| CIGNA | 54,450 | 2,004,305 |
| Covidien | 15,751 | 662,645 |
| Dendreon | 14,080 e | 503,219 |
| Emergency Medical Services, Cl. A | 10,640 e | 527,106 |
| Gilead Sciences | 22,890 e | 835,485 |
| Hospira | 14,480 e | 814,645 |
| Human Genome Sciences | 47,430 c,e | 1,163,458 |
22
| Common Stocks (continued) | Shares | Value ($) | |
| Health Care (continued) | |||
| McKesson | 11,280 | 720,792 | |
| Merck & Co. | 54,580 | 1,881,373 | |
| Pfizer | 372,247 | 6,063,904 | |
| St. Jude Medical | 13,780 | e | 533,148 |
| Thermo Fisher Scientific | 8,570 e | 435,870 | |
| UnitedHealth Group | 33,110 | 1,209,177 | |
| Universal Health Services, Cl. B | 12,380 | 509,066 | |
| Zimmer Holdings | 23,430 | e | 1,154,162 |
| 23,240,377 | |||
| Industrial—8.2% | |||
| Caterpillar | 36,830 | 3,115,818 | |
| Cummins | 19,090 | 1,854,021 | |
| Dover | 56,363 | 3,089,256 | |
| Eaton | 7,230 | 696,972 | |
| Ford Motor | 67,500 e | 1,075,950 | |
| General Electric | 178,340 | 2,823,122 | |
| General Motors | 23,984 | 820,253 | |
| Honeywell International | 10,100 | 502,071 | |
| Ingersoll-Rand | 36,520 | 1,497,320 | |
| Norfolk Southern | 27,680 | 1,665,506 | |
| Paccar | 9,540 | 513,824 | |
| Pitney Bowes | 48,770 | 1,070,014 | |
| Raytheon | 26,220 | 1,212,675 | |
| Stanley Black & Decker | 9,520 | 566,726 | |
| Textron | 42,320 | 946,275 | |
| Thomas & Betts | 13,550 e | 602,298 | |
| Tyco International | 17,235 | 653,034 | |
| Union Pacific | 7,453 | 671,590 | |
| United Technologies | 9,210 | 693,237 | |
| 24,069,962 | |||
| Information Technology—10.0% | |||
| Allscripts Healthcare Solutions | 44,320 | e | 777,816 |
| AOL | 34,803 e | 841,537 | |
| Apple | 14,081 e | 4,381,303 | |
| BMC Software | 37,780 e | 1,677,432 | |
| Cisco Systems | 79,328 e | 1,519,924 | |
| The Fund | 23 |
STATEMENT OF INVESTMENTS (continued)
| Common Stocks (continued) | Shares | Value ($) |
| Information Technology (continued) | ||
| Cypress Semiconductor | 38,190 e | 598,437 |
| eBay | 24,070 e | 701,159 |
| EMC | 47,270 e | 1,015,832 |
| F5 Networks | 7,200 e | 949,536 |
| Google, Cl. A | 3,610 e | 2,006,113 |
| Informatica | 29,810 e | 1,230,557 |
| International Business Machines | 11,490 | 1,625,375 |
| Microsoft | 83,840 | 2,113,606 |
| NetApp | 15,300 e | 779,229 |
| Oracle | 109,940 | 2,972,778 |
| QUALCOMM | 78,960 | 3,690,590 |
| Teradata | 28,878 e | 1,186,597 |
| Western Digital | 38,980 e | 1,305,830 |
| 29,373,651 | ||
| Materials—1.9% | ||
| Air Products & Chemicals | 5,820 | 501,800 |
| CF Industries Holdings | 4,370 | 527,765 |
| Dow Chemical | 29,720 | 926,670 |
| E.I. du Pont de Nemours & Co. | 27,960 | 1,313,840 |
| Freeport-McMoRan Copper & Gold | 18,080 | 1,831,866 |
| International Paper | 19,850 | 495,655 |
| 5,597,596 | ||
| Telecommunication Services—1.2% | ||
| AT&T | 102,604 | 2,851,365 |
| Motorola | 79,760 e | 610,962 |
| 3,462,327 | ||
| Utilities—1.6% | ||
| American Electric Power | 18,350 | 653,260 |
| Entergy | 20,240 | 1,441,898 |
| NextEra Energy | 25,070 | 1,269,043 |
| Public Service Enterprise Group | 41,780 | 1,288,077 |
| Questar | 16,300 | 270,743 |
| 4,923,021 | ||
| Total Common Stocks | ||
| (cost $205,116,963) | 208,356,304 |
24
| Other Investment—.5% | Shares | Value ($) |
| Registered Investment Company; | ||
| Dreyfus Institutional Preferred | ||
| Plus Money Market Fund | ||
| (cost $1,427,000) | 1,427,000 f | 1,427,000 |
| Investment of Cash Collateral | ||
| for Securities Loaned—.5% | ||
| Registered Investment Company; | ||
| Dreyfus Institutional Cash | ||
| Advantage Plus Fund | ||
| (cost $1,574,381) | 1,574,381 f | 1,574,381 |
| Total Investments (cost $289,180,347) | 100.5% | 295,877,263 |
| Liabilities, Less Cash and Receivables | (.5%) | (1,486,814) |
| Net Assets | 100.0% | 294,390,449 |
| ADR—American Depository Receipts |
| GO—General Obligation |
| a Variable rate security—interest rate subject to periodic change. |
| b Securities exempt from registration under Rule 144A of the Securities Act of 1933.These securities may be resold in |
| transactions exempt from registration, normally to qualified institutional buyers.At November 30, 2010, these |
| securities had a market value of $8,144,865 or 2.8% of net assets. |
| c Security, or portion thereof, on loan.At November 30, 2010, the market value of the fund’s securities on loan was |
| $3,048,749 and the market value of the collateral held by the fund was $3,125,562, consisting of cash collateral of |
| $1,574,381 and U.S. Government and Agency securities valued at $1,551,181. |
| d The Federal Housing Finance Agency (“FHFA”) placed Federal Home Loan Mortgage Corporation and Federal |
| National Mortgage Association into conservatorship with FHFA as the conservator.As such, the FHFA oversees the |
| continuing affairs of these companies. |
| e Non-income producing security. |
| f Investment in affiliated money market mutual fund. |
| Portfolio Summary (Unaudited)† | |||
| Value (%) | Value (%) | ||
| Common Stocks | 70.2 | Exchange Traded Funds | .6 |
| U.S. Government & Agencies | 16.1 | Municipal Bonds | .6 |
| Corporate Bonds | 7.9 | Foreign/Governmental | .4 |
| Asset/Mortgage-Backed | 3.7 | ||
| Money Market Investments | 1.0 | 100.5 | |
| † Based on net assets. | |||
| See notes to financial statements. | |||
The Fund 25
| STATEMENT OF ASSETS AND LIABILITIES |
| November 30, 2010 |
| Cost�� | Value | |
| Assets ($): | ||
| Investments in securities—See Statement of Investments (including | ||
| securities on loan, valued at $3,048,749)—Note 1(c): | ||
| Unaffiliated issuers | 286,178,966 | 292,875,882 |
| Affiliated issuers | 3,001,381 | 3,001,381 |
| Cash | 1,626 | |
| Cash denominated in foreign currencies | 2,835 | 2,849 |
| Dividends and interest receivable | 1,065,066 | |
| Receivable for investment securities sold | 229,728 | |
| Receivable for shares of Beneficial Interest subscribed | 53,674 | |
| Prepaid expenses | 44,144 | |
| 297,274,350 | ||
| Liabilities ($): | ||
| Due to The Dreyfus Corporation and affiliates—Note 3(c) | 304,494 | |
| Liability for securities on loan—Note 1(c) | 1,574,381 | |
| Payable for shares of Beneficial Interest redeemed | 587,482 | |
| Payable for investment securities purchased | 239,198 | |
| Accrued expenses | 178,346 | |
| 2,883,901 | ||
| Net Assets ($) | 294,390,449 | |
| Composition of Net Assets ($): | ||
| Paid-in capital | 347,679,078 | |
| Accumulated undistributed investment income—net | 2,933,524 | |
| Accumulated net realized gain (loss) on investments | (62,919,083) | |
| Accumulated net unrealized appreciation (depreciation) | ||
| on investments and foreign currency transactions | 6,696,930 | |
| Net Assets ($) | 294,390,449 |
26
| Net Asset Value Per Share | |
| Class A | |
| Net Assets ($) | 143,377,904 |
| Shares Outstanding | 8,995,570 |
| Net Asset Value Per Share ($) | 15.94 |
| Class B | |
| Net Assets ($) | 36,171,007 |
| Shares Outstanding | 2,296,280 |
| Net Asset Value Per Share ($) | 15.75 |
| Class C | |
| Net Assets ($) | 44,683,163 |
| Shares Outstanding | 2,820,953 |
| Net Asset Value Per Share ($) | 15.84 |
| Class J | |
| Net Assets ($) | 23,766,656 |
| Shares Outstanding | 1,489,323 |
| Net Asset Value Per Share ($) | 15.96 |
| Class I | |
| Net Assets ($) | 2,468,104 |
| Shares Outstanding | 154,540 |
| Net Asset Value Per Share ($) | 15.97 |
| Class Z | |
| Net Assets ($) | 43,923,615 |
| Shares Outstanding | 2,766,470 |
| Net Asset Value Per Share ($) | 15.88 |
| See notes to financial statements. | |
| The Fund | 27 |
| STATEMENT OF OPERATIONS |
| Year Ended November 30, 2010 |
| Investment Income ($): | |
| Income: | |
| Interest | 4,128,987 |
| Cash dividends (net of $6,226 foreign taxes withheld at source): | |
| Unaffiliated issuers | 3,502,466 |
| Affiliated issuers | 4,703 |
| Income from securities lending—Note 1(c) | 4,289 |
| Total Income | 7,640,445 |
| Expenses: | |
| Management fee—Note 3(a) | 2,459,597 |
| Shareholder servicing costs—Note 3(c) | 1,198,189 |
| Distribution fees—Note 3(b) | 817,519 |
| Professional fees | 95,715 |
| Custodian fees—Note 3(c) | 59,221 |
| Registration fees | 52,104 |
| Prospectus and shareholders’ reports | 30,365 |
| Trustees’ fees and expenses—Note 3(d) | 18,442 |
| Loan commitment fees—Note 2 | 5,789 |
| Miscellaneous | 69,045 |
| Total Expenses | 4,805,986 |
| Less—reduction in expenses due to undertaking—Note 3(a) | (484,265) |
| Less—reduction in fees due to earnings credits—Note 3(c) | (1,998) |
| Net Expenses | 4,319,723 |
| Investment Income—Net | 3,320,722 |
| Realized and Unrealized Gain (Loss) on Investments—Note 4 ($): | |
| Net realized gain (loss) on investments | 19,974,118 |
| Net unrealized appreciation (depreciation) on | |
| investments and foreign currency transactions | 542,656 |
| Net Realized and Unrealized Gain (Loss) on Investments | 20,516,774 |
| Net Increase in Net Assets Resulting from Operations | 23,837,496 |
| See notes to financial statements. | |
28
STATEMENT OF CHANGES IN NET ASSETS
| Year Ended November 30, | ||
| 2010 | 2009a | |
| Operations ($): | ||
| Investment income—net | 3,320,722 | 4,819,901 |
| Net realized gain (loss) on investments | 19,974,118 | (32,124,527) |
| Net unrealized appreciation | ||
| (depreciation) on investments | 542,656 | 89,739,117 |
| Net Increase (Decrease) in Net Assets | ||
| Resulting from Operations | 23,837,496 | 62,434,491 |
| Dividends to Shareholders from ($): | ||
| Investment income—net: | ||
| Class A Shares | (1,933,037) | (2,187,886) |
| Class B Shares | (812,208) | (1,608,902) |
| Class C Shares | (486,398) | (899,829) |
| Class J Shares | (419,235) | (935,416) |
| Class I Shares | (38,535) | (9,419) |
| Class T Shares | — | (21,466) |
| Class Z Shares | (811,855) | (1,488,886) |
| Total Dividends | (4,501,268) | (7,151,804) |
| Beneficial Interest Transactions ($): | ||
| Net proceeds from shares sold: | ||
| Class A Shares | 48,129,536 | 8,909,143 |
| Class B Shares | 276,189 | 401,373 |
| Class C Shares | 1,246,370 | 1,593,852 |
| Class J Shares | 969,318 | 1,310,842 |
| Class I Shares | 1,490,455 | 363,223 |
| Class T Shares | — | 68,864 |
| Class Z Shares | 1,798,155 | 1,727,033 |
| Net assets received in connection | ||
| with reorganization—Note 1 | — | 50,352,911 |
| The Fund | 29 |
STATEMENT OF CHANGES IN NET ASSETS (continued)
| Year Ended November 30, | ||
| 2010 | 2009a | |
| Beneficial Interest Transactions ($) (continued): | ||
| Dividends reinvested: | ||
| Class A Shares | 1,768,600 | 2,058,923 |
| Class B Shares | 749,750 | 1,484,399 |
| Class C Shares | 399,359 | 747,018 |
| Class J Shares | 405,493 | 884,898 |
| Class I Shares | 34,206 | 9,388 |
| Class T Shares | — | 16,832 |
| Class Z Shares | 786,174 | 1,445,592 |
| Cost of shares redeemed: | ||
| Class A Shares | (30,211,949) | (30,230,746) |
| Class B Shares | (51,409,276) | (16,513,654) |
| Class C Shares | (10,075,853) | (9,972,776) |
| Class J Shares | (4,994,048) | (7,880,750) |
| Class I Shares | (1,279,778) | (399,446) |
| Class T Shares | — | (946,369) |
| Class Z Shares | (9,068,795) | (8,289,202) |
| Increase (Decrease) in Net Assets from | ||
| Beneficial Interest Transactions | (48,986,094) | (2,858,652) |
| Total Increase (Decrease) in Net Assets | (29,649,866) | 52,424,035 |
| Net Assets ($): | ||
| Beginning of Period | 324,040,315 | 271,616,280 |
| End of Period | 294,390,449 | 324,040,315 |
| Undistributed investment income—net | 2,933,524 | 3,960,143 |
30
| Year Ended November 30, | ||
| 2010 | 2009a | |
| Capital Share Transactions: | ||
| Class Ab,c | ||
| Shares sold | 3,128,506 | 687,943 |
| Shares issued in connection with reorganization—Note 1 | — | 3,334,487 |
| Shares issued for dividends reinvested | 118,937 | 166,310 |
| Shares redeemed | (1,967,187) | (2,365,065) |
| Net Increase (Decrease) in Shares Outstanding | 1,280,256 | 1,823,675 |
| Class Bb | ||
| Shares sold | 18,417 | 28,285 |
| Shares issued in connection with reorganization—Note 1 | — | 191,471 |
| Shares issued for dividends reinvested | 50,693 | 120,204 |
| Shares redeemed | (3,377,454) | (1,305,262) |
| Net Increase (Decrease) in Shares Outstanding | (3,308,344) | (965,302) |
| Class C | ||
| Shares sold | 82,562 | 117,168 |
| Shares issued in connection with reorganization—Note 1 | — | 391,069 |
| Shares issued for dividends reinvested | 26,839 | 60,191 |
| Shares redeemed | (661,117) | (768,887) |
| Net Increase (Decrease) in Shares Outstanding | (551,716) | (200,459) |
| Class J | ||
| Shares sold | 63,290 | 103,149 |
| Shares issued for dividends reinvested | 27,288 | 71,420 |
| Shares redeemed | (328,771) | (617,798) |
| Net Increase (Decrease) in Shares Outstanding | (238,193) | (443,229) |
| The Fund | 31 |
STATEMENT OF CHANGES IN NET ASSETS (continued)
| Year Ended November 30, | ||
| 2010 | 2009a | |
| Capital Share Transactions (continued): | ||
| Class I | ||
| Shares sold | 96,931 | 26,494 |
| Shares issued in connection with reorganization—Note 1 | — | 123,934 |
| Shares issued for dividends reinvested | 2,302 | 760 |
| Shares redeemed | (86,834) | (31,052) |
| Net Increase (Decrease) in Shares Outstanding | 12,399 | 120,136 |
| Class Tc | ||
| Shares sold | — | 5,469 |
| Shares issued in connection with reorganization—Note 1 | — | 7,023 |
| Shares issued for dividends reinvested | — | 1,356 |
| Shares redeemed | — | (81,189) |
| Net Increase (Decrease) in Shares Outstanding | — | (67,341) |
| Class Z | ||
| Shares sold | 117,774 | 136,555 |
| Shares issued for dividends reinvested | 53,120 | 117,124 |
| Shares redeemed | (594,165) | (656,137) |
| Net Increase (Decrease) in Shares Outstanding | (423,271) | (402,458) |
| a | Effective as of the close of business on February 4, 2009, the fund no longer offers Class T shares. |
| b | During the period ended November 30, 2010, 1,039,824 Class B shares representing $15,761,167 were |
| automatically converted to 1,029,756 Class A shares and during the period ended November 30, 2009, 143,541 | |
| Class B shares representing $1,794,416 were automatically converted to 142,492 Class A shares. | |
| c | On the close of business on February 4, 2009, 74,880 Class T shares representing $869,506 were converted to |
| 74,957 Class A shares. | |
| See notes to financial statements. | |
32
FINANCIAL HIGHLIGHTS
The following tables describe the performance for each share class for the fiscal periods indicated.All information (except portfolio turnover rate) reflects financial results for a single fund share.Total return shows how much your investment in the fund would have increased (or decreased) during each period, assuming you had reinvested all dividends and distributions.These figures have been derived from the fund’s financial statements.
| Year Ended November 30, | |||||
| Class A Shares | 2010 | 2009 | 2008 | 2007 | 2006 |
| Per Share Data ($): | |||||
| Net asset value, beginning of period | 14.96 | 12.47 | 21.28 | 20.38 | 19.15 |
| Investment Operations: | |||||
| Investment income—neta | .21 | .25 | .34 | .33 | .28 |
| Net realized and unrealized | |||||
| gain (loss) on investments | 1.03 | 2.62 | (5.62) | .89 | 1.40 |
| Total from Investment Operations | 1.24 | 2.87 | (5.28) | 1.22 | 1.68 |
| Distributions: | |||||
| Dividends from investment income—net | (.26) | (.38) | (.39) | (.32) | (.29) |
| Dividends from net realized | |||||
| gain on investments | — | — | (3.14) | — | (.16) |
| Total Distributions | (.26) | (.38) | (3.53) | (.32) | (.45) |
| Net asset value, end of period | 15.94 | 14.96 | 12.47 | 21.28 | 20.38 |
| Total Return (%)b | 8.38 | 23.77 | (29.77) | 6.08 | 8.96 |
| Ratios/Supplemental Data (%): | |||||
| Ratio of total expenses | |||||
| to average net assets | 1.37 | 1.45 | 1.29 | 1.23 | 1.21 |
| Ratio of net expenses | |||||
| to average net assets | 1.16 | 1.12 | 1.18 | 1.16 | 1.21 |
| Ratio of net investment income | |||||
| to average net assets | 1.33 | 1.89 | 2.04 | 1.57 | 1.44 |
| Portfolio Turnover Rate | 103.49 | 134.74 | 138.66 | 168.94c | 33.30 |
| Net Assets, end of period ($ x 1,000) | 143,378 | 115,445 | 73,441 | 151,796 | 215,342 |
| a | Based on average shares outstanding at each month end. |
| b | Exclusive of sales charge. |
| c | The portfolio turnover rate excluding mortgage dollar roll transactions for the period ended November 30, 2007 |
| was 162.34%. | |
| See notes to financial statements. | |
The Fund 33
FINANCIAL HIGHLIGHTS (continued)
| Year Ended November 30, | |||||
| Class B Shares | 2010 | 2009 | 2008 | 2007 | 2006 |
| Per Share Data ($): | |||||
| Net asset value, beginning of period | 14.79 | 12.31 | 21.04 | 20.14 | 18.94 |
| Investment Operations: | |||||
| Investment income—neta | .08 | .15 | .21 | .17 | .12 |
| Net realized and unrealized | |||||
| gain (loss) on investments | 1.03 | 2.58 | (5.57) | .89 | 1.40 |
| Total from Investment Operations | 1.11 | 2.73 | (5.36) | 1.06 | 1.52 |
| Distributions: | |||||
| Dividends from investment income—net | (.15) | (.25) | (.23) | (.16) | (.16) |
| Dividends from net realized | |||||
| gain on investments | — | — | (3.14) | — | (.16) |
| Total Distributions | (.15) | (.25) | (3.37) | (.16) | (.32) |
| Net asset value, end of period | 15.75 | 14.79 | 12.31 | 21.04 | 20.14 |
| Total Return (%)b | 7.55 | 22.58 | (30.31) | 5.30 | 8.11 |
| Ratios/Supplemental Data (%): | |||||
| Ratio of total expenses | |||||
| to average net assets | 2.13 | 2.20 | 2.05 | 2.02 | 2.01 |
| Ratio of net expenses | |||||
| to average net assets | 1.90 | 1.89 | 1.95 | 1.94 | 2.01 |
| Ratio of net investment income | |||||
| to average net assets | .57 | 1.16 | 1.28 | .81 | .65 |
| Portfolio Turnover Rate | 103.49 | 134.74 | 138.66 | 168.94c | 33.30 |
| Net Assets, end of period ($ x 1,000) | 36,171 | 82,906 | 80,893 | 147,807 | 169,513 |
| a | Based on average shares outstanding at each month end. |
| b | Exclusive of sales charge. |
| c | The portfolio turnover rate excluding mortgage dollar roll transactions for the period ended November 30, 2007 |
| was 162.34%. | |
| See notes to financial statements. | |
34
| Year Ended November 30, | |||||
| Class C Shares | 2010 | 2009 | 2008 | 2007 | 2006 |
| Per Share Data ($): | |||||
| Net asset value, beginning of period | 14.88 | 12.38 | 21.10 | 20.19 | 18.98 |
| Investment Operations: | |||||
| Investment income—neta | .09 | .15 | .22 | .17 | .13 |
| Net realized and unrealized | |||||
| gain (loss) on investments | 1.02 | 2.61 | (5.59) | .89 | 1.40 |
| Total from Investment Operations | 1.11 | 2.76 | (5.37) | 1.06 | 1.53 |
| Distributions: | |||||
| Dividends from investment income—net | (.15) | (.26) | (.21) | (.15) | (.16) |
| Dividends from net realized | |||||
| gain on investments | — | — | (3.14) | — | (.16) |
| Total Distributions | (.15) | (.26) | (3.35) | (.15) | (.32) |
| Net asset value, end of period | 15.84 | 14.88 | 12.38 | 21.10 | 20.19 |
| Total Return (%)b | 7.50 | 22.68 | (30.22) | 5.29 | 8.14 |
| Ratios/Supplemental Data (%): | |||||
| Ratio of total expenses | |||||
| to average net assets | 2.05 | 2.12 | 2.01 | 1.97 | 1.95 |
| Ratio of net expenses | |||||
| to average net assets | 1.91 | 1.88 | 1.90 | 1.90 | 1.95 |
| Ratio of net investment income | |||||
| to average net assets | .58 | 1.16 | 1.32 | .84 | .70 |
| Portfolio Turnover Rate | 103.49 | 134.74 | 138.66 | 168.94c | 33.30 |
| Net Assets, end of period ($ x 1,000) | 44,683 | 50,170 | 44,224 | 85,801 | 119,851 |
| a | Based on average shares outstanding at each month end. |
| b | Exclusive of sales charge. |
| c | The portfolio turnover rate excluding mortgage dollar roll transactions for the period ended November 30, 2007 |
| was 162.34%. | |
| See notes to financial statements. | |
| The Fund | 35 |
FINANCIAL HIGHLIGHTS (continued)
| Year Ended November 30, | |||||
| Class J Shares | 2010 | 2009 | 2008 | 2007 | 2006 |
| Per Share Data ($): | |||||
| Net asset value, beginning of period | 14.97 | 12.52 | 21.38 | 20.47 | 19.22 |
| Investment Operations: | |||||
| Investment income—neta | .22 | .26 | .40 | .36 | .33 |
| Net realized and unrealized | |||||
| gain (loss) on investments | 1.03 | 2.63 | (5.65) | .93 | 1.41 |
| Total from Investment Operations | 1.25 | 2.89 | (5.25) | 1.29 | 1.74 |
| Distributions: | |||||
| Dividends from investment income—net | (.26) | (.44) | (.47) | (.38) | (.33) |
| Dividends from net realized | |||||
| gain on investments | — | — | (3.14) | — | (.16) |
| Total Distributions | (.26) | (.44) | (3.61) | (.38) | (.49) |
| Net asset value, end of period | 15.96 | 14.97 | 12.52 | 21.38 | 20.47 |
| Total Return (%) | 8.50 | 23.81 | (29.53) | 6.41 | 9.25 |
| Ratios/Supplemental Data (%): | |||||
| Ratio of total expenses | |||||
| to average net assets | 1.02 | 1.06 | .99 | .91 | .96 |
| Ratio of net expenses | |||||
| to average net assets | 1.02 | 1.05 | .88 | .87 | .96 |
| Ratio of net investment income | |||||
| to average net assets | 1.46 | 1.99 | 2.34 | 1.77 | 1.69 |
| Portfolio Turnover Rate | 103.49 | 134.74 | 138.66 | 168.94b | 33.30 |
| Net Assets, end of period ($ x 1,000) | 23,767 | 25,858 | 27,178 | 54,149 | 174,820 |
| a | Based on average shares outstanding at each month end. |
| b | The portfolio turnover rate excluding mortgage dollar roll transactions for the period ended November 30, 2007 |
| was 162.34%. | |
| See notes to financial statements. | |
36
| Year Ended November 30, | |||||
| Class I Shares | 2010 | 2009 | 2008 | 2007a | 2006 |
| Per Share Data ($): | |||||
| Net asset value, beginning of period | 14.97 | 12.47 | 21.28 | 20.39 | 19.17 |
| Investment Operations: | |||||
| Investment income—netb | .24 | .36 | .37 | .36 | .31 |
| Net realized and unrealized | |||||
| gain (loss) on investments | 1.03 | 2.56 | (5.61) | .89 | 1.40 |
| Total from Investment Operations | 1.27 | 2.92 | (5.24) | 1.25 | 1.71 |
| Distributions: | |||||
| Dividends from investment income—net | (.27) | (.42) | (.43) | (.36) | (.33) |
| Dividends from net realized | |||||
| gain on investments | — | — | (3.14) | — | (.16) |
| Total Distributions | (.27) | (.42) | (3.57) | (.36) | (.49) |
| Net asset value, end of period | 15.97 | 14.97 | 12.47 | 21.28 | 20.39 |
| Total Return (%) | 8.64 | 24.15 | (29.57) | 6.23 | 9.12 |
| Ratios/Supplemental Data (%): | |||||
| Ratio of total expenses | |||||
| to average net assets | 1.04 | 1.20 | 1.07 | 1.12 | 1.07 |
| Ratio of net expenses | |||||
| to average net assets | .90 | .85 | .96 | 1.04 | 1.07 |
| Ratio of net investment income | |||||
| to average net assets | 1.58 | 2.63 | 2.25 | 1.72 | 1.59 |
| Portfolio Turnover Rate | 103.49 | 134.74 | 138.66 | 168.94c | 33.30 |
| Net Assets, end of period ($ x 1,000) | 2,468 | 2,128 | 274 | 711 | 741 |
| a | Effective June 1, 2007, Class R shares were redesignated as Class I shares. |
| b | Based on average shares outstanding at each month end. |
| c | The portfolio turnover rate excluding mortgage dollar roll transactions for the period ended November 30, 2007 |
| was 162.34%. | |
| See notes to financial statements. | |
| The Fund | 37 |
FINANCIAL HIGHLIGHTS (continued)
| Year Ended November 30, | |||||
| Class Z Shares | 2010 | 2009 | 2008 | 2007 | 2006 |
| Per Share Data ($): | |||||
| Net asset value, beginning of period | 14.90 | 12.46 | 21.30 | 20.39 | 19.16 |
| Investment Operations: | |||||
| Investment income—neta | .21 | .24 | .37 | .38 | .30 |
| Net realized and unrealized | |||||
| gain (loss) on investments | 1.03 | 2.62 | (5.61) | .89 | 1.41 |
| Total from Investment Operations | 1.24 | 2.86 | (5.24) | 1.27 | 1.71 |
| Distributions: | |||||
| Dividends from investment income—net | (.26) | (.42) | (.46) | (.36) | (.32) |
| Dividends from net realized | |||||
| gain on investments | — | — | (3.14) | — | (.16) |
| Total Distributions | (.26) | (.42) | (3.60) | (.36) | (.48) |
| Net asset value, end of period | 15.88 | 14.90 | 12.46 | 21.30 | 20.39 |
| Total Return (%) | 8.43 | 23.63 | (29.61) | 6.31 | 9.11 |
| Ratios/Supplemental Data (%): | |||||
| Ratio of total expenses | |||||
| to average net assets | 1.12 | 1.18 | 1.09 | 1.12 | 1.15 |
| Ratio of net expenses | |||||
| to average net assets | 1.12 | 1.16 | .98 | .93 | 1.07 |
| Ratio of net investment income | |||||
| to average net assets | 1.37 | 1.88 | 2.24 | 1.83 | 1.58 |
| Portfolio Turnover Rate | 103.49 | 134.74 | 138.66 | 168.94b | 33.30 |
| Net Assets, end of period ($ x 1,000) | 43,924 | 47,532 | 44,768 | 76,939 | 85,923 |
| a | Based on average shares outstanding at each month end. |
| b | The portfolio turnover rate excluding mortgage dollar roll transactions for the period ended November 30, 2007 |
| was 162.34%. | |
| See notes to financial statements. | |
38
NOTES TO FINANCIAL STATEMENTS
NOTE 1—Significant Accounting Policies:
Dreyfus Balanced Opportunity Fund (the “fund”) is the sole series of Dreyfus Manager Funds II (the “Company”), which is registered under the Investment Company Act of 1940, as amended (the “Act”), as a diversified open-end management investment company. The fund’s investment objective is to seek a high total return through a combination of capital appreciation and current income.The Dreyfus Corporation (the “Manager” or “Dreyfus”), a wholly-owned subsidiary of The Bank of New York Mellon Corporation (“BNY Mellon”), serves as the fund’s investment adviser.
As of the close of business on January 8, 2009, pursuant to an Agreement and Plan of Reorganization previously approved by the fund’s Board of Trustees, all of the assets, subject to liabilities, of Dreyfus Balanced Fund (“Dreyfus Balanced”) were transferred to the fund in exchange for corresponding class of shares of Beneficial Interest of the fund of equal value. Shareholders of Class A, Class B, Class C, Class I and ClassT shares of Dreyfus Balanced received Class A, Class B, Class C, Class I and Class T shares of the fund, respectively, in each case in an amount equal to the aggregate net asset value of their investment in Dreyfus Balanced at the time of the exchange. The net asset value of the fund’s shares on the close of business January 8, 2009, after the reorganization was $12.44 for Class A, $12.40 for Class B, $12.46 for Class C, $12.40 for Class I and $12.46 for ClassT shares, and a total of 3,334,487 Class A shares, 191,471 Class B shares, 391,069 Class C shares, 123,934 Class I shares and 7,023 Class T shares, representing net assets of $50,352,911 (including $11,965,047 net unrealized depreciation on investments) were issued to shareholders of Dreyfus Balanced in the exchange.The exchange was a tax-free event to the Dreyfus Balanced shareholders.
MBSC Securities Corporation (the “Distributor”), a wholly-owned subsidiary of the Manager, is the distributor of the fund’s shares. The fund is authorized to issue an unlimited number of $.001 par value
| The Fund | 39 |
NOTES TO FINANCIAL STATEMENTS (continued)
shares of Beneficial Interest in each of the following classes of shares: Class A, Class B, Class C, Class J, Class I and Class Z shares. Class A shares are subject to a sales charge imposed at the time of purchase. Class B shares are subject to a contingent deferred sales charge (“CDSC”) imposed on Class B share redemptions made within six years of purchase and automatically convert to Class A shares after six years.The fund no longer offers Class B shares, except in connection with dividend reinvestment and permitted exchanges of Class B shares. Class C shares are subject to a CDSC imposed on Class C shares redeemed within one year of purchase. Class J, Class I and Class Z shares are sold at net asset value per share. Class I shares are sold only to institutional investors and Class J and Class Z shares are closed to new investors. Other differences between the classes include the services offered to a nd the expenses borne by each class, the allocation of certain transfer agency costs and certain voting rights. Income, expenses (other than expenses attributable to a specific class), and realized and unrealized gains or losses on investments are allocated to each class of shares based on its relative net assets.
The Financial Accounting Standards Board (“FASB”) Accounting Standards Codification (“ASC”) is the exclusive reference of authoritative U.S. generally accepted accounting principles (“GAAP”) recognized by the FASB to be applied by nongovernmental entities. Rules and interpretive releases of the Securities and Exchange Commission (“SEC”) under authority of federal laws are also sources of authoritative GAAP for SEC registrants. The fund’s financial statements are prepared in accordance with GAAP, which may require the use of management estimates and assumptions.Actual results could differ from those estimates.
The Company enters into contracts that contain a variety of indemnifications.The fund’s maximum exposure under these arrangements is unknown.The fund does not anticipate recognizing any loss related to these arrangements.
(a) Portfolio valuation: Investments in securities are valued at the last sales price on the securities exchange or national securities market on which such securities are primarily traded. Securities listed on the
40
National Market System for which market quotations are available are valued at the official closing price or, if there is no official closing price that day, at the last sales price. Securities not listed on an exchange or the national securities market, or securities for which there were no transactions, are valued at the average of the most recent bid and asked prices, except for open short positions, where the asked price is used for valuation purposes. Bid price is used when no asked price is available. Registered investment companies that are not traded on an exchange are valued at their net asset value.When market quotations or official closing prices are not readily available, or are determined not to reflect accurately fair value, such as when the value of a security has been significantly affected by events after the close of the exchange or market on which the security is principally traded (for example, a foreign exchange or market), but before the fund calculates its net asset value, the fund may value these investments at fair value as determined in accordance with the procedures approved by the Board of Trustees. Fair valuing of securities may be determined with the assistance of a pricing service using calculations based on indices of domestic securities and other appropriate indicators, such as prices of relevant ADRs and futures contracts. For other securities that are fair valued by the Board of Trustees, certain factors may be considered such as: fundamental analytical data, the nature and duration of restrictions on disposition, an evaluation of the forces that influence the market in which the securities are purchased and sold and public trading in similar securities of the issuer or comparable issuers. Investments denominated in foreign currencies are translated to U.S. dollars at the prevailing rates of exchange.
Investments in debt securities excluding short-term investments (other than U.S.Treasury Bills) are valued each business day by an independent pricing service (the “Service”) approved by the Board of Trustees. Investments for which quoted bid prices are readily available and are representative of the bid side of the market in the judgment of the Service are valued at the mean between the quoted bid prices (as obtained by the
| The Fund | 41 |
NOTES TO FINANCIAL STATEMENTS (continued)
Service from dealers in such securities) and asked prices (as calculated by the Service based upon its evaluation of the market for such securities). Other investments are valued as determined by the Service, based on methods which include consideration of: yields or prices of securities of comparable quality, coupon, maturity and type; indications as to values from dealers; and general market conditions. Restricted securities, as well as securities or other assets for which recent market quotations are not readily available and are not valued by a pricing service approved by the Board ofTrustees, or are determined by the fund not to reflect accurately fair value, are valued at fair value as determined in good faith under the direction of the Board of Trustees. The factors that may be considered when fair valuing a security include fundamental analytical data, the nature and duration of restrictions on disposition , an evaluation of the forces that influence the market in which the securities are purchased and sold and public trading in similar securities of the issuer or comparable issuers. Short-term investments, excluding U.S.Treasury Bills, are carried at amortized cost, which approximates value.
The fair value of a financial instrument is the amount that would be received to sell an asset or paid to transfer a liability in an orderly transaction between market participants at the measurement date (i.e. the exit price). GAAP establishes a fair value hierarchy that prioritizes the inputs of valuation techniques used to measure fair value.This hierarchy gives the highest priority to unadjusted quoted prices in active markets for identical assets or liabilities (Level 1 measurements) and the lowest priority to unobservable inputs (Level 3 measurements).
Additionally, GAAP provides guidance on determining whether the volume and activity in a market has decreased significantly and whether such a decrease in activity results in transactions that are not orderly. GAAP requires enhanced disclosures around valuation inputs and techniques used during annual and interim periods.
42
Various inputs are used in determining the value of the fund’s investments relating to fair value measurements.These inputs are summarized in the three broad levels listed below:
Level 1—unadjusted quoted prices in active markets for identical investments.
Level 2—other significant observable inputs (including quoted prices for similar investments, interest rates, prepayment speeds, credit risk, etc.).
Level 3—significant unobservable inputs (including the fund’s own assumptions in determining the fair value of investments).
The inputs or methodology used for valuing securities are not necessarily an indication of the risk associated with investing in those securities.
The following is a summary of the inputs used as of November 30, 2010 in valuing the fund’s investments:
| Level 2—Other | Level 3— | |||
| Level 1— | Significant | Significant | ||
| Unadjusted | Observable | Unobservable | ||
| Quoted Prices | Inputs | Inputs | Total | |
| Assets ($) | ||||
| Investments in Securities: | ||||
| Asset-Backed | — | 4,171,768 | — | 4,171,768 |
| Commercial | ||||
| Mortgage-Backed | — | 6,460,409 | — | 6,460,409 |
| Corporate Bonds† | — | 23,143,623 | — | 23,143,623 |
| Equity Securities— | ||||
| Domestic† | 201,030,257 | — | — | 201,030,257 |
| Equity Securities— | ||||
| Foreign† | 5,475,233 | — | — | 5,475,233 |
| Foreign Government | — | 1,208,963 | — | 1,208,963 |
| Municipal Bonds | — | 1,888,627 | — | 1,888,627 |
| The Fund | 43 |
NOTES TO FINANCIAL STATEMENTS (continued)
| Level 2—Other | Level 3— | |||
| Level 1— | Significant | Significant | ||
| Unadjusted | Observable | Unobservable | ||
| Quoted Prices | Inputs | Inputs | Total | |
| Assets ($) (continued) | ||||
| Mutual Funds/ | ||||
| Exchange Traded | ||||
| Funds | 4,852,195 | — | — | 4,852,195 |
| Residential | ||||
| Mortgage-Backed | — | 149,087 | — | 149,087 |
| U.S. Government | ||||
| Agencies/ | ||||
| Mortgage-Backed | — | 31,796,932 | — | 31,796,932 |
| U.S. Treasury | — | 15,700,169 | — | 15,700,169 |
† See Statement of Investments for industry classification.
In January 2010, FASB issued Accounting Standards Update (“ASU”) No. 2010-06 “Improving Disclosures about FairValue Measurements”. The portions of ASU No. 2010-06 which require reporting entities to prepare new disclosures surrounding amounts and reasons for significant transfers in and out of Level 1 and Level 2 fair value measurements as well as inputs and valuation techniques used to measure fair value for both recurring and nonrecurring fair value measurements that fall in either Level 2 or Level 3 have been adopted by the fund. No significant transfers between Level 1 or Level 2 fair value measurements occurred at November 30, 2010. The remaining portion of ASU No. 2010-06 requires reporting entities to make new disclosures about information on purchases, sales, issuances and settlements on a gross basis in the reconciliation of activity in Level 3 fair value measurements. These new and re vised disclosures are required to be implemented for fiscal years beginning after December 15, 2010. Management is currently evaluating the impact that the adoption of this remaining portion of ASU No. 2010-06 may have on the fund’s financial statement disclosures.
(b) Foreign currency transactions: The fund does not isolate that portion of the results of operations resulting from changes in foreign exchange rates on investments from the fluctuations arising from changes in market prices of securities held. Such fluctuations are included with the net realized and unrealized gain or loss on investments.
44
Net realized foreign exchange gains or losses arise from sales of foreign currencies, currency gains or losses realized on securities transactions between trade and settlement date, and the difference between the amounts of dividends, interest and foreign withholding taxes recorded on the fund’s books and the U.S. dollar equivalent of the amounts actually received or paid. Net unrealized foreign exchange gains and losses arise from changes in the value of assets and liabilities other than investments resulting from changes in exchange rates. Foreign currency gains and losses on investments are included with net realized and unrealized gain or loss on investments.
(c) Securities transactions and investment income: Securities transactions are recorded on a trade date basis. Realized gains and losses from securities transactions are recorded on the identified cost basis. Dividend income is recognized on the ex-dividend date and interest income, including, where applicable, accretion of discount and amortization of premium on investments, is recognized on the accrual basis.
Pursuant to a securities lending agreement withThe Bank of NewYork Mellon, a subsidiary of BNY Mellon and an affiliate of Dreyfus, the fund may lend securities to qualified institutions. It is the fund’s policy that, at origination, all loans are secured by collateral of at least 102% of the value of U.S. securities loaned and 105% of the value of foreign securities loaned. Collateral equivalent to at least 100% of the market value of securities on loan is maintained at all times. Collateral is either in the form of cash, which can be invested in certain money market mutual funds managed by the Manager, U.S. Government and Agency securities or letters of credit.The fund is entitled to receive all income on securities loaned, in addition to income earned as a result of the lending transaction. Although each security loaned is fully collateralized, the fund bears the risk of delay in recovery of, or loss of rig hts in, the securities loaned should a borrower fail to return the securities in a timely manner. During the period ended November 30, 2010, The Bank of New York Mellon earned $1,838 from lending portfolio securities, pursuant to the securities lending agreement.
| The Fund | 45 |
NOTES TO FINANCIAL STATEMENTS (continued)
(d) Affiliated issuers: Investments in other investment companies advised by Dreyfus are defined as “affiliated” in the Act.
The fund may invest in shares of certain affiliated investment companies also advised or managed by Dreyfus. Investments in affiliated investment companies for the period ended November 30, 2010 were as follows:
| Affiliated | |||||
| Investment | Value | Value | Net | ||
| Company | 11/30/2009 ($) | Purchases ($) | Sales ($) | 11/30/2010 ($) | Assets (%) |
| Dreyfus | |||||
| Institutional | |||||
| Preferred | |||||
| Plus Money | |||||
| Market Fund | 656,000 | 80,542,000 | 79,771,000 | 1,427,000 | .5 |
| Dreyfus | |||||
| Institutional | |||||
| Cash | |||||
| Advantage | |||||
| Plus Fund | — | 68,197,470 | 66,623,089 | 1,574,381 | .5 |
| Total | 656,000 | 148,739,470 | 146,394,089 | 3,001,381 | 1.0 |
(e) Dividends to shareholders: Dividends are recorded on the ex-dividend date. Dividends from investment income-net and dividends from net realized capital gains, if any, are normally declared and paid annually, but the fund may make distributions on a more frequent basis to comply with the distribution requirements of the Internal Revenue Code of 1986, as amended (the “Code”).To the extent that net realized capital gains can be offset by capital loss carryovers, it is the policy of the fund not to distribute such gains. Income and capital gain distributions are determined in accordance with income tax regulations, which may differ from GAAP.
(f) Federal income taxes: It is the policy of the fund to continue to qualify as a regulated investment company, if such qualification is in the best interests of its shareholders, by complying with the applicable provisions of the Code, and to make distributions of taxable income sufficient to relieve it from substantially all federal income and excise taxes.
As of and during the period ended November 30, 2010, the fund did not have any liabilities for any uncertain tax positions.The fund recognizes interest and penalties, if any, related to uncertain tax positions
46
as income tax expense in the Statement of Operations. During the period, the fund did not incur any interest or penalties.
Each of the tax years in the four-year period ended November 30, 2010 remains subject to examination by the Internal Revenue Service and state taxing authorities.
At November 30, 2010, the components of accumulated earnings on a tax basis were as follows: undistributed ordinary income $2,933,524, accumulated capital losses $61,314,035 and unrealized appreciation $5,091,882.
The accumulated capital loss carryover is available for federal income tax purposes to be applied against future net securities profits, if any, realized subsequent to November 30, 2010. If not applied, $5,034,522 of the carryover expires in fiscal 2015, $12,020,330 expires in fiscal 2016, $43,899,797 expires in fiscal 2017 and $359,386 expires in fiscal 2018.
The tax character of distributions paid to shareholders during the fiscal periods ended November 30, 2010 and November 30, 2009 were as follows: ordinary income $4,501,268 and $7,151,804, respectively.
During the period ended November 30, 2010, as a result of permanent book to tax differences, primarily due to the tax treatment for capital loss carryover from prior year fund merger, paydown gains and losses on mortgage-backed securities and consent fees, the fund increased accumulated undistributed investment income-net by $153,927, decreased accumulated net realized gain (loss) on investments by $2,622,930 and increased paid-in capital by $2,469,003. Net assets and net asset value per share were not affected by this reclassification.
NOTE 2—Bank Lines of Credit:
The fund participates with other Dreyfus-managed funds in a $225 million unsecured credit facility led by Citibank, N.A. and a $300 million unsecured credit facility provided by The Bank of New York Mellon (each, a “Facility”), each to be utilized primarily for temporary or emergency purposes, including the financing of redemptions. In
| The Fund | 47 |
NOTES TO FINANCIAL STATEMENTS (continued)
connection therewith, the fund has agreed to pay its pro rata portion of commitment fees for each Facility. Interest is charged to the fund based on rates determined pursuant to the terms of the respective Facility at the time of borrowing. During the period ended November 30, 2010, the fund did not borrow under the Facilities.
NOTE 3—Management Fee and Other Transactions With Affiliates:
(a) Pursuant to a management agreement with the Manager, the management fee is computed at the annual rate of .80% of the value of the fund’s average daily net assets and is payable monthly. The Manager has contractually agreed from April 1, 2010 through April 1, 2011 to waive receipt of its fees and/or assume the expenses of the fund’s Class A, B, C and I shares, so that the net operating expenses of the fund’s Class A, B, C and I shares (excluding taxes, interest, brokerage commissions, commitment fees on borrowings and extraordinary expenses) do not exceed 1.18%, 1.93%, 1.93% and .92%, respectively, of such class’ average daily net assets. The Manager had contractually agreed from December 1, 2009 through March 31, 2010 to waive receipt of its fees and/or assume the expenses of the fund’s Class A, B, C and I shares, so that the net operating expenses of the fund’s Class A, B, C and I shares exclusive of certain expenses as described above did not exceed 1.11%, 1.86%, 1.86% and .85%, respectively, of such class’ average daily net assets. The reduction in expenses, pursuant to the undertaking, amounted to $484,265 during the period ended November 30, 2010.
During the period ended November 30, 2010, the Distributor retained $25,676 from commissions earned on sales of the fund’s Class A shares and $70,555 and $839 from CDSCs on redemptions of the fund’s Class B and Class C shares, respectively.
(b) Under the Distribution Plan (the “Plan”) adopted pursuant to Rule 12b-1 under the Act, Class B and Class C shares pay the Distributor for distributing their shares at an annual rate of .75% of the value of the average daily net assets of Class B and Class C shares. During the period
48
ended November 30, 2010, Class B and Class C shares were charged $459,515 and $358,004, respectively, pursuant to the Plan.
(c) Under the Shareholder Services Plan, Class A, Class B and Class C shares pay the Distributor at an annual rate of .25% of the value of their average daily net assets for the provision of certain services.The services provided may include personal services relating to shareholder accounts, such as answering shareholder inquiries regarding the fund and providing reports and other information, and services related to the maintenance of shareholder accounts.The Distributor may make payments to Service Agents (a securities dealer, financial institution or other industry professional) in respect of these services.The Distributor determines the amounts to be paid to Service Agents. During the period ended November 30, 2010, Class A, Class B and Class C shares were charged $316,283, $153,171 and $119,335, respectively, pursuant to the Shareholder Services Plan.
Under the Shareholder Services Plan with respect to Class Z (“Class Z Shareholder Services Plan”), Class Z shares reimburse the Distributor an amount not to exceed an annual rate of .25% of the value of Class Z shares’ average daily net assets for certain allocated expenses of providing personal services and/or maintaining shareholder accounts.The services provided may include personal services relating to shareholder accounts, such as answering shareholder inquiries regarding Class Z shares and providing reports and other information, and services related to the maintenance of shareholder accounts. During the period ended November 30, 2010, Class Z shares did not incur charges pursuant to the Class Z Shareholder Services Plan.
The fund compensates Dreyfus Transfer, Inc., a wholly-owned subsidiary of the Manager, under a transfer agency agreement for providing personnel and facilities to perform transfer agency services for the fund. During the period ended November 30, 2010, the fund was charged $233,683 pursuant to the transfer agency agreement, which is included in Shareholder servicing costs in the Statement of Operations.
| The Fund | 49 |
NOTES TO FINANCIAL STATEMENTS (continued)
The fund has arrangements with the custodian and cash management bank whereby the fund may receive earnings credits when positive cash balances are maintained, which are used to offset custody and cash management fees. For financial reporting purposes, the fund includes net earnings credits as an expense offset in the Statement of Operations.
The fund compensates The Bank of New York Mellon under a cash management agreement for performing cash management services related to fund subscriptions and redemptions. During the period ended November 30, 2010, the fund was charged $33,922 pursuant to the cash management agreement, which is included in Shareholder servicing costs in the Statement of Operations.These fees were partially offset by earnings credits of $1,998.
The fund also compensates The Bank of New York Mellon under a custody agreement for providing custodial services for the fund. During the period ended November 30, 2010, the fund was charged $59,221 pursuant to the custody agreement.
During the period ended November 30, 2010, the fund was charged $6,399 for services performed by the Chief Compliance Officer.
The components of “Due to The Dreyfus Corporation and affiliates” in the Statement of Assets and Liabilities consist of: management fees $197,134, Rule 12b-1 distribution plan fees $51,000, shareholder services plan fees $46,929, custodian fees $9,173, chief compliance officer fees $1,152 and transfer agency per account fees $54,573, which are offset against an expense reimbursement currently in effect in the amount of $55,467.
(d) Each Board member also serves as a Board member of other funds within the Dreyfus complex. Annual retainer fees and attendance fees are allocated to each fund based on net assets.
50
NOTE 4—Securities Transactions:
The aggregate amount of purchases and sales (including paydowns) of investment securities, excluding short-term securities, during the period ended November 30, 2010, amounted to $313,211,532 and $363,286,318, respectively.
The provisions of ASC Topic 815 “Derivatives and Hedging” require qualitative disclosures about objectives and strategies for using derivatives, quantitative disclosures about fair value amounts of gains and losses on derivative instruments and disclosures about credit-risk-related contingent features in derivative agreements.The fund held no derivatives during the period ended November 30, 2010.
At November 30, 2010, the cost of investments for federal income tax purposes was $290,785,395; accordingly, accumulated net unrealized appreciation on investments was $5,091,868, consisting of $21,816,599 gross unrealized appreciation and $16,724,731 gross unrealized depreciation.
| The Fund | 51 |
| REPORT OF INDEPENDENT REGISTERED |
| PUBLIC ACCOUNTING FIRM |
Shareholders and Board of Trustees
Dreyfus Balanced Opportunity Fund
We have audited the accompanying statement of assets and liabilities, including the statement of investments, of Dreyfus Balanced Opportunity Fund (the sole series comprising Dreyfus Manager Funds II) as of November 30, 2010, and the related statement of operations for the year then ended, the statement of changes in net assets for each of the two years in the period then ended, and financial highlights for each of the four years in the period then ended. These financial statements and financial highlights are the responsibility of the Fund’s management. Our responsibility is to express an opinion on these financial statements and financial highlights based on our audits.The financial highlights for the year ended November 30, 2006 were audited by other auditors whose report dated January 19, 2007 expressed an unqualified opinion on such financial highlights.
We conducted our audits in accordance with the standards of the Public Company Accounting Oversight Board (United States).Those standards require that we plan and perform the audit to obtain reasonable assurance about whether the financial statements and financial highlights are free of material misstatement. We were not engaged to perform an audit of the Fund’s internal control over financial reporting. Our audits included consideration of internal control over financial reporting as a basis for designing audit procedures that are appropriate in the circumstances, but not for the purpose of expressing an opinion on the effectiveness of the Fund’s internal control over financial reporting. Accordingly, we express no such opinion. An audit also includes examining, on a test basis, evidence supporting the amounts and disclosures in the financial statements and financial highlights, assessing the accounting principles used and significant estimates made by management, and evaluating the overall financial statement presentation. Our procedures included confirmation of securities owned as of November 30, 2010 by correspondence with the custodian and others.We believe that our audits provide a reasonable basis for our opinion.
In our opinion, the financial statements and financial highlights referred to above present fairly, in all material respects, the financial position of Dreyfus Balanced Opportunity Fund at November 30, 2010, the results of its operations for the year then ended, the changes in its net assets for each of the two years in the period then ended and the financial highlights for each of the four years in the period then ended, in conformity with U.S. generally accepted accounting principles.
New York, New York
January 25, 2011
52
IMPORTANT TAX INFORMATION (Unaudited)
For federal tax purposes the fund hereby designates 84.51% of the ordinary dividends paid during the fiscal year ended November 30, 2010 as qualifying for the corporate dividends received deduction. Also certain dividends paid by the fund may be subject to a maximum tax rate of 15%, as provided for by the Jobs and Growth Tax Relief Reconciliation Act of 2003. Of the distributions paid during the fiscal year, $3,906,016 represents the maximum amount that may be considered qualified dividend income. Shareholders will receive notification in early 2011 of the percentage applicable to the preparation of their 2010 income tax returns.
| The Fund | 53 |
OFFICERS OF THE FUND (Unaudited)
BRADLEY J. SKAPYAK, President since January 2010.
Chief Operating Officer and a director of the Manager since June 2009. From April 2003 to June 2009, Mr. Skapyak was the head of the Investment Accounting and Support Department of the Manager. He is an officer of 76 investment companies (comprised of 170 portfolios) managed by the Manager. He is 52 years old and has been an employee of the Manager since February 1988.
PHILLIP N. MAISANO, Executive Vice President since July 2007.
Chief Investment Officer,Vice Chair and a director of the Manager, and an officer of 76 investment companies (comprised of 170 portfolios) managed by the Manager. Mr. Maisano also is an officer and/or Board member of certain other investment management subsidiaries of The Bank of New York Mellon Corporation, each of which is an affiliate of the Manager. He is 63 years old and has been an employee of the Manager since November 2006. Prior to joining the Manager, Mr. Maisano served as Chairman and Chief Executive Officer of EACM Advisors, an affiliate of the Manager, since August 2004.
MICHAEL A. ROSENBERG, Vice President and Secretary since September 2003.
Assistant General Counsel of BNY Mellon, and an officer of 77 investment companies (comprised of 195 portfolios) managed by the Manager. He is 50 years old and has been an employee of the Manager since October 1991.
KIESHA ASTWOOD, Vice President and Assistant Secretary since January 2010.
Counsel of BNY Mellon, and an officer of 77 investment companies (comprised of 195 portfolios) managed by the Manager. She is 37 years old and has been an employee of the Manager since July 1995.
JAMES BITETTO, Vice President and Assistant Secretary since August 2005.
Senior Counsel of BNY Mellon and Secretary of the Manager, and an officer of 77 investment companies (comprised of 195 portfolios) managed by the Manager. He is 44 years old and has been an employee of the Manager since December 1996.
JONI LACKS CHARATAN, Vice President and Assistant Secretary since August 2005.
Senior Counsel of BNY Mellon, and an officer of 77 investment companies (comprised of 195 portfolios) managed by the Manager. She is 55 years old and has been an employee of the Manager since October 1988.
JOSEPH M. CHIOFFI, Vice President and Assistant Secretary since August 2005.
Senior Counsel of BNY Mellon, and an officer of 77 investment companies (comprised of 195 portfolios) managed by the Manager. He is 49 years old and has been an employee of the Manager since June 2000.
KATHLEEN DENICHOLAS, Vice President and Assistant Secretary since January 2010.
Senior Counsel of BNY Mellon, and an officer of 77 investment companies (comprised of 195 portfolios) managed by the Manager. She is 36 years old and has been an employee of the Manager since February 2001.
JANETTE E. FARRAGHER, Vice President and Assistant Secretary since August 2005.
Assistant General Counsel of BNY Mellon, and an officer of 77 investment companies (comprised of 195 portfolios) managed by the Manager. She is 47 years old and has been an employee of the Manager since February 1984.
56
JOHN B. HAMMALIAN, Vice President and Assistant Secretary since August 2005.
Managing Counsel of BNY Mellon, and an officer of 77 investment companies (comprised of 195 portfolios) managed by the Manager. He is 47 years old and has been an employee of the Manager since February 1991.
M. CRISTINA MEISER, Vice President and Assistant Secretary since January 2010.
Senior Counsel of BNY Mellon, and an officer of 77 investment companies (comprised of 195 portfolios) managed by the Manager. She is 40 years old and has been an employee of the Manager since August 2001.
ROBERT R. MULLERY, Vice President and Assistant Secretary since August 2005.
Managing Counsel of BNY Mellon, and an officer of 77 investment companies (comprised of 195 portfolios) managed by the Manager. He is 58 years old and has been an employee of the Manager since May 1986.
JEFF PRUSNOFSKY, Vice President and Assistant Secretary since September 2003.
Managing Counsel of BNY Mellon, and an officer of 77 investment companies (comprised of 195 portfolios) managed by the Manager. He is 45 years old and has been an employee of the Manager since October 1990.
JAMES WINDELS, Treasurer since September 2003.
Director – Mutual Fund Accounting of the Manager, and an officer of 77 investment companies (comprised of 195 portfolios) managed by the Manager. He is 52 years old and has been an employee of the Manager since April 1985.
RICHARD CASSARO, Assistant Treasurer since January 2008.
Senior Accounting Manager – Money Market and Municipal Bond Funds of the Manager, and an officer of 77 investment companies (comprised of 195 portfolios) managed by the Manager. He is 51 years old and has been an employee of the Manager since September 1982.
GAVIN C. REILLY, Assistant Treasurer since December 2005.
Tax Manager of the Investment Accounting and Support Department of the Manager, and an officer of 77 investment companies (comprised of 195 portfolios) managed by the Manager. He is 42 years old and has been an employee of the Manager since April 1991.
ROBERT ROBOL, Assistant Treasurer since August 2005.
Senior Accounting Manager – Fixed Income Funds of the Manager, and an officer of 77 investment companies (comprised of 195 portfolios) managed by the Manager. He is 46 years old and has been an employee of the Manager since October 1988.
ROBERT SALVIOLO, Assistant Treasurer since July 2007.
Senior Accounting Manager – Equity Funds of the Manager, and an officer of 77 investment companies (comprised of 195 portfolios) managed by the Manager. He is 43 years old and has been an employee of the Manager since June 1989.
| The Fund | 57 |
OFFICERS OF THE FUND (Unaudited) (continued)
ROBERT SVAGNA, Assistant Treasurer since September 2002.
Senior Accounting Manager – Equity Funds of the Manager, and an officer of 77 investment companies (comprised of 195 portfolios) managed by the Manager. He is 43 years old and has been an employee of the Manager since November 1990.
JOSEPH W. CONNOLLY, Chief Compliance Officer since October 2004.
Chief Compliance Officer of the Manager and The Dreyfus Family of Funds (77 investment companies, comprised of 195 portfolios). From November 2001 through March 2004, Mr. Connolly was first Vice-President, Mutual Fund Servicing for Mellon Global Securities Services. In that capacity, Mr. Connolly was responsible for managing Mellon’s Custody, Fund Accounting and Fund Administration services to third-party mutual fund clients. He is 53 years old and has served in various capacities with the Manager since 1980, including manager of the firm’s Fund Accounting Department from 1997 through October 2001.
NATALIA GRIBAS, Anti-Money Laundering Compliance Officer since July 2010.
Anti-Money Laundering Compliance Officer of the Distributor, and the Anti-Money Laundering Compliance Officer of 73 investment companies (comprised of 191 portfolios) managed by the Manager. She is 40 years old and has been an employee of the Distributor since September 2008.
58
NOTES
Item 2. Code of Ethics.
The Registrant has adopted a code of ethics that applies to the Registrant's principal executive officer, principal financial officer, principal accounting officer or controller, or persons performing similar functions. There have been no amendments to, or waivers in connection with, the Code of Ethics during the period covered by this Report.
Item 3. Audit Committee Financial Expert.
The Registrant's Board has determined that Mr. David P. Feldman, a member of the Audit Committee of the Board, is an audit committee financial expert as defined by the Securities and Exchange Commission (the "SEC"). Mr. David P. Feldman is "independent" as defined by the SEC for purposes of audit committee financial expert determinations.
Item 4. Principal Accountant Fees and Services.
(a) Audit Fees. The aggregate fees billed for each of the last two fiscal years (the "Reporting Periods") for professional services rendered by the Registrant's principal accountant (the "Auditor") for the audit of the Registrant's annual financial statements or services that are normally provided by the Auditor in connection with the statutory and regulatory filings or engagements for the Reporting Periods, were $48,328 in 2009 and $48,328 in 2010.
(b) Audit-Related Fees. The aggregate fees billed in the Reporting Periods for assurance and related services by the Auditor that are reasonably related to the performance of the audit of the Registrant's financial statements and are not reported under paragraph (a) of this Item 4 were $5,276 in 2009 and $5,382 in 2010. These services consisted of one or more of the following: (i) agreed upon procedures related to compliance with Internal Revenue Code section 817(h), (ii) security counts required by Rule 17f-2 under the Investment Company Act of 1940, as amended, (iii) advisory services as to the accounting or disclosure treatment of Registrant transactions or events and (iv) advisory services to the accounting or discl osure treatment of the actual or potential impact to the Registrant of final or proposed rules, standards or interpretations by the Securities and Exchange Commission, the Financial Accounting Standards Boards or other regulatory or standard-setting bodies.
The aggregate fees billed in the Reporting Periods for non-audit assurance and related services by the Auditor to the Registrant's investment adviser (not including any sub-investment adviser whose role is primarily portfolio management and is subcontracted with or overseen by another investment adviser), and any entity controlling, controlled by or under common control with the investment adviser that provides ongoing services to the Registrant ("Service Affiliates"), that were reasonably related to the performance of the annual audit of the Service Affiliate, which required pre-approval by the Audit Committee were $0 in 2009 and $0 in 2010.
(c) Tax Fees. The aggregate fees billed in the Reporting Periods for professional services rendered by the Auditor for tax compliance, tax advice, and tax planning ("Tax Services") were $3,579 in 2009 and $4,007 in 2010. These services consisted of: (i) review or preparation of U.S. federal, state, local and excise tax returns; (ii) U.S. federal, state and local tax planning, advice and assistance regarding statutory, regulatory or administrative developments; (iii) tax advice regarding tax qualification matters and/or treatment of various financial instruments held or proposed to be acquired or held, and (iv) determination of Passive Foreign Investment Companies. The aggregate fees billed in the Reporting Periods for Tax Services by the Auditor to Service Affiliates, which required pre-approval by the Audit Committee were $0 in 2009 and $0 in 2010.
-3-
(d) All Other Fees. The aggregate fees billed in the Reporting Periods for products and services provided by the Auditor, other than the services reported in paragraphs (a) through (c) of this Item, were $79 in 2009 and $108 in 2010. [These services consisted of a review of the Registrant's anti-money laundering program].
The aggregate fees billed in the Reporting Periods for Non-Audit Services by the Auditor to Service Affiliates, other than the services reported in paragraphs (b) through (c) of this Item, which required pre-approval by the Audit Committee, were $0 in 2009 and $0 in 2010.
(e)(1) Audit Committee Pre-Approval Policies and Procedures. The Registrant's Audit Committee has established policies and procedures (the "Policy") for pre-approval (within specified fee limits) of the Auditor's engagements for non-audit services to the Registrant and Service Affiliates without specific case-by-case consideration. The pre-approved services in the Policy can include pre-approved audit services, pre-approved audit-related services, pre-approved tax services and pre-approved all other services. Pre-approval considerations include whether the proposed services are compatible with maintaining the Auditor's independence. Pre-approvals pursuant to the Policy are considered annually.
(e)(2) Note: None of the services described in paragraphs (b) through (d) of this Item 4 were approved by the Audit Committee pursuant to paragraph (c)(7)(i)(C) of Rule 2-01 of Regulation S-X.
(f) None of the hours expended on the principal accountant's engagement to audit the registrant's financial statements for the most recent fiscal year were attributed to work performed by persons other than the principal account's full-time, permanent employees.
Non-Audit Fees. The aggregate non-audit fees billed by the Auditor for services rendered to the Registrant, and rendered to Service Affiliates, for the Reporting Periods were $26,086,988 in 2009 and $33,851,490 in 2010.
Auditor Independence. The Registrant's Audit Committee has considered whether the provision of non-audit services that were rendered to Service Affiliates, which were not pre-approved (not requiring pre-approval), is compatible with maintaining the Auditor's independence.
Item 5. Audit Committee of Listed Registrants.
Not applicable. [CLOSED-END FUNDS ONLY]
Item 6. Investments.
(a) Not applicable.
Item 7. Disclosure of Proxy Voting Policies and Procedures for Closed-End Management Investment Companies.
Not applicable. [CLOSED-END FUNDS ONLY]
Item 8. Portfolio Managers of Closed-End Management Investment Companies.
Not applicable. [CLOSED-END FUNDS ONLY, beginning with reports for periods ended on and after December 31, 2005]
Item 9. Purchases of Equity Securities by Closed-End Management Investment Companies and Affiliated Purchasers.
-4-
Not applicable. [CLOSED-END FUNDS ONLY]
Item 10. Submission of Matters to a Vote of Security Holders.
There have been no material changes to the procedures applicable to Item 10.
Item 11. Controls and Procedures.
(a) The Registrant's principal executive and principal financial officers have concluded, based on their evaluation of the Registrant's disclosure controls and procedures as of a date within 90 days of the filing date of this report, that the Registrant's disclosure controls and procedures are reasonably designed to ensure that information required to be disclosed by the Registrant on Form N-CSR is recorded, processed, summarized and reported within the required time periods and that information required to be disclosed by the Registrant in the reports that it files or submits on Form N-CSR is accumulated and communicated to the Registrant's management, including its principal executive and principal financial officers, as appropriate to allow timely decisions regarding required disclosure.
(b) There were no changes to the Registrant's internal control over financial reporting that occurred during the second fiscal quarter of the period covered by this report that have materially affected, or are reasonably likely to materially affect, the Registrant's internal control over financial reporting.
Item 12. Exhibits.
(a)(1) Code of ethics referred to in Item 2.
(a)(2) Certifications of principal executive and principal financial officers as required by Rule 30a-2(a) under the Investment Company Act of 1940.
(a)(3) Not applicable.
(b) Certification of principal executive and principal financial officers as required by Rule 30a-2(b) under the Investment Company Act of 1940.
-5-
SIGNATURES
Pursuant to the requirements of the Securities Exchange Act of 1934 and the Investment Company Act of 1940, the Registrant has duly caused this Report to be signed on its behalf by the undersigned, thereunto duly authorized.
Dreyfus Manager Funds II
By: /s/ Bradley J. Skapyak |
Bradley J. Skapyak, President
|
Date: January 24, 2011 |
|
Pursuant to the requirements of the Securities Exchange Act of 1934 and the Investment Company Act of 1940, this Report has been signed below by the following persons on behalf of the Registrant and in the capacities and on the dates indicated. |
|
By: /s/ Bradley J. Skapyak |
Bradley J. Skapyak, President
|
Date: January 24, 2011 |
|
By: /s/ James Windels |
James Windels, Treasurer
|
Date: January 24, 2011 |
|
EXHIBIT INDEX
(a)(1) Code of ethics referred to in Item 2.
(a)(2) Certifications of principal executive and principal financial officers as required by Rule 30a-2(a) under the Investment Company Act of 1940. (EX-99.CERT)
(b) Certification of principal executive and principal financial officers as required by Rule 30a-2(b) under the Investment Company Act of 1940. (EX-99.906CERT)
-6-