UNITED STATES
SECURITIES AND EXCHANGE COMMISSION
Washington, D.C. 20549
FORM N-CSR
CERTIFIED SHAREHOLDER REPORT OF REGISTERED MANAGEMENT
INVESTMENT COMPANIES
Investment Company Act file number | 811-21327 | |||||
|
| |||||
| Dreyfus Manager Funds II |
| ||||
| (Exact name of Registrant as specified in charter) |
| ||||
|
|
| ||||
|
c/o The Dreyfus Corporation 200 Park Avenue New York, New York 10166 |
| ||||
| (Address of principal executive offices) (Zip code) |
| ||||
|
|
| ||||
| Janette E. Farragher, Esq. 200 Park Avenue New York, New York 10166 |
| ||||
| (Name and address of agent for service) |
| ||||
| ||||||
Registrant's telephone number, including area code: | (212) 922-6000 | |||||
|
| |||||
Date of fiscal year end:
| 11/30 |
| ||||
Date of reporting period: | 11/30/12 |
| ||||
Save time. Save paper. View your next shareholder report online as soon as it’s available. Log into www.dreyfus.com and sign up for Dreyfus eCommunications. It’s simple and only takes a few minutes.
The views expressed in this report reflect those of the portfolio manager only through the end of the period covered and do not necessarily represent the views of Dreyfus or any other person in the Dreyfus organization. Any such views are subject to change at any time based upon market or other conditions and Dreyfus disclaims any responsibility to update such views.These views may not be relied on as investment advice and, because investment decisions for a Dreyfus fund are based on numerous factors, may not be relied on as an indication of trading intent on behalf of any Dreyfus fund.
Contents | |
THE FUND | |
| 2 | A Letter from the President |
| 3 | Discussion of Fund Performance |
| 6 | Fund Performance |
| 8 | Understanding Your Fund’s Expenses |
| 9 | Comparing Your Fund’s Expenses With Those of Other Funds |
| 10 | Statement of Investments |
| 25 | Statement of Assets and Liabilities |
| 26 | Statement of Operations |
| 27 | Statement of Changes in Net Assets |
| 29 | Financial Highlights |
| 34 | Notes to Financial Statements |
| 47 | Report of Independent Registered Public Accounting Firm |
| 48 | Important Tax Information |
| 49 | Proxy Results |
| 50 | Board Members Information |
| 52 | Officers of the Fund |
FOR MORE INFORMATION | |
Back Cover |
Dreyfus
Balanced Opportunity Fund
The Fund
A LETTER FROM THE PRESIDENT
Dear Shareholder:
We are pleased to present this annual report for Dreyfus Balanced Opportunity Fund, covering the 12-month period from December 1, 2011, through November 30, 2012. For information about how the fund performed during the reporting period, as well as general market perspectives, we provide a Discussion of Fund Performance on the pages that follow.
Despite pronounced weakness across most financial markets during the spring of 2012, stocks and higher yielding bonds generally advanced over the past year as investors responded to encouraging macroeconomic developments throughout the world. Employment gains in the United States, credible measures to prevent a more severe banking crisis in Europe, and the likelihood of a “soft landing” for China’s economy buoyed investor sentiment, as did aggressively accommodative monetary policies from central banks in the United States, Europe, Japan and China. Consequently, U.S. stocks across all capitalization ranges posted double-digit returns and bonds produced more modest gains, on average, for the reporting period.
In light of the easy monetary policies adopted by many countries, we expect global growth to be slightly more robust in 2013 than in 2012.The U.S. economic recovery is likely to persist at subpar levels over the first half of the new year, as growth may remain constrained by uncertainties surrounding fiscal policy and tax reforms. However, resolution of these issues may prompt corporate decision-makers to increase capital spending, which could have positive implications for the U.S. economy and financial markets later in the year.As always, we encourage you to stay in touch with your financial advisor as new developments unfold.
Thank you for your continued confidence and support.
Sincerely,
J. Charles Cardona
President
The Dreyfus Corporation
December 17, 2012
2
DISCUSSION OF FUND PERFORMANCE
For the reporting period of December 1, 2011, through November 30, 2012, as provided by Keith Stransky, Brian Ferguson, Sean Fitzgibbon and David Bowser, Portfolio Managers
Fund and Market Performance Overview
For the 12-month period ended November 30, 2012, Dreyfus Balanced Opportunity Fund’s Class A shares, Class C shares, Class I shares, Class J shares and Class Z shares produced total returns of 12.50%, 11.58%, 12.75%, 12.67% and 12.34%, respectively.1 In comparison, the fund’s benchmark, a blended index composed of 60% Standard & Poor’s 500 Composite Stock Price Index (“S&P 500 Index”) and 40% Barclays U.S. Aggregate Bond Index, produced an 11.87% total return for the same period.2 Separately, the S&P 500 Index and the Barclays U.S.Aggregate Bond Index produced total returns of 16.11% and 5.51%, respectively, for the same period.
Improving economic sentiment generally drove prices of stocks and higher yielding bonds higher. The fund’s Class A, Class I, Class J, and Class Z shares produced higher returns than the blended benchmark, as strong results from fixed-income investments and an overweighting in equities more than offset an in-line result of its stock portfolio.
The Fund’s Investment Approach
The fund seeks high total return, including capital appreciation and current income, through a diversified mix of stocks and fixed-income securities.When allocating assets, we assess the relative return and risk of each asset class, general economic conditions, anticipated future changes in interest rates and the general outlook for stocks.
Among stocks, we strive to create a broadly diversified portfolio that includes a blend of growth and value stocks. Using quantitative and fundamental research, we look for companies with leading market positions, competitive or technological advantages, high returns on equity and assets, good growth prospects, attractive valuations and strong management teams.
The fund normally invests between 25% and 50% of its assets in fixed-income securities that, at the time of purchase, are rated investment grade (Baa/BBB or higher) or the non-rated equivalent as determined by Dreyfus. We may invest up to 5% of the
The Fund 3
DISCUSSION OF FUND PERFORMANCE (continued)
fixed-income portfolio in securities rated below investment grade (but not lower than B) and up to 10% in bonds from foreign issuers.
Improved Investor Sentiment Sparked Rallies
The reporting period began in the wake of major declines in most financial markets, resulting in attractive valuations across several asset classes in December 2011. By early 2012, U.S. stocks and higher yielding bonds were rallying amid domestic employment gains and a quantitative easing program in Europe. Investors grew more tolerant of risks, focusing more on underlying fundamentals and less on macroeconomic developments.
These positive influences were called into question during the spring, when the U.S. labor market’s rebound slowed and measures designed to relieve fiscal pressures in Europe encountered resistance. However, investor sentiment soon improved when several major central banks announced measures to stimulate their economies. In the United States, the Federal Reserve Board extended Operation Twist in June and embarked on a third round of quantitative easing in September. In July, the European Central Bank signaled its commitment to supporting the euro, followed by plans to buy distressed debt from some of the European Union’s more troubled members.
U.S. investors also were cheered by improving economic data.The unemployment rate fell from 8.2% at the end of May to 7.7% at the end of November, U.S. GDP growth accelerated from an annualized rate of 1.3% for the second quarter to an estimated 2.7% for the third quarter, and housing markets showed long-awaited signs of recovery.These positive developments drove stock prices broadly higher.
Constructive Posture Buoyed Fixed-Income Returns
The fund’s relative performance for the reporting period was buoyed by its bond portfolio, where overweighted exposure to investment-grade corporate bonds and favorable security selections among corporate- and mortgage-backed securities bolstered returns. Underweighted exposure to the longer end of the market’s maturity range in early 2012 also supported results.
Although the fund’s stock portfolio participated significantly in the market’s gains, relative performance was undermined by shortfalls in the information technology and financials sectors.Videogame developer Electronic Arts was hurt by the disappointing
4
launch of a new multi-player game, and insurer Genworth Financial disappointed investors when it proved unable to spin off its Australian business. In addition, the fund did not own some of the large, diversified financial institutions that led the financials sector higher.
The fund achieved better results through an underweighted position in the lagging utilities sector and through strong stock selections in the consumer discretionary sector. Media companies benefited from elevated advertising spending in an election year, and homebuilders rebounded along with U.S. housing markets.
Positioned for Economic Growth
We have been encouraged by recently positive economic data, which could help drive further gains for stocks and some bond market sectors.Therefore, we have retained a generally constructive investment posture in the bond portfolio, and in the equity portfolio we have found a number of opportunities in the consumer discretionary, information technology and health care sectors, but fewer among energy companies.
December 17, 2012
| Equity funds are subject generally to market, market sector, market liquidity, issuer and investment style risks, among |
| other factors, to varying degrees, all of which are more fully described in the fund’s prospectus. |
| Bond funds are subject generally to interest rate, credit, liquidity and market risks, to varying degrees, all of which are |
| more fully described in the fund’s prospectus. Generally, all other factors being equal, bond prices are inversely related |
| to interest-rate changes, and rate increases can cause price declines. |
| 1 Total return includes reinvestment of dividends and any capital gains paid, and does not take into consideration the |
| maximum initial sales charge in the case of Class A shares, or the applicable contingent deferred sales charge imposed |
| on redemptions in the case of Class C shares. Had these charges been reflected, returns would have been lower. Past |
| performance is no guarantee of future results. Share price and investment return fluctuate such that upon redemption, |
| fund shares may be worth more or less than their original cost. Return figures for Classes A, C and I shares provided |
| reflect the absorption of certain fund expenses by The Dreyfus Corporation pursuant to an undertaking in effect |
| through April 1, 2013, at which time it may be extended, terminated or modified. Had these expenses not been |
| absorbed, Class A, C and I returns would have been lower. |
| 2 SOURCE: LIPPER INC. — Reflects reinvestment of dividends and, where applicable, capital gain distributions. |
| The Standard & Poor’s 500 Composite Stock Price Index is a widely accepted, unmanaged index of U.S. stock |
| market performance.The Barclays U.S.Aggregate Bond Index is a widely accepted, unmanaged total return index of |
| corporate, U.S. government and U.S. government agency debt instruments, mortgage-backed securities and asset-backed |
| securities with an average maturity of 1-10 years. Investors cannot invest directly in any index. |
The Fund 5
FUND PERFORMANCE
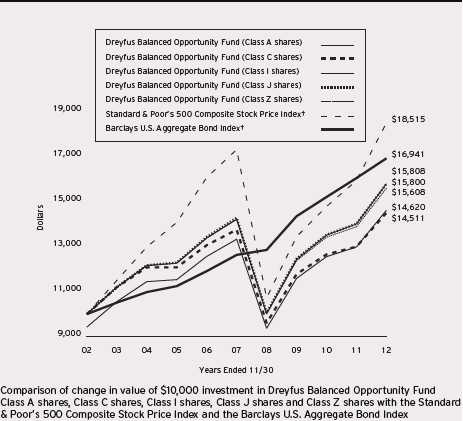
| † | Source: Lipper Inc. |
Past performance is not predictive of future performance.
The above graph compares a $10,000 investment made in each of the Class A, Class C, Class I, Class J and Class Z shares of Dreyfus Balanced Opportunity Fund on 11/30/02 to a $10,000 investment made in the Standard & Poor’s 500 Composite Stock Price Index (the “S&P 500 Index”) and the Barclays U.S.Aggregate Bond Index (the “Barclays Index”) on that date.All dividends and capital gain distributions are reinvested.
On January 30, 2004, Dreyfus Balanced Opportunity Fund (the “fund”) commenced operations after all of the assets of another mutual fund advised by the fund's sub-investment adviser were transferred to the fund in exchange for Class J shares of the fund in a tax-free reorganization. Class J and Z shares are closed to new investors.The fund offers Class A, C and I shares, which are subject to different sales charges and expenses.The performance figures for Class A, Class C, Class I and Class Z shares in the line graph above include the performance of the predecessor fund and reflect current sales loads and distribution expenses in effect since the reorganization date.
The fund’s performance shown in the line graph above takes into account the maximum initial sales charge on Class A shares and all other applicable fees and expenses on all classes.The S&P 500 Index is a widely accepted, unmanaged index of U.S. stock market performance.The Barclays Index is a widely accepted, unmanaged index of corporate, U.S. government and U.S. government agency debt instruments, mortgage-backed securities, and asset-backed securities with an average maturity of 1-10 years. Unlike a mutual fund, the indices are not subject to charges, fees and other expenses. Investors cannot invest directly in any index. Further information relating to fund performance, including expense reimbursements, if applicable, is contained in the Financial Highlights section of the prospectus and elsewhere in this report.
6
| Average Annual Total Returns as of 11/30/12 | ||||||
| 1 | Year | 5 Years | 10 Years | |||
| Class A shares | ||||||
| with maximum sales charge (5.75%) | 6.04 | % | 0.66 | % | 3.87 | % |
| without sales charge | 12.50 | % | 1.86 | % | 4.49 | % |
| Class C shares | ||||||
| with applicable redemption charge† | 10.58 | % | 1.07 | % | 3.79 | % |
| without redemption | 11.58 | % | 1.07 | % | 3.79 | % |
| Class I shares | 12.75 | % | 2.14 | % | 4.69 | % |
| Class J shares | 12.67 | % | 2.02 | % | 4.68 | % |
| Class Z shares | 12.34 | % | 1.87 | % | 4.55 | % |
| Standard & Poor’s 500 | ||||||
| Composite Stock Price Index | 16.11 | % | 1.34 | % | 6.35 | % |
| Barclays U.S. Aggregate Bond Index | 5.51 | % | 6.04 | % | 5.41 | % |
Past performance is not predictive of future performance.The fund’s performance shown in the graph and table does not reflect the deduction of taxes that a shareholder would pay on fund distributions or the redemption of fund shares.The performance figures for Class A, Class C, Class I and Class Z shares shown in the table include the performance of the predecessor fund and reflect current sales loads and distribution expenses in effect since the reorganization date.
| † The maximum contingent deferred sales charge for Class C shares is 1% for shares redeemed within one year of the |
| date of purchase. |
The Fund 7
UNDERSTANDING YOUR FUND’S EXPENSES (Unaudited)
As a mutual fund investor, you pay ongoing expenses, such as management fees and other expenses. Using the information below, you can estimate how these expenses affect your investment and compare them with the expenses of other funds. You also may pay one-time transaction expenses, including sales charges (loads) and redemption fees, which are not shown in this section and would have resulted in higher total expenses. For more information, see your fund’s prospectus or talk to your financial adviser.
Review your fund’s expenses
The table below shows the expenses you would have paid on a $1,000 investment in Dreyfus Balanced Opportunity Fund from June 1, 2012 to November 30, 2012. It also shows how much a $1,000 investment would be worth at the close of the period, assuming actual returns and expenses.
Expenses and Value of a $1,000 Investment
assuming actual returns for the six months ended November 30, 2012
| Expenses paid | Ending value | |||
| per $1,000† | (after expenses) | |||
| Class A | $6.25 | $1,084.80 | ||
| Class C | $10.14 | $1,080.10 | ||
| Class J | $5.47 | $1,085.30 | ||
| Class I | $4.95 | $1,085.90 | ||
| Class Z | $6.56 | $1,084.00 |
| † Expenses are equal to the fund’s annualized expense ratio of 1.20% for Class A, 1.95% for Class C, 1.05% for |
| Class J, .95% for Class I and 1.26% for Class Z, multiplied by the average account value over the period, |
| multiplied by 183/366 (to reflect the one-half year period). |
8
COMPARING YOUR FUND’S EXPENSES
WITH THOSE OF OTHER FUNDS (Unaudited)
Using the SEC’s method to compare expenses
The Securities and Exchange Commission (SEC) has established guidelines to help investors assess fund expenses. Per these guidelines, the table below shows your fund’s expenses based on a $1,000 investment, assuming a hypothetical 5% annualized return. You can use this information to compare the ongoing expenses (but not transaction expenses or total cost) of investing in the fund with those of other funds.All mutual fund shareholder reports will provide this information to help you make this comparison. Please note that you cannot use this information to estimate your actual ending account balance and expenses paid during the period.
Expenses and Value of a $1,000 Investment
assuming a hypothetical 5% annualized return for the six months ended November 30, 2012
| Expenses paid | Ending value | ||||
| per $1,000 | † | (after expenses) | |||
| Class A | $6.06 | $1,019.00 | |||
| Class C | $9.82 | $1,015.25 | |||
| Class J | $5.30 | $1,019.75 | |||
| Class I | $4.80 | $1,020.25 | |||
| Class Z | $6.36 | $1,018.70 |
| † Expenses are equal to the fund’s annualized expense ratio of 1.20% for Class A, 1.95% for Class C, 1.05% for |
| Class J, .95% for Class I and 1.26% for Class Z, multiplied by the average account value over the period, |
| multiplied by 183/366 (to reflect the one-half year period). |
The Fund 9
STATEMENT OF INVESTMENTS
November 30, 2012
| Coupon | Maturity | Principal | |||
| Bonds and Notes—31.0% | Rate (%) | Date | Amount ($) | Value ($) | |
| Asset-Backed Ctfs./ | |||||
| Auto Receivables—1.5% | |||||
| Ally Auto Receivables Trust, | |||||
| Ser. 2010-1, Cl. B | 3.29 | 3/15/15 | 315,000 | a | 324,410 |
| Americredit Automobile Receivables | |||||
| Trust, Ser. 2010-3, Cl. B | 2.04 | 9/8/15 | 230,000 | 232,936 | |
| Americredit Automobile Receivables | |||||
| Trust, Ser. 2010-1, Cl. C | 5.19 | 8/17/15 | 275,000 | 287,249 | |
| CarMax Auto Owner Trust, | |||||
| Ser. 2010-1, Cl. B | 3.75 | 12/15/15 | 75,000 | 77,491 | |
| Chrysler Financial Auto | |||||
| Securitization Trust, | |||||
| Ser. 2010-A, Cl. D | 3.52 | 8/8/16 | 165,000 | 165,821 | |
| Ford Credit Auto Owner Trust, | |||||
| Ser. 2010-A, Cl. C | 3.22 | 3/15/16 | 310,000 | 320,961 | |
| Santander Drive Auto Receivables | |||||
| Trust, Ser. 2012-4, Cl. B | 1.83 | 3/15/17 | 540,000 | 546,050 | |
| Santander Drive Auto Receivables | |||||
| Trust, Ser. 2012-6, Cl. C | 1.94 | 3/15/18 | 480,000 | 480,573 | |
| Santander Drive Auto Receivables | |||||
| Trust, Ser. 2010-3, Cl. B | 2.05 | 5/15/15 | 95,000 | 95,612 | |
| Santander Drive Auto Receivables | |||||
| Trust, Ser. 2010-2, Cl. B | 2.24 | 12/15/14 | 100,000 | 100,726 | |
| Santander Drive Auto Receivables | |||||
| Trust, Ser. 2012-3, Cl. C | 3.01 | 4/16/18 | 320,000 | 330,456 | |
| Santander Drive Auto Receivables | |||||
| Trust, Ser. 2010-B, Cl. C | 3.02 | 10/17/16 | 330,000 | a | 336,456 |
| Santander Drive Auto Receivables | |||||
| Trust, Ser. 2011-1, Cl. C | 3.11 | 5/16/16 | 435,000 | 448,603 | |
| 3,747,344 | |||||
| Asset-Backed Ctfs./Equipment—.2% | |||||
| CNH Equipment Trust, | |||||
| Ser. 2010-B, Cl. B | 3.12 | 2/15/17 | 395,000 | 405,051 | |
| Asset-Backed Ctfs./ | |||||
| Home Equity Loans—.0% | |||||
| Ameriquest Mortgage Securities, | |||||
| Ser. 2003-11, Cl. AF6 | 5.61 | 1/25/34 | 76,213 | b | 77,790 |
10
| Coupon | Maturity | Principal | |||
| Bonds and Notes (continued) | Rate (%) | Date | Amount ($) | Value ($) | |
| Commercial Mortgage | |||||
| Pass-Through Ctfs.—1.7% | |||||
| American Tower Trust, | |||||
| Ser. 2007-1A, Cl. AFX | 5.42 | 4/15/37 | 225,000 | a | 232,405 |
| Banc of America Merrill Lynch | |||||
| Commercial Mortgage, | |||||
| Ser. 2004-6, Cl. A5 | 4.81 | 12/10/42 | 575,000 | 614,519 | |
| Bear Stearns Commercial Mortgage | |||||
| Securities, Ser. 2006-T22, Cl. A4 | 5.57 | 4/12/38 | 275,000 | b | 313,436 |
| Bear Stearns Commercial Mortgage | |||||
| Securities, Ser. 2007-PW17, | |||||
| Cl. AAB | 5.70 | 6/11/50 | 266,000 | 283,202 | |
| Bear Stearns Commercial Mortgage | |||||
| Securities, Ser. 2007-T28, Cl. A4 | 5.74 | 9/11/42 | 175,000 | b | 209,814 |
| Citigroup Commercial Mortgage | |||||
| Trust, Ser. 2012-GC8, Cl. A4 | 3.02 | 9/10/45 | 330,000 | 347,620 | |
| GS Mortgage Securities Corporation | |||||
| II, Ser. 2007-EOP, Cl. E | 2.48 | 3/6/20 | 560,000 | a,b | 562,540 |
| JP Morgan Chase Commercial | |||||
| Mortgage Securities, | |||||
| Ser. 2011-C3, Cl. A4 | 4.72 | 2/15/46 | 445,000 | a | 523,913 |
| JP Morgan Chase Commercial | |||||
| Mortgage Securities, | |||||
| Ser. 2006-CB14, Cl. ASB | 5.51 | 12/12/44 | 79,958 | b | 84,889 |
| JP Morgan Chase Commercial | |||||
| Mortgage Securities, | |||||
| Ser. 2009-IWST, Cl. C | 7.45 | 12/5/27 | 435,000 | a,b | 538,217 |
| TIAA Seasoned Commercial Mortgage | |||||
| Trust, Ser. 2007-C4, Cl. A3 | 5.58 | 8/15/39 | 391,450 | b | 415,087 |
| Wachovia Bank Commercial Mortgage | |||||
| Trust, Ser. 2005-C16, Cl. A2 | 4.38 | 10/15/41 | 3,518 | 3,517 | |
| 4,129,159 | |||||
| Consumer Discretionary—1.2% | |||||
| AutoZone, | |||||
| Sr. Unscd. Notes | 3.70 | 4/15/22 | 165,000 | 175,081 | |
| Comcast, | |||||
| Gtd. Notes | 6.50 | 11/15/35 | 135,000 | 175,342 |
The Fund 11
STATEMENT OF INVESTMENTS (continued)
| Coupon | Maturity | Principal | |||
| Bonds and Notes (continued) | Rate (%) | Date | Amount ($) | Value ($) | |
| Consumer Discretionary (continued) | |||||
| Cox Communications, | |||||
| Sr. Unscd. Notes | 6.25 | 6/1/18 | 355,000 | a | 433,101 |
| CVS Pass-Through Trust, | |||||
| Pass Thru Certificates Notes | 8.35 | 7/10/31 | 553,649 | a | 778,313 |
| Hutchison Whampoa International | |||||
| (12) (II), Gtd. Notes | 2.00 | 11/8/17 | 300,000 | a | 301,548 |
| NBCUniversal Media, | |||||
| Sr. Unscd. Notes | 5.15 | 4/30/20 | 240,000 | 286,111 | |
| News America, | |||||
| Gtd. Notes | 6.65 | 11/15/37 | 175,000 | 225,886 | |
| Staples, | |||||
| Gtd. Notes | 9.75 | 1/15/14 | 170,000 | 185,981 | |
| Time Warner | |||||
| Gtd. Debs | 6.10 | 7/15/40 | 75,000 | 92,689 | |
| Time Warner, | |||||
| Gtd. Notes | 3.40 | 6/15/22 | 225,000 | 235,433 | |
| Time Warner, | |||||
| Gtd. Notes | 5.88 | 11/15/16 | 76,000 | 89,557 | |
| 2,979,042 | |||||
| Consumer Staples—.4% | |||||
| Altria Group, | |||||
| Gtd. Notes | 4.25 | 8/9/42 | 90,000 | 89,769 | |
| Altria Group, | |||||
| Gtd. Notes | 10.20 | 2/6/39 | 60,000 | 101,415 | |
| Mondelez International, | |||||
| Sr. Unscd. Notes | 6.88 | 2/1/38 | 180,000 | 248,215 | |
| SABMiller Holdings, | |||||
| Gtd. Notes | 4.95 | 1/15/42 | 200,000 | a | 231,926 |
| Walgreen, | |||||
| Sr. Unscd. Notes | 1.00 | 3/13/15 | 330,000 | 330,688 | |
| 1,002,013 | |||||
| Energy—1.0% | |||||
| Enterprise Products Operating, | |||||
| Gtd. Notes | 4.45 | 2/15/43 | 110,000 | 109,180 | |
| Enterprise Products Operating, | |||||
| Gtd. Notes, Ser. N | 6.50 | 1/31/19 | 205,000 | 259,766 | |
| EQT, | |||||
| Sr. Unscd. Notes | 8.13 | 6/1/19 | 225,000 | 281,511 |
12
| Coupon | Maturity | Principal | ||
| Bonds and Notes (continued) | Rate (%) | Date | Amount ($) | Value ($) |
| Energy (continued) | ||||
| Hess, | ||||
| Sr. Unscd. Notes | 5.60 | 2/15/41 | 105,000 | 123,998 |
| Kinder Morgan Energy Partners, | ||||
| Sr. Unscd. Notes | 6.55 | 9/15/40 | 205,000 | 258,777 |
| Pemex Project Funding Master | ||||
| Trust, Gtd. Bonds | 6.63 | 6/15/35 | 405,000 | 514,350 |
| Petrobras International Finance, | ||||
| Gtd. Notes | 5.38 | 1/27/21 | 200,000 | 225,918 |
| Petrobras International Finance, | ||||
| Gtd. Notes | 6.75 | 1/27/41 | 137,000 | 173,924 |
| Transocean, | ||||
| Gtd. Notes | 2.50 | 10/15/17 | 150,000 | 150,968 |
| Williams Partners, | ||||
| Sr. Unscd. Notes | 3.35 | 8/15/22 | 285,000 | 291,374 |
| Williams Partners, | ||||
| Sr. Unscd. Notes | 6.30 | 4/15/40 | 60,000 | 73,995 |
| 2,463,761 | ||||
| Financial—4.9% | ||||
| ACE INA Holdings, | ||||
| Gtd. Notes | 5.80 | 3/15/18 | 45,000 | 55,172 |
| Allstate, | ||||
| Sr. Unscd. Debs | 6.75 | 5/15/18 | 220,000 | 277,694 |
| AON, | ||||
| Gtd. Notes | 3.50 | 9/30/15 | 165,000 | 174,464 |
| Bank of America, | ||||
| Sr. Unscd. Notes | 5.63 | 7/1/20 | 570,000 | 674,012 |
| Bank of America, | ||||
| Sr. Unscd. Notes | 5.70 | 1/24/22 | 445,000 | 542,322 |
| Capital One Bank USA, | ||||
| Sub. Notes | 8.80 | 7/15/19 | 250,000 | 339,025 |
| Cincinnati Financial, | ||||
| Sr. Unscd. Notes | 6.13 | 11/1/34 | 169,000 | 196,985 |
| Citigroup, | ||||
| Sr. Unscd. Notes | 4.50 | 1/14/22 | 605,000 | 681,930 |
| Citigroup, | ||||
| Sr. Unscd. Notes | 6.13 | 5/15/18 | 230,000 | 275,582 |
| Duke Realty, | ||||
| Sr. Unscd. Notes | 6.75 | 3/15/20 | 20,000 | 24,242 |
The Fund 13
STATEMENT OF INVESTMENTS (continued)
| Coupon | Maturity | Principal | |||
| Bonds and Notes (continued) | Rate (%) | Date | Amount ($) | Value ($) | |
| Financial (continued) | |||||
| Duke Realty, | |||||
| Sr. Unscd. Notes | 8.25 | 8/15/19 | 195,000 | 250,092 | |
| ERAC USA Finance, | |||||
| Gtd. Notes | 7.00 | 10/15/37 | 210,000 | a | 270,625 |
| Federal Realty Investment Trust, | |||||
| Sr. Unscd. Bonds | 5.65 | 6/1/16 | 260,000 | 294,381 | |
| Ford Motor Credit, | |||||
| Sr. Unscd. Notes | 4.21 | 4/15/16 | 265,000 | 281,886 | |
| General Electric Capital, | |||||
| Sr. Unscd. Notes | 2.30 | 4/27/17 | 495,000 | 512,033 | |
| General Electric Capital, | |||||
| Sr. Unscd. Notes | 6.88 | 1/10/39 | 295,000 | 401,653 | |
| Goldman Sachs Group, | |||||
| Sr. Unscd. Notes | 5.25 | 7/27/21 | 230,000 | 263,464 | |
| Goldman Sachs Group, | |||||
| Sr. Unscd. Notes | 5.75 | 1/24/22 | 125,000 | 148,644 | |
| Harley-Davidson Funding, | |||||
| Gtd. Notes | 5.75 | 12/15/14 | 475,000 | a | 520,732 |
| Health Care REIT, | |||||
| Sr. Unscd. Notes | 5.13 | 3/15/43 | 235,000 | 232,086 | |
| Healthcare Realty Trust, | |||||
| Sr. Unscd. Notes | 5.13 | 4/1/14 | 255,000 | 267,654 | |
| HSBC Holdings, | |||||
| Sr. Unscd. Notes | 4.00 | 3/30/22 | 295,000 | 324,844 | |
| JPMorgan Chase & Co., | |||||
| Sr. Unscd. Notes | 4.50 | 1/24/22 | 420,000 | 476,070 | |
| Lincoln National, | |||||
| Sr. Unscd. Notes | 8.75 | 7/1/19 | 205,000 | 272,363 | |
| MetLife, | |||||
| Sr. Unscd. Notes | 7.72 | 2/15/19 | 180,000 | 237,193 | |
| Morgan Stanley, | |||||
| Sr. Unscd. Notes | 3.80 | 4/29/16 | 100,000 | 104,250 | |
| Morgan Stanley, | |||||
| Sr. Unscd. Notes | 5.30 | 3/1/13 | 30,000 | 30,333 | |
| Morgan Stanley, | |||||
| Sr. Unscd. Notes | 5.50 | 1/26/20 | 105,000 | 117,243 | |
| Morgan Stanley, | |||||
| Sr. Unscd. Notes | 5.50 | 7/28/21 | 225,000 | 257,755 |
14
| Coupon | Maturity | Principal | |||
| Bonds and Notes (continued) | Rate (%) | Date | Amount ($) | Value ($) | |
| Financial (continued) | |||||
| PNC Bank, | |||||
| Sub. Notes | 6.88 | 4/1/18 | 250,000 | 315,152 | |
| Principal Financial Group, | |||||
| Gtd. Notes | 8.88 | 5/15/19 | 205,000 | 280,416 | |
| Prudential Financial, | |||||
| Sr. Unscd. Notes | 5.38 | 6/21/20 | 410,000 | 482,077 | |
| Prudential Financial, | |||||
| Sr. Unscd. Notes | 6.20 | 11/15/40 | 380,000 | 465,763 | |
| Rabobank Nederland, | |||||
| Bank Gtd. Notes | 3.95 | 11/9/22 | 250,000 | 253,879 | |
| Regency Centers, | |||||
| Gtd. Notes | 5.88 | 6/15/17 | 205,000 | 238,952 | |
| Royal Bank of Scotland Group, | |||||
| Sr. Unscd. Notes | 2.55 | 9/18/15 | 225,000 | 230,384 | |
| Santander US Debt, | |||||
| Bank Gtd. Notes | 3.72 | 1/20/15 | 400,000 | a | 401,464 |
| US Bancorp, | |||||
| Sub. Notes | 2.95 | 7/15/22 | 250,000 | 256,469 | |
| WEA Finance, | |||||
| Gtd. Notes | 7.13 | 4/15/18 | 135,000 | a | 166,842 |
| Willis North America, | |||||
| Gtd. Notes | 6.20 | 3/28/17 | 215,000 | 246,307 | |
| Willis North America, | |||||
| Gtd. Notes | 7.00 | 9/29/19 | 245,000 | 294,387 | |
| 12,136,821 | |||||
| Foreign/Governmental—.4% | |||||
| Korea Finance, | |||||
| Sr. Unscd. Notes | 2.25 | 8/7/17 | 280,000 | 284,017 | |
| Province of Quebec Canada, | |||||
| Unscd. Notes | 4.60 | 5/26/15 | 85,000 | 93,691 | |
| Republic of Korea, | |||||
| Sr. Unscd. Notes | 7.13 | 4/16/19 | 100,000 | 131,736 | |
| Slovenian Government, | |||||
| Sr. Unscd. Notes | 5.50 | 10/26/22 | 385,000 | a | 385,154 |
| 894,598 | |||||
| Health Care—.1% | |||||
| Watson Pharmaceuticals, | |||||
| Sr. Unscd. Notes | 4.63 | 10/1/42 | 100,000 | 105,987 |
The Fund 15
STATEMENT OF INVESTMENTS (continued)
| Coupon | Maturity | Principal | |||
| Bonds and Notes (continued) | Rate (%) | Date | Amount ($) | Value ($) | |
| Health Care (continued) | |||||
| WellPoint, | |||||
| Sr. Unscd. Notes | 1.25 | 9/10/15 | 260,000 | 262,499 | |
| 368,486 | |||||
| Industrial—.1% | |||||
| Xerox, | |||||
| Sr. Unscd. Notes | 5.63 | 12/15/19 | 185,000 | 208,922 | |
| Materials—.3% | |||||
| Dow Chemical, | |||||
| Sr. Unscd. Notes | 4.13 | 11/15/21 | 210,000 | 229,125 | |
| Teck Resources, | |||||
| Gtd. Notes | 6.25 | 7/15/41 | 65,000 | 74,407 | |
| Vale Overseas, | |||||
| Gtd. Notes | 4.38 | 1/11/22 | 215,000 | 228,798 | |
| Vale, | |||||
| Sr. Unscd. Notes | 5.63 | 9/11/42 | 185,000 | 200,699 | |
| 733,029 | |||||
| Municipal Bonds—.2% | |||||
| Los Angeles Department of Water | |||||
| and Power, Revenue (Build | |||||
| America Bonds) | 5.72 | 7/1/39 | 120,000 | 148,770 | |
| Metropolitan Transportation | |||||
| Authority, Dedicated Tax Fund | |||||
| Revenue (Build America Bonds) | 6.09 | 11/15/40 | 10,000 | 12,978 | |
| Metropolitan Transportation | |||||
| Authority, Revenue (Build | |||||
| America Bonds) | 6.55 | 11/15/31 | 225,000 | 281,849 | |
| New York City, | |||||
| GO (Build America Bonds) | 5.99 | 12/1/36 | 135,000 | 172,812 | |
| 616,409 | |||||
| Residential Mortgage | |||||
| Pass-Through Ctfs.—.0% | |||||
| Credit Suisse First Boston | |||||
| Mortgage Securities, | |||||
| Ser. 2005-6, Cl. 1A2 | 0.48 | 7/25/35 | 98,964 | b | 82,016 |
| Telecommunications—.5% | |||||
| Cellco Partnership/Verizon | |||||
| Wireless Capital, Sr. Unscd. Notes | 8.50 | 11/15/18 | 150,000 | 207,867 | |
| Telecom Italia Capital, | |||||
| Gtd. Notes | 7.00 | 6/4/18 | 450,000 | 509,063 |
16
| Coupon | Maturity | Principal | ||||
| Bonds and Notes (continued) | Rate (%) | Date | Amount ($) | Value ($) | ||
| Telecommunications (continued) | ||||||
| Telecom Italia Capital, | ||||||
| Gtd. Notes | 7.18 | 6/18/19 | 65,000 | 74,425 | ||
| Telefonica Emisiones, | ||||||
| Gtd. Notes | 5.46 | 2/16/21 | 560,000 | 569,800 | ||
| 1,361,155 | ||||||
| U.S. Government Agencies—2.8% | ||||||
| Federal Home Loan Mortgage Corp., | ||||||
| Notes | 4.88 | 6/13/18 | 855,000 | c | 1,041,324 | |
| Federal National Mortgage | ||||||
| Association, Notes | 0.88 | 12/20/17 | 2,305,000 | c | 2,321,764 | |
| Federal National Mortgage | ||||||
| Association, Notes | 1.55 | 10/29/19 | 745,000 | c | 746,399 | |
| Federal National Mortgage | ||||||
| Association, Notes | 1.55 | 10/29/19 | 765,000 | c | 766,822 | |
| Federal National Mortgage | ||||||
| Association, Notes | 1.63 | 10/26/15 | 495,000 | c | 512,926 | |
| Federal National Mortgage | ||||||
| Association, Notes | 1.70 | 10/4/19 | 770,000 | c | 772,002 | |
| Federal National Mortgage | ||||||
| Association, Notes | 1.70 | 11/13/19 | 740,000 | c | 743,081 | |
| 6,904,318 | ||||||
| U.S. Government Agencies/ | ||||||
| Mortgage-Backed—8.1% | ||||||
| Federal Home Loan Mortgage Corp.: | ||||||
| 3.50%, 12/1/41—3/1/42 | 2,081,186 | c | 2,251,280 | |||
| 5.00%, 4/1/39 | 990,499 | c | 1,101,112 | |||
| 5.50%, 4/1/22—1/1/36 | 758,718 | c | 821,565 | |||
| Federal National Mortgage Association: | ||||||
| 3.00%, 5/1/42—10/1/42 | 3,429,051 | c | 3,622,495 | |||
| 3.50%, 12/1/41—8/1/42 | 3,859,741 | c | 4,165,046 | |||
| 4.00%, 1/1/41—12/1/41 | 4,382,690 | c | 4,720,493 | |||
| 4.50%, 2/1/39 | 212,840 | c | 229,482 | |||
| 5.00%, 8/1/20—7/1/39 | 1,774,795 | c | 1,977,298 | |||
| 5.50%, 9/1/34—5/1/40 | 529,983 | c | 596,497 | |||
| 6.00%, 10/1/37—5/1/39 | 502,897 | c | 558,971 | |||
| 8.00%, 3/1/30 | 136 | c | 140 | |||
| Government National Mortgage Association I; | ||||||
| 5.50%, 4/15/33 | 72,528 | 81,172 | ||||
| 20,125,551 | ||||||
The Fund 17
STATEMENT OF INVESTMENTS (continued)
| Coupon | Maturity | Principal | |||
| Bonds and Notes (continued) | Rate (%) | Date | Amount ($) | Value ($) | |
| U.S. Government Securities—7.0% | |||||
| U.S. Treasury Bonds: | |||||
| 3.88%, 8/15/40 | 2,105,000 | d | 2,591,781 | ||
| 4.63%, 2/15/40 | 160,000 | d | 221,250 | ||
| U.S. Treasury Notes: | |||||
| 0.13%, 7/31/14 | 1,540,000 | 1,537,113 | |||
| 0.63%, 12/31/12 | 8,290,000 | d | 8,293,888 | ||
| 0.63%, 1/31/13 | 1,100,000 | 1,101,118 | |||
| 1.75%, 5/31/16 | 1,785,000 | 1,869,091 | |||
| 2.13%, 5/31/15 | 1,475,000 | d | 1,542,067 | ||
| 2.63%, 8/15/20 | 120,000 | 132,956 | |||
| 17,289,264 | |||||
| Utilities—.6% | |||||
| Duke Energy Carolinas, | |||||
| First Mortgage Bonds | 5.25 | 1/15/18 | 95,000 | 114,133 | |
| Enel Finance International, | |||||
| Gtd. Bonds | 6.25 | 9/15/17 | 345,000 | a | 382,620 |
| Exelon Generation, | |||||
| Sr. Unscd. Notes | 6.25 | 10/1/39 | 315,000 | 366,834 | |
| Iberdrola International, | |||||
| Gtd. Notes | 6.75 | 7/15/36 | 30,000 | 32,559 | |
| Nevada Power, | |||||
| Mortgage Notes | 6.50 | 8/1/18 | 90,000 | 113,320 | |
| NiSource Finance, | |||||
| Gtd. Notes | 6.40 | 3/15/18 | 230,000 | 277,902 | |
| Sempra Energy, | |||||
| Sr. Unscd. Notes | 6.50 | 6/1/16 | 215,000 | 254,404 | |
| Sierra Pacific Power, | |||||
| Mortgage Notes, Ser. P | 6.75 | 7/1/37 | 25,000 | 35,369 | |
| 1,577,141 | |||||
| Total Bonds and Notes | |||||
| (cost $73,554,846) | 77,101,870 |
18
| Common Stocks—68.2% | Shares | Value ($) | |
| Consumer Discretionary—8.2% | |||
| American Eagle Outfitters | 25,720 | 545,264 | |
| Cabela’s | 16,350 | e | 781,039 |
| Carnival | 40,303 | 1,558,114 | |
| CBS, Cl. B | 16,750 | 602,665 | |
| Delphi Automotive | 35,450 | 1,204,946 | |
| Dollar General | 21,220 | e | 1,061,000 |
| Foot Locker | 11,850 | 424,704 | |
| General Motors | 15,210 | e | 393,635 |
| Johnson Controls | 33,650 | 926,721 | |
| Macy’s | 22,820 | 883,134 | |
| Newell Rubbermaid | 61,220 | 1,335,208 | |
| News, Cl. A | 46,500 | 1,145,760 | |
| Omnicom Group | 17,340 | 862,492 | |
| PulteGroup | 13,770 | e | 231,474 |
| PVH | 15,410 | 1,765,832 | |
| Robert Half International | 36,520 | 1,032,055 | |
| Time Warner | 27,956 | 1,322,319 | |
| Toll Brothers | 7,230 | e | 230,203 |
| Viacom, Cl. B | 17,870 | 922,271 | |
| Walt Disney | 61,980 | 3,077,927 | |
| 20,306,763 | |||
| Consumer Staples—5.3% | |||
| Beam | 6,940 | 389,403 | |
| Coca-Cola Enterprises | 22,160 | 690,949 | |
| ConAgra Foods | 61,140 | 1,825,640 | |
| CVS Caremark | 14,431 | 671,186 | |
| Dean Foods | 71,460 | e | 1,224,824 |
| Dr. Pepper Snapple Group | 8,740 | 391,989 |
The Fund 19
STATEMENT OF INVESTMENTS (continued)
| Common Stocks (continued) | Shares | Value ($) | ||
| Consumer Staples (continued) | ||||
| Kraft Foods Group | 19,600 | e | 886,312 | |
| Lowe’s | 13,770 | 496,959 | ||
| Mondelez International | 19,830 | 513,399 | ||
| PepsiCo | 19,285 | 1,354,000 | ||
| Philip Morris International | 27,780 | 2,496,866 | ||
| Unilever, ADR | 58,280 | 2,235,038 | ||
| 13,176,565 | ||||
| Energy—8.7% | ||||
| Anadarko Petroleum | 22,798 | 1,668,586 | ||
| Apache | 7,380 | 568,924 | ||
| Cameron International | 32,249 | e | 1,739,834 | |
| Chevron | 23,784 | 2,513,731 | ||
| Ensco, Cl. A | 17,400 | 1,013,202 | ||
| EOG Resources | 25,061 | 2,947,675 | ||
| Hess | 17,130 | 849,819 | ||
| Marathon Petroleum | 7,690 | 457,863 | ||
| National Oilwell Varco | 27,330 | 1,866,639 | ||
| Occidental Petroleum | 41,860 | 3,148,291 | ||
| Pentair | 2,874 | 139,360 | ||
| Phillips 66 | 14,720 | 770,886 | ||
| Schlumberger | 17,530 | 1,255,499 | ||
| TransCanada | 18,510 | 851,275 | ||
| Valero Energy | 58,410 | 1,884,307 | ||
| 21,675,891 | ||||
| Exchange-Traded Funds—1.1% | ||||
| iShares Russell 1000 Value Index Fund | 3,987 | 286,067 | ||
| Standard & Poor’s Depository | ||||
| Receipts S&P 500 ETF Trust | 16,890 | 2,400,913 | ||
| 2,686,980 | ||||
| Financial—15.5% | ||||
| Affiliated Managers Group | 8,766 | e | 1,129,674 | |
| American Express | 20,690 | 1,156,571 | ||
| American International Group | 37,100 | e | 1,229,123 | |
| American Tower | 8,130 | 609,181 | ||
| Ameriprise Financial | 37,120 | 2,252,070 | ||
| Aon | 16,048 | 911,526 |
20
| Common Stocks (continued) | Shares | Value ($) | ||
| Financial (continued) | ||||
| Bank of America | 66,570 | 656,380 | ||
| Capital One Financial | 32,080 | 1,847,808 | ||
| CBRE Group, Cl. A | 48,100 | e | 910,533 | |
| Chubb | 32,060 | 2,468,299 | ||
| Citigroup | 50,793 | 1,755,914 | ||
| Comerica | 28,030 | 829,408 | ||
| Discover Financial Services | 29,910 | 1,244,555 | ||
| Fifth Third Bancorp | 44,450 | 650,748 | ||
| Franklin Resources | 4,780 | 631,056 | ||
| Goldman Sachs Group | 10,210 | 1,202,636 | ||
| IntercontinentalExchange | 6,220 | e | 821,973 | |
| Invesco | 18,460 | 461,315 | ||
| JPMorgan Chase & Co. | 72,324 | 2,971,070 | ||
| Marsh & McLennan | 37,500 | 1,320,750 | ||
| MetLife | 33,887 | 1,124,710 | ||
| Moody’s | 51,840 | 2,518,387 | ||
| NASDAQ OMX Group | 14,370 | 348,185 | ||
| PNC Financial Services Group | 14,000 | 785,960 | ||
| Prudential Financial | 13,770 | 717,692 | ||
| SunTrust Banks | 16,280 | 442,002 | ||
| T. Rowe Price Group | 6,890 | 445,576 | ||
| TD Ameritrade Holding | 39,080 | 633,096 | ||
| U.S. Bancorp | 44,940 | 1,449,764 | ||
| Wells Fargo & Co. | 149,622 | 4,939,022 | ||
| 38,464,984 | ||||
| Health Care—10.6% | ||||
| Baxter International | 17,880 | 1,184,908 | ||
| Cigna | 27,230 | 1,423,312 | ||
| Covidien | 26,971 | 1,567,285 | ||
| Eli Lilly & Co. | 12,940 | 634,578 | ||
| Health Net | 9,650 | e | 227,257 | |
| Humana | 6,970 | 455,908 | ||
| Johnson & Johnson | 59,887 | 4,175,921 | ||
| McKesson | 16,430 | 1,552,142 | ||
| Merck & Co. | 105,940 | 4,693,142 |
The Fund 21
STATEMENT OF INVESTMENTS (continued)
| Common Stocks (continued) | Shares | Value ($) | ||
| Health Care (continued) | ||||
| Mylan | 26,860 | e | 730,055 | |
| Pfizer | 276,047 | 6,906,696 | ||
| Sanofi, ADR | 47,970 | 2,140,421 | ||
| Thermo Fisher Scientific | 8,240 | 523,652 | ||
| 26,215,277 | ||||
| Industrial—6.6% | ||||
| ADT | 5,987 | 274,803 | ||
| Cummins | 11,220 | 1,101,355 | ||
| Eaton | 42,770 | d | 2,230,883 | |
| FedEx | 26,620 | 2,383,289 | ||
| Fluor | 18,800 | 997,904 | ||
| General Electric | 286,190 | 6,047,195 | ||
| Honeywell International | 18,100 | 1,110,073 | ||
| JB Hunt Transport Services | 13,330 | 792,469 | ||
| Tyco International | 11,985 | 340,014 | ||
| Union Pacific | 9,330 | 1,145,537 | ||
| 16,423,522 | ||||
| Information Technology—9.7% | ||||
| Alliance Data Systems | 7,030 | d,e | 1,001,705 | |
| Apple | 6,901 | 4,039,017 | ||
| Ciena | 57,720 | d,e | 858,874 | |
| Cisco Systems | 84,170 | 1,591,655 | ||
| Cognizant Technology Solutions, Cl. A | 14,000 | e | 941,220 | |
| Corning | 32,230 | 394,173 | ||
| EMC | 86,120 | e | 2,137,498 | |
| Google, Cl. A | 607 | e | 423,911 | |
| International Business Machines | 6,850 | 1,301,979 |
22
| Common Stocks (continued) | Shares | Value ($) | |
| Information Technology (continued) | |||
| Oracle | 90,240 | 2,896,704 | |
| QUALCOMM | 60,680 | 3,860,462 | |
| SanDisk | 22,680 | e | 886,788 |
| Skyworks Solutions | 55,510 | e | 1,257,301 |
| Texas Instruments | 47,440 | 1,398,057 | |
| Vishay Intertechnology | 30,830 | e | 299,051 |
| VMware, Cl. A | 7,750 | e | 704,863 |
| 23,993,258 | |||
| Materials—2.3% | |||
| Celanese, Ser. A | 11,050 | 453,492 | |
| Eastman Chemical | 7,890 | 480,107 | |
| International Paper | 25,670 | 953,384 | |
| LyondellBasell Industries, Cl. A | 35,990 | 1,789,783 | |
| Monsanto | 13,410 | 1,228,222 | |
| Mosaic | 7,350 | 397,341 | |
| Packaging Corp. of America | 12,910 | 470,440 | |
| 5,772,769 | |||
| Utilities—.2% | |||
| NRG Energy | 29,030 | 612,533 | |
| Total Common Stocks | |||
| (cost $157,274,215) | 169,328,542 | ||
| Other Investment—.8% | |||
| Registered Investment Company; | |||
| Dreyfus Institutional Preferred | |||
| Plus Money Market Fund | |||
| (cost $1,957,164) | 1,957,164 | f | 1,957,164 |
The Fund 23
STATEMENT OF INVESTMENTS (continued)
| Investment of Cash Collateral | ||||
| for Securities Loaned—1.5% | Shares | Value ($) | ||
| Registered Investment Company; | ||||
| Dreyfus Institutional Cash Advantage Fund | ||||
| (cost $3,756,781) | 3,756,781 | f | 3,756,781 | |
| Total Investments (cost $236,543,006) | 101.5 | % | 252,144,357 | |
| Liabilities, Less Cash and Receivables | (1.5 | %) | (3,798,485 | ) |
| Net Assets | 100.0 | % | 248,345,872 |
ADR—American Depository Receipts
GO—General Obligation
REIT—Real Estate Investment Trust
| a Securities exempt from registration pursuant to Rule 144A under the Securities Act of 1933.These securities may be |
| resold in transactions exempt from registration, normally to qualified institutional buyers.At November 30, 2012, |
| these securities were valued at $6,390,266 or 2.6% of net assets. |
| b Variable rate security—interest rate subject to periodic change. |
| c The Federal Housing Finance Agency (“FHFA”) placed Federal Home Loan Mortgage Corporation and Federal |
| National Mortgage Association into conservatorship with FHFA as the conservator.As such, the FHFA oversees the |
| continuing affairs of these companies. |
| d Security, or portion thereof, on loan.At November 30, 2012, the value of the fund’s securities on loan was |
| $10,167,672 and the value of the collateral held by the fund was $10,402,240, consisting of cash collateral of |
| $3,756,781 and U.S. Government & Agency securities valued at $6,645,459. |
| e Non-income producing security. |
| f Investment in affiliated money market mutual fund. |
| Portfolio Summary (Unaudited)† | |||
| Value (%) | Value (%) | ||
| Common Stocks | 67.1 | Exchange-Traded Funds | 1.1 |
| U.S. Government & Agencies | 17.9 | Foreign/Governmental | .4 |
| Corporate Bonds | 9.1 | Muncipal Bonds | .2 |
| Asset/Mortgage-Backed | 3.4 | ||
| Money Market Investments | 2.3 | 101.5 | |
| † Based on net assets. | |||
| See notes to financial statements. | |||
24
STATEMENT OF ASSETS AND LIABILITIES
November 30, 2012
| Cost | Value | |||||
| Assets ($): | ||||||
| Investments in securities—See Statement of Investments (including | ||||||
| securities on loan, vlaued at $10,167,672)—Note 1(c): | ||||||
| Unaffiliated issuers | 230,829,061 | 246,430,412 | ||||
| Affiliated issuers | 5,713,945 | 5,713,945 | ||||
| Cash denominated in foreign currencies | 2,834 | 2,854 | ||||
| Receivable for investment securities sold | 1,267,747 | |||||
| Dividends, interest and securities lending income receivable | 948,676 | |||||
| Receivable for shares of Beneficial Interest subscribed | 45,628 | |||||
| Prepaid expenses | 83,242 | |||||
| 254,492,504 | ||||||
| Liabilities ($): | ||||||
| Due to The Dreyfus Corporation and affiliates—Note 3(c) | 249,437 | |||||
| Cash overdraft due to Custodian | 1,129,467 | |||||
| Liability for securities on loan—Note 1(c) | 3,756,781 | |||||
| Payable for investment securities purchased | 782,097 | |||||
| Payable for shares of Beneficial Interest redeemed | 85,983 | |||||
| Accrued expenses | 142,867 | |||||
| 6,146,632 | ||||||
| Net Assets ($) | 248,345,872 | |||||
| Composition of Net Assets ($): | ||||||
| Paid-in capital | 267,503,499 | |||||
| Accumulated undistributed investment income—net | 2,303,938 | |||||
| Accumulated net realized gain (loss) on investments | (37,062,936 | ) | ||||
| Accumulated net unrealized appreciation (depreciation) | ||||||
| on investments and foreign currency transactions | 15,601,371 | |||||
| Net Assets ($) | 248,345,872 | |||||
| Net Asset Value Per Share | ||||||
| Class A | Class C | Class J | Class I | Class Z | ||
| Net Assets ($) | 151,112,566 | 36,702,890 | 19,498,503 | 2,184,216 | 38,847,697 | |
| Shares Outstanding | 8,382,667 | 2,045,618 | 1,079,739 | 120,834 | 2,165,450 | |
| Net Asset Value | ||||||
| Per Share ($) | 18.03 | 17.94 | 18.06 | 18.08 | 17.94 | |
| See notes to financial statements. | ||||||
The Fund 25
STATEMENT OF OPERATIONS
Year Ended November 30, 2012
| Investment Income ($): | ||
| Income: | ||
| Cash dividends (net of $37,623 foreign taxes withheld at source): | ||
| Unaffiliated issuers | 3,531,199 | |
| Affiliated issuers | 2,422 | |
| Interest | 2,526,676 | |
| Income from securities lending—Note 1(c) | 24,779 | |
| Total Income | 6,085,076 | |
| Expenses: | ||
| Management fee—Note 3(a) | 2,035,054 | |
| Shareholder servicing costs—Note 3(c) | 951,702 | |
| Distribution fees—Note 3(b) | 287,749 | |
| Professional fees | 97,963 | |
| Registration fees | 91,805 | |
| Prospectus and shareholders’ reports | 66,592 | |
| Custodian fees—Note 3(c) | 47,682 | |
| Trustees’ fees and expenses—Note 3(d) | 18,810 | |
| Loan commitment fees—Note 2 | 2,289 | |
| Interest expense—Note 2 | 81 | |
| Miscellaneous | 50,840 | |
| Total Expenses | 3,650,567 | |
| Less—reduction in expenses due to undertaking—Note 3(a) | (310,587 | ) |
| Less—reduction in fees due to earnings credits—Note 3(c) | (1,212 | ) |
| Net Expenses | 3,338,768 | |
| Investment Income—Net | 2,746,308 | |
| Realized and Unrealized Gain (Loss) on Investments—Note 4 ($): | ||
| Net realized gain (loss) on investments and foreign currency transactions: | ||
| Long transactions | 10,466,987 | |
| Short transactions | (28,241 | ) |
| Net Realized Gain (Loss) | 10,438,746 | |
| Net unrealized appreciation (depreciation) on | ||
| investments and foreign currency transactions | 16,438,252 | |
| Net unrealized appreciation (depreciation) on securities sold short | 12,735 | |
| Net Unrealized Appreciation (Depreciation) | 16,450,987 | |
| Net Realized and Unrealized Gain (Loss) on Investments | 26,889,733 | |
| Net Increase in Net Assets Resulting from Operations | 29,636,041 | |
| See notes to financial statements. | ||
26
STATEMENT OF CHANGES IN NET ASSETS
| Year Ended November 30, | ||||
| 2012 | a | 2011 | ||
| Operations ($): | ||||
| Investment income—net | 2,746,308 | 3,127,871 | ||
| Net realized gain (loss) on investments | 10,438,746 | 15,713,297 | ||
| Net unrealized appreciation | ||||
| (depreciation) on investments | 16,450,987 | (7,546,546 | ) | |
| Net Increase (Decrease) in Net Assets | ||||
| Resulting from Operations | 29,636,041 | 11,294,622 | ||
| Dividends to Shareholders from ($): | ||||
| Investment income—net: | ||||
| Class A Shares | (2,154,925 | ) | (2,149,352 | ) |
| Class C Shares | (212,238 | ) | (273,965 | ) |
| Class J Shares | (340,289 | ) | (376,803 | ) |
| Class I Shares | (35,192 | ) | (41,424 | ) |
| Class Z Shares | (560,934 | ) | (654,539 | ) |
| Total Dividends | (3,303,578 | ) | (3,496,083 | ) |
| Beneficial Interest Transactions ($): | ||||
| Net proceeds from shares sold: | ||||
| Class A Shares | 9,515,684 | 37,041,200 | ||
| Class B Shares | — | 107,300 | ||
| Class C Shares | 818,506 | 1,450,159 | ||
| Class J Shares | 469,033 | 950,777 | ||
| Class I Shares | 340,527 | 192,104 | ||
| Class Z Shares | 1,314,430 | 1,535,503 | ||
| Dividends reinvested: | ||||
| Class A Shares | 1,948,618 | 1,923,684 | ||
| Class C Shares | 165,567 | 217,538 | ||
| Class J Shares | 327,476 | 363,783 | ||
| Class I Shares | 30,375 | 35,551 | ||
| Class Z Shares | 539,967 | 630,583 | ||
| Cost of shares redeemed: | ||||
| Class A Shares | (27,367,774 | ) | (33,692,275 | ) |
| Class B Shares | (5,366,168 | ) | (33,448,803 | ) |
| Class C Shares | (6,388,768 | ) | (9,298,661 | ) |
| Class J Shares | (4,864,374 | ) | (4,298,617 | ) |
| Class I Shares | (492,972 | ) | (684,108 | ) |
| Class Z Shares | (6,797,885 | ) | (7,393,539 | ) |
| Increase (Decrease) in Net Assets from | ||||
| Beneficial Interest Transactions | (35,807,758 | ) | (44,367,821 | ) |
| Total Increase (Decrease) in Net Assets | (9,475,295 | ) | (36,569,282 | ) |
| Net Assets ($): | ||||
| Beginning of Period | 257,821,167 | 294,390,449 | ||
| End of Period | 248,345,872 | 257,821,167 | ||
| Undistributed investment income—net | 2,303,938 | 2,711,079 | ||
The Fund 27
STATEMENT OF CHANGES IN NET ASSETS (continued)
| Year Ended November 30, | ||||
| 2012 | a | 2011 | ||
| Capital Share Transactions: | ||||
| Class Ab | ||||
| Shares sold | 559,569 | 2,193,958 | ||
| Shares issued for dividends reinvested | 121,258 | 115,897 | ||
| Shares redeemed | (1,596,638 | ) | (2,006,947 | ) |
| Net Increase (Decrease) in Shares Outstanding | (915,811 | ) | 302,908 | |
| Class Bb | ||||
| Shares sold | — | 6,284 | ||
| Shares redeemed | (318,052 | ) | (1,984,512 | ) |
| Net Increase (Decrease) in Shares Outstanding | (318,052 | ) | (1,978,228 | ) |
| Class C | ||||
| Shares sold | 48,040 | 85,908 | ||
| Shares issued for dividends reinvested | 10,271 | 13,083 | ||
| Shares redeemed | (374,868 | ) | (557,769 | ) |
| Net Increase (Decrease) in Shares Outstanding | (316,557 | ) | (458,778 | ) |
| Class J | ||||
| Shares sold | 27,484 | 56,555 | ||
| Shares issued for dividends reinvested | 20,365 | 21,915 | ||
| Shares redeemed | (283,455 | ) | (252,448 | ) |
| Net Increase (Decrease) in Shares Outstanding | (235,606 | ) | (173,978 | ) |
| Class I | ||||
| Shares sold | 19,978 | 11,297 | ||
| Shares issued for dividends reinvested | 1,889 | 2,140 | ||
| Shares redeemed | (28,966 | ) | (40,044 | ) |
| Net Increase (Decrease) in Shares Outstanding | (7,099 | ) | (26,607 | ) |
| Class Z | ||||
| Shares sold | 76,955 | 92,232 | ||
| Shares issued for dividends reinvested | 33,727 | 38,148 | ||
| Shares redeemed | (399,230 | ) | (442,852 | ) |
| Net Increase (Decrease) in Shares Outstanding | (288,548 | ) | (312,472 | ) |
| a Effective as of the close of business on March 13, 2012, the fund no longer offers Class B shares. |
| b During the period ended November 30, 2012, 199,789 Class B shares representing $3,344,201 were |
| automatically converted to 200,606 Class A shares and during the period ended November 30, 2011, 1,208,900 |
| Class B shares representing $20,398,678 were automatically converted to 1,206,723 Class A shares. |
See notes to financial statements.
28
FINANCIAL HIGHLIGHTS
The following tables describe the performance for each share class for the fiscal periods indicated.All information (except portfolio turnover rate) reflects financial results for a single fund share.Total return shows how much your investment in the fund would have increased (or decreased) during each period, assuming you had reinvested all dividends and distributions.These figures have been derived from the fund’s financial statements.
| Year Ended November 30, | ||||||||||
| Class A Shares | 2012 | 2011 | 2010 | 2009 | 2008 | |||||
| Per Share Data ($): | ||||||||||
| Net asset value, beginning of period | 16.26 | 15.94 | 14.96 | 12.47 | 21.28 | |||||
| Investment Operations: | ||||||||||
| Investment income—neta | .21 | .21 | .21 | .25 | .34 | |||||
| Net realized and unrealized | ||||||||||
| gain (loss) on investments | 1.79 | .35 | 1.03 | 2.62 | (5.62 | ) | ||||
| Total from Investment Operations | 2.00 | .56 | 1.24 | 2.87 | (5.28 | ) | ||||
| Distributions: | ||||||||||
| Dividends from investment income—net | (.23 | ) | (.24 | ) | (.26 | ) | (.38 | ) | (.39 | ) |
| Dividends from net realized | ||||||||||
| gain on investments | — | — | — | — | (3.14 | ) | ||||
| Total Distributions | (.23 | ) | (.24 | ) | (.26 | ) | (.38 | ) | (3.53 | ) |
| Net asset value, end of period | 18.03 | 16.26 | 15.94 | 14.96 | 12.47 | |||||
| Total Return (%)b | 12.50 | 3.46 | 8.38 | 23.77 | (29.77 | ) | ||||
| Ratios/Supplemental Data (%): | ||||||||||
| Ratio of total expenses | ||||||||||
| to average net assets | 1.37 | 1.36 | 1.37 | 1.45 | 1.29 | |||||
| Ratio of net expenses | ||||||||||
| to average net assets | 1.20 | 1.20 | 1.16 | 1.12 | 1.18 | |||||
| Ratio of net investment income | ||||||||||
| to average net assets | 1.19 | 1.23 | 1.33 | 1.89 | 2.04 | |||||
| Portfolio Turnover Rate | 117.20 | 99.71 | c | 103.49 | 134.74 | 138.66 | ||||
| Net Assets, end of period ($ x 1,000) | 151,113 | 151,210 | 143,378 | 115,445 | 73,441 | |||||
| a Based on average shares outstanding at each month end. |
| b Exclusive of sales charge. |
| c The portfolio turnover rate excluding mortgage dollar roll transactions for the period ended November 30, 2011 |
| was 97.61%. |
See notes to financial statements.
The Fund 29
FINANCIAL HIGHLIGHTS (continued)
| Year Ended November 30, | ||||||||||
| Class C Shares | 2012 | 2011 | 2010 | 2009 | 2008 | |||||
| Per Share Data ($): | ||||||||||
| Net asset value, beginning of period | 16.17 | 15.84 | 14.88 | 12.38 | 21.10 | |||||
| Investment Operations: | ||||||||||
| Investment income—neta | .08 | .08 | .09 | .15 | .22 | |||||
| Net realized and unrealized | ||||||||||
| gain (loss) on investments | 1.78 | .35 | 1.02 | 2.61 | (5.59 | ) | ||||
| Total from Investment Operations | 1.86 | .43 | 1.11 | 2.76 | (5.37 | ) | ||||
| Distributions: | ||||||||||
| Dividends from investment income—net | (.09 | ) | (.10 | ) | (.15 | ) | (.26 | ) | (.21 | ) |
| Dividends from net realized | ||||||||||
| gain on investments | — | — | — | — | (3.14 | ) | ||||
| Total Distributions | (.09 | ) | (.10 | ) | (.15 | ) | (.26 | ) | (3.35 | ) |
| Net asset value, end of period | 17.94 | 16.17 | 15.84 | 14.88 | 12.38 | |||||
| Total Return (%)b | 11.58 | 2.70 | 7.50 | 22.68 | (30.22 | ) | ||||
| Ratios/Supplemental Data (%): | ||||||||||
| Ratio of total expenses | ||||||||||
| to average net assets | 2.08 | 2.04 | 2.05 | 2.12 | 2.01 | |||||
| Ratio of net expenses | ||||||||||
| to average net assets | 1.95 | 1.94 | 1.91 | 1.88 | 1.90 | |||||
| Ratio of net investment income | ||||||||||
| to average net assets | .44 | .48 | .58 | 1.16 | 1.32 | |||||
| Portfolio Turnover Rate | 117.20 | 99.71 | c | 103.49 | 134.74 | 138.66 | ||||
| Net Assets, end of period ($ x 1,000) | 36,703 | 38,205 | 44,683 | 50,170 | 44,224 | |||||
| a Based on average shares outstanding at each month end. |
| b Exclusive of sales charge. |
| c The portfolio turnover rate excluding mortgage dollar roll transactions for the period ended November 30, 2011 |
| was 97.61%. |
See notes to financial statements.
30
| Year Ended November 30, | ||||||||||
| Class J Shares | 2012 | 2011 | 2010 | 2009 | 2008 | |||||
| Per Share Data ($): | ||||||||||
| Net asset value, beginning of period | 16.29 | 15.96 | 14.97 | 12.52 | 21.38 | |||||
| Investment Operations: | ||||||||||
| Investment income—neta | .23 | .23 | .22 | .26 | .40 | |||||
| Net realized and unrealized | ||||||||||
| gain (loss) on investments | 1.80 | .36 | 1.03 | 2.63 | (5.65 | ) | ||||
| Total from Investment Operations | 2.03 | .59 | 1.25 | 2.89 | (5.25 | ) | ||||
| Distributions: | ||||||||||
| Dividends from investment income—net | (.26 | ) | (.26 | ) | (.26 | ) | (.44 | ) | (.47 | ) |
| Dividends from net realized | ||||||||||
| gain on investments | — | — | — | — | (3.14 | ) | ||||
| Total Distributions | (.26 | ) | (.26 | ) | (.26 | ) | (.44 | ) | (3.61 | ) |
| Net asset value, end of period | 18.06 | 16.29 | 15.96 | 14.97 | 12.52 | |||||
| Total Return (%) | 12.67 | 3.64 | 8.50 | 23.81 | (29.53 | ) | ||||
| Ratios/Supplemental Data (%): | ||||||||||
| Ratio of total expenses | ||||||||||
| to average net assets | 1.06 | 1.03 | 1.02 | 1.06 | .99 | |||||
| Ratio of net expenses | ||||||||||
| to average net assets | 1.06 | 1.03 | 1.02 | 1.05 | .88 | |||||
| Ratio of net investment income | ||||||||||
| to average net assets | 1.33 | 1.39 | 1.46 | 1.99 | 2.34 | |||||
| Portfolio Turnover Rate | 117.20 | 99.71 | b | 103.49 | 134.74 | 138.66 | ||||
| Net Assets, end of period ($ x 1,000) | 19,499 | 21,430 | 23,767 | 25,858 | 27,178 | |||||
| a Based on average shares outstanding at each month end. |
| b The portfolio turnover rate excluding mortgage dollar roll transactions for the period ended November 30, 2011 |
| was 97.61%. |
See notes to financial statements.
The Fund 31
FINANCIAL HIGHLIGHTS (continued)
| Year Ended November 30, | ||||||||||
| Class I Shares | 2012 | 2011 | 2010 | 2009 | 2008 | |||||
| Per Share Data ($): | ||||||||||
| Net asset value, beginning of period | 16.31 | 15.97 | 14.97 | 12.47 | 21.28 | |||||
| Investment Operations: | ||||||||||
| Investment income—neta | .25 | .25 | .24 | .36 | .37 | |||||
| Net realized and unrealized | ||||||||||
| gain (loss) on investments | 1.80 | .36 | 1.03 | 2.56 | (5.61 | ) | ||||
| Total from Investment Operations | 2.05 | .61 | 1.27 | 2.92 | (5.24 | ) | ||||
| Distributions: | ||||||||||
| Dividends from investment income—net | (.28 | ) | (.27 | ) | (.27 | ) | (.42 | ) | (.43 | ) |
| Dividends from net realized | ||||||||||
| gain on investments | — | — | — | — | (3.14 | ) | ||||
| Total Distributions | (.28 | ) | (.27 | ) | (.27 | ) | (.42 | ) | (3.57 | ) |
| Net asset value, end of period | 18.08 | 16.31 | 15.97 | 14.97 | 12.47 | |||||
| Total Return (%) | 12.75 | 3.77 | 8.64 | 24.15 | (29.57 | ) | ||||
| Ratios/Supplemental Data (%): | ||||||||||
| Ratio of total expenses | ||||||||||
| to average net assets | 1.09 | 1.04 | 1.04 | 1.20 | 1.07 | |||||
| Ratio of net expenses | ||||||||||
| to average net assets | .95 | .94 | .90 | .85 | .96 | |||||
| Ratio of net investment income | ||||||||||
| to average net assets | 1.45 | 1.48 | 1.58 | 2.63 | 2.25 | |||||
| Portfolio Turnover Rate | 117.20 | 99.71 | b | 103.49 | 134.74 | 138.66 | ||||
| Net Assets, end of period ($ x 1,000) | 2,184 | 2,086 | 2,468 | 2,128 | 274 | |||||
| a Based on average shares outstanding at each month end. |
| b The portfolio turnover rate excluding mortgage dollar roll transactions for the period ended November 30, 2011 |
| was 97.61%. |
See notes to financial statements.
32
| Year Ended November 30, | ||||||||||
| Class Z Shares | 2012 | 2011 | 2010 | 2009 | 2008 | |||||
| Per Share Data ($): | ||||||||||
| Net asset value, beginning of period | 16.20 | 15.88 | 14.90 | 12.46 | 21.30 | |||||
| Investment Operations: | ||||||||||
| Investment income—neta | .19 | .21 | .21 | .24 | .37 | |||||
| Net realized and unrealized | ||||||||||
| gain (loss) on investments | 1.78 | .35 | 1.03 | 2.62 | (5.61 | ) | ||||
| Total from Investment Operations | 1.97 | .56 | 1.24 | 2.86 | (5.24 | ) | ||||
| Distributions: | ||||||||||
| Dividends from investment income—net | (.23 | ) | (.24 | ) | (.26 | ) | (.42 | ) | (.46 | ) |
| Dividends from net realized | ||||||||||
| gain on investments | — | — | — | — | (3.14 | ) | ||||
| Total Distributions | (.23 | ) | (.24 | ) | (.26 | ) | (.42 | ) | (3.60 | ) |
| Net asset value, end of period | 17.94 | 16.20 | 15.88 | 14.90 | 12.46 | |||||
| Total Return (%) | 12.34 | 3.49 | 8.43 | 23.63 | (29.61 | ) | ||||
| Ratios/Supplemental Data (%): | ||||||||||
| Ratio of total expenses | ||||||||||
| to average net assets | 1.28 | 1.19 | 1.12 | 1.18 | 1.09 | |||||
| Ratio of net expenses | ||||||||||
| to average net assets | 1.28 | 1.19 | 1.12 | 1.16 | .98 | |||||
| Ratio of net investment income | ||||||||||
| to average net assets | 1.11 | 1.23 | 1.37 | 1.88 | 2.24 | |||||
| Portfolio Turnover Rate | 117.20 | 99.71 | b | 103.49 | 134.74 | 138.66 | ||||
| Net Assets, end of period ($ x 1,000) | 38,848 | 39,744 | 43,924 | 47,532 | 44,768 | |||||
| a Based on average shares outstanding at each month end. |
| b The portfolio turnover rate excluding mortgage dollar roll transactions for the period ended November 30, 2011 |
| was 97.61%. |
See notes to financial statements.
The Fund 33
NOTES TO FINANCIAL STATEMENTS
NOTE 1—Significant Accounting Policies:
Dreyfus Balanced Opportunity Fund (the “fund”) is the sole series of Dreyfus Manager Funds II (the “Company”), which is registered under the Investment Company Act of 1940, as amended (the “Act”), as a diversified open-end management investment company. The fund’s investment objective is to seek a high total return through a combination of capital appreciation and current income.The Dreyfus Corporation (the “Manager” or “Dreyfus”), a wholly-owned subsidiary of The Bank of New York Mellon Corporation (“BNY Mellon”), serves as the fund’s investment adviser.
MBSC Securities Corporation (the “Distributor”), a wholly-owned subsidiary of the Manager, is the distributor of the fund’s shares.The fund is authorized to issue an unlimited number of $.001 par value shares of Beneficial Interest in each of the following classes of shares: Class A, Class C, Class J, Class I and Class Z. Class A shares are subject to a sales charge imposed at the time of purchase. Class C shares are subject to a contingent deferred sales charge (“CDSC”) imposed on Class C shares redeemed within one year of purchase. Class J, Class I and Class Z shares are sold at net asset value per share. Class I shares are sold only to institutional investors and Class J and Class Z shares are closed to new investors. Class B shares were subject to a CDSC imposed on Class B share redemptions made within six years of purchase and automatically converted to Class A shares after six years.The fund no longer offers Class B shares. Effective March 13, 2012, all outstanding Class B shares were automatically converted to Class A shares. Other differences between the classes include the services offered to and the expenses borne by each class, the allocation of certain transfer agency costs and certain voting rights. Income, expenses (other than expenses attributable to a specific class), and realized and unrealized gains or losses on investments are allocated to each class of shares based on its relative net assets.
34
The Company accounts separately for the assets, liabilities and operations of each series. Expenses directly attributable to each series are charged to that series’ operation; expenses which are applicable to all series are allocated among them on a pro rata basis.
The Financial Accounting Standards Board (“FASB”) Accounting Standards Codification is the exclusive reference of authoritative U.S. generally accepted accounting principles (“GAAP”) recognized by the FASB to be applied by nongovernmental entities. Rules and interpretive releases of the Securities and Exchange Commission (“SEC”) under authority of federal laws are also sources of authoritative GAAP for SEC registrants. The fund’s financial statements are prepared in accordance with GAAP, which may require the use of management estimates and assumptions.Actual results could differ from those estimates.
The Company enters into contracts that contain a variety of indemnifications.The fund’s maximum exposure under these arrangements is unknown.The fund does not anticipate recognizing any loss related to these arrangements.
(a) Portfolio valuation: The fair value of a financial instrument is the amount that would be received to sell an asset or paid to transfer a liability in an orderly transaction between market participants at the measurement date (i.e., the exit price). GAAP establishes a fair value hierarchy that prioritizes the inputs of valuation techniques used to measure fair value.This hierarchy gives the highest priority to unadjusted quoted prices in active markets for identical assets or liabilities (Level 1 measurements) and the lowest priority to unobservable inputs (Level 3 measurements).
Additionally, GAAP provides guidance on determining whether the volume and activity in a market has decreased significantly and whether such a decrease in activity results in transactions that are not
The Fund 35
NOTES TO FINANCIAL STATEMENTS (continued)
orderly. GAAP requires enhanced disclosures around valuation inputs and techniques used during annual and interim periods.
Various inputs are used in determining the value of the fund’s investments relating to fair value measurements.These inputs are summarized in the three broad levels listed below:
Level 1—unadjusted quoted prices in active markets for identical investments.
Level 2—other significant observable inputs (including quoted prices for similar investments, interest rates, prepayment speeds, credit risk, etc.).
Level 3—significant unobservable inputs (including the fund’s own assumptions in determining the fair value of investments).
The inputs or methodology used for valuing securities are not necessarily an indication of the risk associated with investing in those securities.
Changes in valuation techniques may result in transfers in or out of an assigned level within the disclosure hierarchy. Valuation techniques used to value the fund’s investments are as follows:
Investments in equity securities are valued at the last sales price on the securities exchange or national securities market on which such securities are primarily traded. Securities listed on the National Market System for which market quotations are available are valued at the official closing price or, if there is no official closing price that day, at the last sales price. Securities not listed on an exchange or the national securities market, or securities for which there were no transactions, are valued at the average of the most recent bid and asked prices, except for open short positions, where the asked price is used for valuation purposes. Bid price is used when no asked price is available. Registered investment companies that are not traded on an exchange are valued at their net asset value. All of the preceding securities are categorized within Level 1 of the fair value hierarchy.
Investments in debt securities excluding short-term investments (other than U.S.Treasury Bills), are valued each business day by an indepen-
36
dent pricing service (the “Service”) approved by the Company’s Board of Trustees (the “Board”). Investments for which quoted bid prices are readily available and are representative of the bid side of the market in the judgment of the Service are valued at the mean between the quoted bid prices (as obtained by the Service from dealers in such securities) and asked prices (as calculated by the Service based upon its evaluation of the market for such securities). Other investments are valued as determined by the Service, based on methods which include consideration of the following: yields or prices of securities of comparable quality, coupon, maturity and type; indications as to values from dealers; and general market conditions. These securities are generally categorized within Level 2 of the fair value hierarchy.
The Service’s procedures are reviewed by Dreyfus under the general supervision of the Board.
Fair valuing of securities may be determined with the assistance of a pricing service using calculations based on indices of domestic securities and other appropriate indicators, such as prices of relevant ADRs and financial futures. Utilizing these techniques may result in transfers between Level 1 and Level 2 of the fair value hierarchy.
When market quotations or official closing prices are not readily available, or are determined not to reflect accurately fair value, such as when the value of a security has been significantly affected by events after the close of the exchange or market on which the security is principally traded (for example, a foreign exchange or market), but before the fund calculates its net asset value, the fund may value these investments at fair value as determined in accordance with the procedures approved by the Board. Certain factors may be considered when fair valuing investments such as: fundamental analytical data, the nature and duration of restrictions on disposition, an evaluation of the forces that influence the market in which the securities are purchased and sold, and public trading in similar securities of the issuer or comparable issuers. These securities are either categorized within Level 2 or 3 depending on the relevant inputs used.
The Fund 37
NOTES TO FINANCIAL STATEMENTS (continued)
For restricted securities where observable inputs are limited, assumptions about market activity and risk are used and are categorized within Level 3 of the fair value hierarchy.
Investments denominated in foreign currencies are translated to U.S. dollars at the prevailing rates of exchange.
The following is a summary of the inputs used as of November 30, 2012 in valuing the fund’s investments:
| Level 2—Other | Level 3— | |||
| Level 1— | Significant | Significant | ||
| Unadjusted | Observable | Unobservable | ||
| Quoted Prices | Inputs | Inputs | Total | |
| Assets ($) | ||||
| Investments in Securities: | ||||
| Asset-Backed | — | 4,230,185 | — | 4,230,185 |
| Commercial | ||||
| Mortgage-Backed | — | 4,129,159 | — | 4,129,159 |
| Corporate Bonds† | — | 22,830,370 | — | 22,830,370 |
| Equity Securities— | ||||
| Domestic | ||||
| Common Stocks† | 160,401,626 | — | — | 160,401,626 |
| Equity Securities— | ||||
| Foreign | ||||
| Common Stocks† | 6,239,936 | — | — | 6,239,936 |
| Exchange-Traded | ||||
| Funds | 2,686,980 | — | — | 2,686,980 |
| Foreign Government | — | 894,598 | — | 894,598 |
| Municipal Bonds | — | 616,409 | — | 616,409 |
| Mutual Funds | 5,713,945 | — | — | 5,713,945 |
| Residential | ||||
| Mortgage-Backed | — | 82,016 | — | 82,016 |
| U.S. Government | ||||
| Agencies/ | ||||
| Mortgage-Backed | — | 27,029,869 | — | 27,029,869 |
| U.S. Treasury | — | 17,289,264 | — | 17,289,264 |
† See Statement of Investments for additional detailed categorizations.
At November 30, 2012, there were no transfers between Level 1 and Level 2 of the fair value hierarchy.
38
(b) Foreign currency transactions: The fund does not isolate that portion of the results of operations resulting from changes in foreign exchange rates on investments from the fluctuations arising from changes in the market prices of securities held. Such fluctuations are included with the net realized and unrealized gain or loss on investments.
Net realized foreign exchange gains or losses arise from sales of foreign currencies, currency gains or losses realized on securities transactions between trade and settlement date, and the difference between the amounts of dividends, interest and foreign withholding taxes recorded on the fund’s books and the U.S. dollar equivalent of the amounts actually received or paid. Net unrealized foreign exchange gains and losses arise from changes in the value of assets and liabilities other than investments resulting from changes in exchange rates. Foreign currency gains and losses on investments are also included with net realized and unrealized gain or loss on investments.
(c) Securities transactions and investment income: Securities transactions are recorded on a trade date basis. Realized gains and losses from securities transactions are recorded on the identified cost basis. Dividend income is recognized on the ex-dividend date and interest income, including, where applicable, accretion of discount and amortization of premium on investments, is recognized on the accrual basis.
Pursuant to a securities lending agreement with The Bank of New York Mellon, a subsidiary of BNY Mellon and an affiliate of Dreyfus, the fund may lend securities to qualified institutions. It is the fund’s policy that, at origination, all loans are secured by collateral of at least 102% of the value of U.S. securities loaned and 105% of the value of foreign securities loaned. Collateral equivalent to at least 100% of the market value of securities on loan is maintained at all times. Collateral is either in the form of cash, which can be invested in certain money market mutual funds managed by the Manager, U.S. Government and Agency securities or letters of credit.The fund is entitled to receive all
The Fund 39
NOTES TO FINANCIAL STATEMENTS (continued)
income on securities loaned, in addition to income earned as a result of the lending transaction. Although each security loaned is fully collateralized, the fund bears the risk of delay in recovery of, or loss of rights in, the securities loaned should a borrower fail to return the securities in a timely manner. During the period ended November 30, 2012, The Bank of New York Mellon earned $10,620 from lending portfolio securities, pursuant to the securities lending agreement.
(d) Affiliated issuers: Investments in other investment companies advised by Dreyfus are defined as “affiliated” in the Act. Investments in affiliated investment companies for the period ended November 30, 2012 were as follows:
| Affiliated | |||||||
| Investment | Value | Value | Net | ||||
| Company | 11/30/2011 | ($) | Purchases ($) | Sales ($) | 11/30/2012($) | Assets (%) | |
| Dreyfus | |||||||
| Institutional | |||||||
| Preferred | |||||||
| Plus Money | |||||||
| Market Fund | 4,922,203 | 63,869,230 | 66,834,269 | 1,957,164 | .8 | ||
| Dreyfus | |||||||
| Institutional | |||||||
| Cash | |||||||
| Advantage | |||||||
| Fund | 3,411,513 | 64,507,882 | 64,162,614 | 3,756,781 | 1.5 | ||
| Total | 8,333,716 | 128,377,112 | 130,996,883 | 5,713,945 | 2.3 |
(e) Dividends to shareholders: Dividends are recorded on the ex-dividend date. Dividends from investment income-net and dividends from net realized capital gains, if any, are normally declared and paid annually, but the fund may make distributions on a more frequent basis to comply with the distribution requirements of the Internal Revenue Code of 1986, as amended (the “Code”). To the extent that net realized capital gains can be offset by capital loss carryovers, it is the policy of the fund not to distribute such gains. Income and capital gain distributions are determined in accordance with income tax regulations, which may differ from GAAP.
40
(f) Federal income taxes: It is the policy of the fund to continue to qualify as a regulated investment company, if such qualification is in the best interests of its shareholders, by complying with the applicable provisions of the Code, and to make distributions of taxable income sufficient to relieve it from substantially all federal income and excise taxes.
As of and during the period ended November 30, 2012, the fund did not have any liabilities for any uncertain tax positions.The fund recognizes interest and penalties, if any, related to uncertain tax positions as income tax expense in the Statement of Operations. During the period, the fund did not incur any interest or penalties.
Each of the tax years in the four-year period ended November 30, 2012 remains subject to examination by the Internal Revenue Service and state taxing authorities.
At November 30, 2012, the components of accumulated earnings on a tax basis were as follows: undistributed ordinary income $2,303,938, accumulated capital losses $35,108,911 and unrealized appreciation $13,647,346.
Under the Regulated Investment Company Modernization Act of 2010 (the “2010 Act”), the fund is permitted to carry forward capital losses incurred in taxable years beginning after December 22, 2010 (“post-enactment losses”) for an unlimited period. Furthermore, post-enactment capital loss carryovers retain their character as either short-term or long-term capital losses rather than short-term as they were under previous statute.The 2010 Act requires post-enactment losses to be utilized before the utilization of losses incurred in taxable years prior to the effective date of the 2010 Act (“pre-enactment losses”).As a result of this ordering rule, pre-enactment losses may be more likely to expire unused.
The accumulated capital loss carryover is available for federal income tax purposes to be applied against future net realized capital gains, if any, realized subsequent to November 30, 2012. If not applied, $3,291,121
The Fund 41
NOTES TO FINANCIAL STATEMENTS (continued)
of the carryover expires in fiscal year 2016, $31,310,452 expires in fiscal year 2017, $359,386 expires in fiscal year 2018 and $147,952 expires in fiscal year 2019.
The tax character of distributions paid to shareholders during the fiscal periods ended November 30, 2012 and November 30, 2011 were as follows: ordinary income $3,303,578 and $3,496,083, respectively.
During the period ended November 30, 2012, as a result of permanent book to tax differences, primarily due to the tax treatment for paydown gains and losses on mortgage-backed securities and consent fees, the fund increased accumulated undistributed investment income-net by $150,129 and decreased accumulated net realized gain (loss) on investments by the same amount. Net assets and net asset value per share were not affected by this reclassification.
NOTE 2—Bank Lines of Credit:
The fund participates with other Dreyfus-managed funds in a $210 million unsecured credit facility led by Citibank, N.A. and a $300 million unsecured credit facility provided by The Bank of New York Mellon (each, a “Facility”), each to be utilized primarily for temporary or emergency purposes, including the financing of redemptions. Prior to October 10, 2012, the unsecured credit facility with Citibank, N.A., was $225 million. In connection therewith, the fund has agreed to pay its pro rata portion of commitment fees for each Facility. Interest is charged to the fund based on rates determined pursuant to the terms of the respective Facility at the time of borrowing.
The average amount of borrowings outstanding under the Facilities during the period ended November 30, 2012, was approximately $6,800 with a related weighted average annualized interest rate of 1.18%.
NOTE 3—Management Fee and Other Transactions With Affiliates:
(a) Pursuant to a management agreement with the Manager, the management fee is computed at the annual rate of .80% of the value of the fund’s average daily net assets and is payable monthly.The Manager has
42
contractually agreed, from December 1, 2011 through April 1, 2013, to waive receipt of its fees and/or assume the expenses of the fund, so that the net operating expenses of the fund’s Class A, C and I shares (excluding Rule 12b-1 Distribution Plan fees, Shareholder Services Plan fees, taxes, interest expense, brokerage commissions, commitment fees on borrowings and extraordinary expenses) do not exceed an annual rate of .95% of the value of the average daily net assets of their class. The reduction in expenses, pursuant to the undertaking, amounted to $310,587 during the period ended November 30, 2012.
During the period ended November 30, 2012, the Distributor retained $11,074 from commissions earned on sales of the fund’s Class A shares and $282 and $2,048 from CDSCs on redemptions of the fund’s Class B and Class C shares, respectively.
(b) Under the Distribution Plan adopted pursuant to Rule 12b-1 under the Act, Class B shares paid and Class C shares pay the Distributor for distributing their shares at an annual rate of .75% of the value of the average daily net assets of Class B and Class C shares. During the period ended November 30, 2012, Class B and Class C shares were charged $6,148 and $281,601, respectively, pursuant to the Distribution Plan.
(c) Under the Shareholder Services Plan, Class A and Class C shares pay and Class B shares paid the Distributor at an annual rate of .25% of the value of their average daily net assets for the provision of certain services.The services provided may include personal services relating to shareholder accounts, such as answering shareholder inquiries regarding the fund and providing reports and other information, and services related to the maintenance of shareholder accounts. The Distributor may make payments to Service Agents (securities dealers, financial institutions or other industry professionals) with respect to these services.The Distributor determines the amounts to be paid to Service Agents. During the period ended November 30, 2012, Class A, Class B and Class C shares were charged $383,227, $2,050 and $93,867, respectively, pursuant to the Shareholder Services Plan.
The Fund 43
NOTES TO FINANCIAL STATEMENTS (continued)
Under the Shareholder Services Plan with respect to Class Z (“Class Z Shareholder Services Plan”), Class Z shares reimburse the Distributor an amount not to exceed an annual rate of .25% of the value of Class Z shares’ average daily net assets for certain allocated expenses of providing personal services and/or maintaining shareholder accounts.The services provided may include personal services relating to shareholder accounts, such as answering shareholder inquiries regarding Class Z shares and providing reports and other information, and services related to the maintenance of shareholder accounts. During the period ended November 30, 2012, Class Z shares were charged $60,573, pursuant to the Class Z Shareholder Services Plan.
The fund has arrangements with the transfer agent and the custodian whereby the fund may receive earnings credits when positive cash balances are maintained, which are used to offset transfer agency and custody fees. For financial reporting purposes, the fund includes net earnings credits as an expense offset in the Statement of Operations.
The fund compensates Dreyfus Transfer, Inc., a wholly-owned subsidiary of the Manager, under a transfer agency agreement for providing transfer agency services for the fund and, since May 29, 2012, cash management services related to fund subscriptions and redemptions. During the period ended November 30, 2012, the fund was charged $158,080 for transfer agency services and $6,002 for cash management services. Cash management fees were partially offset by earnings credits of $748.These fees are included in Shareholder servicing costs in the Statement of Operations.
The fund compensatesThe Bank of NewYork Mellon under a custody agreement for providing custodial services for the fund. During the period ended November 30, 2012, the fund was charged $47,682 pursuant to the custody agreement.
Prior to May 29, 2012, the fund compensated The Bank of New York Mellon under a cash management agreement for performing cash management services related to fund subscriptions and redemptions. During
44
the period ended November 30, 2012, the fund was charged $12,668 pursuant to the cash management agreement, which is included in Shareholder servicing costs in the Statement of Operations.These fees were partially offset by earnings credits of $464.
During the period ended November 30, 2012, the fund was charged $8,650 for services performed by the Chief Compliance Officer and his staff.
The components of “Due to The Dreyfus Corporation and affiliates” in the Statement of Assets and Liabilities consist of: management fees $161,318, Distribution Plan fees $22,347, Shareholder Services Plan fees $38,084, custodian fees $16,011, Chief Compliance Officer fees $3,318 and transfer agency fees $34,530, which are offset against an expense reimbursement currently in effect in the amount of $26,171.
(d) Each Board member also serves as a Board member of other funds within the Dreyfus complex. Annual retainer fees and attendance fees are allocated to each fund based on net assets.
NOTE 4—Securities Transactions:
The aggregate amount of purchases and sales (including paydowns) of investment securities and securities sold short, excluding short-term securities, during the period ended November 30, 2012 was as follows:
| Purchases ($) | Sales ($) | |
| Long transactions | 295,398,327 | 332,108,034 |
| Short sale transactions | 6,401,622 | — |
| Total | 301,799,949 | 332,108,034 |
Short Sales: The fund is engaged in short-selling which obligates the fund to replace the security borrowed by purchasing the security at current market value.The fund incurs a loss if the price of the security increases between the date of the short sale and the date on which the fund replaces the borrowed security. The fund realizes a gain if the price of the security declines between those dates. Until the fund
The Fund 45
NOTES TO FINANCIAL STATEMENTS (continued)
replaces the borrowed security, the fund will maintain daily a segregated account with a broker or custodian of permissible liquid assets sufficient to cover its short positions. At November 30, 2012, there were no securities sold short.
At November 30, 2012, the cost of investments for federal income tax purposes was $238,497,031; accordingly, accumulated net unrealized appreciation on investments was $13,647,326, consisting of $21,342,948 gross unrealized appreciation and $7,695,622 gross unrealized depreciation.
46
REPORT OF INDEPENDENT REGISTERED
PUBLIC ACCOUNTING FIRM
Shareholders and Board of Trustees
Dreyfus Balanced Opportunity Fund
We have audited the accompanying statement of assets and liabilities, including the statement of investments, of Dreyfus Balanced Opportunity Fund (the sole series comprising Dreyfus Manager Funds II) as of November 30, 2012, and the related statement of operations for the year then ended, the statement of changes in net assets for each of the two years in the period then ended, and the financial highlights for each of the five years in the period then ended.These financial statements and financial highlights are the responsibility of the Fund’s management. Our responsibility is to express an opinion on these financial statements and financial highlights based on our audits.
We conducted our audits in accordance with the standards of the Public Company Accounting Oversight Board (United States).Those standards require that we plan and perform the audit to obtain reasonable assurance about whether the financial statements and financial highlights are free of material misstatement.We were not engaged to perform an audit of the Fund’s internal control over financial reporting. Our audits included consideration of internal control over financial reporting as a basis for designing audit procedures that are appropriate in the circumstances, but not for the purpose of expressing an opinion on the effectiveness of the Fund’s internal control over financial reporting. Accordingly, we express no such opinion.An audit also includes examining, on a test basis, evidence supporting the amounts and disclosures in the financial statements and financial highlights, assessing the accounting principles used and significant estimates made by management, and evaluating the overall financial statement presentation. Our procedures included confirmation of securities owned as of November 30, 2012 by correspondence with the custodian and others. We believe that our audits provide a reasonable basis for our opinion.
In our opinion, the financial statements and financial highlights referred to above present fairly, in all material respects, the financial position of Dreyfus Balanced Opportunity Fund at November 30, 2012, the results of its operations for the year then ended, the changes in its net assets for each of the two years in the period then ended, and the financial highlights for each of the five years in the period then ended, in conformity with U.S. generally accepted accounting principles.

New York, New York
January 28, 2013
The Fund 47
IMPORTANT TAX INFORMATION (Unaudited)
For federal tax purposes the fund hereby reports 94.30% of the ordinary dividends paid during the fiscal year ended November 30, 2012 as qualifying for the corporate dividends received deduction.Also certain dividends paid by the fund may be subject to a maximum tax rate of 15%, as provided for by the Jobs and Growth Tax Relief Reconciliation Act of 2003. Of the distributions paid during the fiscal year, $3,303,578 represents the maximum amount that may be considered qualified dividend income. Shareholders will receive notification in early 2013 of the percentage applicable to the preparation of their 2012 income tax returns.
48
PROXY RESULTS (Unaudited)
The Company held a special meeting of shareholders on August 3, 2012.The proposal considered at the meeting, and the results, are as follows:
| Shares | |||
| Votes For | Authority Withheld | ||
| To elect additional Board Members: | |||
| Lynn Martin† | 10,608,413 | 406,727 | |
| Robin A. Melvin† | 10,629,072 | 386,068 | |
| Philip L. Toia† | 10,591,829 | 423,311 |
† Each new Board Member’s term commenced on September 1, 2012.
In addition Peggy C. Davis, Joseph S. DiMartino, David P. Feldman, Ehud Houminer and Dr. Martin Peretz continue as Board Members of the Company.
The Fund 49
BOARD MEMBERS INFORMATION (Unaudited)
| Joseph S. DiMartino (69) |
| Chairman of the Board (2003) |
| Principal Occupation During Past 5Years: |
| • Corporate Director and Trustee |
| Other Public Company Board Memberships During Past 5Years: |
| • CBIZ (formerly, Century Business Services, Inc.), a provider of outsourcing functions for small |
| and medium size companies, Director (1997-present) |
| • Sunair Services Corporation, a provider of certain outdoor-related services to homes and |
| businesses, Director (2005-2009) |
| • The Newark Group, a provider of a national market of paper recovery facilities, paperboard |
| mills and paperboard converting plants, Director (2000-2010) |
| No. of Portfolios for which Board Member Serves: 157 |
| ——————— |
| Peggy C. Davis (69) |
| Board Member (2006) |
| Principal Occupation During Past 5Years: |
| • Shad Professor of Law, New York University School of Law (1983-present) |
| No. of Portfolios for which Board Member Serves: 63 |
| ——————— |
| David P. Feldman (73) |
| Board Member (2003) |
| Principal Occupation During Past 5Years: |
| • Corporate Director and Trustee |
| Other Public Company Board Memberships During Past 5Years: |
| • BBH Mutual Funds Group (4 registered mutual funds), Director (1992-present) |
| • QMed, Inc. a healthcare company, Director (1999-2007) |
| No. of Portfolios for which Board Member Serves: 46 |
| ——————— |
| Ehud Houminer (72) |
| Board Member (2006) |
| Principal Occupation During Past 5Years: |
| • Executive-in-Residence at the Columbia Business School, Columbia University (1992-present) |
| Other Public Company Board Memberships During Past 5Years: |
| • Avnet Inc., an electronics distributor, Director (1993-2012) |
| No. of Portfolios for which Board Member Serves: 73 |
50
| Lynn Martin (72) |
| Board Member (2012) |
| Principal Occupation During Past 5Years: |
| • President of The Martin Hall Group LLC, a human resources consulting firm, from January |
| 2005-present |
| Other Public Company Board Memberships During Past 5Years: |
| • AT&T Inc., a telecommunications company, Director (1999-2012) |
| • Ryder System, Inc., a supply chain and transportation management company, Director (1993-2012) |
| • The Proctor & Gamble Co., a consumer products company, Director (1994-2009) |
| • Constellation Energy Group Inc., Director (2003-2009) |
| No. of Portfolios for which Board Member Serves: 46 |
| ——————— |
| Robin A. Melvin (49) |
| Board Member (2012) |
| Principal Occupation During Past 5Years: |
| • Director, Boisi Family Foundation, a private family foundation that supports youth-serving orga- |
| nizations that promote the self sufficiency of youth from disadvantaged circumstances (1995-2012) |
| No. of Portfolios for which Board Member Serves: 100 |
| ——————— |
| Dr. Martin Peretz (73) |
| Board Member (2006) |
| Principal Occupation During Past 5Years: |
| • Editor-in-Chief Emeritus of The New Republic Magazine (2010-present) (previously, |
| Editor-in-Chief, 1974-2010) |
| • Director of TheStreet.com, a financial information service on the web (1996-present) |
| No. of Portfolios for which Board Member Serves: 46 |
| ——————— |
| Philip L. Toia (79) |
| Board Member (2012) |
| Principal Occupation During Past 5Years: |
| • Private Investor |
| No. of Portfolios for which Board Member Serves: 56 |
| ——————— |
| Once elected all Board Members serve for an indefinite term, but achieve Emeritus status upon reaching age 80.The |
| address of the Board Members and Officers is c/o The Dreyfus Corporation, 200 Park Avenue, NewYork, NewYork |
| 10166.Additional information about the Board Members is available in the fund’s Statement of Additional Information |
| which can be obtained from Dreyfus free of charge by calling this toll free number: 1-800-DREYFUS. |
| James F. Henry, Emeritus Board Member |
| Dr. Paul A. Marks, Emeritus Board Member |
| Gloria Messinger, Emeritus Board Member |
The Fund 51
OFFICERS OF THE FUND (Unaudited)
52

The Fund 53
Item 2. Code of Ethics.
The Registrant has adopted a code of ethics that applies to the Registrant's principal executive officer, principal financial officer, principal accounting officer or controller, or persons performing similar functions. There have been no amendments to, or waivers in connection with, the Code of Ethics during the period covered by this Report.
Item 3. Audit Committee Financial Expert.
The Registrant's Board has determined that Mr. David P. Feldman, a member of the Audit Committee of the Board, is an audit committee financial expert as defined by the Securities and Exchange Commission (the "SEC"). Mr. David P. Feldman is "independent" as defined by the SEC for purposes of audit committee financial expert determinations.
Item 4. Principal Accountant Fees and Services.
(a) Audit Fees. The aggregate fees billed for each of the last two fiscal years (the "Reporting Periods") for professional services rendered by the Registrant's principal accountant (the "Auditor") for the audit of the Registrant's annual financial statements or services that are normally provided by the Auditor in connection with the statutory and regulatory filings or engagements for the Reporting Periods, were $35,820 in 2011 and $37,074 in 2012.
(b) Audit-Related Fees. The aggregate fees billed in the Reporting Periods for assurance and related services by the Auditor that are reasonably related to the performance of the audit of the Registrant's financial statements and are not reported under paragraph (a) of this Item 4 were $6,000in 2011 and $12,000 in 2012. These services consisted of one or more of the following: (i) agreed upon procedures related to compliance with Internal Revenue Code section 817(h), (ii) security counts required by Rule 17f-2 under the Investment Company Act of 1940, as amended, (iii) advisory services as to the accounting or disclosure treatment of Registrant transactions or events and (iv) advisory services to the accounting or disclosure treatment of the actual or potential impact to the Registrant of final or proposed rules, standards or interpretations by the Securities and Exchange Commission, the Financial Accounting Standards Boards or other regulatory or standard-setting bodies.
The aggregate fees billed in the Reporting Periods for non-audit assurance and related services by the Auditor to the Registrant's investment adviser (not including any sub-investment adviser whose role is primarily portfolio management and is subcontracted with or overseen by another investment adviser), and any entity controlling, controlled by or under common control with the investment adviser that provides ongoing services to the Registrant ("Service Affiliates"), that were reasonably related to the performance of the annual audit of the Service Affiliate, which required pre-approval by the Audit Committee were $0 in 2011 an $0 in 2012.
(c) Tax Fees. The aggregate fees billed in the Reporting Periods for professional services rendered by the Auditor for tax compliance, tax advice, and tax planning ("Tax Services") were $2,460 in 2011 and $4,382 in 2012. These services consisted of: (i) review or preparation of U.S. federal, state, local and excise tax returns; (ii) U.S. federal, state and local tax planning, advice and assistance regarding statutory, regulatory or administrative developments; (iii) tax advice regarding tax qualification matters and/or treatment of various financial instruments held or proposed to be acquired or held, and (iv) determination of Passive Foreign Investment Companies. The aggregate fees billed in the Reporting Periods for Tax Services by the Auditor to Service Affiliates, which required pre-approval by the Audit Committee were $0 in 2011 and $0 in 2012.
(d) All Other Fees. The aggregate fees billed in the Reporting Periods for products and services provided by the Auditor, other than the services reported in paragraphs (a) through (c) of this Item, were $98 in 2011 and $1,014 in 2012. [These services consisted of a review of the Registrant's anti-money laundering program].
The aggregate fees billed in the Reporting Periods for Non-Audit Services by the Auditor to Service Affiliates, other than the services reported in paragraphs (b) through (c) of this Item, which required pre-approval by the Audit Committee, were $0 in 2011 and $200,000 in 2012.
(e)(1) Audit Committee Pre-Approval Policies and Procedures. The Registrant's Audit Committee has established policies and procedures (the "Policy") for pre-approval (within specified fee limits) of the Auditor's engagements for non-audit services to the Registrant and Service Affiliates without specific case-by-case consideration. The pre-approved services in the Policy can include pre-approved audit services, pre-approved audit-related services, pre-approved tax services and pre-approved all other services. Pre-approval considerations include whether the proposed services are compatible with maintaining the Auditor's independence. Pre-approvals pursuant to the Policy are considered annually.
(e)(2) Note: None of the services described in paragraphs (b) through (d) of this Item 4 were approved by the Audit Committee pursuant to paragraph (c)(7)(i)(C) of Rule 2-01 of Regulation S-X.
(f) None of the hours expended on the principal accountant's engagement to audit the registrant's financial statements for the most recent fiscal year were attributed to work performed by persons other than the principal account's full-time, permanent employees.
Non-Audit Fees. The aggregate non-audit fees billed by the Auditor for services rendered to the Registrant, and rendered to Service Affiliates, for the Reporting Periods were $19,415,177 in 2011 and $50,505,978 in 2012.
Auditor Independence. The Registrant's Audit Committee has considered whether the provision of non-audit services that were rendered to Service Affiliates, which were not pre-approved (not requiring pre-approval), is compatible with maintaining the Auditor's independence.
Item 5. Audit Committee of Listed Registrants.
Not applicable. [CLOSED-END FUNDS ONLY]
Item 6. Investments.
(a) Not applicable.
Item 7. Disclosure of Proxy Voting Policies and Procedures for Closed-End Management Investment Companies.
Not applicable. [CLOSED-END FUNDS ONLY]
Item 8. Portfolio Managers of Closed-End Management Investment Companies.
Not applicable. [CLOSED-END FUNDS ONLY, beginning with reports for periods ended on and after December 31, 2005]
Item 9. Purchases of Equity Securities by Closed-End Management Investment Companies and Affiliated Purchasers.
Not applicable. [CLOSED-END FUNDS ONLY]
Item 10. Submission of Matters to a Vote of Security Holders.
There have been no material changes to the procedures applicable to Item 10.
Item 11. Controls and Procedures.
(a) The Registrant's principal executive and principal financial officers have concluded, based on their evaluation of the Registrant's disclosure controls and procedures as of a date within 90 days of the filing date of this report, that the Registrant's disclosure controls and procedures are reasonably designed to ensure that information required to be disclosed by the Registrant on Form N-CSR is recorded, processed, summarized and reported within the required time periods and that information required to be disclosed by the Registrant in the reports that it files or submits on Form N-CSR is accumulated and communicated to the Registrant's management, including its principal executive and principal financial officers, as appropriate to allow timely decisions regarding required disclosure.
(b) There were no changes to the Registrant's internal control over financial reporting that occurred during the second fiscal quarter of the period covered by this report that have materially affected, or are reasonably likely to materially affect, the Registrant's internal control over financial reporting.
Item 12. Exhibits.
(a)(1) Code of ethics referred to in Item 2.
(a)(2) Certifications of principal executive and principal financial officers as required by Rule 30a-2(a) under the Investment Company Act of 1940.
(a)(3) Not applicable.
(b) Certification of principal executive and principal financial officers as required by Rule 30a-2(b) under the Investment Company Act of 1940.
SIGNATURES
Pursuant to the requirements of the Securities Exchange Act of 1934 and the Investment Company Act of 1940, the Registrant has duly caused this Report to be signed on its behalf by the undersigned, thereunto duly authorized.
Dreyfus Manager Funds II
By: /s/Bradley J. Skapyak | |
Bradley J. Skapyak, President
| |
Date: | January 24, 2013 |
| |
Pursuant to the requirements of the Securities Exchange Act of 1934 and the Investment Company Act of 1940, this Report has been signed below by the following persons on behalf of the Registrant and in the capacities and on the dates indicated. | |
| |
By: /s/Bradley J. Skapyak | |
Bradley J. Skapyak, President
| |
Date: | January 24, 2013 |
| |
By: /s/James Windels | |
James Windels, Treasurer
| |
Date: | January 24, 2013 |
| |
EXHIBIT INDEX
(a)(1) Code of ethics referred to in Item 2.
(a)(2) Certifications of principal executive and principal financial officers as required by Rule 30a-2(a) under the Investment Company Act of 1940. (EX-99.CERT)
(b) Certification of principal executive and principal financial officers as required by Rule 30a-2(b) under the Investment Company Act of 1940. (EX-99.906CERT)