UNITED STATES
SECURITIES AND EXCHANGE COMMISSION
Washington, D.C. 20549
FORM N-CSR
CERTIFIED SHAREHOLDER REPORT OF REGISTERED MANAGEMENT
INVESTMENT COMPANIES
Investment Company Act file number | 811- 21327 | ||||
|
| ||||
| Dreyfus Manager Funds II |
| |||
| (Exact name of Registrant as specified in charter) |
| |||
|
|
| |||
|
c/o The Dreyfus Corporation 200 Park Avenue New York, New York 10166 |
| |||
| (Address of principal executive offices) (Zip code) |
| |||
|
|
| |||
| John Pak, Esq. 200 Park Avenue New York, New York 10166 |
| |||
| (Name and address of agent for service) |
| |||
| |||||
Registrant's telephone number, including area code: (212) 922-6000 | |||||
| |||||
|
| ||||
Date of fiscal year end:
| 11/30 |
| |||
Date of reporting period: | 11/30/2014 |
| |||
| Dreyfus |
| Balanced Opportunity Fund |
ANNUAL REPORT November 30, 2014
Save time. Save paper. View your next shareholder report online as soon as it’s available. Log into www.dreyfus.com and sign up for Dreyfus eCommunications. It’s simple and only takes a few minutes.
The views expressed in this report reflect those of the portfolio manager only through the end of the period covered and do not necessarily represent the views of Dreyfus or any other person in the Dreyfus organization. Any such views are subject to change at any time based upon market or other conditions and Dreyfus disclaims any responsibility to update such views.These views may not be relied on as investment advice and, because investment decisions for a Dreyfus fund are based on numerous factors, may not be relied on as an indication of trading intent on behalf of any Dreyfus fund.
| Not FDIC-Insured • Not Bank-Guaranteed • May Lose Value |
Contents | |
THE FUND | |
| 2 | A Letter from the President |
| 3 | Discussion of Fund Performance |
| 6 | Fund Performance |
| 8 | Understanding Your Fund’s Expenses |
| 8 | Comparing Your Fund’s Expenses With Those of Other Funds |
| 9 | Statement of Investments |
| 22 | Statement of Assets and Liabilities |
| 23 | Statement of Operations |
| 24 | Statement of Changes in Net Assets |
| 27 | Financial Highlights |
| 32 | Notes to Financial Statements |
| 44 | Report of Independent Registered Public Accounting Firm |
| 45 | Important Tax Information |
| 46 | Board Members Information |
| 48 | Officers of the Fund |
FOR MORE INFORMATION | |
Back Cover |
Dreyfus
Balanced Opportunity Fund
The Fund
A LETTER FROM THE PRESIDENT
Dear Shareholder:
We are pleased to present this annual report for Dreyfus Balanced Opportunity Fund, covering the 12-month period from December 1, 2013, through November 30, 2014. For information about how the fund performed during the reporting period, as well as general market perspectives, we provide a Discussion of Fund Performance on the pages that follow.
Despite occasional bouts of heightened volatility, U.S. stocks gained ground over the reporting period when the domestic economy continued to rebound.As a result, broad measures of equity market performance established a series of new record highs. Bonds also fared well when falling long-term interest rates boosted prices of U.S. government obligations, and improving credit conditions buoyed corporate-backed securities.
We remain optimistic regarding the U.S. stock market’s prospects, but we have adopted a more cautious view on fixed-income markets. We currently expect the economy to continue to accelerate as several longstanding drags — including tight fiscal policies and private sector deleveraging — fade from the scene. While these developments could provide further support to corporate earnings and stock prices, they also may lead to rising interest rates and lower bond prices. As always, we encourage you to discuss our observations with your financial adviser to assess their potential impact on your investments.
Thank you for your continued confidence and support.

J. Charles Cardona
President
The Dreyfus Corporation
December 15, 2014
2
DISCUSSION OF FUND PERFORMANCE
For the reporting period of December 1, 2013, through November 30, 2014, as provided by Keith Stransky, Brian Ferguson, Sean Fitzgibbon, and David Bowser, Portfolio Managers
Fund and Market Performance Overview
For the 12-month period ended November 30, 2014, Dreyfus Balanced Opportunity Fund’s Class A shares, Class C shares, Class I shares, Class J shares, and Class Z shares produced total returns of 8.99%, 8.16%, 9.27%, 9.24%, and 9.18%, respectively.1 In comparison, the fund’s benchmarks, a customized blended index composed of 60% Standard & Poor’s 500® Composite Stock Price Index (“S&P 500 Index”) and 40% Barclays U.S. Aggregate Bond Index, and the S&P 500 Index and the Barclays U.S. Aggregate Bond Index returned total returns of 12.17%, 16.83% and 5.26%, respectively, for the same period.2
Positive U.S. economic growth drove domestic stocks higher during the reporting period, and bonds benefited from favorable supply-and-demand dynamics. While the fund participated in the market’s gains, weak stock selections in several market sectors caused its returns to lag the blended benchmark.
The Fund’s Investment Approach
The fund seeks high total return, including capital appreciation and current income, through a diversified mix of stocks and fixed-income securities.When allocating assets, we assess the relative return and risk of each asset class, general economic conditions, anticipated future changes in interest rates, and the general outlook for stocks.
Among stocks, we strive to create a broadly diversified portfolio that includes a blend of growth and value stocks. Using quantitative and fundamental research, we look for companies with leading market positions, competitive or technological advantages, high returns on equity and assets, good growth prospects, attractive valuations, and strong management teams.
The fund normally invests between 25% and 50% of its assets in fixed-income securities and invests principally in securities that, at the time of purchase, are rated investment grade (Baa/BBB or higher) or the non-rated equivalent as determined by Dreyfus, and in securities that are issued or guaranteed by the U.S. government (including its agencies and instrumentalities), including Treasury inflation-protected securities (TIPS). We may invest up to 5% of the fund’s assets in securities rated
The Fund 3
DISCUSSION OF FUND PERFORMANCE (continued)
below investment grade (but not lower than B) or the non-rated equivalent as determined by Dreyfus at the time of purchase and up to 10% in bonds from foreign issuers that are denominated in U.S. dollars or foreign currencies, but will limit investment in bonds issued by foreign issuers that are denominated in foreign currencies to no more than 5% of the fund's assets. The fund has no limit with respect to its portfolio maturity or duration.
A Favorable Time for Stocks and Bonds
Except for a weather-related contraction during the first quarter of 2014, the U.S. economy expanded steadily throughout the reporting period, even as growth slowed in most of the rest of the world. Lower unemployment, muted inflation, and strong corporate earnings drove the S&P 500 Index to a series of new record highs. Although bonds typically lose value during economic recoveries, robust demand for a relatively limited supply of fixed-income securities pushed long-term yields lower and bond prices higher.
Health care stocks led the equity markets’ gains as biotechnology firms developed new treatments for a wide range of conditions. Information technology stocks benefited from increased enterprise spending by companies seeking to boost productivity. Dividend-paying utility stocks and real estate investment trusts (REITs) outperformed the overall market as investors sought alternative sources of current income. Only the energy sector produced negative absolute returns when plummeting oil prices took their toll.
Among bonds, higher yielding market sectors — including corporate-backed, commercial mortgage-backed, and asset-backed securities — outpaced U.S. government securities when investors reached for higher levels of current income in the low interest rate environment.
Fund Performance Determined by Individual Holdings
The fund’s performance compared to the blended index was undermined by stock selection shortfalls in a number of industry groups. In the energy sector, falling oil prices hurt several of the fund’s exploration-and-production companies more than the integrated energy producers that dominate the benchmark. In the financials sector, the fund held underweighted exposure to REITs, which fared well, and overweighted exposure to large banks that were hurt by regulatory uncertainty and weakness in overseas markets. Among industrial companies, the fund did not own many of the sector’s better performing railroad and logistics companies, and we
4
maintained underweighted positions in aerospace-and-defense contractors that gained value when geopolitical tensions intensified.
The fund achieved better results through underweighted exposure to the lagging telecommunications services sector and strong stock selections in the consumer staples sector, where we focused on food and drug retailers and maintained relatively light positions in personal products makers with high valuations and operations in overseas markets.
The fund’s bond portfolio produced slightly higher returns than the Barclays U.S. Aggregate Bond Index, largely due to overweighted exposure to lower rated corporate bonds, commercial mortgage-backed securities, and asset-backed securities.The fund’s duration strategy and inflation-adjusted securities provided less favorable relative results. At times, we employed interest rate futures to set the fund’s duration strategy.
Investing in Continued U.S. Economic Growth
With the U.S. economy expanding but international markets struggling, we have maintained overweighted equity exposure to the financials and health care sectors, but we have identified fewer opportunities among industrial, energy, and telecommunications companies. The fund’s fixed-income positioning includes modestly overweighted positions in higher yielding market sectors and a modestly short average duration.
December 15, 2014
| Equity funds are subject generally to market, market sector, market liquidity, issuer, and investment style risks, among | |
| other factors, to varying degrees, all of which are more fully described in the fund’s prospectus. | |
| Bond funds are subject generally to interest rate, credit, liquidity, and market risks, to varying degrees, all of which are | |
| more fully described in the fund’s prospectus. Generally, all other factors being equal, bond prices are inversely related | |
| to interest-rate changes, and rate increases can cause price declines. | |
| 1 | Total return includes reinvestment of dividends and any capital gains paid, and does not take into consideration the |
| maximum initial sales charge in the case of Class A shares, or the applicable contingent deferred sales charge imposed | |
| on redemptions in the case of Class C shares. Had these charges been reflected, returns would have been lower. Past | |
| performance is no guarantee of future results. Share price and investment return fluctuate such that upon redemption, | |
| fund shares may be worth more or less than their original cost. Return figures for the fund provided reflect the | |
| absorption of certain fund expenses by The Dreyfus Corporation pursuant to an undertaking in effect through April 1, | |
| 2015, at which time it may be extended, terminated, or modified. Had these expenses not been absorbed, the fund’s | |
| returns would have been lower. | |
| 21 | SOURCE: LIPPER INC. — Reflects reinvestment of dividends and, where applicable, capital gain distributions. |
| The Standard & Poor’s 500 Composite Stock Price Index is a widely accepted, unmanaged index of U.S. stock | |
| market performance.The Barclays U.S.Aggregate Bond Index is a widely accepted, unmanaged total return index of | |
| corporate, U.S. government and U.S. government agency debt instruments, mortgage-backed securities, and asset- | |
| backed securities with an average maturity of 1-10 years. Investors cannot invest directly in any index. Source for | |
| customized blended index is FactSet. |
The Fund 5
FUND PERFORMANCE
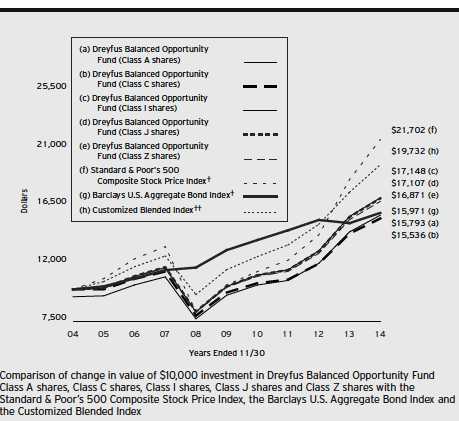
| † | Source: Lipper Inc. |
| †† | Source: FactSet |
| Past performance is not predictive of future performance. | |
| The above graph compares a $10,000 investment made in each of the Class A, Class C, Class I, Class J and Class Z | |
| shares of Dreyfus Balanced Opportunity Fund on 11/30/04 to a $10,000 investment made in the Standard & Poor’s | |
| 500 Composite Stock Price Index (the “S&P 500 Index”), the Barclays U.S.Aggregate Bond Index (the “Barclays | |
| Index”) and a hybrid Customized Blended Index (60% S&P 500 and 40% Barclays Aggregate) on that date.All | |
| dividends and capital gain distributions are reinvested. Returns for the Customized Blended Index are re-balanced monthly. | |
| The fund’s performance shown in the line graph above takes into account the maximum initial sales charge on Class A | |
| shares and all other applicable fees and expenses on all classes.The S&P 500 Index is a widely accepted, unmanaged | |
| index of U.S. stock market performance.The Barclays Index is a widely accepted, unmanaged index of corporate, U.S. | |
| government and U.S. government agency debt instruments, mortgage-backed securities, and asset-backed securities with an | |
| average maturity of 1-10 years.The Customized Blended Index is 60% S&P 500 Index and 40% Barclays Index. | |
| Unlike a mutual fund, the indices are not subject to charges, fees and other expenses. Investors cannot invest directly in | |
| any index. Further information relating to fund performance, including expense reimbursements, if applicable, is contained | |
| in the Financial Highlights section of the prospectus and elsewhere in this report. | |
6
| Average Annual Total Returns as of 11/30/14 | ||||||
| 1 Year | 5 Years | 10 Years | ||||
| Class A shares | ||||||
| with maximum sales charge (5.75%) | 2.72 | % | 9.31 | % | 4.68 | % |
| without sales charge | 8.99 | % | 10.61 | % | 5.30 | % |
| Class C shares | ||||||
| with applicable redemption charge† | 7.16 | % | 9.76 | % | 4.50 | % |
| without redemption | 8.16 | % | 9.76 | % | 4.50 | % |
| Class I shares | 9.27 | % | 10.88 | % | 5.54 | % |
| Class J shares | 9.24 | % | 10.81 | % | 5.52 | % |
| Class Z shares | 9.18 | % | 10.66 | % | 5.37 | % |
| Standard & Poor’s 500 | ||||||
| Composite Stock Price Index | 16.83 | % | 15.94 | % | 8.06 | % |
| Barclays U.S. Aggregate Bond Index | 5.26 | % | 4.10 | % | 4.79 | % |
| Customized Blended Index | 12.17 | % | 11.33 | % | 7.03 | % |
Past performance is not predictive of future performance.The fund’s performance shown in the graph and table does not reflect the deduction of taxes that a shareholder would pay on fund distributions or the redemption of fund shares. In addition to the performance of Class A shares shown with and without a maximum sales charge, the fund’s performance shown in the table takes into account all other applicable fees and expenses on all classes.
| † The maximum contingent deferred sales charge for Class C shares is 1% for shares redeemed within one year of the |
| date of purchase. |
The Fund 7
UNDERSTANDING YOUR FUND’S EXPENSES (Unaudited)
As a mutual fund investor, you pay ongoing expenses, such as management fees and other expenses. Using the information below, you can estimate how these expenses affect your investment and compare them with the expenses of other funds.You also may pay one-time transaction expenses, including sales charges (loads) and redemption fees, which are not shown in this section and would have resulted in higher total expenses. For more information, see your fund’s prospectus or talk to your financial adviser.
Review your fund’s expenses
The table below shows the expenses you would have paid on a $1,000 investment in Dreyfus Balanced Opportunity Fund from June 1, 2014 to November 30, 2014. It also shows how much a $1,000 investment would be worth at the close of the period, assuming actual returns and expenses.
Expenses and Value of a $1,000 Investment
assuming actual returns for the six months ended November 30, 2014
| Class A | Class C | Class I | Class J | Class Z | ||||||
| Expenses paid per $1,000† | $6.15 | $9.97 | $4.87 | $4.87 | $5.23 | |||||
| Ending value (after expenses) | $1,043.40 | $1,039.30 | $1,044.60 | $1,044.60 | $1,044.40 |
COMPARING YOUR FUND’S EXPENSES
WITH THOSE OF OTHER FUNDS (Unaudited)
Using the SEC’s method to compare expenses
The Securities and Exchange Commission (SEC) has established guidelines to help investors assess fund expenses. Per these guidelines, the table below shows your fund’s expenses based on a $1,000 investment, assuming a hypothetical 5% annualized return. You can use this information to compare the ongoing expenses (but not transaction expenses or total cost) of investing in the fund with those of other funds. All mutual fund shareholder reports will provide this information to help you make this comparison. Please note that you cannot use this information to estimate your actual ending account balance and expenses paid during the period.
Expenses and Value of a $1,000 Investment
assuming a hypothetical 5% annualized return for the six months ended November 30, 2014
| Class A | Class C | Class I | Class J | Class Z | ||||||
| Expenses paid per $1,000† | $6.07 | $9.85 | $4.81 | $4.81 | $5.16 | |||||
| Ending value (after expenses) | $1,019.05 | $1,015.29 | $1,020.31 | $1,020.31 | $1,019.95 |
| † Expenses are equal to the fund’s annualized expense ratio of 1.20% for Class A, 1.95% for Class C, .95% for |
| Class I, .95% for Class J and 1.02% for Class Z, multiplied by the average account value over the period, |
| multiplied by 183/365 (to reflect the one-half year period). |
8
| STATEMENT OF INVESTMENTS |
| November 30, 2014 |
| Coupon | Maturity | Principal | |||
| Bonds and Notes—33.2% | Rate (%) | Date | Amount ($) | Value ($) | |
| Asset-Backed Ctfs./ | |||||
| Auto Receivables—1.1% | |||||
| AmeriCredit Automobile Receivables | |||||
| Trust, Ser. 2014-1, Cl. C | 2.15 | 3/9/20 | 585,000 | 585,517 | |
| Capital Auto Receivables Asset | |||||
| Trust, Ser. 2014-1, Cl. C | 2.84 | 4/22/19 | 395,000 | 402,789 | |
| DT Auto Owner Trust, | |||||
| Ser. 2014-1A, Cl. C | 2.64 | 10/15/19 | 420,000 | a | 423,028 |
| Exeter Automobile Receivables | |||||
| Trust, Ser. 2013-2A, Cl. A | 1.49 | 11/15/17 | 143,379 | a | 143,589 |
| Santander Drive Auto Receivables | |||||
| Trust, Ser. 2012-4, Cl. B | 1.83 | 3/15/17 | 457,945 | 459,323 | |
| Santander Drive Auto Receivables | |||||
| Trust, Ser. 2012-6, Cl. C | 1.94 | 3/15/18 | 480,000 | 484,797 | |
| Santander Drive Auto Receivables | |||||
| Trust, Ser. 2012-3, Cl. C | 3.01 | 4/16/18 | 320,000 | 325,778 | |
| Santander Drive Auto Receivables | |||||
| Trust, Ser. 2011-1, Cl. C | 3.11 | 5/16/16 | 145,995 | 146,482 | |
| 2,971,303 | |||||
| Commercial Mortgage | |||||
| Pass-Through Ctfs.—1.3% | |||||
| Bear Stearns Commercial Mortgage | |||||
| Securities Trust, | |||||
| Ser. 2007-PW17, Cl. AAB | 5.70 | 6/11/50 | 150,477 | 151,755 | |
| Bear Stearns Commercial Mortgage | |||||
| Securities Trust, | |||||
| Ser. 2007-T28, Cl. A4 | 5.74 | 9/11/42 | 175,000 | b | 192,771 |
| Commercial Mortgage Trust, | |||||
| Ser. 2014-CR14, Cl. A4 | 4.24 | 2/10/47 | 345,000 | b | 378,343 |
| Commercial Mortgage Trust, | |||||
| Ser. 2013-LC13, Cl. B | 5.01 | 8/10/46 | 380,000 | a,b | 422,896 |
| Credit Suisse Mortgage Trust, | |||||
| Ser. 2014-USA, Cl. C | 4.34 | 9/15/37 | 240,000 | a | 250,689 |
| Hilton USA Trust, | |||||
| Ser. 2013-HLT, Cl. BFX | 3.37 | 11/5/30 | 725,000 | a | 739,866 |
| JPMBB Commercial Mortgage | |||||
| Securities Trust, | |||||
| Ser. 2014-C18, Cl. A5 | 4.08 | 2/15/47 | 865,000 | 933,517 | |
| Morgan Stanley Bank of America | |||||
| Merrill Lynch Trust, | |||||
| Ser. 2013-C13, Cl. B | 4.74 | 11/15/46 | 335,000 | b | 366,093 |
The Fund 9
STATEMENT OF INVESTMENTS (continued)
| Coupon | Maturity | Principal | |||
| Bonds and Notes (continued) | Rate (%) | Date | Amount ($) | Value ($) | |
| Commercial Mortgage | |||||
| Pass-Through Ctfs. (continued) | |||||
| UBS Commercial Mortgage Trust, | |||||
| Ser. 2012-C1, Cl. A3 | 3.40 | 5/10/45 | 125,000 | 130,336 | |
| 3,566,266 | |||||
| Consumer Discretionary—1.4% | |||||
| 21st Century Fox America, | |||||
| Gtd. Notes | 4.00 | 10/1/23 | 55,000 | 58,277 | |
| 21st Century Fox America, | |||||
| Gtd. Notes | 6.65 | 11/15/37 | 175,000 | 230,196 | |
| Comcast, | |||||
| Gtd. Notes | 6.50 | 11/15/35 | 135,000 | 178,913 | |
| Cox Communications, | |||||
| Sr. Unscd. Notes | 6.25 | 6/1/18 | 355,000 | a | 404,690 |
| CVS Pass-Through Trust, | |||||
| Pass Thru Certificates Notes | 8.35 | 7/10/31 | 526,473 | a | 719,761 |
| Daimler Finance North America, | |||||
| Gtd. Notes | 1.25 | 1/11/16 | 345,000 | a | 346,846 |
| NBCUniversal Media, | |||||
| Gtd. Notes | 5.15 | 4/30/20 | 240,000 | 275,428 | |
| Sky, | |||||
| Gtd. Notes | 3.75 | 9/16/24 | 465,000 | a | 473,046 |
| Staples, | |||||
| Sr. Unscd. Notes | 2.75 | 1/12/18 | 215,000 | 218,277 | |
| Time Warner, | |||||
| Gtd. Debs | 5.35 | 12/15/43 | 530,000 | 583,042 | |
| Walgreen, | |||||
| Sr. Unscd. Notes | 3.10 | 9/15/22 | 350,000 | 349,059 | |
| 3,837,535 | |||||
| Consumer Staples—1.0% | |||||
| Altria Group, | |||||
| Gtd. Notes | 4.00 | 1/31/24 | 65,000 | 67,791 | |
| Altria Group, | |||||
| Gtd. Notes | 4.25 | 8/9/42 | 90,000 | 85,583 | |
| Altria Group, | |||||
| Gtd. Notes | 4.75 | 5/5/21 | 120,000 | 133,227 | |
| Altria Group, | |||||
| Gtd. Notes | 10.20 | 2/6/39 | 20,000 | 34,647 | |
| ConAgra Foods, | |||||
| Sr. Unscd. Notes | 1.90 | 1/25/18 | 425,000 | 423,622 |
10
| Coupon | Maturity | Principal | |||
| Bonds and Notes (continued) | Rate (%) | Date | Amount ($) | Value ($) | |
| Consumer Staples (continued) | |||||
| Lorillard Tobacco, | |||||
| Gtd. Notes | 3.75 | 5/20/23 | 205,000 | 203,620 | |
| Pernod Ricard, | |||||
| Sr. Unscd. Notes | 4.45 | 1/15/22 | 500,000 | a | 535,575 |
| Reynolds American, | |||||
| Gtd. Notes | 4.85 | 9/15/23 | 555,000 | 599,057 | |
| SABMiller Holdings, | |||||
| Gtd. Notes | 3.75 | 1/15/22 | 280,000 | a | 293,976 |
| SABMiller Holdings, | |||||
| Gtd. Notes | 4.95 | 1/15/42 | 200,000 | a | 222,103 |
| Wm. Wrigley Jr., | |||||
| Sr. Unscd. Notes | 3.38 | 10/21/20 | 270,000 | a | 279,749 |
| 2,878,950 | |||||
| Energy—1.1% | |||||
| Energy Transfer Partners, | |||||
| Sr. Unscd. Notes | 4.90 | 2/1/24 | 440,000 | 466,767 | |
| Energy Transfer Partners, | |||||
| Sr. Unscd. Notes | 5.95 | 10/1/43 | 220,000 | 239,681 | |
| EQT, | |||||
| Sr. Unscd. Notes | 8.13 | 6/1/19 | 225,000 | 275,625 | |
| Kinder Morgan Energy Partners, | |||||
| Sr. Unscd. Notes | 5.00 | 3/1/43 | 235,000 | 224,926 | |
| Kinder Morgan Energy Partners, | |||||
| Sr. Unscd. Notes | 6.55 | 9/15/40 | 205,000 | 230,362 | |
| Ensco, | |||||
| Sr. Unscd. Notes | 4.50 | 10/1/24 | 240,000 | 241,336 | |
| Spectra Energy Partners, | |||||
| Sr. Unscd. Notes | 2.95 | 9/25/18 | 90,000 | 92,871 | |
| Spectra Energy Partners, | |||||
| Sr. Unscd. Notes | 4.75 | 3/15/24 | 75,000 | 81,306 | |
| Talisman Energy, | |||||
| Sr. Unscd. Notes | 3.75 | 2/1/21 | 170,000 | 164,811 | |
| TransCanada Pipelines, | |||||
| Sr. Unscd. Notes | 3.75 | 10/16/23 | 215,000 | 222,318 | |
| Transocean, | |||||
| Gtd. Notes | 3.80 | 10/15/22 | 110,000 | 95,124 | |
| Transocean, | |||||
| Gtd. Notes | 6.38 | 12/15/21 | 155,000 | 154,616 |
The Fund 11
STATEMENT OF INVESTMENTS (continued)
| Coupon | Maturity | Principal | |||
| Bonds and Notes (continued) | Rate (%) | Date | Amount ($) | Value ($) | |
| Energy (continued) | |||||
| Williams Partners, | |||||
| Sr. Unscd. Notes | 3.35 | 8/15/22 | 285,000 | 276,705 | |
| Williams Partners, | |||||
| Sr. Unscd. Notes | 4.50 | 11/15/23 | 145,000 | 153,215 | |
| Williams Partners, | |||||
| Sr. Unscd. Notes | 6.30 | 4/15/40 | 60,000 | 69,109 | |
| 2,988,772 | |||||
| Financial—3.6% | |||||
| ABN AMRO Bank, | |||||
| Sr. Unscd. Notes | 2.50 | 10/30/18 | 265,000 | a | 269,200 |
| ACE INA Holdings, | |||||
| Gtd. Notes | 5.80 | 3/15/18 | 45,000 | 50,980 | |
| ARC Properties Operating | |||||
| Partnership/Clark Acquisition, | |||||
| Gtd. Notes | 3.00 | 2/6/19 | 410,000 | 389,036 | |
| Bank of America, | |||||
| Sr. Unscd. Notes | 1.27 | 1/15/19 | 520,000 | b | 526,818 |
| Bank of America, | |||||
| Sr. Unscd. Notes, Ser. L | 2.60 | 1/15/19 | 150,000 | 152,190 | |
| Bank of America, | |||||
| Sr. Unscd. Notes | 4.00 | 4/1/24 | 500,000 | 523,433 | |
| Bank of America, | |||||
| Sub. Notes | 4.25 | 10/22/26 | 515,000 | 518,870 | |
| Bank of America, | |||||
| Sr. Unscd. Notes | 5.63 | 7/1/20 | 290,000 | 332,890 | |
| Bank of America, | |||||
| Sr. Unscd. Notes | 5.70 | 1/24/22 | 50,000 | 58,256 | |
| Capital One Bank USA, | |||||
| Sub. Notes | 3.38 | 2/15/23 | 300,000 | 298,103 | |
| Cincinnati Financial, | |||||
| Sr. Unscd. Notes | 6.13 | 11/1/34 | 169,000 | 203,019 | |
| Citigroup, | |||||
| Sr. Unscd. Notes | 3.88 | 10/25/23 | 235,000 | 244,898 | |
| Citigroup, | |||||
| Sr. Unscd. Notes | 4.50 | 1/14/22 | 180,000 | 197,070 | |
| Citigroup, | |||||
| Sr. Unscd. Notes | 6.13 | 5/15/18 | 160,000 | 182,102 | |
| ERAC USA Finance, | |||||
| Gtd. Notes | 3.85 | 11/15/24 | 55,000 | a | 56,079 |
12
| Coupon | Maturity | Principal | |||
| Bonds and Notes (continued) | Rate (%) | Date | Amount ($) | Value ($) | |
| Financial (continued) | |||||
| ERAC USA Finance, | |||||
| Gtd. Notes | 7.00 | 10/15/37 | 210,000 | a | 282,949 |
| Federal Realty | |||||
| Investment Trust, | |||||
| Sr. Unscd. Bonds | 5.65 | 6/1/16 | 260,000 | 278,643 | |
| Ford Motor Credit, | |||||
| Sr. Unscd. Notes, Ser. 1 | 1.06 | 3/12/19 | 765,000 | b | 766,119 |
| Ford Motor Credit, | |||||
| Sr. Unscd. Notes | 4.21 | 4/15/16 | 145,000 | 150,925 | |
| Ford Motor Credit, | |||||
| Sr. Unscd. Notes | 4.38 | 8/6/23 | 200,000 | 213,934 | |
| General Electric Capital, | |||||
| Sr. Unscd. Notes | 0.74 | 1/14/19 | 405,000 | b | 405,576 |
| Goldman Sachs Group, | |||||
| Sr. Unscd. Notes | 1.33 | 11/15/18 | 505,000 | b | 511,746 |
| Goldman Sachs Group, | |||||
| Sr. Unscd. Notes | 1.84 | 11/29/23 | 430,000 | b | 445,034 |
| Goldman Sachs Group, | |||||
| Sr. Unscd. Notes | 5.25 | 7/27/21 | 230,000 | 259,593 | |
| Health Care REIT, | |||||
| Sr. Unscd. Notes | 5.13 | 3/15/43 | 235,000 | 254,470 | |
| HSBC Holdings, | |||||
| Sr. Unscd. Notes | 4.00 | 3/30/22 | 295,000 | 316,090 | |
| JPMorgan Chase & Co., | |||||
| Sr. Unscd. Notes | 4.50 | 1/24/22 | 235,000 | 258,314 | |
| Morgan Stanley, | |||||
| Sr. Unscd. Notes | 3.70 | 10/23/24 | 500,000 | 508,756 | |
| Morgan Stanley, | |||||
| Sr. Unscd. Notes | 3.75 | 2/25/23 | 220,000 | 226,694 | |
| Morgan Stanley, | |||||
| Sr. Unscd. Notes | 5.50 | 1/26/20 | 105,000 | 119,190 | |
| Pacific LifeCorp, | |||||
| Sr. Unscd. Notes | 5.13 | 1/30/43 | 150,000 | a | 159,434 |
| PNC Bank, | |||||
| Sr. Unscd. Notes | 2.20 | 1/28/19 | 250,000 | 252,466 | |
| Regency Centers, | |||||
| Gtd. Notes | 5.88 | 6/15/17 | 205,000 | 227,647 | |
| Royal Bank of Scotland Group, | |||||
| Sr. Unscd. Notes | 2.55 | 9/18/15 | 225,000 | 227,931 |
The Fund 13
STATEMENT OF INVESTMENTS (continued)
| Coupon | Maturity | Principal | ||
| Bonds and Notes (continued) | Rate (%) | Date | Amount ($) | Value ($) |
| Financial (continued) | ||||
| Synchrony Financial, | ||||
| Sr. Unscd. Notes | 3.75 | 8/15/21 | 210,000 | 215,551 |
| 10,084,006 | ||||
| Foreign/Governmental—.6% | ||||
| Korea Finance, | ||||
| Sr. Unscd. Notes | 2.25 | 8/7/17 | 280,000 | 284,876 |
| Petroleos Mexicanos, | ||||
| Gtd. Notes | 5.50 | 1/21/21 | 560,000 | 623,700 |
| Petroleos Mexicanos, | ||||
| Gtd. Bonds | 6.63 | 6/15/35 | 405,000 | 475,875 |
| Province of Quebec Canada, | ||||
| Sr. Unscd. Notes | 4.60 | 5/26/15 | 85,000 | 86,803 |
| Republic of Korea, | ||||
| Sr. Unscd. Notes | 7.13 | 4/16/19 | 100,000 | 121,949 |
| South African Government, | ||||
| Sr. Unscd. Notes | 5.50 | 3/9/20 | 215,000 | 237,736 |
| 1,830,939 | ||||
| Health Care—.2% | ||||
| Actavis, | ||||
| Gtd. Notes | 4.63 | 10/1/42 | 100,000 | 94,053 |
| Mylan, | ||||
| Sr. Unscd. Notes | 5.40 | 11/29/43 | 190,000 | 207,174 |
| WellPoint, | ||||
| Sr. Unscd. Notes | 2.30 | 7/15/18 | 255,000 | 258,130 |
| 559,357 | ||||
| Industrial—.1% | ||||
| Waste Management, | ||||
| Gtd. Notes | 6.10 | 3/15/18 | 145,000 | 165,352 |
| Information Technology—.2% | ||||
| Hewlett-Packard, | ||||
| Sr. Unscd. Notes | 4.30 | 6/1/21 | 70,000 | 73,295 |
| Hewlett-Packard, | ||||
| Sr. Unscd. Notes | 6.00 | 9/15/41 | 350,000 | 390,000 |
| Xerox, | ||||
| Sr. Unscd. Notes | 5.63 | 12/15/19 | 185,000 | 209,872 |
| 673,167 | ||||
| Materials—.8% | ||||
| Freeport-McMoran Oil & Gas, | ||||
| Gtd. Notes | 6.88 | 2/15/23 | 410,000 | 463,628 |
14
| Coupon | Maturity | Principal | |||
| Bonds and Notes (continued) | Rate (%) | Date | Amount ($) | Value ($) | |
| Materials (continued) | |||||
| Freeport-McMoRan, | |||||
| Gtd. Notes | 5.45 | 3/15/43 | 245,000 | 246,955 | |
| Glencore Funding, | |||||
| Gtd. Notes | 4.63 | 4/29/24 | 465,000 | a | 476,532 |
| LYB International Finance, | |||||
| Gtd. Notes | 4.00 | 7/15/23 | 335,000 | 351,501 | |
| Mosaic, | |||||
| Sr. Unscd. Notes | 4.25 | 11/15/23 | 265,000 | 277,687 | |
| Vale Overseas, | |||||
| Gtd. Notes | 4.38 | 1/11/22 | 320,000 | 321,155 | |
| Vale Overseas, | |||||
| Gtd. Notes | 6.88 | 11/21/36 | 190,000 | 208,321 | |
| 2,345,779 | |||||
| Municipal Bonds—.3% | |||||
| Chicago, | |||||
| GO (Project and Refunding Series) | 6.31 | 1/1/44 | 85,000 | 88,698 | |
| Illinois, | |||||
| GO (Pension Funding Series) | 5.10 | 6/1/33 | 150,000 | 147,890 | |
| Los Angeles Department of Water | |||||
| and Power, Revenue (Build | |||||
| America Bonds) | 5.72 | 7/1/39 | 120,000 | 151,295 | |
| Metropolitan Transportation | |||||
| Authority, Dedicated Tax Fund | |||||
| Revenue (Build America Bonds) | 6.09 | 11/15/40 | 10,000 | 13,223 | |
| Metropolitan Transportation | |||||
| Authority, Revenue (Build | |||||
| America Bonds) | 6.55 | 11/15/31 | 225,000 | 292,230 | |
| New York City, | |||||
| GO (Build America Bonds) | 5.99 | 12/1/36 | 135,000 | 171,204 | |
| 864,540 | |||||
| Telecommunications—.5% | |||||
| AT&T, | |||||
| Sr. Unscd. Notes | 1.15 | 11/27/18 | 355,000 | b | 361,196 |
| Rogers Communications, | |||||
| Gtd. Notes | 4.10 | 10/1/23 | 205,000 | 216,839 | |
| Verizon Communications, | |||||
| Sr. Unscd. Notes | 5.15 | 9/15/23 | 210,000 | 236,255 | |
| Verizon Communications, | |||||
| Sr. Unscd. Notes | 6.55 | 9/15/43 | 455,000 | 588,564 | |
| 1,402,854 |
The Fund 15
STATEMENT OF INVESTMENTS (continued)
| Coupon | Maturity | Principal | ||||
| Bonds and Notes (continued) | Rate (%) | Date | Amount ($) | Value ($) | ||
| U.S. Government Agencies—1.3% | ||||||
| Federal Home Loan Mortgage Corp., | ||||||
| Notes | 4.88 | 6/13/18 | 855,000 | c | 964,852 | |
| Federal National Mortgage | ||||||
| Association, Notes | 0.88 | 12/20/17 | 2,305,000 | c | 2,296,794 | |
| Federal National Mortgage | ||||||
| Association, Notes | 1.63 | 10/26/15 | 495,000 | c | 501,267 | |
| 3,762,913 | ||||||
| U.S. Government Agencies/ | ||||||
| Mortgage-Backed—8.8% | ||||||
| Federal Home Loan Mortgage Corp.: | ||||||
| 3.50%, 12/1/41—11/1/44 | 4,934,222 | c | 5,145,046 | |||
| 5.00%, 4/1/39 | 451,984 | c | 507,924 | |||
| 5.50%, 4/1/22—1/1/36 | 316,473 | c | 352,796 | |||
| Federal National Mortgage Association: | ||||||
| 3.00%, 5/1/42—5/1/43 | 3,589,151 | c | 3,634,110 | |||
| 3.50%, 12/1/41—8/1/42 | 2,422,721 | c | 2,533,663 | |||
| 4.00%, 6/1/24—12/1/43 | 6,781,025 | c | 7,259,598 | |||
| 4.50%, 2/1/39—8/1/41 | 3,511,019 | c | 3,838,472 | |||
| 5.00%, 8/1/20—7/1/39 | 972,249 | c | 1,073,321 | |||
| 5.50%, 9/1/34—5/1/40 | 307,956 | c | 349,095 | |||
| 6.00%, 10/1/37—2/1/39 | 80,222 | c | 90,832 | |||
| 8.00%, 3/1/30 | 128 | c | 131 | |||
| Government National Mortgage Association I: | ||||||
| 5.50%, 4/15/33 | 39,803 | 44,819 | ||||
| 24,829,807 | ||||||
| U.S. Government Securities—10.2% | ||||||
| U.S. Treasury Bonds: | ||||||
| 3.75%, 11/15/43 | 3,055,000 | 3,561,461 | ||||
| 6.25%, 5/15/30 | 480,000 | 710,925 | ||||
| U.S. Treasury Floating Rate Notes; | ||||||
| 0.07%, 1/31/16 | 3,980,000 | b | 3,979,702 | |||
| U.S. Treasury Notes: | ||||||
| 0.25%, 12/31/15 | 135,000 | 135,137 | ||||
| 0.75%, 1/15/17 | 14,560,000 | 14,622,564 | ||||
| 1.50%, 12/31/18 | 5,620,000 | 5,664,786 | ||||
| 28,674,575 | ||||||
| Utilities—.7% | ||||||
| Duke Energy Carolinas, | ||||||
| First Mortgage Bonds | 5.25 | 1/15/18 | 95,000 | 105,971 | ||
| Enel Finance International, | ||||||
| Gtd. Notes | 6.00 | 10/7/39 | 210,000 | a | 243,446 | |
16
| Coupon | Maturity | Principal | |||
| Bonds and Notes (continued) | Rate (%) | Date | Amount ($) | Value ($) | |
| Utilities (continued) | |||||
| Exelon Generation, | |||||
| Sr. Unscd. Notes | 6.25 | 10/1/39 | 315,000 | 371,436 | |
| Iberdrola International, | |||||
| Gtd. Notes | 6.75 | 7/15/36 | 205,000 | 256,676 | |
| Nevada Power, | |||||
| Mortgage Notes | 6.50 | 8/1/18 | 90,000 | 105,106 | |
| NiSource Finance, | |||||
| Gtd. Notes | 5.65 | 2/1/45 | 390,000 | 465,644 | |
| NiSource Finance, | |||||
| Gtd. Notes | 6.40 | 3/15/18 | 230,000 | 263,762 | |
| Sempra Energy, | |||||
| Sr. Unscd. Notes | 6.50 | 6/1/16 | 215,000 | 232,772 | |
| Sierra Pacific Power, | |||||
| Mortgage Notes, Ser. P | 6.75 | 7/1/37 | 25,000 | 35,229 | |
| 2,080,042 | |||||
| Total Bonds and Notes | |||||
| (cost $91,098,598) | 93,516,157 | ||||
| Common Stocks—63.5% | Shares | Value ($) | |||
| Consumer Discretionary—5.2% | |||||
| Carnival | 35,890 | 1,584,902 | |||
| Dollar General | 8,740 | d | 583,308 | ||
| General Motors | 32,100 | 1,073,103 | |||
| Kohl’s | 9,100 | 542,542 | |||
| Liberty Interactive, Cl. A | 20,560 | d | 599,324 | ||
| Lowe’s | 10,140 | 647,236 | |||
| Macy’s | 8,039 | 521,811 | |||
| News Corp., Cl. A | 27,260 | d | 423,075 | ||
| Omnicom Group | 27,150 | 2,097,880 | |||
| PVH | 14,390 | 1,829,545 | |||
| Time Warner | 11,240 | 956,749 | |||
| Twenty-First Century Fox, Cl. A | 50,790 | 1,869,072 | |||
| Viacom, Cl. B | 6,270 | 474,200 | |||
| Walt Disney | 16,422 | 1,519,199 | |||
| 14,721,946 | |||||
| Consumer Staples—5.0% | |||||
| Archer-Daniels-Midland | 37,108 | 1,954,849 | |||
| Coca-Cola Enterprises | 51,275 | 2,253,023 | |||
The Fund 17
STATEMENT OF INVESTMENTS (continued)
| Common Stocks (continued) | Shares | Value ($) | |
| Consumer Staples (continued) | |||
| Costco Wholesale | 4,220 | 599,746 | |
| CVS Health | 40,493 | 3,699,440 | |
| Molson Coors Brewing, Cl. B | 30,586 | 2,365,827 | |
| Mondelez International, Cl. A | 20,790 | 814,968 | |
| PepsiCo | 11,650 | 1,166,165 | |
| Philip Morris International | 13,038 | 1,133,393 | |
| 13,987,411 | |||
| Energy—5.7% | |||
| Anadarko Petroleum | 30,994 | 2,453,175 | |
| EOG Resources | 2,840 | 246,285 | |
| Exxon Mobil | 9,744 | 882,222 | |
| Marathon Oil | 58,300 | 1,686,036 | |
| Occidental Petroleum | 81,298 | 6,485,141 | |
| Phillips 66 | 25,294 | 1,846,968 | |
| Schlumberger | 28,520 | 2,451,294 | |
| 16,051,121 | |||
| Exchange-Traded Funds—.1% | |||
| iShares Russell 1000 Value Index Fund | 740 | 77,293 | |
| SPDR S&P 500 ETF Trust | 1,366 | 283,035 | |
| 360,328 | |||
| Financial—17.0% | |||
| Allstate | 17,955 | 1,223,633 | |
| American International Group | 22,427 | 1,229,000 | |
| Ameriprise Financial | 20,431 | 2,692,193 | |
| Bank of America | 233,320 | 3,975,773 | |
| Berkshire Hathaway, Cl. B | 32,076 | d | 4,769,380 |
| Citigroup | 71,375 | 3,852,109 | |
| Discover Financial Services | 8,790 | 576,184 | |
| Fifth Third Bancorp | 33,840 | 680,861 | |
| Goldman Sachs Group | 18,960 | 3,572,254 | |
| Hartford Financial Services Group | 49,944 | 2,062,687 | |
| Invesco | 27,620 | 1,114,743 | |
| JPMorgan Chase & Co. | 76,934 | 4,628,349 | |
| MetLife | 26,797 | 1,490,181 | |
| Morgan Stanley | 58,070 | 2,042,903 | |
| PNC Financial Services Group | 28,340 | 2,478,900 | |
| Prudential Financial | 17,830 | 1,515,193 |
18
| Common Stocks (continued) | Shares | Value ($) | |
| Financial (continued) | |||
| Regions Financial | 157,880 | 1,589,852 | |
| TD Ameritrade Holding | 23,300 | 806,413 | |
| Voya Financial | 87,840 | 3,678,739 | |
| Wells Fargo & Co. | 72,151 | 3,930,786 | |
| 47,910,133 | |||
| Health Care—11.1% | |||
| AbbVie | 48,700 | 3,370,040 | |
| Aetna | 10,170 | 887,231 | |
| Agilent Technologies | 13,770 | 588,530 | |
| Amgen | 12,100 | 2,000,251 | |
| Biogen Idec | 2,530 | d | 778,456 |
| Cardinal Health | 38,384 | 3,154,781 | |
| Cigna | 5,466 | 562,397 | |
| Eli Lilly & Co. | 10,223 | 696,391 | |
| Endo International | 7,983 | d | 584,116 |
| Gilead Sciences | 10,620 | d | 1,065,398 |
| Humana | 6,202 | 855,690 | |
| Laboratory Corporation of America Holdings | 7,570 | d | 792,125 |
| McKesson | 9,221 | 1,943,418 | |
| Medtronic | 12,840 | 948,491 | |
| Merck & Co. | 46,401 | 2,802,620 | |
| Mylan | 16,920 | d | 991,681 |
| Omnicare | 25,834 | 1,816,647 | |
| Pfizer | 131,699 | 4,102,424 | |
| UnitedHealth Group | 26,090 | 2,573,257 | |
| Zoetis | 13,950 | 626,773 | |
| 31,140,717 | |||
| Industrial—4.6% | |||
| Cummins | 11,445 | 1,666,621 | |
| Delta Air Lines | 14,927 | 696,643 | |
| Fluor | 11,060 | 685,609 | |
| Honeywell International | 32,381 | 3,207,986 | |
| Northrop Grumman | 11,685 | 1,646,767 | |
| Owens Corning | 35,461 | 1,235,461 | |
| PACCAR | 9,250 | 619,935 | |
| Raytheon | 22,354 | 2,385,172 | |
| Tyco International | 12,040 | 516,516 |
The Fund 19
STATEMENT OF INVESTMENTS (continued)
| Common Stocks (continued) | Shares | Value ($) | |
| Industrial (continued) | |||
| United Technologies | 3,080 | 339,046 | |
| 12,999,756 | |||
| Information Technology—11.1% | |||
| Accenture, Cl. A | 11,910 | 1,028,190 | |
| Apple | 53,810 | 6,399,623 | |
| Applied Materials | 97,195 | 2,337,540 | |
| Cisco Systems | 208,510 | 5,763,216 | |
| EMC | 105,990 | 3,216,796 | |
| Facebook, Cl. A | 9,950 | d | 773,115 |
| Google, Cl. A | 1,700 | d | 933,436 |
| Google, Cl. C | 3,529 | d | 1,912,118 |
| Hewlett-Packard | 19,980 | 780,419 | |
| Keysight Technologies | 6,885 | 242,352 | |
| Microchip Technology | 15,539 | 701,586 | |
| Microsoft | 44,483 | 2,126,732 | |
| salesforce.com | 16,630 | d | 995,638 |
| Symantec | 29,240 | 762,872 | |
| Texas Instruments | 34,080 | 1,854,634 | |
| Visa, Cl. A | 4,010 | 1,035,342 | |
| Windstream Holdings | 27,750 | 280,552 | |
| 31,144,161 | |||
| Materials—2.8% | |||
| Dow Chemical | 12,331 | 600,150 | |
| International Paper | 20,136 | 1,083,719 | |
| Martin Marietta Materials | 26,132 | 3,136,885 | |
| Packaging Corporation of America | 7,422 | 551,306 | |
| Praxair | 4,710 | 604,670 | |
| Vulcan Materials | 29,214 | 1,931,045 | |
| 7,907,775 | |||
| Utilities—.9% | |||
| Exelon | 39,605 | 1,432,513 | |
| NRG Energy | 32,333 | 1,010,729 | |
| 2,443,242 | |||
| Total Common Stocks | |||
| (cost $151,150,347) | 178,666,590 |
20
| Other Investment—3.0% | Shares | Value ($) | |
| Registered Investment Company; | |||
| Dreyfus Institutional Preferred | |||
| Plus Money Market Fund | |||
| (cost $8,455,485) | 8,455,485 | e | 8,455,485 |
| Total Investments (cost $250,704,430) | 99.7 | % | 280,638,232 |
| Cash and Receivables (Net) | .3 | % | 829,112 |
| Net Assets | 100.0 | % | 281,467,344 |
ETF—Exchange-Traded Fund
GO—General Obligation
REIT—Real Estate Investment Trust
| a Securities exempt from registration pursuant to Rule 144A under the Securities Act of 1933.These securities may be |
| resold in transactions exempt from registration, normally to qualified institutional buyers.At November 30, 2014, |
| these securities were valued at $6,743,454 or 2.4% of net assets. |
| b Variable rate security—interest rate subject to periodic change. |
| c The Federal Housing Finance Agency (“FHFA”) placed the Federal Home Loan Mortgage Corporation and Federal |
| National Mortgage Association into conservatorship with FHFA as the conservator.As such, the FHFA oversees the |
| continuing affairs of these companies. |
| d Non-income producing security. |
| e Investment in affiliated money market mutual fund. |
| Portfolio Summary (Unaudited)† | |||
| Value (%) | Value (%) | ||
| Common Stocks | 63.4 | Asset-Backed | 1.1 |
| U.S. Government Agencies/ | Foreign/Governmental | .6 | |
| Mortgage-Backed | 20.3 | Municipal Bonds | .3 |
| Corporate Bonds | 9.6 | Exchange-Traded Funds | .1 |
| Money Market Investment | 3.0 | ||
| Commercial Mortgage-Backed | 1.3 | 99.7 | |
| † Based on net assets. |
| See notes to financial statements. |
The Fund 21
| STATEMENT OF ASSETS AND LIABILITIES |
| November 30, 2014 |
| Cost | Value | ||||
| Assets ($): | |||||
| Investments in securities—See Statement of Investments: | |||||
| Unaffiliated issuers | 242,248,945 | 272,182,747 | |||
| Affiliated issuers | 8,455,485 | 8,455,485 | |||
| Cash | 116,471 | ||||
| Cash denominated in foreign currencies | 2,834 | 2,729 | |||
| Receivable for investment securities sold | 3,275,563 | ||||
| Dividends, interest and securities lending income receivable | 825,962 | ||||
| Receivable for shares of Beneficial Interest subscribed | 6,013 | ||||
| Prepaid expenses | 47,338 | ||||
| 284,912,308 | |||||
| Liabilities ($): | |||||
| Due to The Dreyfus Corporation and affiliates—Note 3(c) | 261,366 | ||||
| Payable for investment securities purchased | 3,012,337 | ||||
| Payable for shares of Beneficial Interest redeemed | 99,121 | ||||
| Accrued expenses | 72,140 | ||||
| 3,444,964 | |||||
| Net Assets ($) | 281,467,344 | ||||
| Composition of Net Assets ($): | |||||
| Paid-in capital | 237,050,055 | ||||
| Accumulated undistributed investment income—net | 2,003,817 | ||||
| Accumulated net realized gain (loss) on investments | 12,479,775 | ||||
| Accumulated net unrealized appreciation (depreciation) | |||||
| on investments and foreign currency transactions | 29,933,697 | ||||
| 281,467,344 | |||||
| Net Assets ($) | |||||
| Net Asset Value Per Share | |||||
| Class A | Class C | Class I | Class J | Class Z | |
| Net Assets ($) | 183,228,015 | 33,966,068 | 4,098,681 | 20,184,068 | 39,990,512 |
| Shares Outstanding | 8,013,482 | 1,491,559 | 178,722 | 880,092 | 1,752,961 |
| Net Asset Value | |||||
| Per Share ($) | 22.86 | 22.77 | 22.93 | 22.93 | 22.81 |
| See notes to financial statements. | |||||
22
| STATEMENT OF OPERATIONS | ||
| Year Ended November 30, 2014 | ||
| Investment Income ($): | ||
| Income: | ||
| Cash dividends: | ||
| Unaffiliated issuers | 3,187,615 | |
| Affiliated issuers | 3,861 | |
| Interest | 2,512,515 | |
| Income from securities lending—Note 1(c) | 20,037 | |
| Total Income | 5,724,028 | |
| Expenses: | ||
| Management fee—Note 3(a) | 2,225,114 | |
| Shareholder servicing costs—Note 3(c) | 857,998 | |
| Distribution fees—Note 3(b) | 244,383 | |
| Professional fees | 105,496 | |
| Registration fees | 74,224 | |
| Custodian fees—Note 3(c) | 35,336 | |
| Prospectus and shareholders’ reports | 31,236 | |
| Trustees’ fees and expenses—Note 3(d) | 14,500 | |
| Loan commitment fees—Note 2 | 2,767 | |
| Miscellaneous | 47,403 | |
| Total Expenses | 3,638,457 | |
| Less—reduction in expenses due to undertaking—Note 3(a) | (187,096 | ) |
| Less—reduction in fees due to earnings credits—Note 3(c) | (464 | ) |
| Net Expenses | 3,450,897 | |
| Investment Income—Net | 2,273,131 | |
| Realized and Unrealized Gain (Loss) on Investments—Note 4 ($): | ||
| Net realized gain (loss) on investments | 24,106,158 | |
| Net realized gain (loss) on financial futures | (37,190 | ) |
| Net Realized Gain (Loss) | 24,068,968 | |
| Net unrealized appreciation (depreciation) on | ||
| investments and foreign currency transactions | (2,473,736 | ) |
| Net Realized and Unrealized Gain (Loss) on Investments | 21,595,232 | |
| Net Increase in Net Assets Resulting from Operations | 23,868,363 | |
| See notes to financial statements. | ||
The Fund 23
STATEMENT OF CHANGES IN NET ASSETS
| Year Ended November 30, | ||||
| 2014 | 2013 | |||
| Operations ($): | ||||
| Investment income—net | 2,273,131 | 2,236,455 | ||
| Net realized gain (loss) on investments | 24,068,968 | 29,348,005 | ||
| Net unrealized appreciation | ||||
| (depreciation) on investments | (2,473,736 | ) | 16,806,062 | |
| Net Increase (Decrease) in Net Assets | ||||
| Resulting from Operations | 23,868,363 | 48,390,522 | ||
| Dividends to Shareholders from ($): | ||||
| Investment income—net: | ||||
| Class A | (1,563,200 | ) | (1,935,562 | ) |
| Class C | (18,760 | ) | (185,888 | ) |
| Class I | (28,524 | ) | (33,202 | ) |
| Class J | (216,891 | ) | (271,444 | ) |
| Class Z | (385,121 | ) | (471,935 | ) |
| Net realized gain on investments: | ||||
| Class A | (2,354,940 | ) | — | |
| Class C | (402,193 | ) | — | |
| Class I | (33,828 | ) | — | |
| Class J | (263,963 | ) | — | |
| Class Z | (518,518 | ) | — | |
| Total Dividends | (5,785,938 | ) | (2,898,031 | ) |
| Beneficial Interest Transactions ($): | ||||
| Net proceeds from shares sold: | ||||
| Class A | 9,442,324 | 24,710,126 | ||
| Class C | 6,101,334 | 7,749,450 | ||
| Class I | 2,327,336 | 627,724 | ||
| Class J | 414,785 | 480,803 | ||
| Class Z | 1,152,809 | 2,185,217 | ||
24
| Year Ended November 30, | ||||
| 2014 | 2013 | |||
| Beneficial Interest Transactions ($) (continued): | ||||
| Dividends reinvested: | ||||
| Class A | 3,626,009 | 1,763,047 | ||
| Class C | 291,697 | 148,238 | ||
| Class I | 54,840 | 28,912 | ||
| Class J | 460,702 | 258,875 | ||
| Class Z | 864,634 | 453,407 | ||
| Cost of shares redeemed: | ||||
| Class A | (23,544,050 | ) | (24,106,360 | ) |
| Class C | (6,162,807 | ) | (19,107,485 | ) |
| Class I | (1,111,138 | ) | (643,471 | ) |
| Class J | (2,455,187 | ) | (3,281,169 | ) |
| Class Z | (5,587,355 | ) | (7,596,691 | ) |
| Increase (Decrease) in Net Assets from | ||||
| Beneficial Interest Transactions | (14,124,067 | ) | (16,329,377 | ) |
| Total Increase (Decrease) in Net Assets | 3,958,358 | 29,163,114 | ||
| Net Assets ($): | ||||
| Beginning of Period | 277,508,986 | 248,345,872 | ||
| End of Period | 281,467,344 | 277,508,986 | ||
| Undistributed investment income—net | 2,003,817 | 1,787,251 | ||
The Fund 25
STATEMENT OF CHANGES IN NET ASSETS (continued)
| Year Ended November 30, | ||||
| 2014 | 2013 | |||
| Capital Share Transactions: | ||||
| Class Aa | ||||
| Shares sold | 430,771 | 1,237,143 | ||
| Shares issued for dividends reinvested | 169,996 | 97,893 | ||
| Shares redeemed | (1,074,779 | ) | (1,230,209 | ) |
| Net Increase (Decrease) in Shares Outstanding | (474,012 | ) | 104,827 | |
| Class Ca | ||||
| Shares sold | 281,833 | 390,383 | ||
| Shares issued for dividends reinvested | 13,637 | 8,208 | ||
| Shares redeemed | (284,023 | ) | (964,097 | ) |
| Net Increase (Decrease) in Shares Outstanding | 11,447 | (565,506 | ) | |
| Class I | ||||
| Shares sold | 105,018 | 31,953 | ||
| Shares issued for dividends reinvested | 2,568 | 1,603 | ||
| Shares redeemed | (50,024 | ) | (33,230 | ) |
| Net Increase (Decrease) in Shares Outstanding | 57,562 | 326 | ||
| Class J | ||||
| Shares sold | 19,004 | 24,653 | ||
| Shares issued for dividends reinvested | 21,579 | 14,366 | ||
| Shares redeemed | (111,746 | ) | (167,503 | ) |
| Net Increase (Decrease) in Shares Outstanding | (71,163 | ) | (128,484 | ) |
| Class Z | ||||
| Shares sold | 52,960 | 111,562 | ||
| Shares issued for dividends reinvested | 40,689 | 25,274 | ||
| Shares redeemed | (257,550 | ) | (385,424 | ) |
| Net Increase (Decrease) in Shares Outstanding | (163,901 | ) | (248,588 | ) |
| a During the period ended November 30, 2013, 612,770 Class C shares representing $12,273,787 were exchanged |
| for 612,770 Class A shares. |
See notes to financial statements.
26
FINANCIAL HIGHLIGHTS
The following tables describe the performance for each share class for the fiscal periods indicated. All information (except portfolio turnover rate) reflects financial results for a single fund share.Total return shows how much your investment in the fund would have increased (or decreased) during each period, assuming you had reinvested all dividends and distributions.These figures have been derived from the fund’s financial statements.
| Year Ended November 30, | ||||||||||
| Class A Shares | 2014 | 2013 | 2012 | 2011 | 2010 | |||||
| Per Share Data ($): | ||||||||||
| Net asset value, beginning of period | 21.43 | 18.03 | 16.26 | 15.94 | 14.96 | |||||
| Investment Operations: | ||||||||||
| Investment income—neta | .19 | .18 | .21 | .21 | .21 | |||||
| Net realized and unrealized | ||||||||||
| gain (loss) on investments | 1.71 | 3.45 | 1.79 | .35 | 1.03 | |||||
| Total from Investment Operations | 1.90 | 3.63 | 2.00 | .56 | 1.24 | |||||
| Distributions: | ||||||||||
| Dividends from investment income—net | (.19 | ) | (.23 | ) | (.23 | ) | (.24 | ) | (.26 | ) |
| Dividends from net realized | ||||||||||
| gain on investments | (.28 | ) | — | — | — | — | ||||
| Total Distributions | (.47 | ) | (.23 | ) | (.23 | ) | (.24 | ) | (.26 | ) |
| Net asset value, end of period | 22.86 | 21.43 | 18.03 | 16.26 | 15.94 | |||||
| Total Return (%)b | 8.99 | 20.40 | 12.50 | 3.46 | 8.38 | |||||
| Ratios/Supplemental Data (%): | ||||||||||
| Ratio of total expenses | ||||||||||
| to average net assets | 1.27 | 1.32 | 1.37 | 1.36 | 1.37 | |||||
| Ratio of net expenses | ||||||||||
| to average net assets | 1.20 | 1.20 | 1.20 | 1.20 | 1.16 | |||||
| Ratio of net investment income | ||||||||||
| to average net assets | .86 | .91 | 1.19 | 1.23 | 1.33 | |||||
| Portfolio Turnover Rate | 110.18 | 112.56 | 117.20 | 99.71 | c | 103.49 | ||||
| Net Assets, end of period ($ x 1,000) | 183,228 | 181,922 | 151,113 | 151,210 | 143,378 | |||||
| a Based on average shares outstanding. |
| b Exclusive of sales charge. |
| c The portfolio turnover rate excluding mortgage dollar roll transactions for the period ended November 30, 2011 |
| was 97.61%. |
See notes to financial statements.
The Fund 27
FINANCIAL HIGHLIGHTS (continued)
| Year Ended November 30, | ||||||||||
| Class C Shares | 2014 | 2013 | 2012 | 2011 | 2010 | |||||
| Per Share Data ($): | ||||||||||
| Net asset value, beginning of period | 21.34 | 17.94 | 16.17 | 15.84 | 14.88 | |||||
| Investment Operations: | ||||||||||
| Investment income—neta | .02 | .04 | .08 | .08 | .09 | |||||
| Net realized and unrealized | ||||||||||
| gain (loss) on investments | 1.70 | 3.45 | 1.78 | .35 | 1.02 | |||||
| Total from Investment Operations | 1.72 | 3.49 | 1.86 | .43 | 1.11 | |||||
| Distributions: | ||||||||||
| Dividends from investment income—net | (.01 | ) | (.09 | ) | (.09 | ) | (.10 | ) | (.15 | ) |
| Dividends from net realized | ||||||||||
| gain on investments | (.28 | ) | — | — | — | — | ||||
| Total Distributions | (.29 | ) | (.09 | ) | (.09 | ) | (.10 | ) | (.15 | ) |
| Net asset value, end of period | 22.77 | 21.34 | 17.94 | 16.17 | 15.84 | |||||
| Total Return (%)b | 8.16 | 19.56 | 11.58 | 2.70 | 7.50 | |||||
| Ratios/Supplemental Data (%): | ||||||||||
| Ratio of total expenses | ||||||||||
| to average net assets | 2.01 | 2.05 | 2.08 | 2.04 | 2.05 | |||||
| Ratio of net expenses | ||||||||||
| to average net assets | 1.95 | 1.95 | 1.95 | 1.94 | 1.91 | |||||
| Ratio of net investment income | ||||||||||
| to average net assets | .11 | .18 | .44 | .48 | .58 | |||||
| Portfolio Turnover Rate | 110.18 | 112.56 | 117.20 | 99.71 | c | 103.49 | ||||
| Net Assets, end of period ($ x 1,000) | 33,966 | 31,582 | 36,703 | 38,205 | 44,683 | |||||
| a Based on average shares outstanding. |
| b Exclusive of sales charge. |
| c The portfolio turnover rate excluding mortgage dollar roll transactions for the period ended November 30, 2011 |
| was 97.61%. |
See notes to financial statements.
28
| Year Ended November 30, | ||||||||||
| Class I Shares | 2014 | 2013 | 2012 | 2011 | 2010 | |||||
| Per Share Data ($): | ||||||||||
| Net asset value, beginning of period | 21.49 | 18.08 | 16.31 | 15.97 | 14.97 | |||||
| Investment Operations: | ||||||||||
| Investment income—neta | .24 | .23 | .25 | .25 | .24 | |||||
| Net realized and unrealized | ||||||||||
| gain (loss) on investments | 1.72 | 3.46 | 1.80 | .36 | 1.03 | |||||
| Total from Investment Operations | 1.96 | 3.69 | 2.05 | .61 | 1.27 | |||||
| Distributions: | ||||||||||
| Dividends from investment income—net | (.24 | ) | (.28 | ) | (.28 | ) | (.27 | ) | (.27 | ) |
| Dividends from net realized | ||||||||||
| gain on investments | (.28 | ) | — | — | — | — | ||||
| Total Distributions | (.52 | ) | (.28 | ) | (.28 | ) | (.27 | ) | (.27 | ) |
| Net asset value, end of period | 22.93 | 21.49 | 18.08 | 16.31 | 15.97 | |||||
| Total Return (%) | 9.27 | 20.68 | 12.75 | 3.77 | 8.64 | |||||
| Ratios/Supplemental Data (%): | ||||||||||
| Ratio of total expenses | ||||||||||
| to average net assets | 1.01 | 1.05 | 1.09 | 1.04 | 1.04 | |||||
| Ratio of net expenses | ||||||||||
| to average net assets | .95 | .95 | .95 | .94 | .90 | |||||
| Ratio of net investment income | ||||||||||
| to average net assets | 1.09 | 1.17 | 1.45 | 1.48 | 1.58 | |||||
| Portfolio Turnover Rate | 110.18 | 112.56 | 117.20 | 99.71 | b | 103.49 | ||||
| Net Assets, end of period ($ x 1,000) | 4,099 | 2,604 | 2,184 | 2,086 | 2,468 | |||||
| a Based on average shares outstanding. |
| b The portfolio turnover rate excluding mortgage dollar roll transactions for the period ended November 30, 2011 |
| was 97.61%. |
See notes to financial statements.
The Fund 29
FINANCIAL HIGHLIGHTS (continued)
| Year Ended November 30, | ||||||||||
| Class J Shares | 2014 | 2013 | 2012 | 2011 | 2010 | |||||
| Per Share Data ($): | ||||||||||
| Net asset value, beginning of period | 21.49 | 18.06 | 16.29 | 15.96 | 14.97 | |||||
| Investment Operations: | ||||||||||
| Investment income—neta | .24 | .22 | .23 | .23 | .22 | |||||
| Net realized and unrealized | ||||||||||
| gain (loss) on investments | 1.71 | 3.47 | 1.80 | .36 | 1.03 | |||||
| Total from Investment Operations | 1.95 | 3.69 | 2.03 | .59 | 1.25 | |||||
| Distributions: | ||||||||||
| Dividends from investment income—net | (.23 | ) | (.26 | ) | (.26 | ) | (.26 | ) | (.26 | ) |
| Dividends from net realized | ||||||||||
| gain on investments | (.28 | ) | — | — | — | — | ||||
| Total Distributions | (.51 | ) | (.26 | ) | (.26 | ) | (.26 | ) | (.26 | ) |
| Net asset value, end of period | 22.93 | 21.49 | 18.06 | 16.29 | 15.96 | |||||
| Total Return (%) | 9.24 | 20.71 | 12.67 | 3.64 | 8.50 | |||||
| Ratios/Supplemental Data (%): | ||||||||||
| Ratio of total expenses | ||||||||||
| to average net assets | .99 | 1.03 | 1.06 | 1.03 | 1.02 | |||||
| Ratio of net expenses | ||||||||||
| to average net assets | .95 | .98 | 1.06 | 1.03 | 1.02 | |||||
| Ratio of net investment income | ||||||||||
| to average net assets | 1.11 | 1.13 | 1.33 | 1.39 | 1.46 | |||||
| Portfolio Turnover Rate | 110.18 | 112.56 | 117.20 | 99.71 | b | 103.49 | ||||
| Net Assets, end of period ($ x 1,000) | 20,184 | 20,441 | 19,499 | 21,430 | 23,767 | |||||
| a Based on average shares outstanding. |
| b The portfolio turnover rate excluding mortgage dollar roll transactions for the period ended November 30, 2011 |
| was 97.61%. |
See notes to financial statements.
30
| Year Ended November 30, | ||||||||||
| Class Z Shares | 2014 | 2013 | 2012 | 2011 | 2010 | |||||
| Per Share Data ($): | ||||||||||
| Net asset value, beginning of period | 21.37 | 17.94 | 16.20 | 15.88 | 14.90 | |||||
| Investment Operations: | ||||||||||
| Investment income—neta | .23 | .20 | .19 | .21 | .21 | |||||
| Net realized and unrealized | ||||||||||
| gain (loss) on investments | 1.70 | 3.45 | 1.78 | .35 | 1.03 | |||||
| Total from Investment Operations | 1.93 | 3.65 | 1.97 | .56 | 1.24 | |||||
| Distributions: | ||||||||||
| Dividends from investment income—net | (.21 | ) | (.22 | ) | (.23 | ) | (.24 | ) | (.26 | ) |
| Dividends from net realized | ||||||||||
| gain on investments | (.28 | ) | — | — | — | — | ||||
| Total Distributions | (.49 | ) | (.22 | ) | (.23 | ) | (.24 | ) | (.26 | ) |
| Net asset value, end of period | 22.81 | 21.37 | 17.94 | 16.20 | 15.88 | |||||
| Total Return (%) | 9.18 | 20.58 | 12.34 | 3.49 | 8.43 | |||||
| Ratios/Supplemental Data (%): | ||||||||||
| Ratio of total expenses | ||||||||||
| to average net assets | 1.10 | 1.17 | 1.28 | 1.19 | 1.12 | |||||
| Ratio of net expenses | ||||||||||
| to average net assets | 1.01 | 1.10 | 1.28 | 1.19 | 1.12 | |||||
| Ratio of net investment income | ||||||||||
| to average net assets | 1.05 | 1.02 | 1.11 | 1.23 | 1.37 | |||||
| Portfolio Turnover Rate | 110.18 | 112.56 | 117.20 | 99.71 | b | 103.49 | ||||
| Net Assets, end of period ($ x 1,000) | 39,991 | 40,960 | 38,848 | 39,744 | 43,924 | |||||
| a Based on average shares outstanding. |
| b The portfolio turnover rate excluding mortgage dollar roll transactions for the period ended November 30, 2011 |
| was 97.61%. |
See notes to financial statements.
The Fund 31
NOTES TO FINANCIAL STATEMENTS
NOTE 1—Significant Accounting Policies:
Dreyfus Balanced Opportunity Fund (the “fund”) is the sole series of Dreyfus Manager Funds II (the “Company”), which is registered under the Investment Company Act of 1940, as amended (the “Act”), as a diversified open-end management investment company. The fund’s investment objective is to seek a high total return through a combination of capital appreciation and current income. The Dreyfus Corporation (the “Manager” or “Dreyfus”), a wholly-owned subsidiary of The Bank of New York Mellon Corporation (“BNY Mellon”), serves as the fund’s investment adviser.
MBSC Securities Corporation (the “Distributor”), a wholly-owned subsidiary of the Manager, is the distributor of the fund’s shares. The fund is authorized to issue an unlimited number of $.001 par value shares of Beneficial Interest in each of the following classes of shares: Class A, Class C, Class I, Class J and Class Z. Class A shares generally are subject to a sales charge imposed at the time of purchase. Class C shares are subject to a contingent deferred sales charge (“CDSC”) imposed on Class C shares redeemed within one year of purchase. Class I, Class J and Class Z shares are sold at net asset value per share. Class I shares are sold generally to institutional investors and Class J and Class Z shares are closed to new investors. Other differences between the classes include the services offered to and the expenses borne by each class, the allocation of certain transfer agency costs, and certain voting rights. Income, expenses (other than expenses attributable to a specific class), and realized and unrealized gains or losses on investments are allocated to each class of shares based on its relative net assets.
The Financial Accounting Standards Board (“FASB”) Accounting Standards Codification (“ASC”) is the exclusive reference of authoritative U.S. generally accepted accounting principles (“GAAP”) recognized by the FASB to be applied by nongovernmental entities. Rules and interpretive releases of the Securities and Exchange Commission (“SEC”) under authority of federal laws are also sources of authoritative GAAP for
32
SEC registrants. The fund’s financial statements are prepared in accordance with GAAP, which may require the use of management estimates and assumptions. Actual results could differ from those estimates.
The Company enters into contracts that contain a variety of indemnifications. The fund’s maximum exposure under these arrangements is unknown.The fund does not anticipate recognizing any loss related to these arrangements.
(a) Portfolio valuation: The fair value of a financial instrument is the amount that would be received to sell an asset or paid to transfer a liability in an orderly transaction between market participants at the measurement date (i.e., the exit price). GAAP establishes a fair value hierarchy that prioritizes the inputs of valuation techniques used to measure fair value. This hierarchy gives the highest priority to unadjusted quoted prices in active markets for identical assets or liabilities (Level 1 measurements) and the lowest priority to unobservable inputs (Level 3 measurements).
Additionally, GAAP provides guidance on determining whether the volume and activity in a market has decreased significantly and whether such a decrease in activity results in transactions that are not orderly. GAAP requires enhanced disclosures around valuation inputs and techniques used during annual and interim periods.
Various inputs are used in determining the value of the fund’s investments relating to fair value measurements.These inputs are summarized in the three broad levels listed below:
Level 1—unadjusted quoted prices in active markets for identical investments.
Level 2—other significant observable inputs (including quoted prices for similar investments, interest rates, prepayment speeds, credit risk, etc.).
Level 3—significant unobservable inputs (including the fund’s own assumptions in determining the fair value of investments).
The Fund 33
NOTES TO FINANCIAL STATEMENTS (continued)
The inputs or methodology used for valuing securities are not necessarily an indication of the risk associated with investing in those securities.
Changes in valuation techniques may result in transfers in or out of an assigned level within the disclosure hierarchy. Valuation techniques used to value the fund’s investments are as follows:
Investments in equity securities are valued at the last sales price on the securities exchange or national securities market on which such securities are primarily traded. Securities listed on the National Market System for which market quotations are available are valued at the official closing price or, if there is no official closing price that day, at the last sales price. Securities not listed on an exchange or the national securities market, or securities for which there were no transactions, are valued at the average of the most recent bid and asked prices, except for open short positions, where the asked price is used for valuation purposes. Bid price is used when no asked price is available. Registered investment companies that are not traded on an exchange are valued at their net asset value. All of the preceding securities are generally categorized within Level 1 of the fair value hierarchy.
Investments in debt securities, excluding short-term investments (other than U.S. Treasury Bills), and financial futures are valued each business day by an independent pricing service (the “Service”) approved by the Company’s Board of Trustees (the “Board”). Investments for which quoted bid prices are readily available and are representative of the bid side of the market in the judgment of the Service are valued at the mean between the quoted bid prices (as obtained by the Service from dealers in such securities) and asked prices (as calculated by the Service based upon its evaluation of the market for such securities). Other investments are valued as determined by the Service, based on methods which include consideration of the following: yields or prices of securities of comparable quality, coupon, maturity and type; indications as to values from dealers; and general market conditions. These securities are generally categorized within Level 2 of the fair value hierarchy.
34
The Service’s procedures are reviewed by Dreyfus under the general supervision of the Board.
Fair valuing of securities may be determined with the assistance of a pricing service using calculations based on indices of domestic securities and other appropriate indicators, such as prices of relevant American Depository Receipts and financial futures. Utilizing these techniques may result in transfers between Level 1 and Level 2 of the fair value hierarchy.
When market quotations or official closing prices are not readily available, or are determined not to reflect accurately fair value, such as when the value of a security has been significantly affected by events after the close of the exchange or market on which the security is principally traded (for example, a foreign exchange or market), but before the fund calculates its net asset value, the fund may value these investments at fair value as determined in accordance with the procedures approved by the Board. Certain factors may be considered when fair valuing investments such as: fundamental analytical data, the nature and duration of restrictions on disposition, an evaluation of the forces that influence the market in which the securities are purchased and sold, and public trading in similar securities of the issuer or comparable issuers. These securities are either categorized within Level 2 or 3 of the fair value hierarchy depending on the relevant inputs used.
For restricted securities where observable inputs are limited, assumptions about market activity and risk are used and are generally categorized within Level 3 of the fair value hierarchy.
Investments denominated in foreign currencies are translated to U.S. dollars at the prevailing rates of exchange.
Financial futures, which are traded on an exchange, are valued at the last sales price on the securities exchange on which such securities are primarily traded or at the last sales price on the national securities market on each business day and are generally categorized within Level 1 of the fair value hierarchy.
The Fund 35
NOTES TO FINANCIAL STATEMENTS (continued)
The following is a summary of the inputs used as of November 30, 2014 in valuing the fund’s investments:
| Level 2—Other | Level 3— | ||||
| Level 1— | Significant | Significant | |||
| Unadjusted | Observable | Unobservable | |||
| Quoted Prices | Inputs | Inputs | Total | ||
| Assets ($) | |||||
| Investments in Securities: | |||||
| Asset-Backed | — | 2,971,303 | — | 2,971,303 | |
| Commercial Mortgage-Backed | — | 3,566,266 | — | 3,566,266 | |
| Corporate Bonds† | — | 27,015,814 | — | 27,015,814 | |
| Equity Securities— | |||||
| Domestic | |||||
| Common Stocks† | 178,306,262 | — | — | 178,306,262 | |
| Exchange-Traded | |||||
| Funds | 360,328 | — | — | 360,328 | |
| Foreign Government | — | 1,830,939 | — | 1,830,939 | |
| Municipal Bonds† | — | 864,540 | — | 864,540 | |
| Mutual Funds | 8,455,485 | — | — | 8,455,485 | |
| U.S. Government | |||||
| Agencies/ | |||||
| Mortgage-Backed | — | 28,592,720 | — | 28,592,720 | |
| U.S. Treasury | — | 28,674,575 | — | 28,674,575 | |
| † | See Statement of Investments for additional detailed categorizations. |
At November 30, 2014, there were no transfers between Level 1 and Level 2 of the fair value hierarchy.
(b) Foreign currency transactions: The fund does not isolate that portion of the results of operations resulting from changes in foreign exchange rates on investments from the fluctuations arising from changes in the market prices of securities held. Such fluctuations are included with the net realized and unrealized gain or loss on investments.
Net realized foreign exchange gains or losses arise from sales of foreign currencies, currency gains or losses realized on securities transactions between trade and settlement date, and the difference between the amounts of dividends, interest and foreign withholding taxes recorded
36
on the fund’s books and the U.S. dollar equivalent of the amounts actually received or paid. Net unrealized foreign exchange gains and losses arise from changes in the value of assets and liabilities other than investments resulting from changes in exchange rates. Foreign currency gains and losses on foreign currency transactions are also included with net realized and unrealized gain or loss on investments.
(c) Securities transactions and investment income: Securities transactions are recorded on a trade date basis. Realized gains and losses from securities transactions are recorded on the identified cost basis. Dividend income is recognized on the ex-dividend date and interest income, including, where applicable, accretion of discount and amortization of premium on investments, is recognized on the accrual basis.
Pursuant to a securities lending agreement with The Bank of New York Mellon, a subsidiary of BNY Mellon and an affiliate of Dreyfus, the fund may lend securities to qualified institutions. It is the fund’s policy that, at origination, all loans are secured by collateral of at least 102% of the value of U.S. securities loaned and 105% of the value of foreign securities loaned. Collateral equivalent to at least 100% of the market value of securities on loan is maintained at all times. Collateral is either in the form of cash, which can be invested in certain money market mutual funds managed by the Manager or U.S. Government and Agency securities. The fund is entitled to receive all dividends, interest and distributions on securities loaned, in addition to income earned as a result of the lending transaction. Should a borrower fail to return the securities in a timely manner, The Bank of New York Mellon is required to replace the securities for the benefit of the fund or credit the fund with the market value of the unreturned securities and is subrogated to the fund’s rights against the borrower and the collateral. During the period ended November 30, 2014,The Bank of New York Mellon earned $5,380 from lending portfolio securities, pursuant to the securities lending agreement.
The Fund 37
NOTES TO FINANCIAL STATEMENTS (continued)
(d) Affiliated issuers: Investments in other investment companies advised by Dreyfus are defined as “affiliated” under the Act. Investments in affiliated investment companies during the period ended November 30, 2014 were as follows:
| Affiliated | |||||
| Investment | Value | Value | Net | ||
| Company | 11/30/2013 ($) | Purchases ($) | Sales($) | 11/30/2014 ($) | Assets (%) |
| Dreyfus | |||||
| Institutional | |||||
| Preferred | |||||
| Plus Money | |||||
| Market Fund | 6,511,659 | 36,304,373 | 34,360,547 | 8,455,485 | 3.0 |
| Dreyfus | |||||
| Institutional | |||||
| Cash | |||||
| Advantage | |||||
| Fund | 1,013,009 | 22,662,572 | 23,675,581 | — | — |
| Total | 7,524,668 | 58,966,945 | 58,036,128 | 8,455,485 | 3.0 |
(e) Dividends to shareholders: Dividends are recorded on the ex-dividend date. Dividends from investment income-net and dividends from net realized capital gains, if any, are normally declared and paid annually, but the fund may make distributions on a more frequent basis to comply with the distribution requirements of the Internal Revenue Code of 1986, as amended (the “Code”). To the extent that net realized capital gains can be offset by capital loss carryovers, it is the policy of the fund not to distribute such gains. Income and capital gain distributions are determined in accordance with income tax regulations, which may differ from GAAP.
(f) Federal income taxes: It is the policy of the fund to continue to qualify as a regulated investment company, if such qualification is in the best interests of its shareholders, by complying with the applicable provisions of the Code, and to make distributions of taxable income sufficient to relieve it from substantially all federal income and excise taxes.
As of and during the period ended November 30, 2014, the fund did not have any liabilities for any uncertain tax positions. The fund recognizes interest and penalties, if any, related to uncertain tax positions as income tax expense in the Statement of Operations. During the period ended November 30, 2014, the fund did not incur any interest or penalties.
38
Each tax year in the four-year period ended November 30, 2014 remains subject to examination by the Internal Revenue Service and state taxing authorities.
At November 30, 2014, the components of accumulated earnings on a tax basis were as follows: undistributed ordinary income $4,260,621, undistributed capital gains $18,703,457, accumulated capital losses $7,356,398 and unrealized appreciation $28,809,609.
Under the Regulated Investment Company Modernization Act of 2010 (the “2010 Act”), the fund is permitted to carry forward capital losses incurred in taxable years beginning after December 22, 2010 (“post-enactment losses”) for an unlimited period. Furthermore, post-enactment capital loss carryovers retain their character as either short-term or long-term capital losses rather than short-term as they were under previous statute. The 2010 Act requires post-enactment losses to be utilized before the utilization of losses incurred in taxable years prior to the effective date of the 2010 Act (“pre-enactment losses”). As a result of this ordering rule, pre-enactment losses may be more likely to expire unused.
The accumulated capital loss carryover is available for federal income tax purposes to be applied against future net realized capital gains, if any, realized subsequent to November 30, 2014. Based on certain provisions in the Code, the amount of losses which can be utilized in subsequent years is subject to an annual limitation. If not applied, $6,849,060 of the carryover expires in fiscal year 2017, $359,386 expires in fiscal year 2018 and $147,952 expires in fiscal year 2019.
The tax character of distributions paid to shareholders during the fiscal periods ended November 30, 2014 and November 30, 2013 were as follows: ordinary income $2,212,496 and $2,898,031, and long-term capital gains $3,573,442 and $0, respectively.
During the period ended November 30, 2014, as a result of permanent book to tax differences, primarily due to the tax treatment for paydown gains and losses on mortgage-backed securities and consent fees, the
The Fund 39
NOTES TO FINANCIAL STATEMENTS (continued)
fund increased accumulated undistributed investment income-net by $155,931 and decreased accumulated net realized gain (loss) on investments by the same amount. Net assets and net asset value per share were not affected by this reclassification.
NOTE 2—Bank Lines of Credit:
The fund participates with other Dreyfus-managed funds in a $430 million unsecured credit facility led by Citibank, N.A. and a $300 million unsecured credit facility provided by The Bank of New York Mellon (each, a “Facility”), each to be utilized primarily for temporary or emergency purposes, including the financing of redemptions. Prior to October 8, 2014, the unsecured credit facility with Citibank, N.A. was $265 million. In connection therewith, the fund has agreed to pay its pro rata portion of commitment fees for each Facility. Interest is charged to the fund based on rates determined pursuant to the terms of the respective Facility at the time of borrowing. During the period ended November 30, 2014, the fund did not borrow under the Facilities.
NOTE 3—Management Fee and Other Transactions with Affiliates:
(a) Pursuant to a management agreement with the Manager, the management fee is computed at the annual rate of .80% of the value of the fund’s average daily net assets and is payable monthly.The Manager has contractually agreed, from December 1, 2013 through April 1, 2015, to waive receipt of its fees and/or assume the direct expenses of the fund, so that the expenses of none of the classes (excluding Rule 12b-1 Distribution Plan fees, Shareholder Services Plan fees, taxes, interest expense, brokerage commissions, commitment fees on borrowings and extraordinary expenses) exceed .95% of the value of the fund’s average daily net assets.The reduction in expenses, pursuant to the undertaking, amounted to $187,096 during the period ended November 30, 2014.
During the period ended November 30, 2014, the Distributor retained $11,665 from commissions earned on sales of the fund’s Class A shares and $24,521 from CDSCs on redemptions of the fund’s Class C shares.
40
(b) Under the Distribution Plan adopted pursuant to Rule 12b-1 under the Act, Class C shares pay the Distributor for distributing its shares at an annual rate of .75% of the value of its average daily net assets. During the period ended November 30, 2014, Class C shares were charged $244,383 pursuant to the Distribution Plan.
(c) Under the Shareholder Services Plan, Class A and Class C shares pay the Distributor at an annual rate of .25% of the value of their average daily net assets for the provision of certain services. The services provided may include personal services relating to shareholder accounts, such as answering shareholder inquiries regarding the fund and providing reports and other information, and services related to the maintenance of shareholder accounts. The Distributor may make payments to Service Agents (securities dealers, financial institutions or other industry professionals) with respect to these services. The Distributor determines the amounts to be paid to Service Agents. During the period ended November 30, 2014, Class A and Class C shares were charged $455,885 and $81,461, respectively, pursuant to the Shareholder Services Plan.
Under the Shareholder Services Plan, Class Z shares reimburse the Distributor an amount not to exceed an annual rate of .25% of the value of Class Z shares’ average daily net assets for certain allocated expenses of providing personal services and/or maintaining shareholder accounts. The services provided may include personal services relating to shareholder accounts, such as answering shareholder inquiries regarding and providing reports and other information, and services related to the maintenance of shareholder accounts. During the period ended November 30, 2014, Class Z shares was charged $24,079 pursuant to the Shareholder Services Plan.
The fund has arrangements with the transfer agent and the custodian whereby the fund may receive earnings credits when positive cash balances are maintained, which are used to offset transfer agency and custody fees. For financial reporting purposes, the fund includes net earnings credits as an expense offset in the Statement of Operations.
The Fund 41
NOTES TO FINANCIAL STATEMENTS (continued)
The fund compensates Dreyfus Transfer, Inc., a wholly-owned subsidiary of the Manager, under a transfer agency agreement for providing transfer agency and cash management services for the fund. The majority of transfer agency fees are comprised of amounts paid on a per account basis, while cash management fees are related to fund subscriptions and redemptions. During the period ended November 30, 2014, the fund was charged $101,439 for transfer agency services and $7,170 for cash management services. These fees are included in Shareholder servicing costs in the Statement of Operations. Cash management fees were partially offset by earnings credits of $464.
The fund compensates The Bank of NewYork Mellon under a custody agreement for providing custodial services for the fund.These fees are determined based on net assets, geographic region and transaction activity. During the period ended November 30, 2014, the fund was charged $35,336 pursuant to the custody agreement.
During the period ended November 30, 2014, the fund was charged $8,873 for services performed by the Chief Compliance Officer and his staff.
The components of “Due to The Dreyfus Corporation and affiliates” in the Statement of Assets and Liabilities consist of: management fees $183,950, Distribution Plan fees $20,861, Shareholder Services Plan fees $45,422, custodian fees $12,800, Chief Compliance Officer fees $1,480 and transfer agency fees $14,420, which are offset against an expense reimbursement currently in effect in the amount of $17,567.
(d) Each Board member also serves as a Board member of other funds within the Dreyfus complex. Annual retainer fees and attendance fees are allocated to each fund based on net assets.
NOTE 4—Securities Transactions:
The aggregate amount of purchases and sales (including paydowns) of investment securities, excluding short-term securities and financial futures, during the period ended November 30, 2014, amounted to $301,225,555 and $321,367,896, respectively.
42
Derivatives: A derivative is a financial instrument whose performance is derived from the performance of another asset. Each type of derivative instrument that was held by the fund during the period ended November 30, 2014 is discussed below.
Financial Futures: In the normal course of pursuing its investment objective, the fund is exposed to market risk, including, interest rate risk, as a result of changes in value of underlying financial instruments. The fund invests in financial futures in order to manage its exposure to or protect against changes in the market. A financial futures contract represents a commitment for the future purchase or a sale of an asset at a specified date. Upon entering into such contracts, these investments require initial margin deposits with a counterparty, which consist of cash or cash equivalents.The amount of these deposits is determined by the exchange or Board of Trade on which the contract is traded and is subject to change. Accordingly, variation margin payments are received or made to reflect daily unrealized gains or losses which are recorded in the Statement of Operations.When the contracts are closed, the fund recognizes a realized gain or loss which is reflected in the Statement of Operations.There is minimal counterparty credit risk to the fund with financial futures since they are exchange traded, and the exchange guarantees the financial futures against default. At November 30, 2014, there were no financial futures outstanding.
The following summarizes the average market value of derivatives outstanding during the period ended November 30, 2014:
| Average Market Value ($) | |
| Interest rate financial futures | 1,154,077 |
At November 30, 2014, the cost of investments for federal income tax purposes was $251,828,518; accordingly, accumulated net unrealized appreciation on investments was $28,809,714, consisting of $33,544,503 gross unrealized appreciation and $4,734,789 gross unrealized depreciation.
The Fund 43
| REPORT OF INDEPENDENT REGISTERED |
| PUBLIC ACCOUNTING FIRM |
Shareholders and Board of Trustees
Dreyfus Balanced Opportunity Fund
We have audited the accompanying statement of assets and liabilities, including the statement of investments, of Dreyfus Balanced Opportunity Fund (the sole series comprising Dreyfus Manager Funds II) as of November 30, 2014, and the related statement of operations for the year then ended, the statement of changes in net assets for each of the two years in the period then ended, and the financial highlights for each of the five years in the period then ended. These financial statements and financial highlights are the responsibility of the Fund’s management. Our responsibility is to express an opinion on these financial statements and financial highlights based on our audits.
We conducted our audits in accordance with the standards of the Public Company Accounting Oversight Board (United States). Those standards require that we plan and perform the audit to obtain reasonable assurance about whether the financial statements and financial highlights are free of material misstatement. We were not engaged to perform an audit of the Fund’s internal control over financial reporting. Our audits included consideration of internal control over financial reporting as a basis for designing audit procedures that are appropriate in the circumstances, but not for the purpose of expressing an opinion on the effectiveness of the Fund’s internal control over financial reporting. Accordingly, we express no such opinion. An audit also includes examining, on a test basis, evidence supporting the amounts and disclosures in the financial statements and financial highlights, assessing the accounting principles used and significant estimates made by management, and evaluating the overall financial statement presentation. Our procedures included confirmation of securities owned as of November 30, 2014 by correspondence with the custodian and others.We believe that our audits provide a reasonable basis for our opinion.
In our opinion, the financial statements and financial highlights referred to above present fairly, in all material respects, the financial position of Dreyfus Balanced Opportunity Fund at November 30, 2014, the results of its operations for the year then ended, the changes in its net assets for each of the two years in the period then ended, and the financial highlights for each of the five years in the period then ended, in conformity with U.S. generally accepted accounting principles.

New York, New York
January 28, 2015
44
IMPORTANT TAX INFORMATION (Unaudited)
For federal tax purposes the fund hereby reports 93.17% of the ordinary dividends paid during the fiscal year ended November 30, 2014 as qualifying for the corporate dividends received deduction.Also, certain dividends paid by the fund may be subject to a maximum tax rate of 15%, as provided for by the Jobs and Growth Tax Relief Reconciliation Act of 2003. Of the distributions paid during the fiscal year, $2,212,496 represents the maximum amount that may be considered qualified dividend income. Shareholders will receive notification in early 2015 of the percentage applicable to the preparation of their 2014 income tax returns. Also, the fund hereby reports $.2787 per share as a long-term capital gain distribution paid on December 31, 2013.
The Fund 45
| BOARD MEMBERS INFORMATION (Unaudited) |
| INDEPENDENT BOARD MEMBERS |
| Joseph S. DiMartino (71) |
| Chairman of the Board (2003) |
| Principal Occupation During Past 5Years: |
| • Corporate Director and Trustee (1995-present) |
| Other Public Company Board Memberships During Past 5Years: |
| • CBIZ (formerly, Century Business Services, Inc.), a provider of outsourcing functions for small |
| and medium size companies, Director (1997-present) |
| • The Newark Group, a provider of a national market of paper recovery facilities, paperboard |
| mills and paperboard converting plants, Director (2000-2010) |
| • Sunair Services Corporation, a provider of certain outdoor-related services to homes and |
| businesses, Director (2005-2009) |
| No. of Portfolios for which Board Member Serves: 146 |
| ——————— |
| Peggy C. Davis (71) |
| Board Member (2006) |
| Principal Occupation During Past 5Years: |
| • Shad Professor of Law, New York University School of Law (1983-present) |
| No. of Portfolios for which Board Member Serves: 52 |
| ——————— |
| David P. Feldman (75) |
| Board Member (2003) |
| Principal Occupation During Past 5Years: |
| • Corporate Director and Trustee (1985-present) |
| Other Public Company Board Membership During Past 5Years: |
| • BBH Mutual Funds Group (5 registered mutual funds), Director (1992-present) |
| No. of Portfolios for which Board Member Serves: 38 |
| ——————— |
| Ehud Houminer (74) |
| Board Member (2006) |
| Principal Occupation During Past 5Years: |
| • Executive-in-Residence at the Columbia Business School, Columbia University (1992-present) |
| Other Public Company Board Membership During Past 5Years: |
| • Avnet, Inc., an electronics distributor, Director (1993-2012) |
| No. of Portfolios for which Board Member Serves: 62 |
46
| Lynn Martin (74) |
| Board Member (2012) |
| Principal Occupation During Past 5Years: |
| • President of The Martin Hall Group LLC, a human resources consulting firm (2005-2012) |
| Other Public Company Board Memberships During Past 5Years: |
| • AT&T Inc., a telecommunications company, Director (1999-2012) |
| • Ryder System, Inc., a supply chain and transportation management company, Director (1993-2012) |
| • The Proctor & Gamble Co., a consumer products company, Director (1994-2009) |
| • Constellation Energy Group, Inc., Director (2003-2009) |
| No. of Portfolios for which Board Member Serves: 38 |
| ——————— |
| Robin A. Melvin (51) |
| Board Member (2012) |
| Principal Occupation During Past 5Years: |
| • Board Member, Illinois Mentoring Partnership, non-profit organization dedicated to increasing |
| the quantity and quality of mentoring services in Illinois (2013-present) |
| • Director, Boisi Family Foundation, a private family foundation that supports youth-serving orga- |
| nizations that promote the self sufficiency of youth from disadvantaged circumstances (1995-2012) |
| No. of Portfolios for which Board Member Serves: 114 |
| ——————— |
| Dr. Martin Peretz (75) |
| Board Member (2006) |
| Principal Occupation During Past 5Years: |
| • Editor-in-Chief Emeritus of The New Republic Magazine (2010-2011) (previously, |
| Editor-in-Chief, 1974-2010) |
| • Director of TheStreet.com, a financial information service on the web (1996-2010) |
| No. of Portfolios for which Board Member Serves: 38 |
| ——————— |
| Once elected all Board Members serve for an indefinite term, but achieve Emeritus status upon reaching age 80.The |
| address of the Board Members and Officers is c/o The Dreyfus Corporation, 200 Park Avenue, NewYork, NewYork |
| 10166.Additional information about the Board Members is available in the fund’s Statement of Additional Information |
| which can be obtained from Dreyfus free of charge by calling this toll free number: 1-800-DREYFUS. |
| James F. Henry, Emeritus Board Member |
| Rosalind G. Jacobs, Emeritus Board Member |
| Dr. Paul A. Marks, Emeritus Board Member |
| Daniel Rose, Emeritus Board Member |
| Philip L.Toia, Emeritus Board Member |
| Sander Vanocur, Emeritus Board Member |
The Fund 47
OFFICERS OF THE FUND (Unaudited)
BRADLEY J. SKAPYAK, President since January 2010.
Chief Operating Officer and a director of the Manager since June 2009, Chairman of Dreyfus Transfer, Inc., an affiliate of the Manager and the transfer agent of the funds, since May 2011 and Executive Vice President of the Distributor since June 2007. From April 2003 to June 2009, Mr. Skapyak was the head of the Investment Accounting and Support Department of the Manager. He is an officer of 69 investment companies (comprised of 146 portfolios) managed by the Manager. He is 56 years old and has been an employee of the Manager since February 1988.
JOHN PAK, Chief Legal Officer since March 2013.
Deputy General Counsel, Investment Management, of BNY Mellon since August 2014; Chief Legal Officer of the Manager since August 2012; from March 2005 to July 2012, Managing Director of Deutsche Bank, Deputy Global Head of Deutsche Asset Management Legal and Regional Head of Deutsche Asset Management Americas Legal. He is an officer of 70 investment companies (comprised of 171 portfolios) managed by the Manager. He is 46 years old and has been an employee of the Manager since August 2012.
JANETTE E. FARRAGHER, Vice President and Secretary since December 2011.
Assistant General Counsel of BNY Mellon, and an officer of 70 investment companies (comprised of 171 portfolios) managed by the Manager. She is 51 years old and has been an employee of the Manager since February 1984.
KIESHA ASTWOOD, Vice President and Assistant Secretary since January 2010.
Counsel of BNY Mellon, and an officer of 70 investment companies (comprised of 171 portfolios) managed by the Manager. She is 41 years old and has been an employee of the Manager since July 1995.
JAMES BITETTO, Vice President and Assistant Secretary since August 2005.
Managing Counsel of BNY Mellon and Secretary of the Manager, and an officer of 70 investment companies (comprised of 171 portfolios) managed by the Manager. He is 48 years old and has been an employee of the Manager since December 1996.
JONI LACKS CHARATAN, Vice President and Assistant Secretary since August 2005.
Managing Counsel of BNY Mellon, and an officer of 70 investment companies (comprised of 171 portfolios) managed by the Manager. She is 59 years old and has been an employee of the Manager since October 1988.
JOSEPH M. CHIOFFI, Vice President and Assistant Secretary since August 2005.
Managing Counsel of BNY Mellon, and an officer of 70 investment companies (comprised of 171 portfolios) managed by the Manager. He is 53 years old and has been an employee of the Manager since June 2000.
JOHN B. HAMMALIAN, Vice President and Assistant Secretary since August 2005.
Senior Managing Counsel of BNY Mellon, and an officer of 70 investment companies (comprised of 171 portfolios) managed by the Manager. He is 51 years old and has been an employee of the Manager since February 1991.
SARAH S. KELLEHER, Vice President and Assistant Secretary since April 2014.
Senior Counsel of BNY Mellon, and an officer of 70 investment companies (comprised of 171 portfolios) managed by the Manager; from August 2005 to March 2013, Associate General Counsel of Third Avenue Management. She is 38 years old and has been an employee of the Manager since March 2013.
48
JEFF PRUSNOFSKY, Vice President and Assistant Secretary since September 2003.
Senior Managing Counsel of BNY Mellon, and an officer of 70 investment companies (comprised of 171 portfolios) managed by the Manager. He is 49 years old and has been an employee of the Manager since October 1990.
JAMES WINDELS, Treasurer since September 2003.
Director – Mutual Fund Accounting of the Manager, and an officer of 70 investment companies (comprised of 171 portfolios) managed by the Manager. He is 56 years old and has been an employee of the Manager since April 1985.
RICHARD CASSARO, Assistant Treasurer since January 2008.
Senior Accounting Manager – Money Market and Municipal Bond Funds of the Manager, and an officer of 70 investment companies (comprised of 171 portfolios) managed by the Manager. He is 55 years old and has been an employee of the Manager since September 1982.
GAVIN C. REILLY, Assistant Treasurer since December 2005.
Tax Manager of the Investment Accounting and Support Department of the Manager, and an officer of 70 investment companies (comprised of 171 portfolios) managed by the Manager. He is 46 years old and has been an employee of the Manager since April 1991.
ROBERT S. ROBOL, Assistant Treasurer since August 2005.
Senior Accounting Manager – Fixed Income Funds of the Manager, and an officer of 70 investment companies (comprised of 171 portfolios) managed by the Manager. He is 50 years old and has been an employee of the Manager since October 1988.
ROBERT SALVIOLO, Assistant Treasurer since July 2007.
Senior Accounting Manager – Equity Funds of the Manager, and an officer of 70 investment companies (comprised of 171 portfolios) managed by the Manager. He is 47 years old and has been an employee of the Manager since June 1989.
ROBERT SVAGNA, Assistant Treasurer since September 2002.
Senior Accounting Manager – Equity Funds of the Manager, and an officer of 70 investment companies (comprised of 171 portfolios) managed by the Manager. He is 47 years old and has been an employee of the Manager since November 1990.
JOSEPH W. CONNOLLY, Chief Compliance Officer since October 2004.
Chief Compliance Officer of the Manager and The Dreyfus Family of Funds (70 investment companies, comprised of 171 portfolios). He is 57 years old and has served in various capacities with the Manager since 1980, including manager of the firm’s Fund Accounting Department from 1997 through October 2001.
MATTHEW D. CONNOLLY, Anti-Money Laundering Compliance Officer since April 2012.
Anti-Money Laundering Compliance Officer of the Distributor since October 2011; from March 2010 to September 2011, Global Head, KYC Reviews and Director of UBS Investment Bank; until March 2010, AML Compliance Officer and Senior Vice President of Citi Global Wealth Management. He is an officer of 65 investment companies (comprised of 166 portfolios) managed by the Manager. He is 42 years old and has been an employee of the Distributor since October 2011.
The Fund 49
For More Information
Telephone Call your financial representative or 1-800-DREYFUS
Mail The Dreyfus Family of Funds, 144 Glenn Curtiss Boulevard, Uniondale, NY 11556-0144
The fund files its complete schedule of portfolio holdings with the Securities and Exchange Commission (“SEC”) for the first and third quarters of each fiscal year on Form N-Q. The fund’s Forms N-Q are available on the SEC’s website at http://www.sec.gov and may be reviewed and copied at the SEC’s Public Reference Room in Washington, DC. Information on the operation of the Public Reference Room may be obtained by calling 1-800-SEC-0330.
A description of the policies and procedures that the fund uses to determine how to vote proxies relating to portfolio securities, and information regarding how the fund voted these proxies for the most recent 12-month period ended June 30 is available at http://www.dreyfus.com and on the SEC’s website at http://www.sec.gov. The description of the policies and procedures is also available without charge, upon request, by calling 1-800-DREYFUS.

Item 2. Code of Ethics.
The Registrant has adopted a code of ethics that applies to the Registrant's principal executive officer, principal financial officer, principal accounting officer or controller, or persons performing similar functions. There have been no amendments to, or waivers in connection with, the Code of Ethics during the period covered by this Report.
Item 3. Audit Committee Financial Expert.
The Registrant's Board has determined that David P. Feldman, a member of the Audit Committee of the Board, is an audit committee financial expert as defined by the Securities and Exchange Commission (the "SEC"). David P. Feldman is "independent" as defined by the SEC for purposes of audit committee financial expert determinations.
Item 4. Principal Accountant Fees and Services.
(a) Audit Fees. The aggregate fees billed for each of the last two fiscal years (the "Reporting Periods") for professional services rendered by the Registrant's principal accountant (the "Auditor") for the audit of the Registrant's annual financial statements or services that are normally provided by the Auditor in connection with the statutory and regulatory filings or engagements for the Reporting Periods, were $37,935 in 2013 and $38,694 in 2014.
(b) Audit-Related Fees. The aggregate fees billed in the Reporting Periods for assurance and related services by the Auditor that are reasonably related to the performance of the audit of the Registrant's financial statements and are not reported under paragraph (a) of this Item 4 were $7,691 in 2013 and $6,942 in 2014. These services consisted of one or more of the following: (i) agreed upon procedures related to compliance with Internal Revenue Code section 817(h), (ii) security counts required by Rule 17f-2 under the Investment Company Act of 1940, as amended, (iii) advisory services as to the accounting or disclosure treatment of Registrant transactions or events and (iv) advisory services to the accounting or disclosure treatment of the actual or potential impact to the Registrant of final or proposed rules, standards or interpretations by the Securities and Exchange Commission, the Financial Accounting Standards Boards or other regulatory or standard-setting bodies.
The aggregate fees billed in the Reporting Periods for non-audit assurance and related services by the Auditor to the Registrant's investment adviser (not including any sub-investment adviser whose role is primarily portfolio management and is subcontracted with or overseen by another investment adviser), and any entity controlling, controlled by or under common control with the investment adviser that provides ongoing services to the Registrant ("Service Affiliates"), that were reasonably related to the performance of the annual audit of the Service Affiliate, which required pre-approval by the Audit Committee were $-0- in 2013 and $-0- in 2014.
(c) Tax Fees. The aggregate fees billed in the Reporting Periods for professional services rendered by the Auditor for tax compliance, tax advice, and tax planning ("Tax Services") were $5,402 in 2013 and $6,893 in 2014. These services consisted of: (i) review or preparation of U.S. federal, state, local and excise tax returns; (ii) U.S. federal, state and local tax planning, advice and assistance regarding statutory, regulatory or administrative developments; (iii) tax advice regarding tax qualification matters and/or treatment of various financial instruments held or proposed to be acquired or held, and (iv) determination of Passive Foreign Investment Companies. The aggregate fees billed in the Reporting Periods for Tax Services by the Auditor to Service Affiliates, which required pre-approval by the Audit Committee were $-0- in 2013 and $-0- in 2014.
(d) All Other Fees. The aggregate fees billed in the Reporting Periods for products and services provided by the Auditor, other than the services reported in paragraphs (a) through (c) of this Item, were $984 in 2013 and $1,198 in 2014. These services consisted of a review of the Registrant's anti-money laundering program.
The aggregate fees billed in the Reporting Periods for Non-Audit Services by the Auditor to Service Affiliates, other than the services reported in paragraphs (b) through (c) of this Item, which required pre-approval by the Audit Committee, were $-0- in 2013 and $-0- in 2014.
(e)(1) Audit Committee Pre-Approval Policies and Procedures. The Registrant's Audit Committee has established policies and procedures (the "Policy") for pre-approval (within specified fee limits) of the Auditor's engagements for non-audit services to the Registrant and Service Affiliates without specific case-by-case consideration. The pre-approved services in the Policy can include pre-approved audit services, pre-approved audit-related services, pre-approved tax services and pre-approved all other services. Pre-approval considerations include whether the proposed services are compatible with maintaining the Auditor's independence. Pre-approvals pursuant to the Policy are considered annually.
(e)(2) Note: None of the services described in paragraphs (b) through (d) of this Item 4 were approved by the Audit Committee pursuant to paragraph (c)(7)(i)(C) of Rule 2-01 of Regulation S-X.
(f) None of the hours expended on the principal accountant's engagement to audit the registrant's financial statements for the most recent fiscal year were attributed to work performed by persons other than the principal account's full-time, permanent employees.
Non-Audit Fees. The aggregate non-audit fees billed by the Auditor for services rendered to the Registrant, and rendered to Service Affiliates, for the Reporting Periods were $51,023,448 in 2013 and $25,624,689 in 2014.
Auditor Independence. The Registrant's Audit Committee has considered whether the provision of non-audit services that were rendered to Service Affiliates, which were not pre-approved (not requiring pre-approval), is compatible with maintaining the Auditor's independence.
Item 5. Audit Committee of Listed Registrants.
Not applicable. [CLOSED-END FUNDS ONLY]
Item 6. Investments.
(a) Not applicable.
Item 7. Disclosure of Proxy Voting Policies and Procedures for Closed-End Management Investment Companies.
Not applicable. [CLOSED-END FUNDS ONLY]
Item 8. Portfolio Managers of Closed-End Management Investment Companies.
Not applicable. [CLOSED-END FUNDS ONLY, beginning with reports for periods ended on and after December 31, 2005]
Item 9. Purchases of Equity Securities by Closed-End Management Investment Companies and Affiliated Purchasers.
Not applicable. [CLOSED-END FUNDS ONLY]
Item 10. Submission of Matters to a Vote of Security Holders.
There have been no material changes to the procedures applicable to Item 10.
Item 11. Controls and Procedures.
(a) The Registrant's principal executive and principal financial officers have concluded, based on their evaluation of the Registrant's disclosure controls and procedures as of a date within 90 days of the filing date of this report, that the Registrant's disclosure controls and procedures are reasonably designed to ensure that information required to be disclosed by the Registrant on Form N-CSR is recorded, processed, summarized and reported within the required time periods and that information required to be disclosed by the Registrant in the reports that it files or submits on Form N-CSR is accumulated and communicated to the Registrant's management, including its principal executive and principal financial officers, as appropriate to allow timely decisions regarding required disclosure.
(b) There were no changes to the Registrant's internal control over financial reporting that occurred during the second fiscal quarter of the period covered by this report that have materially affected, or are reasonably likely to materially affect, the Registrant's internal control over financial reporting.
Item 12. Exhibits.
(a)(1) Code of ethics referred to in Item 2.
(a)(2) Certifications of principal executive and principal financial officers as required by Rule 30a-2(a) under the Investment Company Act of 1940.
(a)(3) Not applicable.
(b) Certification of principal executive and principal financial officers as required by Rule 30a-2(b) under the Investment Company Act of 1940.
SIGNATURES
Pursuant to the requirements of the Securities Exchange Act of 1934 and the Investment Company Act of 1940, the Registrant has duly caused this Report to be signed on its behalf by the undersigned, thereunto duly authorized.
Dreyfus Manager Funds II
By: /s/ Bradley J. Skapyak
Bradley J. Skapyak,
President
Date: January 22, 2015
Pursuant to the requirements of the Securities Exchange Act of 1934 and the Investment Company Act of 1940, this Report has been signed below by the following persons on behalf of the Registrant and in the capacities and on the dates indicated.
By: /s/ Bradley J. Skapyak
Bradley J. Skapyak,
President
Date: January 22, 2015
By: /s/ James Windels
James Windels,
Treasurer
Date: January 22, 2015
EXHIBIT INDEX
(a)(1) Code of ethics referred to in Item 2.
(a)(2) Certifications of principal executive and principal financial officers as required by Rule 30a-2(a) under the Investment Company Act of 1940. (EX-99.CERT)
(b) Certification Registrant's telephone number, of principal executive and principal financial officers as required by Rule 30a-2(b) under the Investment Company Act of 1940. (EX-99.906CERT)