4Q11 Financial and operating results for the period ended December 31, 2011 February 23, 2012 Unless otherwise specified, comparisons in this presentation are between 4Q11 and 4Q10. Exhibit 99.1

CNO Financial Group 2 Forward-Looking Statements Cautionary Statement Regarding Forward-Looking Statements. Our statements, trend analyses and other information contained in these materials relative to markets for CNO Financial’s products and trends in CNO Financial’s operations or financial results, as well as other statements, contain forward-looking statements within the meaning of the federal securities laws and the Private Securities Litigation Reform Act of 1995. Forward-looking statements typically are identified by the use of terms such as “anticipate,” “believe,” “plan,” “estimate,” “expect,” “project,” “intend,” “may,” “will,” “would,” “contemplate,” “possible,” “attempt,” “seek,” “should,” “could,” “goal,” “target,” “on track,” “comfortable with,” “optimistic” and similar words, although some forward-looking statements are expressed differently. You should consider statements that contain these words carefully because they describe our expectations, plans, strategies and goals and our beliefs concerning future business conditions, our results of operations, financial position, and our business outlook or they state other ‘‘forward-looking’’ information based on currently available information. Assumptions and other important factors that could cause our actual results to differ materially from those anticipated in our forward-looking statements include, among other things: (i) changes in or sustained low interest rates causing reductions in investment income, the margins of our fixed annuity and life insurance businesses, and sales of, and demand for, our products; (ii) general economic, market and political conditions, including the performance and fluctuations of the financial markets which may affect the value of our investments as well as our ability to raise capital or refinance existing indebtedness and the cost of doing so; (iii) the ultimate outcome of lawsuits filed against us and other legal and regulatory proceedings to which we are subject; (iv) our ability to make anticipated changes to certain non-guaranteed elements of our life insurance products; (v) our ability to obtain adequate and timely rate increases on our health products, including our long-term care business; (vi) the receipt of any required regulatory approvals for dividend and surplus debenture interest payments from our insurance subsidiaries; (vii) mortality, morbidity, the increased cost and usage of health care services, persistency, the adequacy of our previous reserve estimates and other factors which may affect the profitability of our insurance products; (viii) changes in our assumptions related to deferred acquisition costs or the present value of future profits; (ix) the recoverability of our deferred tax assets and the effect of potential ownership changes and tax rate changes on their value; (x) our assumption that the positions we take on our tax return filings, including our position that our 7.0% convertible senior debentures due 2016 will not be treated as stock for purposes of Section 382 of the Internal Revenue Code of 1986, as amended, and will not trigger an ownership change, will not be successfully challenged by the Internal Revenue Service; (xi) changes in accounting principles and the interpretation thereof (including changes in principles related to accounting for deferred acquisition costs); (xii) our ability to continue to satisfy the financial ratio and balance requirements and other covenants of our debt agreements; (xiii) our ability to achieve anticipated expense reductions and levels of operational efficiencies including improvements in claims adjudication and continued automation and rationalization of operating systems, (xiv) performance and valuation of our investments, including the impact of realized losses (including other-than-temporary impairment charges); (xv) our ability to identify products and markets in which we can compete effectively against competitors with greater market share, higher ratings, greater financial resources and stronger brand recognition; (xvi) our ability to generate sufficient liquidity to meet our debt service obligations and other cash needs; (xvii) our ability to maintain effective controls over financial reporting; (xviii) our ability to continue to recruit and retain productive agents and distribution partners and customer response to new products, distribution channels and marketing initiatives; (xix) our ability to achieve eventual upgrades of the financial strength ratings of CNO Financial and our insurance company subsidiaries as well as the impact of our ratings on our business, our ability to access capital and the cost of capital; (xx) the risk factors or uncertainties listed from time to time in our filings with the Securities and Exchange Commission; (xxi) regulatory changes or actions, including those relating to regulation of the financial affairs of our insurance companies, such as the payment of dividends and surplus debenture interest to us, regulation of the sale, underwriting and pricing of products, and health care regulation affecting health insurance products; and (xxii) changes in the Federal income tax laws and regulations which may affect or eliminate the relative tax advantages of some of our products or affect the value of our deferred tax assets. Other factors and assumptions not identified above are also relevant to the forward-looking statements, and if they prove incorrect, could also cause actual results to differ materially from those projected. All forward-looking statements are expressly qualified in their entirety by the foregoing cautionary statements. Our forward- looking statements speak only as of the date made. We assume no obligation to update or to publicly announce the results of any revisions to any of the forward-looking statements to reflect actual results, future events or developments, changes in assumptions or changes in other factors affecting the forward-looking statements.
CNO Financial Group 3 Non-GAAP Measures This presentation contains the following financial measures that differ from the comparable measures under Generally Accepted Accounting Principles (GAAP): operating earnings measures; book value, excluding accumulated other comprehensive income (loss) per share; operating return measures; earnings before net realized investment gains (losses) and corporate interest and taxes; and debt to capital ratios, excluding accumulated other comprehensive income (loss). Reconciliations between those non-GAAP measures and the comparable GAAP measures are included in the Appendix, or on the page such measure is presented. While management believes these measures are useful to enhance understanding and comparability of our financial results, these non-GAAP measures should not be considered substitutes for the most directly comparable GAAP measures. Additional information concerning non-GAAP measures is included in our periodic filings with the Securities and Exchange Commission that are available in the “Investors – SEC Filings” section of CNO’s website, www.CNOinc.com.

CNO Financial Group 4
CNO Financial Group 5 Summary Our businesses continue to perform well – Solid earnings continued throughout 2011 – Sales in the quarter grew 6% over 4Q2010 Financial strength and credit profile continue to improve – Generating significant amounts of excess capital – Statutory capital and RBC continued to increase in 2011 – Leverage at 17.1% Continue emphasis on profitable organic growth – Sales in all 3 core* segments increased in 2011 – Added 15 Bankers locations in 2011 – Investing in further agent recruiting, footprint expansion and field management development CNO * Actively marketed segments
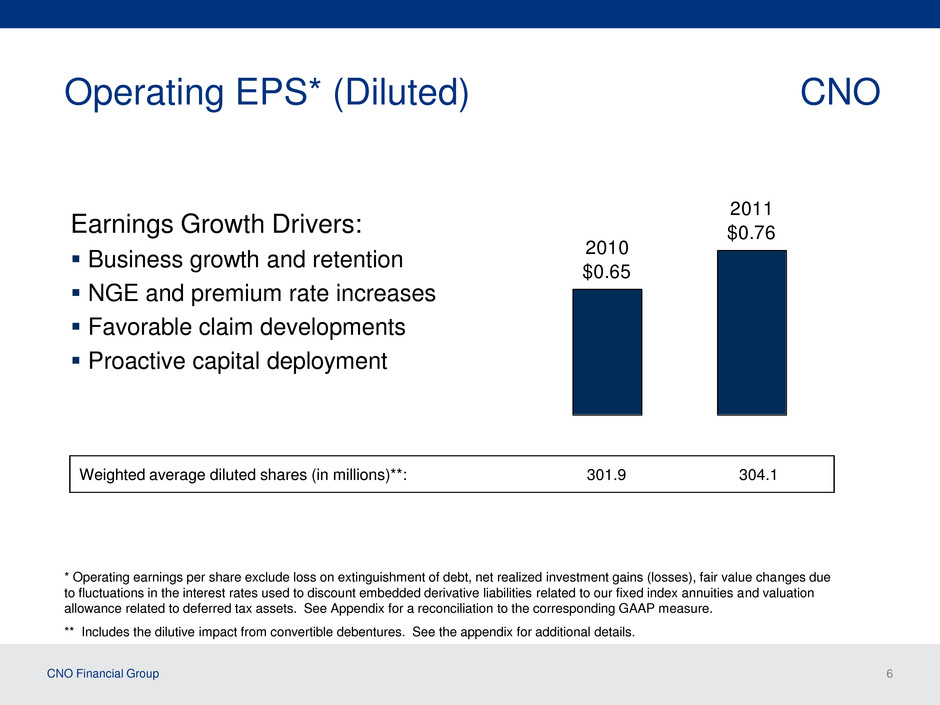
CNO Financial Group 6 Operating EPS* (Diluted) CNO Earnings Growth Drivers: Business growth and retention NGE and premium rate increases Favorable claim developments Proactive capital deployment 2010 $0.65 2011 $0.76 * Operating earnings per share exclude loss on extinguishment of debt, net realized investment gains (losses), fair value changes due to fluctuations in the interest rates used to discount embedded derivative liabilities related to our fixed index annuities and valuation allowance related to deferred tax assets. See Appendix for a reconciliation to the corresponding GAAP measure. ** Includes the dilutive impact from convertible debentures. See the appendix for additional details. Weighted average diluted shares (in millions)**: 301.9 304.1
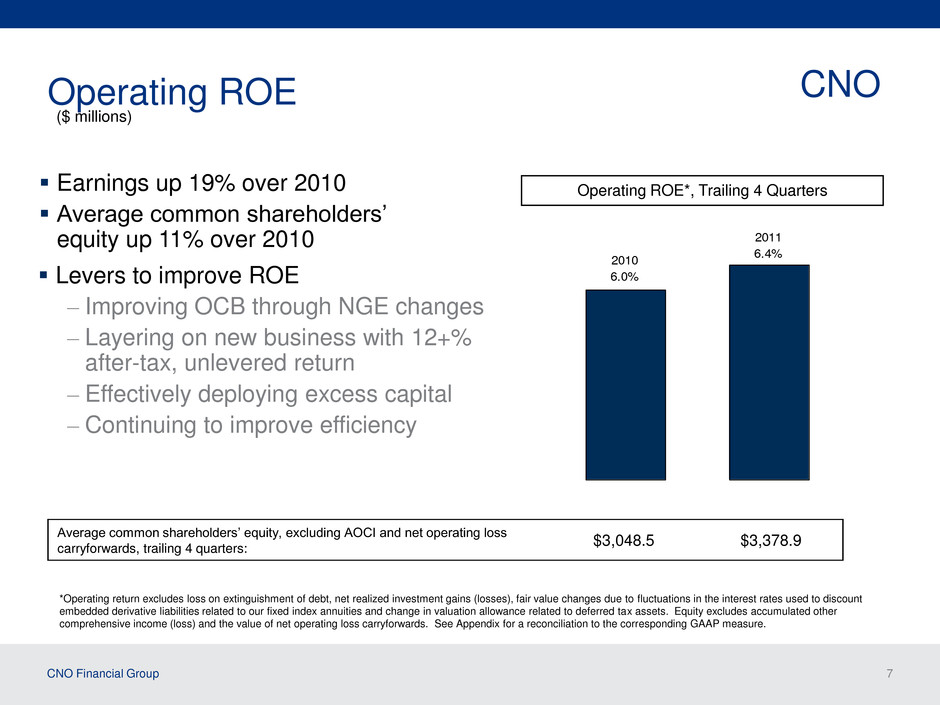
CNO Financial Group 7 Operating ROE CNO Operating ROE*, Trailing 4 Quarters *Operating return excludes loss on extinguishment of debt, net realized investment gains (losses), fair value changes due to fluctuations in the interest rates used to discount embedded derivative liabilities related to our fixed index annuities and change in valuation allowance related to deferred tax assets. Equity excludes accumulated other comprehensive income (loss) and the value of net operating loss carryforwards. See Appendix for a reconciliation to the corresponding GAAP measure. Average common shareholders’ equity, excluding AOCI and net operating loss carryforwards, trailing 4 quarters: $3,048.5 $3,378.9 ($ millions) 2010 6.0% 2011 6.4% Earnings up 19% over 2010 Average common shareholders’ equity up 11% over 2010 Levers to improve ROE – Improving OCB through NGE changes – Layering on new business with 12+% after-tax, unlevered return – Effectively deploying excess capital – Continuing to improve efficiency

CNO Financial Group 8 $11,478.0 $12,106.9 $12,765.2 $2,894.9 $2,676.8 $2,637.6 $698.0 $704.0 $693.6 Growth in the CNO Franchise ($ millions) $16,106.8 Average liabilities on core business segments are increasing, while OCB is shrinking CNO $15,066.5 $15,481.7 $5,799.2 $5,511.5 $5,286.1 2009 2010 2011
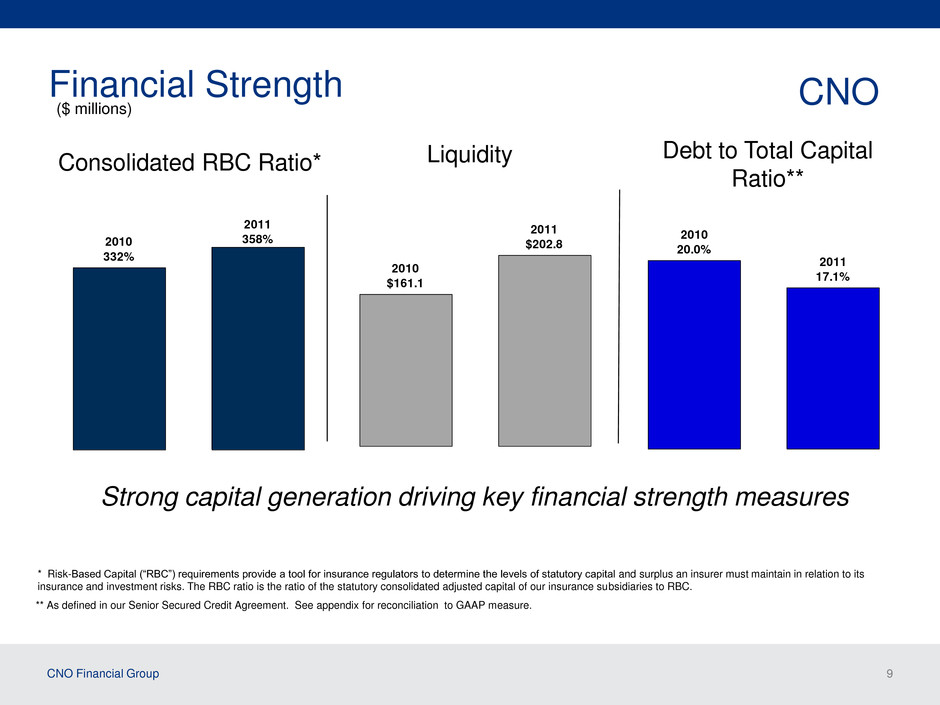
CNO Financial Group 9 Financial Strength CNO * Risk-Based Capital (“RBC”) requirements provide a tool for insurance regulators to determine the levels of statutory capital and surplus an insurer must maintain in relation to its insurance and investment risks. The RBC ratio is the ratio of the statutory consolidated adjusted capital of our insurance subsidiaries to RBC. Consolidated RBC Ratio* Liquidity ($ millions) ** As defined in our Senior Secured Credit Agreement. See appendix for reconciliation to GAAP measure. Strong capital generation driving key financial strength measures 2010 20.0% 2011 17.1% 2010 $161.1 2011 $202.8 Debt to Total Capital Ratio** 2010 332% 2011 358%
CNO Financial Group 10 2011: A Year of Accomplishments CNO Continued to generate significant excess capital Maintained focus on growing the franchise and brands Progress recognized in ratings upgrades Financial strength and credit profile further improved
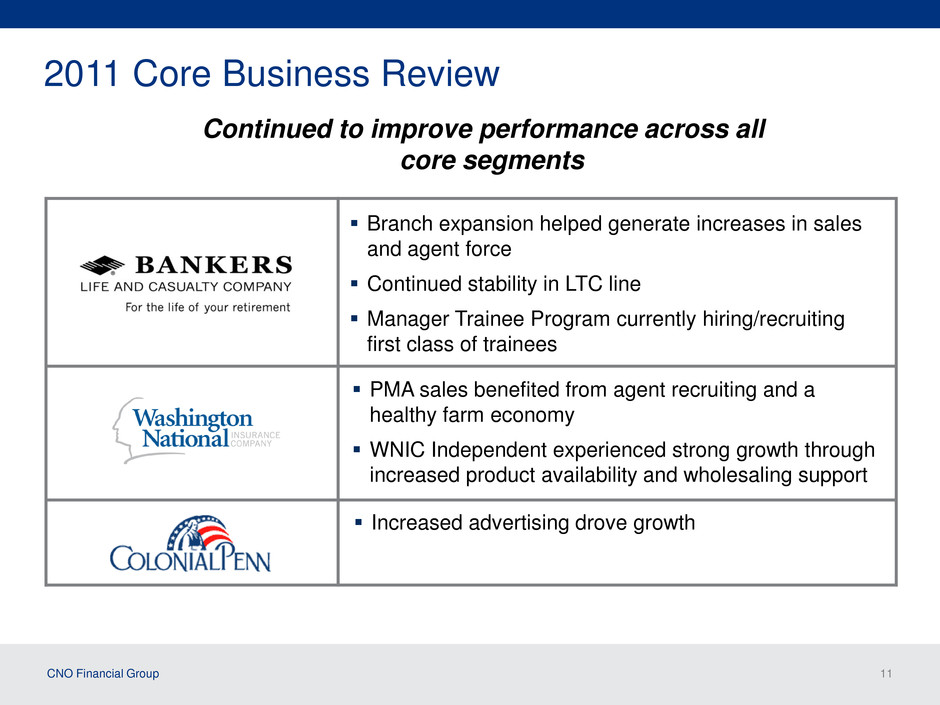
CNO Financial Group 11 2011 Core Business Review Continued to improve performance across all core segments Branch expansion helped generate increases in sales and agent force Continued stability in LTC line Manager Trainee Program currently hiring/recruiting first class of trainees PMA sales benefited from agent recruiting and a healthy farm economy WNIC Independent experienced strong growth through increased product availability and wholesaling support Increased advertising drove growth
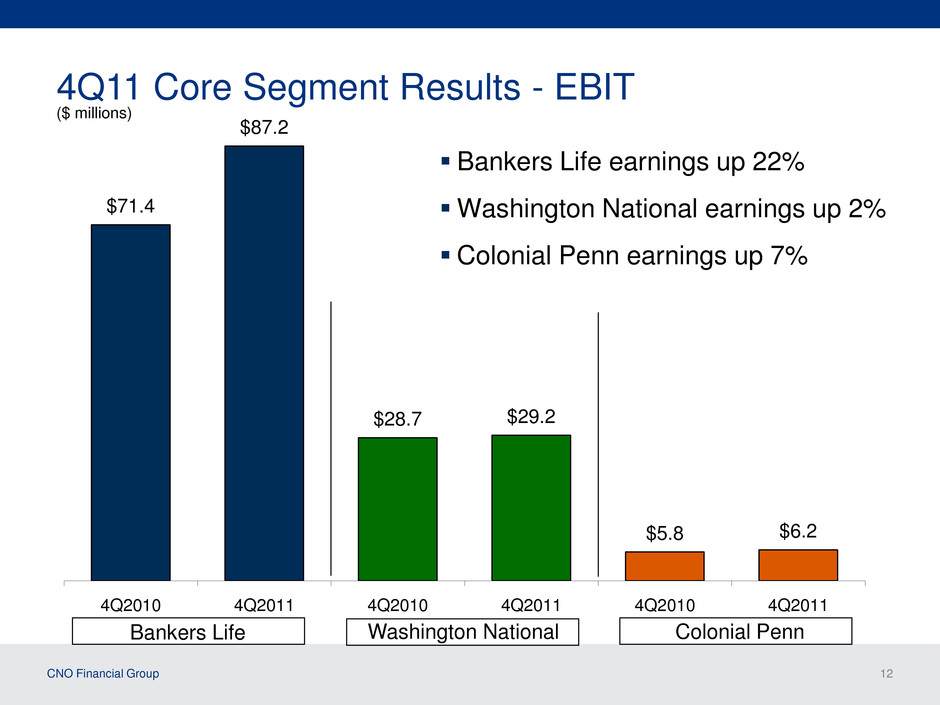
CNO Financial Group 12 $71.4 $87.2 $28.7 $29.2 $5.8 $6.2 4Q2010 4Q2011 4Q2010 4Q2011 4Q2010 4Q2011 Bankers Life earnings up 22% Washington National earnings up 2% Colonial Penn earnings up 7% 4Q11 Core Segment Results - EBIT Bankers Life Washington National Colonial Penn ($ millions)
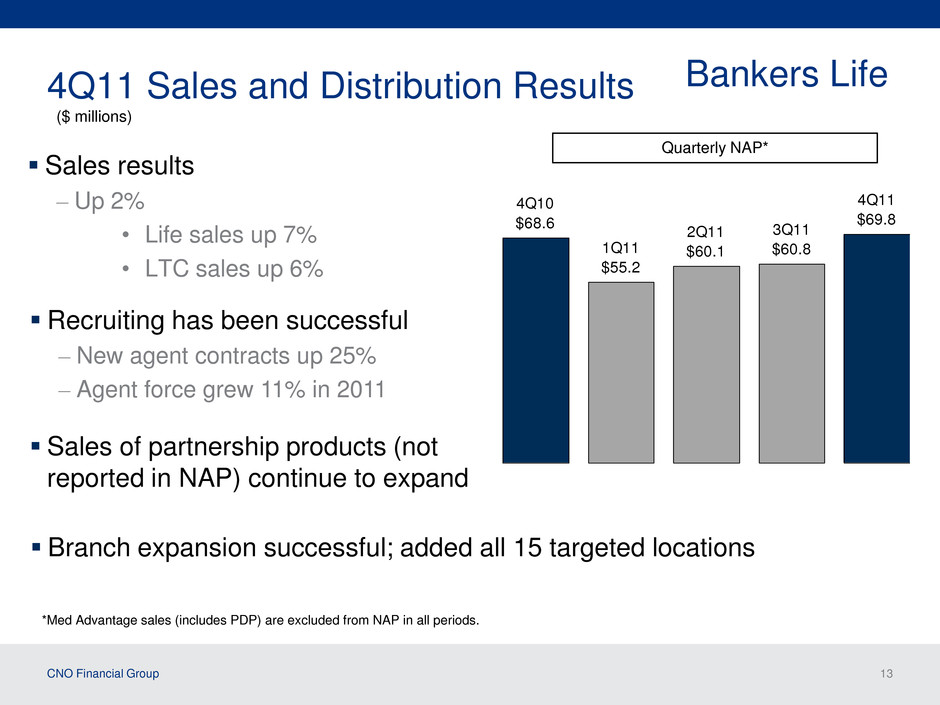
CNO Financial Group 13 4Q11 Sales and Distribution Results Sales results – Up 2% • Life sales up 7% • LTC sales up 6% Bankers Life Quarterly NAP* *Med Advantage sales (includes PDP) are excluded from NAP in all periods. ($ millions) Recruiting has been successful – New agent contracts up 25% – Agent force grew 11% in 2011 4Q10 $68.6 1Q11 $55.2 2Q11 $60.1 3Q11 $60.8 4Q11 $69.8 Branch expansion successful; added all 15 targeted locations Sales of partnership products (not reported in NAP) continue to expand
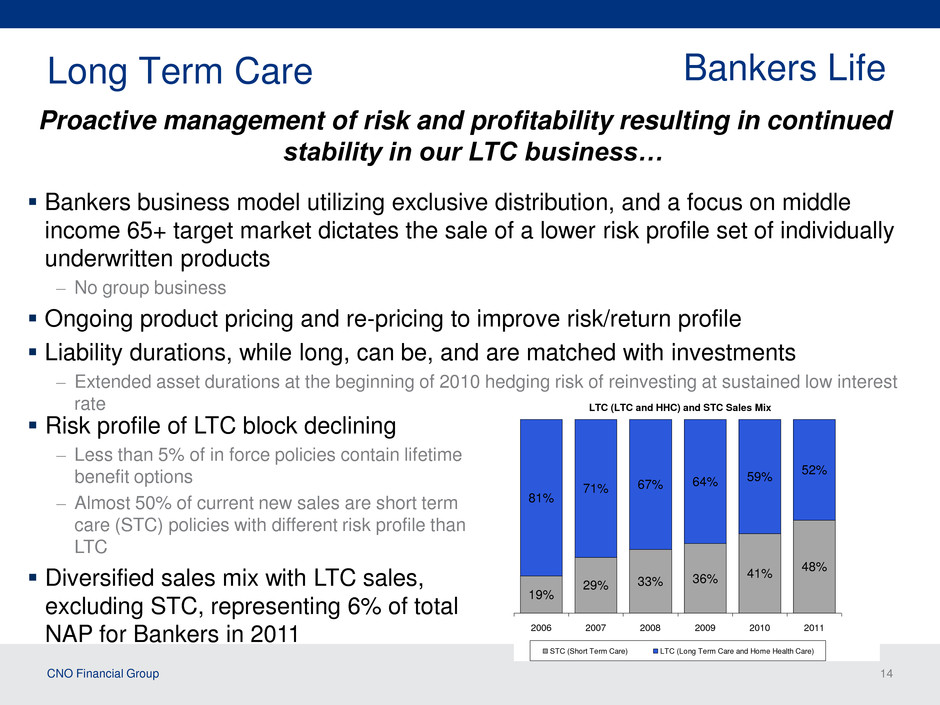
CNO Financial Group 14 LTC (LTC and HHC) and STC Sales Mix 19% 29% 33% 36% 41% 48% 81% 71% 67% 64% 59% 52% 2006 2007 2008 2009 2010 2011 STC (Short Term Care) LTC (Long Term Care and Home Health Care) Long Term Care Bankers Life Bankers business model utilizing exclusive distribution, and a focus on middle income 65+ target market dictates the sale of a lower risk profile set of individually underwritten products – No group business Ongoing product pricing and re-pricing to improve risk/return profile Liability durations, while long, can be, and are matched with investments – Extended asset durations at the beginning of 2010 hedging risk of reinvesting at sustained low interest rate Risk profile of LTC block declining – Less than 5% of in force policies contain lifetime benefit options – Almost 50% of current new sales are short term care (STC) policies with different risk profile than LTC Diversified sales mix with LTC sales, excluding STC, representing 6% of total NAP for Bankers in 2011 Proactive management of risk and profitability resulting in continued stability in our LTC business…
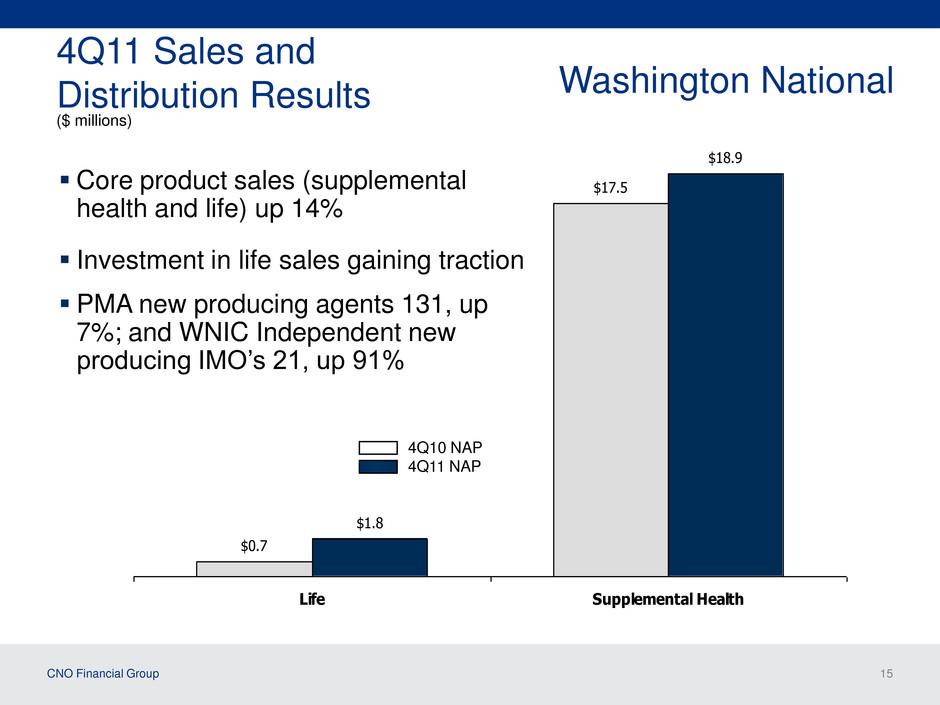
CNO Financial Group 15 Washington National $0.7 $17.5 $18.9 $1.8 Life Supplemental Health4Q10 NAP 4Q11 NAP 4Q11 Sales and Distribution Results ($ millions) Core product sales (supplemental health and life) up 14% Investment in life sales gaining traction PMA new producing agents 131, up 7%; and WNIC Independent new producing IMO’s 21, up 91%
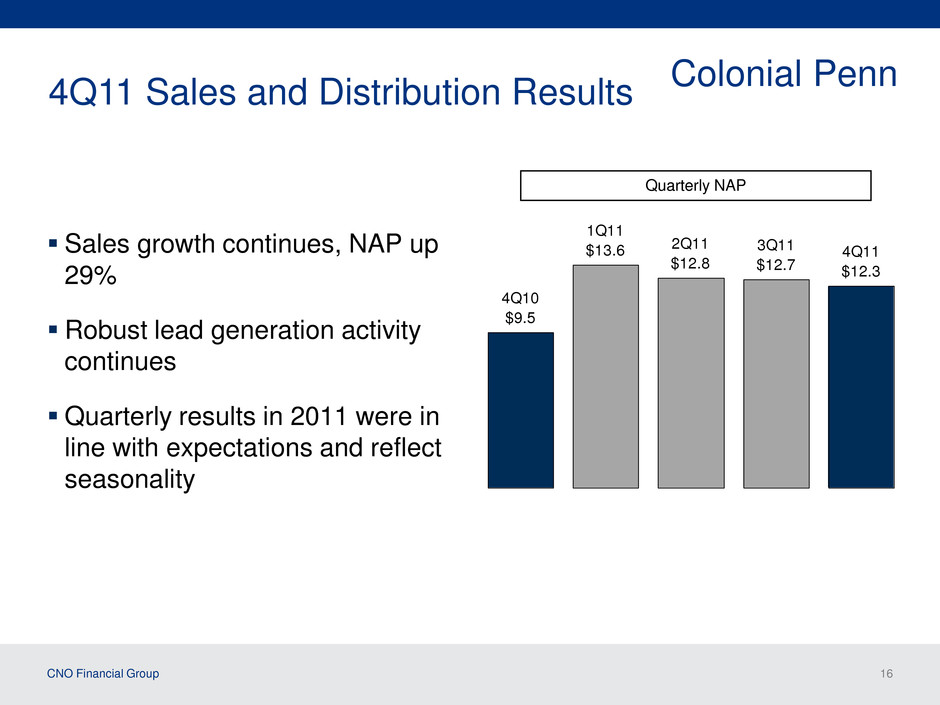
CNO Financial Group 16 Sales growth continues, NAP up 29% Robust lead generation activity continues Quarterly results in 2011 were in line with expectations and reflect seasonality 4Q11 Sales and Distribution Results Colonial Penn 4Q10 $9.5 1Q11 $13.6 2Q11 $12.8 3Q11 $12.7 4Q11 $12.3 Quarterly NAP
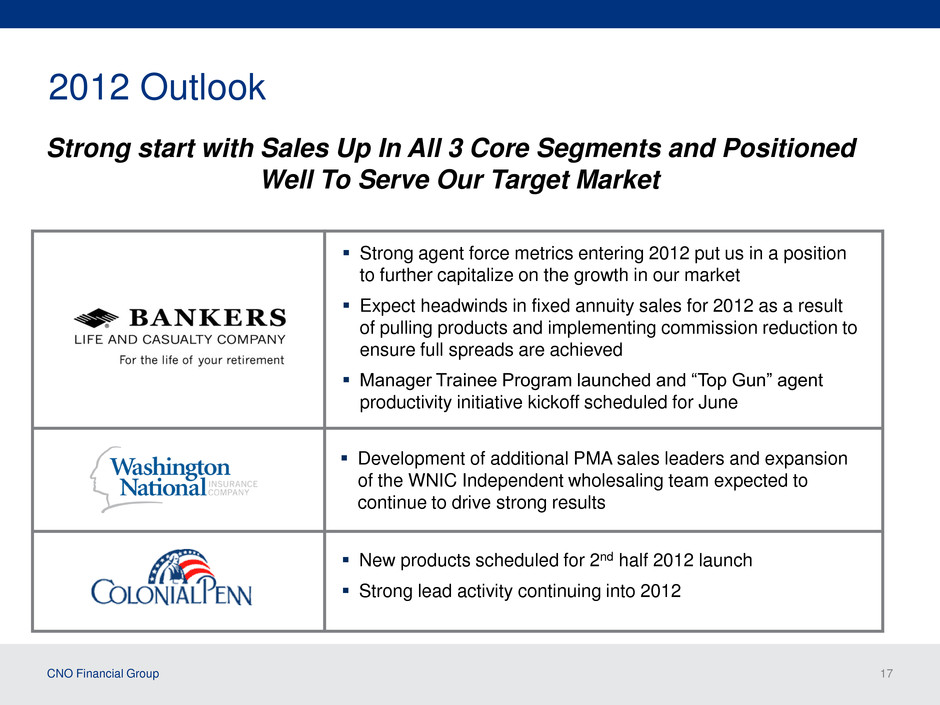
CNO Financial Group 17 2012 Outlook Strong start with Sales Up In All 3 Core Segments and Positioned Well To Serve Our Target Market Strong agent force metrics entering 2012 put us in a position to further capitalize on the growth in our market Expect headwinds in fixed annuity sales for 2012 as a result of pulling products and implementing commission reduction to ensure full spreads are achieved Manager Trainee Program launched and “Top Gun” agent productivity initiative kickoff scheduled for June Development of additional PMA sales leaders and expansion of the WNIC Independent wholesaling team expected to continue to drive strong results New products scheduled for 2nd half 2012 launch Strong lead activity continuing into 2012
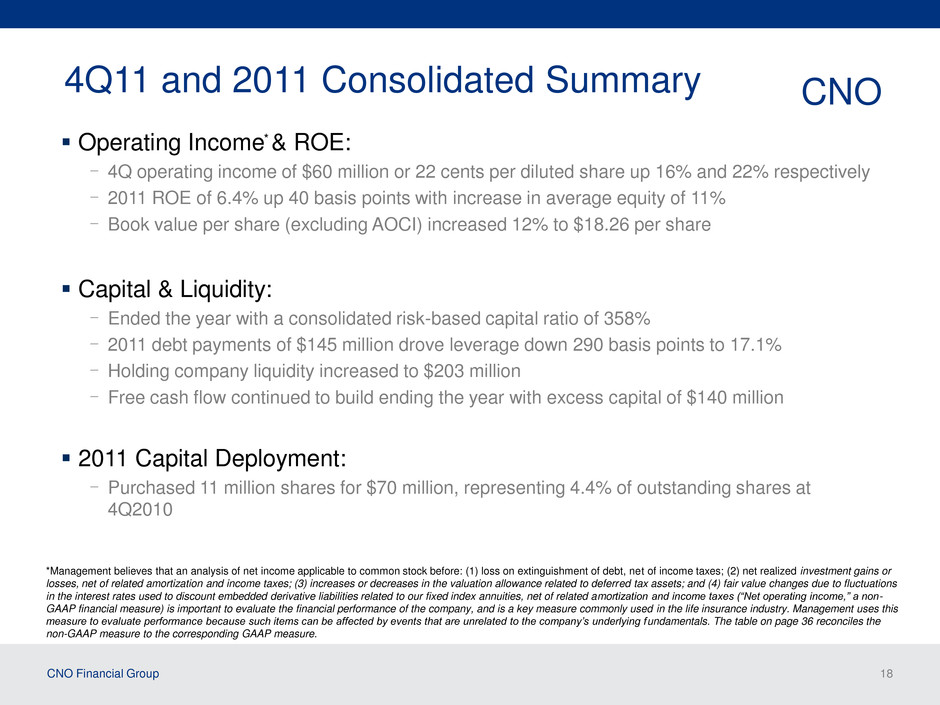
CNO Financial Group 18 4Q11 and 2011 Consolidated Summary CNO *Management believes that an analysis of net income applicable to common stock before: (1) loss on extinguishment of debt, net of income taxes; (2) net realized investment gains or losses, net of related amortization and income taxes; (3) increases or decreases in the valuation allowance related to deferred tax assets; and (4) fair value changes due to fluctuations in the interest rates used to discount embedded derivative liabilities related to our fixed index annuities, net of related amortization and income taxes (“Net operating income,” a non- GAAP financial measure) is important to evaluate the financial performance of the company, and is a key measure commonly used in the life insurance industry. Management uses this measure to evaluate performance because such items can be affected by events that are unrelated to the company’s underlying fundamentals. The table on page 36 reconciles the non-GAAP measure to the corresponding GAAP measure. Operating Income & ROE: - 4Q operating income of $60 million or 22 cents per diluted share up 16% and 22% respectively - 2011 ROE of 6.4% up 40 basis points with increase in average equity of 11% - Book value per share (excluding AOCI) increased 12% to $18.26 per share Capital & Liquidity: - Ended the year with a consolidated risk-based capital ratio of 358% - 2011 debt payments of $145 million drove leverage down 290 basis points to 17.1% - Holding company liquidity increased to $203 million - Free cash flow continued to build ending the year with excess capital of $140 million 2011 Capital Deployment: - Purchased 11 million shares for $70 million, representing 4.4% of outstanding shares at 4Q2010 *
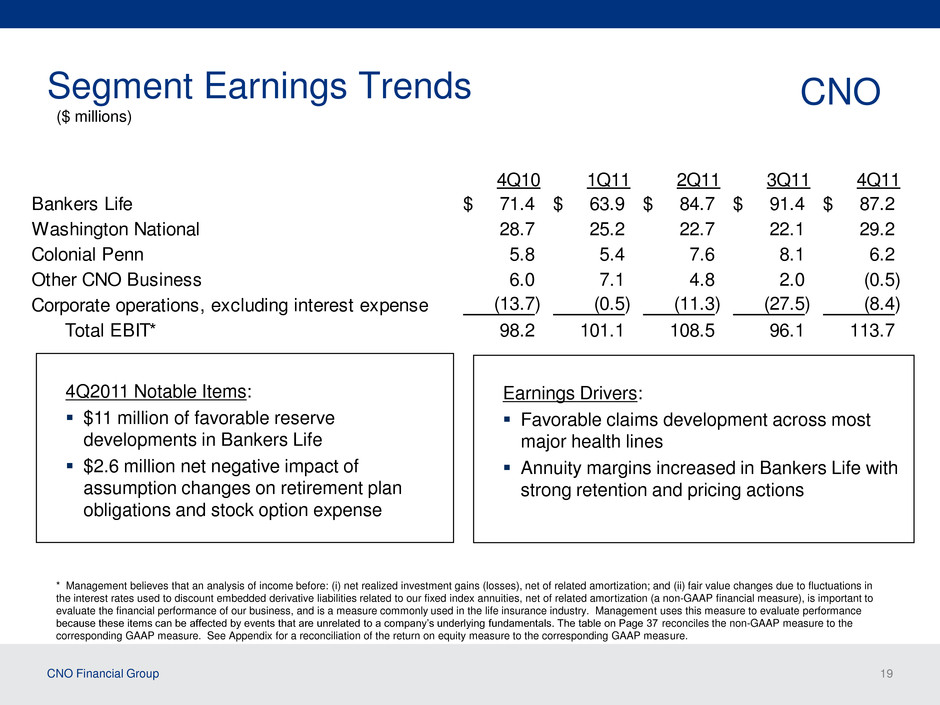
CNO Financial Group 19 Segment Earnings Trends CNO ($ millions) 4Q10 1Q11 2Q11 3Q11 4Q11 Bankers Life 71.4$ 63.9$ 84.7$ 91.4$ 87.2$ Washington National 28.7 25.2 22.7 22.1 29.2 Colonial Penn 5.8 5.4 7.6 8.1 6.2 Other CNO Business 6.0 7.1 4.8 2.0 (0.5) Corporate operations, excluding interest expense (13.7) (0.5) (11.3) (27.5) (8.4) Total EBIT* 98.2 101.1 108.5 96.1 113.7 * Management believes that an analysis of income before: (i) net realized investment gains (losses), net of related amortization; and (ii) fair value changes due to fluctuations in the interest rates used to discount embedded derivative liabilities related to our fixed index annuities, net of related amortization (a non-GAAP financial measure), is important to evaluate the financial performance of our business, and is a measure commonly used in the life insurance industry. Management uses this measure to evaluate performance because these items can be affected by events that are unrelated to a company’s underlying fundamentals. The table on Page 37 reconciles the non-GAAP measure to the corresponding GAAP measure. See Appendix for a reconciliation of the return on equity measure to the corresponding GAAP measure. 4Q2011 Notable Items: $11 million of favorable reserve developments in Bankers Life $2.6 million net negative impact of assumption changes on retirement plan obligations and stock option expense Earnings Drivers: Favorable claims development across most major health lines Annuity margins increased in Bankers Life with strong retention and pricing actions
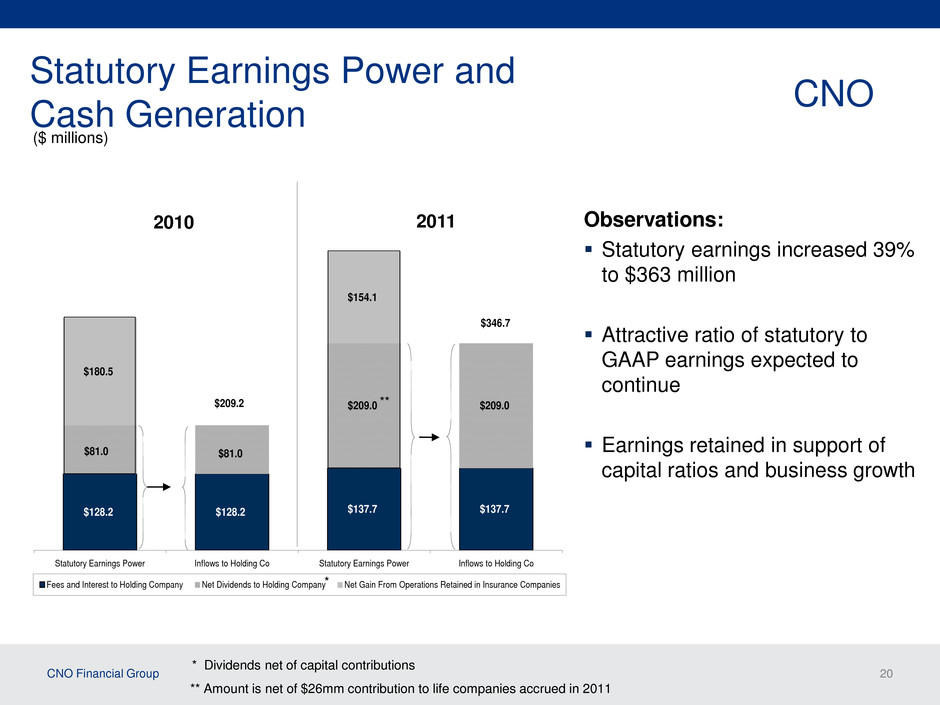
CNO Financial Group 20 $128.2 $137.7 $209.0 $180.5 $154.1 $128.2 $137.7 $209.0 $81.0 $81.0 $346.7 $209.2 Statutory Earnings Power Inflows to Holding Co Statutory Earnings Power Inflows to Holding Co Fees and Interest to Holding Company Net Dividends to Holding Company Net Gain From Operations Retained in Insurance Companies ($ millions) 2010 2011 Statutory Earnings Power and Cash Generation ** Amount is net of $26mm contribution to life companies accrued in 2011 CNO ** Observations: Statutory earnings increased 39% to $363 million Attractive ratio of statutory to GAAP earnings expected to continue Earnings retained in support of capital ratios and business growth * Dividends net of capital contributions *
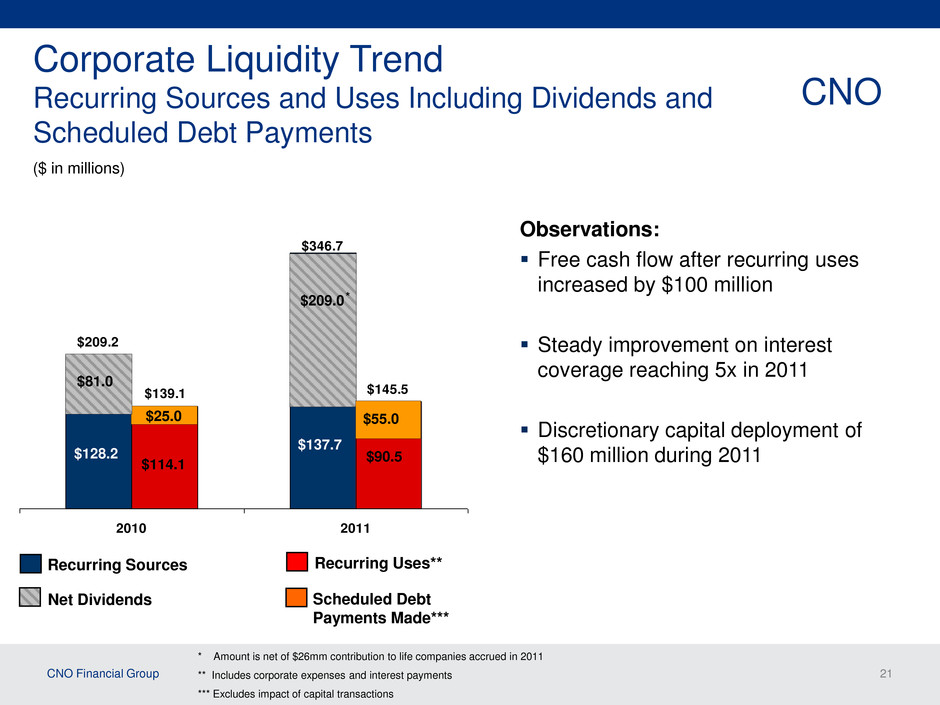
CNO Financial Group 21 $209.2 $346.7 $145.5$139.1 2010 2011 Corporate Liquidity Trend Recurring Sources and Uses Including Dividends and Scheduled Debt Payments ($ in millions) Recurring Sources Net Dividends Recurring Uses** Scheduled Debt Payments Made*** $128.2 $114.1 $137.7 $90.5 $209.0 * Amount is net of $26mm contribution to life companies accrued in 2011 ** Includes corporate expenses and interest payments *** Excludes impact of capital transactions $25.0 $55.0 CNO * $81.0 Observations: Free cash flow after recurring uses increased by $100 million Steady improvement on interest coverage reaching 5x in 2011 Discretionary capital deployment of $160 million during 2011
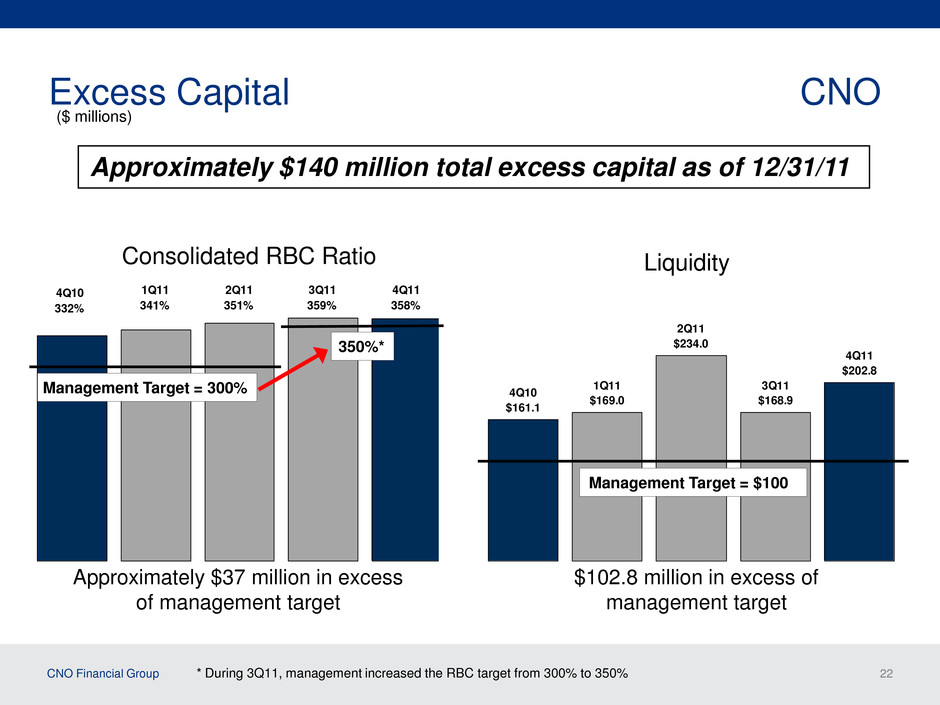
CNO Financial Group 22 4Q11 358% 3Q11 359% 2Q11 351% 1Q11 341% 4Q10 332% 4Q10 $161.1 1Q11 $169.0 2Q11 $234.0 3Q11 $168.9 4Q11 $202.8 Excess Capital Consolidated RBC Ratio Liquidity ($ millions) Approximately $37 million in excess of management target $102.8 million in excess of management target 350%* Management Target = $100 Approximately $140 million total excess capital as of 12/31/11 CNO Management Target = 300% * During 3Q11, management increased the RBC target from 300% to 350%
CNO Financial Group 23 Actively Managing Interest Rate Risk CNO Factored into Loss Recognition Testing – Assumed continuation of current interest rates through the end of the next calendar year – Resulted in 3Q charges of approximately $13 million (pre-tax) in both 2010 and 2011 Statutory Reserves and Capital – Sustained low interest-rate environment considered in determining reserve adequacy – Completed testing has verified adequacy of Statutory reserve levels – No material reserve impact Management Tools for Mitigating Impact of Low-Interest Rate Environment – Active portfolio management – Adjust agent compensation – Remove some products from the market (e.g. certain annuity products) – Adjust crediting rates and product charges on interest-sensitive life and annuities – Increase new business premiums to offset reduced long term investment yields on traditional insurance (whole life, long term care, specified disease, accident) – Reinsure certain blocks
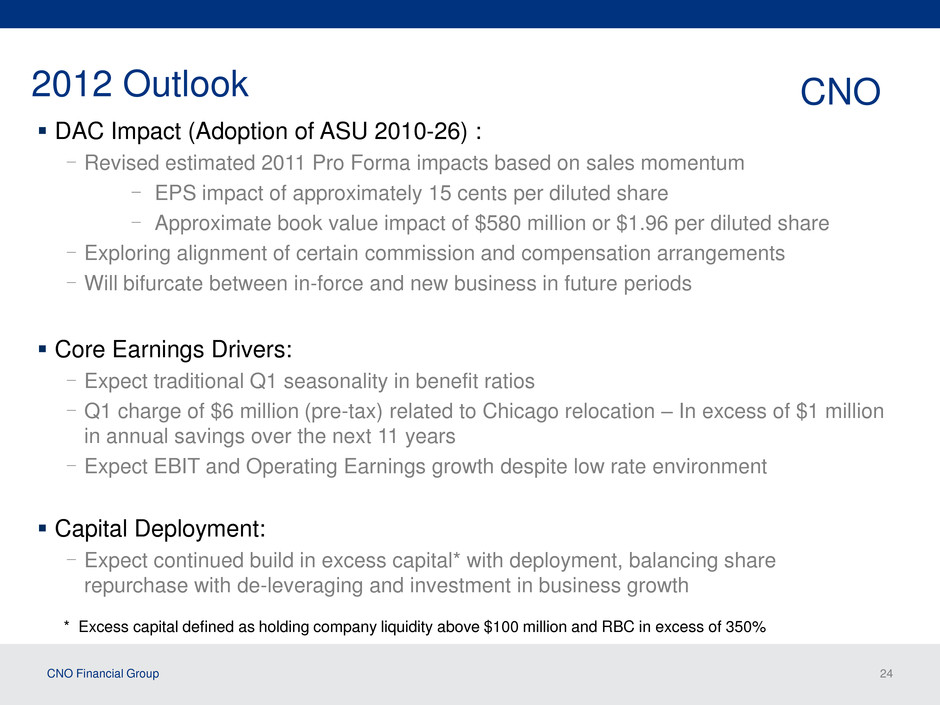
CNO Financial Group 24 2012 Outlook DAC Impact (Adoption of ASU 2010-26) : - Revised estimated 2011 Pro Forma impacts based on sales momentum - EPS impact of approximately 15 cents per diluted share - Approximate book value impact of $580 million or $1.96 per diluted share - Exploring alignment of certain commission and compensation arrangements - Will bifurcate between in-force and new business in future periods Core Earnings Drivers: - Expect traditional Q1 seasonality in benefit ratios - Q1 charge of $6 million (pre-tax) related to Chicago relocation – In excess of $1 million in annual savings over the next 11 years - Expect EBIT and Operating Earnings growth despite low rate environment Capital Deployment: - Expect continued build in excess capital* with deployment, balancing share repurchase with de-leveraging and investment in business growth CNO * Excess capital defined as holding company liquidity above $100 million and RBC in excess of 350%
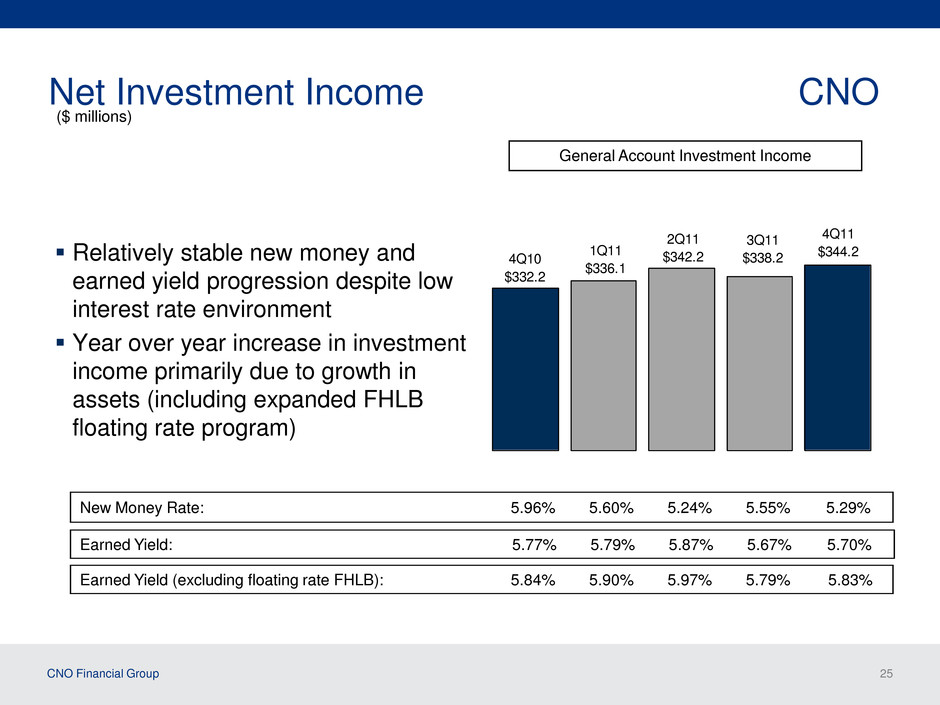
CNO Financial Group 25 Net Investment Income CNO Relatively stable new money and earned yield progression despite low interest rate environment Year over year increase in investment income primarily due to growth in assets (including expanded FHLB floating rate program) 3Q11 $338.24Q10 $332.2 1Q11 $336.1 2Q11 $342.2 4Q11 $344.2 General Account Investment Income Earned Yield: 5.77% 5.79% 5.87% 5.67% 5.70% ($ millions) Earned Yield (excluding floating rate FHLB): 5.84% 5.90% 5.97% 5.79% 5.83% New Money Rate: 5.96% 5.60% 5.24% 5.55% 5.29%
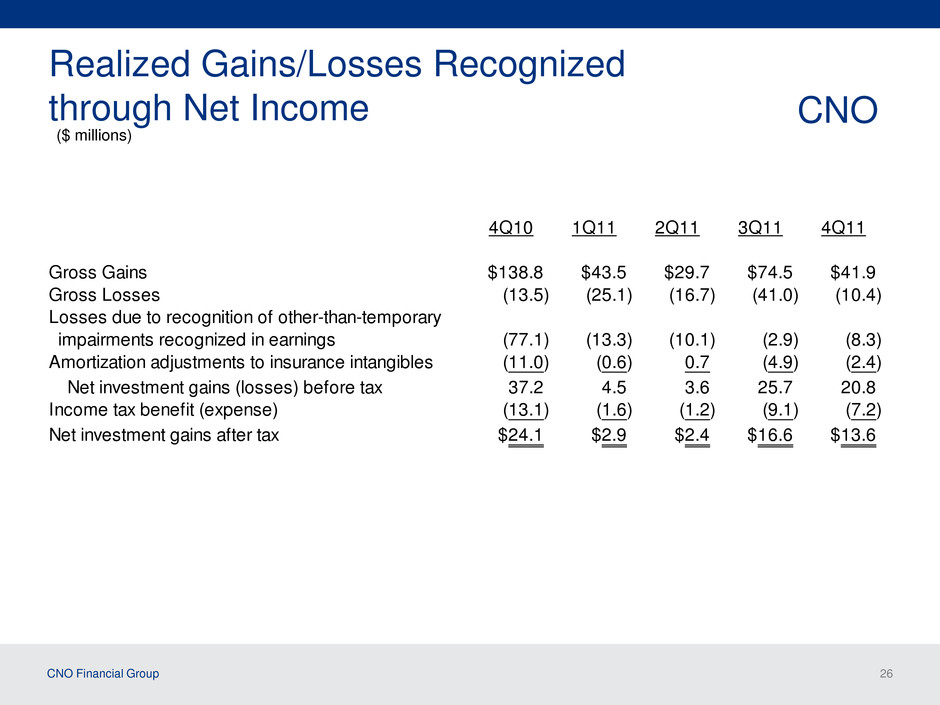
CNO Financial Group 26 Realized Gains/Losses Recognized through Net Income CNO 4Q10 1Q11 2Q11 3Q11 4Q11 Gross Gains $138.8 $43.5 $29.7 $74.5 $41.9 Gross Losses (13.5) (25.1) (16.7) (41.0) (10.4) Losses due to recognition of other-than-temporary impairments recognized in earnings (77.1) (13.3) (10.1) (2.9) (8.3) Amortization adjustments to insurance intangibles (11.0) (0.6) 0.7 (4.9) (2.4) Net investment gains (losses) before tax 37.2 4.5 3.6 25.7 20.8 Income tax benefit (expense) (13.1) (1.6) (1.2) (9.1) (7.2) Net investment gains after tax $24.1 $2.9 $2.4 $16.6 $13.6 ($ millions)
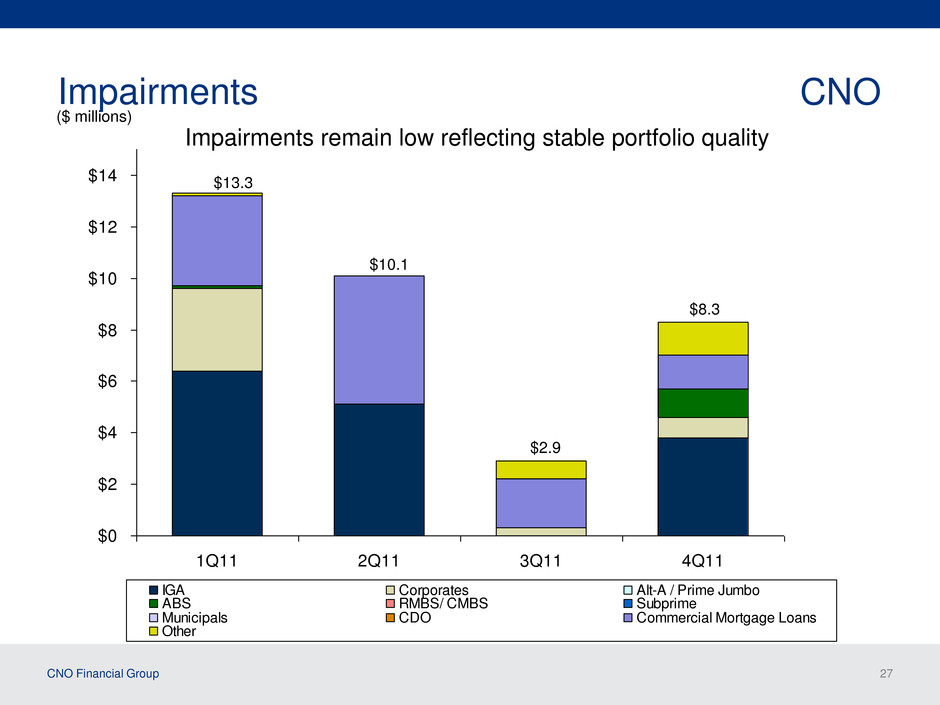
CNO Financial Group 27 Holdings Investors Guaranty Assurance Berkshire Hathaway Comcast Cable Communications Prudential Securities Kraft Time Warner Cable Home Depot, Inc. Ahold Lease USA, Inc. Heinz (H.J.) Company Cox Enterprises $0 $2 $4 $6 $8 $10 $12 $14 1Q11 2Q11 3Q11 4Q11 IGA Corporates Alt-A / Prime Jumbo ABS RMBS/ CMBS Subprime Municipals CDO Commercial Mortgage Loans Other CNO ($ millions) Impairments remain low reflecting stable portfolio quality Impairments $13.3 $10.1 $2.9 $8.3
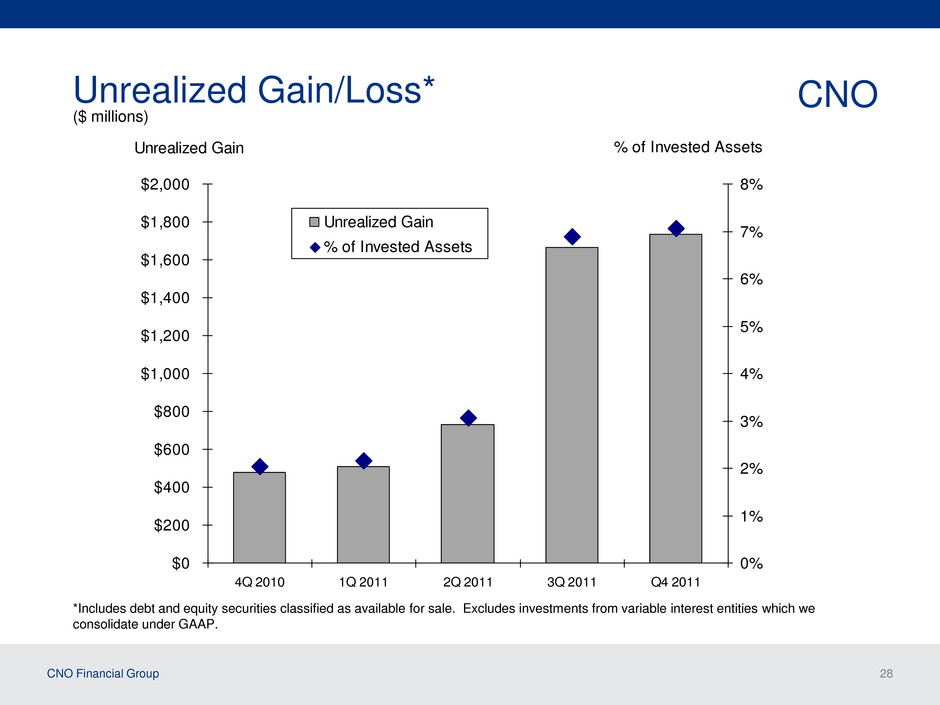
CNO Financial Group 28 Unrealized Gain/Loss* CNO ($ millions) *Includes debt and equity securities classified as available for sale. Excludes investments from variable interest entities which we consolidate under GAAP. $0 $200 $400 $600 $800 $1,000 $1,200 $1,400 $1,600 $1,800 $2,000 4Q 2010 1Q 2011 2Q 2011 3Q 2011 Q4 2011 Unrealized Gain 0% 1% 2% 3% 4% 5% 6% 7% 8% % of Invested Assets Unrealized Gain % of Invested Assets
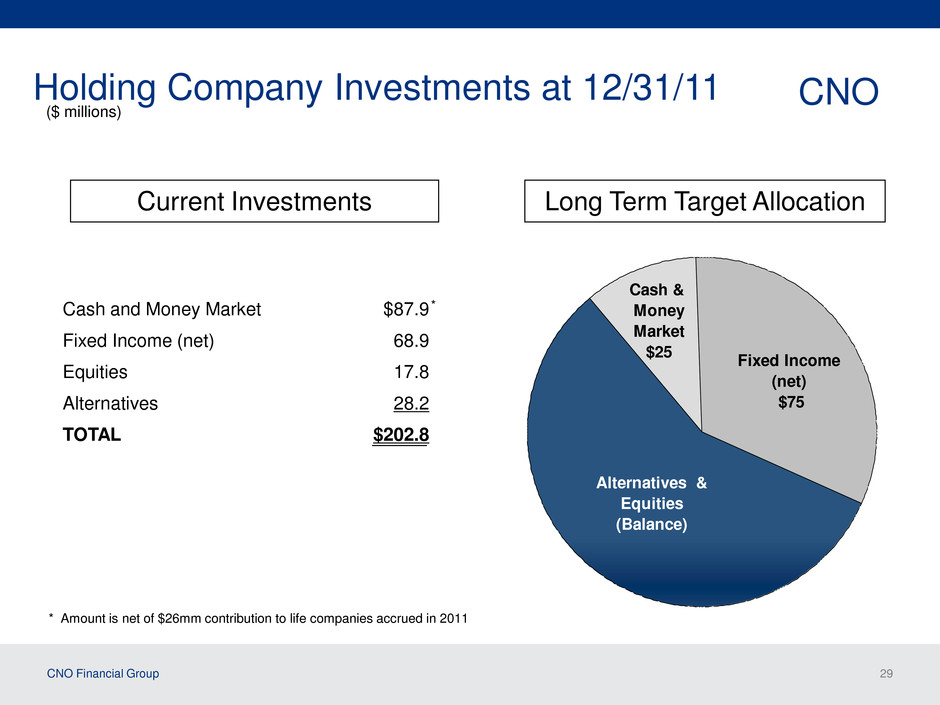
CNO Financial Group 29 Holding Company Investments at 12/31/11 CNO ($ millions) Alternatives & Equities (Balance) Fixed Income (net) $75 Cash & Money Market $25 Cash and Money Market $87.9 Fixed Income (net) 68.9 Equities 17.8 Alternatives 28.2 TOTAL $202.8 Long Term Target Allocation Current Investments * * Amount is net of $26mm contribution to life companies accrued in 2011
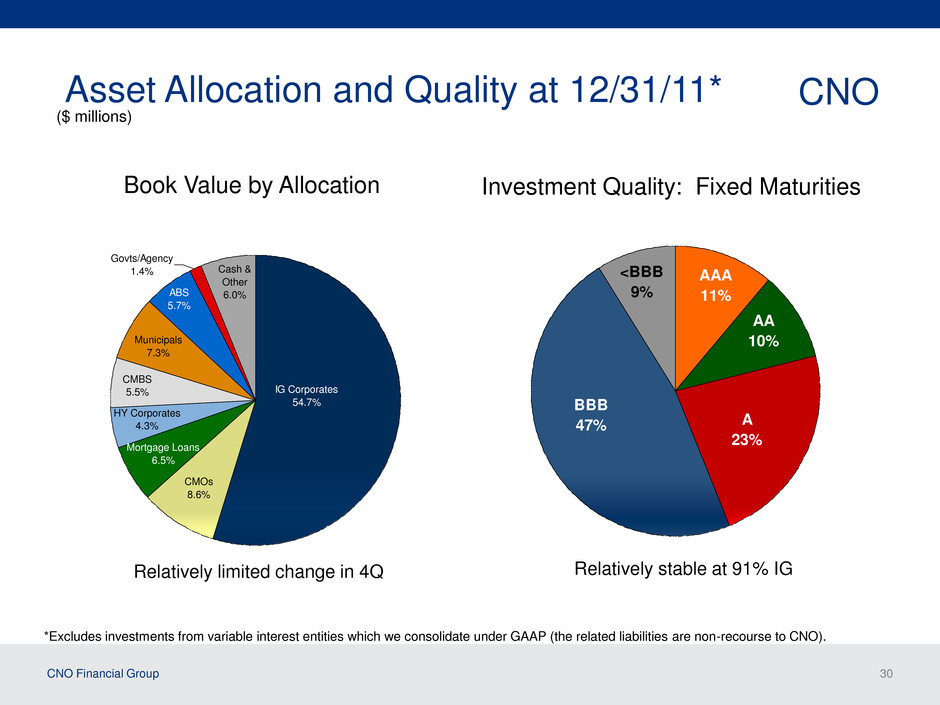
CNO Financial Group 30 Asset Allocation and Quality at 12/31/11* Govts/Agency 1.4% Cash & Other 6.0%ABS 5.7% Municipals 7.3% CMBS 5.5% HY Corporates 4.3% Mortgage Loans 6.5% CMOs 8.6% IG Corporates 54.7% *Excludes investments from variable interest entities which we consolidate under GAAP (the related liabilities are non-recourse to CNO). ($ millions) CNO <BBB 9% AAA 11% AA 10% A 23% BBB 47% Book Value by Allocation Investment Quality: Fixed Maturities Relatively limited change in 4Q Relatively stable at 91% IG
CNO Financial Group 31 2011 Summary and Outlook CNO Market Observations Many market participants appear to be increasing HG corporate allocations without offsetting increase in supply Most structured credit markets face emerging supply/demand imbalance due to limited new issue volume and ongoing pay down proceeds Decline in tail risk (but not eliminated) driven by improvements in U.S. economic environment and various European initiatives Reduction in volatility extending beyond equities into fixed income Fed’s extended low rate policy Impacts new money rates, with marginal effect on portfolio book yield Credit migration/dilution expected to be moderate; 2012 likely to show limited credit dilution What we are doing… Remain somewhat cautious on credit after the recent rally Realize spreads could tighten Remain a buyer of credit, including corporates, select non-agency RMBS, ABS, and high yield Taking no curve position at this point (ALM match neutral) Seeing attractive opportunities to increase our allocation to A quality commercial mortgages Actively de-risking our mortgage portfolio by pruning exposures to less stabilized, more leveraged properties; we have reduced our loan portfolio by 18% over the past 2 years
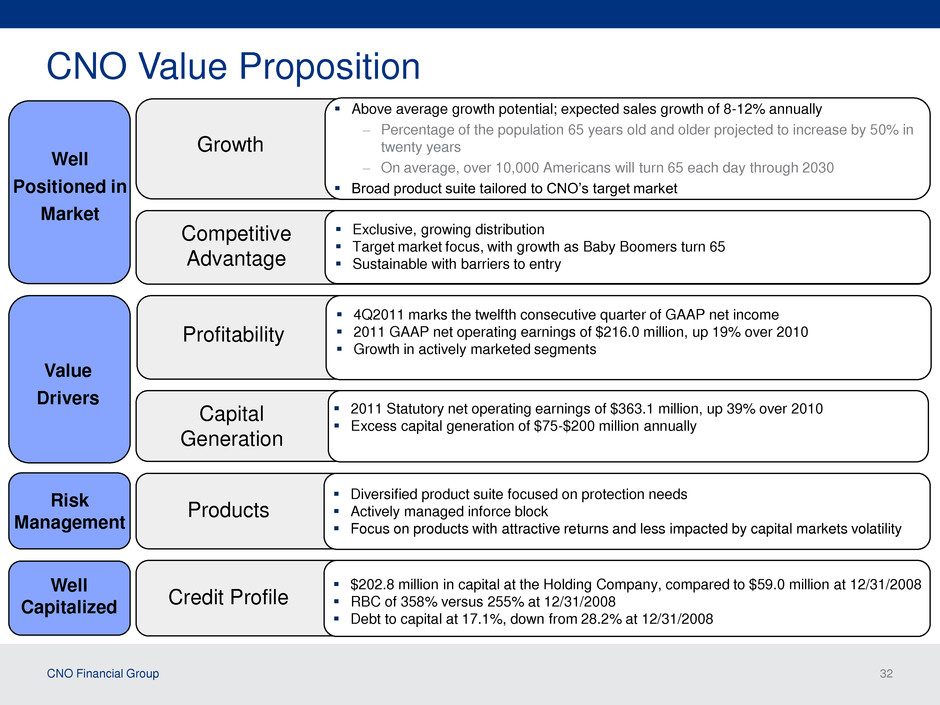
CNO Financial Group 32 CNO Value Proposition Competitive Advantage Exclusive, growing distribution Target market focus, with growth as Baby Boomers turn 65 Sustainable with barriers to entry Products Diversified product suite focused on protection needs Actively managed inforce block Focus on products with attractive returns and less impacted by capital markets volatility Credit Profile $202.8 million in capital at the Holding Company, compared to $59.0 million at 12/31/2008 RBC of 358% versus 255% at 12/31/2008 Debt to capital at 17.1%, down from 28.2% at 12/31/2008 Value Drivers Well Positioned in Market Well Capitalized Risk Management Profitability 4Q2011 marks the twelfth consecutive quarter of GAAP net income 2011 GAAP net operating earnings of $216.0 million, up 19% over 2010 Growth in actively marketed segments Growth Above average growth potential; expected sales growth of 8-12% annually – Percentage of the population 65 years old and older projected to increase by 50% in twenty years – On average, over 10,000 Americans will turn 65 each day through 2030 Broad product suite tailored to CNO’s target market Capital Generation 2011 Statutory net operating earnings of $363.1 million, up 39% over 2010 Excess capital generation of $75-$200 million annually
CNO Financial Group 33 CNO: Well Positioned in Growing & Underserved Markets The middle-income, pre-retiree, and retirement markets are growing as the Boomers age These markets need simple, straightforward products that help address payment of healthcare expenditures, adequacy of retirement, and leaving a legacy for loved ones We are well positioned in all 3 segments to serve these needs

CNO Financial Group 34 Questions and Answers
CNO Financial Group 35 Appendix
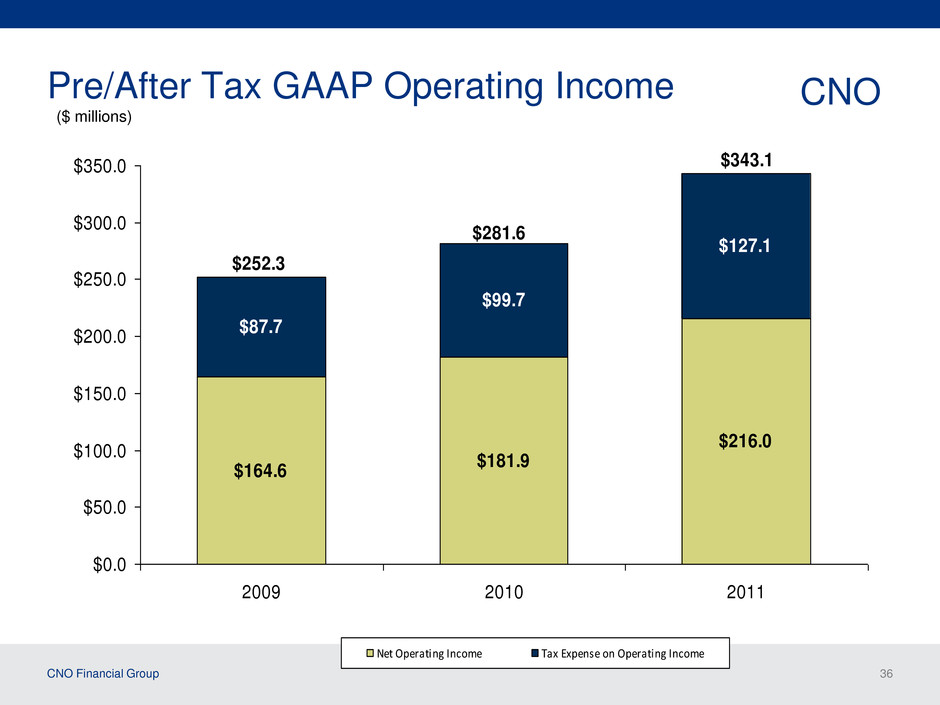
CNO Financial Group 36 Pre/After Tax GAAP Operating Income CNO ($ millions) $164.6 $181.9 $216.0 $87.7 $99.7 $127.1 $0.0 $50.0 $100.0 $150.0 $200.0 $250.0 $300.0 $350.0 2009 2010 2011 Net Operating Income Tax Expense on Operating Income $252.3 $343.1 $281.6
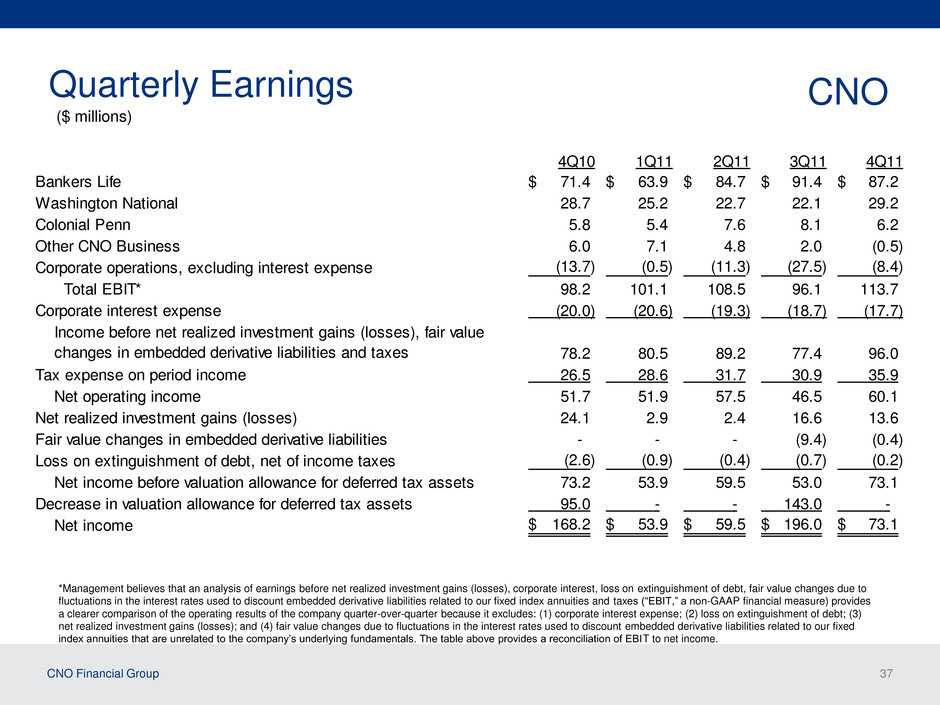
CNO Financial Group 37 Quarterly Earnings CNO *Management believes that an analysis of earnings before net realized investment gains (losses), corporate interest, loss on extinguishment of debt, fair value changes due to fluctuations in the interest rates used to discount embedded derivative liabilities related to our fixed index annuities and taxes (“EBIT,” a non-GAAP financial measure) provides a clearer comparison of the operating results of the company quarter-over-quarter because it excludes: (1) corporate interest expense; (2) loss on extinguishment of debt; (3) net realized investment gains (losses); and (4) fair value changes due to fluctuations in the interest rates used to discount embedded derivative liabilities related to our fixed index annuities that are unrelated to the company’s underlying fundamentals. The table above provides a reconciliation of EBIT to net income. 4Q10 1Q11 2Q11 3Q11 4Q11 Bankers Life 71.4$ 63.9$ 84.7$ 91.4$ 87.2$ Washington National 28.7 25.2 22.7 22.1 29.2 Colonial Penn 5.8 5.4 7.6 8.1 6.2 Other CNO Business 6.0 7.1 4.8 2.0 (0.5) Corporate operations, excluding interest expense (13.7) (0.5) (11.3) (27.5) (8.4) Total EBIT* 98.2 101.1 108.5 96.1 113.7 Corporate interest expense (20.0) (20.6) (19.3) (18.7) (17.7) 78.2 80.5 89.2 77.4 96.0 Tax expense on period income 26.5 28.6 31.7 30.9 35.9 Net operating income 51.7 51.9 57.5 46.5 60.1 Net realized investment gains (losses) 24.1 2.9 2.4 16.6 13.6 Fair value changes in embedded derivative liabilities - - - (9.4) (0.4) Loss on extinguishment of debt, net of income taxes (2.6) (0.9) (0.4) (0.7) (0.2) Net income before valuation allowance for deferred tax assets 73.2 53.9 59.5 53.0 73.1 Decrease in valuation allowance for deferred tax assets 95.0 - - 143.0 - Net income 168.2$ 53.9$ 59.5$ 196.0$ 73.1$ Income before net realized investment gains (losses), fair value changes in embedded derivative liabilities and taxes ($ millions)
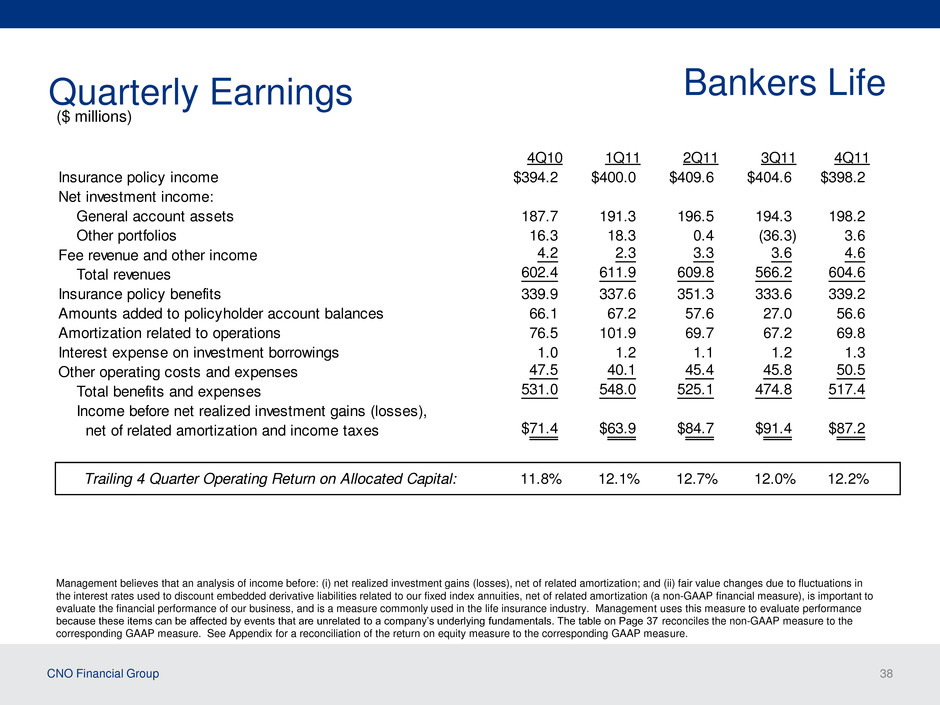
CNO Financial Group 38 Quarterly Earnings 4Q10 1Q11 2Q11 3Q11 4Q11 Insurance policy income $394.2 $400.0 $409.6 $404.6 $398.2 Net investment income: General account assets 187.7 191.3 196.5 194.3 198.2 Other portfolios 16.3 18.3 0.4 (36.3) 3.6 Fee revenue and other income 4.2 2.3 3.3 3.6 4.6 Total revenues 602.4 611.9 609.8 566.2 604.6 Insurance policy benefits 339.9 337.6 351.3 333.6 339.2 Amounts added to policyholder account balances 66.1 67.2 57.6 27.0 56.6 Amortization related to operations 76.5 101.9 69.7 67.2 69.8 Interest expense on investment borrowings 1.0 1.2 1.1 1.2 1.3 Other operating costs and expenses 47.5 40.1 45.4 45.8 50.5 Total benefits and expenses 531.0 548.0 525.1 474.8 517.4 I come before net realized investment gains (losses), net of related amortization and income taxes $71.4 $63.9 $84.7 $91.4 $87.2 Trailing 4 Quarter Operating Return on Allocated Capital: 11.8% 12.1% 12.7% 12.0% 12.2% Management believes that an analysis of income before: (i) net realized investment gains (losses), net of related amortization; and (ii) fair value changes due to fluctuations in the interest rates used to discount embedded derivative liabilities related to our fixed index annuities, net of related amortization (a non-GAAP financial measure), is important to evaluate the financial performance of our business, and is a measure commonly used in the life insurance industry. Management uses this measure to evaluate performance because these items can be affected by events that are unrelated to a company’s underlying fundamentals. The table on Page 37 reconciles the non-GAAP measure to the corresponding GAAP measure. See Appendix for a reconciliation of the return on equity measure to the corresponding GAAP measure. Bankers Life ($ millions)
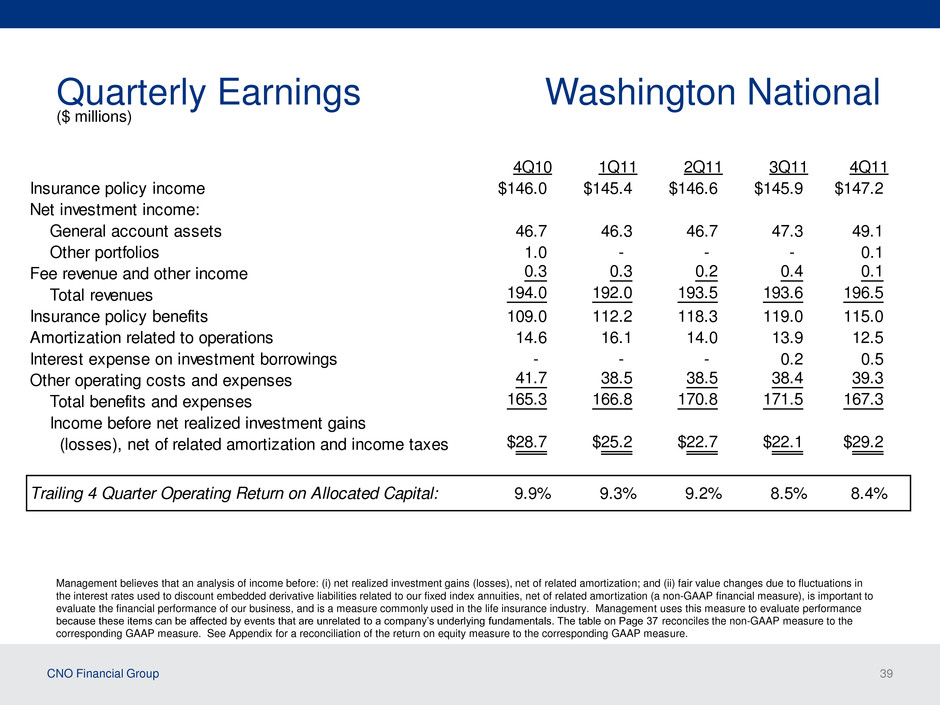
CNO Financial Group 39 Quarterly Earnings Washington National 4Q10 1Q11 2Q11 3Q11 4Q11 Insurance policy income $146.0 $145.4 $146.6 $145.9 $147.2 Net investment income: General account assets 46.7 46.3 46.7 47.3 49.1 Other portfolios 1.0 - - - 0.1 Fee revenue and other income 0.3 0.3 0.2 0.4 0.1 Total revenues 194.0 192.0 193.5 193.6 196.5 Insurance policy benefits 109.0 112.2 118.3 119.0 115.0 Amortization related to operations 14.6 16.1 14.0 13.9 12.5 Interest expense on investment borrowings - - - 0.2 0.5 Other operating costs and expenses 41.7 38.5 38.5 38.4 39.3 Total benefits and expenses 165.3 166.8 170.8 171.5 167.3 Income before net realized investment gains (losses), net of related amortization and income taxes $28.7 $25.2 $22.7 $22.1 $29.2 Trailing 4 Quarter Operating Return on Allocated Capital: 9.9% 9.3% 9.2% 8.5% 8.4% ($ millions) Management believes that an analysis of income before: (i) net realized investment gains (losses), net of related amortization; and (ii) fair value changes due to fluctuations in the interest rates used to discount embedded derivative liabilities related to our fixed index annuities, net of related amortization (a non-GAAP financial measure), is important to evaluate the financial performance of our business, and is a measure commonly used in the life insurance industry. Management uses this measure to evaluate performance because these items can be affected by events that are unrelated to a company’s underlying fundamentals. The table on Page 37 reconciles the non-GAAP measure to the corresponding GAAP measure. See Appendix for a reconciliation of the return on equity measure to the corresponding GAAP measure.
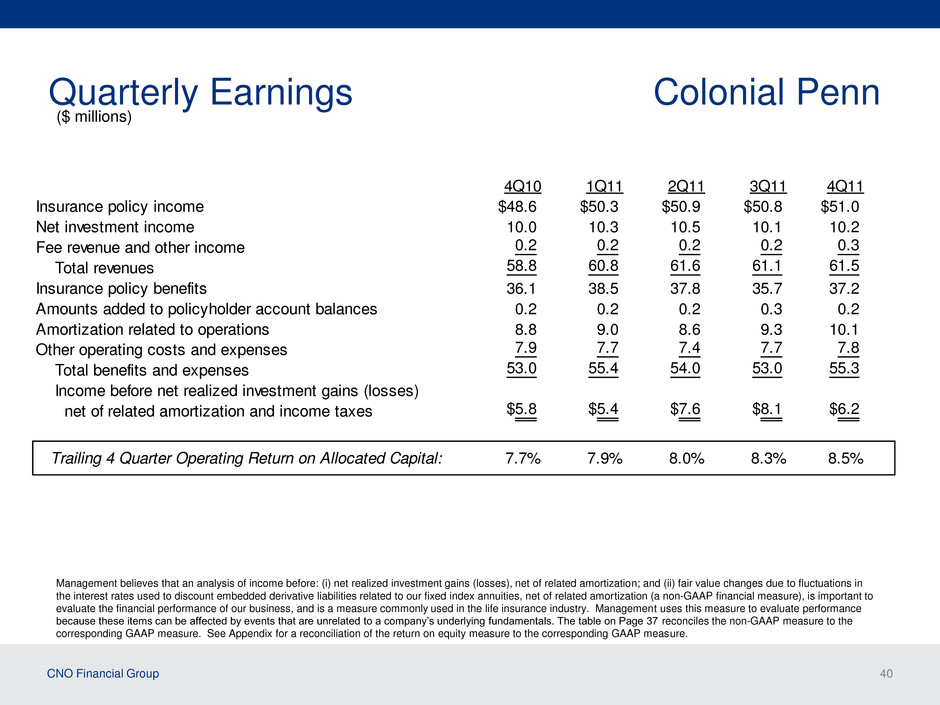
CNO Financial Group 40 Quarterly Earnings Colonial Penn 4Q10 1Q11 2Q11 3Q11 4Q11 Insurance policy income $48.6 $50.3 $50.9 $50.8 $51.0 Net investment income 10.0 10.3 10.5 10.1 10.2 Fee revenue and other income 0.2 0.2 0.2 0.2 0.3 Total revenues 58.8 60.8 61.6 61.1 61.5 Insurance policy benefits 36.1 38.5 37.8 35.7 37.2 Amounts added to policyholder account balances 0.2 0.2 0.2 0.3 0.2 Amortization related to operations 8.8 9.0 8.6 9.3 10.1 Other operating costs and expenses 7.9 7.7 7.4 7.7 7.8 Total benefits and expenses 53.0 55.4 54.0 53.0 55.3 Income before net realized investment gains (losses) et of related amortization and income taxes $5.8 $5.4 $7.6 $8.1 $6.2 Trailing 4 Quarter Operating Return on Allocated Capital: 7.7% 7.9% 8.0% 8.3% 8.5% ($ millions) Management believes that an analysis of income before: (i) net realized investment gains (losses), net of related amortization; and (ii) fair value changes due to fluctuations in the interest rates used to discount embedded derivative liabilities related to our fixed index annuities, net of related amortization (a non-GAAP financial measure), is important to evaluate the financial performance of our business, and is a measure commonly used in the life insurance industry. Management uses this measure to evaluate performance because these items can be affected by events that are unrelated to a company’s underlying fundamentals. The table on Page 37 reconciles the non-GAAP measure to the corresponding GAAP measure. See Appendix for a reconciliation of the return on equity measure to the corresponding GAAP measure.
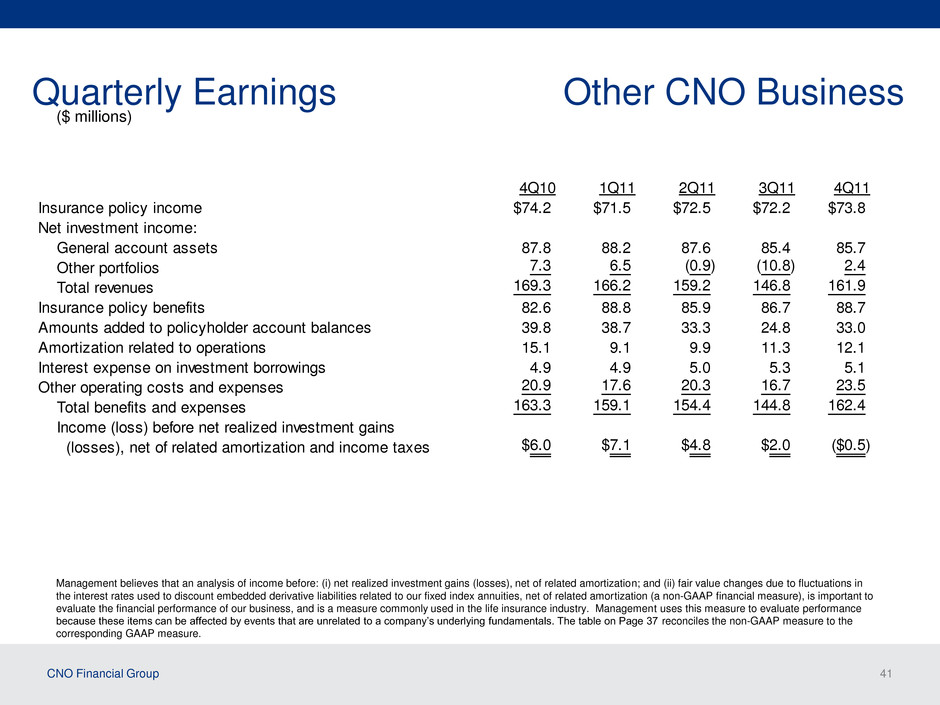
CNO Financial Group 41 Quarterly Earnings Other CNO Business 4Q10 1Q11 2Q11 3Q11 4Q11 Insurance policy income $74.2 $71.5 $72.5 $72.2 $73.8 Net investment income: General account assets 87.8 88.2 87.6 85.4 85.7 Other portfolios 7.3 6.5 (0.9) (10.8) 2.4 Total revenues 169.3 166.2 159.2 146.8 161.9 Insurance policy benefits 82.6 88.8 85.9 86.7 88.7 Amounts added to policyholder account balances 39.8 38.7 33.3 24.8 33.0 Amortization related to operations 15.1 9.1 9.9 11.3 12.1 Interest expense on investment borrowings 4.9 4.9 5.0 5.3 5.1 Other operating costs and expenses 20.9 17.6 20.3 16.7 23.5 Total benefit and expenses 163.3 159.1 154.4 144.8 162.4 Income (loss) before net realized investment gains (losses), net of related amortization and income taxes $6.0 $7.1 $4.8 $2.0 ($0.5) ($ millions) Management believes that an analysis of income before: (i) net realized investment gains (losses), net of related amortization; and (ii) fair value changes due to fluctuations in the interest rates used to discount embedded derivative liabilities related to our fixed index annuities, net of related amortization (a non-GAAP financial measure), is important to evaluate the financial performance of our business, and is a measure commonly used in the life insurance industry. Management uses this measure to evaluate performance because these items can be affected by events that are unrelated to a company’s underlying fundamentals. The table on Page 37 reconciles the non-GAAP measure to the corresponding GAAP measure.
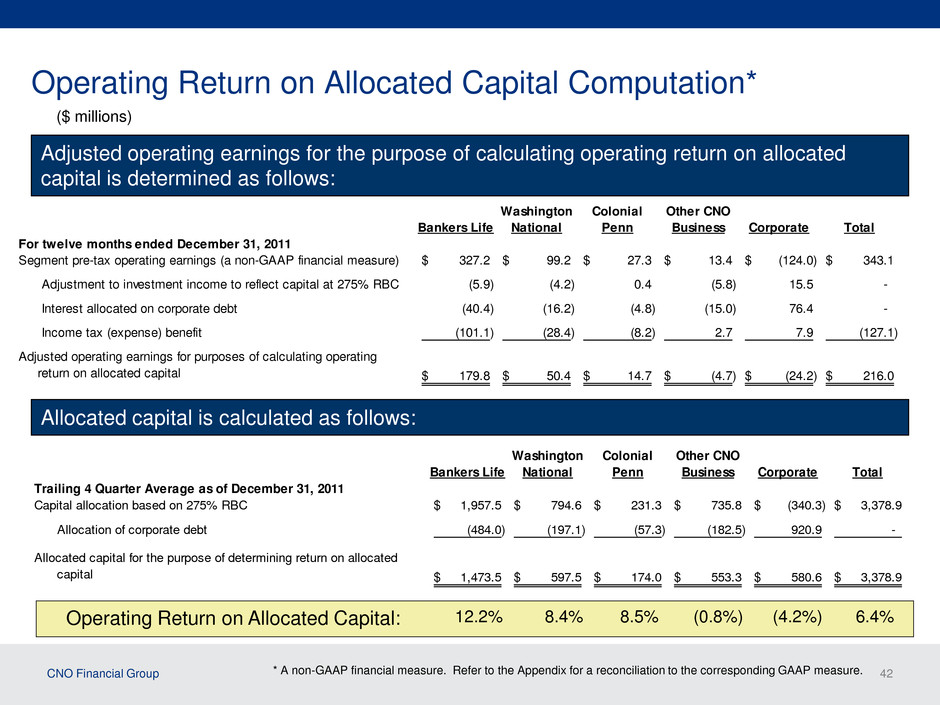
CNO Financial Group 42 Operating Return on Allocated Capital Computation* Bankers Life Washington National Colonial Penn Other CNO Business Corporate Total For twelve months ended December 31, 2011 Segment pre-tax operating earnings (a non-GAAP financial measure) 327.2$ 99.2$ 27.3$ 13.4$ (124.0)$ 343.1$ Adjustment to investment income to reflect capital at 275% RBC (5.9) (4.2) 0.4 (5.8) 15.5 - Interest allocated on corporate debt (40.4) (16.2) (4.8) (15.0) 76.4 - Income tax (expense) benefit (101.1) (28.4) (8.2) 2.7 7.9 (127.1) Adjusted operating earnings for purposes of calculating operating return on allocated capital 179.8$ 50.4$ 14.7$ (4.7)$ (24.2)$ 216.0$ Adjusted operating earnings for the purpose of calculating operating return on allocated capital is determined as follows: Allocated capital is calculated as follows: Bankers Life Washington National Colonial Penn Other CNO Business Corporate Total Trailing 4 Quarter Average as of December 31, 2011 Capital allocation based on 275% RBC 1,957.5$ 794.6$ 231.3$ 735.8$ (340.3)$ 3,378.9$ Allocation of corporate debt (484.0) (197.1) (57.3) (182.5) 920.9 - Allocated capital for the purpose of determining return on allocated capital 1,473.5$ 597.5$ 174.0$ 553.3$ 580.6$ 3,378.9$ * A non-GAAP financial measure. Refer to the Appendix for a reconciliation to the corresponding GAAP measure. ($ millions) Operating Return on Allocated Capital: 12.2% 8.4% 8.5% (0.8%) (4.2%) 6.4%
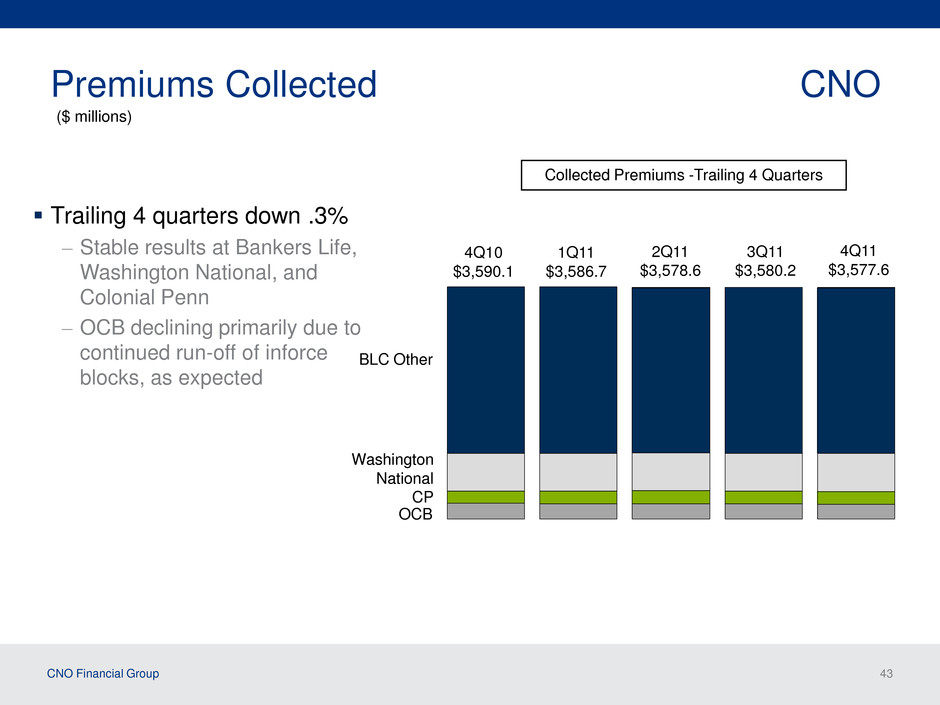
CNO Financial Group 43 Premiums Collected CNO Trailing 4 quarters down .3% – Stable results at Bankers Life, Washington National, and Colonial Penn – OCB declining primarily due to continued run-off of inforce blocks, as expected CP Washington National Collected Premiums -Trailing 4 Quarters BLC Other 4Q10 $3,590.1 1Q11 $3,586.7 OCB ($ millions) 2Q11 $3,578.6 3Q11 $3,580.2 4Q11 $3,577.6
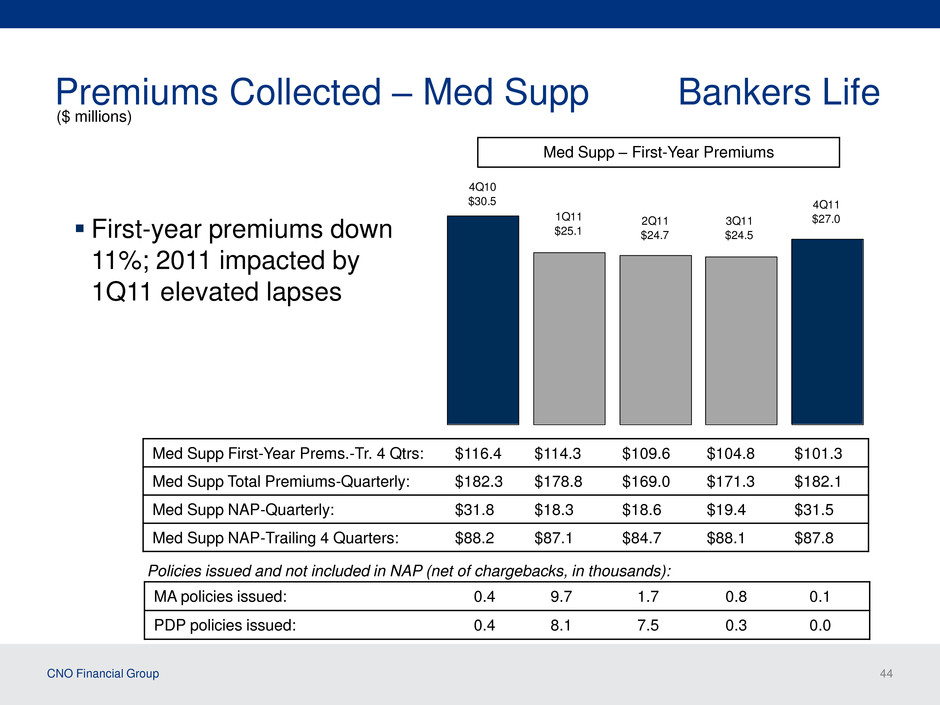
CNO Financial Group 44 Premiums Collected – Med Supp First-year premiums down 11%; 2011 impacted by 1Q11 elevated lapses Med Supp – First-Year Premiums 4Q10 $30.5 1Q11 $25.1 2Q11 $24.7 3Q11 $24.5 4Q11 $27.0 Bankers Life ($ millions) Policies issued and not included in NAP (net of chargebacks, in thousands): MA policies issued: 0.4 9.7 1.7 0.8 0.1 PDP policies issued: 0.4 8.1 7.5 0.3 0.0 Med Supp First-Year Prems.-Tr. 4 Qtrs: $116.4 $114.3 $109.6 $104.8 $101.3 Med Supp Total Premiums-Quarterly: $182.3 $178.8 $169.0 $171.3 $182.1 Med Supp NAP-Quarterly: $31.8 $18.3 $18.6 $19.4 $31.5 Med Supp NAP-Trailing 4 Quarters: $88.2 $87.1 $84.7 $88.1 $87.8

CNO Financial Group 45 Premiums Collected – LTC Net first-year premiums down 11% (Net) $6.2 (Net) $6.1 (Net) $6.0 (Net) $5.9 (Net) $5.5Long-Term Care – First-Year Premiums* *Includes $2.0 million in 4Q10, $1.5 million in 1Q11, $1.4 million in 2Q11, $1.4 million in 3Q11, and $1.6 million in 4Q11 of premiums ceded under business reinsurance agreement. 2Q11 (Direct) $7.4 4Q10 (Direct) $8.2 1Q11 (Direct) $7.6 Bankers Life ($ millions) 3Q11 (Direct) $7.3 First-Year Prems – Tr. 4 Qtrs: $22.2 $23.5 $24.0 $24.2 $23.5 Total Premiums - Quarterly: $143.5 $144.9 $142.9 $137.8 $136.3 NAP – Quarterly: $6.7 $6.9 $7.3 $7.3 $7.0 NAP – Trailing 4 Quarters: $31.2 $29.5 $28.1 $28.2 $28.5 4Q11 (Direct) $7.1
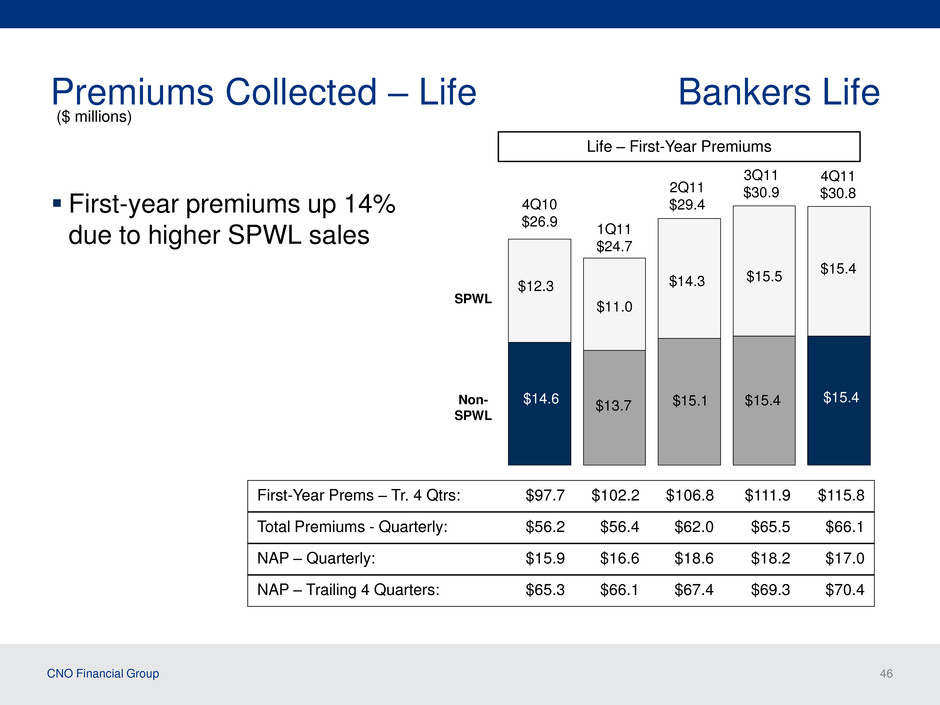
CNO Financial Group 46 Premiums Collected – Life First-year premiums up 14% due to higher SPWL sales Life – First-Year Premiums SPWL Non- SPWL 1Q11 $24.7 $12.3 $14.6 4Q10 $26.9 $11.0 $15.1 Bankers Life ($ millions) 2Q11 $29.4 $13.7 $14.3 First-Year Prems – Tr. 4 Qtrs: $97.7 $102.2 $106.8 $111.9 $115.8 Total Premiums - Quarterly: $56.2 $56.4 $62.0 $65.5 $66.1 NAP – Quarterly: $15.9 $16.6 $18.6 $18.2 $17.0 NAP – Trailing 4 Quarters: $65.3 $66.1 $67.4 $69.3 $70.4 $15.4 $15.5 3Q11 $30.9 $15.4 $15.4 4Q11 $30.8
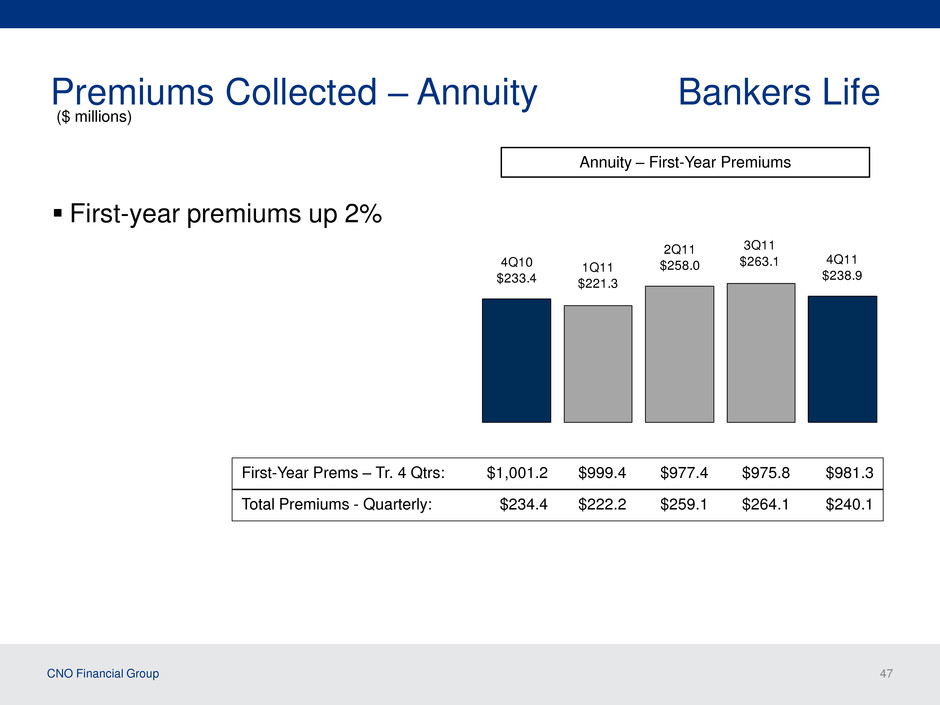
CNO Financial Group 47 Premiums Collected – Annuity First-year premiums up 2% 4Q10 $233.4 1Q11 $221.3 2Q11 $258.0 3Q11 $263.1 4Q11 $238.9 Annuity – First-Year Premiums Bankers Life ($ millions) First-Year Prems – Tr. 4 Qtrs: $1,001.2 $999.4 $977.4 $975.8 $981.3 Total Premiums - Quarterly: $234.4 $222.2 $259.1 $264.1 $240.1
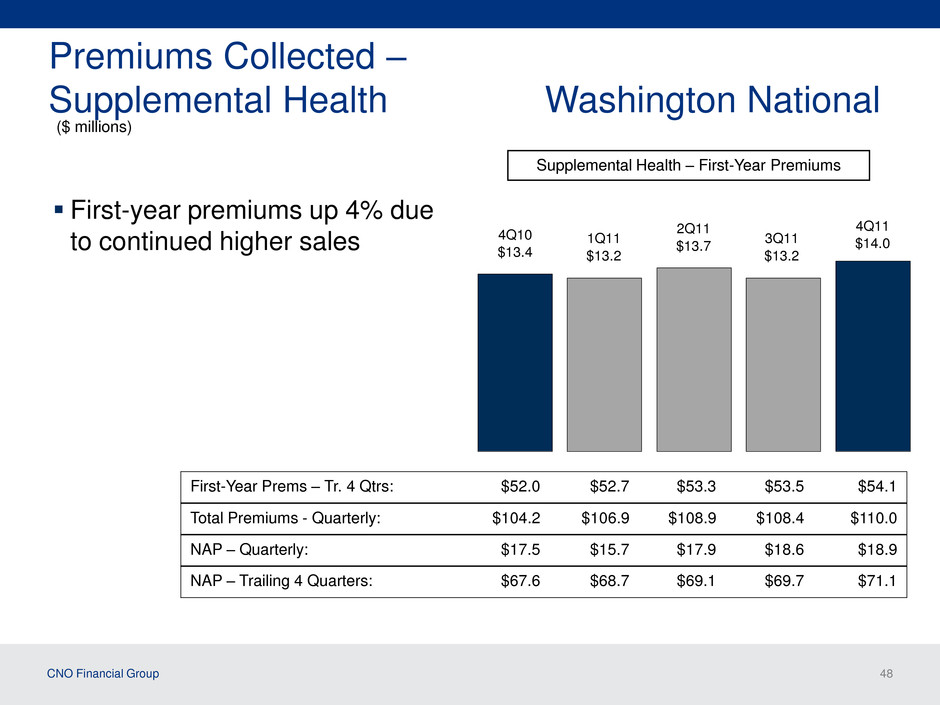
CNO Financial Group 48 Premiums Collected – Supplemental Health Washington National First-year premiums up 4% due to continued higher sales 4Q10 $13.4 1Q11 $13.2 2Q11 $13.7 3Q11 $13.2 4Q11 $14.0 Supplemental Health – First-Year Premiums ($ millions) First-Year Prems – Tr. 4 Qtrs: $52.0 $52.7 $53.3 $53.5 $54.1 Total Premiums - Quarterly: $104.2 $106.9 $108.9 $108.4 $110.0 NAP – Quarterly: $17.5 $15.7 $17.9 $18.6 $18.9 NAP – Trailing 4 Quarters: $67.6 $68.7 $69.1 $69.7 $71.1
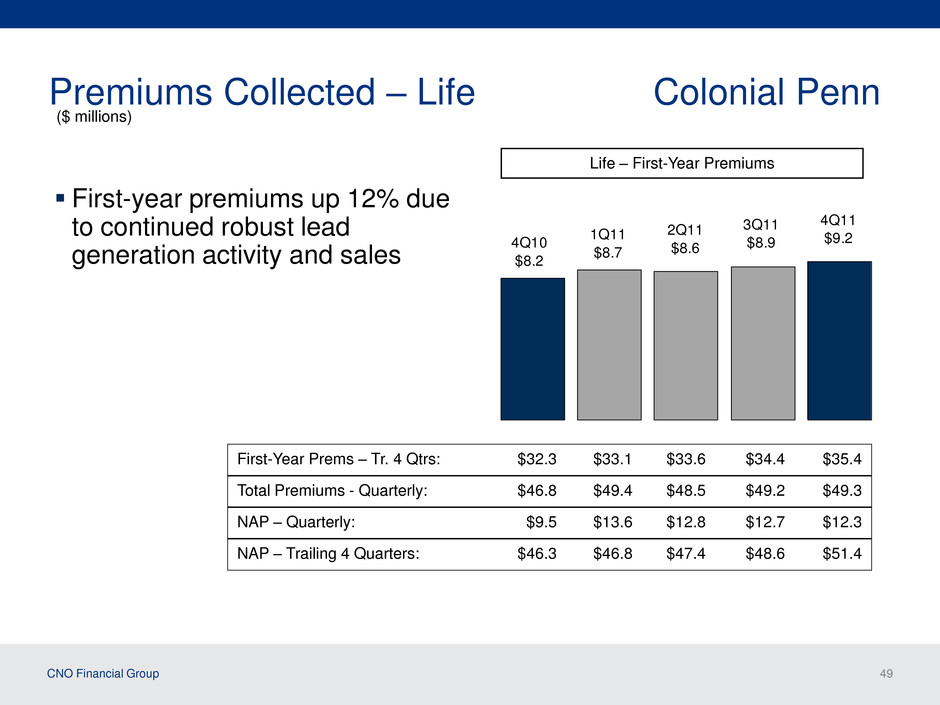
CNO Financial Group 49 Premiums Collected – Life Colonial Penn First-year premiums up 12% due to continued robust lead generation activity and sales 4Q10 $8.2 1Q11 $8.7 2Q11 $8.6 3Q11 $8.9 4Q11 $9.2 Life – First-Year Premiums ($ millions) First-Year Prems – Tr. 4 Qtrs: $32.3 $33.1 $33.6 $34.4 $35.4 Total Premiums - Quarterly: $46.8 $49.4 $48.5 $49.2 $49.3 NAP – Quarterly: $9.5 $13.6 $12.8 $12.7 $12.3 NAP – Trailing 4 Quarters: $46.3 $46.8 $47.4 $48.6 $51.4
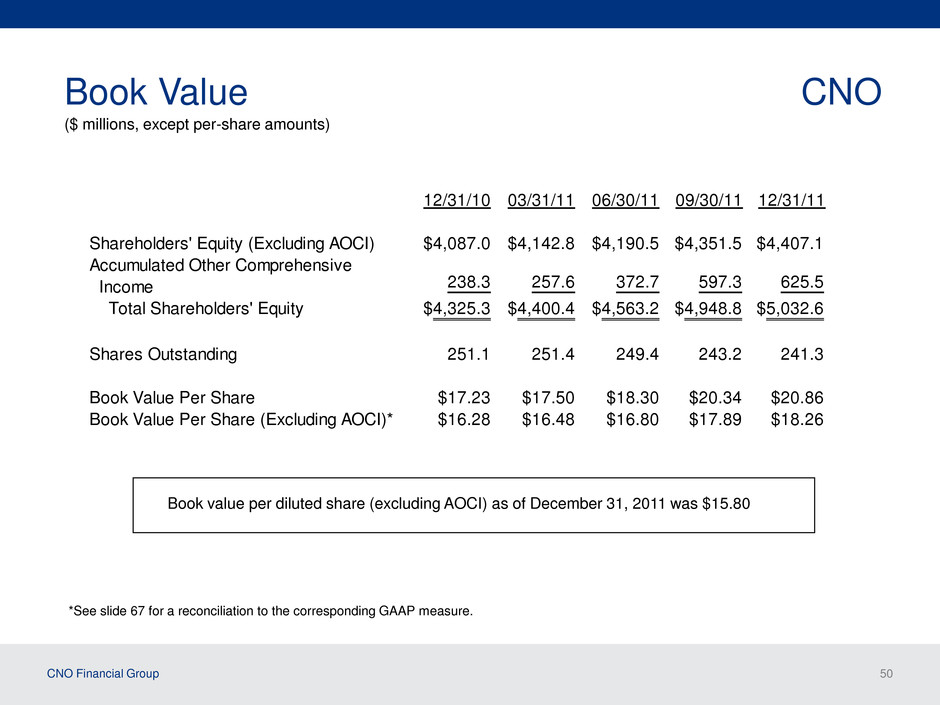
CNO Financial Group 50 Book Value CNO *See slide 67 for a reconciliation to the corresponding GAAP measure. ($ millions, except per-share amounts) 12/31/10 03/31/11 06/30/11 09/30/11 12/31/11 Shareholders' Equity (Excluding AOCI) $4,087.0 $4,142.8 $4,190.5 $4,351.5 $4,407.1 Accumulated Other Comprehensive Income 238.3 257.6 372.7 597.3 625.5 Total Shareholders' Equity $4,325.3 $4,400.4 $4,563.2 $4,948.8 $5,032.6 S ares Outstanding 251.1 251.4 249.4 243.2 241.3 Book Value Per Share $17.23 $17.50 $18.30 $20.34 $20.86 Book Value Per Share (Excluding AOCI)* $16.28 $16.48 $16.80 $17.89 $18.26 Book value per diluted share (excluding AOCI) as of December 31, 2011 was $15.80
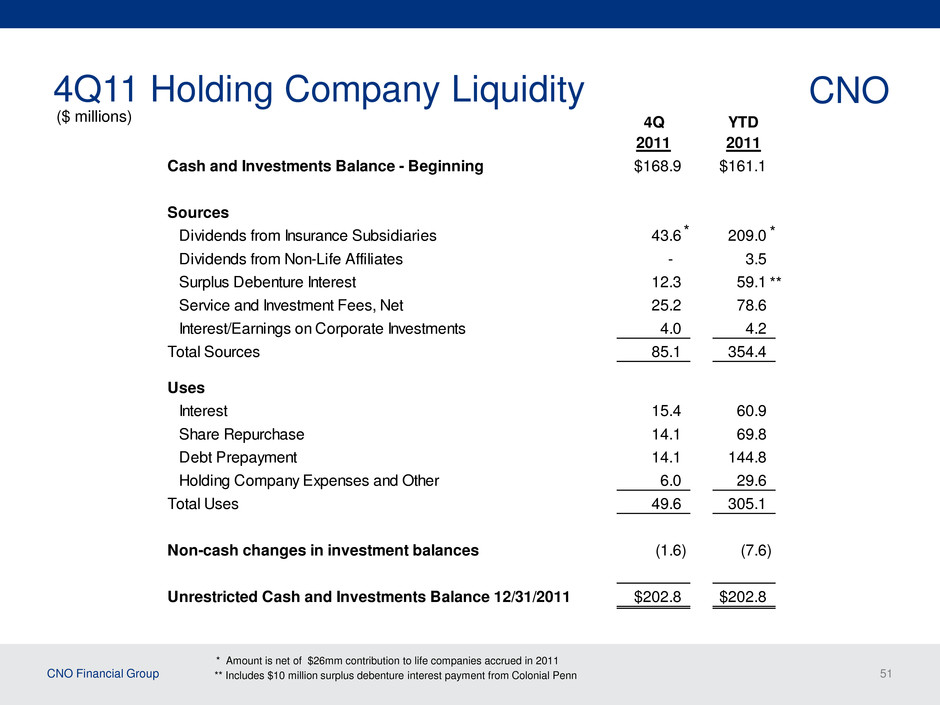
CNO Financial Group 51 4Q11 Holding Company Liquidity CNO ($ millions) 4Q 2011 YTD 2011 Cash and Investments Balance - Beginning $168.9 $161.1 Sources Dividends from Insurance Subsidiaries 43.6 209.0 Dividends from Non-Life Affiliates - 3.5 Surplus Debenture Interest 12.3 59.1 Service and Investment Fees, Net 25.2 78.6 Interest/Earnings on Corporate Investments 4.0 4.2 Total Sources 85.1 354.4 Uses Interest 15.4 60.9 Share Repurchase 14.1 69.8 Debt Prepayment 14.1 144.8 Holding Company Expenses and Other 6.0 29.6 Total Uses 49.6 305.1 Non-cash changes in investment balances (1.6) (7.6) Unrestricted Cash and Investments Balance 12/31/2011 $202.8 $202.8 ** Includes $10 million surplus debenture interest payment from Colonial Penn ** * Amount is net of $26mm contribution to life companies accrued in 2011 * *
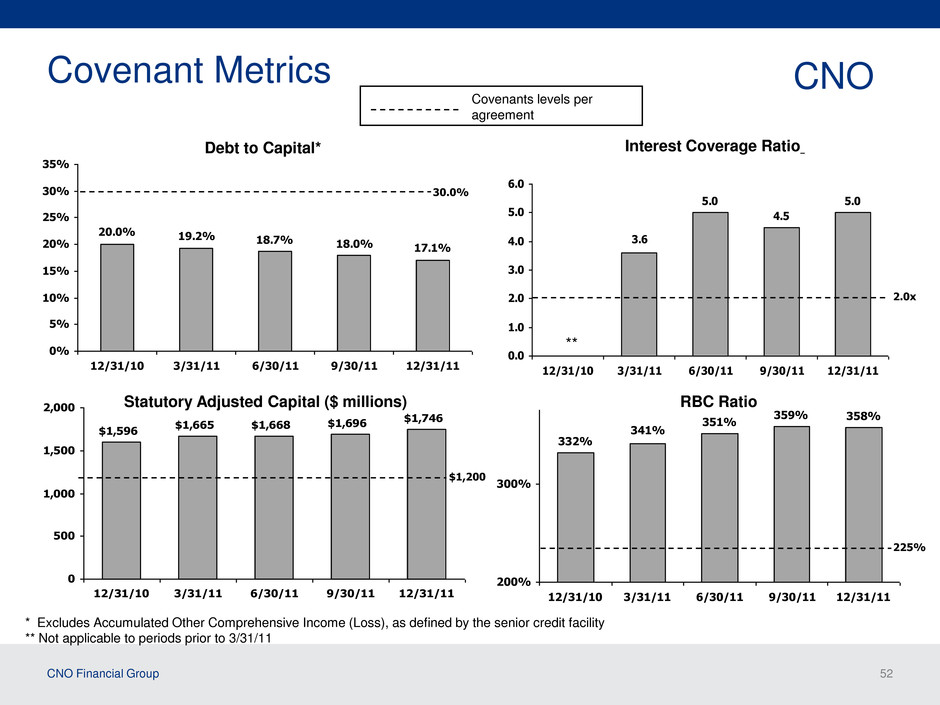
CNO Financial Group 52 Covenant Metrics Interest Coverage Ratio RBC Ratio $1,596 $1,665 $1,668 $1,696 $1,746 0 500 1,000 1,500 2,000 12/31/10 3/31/11 6/30/11 9/30/11 12/31/11 332% 351% 359% 358% 341% 200% 300% 12/31/10 3/31/11 6/30/11 9/30/11 12/31/11 Statutory Adjusted Capital ($ millions) Debt to Capital* * Excludes Accumulated Other Comprehensive Income (Loss), as defined by the senior credit facility ** Not applicable to periods prior to 3/31/11 $1,200 30.0% CNO 20.0% 19.2% 18.7% 18.0% 17.1% 0% 5% 10% 15% 20% 25% 30% 35% 12/31/10 3/31/11 6/30/11 9/30/11 12/31/11 225% Covenants levels per agreement 5.0 4.5 5.0 3.6 0.0 1.0 2.0 3.0 4.0 5.0 6.0 12/31/10 3/31/11 6/30/11 9/30/11 12/31/11 2.0x **
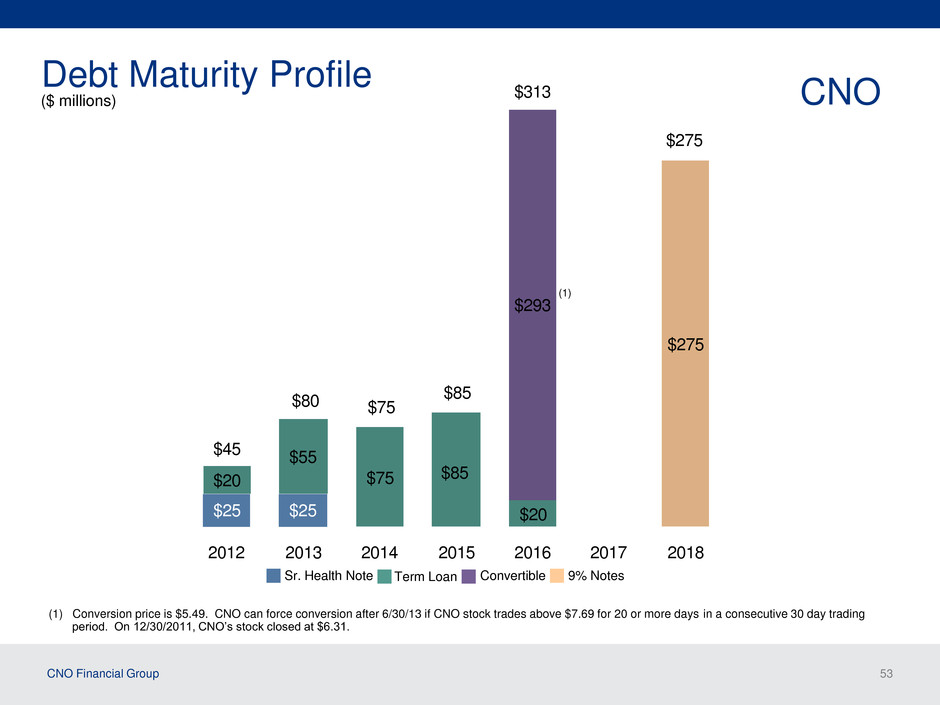
CNO Financial Group 53 $25 $25 $20 $275 $20 $85$75 $55 $293 $275 $45 $80 $85 $313 $75 2012 2013 2014 2015 2016 2017 2018 Debt Maturity Profile Term Loan Sr. Health Note Convertible 9% Notes (1) Conversion price is $5.49. CNO can force conversion after 6/30/13 if CNO stock trades above $7.69 for 20 or more days in a consecutive 30 day trading period. On 12/30/2011, CNO’s stock closed at $6.31. (1) ($ millions) CNO
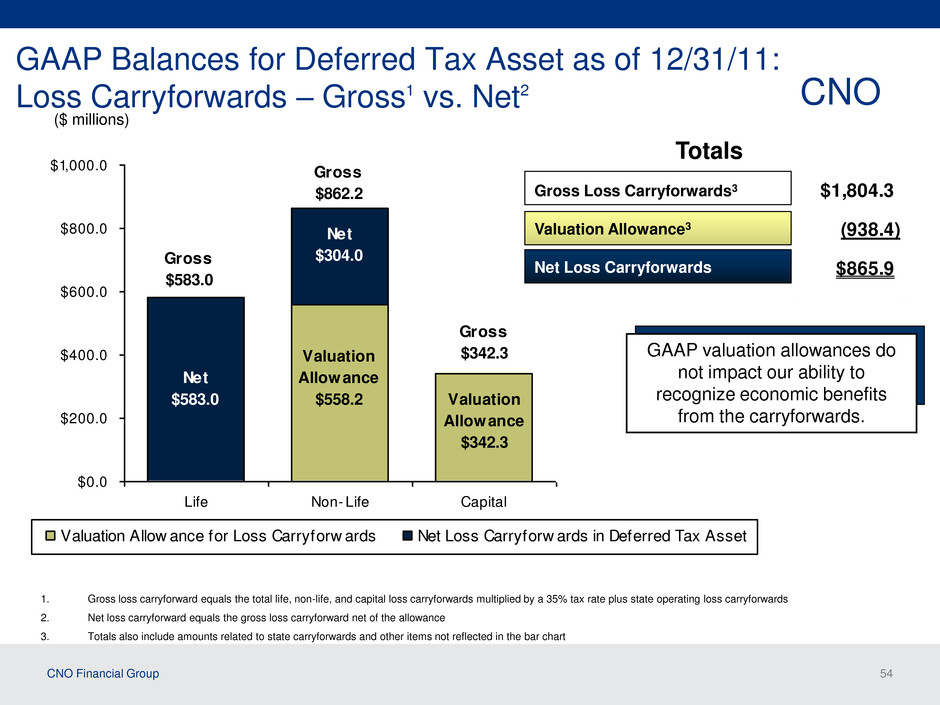
CNO Financial Group 54 Valuation Allowance $558.2 Valuation Allowance $342.3 Net $583.0 Net $304.0 $0.0 $200.0 $400.0 $600.0 $800.0 $1,000.0 Life Non- Life Capital Valuation Allow ance for Loss Carryforw ards Net Loss Carryforw ards in Deferred Tax Asset Gross $583.0 Gross $342.3 Gross $862.2 GAAP Balances for Deferred Tax Asset as of 12/31/11: Loss Carryforwards – Gross1 vs. Net2 ($ millions) 1. Gross loss carryforward equals the total life, non-life, and capital loss carryforwards multiplied by a 35% tax rate plus state operating loss carryforwards 2. Net loss carryforward equals the gross loss carryforward net of the allowance 3. Totals also include amounts related to state carryforwards and other items not reflected in the bar chart Totals Gross Loss Carryforwards3 Net Loss Carryforwards Valuation Allowance3 CNO GAAP valuation allowances do not impact our ability to recognize economic benefits from the carryforwards. $1,804.3 (938.4) $865.9
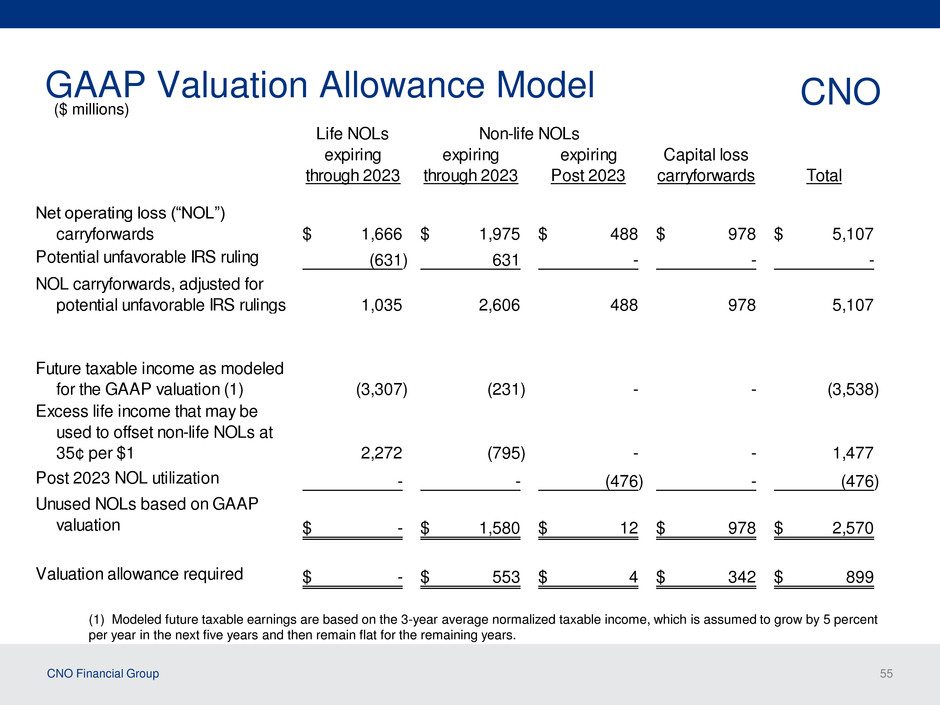
CNO Financial Group 55 GAAP Valuation Allowance Model ($ millions) CNO (1) Modeled future taxable earnings are based on the 3-year average normalized taxable income, which is assumed to grow by 5 percent per year in the next five years and then remain flat for the remaining years. Life NOLs Non-life NOLs expiring expiring expiring Capital loss through 2023 through 2023 Post 2023 carryforwards Total Net operating loss (“NOL”) carryforwards 1,666$ 1,975$ 488$ 978$ 5,107$ Potential unfavorable IRS ruling (631) 631 - - - NOL carryforwards, adjusted for potential unfavorable IRS rulings 1,035 2,606 488 978 5,107 Future taxable income as modeled for the GAAP valuation (1) (3,307) (231) - - (3,538) Excess life income that may be used to offset non-life NOLs at 35¢ per $1 2,272 (795) - - 1,477 Post 2023 N L utilization - - (476) - (476) Unused NOLs based on GAAP valuation -$ 1,580$ 12$ 978$ 2,570$ Valuation allowance required -$ 553$ 4$ 342$ 899$
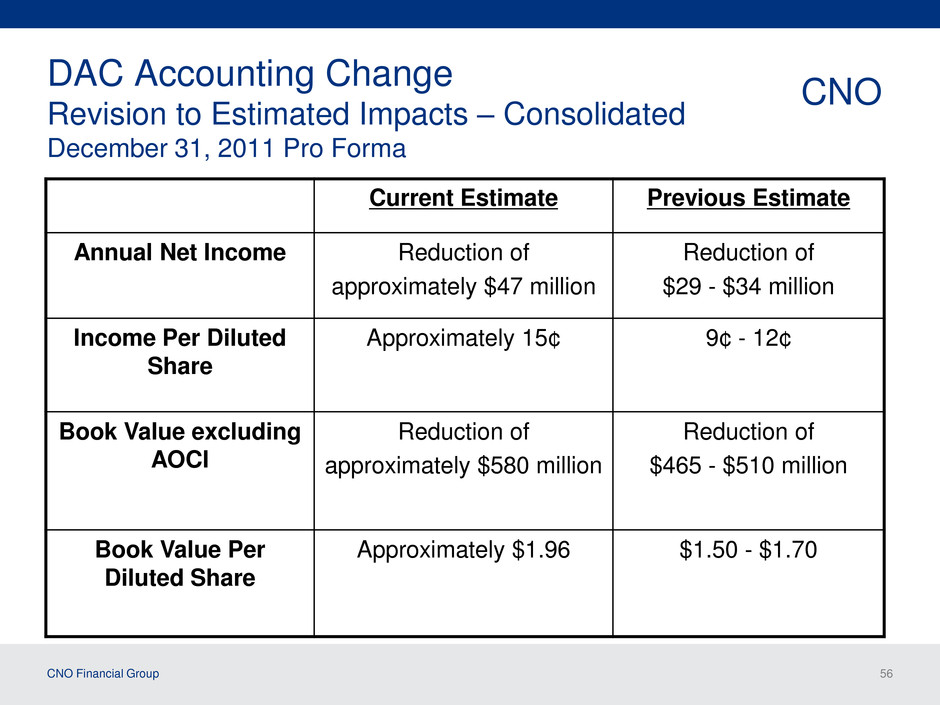
CNO Financial Group 56 DAC Accounting Change Revision to Estimated Impacts – Consolidated December 31, 2011 Pro Forma Current Estimate Previous Estimate Annual Net Income Reduction of approximately $47 million Reduction of $29 - $34 million Income Per Diluted Share Approximately 15¢ 9¢ - 12¢ Book Value excluding AOCI Reduction of approximately $580 million Reduction of $465 - $510 million Book Value Per Diluted Share Approximately $1.96 $1.50 - $1.70 CNO
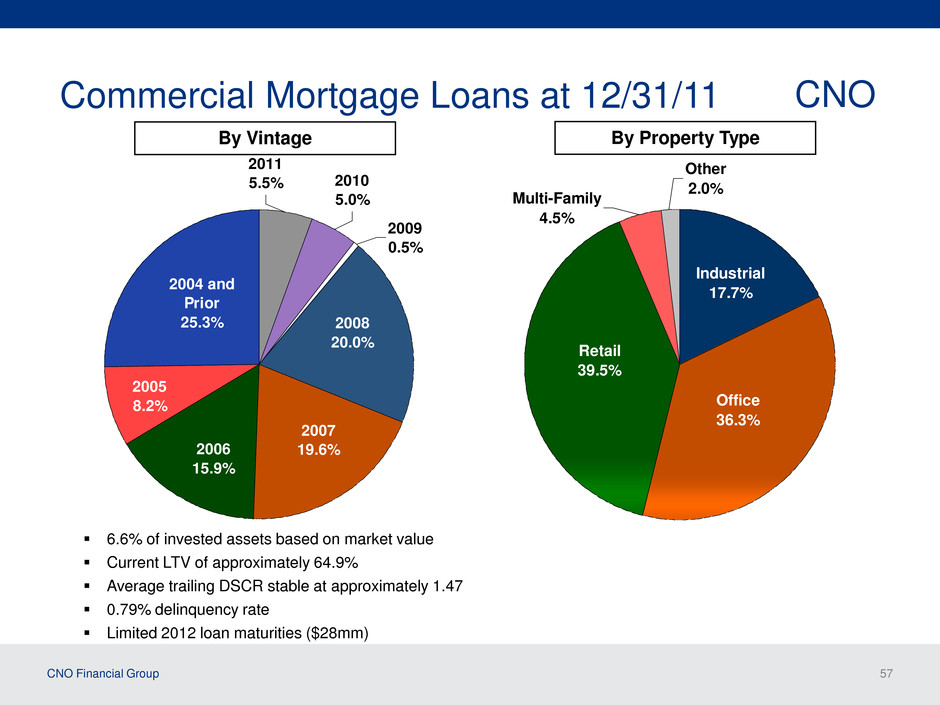
CNO Financial Group 57 Commercial Mortgage Loans at 12/31/11 By Vintage CNO By Property Type 6.6% of invested assets based on market value Current LTV of approximately 64.9% Average trailing DSCR stable at approximately 1.47 0.79% delinquency rate Limited 2012 loan maturities ($28mm) 2008 18.8% 2007 20.2% 2006 17.8% 2005 9.3% 2004 and Prior 26.2% Office 36.3% Industrial 17.7% Retail 39.5% Multi-Family 4.5% Other 2.0% 2010 5.0% 2011 5.5% 2009 0.5% 2008 20.0% 2007 19.6%2006 15.9% 2005 8.2% 2004 and Prior 25.3%
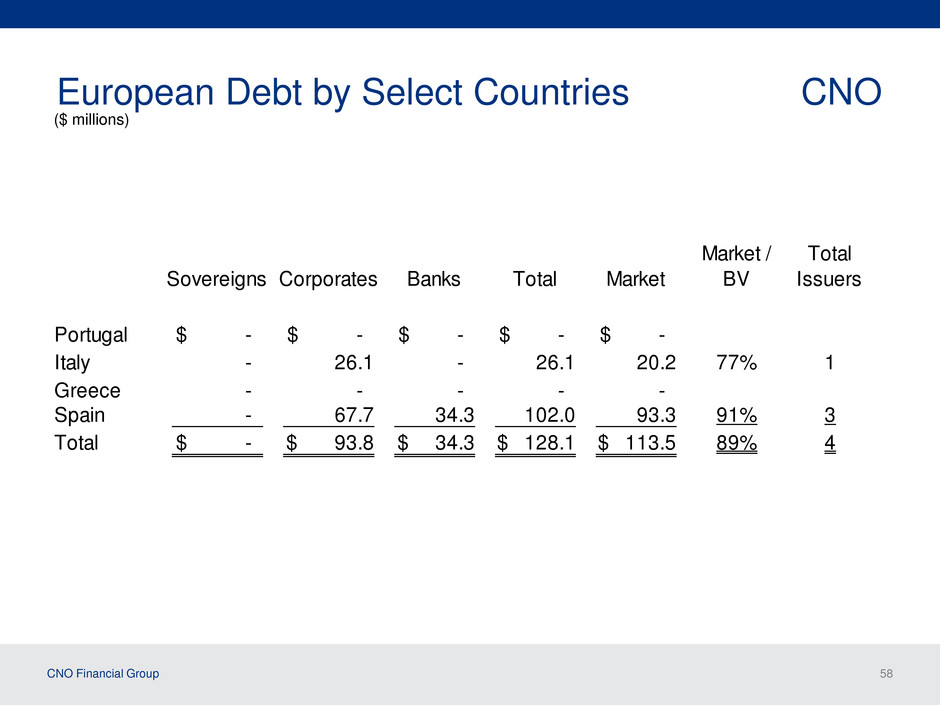
CNO Financial Group 58 European Debt by Select Countries CNO Sovereigns Corporates Banks Total Market Market / BV Total Issuers Portugal -$ -$ -$ -$ -$ Italy - 26.1 - 26.1 20.2 77% 1 Greece - - - - - Spain - 67.7 34.3 102.0 93.3 91% 3 Total -$ 93.8$ 34.3$ 128.1$ 113.5$ 89% 4 ($ millions)
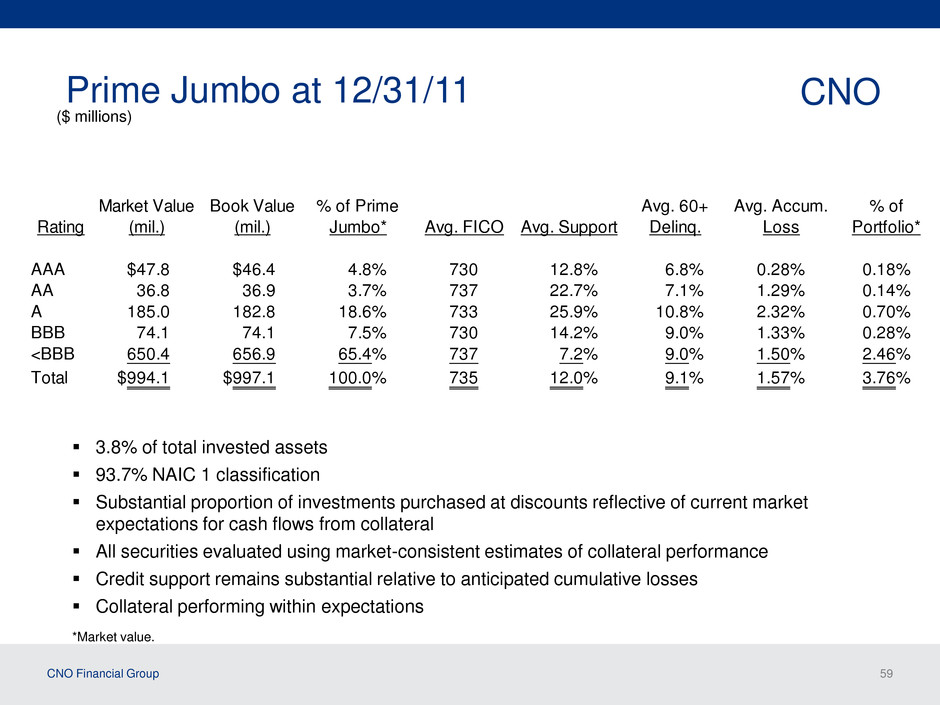
CNO Financial Group 59 Prime Jumbo at 12/31/11 CNO 3.8% of total invested assets 93.7% NAIC 1 classification Substantial proportion of investments purchased at discounts reflective of current market expectations for cash flows from collateral All securities evaluated using market-consistent estimates of collateral performance Credit support remains substantial relative to anticipated cumulative losses Collateral performing within expectations *Market value. Rating Market Value (mil.) Book Value (mil.) % of Prime Jumbo* Avg. FICO Avg. Support Avg. 60+ Delinq. Avg. Accum. Loss % of Portfolio* AAA $47.8 $46.4 4.8% 730 12.8% 6.8% 0.28% 0.18% AA 36.8 36.9 3.7% 737 22.7% 7.1% 1.29% 0.14% A 185.0 182.8 18.6% 733 25.9% 10.8% 2.32% 0.70% BBB 74.1 74.1 7.5% 730 14.2% 9.0% 1.33% 0.28% <BBB 650.4 656.9 65.4% 737 7.2% 9.0% 1.50% 2.46% Total $994.1 $997.1 100.0% 735 12.0% 9.1% 1.57% 3.76% ($ millions)
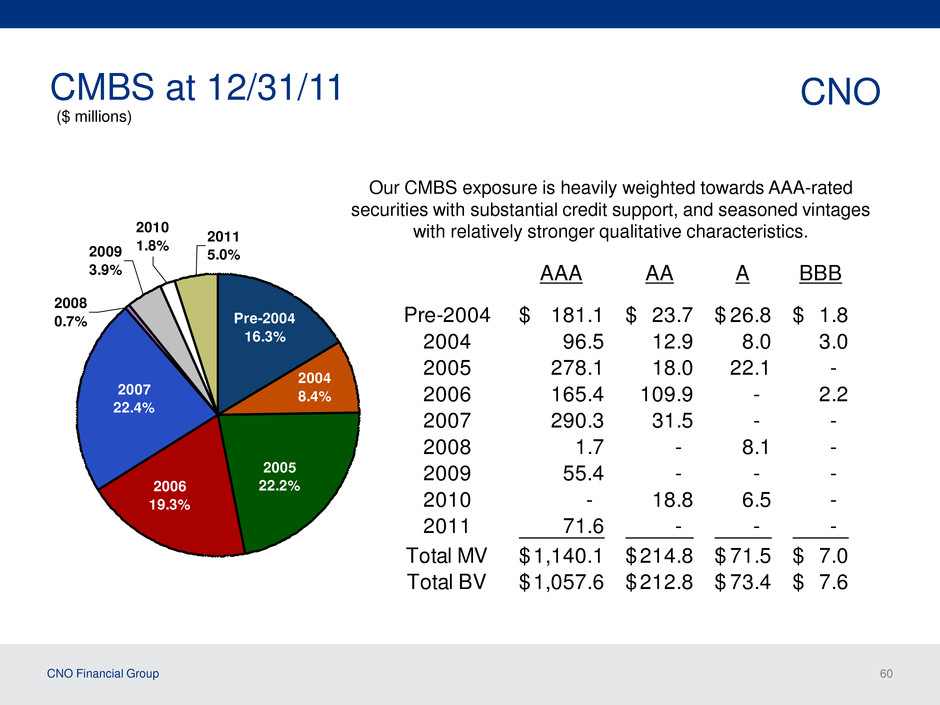
CNO Financial Group 60 CMBS at 12/31/11 Our CMBS exposure is heavily weighted towards AAA-rated securities with substantial credit support, and seasoned vintages with relatively stronger qualitative characteristics. CNO AAA AA A BBB Pre-2004 181.1$ 23.7$ 26.8$ 1.8$ 2004 96.5 12.9 8.0 3.0 2005 278.1 18.0 22.1 - 2006 165.4 109.9 - 2.2 2007 290.3 31.5 - - 2008 1.7 - 8.1 - 2009 55.4 - - - 2010 - 18.8 6.5 - 2011 71.6 - - - Total MV 1,140.1$ 214.8$ 71.5$ 7.0$ Total BV 1,057.6$ 212.8$ 73.4$ 7.6$ Pre-2004 16.3% 2004 8.4% 2005 22.2%2006 19.3% 2007 22.4% 2010 1.8%2009 3.9% 2008 0.7% 2011 5.0% ($ millions)
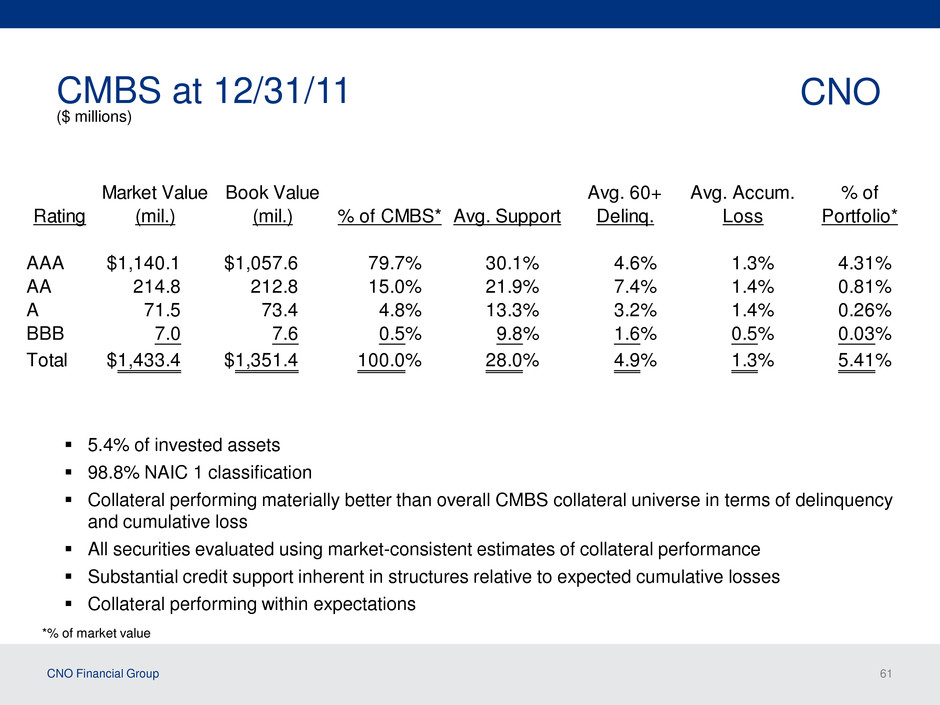
CNO Financial Group 61 CMBS at 12/31/11 CNO 5.4% of invested assets 98.8% NAIC 1 classification Collateral performing materially better than overall CMBS collateral universe in terms of delinquency and cumulative loss All securities evaluated using market-consistent estimates of collateral performance Substantial credit support inherent in structures relative to expected cumulative losses Collateral performing within expectations *% of market value Rating Market Value (mil.) Book Value (mil.) % of CMBS* Avg. Support Avg. 60+ Delinq. Avg. Accum. Loss % of Portfolio* AAA $1,140.1 $1,057.6 79.7% 30.1% 4.6% 1.3% 4.31% AA 214.8 212.8 15.0% 21.9% 7.4% 1.4% 0.81% A 71.5 73.4 4.8% 13.3% 3.2% 1.4% 0.26% BBB 7.0 7.6 0.5% 9.8% 1.6% 0.5% 0.03% Total $1,433.4 $1,351.4 100.0% 28.0% 4.9% 1.3% 5.41% ($ millions)
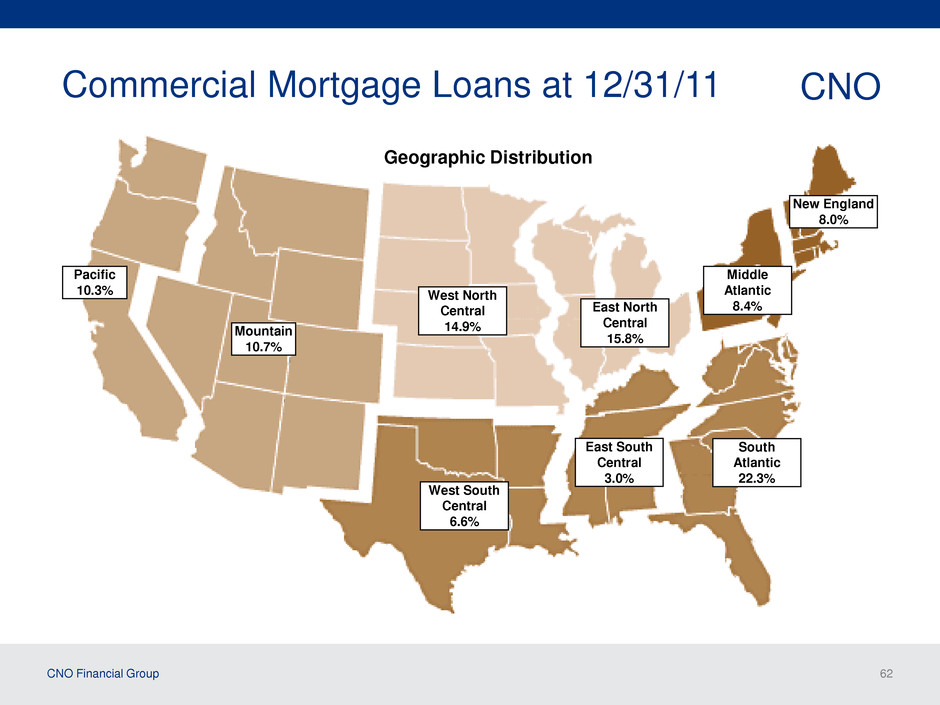
CNO Financial Group 62 Commercial Mortgage Loans at 12/31/11 Geographic Distribution CNO Pacific 10.3% Mountain 10.7% West North Central 14.9% West South Central 6.6% East North Central 15.8% East South Central 3.0% New England 8.0% Middle Atlantic 8.4% South Atlantic 22.3%
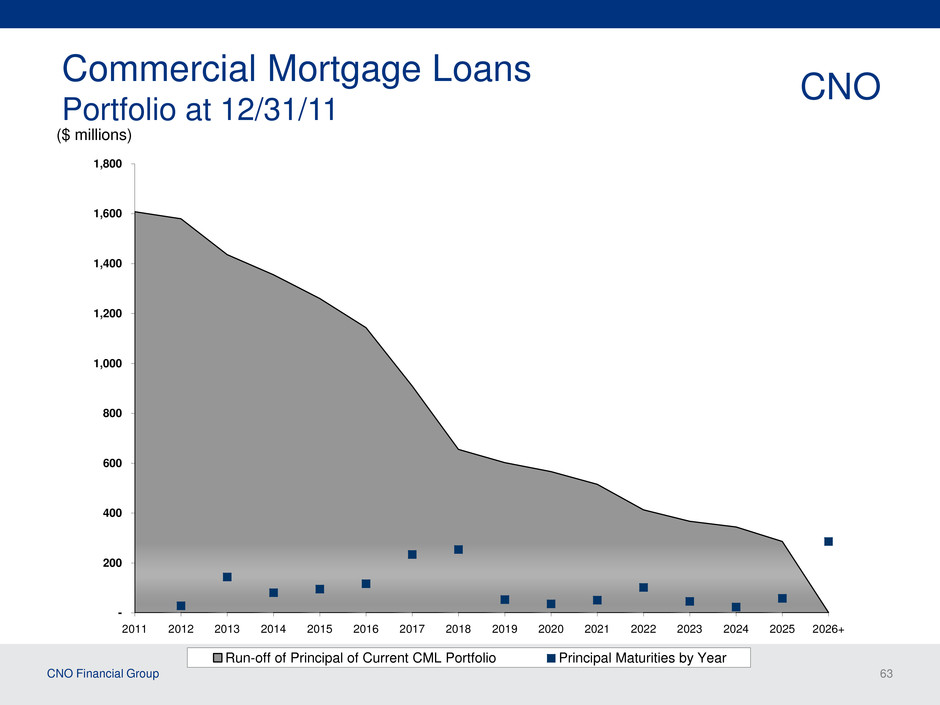
CNO Financial Group 63 Commercial Mortgage Loans Portfolio at 12/31/11 CNO ($ millions) - 200 400 600 800 1,000 1,200 1,400 1,600 1,800 2011 2012 2013 2014 2015 2016 2017 2018 2019 2020 2021 2022 2023 2024 2025 2026+ Run-off of Principal of Current CML Portfolio Principal Maturities by Year
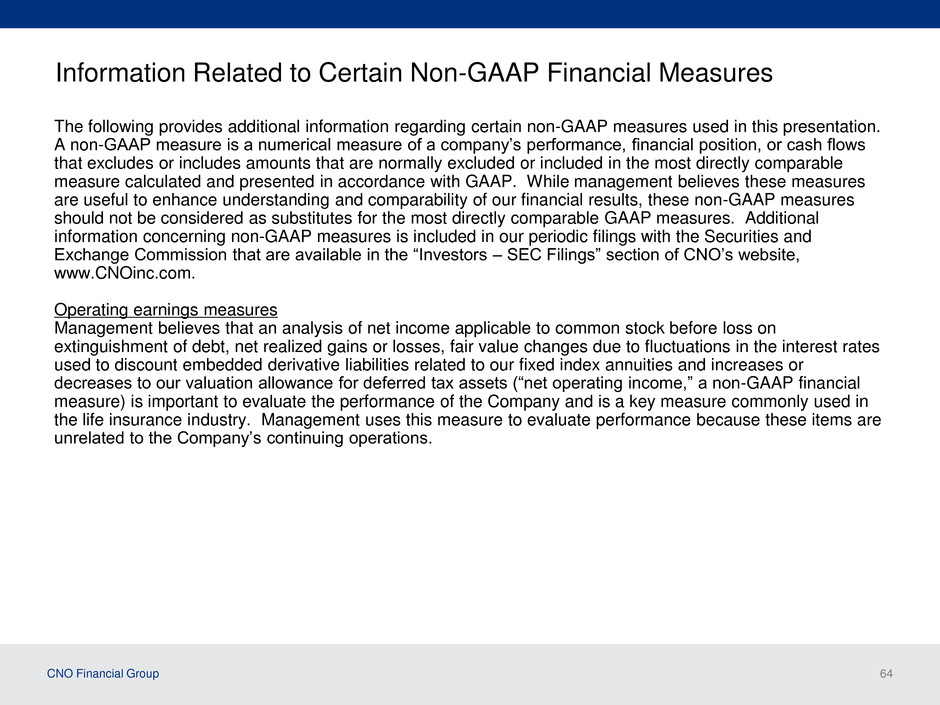
CNO Financial Group 64 Information Related to Certain Non-GAAP Financial Measures The following provides additional information regarding certain non-GAAP measures used in this presentation. A non-GAAP measure is a numerical measure of a company’s performance, financial position, or cash flows that excludes or includes amounts that are normally excluded or included in the most directly comparable measure calculated and presented in accordance with GAAP. While management believes these measures are useful to enhance understanding and comparability of our financial results, these non-GAAP measures should not be considered as substitutes for the most directly comparable GAAP measures. Additional information concerning non-GAAP measures is included in our periodic filings with the Securities and Exchange Commission that are available in the “Investors – SEC Filings” section of CNO’s website, www.CNOinc.com. Operating earnings measures Management believes that an analysis of net income applicable to common stock before loss on extinguishment of debt, net realized gains or losses, fair value changes due to fluctuations in the interest rates used to discount embedded derivative liabilities related to our fixed index annuities and increases or decreases to our valuation allowance for deferred tax assets (“net operating income,” a non-GAAP financial measure) is important to evaluate the performance of the Company and is a key measure commonly used in the life insurance industry. Management uses this measure to evaluate performance because these items are unrelated to the Company’s continuing operations.
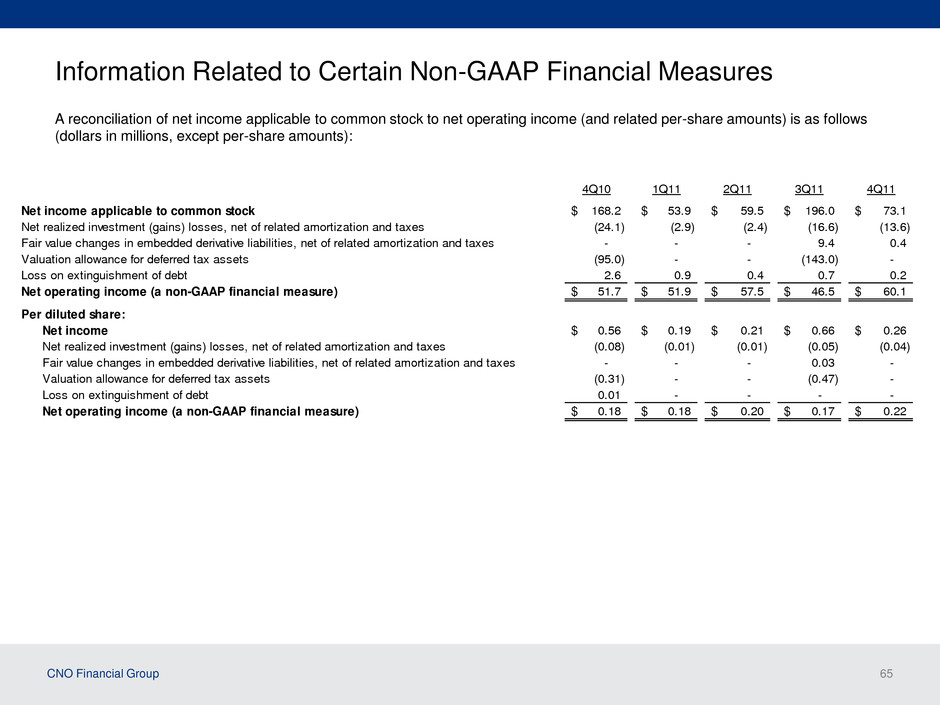
CNO Financial Group 65 Information Related to Certain Non-GAAP Financial Measures A reconciliation of net income applicable to common stock to net operating income (and related per-share amounts) is as follows (dollars in millions, except per-share amounts): 4Q10 1Q11 2Q11 3Q11 4Q11 Net income applicable to common stock 168.2$ 53.9$ 59.5$ 196.0$ 73.1$ Net realized investment (gains) losses, net of related amortization and taxes (24.1) (2.9) (2.4) (16.6) (13.6) Fair value changes in embedded derivative liabilities, net of related amortization and taxes - - - 9.4 0.4 Valuation allowance for deferred tax assets (95.0) - - (143.0) - Loss on extinguishment of debt 2.6 0.9 0.4 0.7 0.2 Net operating income (a non-GAAP financial measure) 51.7$ 51.9$ 57.5$ 46.5$ 60.1$ Per diluted share: Net income 0.56$ 0.19$ 0.21$ 0.66$ 0.26$ N t realized investment (gains) losses, net of related amortization and taxes (0.08) (0.01) (0.01) (0.05) (0.04) Fair valu changes in embedded derivative liabilities, net of related amortization and taxes - - - 0.03 - Valuation allowance for deferred tax assets (0.31) - - (0.47) - Loss on extinguishment of debt 0.01 - - - - Net operating income (a non-GAAP financial measure) 0.18$ 0.18$ 0.20$ 0.17$ 0.22$
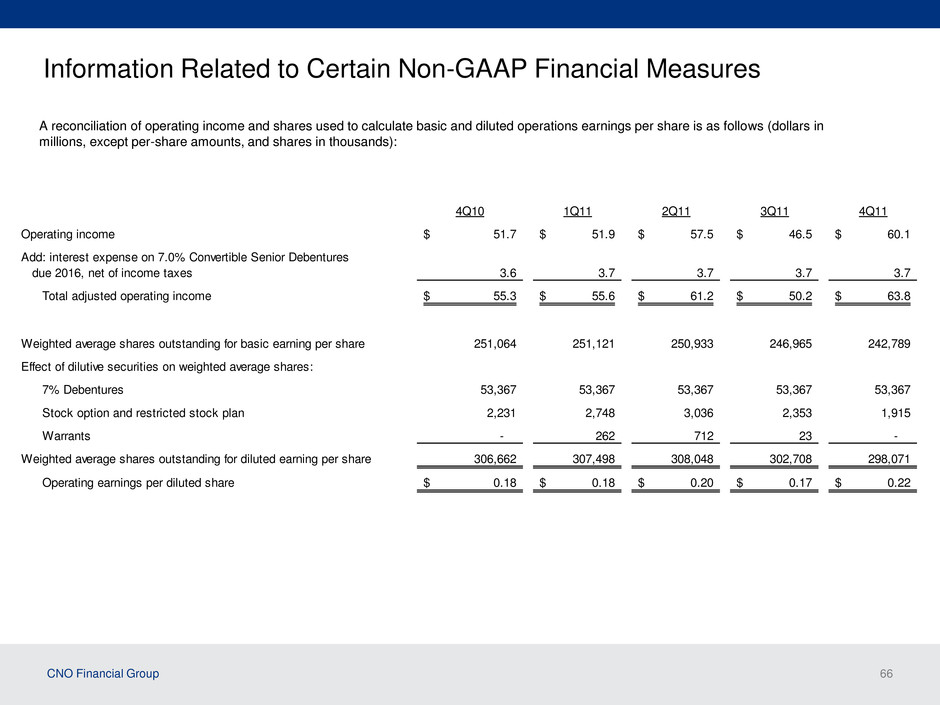
CNO Financial Group 66 4Q10 1Q11 2Q11 3Q11 4Q11 Operating income 51.7$ 51.9$ 57.5$ 46.5$ 60.1$ Add: interest expense on 7.0% Convertible Senior Debentures due 2016, net of income taxes 3.6 3.7 3.7 3.7 3.7 Total adjusted operating income 55.3$ 55.6$ 61.2$ 50.2$ 63.8$ Weighted average shares outstanding for basic earning per share 251,064 251,121 250,933 246,965 242,789 Effect of dilutive securities on weighted average shares: 7% Debentures 53,367 53,367 53,367 53,367 53,367 Stock option and restricted stock plan 2,231 2,748 3,036 2,353 1,915 Warrants - 262 712 23 - Weighted average shares outstanding for diluted earning per share 306,662 307,498 308,048 302,708 298,071 Operating earnings per diluted share 0.18$ 0.18$ 0.20$ 0.17$ 0.22$ A reconciliation of operating income and shares used to calculate basic and diluted operations earnings per share is as follows (dollars in millions, except per-share amounts, and shares in thousands): Information Related to Certain Non-GAAP Financial Measures
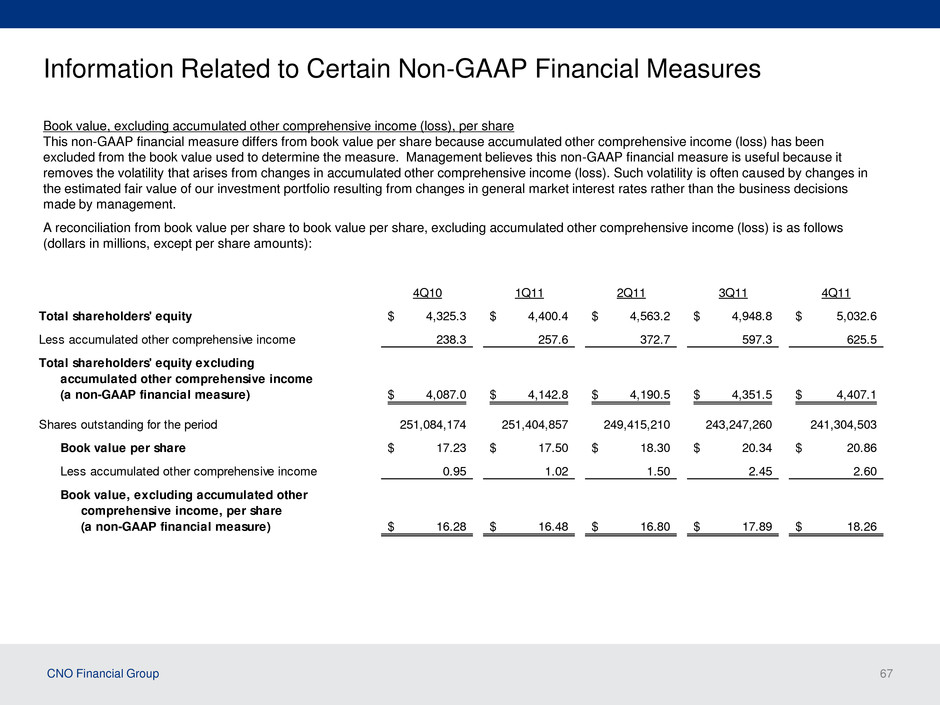
CNO Financial Group 67 Information Related to Certain Non-GAAP Financial Measures Book value, excluding accumulated other comprehensive income (loss), per share This non-GAAP financial measure differs from book value per share because accumulated other comprehensive income (loss) has been excluded from the book value used to determine the measure. Management believes this non-GAAP financial measure is useful because it removes the volatility that arises from changes in accumulated other comprehensive income (loss). Such volatility is often caused by changes in the estimated fair value of our investment portfolio resulting from changes in general market interest rates rather than the business decisions made by management. 4Q10 1Q11 2Q11 3Q11 4Q11 Total shareholders' equity 4,325.3$ 4,400.4$ 4,563.2$ 4,948.8$ 5,032.6$ Less accumulated other comprehensive income 238.3 257.6 372.7 597.3 625.5 Total shareholders' equity excluding accumulated other comprehensive income (a non-GAAP financial measure) 4,087.0$ 4,142.8$ 4,190.5$ 4,351.5$ 4,407.1$ Shares outstanding for the period 251,084,174 251,404,857 249,415,210 243,247,260 241,304,503 Book value per share 17.23$ 17.50$ 18.30$ 20.34$ 20.86$ Less accumulated other comprehensive income 0.95 1.02 1.50 2.45 2.60 Book value, excluding accumulated other comprehensive income, per share (a non-GAAP financial measure) 16.28$ 16.48$ 16.80$ 17.89$ 18.26$ A reconciliation from book value per share to book value per share, excluding accumulated other comprehensive income (loss) is as follows (dollars in millions, except per share amounts):
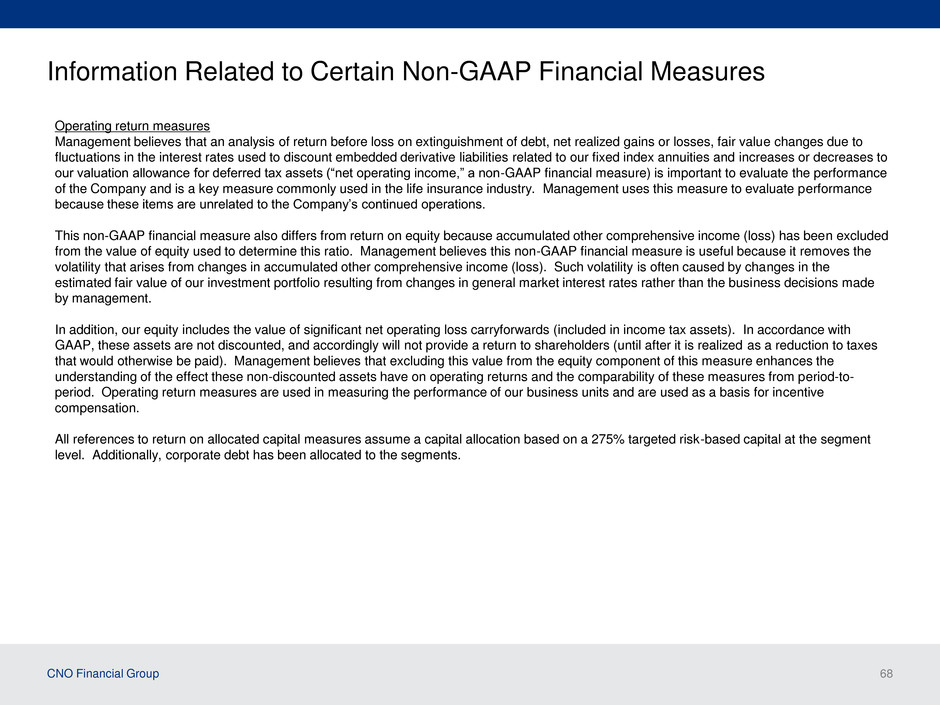
CNO Financial Group 68 Information Related to Certain Non-GAAP Financial Measures Operating return measures Management believes that an analysis of return before loss on extinguishment of debt, net realized gains or losses, fair value changes due to fluctuations in the interest rates used to discount embedded derivative liabilities related to our fixed index annuities and increases or decreases to our valuation allowance for deferred tax assets (“net operating income,” a non-GAAP financial measure) is important to evaluate the performance of the Company and is a key measure commonly used in the life insurance industry. Management uses this measure to evaluate performance because these items are unrelated to the Company’s continued operations. This non-GAAP financial measure also differs from return on equity because accumulated other comprehensive income (loss) has been excluded from the value of equity used to determine this ratio. Management believes this non-GAAP financial measure is useful because it removes the volatility that arises from changes in accumulated other comprehensive income (loss). Such volatility is often caused by changes in the estimated fair value of our investment portfolio resulting from changes in general market interest rates rather than the business decisions made by management. In addition, our equity includes the value of significant net operating loss carryforwards (included in income tax assets). In accordance with GAAP, these assets are not discounted, and accordingly will not provide a return to shareholders (until after it is realized as a reduction to taxes that would otherwise be paid). Management believes that excluding this value from the equity component of this measure enhances the understanding of the effect these non-discounted assets have on operating returns and the comparability of these measures from period-to- period. Operating return measures are used in measuring the performance of our business units and are used as a basis for incentive compensation. All references to return on allocated capital measures assume a capital allocation based on a 275% targeted risk-based capital at the segment level. Additionally, corporate debt has been allocated to the segments.
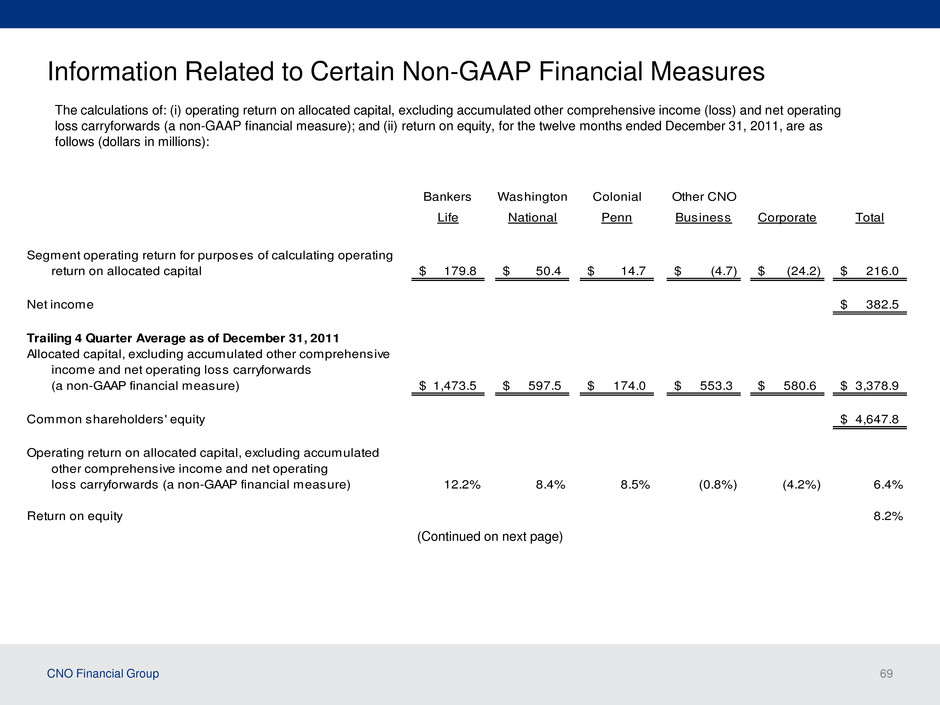
CNO Financial Group 69 Information Related to Certain Non-GAAP Financial Measures The calculations of: (i) operating return on allocated capital, excluding accumulated other comprehensive income (loss) and net operating loss carryforwards (a non-GAAP financial measure); and (ii) return on equity, for the twelve months ended December 31, 2011, are as follows (dollars in millions): Bankers Washington Colonial Other CNO Life National Penn Business Corporate Total Segment operating return for purposes of calculating operating return on allocated capital 179.8$ 50.4$ 14.7$ (4.7)$ (24.2)$ 216.0$ Net income 382.5$ Trailing 4 Quarter Average as of December 31, 2011 Allocated capital, excluding accumulated other comprehensive income and net operating loss carryforwards (a non-GAAP financial measure) 1,473.5$ 597.5$ 174.0$ 553.3$ 580.6$ 3,378.9$ Common shareholders' equity 4,647.8$ Operating return on allocated capital, excluding accumulated other comprehensive income and net operating loss carryforwards (a non-GAAP financial measure) 12.2% 8.4% 8.5% (0.8%) (4.2%) 6.4% Return on equity 8.2% (Continued on next page)
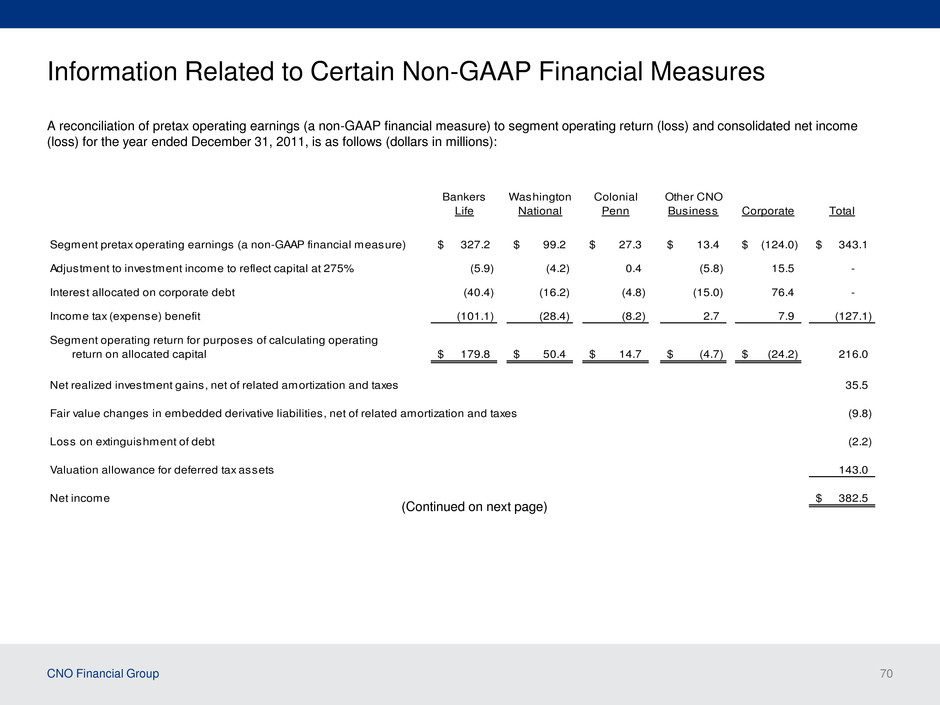
CNO Financial Group 70 Information Related to Certain Non-GAAP Financial Measures A reconciliation of pretax operating earnings (a non-GAAP financial measure) to segment operating return (loss) and consolidated net income (loss) for the year ended December 31, 2011, is as follows (dollars in millions): Bankers Washington Colonial Other CNO Life National Penn Business Corporate Total Segment pretax operating earnings (a non-GAAP financial measure) 327.2$ 99.2$ 27.3$ 13.4$ (124.0)$ 343.1$ Adjustment to investment income to reflect capital at 275% (5.9) (4.2) 0.4 (5.8) 15.5 - Interest allocated on corporate debt (40.4) (16.2) (4.8) (15.0) 76.4 - Income tax (expense) benefit (101.1) (28.4) (8.2) 2.7 7.9 (127.1) Segment operating return for purposes of calculating operating return on allocated capital 179.8$ 50.4$ 14.7$ (4.7)$ (24.2)$ 216.0 Net realized investment gains, net of related amortization and taxes 35.5 Fair value changes in embedded derivative liabilities, net of related amortization and taxes (9.8) Loss on extinguishment of debt (2.2) Valuation allowance for deferred tax assets 143.0 Net income 382.5$ (Continued on next page)
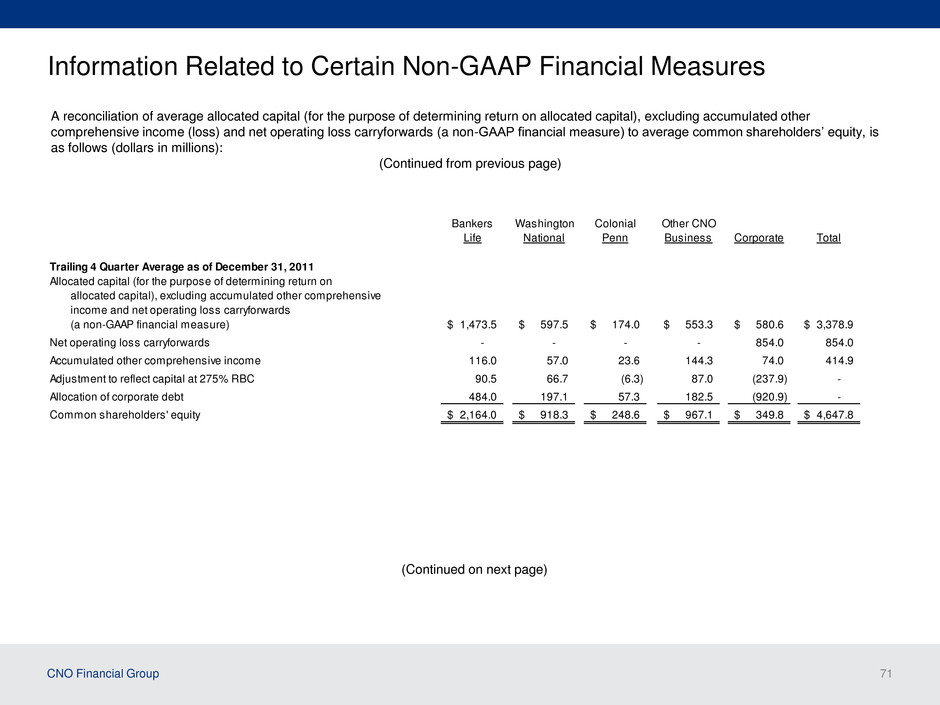
CNO Financial Group 71 Information Related to Certain Non-GAAP Financial Measures A reconciliation of average allocated capital (for the purpose of determining return on allocated capital), excluding accumulated other comprehensive income (loss) and net operating loss carryforwards (a non-GAAP financial measure) to average common shareholders’ equity, is as follows (dollars in millions): Bankers Washington Colonial Other CNO Life National Penn Business Corporate Total Trailing 4 Quarter Average as of December 31, 2011 Allocated capital (for the purpose of determining return on allocated capital), excluding accumulated other comprehensive income and net operating loss carryforwards (a non-GAAP financial measure) 1,473.5$ 597.5$ 174.0$ 553.3$ 580.6$ 3,378.9$ Net operating loss carryforwards - - - - 854.0 854.0 Accumulated other comprehensive income 116.0 57.0 23.6 144.3 74.0 414.9 Adjustment to reflect capital at 275% RBC 90.5 66.7 (6.3) 87.0 (237.9) - Allocation of corporate debt 484.0 197.1 57.3 182.5 (920.9) - Common shareholders' equity 2,164.0$ 918.3$ 248.6$ 967.1$ 349.8$ 4,647.8$ (Continued on next page) (Continued from previous page)
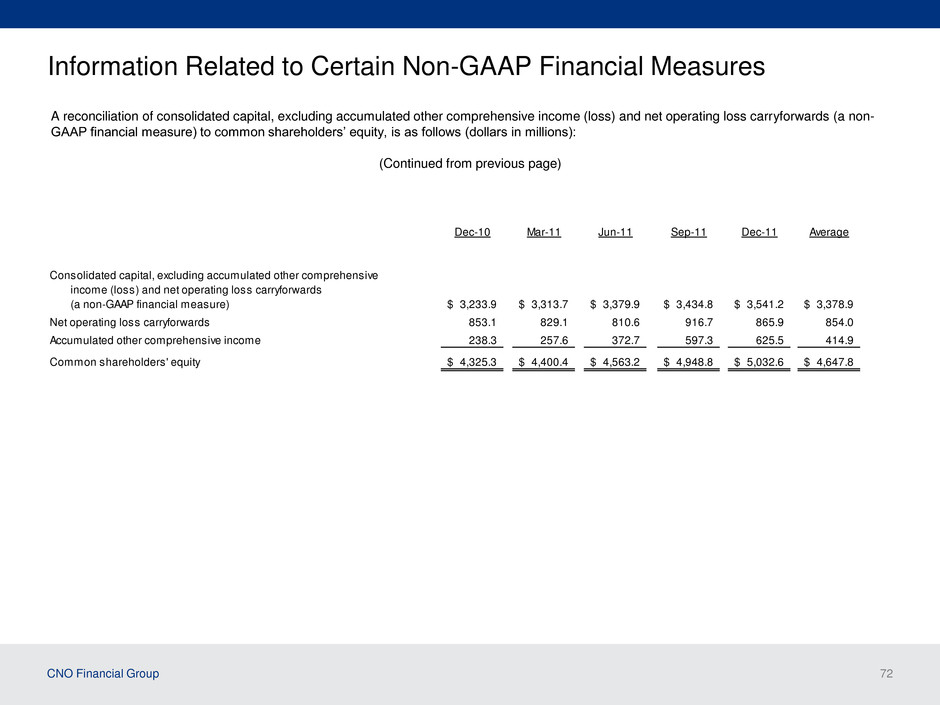
CNO Financial Group 72 Information Related to Certain Non-GAAP Financial Measures A reconciliation of consolidated capital, excluding accumulated other comprehensive income (loss) and net operating loss carryforwards (a non- GAAP financial measure) to common shareholders’ equity, is as follows (dollars in millions): Dec-10 Mar-11 Jun-11 Sep-11 Dec-11 Average Consolidated capital, excluding accumulated other comprehensive income (loss) and net operating loss carryforwards (a non-GAAP financial measure) 3,233.9$ 3,313.7$ 3,379.9$ 3,434.8$ 3,541.2$ 3,378.9$ Net operating loss carryforwards 853.1 829.1 810.6 916.7 865.9 854.0 Accumulated other comprehensive income 238.3 257.6 372.7 597.3 625.5 414.9 Common shareholders' equity 4,325.3$ 4,400.4$ 4,563.2$ 4,948.8$ 5,032.6$ 4,647.8$ (Continued from previous page)
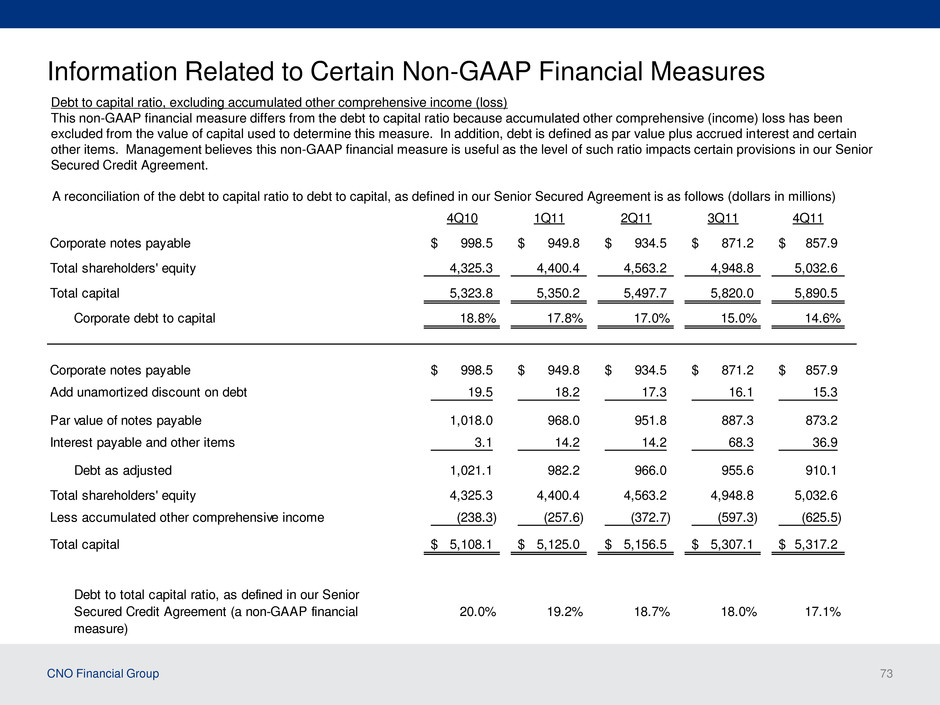
CNO Financial Group 73 Information Related to Certain Non-GAAP Financial Measures A reconciliation of the debt to capital ratio to debt to capital, as defined in our Senior Secured Agreement is as follows (dollars in millions) 4Q10 1Q11 2Q11 3Q11 4Q11 Corporate notes payable 998.5$ 949.8$ 934.5$ 871.2$ 857.9$ Total shareholders' equity 4,325.3 4,400.4 4,563.2 4,948.8 5,032.6 Total capital 5,323.8 5,350.2 5,497.7 5,820.0 5,890.5 Corporate debt to capital 18.8% 17.8% 17.0% 15.0% 14.6% Corporate notes payable 998.5$ 949.8$ 934.5$ 871.2$ 857.9$ Add unamortized discount on debt 19.5 18.2 17.3 16.1 15.3 Par value of notes payable 1,018.0 968.0 951.8 887.3 873.2 Interest payable and other items 3.1 14.2 14.2 68.3 36.9 Debt as adjusted 1,021.1 982.2 966.0 955.6 910.1 Total shareholders' equity 4,325.3 4,400.4 4,563.2 4,948.8 5,032.6 Less accumulated other comprehensive income (238.3) (257.6) (372.7) (597.3) (625.5) Total capital 5,108.1$ 5,125.0$ 5,156.5$ 5,307.1$ 5,317.2$ Debt to total capital ratio, as defined in our Senior Secured Credit Agreement (a non-GAAP financial 20.0% 19.2% 18.7% 18.0% 17.1% measure) Debt to capital ratio, excluding accumulated other comprehensive income (loss) This non-GAAP financial measure differs from the debt to capital ratio because accumulated other comprehensive (income) loss has been excluded from the value of capital used to determine this measure. In addition, debt is defined as par value plus accrued interest and certain other items. Management believes this non-GAAP financial measure is useful as the level of such ratio impacts certain pr visions in our Senior Secured Credit Agreement.


