Exhibit 99.1
TABLE OF CONTENTS
|
| | |
| PART II | | Page |
| Item 7. | | |
| Item 8. | | |
PART II
| |
| ITEM 7. | MANAGEMENT'S DISCUSSION AND ANALYSIS OF CONSOLIDATED FINANCIAL CONDITION AND RESULTS OF OPERATIONS. |
In this section, we review the consolidated financial condition of CNO and its consolidated results of operations for the years ended December 31, 2014, 2013 and 2012 and, where appropriate, factors that may affect future financial performance. Please read this discussion in conjunction with the consolidated financial statements and notes included in this Form 10-K.
CAUTIONARY STATEMENT REGARDING FORWARD-LOOKING STATEMENTS
Our statements, trend analyses and other information contained in this report and elsewhere (such as in filings by CNO with the SEC, press releases, presentations by CNO or its management or oral statements) relative to markets for CNO's products and trends in CNO's operations or financial results, as well as other statements, contain forward-looking statements within the meaning of the federal securities laws and the Private Securities Litigation Reform Act of 1995. Forward-looking statements typically are identified by the use of terms such as "anticipate," "believe," "plan," "estimate," "expect," "project," "intend," "may," "will," "would," "contemplate," "possible," "attempt," "seek," "should," "could," "goal," "target," "on track," "comfortable with," "optimistic" and similar words, although some forward-looking statements are expressed differently. You should consider statements that contain these words carefully because they describe our expectations, plans, strategies and goals and our beliefs concerning future business conditions, our results of operations, financial position, and our business outlook or they state other "forward-looking" information based on currently available information. The "Risk Factors" in Item 1A provide examples of risks, uncertainties and events that could cause our actual results to differ materially from the expectations expressed in our forward-looking statements. Assumptions and other important factors that could cause our actual results to differ materially from those anticipated in our forward-looking statements include, among other things:
| |
| • | changes in or sustained low interest rates causing reductions in investment income, the margins of our fixed annuity and life insurance businesses, and sales of, and demand for, our products; |
| |
| • | expectations of lower future investment earnings may cause us to accelerate amortization, write down the balance of insurance acquisition costs or establish additional liabilities for insurance products; |
| |
| • | general economic, market and political conditions, including the performance of the financial markets which may affect the value of our investments as well as our ability to raise capital or refinance existing indebtedness and the cost of doing so; |
| |
| • | the ultimate outcome of lawsuits filed against us and other legal and regulatory proceedings to which we are subject; |
| |
| • | our ability to make anticipated changes to certain non-guaranteed elements of our life insurance products; |
| |
| • | our ability to obtain adequate and timely rate increases on our health products, including our long-term care business; |
| |
| • | the receipt of any required regulatory approvals for dividend and surplus debenture interest payments from our insurance subsidiaries; |
| |
| • | mortality, morbidity, the increased cost and usage of health care services, persistency, the adequacy of our previous reserve estimates and other factors which may affect the profitability of our insurance products; |
| |
| • | changes in our assumptions related to deferred acquisition costs or the present value of future profits; |
| |
| • | the recoverability of our deferred tax assets and the effect of potential ownership changes and tax rate changes on their value; |
| |
| • | our assumption that the positions we take on our tax return filings will not be successfully challenged by the IRS; |
| |
| • | changes in accounting principles and the interpretation thereof; |
| |
| • | our ability to continue to satisfy the financial ratio and balance requirements and other covenants of our debt agreements; |
| |
| • | our ability to achieve anticipated expense reductions and levels of operational efficiencies including improvements in claims adjudication and continued automation and rationalization of operating systems; |
| |
| • | performance and valuation of our investments, including the impact of realized losses (including other-than-temporary impairment charges); |
| |
| • | our ability to identify products and markets in which we can compete effectively against competitors with greater market share, higher ratings, greater financial resources and stronger brand recognition; |
| |
| • | our ability to generate sufficient liquidity to meet our debt service obligations and other cash needs; |
| |
| • | our ability to maintain effective controls over financial reporting; |
| |
| • | our ability to continue to recruit and retain productive agents and distribution partners and customer response to new products, distribution channels and marketing initiatives; |
| |
| • | our ability to achieve additional upgrades of the financial strength ratings of CNO and our insurance company subsidiaries as well as the impact of our ratings on our business, our ability to access capital, and the cost of capital; |
| |
| • | regulatory changes or actions, including those relating to regulation of the financial affairs of our insurance companies, such as the payment of dividends and surplus debenture interest to us, regulation of the sale, underwriting and pricing of products, and health care regulation affecting health insurance products; |
| |
| • | changes in the Federal income tax laws and regulations which may affect or eliminate the relative tax advantages of some of our products or affect the value of our deferred tax assets; |
| |
| • | availability and effectiveness of reinsurance arrangements, as well as any defaults or failure of reinsurers to perform; |
| |
| • | the performance of third party service providers and potential difficulties arising from outsourcing arrangements; |
| |
| • | the growth rate of sales, collected premiums, annuity deposits and assets; |
| |
| • | interruption in telecommunication, information technology or other operational systems or failure to maintain the security, confidentiality or privacy of sensitive data on such systems; |
| |
| • | events of terrorism, cyber attacks, natural disasters or other catastrophic events, including losses from a disease pandemic; |
| |
| • | ineffectiveness of risk management policies and procedures in identifying, monitoring and managing risks; and |
| |
| • | the risk factors or uncertainties listed from time to time in our filings with the SEC; |
Other factors and assumptions not identified above are also relevant to the forward-looking statements, and if they prove incorrect, could also cause actual results to differ materially from those projected.
All written or oral forward-looking statements attributable to us are expressly qualified in their entirety by the foregoing cautionary statement. Our forward-looking statements speak only as of the date made. We assume no obligation to update or to publicly announce the results of any revisions to any of the forward-looking statements to reflect actual results, future events or developments, changes in assumptions or changes in other factors affecting the forward-looking statements.
The reporting of RBC measures is not intended for the purpose of ranking any insurance company or for use in connection with any marketing, advertising or promotional activities.
OVERVIEW
We are a holding company for a group of insurance companies operating throughout the United States that develop, market and administer health insurance, annuity, individual life insurance and other insurance products. We focus on serving the senior and middle-income markets, which we believe are attractive, underserved, high growth markets. We sell our
products through three distribution channels: career agents, independent producers (some of whom sell one or more of our product lines exclusively) and direct marketing.
Prior to 2014, the Company managed its business through the following operating segments: Bankers Life, Washington National and Colonial Penn, which are defined on the basis of product distribution; Other CNO Business, comprised primarily of products we no longer sell actively; and corporate operations, comprised of holding company activities and certain noninsurance company businesses. As a result of the sale of CLIC which was completed on July 1, 2014 and the coinsurance agreements to cede certain long-term care business effective December 31, 2013 (as further described in the note to the consolidated financial statements entitled "Summary of Significant Accounting Policies - Reinsurance"), management has changed the manner in which it disaggregates the Company's operations for making operating decisions and assessing performance. In periods prior to 2014: (i) the results in the Washington National segment have been adjusted to include the results from the business in the Other CNO Business segment that are being retained; (ii) the Other CNO Business segment included only the long-term care business that was ceded effective December 31, 2013 and the overhead expense of CLIC that is expected to continue after the completion of the sale; and (iii) the CLIC business being sold is excluded from our analysis of business segment results. Beginning on January 1, 2014: (i) the overhead expense of CLIC that is expected to continue after the completion of the sale has been reallocated primarily to the Bankers Life and Washington National segments; (ii) there is no longer an Other CNO Business segment; and (iii) the CLIC business being sold continues to be excluded from our analysis of business segment results. After the completion of the sale of CLIC: (i) the Bankers Life segment includes the results of certain life insurance business that was recaptured from Wilton Re; and (ii) the revenues and expenses associated with a transition services agreement and a special support services agreement with Wilton Re are included in our non-operating earnings. Under such agreements, we will receive $30 million in the year ending June 30, 2015 and $20 million in the year ending June 30, 2016. In addition, certain services will continue to be provided in the three years ending June 30, 2019 for an annual fee of $.2 million. The income we receive from these services agreements will offset certain of our overhead costs. If we are not successful in reducing our overhead costs to the same extent as the reduction in fees to be received from Wilton Re over the period of the agreements, our results of operations will be adversely affected. Our prior period segment disclosures have been revised to reflect management's current view of the Company's operating segments. The Company’s insurance segments are described below:
| |
| • | Bankers Life, which markets and distributes Medicare supplement insurance, interest-sensitive life insurance, traditional life insurance, fixed annuities and long-term care insurance products to the middle-income senior market through a dedicated field force of career agents and sales managers supported by a network of community-based sales offices. The Bankers Life segment includes primarily the business of Bankers Life and Casualty Company. Bankers Life also markets and distributes Medicare Advantage plans primarily through distribution arrangements with Humana, Inc. and United HealthCare and PDP primarily through a distribution arrangement with Coventry. |
| |
| • | Washington National, which markets and distributes supplemental health (including specified disease, accident and hospital indemnity insurance products) and life insurance to middle-income consumers at home and at the worksite. These products are marketed through PMA and through independent marketing organizations and insurance agencies including worksite marketing. The products being marketed are underwritten by Washington National. This segment's business also includes certain closed blocks of annuities and Medicare supplement policies which are no longer being actively marketed by this segment and were primarily issued or acquired by Washington National. |
| |
| • | Colonial Penn, which markets primarily graded benefit and simplified issue life insurance directly to customers in the senior middle-income market through television advertising, direct mail, the internet and telemarketing. The Colonial Penn segment includes primarily the business of Colonial Penn. |
Effective January 1, 2015, we changed our definition of operating income and operating income per diluted share to exclude the impact of fair market value changes related to the agent deferred compensation plan, since such impacts are not indicative of our ongoing business and trends in our business. Prior periods have been revised to conform to our current presentation. Net income (loss) and net income (loss) per diluted share are not impacted by this change. The following summarizes our earnings for the three years ending December 31, 2014 (dollars in millions, except per share data):
|
| | | | | | | | | | | |
| | 2014 | | 2013 | | 2012 |
| EBIT (a non-GAAP financial measure) (a): | | | | | |
| Bankers Life | $ | 386.9 |
| | $ | 310.5 |
| | $ | 300.9 |
|
| Washington National | 111.2 |
| | 140.6 |
| | 148.8 |
|
| Colonial Penn | .8 |
| | (12.5 | ) | | (8.6 | ) |
| Other CNO Business: | | | | | |
| Losses from the long-term care business reinsured effective December 31, 2013 | — |
| | (8.0 | ) | | (9.2 | ) |
| Overhead expense of CLIC allocated to other segments effective January 1, 2014 | — |
| | (19.6 | ) | | (20.5 | ) |
| EBIT from business segments continuing after the CLIC sale | 498.9 |
| | 411.0 |
| | 411.4 |
|
| Corporate operations, excluding corporate interest expense | (27.6 | ) | | 2.8 |
| | (10.3 | ) |
| EBIT from operations continuing after the CLIC sale | 471.3 |
| | 413.8 |
| | 401.1 |
|
| Corporate interest expense | (43.9 | ) | | (51.3 | ) | | (66.2 | ) |
| Operating earnings before taxes | 427.4 |
| | 362.5 |
| | 334.9 |
|
| Tax expense on operating income | 150.5 |
| | 124.3 |
| | 121.5 |
|
| Net operating income | 276.9 |
| | 238.2 |
| | 213.4 |
|
| Earnings of CLIC prior to being sold (net of taxes) | 15.2 |
| | 25.5 |
| | (31.1 | ) |
| Net loss on sale of CLIC and gain on reinsurance transactions (including impact of taxes) | (269.7 | ) | | (63.3 | ) | | — |
|
| Net realized investment gains (net of related amortization and taxes) | 21.4 |
| | 16.8 |
| | 53.0 |
|
| Fair value changes in embedded derivative liabilities (net of related amortization and taxes) | (23.4 | ) | | 23.0 |
| | (1.8 | ) |
| Fair value changes related to agent deferred compensation plan (net of taxes) | (17.4 | ) | | 10.2 |
| | (6.5 | ) |
| Loss on extinguishment or modification of debt (net of taxes) | (.4 | ) | | (64.0 | ) | | (177.5 | ) |
| Valuation allowance for deferred tax assets and other tax items (b) | 54.9 |
| | 301.5 |
| | 171.5 |
|
| Other | (6.1 | ) | | (9.9 | ) | | — |
|
| Net income | $ | 51.4 |
| | $ | 478.0 |
| | $ | 221.0 |
|
| Per diluted share: | | | | | |
| Net operating income | $ | 1.27 |
| | $ | 1.03 |
| | $ | .80 |
|
| Earnings of CLIC prior to being sold (net of taxes) | .07 |
| | .11 |
| | (.11 | ) |
| Net loss on sale of CLIC and gain on reinsurance transactions (including impact of taxes) | (1.24 | ) | | (.27 | ) | | — |
|
| Net realized investment gains (net of related amortization and taxes) | .10 |
| | .08 |
| | .19 |
|
| Fair value changes in embedded derivative liabilities (net of related amortization and taxes) | (.11 | ) | | .10 |
| | (.01 | ) |
| Fair value changes related to agent deferred compensation plan (net of taxes) | (.08 | ) | | .04 |
| | (.02 | ) |
| Loss on extinguishment or modification of debt (net of taxes) | — |
| | (.28 | ) | | (.63 | ) |
| Valuation allowance for deferred tax assets and other tax items (b) | .25 |
| | 1.29 |
| | .61 |
|
| Other | (.02 | ) | | (.04 | ) | | — |
|
| Net income | $ | .24 |
| | $ | 2.06 |
| | $ | .83 |
|
____________
| |
| (a) | Management believes that an analysis of net operating income provides a clearer comparison of the operating results of the Company from period to period because it excludes: (i) the net loss on the sale of CLIC and gain on reinsurance transactions, including impact of taxes; (ii) the earnings of CLIC prior to being sold on July 1, 2014, net of taxes; (iii) net realized investment gains or losses, net of related amortization and taxes; (iv) fair value changes due to fluctuations in the interest rates used to discount embedded derivative liabilities related to our fixed index annuities, net of related amortization and taxes; (v) fair value changes related to the agent deferred compensation plan, net of taxes; (vi) loss on extinguishment or modification of debt, net of taxes; (vii) changes in the valuation allowance for deferred tax assets; and (viii) other non-operating items consisting primarily of equity in earnings of certain non-strategic investments and earnings attributable to variable interest entities. Net realized investment gains or losses include: (i) gains or losses on the sales of investments; (ii) other-than-temporary impairments recognized through net income; and (iii) changes in fair value of certain fixed maturity investments with embedded derivatives. EBIT is presented as net operating income excluding corporate interest expense and income tax expense. The table above reconciles the non-GAAP measures to the corresponding GAAP measure. |
| |
| (b) | Increase in valuation allowance of $19.4 million in 2014, related to the expected change in future taxable income following the sale of CLIC, is included in the "net loss on sale of CLIC and gain on reinsurance transactions (including impact of taxes)". |
Our mission is to be the recognized market leader in providing financial security for the protection and retirement needs of middle-income American working families and retirees. Our strategic plans are focused on continuing to grow and deliver long-term value for all our stakeholders. Specifically, we will focus on the following priorities:
Growth
•Continue to expand our reach to serve middle-income Americans
•Capitalize on increased opportunities to grow sales
•Continue to increase the productivity and size of our agent force
Further enhance the customer experience
•Continue with initiatives that make it easier for our customers to do business with us
Increase profitability and return on equity
•Maintain our strong capital position
•Maintain favorable financial metrics
•Continue to increase our return on equity
Effectively manage risk and deploy capital
•Further invest in growing our business organically, while seeking strategic acquisitions
•Continue to cost effectively repurchase our common stock
•Maintain a competitive dividend payout ratio
Invest in our business and talent
•Improve our business over the long-term through ongoing financial commitments
•Continue to provide our associates with new assignments and developmental opportunities
•Develop future leaders through our leadership development program
CRITICAL ACCOUNTING POLICIES
The preparation of financial statements in accordance with GAAP requires management to make estimates and assumptions that affect the reported amounts of assets and liabilities and disclosure of contingent assets and liabilities at the date of the financial statements and the reported amounts of revenues and expenses during the reporting period. Management has made estimates in the past that we believed to be appropriate but were subsequently revised to reflect actual experience. If our future experience differs materially from these estimates and assumptions, our results of operations and financial condition could be materially affected.
We base our estimates on historical experience and other assumptions that we believe are reasonable under the circumstances. We continually evaluate the information used to make these estimates as our business and the economic environment change. The use of estimates is pervasive throughout our financial statements. The accounting policies and
estimates we consider most critical are summarized below. Additional information on our accounting policies is included in the note to our consolidated financial statements entitled "Summary of Significant Accounting Policies".
Investments
At December 31, 2014, the carrying value of our investment portfolio was $24.9 billion.
Interest income on fixed maturity securities is recognized when earned using a constant effective yield method giving effect to amortization of premiums and accretion of discounts. Prepayment fees are recognized when earned. Dividends on equity securities are recognized when declared.
Our evaluation of investments for impairment requires significant judgments, including: (i) the identification of potentially impaired securities; (ii) the determination of their estimated fair value; and (iii) the assessment of whether any decline in estimated fair value is other than temporary.
We regularly evaluate all of our investments with unrealized losses for possible impairment. Our assessment of whether unrealized losses are "other than temporary" requires significant judgment. Factors considered include: (i) the extent to which fair value is less than the cost basis; (ii) the length of time that the fair value has been less than cost; (iii) whether the unrealized loss is event driven, credit-driven or a result of changes in market interest rates or risk premium; (iv) the near-term prospects for specific events, developments or circumstances likely to affect the value of the investment; (v) the investment's rating and whether the investment is investment-grade and/or has been downgraded since its purchase; (vi) whether the issuer is current on all payments in accordance with the contractual terms of the investment and is expected to meet all of its obligations under the terms of the investment; (vii) whether we intend to sell the investment or it is more likely than not that circumstances will require us to sell the investment before recovery occurs; (viii) the underlying current and prospective asset and enterprise values of the issuer and the extent to which the recoverability of the carrying value of our investment may be affected by changes in such values; (ix) projections of, and unfavorable changes in, cash flows on structured securities including mortgage-backed and asset-backed securities; (x) our best estimate of the value of any collateral; and (xi) other objective and subjective factors.
Future events may occur, or additional information may become available, which may necessitate future realized losses in our portfolio. Significant losses could have a material adverse effect on our consolidated financial statements in future periods.
Impairment losses on equity securities are recognized in net income. The manner in which impairment losses on fixed maturity securities, available for sale, are recognized in the financial statements is dependent on the facts and circumstances related to the specific security. If we intend to sell a security or it is more likely than not that we would be required to sell a security before the recovery of its amortized cost, the security is other-than-temporarily impaired and the full amount of the impairment is recognized as a loss through earnings. If we do not expect to recover the amortized cost basis, we do not plan to sell the security, and if it is not more likely than not that we would be required to sell a security before the recovery of its amortized cost, less any current period credit loss, the recognition of the other-than-temporary impairment is bifurcated. We recognize the credit loss portion in net income and the noncredit loss portion in accumulated other comprehensive income.
We estimate the amount of the credit loss component of a fixed maturity security impairment as the difference between amortized cost and the present value of the expected cash flows of the security. The present value is determined using the best estimate of future cash flows discounted at the effective interest rate implicit to the security at the date of purchase or the current yield to accrete an asset-backed or floating rate security. The methodology and assumptions for establishing the best estimate of future cash flows vary depending on the type of security.
For most structured securities, cash flow estimates are based on bond specific facts and circumstances that may include collateral characteristics, expectations of delinquency and default rates, loss severity, prepayment speeds and structural support, including excess spread, subordination and guarantees. For corporate bonds, cash flow estimates are derived from scenario-based outcomes of expected corporate restructurings or the disposition of assets using bond specific facts and circumstances. The previous amortized cost basis less the impairment recognized in net income becomes the security's new cost basis. We accrete the new cost basis to the estimated future cash flows over the expected remaining life of the security, except when the security is in default or considered nonperforming.
The remaining noncredit impairment, which is recorded in accumulated other comprehensive income, is the difference between the security's estimated fair value and our best estimate of future cash flows discounted at the effective interest rate prior to impairment. The remaining noncredit impairment typically represents changes in the market interest rates, current
market liquidity and risk premiums. As of December 31, 2014, other-than-temporary impairments included in accumulated other comprehensive income of $3.2 million (before taxes and related amortization) related to structured securities.
Fair value is the price that would be received to sell an asset or paid to transfer a liability in an orderly transaction between market participants at the measurement date and, therefore, represents an exit price, not an entry price. We carry certain assets and liabilities at fair value on a recurring basis, including fixed maturities, equity securities, trading securities, investments held by VIEs, derivatives, cash and cash equivalents, separate account assets and embedded derivatives. We carry our company-owned life insurance policy, which is invested in a series of mutual funds, at its cash surrender value and our hedge fund investments at their net asset values; in both cases, we believe these values approximate their fair values. In addition, we disclose fair value for certain financial instruments, including mortgage loans and policy loans, policyholder account balances, investment borrowings, notes payable and borrowings related to variable interest entities ("VIEs").
The degree of judgment utilized in measuring the fair value of financial instruments is largely dependent on the level to which pricing is based on observable inputs. Observable inputs reflect market data obtained from independent sources, while unobservable inputs reflect our view of market assumptions in the absence of observable market data. Financial instruments with readily available active quoted prices would be considered to have fair values based on the highest level of observable inputs, and little judgment would be utilized in measuring fair value. Financial instruments that rarely trade would often have fair value based on a lower level of observable inputs, and more judgment would be utilized in measuring fair value.
There is a three-level hierarchy for valuing assets or liabilities at fair value based on whether inputs are observable or unobservable.
| |
| • | Level 1 – includes assets and liabilities valued using inputs that are unadjusted quoted prices in active markets for identical assets or liabilities. Our Level 1 assets primarily include cash and exchange traded securities. |
| |
| • | Level 2 – includes assets and liabilities valued using inputs that are quoted prices for similar assets in an active market, quoted prices for identical or similar assets in a market that is not active, observable inputs, or observable inputs that can be corroborated by market data. Level 2 assets and liabilities include those financial instruments that are valued by independent pricing services using models or other valuation methodologies. These models consider various inputs such as credit rating, maturity, corporate credit spreads, reported trades and other inputs that are observable or derived from observable information in the marketplace or are supported by transactions executed in the marketplace. Financial assets in this category primarily include: certain publicly registered and privately placed corporate fixed maturity securities; certain government or agency securities; certain mortgage and asset-backed securities; certain equity securities; most investments held by our consolidated VIEs; certain mutual fund and hedge fund investments; most short-term investments; and non-exchange-traded derivatives such as call options. Financial liabilities in this category include investment borrowings, notes payable and borrowings related to VIEs. |
| |
| • | Level 3 – includes assets and liabilities valued using unobservable inputs that are used in model-based valuations that contain management assumptions. Level 3 assets and liabilities include those financial instruments whose fair value is estimated based on broker/dealer quotes, pricing services or internally developed models or methodologies utilizing significant inputs not based on, or corroborated by, readily available market information. Financial assets in this category include certain corporate securities (primarily certain below-investment grade privately placed securities), certain structured securities, mortgage loans, and other less liquid securities. Financial liabilities in this category include our insurance liabilities for interest-sensitive products, which includes embedded derivatives (including embedded derivatives related to our fixed index annuity products and to a modified coinsurance arrangement) since their values include significant unobservable inputs including actuarial assumptions. |
At each reporting date, we classify assets and liabilities into the three input levels based on the lowest level of input that is significant to the measurement of fair value for each asset and liability reported at fair value. This classification is impacted by a number of factors, including the type of financial instrument, whether the financial instrument is new to the market and not yet established, the characteristics specific to the transaction and overall market conditions. Our assessment of the significance of a particular input to the fair value measurement and the ultimate classification of each asset and liability requires judgment and is subject to change from period to period based on the observability of the valuation inputs.
Below-investment grade corporate debt securities typically have different characteristics than investment grade corporate debt securities. Based on historical performance, probability of default by the borrower is significantly greater for below-investment grade corporate debt securities and in many cases severity of loss is relatively greater as such securities are generally unsecured and often subordinated to other indebtedness of the issuer. Also, issuers of below-investment grade
corporate debt securities frequently have higher levels of debt relative to investment-grade issuers, hence, all other things being equal, are generally more sensitive to adverse economic conditions. The Company attempts to reduce the overall risk related to its investment in below-investment grade securities, as in all investments, through careful credit analysis, strict investment policy guidelines, and diversification by issuer and/or guarantor and by industry.
Our fixed maturity investments are generally purchased in the context of long-term strategies, including funding insurance liabilities, so we do not generally seek to generate short-term realized gains through the purchase and sale of such securities. In certain circumstances, including those in which securities are selling at prices which exceed our view of their underlying economic value, or when it is possible to reinvest the proceeds to better meet our long-term asset-liability objectives, we may sell certain securities. During 2014, we sold $233.7 million of fixed maturity investments which resulted in gross investment losses (before income taxes) of $13.0 million.
We actively manage the relationship between the duration and cash flows of our invested assets and the estimated duration and cash flows of benefit payments arising from contract liabilities. These efforts may cause us to sell investments before their maturity date and could result in the realization of net realized investment gains (losses). When the estimated durations of assets and liabilities are similar, exposure to interest rate risk is minimized because a change in the value of assets should be largely offset by a change in the value of liabilities. In certain circumstances, a mismatch of the durations or related cash flows of invested assets and insurance liabilities could have a significant impact on our results of operations and financial position.
For more information on our investment portfolio and our critical accounting policies related to investments, see the note to our consolidated financial statements entitled "Investments".
Present Value of Future Profits and Deferred Acquisition Costs
In conjunction with the implementation of fresh start accounting, we eliminated the historical balances of our Predecessor's deferred acquisition costs and the present value of future profits and replaced them with the present value of future profits as calculated on the Effective Date.
The value assigned to the right to receive future cash flows from contracts existing at the Effective Date is referred to as the present value of future profits. The balance of this account is amortized, evaluated for recovery, and adjusted for the impact of unrealized gains (losses) in the same manner as the deferred acquisition costs described below. We expect to amortize the balance of the present value of future profits as of December 31, 2014 as follows: 11 percent in 2015, 10 percent in 2016, 9 percent in 2017, 8 percent in 2018 and 7 percent in 2019.
Deferred acquisition costs represent incremental direct costs related to the successful acquisition of new or renewal insurance contracts. For interest-sensitive life or annuity products, we amortize these costs in relation to the estimated gross profits using the interest rate credited to the underlying policies. For other products, we generally amortize these costs in relation to future anticipated premium revenue using the projected investment earnings rate.
Insurance acquisition costs are amortized to expense over the lives of the underlying policies in relation to future anticipated premiums or gross profits. The insurance acquisition costs for policies other than interest-sensitive life and annuity products are amortized with interest (using the projected investment earnings rate) over the estimated premium-paying period of the policies, in a manner which recognizes amortization expense in proportion to each year's premium income. The insurance acquisition costs for interest-sensitive life and annuity products are amortized with interest (using the interest rate credited to the underlying policy) in proportion to estimated gross profits. The interest, mortality, morbidity and persistency assumptions used to amortize insurance acquisition costs are consistent with those assumptions used to estimate liabilities for insurance products. For interest-sensitive life and annuity products, these assumptions are reviewed on a regular basis. When actual profits or our current best estimates of future profits are different from previous estimates, we adjust cumulative amortization of insurance acquisition costs to maintain amortization expense as a constant percentage of gross profits over the entire life of the policies.
When we realize a gain or loss on investments backing our interest-sensitive life or annuity products, we adjust the amortization of insurance acquisition costs to reflect the change in estimated gross profits from the products due to the gain or loss realized and the effect on future investment yields. We increased amortization expense for such changes by $1.0 million, $1.6 million and $6.5 million during the years ended December 31, 2014, 2013 and 2012, respectively. We also adjust insurance acquisition costs for the change in amortization that would have been recorded if fixed maturity securities, available for sale, had been sold at their stated aggregate fair value and the proceeds reinvested at current yields. Such adjustments are commonly
referred to as "shadow adjustments" and may include adjustments to: (i) deferred acquisition costs; (ii) the present value of future profits; (iii) loss recognition reserves; and (iv) income taxes. We include the impact of this adjustment in accumulated other comprehensive income (loss) within shareholders' equity. The total pre-tax impact of such adjustments on accumulated other comprehensive income was a decrease of $921.8 million at December 31, 2014 (including $652.4 million for premium deficiencies that would exist on certain blocks of business (primarily long-term care products) if unrealized gains on the assets backing such products had been realized and the proceeds from our sales of such assets were invested at then current yields.) The total pre-tax impact of such adjustments on accumulated other comprehensive income at December 31, 2013 was a decrease of $184.7 million (including $27.8 million for premium deficiencies that would exist on certain long-term care products if unrealized gains on the assets backing such products had been realized and the proceeds from our sales of such assets were invested at then current yields.)
At December 31, 2014, the balance of insurance acquisition costs was $1.8 billion prior to shadow adjustments. The recoverability of this amount is dependent on the future profitability of the related business. Each year, we evaluate the recoverability of the unamortized balance of insurance acquisition costs. These evaluations are performed to determine whether estimates of the present value of future cash flows, in combination with the related liability for insurance products, will support the unamortized balance. These future cash flows are based on our best estimate of future premium income, less benefits and expenses. The present value of these cash flows, plus the related balance of liabilities for insurance products, is then compared with the unamortized balance of insurance acquisition costs. In the event of a deficiency, such amount would be charged to amortization expense. If the deficiency exceeds the balance of insurance acquisition costs, a premium deficiency reserve is established for the excess. The determination of future cash flows involves significant judgment. Revisions to the assumptions which determine such cash flows could have a significant adverse effect on our results of operations and financial position. While we expect the long-term care business in the Bankers Life segment to generate future profits, the margins are relatively thin and are vulnerable to changes in assumptions. In 2014, we were required to establish a $9 million deficiency reserve for the life contingent payout annuities in the Washington National segment. Accordingly, these annuities are not expected to generate future profits and future unfavorable changes to our assumptions will reduce earnings in the period such changes occur.
The table presented below summarizes our estimates of cumulative adjustments to insurance acquisition costs or premium deficiency reserves (when the deficiency exceeds the balance of insurance acquisition costs) resulting from hypothetical revisions to certain assumptions. Although such hypothetical revisions are not currently required or anticipated, we believe they could occur based on past variances in experience and our expectations of the ranges of future experience that could reasonably occur. We have assumed that revisions to assumptions resulting in the adjustments summarized below would occur equally among policy types, ages and durations within each product classification. Any actual adjustment would be dependent on the specific policies affected and, therefore, may differ from the estimates summarized below. In addition, the impact of actual adjustments would reflect the net effect of all changes in assumptions during the period.
|
| | | | |
| Change in assumptions | | Estimated adjustment to income before income taxes based on revisions to certain assumptions |
| | | (dollars in millions) |
| Interest-sensitive life products: | | |
| 5% increase to assumed mortality | | $ | (25 | ) |
| 5% decrease to assumed mortality | | 25 |
|
| 15% increase to assumed expenses | | (10 | ) |
| 15% decrease to assumed expenses | | 10 |
|
| 10 basis point decrease to assumed spread | | (5 | ) |
| 10 basis point increase to assumed spread | | 5 |
|
| 10% increase to assumed lapses | | (5 | ) |
| 10% decrease to assumed lapses | | 5 |
|
| Fixed index and fixed interest annuity products: | | |
| 20% increase to assumed surrenders | | (70 | ) |
| 20% decrease to assumed surrenders | | 85 |
|
| 15% increase to assumed expenses | | (10 | ) |
| 15% decrease to assumed expenses | | 10 |
|
| 10 basis point decrease to assumed spread | | (35 | ) |
| 10 basis point increase to assumed spread | | 35 |
|
| Other than interest-sensitive life and annuity products (a): | | |
| 5% increase to assumed morbidity | | (210 | ) |
| 20 basis point decrease to investment earnings rate | | — |
|
| 50 basis point decrease to investment earnings rate | | (175 | ) |
| 5% decrease to assumed mortality | | (60 | ) |
__________________
| |
| (a) | We have excluded the effect of reasonably likely changes in lapse, surrender and expense assumptions for policies other than interest-sensitive life and annuity products. |
The following summarizes the persistency of our major blocks of insurance business summarized by segment and line of business:
|
| | | | | | | | |
| | Years ended December 31, |
| | 2014 | | 2013 | | 2012 |
| Bankers Life: | | | | | |
| Medicare supplement (1) | 82.8 | % | | 82.3 | % | | 80.7 | % |
| Long-term care (1) | 91.1 | % | | 90.9 | % | | 90.4 | % |
| Fixed index annuities (2) | 90.8 | % | | 90.8 | % | | 90.8 | % |
| Other annuities (2) | 85.2 | % | | 86.6 | % | | 87.3 | % |
| Life (1) | 87.3 | % | | 87.2 | % | | 86.2 | % |
| Washington National: | | | | | |
| Medicare supplement (1) | 84.2 | % | | 82.4 | % | | 81.2 | % |
| Supplemental health (1) | 88.4 | % | | 87.2 | % | | 88.3 | % |
| Life (1) | 92.5 | % | | 90.9 | % | | 92.4 | % |
| Colonial Penn: | | | | | |
| Life (1) | 83.2 | % | | 83.8 | % | | 84.7 | % |
_____________________
| |
| (1) | Based on number of inforce policies. |
| |
| (2) | Based on the percentage of the inforce block persisting. |
Liabilities for Insurance Products - reserves for the future payment of long-term care policy claims
We calculate and maintain reserves for the future payment of claims to our policyholders based on actuarial assumptions. For all our insurance products, we establish an active life reserve, a liability for due and unpaid claims, claims in the course of settlement and incurred but not reported claims. In addition, for our health insurance business, we establish a reserve for the present value of amounts not yet due on claims. Many factors can affect these reserves and liabilities, such as economic and social conditions, inflation, hospital and pharmaceutical costs, changes in doctrines of legal liability and extra-contractual damage awards. Therefore, our reserves and liabilities are necessarily based on numerous estimates and assumptions as well as historical experience. Establishing reserves is an uncertain process, and it is possible that actual claims will materially exceed our reserves and have a material adverse effect on our results of operations and financial condition. For example, our long-term care policy claims may be paid over a long period of time and, therefore, loss estimates have a higher degree of uncertainty.
The following summarizes the components of the reserves related to our long-term care business in our Bankers Life segment as well as the long-term care reserves ceded to BRe as of December 31, 2014 and 2013 (dollars in millions):
|
| | | | | | | | |
| | | 2014 | | 2013 |
| Amounts classified as future policy benefits: | | | | |
| Active life reserves | | $ | 3,634.5 |
| | $ | 3,547.9 |
|
| Reserves for the present value of amounts not yet due on claims | | 1,279.7 |
| | 1,256.8 |
|
| Future loss reserves | | 120.1 |
| | 98.1 |
|
| Premium deficiency reserves related to reinsurance transaction | | — |
| | 96.9 |
|
| Premium deficiency reserves assuming net unrealized gains had been realized | | 350.9 |
| | — |
|
| Amounts classified as liability for policy and contract claims: | | | | |
| Liability for due and unpaid claims, claims in the course of settlement and incurred but not reported claims | | 185.1 |
| | 187.8 |
|
| Total | | 5,570.3 |
| | 5,187.5 |
|
| Reinsurance receivables | | 490.1 |
| | 494.5 |
|
| Long-term care reserves, net of reinsurance receivables | | $ | 5,080.2 |
| | $ | 4,693.0 |
|
The significant assumptions used to calculate the active life reserves include morbidity, persistency and investment yields. These assumptions are determined at the issuance date and do not change over the life of the policy.
The significant assumptions used to calculate the reserves for the present value of amounts not yet due on claims include future benefit payments, interest rates and claim continuance patterns. Interest rates are used to determine the present value of the future benefit payments and are based on the investment yield of assets supporting the reserves. Claim continuance assumptions are estimates of the expected period of time that claim payments will continue before termination due to recovery, death or attainment of policy maximum benefits. These estimates are based on historical claim experience for similar policy and coverage types. Our estimates of benefit payments, interest rates and claim continuance are reviewed regularly and updated to consider current portfolio investment yields and recent claims experience.
In December 2013, two of our insurance subsidiaries with long-term care business in our former Other CNO Business segment entered into 100% coinsurance agreements ceding $495 million of long-term care reserves to BRe. Pursuant to the agreements, the Company paid an additional premium of $96.9 million to BRe and an amount equal to the related net liabilities. We recognized a premium deficiency reserve of $96.9 million at December 31, 2013. Such deficiency reserve was no longer required when the additional premium was paid to BRe in conjunction with its assumption of the liabilities related to this block.
With respect to the long-term care block in our Bankers Life segment, the aggregate liability is not deficient, but our projections of estimated future profits (losses) indicate that profits will be recognized in earlier periods, followed by losses in later periods. In this situation, we are required to recognize future loss reserves. Such reserves are calculated based on our current estimate of the amount necessary to offset the losses in future periods and are established during the period the block is profitable. We estimate the future losses based on our current best estimates of morbidity, persistency, premium rates, maintenance expense and investment yields, which estimates are generally updated annually. During 2014, we increased the future loss reserves related to our long-term care blocks of business by $22.0 million based on these calculations.
The significant assumptions used to calculate the liability for due and unpaid claims, claims in the course of settlement and incurred but not reported claims are based on historical claim payment patterns and include assumptions related to the number of claims and the size and timing of claim payments. These assumptions are updated quarterly to reflect the most current information regarding claim payment patterns. In order to determine the accuracy of our prior estimates, we calculate the total redundancy (deficiency) of our prior claim reserve estimates. The 2013 claim reserve redundancy for long-term care claim reserves in our Bankers Life segment, as measured at December 31, 2014, was $21.2 million.
Estimates of unpaid losses related to long-term care business have a higher degree of uncertainty than estimates for our other products due to the range of ultimate duration of these claims and the resulting variability in their cost (in addition to the variations in the lag time in reporting claims). As an example, an increase in the loss ratio of 5 percentage points for claims incurred in 2014 related to our long-term care business in our Bankers Life segment would have resulted in an immediate decrease in our earnings of approximately $25 million. Our financial results depend significantly upon the extent to which our actual claims experience is consistent with the assumptions we used in determining our reserves and pricing our products. If our assumptions with respect to future claims are incorrect, and our reserves are insufficient to cover our actual losses and expenses, we would be required to increase our liabilities, which would negatively affect our operating results.
Accounting for certain marketing agreements
Bankers Life has entered into various distribution and marketing agreements with other insurance companies to use Bankers Life's career agents to distribute prescription drug and Medicare Advantage plans. These agreements allow Bankers Life to offer these products to current and potential future policyholders without investment in management and infrastructure. We receive fee income related to the plans sold through our distribution channels.
We account for these distribution agreements as follows:
| |
| • | We recognize distribution income based on either: (i) a fixed fee per contract sold; or (ii) a percentage of premiums collected. This fee income is recognized over the calendar year term of the contract. |
| |
| • | We also pay commissions to our agents who sell the plans. These payments are deferred and amortized over the term of the contract. |
The following summarizes the fee revenue, net of distribution expenses, earned through these marketing agreements (dollars in millions):
|
| | | | | | | | | | | |
| | 2014 | | 2013 | | 2012 |
| Fee revenue: | | | | | |
| Medicare Advantage contracts | $ | 22.4 |
| | $ | 16.1 |
| | $ | 12.4 |
|
| PDP contracts | 3.0 |
| | 2.3 |
| | 2.5 |
|
| Total revenue | 25.4 |
| | 18.4 |
| | 14.9 |
|
| Distribution expenses | 10.4 |
| | 7.1 |
| | 5.9 |
|
| Fee revenue, net of distribution expenses | $ | 15.0 |
| | $ | 11.3 |
| | $ | 9.0 |
|
Income Taxes
Our income tax expense includes deferred income taxes arising from temporary differences between the financial reporting and tax bases of assets and liabilities, capital loss carryforwards and NOLs. Deferred tax assets and liabilities are measured using enacted tax rates expected to apply in the years in which temporary differences are expected to be recovered or paid. The effect of a change in tax rates on deferred tax assets and liabilities is recognized in earnings in the period when the changes are enacted.
A reduction of the net carrying amount of deferred tax assets by establishing a valuation allowance is required if, based on the available evidence, it is more likely than not that such assets will not be realized. In assessing the need for a valuation allowance, all available evidence, both positive and negative, shall be considered to determine whether, based on the weight of that evidence, a valuation allowance for deferred tax assets is needed. This assessment requires significant judgment and considers, among other matters, the nature, frequency and severity of current and cumulative losses, forecasts of future
profitability, the duration of carryforward periods, our experience with operating loss and tax credit carryforwards expiring unused, and tax planning strategies. We evaluate the need to establish a valuation allowance for our deferred tax assets on an ongoing basis. The realization of our deferred tax assets depends upon generating sufficient future taxable income of the appropriate type during the periods in which our temporary differences become deductible and before our life and non-life NOLs expire.
Based on our assessment, it appears more likely than not that $799.8 million of our total deferred tax assets of $1,045.8 million will be realized through future taxable earnings. Accordingly, we have established a deferred tax valuation allowance of $246.0 million at December 31, 2014. We will continue to assess the need for a valuation allowance in the future. If future results are less than projected, an increase to the valuation allowance may be required to reduce the deferred tax asset, which could have a material impact on our results of operations in the period in which it is recorded.
We use a deferred tax valuation model to assess the need for a valuation allowance. Our model is adjusted to reflect changes in our projections of future taxable income including changes resulting from investment trading strategies, reinsurance transactions and the impact of the sale of CLIC. Our estimates of future taxable income are based on evidence we consider to be objective and verifiable.
At December 31, 2014, our projection of future taxable income for purposes of determining the valuation allowance is based on our adjusted average annual taxable income for the last three years plus: (i) a 3 percent core growth factor (consistent with the prior year assumption); and (ii) an additional 1 percent increase which primarily reflects the impact of the investment trading strategies completed in 2013 (which grade off over time). The aggregate 4 percent factor is used to increase taxable income annually over the next five years, and level taxable income is assumed thereafter. In the projections used for our December 31, 2014 analysis, our three year average taxable income increased to approximately $320 million, compared to $315 million in our prior projections. Approximately $50 million of the current three year average relates to non-life taxable income and $270 million relates to life income.
Based on our assessment, we recognized a reduction to the allowance for deferred tax assets of $48.8 million in 2014. We have evaluated the recovery of our deferred tax assets and assessed the effect of limitations and/or interpretations on their value and have concluded that it is more likely than not that the value recognized will be fully realized in the future.
Changes in our valuation allowance are summarized as follows (dollars in millions):
|
| | | | |
| Balance, December 31, 2011 | $ | 938.4 |
| |
| Decrease in 2012 | (171.5 | ) | (a) |
| Balance, December 31, 2012 | 766.9 |
| |
| Decrease in 2013 | (472.1 | ) | (b) |
| Balance, December 31, 2013 | 294.8 |
| |
| Decrease in 2014 | (48.8 | ) | (c) |
| Balance, December 31, 2014 | $ | 246.0 |
| |
___________________
| |
| (a) | The 2012 reduction to the deferred tax valuation allowance primarily resulted from the impact of recent higher levels of income when projecting future taxable income. |
| |
| (b) | The 2013 reduction to the deferred tax valuation allowance primarily resulted from the impact of higher levels of income on projected future taxable income, the expiration of capital loss carryforwards, a settlement with the IRS related to the classification of a portion of the cancellation of indebtedness income and the execution of certain investment trading strategies. |
| |
| (c) | The 2014 reduction to the deferred tax valuation allowance primarily resulted from tax examination adjustments and the tax gain on the sale of CLIC. |
Recovery of our deferred tax asset is dependent on achieving the level of future taxable income projected in our deferred tax valuation model and failure to do so could result in an increase in the valuation allowance in a future period. Any future increase in the valuation allowance may result in additional income tax expense and reduce shareholders' equity, and such an increase could have a significant impact upon our earnings in the future.
The Code limits the extent to which losses realized by a non-life entity (or entities) may offset income from a life insurance company (or companies) to the lesser of: (i) 35 percent of the income of the life insurance company; or (ii) 35
percent of the total loss of the non-life entities (including NOLs of the non-life entities). There is no similar limitation on the extent to which losses realized by a life insurance entity (or entities) may offset income from a non-life entity (or entities). This limitation is the primary reason a valuation allowance for non-life NOL carryforwards is required.
Section 382 of the Code imposes limitations on a corporation's ability to use its NOLs when the company undergoes an ownership change. Future transactions and the timing of such transactions could cause an ownership change for Section 382 income tax purposes. Such transactions may include, but are not limited to, additional repurchases under our securities repurchase program, issuances of common stock and acquisitions or sales of shares of CNO stock by certain holders of our shares, including persons who have held, currently hold or may accumulate in the future five percent or more of our outstanding common stock for their own account. Many of these transactions are beyond our control. If an additional ownership change were to occur for purposes of Section 382, we would be required to calculate an annual restriction on the use of our NOLs to offset future taxable income. The annual restriction would be calculated based upon the value of CNO's equity at the time of such ownership change, multiplied by a federal long-term tax exempt rate (2.80 percent at December 31, 2014), and the annual restriction could limit our ability to use a substantial portion of our NOLs to offset future taxable income. We regularly monitor ownership change (as calculated for purposes of Section 382) and, as of December 31, 2014, we were below the 50 percent ownership change level that would trigger further impairment of our ability to utilize our NOLs.
As of December 31, 2014, we had $3.0 billion of federal NOLs. The following table summarizes the expiration dates of our loss carryforwards assuming the IRS ultimately agrees with the position we have taken with respect to the loss on our investment in Conseco Senior Health Insurance Company ("CSHI") (dollars in millions):
|
| | | | | | | | | | | | |
| Year of expiration | | Net operating loss carryforwards | | Total loss |
| | | Life | | Non-life | | carryforwards |
| 2022 | | $ | 112.1 |
| | $ | — |
| | $ | 112.1 |
|
| 2023 | | 742.6 |
| | 1,983.0 |
| | 2,725.6 |
|
| 2025 | | — |
| | 91.5 |
| | 91.5 |
|
| 2026 | | — |
| | 207.4 |
| | 207.4 |
|
| 2027 | | — |
| | 4.9 |
| | 4.9 |
|
| 2028 | | — |
| | 203.7 |
| | 203.7 |
|
| 2029 | | — |
| | 146.6 |
| | 146.6 |
|
| 2032 | | — |
| | 44.0 |
| | 44.0 |
|
| Subtotal | | 854.7 |
| | 2,681.1 |
| | 3,535.8 |
|
| Less: | | | | | | |
| Unrecognized tax benefits | | (342.9 | ) | | (197.4 | ) | | (540.3 | ) |
| Total | | $ | 511.8 |
| | $ | 2,483.7 |
| | $ | 2,995.5 |
|
We had deferred tax assets related to NOLs for state income taxes of $15.2 million and $20.0 million at December 31, 2014 and 2013, respectively. The related state NOLs are available to offset future state taxable income in certain states through 2025.
We recognized an $878 million ordinary loss on our investment in CSHI which was worthless when it was transferred to an independent trust in 2008. Of this loss, $742 million has been reported as a life loss and $136 million as a non-life loss. The IRS has disagreed with our ordinary loss treatment and believes that it should be treated as a capital loss, subject to a five year carryover. We are seeking resolution of this matter through early referral to appeals, a process that seeks to resolve disputes with the IRS. If the IRS position is ultimately determined to be correct, $473 million would have expired unused in 2013. Due to this uncertainty, we have not recognized a tax benefit of $166.0 million. However, if this unrecognized tax benefit had been recognized, we would also have established a valuation allowance of $34.0 million at December 31, 2014.
A reconciliation of the beginning and ending amount of unrecognized tax benefits for the years ended December 31, 2014 and 2013 is as follows (dollars in millions):
|
| | | | | | | |
| | Years ended December 31, |
| | 2014 | | 2013 |
| | | | |
| Balance at beginning of year | $ | 226.7 |
| | $ | 310.5 |
|
| Increase based on tax positions taken in prior years | 10.9 |
| | 35.6 |
|
| Decrease based on tax positions taken in prior years | — |
| | (27.0 | ) |
| Increase based on tax positions taken in the current year | — |
| | 47.6 |
|
| Decrease in unrecognized tax benefits related to settlements with taxing authorities | (8.9 | ) | | (140.0 | ) |
| Balance at end of year | $ | 228.7 |
| | $ | 226.7 |
|
As of December 31, 2014 and 2013, $155.4 million and $156.0 million, respectively, of our unrecognized tax benefits, if recognized, would affect the effective tax rate. The remaining balances relate to timing differences which, if recognized, would have no effect on the Company's tax expense. The Company recognizes interest related to unrecognized tax benefits as income tax expense in the consolidated statement of operations. Such amounts were not significant in each of the three years ended December 31, 2014. The liability for accrued interest was $2.4 million and $1.8 million at December 31, 2014 and 2013, respectively.
Tax years 2004 and 2008 through 2014 are open to examination by the IRS. The Company's various state income tax returns are generally open for tax years 2011 through 2014 based on the individual state statutes of limitation. Generally, for tax years which generate NOLs, capital losses or tax credit carryforwards, the statute of limitations does not close until the expiration of the statute of limitations for the tax year in which such carryforwards are utilized.
Liabilities for Insurance Products
At December 31, 2014, the total balance of our liabilities for insurance products was $22.3 billion. These liabilities are generally payable over an extended period of time and the profitability of the related products is dependent on the pricing of the products and other factors. Differences between our expectations when we sold these products and our actual experience could result in future losses.
We calculate and maintain reserves for the future payment of claims to our policyholders based on actuarial assumptions. For our insurance products, we establish an active life reserve, a liability for due and unpaid claims, claims in the course of settlement and incurred but not reported claims. In addition, for our health insurance business, we establish a reserve for the present value of amounts not yet due on claims. Many factors can affect these reserves and liabilities, such as economic and social conditions, inflation, hospital and pharmaceutical costs, changes in doctrines of legal liability and extra-contractual damage awards. We establish liabilities for annuity and interest-sensitive life products equal to the accumulated policy account values, which include an accumulation of deposit payments plus credited interest, less withdrawals and the amounts assessed against the policyholder through the end of the period. In addition, policyholder account values for certain interest-sensitive life products are impacted by our assumptions related to changes of certain NGEs that we are allowed to make under the terms of the policy, such as cost of insurance charges, expense loads, credited interest rates and policyholder bonuses. Therefore, our reserves and liabilities are necessarily based on numerous estimates and assumptions as well as historical experience. Establishing reserves is an uncertain process, and it is possible that actual claims will materially exceed our reserves and have a material adverse effect on our results of operations and financial condition. Our financial results depend significantly upon the extent to which our actual claims experience is consistent with the assumptions we used in determining our reserves and pricing our products. If our assumptions with respect to future claims are incorrect, and our reserves are insufficient to cover our actual losses and expenses, we would be required to increase our liabilities, which would negatively affect our operating results. Liabilities for insurance products are calculated using management's best judgments, based on our past experience and standard actuarial tables, of mortality, morbidity, lapse rates, investment experience and expense levels.
Accounting for Long-term Care Premium Rate Increases
Many of our long-term care policies have been subject to premium rate increases. In some cases, these premium rate increases were materially consistent with the assumptions we used to value the particular block of business at the Effective
Date. With respect to certain premium rate increases, some of our policyholders were provided an option to cease paying their premiums and receive a non-forfeiture option in the form of a paid-up policy with limited benefits. In addition, our policyholders could choose to reduce their coverage amounts and premiums in the same proportion, when permitted by our contracts or as required by regulators. The following describes how we account for these policyholder options:
| |
| • | Premium rate increases - If premium rate increases reflect a change in our previous rate increase assumptions, the new assumptions are not reflected prospectively in our reserves. Instead, the additional premium revenue resulting from the rate increase is recognized as earned and original assumptions continue to be used to determine changes to liabilities for insurance products unless a premium deficiency exists. |
| |
| • | Benefit reductions - If there is a premium rate increase on one of our long-term care policies, a policyholder may choose reduced coverage with a proportionate reduction in premium, when permitted by our contracts. This option does not require additional underwriting. Benefit reductions are treated as a partial lapse of coverage, and the balance of our reserves and deferred insurance acquisition costs is reduced in proportion to the reduced coverage. |
| |
| • | Non-forfeiture benefits offered in conjunction with a rate increase - In some cases, non-forfeiture benefits are offered to policyholders who wish to lapse their policies at the time of a significant rate increase. In these cases, exercise of this option is treated as an extinguishment of the original contract and issuance of a new contract. The balance of our reserves and deferred insurance acquisition costs are released, and a reserve for the new contract is established. |
Some of our policyholders may receive a non-forfeiture benefit if they cease paying their premiums pursuant to their original contract (or pursuant to changes made to their original contract as a result of a litigation settlement made prior to the Effective Date or an order issued by the Florida Office of Insurance Regulation). In these cases, exercise of this option is treated as the exercise of a policy benefit, and the reserve for premium paying benefits is reduced, and the reserve for the non-forfeiture benefit is adjusted to reflect the election of this benefit.
Liabilities for Loss Contingencies Related to Lawsuits
The Company and its subsidiaries are involved in various legal actions in the normal course of business, in which claims for compensatory and punitive damages are asserted, some for substantial amounts. We recognize an estimated loss from these loss contingencies when we believe it is probable that a loss has been incurred and the amount of the loss can be reasonably estimated. Some of the pending matters have been filed as purported class actions and some actions have been filed in certain jurisdictions that permit punitive damage awards that are disproportionate to the actual damages incurred. The amounts sought in certain of these actions are often large or indeterminate and the ultimate outcome of certain actions is difficult to predict. In the event of an adverse outcome in one or more of these matters, there is a possibility that the ultimate liability may be in excess of the liabilities we have established and could have a material adverse effect on our business, financial condition, results of operations and cash flows. In addition, the resolution of pending or future litigation may involve modifications to the terms of outstanding insurance policies or could impact the timing and amount of rate increases, which could adversely affect the future profitability of the related insurance policies. Based upon information presently available, and in light of legal, factual and other defenses available to the Company and its subsidiaries, the Company does not believe that it is probable that the ultimate liability from either pending or threatened legal actions, after consideration of existing loss provisions, will have a material adverse effect on the Company's consolidated financial condition, operating results or cash flows. However, given the inherent difficulty in predicting the outcome of legal proceedings, there exists the possibility such legal actions could have a material adverse effect on the Company's consolidated financial condition, operating results or cash flows.
In addition to the inherent difficulty of predicting litigation outcomes, particularly those that will be decided by a jury, many of these matters purport to seek substantial or an unspecified amount of damages for unsubstantiated conduct spanning several years based on complex legal theories and damages models. The alleged damages typically are indeterminate or not factually supported in the complaint, and, in any event, the Company's experience indicates that monetary demands for damages often bear little relation to the ultimate loss. In some cases, plaintiffs are seeking to certify classes in the litigation and class certification either has been denied or is pending and we have filed oppositions to class certification or sought to decertify a prior class certification. In addition, for many of these cases: (i) there is uncertainty as to the outcome of pending appeals or motions; (ii) there are significant factual issues to be resolved; and/or (iii) there are novel legal issues presented. Accordingly, the Company cannot reasonably estimate the possible loss or range of loss in excess of amounts accrued, if any, or predict the timing of the eventual resolution of these matters. The Company reviews these matters on an ongoing basis. When assessing reasonably possible and probable outcomes, the Company bases its assessment on the expected ultimate outcome following all appeals.
RESULTS OF OPERATIONS
The following tables and narratives summarize the operating results of our segments (dollars in millions):
|
| | | | | | | | | | | |
| | 2014 | | 2013 | | 2012 |
| Pre-tax operating earnings (a non-GAAP measure) (a): | | | | | |
| Bankers Life | $ | 386.9 |
| | $ | 310.5 |
| | $ | 300.9 |
|
| Washington National | 111.2 |
| | 140.6 |
| | 148.8 |
|
| Colonial Penn | .8 |
| | (12.5 | ) | | (8.6 | ) |
| Corporate operations | (71.5 | ) | | (48.5 | ) | | (76.5 | ) |
| Other CNO Business | — |
| | (27.6 | ) | | (29.7 | ) |
| | 427.4 |
| | 362.5 |
| | 334.9 |
|
| Gain (loss) on reinsurance transactions: | | | | | |
| Bankers Life | 26.1 |
| | — |
| | — |
|
| Washington National | 3.8 |
| | — |
| | — |
|
| Other CNO Business | — |
| | (98.4 | ) | | — |
|
| | 29.9 |
| | (98.4 | ) | | — |
|
| Net realized investment gains (losses), net of related amortization: | | | | | |
| Bankers Life | 7.8 |
| | 15.1 |
| | 48.7 |
|
| Washington National | 33.9 |
| | 11.8 |
| | 23.9 |
|
| Colonial Penn | 1.1 |
| | .4 |
| | 7.2 |
|
| Corporate operations | (9.9 | ) | | (1.5 | ) | | 1.8 |
|
| | 32.9 |
| | 25.8 |
| | 81.6 |
|
| Fair value changes in embedded derivative liabilities, net of related amortization: | | | | | |
| Bankers Life | (35.6 | ) | | 34.8 |
| | (2.8 | ) |
| Washington National | (.4 | ) | | .6 |
| | — |
|
| | (36.0 | ) | | 35.4 |
| | (2.8 | ) |
| Fair value changes related to agent deferred compensation plan: | | | | | |
| Corporate operations | (26.8 | ) | | 15.8 |
| | (10.0 | ) |
| Equity in earnings of certain non-strategic investments and earnings attributable to VIEs: | | | | | |
| Corporate operations | (8.0 | ) | | (10.2 | ) | | — |
|
| Net revenue pursuant to transition and support services agreements, net of taxes | | | | | |
| Corporate operations | 2.6 |
| | — |
| | — |
|
| Loss on extinguishment or modification of debt: | | | | | |
| Corporate operations | (.6 | ) | | (65.4 | ) | | (200.2 | ) |
| Amounts related to CLIC prior to being sold: | | | | | |
| Earnings of CLIC prior to being sold | 23.4 |
| | 39.3 |
| | (47.8 | ) |
| Loss on sale of CLIC | (269.7 | ) | | — |
| | — |
|
| | (246.3 | ) | | 39.3 |
| | (47.8 | ) |
| Income (loss) before income taxes: | | | | | |
| Bankers Life | 385.2 |
| | 360.4 |
| | 346.8 |
|
| Washington National | 148.5 |
| | 153.0 |
| | 172.7 |
|
| Colonial Penn | 1.9 |
| | (12.1 | ) | | (1.4 | ) |
| Corporate operations | (114.2 | ) | | (109.8 | ) | | (284.9 | ) |
| Other CNO Business | — |
| | (126.0 | ) | | (29.7 | ) |
| Amount related to CLIC prior to being sold | (246.3 | ) | | 39.3 |
| | (47.8 | ) |
| Income before income taxes | $ | 175.1 |
| | $ | 304.8 |
| | $ | 155.7 |
|
____________________
| |
| (a) | These non-GAAP measures as presented in the above table and in the following segment financial data and discussions of segment results exclude the net loss on the sale of CLIC and gain on reinsurance transactions, the earnings of CLIC prior to being sold, net realized investment gains (losses), fair value changes in embedded derivative liabilities, net of related amortization, equity in earnings of certain non-strategic investments and earnings attributable to VIEs, net revenue pursuant to transition and support services agreements, loss on extinguishment or modification of debt and before income taxes. These are considered non-GAAP financial measures. A non-GAAP measure is a numerical measure of a company's performance, financial position, or cash flows that excludes or includes amounts that are normally excluded or included in the most directly comparable measure calculated and presented in accordance with GAAP. |
These non-GAAP financial measures of "pre-tax operating earnings" differ from "income (loss) before income taxes" as presented in our consolidated statement of operations prepared in accordance with GAAP due to the exclusion of the net loss on the sale of CLIC and gain on reinsurance transactions, the earnings of CLIC prior to being sold, realized investment gains (losses), fair value changes in embedded derivative liabilities, net of related amortization, equity in earnings of certain non-strategic investments and earnings attributable to VIEs, net revenue pursuant to transition and support services agreements and loss on extinguishment or modification of debt. We measure segment performance excluding these items because we believe that this performance measure is a better indicator of the ongoing businesses and trends in our business. Our primary investment focus is on investment income to support our liabilities for insurance products as opposed to the generation of realized investment gains (losses), and a long-term focus is necessary to maintain profitability over the life of the business. Realized investment gains (losses), fair value changes in embedded derivative liabilities and equity in earnings of certain non-strategic investments and earnings attributable to VIEs depend on market conditions and do not necessarily relate to decisions regarding the underlying business of our segments. However, "pre-tax operating earnings" does not replace "income (loss) before income taxes" as a measure of overall profitability.
We may experience realized investment gains (losses), which will affect future earnings levels since our underlying business is long-term in nature and we need to earn the assumed interest rates on the investments backing our liabilities for insurance products to maintain the profitability of our business. In addition, management uses this non-GAAP financial measure in its budgeting process, financial analysis of segment performance and in assessing the allocation of resources. We believe these non-GAAP financial measures enhance an investor's understanding of our financial performance and allows them to make more informed judgments about the Company as a whole. These measures also highlight operating trends that might not otherwise be transparent. The table above reconciles the non-GAAP measure to the corresponding GAAP measure.
General: CNO is the top tier holding company for a group of insurance companies operating throughout the United States that develop, market and administer health insurance, annuity, individual life insurance and other insurance products. We distribute these products through our Bankers Life segment, which utilizes a career agency force, through our Washington National segment, which utilizes independent producers and through our Colonial Penn segment, which utilizes direct response marketing.
Bankers Life (dollars in millions)
|
| | | | | | | | | | | |
| | 2014 | | 2013 | | 2012 |
| Premium collections: | | | | | |
| Annuities | $ | 782.3 |
| | $ | 744.1 |
| | $ | 709.0 |
|
| Medicare supplement and other supplemental health | 1,275.1 |
| | 1,317.8 |
| | 1,323.9 |
|
| Life | 424.9 |
| | 368.3 |
| | 314.6 |
|
| Total collections | $ | 2,482.3 |
| | $ | 2,430.2 |
| | $ | 2,347.5 |
|
| Average liabilities for insurance products: | | | | | |
|
| Fixed index annuities | $ | 3,636.7 |
| | $ | 3,185.8 |
| | $ | 2,831.5 |
|
| Fixed interest annuities | 3,845.0 |
| | 4,137.2 |
| | 4,407.2 |
|
| SPIAs and supplemental contracts: | | | | | |
| Mortality based | 202.8 |
| | 221.5 |
| | 231.7 |
|
| Deposit based | 149.1 |
| | 156.5 |
| | 162.5 |
|
| Health: | | | | | |
| Long-term care | 4,735.4 |
| | 4,632.2 |
| | 4,370.0 |
|
| Medicare supplement | 331.0 |
| | 332.4 |
| | 334.2 |
|
| Other health | 47.5 |
| | 45.4 |
| | 43.9 |
|
| Life: | | | | | |
| Interest sensitive | 564.7 |
| | 490.4 |
| | 448.9 |
|
| Non-interest sensitive | 782.1 |
| | 610.6 |
| | 499.3 |
|
| Total average liabilities for insurance products, net of reinsurance ceded | $ | 14,294.3 |
| | $ | 13,812.0 |
| | $ | 13,329.2 |
|
| Revenues: | | | | | |
|
| Insurance policy income | $ | 1,651.7 |
| | $ | 1,648.7 |
| | $ | 1,657.4 |
|
| Net investment income: | | | | | |
| General account invested assets | 895.4 |
| | 854.0 |
| | 817.6 |
|
| Fixed index products | 61.9 |
| | 151.7 |
| | 21.3 |
|
| Fee revenue and other income | 29.3 |
| | 19.0 |
| | 15.2 |
|
| Total revenues | 2,638.3 |
| | 2,673.4 |
| | 2,511.5 |
|
| Expenses: | | | | | |
| Insurance policy benefits | 1,427.7 |
| | 1,447.5 |
| | 1,415.0 |
|
| Amounts added to policyholder account balances: | | | | | |
| Cost of interest credited to policyholders | 127.2 |
| | 141.9 |
| | 155.0 |
|
| Cost of options to fund index credits, net of forfeitures | 49.2 |
| | 47.4 |
| | 51.1 |
|
| Market value changes credited to policyholders | 63.5 |
| | 151.9 |
| | 21.8 |
|
| Amortization related to operations | 174.7 |
| | 187.5 |
| | 187.6 |
|
| Interest expense on investment borrowings | 7.9 |
| | 6.7 |
| | 5.3 |
|
| Other operating costs and expenses | 401.2 |
| | 380.0 |
| | 374.8 |
|
| Total benefits and expenses | 2,251.4 |
| | 2,362.9 |
| | 2,210.6 |
|
| Income before gain on reinsurance transaction, net realized investment gains (losses), net of related amortization, and fair value changes in embedded derivative liabilities, net of related amortization, and income taxes | 386.9 |
| | 310.5 |
| | 300.9 |
|
| Gain on reinsurance transaction | 26.1 |
| | — |
| | — |
|
| Net realized investment gains | 8.3 |
| | 16.3 |
| | 53.0 |
|
| Amortization related to net realized investment gains | (.5 | ) | | (1.2 | ) | | (4.3 | ) |
| Net realized investment gains, net of related amortization | 7.8 |
| | 15.1 |
| | 48.7 |
|
| Insurance policy benefits - fair value changes in embedded derivative liabilities | (47.0 | ) | | 51.7 |
| | (4.5 | ) |
| Amortization related to fair value changes in embedded derivative liabilities | 11.4 |
| | (16.9 | ) | | 1.7 |
|
| Fair value changes in embedded derivative liabilities, net of related amortization | (35.6 | ) | | 34.8 |
| | (2.8 | ) |
| Income before income taxes | $ | 385.2 |
| | $ | 360.4 |
| | $ | 346.8 |
|
|
| | | | | | | | | | | |
| | 2014 | | 2013 | | 2012 |
| Health benefit ratios: | | | | | |
| All health lines: | | | | | |
| Insurance policy benefits | $ | 1,190.6 |
| | $ | 1,214.0 |
| | $ | 1,196.7 |
|
| Benefit ratio (a) | 92.5 | % | | 92.6 | % | | 89.1 | % |
| Medicare supplement: | | | | | |
| Insurance policy benefits | $ | 529.3 |
| | $ | 509.0 |
| | $ | 508.5 |
|
| Benefit ratio (a) | 68.4 | % | | 67.1 | % | | 69.0 | % |
| PDP: | | | | | |
| Insurance policy benefits | $ | 5.3 |
| | $ | 15.9 |
| | $ | 35.6 |
|
| Benefit ratio (a) | 77.9 | % | | 80.5 | % | | 71.4 | % |
| Long-term care: | | | | | |
| Insurance policy benefits | $ | 656.0 |
| | $ | 689.2 |
| | $ | 653.1 |
|
| Benefit ratio (a) | 129.7 | % | | 129.3 | % | | 117.6 | % |
| Interest-adjusted benefit ratio (b) | 77.2 | % | | 80.6 | % | | 71.2 | % |
______________
| |
| (a) | We calculate benefit ratios by dividing the related product's insurance policy benefits by insurance policy income. |
| |
| (b) | We calculate the interest-adjusted benefit ratio (a non-GAAP measure) for Bankers Life's long-term care products by dividing such product's insurance policy benefits less the imputed interest income on the accumulated assets backing the insurance liabilities by policy income. These are considered non-GAAP financial measures. A non-GAAP measure is a numerical measure of a company's performance, financial position, or cash flows that excludes or includes amounts that are normally excluded or included in the most directly comparable measure calculated and presented in accordance with GAAP. |
These non-GAAP financial measures of "interest-adjusted benefit ratios" differ from "benefit ratios" due to the deduction of imputed interest income on the accumulated assets backing the insurance liabilities from the product's insurance policy benefits used to determine the ratio. Interest income is an important factor in measuring the performance of health products that are expected to be inforce for a longer duration of time, are not subject to unilateral changes in provisions (such as non-cancelable or guaranteed renewable contracts) and require the performance of various functions and services (including insurance protection) for an extended period of time. The net cash flows from long-term care products generally cause an accumulation of amounts in the early years of a policy (accounted for as reserve increases) that will be paid out as benefits in later policy years (accounted for as reserve decreases). Accordingly, as the policies age, the benefit ratio will typically increase, but the increase in benefits will be partially offset by the imputed interest income earned on the accumulated assets. The interest-adjusted benefit ratio reflects the effects of such interest income offset (which is equal to the tabular interest on the related insurance liabilities). Since interest income is an important factor in measuring the performance of this product, management believes a benefit ratio that includes the effect of interest income is useful in analyzing product performance. We utilize the interest-adjusted benefit ratio in measuring segment performance because we believe that this performance measure is a better indicator of the ongoing businesses and trends in the business. However, the "interest-adjusted benefit ratio" does not replace the "benefit ratio" as a measure of current period benefits to current period insurance policy income. Accordingly, management reviews both "benefit ratios" and "interest-adjusted benefit ratios" when analyzing the financial results attributable to these products. The imputed investment income earned on the accumulated assets backing Bankers Life's long-term care reserves was $265.5 million, $259.5 million and $257.8 million in 2014, 2013 and 2012, respectively.
The Bankers Life segment included approximately $5.5 million of additional pre-tax earnings in the last six months of 2014 from the recapture of a block of life insurance business previously ceded to Wilton Re.
Total premium collections were $2,482.3 million in 2014, up 2.1 percent from 2013, and $2,430.2 million in 2013, up 3.5 percent from 2012. See "Premium Collections" for further analysis of Bankers Life's premium collections.
Average liabilities for insurance products, net of reinsurance ceded were $14.3 billion in 2014, up 3.5 percent from 2013 and $13.8 billion in 2013, up 3.6 percent from 2012. Such average insurance liabilities for certain long-term care products were increased by $126 million, $159 million and $145 million in 2014, 2013 and 2012, respectively, to reflect the premium deficiencies that would exist if unrealized gains on the assets backing such products had been realized and the proceeds from the sales of such assets were invested at then current yields. Such increase is reflected as a reduction of accumulated other comprehensive income. In addition, the increase in the non-interest sensitive life reserves in 2014 reflects approximately $155 million of reserves related to the recapture in July 2014 of a block of life insurance business previously ceded to Wilton Re. Excluding the impact of the aforementioned items, the increase in average liabilities for insurance products was primarily due to new sales and the amounts added to policyholder account balances on interest-sensitive products.
Insurance policy income is comprised of premiums earned on policies which provide mortality or morbidity coverage and fees and other charges assessed on other policies. Insurance policy income included premium revenue of $6.8 million, $19.7 million and $49.9 million in 2014, 2013 and 2012, respectively, related to our PDP quota-share reinsurance agreement with Coventry. In August 2013, we received a notice of Coventry's intent to terminate our PDP quota-share reinsurance agreement, as further described in the note to the consolidated financial statements entitled "Summary of Significant Accounting Policies - Reinsurance". The PDP premiums collected in 2014 represent adjustments to premiums on such business related to periods prior to the termination of the agreement. Partially offsetting the decrease in premium income from the PDP business in 2013 was higher premium income and policyholder charges from our life insurance products.
Net investment income on general account invested assets (which excludes income on policyholder accounts) increased 4.8 percent, to $895.4 million, in 2014 and 4.5 percent, to $854.0 million, in 2013. The increase in net investment income is due to: (i) the impact of favorable experience resulting in prospective changes in assumptions which increased the yield on certain structured securities in 2014; and (ii) higher general account invested assets. The increase in general account invested assets has resulted from: (i) sales and persistency of our annuity and health products in recent periods; and (ii) the proceeds from $50 million and $250 million in 2014 and 2013, respectively, of additional collateralized borrowings from the FHLB pursuant to an investment borrowing program. Prepayment income was $16.9 million, $13.4 million and $11.6 million in 2014, 2013 and 2012, respectively.
Net investment income related to fixed index products represents the change in the estimated fair value of options which are purchased in an effort to offset or hedge certain potential benefits accruing to the policyholders of our fixed index products. Our fixed index products are designed so that investment income spread is expected to be more than adequate to cover the cost of the options and other costs related to these policies. Net investment income related to fixed index products was $61.9 million, $151.7 million and $21.3 million in 2014, 2013 and 2012, respectively. Such amounts were mostly offset by the corresponding charge (credit) to amounts added to policyholder account balances - market value changes credited to policyholders. Such income and related charges fluctuate based on the value of options embedded in the segment's fixed index annuity policyholder account balances subject to this benefit and to the performance of the index to which the returns on such products are linked.
Fee revenue and other income was $29.3 million in 2014, compared to $19.0 million in 2013, and $15.2 million in 2012. We recognized fee income of $25.4 million, $18.4 million and $14.9 million in 2014, 2013 and 2012, respectively, pursuant to marketing agreements to sell PDP and Medicare Advantage products of other insurance companies. In 2014, we also received a $3 million settlement from Coventry related to the termination of our PDP quota-share agreement.
Insurance policy benefits fluctuated as a result of the factors summarized below for benefit ratios. Benefit ratios are calculated by dividing the related insurance product’s insurance policy benefits by insurance policy income.
The Medicare supplement business consists of both individual and group policies. Government regulations generally require us to attain and maintain a ratio of total benefits incurred to total premiums earned (excluding changes in policy benefit reserves), after three years from the original issuance of the policy and over the lifetime of the policy, of not less than 65 percent on individual products and not less than 75 percent on group products, as determined in accordance with statutory accounting principles. Since the insurance product liabilities we establish for Medicare supplement business are subject to significant estimates, the ultimate claim liability we incur for a particular period is likely to be different than our initial estimate. Our benefit ratios were 68.4 percent, 67.1 percent and 69.0 percent in 2014, 2013 and 2012, respectively. Our insurance policy benefits reflected reserve redundancies from prior years of $2.3 million, $10.3 million and $13.7 million in 2014, 2013 and 2012, respectively. Excluding the effects of prior period claim reserve redundancies, our benefit ratios would have been 68.7 percent, 68.5 percent and 70.8 percent in 2014, 2013 and 2012, respectively. We currently expect the benefit ratio on this Medicare supplement business to be in the 70 percent range in 2015.
The insurance policy benefits on our PDP business result from our quota-share reinsurance agreement with Coventry. Insurance margins (insurance policy income less insurance policy benefits) on the PDP business were $1.5 million, $3.8 million and $14.3 million in 2014, 2013 and 2012, respectively. In August 2013, we received a notice of Coventry's intent to terminate our PDP quota-share reinsurance agreement, as further described in the note to the consolidated financial statements entitled "Summary of Significant Accounting Policies - Reinsurance". As a result, there was no PDP business recognized in the third and fourth quarters of 2013. The PDP results in 2014 represent adjustments to earnings on such business related to periods prior to the termination of the agreement.
The net cash flows from our long-term care products generally cause an accumulation of amounts in the early years of a policy (accounted for as reserve increases) which will be paid out as benefits in later policy years (accounted for as reserve decreases). Accordingly, as the policies age, the benefit ratio typically increases, but the increase in reserves is partially offset by investment income earned on the accumulated assets. The benefit ratio on our long-term care business in the Bankers Life segment was 129.7 percent, 129.3 percent and 117.6 percent in 2014, 2013 and 2012, respectively. The interest-adjusted benefit ratio on this business was 77.2 percent, 80.6 percent and 71.2 percent in 2014, 2013 and 2012, respectively. The benefit ratio in 2014 reflects $2.8 million of reserve releases related to the use of a new process to identify changes in the status of our insureds in a more timely manner. The benefit ratio in 2013 increased due to higher persistency and higher incurred claims as the business continues to age and as new business becomes less of a component of the overall inforce business. In addition, we recognized an out-of-period adjustment of $6.7 million in the first quarter of 2013 and made certain refinements to reserving methodologies of $3.5 million in the second quarter of 2013, both of which increased insurance policy benefits. We currently expect the interest-adjusted benefit ratio on this long-term care business to be in the 81 percent range in 2015. Since the insurance product liabilities we establish for long-term care business are subject to significant estimates, the ultimate claim liability we incur for a particular period is likely to be different than our initial estimate. Our insurance policy benefits reflected reserve redundancies from prior years of $21.2 million, $17.9 million and $26.6 million in 2014, 2013 and 2012, respectively. Excluding the effects of prior year claim reserve redundancies, our benefit ratios would have been 133.8 percent, 132.7 percent and 122.4 percent in 2014, 2013 and 2012, respectively. When policies lapse, active life reserves for such lapsed policies are released, resulting in decreased insurance policy benefits (although such decrease is somewhat offset by additional amortization expense).
In 2013 and 2012, the income before income taxes in the Bankers Life segment reflected a reduction in insurance policy benefits partially offset by additional amortization of insurance acquisition costs due to the impacts of recent rate increases. These impacts netted to approximately $4 million in 2013 and $18 million in 2012 and included: (i) the reduction in liabilities for policyholders choosing to lapse their policies rather than paying higher rates; (ii) the reduction in liabilities for policyholders choosing to reduce their coverages to achieve a lower cost; offset by (iii) the increase in the liabilities related to waiver of premium benefits to reflect higher premiums after the rate increases; and (iv) increased amortization of insurance acquisition costs resulting from the increase in lapses. In 2014, the impact of rate increases was not material. In 2015, we expect to file additional rate increases generally on older blocks of our long-term care business.
Amounts added to policyholder account balances - cost of interest credited to policyholders were $127.2 million, $141.9 million and $155.0 million in 2014, 2013 and 2012, respectively. The weighted average crediting rates for these products was 2.8 percent, 3.0 percent and 3.1 percent in 2014, 2013 and 2012, respectively. The average liabilities of the fixed interest annuity block was $3.8 billion, $4.1 billion and $4.4 billion in 2014, 2013 and 2012, respectively.
Amounts added to policyholder account balances for fixed index products represent a guaranteed minimum rate of return and a higher potential return that is based on a percentage (the “participation rate”) of the amount of increase in the value of a particular index, such as the S&P 500 Index, over a specified period. Such amounts include our cost to fund the annual index credits, net of policies that are canceled prior to their anniversary date (classified as cost of options to fund index credits, net of forfeitures). Market value changes in the underlying indices during a specified period of time are classified as market value changes credited to policyholders. Such market value changes are generally offset by the net investment income related to fixed index products discussed above.
Amortization related to operations includes amortization of insurance acquisition costs. Insurance acquisition costs are generally amortized either: (i) in relation to the estimated gross profits for interest-sensitive life and annuity products; or (ii) in relation to actual and expected premium revenue for other products. In addition, for interest-sensitive life and annuity products, we are required to adjust the total amortization recorded to date through the statement of operations if actual experience or other evidence suggests that earlier estimates of future gross profits should be revised. Accordingly, amortization for interest-sensitive life and annuity products is dependent on the profits realized during the period and on our expectation of future profits. For other products, we amortize insurance acquisition costs in relation to actual and expected premium revenue, and
amortization is only adjusted if expected premium revenue changes or if we determine the balance of these costs is not recoverable from future profits. In the fourth quarter of 2014, we completed our comprehensive review of actuarial assumptions. Such review resulted in a decrease to amortization expense of $11 million due to changes in mortality, spread and surrender rate assumptions related to certain annuity and interest-sensitive life products. Such amount was partially offset by $5 million of additional reserves on such products due to the changes in assumptions and refinements to reserving methodologies.
Interest expense on investment borrowings represents interest expense on collateralized borrowings as further described in the note to the consolidated financial statements entitled "Summary of Significant Accounting Policies - Investment Borrowings".
Other operating costs and expenses in our Bankers Life segment were $401.2 million in 2014, up 5.6 percent from 2013, and were $380.0 million in 2013, up 1.4 percent from 2012. Expenses in 2014 included approximately $9 million of overhead expenses that were allocated to the Other CNO Business segment prior to 2014 and are expected to continue after the completion of the sale of CLIC. The increase in operating costs in 2014 from 2013 also reflected additional investments in our business, partially offset by lower legal and regulatory costs. Other operating costs and expenses include the following (dollars in millions):
|
| | | | | | | | | | | |
| | 2014 | | 2013 | | 2012 |
| Commission expense and agent manager benefits | $ | 57.2 |
| | $ | 60.0 |
| | $ | 61.1 |
|
| Other operating expenses | 344.0 |
| | 320.0 |
| | 313.7 |
|
| Total | $ | 401.2 |
| | $ | 380.0 |
| | $ | 374.8 |
|
Gain on reinsurance transaction in 2014 resulted from the recapture of life insurance business written by Bankers Life that was reinsured by Wilton Re.
Net realized investment gains (losses) fluctuate each period. During 2014, net realized investment gains in this segment included $13.1 million of net gains from the sales of investments (primarily fixed maturities) and $4.8 million of writedowns of investments for other than temporary declines in fair value recognized through net income. During 2013, net realized investment gains in this segment included $22.3 million of net gains from the sales of investments (primarily fixed maturities) and $6.0 million of writedowns of investments for other than temporary declines in fair value recognized through net income. During 2012, net realized investment gains in this segment included $61.7 million of net gains from the sales of investments (primarily fixed maturities) and $8.7 million of writedowns of investments for other than temporary declines in fair value recognized through net income.
Amortization related to net realized investment losses is the increase or decrease in the amortization of insurance acquisition costs which results from realized investment gains or losses. When we sell securities which back our interest-sensitive life and annuity products at a gain (loss) and reinvest the proceeds at a different yield, we increase (reduce) the amortization of insurance acquisition costs in order to reflect the change in estimated gross profits due to the gains (losses) realized and the resulting effect on estimated future yields. Sales of fixed maturity investments resulted in an increase in the amortization of insurance acquisition costs of $.5 million, $1.2 million and $4.3 million in 2014, 2013 and 2012, respectively.
Insurance policy benefits - fair value changes in embedded derivative liabilities represents fair value changes due to fluctuations in the interest rates used to discount embedded derivative liabilities related to our fixed index annuities.
Amortization related to fair value changes in embedded derivative liabilities is the increase or decrease in the amortization of insurance acquisition costs which results from changes in interest rates used to discount embedded derivative liabilities related to our fixed index annuities.
Washington National (dollars in millions)
|
| | | | | | | | | | | |
| | 2014 | | 2013 | | 2012 |
| Premium collections: | | | | | |
| Supplemental health and other health | $ | 517.8 |
| | $ | 494.4 |
| | $ | 463.1 |
|
| Medicare supplement | 85.2 |
| | 101.9 |
| | 113.9 |
|
| Life | 25.9 |
| | 26.5 |
| | 23.8 |
|
| Annuity | 2.6 |
| | 4.3 |
| | 3.5 |
|
| Total collections | $ | 631.5 |
| | $ | 627.1 |
| | $ | 604.3 |
|
| Average liabilities for insurance products: | | | | | |
|
| Fixed index annuities | $ | 421.5 |
| | $ | 457.4 |
| | $ | 521.7 |
|
| Fixed interest annuities | 130.2 |
| | 147.1 |
| | 166.9 |
|
| SPIAs and supplemental contracts: | | | | | |
| Mortality based | 245.4 |
| | 248.9 |
| | 258.9 |
|
| Deposit based | 252.6 |
| | 245.9 |
| | 234.2 |
|
| Separate Accounts | 8.5 |
| | 14.1 |
| | 15.6 |
|
| Health: | | | | | |
| Supplemental health | 2,387.9 |
| | 2,231.0 |
| | 2,199.6 |
|
| Medicare supplement | 35.2 |
| | 38.7 |
| | 44.2 |
|
| Other health | 14.9 |
| | 12.3 |
| | 15.1 |
|
| Life: | | | | | |
| Interest sensitive life | 159.4 |
| | 166.2 |
| | 166.8 |
|
| Non-interest sensitive life | 192.0 |
| | 198.8 |
| | 199.4 |
|
| Total average liabilities for insurance products, net of reinsurance ceded | $ | 3,847.6 |
| | $ | 3,760.4 |
| | $ | 3,822.4 |
|
| Revenues: | | | | | |
|
| Insurance policy income | $ | 626.0 |
| | $ | 621.5 |
| | $ | 608.9 |
|
| Net investment income: | | | | | |
| General account invested assets | 266.5 |
| | 275.0 |
| | 281.4 |
|
| Fixed index products | 6.3 |
| | 17.9 |
| | 4.2 |
|
| Trading account income related to reinsurer accounts | 1.4 |
| | (3.7 | ) | | 3.1 |
|
| Change in value of embedded derivatives related to modified coinsurance agreements | (1.4 | ) | | 3.7 |
| | (2.4 | ) |
| Trading account income related to policyholder accounts | 3.3 |
| | 4.0 |
| | 2.9 |
|
| Fee revenue and other income | 1.1 |
| | .9 |
| | 1.1 |
|
| Total revenues | 903.2 |
| | 919.3 |
| | 899.2 |
|
| Expenses: | | | | | |
| Insurance policy benefits | 505.7 |
| | 497.8 |
| | 469.0 |
|
| Amounts added to policyholder account balances: | | | | | |
| Cost of interest credited to policyholders | 14.9 |
| | 14.7 |
| | 16.5 |
|
| Cost of options to fund index credits, net of forfeitures | 5.6 |
| | 6.1 |
| | 8.9 |
|
| Market value changes credited to policyholders | 10.0 |
| | 22.8 |
| | 6.2 |
|
| Amortization related to operations | 64.6 |
| | 64.9 |
| | 64.9 |
|
| Interest expense on investment borrowings | 1.7 |
| | 1.9 |
| | 2.8 |
|
| Other operating costs and expenses | 189.5 |
| | 170.5 |
| | 182.1 |
|
| Total benefits and expenses | 792.0 |
| | 778.7 |
| | 750.4 |
|
| Income before gain on reinsurance transaction, net realized investment gains and fair value changes in embedded derivative liabilities, net of related amortization, and income taxes | 111.2 |
| | 140.6 |
| | 148.8 |
|
| Gain on reinsurance transaction | 3.8 |
| | — |
| | — |
|
| Net realized investment gains | 34.4 |
| | 12.2 |
| | 26.0 |
|
| Amortization related to net realized investment gains | (.5 | ) | | (.4 | ) | | (2.1 | ) |
| Net realized investment gains, net of related amortization | 33.9 |
| | 11.8 |
| | 23.9 |
|
| Insurance policy benefits - fair value changes in embedded derivative liabilities | (1.5 | ) | | 2.7 |
| | .1 |
|
| Amortization related to fair value changes in embedded derivative liabilities | 1.1 |
| | (2.1 | ) | | (.1 | ) |
| Fair value changes in embedded derivative liabilities, net of related amortization | (.4 | ) | | .6 |
| | — |
|
| Income before income taxes | $ | 148.5 |
| | $ | 153.0 |
| | $ | 172.7 |
|
|
| | | | | | | | | | | |
| | 2014 | | 2013 | | 2012 |
| Health benefit ratios: | | | | | |
| Medicare supplement: | | | | | |
| Insurance policy benefits | $ | 55.2 |
| | $ | 66.1 |
| | $ | 77.6 |
|
| Benefit ratio (a) | 63.3 | % | | 64.6 | % | | 65.4 | % |
| Supplemental health: | | | | | |
| Insurance policy benefits | $ | 408.7 |
| | $ | 378.1 |
| | $ | 347.6 |
|
| Benefit ratio (a) | 80.1 | % | | 78.5 | % | | 76.6 | % |
| Interest-adjusted benefit ratio (b) | 54.6 | % | | 52.3 | % | | 49.8 | % |
_________________
| |
| (a) | We calculate benefit ratios by dividing the related product’s insurance policy benefits by insurance policy income. |
| |
| (b) | We calculate the interest-adjusted benefit ratio (a non-GAAP measure) for Washington National's supplemental health products by dividing such product’s insurance policy benefits less the imputed interest income on the accumulated assets backing the insurance liabilities by policy income. These are considered non-GAAP financial measures. A non-GAAP measure is a numerical measure of a company's performance, financial position, or cash flows that excludes or includes amounts that are normally excluded or included in the most directly comparable measure calculated and presented in accordance with GAAP. |
These non-GAAP financial measures of "interest-adjusted benefit ratios" differ from "benefit ratios" due to the deduction of imputed interest income on the accumulated assets backing the insurance liabilities from the product’s insurance policy benefits used to determine the ratio. Interest income is an important factor in measuring the performance of health products that are expected to be inforce for a longer duration of time, are not subject to unilateral changes in provisions (such as non-cancelable or guaranteed renewable contracts) and require the performance of various functions and services (including insurance protection) for an extended period of time. The net cash flows from supplemental health products generally cause an accumulation of amounts in the early years of a policy (accounted for as reserve increases) that will be paid out as benefits in later policy years (accounted for as reserve decreases). Accordingly, as the policies age, the benefit ratio will typically increase, but the increase in benefits will be partially offset by the imputed interest income earned on the accumulated assets. The interest-adjusted benefit ratio reflects the effects of such interest income offset (which is equal to the tabular interest on the related insurance liabilities). Since interest income is an important factor in measuring the performance of these products, management believes a benefit ratio that includes the effect of interest income is useful in analyzing product performance. We utilize the interest-adjusted benefit ratio in measuring segment performance because we believe that this performance measure is a better indicator of the ongoing businesses and trends in the business. However, the "interest-adjusted benefit ratio" does not replace the "benefit ratio" as a measure of current period benefits to current period insurance policy income. Accordingly, management reviews both "benefit ratios" and "interest-adjusted benefit ratios" when analyzing the financial results attributable to these products. The imputed investment income earned on the accumulated assets backing the supplemental health reserves was $130.2 million, $126.4 million and $121.6 million in 2014, 2013 and 2012, respectively.
Total premium collections were $631.5 million in 2014, up .7 percent from 2013, and $627.1 million in 2013, up 3.8 percent from 2012. This segment no longer markets Medicare supplement products and no longer actively pursues sales of annuity products. See "Premium Collections" for further analysis of fluctuations in premiums collected by product.
Average liabilities for insurance products, net of reinsurance ceded were $3,847.6 million in 2014, up 2.3 percent from 2013, and $3,760.4 million in 2013, down 1.6 percent from 2012, primarily reflecting an increase in the supplemental health block; partially offset by the run-off of the annuity blocks.
Insurance policy income is comprised of premiums earned on traditional insurance policies which provide mortality or morbidity coverage and fees and other charges assessed on other policies. Such income increased in recent periods as supplemental health premiums have increased consistent with sales; partially offset by the decrease in Medicare supplement premiums.
Net investment income on general account invested assets (which excludes income on policyholder and reinsurer accounts) decreased 3.1 percent, to $266.5 million in 2014 and 2.3 percent, to $275.0 million in 2013. As a result of the sale of CLIC, investment income decreased by approximately $5.2 million in 2014, representing the investment income earned on the invested assets backing a block of health business issued by CLIC and included in the Washington National segment. Prior to
the sale of CLIC, such business was ceded to Washington National through a modified coinsurance agreement pursuant to which all invested assets related to the insurance block are held by CLIC.
Net investment income related to fixed index products represents the change in the estimated fair value of options which are purchased in an effort to offset or hedge certain potential benefits accruing to the policyholders of our fixed index products. Our fixed index products are designed so that investment income spread is expected to be more than adequate to cover the cost of the options and other costs related to these policies. Net investment income related to fixed index products was $6.3 million, $17.9 million and $4.2 million in 2014, 2013 and 2012, respectively. Such amounts were generally offset by the corresponding charge to amounts added to policyholder account balances - market value changes credited to policyholders. Such income and related charges fluctuate based on the value of options embedded in the segment's fixed index annuity policyholder account balances subject to this benefit and to the performance of the index to which the returns on such products are linked.
Trading account income related to reinsurer accounts primarily represents the income on trading securities which were held to act as hedges for embedded derivatives related to a modified coinsurance agreement. The income on such trading account securities was designed to substantially offset the change in value of embedded derivatives related to a modified coinsurance agreement. Such trading securities were sold in the second quarter of 2014 in conjunction with the recapture of a modified coinsurance agreement.
Change in value of embedded derivatives related to modified coinsurance agreements is described in the note to our consolidated financial statements entitled "Summary of Significant Accounting Policies - Accounting for Derivatives." We transferred a specific block of investments related to these agreements to our trading securities account, which we carried at estimated fair value with changes in such value recognized as trading account income. The change in the value of the embedded derivatives was largely offset by the change in value of the trading securities. In the second quarter of 2014, we recaptured this modified coinsurance agreement and the embedded derivative was eliminated.
Trading account income related to policyholder accounts represents the income on investments backing the market strategies of certain annuity products which provide for different rates of cash value growth based on the experience of a particular market strategy. The income on our trading account securities is designed to substantially offset certain amounts included in insurance policy benefits related to the aforementioned annuity products.
Insurance policy benefits fluctuated as a result of the factors summarized below. Benefit ratios are calculated by dividing the related insurance product's insurance policy benefits by insurance policy income.
In the fourth quarter of 2014, we completed our comprehensive annual review of actuarial assumptions. Such review resulted in a $9 million increase in reserves related to a block of payout annuities due to changes in our interest rate and mortality assumptions for this block.
Washington National's Medicare supplement business primarily consists of individual policies. The insurance product liabilities we establish for our Medicare supplement business are subject to significant estimates and the ultimate claim liability we incur for a particular period is likely to be different than our initial estimate. Governmental regulations generally require us to attain and maintain a ratio of total benefits incurred to total premiums earned (excluding changes in policy benefit reserves), after three years from the original issuance of the policy and over the lifetime of the policy, of not less than 65 percent on these products, as determined in accordance with statutory accounting principles. Insurance margins (insurance policy income less insurance policy benefits) on these products were $31.9 million, $36.2 million and $41.0 million in 2014, 2013 and 2012, respectively. Such decrease reflects the run-off of this business as we discontinued new sales of Medicare supplement business in this segment in the fourth quarter of 2012.
Washington National's supplemental health products (including specified disease, accident and hospital indemnity products) generally provide fixed or limited benefits. For example, payments under cancer insurance policies are generally made directly to, or at the direction of, the policyholder following diagnosis of, or treatment for, a covered type of cancer. Approximately three-fourths of our supplemental health policies inforce (based on policy count) were sold with return of premium or cash value riders. The return of premium rider generally provides that after a policy has been inforce for a specified number of years or upon the policyholder reaching a specified age, we will pay to the policyholder, or a beneficiary under the policy, the aggregate amount of all premiums paid under the policy, without interest, less the aggregate amount of all claims incurred under the policy. The cash value rider is similar to the return of premium rider, but also provides for payment of a graded portion of the return of premium benefit if the policy terminates before the return of premium benefit is earned. Accordingly, the net cash flows from these products generally result in the accumulation of amounts in the early years of a
policy (reflected in our earnings as reserve increases) which will be paid out as benefits in later policy years (reflected in our earnings as reserve decreases which offset the recording of benefit payments). As the policies age, the benefit ratio will typically increase, but the increase in benefits will be partially offset by investment income earned on the accumulated assets. The benefit ratio will fluctuate depending on the claim experience during the year.
Insurance margins (insurance policy income less insurance policy benefits) on supplemental health products were $101.8 million, $103.4 million and $106.2 million in 2014, 2013 and 2012, respectively. The benefit ratio on these products was 80.1 percent, 78.5 percent and 76.6 percent in 2014, 2013 and 2012, respectively. In addition, the insurance margin on supplemental health products was reduced by $2.5 million related to premium refunds due to the use of a new process to identify changes in the status of insureds in a more timely manner. The benefit ratios on this business can be impacted by changes in the extent to which policyholders convert their current policies to policies with additional benefits, as well as persistency in certain blocks. The benefits ratio in 2013 and 2014 reflect a decision we made in 2013 to reduce the commission we pay on certain conversion activity. While we believe this change will improve the longer-term profitability of the block, lower conversions of policies with return-of-premium features that are approaching maturity, results in lower reserve releases. Accordingly, the benefit ratio on this block has increased. The interest adjusted benefit ratio on this supplemental health business was 54.6 percent, 52.3 percent and 49.8 percent in 2014, 2013 and 2012, respectively. We currently expect the interest-adjusted benefit ratio on this supplemental health business to be in the 54 percent range in 2015.
Amounts added to policyholder account balances - cost of interest credited to policyholders were $14.9 million, $14.7 million and $16.5 million in 2014, 2013 and 2012, respectively.
Amounts added to policyholder account balances for fixed index products represent a guaranteed minimum rate of return and a higher potential return that is based on a percentage (the "participation rate") of the amount of increase in the value of a particular index, such as the S&P 500 Index, over a specified period. Such amounts include our cost to fund the annual index credits, net of policies that are canceled prior to their anniversary date (classified as cost of options to fund index credits, net of forfeitures). Market value changes in the underlying indices during a specified period of time are classified as market value changes credited to policyholders. Such market value changes are generally offset by the net investment income related to fixed index products discussed above.
Amortization related to operations includes amortization of insurance acquisition costs. Insurance acquisition costs are generally amortized in relation to actual and expected premium revenue, and amortization is only adjusted if expected premium revenue changes or if we determine the balance of these costs is not recoverable from future profits. Such amounts were generally consistent with the related premium revenue. A revision to our current assumptions could result in increases or decreases to amortization expense in future periods.
Interest expense on investment borrowings represents $1.7 million, $1.9 million and $2.8 million of interest expense on collateralized borrowings in 2014, 2013 and 2012, respectively, as further described in the note to the consolidated financial statements entitled "Summary of Significant Accounting Policies - Investment Borrowings".
Other operating costs and expenses were $189.5 million, $170.5 million and $182.1 million in 2014, 2013 and 2012, respectively. Other operating costs and expenses include commission expense of $64.6 million, $63.1 million and $69.9 million in 2014, 2013 and 2012, respectively. Expenses in 2014 included approximately $7 million of overhead expenses that were allocated to the Other CNO Business segment prior to 2014 and are expected to continue after the completion of the sale of CLIC. In addition, 2013 reflects lower legal expenses than the previous year.
Gain on reinsurance transaction of $3.8 million related to the recapture of a modified coinsurance agreement in the second quarter of 2014.
Net realized investment gains fluctuate each period. During 2014, net realized investment gains in this segment included $37.8 million of net gains from the sales of investments (primarily fixed maturities) and $3.4 million of writedowns of investments for other than temporary declines in fair value recognized through net income. During 2013, net realized investment gains in this segment included $15.9 million of net gains from the sales of investments (primarily fixed maturities) and $3.7 million of writedowns of investments for other than temporary declines in fair value recognized through net income. During 2012, net realized investment gains in this segment included $40.5 million of net gains from the sales of investments (primarily fixed maturities) and $14.5 million of writedowns of investments for other than temporary declines in fair value recognized through net income.
Amortization related to net realized investment gains is the increase or decrease in the amortization of insurance acquisition costs which results from realized investment gains or losses. When we sell securities which back our interest-sensitive life and annuity products at a gain (loss) and reinvest the proceeds at a different yield (or when we have the intent to sell the impaired investments before an anticipated recovery in value occurs), we increase (reduce) the amortization of insurance acquisition costs in order to reflect the change in estimated gross profits due to the gains (losses) realized and the resulting effect on estimated future yields. Sales of fixed maturity investments resulted in an increase in the amortization of insurance acquisition costs of $.5 million, $.4 million and $2.1 million in 2014, 2013 and 2012, respectively.
Insurance policy benefits - fair value changes in embedded derivative liabilities represents fair value changes due to fluctuations in the interest rates used to discount embedded derivative liabilities related to our fixed index annuities.
Amortization related to fair value changes in embedded derivative liabilities is the increase or decrease in the amortization of insurance acquisition costs which results from changes in interest rates used to discount embedded derivative liabilities related to our fixed index annuities.
Colonial Penn (dollars in millions)
|
| | | | | | | | | | | |
| | 2014 | | 2013 | | 2012 |
| Premium collections: | | | | | |
| Life | $ | 241.7 |
| | $ | 227.6 |
| | $ | 211.9 |
|
| Supplemental health | 3.4 |
| | 4.1 |
| | 4.9 |
|
| Total collections | $ | 245.1 |
| | $ | 231.7 |
| | $ | 216.8 |
|
| Average liabilities for insurance products: | | | | | |
|
| SPIAs - mortality based | $ | 69.6 |
| | $ | 73.5 |
| | $ | 76.5 |
|
| Health: | | | | | |
| Medicare supplement | 8.3 |
| | 9.2 |
| | 10.2 |
|
| Other health | 4.5 |
| | 4.7 |
| | 4.9 |
|
| Life: | | | | | |
| Interest sensitive | 17.0 |
| | 17.5 |
| | 18.7 |
|
| Non-interest sensitive | 649.8 |
| | 629.4 |
| | 604.5 |
|
| Total average liabilities for insurance products, net of reinsurance ceded | $ | 749.2 |
| | $ | 734.3 |
| | $ | 714.8 |
|
| Revenues: | | | | | |
|
| Insurance policy income | $ | 246.0 |
| | $ | 232.1 |
| | $ | 217.8 |
|
| Net investment income on general account invested assets | 41.7 |
| | 40.0 |
| | 40.4 |
|
| Fee revenue and other income | 1.0 |
| | .8 |
| | .7 |
|
| Total revenues | 288.7 |
| | 272.9 |
| | 258.9 |
|
| Expenses: | | | | | |
| Insurance policy benefits | 172.5 |
| | 165.0 |
| | 160.3 |
|
| Amounts added to annuity and interest-sensitive life product account balances | .7 |
| | .7 |
| | .8 |
|
| Amortization related to operations | 15.3 |
| | 14.5 |
| | 15.0 |
|
| Other operating costs and expenses | 99.4 |
| | 105.2 |
| | 91.4 |
|
| Total benefits and expenses | 287.9 |
| | 285.4 |
| | 267.5 |
|
| Income (loss) before net realized investment gains and income taxes | .8 |
| | (12.5 | ) | | (8.6 | ) |
| Net realized investment gains | 1.1 |
| | .4 |
| | 7.2 |
|
| Income (loss) before income taxes | $ | 1.9 |
| | $ | (12.1 | ) | | $ | (1.4 | ) |
This segment's results are significantly impacted by the accounting standard related to deferred acquisition costs. We are not able to defer most of Colonial Penn's direct response advertising costs although such costs generate predictable sales and future inforce profits. We plan to continue to invest in this segment's business, including the development of new products and
markets. The amount of our investment in new business during a particular period will have a significant impact on this segment's results. Based on our current advertising plan, we expect this segment to report slightly positive earnings (before net realized investment gains (losses) and income taxes) in 2015, but because of the seasonality of the advertising spend, we expect a loss in the $7 million range in the first quarter of 2015.
Total premium collections increased 5.8 percent, to $245.1 million, in 2014 and 6.9 percent, to $231.7 million, in 2013. See "Premium Collections" for further analysis of Colonial Penn's premium collections.
Average liabilities for insurance products, net of reinsurance ceded have increased as a result of growth in this segment.
Insurance policy income is comprised of premiums earned on policies which provide mortality or morbidity coverage and fees and other charges assessed on other policies. The increase in such income reflects the growth in the block of business.
Net investment income on general account invested assets increased in 2014 primarily due to the higher general account invested assets as a result of growth in this segment.
Insurance policy benefits fluctuated as a result of the growth in this segment.
Amortization related to operations includes amortization of insurance acquisition costs. Insurance acquisition costs in the Colonial Penn segment are amortized in relation to actual and expected premium revenue, and amortization is only adjusted if expected premium revenue changes or if we determine the balance of these costs is not recoverable from future profits. Such amounts were generally consistent with the related premium revenue and gross profits for such periods and the assumptions we made when we established the present value of future profits. A revision to our current assumptions could result in increases or decreases to amortization expense in future periods.
Other operating costs and expenses in our Colonial Penn segment fluctuate primarily due to changes in the marketing expenses incurred to generate new business. Such marketing expenses totaled $71.3 million, $76.7 million and $66.1 million in 2014, 2013 and 2012, respectively. Marketing expenses in 2014 reflect a modest increase in the deferral of acquisition costs due to a slight shift to deferrable direct mail marketing activities. Although the effectiveness of our sales and marketing expenditures have improved, we continue to face increased competition from other insurance companies who also distribute products through direct marketing. In addition, the demand and cost of television advertising appropriate for Colonial Penn's campaigns has fluctuated widely in certain periods. In some periods increased advertising costs have resulted in decisions to lower our planned spending. These factors may reoccur in the future.
Net realized investment gains fluctuated each period. During 2014, we recognized $1.1 million of net gains from the sales of investments (primarily fixed maturities). During 2013, net realized investment gains in this segment included $.6 million of net gains from the sales of investments (primarily fixed maturities) and $.2 million of writedowns of investments for other than temporary declines in fair value recognized through net income. During 2012, net realized investment gains in this segment included $7.8 million of net gains from the sales of investments (primarily fixed maturities) and $.6 million of writedowns of investments for other than temporary declines in fair value recognized through net income.
Corporate Operations (dollars in millions)
|
| | | | | | | | | | | |
| | 2014 | | 2013 | | 2012 |
| Corporate operations: | | | | | |
| Interest expense on corporate debt | $ | (43.9 | ) | | $ | (51.3 | ) | | $ | (66.2 | ) |
| Net investment income (loss): | | | | | |
| General investment portfolio | 8.5 |
| | 5.4 |
| | 3.6 |
|
| Other special-purpose portfolios: | | | | | |
| COLI | (1.3 | ) | | 15.7 |
| | 5.0 |
|
| Investments held in a rabbi trust | .4 |
| | 1.3 |
| | 4.3 |
|
| Investments in certain hedge funds | (2.8 | ) | | 4.9 |
| | (2.1 | ) |
| Other trading account activities | 10.1 |
| | 12.5 |
| | 20.3 |
|
| Fee revenue and other income | 6.7 |
| | 6.2 |
| | 1.2 |
|
| Net operating results of variable interest entities | — |
| | — |
| | 12.3 |
|
| Interest expense on investment borrowings | (.1 | ) | | (.1 | ) | | (.4 | ) |
| Other operating costs and expenses | (49.1 | ) | | (43.1 | ) | | (54.5 | ) |
| Loss before net realized investment gains (losses), equity in earnings of certain non-strategic investments and earnings attributable to non-controlling interests, net revenue pursuant to transition and support services agreements, loss on extinguishment or modification of debt and income taxes | (71.5 | ) | | (48.5 | ) | | (76.5 | ) |
| Net realized investment gains (losses) | (9.9 | ) | | (1.5 | ) | | 1.8 |
|
| Fair value changes related to agent deferred compensation plan | (26.8 | ) | | 15.8 |
| | (10.0 | ) |
| Equity in earnings of certain non-strategic investments and earnings attributable to non-controlling interests | (8.0 | ) | | (10.2 | ) | | — |
|
| Net revenue pursuant to transition and support services agreements | 2.6 |
| | — |
| | — |
|
| Loss on extinguishment or modification of debt | (.6 | ) | | (65.4 | ) | | (200.2 | ) |
| Loss before income taxes | $ | (114.2 | ) | | $ | (109.8 | ) | | $ | (284.9 | ) |
Interest expense on corporate debt has been impacted by: (i) repayments of the Senior Secured Credit Agreement; (ii) the amendment to our Senior Secured Credit Agreement in May 2013 which reduced the interest rate payable; (iii) the completion of the cash tender offer (the "Offer") in March 2013 for $59.3 million aggregate principal amount of our 7.0% Senior Debentures due 2016 (the "7.0% Debentures"); (iv) repayments of the Senior Health Note due November 12, 2013; and (v) the recapitalization transactions completed in September 2012. Such transactions are further discussed in the note to the consolidated financial statements entitled "Notes Payable - Direct Corporate Obligations". Our average corporate debt outstanding was $838.2 million, $926.9 million and $882.7 million in 2014, 2013 and 2012, respectively. The average interest rate on our debt was 4.5 percent, 4.8 percent and 6.8 percent in 2014, 2013 and 2012, respectively.
Net investment income on general investment portfolio fluctuates based on the amount and type of invested assets in the corporate operations segment.
Net investment income on other special-purpose portfolios includes the income (loss) from: (i) investments related to deferred compensation plans held in a rabbi trust (which is offset by amounts included in other operating costs and expenses as the investment results are allocated to participants' account balances); (ii) trading account activities; (iii) income (loss) from Company-owned life insurance ("COLI") equal to the difference between the return on these investments (representing the change in value of the underlying investments) and our overall portfolio yield; and (iv) other investments including certain hedge funds and other alternative strategies. COLI is utilized as an investment vehicle to fund Bankers Life's agent deferred compensation plan. For segment reporting, the Bankers Life segment is allocated a return on these investments equivalent to the yield on the Company’s overall portfolio, with any difference in the actual COLI return allocated to the Corporate operations segment. We also recognized death benefits of $1.7 million and $2.9 million related to the COLI in 2014 and 2013, respectively.
Net operating results of variable interest entities relates to the 2012 period and represents the impact of consolidating various VIEs in accordance with GAAP. These entities were established to issue securities and use the proceeds to invest in loans and other permitted assets. Refer to the note to the consolidated financial statements entitled "Investments in Variable Interest Entities" for more information on the VIEs. Beginning January 1, 2013, the earnings from the VIEs are recognized by our segments as follows: (i) investment income earned on investments in the VIEs made by our insurance segments are recognized in the segment's earnings; (ii) investment income earned on investments in the VIEs made by the Corporate segment are recognized in the Corporate segment earnings; (iii) fee revenue earned for providing investment management services to the VIEs is recognized in fee revenue and other income in the Corporate segment; and (iv) earnings from the non-controlling interests in the VIEs are recognized as "equity in earnings of certain non-strategic investments and earnings attributable to non-controlling interests."
Other operating costs and expenses include general corporate expenses, net of amounts charged to subsidiaries for services provided by the corporate operations. These amounts fluctuate as a result of expenses such as consulting and legal costs which often vary from period to period. Such amounts in the first three months of 2014 included higher expenses of $3 million primarily related to accrual adjustments for incentive compensation. In 2012, we also recognized a $6.8 million charge related to the relocation of Bankers Life's primary office.
Net realized investment gains (losses) often fluctuate each period. During 2014, net realized investment losses in this segment included $9.2 million of net gains from the sales of investments (of which $2.2 million were losses recognized by VIEs) and $19.1 million of writedowns of investments (none of which were recognized by VIEs) due to other-than-temporary declines in value. During 2013, net realized investment losses in this segment included $.4 million of net losses from the sales of investments (of which $.5 million were losses recognized by VIEs) and $1.1 million of writedowns of investments (all of which were recognized by VIEs) due to other-than-temporary declines in value. During 2012, net realized investment gains in this segment included $2.6 million of net gains from the sales of investments (of which $.4 million were gains recognized by VIEs) and $.8 million of writedowns of investments (all of which were recognized by VIEs) due to other-than-temporary declines in value.
Fair value changes related to agent deferred compensation plan related to changes in the underlying actuarial assumptions used to value liabilities for our agent deferred compensation plan.
Equity in earnings of certain non-strategic investments and earnings attributable to non-controlling interests include the earnings attributable to non-controlling interests in certain VIEs that we are required to consolidate and certain private companies that were acquired in the commutation of an investment made by our Predecessor, net of affiliated amounts. Such earnings are not indicative and are unrelated to the Company's underlying fundamentals.
Net revenue pursuant to transition and support services agreements represents the difference between the fees we receive from Wilton Re and the overhead costs incurred to provide such services under the agreements subsequent to the sale of CLIC.
Loss on extinguishment or modification of debt in 2014 of $.6 million resulted from: (i) expenses related to the amendment of the Senior Secured Credit Agreement in May 2014; and (ii) the repurchase of the remaining $3.5 million principal amount of the 7.0% Debentures for a purchase price of $3.7 million. The loss on extinguishment of debt of $65.4 million in 2013 resulted from: (i) the Offer and repurchase of 7.0% Debentures, the write-off of unamortized discount and issuance costs associated with the 7.0% Debentures that were repurchased and other transaction costs; and (ii) expenses related to the amendment of our Senior Secured Credit Agreement and the write-off of unamortized discount and issuance costs associated with prepayments on the Senior Secured Credit Agreement. The loss on extinguishment of debt of $200.2 million in 2012 represents: (i) $136.5 million due to our repurchase of $200.0 million principal amount of 7.0% Debentures and the write-off of unamortized discount and issuance costs associated with the 7.0% Debentures; (ii) $58.2 million related to the tender offer and consent solicitation for the 9.0% Senior Secured Notes due January 2018 (the "9.0% Notes"), the write-off of unamortized issuance costs related to the 9.0% Notes and other transactions; (iii) $5.1 million representing the write-off of unamortized discount and issuance costs associated with repayments of a previous senior secured credit agreement; and (iv) $.4 million representing the write-off of unamortized discount and issuance costs associated with payments on our Senior Secured Credit Agreement. These transactions are further discussed in the note to the consolidated financial statements entitled "Notes Payable - Direct Corporate Obligations".
Other CNO Business (dollars in millions)
The Other CNO Business segment included the long-term care business that was ceded to BRe effective December 31, 2013, as further described below. This segment also included the overhead expense of CLIC that is expected to continue after the completion of the CLIC sale. The Other CNO Business segment no longer exists, effective January 1, 2014. Beginning on January 1, 2014 the overhead of CLIC that is expected to continue after the completion of the sale was reallocated primarily to the Bankers Life and Washington National segments.
|
| | | | | | | |
| | 2013 | | 2012 |
| Premium collections: | | | |
| Long-term care (all renewal) | $ | 23.6 |
| | $ | 25.1 |
|
| | | | |
| Average liabilities for insurance products: | | | |
| Average liabilities for long-term care products, net of reinsurance ceded | $ | 467.4 |
| | $ | 467.0 |
|
| | | | |
| Revenues: | | | |
| Insurance policy income | $ | 24.1 |
| | $ | 25.6 |
|
| Net investment income on general account invested assets | 33.3 |
| | 32.9 |
|
| Total revenues | 57.4 |
| | 58.5 |
|
| Expenses: | | | |
| Insurance policy benefits | 59.2 |
| | 63.2 |
|
| Other operating costs and expenses: | | | |
| Related to the long-term care business reinsured in 4Q13 | 6.2 |
| | 4.5 |
|
| Overhead expense of CLIC expected to continue after the completion of the sale | 19.6 |
| | 20.5 |
|
| Total benefits and expenses | 85.0 |
| | 88.2 |
|
| Loss before loss related to reinsurance transaction and income taxes | (27.6 | ) | | (29.7 | ) |
| Loss related to reinsurance transaction | (98.4 | ) | | — |
|
| Loss before income taxes | $ | (126.0 | ) | | $ | (29.7 | ) |
|
| | | | | | | |
| | 2013 | | 2012 |
| Health benefit ratios: | | | |
| Long-term care: | | | |
| Insurance policy benefits | $ | 59.2 |
| | $ | 63.4 |
|
| Benefit ratio (a) | 245.7 | % | | 247.0 | % |
| Interest-adjusted benefit ratio (b) | 131.2 | % | | 137.6 | % |
_______________
| |
| (a) | We calculate benefit ratios by dividing the related product's insurance policy benefits by insurance policy income. |
| |
| (b) | We calculate the interest-adjusted benefit ratio (a non-GAAP measure) for long-term care products in our Other CNO Business segment by dividing such product's insurance policy benefits less the imputed interest income on the accumulated assets backing the insurance liabilities by policy income. These are considered non-GAAP financial measures. A non-GAAP measure is a numerical measure of a company's performance, financial position, or cash flows that excludes or includes amounts that are normally excluded or included in the most directly comparable measure calculated and presented in accordance with GAAP. |
These non-GAAP financial measures of "interest-adjusted benefit ratios" differ from "benefit ratios" due to the deduction of imputed interest income on the accumulated assets backing the insurance liabilities from the product's insurance policy benefits used to determine the ratio. Interest income is an important factor in measuring the performance of health products that are expected to be inforce for a longer duration of time, are not subject to unilateral changes in provisions (such as non-cancelable or guaranteed renewable contracts) and require the performance of various functions and services (including insurance protection) for an extended period of time. The net cash flows from long-term care
products generally cause an accumulation of amounts in the early years of a policy (accounted for as reserve increases) that will be paid out as benefits in later policy years (accounted for as reserve decreases). Accordingly, as the policies age, the benefit ratio will typically increase, but the increase in benefits will be partially offset by the imputed interest income earned on the accumulated assets. The interest-adjusted benefit ratio reflects the effects of such interest income offset (which is equal to the tabular interest on the related insurance liabilities). Since interest income is an important factor in measuring the performance of these products, management believes a benefit ratio that includes the effect of interest income is useful in analyzing product performance. We utilize the interest-adjusted benefit ratio in measuring segment performance because we believe that this performance measure is a better indicator of the ongoing businesses and trends in the business. However, the "interest-adjusted benefit ratio" does not replace the "benefit ratio" as a measure of current period benefits to current period insurance policy income. Accordingly, management reviews both "benefit ratios" and "interest-adjusted benefit ratios" when analyzing the financial results attributable to these products. The imputed investment income earned on the accumulated assets backing the long-term care reserves was $27.6 million and $28.1 million in 2013 and 2012, respectively.
Insurance policy benefits fluctuated as a result of the factors summarized below for benefit ratios. Benefit ratios are calculated by dividing the related insurance product's insurance policy benefits by insurance policy income. The long-term care policies in this segment generally provide for indemnity and non-indemnity benefits on a guaranteed renewable or non-cancellable basis. The benefit ratio on our long-term care policies was 245.7 percent and 247.0 percent in 2013 and 2012, respectively. Since the insurance product liabilities we establish for long-term care business are subject to significant estimates, the ultimate claim liability we incur for a particular period is likely to be different than our initial estimate. Our insurance policy benefits reflected reserve deficiencies from prior years of $5.1 million and $9.2 million in 2013 and 2012, respectively. Excluding the effects of prior year claim reserve deficiencies, our benefit ratios would have been 224.6 percent and 211.1 percent in 2013 and 2012, respectively. These ratios reflect the level of incurred claims experienced in recent periods, adverse development on claims incurred in prior periods and lower policy income. The prior period deficiencies have primarily resulted from the impact of paid claim experience being different than prior estimates.
The net cash flows from long-term care products generally cause an accumulation of amounts in the early years of a policy (reflected in our earnings as reserve increases) which will be paid out as benefits in later policy years (reflected in our earnings as reserve decreases which offset the recording of benefit payments). Accordingly, as the policies age, the benefit ratio will typically increase, but the increase in benefits will be partially offset by investment income earned on the assets which have accumulated. The interest-adjusted benefit ratio for long-term care products is calculated by dividing the insurance product's insurance policy benefits less the imputed interest income on the accumulated assets backing the insurance liabilities by insurance policy income. The interest-adjusted benefit ratio on this business was 131.2 percent and 137.6 percent in 2013 and 2012, respectively. Excluding the effects of prior year claim reserve deficiencies, our interest-adjusted benefit ratios would have been 110.0 percent and 101.8 percent in 2013 and 2012, respectively.
In each quarterly period, we calculate our best estimate of claim reserves based on all of the information available to us at that time, which necessarily takes into account new experience emerging during the period. Our actuaries estimate these claim reserves using various generally recognized actuarial methodologies which are based on informed estimates and judgments that are believed to be appropriate. As additional experience emerges and other data become available, these estimates and judgments are reviewed and may be revised. Significant assumptions made in estimating claim reserves for long-term care policies include expectations about the: (i) future duration of existing claims; (ii) cost of care and benefit utilization; (iii) interest rate utilized to discount claim reserves; (iv) claims that have been incurred but not yet reported; (v) claim status on the reporting date; (vi) claims that have been closed but are expected to reopen; and (vii) correspondence that has been received that will ultimately become claims that have payments associated with them.
Loss related to reinsurance transaction resulted from the long-term care business in this segment being ceded under 100% coinsurance agreements effective December 31, 2013. As a result, the long-term care reserves in this segment were ceded to BRe. Pursuant to the agreements, we paid an additional premium of $96.9 million to BRe plus an amount equal to the related net statutory liabilities. The reinsurance receivables related to the agreements will be secured by assets in market-value trusts subject to a 7% over-collateralization, investment guidelines and periodic true-up provisions. Future payments into the trusts to maintain collateral requirements are the responsibility of BRe. We evaluate this block separately to determine whether aggregate liabilities are deficient. We recognized a pre-tax loss of $98.4 million in 2013 to reflect: (i) the known loss (or premium deficiency) on the business, as we will not be recognizing additional income in future periods to recover the unamortized additional premium which will be paid to BRe; and (ii) other transaction costs related to the reinsurance agreements.
Amounts related to CLIC prior to being sold (dollars in millions)
|
| | | | | | | | | | | |
| | 2014 | | 2013 | | 2012 |
| Premium collections: | | | | | |
| Annuities | $ | .2 |
| | $ | .3 |
| | $ | .3 |
|
| Life | 71.0 |
| | 142.0 |
| | 155.4 |
|
| Total collections | $ | 71.2 |
| | $ | 142.3 |
| | $ | 155.7 |
|
| Average liabilities for insurance products: | | | | | |
|
| Fixed index annuities | $ | — |
| | $ | .6 |
| | $ | — |
|
| Fixed interest annuities | — |
| | 148.4 |
| | 157.5 |
|
| SPIAs and supplemental contracts: | | | | | |
| Mortality based | — |
| | 39.2 |
| | 41.9 |
|
| Deposit based | — |
| | 106.7 |
| | 123.7 |
|
| Health: | | | | | |
| Supplemental health | — |
| | 146.9 |
| | 157.4 |
|
| Medicare supplement | — |
| | 2.2 |
| | 3.1 |
|
| Other health | — |
| | 6.7 |
| | 12.5 |
|
| Life: | | | | | |
| Interest sensitive | — |
| | 2,317.8 |
| | 2,388.1 |
|
| Non-interest sensitive | — |
| | 432.1 |
| | 450.3 |
|
| Total average liabilities for insurance products, net of reinsurance ceded | $ | — |
| | $ | 3,200.6 |
| | $ | 3,334.5 |
|
| Revenues: | | | | | |
|
| Insurance policy income | $ | 106.0 |
| | $ | 218.3 |
| | $ | 245.7 |
|
| Net investment income: | | | | | |
| General account invested assets | 100.7 |
| | 210.2 |
| | 222.6 |
|
| Fixed index products | 1.3 |
| | 7.9 |
| | — |
|
| Fee revenue and other income | — |
| | 5.1 |
| | — |
|
| Total revenues | 208.0 |
| | 441.5 |
| | 468.3 |
|
| Expenses: | | | | | |
| Insurance policy benefits | 115.8 |
| | 239.6 |
| | 291.9 |
|
| Amounts added to policyholder account balances: | | | | | |
| Cost of interest credited to policyholders | 43.2 |
| | 90.2 |
| | 97.9 |
|
| Cost of options to fund index credits, net of forfeitures | .8 |
| | 1.4 |
| | 1.8 |
|
| Market value changes credited to policyholders | .9 |
| | 7.9 |
| | .1 |
|
| Amortization related to operations | 4.3 |
| | 8.8 |
| | 16.6 |
|
| Interest expense on investment borrowings | 9.1 |
| | 19.3 |
| | 19.9 |
|
| Other operating costs and expenses | 13.3 |
| | 41.0 |
| | 80.9 |
|
| Total benefits and expenses | 187.4 |
| | 408.2 |
| | 509.1 |
|
| Income (loss) before net realized investment gains (losses), loss on sale of CLIC and income taxes | 20.6 |
| | 33.3 |
| | (40.8 | ) |
| Net realized investment gains (losses) | 2.8 |
| | 6.0 |
| | (6.9 | ) |
| Amortization related to net realized investment gains (losses) | — |
| | — |
| | (.1 | ) |
| Net realized investment gains (losses), net of related amortization | 2.8 |
| | 6.0 |
| | (7.0 | ) |
| Earnings of CLIC prior to being sold | 23.4 |
| | 39.3 |
| | (47.8 | ) |
| Loss on sale of CLIC | (269.7 | ) | | — |
| | — |
|
| Income (loss) before income taxes | $ | (246.3 | ) | | $ | 39.3 |
| | $ | (47.8 | ) |
The information summarized above represents the pre-tax earnings related to the operations of CLIC prior to being sold (which occurred on July 1, 2014) as well as the loss on the sale of CLIC. Operating expenses exclude overhead expense that is expected to continue after the sale of CLIC. Refer to the note to the consolidated financial statements entitled "Sale of Subsidiary" for additional information.
Total premium collections were $142.3 million in 2013, down 8.6 percent from 2012. The decrease in collected premiums was primarily due to policyholder redemptions and lapses. See "Premium Collections" for further analysis of fluctuations in premiums collected by product.
Average liabilities for insurance products, net of reinsurance ceded were $3.2 billion in 2013, down 4.0 percent from 2012. The decreases in such liabilities were primarily due to policyholder redemptions and lapses.
Insurance policy income is comprised of policyholder charges on our interest-sensitive products and premiums earned on traditional insurance policies which provide mortality or morbidity coverage. The decrease in insurance policy income in 2013 is primarily due to a reduction in policyholder charges on certain interest-sensitive life products consistent with the settlement offered in a class action lawsuit and lower premium revenue due to policyholder redemptions and lapses.
Net investment income on general account invested assets (which excludes income on policyholder and reinsurer accounts) decreased 5.6 percent, to $210.2 million in 2013. The decrease in net investment income is primarily due to the lower invested assets in this segment as the business runs off.
Net investment income related to fixed index products represents the change in the estimated fair value of options which are purchased in an effort to offset or hedge certain potential benefits accruing to the policyholders of our fixed index products. Our fixed index products are designed so that investment income spread is expected to be more than adequate to cover the cost of the options and other costs related to these policies. Net investment income (loss) related to fixed index products was $1.3 million, $7.9 million and nil in 2014, 2013 and 2012, respectively. Such amounts were mostly offset by the corresponding charge (credit) to amounts added to policyholder account balances - market value changes credited to policyholders. Such income and related charges fluctuate based on the value of options embedded in the segment's fixed index annuity policyholder account balances subject to this benefit and to the performance of the index to which the returns on such products are linked.
Fee revenue and other income in 2013 included a $5 million favorable impact from the settlement of a reinsurance matter.
Insurance policy benefits in 2012 included approximately $43 million of increases to future loss reserves primarily resulting from decreased projected future investment yields related to interest-sensitive insurance products. During 2013, our review of assumptions resulted in no significant adjustments. We did not change our long-term interest rate assumptions, as investment results were relatively consistent with our 2013 new money rate assumptions.
Amounts added to policyholder account balances - cost of interest credited to policyholders were $43.2 million, $90.2 million and $97.9 million in 2014, 2013 and 2012, respectively. The decrease was primarily due to a smaller block of interest-sensitive life business inforce due to lapses in recent periods.
Amounts added to policyholder account balances for fixed index products represent a guaranteed minimum rate of return and a higher potential return that is based on a percentage (the “participation rate”) of the amount of increase in the value of a particular index, such as the S&P 500 Index, over a specified period. Such amounts include our cost to fund the annual index credits, net of policies that are canceled prior to their anniversary date (classified as cost of options to fund index credits, net of forfeitures). Market value changes in the underlying indices during a specified period of time are classified as market value changes credited to policyholders. Such market value changes are generally offset by the net investment income related to fixed index products discussed above.
Amortization related to operations includes amortization of insurance acquisition costs. Insurance acquisition costs were generally amortized either: (i) in relation to the estimated gross profits for interest-sensitive life and annuity products; or (ii) in relation to actual and expected premium revenue for other products. In addition, for interest-sensitive life and annuity products, we were required to adjust the total amortization recorded to date through the statement of operations if actual experience or other evidence suggests that earlier estimates of future gross profits should be revised. Accordingly, amortization for interest-sensitive life and annuity products is dependent on the profits realized during the period and on our expectation of future profits. For other products, we amortize insurance acquisition costs in relation to actual and expected premium revenue, and amortization was only adjusted if expected premium revenue changes. The assumptions we used to estimate our future gross profits and premiums involved significant judgment. Earnings on our interest-sensitive life products, which comprised a significant part of this block, was subject to volatility since our insurance acquisition costs were equal to the value of future estimated gross profits. Accordingly, the impact of adverse changes in our earlier estimates of future gross profits was generally reflected in earnings in the period such differences occur. In 2013, amortization of insurance acquisition costs in the
annuity block was favorably impacted primarily due to revising our lapse assumptions as we had experienced lower surrenders than reflected in our previous assumptions. Amortization related to operations in 2012 was impacted by an acceleration of amortization due to lower projected estimated gross profits for interest-sensitive life products. The lower profits primarily resulted from decreased projected future investment yields, as described above under insurance policy benefits.
Interest expense on investment borrowings includes $9.1 million, $19.3 million and $19.9 million of interest expense on collateralized borrowings in 2014, 2013 and 2012, respectively.
Other operating costs and expenses were $13.3 million, $41.0 million and $80.9 million in 2014, 2013 and 2012, respectively. Other operating costs and expenses include commission expense of $.2 million, $3.8 million and $4.5 million in 2014, 2013 and 2012, respectively. In 2012, we recognized charges of $41.5 million related to pending lawsuits that were subsequently settled.
Net realized investment gains (losses) fluctuate each period. During 2014, we recognized net realized investment gains in this segment of $2.8 million from the sales of investments (primarily fixed maturities). During 2013, net realized investment gains in this segment included $6.6 million of net gains from the sales of investments (primarily fixed maturities) and $.6 million of writedowns of investments for other than temporary declines in fair value recognized through net income. During 2012, net realized investment gains in this segment included $6.3 million of net gains from the sales of investments (primarily fixed maturities) and $13.2 million of writedowns of investments for other than temporary declines in fair value recognized through net income.
Amortization related to net realized investment gains (losses) is the increase or decrease in the amortization of insurance acquisition costs which results from realized investment gains or losses. When we sell securities which back our interest-sensitive life and annuity products at a gain (loss) and reinvest the proceeds at a different yield (or when we have the intent to sell the impaired investments before an anticipated recovery in value occurs), we increase (reduce) the amortization of insurance acquisition costs in order to reflect the change in estimated gross profits due to the gains (losses) realized and the resulting effect on estimated future yields. Sales of fixed maturity investments resulted in an increase in the amortization of insurance acquisition costs of nil, nil and $.1 million in 2014, 2013 and 2012, respectively.
EBIT FROM BUSINESS SEGMENTS CONTINUING AFTER THE CLIC SALE SUMMARIZED BY IN-FORCE AND NEW BUSINESS
Management believes that an analysis of EBIT from our business segments continuing after the CLIC sale, separated between in-force and new business, provides increased clarity around the value drivers of our business, particularly since the new business results are significantly impacted by the rate of sales, mix of business and the distribution channel through which new sales are made. EBIT from new business includes pre-tax revenues and expenses associated with new sales of our insurance products during the first year after the sale is completed. EBIT from in-force business includes all pre-tax revenues and expenses associated with sales of insurance products that were completed more than one year before the end of the reporting period. The allocation of certain revenues and expenses between new and in-force business is based on estimates, which we believe are reasonable.
The following summarizes our earnings, separated between in-force and new business on a consolidated basis and for each of our operating segments for the three years ended December 31, 2014:
Business segments - total (dollars in millions)
|
| | | | | | | | | | | |
| | 2014 | | 2013 | | 2012 |
| EBIT from In-Force Business | | | | | |
| Revenues: | | | | | |
| Insurance policy income | $ | 2,163.4 |
| | $ | 2,147.1 |
| | $ | 2,131.4 |
|
| Net investment income and other | 1,263.2 |
| | 1,348.8 |
| | 1,179.7 |
|
| Total revenues | 3,426.6 |
| | 3,495.9 |
| | 3,311.1 |
|
| Benefits and expenses: | | | | | |
| Insurance policy benefits | 2,136.4 |
| | 2,287.9 |
| | 2,107.1 |
|
| Amortization | 228.2 |
| | 236.3 |
| | 237.9 |
|
| Other expenses | 357.5 |
| | 358.6 |
| | 370.3 |
|
| Total benefits and expenses | 2,722.1 |
| | 2,882.8 |
| | 2,715.3 |
|
| EBIT from In-Force Business | $ | 704.5 |
| | $ | 613.1 |
| | $ | 595.8 |
|
| | | | | | |
| EBIT from New Business | | | | | |
| Revenues: | | | | | |
| Insurance policy income | $ | 360.3 |
| | $ | 379.3 |
| | $ | 378.3 |
|
| Net investment income and other | 43.3 |
| | 47.8 |
| | 38.7 |
|
| Total revenues | 403.6 |
| | 427.1 |
| | 417.0 |
|
| Benefits and expenses: | | | | | |
| Insurance policy benefits | 240.6 |
| | 267.1 |
| | 260.7 |
|
| Amortization | 26.4 |
| | 30.6 |
| | 29.6 |
|
| Other expenses | 342.2 |
| | 331.5 |
| | 311.1 |
|
| Total benefits and expenses | 609.2 |
| | 629.2 |
| | 601.4 |
|
| EBIT from New Business | $ | (205.6 | ) | | $ | (202.1 | ) | | $ | (184.4 | ) |
| | | | | | |
| EBIT from In-Force and New Business | | | | | |
| Revenues: | | | | | |
| Insurance policy income | $ | 2,523.7 |
| | $ | 2,526.4 |
| | $ | 2,509.7 |
|
| Net investment income and other | 1,306.5 |
| | 1,396.6 |
| | 1,218.4 |
|
| Total revenues | 3,830.2 |
| | 3,923.0 |
| | 3,728.1 |
|
| Benefits and expenses: | | | | | |
| Insurance policy benefits | 2,377.0 |
| | 2,555.0 |
| | 2,367.8 |
|
| Amortization | 254.6 |
| | 266.9 |
| | 267.5 |
|
| Other expenses | 699.7 |
| | 690.1 |
| | 681.4 |
|
| Total benefits and expenses | 3,331.3 |
| | 3,512.0 |
| | 3,316.7 |
|
| EBIT from In-Force and New Business | $ | 498.9 |
| | $ | 411.0 |
| | $ | 411.4 |
|
Bankers Life (dollars in millions)
|
| | | | | | | | | | | |
| | 2014 | | 2013 | | 2012 |
| EBIT from In-Force Business | | | | | |
| Revenues: | | | | | |
| Insurance policy income | $ | 1,411.0 |
| | $ | 1,378.0 |
| | $ | 1,381.3 |
|
| Net investment income and other | 943.3 |
| | 976.9 |
| | 815.4 |
|
| Total revenues | 2,354.3 |
| | 2,354.9 |
| | 2,196.7 |
|
| Benefits and expenses: | | | | | |
| Insurance policy benefits | 1,484.3 |
| | 1,574.7 |
| | 1,431.2 |
|
| Amortization | 153.3 |
| | 160.9 |
| | 161.8 |
|
| Other expenses | 184.7 |
| | 176.7 |
| | 186.4 |
|
| Total benefits and expenses | 1,822.3 |
| | 1,912.3 |
| | 1,779.4 |
|
| EBIT from In-Force Business | $ | 532.0 |
| | $ | 442.6 |
| | $ | 417.3 |
|
| | | | | | |
| EBIT from New Business | | | | | |
| Revenues: | | | | | |
| Insurance policy income | $ | 240.7 |
| | $ | 270.7 |
| | $ | 276.1 |
|
| Net investment income and other | 43.3 |
| | 47.8 |
| | 38.7 |
|
| Total revenues | 284.0 |
| | 318.5 |
| | 314.8 |
|
| Benefits and expenses: | | | | | |
| Insurance policy benefits | 183.3 |
| | 214.0 |
| | 211.7 |
|
| Amortization | 21.4 |
| | 26.6 |
| | 25.8 |
|
| Other expenses | 224.4 |
| | 210.0 |
| | 193.7 |
|
| Total benefits and expenses | 429.1 |
| | 450.6 |
| | 431.2 |
|
| EBIT from New Business | $ | (145.1 | ) | | $ | (132.1 | ) | | $ | (116.4 | ) |
| | | | | | |
| EBIT from In-Force and New Business | | | | | |
| Revenues: | | | | | |
| Insurance policy income | $ | 1,651.7 |
| | $ | 1,648.7 |
| | $ | 1,657.4 |
|
| Net investment income and other | 986.6 |
| | 1,024.7 |
| | 854.1 |
|
| Total revenues | 2,638.3 |
| | 2,673.4 |
| | 2,511.5 |
|
| Benefits and expenses: | | | | | |
| Insurance policy benefits | 1,667.6 |
| | 1,788.7 |
| | 1,642.9 |
|
| Amortization | 174.7 |
| | 187.5 |
| | 187.6 |
|
| Other expenses | 409.1 |
| | 386.7 |
| | 380.1 |
|
| Total benefits and expenses | 2,251.4 |
| | 2,362.9 |
| | 2,210.6 |
|
| EBIT from In-Force and New Business | $ | 386.9 |
| | $ | 310.5 |
| | $ | 300.9 |
|
Washington National (dollars in millions)
|
| | | | | | | | | | | |
| | 2014 | | 2013 | | 2012 |
| EBIT from In-Force Business | | | | | |
| Revenues: | | | | | |
| Insurance policy income | $ | 552.1 |
| | $ | 558.0 |
| | $ | 550.0 |
|
| Net investment income and other | 277.2 |
| | 297.8 |
| | 290.3 |
|
| Total revenues | 829.3 |
| | 855.8 |
| | 840.3 |
|
| Benefits and expenses: | | | | | |
| Insurance policy benefits | 505.2 |
| | 514.2 |
| | 476.4 |
|
| Amortization | 60.0 |
| | 61.3 |
| | 62.0 |
|
| Other expenses | 141.2 |
| | 128.4 |
| | 134.3 |
|
| Total benefits and expenses | 706.4 |
| | 703.9 |
| | 672.7 |
|
| EBIT from In-Force Business | $ | 122.9 |
| | $ | 151.9 |
| | $ | 167.6 |
|
| | | | | | |
| EBIT from New Business | | | | | |
| Revenues: | | | | | |
| Insurance policy income | $ | 73.9 |
| | $ | 63.5 |
| | $ | 58.9 |
|
| Net investment income and other | — |
| | — |
| | — |
|
| Total revenues | 73.9 |
| | 63.5 |
| | 58.9 |
|
| Benefits and expenses: | | | | | |
| Insurance policy benefits | 31.0 |
| | 27.2 |
| | 24.2 |
|
| Amortization | 4.6 |
| | 3.6 |
| | 2.9 |
|
| Other expenses | 50.0 |
| | 44.0 |
| | 50.6 |
|
| Total benefits and expenses | 85.6 |
| | 74.8 |
| | 77.7 |
|
| EBIT from New Business | $ | (11.7 | ) | | $ | (11.3 | ) | | $ | (18.8 | ) |
| | | | | | |
| EBIT from In-Force and New Business | | | | | |
| Revenues: | | | | | |
| Insurance policy income | $ | 626.0 |
| | $ | 621.5 |
| | $ | 608.9 |
|
| Net investment income and other | 277.2 |
| | 297.8 |
| | 290.3 |
|
| Total revenues | 903.2 |
| | 919.3 |
| | 899.2 |
|
| Benefits and expenses: | | | | | |
| Insurance policy benefits | 536.2 |
| | 541.4 |
| | 500.6 |
|
| Amortization | 64.6 |
| | 64.9 |
| | 64.9 |
|
| Other expenses | 191.2 |
| | 172.4 |
| | 184.9 |
|
| Total benefits and expenses | 792.0 |
| | 778.7 |
| | 750.4 |
|
| EBIT from In-Force and New Business | $ | 111.2 |
| | $ | 140.6 |
| | $ | 148.8 |
|
Colonial Penn (dollars in millions)
|
| | | | | | | | | | | |
| | 2014 | | 2013 | | 2012 |
| EBIT from In-Force Business | | | | | |
| Revenues: | | | | | |
| Insurance policy income | $ | 200.3 |
| | $ | 187.0 |
| | $ | 174.5 |
|
| Net investment income and other | 42.7 |
| | 40.8 |
| | 41.1 |
|
| Total revenues | 243.0 |
| | 227.8 |
| | 215.6 |
|
| Benefits and expenses: | | | | | |
| Insurance policy benefits | 146.9 |
| | 139.8 |
| | 136.3 |
|
| Amortization | 14.9 |
| | 14.1 |
| | 14.1 |
|
| Other expenses | 31.6 |
| | 27.7 |
| | 24.6 |
|
| Total benefits and expenses | 193.4 |
| | 181.6 |
| | 175.0 |
|
| EBIT from In-Force Business | $ | 49.6 |
| | $ | 46.2 |
| | $ | 40.6 |
|
| | | | | | |
| EBIT from New Business | | | | | |
| Revenues: | | | | | |
| Insurance policy income | $ | 45.7 |
| | $ | 45.1 |
| | $ | 43.3 |
|
| Net investment income and other | — |
| | — |
| | — |
|
| Total revenues | 45.7 |
| | 45.1 |
| | 43.3 |
|
| Benefits and expenses: | | | | | |
| Insurance policy benefits | 26.3 |
| | 25.9 |
| | 24.8 |
|
| Amortization | .4 |
| | .4 |
| | .9 |
|
| Other expenses | 67.8 |
| | 77.5 |
| | 66.8 |
|
| Total benefits and expenses | 94.5 |
| | 103.8 |
| | 92.5 |
|
| EBIT from New Business | $ | (48.8 | ) | | $ | (58.7 | ) | | $ | (49.2 | ) |
| | | | | | |
| EBIT from In-Force and New Business | | | | | |
| Revenues: | | | | | |
| Insurance policy income | $ | 246.0 |
| | $ | 232.1 |
| | $ | 217.8 |
|
| Net investment income and other | 42.7 |
| | 40.8 |
| | 41.1 |
|
| Total revenues | 288.7 |
| | 272.9 |
| | 258.9 |
|
| Benefits and expenses: | | | | | |
| Insurance policy benefits | 173.2 |
| | 165.7 |
| | 161.1 |
|
| Amortization | 15.3 |
| | 14.5 |
| | 15.0 |
|
| Other expenses | 99.4 |
| | 105.2 |
| | 91.4 |
|
| Total benefits and expenses | 287.9 |
| | 285.4 |
| | 267.5 |
|
| EBIT from In-Force and New Business | $ | .8 |
| | $ | (12.5 | ) | | $ | (8.6 | ) |
Other CNO Business (dollars in millions)
|
| | | | | | | |
| | 2013 | | 2012 |
| EBIT from In-Force Business (a) | | | |
| Revenues: | | | |
| Insurance policy income | $ | 24.1 |
| | $ | 25.6 |
|
| Net investment income and other | 33.3 |
| | 32.9 |
|
| Total revenues | 57.4 |
| | 58.5 |
|
| Benefits and expenses: | | | |
| Insurance policy benefits | 59.2 |
| | 63.2 |
|
| Amortization | — |
| | — |
|
| Other expenses | 25.8 |
| | 25.0 |
|
| Total benefits and expenses | 85.0 |
| | 88.2 |
|
| EBIT from In-Force Business | $ | (27.6 | ) | | $ | (29.7 | ) |
_________________________
| |
| (a) | All activity in the Other CNO Business segment related to in-force business. |
The above analysis of EBIT, separated between in-force and new business, illustrates how our segments are impacted by the rate of sales, mix of business and distribution channel through which new sales are made. In addition, when the impacts from new business are separated, the value drivers of our in-force business are more apparent.
The EBIT from in-force business in the Bankers Life segment grew in 2014 and 2013 primarily due to the growth in the size of the block. The EBIT from new business in the Bankers Life segment reflects new sales.
The EBIT from in-force business in the Washington National segment was lower in 2014 due to the run-off of the Medicare supplement business in this segment and additional overhead expenses that were previously allocated to the Other CNO Business segment. EBIT from in-force business in the Washington National segment was lower in 2013 due to higher supplemental health benefit ratios and the run-off of the Medicare supplement business in this segment as compared to 2012.
The EBIT from in-force business in the Colonial Penn segment in 2014 and 2013 reflects growth in the size of the block. The EBIT from new business in the Colonial Penn segment in 2014 reflects a modest increase in the deferral of acquisition costs due to a light shift to deferrable direct mail marketing activities. The vast majority of the costs to generate new business in this segment are not deferrable and EBIT will fluctuate based on management's decisions on how much marketing costs to incur in each period.
PREMIUM COLLECTIONS
In accordance with GAAP, insurance policy income in our consolidated statement of operations consists of premiums earned for traditional insurance policies that have life contingencies or morbidity features. For annuity and interest-sensitive life contracts, premiums collected are not reported as revenues, but as deposits to insurance liabilities. We recognize revenues for these products over time in the form of investment income and surrender or other charges.
Our insurance segments sell products through three primary distribution channels - career agents (our Bankers Life segment), direct marketing (our Colonial Penn segment) and independent producers (our Washington National segment). Our career agency force in the Bankers Life segment sells primarily Medicare supplement and long-term care insurance policies, life insurance and annuities. These agents visit the customer's home, which permits one-on-one contact with potential policyholders and promotes strong personal relationships with existing policyholders. Our direct marketing distribution channel in the Colonial Penn segment is engaged primarily in the sale of graded benefit life and simplified issue life insurance policies which are sold directly to the policyholder. Our Washington National segment sells primarily supplemental health and life insurance. These products are marketed through PMA, a subsidiary that specializes in marketing and distributing health products, and through independent marketing organizations and insurance agencies, including worksite marketing.
Agents, insurance brokers and marketing companies who market our products and prospective purchasers of our products use the financial strength ratings of our insurance subsidiaries as an important factor in determining whether to market or purchase. Ratings have the most impact on our sales of supplemental health and life products to consumers at the
worksite. The current financial strength ratings of our primary insurance subsidiaries from A.M. Best, S&P, Fitch and Moody's are "B++", "BBB+", "BBB" and "Baa2", respectively. For a description of these ratings and additional information on our ratings, see "Consolidated Financial Condition - Financial Strength Ratings of our Insurance Subsidiaries."
We set premium rates on our health insurance policies based on facts and circumstances known at the time we issue the policies using assumptions about numerous variables, including the actuarial probability of a policyholder incurring a claim, the probable size of the claim, and the interest rate earned on our investment of premiums. We also consider historical claims information, industry statistics, the rates of our competitors and other factors. If our actual claims experience is less favorable than we anticipated and we are unable to raise our premium rates, our financial results may be adversely affected. We generally cannot raise our health insurance premiums in any state until we obtain the approval of the state insurance regulator. We review the adequacy of our premium rates regularly and file for rate increases on our products when we believe such rates are too low. It is likely that we will not be able to obtain approval for all requested premium rate increases. If such requests are denied in one or more states, our net income may decrease. If such requests are approved, increased premium rates may reduce the volume of our new sales and may cause existing policyholders to lapse their policies. If the healthier policyholders allow their policies to lapse, this would reduce our premium income and profitability in the future.
Total premium collections by segment were as follows:
Bankers Life (dollars in millions)
|
| | | | | | | | | | | |
| | 2014 | | 2013 | | 2012 |
| Premiums collected by product: | | | | | |
| Annuities: | | | | | |
| Fixed index (first-year) | $ | 646.2 |
| | $ | 566.8 |
| | $ | 505.0 |
|
| Other fixed rate (first-year) | 129.1 |
| | 170.6 |
| | 198.0 |
|
| Other fixed rate (renewal) | 7.0 |
| | 6.7 |
| | 6.0 |
|
| Subtotal - other fixed rate annuities | 136.1 |
| | 177.3 |
| | 204.0 |
|
| Total annuities | 782.3 |
| | 744.1 |
| | 709.0 |
|
| Health: | | | | | |
| Medicare supplement (first-year) | 88.6 |
| | 92.1 |
| | 99.4 |
|
| Medicare supplement (renewal) | 654.7 |
| | 653.2 |
| | 617.8 |
|
| Subtotal - Medicare supplement | 743.3 |
| | 745.3 |
| | 717.2 |
|
| Long-term care (first-year) | 16.8 |
| | 21.2 |
| | 23.4 |
|
| Long-term care (renewal) | 483.8 |
| | 512.8 |
| | 523.1 |
|
| Subtotal - long-term care | 500.6 |
| | 534.0 |
| | 546.5 |
|
| PDP (first year) | — |
| | .1 |
| | .7 |
|
| PDP (renewal) | 6.8 |
| | 18.1 |
| | 47.1 |
|
| Subtotal – PDP | 6.8 |
| | 18.2 |
| | 47.8 |
|
| Supplemental health (first-year) | 7.6 |
| | 8.3 |
| | 1.9 |
|
| Supplemental health (renewal) | 8.7 |
| | 1.6 |
| | — |
|
| Subtotal – supplemental health | 16.3 |
| | 9.9 |
| | 1.9 |
|
| Other health (first-year) | .7 |
| | 1.3 |
| | 1.4 |
|
| Other health (renewal) | 7.4 |
| | 9.1 |
| | 9.1 |
|
| Subtotal - other health | 8.1 |
| | 10.4 |
| | 10.5 |
|
| Total health | 1,275.1 |
| | 1,317.8 |
| | 1,323.9 |
|
| Life insurance: | | | | | |
| First-year | 157.0 |
| | 163.3 |
| | 149.9 |
|
| Renewal | 267.9 |
| | 205.0 |
| | 164.7 |
|
| Total life insurance | 424.9 |
| | 368.3 |
| | 314.6 |
|
| Collections on insurance products: | | | | | |
| Total first-year premium collections on insurance products | 1,046.0 |
| | 1,023.7 |
| | 979.7 |
|
| Total renewal premium collections on insurance products | 1,436.3 |
| | 1,406.5 |
| | 1,367.8 |
|
| Total collections on insurance products | $ | 2,482.3 |
| | $ | 2,430.2 |
| | $ | 2,347.5 |
|
Annuities in this segment include fixed index and other fixed annuities sold to the senior market. Annuity collections in this segment increased 5.1 percent, to $782.3 million in 2014 and 5.0 percent, to $744.1 million, in 2013. Premium collections from our fixed index products were favorably impacted in 2014 and 2013 by the general stock market performance which made these products attractive to certain customers. Premium collections from Bankers Life's other fixed rate annuity products have decreased in recent periods as low new money rates negatively impacted our sales and the overall sales in the fixed rate annuity market.
Health products include Medicare supplement, long-term care, PDP contracts and other insurance products. Our profits on health policies depend on the overall level of sales, the length of time the business remains inforce, investment yields, claims experience and expense management.
Collected premiums on Medicare supplement policies in the Bankers Life segment decreased .3 percent, to $743.3 million, in 2014 and increased 3.9 percent, to $745.3 million, in 2013. In recent periods, we experienced a slight shift in the sale of Medicare supplement policies to the sale of Medicare Advantage policies. Medicare Advantage policies are sold through Bankers Life's agency force for other providers in exchange for marketing fees. Our new agents often focus their sales efforts on Medicare supplement products. Accordingly, first year collected premiums on Medicare supplement policies were impacted by lower recruiting levels of new agents in 2014.
Premiums collected on Bankers Life's long-term care policies decreased 6.3 percent, to $500.6 million in 2014 and 2.3 percent, to $534.0 million in 2013, reflecting the run-off of this business and a continuing shift in the mix of new business to short-term care sales, which have lower premiums per policy.
Premiums collected on PDP business related to our quota-share reinsurance agreement with Coventry. In August 2013, we received a notice of Coventry's intent to terminate our PDP quota-share reinsurance agreement as further described in the note to the consolidated financial statements entitled "Summary of Significant Accounting Policies - Reinsurance". The premiums collected in 2014 represent adjustments to premiums on such business related to periods prior to the termination of the agreement.
Premiums collected on supplemental health products relate to a new critical illness product that was introduced in 2012.
Life products in this segment include traditional and interest-sensitive life products. Life premiums collected in this segment increased 15 percent, $424.9 million, in 2014 and 17 percent, to $368.3 million, in 2013. Collected premiums in 2014 and 2013 reflect higher sales in this segment in recent years and higher persistency.
Washington National (dollars in millions)
|
| | | | | | | | | | | |
| | 2014 | | 2013 | | 2012 |
| Premiums collected by product: | | | | | |
| Health: | | | | | |
| Medicare supplement (first-year) | $ | — |
| | $ | .3 |
| | $ | 1.0 |
|
| Medicare supplement (renewal) | 85.2 |
| | 101.6 |
| | 112.9 |
|
| Subtotal - Medicare supplement | 85.2 |
| | 101.9 |
| | 113.9 |
|
| Supplemental health (first-year) | 72.8 |
| | 64.7 |
| | 59.2 |
|
| Supplemental health (renewal) | 442.6 |
| | 426.6 |
| | 400.5 |
|
| Subtotal – supplemental health | 515.4 |
| | 491.3 |
| | 459.7 |
|
| Other health (first-year) | .2 |
| | .2 |
| | — |
|
| Other health (renewal) | 2.2 |
| | 2.9 |
| | 3.4 |
|
| Subtotal – other health | 2.4 |
| | 3.1 |
| | 3.4 |
|
| Total health | 603.0 |
| | 596.3 |
| | 577.0 |
|
| Life insurance: | | | | | |
| First-year | 4.4 |
| | 4.6 |
| | 4.1 |
|
| Renewal | 21.5 |
| | 21.9 |
| | 19.7 |
|
| Total life insurance | 25.9 |
| | 26.5 |
| | 23.8 |
|
| Annuities: | | | | | |
| Fixed index (first-year) | .2 |
| | .4 |
| | .6 |
|
| Fixed index (renewal) | 1.8 |
| | 3.4 |
| | 2.3 |
|
| Subtotal - fixed index annuities | 2.0 |
| | 3.8 |
| | 2.9 |
|
| Other fixed rate (renewal) | .6 |
| | .5 |
| | .6 |
|
| Total annuities | 2.6 |
| | 4.3 |
| | 3.5 |
|
| Collections on insurance products: | | | | | |
| Total first-year premium collections on insurance products | 77.6 |
| | 70.2 |
| | 64.9 |
|
| Total renewal premium collections on insurance products | 553.9 |
| | 556.9 |
| | 539.4 |
|
| Total collections on insurance products | $ | 631.5 |
| | $ | 627.1 |
| | $ | 604.3 |
|
Health products in the Washington National segment include Medicare supplement, supplemental health and other insurance products. Our profits on health policies depend on the overall level of sales, the length of time the business remains inforce, investment yields, claim experience and expense management.
Collected premiums on Medicare supplement policies in the Washington National segment decreased 16 percent, to $85.2 million, in 2014 and 11 percent, to $101.9 million, in 2013. We discontinued new sales of Medicare supplement policies in this segment in the fourth quarter of 2012.
Premiums collected on supplemental health products (including specified disease, accident and hospital indemnity insurance products) increased 4.9 percent, to $515.4 million, in 2014 and 6.9 percent, to $491.3 million, in 2013. Such increases are due to higher new sales in each year and steady persistency.
Overall, excluding premiums from the Washington National Medicare supplement and annuity blocks which are in run-off, collected premiums were up 4.4 percent in 2014 compared to 2013, driven by strong sales and persistency.
Life products in the Washington National segment are primarily traditional life products. Life premiums collected decreased 2.3 percent, to $25.9 million, in 2014 and increased 11 percent, to $26.5 million, in 2013.
Annuities in this segment include fixed index and other fixed annuities. We are no longer actively pursuing sales of annuity products in this segment.
Colonial Penn (dollars in millions)
|
| | | | | | | | | | | |
| | 2014 | | 2013 | | 2012 |
| Premiums collected by product: | | | | | |
| Life insurance: | | | | | |
| First-year | $ | 45.7 |
| | $ | 45.2 |
| | $ | 43.1 |
|
| Renewal | 196.0 |
| | 182.4 |
| | 168.8 |
|
| Total life insurance | 241.7 |
| | 227.6 |
| | 211.9 |
|
| Health (all renewal): | | | | | |
| Medicare supplement | 3.2 |
| | 3.7 |
| | 4.5 |
|
| Other health | .2 |
| | .4 |
| | .4 |
|
| Total health | 3.4 |
| | 4.1 |
| | 4.9 |
|
| Collections on insurance products: | | | | | |
| Total first-year premium collections on insurance products | 45.7 |
| | 45.2 |
| | 43.1 |
|
| Total renewal premium collections on insurance products | 199.4 |
| | 186.5 |
| | 173.7 |
|
| Total collections on insurance products | $ | 245.1 |
| | $ | 231.7 |
| | $ | 216.8 |
|
Life products in this segment are sold primarily to the senior market. Life premiums collected in this segment increased 6.2 percent, to $241.7 million, in 2014 and 7.4 percent, to $227.6 million, in 2013. Graded benefit life products sold through our direct response marketing channel accounted for $239.5 million, $225.2 million and $209.2 million of collected premiums in 2014, 2013 and 2012, respectively.
Health products include Medicare supplement and other insurance products. Our profits on health policies depend on the overall level of sales, the length of time the business remains inforce, investment yields, claims experience and expense management. Premiums collected on these products have decreased as we do not currently market these products through this segment.
Other CNO Business (dollars in millions)
|
| | | | | | | | | | | |
| | 2014 | | 2013 | | 2012 |
| Premiums collected by product: | | | | | |
| Health: | | | | | |
| Long-term care (all renewal) | $ | — |
| | $ | 23.6 |
| | $ | 25.1 |
|
The Other CNO Business segment reflected the long-term care premiums collected prior to the reinsurance agreement with BRe effective December 31, 2013. Refer to the note to the consolidated financial statements entitled "Summary of Significant Accounting Policies - Reinsurance" for additional information.
INVESTMENTS
Our investment strategy is to: (i) provide largely stable investment income from a diversified high quality fixed income portfolio; (ii) mitigate the effect of changing interest rates through active asset/liability management; (iii) provide liquidity to meet our cash obligations to policyholders and others; and (iv) maximize total return through active investment management. Consistent with this strategy, investments in fixed maturity securities, mortgage loans and policy loans made up 90 percent of our $24.9 billion investment portfolio at December 31, 2014. The remainder of the invested assets was trading securities, investments held by variable interest entities, equity securities and other invested assets.
The following table summarizes the composition of our investment portfolio as of December 31, 2014 (dollars in millions):
|
| | | | | | |
| | Carrying value | | Percent of total investments |
| Fixed maturities, available for sale | $ | 20,634.9 |
| | 83 | % |
| Equity securities | 419.0 |
| | 2 |
|
| Mortgage loans | 1,691.9 |
| | 7 |
|
| Policy loans | 106.9 |
| | — |
|
| Trading securities | 244.9 |
| | 1 |
|
| Investments held by variable interest entities | 1,367.1 |
| | 5 |
|
| Company-owned life insurance | 157.6 |
| | 1 |
|
| Other invested assets | 286.0 |
| | 1 |
|
| Total investments | $ | 24,908.3 |
| | 100 | % |
Insurance statutes regulate the types of investments that our insurance subsidiaries are permitted to make and limit the amount of funds that may be used for any one type of investment. In addition, we have internal management compliance limits on various exposures and activities which are typically more restrictive than insurance statutes. In light of these statutes and regulations and our business and investment strategy, we generally seek to invest in United States government and government-agency securities and corporate securities rated investment grade by established nationally recognized rating organizations or in securities of comparable investment quality, if not rated.
The following table summarizes the carrying values and gross unrealized losses of our fixed maturity securities, available for sale, by category as of December 31, 2014 (dollars in millions):
|
| | | | | | | | | | | | | |
| | Carrying value | | Percent of fixed maturities | | Gross unrealized losses | | Percent of gross unrealized losses |
| States and political subdivisions | $ | 2,277.7 |
| | 11.0 | % | | $ | 3.0 |
| | 3.1 | % |
| Energy/pipelines | 2,007.2 |
| | 9.7 |
| | 49.0 |
| | 50.6 |
|
| Utilities | 1,780.7 |
| | 8.6 |
| | — |
| | — |
|
| Insurance | 1,468.8 |
| | 7.1 |
| | .7 |
| | .7 |
|
| Collateralized mortgage obligations | 1,341.0 |
| | 6.5 |
| | 1.3 |
| | 1.4 |
|
| Commercial mortgage-backed securities | 1,276.3 |
| | 6.2 |
| | .5 |
| | .6 |
|
| Asset-backed securities | 1,269.0 |
| | 6.2 |
| | 3.4 |
| | 3.5 |
|
| Healthcare/pharmaceuticals | 1,133.0 |
| | 5.5 |
| | 1.2 |
| | 1.2 |
|
| Food/beverage | 928.8 |
| | 4.5 |
| | 3.5 |
| | 3.6 |
|
| Cable/media | 853.4 |
| | 4.1 |
| | 3.2 |
| | 3.3 |
|
| Real estate/REITs | 723.2 |
| | 3.5 |
| | .1 |
| | .1 |
|
| Banks | 662.5 |
| | 3.2 |
| | .5 |
| | .6 |
|
| Capital goods | 587.7 |
| | 2.8 |
| | 1.7 |
| | 1.7 |
|
| Aerospace/defense | 401.7 |
| | 1.9 |
| | 1.2 |
| | 1.3 |
|
| Transportation | 397.2 |
| | 1.9 |
| | — |
| | — |
|
| Chemicals | 396.7 |
| | 1.9 |
| | 1.3 |
| | 1.3 |
|
| Telecom | 371.5 |
| | 1.8 |
| | 2.7 |
| | 2.8 |
|
| Collateralized debt obligations | 324.5 |
| | 1.6 |
| | 3.4 |
| | 3.5 |
|
| Building materials | 324.2 |
| | 1.6 |
| | 3.7 |
| | 3.8 |
|
| Metals and mining | 281.0 |
| | 1.4 |
| | 7.3 |
| | 7.6 |
|
| Paper | 260.5 |
| | 1.3 |
| | .1 |
| | .1 |
|
| Brokerage | 250.3 |
| | 1.2 |
| | .7 |
| | .7 |
|
| Technology | 220.2 |
| | 1.1 |
| | .4 |
| | .4 |
|
| Business services | 208.3 |
| | 1.0 |
| | 5.8 |
| | 6.0 |
|
| Other | 889.5 |
| | 4.4 |
| | 2.1 |
| | 2.1 |
|
| Total fixed maturities, available for sale | $ | 20,634.9 |
| | 100.0 | % | | $ | 96.8 |
| | 100.0 | % |
At December 31, 2014, the carrying value of the Company's fixed maturity securities in the energy/pipeline sector was $2.0 billion, with gross unrealized gains of $194.7 million and gross unrealized losses of $49.0 million. Although these securities are of high quality (87 percent are rated investment grade) and diversified (over 85 individual credits/issuers), we could be exposed to future downgrades and declines in market values if oil prices remain at low levels for an extended period of time.
The following table summarizes the gross unrealized losses of our fixed maturity securities, available for sale, by category and ratings category as of December 31, 2014 (dollars in millions):
|
| | | | | | | | | | | | | | | | | | | |
| | Investment grade | | Below-investment grade | | |
| | AAA/AA/A | | BBB | | BB | | B+ and below | | Total gross unrealized
losses |
| Energy/pipelines | $ | 1.6 |
| | $ | 26.3 |
| | $ | 6.4 |
| | $ | 14.7 |
| | $ | 49.0 |
|
| Metals and mining | — |
| | 6.7 |
| | .6 |
| | — |
| | 7.3 |
|
| Business services | — |
| | — |
| | 5.7 |
| | .1 |
| | 5.8 |
|
| Building materials | — |
| | — |
| | 3.3 |
| | .4 |
| | 3.7 |
|
| Food/beverage | .3 |
| | .2 |
| | 2.1 |
| | .9 |
| | 3.5 |
|
| Asset-backed securities | .5 |
| | 1.1 |
| | .1 |
| | 1.7 |
| | 3.4 |
|
| Collateralized debt obligations | 3.4 |
| | — |
| | — |
| | — |
| | 3.4 |
|
| Cable/media | — |
| | 1.5 |
| | .9 |
| | .8 |
| | 3.2 |
|
| States and political subdivisions | .7 |
| | — |
| | 2.3 |
| | — |
| | 3.0 |
|
| Telecom | — |
| | — |
| | 1.6 |
| | 1.2 |
| | 2.8 |
|
| Capital goods | — |
| | .1 |
| | — |
| | 1.6 |
| | 1.7 |
|
| Collateralized mortgage obligations | .5 |
| | .1 |
| | .3 |
| | .4 |
| | 1.3 |
|
| Chemicals | — |
| | 1.1 |
| | — |
| | .2 |
| | 1.3 |
|
| Aerospace/defense | — |
| | — |
| | .1 |
| | 1.1 |
| | 1.2 |
|
| Healthcare/pharmaceuticals | — |
| | 1.0 |
| | .2 |
| | — |
| | 1.2 |
|
| Retail | — |
| | .8 |
| | — |
| | — |
| | .8 |
|
| Brokerage | — |
| | .5 |
| | .2 |
| | — |
| | .7 |
|
| Insurance | .1 |
| | .6 |
| | — |
| | — |
| | .7 |
|
| Commercial mortgage-backed securities | .5 |
| | — |
| | — |
| | — |
| | .5 |
|
| Banks | .4 |
| | .1 |
| | — |
| | — |
| | .5 |
|
| Technology | — |
| | — |
| | .1 |
| | .3 |
| | .4 |
|
| Autos | — |
| | .1 |
| | .2 |
| | — |
| | .3 |
|
| Consumer products | — |
| | — |
| | .1 |
| | — |
| | .1 |
|
| Paper | — |
| | .1 |
| | — |
| | — |
| | .1 |
|
| United States Treasury securities and obligations of United States government corporations and agencies | .1 |
| | — |
| | — |
| | — |
| | .1 |
|
| Entertainment/hotels | — |
| | — |
| | .1 |
| | — |
| | .1 |
|
| Gaming | — |
| | — |
| | .1 |
| | — |
| | .1 |
|
| Other | — |
| | .6 |
| | — |
| | — |
| | .6 |
|
| Total fixed maturities, available for sale | $ | 8.1 |
| | $ | 40.9 |
| | $ | 24.4 |
| | $ | 23.4 |
| | $ | 96.8 |
|
Our investment strategy is to maximize, over a sustained period and within acceptable parameters of quality and risk, investment income and total investment return through active investment management. Accordingly, we may sell securities at a gain or a loss to enhance the projected total return of the portfolio as market opportunities change, to reflect changing perceptions of risk, or to better match certain characteristics of our investment portfolio with the corresponding characteristics of our insurance liabilities.
Our fixed maturity securities consist predominantly of publicly traded securities. We classify securities issued in the Rule 144A market as publicly traded. Securities not publicly traded comprise approximately 10 percent of our total fixed maturity securities portfolio.
Fair Value of Investments
Fair value is the price that would be received to sell an asset or paid to transfer a liability in an orderly transaction between market participants at the measurement date and, therefore, represents an exit price, not an entry price. We carry certain assets and liabilities at fair value on a recurring basis, including fixed maturities, equity securities, trading securities, investments held by VIEs, derivatives, cash and cash equivalents, separate account assets and embedded derivatives. We carry our company-owned life insurance policy, which is backed by a series of mutual funds, at its cash surrender value and our hedge fund investments at their net asset values; in both cases, we believe these values approximate their fair values. In addition, we disclose fair value for certain financial instruments, including mortgage loans and policy loans, insurance liabilities for interest-sensitive products, investment borrowings, notes payable and borrowings related to VIEs.
The degree of judgment utilized in measuring the fair value of financial instruments is largely dependent on the level to which pricing is based on observable inputs. Observable inputs reflect market data obtained from independent sources, while unobservable inputs reflect our view of market assumptions in the absence of observable market data. Financial instruments with readily available active quoted prices would be considered to have fair values based on the highest level of observable inputs, and little judgment would be utilized in measuring fair value. Financial instruments that rarely trade would often have fair value based on a lower level of observable inputs, and more judgment would be utilized in measuring fair value.
Valuation Hierarchy
There is a three-level hierarchy for valuing assets or liabilities at fair value based on whether inputs are observable or unobservable.
| |
| • | Level 1 – includes assets and liabilities valued using inputs that are unadjusted quoted prices in active markets for identical assets or liabilities. Our Level 1 assets primarily include cash and exchange traded securities. |
| |
| • | Level 2 – includes assets and liabilities valued using inputs that are quoted prices for similar assets in an active market, quoted prices for identical or similar assets in a market that is not active, observable inputs, or observable inputs that can be corroborated by market data. Level 2 assets and liabilities include those financial instruments that are valued by independent pricing services using models or other valuation methodologies. These models consider various inputs such as interest rate, credit or issuer spreads, reported trades and other inputs that are observable or derived from observable information in the marketplace or are supported by observable levels at which transactions are executed in the marketplace. Financial assets in this category primarily include: certain public and privately placed corporate fixed maturity securities; certain government or agency securities; certain mortgage and asset-backed securities; certain equity securities; most investments held by our consolidated VIEs; certain mutual fund and hedge fund investments; and most short-term investments; and non-exchange-traded derivatives such as call options to hedge liabilities related to our fixed index annuity products. Financial liabilities in this category include investment borrowings, notes payable and borrowings related to VIEs. |
| |
| • | Level 3 – includes assets and liabilities valued using unobservable inputs that are used in model-based valuations that contain management assumptions. Level 3 assets and liabilities include those financial instruments whose fair value is estimated based on broker/dealer quotes, pricing services or internally developed models or methodologies utilizing significant inputs not based on, or corroborated by, readily available market information. Financial assets in this category include certain corporate securities (primarily certain below-investment grade privately placed securities), certain structured securities, mortgage loans, and other less liquid securities. Financial liabilities in this category include our insurance liabilities for interest-sensitive products, which includes embedded derivatives (including embedded derivatives related to our fixed index annuity products and to a modified coinsurance arrangement) since their values include significant unobservable inputs including actuarial assumptions. |
At each reporting date, we classify assets and liabilities into the three input levels based on the lowest level of input that is significant to the measurement of fair value for each asset and liability reported at fair value. This classification is impacted by a number of factors, including the type of financial instrument, whether the financial instrument is new to the market and not yet established, the characteristics specific to the transaction and overall market conditions. Our assessment of the significance of a particular input to the fair value measurement and the ultimate classification of each asset and liability requires judgment and is subject to change from period to period based on the observability of the valuation inputs. Any transfers between levels are reported as having occurred at the beginning of the period. There were no transfers between Level 1 and Level 2 in 2014 and 2013.
The vast majority of our fixed maturity and equity securities, including those held in trading portfolios and those held by consolidated VIEs, short-term and separate account assets use Level 2 inputs for the determination of fair value. These fair values are obtained primarily from independent pricing services, which use Level 2 inputs for the determination of fair value. Substantially all of our Level 2 fixed maturity securities and separate account assets were valued from independent pricing services. Third party pricing services normally derive the security prices through recently reported trades for identical or similar securities making adjustments through the reporting date based upon available market observable information. If there are no recently reported trades, the third party pricing services may use matrix or model processes to develop a security price where future cash flow expectations are discounted at an estimated risk-adjusted market rate. The number of prices obtained for a given security is dependent on the Company's analysis of such prices as further described below.
For securities that are not priced by pricing services and may not be reliably priced using pricing models, we obtain broker quotes. These broker quotes are non-binding and represent an exit price, but assumptions used to establish the fair value may not be observable and therefore represent Level 3 inputs. Approximately 26 percent of our Level 3 fixed maturity securities were valued using unadjusted broker quotes or broker-provided valuation inputs. The remaining Level 3 fixed maturity investments do not have readily determinable market prices and/or observable inputs. For these securities, we use internally developed valuations. Key assumptions used to determine fair value for these securities may include risk-free rates, risk premiums, performance of underlying collateral and other factors involving significant assumptions which may not be reflective of an active market. For certain investments, we use a matrix or model process to develop a security price where future cash flow expectations are developed and discounted at an estimated market rate. The pricing matrix incorporates term interest rates as well as a spread level based on the issuer's credit rating and other factors relating to the issuer and the security's maturity. In some instances issuer-specific spread adjustments, which can be positive or negative, are made based upon internal analysis of security specifics such as liquidity, deal size, and time to maturity.
As the Company is responsible for the determination of fair value, we have control processes designed to ensure that the fair values received from third-party pricing sources are reasonable and the valuation techniques and assumptions used appear reasonable and consistent with prevailing market conditions. Additionally, when inputs are provided by third-party pricing sources, we have controls in place to review those inputs for reasonableness. As part of these controls, we perform monthly quantitative and qualitative analysis on the prices received from third parties to determine whether the prices are reasonable estimates of fair value. The Company's analysis includes: (i) a review of the methodology used by third party pricing services; (ii) where available, a comparison of multiple pricing services' valuations for the same security; (iii) a review of month to month price fluctuations; (iv) a review to ensure valuations are not unreasonably dated; and (v) back testing to compare actual purchase and sale transactions with valuations received from third parties. As a result of such procedures, the Company may conclude the prices received from third parties are not reflective of current market conditions. In those instances, we may request additional pricing quotes or apply internally developed valuations. However, the number of instances is insignificant and the aggregate change in value of such investments is not materially different from the original prices received.
The categorization of the fair value measurements of our investments priced by independent pricing services was based upon the Company's judgment of the inputs or methodologies used by the independent pricing services to value different asset classes. Such inputs typically include: benchmark yields, reported trades, broker dealer quotes, issuer spreads, benchmark securities, bids, offers and reference data. The Company categorizes such fair value measurements based upon asset classes and the underlying observable or unobservable inputs used to value such investments.
The fair value measurements for derivative instruments, including embedded derivatives requiring bifurcation, are determined based on the consideration of several inputs including closing exchange or over-the-counter market price quotations; time value and volatility factors underlying options; market interest rates; and non-performance risk. For certain embedded derivatives, we use actuarial assumptions in the determination of fair value.
The categorization of fair value measurements, by input level, for our financial instruments carried at fair value on a recurring basis at December 31, 2014 is as follows (dollars in millions):
|
| | | | | | | | | | | | | | | |
| | Quoted prices in active markets
for identical assets or liabilities
(Level 1) | | Significant other observable inputs (Level 2) | | Significant unobservable inputs (Level 3) | | Total |
| Assets: | | | | | | | |
| Fixed maturities, available for sale: | | | | | | | |
| Corporate securities | $ | — |
| | $ | 13,605.1 |
| | $ | 365.9 |
| | $ | 13,971.0 |
|
| United States Treasury securities and obligations of United States government corporations and agencies | — |
| | 168.9 |
| | — |
| | 168.9 |
|
| States and political subdivisions | — |
| | 2,242.2 |
| | 35.5 |
| | 2,277.7 |
|
| Debt securities issued by foreign governments | — |
| | 1.9 |
| | — |
| | 1.9 |
|
| Asset-backed securities | — |
| | 1,209.8 |
| | 59.2 |
| | 1,269.0 |
|
| Collateralized debt obligations | — |
| | 324.5 |
| | — |
| | 324.5 |
|
| Commercial mortgage-backed securities | — |
| | 1,275.1 |
| | 1.2 |
| | 1,276.3 |
|
| Mortgage pass-through securities | — |
| | 4.2 |
| | .4 |
| | 4.6 |
|
| Collateralized mortgage obligations | — |
| | 1,341.0 |
| | — |
| | 1,341.0 |
|
| Total fixed maturities, available for sale | — |
| | 20,172.7 |
| | 462.2 |
| | 20,634.9 |
|
| Equity securities - corporate securities | 216.9 |
| | 174.1 |
| | 28.0 |
| | 419.0 |
|
| Trading securities: | |
| | |
| | |
| | |
|
| Corporate securities | — |
| | 24.3 |
| | — |
| | 24.3 |
|
| United States Treasury securities and obligations of United States government corporations and agencies | — |
| | 3.7 |
| | — |
| | 3.7 |
|
| Asset-backed securities | — |
| | 24.0 |
| | — |
| | 24 |
|
| Commercial mortgage-backed securities | — |
| | 131.0 |
| | 28.6 |
| | 159.6 |
|
| Mortgage pass-through securities | — |
| | .1 |
| | — |
| | .1 |
|
| Collateralized mortgage obligations | — |
| | 29.7 |
| | — |
| | 29.7 |
|
| Equity securities | 3.5 |
| | — |
| | — |
| | 3.5 |
|
| Total trading securities | 3.5 |
| | 212.8 |
| | 28.6 |
| | 244.9 |
|
| Investments held by variable interest entities - corporate securities | — |
| | 1,367.1 |
| | — |
| | 1,367.1 |
|
| Other invested assets - derivatives | 1.4 |
| | 107.2 |
| | — |
| | 108.6 |
|
| Assets held in separate accounts | — |
| | 5.6 |
| | — |
| | 5.6 |
|
| Total assets carried at fair value by category | $ | 221.8 |
| | $ | 22,039.5 |
| | $ | 518.8 |
| | $ | 22,780.1 |
|
| | | | | | | | |
| Liabilities: | |
| | |
| | |
| | |
|
| Future policy benefits - embedded derivatives associated with fixed index annuity products | $ | — |
| | $ | — |
| | $ | 1,081.5 |
| | $ | 1,081.5 |
|
The following table presents additional information about assets and liabilities measured at fair value on a recurring basis and for which we have utilized significant unobservable (Level 3) inputs to determine fair value for the year ended December 31, 2014 (dollars in millions):
|
| | | | | | | | | | | | | | | | | | | | | | | | | | | | | | | | | | | | |
| | | December 31, 2014 | | |
| | | Beginning balance as of December 31, 2013 | | Purchases, sales, issuances and settlements, net (b) | | Total realized and unrealized gains (losses) included in net income | | Total realized and unrealized gains (losses) included in accumulated other comprehensive income (loss) | | Transfers into Level 3 (a) | | Transfers out of Level 3 (a) | | Assets of CLIC sold | | Ending balance as of December 31, 2014 | | Amount of total gains (losses) for the year ended December 31, 2014 included in our net income relating to assets and liabilities still held as of the reporting date |
| Assets: | | | | | | | | | | | | | | | | | | |
| Fixed maturities, available for sale: | | | | | | | | | | | | | | | | | | |
| Corporate securities | | $ | 359.6 |
| | $ | 70.0 |
| | $ | — |
| | $ | 20.1 |
| | $ | 36.8 |
| | $ | (69.4 | ) | | $ | (51.2 | ) | | $ | 365.9 |
| | $ | — |
|
| States and political subdivisions | | — |
| | (1.8 | ) | | — |
| | 3.0 |
| | 36.5 |
| | — |
| | (2.2 | ) | | 35.5 |
| | — |
|
| Asset-backed securities | | 42.2 |
| | 7.6 |
| | — |
| | 5.1 |
| | 14.0 |
| | — |
| | (9.7 | ) | | 59.2 |
| | — |
|
| Collateralized debt obligations | | 246.7 |
| | — |
| | — |
| | — |
| | — |
| | (246.7 | ) | | — |
| | — |
| | — |
|
| Commercial mortgage-backed securities | | — |
| | 1.1 |
| | — |
| | .1 |
| | — |
| | — |
| | — |
| | 1.2 |
| | — |
|
| Mortgage pass-through securities | | 1.6 |
| | (1.2 | ) | | — |
| | — |
| | — |
| | — |
| | — |
| | .4 |
| | — |
|
| Total fixed maturities, available for sale | | 650.1 |
| | 75.7 |
| | — |
| | 28.3 |
| | 87.3 |
| | (316.1 | ) | | (63.1 | ) | | 462.2 |
| | — |
|
| Equity securities - corporate securities | | 24.5 |
| | 3.5 |
| | — |
| | — |
| | — |
| | — |
| | — |
| | 28.0 |
| | — |
|
| Trading securities - commercial mortgage-backed securities | | — |
| | 29.0 |
| | — |
| | (.4 | ) | | — |
| | — |
| | — |
| | 28.6 |
| | (.4 | ) |
| Liabilities: | | |
| | |
| | |
| | |
| | |
| | |
| | | | |
| | |
|
| Future policy benefits - embedded derivatives associated with fixed index annuity products | | (903.7 | ) | | (104.3 | ) | | (73.5 | ) | | — |
| | — |
| | — |
| | — |
| | (1,081.5 | ) | | (73.5 | ) |
| Other liabilities - embedded derivatives associated with modified coinsurance agreement | | (1.8 | ) | | 1.8 |
| | — |
| | — |
| | — |
| | — |
| | — |
| | — |
| | — |
|
| Total liabilities | | (905.5 | ) | | (102.5 | ) | | (73.5 | ) | | — |
| | — |
| | — |
| | — |
| | (1,081.5 | ) | | (73.5 | ) |
_________
| |
| (a) | Transfers into Level 3 are the result of unobservable inputs utilized within valuation methodologies for assets that were previously valued using observable inputs. Transfers out of Level 3 are due to the use of observable inputs in valuation methodologies as well as the utilization of pricing service information for certain assets that the Company is able to validate. |
| |
| (b) | Purchases, sales, issuances and settlements, net, represent the activity that occurred during the period that results in a change of the asset or liability but does not represent changes in fair value for the instruments held at the beginning of the period. Such activity primarily consists of purchases and sales of fixed maturity and equity securities and changes to embedded derivative instruments related to insurance products resulting from the issuance of new contracts, or changes to existing contracts. The following summarizes such activity for the year ended December 31, 2014 (dollars in millions): |
|
| | | | | | | | | | | | | | | | | | | |
| | Purchases | | Sales | | Issuances | | Settlements | | Purchases, sales, issuances and settlements, net |
| Assets: | | | | | | | | | |
| Fixed maturities, available for sale: | | | | | | | | | |
| Corporate securities | $ | 71.7 |
| | $ | (1.7 | ) | | $ | — |
| | $ | — |
| | $ | 70.0 |
|
| States and political subdivisions | — |
| | (1.8 | ) | | — |
| | — |
| | (1.8 | ) |
| Asset-backed securities | 9.9 |
| | (2.3 | ) | | — |
| | — |
| | 7.6 |
|
| Commercial mortgage-backed securities | 1.1 |
| | — |
| | — |
| | — |
| | 1.1 |
|
| Mortgage pass-through securities | 1.1 |
| | (2.3 | ) | | — |
| | — |
| | (1.2 | ) |
| Total fixed maturities, available for sale | 83.8 |
| | (8.1 | ) | | — |
| | — |
| | 75.7 |
|
| Equity securities - corporate securities | 3.5 |
| | — |
| | — |
| | — |
| | 3.5 |
|
| Trading securities - commercial mortgage-backed securities | 29.0 |
| | — |
| | — |
| | — |
| | 29.0 |
|
| Liabilities: | | | | | | | | | |
| Future policy benefits - embedded derivatives associated with fixed index annuity products | (121.9 | ) | | 7.5 |
| | (45.9 | ) | | 56.0 |
| | (104.3 | ) |
| Other liabilities - embedded derivatives associated with modified coinsurance agreement | — |
| | 3.4 |
| | (1.6 | ) | | — |
| | 1.8 |
|
| Total liabilities | (121.9 | ) | | 10.9 |
| | (47.5 | ) | | 56.0 |
| | (102.5 | ) |
At December 31, 2014, 85 percent of our Level 3 fixed maturities, available for sale, were investment grade and 79 percent of our Level 3 fixed maturities, available for sale, consisted of corporate securities.
Realized and unrealized investment gains and losses presented in the preceding tables represent gains and losses during the time the applicable financial instruments were classified as Level 3.
Realized and unrealized gains (losses) on Level 3 assets are primarily reported in either net investment income for policyholder and reinsurer accounts and other special-purpose portfolios, net realized investment gains (losses) or insurance policy benefits within the consolidated statement of operations or accumulated other comprehensive income within shareholders' equity based on the appropriate accounting treatment for the instrument.
The amount presented for gains (losses) included in our net loss for assets and liabilities still held as of the reporting date primarily represents impairments for fixed maturities, available for sale, changes in fair value of trading securities and certain derivatives and changes in fair value of embedded derivative instruments included in liabilities for insurance products that exist as of the reporting date.
Investment ratings are assigned the second lowest rating by Nationally Recognized Statistical Rating Organizations ("NRSROs") (Moody's, S&P or Fitch), or if not rated by such firms, the rating assigned by the NAIC. NAIC designations of "1" or "2" include fixed maturities generally rated investment grade (rated "Baa3" or higher by Moody's or rated "BBB-" or
higher by S&P and Fitch). NAIC designations of "3" through "6" are referred to as below-investment grade (which generally are rated "Ba1" or lower by Moody's or rated "BB+" or lower by S&P and Fitch). References to investment grade or below-investment grade throughout our consolidated financial statements are determined as described above. The following table sets forth fixed maturity investments at December 31, 2014, classified by ratings (dollars in millions):
|
| | | | | | | | | | |
| | | | Estimated fair value |
| Investment rating | Amortized cost | | Amount | | Percent of fixed maturities |
| AAA | $ | 971.9 |
| | $ | 1,038.1 |
| | 5 | % |
| AA | 1,745.6 |
| | 1,998.4 |
| | 10 |
|
| A | 4,840.4 |
| | 5,669.5 |
| | 27 |
|
| BBB+ | 2,275.9 |
| | 2,650.3 |
| | 13 |
|
| BBB | 3,326.7 |
| | 3,708.9 |
| | 18 |
|
| BBB- | 2,908.4 |
| | 3,153.6 |
| | 15 |
|
| Investment grade | 16,068.9 |
| | 18,218.8 |
| | 88 |
|
| BB+ | 252.0 |
| | 263.6 |
| | 1 |
|
| BB | 310.7 |
| | 310.5 |
| | 2 |
|
| BB- | 437.9 |
| | 438.0 |
| | 2 |
|
| B+ and below | 1,338.6 |
| | 1,404.0 |
| | 7 |
|
| Below-investment grade | 2,339.2 |
| | 2,416.1 |
| | 12 |
|
| Total fixed maturity securities | $ | 18,408.1 |
| | $ | 20,634.9 |
| | 100 | % |
The following table summarizes investment yields earned over the past three years on the general account invested assets of our insurance subsidiaries. General account investments exclude the value of options (dollars in millions).
|
| | | | | | | | | | | |
| | 2014 | | 2013 | | 2012 |
| Weighted average general account invested assets at amortized cost | $ | 22,939.9 |
| | $ | 24,693.2 |
| | $ | 24,215.5 |
|
| Net investment income on general account invested assets | 1,304.3 |
| | 1,412.5 |
| | 1,394.9 |
|
| Yield earned | 5.69 | % | | 5.72 | % | | 5.76 | % |
Although investment income is a significant component of total revenues, the profitability of certain of our insurance products is evaluated primarily by the spreads between the interest rates we earn and the rates we credit or accrue to our insurance liabilities. At both December 31, 2014 and 2013, the average yield, computed on the cost basis of our fixed maturity portfolio, was 5.6 percent and the average interest rate credited or accruing to our total insurance liabilities (excluding interest rate bonuses for the first policy year only and excluding the effect of credited rates attributable to variable or fixed index products) was 4.5 percent.
Fixed Maturities, Available for Sale
Our fixed maturity portfolio at December 31, 2014, included primarily debt securities of the United States government, various corporations, and structured securities. Asset-backed securities, collateralized debt obligations, commercial mortgage-backed securities, mortgage pass-through securities and collateralized mortgage obligations are collectively referred to as "structured securities".
At December 31, 2014, our fixed maturity portfolio had $2,323.6 million of unrealized gains and $96.8 million of unrealized losses, for a net unrealized gain of $2,226.8 million. Estimated fair values of fixed maturity investments were determined based on estimates from: (i) nationally recognized pricing services (89 percent of the portfolio); (ii) broker-dealer market makers (1 percent of the portfolio); and (iii) internally developed methods (10 percent of the portfolio).
At December 31, 2014, approximately 10 percent of our invested assets (12 percent of fixed maturity investments) were fixed maturities rated below-investment grade. Our level of investments in below-investment grade fixed maturities could change based on market conditions or changes in our management policies. Below-investment grade corporate debt securities have different characteristics than investment grade corporate debt securities. Based on historical performance, probability of default by the borrower is significantly greater for below-investment grade securities and in many cases severity of loss is
relatively greater as such securities are often subordinated to other indebtedness of the issuer. Also, issuers of below-investment grade securities frequently have higher levels of debt relative to investment-grade issuers, hence, all other things being equal, are more sensitive to adverse economic conditions, such as recession or increasing interest rates. The Company attempts to reduce the overall risk related to its investment in below-investment grade securities, as in all investments, through careful credit analysis, strict investment policy guidelines, and diversification by issuer and/or guarantor and by industry. At December 31, 2014, our below-investment grade fixed maturity investments had an amortized cost of $2,339.2 million and an estimated fair value of $2,416.1 million.
We continually evaluate the creditworthiness of each issuer whose securities we hold. We pay special attention to large investments, investments which have significant risk characteristics and to those securities whose fair values have declined materially for reasons other than changes in interest rates or other general market conditions. We evaluate the realizable value of the investment, the specific condition of the issuer and the issuer's ability to comply with the material terms of the security. We review the recent operational results and financial position of the issuer, information about its industry, information about factors affecting the issuer's performance and other information. 40|86 Advisors employs experienced securities analysts in a broad variety of specialty areas who compile and review such data. If evidence does not exist to support a realizable value equal to or greater than the amortized cost of the investment, and such decline in fair value is determined to be other than temporary, we reduce the amortized cost to its fair value, which becomes the new cost basis. We report the amount of the reduction as a realized loss. We recognize any recovery of such reductions as investment income over the remaining life of the investment (but only to the extent our current valuations indicate such amounts will ultimately be collected), or upon the repayment of the investment. During 2014, we recognized net realized investment gains of $36.7 million, which were comprised of: (i) $54.4 million of net gains from the sales of investments (primarily fixed maturities) with proceeds of $2.1 billion; (ii) the increase in fair value of certain fixed maturity investments with embedded derivatives of $7.6 million; (iii) the increase in fair value of embedded derivatives related to a modified coinsurance agreement of $2.0 million; and (iv) $27.3 million of writedowns of investments for other than temporary declines in fair value recognized through net income. Our investment portfolio is subject to the risk of declines in realizable value. However, we attempt to mitigate this risk through the diversification and active management of our portfolio.
Our investment strategy is to maximize, over a sustained period and within acceptable parameters of quality and risk, investment income and total investment return through active investment management. Accordingly, we may sell securities at a gain or a loss to enhance the projected total return of the portfolio as market opportunities change, to reflect changing perceptions of risk, or to better match certain characteristics of our investment portfolio with the corresponding characteristics of our insurance liabilities.
As of December 31, 2014, we had no investments in substantive default (i.e., in default due to nonpayment of interest or principal). There were no other fixed maturity investments about which we had serious doubts as to the recoverability of the carrying value of the investment.
When a security defaults or securities (other than structured securities) are other-than-temporarily impaired, our policy is to discontinue the accrual of interest and eliminate all previous interest accruals, if we determine that such amounts will not be ultimately realized in full. Investment income forgone on nonperforming investments was less than $.1 million, $.5 million and $.6 million for the years ended December 31, 2014, 2013 and 2012, respectively.
At December 31, 2014 fixed maturity investments included structured securities with an estimated fair value of $4.2 billion (or 20 percent of all fixed maturity securities). The yield characteristics of structured securities generally differ in some respects from those of traditional corporate fixed-income securities or government securities. For example, interest and principal payments on structured securities may occur more frequently, often monthly. In many instances, we are subject to variability in the amount and timing of principal and interest payments. For example, in many cases, partial prepayments may occur at the option of the issuer and prepayment rates are influenced by a number of factors that cannot be predicted with certainty, including: the relative sensitivity of prepayments on the underlying assets backing the security to changes in interest rates and asset values; the availability and cost of alternative financing; a variety of economic, geographic and other factors; the timing, pace and proceeds of liquidations of defaulted collateral; and various security-specific structural considerations (for example, the repayment priority of a given security in a securitization structure). In addition, the total amount of payments for non-agency structured securities may be affected by changes to cumulative default rates or loss severities of the related collateral.
Historically, the rate of prepayments on structured securities has tended to increase when prevailing interest rates have declined significantly in absolute terms and also relative to the interest rates on the underlying collateral. The yields recognized on structured securities purchased at a discount to par will generally increase (relative to the stated rate) when the underlying
collateral prepays faster than expected. The yields recognized on structured securities purchased at a premium will decrease (relative to the stated rate) when the underlying collateral prepays faster than expected. When interest rates decline, the proceeds from prepayments may be reinvested at lower rates than we were earning on the prepaid securities. When interest rates increase, prepayments may decrease below expected levels. When this occurs, the average maturity and duration of structured securities increases, decreasing the yield on structured securities purchased at discounts and increasing the yield on those purchased at a premium because of a decrease in the annual amortization of premium.
For structured securities included in fixed maturities, available for sale, that were purchased at a discount or premium, we recognize investment income using an effective yield based on anticipated future prepayments and the estimated final maturity of the securities. Actual prepayment experience is periodically reviewed and effective yields are recalculated when differences arise between the prepayments originally anticipated and the actual prepayments received and currently anticipated. For credit sensitive mortgage-backed and asset-backed securities, and for securities that can be prepaid or settled in a way that we would not recover substantially all of our investment, the effective yield is recalculated on a prospective basis. Under this method, the amortized cost basis in the security is not immediately adjusted and a new yield is applied prospectively. For all other structured and asset-backed securities, the effective yield is recalculated when changes in assumptions are made, and reflected in our income on a retrospective basis. Under this method, the amortized cost basis of the investment in the securities is adjusted to the amount that would have existed had the new effective yield been applied since the acquisition of the securities. Such adjustments were not significant in 2014.
The following table sets forth the par value, amortized cost and estimated fair value of structured securities, summarized by interest rates on the underlying collateral, at December 31, 2014 (dollars in millions):
|
| | | | | | | | | | | |
| | Par value | | Amortized cost | | Estimated fair value |
| Below 4 percent | $ | 1,160.7 |
| | $ | 887.8 |
| | $ | 908.0 |
|
| 4 percent – 5 percent | 759.5 |
| | 717.6 |
| | 757.7 |
|
| 5 percent – 6 percent | 1,880.0 |
| | 1,760.1 |
| | 1,882.2 |
|
| 6 percent – 7 percent | 533.6 |
| | 496.5 |
| | 544.7 |
|
| 7 percent – 8 percent | 85.3 |
| | 87.0 |
| | 101.3 |
|
| 8 percent and above | 20.0 |
| | 20.9 |
| | 21.5 |
|
| Total structured securities | $ | 4,439.1 |
| | $ | 3,969.9 |
| | $ | 4,215.4 |
|
The amortized cost and estimated fair value of structured securities at December 31, 2014, summarized by type of security, were as follows (dollars in millions):
|
| | | | | | | | | | |
| | | | Estimated fair value |
| Type | Amortized cost | | Amount | | Percent of fixed maturities |
| Pass-throughs, sequential and equivalent securities | $ | 969.4 |
| | $ | 1,033.4 |
| | 5.0 | % |
| Planned amortization classes, target amortization classes and accretion-directed bonds | 243.3 |
| | 262.0 |
| | 1.3 |
|
| Commercial mortgage-backed securities | 1,195.0 |
| | 1,276.3 |
| | 6.2 |
|
| Asset-backed securities | 1,186.6 |
| | 1,269.0 |
| | 6.1 |
|
| Collateralized debt obligations | 325.3 |
| | 324.5 |
| | 1.6 |
|
| Other | 50.3 |
| | 50.2 |
| | .2 |
|
| Total structured securities | $ | 3,969.9 |
| | $ | 4,215.4 |
| | 20.4 | % |
Pass-throughs, sequentials and equivalent securities have unique prepayment variability characteristics. Pass-through securities typically return principal to the holders based on cash payments from the underlying mortgage obligations. Sequential securities return principal to tranche holders in a detailed hierarchy. Planned amortization classes, targeted amortization classes and accretion-directed bonds adhere to fixed schedules of principal payments as long as the underlying
mortgage loans experience prepayments within certain estimated ranges. In most circumstances, changes in prepayment rates are first absorbed by support or companion classes insulating the timing of receipt of cash flows from the consequences of both faster prepayments (average life shortening) and slower prepayments (average life extension).
Commercial mortgage-backed securities are secured by commercial real estate mortgages, generally income producing properties that are managed for profit. Property types include multi-family dwellings including apartments, retail centers, hotels, restaurants, hospitals, nursing homes, warehouses, and office buildings. While most commercial mortgage-backed securities have call protection features whereby underlying borrowers may not prepay their mortgages for stated periods of time without incurring prepayment penalties, recoveries on defaulted collateral may result in involuntary prepayments.
During 2014, we sold $233.7 million of fixed maturity investments which resulted in gross investment losses (before income taxes) of $13.0 million. Securities are generally sold at a loss following unforeseen issue-specific events or conditions or shifts in perceived risks. These reasons include but are not limited to: (i) changes in the investment environment; (ii) expectation that the market value could deteriorate further; (iii) desire to reduce our exposure to an asset class, an issuer or an industry; (iv) prospective or actual changes in credit quality; or (v) changes in expected cash flows.
Other Investments
At December 31, 2014, we held commercial mortgage loan investments with a carrying value of $1,691.9 million (or 6.8 percent of total invested assets) and a fair value of $1,768.9 million. We had no mortgage loans that were in the process of foreclosure at December 31, 2014. During 2014, 2013 and 2012, we recognized $6.8 million, $.8 million and $5.4 million, respectively, of impairments on commercial mortgage loans. Our commercial mortgage loan portfolio is comprised of large commercial mortgage loans. We do not hold groups of smaller-balance homogeneous loans. Our loans have risk characteristics that are individually unique. Accordingly, we measure potential losses on a loan-by-loan basis rather than establishing an allowance for losses on mortgage loans. Approximately 13 percent, 10 percent and 7 percent of the mortgage loan balance were on properties located in California, Texas and Maryland, respectively. No other state comprised greater than five percent of the mortgage loan balance.
The following table shows the distribution of our commercial mortgage loan portfolio by property type as of December 31, 2014 (dollars in millions):
|
| | | | | | |
| | Number of loans | | Carrying value |
| Retail | 124 |
| | $ | 473.2 |
|
| Office building | 56 |
| | 471.2 |
|
| Multi-family | 31 |
| | 428.4 |
|
| Industrial | 28 |
| | 223.3 |
|
| Other | 9 |
| | 95.8 |
|
| Total commercial mortgage loans | 248 |
| | $ | 1,691.9 |
|
The following table shows our commercial mortgage loan portfolio by loan size as of December 31, 2014 (dollars in millions):
|
| | | | | | |
| | Number of loans | | Carrying value |
| Under $5 million | 129 |
| | $ | 224.5 |
|
| $5 million but less than $10 million | 61 |
| | 425.3 |
|
| $10 million but less than $20 million | 35 |
| | 481.2 |
|
| Over $20 million | 23 |
| | 560.9 |
|
| Total commercial mortgage loans | 248 |
| | $ | 1,691.9 |
|
The following table summarizes the distribution of maturities of our commercial mortgage loans as of December 31, 2014 (dollars in millions):
|
| | | | | | |
| | Number of loans | | Carrying value |
| 2015 | 11 |
| | $ | 49.3 |
|
| 2016 | 16 |
| | 51.2 |
|
| 2017 | 21 |
| | 113.4 |
|
| 2018 | 31 |
| | 156.6 |
|
| 2019 | 24 |
| | 49.5 |
|
| after 2019 | 145 |
| | 1,271.9 |
|
| Total commercial mortgage loans | 248 |
| | $ | 1,691.9 |
|
The following table provides the carrying value and estimated fair value of our outstanding mortgage loans and the underlying collateral as of December 31, 2014 (dollars in millions):
|
| | | | | | | | | | | |
| | | | Estimated fair value |
| Loan-to-value ratio (a) | Carrying value | | Mortgage loans | | Collateral |
| Less than 60% | $ | 745.8 |
| | $ | 787.4 |
| | $ | 1,694.1 |
|
| 60% to 70% | 376.9 |
| | 387.1 |
| | 587.0 |
|
| Greater than 70% to 80% | 425.3 |
| | 441.6 |
| | 574.8 |
|
| Greater than 80% to 90% | 139.6 |
| | 147.8 |
| | 165.2 |
|
| Greater than 90% | 4.3 |
| | 5.0 |
| | 4.7 |
|
| Total | $ | 1,691.9 |
| | $ | 1,768.9 |
| | $ | 3,025.8 |
|
________________
| |
| (a) | Loan-to-value ratios are calculated as the ratio of: (i) the carrying value of the commercial mortgage loans; to (ii) the estimated fair value of the underlying collateral. |
At December 31, 2014, we held $244.9 million of trading securities. We carry trading securities at estimated fair value; changes in fair value are reflected in the statement of operations. Our trading securities include: (i) investments purchased with the intent of selling in the near term to generate income; (ii) investments supporting certain insurance liabilities (including investments backing the market strategies of our multibucket annuity products) and certain reinsurance agreements; and (iii) certain fixed maturity securities containing embedded derivatives for which we have elected the fair value option. Investment income from trading securities backing certain insurance liabilities and certain reinsurance agreements is substantially offset by the change in insurance policy benefits related to certain products and agreements.
Other invested assets also include options backing our fixed index products, COLI, credit default swaps and certain nontraditional investments, including investments in limited partnerships, promissory notes, hedge funds and real estate investments held for sale.
At December 31, 2014, we held investments with an amortized cost of $1,398.1 million and an estimated fair value of $1,367.1 million related to variable interest entities that we are required to consolidate. The investment portfolio held by the variable interest entities is primarily comprised of commercial bank loans, the borrowers for which are almost entirely rated below-investment grade. Refer to the note to the consolidated financial statements entitled "Investments in Variable Interest Entities" for additional information on these investments.
CONSOLIDATED FINANCIAL CONDITION
Changes in the Consolidated Balance Sheet
Changes in our consolidated balance sheet between December 31, 2014 and December 31, 2013, primarily reflect: (i) the sale of CLIC; (ii) our net income for 2014; (iii) changes in the fair value of our fixed maturity securities, available for sale; and (iv) payments to repurchase common stock and warrants of $376.5 million.
In accordance with GAAP, we record our fixed maturity securities, available for sale, equity securities and certain other invested assets at estimated fair value with any unrealized gain or loss (excluding impairment losses, which are recognized through earnings), net of tax and related adjustments, recorded as a component of shareholders' equity. At December 31, 2014, we increased the carrying value of such investments by $2.2 billion as a result of this fair value adjustment.
Our capital structure as of December 31, 2014 and December 31, 2013 was as follows (dollars in millions):
|
| | | | | | | |
| | December 31,
2014 | | December 31, 2013 |
| Total capital: | | | |
| Corporate notes payable | $ | 794.4 |
| | $ | 856.4 |
|
| Shareholders’ equity: | | | |
|
| Common stock | 2.0 |
| | 2.2 |
|
| Additional paid-in capital | 3,732.4 |
| | 4,092.8 |
|
| Accumulated other comprehensive income | 825.3 |
| | 731.8 |
|
| Retained earnings | 128.5 |
| | 128.4 |
|
| Total shareholders’ equity | 4,688.2 |
| | 4,955.2 |
|
| Total capital | $ | 5,482.6 |
| | $ | 5,811.6 |
|
The following table summarizes certain financial ratios as of and for the years ended December 31, 2014 and December 31, 2013:
|
| | | | | | | |
| | December 31,
2014 | | December 31, 2013 |
| Book value per common share | $ | 23.06 |
| | $ | 22.49 |
|
| Book value per common share, excluding accumulated other comprehensive income (a) | 19.00 |
| | 19.17 |
|
| Ratio of earnings to fixed charges | 1.62X |
| | 1.87X |
|
| Debt to total capital ratios: | | | |
| Corporate debt to total capital | 14.5 | % | | 14.7 | % |
| Corporate debt to total capital, excluding accumulated other comprehensive income (a) | 17.1 | % | | 16.9 | % |
_____________________
| |
| (a) | This non-GAAP measure differs from the corresponding GAAP measure presented immediately above, because accumulated other comprehensive income has been excluded from the value of capital used to determine this measure. Management believes this non-GAAP measure is useful because it removes the volatility that arises from changes in accumulated other comprehensive income. Such volatility is often caused by changes in the estimated fair value of our investment portfolio resulting from changes in general market interest rates rather than the business decisions made by management. However, this measure does not replace the corresponding GAAP measure. |
Contractual Obligations
The Company's significant contractual obligations as of December 31, 2014, were as follows (dollars in millions):
|
| | | | | | | | | | | | | | | | | | | |
| | | | Payment due in |
| | Total | | 2015 | | 2016-2017 | | 2018-2019 | | Thereafter |
| Insurance liabilities (a) | $ | 52,342.2 |
| | $ | 3,234.7 |
| | $ | 6,859.3 |
| | $ | 6,399.2 |
| | $ | 35,849.0 |
|
| Notes payable (b) | 961.8 |
| | 115.1 |
| | 130.1 |
| | 424.1 |
| | 292.5 |
|
| Investment borrowings (c) | 1,599.0 |
| | 84.2 |
| | 753.4 |
| | 662.2 |
| | 99.2 |
|
Borrowings related to variable interest entities (d) | 1,563.9 |
| | 66.1 |
| | 60.1 |
| | 121.7 |
| | 1,316.0 |
|
| Postretirement plans (e) | 270.1 |
| | 6.5 |
| | 13.9 |
| | 15.7 |
| | 234.0 |
|
| Operating leases and certain other contractual commitments (f) | 220.7 |
| | 129.1 |
| | 56.0 |
| | 24.5 |
| | 11.1 |
|
| Total | $ | 56,957.7 |
| | $ | 3,635.7 |
| | $ | 7,872.8 |
| | $ | 7,647.4 |
| | $ | 37,801.8 |
|
________________
| |
| (a) | These cash flows represent our estimates of the payments we expect to make to our policyholders, without consideration of future premiums or reinsurance recoveries. These estimates are based on numerous assumptions (depending on the product type) related to mortality, morbidity, lapses, withdrawals, future premiums, future deposits, interest rates on investments, credited rates, expenses and other factors which affect our future payments. The cash flows presented are undiscounted for interest. As a result, total outflows for all years exceed the corresponding liabilities of $22.3 billion included in our consolidated balance sheet as of December 31, 2014. As such payments are based on numerous assumptions, the actual payments may vary significantly from the amounts shown. |
In estimating the payments we expect to make to our policyholders, we considered the following:
| |
| • | For products such as immediate annuities and structured settlement annuities without life contingencies, the payment obligation is fixed and determinable based on the terms of the policy. |
| |
| • | For products such as universal life, ordinary life, long-term care, supplemental health and fixed rate annuities, the future payments are not due until the occurrence of an insurable event (such as death or disability) or a triggering event (such as a surrender or partial withdrawal). We estimated these payments using actuarial models based on historical experience and our expectation of the future payment patterns. |
| |
| • | For short-term insurance products such as Medicare supplement insurance, the future payments relate only to amounts necessary to settle all outstanding claims, including those that have been incurred but not reported as of the balance sheet date. We estimated these payments based on our historical experience and our expectation of future payment patterns. |
| |
| • | The average interest rate we assumed would be credited to our total insurance liabilities (excluding interest rate bonuses for the first policy year only and excluding the effect of credited rates attributable to variable or fixed index products) over the term of the contracts was 4.5 percent. |
| |
| (b) | Includes projected interest payments based on interest rates, as applicable, as of December 31, 2014. Refer to the note to the consolidated financial statements entitled "Notes Payable - Direct Corporate Obligations" for additional information on notes payable. |
| |
| (c) | These borrowings primarily represent collateralized borrowings from the FHLB. |
| |
| (d) | These borrowings represent the securities issued by VIEs and include projected interest payments based on interest rates, as applicable, as of December 31, 2014. |
| |
| (e) | Includes benefits expected to be paid pursuant to our deferred compensation plan and postretirement plans based on numerous actuarial assumptions and interest credited at 4.15 percent. |
| |
| (f) | Includes amounts related to noncancellable operating leases, sponsorship agreements and commitments to purchase investments. |
It is possible that the ultimate outcomes of various uncertainties could affect our liquidity in future periods. For example, the following events could have a material adverse effect on our cash flows:
| |
| • | An adverse decision in pending or future litigation. |
| |
| • | An inability to obtain rate increases on certain of our insurance products. |
| |
| • | Worse than anticipated claims experience. |
| |
| • | Lower than expected dividends and/or surplus debenture interest payments from our insurance subsidiaries (resulting from inadequate earnings or capital or regulatory requirements). |
| |
| • | An inability to meet and/or maintain the covenants in our Senior Secured Credit Agreement. |
| |
| • | A significant increase in policy surrender levels. |
| |
| • | A significant increase in investment defaults. |
| |
| • | An inability of our reinsurers to meet their financial obligations. |
While we actively manage the relationship between the duration and cash flows of our invested assets and the estimated duration and cash flows of benefit payments arising from contract liabilities, there could be significant variations in the timing of such cash flows. Although we believe our current estimates properly project future claim experience, if these estimates prove to be wrong, and our experience worsens (as it did in some prior periods), our future liquidity could be adversely affected.
Liquidity for Insurance Operations
Our insurance companies generally receive adequate cash flows from premium collections and investment income to meet their obligations. Life insurance, long-term care insurance and annuity liabilities are generally long-term in nature. Life and annuity policyholders may, however, withdraw funds or surrender their policies, subject to any applicable penalty provisions; there are generally no withdrawal or surrender benefits for long-term care insurance. We actively manage the relationship between the duration of our invested assets and the estimated duration of benefit payments arising from contract liabilities.
Two of the Company's insurance subsidiaries (Washington National and Bankers Life) are members of the FHLB. As members of the FHLB, Washington National and Bankers Life have the ability to borrow on a collateralized basis from the FHLB. Washington National and Bankers Life are required to hold certain minimum amounts of FHLB common stock as a condition of membership in the FHLB, and additional amounts based on the amount of the borrowings. At December 31, 2014, the carrying value of the FHLB common stock was $73.5 million. As of December 31, 2014, collateralized borrowings from the FHLB totaled $1.5 billion and the proceeds were used to purchase fixed maturity securities. The borrowings are classified as investment borrowings in the accompanying consolidated balance sheet. The borrowings are collateralized by investments with an estimated fair value of $1.8 billion at December 31, 2014, which are maintained in custodial accounts for the benefit of the FHLB. The following summarizes the terms of the borrowings from the FHLB by Washington National and Bankers Life (dollars in millions):
|
| | | | | | |
| Amount | | Maturity | | Interest rate at |
| borrowed | | date | | December 31, 2014 |
| $ | 50.0 |
| | October 2015 | | Variable rate – 0.511% |
| 100.0 |
| | June 2016 | | Variable rate – 0.610% |
| 75.0 |
| | June 2016 | | Variable rate – 0.417% |
| 100.0 |
| | October 2016 | | Variable rate – 0.413% |
| 50.0 |
| | November 2016 | | Variable rate – 0.505% |
| 50.0 |
| | November 2016 | | Variable rate – 0.640% |
| 57.7 |
| | June 2017 | | Variable rate – 0.587% |
| 50.0 |
| | August 2017 | | Variable rate – 0.432% |
| 75.0 |
| | August 2017 | | Variable rate – 0.383% |
| 100.0 |
| | October 2017 | | Variable rate – 0.661% |
| 50.0 |
| | November 2017 | | Variable rate – 0.744% |
| 50.0 |
| | January 2018 | | Variable rate – 0.579% |
| 50.0 |
| | January 2018 | | Variable rate – 0.571% |
| 50.0 |
| | February 2018 | | Variable rate – 0.542% |
| 50.0 |
| | February 2018 | | Variable rate – 0.322% |
| 22.0 |
| | February 2018 | | Variable rate – 0.566% |
| 100.0 |
| | May 2018 | | Variable rate – 0.620% |
| 50.0 |
| | July 2018 | | Variable rate – 0.703% |
| 50.0 |
| | August 2018 | | Variable rate – 0.352% |
| 50.0 |
| | January 2019 | | Variable rate – 0.649% |
| 50.0 |
| | February 2019 | | Variable rate – 0.322% |
| 100.0 |
| | March 2019 | | Variable rate – 0.642% |
| 21.8 |
| | July 2019 | | Variable rate – 0.655% |
| 21.8 |
| | June 2020 | | Fixed rate – 1.960% |
| 28.2 |
| | August 2021 | | Fixed rate – 2.550% |
| 26.8 |
| | March 2023 | | Fixed rate – 2.160% |
| 20.5 |
| | June 2025 | | Fixed rate – 2.940% |
| $ | 1,498.8 |
| | | | |
State laws generally give state insurance regulatory agencies broad authority to protect policyholders in their jurisdictions. Regulators have used this authority in the past to restrict the ability of our insurance subsidiaries to pay any dividends or other amounts without prior approval. We cannot be assured that the regulators will not seek to assert greater supervision and control over our insurance subsidiaries' businesses and financial affairs.
During 2014, the financial statements of three of our insurance subsidiaries prepared in accordance with statutory accounting practices prescribed or permitted by regulatory authorities reflected asset adequacy or premium deficiency reserves. Total asset adequacy and premium deficiency reserves for Washington National, Bankers Conseco Life and Bankers Life were
$8.0 million, $1.5 million and $54.0 million, respectively, at December 31, 2014. Due to differences between statutory and GAAP insurance liabilities, we were not required to recognize a similar asset adequacy or premium deficiency reserve in our consolidated financial statements prepared in accordance with GAAP. The determination of the need for and amount of asset adequacy or premium deficiency reserves is subject to numerous actuarial assumptions, including the Company's ability to change NGEs related to certain products consistent with contract provisions.
Financial Strength Ratings of our Insurance Subsidiaries
Financial strength ratings provided by A.M. Best, S&P, Fitch and Moody's are the rating agency's opinions of the ability of our insurance subsidiaries to pay policyholder claims and obligations when due.
On August 14, 2014, A.M. Best affirmed the financial strength ratings of "B++" of our primary insurance subsidiaries and revised the outlook for these ratings to positive from stable. A "positive" designation indicates a company's financial/market trends are favorable, relative to its current rating level and, if continued, the company has a good possibility of having its rating upgraded. The "B++" rating is assigned to companies that have a good ability, in A.M. Best's opinion, to meet their ongoing obligations to policyholders. A.M. Best ratings for the industry currently range from "A++ (Superior)" to "F (In Liquidation)" and some companies are not rated. An "A++" rating indicates a superior ability to meet ongoing obligations to policyholders. A.M. Best has sixteen possible ratings. There are four ratings above the "B++" rating of our primary insurance subsidiaries and eleven ratings that are below that rating.
On July 2, 2014, S&P upgraded the financial strength ratings of our primary insurance subsidiaries to "BBB+" from "BBB" and the outlook for these ratings is stable. S&P financial strength ratings range from "AAA" to "R" and some companies are not rated. An insurer rated "BBB" or higher is regarded as having financial security characteristics that outweigh any vulnerabilities, and is highly likely to have the ability to meet financial commitments. An insurer rated "BBB", in S&P's opinion, has good financial security characteristics, but is more likely to be affected by adverse business conditions than are higher-rated insurers. Pluses and minuses show the relative standing within a category. S&P has twenty-one possible ratings. There are seven ratings above the "BBB+" rating of our primary insurance subsidiaries and thirteen ratings that are below that rating.
On May 5, 2014, Fitch affirmed the financial strength ratings of "BBB" of our primary insurance subsidiaries and revised the outlook for these ratings to positive from stable. A "BBB" rating, in Fitch's opinion, indicates that there is currently a low expectation of ceased or interrupted payments. The capacity to meet policyholder and contract obligations on a timely basis is considered adequate, but adverse changes in circumstances and economic conditions are more likely to impact this capacity. Fitch ratings for the industry range from "AAA Exceptionally Strong" to "C Distressed" and some companies are not rated. Pluses and minuses show the relative standing within a category. Fitch has nineteen possible ratings. There are eight ratings above the "BBB" rating of our primary insurance subsidiaries and ten ratings that are below that rating.
On March 27, 2014, Moody's upgraded the financial strength ratings of our primary insurance subsidiaries to "Baa2" from "Baa3" and the outlook for these ratings is positive. A "positive" designation indicates a higher likelihood of a rating change over the medium term. Moody’s financial strength ratings range from "Aaa" to "C". These ratings may be supplemented with numbers "1", "2", or "3" to show relative standing within a category. In Moody's view, an insurer rated "Baa" offers adequate financial security, however, certain protective elements may be lacking or may be characteristically unreliable over any great length of time. Moody's has twenty-one possible ratings. There are eight ratings above the "Baa2" rating of our primary insurance subsidiaries and twelve ratings that are below the rating.
Rating agencies have increased the frequency and scope of their credit reviews and requested additional information from the companies that they rate, including us. They may also adjust upward the capital and other requirements employed in the rating agency models for maintenance of certain ratings levels. We cannot predict what actions rating agencies may take, or what actions we may take in response. Accordingly, downgrades and outlook revisions related to us or the life insurance industry may occur in the future at any time and without notice by any rating agency. These could increase policy surrenders and withdrawals, adversely affect relationships with our distribution channels, reduce new sales, reduce our ability to borrow and increase our future borrowing costs.
Liquidity of the Holding Companies
Availability and Sources and Uses of Holding Company Liquidity; Limitations on Ability of Insurance Subsidiaries to Make Dividend and Surplus Debenture Interest Payments to the Holding Companies; Limitations on Holding Company Activities
At December 31, 2014, CNO, CDOC and our other non-insurance subsidiaries held: (i) unrestricted cash and cash equivalents of $88.2 million; (ii) fixed income investments of $110.1 million; and (iii) equity securities and other invested assets totaling $146.3 million. CNO and CDOC are holding companies with no business operations of their own; they depend on their operating subsidiaries for cash to make principal and interest payments on debt, and to pay administrative expenses and income taxes. CNO and CDOC receive cash from insurance subsidiaries, consisting of dividends and distributions, interest payments on surplus debentures and tax-sharing payments, as well as cash from non-insurance subsidiaries consisting of dividends, distributions, loans and advances. The principal non-insurance subsidiaries that provide cash to CNO and CDOC are 40|86 Advisors, which receives fees from the insurance subsidiaries for investment services, and CNO Services which receives fees from the insurance subsidiaries for providing administrative services. The agreements between our insurance subsidiaries and CNO Services and 40|86 Advisors, respectively, were previously approved by the domestic insurance regulator for each insurance company, and any payments thereunder do not require further regulatory approval.
The following table sets forth the aggregate amount of dividends (net of capital contributions) and other distributions that our insurance subsidiaries paid to our non-insurance subsidiaries in each of the last three fiscal years (dollars in millions):
|
| | | | | | | | | | | |
| | Years ended December 31, |
| | 2014 | | 2013 | | 2012 |
| Dividends from insurance subsidiaries, net of contributions | $ | 174.0 |
| | $ | 236.8 |
| | $ | 265.0 |
|
| Surplus debenture interest | 63.3 |
| | 63.7 |
| | 58.9 |
|
| Fees for services provided pursuant to service agreements | 92.5 |
| | 72.9 |
| | 99.4 |
|
| Total dividends and other distributions paid by insurance subsidiaries | $ | 329.8 |
| | $ | 373.4 |
| | $ | 423.3 |
|
The following summarizes the current ownership structure of CNO’s primary subsidiaries:
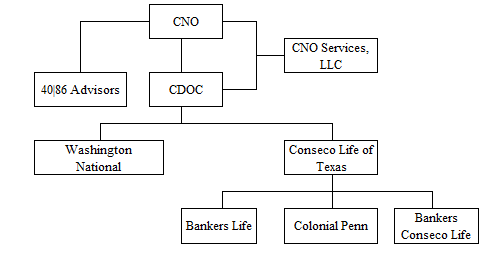
The ability of our insurance subsidiaries to pay dividends is subject to state insurance department regulations and is based on the financial statements of our insurance subsidiaries prepared in accordance with statutory accounting practices prescribed or permitted by regulatory authorities, which differ from GAAP. These regulations generally permit dividends to be paid from statutory earned surplus of the insurance company for any 12-month period in amounts equal to the greater of (or in a few states, the lesser of): (i) statutory net gain from operations or net income for the prior year; or (ii) 10 percent of statutory capital and surplus as of the end of the preceding year. This type of dividend is referred to as an "ordinary dividend". Any dividend in excess of these levels or from an insurance company that has negative earned surplus requires the approval of the director or commissioner of the applicable state insurance department and is referred to as an "extraordinary dividend". Each of the direct insurance subsidiaries of CDOC has significant negative earned surplus and any dividend payments from the subsidiaries of CDOC would be considered extraordinary dividends and, therefore, require the approval of the director or commissioner of the applicable state insurance department. In 2014, our insurance subsidiaries paid extraordinary dividends to CDOC totaling $227.0 million. We expect to receive regulatory approval for future dividends from our subsidiaries, but there can be no assurance that such payments will be approved or that the financial condition of our insurance subsidiaries will not change, making future approvals less likely.
We generally maintain capital and surplus levels in our insurance subsidiaries in an amount that is sufficient to maintain a minimum consolidated RBC ratio of 350 percent and may seek to have our insurance subsidiaries pay ordinary dividends or request regulatory approval for extraordinary dividends when the consolidated RBC ratio exceeds such level and we have concluded the capital level in each of our insurance subsidiaries is adequate to support their business and projected growth. The consolidated RBC ratio of our insurance subsidiaries was estimated at 434 percent at December 31, 2014.
CDOC holds surplus debentures from CLTX with an aggregate principal amount of $749.6 million. Interest payments on those surplus debentures do not require additional approval provided the RBC ratio of CLTX exceeds 100 percent (but do require prior written notice to the Texas state insurance department). The estimated RBC ratio of CLTX was 375 percent at December 31, 2014. CDOC also holds a surplus debenture from Colonial Penn with a principal balance of $160.0 million. Interest payments on that surplus debenture require prior approval by the Pennsylvania state insurance department. Dividends and other payments from our non-insurance subsidiaries, including 40|86 Advisors and CNO Services, to CNO or CDOC do not
require approval by any regulatory authority or other third party. However, insurance regulators may prohibit payments by our insurance subsidiaries to parent companies if they determine that such payments could be adverse to our policyholders or contractholders.
The insurance subsidiaries of CDOC receive funds to pay dividends primarily from: (i) the earnings of their direct businesses; (ii) tax sharing payments received from subsidiaries (if applicable); and (iii) with respect to CLTX, dividends received from subsidiaries. At December 31, 2014, the principal subsidiaries of CLTX had earned surplus (deficit) as summarized below (dollars in millions):
|
| | | | | | |
| Subsidiary of CDOC | | Earned surplus (deficit) | | Additional information |
| Subsidiaries of CLTX: | | | | |
| Bankers Life | | $ | 434.5 |
| | (a) |
| Colonial Penn | | (279.1 | ) | | (b) |
____________________
| |
| (a) | Bankers Life paid ordinary dividends of $95.0 million to CLTX in 2014. |
| |
| (b) | The deficit is primarily due to transactions which occurred several years ago, including a tax planning transaction and the fee paid to recapture a block of business previously ceded to an unaffiliated insurer. |
A significant deterioration in the financial condition, earnings or cash flow of the material subsidiaries of CNO or CDOC for any reason could hinder such subsidiaries' ability to pay cash dividends or other disbursements to CNO and/or CDOC, which, in turn, could limit CNO's ability to meet debt service requirements and satisfy other financial obligations. In addition, we may choose to retain capital in our insurance subsidiaries or to contribute additional capital to our insurance subsidiaries to strengthen their surplus, and these decisions could limit the amount available at our top tier insurance subsidiaries to pay dividends to the holding companies. CDOC made $53.0 million of capital contributions to its insurance subsidiaries in 2014 to fund: (i) the recapture of life business written by Bankers Life that was previously ceded; and (ii) to increase the statutory capital and RBC ratios of our life insurance subsidiaries, consistent with our goal to continue to increase their financial strength ratings.
The scheduled principal and interest payments on our direct corporate obligations are as follows (dollars in millions):
|
| | | | | | | |
| | Principal | | Interest (a) |
| 2015 | $ | 79.2 |
| | $ | 35.9 |
|
| 2016 | 60.5 |
| | 33.2 |
|
| 2017 | 4.3 |
| | 32.1 |
|
| 2018 | 378.1 |
| | 28.4 |
|
| 2019 | — |
| | 17.6 |
|
| 2020 | 275.0 |
| | 17.5 |
|
| | $ | 797.1 |
| | $ | 164.7 |
|
_________________________
| |
| (a) | Based on interest rates as of December 31, 2014. |
In May 2011, the Company announced a common share repurchase program of up to $100.0 million. In February 2012, June 2012, December 2012, December 2013 and November 2014, the Company's Board of Directors approved, in aggregate, an additional $1,200.0 million to repurchase the Company's outstanding securities. In 2014, we repurchased 18.5 million shares of common stock for $319.1 million under the securities repurchase program. In addition, in September 2014, we repurchased all outstanding common stock warrants for $57.4 million under the securities repurchase program. Such warrants had been held by Paulson & Co., Inc. on behalf of several investment funds and accounts managed by them, and were issued in conjunction with a private sale of our common stock in 2009. The Company had remaining repurchase authority of $420.9 million as of December 31, 2014. We currently anticipate repurchasing a total of approximately $250 million to $325 million of our common stock during 2015, absent compelling alternatives. The amount and timing of the securities repurchases (if any) will be based on business and market conditions and other factors.
In May 2012, we initiated a common stock dividend program. In 2014, 2013 and 2012, dividends declared and paid on common stock totaled $51.0 million ($0.24 per common share), $24.4 million ($0.11 per common share) and $13.9 million ($0.06 per common share), respectively. In March 2014, the Company increased its quarterly common stock dividend to $0.06 per share from $0.03 per share.
On May 30, 2014, the Company completed an amendment to the Senior Secured Credit Agreement to waive the requirement that the net proceeds in excess of $125 million received from the sale of CLIC be used to prepay amounts outstanding under the Senior Secured Credit Agreement.
In 2014, we made $59.4 million of scheduled quarterly principal payments due under the Senior Secured Credit Agreement. On May 30, 2014, we repurchased the remaining $3.5 million principal amount of our 7.0% Debentures for a purchase price of $3.7 million.
Mandatory prepayments of the Senior Secured Credit Agreement will be required, subject to certain exceptions, in an amount equal to: (i) 100% of the net cash proceeds from certain asset sales or casualty events; (ii) 100% of the net cash proceeds received by the Company or any of its restricted subsidiaries from certain debt issuances; and (iii) 100% of the amount of certain restricted payments made (including any common stock dividends and share repurchases) as defined in the Senior Secured Credit Agreement provided that if, as of the end of the fiscal quarter immediately preceding such restricted payment, the debt to total capitalization ratio is: (x) equal to or less than 25.0%, but greater than 20.0%, the prepayment requirement shall be reduced to 33.33%; or (y) equal to or less than 20.0%, the prepayment requirement shall not apply.
Notwithstanding the foregoing, no mandatory prepayments pursuant to item (i) in the preceding paragraph shall be required if: (x) the debt to total capitalization ratio is equal or less than 20% and (y) either (A) the financial strength rating of certain of the Company's insurance subsidiaries is equal to or better than A- (stable) from A.M. Best or (B) the Senior Secured Credit Agreement is rated equal or better than BBB- (stable) from S&P and Baa3 (stable) by Moody's.
The Senior Secured Credit Agreement requires the Company to maintain (each as calculated in accordance with the Senior Secured Credit Agreement): (i) a debt to total capitalization ratio of not more than 27.5 percent (such ratio was 17.2 percent at December 31, 2014); (ii) an interest coverage ratio of not less than 2.50 to 1.00 for each rolling four quarters (such ratio was 15.75 to 1.00 for the four quarters ended December 31, 2014); (iii) an aggregate ratio of total adjusted capital to company action level risk-based capital for the Company's insurance subsidiaries of not less than 250 percent (such ratio was
434 percent at December 31, 2014); and (iv) a combined statutory capital and surplus for the Company's insurance subsidiaries of at least $1,300.0 million (combined statutory capital and surplus at December 31, 2014, was $1,868 million).
Under the 6.375% Indenture, the Company can make Restricted Payments (as such term is defined in the 6.375% Indenture) up to a calculated limit, provided that the Company's pro forma risk-based capital ratio exceeds 225% after giving effect to the Restricted Payment and certain other conditions are met. Restricted Payments include, among other items, repurchases of common stock and cash dividends on common stock (to the extent such dividends exceed $30.0 million in the aggregate in any calendar year).
The limit of Restricted Payments permitted under the 6.375% Indenture is the sum of (x) 50% of the Company's "Net Excess Cash Flow" (as defined in the 6.375% Indenture) for the period (taken as one accounting period) from July 1, 2012 to the end of the Company's most recently ended fiscal quarter for which financial statements are available at the time of such Restricted Payment, (y) $175.0 million and (z) certain other amounts specified in the 6.375% Indenture. Based on the provisions set forth in the 6.375% Indenture and the Company's Net Excess Cash Flow for the period from July 1, 2012 through December 31, 2014, the Company could have made additional Restricted Payments under this 6.375% Indenture covenant of approximately $75 million as of December 31, 2014. This limitation on Restricted Payments does not apply if the Debt to Total Capitalization Ratio (as defined in the 6.375% Indenture) as of the last day of the Company's most recently ended fiscal quarter for which financial statements are available that immediately precedes the date of any Restricted Payment, calculated immediately after giving effect to such Restricted Payment and any related transactions on a pro forma basis, is equal to or less than 17.5%.
The amendment to the Senior Secured Credit Agreement on May 30, 2014 did not impact the restrictions set forth in the 6.375% Indenture regarding the Company’s use of the proceeds from the sale of CLIC. Under the Indenture, the net proceeds received by the Company from the sale of CLIC (defined as "Net Available Cash" under the Indenture) may be used to: (i) reinvest in or acquire assets to be used in the insurance business or a related business; or (ii) repay the Senior Secured Credit Agreement. Under the Indenture, any Net Available Cash not so reinvested or applied within 365 days after the closing of the sale of CLIC must be used to make an offer to purchase the outstanding notes at par and, in the interim, may only be invested as set forth in the Indenture. The Company currently plans to use the cash received from the sale of CLIC as permitted under the 6.375% Indenture including the investment on July 1, 2014, of $28.0 million to recapture a block of life insurance business from Wilton Re.
On August 14, 2014, A.M. Best upgraded our issuer credit and senior secured debt ratings to "bb+" from "bb" and the outlook for these ratings is positive. A "positive" designation indicates a possible rating upgrade over an intermediate term due to favorable financial/market trends relative to the current rating level. In A.M. Best's view, a company rated "bb+" has speculative credit characteristics generally due to a moderate margin of principal and interest payment protection and vulnerability to economic changes. Pluses and minuses show the relative standing within a category. A.M. Best has a total of 22 possible ratings ranging from "aaa (Exceptional)" to "d (In default)". There are ten ratings above CNO's "bb+" rating and eleven ratings that are below its rating.
On July 2, 2014, S&P upgraded our issuer credit and senior secured debt ratings to "BB+" from "BB" and the outlook for these ratings is stable. In S&P's view, an obligation rated "BB" is less vulnerable to nonpayment than other speculative issues. However, it faces major ongoing uncertainties or exposure to adverse business, financial or economic conditions which could lead to the obligor's inadequate capacity to meet its financial commitment on the obligation. Pluses and minuses show the relative standing within a category. S&P has a total of 22 possible ratings ranging from "AAA (Extremely Strong)" to "D (Payment Default)". There are ten ratings above CNO's "BB+" rating and eleven ratings that are below its rating.
On May 5, 2014, Fitch upgraded our issuer credit and senior secured debt ratings to "BB+" from "BB" and the outlook for these ratings is positive. The rating outlook indicates the direction a rating is likely to move over a one to two year period. In Fitch's view, an obligation rated "BB" indicates an elevated vulnerability to default risk, particularly in the event of adverse changes in business or economic conditions over time; however, business or financial flexibility exists which supports the servicing of financial commitments. Pluses and minuses show the relative standing within a category. Fitch has a total of 21 possible ratings ranging from "AAA" to "D". There are ten ratings above CNO's "BB+" rating and ten ratings that are below its rating.
On March 27, 2014, Moody's upgraded our issuer credit and senior secured debt ratings to "Ba2" from "Ba3" and the outlook for these ratings is positive. A positive designation indicates a higher likelihood of a ratings change over the medium term. In Moody's view, obligations rated "Ba" are judged to have speculative elements and are subject to substantial credit risk. A rating is supplemented with numerical modifiers "1", "2" or "3" to show the relative standing within a category. Moody's has
a total of 21 possible ratings ranging from "Aaa" to "C". There are eleven ratings above CNO's "Ba2" rating and nine ratings that are below its rating.
As part of our investment strategy, we may enter into repurchase agreements to increase our investment return. Pursuant to such agreements, the Company sells securities subject to an obligation to repurchase the same securities. Under these arrangements, the Company may transfer legal control over the assets but still retain effective control through an agreement that both entitles and obligates the Company to repurchase the assets. As a result, these repurchase agreements are accounted for as collateralized financing arrangements (i.e., secured borrowings) and not as a sale and subsequent repurchase of securities. Such borrowings totaled $20.4 million at December 31, 2014 and mature prior to June 30, 2015.
Outlook
We believe that the existing cash available to the holding company, the cash flows to be generated from operations and other transactions will be sufficient to allow us to meet our debt service obligations, pay corporate expenses and satisfy other financial obligations. However, our cash flow is affected by a variety of factors, many of which are outside of our control, including insurance regulatory issues, competition, financial markets and other general business conditions. We cannot provide assurance that we will possess sufficient income and liquidity to meet all of our debt service requirements and other holding company obligations. For additional discussion regarding the liquidity and other risks that we face, see "Risk Factors".
MARKET-SENSITIVE INSTRUMENTS AND RISK MANAGEMENT
Our spread-based insurance business is subject to several inherent risks arising from movements in interest rates, especially if we fail to anticipate or respond to such movements. First, interest rate changes can cause compression of our net spread between interest earned on investments and interest credited on customer deposits, thereby adversely affecting our results. Second, if interest rate changes produce an unanticipated increase in surrenders of our spread-based products, we may be forced to sell invested assets at a loss in order to fund such surrenders. Many of our products include surrender charges, market interest rate adjustments or other features to encourage persistency; however at December 31, 2014, approximately 24 percent of our total insurance liabilities, or approximately $5.4 billion, could be surrendered by the policyholder without penalty. Finally, changes in interest rates can have significant effects on the performance of our investment portfolio as a result of changes in the prepayment rate of various securities. We use asset/liability strategies that are designed to mitigate the effect of interest rate changes on our profitability. However, there can be no assurance that management will be successful in implementing such strategies and achieving adequate investment spreads.
We seek to invest our available funds in a manner that will fund future obligations to policyholders, subject to appropriate risk considerations. We seek to meet this objective through investments that: (i) have similar cash flow characteristics with the liabilities they support; (ii) are diversified (including by types of obligors); and (iii) are predominantly investment-grade in quality.
Our investment strategy is to maximize, over a sustained period and within acceptable parameters of risk, investment income and total investment return through active investment management. Accordingly, our entire portfolio of fixed maturity securities is available to be sold in response to: (i) changes in market interest rates; (ii) changes in relative values of individual securities and asset sectors; (iii) changes in prepayment risks; (iv) changes in credit quality outlook for certain securities; (v) liquidity needs; and (vi) other factors. From time to time, we invest in securities for trading purposes, although such investments are a relatively small portion of our total portfolio.
The profitability of many of our products depends on the spread between the interest earned on investments and the rates credited on our insurance liabilities. In addition, changes in competition and other factors, including the level of surrenders and withdrawals, may limit our ability to adjust or to maintain crediting rates at levels necessary to avoid narrowing of spreads under certain market conditions. As of December 31, 2014, approximately 26 percent of our insurance liabilities had interest rates that may be reset annually; 50 percent had a fixed explicit interest rate for the duration of the contract; 22 percent had credited rates which approximate the income earned by the Company; and the remainder had no explicit interest rates. At December 31, 2014, the average yield, computed on the cost basis of our fixed maturity portfolio, was 5.6 percent, and the average interest rate credited or accruing to our total insurance liabilities (excluding interest rate bonuses for the first policy year only and excluding the effect of credited rates attributable to variable or fixed index products) was 4.5 percent.
We simulate the cash flows expected from our existing insurance business under various interest rate scenarios. These simulations help us to measure the potential gain or loss in fair value of our interest rate-sensitive investments and to manage the relationship between the interest sensitivity of our assets and liabilities. When the estimated durations of assets and
liabilities are similar, a change in the value of assets should be largely offset by a change in the value of liabilities. At December 31, 2014, the estimated duration of our fixed income securities (as modified to reflect payments and potential calls) and the estimated duration of our insurance liabilities were both approximately 8.5 years. We estimate that our fixed maturity securities and short-term investments (net of corresponding changes in insurance acquisition costs) would decline in fair value by approximately $325 million if interest rates were to increase by 10 percent from their levels at December 31, 2014. Our simulations incorporate numerous assumptions, require significant estimates and assume an immediate change in interest rates without any management of the investment portfolio in reaction to such change. Consequently, potential changes in value of our financial instruments indicated by the simulations will likely be different from the actual changes experienced under given interest rate scenarios, and the differences may be material. Because we actively manage our investments and liabilities, our net exposure to interest rates can vary over time.
We are subject to the risk that our investments will decline in value. This has occurred in the past and may occur again, particularly if interest rates rise from their current low levels. During 2014, we recognized net realized investment gains of $36.7 million, which were comprised of $54.4 million of net gains from the sales of investments (primarily fixed maturities); the increase in fair value of certain fixed maturity investments with embedded derivatives of $7.6 million; the increase in fair value of embedded derivatives related to a modified coinsurance agreement of $2.0 million; and $27.3 million of writedowns of investments for other than temporary declines in fair value recognized through net income. During 2013, we recognized net realized investment gains of $33.4 million, which were comprised of $51.8 million of net gains from the sales of investments (primarily fixed maturities); the decrease in fair value of certain fixed maturity investments with embedded derivatives of $6.8 million; and $11.6 million of writedowns of investments for other than temporary declines in fair value recognized through net income. During 2012, we recognized net realized investment gains of $81.1 million, which were comprised of $98.8 million of net gains from the sales of investments (primarily fixed maturities); the increase in fair value of certain fixed maturity investments with embedded derivatives of $20.1 million; and $37.8 million of writedowns of investments for other than temporary declines in fair value recognized through net income.
The Company is subject to risk resulting from fluctuations in market prices of our equity securities. In general, these investments have more year-to-year price variability than our fixed maturity investments. However, returns over longer time frames have been consistently higher. We manage this risk by limiting our equity securities to a relatively small portion of our total investments.
Our investment in options backing our equity-linked products is closely matched with our obligation to fixed index annuity holders. Fair value changes associated with that investment are substantially offset by an increase or decrease in the amounts added to policyholder account balances for fixed index products.
Inflation
Inflation rates may impact the financial statements and operating results in several areas. Inflation influences interest rates, which in turn impact the fair value of the investment portfolio and yields on new investments. Inflation also impacts a portion of our insurance policy benefits affected by increased medical coverage costs. Operating expenses, including payrolls, are impacted to a certain degree by the inflation rate.
ITEM 8. CONSOLIDATED FINANCIAL STATEMENTS.
|
| |
| Index to Consolidated Financial Statements |
| | Page |
| |
| |
| |
| |
| |
| |
| |
Report of Independent Registered Public Accounting Firm
To the Shareholders and Board of Directors of CNO Financial Group, Inc.:
In our opinion, the accompanying consolidated balance sheets and the related consolidated statements of operations, comprehensive income, shareholders' equity and cash flows present fairly, in all material respects, the financial position of CNO Financial Group, Inc. and its subsidiaries at December 31, 2014 and 2013, and the results of their operations and their cash flows for each of the three years in the period ended December 31, 2014 in conformity with accounting principles generally accepted in the United States of America. Also in our opinion, the Company maintained, in all material respects, effective internal control over financial reporting as of December 31, 2014, based on criteria established in Internal Control - Integrated Framework (2013) issued by the Committee of Sponsoring Organizations of the Treadway Commission (COSO). The Company's management is responsible for these financial statements, for maintaining effective internal control over financial reporting, and for its assessment of the effectiveness of internal control over financial reporting, included in Management's Report on Internal Control Over Financial Reporting appearing under Item 9A (not appearing herein). Our responsibility is to express opinions on these financial statements and on the Company's internal control over financial reporting based on our integrated audits. We conducted our audits in accordance with the standards of the Public Company Accounting Oversight Board (United States). Those standards require that we plan and perform the audits to obtain reasonable assurance about whether the financial statements are free of material misstatement and whether effective internal control over financial reporting was maintained in all material respects. Our audits of the financial statements included examining, on a test basis, evidence supporting the amounts and disclosures in the financial statements, assessing the accounting principles used and significant estimates made by management, and evaluating the overall financial statement presentation. Our audit of internal control over financial reporting included obtaining an understanding of internal control over financial reporting, assessing the risk that a material weakness exists, and testing and evaluating the design and operating effectiveness of internal control based on the assessed risk. Our audits also included performing such other procedures as we considered necessary in the circumstances. We believe that our audits provide a reasonable basis for our opinions.
A company’s internal control over financial reporting is a process designed to provide reasonable assurance regarding the reliability of financial reporting and the preparation of financial statements for external purposes in accordance with generally accepted accounting principles. A company’s internal control over financial reporting includes those policies and procedures that (i) pertain to the maintenance of records that, in reasonable detail, accurately and fairly reflect the transactions and dispositions of the assets of the company; (ii) provide reasonable assurance that transactions are recorded as necessary to permit preparation of financial statements in accordance with generally accepted accounting principles, and that receipts and expenditures of the company are being made only in accordance with authorizations of management and directors of the company; and (iii) provide reasonable assurance regarding prevention or timely detection of unauthorized acquisition, use, or disposition of the company’s assets that could have a material effect on the financial statements.
Because of its inherent limitations, internal control over financial reporting may not prevent or detect misstatements. Also, projections of any evaluation of effectiveness to future periods are subject to the risk that controls may become inadequate because of changes in conditions, or that the degree of compliance with the policies or procedures may deteriorate.
/s/PricewaterhouseCoopers LLP
Indianapolis, Indiana
February 20, 2015, except with respect to our opinion on the consolidated financial statements insofar as it relates to the effects of the change in definition of pre-tax operating income to exclude the impact of fair market value changes related to the agent deferred compensation plan as described in Note 1 and Note 16, as to which the date is May 11, 2015
CNO FINANCIAL GROUP, INC. AND SUBSIDIARIES
CONSOLIDATED BALANCE SHEET
December 31, 2014 and 2013
(Dollars in millions)
ASSETS
|
| | | | | | | |
| | 2014 | | 2013 |
| | | | |
| Investments: | | | |
| Fixed maturities, available for sale, at fair value (amortized cost: 2014 - $18,408.1; 2013 - $21,891.8) | $ | 20,634.9 |
| | $ | 23,204.6 |
|
| Equity securities at fair value (cost: 2014 - $400.5; 2013 - $206.7) | 419.0 |
| | 223.0 |
|
| Mortgage loans | 1,691.9 |
| | 1,729.5 |
|
| Policy loans | 106.9 |
| | 277.0 |
|
| Trading securities | 244.9 |
| | 247.6 |
|
| Investments held by variable interest entities | 1,367.1 |
| | 1,046.7 |
|
| Other invested assets | 443.6 |
| | 423.3 |
|
| Total investments | 24,908.3 |
| | 27,151.7 |
|
| Cash and cash equivalents - unrestricted | 611.6 |
| | 699.0 |
|
| Cash and cash equivalents held by variable interest entities | 68.3 |
| | 104.3 |
|
| Accrued investment income | 242.9 |
| | 286.9 |
|
| Present value of future profits | 489.4 |
| | 679.3 |
|
| Deferred acquisition costs | 770.6 |
| | 968.1 |
|
| Reinsurance receivables | 2,991.1 |
| | 3,392.1 |
|
| Income tax assets, net | 758.7 |
| | 1,147.2 |
|
| Assets held in separate accounts | 5.6 |
| | 10.3 |
|
| Other assets | 337.7 |
| | 341.7 |
|
| Total assets | $ | 31,184.2 |
| | $ | 34,780.6 |
|
(continued on next page)
The accompanying notes are an integral part
of the consolidated financial statements.
CNO FINANCIAL GROUP, INC. AND SUBSIDIARIES
CONSOLIDATED BALANCE SHEET, continued
December 31, 2014 and 2013
(Dollars in millions)
LIABILITIES AND SHAREHOLDERS' EQUITY
|
| | | | | | | |
| | 2014 | | 2013 |
| | | | |
| Liabilities: | | | |
| Liabilities for insurance products: | | | |
| Policyholder account balances | $ | 10,707.2 |
| | $ | 12,776.4 |
|
| Future policy benefits | 10,835.4 |
| | 11,222.5 |
|
| Liability for policy and contract claims | 468.7 |
| | 566.0 |
|
| Unearned and advanced premiums | 291.8 |
| | 300.6 |
|
| Liabilities related to separate accounts | 5.6 |
| | 10.3 |
|
| Other liabilities | 587.6 |
| | 590.6 |
|
| Payable to reinsurer | — |
| | 590.3 |
|
| Investment borrowings | 1,519.2 |
| | 1,900.0 |
|
| Borrowings related to variable interest entities | 1,286.1 |
| | 1,012.3 |
|
| Notes payable – direct corporate obligations | 794.4 |
| | 856.4 |
|
| Total liabilities | 26,496.0 |
| | 29,825.4 |
|
| Commitments and Contingencies |
|
| |
|
|
| Shareholders' equity: | |
| | |
|
| Common stock ($0.01 par value, 8,000,000,000 shares authorized, shares issued and outstanding: 2014 – 203,324,458; 2013 – 220,323,823) | 2.0 |
| | 2.2 |
|
| Additional paid-in capital | 3,732.4 |
| | 4,092.8 |
|
| Accumulated other comprehensive income | 825.3 |
| | 731.8 |
|
| Retained earnings | 128.5 |
| | 128.4 |
|
| Total shareholders' equity | 4,688.2 |
| | 4,955.2 |
|
| Total liabilities and shareholders' equity | $ | 31,184.2 |
| | $ | 34,780.6 |
|
The accompanying notes are an integral part
of the consolidated financial statements.
CNO FINANCIAL GROUP, INC. AND SUBSIDIARIES
CONSOLIDATED STATEMENT OF OPERATIONS
for the years ended December 31, 2014, 2013 and 2012
(Dollars in millions, except per share data)
|
| | | | | | | | | | | | |
| | | 2014 | | 2013 | | 2012 |
| Revenues: | | | | | | |
| Insurance policy income | | $ | 2,629.7 |
| | $ | 2,744.7 |
| | $ | 2,755.4 |
|
| Net investment income (loss): | | |
| | |
| | |
|
| General account assets | | 1,301.0 |
| | 1,405.8 |
| | 1,398.5 |
|
| Policyholder and reinsurer accounts and other special-purpose portfolios | | 126.4 |
| | 258.2 |
| | 87.9 |
|
| Realized investment gains (losses): | | |
| | |
| | |
|
| Net realized investment gains, excluding impairment losses | | 64.0 |
| | 45.0 |
| | 118.9 |
|
| Other-than-temporary impairment losses: | | |
| | |
| | |
|
| Total other-than-temporary impairment losses | | (27.3 | ) | | (11.6 | ) | | (37.8 | ) |
| Portion of other-than-temporary impairment losses recognized in accumulated other comprehensive income | | — |
| | — |
| | — |
|
| Net impairment losses recognized | | (27.3 | ) | | (11.6 | ) | | (37.8 | ) |
| Total realized gains | | 36.7 |
| | 33.4 |
| | 81.1 |
|
| Fee revenue and other income | | 50.9 |
| | 34.0 |
| | 19.8 |
|
| Total revenues | | 4,144.7 |
| | 4,476.1 |
| | 4,342.7 |
|
| Benefits and expenses: | | | | | | |
| Insurance policy benefits | | 2,586.2 |
| | 2,839.7 |
| | 2,763.9 |
|
| Net loss on sale of subsidiary and (gain) loss on reinsurance transactions | | 239.8 |
| | 98.4 |
| | — |
|
| Interest expense | | 92.8 |
| | 105.3 |
| | 114.6 |
|
| Amortization | | 247.4 |
| | 296.3 |
| | 289.0 |
|
| Loss on extinguishment or modification of debt | | .6 |
| | 65.4 |
| | 200.2 |
|
| Other operating costs and expenses | | 802.8 |
| | 766.2 |
| | 819.3 |
|
| Total benefits and expenses | | 3,969.6 |
| | 4,171.3 |
| | 4,187.0 |
|
| Income before income taxes | | 175.1 |
| | 304.8 |
| | 155.7 |
|
| Income tax expense (benefit): | | | | | | |
| Tax expense on period income | | 159.2 |
| | 128.3 |
| | 106.2 |
|
| Valuation allowance for deferred tax assets and other tax items | | (35.5 | ) | | (301.5 | ) | | (171.5 | ) |
| Net income | | $ | 51.4 |
| | $ | 478.0 |
| | $ | 221.0 |
|
| Earnings per common share: | | | | | | |
| Basic: | | | | | | |
| Weighted average shares outstanding | | 212,917,000 |
| | 221,628,000 |
| | 233,685,000 |
|
| Net income | | $ | .24 |
| | $ | 2.16 |
| | $ | .95 |
|
| Diluted: | | | | | | |
| Weighted average shares outstanding | | 217,655,000 |
| | 232,702,000 |
| | 281,427,000 |
|
| Net income | | $ | .24 |
| | $ | 2.06 |
| | $ | .83 |
|
The accompanying notes are an integral part
of the consolidated financial statements.
CNO FINANCIAL GROUP, INC. AND SUBSIDIARIES
CONSOLIDATED STATEMENT OF COMPREHENSIVE INCOME
for the years ended December 31, 2014, 2013 and 2012
(Dollars in millions)
|
| | | | | | | | | | | |
| | 2014 | | 2013 | | 2012 |
| Net income (loss) | $ | 51.4 |
| | $ | 478.0 |
| | $ | 221.0 |
|
| Other comprehensive income, before tax: | | | | | |
| Unrealized gains (losses) for the period | 942.9 |
| | (1,627.4 | ) | | 1,336.2 |
|
| Amortization of present value of future profits and deferred acquisition costs | (113.5 | ) | | 175.2 |
| | (107.1 | ) |
| Amount related to premium deficiencies assuming the net unrealized gains had been realized | (624.6 | ) | | 774.2 |
| | (531.0 | ) |
| Reclassification adjustments: | | | | | |
| For net realized investment gains included in net income (loss) | (59.0 | ) | | (39.8 | ) | | (68.7 | ) |
| For amortization of the present value of future profits and deferred acquisition costs related to net realized investment gains included in net income (loss) | 1.0 |
| | 1.6 |
| | 6.5 |
|
| Unrealized gains (losses) on investments | 146.8 |
| | (716.2 | ) | | 635.9 |
|
| Change related to deferred compensation plan | (1.4 | ) | | .8 |
| | .4 |
|
| Other comprehensive income (loss) before tax | 145.4 |
| | (715.4 | ) | | 636.3 |
|
| Income tax (expense) benefit related to items of accumulated other comprehensive income | (51.9 | ) | | 249.8 |
| | (220.5 | ) |
| Other comprehensive income (loss), net of tax | 93.5 |
| | (465.6 | ) | | 415.8 |
|
| Comprehensive income (loss) | $ | 144.9 |
| | $ | 12.4 |
| | $ | 636.8 |
|
The accompanying notes are an integral part
of the consolidated financial statements.
CNO FINANCIAL GROUP, INC. AND SUBSIDIARIES
CONSOLIDATED STATEMENT OF SHAREHOLDERS' EQUITY
(Dollars in millions)
|
| | | | | | | | | | | | | | | |
| | Common stock and additional paid-in capital | | Accumulated other comprehensive income | | Retained earnings (accumulated deficit) | | Total |
| Balance, December 31, 2011 | $ | 4,364.3 |
| | $ | 781.6 |
| | $ | (532.1 | ) | | $ | 4,613.8 |
|
| Net income | — |
| | — |
| | 221.0 |
| | 221.0 |
|
| Change in unrealized appreciation (depreciation) of investments (net of applicable income tax expense of $216.1) | — |
| | 407.8 |
| | — |
| | 407.8 |
|
| Change in noncredit component of impairment losses on fixed maturities, available for sale (net of applicable income tax expense of $4.4) | — |
| | 8.0 |
| | — |
| | 8.0 |
|
| Extinguishment of beneficial conversion feature related to the repurchase of convertible debentures | (24.0 | ) | | — |
| | — |
| | (24.0 | ) |
| Cost of common stock repurchased | (180.2 | ) | | — |
| | — |
| | (180.2 | ) |
| Dividends on common stock | — |
| | — |
| | (13.9 | ) | | (13.9 | ) |
| Stock options, restricted stock and performance units | 16.8 |
| | — |
| | — |
| | 16.8 |
|
| Balance, December 31, 2012 | 4,176.9 |
| | 1,197.4 |
| | (325.0 | ) | | 5,049.3 |
|
| Net income | — |
| | — |
| | 478.0 |
| | 478.0 |
|
| Change in unrealized appreciation (depreciation) of investments (net of applicable income tax benefit of $248.7) | — |
| | (463.7 | ) | | — |
| | (463.7 | ) |
| Change in noncredit component of impairment losses on fixed maturities, available for sale (net of applicable income tax benefit of $1.1) | — |
| | (1.9 | ) | | — |
| | (1.9 | ) |
| Extinguishment of beneficial conversion feature related to the repurchase of convertible debentures | (12.6 | ) | | — |
| | — |
| | (12.6 | ) |
| Cost of common stock repurchased | (118.4 | ) | | — |
| | — |
| | (118.4 | ) |
| Dividends on common stock | — |
| | — |
| | (24.6 | ) | | (24.6 | ) |
| Conversion of convertible debentures | 24.9 |
| | — |
| | — |
| | 24.9 |
|
| Stock options, restricted stock and performance units | 24.2 |
| | — |
| | — |
| | 24.2 |
|
| Balance, December 31, 2013 | 4,095.0 |
| | 731.8 |
| | 128.4 |
| | 4,955.2 |
|
| Net income | — |
| | — |
| | 51.4 |
| | 51.4 |
|
| Change in unrealized appreciation (depreciation) of investments (net of applicable income tax expense of $52.3) | — |
| | 94.2 |
| | — |
| | 94.2 |
|
| Change in noncredit component of impairment losses on fixed maturities, available for sale (net of applicable income tax benefit of $.4) | — |
| | (.7 | ) | | — |
| | (.7 | ) |
| Cost of common stock and warrants repurchased | (376.5 | ) | | — |
| | — |
| | (376.5 | ) |
| Dividends on common stock | — |
| | — |
| | (51.3 | ) | | (51.3 | ) |
| Stock options, restricted stock and performance units | 15.9 |
| | — |
| | — |
| | 15.9 |
|
| Balance, December 31, 2014 | $ | 3,734.4 |
| | $ | 825.3 |
| | $ | 128.5 |
| | $ | 4,688.2 |
|
The accompanying notes are an integral part
of the consolidated financial statements.
CNO FINANCIAL GROUP, INC. AND SUBSIDIARIES
CONSOLIDATED STATEMENT OF CASH FLOWS
for the years ended December 31, 2014, 2013 and 2012
(Dollars in millions)
|
| | | | | | | | | | | |
| | 2014 | | 2013 | | 2012 |
| Cash flows from operating activities: | | | | | |
| Insurance policy income | $ | 2,407.9 |
| | $ | 2,464.9 |
| | $ | 2,419.7 |
|
| Net investment income | 1,279.0 |
| | 1,387.7 |
| | 1,385.8 |
|
| Fee revenue and other income | 50.9 |
| | 34.0 |
| | 19.8 |
|
| Insurance policy benefits | (1,968.4 | ) | | (2,093.8 | ) | | (2,096.5 | ) |
| Payment to reinsurer pursuant to long-term care business reinsured | (590.3 | ) | | — |
| | — |
|
| Interest expense | (81.7 | ) | | (95.9 | ) | | (109.0 | ) |
| Deferrable policy acquisition costs | (242.8 | ) | | (222.8 | ) | | (191.7 | ) |
| Other operating costs | (728.8 | ) | | (745.7 | ) | | (786.7 | ) |
| Taxes | (4.0 | ) | | (8.0 | ) | | (6.5 | ) |
| Net cash from operating activities | 121.8 |
| (a) | 720.4 |
| | 634.9 |
|
| Cash flows from investing activities: | |
| | |
| | |
| Sales of investments | 2,090.0 |
| | 2,315.8 |
| | 2,057.6 |
|
| Maturities and redemptions of investments | 1,618.2 |
| | 2,491.9 |
| | 1,967.4 |
|
| Purchases of investments | (3,731.6 | ) | | (5,367.1 | ) | | (4,271.1 | ) |
| Net sales of trading securities | 4.9 |
| | 30.0 |
| | 60.4 |
|
| Change in cash and cash equivalents held by variable interest entities | 36.0 |
| | (50.1 | ) | | 20.2 |
|
| Cash and cash equivalents held by subsidiary prior to being sold | (164.7 | ) | | — |
| | — |
|
| Proceeds from sale of subsidiary | 231.0 |
| | — |
| | — |
|
| Other | (27.5 | ) | | (23.0 | ) | | (31.6 | ) |
| Net cash provided (used) by investing activities | 56.3 |
| | (602.5 | ) | | (197.1 | ) |
| Cash flows from financing activities: | |
| | |
| | |
| Issuance of notes payable, net | — |
| | — |
| | 944.5 |
|
| Payments on notes payable | (62.9 | ) | | (126.9 | ) | | (810.6 | ) |
| Expenses related to extinguishment or modification of debt | (.6 | ) | | (61.6 | ) | | (183.0 | ) |
| Amount paid to extinguish the beneficial conversion feature associated with repurchase of convertible debentures | — |
| | (12.6 | ) | | (24.0 | ) |
| Issuance of common stock | 5.0 |
| | 15.1 |
| | 3.1 |
|
| Payments to repurchase common stock and warrants | (376.5 | ) | | (118.4 | ) | | (180.2 | ) |
| Common stock dividends paid | (51.0 | ) | | (24.4 | ) | | (13.9 | ) |
| Amounts received for deposit products | 1,295.4 |
| | 1,298.1 |
| | 1,296.7 |
|
| Withdrawals from deposit products | (1,347.3 | ) | | (1,464.4 | ) | | (1,544.9 | ) |
| Issuance of investment borrowings: | | | | | |
| Federal Home Loan Bank | 350.0 |
| | 500.0 |
| | 375.0 |
|
| Related to variable interest entities | 358.5 |
| | 376.3 |
| | 246.7 |
|
| Payments on investment borrowings: | | | | | |
| Federal Home Loan Bank | (367.7 | ) | | (250.5 | ) | | (375.0 | ) |
| Related to variable interest entities and other | (88.8 | ) | | (132.1 | ) | | (.9 | ) |
| Investment borrowings - repurchase agreements, net | 20.4 |
| | — |
| | (24.8 | ) |
| Net cash used by financing activities | (265.5 | ) | | (1.4 | ) | | (291.3 | ) |
| Net increase (decrease) in cash and cash equivalents | (87.4 | ) | | 116.5 |
| | 146.5 |
|
| Cash and cash equivalents, beginning of year | 699.0 |
| | 582.5 |
| | 436.0 |
|
| Cash and cash equivalents, end of year | $ | 611.6 |
| | $ | 699.0 |
| | $ | 582.5 |
|
______________________
| |
| (a) | Cash flows from operating activities reflect outflows in 2014 due to the payment to reinsurer to transfer certain long-term care business. |
The accompanying notes are an integral part
of the consolidated financial statements.
CNO FINANCIAL GROUP, INC. AND SUBSIDIARIES
Notes to Consolidated Financial Statements
___________________
1. BUSINESS AND BASIS OF PRESENTATION
CNO Financial Group, Inc., a Delaware corporation ("CNO"), is a holding company for a group of insurance companies operating throughout the United States that develop, market and administer health insurance, annuity, individual life insurance and other insurance products. The terms "CNO Financial Group, Inc.", "CNO", the "Company", "we", "us", and "our" as used in these financial statements refer to CNO and its subsidiaries. Such terms, when used to describe insurance business and products, refer to the insurance business and products of CNO's insurance subsidiaries.
We focus on serving middle-income pre-retiree and retired Americans, which we believe are attractive, underserved, high growth markets. We sell our products through three distribution channels: career agents, independent producers (some of whom sell one or more of our product lines exclusively) and direct marketing.
Prior to 2014, the Company managed its business through the following operating segments: Bankers Life, Washington National and Colonial Penn, which are defined on the basis of product distribution; Other CNO Business, comprised primarily of products we no longer sell actively; and corporate operations, comprised of holding company activities and certain noninsurance company businesses. As a result of the sale of Conseco Life Insurance Company ("CLIC") which was completed on July 1, 2014 (as further described in the note to the consolidated financial statements entitled "Sale of Subsidiary") and the coinsurance agreements to cede certain long-term care business effective December 31, 2013, management has changed the manner in which it disaggregates the Company's operations for making operating decisions and assessing performance. In periods prior to 2014: (i) the results in the Washington National segment have been adjusted to include the results from the business in the Other CNO Business segment that are being retained; (ii) the Other CNO Business segment included only the long-term care business that was ceded effective December 31, 2013 and the overhead expense of CLIC that is expected to continue after the completion of the sale; and (iii) the CLIC business being sold is excluded from our analysis of business segment results. Beginning on January 1, 2014: (i) the overhead expense of CLIC that is expected to continue after the completion of the sale has been reallocated primarily to the Bankers Life and Washington National segments; (ii) there is no longer an Other CNO Business segment; and (iii) the CLIC business being sold continues to be excluded from our analysis of business segment results. After the completion of the sale of CLIC: (i) the Bankers Life segment includes the results of certain life insurance business that was recaptured from Wilton Reassurance Company ("Wilton Re"); and (ii) the revenues and expenses associated with a transition services agreement and a special support services agreement with Wilton Re are included in our non-operating earnings. Under such agreements, we will receive $30 million in the year ending June 30, 2015 and $20 million in the year ending June 30, 2016. In addition, certain services will continue to be provided in the three years ending June 30, 2019 for an annual fee of $.2 million. The income we receive from these services agreements will offset certain of our overhead costs. If we are not successful in reducing our overhead costs to the same extent as the reduction in fees to be received from Wilton Re over the period of the agreements, our results of operations will be adversely affected. Our prior period segment disclosures have been revised to reflect management's current view of the Company's operating segments. The Company’s insurance segments are described below:
| |
| • | Bankers Life, which markets and distributes Medicare supplement insurance, interest-sensitive life insurance, traditional life insurance, fixed annuities and long-term care insurance products to the middle-income senior market through a dedicated field force of career agents and sales managers supported by a network of community-based sales offices. The Bankers Life segment includes primarily the business of Bankers Life and Casualty Company ("Bankers Life"). Bankers Life also markets and distributes Medicare Advantage plans primarily through distribution arrangements with Humana, Inc. and United HealthCare and Medicare Part D prescription drug plans ("PDP") primarily through a distribution arrangement with Coventry Health Care ("Coventry"). |
| |
| • | Washington National, which markets and distributes supplemental health (including specified disease, accident and hospital indemnity insurance products) and life insurance to middle-income consumers at home and at the worksite. These products are marketed through Performance Matters Associates of Texas, Inc. (a wholly owned subsidiary) and through independent marketing organizations and insurance agencies including worksite marketing. The products being marketed are underwritten by Washington National Insurance Company ("Washington National"). This segment's business also includes certain closed blocks of annuities and Medicare supplement policies which are no longer being actively marketed by this segment and were primarily issued or acquired by Washington National. |
CNO FINANCIAL GROUP, INC. AND SUBSIDIARIES
Notes to Consolidated Financial Statements
___________________
| |
| • | Colonial Penn, which markets primarily graded benefit and simplified issue life insurance directly to customers in the senior middle-income market through television advertising, direct mail, the internet and telemarketing. The Colonial Penn segment includes primarily the business of Colonial Penn Life Insurance Company ("Colonial Penn"). |
Effective January 1, 2015, we changed our definition of pre-tax operating income to exclude the impact of fair market value changes related to the agent deferred compensation plan, since such impacts are not indicative of our ongoing business and trends in our business. Prior periods have been revised to conform to our current presentation. Pre-tax income is not impacted by this change. Such revisions impacted the following footnotes in the conolidated financial statement: Footnote 1 - Business and Basis of Presentation; and Footnote 16 - Business Segments.
We prepare our financial statements in accordance with accounting principles generally accepted in the United States of America ("GAAP").
The accompanying financial statements include the accounts of the Company and its subsidiaries. Our consolidated financial statements exclude transactions between us and our consolidated affiliates, or among our consolidated affiliates.
When we prepare financial statements in conformity with GAAP, we are required to make estimates and assumptions that significantly affect reported amounts of various assets and liabilities and the disclosure of contingent assets and liabilities at the date of the financial statements and revenues and expenses during the reporting periods. For example, we use significant estimates and assumptions to calculate values for deferred acquisition costs, the present value of future profits, fair value measurements of certain investments (including derivatives), other-than-temporary impairments of investments, assets and liabilities related to income taxes, liabilities for insurance products, liabilities related to litigation and guaranty fund assessment accruals. If our future experience differs from these estimates and assumptions, our financial statements would be materially affected.
2. SUMMARY OF SIGNIFICANT ACCOUNTING POLICIES
Investments
Fixed maturity securities include available for sale bonds and redeemable preferred stocks. We carry these investments at estimated fair value. We record any unrealized gain or loss, net of tax and related adjustments, as a component of shareholders’ equity.
Equity securities include available for sale investments in common stock and non-redeemable preferred stock. We carry these investments at estimated fair value. We record any unrealized gain or loss, net of tax and related adjustments, as a component of shareholders' equity.
Mortgage loans held in our investment portfolio are carried at amortized unpaid balances, net of provisions for estimated losses. Interest income is accrued on the principal amount of the loan based on the loan's contractual interest rate. Payment terms specified for mortgage loans may include a prepayment penalty for unscheduled payoff of the investment. Prepayment penalties are recognized as investment income when received.
Policy loans are stated at current unpaid principal balances. Policy loans are collateralized by the cash surrender value of the life insurance policy. Interest income is recorded as earned using the contractual interest rate.
Trading securities include: (i) investments purchased with the intent of selling in the near team to generate income; (ii) investments supporting certain insurance liabilities (including investments backing the market strategies of our multibucket annuity products) and certain reinsurance agreements; and (iii) certain fixed maturity securities containing embedded derivatives for which we have elected the fair value option. The change in fair value of the income generating investments and investments supporting insurance liabilities and reinsurance agreements is recognized in income from policyholder and reinsurer accounts and other special-purpose portfolios (a component of net investment income). The change in fair value of securities with embedded derivatives is recognized in realized investment gains (losses). Investment income related to investments supporting certain insurance liabilities and certain reinsurance agreements is substantially offset by the change in insurance policy benefits related to certain products and agreements.
CNO FINANCIAL GROUP, INC. AND SUBSIDIARIES
Notes to Consolidated Financial Statements
___________________
Other invested assets include: (i) call options purchased in an effort to offset or hedge the effects of certain policyholder benefits related to our fixed index annuity and life insurance products; (ii) Company-owned life insurance ("COLI"); and (iii) certain non-traditional investments. We carry the call options at estimated fair value as further described in the section of this note entitled "Accounting for Derivatives". We carry COLI at its cash surrender value which approximates its net realizable value. Non-traditional investments include investments in certain limited partnerships and hedge funds which are accounted for using the equity method; and promissory notes, which are accounted for using the cost method. In accounting for limited partnerships and hedge funds, we consistently use the most recently available financial information provided by the general partner or manager of each of these investments, which is one to three months prior to the end of our reporting period.
Interest income on fixed maturity securities is recognized when earned using a constant effective yield method giving effect to amortization of premiums and accretion of discounts. Prepayment fees are recognized when earned. Dividends on equity securities are recognized when declared.
When we sell a security (other than trading securities), we report the difference between the sale proceeds and amortized cost (determined based on specific identification) as a realized investment gain or loss.
We regularly evaluate our investments for possible impairment as further described in the note to the consolidated financial statements entitled "Investments".
When a security defaults (including mortgage loans) or securities are other-than-temporarily impaired, our policy is to discontinue the accrual of interest and eliminate all previous interest accruals, if we determine that such amounts will not be ultimately realized in full.
Cash and Cash Equivalents
Cash and cash equivalents include commercial paper, invested cash and other investments purchased with original maturities of less than three months. We carry them at amortized cost, which approximates estimated fair value.
Deferred Acquisition Costs
Deferred acquisition costs represent incremental direct costs related to the successful acquisition of new or renewal insurance contracts. For interest-sensitive life or annuity products, we amortize these costs in relation to the estimated gross profits using the interest rate credited to the underlying policies. For other products, we amortize these costs in relation to future anticipated premium revenue using the projected investment earnings rate.
When we realize a gain or loss on investments backing our interest-sensitive life or annuity products, we adjust the amortization to reflect the change in estimated gross profits from the products due to the gain or loss realized and the effect on future investment yields. We also adjust deferred acquisition costs for the change in amortization that would have been recorded if our fixed maturity securities, available for sale, had been sold at their stated aggregate fair value and the proceeds reinvested at current yields. We limit the total adjustment related to the impact of unrealized losses to the total of costs capitalized plus interest related to insurance policies issued in a particular year. We include the impact of this adjustment in accumulated other comprehensive income (loss) within shareholders' equity.
We regularly evaluate the recoverability of the unamortized balance of the deferred acquisition costs. We consider estimated future gross profits or future premiums, expected mortality or morbidity, interest earned and credited rates, persistency and expenses in determining whether the balance is recoverable. If we determine a portion of the unamortized balance is not recoverable, it is charged to amortization expense. In certain cases, the unamortized balance of the deferred acquisition costs may not be deficient in the aggregate, but our estimates of future earnings indicate that profits would be recognized in early periods and losses in later periods. In this case, we increase the amortization of the deferred acquisition costs over the period of profits, by an amount necessary to offset losses that are expected to be recognized in the later years.
Present Value of Future Profits
The present value of future profits is the value assigned to the right to receive future cash flows from policyholder insurance contracts existing at September 10, 2003 (the "Effective Date", the effective date of the bankruptcy reorganization of
CNO FINANCIAL GROUP, INC. AND SUBSIDIARIES
Notes to Consolidated Financial Statements
___________________
Conseco, Inc., an Indiana corporation (our "Predecessor")). The discount rate we used to determine the present value of future profits was 12 percent. The balance of this account is amortized and evaluated for recovery in the same manner as described above for deferred acquisition costs. We also adjust the present value of future profits for the change in amortization that would have been recorded if the fixed maturity securities, available for sale, had been sold at their stated aggregate fair value and the proceeds reinvested at current yields, similar to the manner described above for deferred acquisition costs. We limit the total adjustment related to the impact of unrealized losses to the total present value of future profits plus interest.
Assets Held in Separate Accounts
Separate accounts are funds on which investment income and gains or losses accrue directly to certain policyholders. The assets of these accounts are legally segregated. They are not subject to the claims that may arise out of any other business of CNO. We report separate account assets at fair value; the underlying investment risks are assumed by the contractholders. We record the related liabilities at amounts equal to the separate account assets. We record the fees earned for administrative and contractholder services performed for the separate accounts in insurance policy income.
Recognition of Insurance Policy Income and Related Benefits and Expenses on Insurance Contracts
For interest-sensitive life and annuity contracts that do not involve significant mortality or morbidity risk, the amounts collected from policyholders are considered deposits and are not included in revenue. Revenues for these contracts consist of charges for policy administration, cost of insurance charges and surrender charges assessed against policyholders' account balances. Such revenues are recognized when the service or coverage is provided, or when the policy is surrendered.
We establish liabilities for annuity and interest-sensitive life products equal to the accumulated policy account values, which include an accumulation of deposit payments plus credited interest, less withdrawals and the amounts assessed against the policyholder through the end of the period. In addition, policyholder account values for certain interest-sensitive life products are impacted by our assumptions related to changes of certain non-guaranteed elements that we are allowed to make under the terms of the policy, such as cost of insurance charges, expense loads, credited interest rates and policyholder bonuses. Sales inducements provided to the policyholders of these products are recognized as liabilities over the period that the contract must remain in force to qualify for the inducement. The options attributed to the policyholder related to our fixed index annuity products are accounted for as embedded derivatives as described in the section of this note entitled "Accounting for Derivatives".
Premiums from individual life products (other than interest-sensitive life contracts) and health products are recognized when due. When premiums are due over a significantly shorter period than the period over which benefits are provided, any gross premium in excess of the net premium (i.e., the portion of the gross premium required to provide for all expected future benefits and expenses) is deferred and recognized into revenue in a constant relationship to insurance in force. Benefits are recorded as an expense when they are incurred.
We establish liabilities for traditional life, accident and health insurance, and life contingent payment annuity products using mortality tables in general use in the United States, which are modified to reflect the Company's actual experience when appropriate. We establish liabilities for accident and health insurance products using morbidity tables based on the Company's actual or expected experience. These reserves are computed at amounts that, with additions from estimated future premiums received and with interest on such reserves at estimated future rates, are expected to be sufficient to meet our obligations under the terms of the policy. Liabilities for future policy benefits are computed on a net-level premium method based upon assumptions as to future claim costs, investment yields, mortality, morbidity, withdrawals, policy dividends and maintenance expenses determined when the policies were issued (or with respect to policies inforce at August 31, 2003, the Company's best estimate of such assumptions on the Effective Date). We make an additional provision to allow for potential adverse deviation for some of our assumptions. Once established, assumptions on these products are generally not changed unless a premium deficiency exists. In that case, a premium deficiency reserve is recognized and the future pattern of reserve changes is modified to reflect the relationship of premiums to benefits based on the current best estimate of future claim costs, investment yields, mortality, morbidity, withdrawals, policy dividends and maintenance expenses, determined without an additional provision for potential adverse deviation.
We establish claim reserves based on our estimate of the loss to be incurred on reported claims plus estimates of incurred but unreported claims based on our past experience.
CNO FINANCIAL GROUP, INC. AND SUBSIDIARIES
Notes to Consolidated Financial Statements
___________________
Accounting for Long-term Care Premium Rate Increases
Many of our long-term care policies have been subject to premium rate increases. In some cases, these premium rate increases were materially consistent with the assumptions we used to value the particular block of business at the Effective Date. With respect to certain premium rate increases, some of our policyholders were provided an option to cease paying their premiums and receive a non-forfeiture option in the form of a paid-up policy with limited benefits. In addition, our policyholders could choose to reduce their coverage amounts and premiums in the same proportion, when permitted by our contracts or as required by regulators. The following describes how we account for these policyholder options:
| |
| • | Premium rate increases - If premium rate increases reflect a change in our previous rate increase assumptions, the new assumptions are not reflected prospectively in our reserves. Instead, the additional premium revenue resulting from the rate increase is recognized as earned and original assumptions continue to be used to determine changes to liabilities for insurance products unless a premium deficiency exists. |
| |
| • | Benefit reductions - A policyholder may choose reduced coverage with a proportionate reduction in premium, when permitted by our contracts. This option does not require additional underwriting. Benefit reductions are treated as a partial lapse of coverage, and the balance of our reserves and deferred insurance acquisition costs is reduced in proportion to the reduced coverage. |
| |
| • | Non-forfeiture benefits offered in conjunction with a rate increase - In some cases, non-forfeiture benefits are offered to policyholders who wish to lapse their policies at the time of a significant rate increase. In these cases, exercise of this option is treated as an extinguishment of the original contract and issuance of a new contract. The balance of our reserves and deferred insurance acquisition costs are released, and a reserve for the new contract is established. |
Some of our policyholders may receive a non-forfeiture benefit if they cease paying their premiums pursuant to their original contract (or pursuant to changes made to their original contract as a result of a litigation settlement made prior to the Effective Date or an order issued by the Florida Office of Insurance Regulation). In these cases, exercise of this option is treated as the exercise of a policy benefit, and the reserve for premium paying benefits is reduced, and the reserve for the non-forfeiture benefit is adjusted to reflect the election of this benefit.
Accounting for Certain Marketing and Reinsurance Agreements
Bankers Life has entered into various distribution and marketing agreements with other insurance companies to use Bankers Life's career agents to distribute prescription drug and Medicare Advantage plans. These agreements allow Bankers Life to offer these products to current and potential future policyholders without investment in management and infrastructure. We receive fee income related to the plans sold through our distribution channels. We account for these distribution agreements as follows:
| |
| • | We recognize distribution income based on either: (i) a fixed fee per contract sold; or (ii) a percentage of premiums collected. This fee income is recognized over the calendar year term of the contract. |
| |
| • | We also pay commissions to our agents who sell the plans. These payments are deferred and amortized over the term of the contract. |
Prior to its termination in August 2013, we had a quota-share reinsurance agreement with Coventry that provided Bankers Life with 50 percent of the net premiums and related policy benefits of certain PDP business sold through Bankers Life's career agency force. We accounted for the quota-share agreement as follows:
| |
| • | We recognized premium revenue evenly over the period of the underlying Medicare Part D contracts. |
| |
| • | We recognized policyholder benefits and assumed commission expense as incurred. |
| |
| • | We recognized risk-share premium adjustments consistent with Coventry's risk-share agreement with the Centers for Medicare and Medicaid Services. |
CNO FINANCIAL GROUP, INC. AND SUBSIDIARIES
Notes to Consolidated Financial Statements
___________________
Reinsurance
In the normal course of business, we seek to limit our loss exposure on any single insured or to certain groups of policies by ceding reinsurance to other insurance enterprises. We currently retain no more than $.8 million of mortality risk on any one policy. We diversify the risk of reinsurance loss by using a number of reinsurers that have strong claims-paying ratings. In each case, the ceding CNO subsidiary is directly liable for claims reinsured in the event the assuming company is unable to pay.
The cost of reinsurance ceded totaled $176.7 million, $212.1 million and $220.0 million in 2014, 2013 and 2012, respectively. We deduct this cost from insurance policy income. Reinsurance recoveries netted against insurance policy benefits totaled $195.3 million, $196.2 million and $210.2 million in 2014, 2013 and 2012, respectively.
From time-to-time, we assume insurance from other companies. Any costs associated with the assumption of insurance are amortized consistent with the method used to amortize deferred acquisition costs. Reinsurance premiums assumed totaled $35.0 million, $37.4 million and $69.4 million in 2014, 2013 and 2012, respectively. Reinsurance premiums included amounts assumed pursuant to marketing and quota-share agreements with Coventry of $6.8 million, $19.7 million and $49.9 million, in 2014, 2013 and 2012 respectively. As further described above, we received a notice of Coventry's intent to terminate the PDP quota-share reinsurance agreement in August 2013. The premiums collected from Coventry in 2014 represented adjustments to premiums on such business related to periods prior to the termination of the agreement.
In December 2013, two of our insurance subsidiaries with long-term care business in the former Other CNO Business segment entered into 100% coinsurance agreements ceding $495 million of long-term care reserves to Beechwood Re Ltd. ("BRe"). Pursuant to the agreements, the insurance subsidiaries paid an additional premium of $96.9 million to BRe and an amount equal to the related net liabilities. The insurance subsidiaries' ceded reserve credits are secured by assets in market-value trusts subject to a 7% over-collateralization, investment guidelines and periodic true-up provisions. Future payments into the trusts to maintain collateral requirements are the responsibility of BRe. We recognized a pre-tax loss of $98.4 million in 2013 to reflect: (i) the known loss (or premium deficiency) on the business, as we will not be recognizing additional income in future periods to recover the unamortized additional premium which will be paid to BRe; and (ii) other transaction costs.
In the second quarter of 2014, we recaptured a block of interest-sensitive life business that was previously ceded under a modified coinsurance agreement. The recapture of this block resulted in a gain related to reinsurance transaction of $3.8 million.
As further described in the note to the financial statements entitled "Sale of Subsidiary", we recaptured a block of life insurance business in 2014 that was previously ceded under a coinsurance agreement.
Income Taxes
Our income tax expense includes deferred income taxes arising from temporary differences between the financial reporting and tax bases of assets and liabilities, capital loss carryforwards and net operating loss carryforwards ("NOLs"). Deferred tax assets and liabilities are measured using enacted tax rates expected to apply in the years in which temporary differences are expected to be recovered or paid. The effect of a change in tax rates on deferred tax assets and liabilities is recognized in earnings in the period when the changes are enacted.
A reduction of the net carrying amount of deferred tax assets by establishing a valuation allowance is required if, based on the available evidence, it is more likely than not that such assets will not be realized. In assessing the need for a valuation allowance, all available evidence, both positive and negative, shall be considered to determine whether, based on the weight of that evidence, a valuation allowance for deferred tax assets is needed. This assessment requires significant judgment and considers, among other matters, the nature, frequency and severity of current and cumulative losses, forecasts of future profitability, the duration of carryforward periods, our experience with operating loss and tax credit carryforwards expiring unused, and tax planning strategies. We evaluate the need to establish a valuation allowance for our deferred income tax assets on an ongoing basis. The realization of our deferred tax assets depends upon generating sufficient future taxable income of the appropriate type during the periods in which our temporary differences become deductible and before our capital loss carryforwards and life and non-life NOLs expire.
CNO FINANCIAL GROUP, INC. AND SUBSIDIARIES
Notes to Consolidated Financial Statements
___________________
At December 31, 2014, our valuation allowance for our net deferred tax assets was $246.0 million, as we have determined that it is more likely than not that a portion of our deferred tax assets will not be realized. This determination was made by evaluating each component of the deferred tax assets and assessing the effects of limitations and/or interpretations on the value of such component to be fully recognized in the future.
Investments in Variable Interest Entities
We have concluded that we are the primary beneficiary with respect to certain variable interest entities ("VIEs"), which are consolidated in our financial statements.
All such VIEs are collateralized loan trusts that were established to issue securities to finance the purchase of corporate loans and other permitted investments (including two new VIEs which were consolidated in 2014, one new VIE which was consolidated in 2013 and one new VIE which was consolidated in 2012). The assets held by the trusts are legally isolated and not available to the Company. The liabilities of the VIEs are expected to be satisfied from the cash flows generated by the underlying loans held by the trusts, not from the assets of the Company. The Company has no financial obligation to the VIEs beyond its investment in each VIE.
The investment portfolios held by the VIEs are primarily comprised of commercial bank loans to corporate obligors which are almost entirely rated below-investment grade. Refer to the note to the consolidated financial statements entitled "Investments in Variable Interest Entities" for additional information about VIEs.
Investment borrowings
Two of the Company's insurance subsidiaries (Washington National and Bankers Life) are members of the Federal Home Loan Bank ("FHLB"). As members of the FHLB, Washington National and Bankers Life have the ability to borrow on a collateralized basis from the FHLB. Washington National and Bankers Life are required to hold certain minimum amounts of FHLB common stock as a condition of membership in the FHLB, and additional amounts based on the amount of the borrowings. At December 31, 2014, the carrying value of the FHLB common stock was $73.5 million. As of December 31, 2014, collateralized borrowings from the FHLB totaled $1.5 billion and the proceeds were used to purchase fixed maturity securities. The borrowings are classified as investment borrowings in the accompanying consolidated balance sheet. The borrowings are collateralized by investments with an estimated fair value of $1.8 billion at December 31, 2014, which are maintained in a custodial account for the benefit of the FHLB. Substantially all of such investments are classified as fixed maturities, available for sale, in our consolidated balance sheet.
CNO FINANCIAL GROUP, INC. AND SUBSIDIARIES
Notes to Consolidated Financial Statements
___________________
The following summarizes the terms of the borrowings from the FHLB by Washington National and Bankers Life (dollars in millions):
|
| | | | | | |
| Amount | | Maturity | | Interest rate at |
| borrowed | | date | | December 31, 2014 |
| $ | 50.0 |
| | October 2015 | | Variable rate – 0.511% |
| 100.0 |
| | June 2016 | | Variable rate – 0.610% |
| 75.0 |
| | June 2016 | | Variable rate – 0.417% |
| 100.0 |
| | October 2016 | | Variable rate – 0.413% |
| 50.0 |
| | November 2016 | | Variable rate – 0.505% |
| 50.0 |
| | November 2016 | | Variable rate – 0.640% |
| 57.7 |
| | June 2017 | | Variable rate – 0.587% |
| 50.0 |
| | August 2017 | | Variable rate – 0.432% |
| 75.0 |
| | August 2017 | | Variable rate – 0.383% |
| 100.0 |
| | October 2017 | | Variable rate – 0.661% |
| 50.0 |
| | November 2017 | | Variable rate – 0.744% |
| 50.0 |
| | January 2018 | | Variable rate – 0.579% |
| 50.0 |
| | January 2018 | | Variable rate – 0.571% |
| 50.0 |
| | February 2018 | | Variable rate – 0.542% |
| 50.0 |
| | February 2018 | | Variable rate – 0.322% |
| 22.0 |
| | February 2018 | | Variable rate – 0.566% |
| 100.0 |
| | May 2018 | | Variable rate – 0.620% |
| 50.0 |
| | July 2018 | | Variable rate – 0.703% |
| 50.0 |
| | August 2018 | | Variable rate – 0.352% |
| 50.0 |
| | January 2019 | | Variable rate – 0.649% |
| 50.0 |
| | February 2019 | | Variable rate – 0.322% |
| 100.0 |
| | March 2019 | | Variable rate – 0.642% |
| 21.8 |
| | July 2019 | | Variable rate – 0.655% |
| 21.8 |
| | June 2020 | | Fixed rate – 1.960% |
| 28.2 |
| | August 2021 | | Fixed rate – 2.550% |
| 26.8 |
| | March 2023 | | Fixed rate – 2.160% |
| 20.5 |
| | June 2025 | | Fixed rate – 2.940% |
| $ | 1,498.8 |
| | | | |
The variable rate borrowings are pre-payable on each interest reset date without penalty. The fixed rate borrowings are pre-payable subject to payment of a yield maintenance fee based on prevailing market interest rates. At December 31, 2014, the aggregate yield maintenance fee to prepay all fixed rate borrowings was $1.2 million.
Interest expense of $18.7 million, $27.9 million and $28.0 million in 2014, 2013 and 2012, respectively, was recognized related to total borrowings from the FHLB.
In addition to our borrowings from the FHLB, we may enter into repurchase agreements to increase our investment return as part of our investment strategy. Pursuant to such agreements, the Company sells securities subject to an obligation to repurchase the same securities. Under these arrangements, the Company may transfer legal control over the assets but still retain effective control through an agreement that both entitles and obligates the Company to repurchase the assets. As a result, these repurchase agreements are accounted for as collateralized financing arrangements (i.e., secured borrowings) and not as a
CNO FINANCIAL GROUP, INC. AND SUBSIDIARIES
Notes to Consolidated Financial Statements
___________________
sale and subsequent repurchase of securities. Such borrowings totaled $20.4 million at December 31, 2014 and mature prior to June 30, 2015. We had no such borrowings outstanding at December 31, 2013.
The primary risks associated with short-term collateralized borrowings are: (i) a substantial decline in the market value of the margined security; and (ii) that a counterparty may be unable to perform under the terms of the contract or be unwilling to extend such financing in future periods especially if the liquidity or value of the margined security has declined. Exposure is limited to any depreciation in value of the related securities.
Accounting for Derivatives
Our fixed index annuity products provide a guaranteed minimum rate of return and a higher potential return that is based on a percentage (the "participation rate") of the amount of increase in the value of a particular index, such as the Standard & Poor's 500 Index, over a specified period. Typically, on each policy anniversary date, a new index period begins. We are generally able to change the participation rate at the beginning of each index period during a policy year, subject to contractual minimums. The Company accounts for the options attributed to the policyholder for the estimated life of the annuity contract as embedded derivatives. These accounting requirements often create volatility in the earnings from these products. We typically buy call options (including call spreads) referenced to the applicable indices in an effort to offset or hedge potential increases to policyholder benefits resulting from increases in the particular index to which the policy's return is linked.
We utilize United States Treasury interest rate futures primarily to hedge interest rate risk related to anticipated mortgage loan transactions.
In periods prior to the second quarter of 2014, we were required to establish an embedded derivative related to a modified coinsurance agreement which ceded the risks of a block of interest sensitive life business. We recaptured this block in the second quarter of 2014 resulting in a gain of $3.8 million. Prior to the recapture of this block, we maintained the investments related to the modified coinsurance agreement in our trading securities account, which we carried at estimated fair value with changes in such value recognized as investment income. Such trading securities were sold in the second quarter of 2014 in conjunction with the reinsurance recapture.
We purchase certain fixed maturity securities that contain embedded derivatives that are required to be bifurcated from the instrument and held at fair value on the consolidated balance sheet. We have elected the fair value option to carry the entire security at fair value with changes in fair value reported in net income for operational ease.
Multibucket Annuity Products
The Company's multibucket annuity is an annuity product that credits interest based on the experience of a particular market strategy. Policyholders allocate their annuity premium payments to several different market strategies based on different asset classes within the Company's investment portfolio. Interest is credited to this product based on the market return of the given strategy, less management fees, and funds may be moved between different strategies. The Company guarantees a minimum return of premium plus approximately 3 percent per annum over the life of the contract. The investments backing the market strategies of these products are designated by the Company as trading securities. The change in the fair value of these securities is recognized as investment income (classified as income from policyholder and reinsurer accounts and other special-purpose portfolios), which is substantially offset by the change in insurance policy benefits for these products. We hold insurance liabilities of $43.4 million and $45.8 million related to multibucket annuity products as of December 31, 2014 and 2013, respectively.
Sales Inducements
Certain of our annuity products offer sales inducements to contract holders in the form of enhanced crediting rates or bonus payments in the initial period of the contract. Certain of our life insurance products offer persistency bonuses credited to the contract holders balance after the policy has been outstanding for a specified period of time. These enhanced rates and persistency bonuses are considered sales inducements in accordance with GAAP. Such amounts are deferred and amortized in the same manner as deferred acquisition costs. Sales inducements deferred totaled $5.1 million, $5.0 million and $4.4 million during 2014, 2013 and 2012, respectively. Amounts amortized totaled $12.4 million, $22.9 million and $27.1 million during 2014, 2013 and 2012, respectively. The unamortized balance of deferred sales inducements was $67.4 million and $108.6
CNO FINANCIAL GROUP, INC. AND SUBSIDIARIES
Notes to Consolidated Financial Statements
___________________
million at December 31, 2014 and 2013, respectively. The balance of insurance liabilities for persistency bonus benefits was $1.5 million and $28.9 million at December 31, 2014 and 2013, respectively.
Out-of-Period Adjustments
In 2014, we recorded the net effect of an out-of-period adjustment related to the calculation of incentive compensation accruals which increased other operating costs and expenses by $2.4 million, decreased tax expense by $.8 million and decreased our net income by $1.6 million (or 1 cent per diluted share). In 2013 we recorded the net effect of out-of-period adjustment which increased our insurance policy benefits by $4.7 million, increased amortization expense by $2.1 million, increased other operating costs and expenses by $1.5 million, decreased tax expense by $.7 million and decreased our net income by $7.6 million (or 3 cents per diluted share). We evaluated these adjustments taking into account both qualitative and quantitative factors and considered the impact of these adjustments in relation to each period, as well as the periods in which they originated. The impact of recognizing these adjustments in prior years was not significant to any individual period. Management believes these adjustments are immaterial to the consolidated financial statements and all previously issued financial statements.
Recently Issued Accounting Standards
Pending Accounting Standards
In April 2014, the Financial Accounting Standards Board (the "FASB") issued authoritative guidance changing the criteria for reporting discontinued operations. Under the revised guidance, only disposals of a component or a group of components, including those classified as held for sale, which represent a strategic shift that has or will have a major effect on a company's operations and financial results will be reported as discontinued operations. The guidance is effective prospectively for new disposals occurring after January 1, 2015.
In May 2014, the FASB issued authoritative guidance for recognizing revenue from contracts with customers. Certain contracts with customers are specifically excluded from this guidance, including insurance contracts. The core principle of the new guidance is that an entity should recognize revenue when it transfers promised goods or services in an amount that reflects the consideration to which the entity expects to be entitled in exchange for those goods or services. The guidance also requires additional disclosures about the nature, amount, timing and uncertainty of revenue and cash flows arising from contracts with customers. The guidance will be effective for the Company on January 1, 2017 and permits two methods of transition upon adoption; full retrospective and modified retrospective. Under the full retrospective method, prior periods would be restated under the new revenue standard, providing for comparability in all periods presented. Under the modified retrospective method, prior periods would not be restated. Instead, revenues and other disclosures for pre-2017 periods would be provided in the notes to the financial statements as previously reported under the current revenue standard. The Company is currently assessing the impact the guidance will have upon adoption.
In June 2014, the FASB issued authoritative guidance on the accounting and disclosure of repurchase-to-maturity transactions and repurchase financings. Under this new accounting guidance, repurchase-to-maturity transactions will be accounted for as secured borrowings rather than sales of an asset, and transfers of financial assets with a contemporaneous repurchase financing arrangement will no longer be evaluated to determine whether they should be accounted for on a combined basis as forward contracts. The new guidance also prescribes additional disclosures particularly on the nature of collateral pledged in the repurchase agreement accounted for as a secured borrowing. The new guidance is effective beginning on January 1, 2015. We do not expect the adoption of this guidance to have a material impact on our consolidated financial statements.
In August 2014, the FASB issued authoritative guidance related to measuring the financial assets and the financial liabilities of a consolidated collateralized financing entity which provides a measurement alternative for an entity that consolidates collateralized financing entities. A collateralized financing entity is a variable interest entity with no more than nominal equity that holds financial assets and issues beneficial interests in those financial assets; the beneficial interests have contractual recourse only to the related assets of the collateralized financing entity and are classified as financial liabilities. If elected, the alternative method results in the reporting entity measuring both the financial assets and the financial liabilities of the collateralized financing entity using the more observable of the two fair value measurements, which effectively removes measurement differences between the financial assets and the financial liabilities of the collateralized financing entity
CNO FINANCIAL GROUP, INC. AND SUBSIDIARIES
Notes to Consolidated Financial Statements
___________________
previously recorded as net income (loss) attributable to non-controlling and other beneficial interests and as an adjustment to appropriated retained earnings. The reporting entity continues to measure its own beneficial interests in the collateralized financing entity (other than those that represent compensation for services) at fair value. The guidance is effective for interim and annual periods beginning after December 15, 2015. A reporting entity may apply the guidance using a modified retrospective approach by recording a cumulative-effect adjustment to equity as of the beginning of the annual period of adoption. A reporting entity may also apply the guidance retrospectively to all relevant prior periods. Early adoption is permitted. The Company is currently assessing the impact the guidance will have upon adoption.
Adopted Accounting Standards
In July 2013, the FASB issued authoritative guidance regarding the financial statement presentation of an unrecognized tax benefit when a NOL carryforward, a similar tax loss or a tax credit carryforward exists. Such guidance requires an unrecognized tax benefit, or a portion of an unrecognized tax benefit, to be presented in the financial statements as a reduction to a deferred tax asset for a NOL carryforward, a similar tax loss, or a tax credit carryforward, except under certain circumstances as further described in the guidance. Such guidance does not require new recurring disclosures. This guidance is effective for fiscal years, and interim periods within those years, beginning after December 15, 2013. The adoption of this guidance did not have a material impact on our consolidated financial statements.
CNO FINANCIAL GROUP, INC. AND SUBSIDIARIES
Notes to Consolidated Financial Statements
___________________
3. INVESTMENTS
At December 31, 2014, the amortized cost, gross unrealized gains and losses, estimated fair value and other-than-temporary impairments in accumulated other comprehensive income of fixed maturities, available for sale, and equity securities were as follows (dollars in millions):
|
| | | | | | | | | | | | | | | | | | | |
| | Amortized cost | | Gross unrealized gains | | Gross unrealized losses | | Estimated fair value | | Other-than-temporary impairments included in accumulated other comprehensive income |
| Investment grade (a): | | | | | | | | | |
| Corporate securities | $ | 11,177.1 |
| | $ | 1,710.5 |
| | $ | (42.1 | ) | | $ | 12,845.5 |
| | $ | — |
|
| United States Treasury securities and obligations of United States government corporations and agencies | 138.8 |
| | 30.2 |
| | (.1 | ) | | 168.9 |
| | — |
|
| States and political subdivisions | 1,960.6 |
| | 299.3 |
| | (.7 | ) | | 2,259.2 |
| | — |
|
| Debt securities issued by foreign governments | 1.8 |
| | .1 |
| | — |
| | 1.9 |
| | — |
|
| Asset-backed securities | 720.7 |
| | 52.0 |
| | (1.6 | ) | | 771.1 |
| | — |
|
| Collateralized debt obligations | 314.9 |
| | 2.4 |
| | (3.4 | ) | | 313.9 |
| | — |
|
| Commercial mortgage-backed securities | 1,179.7 |
| | 80.9 |
| | (.5 | ) | | 1,260.1 |
| | — |
|
| Mortgage pass-through securities | 4.2 |
| | .4 |
| | — |
| | 4.6 |
| | — |
|
| Collateralized mortgage obligations | 571.1 |
| | 23.1 |
| | (.6 | ) | | 593.6 |
| | — |
|
| Total investment grade fixed maturities, available for sale | 16,068.9 |
| | 2,198.9 |
| | (49.0 | ) | | 18,218.8 |
| | — |
|
| Below-investment grade (a): | |
| | |
| | |
| | |
| | |
| Corporate securities | 1,139.3 |
| | 29.2 |
| | (43.0 | ) | | 1,125.5 |
| | — |
|
| States and political subdivisions | 20.6 |
| | .2 |
| | (2.3 | ) | | 18.5 |
| | — |
|
| Asset-backed securities | 465.9 |
| | 33.8 |
| | (1.8 | ) | | 497.9 |
| | — |
|
| Collateralized debt obligations | 10.4 |
| | .2 |
| | — |
| | 10.6 |
| | — |
|
| Commercial mortgage-backed securities | 15.3 |
| | .9 |
| | — |
| | 16.2 |
| | — |
|
| Collateralized mortgage obligations | 687.7 |
| | 60.4 |
| | (.7 | ) | | 747.4 |
| | (3.2 | ) |
| Total below-investment grade fixed maturities, available for sale | 2,339.2 |
| | 124.7 |
| | (47.8 | ) | | 2,416.1 |
| | (3.2 | ) |
| Total fixed maturities, available for sale | $ | 18,408.1 |
| | $ | 2,323.6 |
| | $ | (96.8 | ) | | $ | 20,634.9 |
| | $ | (3.2 | ) |
| Equity securities | $ | 400.5 |
| | $ | 19.1 |
| | $ | (.6 | ) | | $ | 419.0 |
| | |
_______________
| |
| (a) | Investment ratings – Investment ratings are assigned the second lowest rating by Nationally Recognized Statistical Rating Organizations ("NRSROs") (Moody's Investor Services, Inc. ("Moody's"), Standard & Poor's Corporation ("S&P") or Fitch Ratings ("Fitch")), or if not rated by such firms, the rating assigned by the National Association of Insurance Commissioners (the "NAIC"). NAIC designations of "1" or "2" include fixed maturities generally rated investment grade (rated "Baa3" or higher by Moody's or rated "BBB-" or higher by S&P and Fitch). NAIC designations of "3" through "6" are referred to as below-investment grade (which generally are rated "Ba1" or lower by Moody's or rated "BB+" or lower by S&P and Fitch). References to investment grade or below-investment grade throughout our consolidated financial statements are determined as described above. |
CNO FINANCIAL GROUP, INC. AND SUBSIDIARIES
Notes to Consolidated Financial Statements
___________________
The NAIC evaluates the fixed maturity investments of insurers for regulatory and capital assessment purposes and assigns securities to one of six credit quality categories called NAIC designations, which are used by insurers when preparing their annual statements based on statutory accounting principles. The NAIC designations are generally similar to the credit quality designations of the NRSROs for marketable fixed maturity securities, except for certain structured securities. However, certain structured securities rated below investment grade by the NRSROs can be assigned NAIC 1 or NAIC 2 designations dependent on the cost basis of the holding relative to estimated recoverable amounts as determined by the NAIC. The following summarizes the NAIC designations and NRSRO equivalent ratings:
|
| | |
| NAIC Designation | | NRSRO Equivalent Rating |
| 1 | | AAA/AA/A |
| 2 | | BBB |
| 3 | | BB |
| 4 | | B |
| 5 | | CCC and lower |
| 6 | | In or near default |
A summary of our fixed maturity securities, available for sale, by NAIC designations (or for fixed maturity securities held by non-insurance entities, based on NRSRO ratings) as of December 31, 2014 is as follows (dollars in millions):
|
| | | | | | | | | | | |
| NAIC designation | | Amortized cost | | Estimated fair value | | Percentage of total estimated fair value |
| 1 | | $ | 8,930.8 |
| | $ | 10,158.6 |
| | 49.2 | % |
| 2 | | 8,294.0 |
| | 9,310.1 |
| | 45.1 |
|
| 3 | | 800.6 |
| | 800.6 |
| | 3.9 |
|
| 4 | | 350.2 |
| | 334.5 |
| | 1.6 |
|
| 5 | | 32.5 |
| | 31.1 |
| | .2 |
|
| 6 | | — |
| | — |
| | — |
|
| | | $ | 18,408.1 |
| | $ | 20,634.9 |
| | 100.0 | % |
CNO FINANCIAL GROUP, INC. AND SUBSIDIARIES
Notes to Consolidated Financial Statements
___________________
At December 31, 2013, the amortized cost, gross unrealized gains and losses, estimated fair value and other-than-temporary impairments in accumulated other comprehensive income of fixed maturities, available for sale, and equity securities were as follows (dollars in millions):
|
| | | | | | | | | | | | | | | | | | | |
| | Amortized cost | | Gross unrealized gains | | Gross unrealized losses | | Estimated fair value | | Other-than-temporary impairments included in accumulated other comprehensive income |
| Investment grade (a): | | | | | | | | | |
| Corporate securities | $ | 13,404.1 |
| | $ | 1,086.2 |
| | $ | (125.8 | ) | | $ | 14,364.5 |
| | $ | — |
|
| United States Treasury securities and obligations of United States government corporations and agencies | 71.1 |
| | 2.6 |
| | (.6 | ) | | 73.1 |
| | — |
|
| States and political subdivisions | 2,130.2 |
| | 106.8 |
| | (38.5 | ) | | 2,198.5 |
| | — |
|
| Asset-backed securities | 869.9 |
| | 41.6 |
| | (3.9 | ) | | 907.6 |
| | — |
|
| Collateralized debt obligations | 259.4 |
| | 7.4 |
| | (.1 | ) | | 266.7 |
| | — |
|
| Commercial mortgage-backed securities | 1,517.1 |
| | 97.7 |
| | (5.8 | ) | | 1,609.0 |
| | — |
|
| Mortgage pass-through securities | 12.7 |
| | .7 |
| | — |
| | 13.4 |
| | — |
|
| Collateralized mortgage obligations | 936.2 |
| | 34.3 |
| | (1.3 | ) | | 969.2 |
| | — |
|
| Total investment grade fixed maturities, available for sale | 19,200.7 |
| | 1,377.3 |
| | (176.0 | ) | | 20,402.0 |
| | — |
|
| Below-investment grade (a): | |
| | |
| | |
| | |
| | |
| Corporate securities | 1,314.5 |
| | 53.4 |
| | (32.7 | ) | | 1,335.2 |
| | — |
|
| States and political subdivisions | 6.4 |
| | — |
| | (.5 | ) | | 5.9 |
| | — |
|
| Asset-backed securities | 523.5 |
| | 34.3 |
| | (3.3 | ) | | 554.5 |
| | — |
|
| Collateralized debt obligations | 27.6 |
| | .1 |
| | (.4 | ) | | 27.3 |
| | — |
|
| Collateralized mortgage obligations | 819.1 |
| | 60.9 |
| | (.3 | ) | | 879.7 |
| | (4.3 | ) |
| Total below-investment grade fixed maturities, available for sale | 2,691.1 |
| | 148.7 |
| | (37.2 | ) | | 2,802.6 |
| | (4.3 | ) |
| Total fixed maturities, available for sale | $ | 21,891.8 |
| | $ | 1,526.0 |
| | $ | (213.2 | ) | | $ | 23,204.6 |
| | $ | (4.3 | ) |
| Equity securities | $ | 206.7 |
| | $ | 16.3 |
| | $ | — |
| | $ | 223.0 |
| | |
CNO FINANCIAL GROUP, INC. AND SUBSIDIARIES
Notes to Consolidated Financial Statements
___________________
Accumulated other comprehensive income is primarily comprised of the net effect of unrealized appreciation (depreciation) on our investments. These amounts, included in shareholders' equity as of December 31, 2014 and 2013, were as follows (dollars in millions):
|
| | | | | | | |
| | 2014 | | 2013 |
| Net unrealized appreciation (depreciation) on fixed maturity securities, available for sale, on which an other-than-temporary impairment loss has been recognized | $ | 5.3 |
| | $ | 6.5 |
|
| Net unrealized gains on all other investments | 2,207.7 |
| | 1,322.6 |
|
| Adjustment to present value of future profits (a) | (149.9 | ) | | (47.7 | ) |
| Adjustment to deferred acquisition costs | (390.5 | ) | | (137.0 | ) |
| Adjustment to insurance liabilities | (381.4 | ) | | — |
|
| Unrecognized net loss related to deferred compensation plan | (8.5 | ) | | (7.1 | ) |
| Deferred income tax liabilities | (457.4 | ) | | (405.5 | ) |
| Accumulated other comprehensive income | $ | 825.3 |
| | $ | 731.8 |
|
________
| |
| (a) | The present value of future profits is the value assigned to the right to receive future cash flows from contracts existing at September 10, 2003, the date our Predecessor emerged from bankruptcy. |
At December 31, 2014, adjustments to the present value of future profits, deferred acquisition costs, insurance liabilities and deferred tax assets included $(128.8) million, $(142.2) million, $(381.4) million and $232.1 million, respectively, for premium deficiencies that would exist on certain blocks of business (primarily long-term care products) if unrealized gains on the assets backing such products had been realized and the proceeds from the sales of such assets were invested at then current yields.
At December 31, 2013, adjustments to the present value of future profits and deferred tax assets included $(27.8) million and $9.9 million, respectively, for premium deficiencies that would exist on certain long-term health products if unrealized gains on the assets backing such products had been realized and the proceeds from the sales of such assets were invested at then current yields.
Below-Investment Grade Securities
At December 31, 2014, the amortized cost of the Company's below-investment grade fixed maturity securities was $2,339.2 million, or 13 percent of the Company's fixed maturity portfolio. The estimated fair value of the below-investment grade portfolio was $2,416.1 million, or 103 percent of the amortized cost.
Below-investment grade corporate debt securities typically have different characteristics than investment grade corporate debt securities. Based on historical performance, probability of default by the borrower is significantly greater for below-investment grade corporate debt securities and in many cases severity of loss is relatively greater as such securities are generally unsecured and often subordinated to other indebtedness of the issuer. Also, issuers of below-investment grade corporate debt securities frequently have higher levels of debt relative to investment-grade issuers, hence, all other things being equal, are generally more sensitive to adverse economic conditions. The Company attempts to reduce the overall risk related to its investment in below-investment grade securities, as in all investments, through careful credit analysis, strict investment policy guidelines, and diversification by issuer and/or guarantor and by industry.
CNO FINANCIAL GROUP, INC. AND SUBSIDIARIES
Notes to Consolidated Financial Statements
___________________
Contractual Maturity
The following table sets forth the amortized cost and estimated fair value of fixed maturities, available for sale, at December 31, 2014, by contractual maturity. Actual maturities will differ from contractual maturities because certain borrowers may have the right to call or prepay obligations with or without penalties. In addition, structured securities (such as asset-backed securities, collateralized debt obligations, commercial mortgage-backed securities, mortgage pass-through securities and collateralized mortgage obligations, collectively referred to as "structured securities") frequently include provisions for periodic principal payments and permit periodic unscheduled payments.
|
| | | | | | | |
| | Amortized cost | | Estimated fair value |
| | (Dollars in millions) |
| Due in one year or less | $ | 216.5 |
| | $ | 220.0 |
|
| Due after one year through five years | 1,966.5 |
| | 2,152.3 |
|
| Due after five years through ten years | 2,689.5 |
| | 2,879.6 |
|
| Due after ten years | 9,565.7 |
| | 11,167.6 |
|
| Subtotal | 14,438.2 |
| | 16,419.5 |
|
| Structured securities | 3,969.9 |
| | 4,215.4 |
|
| Total fixed maturities, available for sale | $ | 18,408.1 |
| | $ | 20,634.9 |
|
Net Investment Income
Net investment income consisted of the following (dollars in millions):
|
| | | | | | | | | | | |
| | 2014 | | 2013 | | 2012 |
| | | | | | |
| General account assets: | | | | | |
| Fixed maturities | $ | 1,175.8 |
| | $ | 1,290.3 |
| | $ | 1,281.1 |
|
| Equity securities | 13.9 |
| | 7.0 |
| | 4.2 |
|
| Mortgage loans | 104.2 |
| | 96.3 |
| | 99.8 |
|
| Policy loans | 11.0 |
| | 17.3 |
| | 17.1 |
|
| Other invested assets | 17.1 |
| | 14.4 |
| | 14.4 |
|
| Cash and cash equivalents | .6 |
| | .5 |
| | .6 |
|
| Policyholder and reinsurer accounts and other special-purpose portfolios: | | | | | |
| Trading securities (a) | 14.8 |
| | 12.8 |
| | 26.3 |
|
| Options related to fixed index products: | | | | | |
| Option income | 118.9 |
| | 77.4 |
| | .4 |
|
| Change in value of options | (49.4 | ) | | 100.1 |
| | 25.1 |
|
| Other special-purpose portfolios | 42.1 |
| | 67.9 |
| | 36.1 |
|
| Gross investment income | 1,449.0 |
| | 1,684.0 |
| | 1,505.1 |
|
| Less investment expenses | 21.6 |
| | 20.0 |
| | 18.7 |
|
| Net investment income | $ | 1,427.4 |
| | $ | 1,664.0 |
| | $ | 1,486.4 |
|
_________________
| |
| (a) | Changes in the estimated fair value for trading securities still held as of the end of the respective years and included in net investment income were $3.4 million, $.4 million and $4.9 million for the years ended December 31, 2014, 2013 and 2012, respectively. |
CNO FINANCIAL GROUP, INC. AND SUBSIDIARIES
Notes to Consolidated Financial Statements
___________________
The estimated fair value of fixed maturity investments and mortgage loans not accruing investment income totaled nil and $.5 million at December 31, 2014 and 2013, respectively.
Net Realized Investment Gains (Losses)
The following table sets forth the net realized investment gains (losses) for the periods indicated (dollars in millions):
|
| | | | | | | | | | | |
| | 2014 | | 2013 | | 2012 |
| Fixed maturity securities, available for sale: | | | | | |
| Gross realized gains on sale | $ | 64.4 |
| | $ | 57.7 |
| | $ | 115.4 |
|
| Gross realized losses on sale | (13.0 | ) | | (11.4 | ) | | (15.4 | ) |
| Impairments: | | | | | |
| Total other-than-temporary impairment losses | — |
| | (7.1 | ) | | (1.0 | ) |
| Other-than-temporary impairment losses recognized in accumulated other comprehensive income | — |
| | — |
| | — |
|
| Net impairment losses recognized | — |
| | (7.1 | ) | | (1.0 | ) |
| Net realized investment gains from fixed maturities | 51.4 |
| | 39.2 |
| | 99.0 |
|
| Equity securities | 10.1 |
| | 4.8 |
| | .1 |
|
| Commercial mortgage loans | (.1 | ) | | (1.1 | ) | | (3.7 | ) |
| Impairments of mortgage loans and other investments | (27.3 | ) | | (4.5 | ) | | (36.8 | ) |
| Other (a) | 2.6 |
| | (5.0 | ) | | 22.5 |
|
| Net realized investment gains (losses) | $ | 36.7 |
| | $ | 33.4 |
| | $ | 81.1 |
|
_________________
| |
| (a) | Changes in the estimated fair value for trading securities for we have elected the fair value option still held as of the end of the respective years and included in net realized investment gains (losses) were $7.8 million, $(3.0) million and $20.1 million for the years ended December 31, 2014, 2013 and 2012, respectively. |
During 2014, we recognized net realized investment gains of $36.7 million, which were comprised of: (i) $54.4 million of net gains from the sales of investments (primarily fixed maturities) with proceeds of $2.1 billion; (ii) the increase in fair value of certain fixed maturity investments with embedded derivatives of $7.6 million; (iii) the increase in fair value of embedded derivatives related to a modified coinsurance agreement of $2.0 million; and (iv) $27.3 million of writedowns of mortgage loans and other investments for other than temporary declines in fair value recognized through net income.
During 2013, we recognized net realized investment gains of $33.4 million, which were comprised of: (i) $51.8 million of net gains from the sales of investments (primarily fixed maturities) with proceeds of $2.3 billion; (ii) the decrease in fair value of certain fixed maturity investments with embedded derivatives of $6.8 million; and (iii) $11.6 million of writedowns of investments for other than temporary declines in fair value recognized through net income.
During 2012, we recognized net realized investment gains of $81.1 million, which were comprised of: (i) $98.8 million of net gains from the sales of investments (primarily fixed maturities) with proceeds of $2.1 billion; (ii) the increase in fair value of certain fixed maturity investments with embedded derivatives of $20.1 million; and (iii) $37.8 million of writedowns of investments for other than temporary declines in fair value recognized through net income.
At December 31, 2014, there were no fixed maturity securities in default or considered nonperforming.
During 2014, the $13.0 million of realized losses on sales of $233.7 million of fixed maturity securities, available for sale, included: (i) $.7 million of losses related to the sales of securities issued by state and political subdivisions; and (ii) $12.3 million of additional losses primarily related to various corporate securities. Securities are generally sold at a loss following unforeseen issue-specific events or conditions or shifts in perceived risks. These reasons include but are
CNO FINANCIAL GROUP, INC. AND SUBSIDIARIES
Notes to Consolidated Financial Statements
___________________
not limited to: (i) changes in the investment environment; (ii) expectation that the market value could deteriorate further; (iii) desire to reduce our exposure to an asset class, an issuer or an industry; (iv) prospective or actual changes in credit quality; or (v) changes in expected cash flows.
During 2014, we recognized $27.3 million of impairment losses recorded in earnings which included: (i) a $6.8 million writedown of commercial mortgage loans as a result of our intent to sell the loans; (ii) $19.1 million of impairments related to two legacy private company investments where earnings and cash flows have not met the expectations assumed in our previous valuations; and (iii) $1.4 million of losses on other investments following unforeseen issue-specific events or conditions.
During 2013, the $11.4 million of realized losses on sales of $477.5 million of fixed maturity securities, available for sale, included: (i) $2.5 million of losses related to the sales of mortgage-backed securities and asset-backed securities; and (ii) $8.9 million of additional losses primarily related to various corporate securities.
During 2013, the $11.6 million of other-than-temporary impairments we recorded in earnings included: (i) $5.0 million of losses on a corporate security; (ii) $2.5 million of losses on an equity security; and (iii) $4.1 million of losses primarily related to fixed maturity securities following unforeseen issue-specific events or conditions.
During 2012, the $15.4 million of realized losses on sales of $402.5 million of fixed maturity securities, available for sale, included: (i) $5.2 million of losses related to the sales of mortgage-backed securities and asset-backed securities; and (ii) $10.2 million of additional losses primarily related to various corporate securities.
During 2012, the $37.8 million of other-than-temporary impairments we recorded in earnings included: (i) $5.4 million of losses related to certain commercial mortgage loans; (ii) $29.9 million of losses on equity securities primarily related to investments obtained through the commutation of an investment made by our Predecessor; and (iii) $2.5 million of losses on other investments following unforeseen issue-specific events or conditions.
Our fixed maturity investments are generally purchased in the context of various long-term strategies, including funding insurance liabilities, so we do not generally seek to generate short-term realized gains through the purchase and sale of such securities. In certain circumstances, including those in which securities are selling at prices which exceed our view of their underlying economic value, or when it is possible to reinvest the proceeds to better meet our long-term asset-liability objectives, we may sell certain securities.
The following summarizes the investments sold at a loss during 2014 which had been continuously in an unrealized loss position exceeding 20 percent of the amortized cost basis prior to the sale for the period indicated (dollars in millions):
|
| | | | | | | | | |
| | | | At date of sale |
| | Number
of issuers | | Amortized cost | | Fair value |
| Less than 6 months prior to sale | 1 | | $ | .5 |
| | $ | .4 |
|
| Greater than or equal to 6 months and less than 12 months prior to sale | 1 | | .2 |
| | .2 |
|
| Greater than 12 months prior to sale | 2 | | 5.2 |
| | 3.9 |
|
| | 4 | | $ | 5.9 |
| | $ | 4.5 |
|
We regularly evaluate all of our investments with unrealized losses for possible impairment. Our assessment of whether unrealized losses are "other than temporary" requires significant judgment. Factors considered include: (i) the extent to which fair value is less than the cost basis; (ii) the length of time that the fair value has been less than cost; (iii) whether the unrealized loss is event driven, credit-driven or a result of changes in market interest rates or risk premium; (iv) the near-term prospects for specific events, developments or circumstances likely to affect the value of the investment; (v) the investment's rating and whether the investment is investment-grade and/or has been downgraded since its purchase; (vi) whether the issuer is current on all payments in accordance with the contractual terms of the investment
CNO FINANCIAL GROUP, INC. AND SUBSIDIARIES
Notes to Consolidated Financial Statements
___________________
and is expected to meet all of its obligations under the terms of the investment; (vii) whether we intend to sell the investment or it is more likely than not that circumstances will require us to sell the investment before recovery occurs; (viii) the underlying current and prospective asset and enterprise values of the issuer and the extent to which the recoverability of the carrying value of our investment may be affected by changes in such values; (ix) projections of, and unfavorable changes in, cash flows on structured securities including mortgage-backed and asset-backed securities; (x) our best estimate of the value of any collateral; and (xi) other objective and subjective factors.
Future events may occur, or additional information may become available, which may necessitate future realized losses in our portfolio. Significant losses could have a material adverse effect on our consolidated financial statements in future periods.
Impairment losses on equity securities are recognized in net income. The manner in which impairment losses on fixed maturity securities, available for sale, are recognized in the financial statements is dependent on the facts and circumstances related to the specific security. If we intend to sell a security or it is more likely than not that we would be required to sell a security before the recovery of its amortized cost, the security is other-than-temporarily impaired and the full amount of the impairment is recognized as a loss through earnings. If we do not expect to recover the amortized cost basis, we do not plan to sell the security, and if it is not more likely than not that we would be required to sell a security before the recovery of its amortized cost, less any current period credit loss, the recognition of the other-than-temporary impairment is bifurcated. We recognize the credit loss portion in net income and the noncredit loss portion in accumulated other comprehensive income.
We estimate the amount of the credit loss component of a fixed maturity security impairment as the difference between amortized cost and the present value of the expected cash flows of the security. The present value is determined using the best estimate of future cash flows discounted at the effective interest rate implicit to the security at the date of purchase or the current yield to accrete an asset-backed or floating rate security. The methodology and assumptions for establishing the best estimate of future cash flows vary depending on the type of security.
For most structured securities, cash flow estimates are based on bond specific facts and circumstances that may include collateral characteristics, expectations of delinquency and default rates, loss severity, prepayment speeds and structural support, including excess spread, subordination and guarantees. For corporate bonds, cash flow estimates are derived from scenario-based outcomes of expected corporate restructurings or the disposition of assets using bond specific facts and circumstances. The previous amortized cost basis less the impairment recognized in net income becomes the security's new cost basis. We accrete the new cost basis to the estimated future cash flows over the expected remaining life of the security, except when the security is in default or considered nonperforming.
The remaining noncredit impairment, which is recorded in accumulated other comprehensive income, is the difference between the security's estimated fair value and our best estimate of future cash flows discounted at the effective interest rate prior to impairment. The remaining noncredit impairment typically represents changes in the market interest rates, current market liquidity and risk premiums. As of December 31, 2014, other-than-temporary impairments included in accumulated other comprehensive income of $3.2 million (before taxes and related amortization) related to structured securities.
Mortgage loans are impaired when it is probable that we will not collect the contractual principal and interest on the loan. We measure impairment based upon the difference between the carrying value of the loan and the estimated fair value of the collateral securing the loan less cost to sell.
The following table summarizes the amount of credit losses recognized in earnings on fixed maturity securities, available for sale, held at the beginning of the period, for which a portion of the other-than-temporary impairment was also recognized in accumulated other comprehensive income for years ended December 31, 2014, 2013 and 2012 (dollars in millions):
CNO FINANCIAL GROUP, INC. AND SUBSIDIARIES
Notes to Consolidated Financial Statements
___________________
|
| | | | | | | | | | | |
| | Year ended |
| | December 31, |
| | 2014 | | 2013 | | 2012 |
| Credit losses on fixed maturity securities, available for sale, beginning of period | $ | (1.3 | ) | | $ | (1.6 | ) | | $ | (2.0 | ) |
| Add: credit losses on other-than-temporary impairments not previously recognized | — |
| | — |
| | — |
|
| Less: credit losses on securities sold | .3 |
| | .3 |
| | .4 |
|
| Less: credit losses on securities impaired due to intent to sell (a) | — |
| | — |
| | — |
|
| Add: credit losses on previously impaired securities | — |
| | — |
| | — |
|
| Less: increases in cash flows expected on previously impaired securities | — |
| | — |
| | — |
|
| Credit losses on fixed maturity securities, available for sale, end of period | $ | (1.0 | ) | | $ | (1.3 | ) | | $ | (1.6 | ) |
__________
| |
| (a) | Represents securities for which the amount previously recognized in accumulated other comprehensive income was recognized in earnings because we intend to sell the security or we more likely than not will be required to sell the security before recovery of its amortized cost basis. |
Investments with Unrealized Losses
The following table sets forth the amortized cost and estimated fair value of those fixed maturities, available for sale, with unrealized losses at December 31, 2014, by contractual maturity. Actual maturities will differ from contractual maturities because borrowers may have the right to call or prepay obligations with or without penalties. Structured securities frequently include provisions for periodic principal payments and permit periodic unscheduled payments.
|
| | | | | | | |
| | Amortized cost | | Estimated fair value |
| | (Dollars in millions) |
| Due in one year or less | $ | 7.8 |
| | $ | 7.8 |
|
| Due after one year through five years | 170.7 |
| | 165.3 |
|
| Due after five years through ten years | 508.4 |
| | 474.4 |
|
| Due after ten years | 758.2 |
| | 709.4 |
|
| Subtotal | 1,445.1 |
| | 1,356.9 |
|
| Structured securities | 502.8 |
| | 494.2 |
|
| Total | $ | 1,947.9 |
| | $ | 1,851.1 |
|
The following summarizes the investments in our portfolio rated below-investment grade which have been continuously in an unrealized loss position exceeding 20 percent of the cost basis for the period indicated as of December 31, 2014 (dollars in millions):
|
| | | | | | | | | | | | | |
| | Number
of issuers | | Cost
basis | | Unrealized
loss | | Estimated
fair value |
| Less than 6 months | 6 | | $ | 40.9 |
| | $ | (10.3 | ) | | $ | 30.6 |
|
| Greater than 12 months (a) | 1 | | 14.1 |
| | (4.5 | ) | | 9.6 |
|
| | 7 | | $ | 55.0 |
| | $ | (14.8 | ) | | $ | 40.2 |
|
CNO FINANCIAL GROUP, INC. AND SUBSIDIARIES
Notes to Consolidated Financial Statements
___________________
________________
| |
| (a) | With respect to the security which has been in an unrealized position for greater than 12 months, we have analyzed the issuer's financial performance and determined we expect to recover the entire amortized cost. |
The following table summarizes the gross unrealized losses and fair values of our investments with unrealized losses that are not deemed to be other-than-temporarily impaired, aggregated by investment category and length of time that such securities have been in a continuous unrealized loss position, at December 31, 2014 (dollars in millions):
|
| | | | | | | | | | | | | | | | | | | | | | | | |
| | | Less than 12 months | | 12 months or greater | | Total |
| Description of securities | | Fair value | | Unrealized losses | | Fair value | | Unrealized losses | | Fair value | | Unrealized losses |
| United States Treasury securities and obligations of United States government corporations and agencies | | $ | 12.1 |
| | $ | (.1 | ) | | $ | 4.6 |
| | $ | — |
| | $ | 16.7 |
| | $ | (.1 | ) |
| States and political subdivisions | | 13.2 |
| | (.3 | ) | | 44.5 |
| | (2.7 | ) | | 57.7 |
| | (3.0 | ) |
| Corporate securities | | 985.0 |
| | (65.9 | ) | | 297.5 |
| | (19.2 | ) | | 1,282.5 |
| | (85.1 | ) |
| Asset-backed securities | | 91.2 |
| | (1.3 | ) | | 60.5 |
| | (2.1 | ) | | 151.7 |
| | (3.4 | ) |
| Collateralized debt obligations | | 184.2 |
| | (3.4 | ) | | — |
| | — |
| | 184.2 |
| | (3.4 | ) |
| Commercial mortgage-backed securities | | 46.7 |
| | (.5 | ) | | — |
| | — |
| | 46.7 |
| | (.5 | ) |
| Mortgage pass-through securities | | .5 |
| | — |
| | .1 |
| | — |
| | .6 |
| | — |
|
| Collateralized mortgage obligations | | 79.0 |
| | (.8 | ) | | 32.0 |
| | (.5 | ) | | 111.0 |
| | (1.3 | ) |
| Total fixed maturities, available for sale | | $ | 1,411.9 |
| | $ | (72.3 | ) | | $ | 439.2 |
| | $ | (24.5 | ) | | $ | 1,851.1 |
| | $ | (96.8 | ) |
| Equity securities | | $ | 13.2 |
| | $ | (.6 | ) | | $ | .5 |
| | $ | — |
| | $ | 13.7 |
| | $ | (.6 | ) |
The following table summarizes the gross unrealized losses and fair values of our investments with unrealized losses that are not deemed to be other-than-temporarily impaired, aggregated by investment category and length of time that such securities have been in a continuous unrealized loss position, at December 31, 2013 (dollars in millions):
|
| | | | | | | | | | | | | | | | | | | | | | | | |
| | | Less than 12 months | | 12 months or greater | | Total |
| Description of securities | | Fair value | | Unrealized losses | | Fair value | | Unrealized losses | | Fair value | | Unrealized losses |
| United States Treasury securities and obligations of United States government corporations and agencies | | $ | 23.8 |
| | $ | (.6 | ) | | $ | — |
| | $ | — |
| | $ | 23.8 |
| | $ | (.6 | ) |
| States and political subdivisions | | 473.6 |
| | (30.3 | ) | | 79.2 |
| | (8.7 | ) | | 552.8 |
| | (39.0 | ) |
| Corporate securities | | 2,432.4 |
| | (137.7 | ) | | 170.3 |
| | (20.8 | ) | | 2,602.7 |
| | (158.5 | ) |
| Asset-backed securities | | 308.4 |
| | (6.5 | ) | | 32.5 |
| | (.7 | ) | | 340.9 |
| | (7.2 | ) |
| Collateralized debt obligations | | 46.7 |
| | (.5 | ) | | — |
| | — |
| | 46.7 |
| | (.5 | ) |
| Commercial mortgage-backed securities | | 161.8 |
| | (5.8 | ) | | — |
| | — |
| | 161.8 |
| | (5.8 | ) |
| Mortgage pass-through securities | | 1.6 |
| | — |
| | 1.6 |
| | — |
| | 3.2 |
| | — |
|
| Collateralized mortgage obligations | | 121.8 |
| | (1.6 | ) | | 2.2 |
| | — |
| | 124.0 |
| | (1.6 | ) |
| Total fixed maturities, available for sale | | $ | 3,570.1 |
| | $ | (183.0 | ) | | $ | 285.8 |
| | $ | (30.2 | ) | | $ | 3,855.9 |
| | $ | (213.2 | ) |
| Equity securities | | $ | .5 |
| | $ | — |
| | $ | — |
| | $ | — |
| | $ | .5 |
| | $ | — |
|
CNO FINANCIAL GROUP, INC. AND SUBSIDIARIES
Notes to Consolidated Financial Statements
___________________
Based on management's current assessment of investments with unrealized losses at December 31, 2014, the Company believes the issuers of the securities will continue to meet their obligations (or with respect to equity-type securities, the investment value will recover to its cost basis). While we do not have the intent to sell securities with unrealized losses and it is not more likely than not that we will be required to sell securities with unrealized losses prior to their anticipated recovery, our intent on an individual security may change, based upon market or other unforeseen developments. In such instances, if a loss is recognized from a sale subsequent to a balance sheet date due to these unexpected developments, the loss is recognized in the period in which we had the intent to sell the security before its anticipated recovery.
Structured Securities
At December 31, 2014 fixed maturity investments included structured securities with an estimated fair value of $4.2 billion (or 20 percent of all fixed maturity securities). The yield characteristics of structured securities generally differ in some respects from those of traditional corporate fixed-income securities or government securities. For example, interest and principal payments on structured securities may occur more frequently, often monthly. In many instances, we are subject to variability in the amount and timing of principal and interest payments. For example, in many cases, partial prepayments may occur at the option of the issuer and prepayment rates are influenced by a number of factors that cannot be predicted with certainty, including: the relative sensitivity of prepayments on the underlying assets backing the security to changes in interest rates and asset values; the availability and cost of alternative financing; a variety of economic, geographic and other factors; the timing, pace and proceeds of liquidations of defaulted collateral; and various security-specific structural considerations (for example, the repayment priority of a given security in a securitization structure). In addition, the total amount of payments for non-agency structured securities may be affected by changes to cumulative default rates or loss severities of the related collateral.
Historically, the rate of prepayments on structured securities has tended to increase when prevailing interest rates have declined significantly in absolute terms and also relative to the interest rates on the underlying collateral. The yields recognized on structured securities purchased at a discount to par will generally increase (relative to the stated rate) when the underlying collateral prepays faster than expected. The yields recognized on structured securities purchased at a premium will decrease (relative to the stated rate) when the underlying collateral prepays faster than expected. When interest rates decline, the proceeds from prepayments may be reinvested at lower rates than we were earning on the prepaid securities. When interest rates increase, prepayments may decrease below expected levels. When this occurs, the average maturity and duration of structured securities increases, decreasing the yield on structured securities purchased at discounts and increasing the yield on those purchased at a premium because of a decrease in the annual amortization of premium.
For structured securities included in fixed maturities, available for sale, that were purchased at a discount or premium, we recognize investment income using an effective yield based on anticipated future prepayments and the estimated final maturity of the securities. Actual prepayment experience is periodically reviewed and effective yields are recalculated when differences arise between the prepayments originally anticipated and the actual prepayments received and currently anticipated. For credit sensitive mortgage-backed and asset-backed securities, and for securities that can be prepaid or settled in a way that we would not recover substantially all of our investment, the effective yield is recalculated on a prospective basis. Under this method, the amortized cost basis in the security is not immediately adjusted and a new yield is applied prospectively. For all other structured and asset-backed securities, the effective yield is recalculated when changes in assumptions are made, and reflected in our income on a retrospective basis. Under this method, the amortized cost basis of the investment in the securities is adjusted to the amount that would have existed had the new effective yield been applied since the acquisition of the securities. Such adjustments were not significant in 2014.
For purchased credit impaired securities, at acquisition, the difference between the undiscounted expected future cash flows and the recorded investment in the securities represents the initial accretable yield, which is to be accreted into net investment income over the securities’ remaining lives on a level-yield basis. Subsequently, effective yields recognized on purchased credit impaired securities are recalculated and adjusted prospectively to reflect changes in the contractual benchmark interest rates on variable rate securities and any significant increases in undiscounted expected future cash flows arising due to reasons other than interest rate changes. Significant decreases in expected cash flows arising from credit events would result in impairment if such security's fair value is below amortized cost.
CNO FINANCIAL GROUP, INC. AND SUBSIDIARIES
Notes to Consolidated Financial Statements
___________________
The following table sets forth the par value, amortized cost and estimated fair value of structured securities, summarized by interest rates on the underlying collateral, at December 31, 2014 (dollars in millions):
|
| | | | | | | | | | | |
| | Par value | | Amortized cost | | Estimated fair value |
| Below 4 percent | $ | 1,160.7 |
| | $ | 887.8 |
| | $ | 908.0 |
|
| 4 percent – 5 percent | 759.5 |
| | 717.6 |
| | 757.7 |
|
| 5 percent – 6 percent | 1,880.0 |
| | 1,760.1 |
| | 1,882.2 |
|
| 6 percent – 7 percent | 533.6 |
| | 496.5 |
| | 544.7 |
|
| 7 percent – 8 percent | 85.3 |
| | 87.0 |
| | 101.3 |
|
| 8 percent and above | 20.0 |
| | 20.9 |
| | 21.5 |
|
| Total structured securities | $ | 4,439.1 |
| | $ | 3,969.9 |
| | $ | 4,215.4 |
|
The amortized cost and estimated fair value of structured securities at December 31, 2014, summarized by type of security, were as follows (dollars in millions):
|
| | | | | | | | | | |
| | | | Estimated fair value |
| Type | Amortized cost | | Amount | | Percent of fixed maturities |
| Pass-throughs, sequential and equivalent securities | $ | 969.4 |
| | $ | 1,033.4 |
| | 5.0 | % |
| Planned amortization classes, target amortization classes and accretion-directed bonds | 243.3 |
| | 262.0 |
| | 1.3 |
|
| Commercial mortgage-backed securities | 1,195.0 |
| | 1,276.3 |
| | 6.2 |
|
| Asset-backed securities | 1,186.6 |
| | 1,269.0 |
| | 6.1 |
|
| Collateralized debt obligations | 325.3 |
| | 324.5 |
| | 1.6 |
|
| Other | 50.3 |
| | 50.2 |
| | .2 |
|
| Total structured securities | $ | 3,969.9 |
| | $ | 4,215.4 |
| | 20.4 | % |
Pass-throughs, sequentials and equivalent securities have unique prepayment variability characteristics. Pass-through securities typically return principal to the holders based on cash payments from the underlying mortgage obligations. Sequential securities return principal to tranche holders in a detailed hierarchy. Planned amortization classes, targeted amortization classes and accretion-directed bonds adhere to fixed schedules of principal payments as long as the underlying mortgage loans experience prepayments within certain estimated ranges. In most circumstances, changes in prepayment rates are first absorbed by support or companion classes insulating the timing of receipt of cash flows from the consequences of both faster prepayments (average life shortening) and slower prepayments (average life extension).
Commercial mortgage-backed securities are secured by commercial real estate mortgages, generally income producing properties that are managed for profit. Property types include multi-family dwellings including apartments, retail centers, hotels, restaurants, hospitals, nursing homes, warehouses, and office buildings. While most commercial mortgage-backed securities have call protection features whereby underlying borrowers may not prepay their mortgages for stated periods of time without incurring prepayment penalties, recoveries on defaulted collateral may result in involuntary prepayments.
CNO FINANCIAL GROUP, INC. AND SUBSIDIARIES
Notes to Consolidated Financial Statements
___________________
Commercial Mortgage Loans
At December 31, 2014, the mortgage loan balance was primarily comprised of commercial mortgage loans. Approximately 13 percent, 10 percent and 7 percent of the mortgage loan balance were on properties located in California, Texas and Maryland, respectively. No other state comprised greater than five percent of the mortgage loan balance. None of the commercial mortgage loan balance was noncurrent at December 31, 2014. Our commercial mortgage loan portfolio is comprised of large commercial mortgage loans. We do not hold groups of smaller-balance homogeneous loans. Our loans have risk characteristics that are individually unique. Accordingly, we measure potential losses on a loan-by-loan basis rather than establishing an allowance for losses on mortgage loans.
The following table provides the carrying value and estimated fair value of our outstanding mortgage loans and the underlying collateral as of December 31, 2014 (dollars in millions):
|
| | | | | | | | | | | |
| | | | Estimated fair value |
| Loan-to-value ratio (a) | Carrying value | | Mortgage loans | | Collateral |
| Less than 60% | $ | 745.8 |
| | $ | 787.4 |
| | $ | 1,694.1 |
|
| 60% to 70% | 376.9 |
| | 387.1 |
| | 587.0 |
|
| Greater than 70% to 80% | 425.3 |
| | 441.6 |
| | 574.8 |
|
| Greater than 80% to 90% | 139.6 |
| | 147.8 |
| | 165.2 |
|
| Greater than 90% | 4.3 |
| | 5.0 |
| | 4.7 |
|
| Total | $ | 1,691.9 |
| | $ | 1,768.9 |
| | $ | 3,025.8 |
|
________________
| |
| (a) | Loan-to-value ratios are calculated as the ratio of: (i) the carrying value of the commercial mortgage loans; to (ii) the estimated fair value of the underlying collateral. |
Other Investment Disclosures
Life insurance companies are required to maintain certain investments on deposit with state regulatory authorities. Such assets had aggregate carrying values of $42.3 million and $65.6 million at December 31, 2014 and 2013, respectively.
CNO had no fixed maturity investments that were in excess of 10 percent of shareholders' equity at December 31, 2014 and 2013.
CNO FINANCIAL GROUP, INC. AND SUBSIDIARIES
Notes to Consolidated Financial Statements
___________________
4. FAIR VALUE MEASUREMENTS
Fair value is the price that would be received to sell an asset or paid to transfer a liability in an orderly transaction between market participants at the measurement date and, therefore, represents an exit price, not an entry price. We carry certain assets and liabilities at fair value on a recurring basis, including fixed maturities, equity securities, trading securities, investments held by VIEs, derivatives, cash and cash equivalents, separate account assets and embedded derivatives. We carry our COLI policy, which is invested in a series of mutual funds, at its cash surrender value and our hedge fund investments at their net asset values; in both cases, we believe these values approximate their fair values. In addition, we disclose fair value for certain financial instruments, including mortgage loans and policy loans, policyholder account balances, investment borrowings, notes payable and borrowings related to VIEs.
The degree of judgment utilized in measuring the fair value of financial instruments is largely dependent on the level to which pricing is based on observable inputs. Observable inputs reflect market data obtained from independent sources, while unobservable inputs reflect our view of market assumptions in the absence of observable market data. Financial instruments with readily available active quoted prices would be considered to have fair values based on the highest level of observable inputs, and little judgment would be utilized in measuring fair value. Financial instruments that rarely trade would often have fair value based on a lower level of observable inputs, and more judgment would be utilized in measuring fair value.
Valuation Hierarchy
There is a three-level hierarchy for valuing assets or liabilities at fair value based on whether inputs are observable or unobservable.
| |
| • | Level 1 – includes assets and liabilities valued using inputs that are unadjusted quoted prices in active markets for identical assets or liabilities. Our Level 1 assets primarily include cash and exchange traded securities. |
| |
| • | Level 2 – includes assets and liabilities valued using inputs that are quoted prices for similar assets in an active market, quoted prices for identical or similar assets in a market that is not active, observable inputs, or observable inputs that can be corroborated by market data. Level 2 assets and liabilities include those financial instruments that are valued by independent pricing services using models or other valuation methodologies. These models consider various inputs such as credit rating, maturity, corporate credit spreads, reported trades and other inputs that are observable or derived from observable information in the marketplace or are supported by transactions executed in the marketplace. Financial assets in this category primarily include: certain publicly registered and privately placed corporate fixed maturity securities; certain government or agency securities; certain mortgage and asset-backed securities; certain equity securities; most investments held by our consolidated VIEs; certain mutual fund and hedge fund investments; most short-term investments; and non-exchange-traded derivatives such as call options. Financial liabilities in this category include investment borrowings, notes payable and borrowings related to VIEs. |
| |
| • | Level 3 – includes assets and liabilities valued using unobservable inputs that are used in model-based valuations that contain management assumptions. Level 3 assets and liabilities include those financial instruments whose fair value is estimated based on broker/dealer quotes, pricing services or internally developed models or methodologies utilizing significant inputs not based on, or corroborated by, readily available market information. Financial assets in this category include certain corporate securities (primarily certain below-investment grade privately placed securities), certain structured securities, mortgage loans, and other less liquid securities. Financial liabilities in this category include our insurance liabilities for interest-sensitive products, which includes embedded derivatives (including embedded derivatives related to our fixed index annuity products and to a modified coinsurance arrangement) since their values include significant unobservable inputs including actuarial assumptions. |
At each reporting date, we classify assets and liabilities into the three input levels based on the lowest level of input that is significant to the measurement of fair value for each asset and liability reported at fair value. This classification is impacted by a number of factors, including the type of financial instrument, whether the financial instrument is new to the market and not yet established, the characteristics specific to the transaction and overall market conditions. Our assessment of the significance of a particular input to the fair value measurement and the ultimate classification of each asset and liability requires judgment and is subject to change from period to period based on the observability of the valuation inputs. Any transfers between levels
CNO FINANCIAL GROUP, INC. AND SUBSIDIARIES
Notes to Consolidated Financial Statements
___________________
are reported as having occurred at the beginning of the period. There were no transfers between Level 1 and Level 2 in 2014 and 2013.
The vast majority of our fixed maturity and equity securities, including those held in trading portfolios and those held by consolidated VIEs, short-term and separate account assets use Level 2 inputs for the determination of fair value. These fair values are obtained primarily from independent pricing services, which use Level 2 inputs for the determination of fair value. Substantially all of our Level 2 fixed maturity securities and separate account assets were valued from independent pricing services. Third party pricing services normally derive security prices through recently reported trades for identical or similar securities making adjustments through the reporting date based upon available market observable information. If there are no recently reported trades, the third party pricing services may use matrix or model processes to develop a security price where future cash flow expectations are discounted at an estimated risk-adjusted market rate. The number of prices obtained for a given security is dependent on the Company's analysis of such prices as further described below.
For securities that are not priced by pricing services and may not be reliably priced using pricing models, we obtain broker quotes. These broker quotes are non-binding and represent an exit price, but assumptions used to establish the fair value may not be observable and therefore represent Level 3 inputs. Approximately 26 percent of our Level 3 fixed maturity securities were valued using unadjusted broker quotes or broker-provided valuation inputs. The remaining Level 3 fixed maturity investments do not have readily determinable market prices and/or observable inputs. For these securities, we use internally developed valuations. Key assumptions used to determine fair value for these securities may include risk premiums, projected performance of underlying collateral and other factors involving significant assumptions which may not be reflective of an active market. For certain investments, we use a matrix or model process to develop a security price where future cash flow expectations are discounted at an estimated market rate. The pricing matrix incorporates term interest rates as well as a spread level based on the issuer's credit rating, other factors relating to the issuer, and the security's maturity. In some instances issuer-specific spread adjustments, which can be positive or negative, are made based upon internal analysis of security specifics such as liquidity, deal size, and time to maturity.
As the Company is responsible for the determination of fair value, we have control processes designed to ensure that the fair values received from third-party pricing sources are reasonable and the valuation techniques and assumptions used appear reasonable and consistent with prevailing market conditions. Additionally, when inputs are provided by third-party pricing sources, we have controls in place to review those inputs for reasonableness. As part of these controls, we perform monthly quantitative and qualitative analysis on the prices received from third parties to determine whether the prices are reasonable estimates of fair value. The Company's analysis includes: (i) a review of the methodology used by third party pricing services; (ii) where available, a comparison of multiple pricing services' valuations for the same security; (iii) a review of month to month price fluctuations; (iv) a review to ensure valuations are not unreasonably dated; and (v) back testing to compare actual purchase and sale transactions with valuations received from third parties. As a result of such procedures, the Company may conclude the prices received from third parties are not reflective of current market conditions. In those instances, we may request additional pricing quotes or apply internally developed valuations. However, the number of instances is insignificant and the aggregate change in value of such investments is not materially different from the original prices received.
The categorization of the fair value measurements of our investments priced by independent pricing services was based upon the Company's judgment of the inputs or methodologies used by the independent pricing services to value different asset classes. Such inputs typically include: benchmark yields, reported trades, broker dealer quotes, issuer spreads, benchmark securities, bids, offers and reference data. The Company categorizes such fair value measurements based upon asset classes and the underlying observable or unobservable inputs used to value such investments.
The fair value measurements for derivative instruments, including embedded derivatives requiring bifurcation, are determined based on the consideration of several inputs including closing exchange or over-the-counter market price quotations; time value and volatility factors underlying options; market interest rates; and non-performance risk. For certain embedded derivatives, we use actuarial assumptions in the determination of fair value.
CNO FINANCIAL GROUP, INC. AND SUBSIDIARIES
Notes to Consolidated Financial Statements
___________________
The categorization of fair value measurements, by input level, for our financial instruments carried at fair value on a recurring basis at December 31, 2014 is as follows (dollars in millions):
|
| | | | | | | | | | | | | | | |
| | Quoted prices in active markets
for identical assets or liabilities
(Level 1) | | Significant other observable inputs (Level 2) | | Significant unobservable inputs (Level 3) | | Total |
| Assets: | | | | | | | |
| Fixed maturities, available for sale: | | | | | | | |
| Corporate securities | $ | — |
| | $ | 13,605.1 |
| | $ | 365.9 |
| | $ | 13,971.0 |
|
| United States Treasury securities and obligations of United States government corporations and agencies | — |
| | 168.9 |
| | — |
| | 168.9 |
|
| States and political subdivisions | — |
| | 2,242.2 |
| | 35.5 |
| | 2,277.7 |
|
| Debt securities issued by foreign governments | — |
| | 1.9 |
| | — |
| | 1.9 |
|
| Asset-backed securities | — |
| | 1,209.8 |
| | 59.2 |
| | 1,269.0 |
|
| Collateralized debt obligations | — |
| | 324.5 |
| | — |
| | 324.5 |
|
| Commercial mortgage-backed securities | — |
| | 1,275.1 |
| | 1.2 |
| | 1,276.3 |
|
| Mortgage pass-through securities | — |
| | 4.2 |
| | .4 |
| | 4.6 |
|
| Collateralized mortgage obligations | — |
| | 1,341.0 |
| | — |
| | 1,341.0 |
|
| Total fixed maturities, available for sale | — |
| | 20,172.7 |
| | 462.2 |
| | 20,634.9 |
|
| Equity securities - corporate securities | 216.9 |
| | 174.1 |
| | 28.0 |
| | 419.0 |
|
| Trading securities: | |
| | |
| | |
| | |
|
| Corporate securities | — |
| | 24.3 |
| | — |
| | 24.3 |
|
| United States Treasury securities and obligations of United States government corporations and agencies | — |
| | 3.7 |
| | — |
| | 3.7 |
|
| Asset-backed securities | — |
| | 24.0 |
| | — |
| | 24.0 |
|
| Commercial mortgage-backed securities | — |
| | 131.0 |
| | 28.6 |
| | 159.6 |
|
| Mortgage pass-through securities | — |
| | .1 |
| | — |
| | .1 |
|
| Collateralized mortgage obligations | — |
| | 29.7 |
| | — |
| | 29.7 |
|
| Equity securities | 3.5 |
| | — |
| | — |
| | 3.5 |
|
| Total trading securities | 3.5 |
| | 212.8 |
| | 28.6 |
| | 244.9 |
|
| Investments held by variable interest entities - corporate securities | — |
| | 1,367.1 |
| | — |
| | 1,367.1 |
|
| Other invested assets - derivatives | 1.4 |
| | 107.2 |
| | — |
| | 108.6 |
|
| Assets held in separate accounts | — |
| | 5.6 |
| | — |
| | 5.6 |
|
| Total assets carried at fair value by category | $ | 221.8 |
| | $ | 22,039.5 |
| | $ | 518.8 |
| | $ | 22,780.1 |
|
| | | | | | | | |
| Liabilities: | |
| | |
| | |
| | |
|
| Future policy benefits - embedded derivatives associated with fixed index annuity products | $ | — |
| | $ | — |
| | $ | 1,081.5 |
| | $ | 1,081.5 |
|
CNO FINANCIAL GROUP, INC. AND SUBSIDIARIES
Notes to Consolidated Financial Statements
___________________
The categorization of fair value measurements, by input level, for our financial instruments carried at fair value on a recurring basis at December 31, 2013 is as follows (dollars in millions):
|
| | | | | | | | | | | | | | | |
| | Quoted prices in active markets for identical assets or liabilities (Level 1) | | Significant other observable inputs (Level 2) | | Significant unobservable inputs (Level 3) | | Total |
| Assets: | | | | | | | |
| Fixed maturities, available for sale: | | | | | | | |
| Corporate securities | $ | — |
| | $ | 15,340.1 |
| | $ | 359.6 |
| | $ | 15,699.7 |
|
| United States Treasury securities and obligations of United States government corporations and agencies | — |
| | 73.1 |
| | — |
| | 73.1 |
|
| States and political subdivisions | — |
| | 2,204.4 |
| | — |
| | 2,204.4 |
|
| Asset-backed securities | — |
| | 1,419.9 |
| | 42.2 |
| | 1,462.1 |
|
| Collateralized debt obligations | — |
| | 47.3 |
| | 246.7 |
| | 294.0 |
|
| Commercial mortgage-backed securities | — |
| | 1,609.0 |
| | — |
| | 1,609.0 |
|
| Mortgage pass-through securities | — |
| | 11.8 |
| | 1.6 |
| | 13.4 |
|
| Collateralized mortgage obligations | — |
| | 1,848.9 |
| | — |
| | 1,848.9 |
|
| Total fixed maturities, available for sale | — |
| | 22,554.5 |
| | 650.1 |
| | 23,204.6 |
|
| Equity securities - corporate securities | 79.6 |
| | 118.9 |
| | 24.5 |
| | 223.0 |
|
| Trading securities: | |
| | |
| | |
| | |
|
| Corporate securities | — |
| | 45.2 |
| | — |
| | 45.2 |
|
| United States Treasury securities and obligations of United States government corporations and agencies | — |
| | 4.6 |
| | — |
| | 4.6 |
|
| States and political subdivisions | — |
| | 14.1 |
| | — |
| | 14.1 |
|
| Asset-backed securities | — |
| | 24.3 |
| | — |
| | 24.3 |
|
| Commercial mortgage-backed securities | — |
| | 125.8 |
| | — |
| | 125.8 |
|
| Mortgage pass-through securities | — |
| | .1 |
| | — |
| | .1 |
|
| Collateralized mortgage obligations | — |
| | 31.1 |
| | — |
| | 31.1 |
|
| Equity securities | 2.4 |
| | — |
| | — |
| | 2.4 |
|
| Total trading securities | 2.4 |
| | 245.2 |
| | — |
| | 247.6 |
|
| Investments held by variable interest entities - corporate securities | — |
| | 1,046.7 |
| | — |
| | 1,046.7 |
|
| Other invested assets - derivatives | .6 |
| | 156.2 |
| | — |
| | 156.8 |
|
| Assets held in separate accounts | — |
| | 10.3 |
| | — |
| | 10.3 |
|
| Total assets carried at fair value by category | $ | 82.6 |
| | $ | 24,131.8 |
| | $ | 674.6 |
| | $ | 24,889.0 |
|
| | | | | | | | |
| Liabilities: | |
| | |
| | |
| | |
|
| Future policy benefits - embedded derivatives associated with fixed index annuity products | $ | — |
| | $ | — |
| | $ | 903.7 |
| | $ | 903.7 |
|
| Other liabilities - embedded derivatives associated with modified coinsurance agreement | — |
| | — |
| | 1.8 |
| | 1.8 |
|
| Total liabilities carried at fair value by category | $ | — |
| | $ | — |
| | $ | 905.5 |
| | $ | 905.5 |
|
CNO FINANCIAL GROUP, INC. AND SUBSIDIARIES
Notes to Consolidated Financial Statements
___________________
For those financial instruments disclosed at fair value, we use the following methods and assumptions to determine the estimated fair values:
Mortgage loans and policy loans. We discount future expected cash flows based on interest rates currently being offered for similar loans with similar risk characteristics. We aggregate loans with similar characteristics in our calculations. The fair value of policy loans approximates their carrying value.
Company-owned life insurance is backed by a series of mutual funds and is carried at cash surrender value which approximates estimated fair value.
Alternative investment funds are carried at their net asset values which approximates estimated fair value.
Cash and cash equivalents include commercial paper, invested cash and other investments purchased with original maturities of less than three months. We carry them at amortized cost, which approximates estimated fair value.
Liabilities for policyholder account balances. We discount future expected cash flows based on interest rates currently being offered for similar contracts with similar maturities.
Investment borrowings, notes payable and borrowings related to variable interest entities. For publicly traded debt, we use current fair values. For other notes, we use discounted cash flow analyses based on our current incremental borrowing rates for similar types of borrowing arrangements.
The fair value measurements for our financial instruments disclosed at fair value on a recurring basis are as follows (dollars in millions):
|
| | | | | | | | | | | | | | | | | | | |
| | December 31, 2014 |
| | Quoted prices in active markets for identical assets or liabilities (Level 1) | | Significant other observable inputs (Level 2) | | Significant unobservable inputs (Level 3) | | Total estimated fair value | | Total carrying amount |
| Assets: | | | | | | | | | |
| Mortgage loans | $ | — |
| | $ | — |
| | $ | 1,768.9 |
| | $ | 1,768.9 |
| | $ | 1,691.9 |
|
| Policy loans | — |
| | — |
| | 106.9 |
| | 106.9 |
| | 106.9 |
|
| Other invested assets: | | | | | | | | | |
| Company-owned life insurance | — |
| | 157.6 |
| | — |
| | 157.6 |
| | 157.6 |
|
| Alternative investment funds | — |
| | 102.8 |
| | — |
| | 102.8 |
| | 102.8 |
|
| Cash and cash equivalents: | | | | | | | | | |
| Unrestricted | 549.6 |
| | 62.0 |
| | — |
| | 611.6 |
| | 611.6 |
|
| Held by variable interest entities | 68.3 |
| | — |
| | — |
| | 68.3 |
| | 68.3 |
|
| Liabilities: | | | | | | | | | |
| Policyholder account balances (a) | — |
| | — |
| | 10,707.2 |
| | 10,707.2 |
| | 10,707.2 |
|
| Investment borrowings | — |
| | 1,520.4 |
| | — |
| | 1,520.4 |
| | 1,519.2 |
|
| Borrowings related to variable interest entities | — |
| | 1,229.2 |
| | — |
| | 1,229.2 |
| | 1,286.1 |
|
| Notes payable – direct corporate obligations | — |
| | 807.4 |
| | — |
| | 807.4 |
| | 794.4 |
|
CNO FINANCIAL GROUP, INC. AND SUBSIDIARIES
Notes to Consolidated Financial Statements
___________________
|
| | | | | | | | | | | | | | | | | | | |
| | December 31, 2013 |
| | Quoted prices in active markets for identical assets or liabilities (Level 1) | | Significant other observable inputs (Level 2) | | Significant unobservable inputs (Level 3) | | Total estimated fair value | | Total carrying amount |
| Assets: | | | | | | | | | |
| Mortgage loans | $ | — |
| | $ | — |
| | $ | 1,749.5 |
| | $ | 1,749.5 |
| | $ | 1,729.5 |
|
| Policy loans | — |
| | — |
| | 277.0 |
| | 277.0 |
| | 277.0 |
|
| Other invested assets: | | | | | | | | | |
| Company-owned life insurance | — |
| | 144.8 |
| | — |
| | 144.8 |
| | 144.8 |
|
| Alternative investment funds | — |
| | 67.6 |
| | — |
| | 67.6 |
| | 67.6 |
|
| Cash and cash equivalents: | | | | | | | | | |
| Unrestricted | 457.8 |
| | 241.2 |
| | — |
| | 699.0 |
| | 699.0 |
|
| Held by variable interest entities | 104.3 |
| | — |
| | — |
| | 104.3 |
| | 104.3 |
|
| Liabilities: | | | | | | | | | |
| Policyholder account balances (a) | — |
| | — |
| | 12,776.4 |
| | 12,776.4 |
| | 12,776.4 |
|
| Investment borrowings | — |
| | 1,948.5 |
| | — |
| | 1,948.5 |
| | 1,900.0 |
|
| Borrowings related to variable interest entities | — |
| | 993.7 |
| | — |
| | 993.7 |
| | 1,012.3 |
|
| Notes payable – direct corporate obligations | — |
| | 872.5 |
| | — |
| | 872.5 |
| | 856.4 |
|
____________________
| |
| (a) | The estimated fair value of insurance liabilities for policyholder account balances was approximately equal to its carrying value at December 31, 2014 and 2013. This was because interest rates credited on the vast majority of account balances approximate current rates paid on similar products and because these rates are not generally guaranteed beyond one year. |
CNO FINANCIAL GROUP, INC. AND SUBSIDIARIES
Notes to Consolidated Financial Statements
___________________
The following table presents additional information about assets and liabilities measured at fair value on a recurring basis and for which we have utilized significant unobservable (Level 3) inputs to determine fair value for the year ended December 31, 2014 (dollars in millions):
|
| | | | | | | | | | | | | | | | | | | | | | | | | | | | | | | | | | | | |
| | | December 31, 2014 | | |
| | | Beginning balance as of December 31, 2013 | | Purchases, sales, issuances and settlements, net (b) | | Total realized and unrealized gains (losses) included in net income | | Total realized and unrealized gains (losses) included in accumulated other comprehensive income (loss) | | Transfers into Level 3 (a) | | Transfers out of Level 3 (a) | | Assets of CLIC sold | | Ending balance as of December 31, 2014 | | Amount of total gains (losses) for the year ended December 31, 2014 included in our net income relating to assets and liabilities still held as of the reporting date |
| Assets: | | | | | | | | | | | | | | | | | | |
| Fixed maturities, available for sale: | | | | | | | | | | | | | | | | | | |
| Corporate securities | | $ | 359.6 |
| | $ | 70.0 |
| | $ | — |
| | $ | 20.1 |
| | $ | 36.8 |
| | $ | (69.4 | ) | | $ | (51.2 | ) | | $ | 365.9 |
| | $ | — |
|
| States and political subdivisions | | — |
| | (1.8 | ) | | — |
| | 3.0 |
| | 36.5 |
| | — |
| | (2.2 | ) | | 35.5 |
| | — |
|
| Asset-backed securities | | 42.2 |
| | 7.6 |
| | — |
| | 5.1 |
| | 14.0 |
| | — |
| | (9.7 | ) | | 59.2 |
| | — |
|
| Collateralized debt obligations | | 246.7 |
| | — |
| | — |
| | — |
| | — |
| | (246.7 | ) | | — |
| | — |
| | — |
|
| Commercial mortgage-backed securities | | — |
| | 1.1 |
| | — |
| | .1 |
| | — |
| | — |
| | — |
| | 1.2 |
| | — |
|
| Mortgage pass-through securities | | 1.6 |
| | (1.2 | ) | | — |
| | — |
| | — |
| | — |
| | — |
| | .4 |
| | — |
|
| Total fixed maturities, available for sale | | 650.1 |
| | 75.7 |
| | — |
| | 28.3 |
| | 87.3 |
| | (316.1 | ) | | (63.1 | ) | | 462.2 |
| | — |
|
| Equity securities - corporate securities | | 24.5 |
| | 3.5 |
| | — |
| | — |
| | — |
| | — |
| | — |
| | 28.0 |
| | — |
|
| Trading securities - commercial mortgage-backed securities | | — |
| | 29.0 |
| | — |
| | (.4 | ) | | — |
| | — |
| | — |
| | 28.6 |
| | (.4 | ) |
| Liabilities: | | |
| | |
| | |
| | |
| | |
| | |
| | | | |
| | |
|
| Future policy benefits - embedded derivatives associated with fixed index annuity products | | (903.7 | ) | | (104.3 | ) | | (73.5 | ) | | — |
| | — |
| | — |
| | — |
| | (1,081.5 | ) | | (73.5 | ) |
| Other liabilities - embedded derivatives associated with modified coinsurance agreement | | (1.8 | ) | | 1.8 |
| | — |
| | — |
| | — |
| | — |
| | — |
| | — |
| | — |
|
| Total liabilities | | (905.5 | ) | | (102.5 | ) | | (73.5 | ) | | — |
| | — |
| | — |
| | — |
| | (1,081.5 | ) | | (73.5 | ) |
CNO FINANCIAL GROUP, INC. AND SUBSIDIARIES
Notes to Consolidated Financial Statements
___________________
_________
| |
| (a) | Transfers into Level 3 are the result of unobservable inputs utilized within valuation methodologies for assets that were previously valued using observable inputs. Transfers out of Level 3 are due to the use of observable inputs in valuation methodologies as well as the utilization of pricing service information for certain assets that the Company is able to validate. |
| |
| (b) | Purchases, sales, issuances and settlements, net, represent the activity that occurred during the period that results in a change of the asset or liability but does not represent changes in fair value for the instruments held at the beginning of the period. Such activity primarily consists of purchases and sales of fixed maturity and equity securities and changes to embedded derivative instruments related to insurance products resulting from the issuance of new contracts, or changes to existing contracts. The following summarizes such activity for the year ended December 31, 2014 (dollars in millions): |
|
| | | | | | | | | | | | | | | | | | | |
| | Purchases | | Sales | | Issuances | | Settlements | | Purchases, sales, issuances and settlements, net |
| Assets: | | | | | | | | | |
| Fixed maturities, available for sale: | | | | | | | | | |
| Corporate securities | $ | 71.7 |
| | $ | (1.7 | ) | | $ | — |
| | $ | — |
| | $ | 70.0 |
|
| States and political subdivisions | — |
| | (1.8 | ) | | — |
| | — |
| | (1.8 | ) |
| Asset-backed securities | 9.9 |
| | (2.3 | ) | | — |
| | — |
| | 7.6 |
|
| Commercial mortgage-backed securities | 1.1 |
| | — |
| | — |
| | — |
| | 1.1 |
|
| Mortgage pass-through securities | 1.1 |
| | (2.3 | ) | | — |
| | — |
| | (1.2 | ) |
| Total fixed maturities, available for sale | 83.8 |
| | (8.1 | ) | | — |
| | — |
| | 75.7 |
|
| Equity securities - corporate securities | 3.5 |
| | — |
| | — |
| | — |
| | 3.5 |
|
| Trading securities - commercial mortgage-backed securities | 29.0 |
| | — |
| | — |
| | — |
| | 29.0 |
|
| Liabilities: | | | | | | | | | |
| Future policy benefits - embedded derivatives associated with fixed index annuity products | (121.9 | ) | | 7.5 |
| | (45.9 | ) | | 56.0 |
| | (104.3 | ) |
| Other liabilities - embedded derivatives associated with modified coinsurance agreement | — |
| | 3.4 |
| | (1.6 | ) | | — |
| | 1.8 |
|
| Total liabilities | (121.9 | ) | | 10.9 |
| | (47.5 | ) | | 56.0 |
| | (102.5 | ) |
CNO FINANCIAL GROUP, INC. AND SUBSIDIARIES
Notes to Consolidated Financial Statements
___________________
The following table presents additional information about assets and liabilities measured at fair value on a recurring basis and for which we have utilized significant unobservable (Level 3) inputs to determine fair value for the year ended December 31, 2013 (dollars in millions):
|
| | | | | | | | | | | | | | | | | | | | | | | | | | | | | | | |
| | December 31, 2013 | |
| | Beginning balance as of December 31, 2012 | | Purchases, sales, issuances and settlements, net (b) | | Total realized and unrealized gains (losses) included in net income | | Total realized and unrealized gains (losses) included in accumulated other comprehensive income (loss) | | Transfers into Level 3 (a) | | Transfers out of Level 3 (a) | | Ending balance as of December 31, 2013 | | Amount of total gains (losses) for the year ended December 31, 2013 included in our net income relating to assets and liabilities still held as of the reporting date |
| Assets: | | | | | | | | | | | | | | | |
| Fixed maturities, available for sale: | | | | | | | | | | | | | | | |
| Corporate securities | $ | 355.5 |
| | $ | 34.0 |
| | $ | (.3 | ) | | $ | (9.8 | ) | | $ | 13.2 |
| | $ | (33.0 | ) | | $ | 359.6 |
| | $ | — |
|
| States and political subdivisions | 13.1 |
| | — |
| | — |
| | — |
| | — |
| | (13.1 | ) | | — |
| | — |
|
| Asset-backed securities | 44.0 |
| | 1.6 |
| | .1 |
| | (3.6 | ) | | .1 |
| | — |
| | 42.2 |
| | — |
|
| Collateralized debt obligations | 324.0 |
| | (85.4 | ) | | .2 |
| | 7.9 |
| | — |
| | — |
| | 246.7 |
| | — |
|
| Commercial mortgage-backed securities | 6.2 |
| | — |
| | — |
| | — |
| | — |
| | (6.2 | ) | | — |
| | — |
|
| Mortgage pass-through securities | 1.9 |
| | (.3 | ) | | — |
| | — |
| | — |
| | — |
| | 1.6 |
| | — |
|
| Collateralized mortgage obligations | 16.9 |
| | — |
| | — |
| | — |
| | — |
| | (16.9 | ) | | — |
| | — |
|
| Total fixed maturities, available for sale | 761.6 |
| | (50.1 | ) | | — |
| | (5.5 | ) | | 13.3 |
| | (69.2 | ) | | 650.1 |
| | — |
|
| Equity securities: | | | | | | | | | | | | | | | |
| Corporate securities | .1 |
| | 24.5 |
| | — |
| | (.1 | ) | | — |
| | — |
| | 24.5 |
| | — |
|
| Venture capital investments | 2.8 |
| | — |
| | (2.5 | ) | | (.3 | ) | | — |
| | — |
| | — |
| | — |
|
| Total equity securities | 2.9 |
| | 24.5 |
| | (2.5 | ) | | (.4 | ) | | — |
| | — |
| | 24.5 |
| | — |
|
| Trading securities: | |
| | |
| | |
| | |
| | |
| | |
| | |
| | |
|
| States and political subdivisions | .6 |
| | — |
| | — |
| | — |
| | — |
| | (.6 | ) | | — |
| | — |
|
| Collateralized debt obligations | 7.3 |
| | (7.7 | ) | | .6 |
| | (.2 | ) | | — |
| | — |
| | — |
| | (.2 | ) |
| Collateralized mortgage obligations | 5.8 |
| | — |
| | — |
| | — |
| | — |
| | (5.8 | ) | | — |
| | — |
|
| Total trading securities | 13.7 |
| | (7.7 | ) | | .6 |
| | (.2 | ) | | — |
| | (6.4 | ) | | — |
| | (.2 | ) |
| Liabilities: | |
| | |
| | |
| | |
| | |
| | |
| | |
| | |
|
| Future policy benefits - embedded derivatives associated with fixed index annuity products | (734.0 | ) | | (219.0 | ) | | 49.3 |
| | — |
| | — |
| | — |
| | (903.7 | ) | | 49.3 |
|
| Other liabilities - embedded derivatives associated with modified coinsurance agreement | (5.5 | ) | | 3.7 |
| | — |
| | — |
| | — |
| | — |
| | (1.8 | ) | | — |
|
| Total liabilities | (739.5 | ) | | (215.3 | ) | | 49.3 |
| | — |
| | — |
| | — |
| | (905.5 | ) | | 49.3 |
|
CNO FINANCIAL GROUP, INC. AND SUBSIDIARIES
Notes to Consolidated Financial Statements
___________________
____________
| |
| (a) | Transfers into Level 3 are the result of unobservable inputs utilized within valuation methodologies for assets that were previously valued using observable inputs. Transfers out of Level 3 are due to the use of observable inputs in valuation methodologies as well as the utilization of pricing service information for certain assets that the Company is able to validate. |
| |
| (b) | Purchases, sales, issuances and settlements, net, represent the activity that occurred during the period that results in a change of the asset or liability but does not represent changes in fair value for the instruments held at the beginning of the period. Such activity primarily consists of purchases and sales of fixed maturity and equity securities and changes to embedded derivative instruments related to insurance products resulting from the issuance of new contracts, or changes to existing contracts. The following summarizes such activity for the year ended December 31, 2013 (dollars in millions): |
|
| | | | | | | | | | | | | | | | | | | |
| | Purchases | | Sales | | Issuances | | Settlements | | Purchases, sales, issuances and settlements, net |
| Assets: | | | | | | | | | |
| Fixed maturities, available for sale: | | | | | | | | | |
| Corporate securities | $ | 44.0 |
| | $ | (10.0 | ) | | $ | — |
| | $ | — |
| | $ | 34.0 |
|
| Asset-backed securities | 22.0 |
| | (20.4 | ) | | — |
| | — |
| | 1.6 |
|
| Collateralized debt obligations | 6.0 |
| | (91.4 | ) | | — |
| | — |
| | (85.4 | ) |
| Mortgage pass-through securities | — |
| | (.3 | ) | | — |
| | — |
| | (.3 | ) |
| Total fixed maturities, available for sale | 72.0 |
| | (122.1 | ) | | — |
| | — |
| | (50.1 | ) |
| Equity securities - corporate securities | 24.5 |
| | — |
| | — |
| | — |
| | 24.5 |
|
| Trading securities - collateralized debt obligations | — |
| | (7.7 | ) | | — |
| | — |
| | (7.7 | ) |
| Liabilities: | | | | | | | | | |
| Future policy benefits - embedded derivatives associated with fixed index annuity products | (105.6 | ) | | 1.4 |
| | (156.3 | ) | | 41.5 |
| | (219.0 | ) |
| Other liabilities - embedded derivatives associated with modified coinsurance agreement | — |
| | 3.7 |
| | — |
| | — |
| | 3.7 |
|
| Total liabilities | (105.6 | ) | | 5.1 |
| | (156.3 | ) | | 41.5 |
| | (215.3 | ) |
At December 31, 2014, 85 percent of our Level 3 fixed maturities, available for sale, were investment grade and 79 percent of our Level 3 fixed maturities, available for sale, consisted of corporate securities.
Realized and unrealized investment gains and losses presented in the preceding tables represent gains and losses during the time the applicable financial instruments were classified as Level 3.
Realized and unrealized gains (losses) on Level 3 assets are primarily reported in either net investment income for policyholder and reinsurer accounts and other special-purpose portfolios, net realized investment gains (losses) or insurance policy benefits within the consolidated statement of operations or accumulated other comprehensive income within shareholders' equity based on the stated accounting policy for the instrument.
The amount presented for gains (losses) included in our net loss for assets and liabilities still held as of the reporting date primarily represents impairments for fixed maturities, available for sale, changes in fair value of trading securities and certain derivatives and changes in fair value of embedded derivative instruments included in liabilities for insurance products that exist as of the reporting date.
CNO FINANCIAL GROUP, INC. AND SUBSIDIARIES
Notes to Consolidated Financial Statements
___________________
The following table provides additional information about the significant unobservable (Level 3) inputs developed internally by the Company to determine fair value for certain assets and liabilities carried at fair value at December 31, 2014 (dollars in millions):
|
| | | | | | | | | |
| | Fair value at December 31, 2014 | | Valuation technique(s) | | Unobservable inputs | | Range (weighted average) |
| Assets: | | | | | | | |
| Corporate securities (a) | $ | 312.1 |
| | Discounted cash flow analysis | | Discount margins | | 1.48% - 5.83% (2.58%) |
| Asset-backed securities (b) | 30.6 |
| | Discounted cash flow analysis | | Discount margins | | 1.99% - 4.15% (2.95%) |
| Equity security (c) | 28.0 |
| | Market approach | | Projected cash flows | | Not applicable |
| Other assets categorized as Level 3 (d) | 148.1 |
| | Unadjusted third-party price source | | Not applicable | | Not applicable |
| Total | 518.8 |
| | | | | | |
| Liabilities: | | | | | | | |
| Future policy benefits (e) | 1,081.5 |
| | Discounted projected embedded derivatives | | Projected portfolio yields | | 5.15% - 5.61% (5.42%) |
| | | | | | Discount rates | | 0.00 - 2.74% (1.78%) |
| | | | | | Surrender rates | | 1.98% - 47.88% (14.16%) |
________________________________
| |
| (a) | Corporate securities - The significant unobservable input used in the fair value measurement of our corporate securities is discount margin added to a riskless market yield. Significant increases (decreases) in discount margin in isolation would result in a significantly lower (higher) fair value measurement. |
| |
| (b) | Asset-backed securities - The significant unobservable input used in the fair value measurement of these asset-backed securities is discount margin added to a riskless market yield. Significant increases (decreases) in discount margin in isolation would result in a significantly lower (higher) fair value measurement. |
| |
| (c) | Equity security - This equity security represents an investment in a company that is constructing a manufacturing facility. The significant unobservable input is the cash flows that will be generated upon completion of the manufacturing facility. Given the nature of this investment, the best current indicator of value is the cost basis of the investment, which we believe approximates market value. |
| |
| (d) | Other assets categorized as Level 3 - For these assets, there were no adjustments to quoted market prices obtained from third-party pricing sources. |
| |
| (e) | Future policy benefits - The significant unobservable inputs used in the fair value measurement of our embedded derivatives associated with fixed index annuity products are projected portfolio yields, discount rates and surrender rates. Increases (decreases) in projected portfolio yields in isolation would lead to a higher (lower) fair value measurement. The discount rate is based on the Treasury rate adjusted by a margin. Increases (decreases) in the discount rates would lead to a lower (higher) fair value measurement. Assumed surrender rates are used to project how long the contracts remain in force. Generally, the longer the contracts are assumed to be in force the higher the fair value of the embedded derivative. |
CNO FINANCIAL GROUP, INC. AND SUBSIDIARIES
Notes to Consolidated Financial Statements
___________________
The following table provides additional information about the significant unobservable (Level 3) inputs developed internally by the Company to determine fair value for certain assets and liabilities carried at fair value at December 31, 2013 (dollars in millions):
|
| | | | | | | | | |
| | Fair value at December 31, 2013 | | Valuation technique(s) | | Unobservable inputs | | Range (weighted average) |
| Assets: | | | | | | | |
| Corporate securities (a) | $ | 260.3 |
| | Discounted cash flow analysis | | Discount margins | | 1.65% - 2.90% (2.36%) |
| Asset-backed securities (b) | 35.1 |
| | Discounted cash flow analysis | | Discount margins | | 2.03% - 4.20% (3.09%) |
| Collateralized debt obligations (c) | 240.7 |
| | Discounted cash flow analysis | | Recoveries | | 64% - 67% (65.8%) |
| | | | | | Constant prepayment rate | | 20% |
| | | | | | Discount margins | | .95% - 2.00% (1.32%) |
| | | | | | Annual default rate | | 1.14% - 5.57% (3.05%) |
| | | | | | Portfolio CCC % | | 1.52% - 21.79% (12.57%) |
| Equity security (d) | 24.5 |
| | Market approach | | Projected cash flows | | Not applicable |
| Other assets categorized as Level 3 (e) | 114.0 |
| | Unadjusted third-party price source | | Not applicable | | Not applicable |
| Total | 674.6 |
| | | | | | |
| Liabilities: | | | | | | | |
| Future policy benefits (f) | 905.5 |
| | Discounted projected embedded derivatives | | Projected portfolio yields | | 5.35% - 6.63% (5.60%) |
| | | | | | Discount rates | | 0.00 - 4.64% (2.47%) |
| | | | | | Surrender rates | | 2.80% - 54.60% (14.39%) |
________________________________
| |
| (a) | Corporate securities - The significant unobservable input used in the fair value measurement of our corporate securities is discount margin added to a riskless market yield. Significant increases (decreases) in discount margin in isolation would result in a significantly lower (higher) fair value measurement. |
| |
| (b) | Asset-backed securities - The significant unobservable input used in the fair value measurement of these asset-backed securities is discount margin added to a riskless market yield. Significant increases (decreases) in discount margin in isolation would result in a significantly lower (higher) fair value measurement. |
| |
| (c) | Collateralized debt obligations - The significant unobservable inputs used in the fair value measurement of our collateralized debt obligations relate to collateral performance, including default rate, recoveries and constant prepayment rate, as well as discount margins of the underlying collateral. Significant increases (decreases) in default rate in isolation would result in a significantly lower (higher) fair value measurement. Generally, a significant increase (decrease) in the constant prepayment rate and recoveries in isolation would result in a significantly higher (lower) fair value measurement. Generally a significant increase (decrease) in discount margin in isolation would result in a significantly lower (higher) fair value measurement. Generally, a change in the assumption used for the annual default rate is accompanied by a directionally similar change in the assumption used for discount margins and portfolio CCC % and a directionally opposite change in the assumption used for constant prepayment rate and recoveries. A tranche's payment priority and investment cost basis could alter generalized fair value outcomes. |
| |
| (d) | Equity security - This equity security represents an investment in a company that is constructing a manufacturing facility. The significant unobservable input is the cash flows that will be generated upon completion of the manufacturing facility. Given the nature of this investment, the best current indicator of value is the cost basis of the investment, which we believe approximates market value. |
CNO FINANCIAL GROUP, INC. AND SUBSIDIARIES
Notes to Consolidated Financial Statements
___________________
| |
| (e) | Other assets categorized as Level 3 - For these assets, there were no adjustments to quoted market prices obtained from third-party pricing sources. |
| |
| (f) | Future policy benefits - The significant unobservable inputs used in the fair value measurement of our embedded derivatives associated with fixed index annuity products are projected portfolio yields, discount rates and surrender rates. Increases (decreases) in projected portfolio yields in isolation would lead to a higher (lower) fair value measurement. The discount rate is based on the Treasury rate adjusted by a margin. Increases (decreases) in the discount rates would lead to a lower (higher) fair value measurement. Assumed surrender rates are used to project how long the contracts remain in force. Generally, the longer the contracts are assumed to be in force the higher the fair value of the embedded derivative. |
5. LIABILITIES FOR INSURANCE PRODUCTS
Our future policy benefits are summarized as follows (dollars in millions):
|
| | | | | | | | | | | | | | | |
| | Withdrawal assumption | | Morbidity assumption | | Mortality assumption | | Interest rate assumption | | 2014 | | 2013 |
| | | | | | | | | | | | |
| Long-term care | Company experience | | Company experience | | Company experience | | 6% | | $ | 5,385.2 |
| | $ | 4,999.7 |
|
| Traditional life insurance contracts | Company experience | | Company experience | | (a) | | 5% | | 2,175.8 |
| | 2,517.5 |
|
| Accident and health contracts | Company experience | | Company experience | | Company experience | | 5% | | 2,519.1 |
| | 2,466.8 |
|
| Interest-sensitive life insurance contracts | Company experience | | Company experience | | Company experience | | 5% | | 47.6 |
| | 526.5 |
|
| Annuities and supplemental contracts with life contingencies | Company experience | | Company experience | | (b) | | 4% | | 707.7 |
| | 712.0 |
|
| Total | | | | | | | | | $ | 10,835.4 |
| | $ | 11,222.5 |
|
____________________
| |
| (a) | Principally, modifications of: (i) the 1965 ‑ 70 and 1975 - 80 Basic Tables; and (ii) the 1941, 1958 and 1980 Commissioners' Standard Ordinary Tables; as well as Company experience. |
| |
| (b) | Principally, modifications of: (i) the 1971 Individual Annuity Mortality Table; (ii) the 1983 Table "A"; and (iii) the Annuity 2000 Mortality Table; as well as Company experience. |
Our policyholder account balances are summarized as follows (dollars in millions):
|
| | | | | | | | |
| | | 2014 | | 2013 |
| Fixed index annuities | | $ | 4,496.9 |
| | $ | 4,093.9 |
|
| Other annuities | | 5,280.8 |
| | 6,013.0 |
|
| Interest-sensitive life insurance contracts | | 929.5 |
| | 2,669.5 |
|
| Total | | $ | 10,707.2 |
| | $ | 12,776.4 |
|
The Company establishes reserves for insurance policy benefits based on assumptions as to investment yields, mortality, morbidity, withdrawals, lapses and maintenance expenses. These reserves include amounts for estimated future payment of claims based on actuarial assumptions. The balance includes provision for the Company's best estimate of the future policyholder benefits to be incurred on this business, given recent and expected future changes in experience.
CNO FINANCIAL GROUP, INC. AND SUBSIDIARIES
Notes to Consolidated Financial Statements
___________________
Changes in the unpaid claims reserve (included in claims payable) and disabled life reserves related to accident and health insurance (included in the liability for future policy benefits) were as follows (dollars in millions):
|
| | | | | | | | | | | |
| | 2014 | | 2013 | | 2012 |
| Balance, beginning of year | $ | 1,710.1 |
| | $ | 1,679.3 |
| | $ | 1,637.3 |
|
| Less reinsurance receivables | (164.1 | ) | | (27.4 | ) | | (21.7 | ) |
| Net balance, beginning of year | 1,546.0 |
| | 1,651.9 |
| | 1,615.6 |
|
| Incurred claims related to: | | | | | |
| Current year | 1,468.1 |
| | 1,511.1 |
| | 1,570.1 |
|
| Prior years (a) | (39.9 | ) | | (162.3 | ) | | (56.4 | ) |
| Total incurred | 1,428.2 |
| | 1,348.8 |
| | 1,513.7 |
|
| Interest on claim reserves | 70.5 |
| | 75.2 |
| | 77.8 |
|
| Paid claims related to: | | | | | |
| Current year | 848.7 |
| | 870.0 |
| | 891.3 |
|
| Prior years | 641.5 |
| | 659.9 |
| | 663.9 |
|
| Total paid | 1,490.2 |
| | 1,529.9 |
| | 1,555.2 |
|
| Net balance, end of year | 1,554.5 |
| | 1,546.0 |
| | 1,651.9 |
|
| Add reinsurance receivables | 125.0 |
| | 164.1 |
| | 27.4 |
|
| Balance, end of year | $ | 1,679.5 |
| | $ | 1,710.1 |
| | $ | 1,679.3 |
|
___________
| |
| (a) | The reserves and liabilities we establish are necessarily based on estimates, assumptions and prior years' statistics. Such amounts will fluctuate based upon the estimation procedures used to determine the amount of unpaid losses. It is possible that actual claims will exceed our reserves and have a material adverse effect on our results of operations and financial condition. |
6. INCOME TAXES
The components of income tax expense (benefit) were as follows (dollars in millions):
|
| | | | | | | | | | | |
| | 2014 | | 2013 | | 2012 |
| Current tax expense | $ | 15.6 |
| | $ | 8.2 |
| | $ | 12.5 |
|
| Deferred tax expense | 143.6 |
| | 120.1 |
| | 93.7 |
|
| Tax expense on period income | 159.2 |
| | 128.3 |
| | 106.2 |
|
| Tax expense related to the sale of CLIC | 14.2 |
| | — |
| | — |
|
| Deferred taxes on expired capital loss carryforwards | — |
| | 159.4 |
| | — |
|
| Change in valuation allowance | (48.8 | ) | | (472.1 | ) | | (171.5 | ) |
| Other items | (.9 | ) | | 11.2 |
| | — |
|
| Total income tax expense (benefit) | $ | 123.7 |
| | $ | (173.2 | ) | | $ | (65.3 | ) |
CNO FINANCIAL GROUP, INC. AND SUBSIDIARIES
Notes to Consolidated Financial Statements
___________________
A reconciliation of the U.S. statutory corporate tax rate to the estimated annual effective rate reflected in the consolidated statement of operations is as follows:
|
| | | | | | | | |
| | 2014 | | 2013 | | 2012 |
| U.S. statutory corporate rate | 35.0 | % | | 35.0 | % | | 35.0 | % |
| Valuation allowance | (27.9 | ) | | (154.9 | ) | | (110.1 | ) |
| Expired capital loss carryforwards (which were fully offset by a corresponding reduction in the valuation allowance) | — |
| | 52.3 |
| | — |
|
| Non-taxable income and nondeductible benefits, net | (.9 | ) | | 5.0 |
| | 32.3 |
|
| State taxes | 1.5 |
| | 1.9 |
| | 1.4 |
|
| Impact of the sale of CLIC | 66.3 |
| | — |
| | — |
|
| Other items | (3.4 | ) | | 3.9 |
| | (.5 | ) |
| Effective tax rate | 70.6 | % | | (56.8 | )% | | (41.9 | )% |
The components of the Company's income tax assets and liabilities are summarized below (dollars in millions):
|
| | | | | | | |
| | 2014 | | 2013 |
| Deferred tax assets: | | | |
| Net federal operating loss carryforwards | $ | 1,048.4 |
| | $ | 1,240.2 |
|
| Net state operating loss carryforwards | 15.2 |
| | 20.0 |
|
| Tax credits | 47.2 |
| | 43.9 |
|
| Capital loss carryforwards | — |
| | 13.4 |
|
| Investments | 59.7 |
| | 74.3 |
|
| Insurance liabilities | 585.9 |
| | 723.8 |
|
| Other | 67.3 |
| | 64.7 |
|
| Gross deferred tax assets | 1,823.7 |
| | 2,180.3 |
|
| Deferred tax liabilities: | |
| | |
|
| Present value of future profits and deferred acquisition costs | (320.5 | ) | | (306.8 | ) |
| Accumulated other comprehensive income | (457.4 | ) | | (405.5 | ) |
| Gross deferred tax liabilities | (777.9 | ) | | (712.3 | ) |
| Net deferred tax assets before valuation allowance | 1,045.8 |
| | 1,468.0 |
|
| Valuation allowance | (246.0 | ) | | (294.8 | ) |
| Net deferred tax assets | 799.8 |
| | 1,173.2 |
|
| Current income taxes accrued | (41.1 | ) | | (26.0 | ) |
| Income tax assets, net | $ | 758.7 |
| | $ | 1,147.2 |
|
Our income tax expense includes deferred income taxes arising from temporary differences between the financial reporting and tax bases of assets and liabilities, capital loss carryforwards and NOLs. Deferred tax assets and liabilities are measured using enacted tax rates expected to apply in the years in which temporary differences are expected to be recovered or paid. The effect of a change in tax rates on deferred tax assets and liabilities is recognized in earnings in the period when the changes are enacted.
A reduction of the net carrying amount of deferred tax assets by establishing a valuation allowance is required if, based on the available evidence, it is more likely than not that such assets will not be realized. In assessing the need for a valuation allowance, all available evidence, both positive and negative, shall be considered to determine whether, based on the weight of that evidence, a valuation allowance for deferred tax assets is needed. This assessment requires significant judgment and considers, among other matters, the nature, frequency and severity of current and cumulative losses, forecasts of future
CNO FINANCIAL GROUP, INC. AND SUBSIDIARIES
Notes to Consolidated Financial Statements
___________________
profitability, the duration of carryforward periods, our experience with operating loss and tax credit carryforwards expiring unused, and tax planning strategies. We evaluate the need to establish a valuation allowance for our deferred income tax assets on an ongoing basis. The realization of our deferred tax assets depends upon generating sufficient future taxable income of the appropriate type during the periods in which our temporary differences become deductible and before our life and non-life NOLs expire.
Based on our assessment, it appears more likely than not that $799.8 million of our total deferred tax assets of $1,045.8 million will be realized through future taxable earnings. Accordingly, we have established a deferred tax valuation allowance of $246.0 million at December 31, 2014. We will continue to assess the need for a valuation allowance in the future. If future results are less than projected, an increase to the valuation allowance may be required to reduce the deferred tax asset, which could have a material impact on our results of operations in the period in which it is recorded.
We use a deferred tax valuation model to assess the need for a valuation allowance. Our model is adjusted to reflect changes in our projections of future taxable income including changes resulting from investment trading strategies, reinsurance transactions and the impact of the sale of CLIC. Our estimates of future taxable income are based on evidence we consider to be objective and verifiable.
At December 31, 2014, our projection of future taxable income for purposes of determining the valuation allowance is based on our adjusted average annual taxable income for the last three years plus: (i) a 3 percent core growth factor (consistent with the prior year assumption); and (ii) an additional 1 percent increase which primarily reflects the impact of the investment trading strategies completed in 2013 (which grade off over time). The aggregate 4 percent factor is used to increase taxable income annually over the next five years, and level taxable income is assumed thereafter. In the projections used for our December 31, 2014 analysis, our three year average taxable income increased to approximately $320 million, compared to $315 million in our prior projections. Approximately $50 million of the current three year average relates to non-life taxable income and $270 million relates to life income.
Based on our assessment, we recognized a reduction to the allowance for deferred tax assets of $48.8 million in 2014. We have evaluated the recovery of our deferred tax assets and assessed the effect of limitations and/or interpretations on their value and have concluded that it is more likely than not that the value recognized will be fully realized in the future.
Changes in our valuation allowance are summarized as follows (dollars in millions):
|
| | | | |
| Balance, December 31, 2011 | $ | 938.4 |
| |
| Decrease in 2012 | (171.5 | ) | (a) |
| Balance, December 31, 2012 | 766.9 |
| |
| Decrease in 2013 | (472.1 | ) | (b) |
| Balance, December 31, 2013 | 294.8 |
| |
| Decrease in 2014 | (48.8 | ) | (c) |
| Balance, December 31, 2014 | $ | 246.0 |
| |
___________________
| |
| (a) | The 2012 reduction to the deferred tax valuation allowance primarily resulted from the impact of recent higher levels of income when projecting future taxable income. |
| |
| (b) | The 2013 reduction to the deferred tax valuation allowance primarily resulted from the impact of higher levels of income on projected future taxable income, the expiration of capital loss carryforwards, a settlement with the Internal Revenue Service (the "IRS") related to the classification of a portion of the cancellation of indebtedness income and the execution of certain investment trading strategies. |
| |
| (c) | The 2014 reduction to the deferred tax valuation allowance primarily resulted from tax examination adjustments and the tax gain on the sale of CLIC. |
Recovery of our deferred tax asset is dependent on achieving the level of future taxable income projected in our deferred tax valuation model and failure to do so could result in an increase in the valuation allowance in a future period. Any future increase in the valuation allowance may result in additional income tax expense and reduce shareholders' equity, and such an increase could have a significant impact upon our earnings in the future.
CNO FINANCIAL GROUP, INC. AND SUBSIDIARIES
Notes to Consolidated Financial Statements
___________________
The Internal Revenue Code (the "Code") limits the extent to which losses realized by a non-life entity (or entities) may offset income from a life insurance company (or companies) to the lesser of: (i) 35 percent of the income of the life insurance company; or (ii) 35 percent of the total loss of the non-life entities (including NOLs of the non-life entities). There is no similar limitation on the extent to which losses realized by a life insurance entity (or entities) may offset income from a non-life entity (or entities). This limitation is the primary reason a valuation allowance for non-life NOL carryforwards is required.
Section 382 of the Code imposes limitations on a corporation's ability to use its NOLs when the company undergoes an ownership change. Future transactions and the timing of such transactions could cause an ownership change for Section 382 income tax purposes. Such transactions may include, but are not limited to, additional repurchases under our securities repurchase program, issuances of common stock and acquisitions or sales of shares of CNO stock by certain holders of our shares, including persons who have held, currently hold or may accumulate in the future five percent or more of our outstanding common stock for their own account. Many of these transactions are beyond our control. If an additional ownership change were to occur for purposes of Section 382, we would be required to calculate an annual restriction on the use of our NOLs to offset future taxable income. The annual restriction would be calculated based upon the value of CNO's equity at the time of such ownership change, multiplied by a federal long-term tax exempt rate (2.80 percent at December 31, 2014), and the annual restriction could limit our ability to use a substantial portion of our NOLs to offset future taxable income. We regularly monitor ownership change (as calculated for purposes of Section 382) and, as of December 31, 2014, we were below the 50 percent ownership change level that would trigger further impairment of our ability to utilize our NOLs.
On January 20, 2009, the Company's Board of Directors adopted a Section 382 Rights Agreement designed to protect shareholder value by preserving the value of our tax assets primarily associated with tax NOLs under Section 382. The Section 382 Rights Agreement was adopted to reduce the likelihood of an ownership change occurring by deterring the acquisition of stock that would create "5 percent shareholders" as defined in Section 382. On December 6, 2011, the Company's Board of Directors amended the Section 382 Rights Agreement to, among other things, (i) extend the final expiration date of the Amended Rights Agreement to December 6, 2014, (ii) update the purchase price of the rights described below, (iii) provide for a new series of preferred stock relating to the rights that is substantially identical to the prior series of preferred stock, (iv) provide for a 4.99 percent ownership threshold relating to any Company 382 Securities (as defined below), and amend other provisions to reflect best practices for tax benefit preservation plans, including updates to certain definitions. On November 13, 2014, the Company entered into the Second Amended and Restated Section 382 Rights Agreement which extends the final expiration date of the Amended Section 382 Rights Agreement to December 31, 2017, updates the purchase price of the Rights and provides for a new series of preferred stock relating to the Rights that is substantially identical to the prior series of preferred stock. The Company expects to submit the Second Amended Rights Agreement to the Company’s stockholders for approval at the Company’s 2015 annual meeting.
Under the Section 382 Rights Agreement, one right was distributed for each share of our common stock outstanding as of the close of business on January 30, 2009 and for each share issued after that date. Pursuant to the Amended Section 382 Rights Agreement, if any person or group (subject to certain exemptions) becomes an owner of more than 4.99 percent of the Company's outstanding common stock (or any other interest in the Company that would be treated as "stock" under applicable Section 382 regulations) without the approval of the Board of Directors, there would be a triggering event causing significant dilution in the voting power and economic ownership of that person or group. Shareholders who held more than 4.99 percent of the Company's outstanding common stock as of December 6, 2011 will trigger a dilutive event only if they acquire additional shares exceeding one percent of our outstanding shares without prior approval from the Board of Directors.
On May 11, 2010, our shareholders approved an amendment to CNO's certificate of incorporation designed to prevent certain transfers of common stock which could otherwise adversely affect our ability to use our NOLs (the "Original Section 382 Charter Amendment"). Subject to the provisions set forth in the Original Section 382 Charter Amendment, transfers of our common stock would be void and of no effect if the effect of the purported transfer would be to: (i) increase the direct or indirect ownership of our common stock by any person or public group (as such term is defined in the regulations under Section 382) from less than 5% to 5% or more of our common stock; (ii) increase the percentage of our common stock owned directly or indirectly by a person or public group owning or deemed to own 5% or more of our common stock; or (iii) create a new public group.
On May 8, 2013, our shareholders approved an amendment (the “Extended Section 382 Charter Amendment”) to CNO’s certificate of incorporation to: (i) extend the term of the Original Section 382 Charter Amendment for three years until
CNO FINANCIAL GROUP, INC. AND SUBSIDIARIES
Notes to Consolidated Financial Statements
___________________
December 31, 2016, (ii) provide for a 4.99% percent ownership threshold relating to our stock, and (iii) amend certain other provisions of the Original Section 382 Charter Amendment, including updates to certain definitions, for consistency with the Amended Section 382 Rights Agreement.
As of December 31, 2014, we had $3.0 billion of federal NOLs. The following table summarizes the expiration dates of our loss carryforwards assuming the IRS ultimately agrees with the position we have taken with respect to the loss on our investment in Conseco Senior Health Insurance Company ("CSHI") (dollars in millions):
|
| | | | | | | | | | | | |
| Year of expiration | | Net operating loss carryforwards | | Total loss |
| | | Life | | Non-life | | carryforwards |
| 2022 | | $ | 112.1 |
| | $ | — |
| | $ | 112.1 |
|
| 2023 | | 742.6 |
| | 1,983.0 |
| | 2,725.6 |
|
| 2025 | | — |
| | 91.5 |
| | 91.5 |
|
| 2026 | | — |
| | 207.4 |
| | 207.4 |
|
| 2027 | | — |
| | 4.9 |
| | 4.9 |
|
| 2028 | | — |
| | 203.7 |
| | 203.7 |
|
| 2029 | | — |
| | 146.6 |
| | 146.6 |
|
| 2032 | | — |
| | 44.0 |
| | 44.0 |
|
| Subtotal | | 854.7 |
| | 2,681.1 |
| | 3,535.8 |
|
| Less: | | | | | | |
| Unrecognized tax benefits | | (342.9 | ) | | (197.4 | ) | | (540.3 | ) |
| Total | | $ | 511.8 |
| | $ | 2,483.7 |
| | $ | 2,995.5 |
|
We had deferred tax assets related to NOLs for state income taxes of $15.2 million and $20.0 million at December 31, 2014 and 2013, respectively. The related state NOLs are available to offset future state taxable income in certain states through 2025.
We recognized an $878 million ordinary loss on our investment in CSHI which was worthless when it was transferred to an independent trust in 2008. Of this loss, $742 million has been reported as a life loss and $136 million as a non-life loss. The IRS disagreed with our ordinary loss treatment and believes that it should be treated as a capital loss, subject to a five year carryover. We are seeking resolution of this matter through early referral to appeals, a process that seeks to resolve disputes with the IRS. If the IRS position is ultimately determined to be correct, $473 million would have expired unused in 2013. Due to this uncertainty, we have not recognized the tax benefit related to this loss of $166.0 million. However, if this unrecognized tax benefit had been recognized, we would also have increased our valuation allowance by $34.0 million at December 31, 2014.
A reconciliation of the beginning and ending amount of unrecognized tax benefits for the years ended December 31, 2014 and 2013 is as follows (dollars in millions):
|
| | | | | | | |
| | Years ended December 31, |
| | 2014 | | 2013 |
| | | | |
| Balance at beginning of year | $ | 226.7 |
| | $ | 310.5 |
|
| Increase based on tax positions taken in prior years | 10.9 |
| | 35.6 |
|
| Decrease based on tax positions taken in prior years | — |
| | (27.0 | ) |
| Increase based on tax positions taken in the current year | — |
| | 47.6 |
|
| Decrease in unrecognized tax benefits related to settlements with taxing authorities | (8.9 | ) | | (140.0 | ) |
| Balance at end of year | $ | 228.7 |
| | $ | 226.7 |
|
CNO FINANCIAL GROUP, INC. AND SUBSIDIARIES
Notes to Consolidated Financial Statements
___________________
As of December 31, 2014 and 2013, $155.4 million and $156.0 million, respectively, of our unrecognized tax benefits, if recognized, would affect the effective tax rate. The remaining balances relate to timing differences which, if recognized, would have no effect on the Company's tax expense. The Company recognizes interest related to unrecognized tax benefits as income tax expense in the consolidated statement of operations. Such amounts were not significant in each of the three years ended December 31, 2014. The liability for accrued interest was $2.4 million and $1.8 million at December 31, 2014 and 2013, respectively.
Tax years 2004 and 2008 through 2014 are open to examination by the IRS. The Company's various state income tax returns are generally open for tax years 2011 through 2014 based on the individual state statutes of limitation. Generally, for tax years which generate NOLs, capital losses or tax credit carryforwards, the statute of limitations does not close until the expiration of the statute of limitations for the tax year in which such carryforwards are utilized.
In accordance with GAAP, we are precluded from recognizing the tax benefits of any tax windfall upon the exercise of a stock option or the vesting of restricted stock unless such deduction resulted in actual cash savings to the Company. Because of the Company's NOLs, no cash savings have occurred. NOL carryforwards of $30.9 million related to deductions for stock options and restricted stock will be reflected in additional paid-in capital if realized.
7. NOTES PAYABLE - DIRECT CORPORATE OBLIGATIONS
The following notes payable were direct corporate obligations of the Company as of December 31, 2014 and 2013 (dollars in millions):
|
| | | | | | | |
| | 2014 | | 2013 |
| Senior Secured Credit Agreement (as defined below) | $ | 522.1 |
| | $ | 581.5 |
|
| 6.375% Senior Secured Notes due October 2020 (the "6.375% Notes") | 275.0 |
| | 275.0 |
|
| 7.0% Debentures | — |
| | 3.5 |
|
| Unamortized discount on Senior Secured Credit Agreement | (2.7 | ) | | (3.6 | ) |
| Direct corporate obligations | $ | 794.4 |
| | $ | 856.4 |
|
In the third quarter of 2012, as further discussed below, we completed a comprehensive recapitalization plan. The following table sets forth the sources and uses of cash from the recapitalization transactions (dollars in millions):
|
| | | | |
| Sources: | |
| | Senior Secured Credit Agreement | $ | 669.5 |
|
| | Issuance of 6.375% Notes | 275.0 |
|
| | Total sources | $ | 944.5 |
|
| | | |
| Uses: | |
| | Cash on hand for general corporate purposes | $ | 13.7 |
|
| | Repurchase of $200 million principal amount of 7.0% Debentures pursuant to Debenture Repurchase Agreement | 355.1 |
|
| | Repayment of a previous senior secured credit agreement | 223.8 |
|
| | Repayment of $275.0 million principal amount of 9.0% Notes, including redemption premium | 322.7 |
|
| | Debt issuance costs | 23.1 |
|
| | Accrued interest | 6.1 |
|
| | Total uses | $ | 944.5 |
|
CNO FINANCIAL GROUP, INC. AND SUBSIDIARIES
Notes to Consolidated Financial Statements
___________________
Senior Secured Credit Agreement
On September 28, 2012, the Company entered into a new senior secured credit agreement, providing for: (i) a $425.0 million six-year term loan facility ($390.9 million remained outstanding at December 31, 2014); (ii) a $250.0 million four-year term loan facility ($131.2 million remained outstanding at December 31, 2014); and (iii) a $50.0 million three-year revolving credit facility, with JPMorgan Chase Bank, N.A., as administrative agent (the "Agent"), and the lenders from time to time party thereto (the "Senior Secured Credit Agreement"). The Senior Secured Credit Agreement is guaranteed by the Subsidiary Guarantors (as defined below) and secured by a first-priority lien (which ranks pari passu with the liens securing the 6.375% Notes) on substantially all of the Company's and the Subsidiary Guarantors' assets. As of December 31, 2014, no amounts have been borrowed under the revolving credit facility. The net proceeds from the Senior Secured Credit Agreement, together with the net proceeds from the 6.375% Notes, were used to repay other outstanding indebtedness, as further described below, and for general corporate purposes.
The revolving credit facility includes an uncommitted subfacility for swingline loans of up to $5.0 million, and up to $5.0 million of the revolving credit facility is available for the issuance of letters of credit. The six-year term loan facility amortizes in quarterly installments in amounts resulting in an annual amortization of 1% and the four-year term loan facility amortizes in quarterly installments resulting in an annual amortization of 20% during the first and second years and 30% during the third and fourth years. Subject to certain conditions, the Company may incur additional incremental loans under the Senior Secured Credit Agreement in an amount of up to $250.0 million.
On May 30, 2014, the Company completed an amendment to the Senior Secured Credit Agreement to waive the requirement that the net proceeds in excess of $125 million received from the sale of CLIC be used to prepay amounts outstanding under the Senior Secured Credit Agreement.
In May 2013, we amended our Senior Secured Credit Agreement. Pursuant to the amended terms, the applicable interest rates were decreased. The new interest rates with respect to loans under: (i) the six-year term loan facility are, at the Company's option, equal to a eurodollar rate, plus 2.75% per annum, or a base rate, plus 1.75% per annum, subject to a eurodollar rate "floor" of 1.00% and a base rate "floor" of 2.25% (previously a eurodollar rate, plus 3.75% per annum, or a base rate, plus 2.75% per annum, subject to a eurodollar rate "floor" of 1.25% and a base rate "floor" of 2.25%); (ii) the four-year term loan facility are, at the Company's option, equal to a eurodollar rate, plus 2.25% per annum, or a base rate, plus 1.25% per annum, subject to a eurodollar rate "floor" of .75% and a base rate "floor" of 2.00% (previously a eurodollar rate, plus 3.25% per annum, or a base rate, plus 2.25% per annum, subject to a eurodollar rate "floor" of 1.00% and a base rate "floor" of 2.00%); and (iii) the revolving credit facility will be, at the Company's option, equal to a eurodollar rate, plus 3.00% per annum, or a base rate, plus 2.00% per annum, in each case, with respect to revolving credit facility borrowings only, subject to certain step-downs based on the debt to total capitalization ratio of the Company (previously a eurodollar rate, plus 3.50% per annum, or a base rate, plus 2.50% per annum, subject to certain step-downs based on the debt to total capitalization ratio of the Company). At December 31, 2014, the interest rates on the six-year term loan facility and the four-year term loan facility were 3.75% and 3.00%, respectively.
Other changes made in May 2013 to the Senior Secured Credit Agreement included modifications of mandatory prepayments resulting from certain restricted payments made (including any common stock dividends and share repurchases) as defined in the Senior Secured Credit Agreement. Pursuant to the amended terms, the amount of the mandatory prepayment is: (a) 100% of the amount of certain restricted payments provided that if, as of the end of the fiscal quarter immediately preceding such restricted payment, the debt to total capitalization ratio is: (x) equal to or less than 25.0% but greater than 20.0%, the prepayment requirement shall be reduced to 33.33% (previously less than or equal to 22.5% but greater than 17.5%); or (y) equal to or less than 20.0%, the prepayment requirement shall not apply (previously equal to or less than 17.5%).
Mandatory prepayments of the Senior Secured Credit Agreement will be required, subject to certain exceptions, in an amount equal to: (i) 100% of the net cash proceeds from certain asset sales or casualty events; (ii) 100% of the net cash proceeds received by the Company or any of its restricted subsidiaries from certain debt issuances; and (iii) 100% of the amount of certain restricted payments made (including any common stock dividends and share repurchases) as defined in the Senior Secured Credit Agreement provided that if, as of the end of the fiscal quarter immediately preceding such restricted payment, the debt to total capitalization ratio is: (x) equal to or less than 25.0%, but greater than 20.0%, the prepayment requirement shall be reduced to 33.33%; or (y) equal to or less than 20.0%, the prepayment requirement shall not apply.
CNO FINANCIAL GROUP, INC. AND SUBSIDIARIES
Notes to Consolidated Financial Statements
___________________
Notwithstanding the foregoing, no mandatory prepayments pursuant to item (i) in the preceding paragraph shall be required if: (x) the debt to total capitalization ratio is equal or less than 20% and (y) either (A) the financial strength rating of certain of the Company's insurance subsidiaries is equal to or better than A- (stable) from A.M. Best Company or (B) the Senior Secured Credit Agreement is rated equal or better than BBB- (stable) from S&P and Baa3 (stable) by Moody's.
In 2014, we made $59.4 million of scheduled quarterly principal payments due under the Senior Secured Credit Agreement. In the first six months of 2013, we made mandatory prepayments of $20.4 million in an amount equal to 33.33% of our share repurchases and common stock dividend payments, as required under the terms of our Senior Secured Credit Agreement. No mandatory prepayments were required in the second half of 2013 as our debt to total capitalization ratio, as defined in the Senior Secured Credit Agreement, was below 20.0 percent. We also made additional payments of $42.7 million in 2013 to cover the remaining portion of the scheduled quarterly principal payments due under the Senior Secured Credit Agreement. In 2012, as required under the terms of the Senior Secured Credit Agreement, we made mandatory prepayments of $28.4 million due to repurchases of our common stock and payment of a common stock dividend. We also made an additional payment of $2.0 million to cover the remaining portion of the scheduled quarterly principal payments.
The Senior Secured Credit Agreement contains covenants that limit the Company's ability to take certain actions and perform certain activities, including (each subject to exceptions as set forth in the Senior Secured Credit Agreement):
| |
| • | limitations on debt (including, without limitation, guarantees and other contingent obligations); |
| |
| • | limitations on issuances of disqualified capital stock; |
| |
| • | limitations on liens and further negative pledges; |
| |
| • | limitations on sales, transfers and other dispositions of assets; |
| |
| • | limitations on transactions with affiliates; |
| |
| • | limitations on changes in the nature of the Company's business; |
| |
| • | limitations on mergers, consolidations and acquisitions; |
| |
| • | limitations on dividends and other distributions, stock repurchases and redemptions and other restricted payments; |
| |
| • | limitations on investments and acquisitions; |
| |
| • | limitations on prepayment of certain debt; |
| |
| • | limitations on modifications or waivers of certain debt documents and charter documents; |
| |
| • | investment portfolio requirements for insurance subsidiaries; |
| |
| • | limitations on restrictions affecting subsidiaries; |
| |
| • | limitations on holding company activities; and |
| |
| • | limitations on changes in accounting policies. |
The Senior Secured Credit Agreement requires the Company to maintain (each as calculated in accordance with the Senior Secured Credit Agreement): (i) a debt to total capitalization ratio of not more than 27.5 percent (such ratio was 17.2 percent at December 31, 2014); (ii) an interest coverage ratio of not less than 2.50 to 1.00 for each rolling four quarters (such ratio was 15.75 to 1.00 for the four quarters ended December 31, 2014); (iii) an aggregate ratio of total adjusted capital to company action level risk-based capital for the Company's insurance subsidiaries of not less than 250 percent (such ratio was
CNO FINANCIAL GROUP, INC. AND SUBSIDIARIES
Notes to Consolidated Financial Statements
___________________
434 percent at December 31, 2014); and (iv) a combined statutory capital and surplus for the Company's insurance subsidiaries of at least $1,300.0 million (combined statutory capital and surplus at December 31, 2014, was $1,868 million).
The Senior Secured Credit Agreement provides for customary events of default (subject in certain cases to customary grace and cure periods), which include nonpayment, incorrectness of any representation or warranty in any material respect, breach of covenants in the Senior Secured Credit Agreement or other loan documents, cross default to certain other indebtedness, certain events of bankruptcy and insolvency, certain ERISA events, a failure to pay certain judgments, certain material regulatory events, the occurrence of a change of control, and the invalidity of any material provision of any loan document or material lien or guarantee granted under the loan documents. If an event of default under the Senior Secured Credit Agreement occurs and is continuing, the Agent may accelerate the amounts and terminate all commitments outstanding under the Senior Secured Credit Agreement and may exercise remedies in respect of the collateral.
In connection with the execution of the Senior Secured Credit Agreement, the Company and the Subsidiary Guarantors entered into a guarantee and security agreement, dated as of September 28, 2012 (the "Guarantee and Security Agreement"), by and among the Company, the Subsidiary Guarantors and the Agent, pursuant to which the Subsidiary Guarantors guaranteed all of the obligations of the Company under the Senior Secured Credit Agreement and the Company and the Subsidiary Guarantors pledged substantially all of their assets to secure the Senior Secured Credit Agreement, subject to certain exceptions as set forth in the Guarantee and Security Agreement.
6.375% Notes
On September 28, 2012, we issued $275.0 million in aggregate principal amount of 6.375% Notes pursuant to an Indenture, dated as of September 28, 2012 (the "6.375% Indenture"), among the Company, the subsidiary guarantors party thereto (the "Subsidiary Guarantors") and Wilmington Trust, National Association, as trustee (the "Trustee") and as collateral agent (the "Collateral Agent"). The net proceeds from the issuance of the 6.375% Notes, together with the net proceeds from the Senior Secured Credit Agreement, were used to repay other outstanding indebtedness and for general corporate purposes. The 6.375% Notes mature on October 1, 2020. Interest on the 6.375% Notes accrues at a rate of 6.375% per annum and is payable semiannually in arrears on April 1 and October 1 of each year, commencing on April 1, 2013. The 6.375% Notes and the guarantees thereof (the "Guarantees") are senior secured obligations of the Company and the Subsidiary Guarantors and rank equally in right of payment with all of the Company's and the Subsidiary Guarantors' existing and future senior obligations, and senior to all of the Company's and the Subsidiary Guarantors' future subordinated indebtedness. The 6.375% Notes are secured by a first-priority lien on substantially all of the assets of the Company and the Subsidiary Guarantors, subject to certain exceptions. The 6.375% Notes and the Guarantees are pari passu with respect to security and in right of payment with all of the Company's and the Subsidiary Guarantors' existing and future secured indebtedness under the Senior Secured Credit Agreement. The 6.375% Notes are structurally subordinated to all of the liabilities and preferred stock of each of the Company's insurance subsidiaries, which are not guarantors of the 6.375% Notes.
The Company may redeem all or part of the 6.375% Notes beginning on October 1, 2015, at the redemption prices set forth in the 6.375% Indenture. The Company may also redeem all or part of the 6.375% Notes at any time and from time to time prior to October 1, 2015, at a price equal to 100% of the aggregate principal amount of the 6.375% Notes to be redeemed, plus a "make-whole" premium and accrued and unpaid interest to, but not including, the redemption date. In addition, prior to October 1, 2015, the Company may redeem up to 35% of the aggregate principal amount of the 6.375% Notes with the net cash proceeds of certain equity offerings at a price equal to 106.375% of the aggregate principal amount of the 6.375% Notes to be redeemed, plus accrued and unpaid interest to, but not including, the redemption date.
Upon the occurrence of a Change of Control (as defined in the 6.375% Indenture), each holder of the 6.375% Notes may require the Company to repurchase all or a portion of the 6.375% Notes in cash at a price equal to 101% of the aggregate principal amount of the 6.375% Notes to be repurchased, plus accrued and unpaid interest, if any, to, but not including, the date of repurchase.
The 6.375% Indenture contains covenants that, among other things, limit (subject to certain exceptions) the Company's ability and the ability of the Company's Restricted Subsidiaries (as defined in the 6.375% Indenture) to:
| |
| • | incur or guarantee additional indebtedness or issue preferred stock; |
CNO FINANCIAL GROUP, INC. AND SUBSIDIARIES
Notes to Consolidated Financial Statements
___________________
| |
| • | pay dividends or make other distributions to shareholders; |
| |
| • | purchase or redeem capital stock or subordinated indebtedness; |
| |
| • | incur restrictions on the Company's ability and the ability of its Restricted Subsidiaries to pay dividends or make other payments to the Company; |
| |
| • | sell assets, including capital stock of the Company's subsidiaries; |
| |
| • | consolidate or merge with or into other companies or transfer all or substantially all of the Company's assets; and |
| |
| • | engage in transactions with affiliates. |
The 6.375% Indenture provides for customary events of default (subject in certain cases to customary grace and cure periods), which include nonpayment, breach of covenants in the 6.375% Indenture, failure to pay at maturity or acceleration of other indebtedness, a failure to pay certain judgments and certain events of bankruptcy and insolvency. Generally, if an event of default occurs, the Trustee or holders of at least 25% in principal amount of the then outstanding 6.375% Notes may declare the principal of and accrued but unpaid interest, including any additional interest, on all of the 6.375% Notes to be due and payable.
Under the 6.375% Indenture, the Company can make Restricted Payments (as such term is defined in the 6.375% Indenture) up to a calculated limit, provided that the Company's pro forma risk-based capital ratio exceeds 225% after giving effect to the Restricted Payment and certain other conditions are met. Restricted Payments include, among other items, repurchases of common stock and cash dividends on common stock (to the extent such dividends exceed $30.0 million in the aggregate in any calendar year).
The limit of Restricted Payments permitted under the 6.375% Indenture is the sum of (x) 50% of the Company's "Net Excess Cash Flow" (as defined in the 6.375% Indenture) for the period (taken as one accounting period) from July 1, 2012 to the end of the Company's most recently ended fiscal quarter for which financial statements are available at the time of such Restricted Payment, (y) $175.0 million and (z) certain other amounts specified in the 6.375% Indenture. Based on the provisions set forth in the 6.375% Indenture and the Company's Net Excess Cash Flow for the period from July 1, 2012 through December 31, 2014, the Company could have made additional Restricted Payments under this 6.375% Indenture covenant of approximately $75 million as of December 31, 2014. This limitation on Restricted Payments does not apply if the Debt to Total Capitalization Ratio (as defined in the 6.375% Indenture) as of the last day of the Company's most recently ended fiscal quarter for which financial statements are available that immediately precedes the date of any Restricted Payment, calculated immediately after giving effect to such Restricted Payment and any related transactions on a pro forma basis, is equal to or less than 17.5%.
The amendment to the Senior Secured Credit Agreement on May 30, 2014, did not impact the restrictions set forth in the 6.375% Indenture regarding the Company’s use of the proceeds from the sale of CLIC. Under the Indenture, the net proceeds received by the Company from the sale of CLIC (defined as "Net Available Cash" under the Indenture) may be used to: (i) reinvest in or acquire assets to be used in the insurance business or a related business; or (ii) repay the Senior Secured Credit Agreement. Under the Indenture, any Net Available Cash not so reinvested or applied within 365 days after the closing of the sale of CLIC must be used to make an offer to purchase the outstanding notes at par and, in the interim, may only be invested as set forth in the Indenture. The Company currently plans to use the cash received from the sale of CLIC as permitted under the 6.375 Indenture including the investment on July 1, 2014, of $28.0 million to recapture a block of life insurance business from Wilton Re.
In connection with the issuance of the 6.375% Notes and execution of the 6.375% Indenture, the Company and the Subsidiary Guarantors entered into a security agreement, dated as of September 28, 2012 (the "Security Agreement"), by and
CNO FINANCIAL GROUP, INC. AND SUBSIDIARIES
Notes to Consolidated Financial Statements
___________________
among the Company, the Subsidiary Guarantors and the Collateral Agent, pursuant to which the Company and the Subsidiary Guarantors pledged substantially all of their assets to secure their obligations under the 6.375% Notes and the 6.375% Indenture, subject to certain exceptions as set forth in the Security Agreement.
Pari Passu Intercreditor Agreement
In connection with the issuance of the 6.375% Notes and entry into the Senior Secured Credit Agreement, the Agent and the Collateral Agent, as authorized representative with respect to the 6.375% Notes, entered into a Pari Passu Intercreditor Agreement, dated as of September 28, 2012 (the "Intercreditor Agreement"), which sets forth agreements with respect to the first-priority liens granted by the Company and the Subsidiary Guarantors pursuant to the 6.375% Indenture and the Senior Secured Credit Agreement.
Under the Intercreditor Agreement, any actions that may be taken with respect to the collateral that secures the 6.375% Notes and the Senior Secured Credit Agreement, including the ability to cause the commencement of enforcement proceedings against such collateral, to control such proceedings and to approve amendments to releases of such collateral from the lien of, and waive past defaults under, such documents relating to such collateral, will be at the direction of the authorized representative of the lenders under the Senior Secured Credit Agreement until the earliest of: (i) the Company's obligations under the Senior Secured Credit Agreement (or refinancings thereof) are discharged; (ii) the earlier of (x) the date on which the outstanding principal amount of loans and commitments under the Senior Secured Credit Agreement is less than $25.0 million and (y) the date on which the outstanding principal amount of another tranche of first-priority indebtedness exceeds the principal amount of loans and commitments under the Senior Secured Credit Agreement; and (iii) 180 days after the occurrence of both an event of default under the 6.375% Indenture and the authorized representative of the holders of the New Notes making certain representations as described in the Intercreditor Agreement, unless the authorized representative of the lenders under the Senior Secured Credit Agreement has commenced and is diligently pursuing enforcement action with respect to the collateral or the grantor of the security interest in that collateral (whether the Company or the applicable Subsidiary Guarantor) is then a debtor under or with respect to (or otherwise subject to) any insolvency or liquidation proceeding.
9.0% Notes
On December 21, 2010, we issued $275.0 million aggregate principal amount of 9.0% Senior Secured Notes due January 2018 (the "9.0% Notes"). The net proceeds of $267.0 million were used to repay certain indebtedness. The Company could redeem all or part of the 9.0% Notes at any time and from time to time prior to January 15, 2014, at a price equal to 100% of the aggregate principal amount of the 9.0% Notes to be redeemed plus a "make-whole" premium and accrued and unpaid interest.
On September 28, 2012, the Company completed the cash tender offer for $273.8 million aggregate principal amount of the 9.0% Notes and received consents from such holders to proposed amendments to the indenture governing the 9.0% Notes (the "9.0% Indenture"). In addition, on September 28, 2012 (the "Initial Payment Date"), the Company, the Subsidiary Guarantors and Wilmington Trust, National Association (as successor by merger to Wilmington Trust FSB), as trustee, executed a first supplemental indenture to the 9.0% Indenture (the "Supplemental Indenture") that eliminated substantially all of the restrictive covenants contained in the 9.0% Indenture and certain events of default and related provisions. The Supplemental Indenture became effective upon execution, and the amendments to the 9.0% Indenture became operative on the Initial Payment Date upon acceptance of and payment for the tendered 9.0% Notes by the Company.
On the Initial Payment Date, the Company paid an aggregate of $326.3 million (using a portion of the net proceeds from its offering of the 6.375% Notes, together with borrowings under the Senior Secured Credit Agreement) in order to purchase the 9.0% Notes tendered prior to the Initial Payment Date (representing, in the aggregate, tender offer consideration of approximately $313.1 million, consent payments of approximately $8.2 million and accrued and unpaid interest to, but not including, the Initial Payment Date of approximately $5.0 million). The remaining $1.2 million of 9.0% Notes were redeemed on October 29, 2012.
7.0% Debentures
From November 2009 through May 2010, we issued $293.0 million aggregate principal amount of our 7.0% Senior Debentures due 2016 (the "7.0% Debentures"). The Company used the net proceeds from the issuance of the 7.0% Debentures to retire outstanding indebtedness.
CNO FINANCIAL GROUP, INC. AND SUBSIDIARIES
Notes to Consolidated Financial Statements
___________________
The 7.0% Debentures ranked equally in right of payment with all of the Company's unsecured and unsubordinated obligations. The 7.0% Debentures were governed by an Indenture dated as of October 16, 2009 between the Company and The Bank of New York Mellon Trust Company, N.A., as trustee. The 7.0% Debentures bore interest at a rate of 7.0% per annum, payable semi-annually on June 30 and December 30 of each year. The 7.0% Debentures would have matured on December 30, 2016. The 7.0% Debentures were not convertible prior to June 30, 2013, except under limited circumstances. Commencing on June 30, 2013, the 7.0% Debentures were convertible into shares of our common stock at the option of the holder at any time, subject to certain exceptions and subject to our right to terminate such conversion rights under certain circumstances relating to the sale price of our common stock. As further described below, we elected to terminate the conversion rights in July 2013.
On September 4, 2012, the Company entered into a Debenture Repurchase Agreement (the "Debenture Repurchase Agreement") with Paulson Credit Opportunities Master Ltd. and Paulson Recovery Master Fund Ltd. (collectively, the "Paulson Holders"), funds managed by Paulson & Co. Inc., ("Paulson") that held $200.0 million in aggregate principal amount of the Company's 7.0% Debentures. Pursuant to the Debenture Repurchase Agreement, the Company purchased from each of the Paulson Holders the 7.0% Debentures held by such Paulson Holders, for a cash purchase price of $355.1 million that provided for a 2.8% discount to the estimated fair market value of the 7.0% Debentures as defined in the Debenture Repurchase Agreement.
On March 28, 2013, the Company completed the cash tender offer (the "Offer") for $59.3 million aggregate principal amount of its 7.0% Debentures for an aggregate purchase price of $124.8 million. The Offer was conducted as part of our previously announced securities repurchase program. Pursuant to the terms of the Offer, holders of the 7.0% Debentures who tendered their 7.0% Debentures prior to the expiration date, received, for each $1,000 principal amount of such 7.0% Debentures, a cash purchase price equal to the sum of: (i) the average volume weighted average price of our common stock (as defined in the Offer) ($11.2393 at the close of trading on March 27, 2013) multiplied by 183.5145; plus (ii) a fixed cash amount of $61.25. The final purchase price per $1,000 principal amount of 7.0% Debentures was $2,123.82. In addition to the purchase price, holders received accrued and unpaid interest on any 7.0% Debentures that were tendered to, but excluding, the settlement date of the Offer.
In May 2013, we repurchased $4.5 million principal amount of the 7.0% Debentures for an aggregate purchase price of $9.4 million.
On July 1, 2013, the Company issued a conversion right termination notice to holders of the 7.0% Debentures. The Company elected to terminate the right to convert the 7.0% Debentures into shares of its common stock, effective as of July 30, 2013. Holders of the 7.0% Debentures were able to exercise their conversion right at any time on or prior to the close of business on July 30, 2013. Holders exercising their conversion right received 184.3127 shares of common stock per $1,000 principal amount of 7.0% Debentures converted. The 7.0% Debentures submitted for conversion were deemed paid in full and the Company has no further obligation with respect to such 7.0% Debentures. Holders of $25.7 million in aggregate principal amount of the 7.0% Debentures exercised their conversion right and received 4.7 million shares of our common stock.
On May 30, 2014, we repurchased the remaining $3.5 million principal amount of the 7.0% Debentures for a purchase price of $3.7 million.
Previous Senior Secured Credit Agreement
In the first nine months of 2012, as required under the terms of a previous senior secured credit agreement, we made mandatory prepayments of $31.4 million due to repurchases of our common stock and payment of a common stock dividend.
In September 2012, the Company used a portion of the net proceeds from its offering of the 6.375% Notes, together with borrowings under the Senior Secured Credit Agreement to repay the remaining $223.8 million principal amount outstanding under its previous senior secured credit agreement.
Senior Health Note
In connection with the Transfer, the Company issued the Senior Health Note due November 12, 2013 (the "Senior Health Note") payable to Senior Health. The Senior Health Note was unsecured and had an interest rate of 6.0% payable quarterly,
CNO FINANCIAL GROUP, INC. AND SUBSIDIARIES
Notes to Consolidated Financial Statements
___________________
beginning on March 15, 2009. We were required to make annual principal payments of $25.0 million beginning on November 12, 2009. The Company made a $25.0 million scheduled payment on the Senior Health Note in 2011, 2010 and 2009. In March 2012, we paid in full the remaining $50.0 million principal balance on the Senior Health Note, which had been scheduled to mature in November 2013. The repayment in full of the Senior Health Note removed the previous restriction on our ability to pay cash dividends on our common stock.
Loss on Extinguishment of Debt
In 2014, we recognized a loss on extinguishment or modification of debt totaling $.6 million consisting of:
| |
| (i) | $.4 million of expenses related to the amendment of the Senior Secured Credit Agreement; and |
| |
| (ii) | $.2 million related to the repurchase of the remaining principal amount of the 7.0% Debentures. |
In 2013, we recognized a loss on extinguishment of debt totaling $65.4 million consisting of:
| |
| (i) | $2.9 million related to the amendment of the Senior Secured Credit Agreement and the write-off of unamortized discount and issuance costs associated with prepayments on the Senior Secured Credit Agreement; and |
| |
| (ii) | $62.5 million as a result of the Offer and repurchase of 7.0% Debentures described above, the write-off of unamortized discount and issuance costs associated with the 7.0% Debentures that were repurchased and other transaction costs. Additional paid-in capital was also reduced by $12.6 million to extinguish the beneficial conversion feature associated with a portion of the 7.0% Debentures that were repurchased. |
In 2012, we recognized a loss on extinguishment of debt totaling $200.2 million consisting of:
| |
| (i) | $136.5 million due to our repurchase of $200.0 million principal amount of 7.0% Debentures pursuant to the Debenture Repurchase Agreement described above and the write-off of unamortized discount and issuance costs associated with the 7.0% Debentures. Additional paid-in capital was also reduced by $24.0 million to extinguish the beneficial conversion feature associated with a portion of the 7.0% Debentures that were repurchased. As the Code limits the deduction to taxable income for losses on the redemption of convertible debt, a minimal tax benefit was recognized related to the repurchase of the 7.0% Debentures; |
| |
| (ii) | $58.2 million related to the Offer and consent solicitation for the 9.0% Notes; the write-off of unamortized issuance costs related to the 9.0% Notes; and other transaction costs; |
| |
| (iii) | $5.1 million representing the write-off of unamortized discount and issuance costs associated with repayments of a previous senior secured credit agreement; and |
(iv) $.4 million representing the write-off of unamortized discount and issuance costs associated with payments on our Senior Secured Credit Agreement.
CNO FINANCIAL GROUP, INC. AND SUBSIDIARIES
Notes to Consolidated Financial Statements
___________________
Scheduled Repayment of our Direct Corporate Obligations
The scheduled repayment of our direct corporate obligations was as follows at December 31, 2014 (dollars in millions):
|
| | | |
| Year ending December 31, | |
| 2015 | $ | 79.2 |
|
| 2016 | 60.5 |
|
| 2017 | 4.3 |
|
| 2018 | 378.1 |
|
| 2019 | — |
|
| Thereafter | 275.0 |
|
| | $ | 797.1 |
|
8. LITIGATION AND OTHER LEGAL PROCEEDINGS
Legal Proceedings
The Company and its subsidiaries are involved in various legal actions in the normal course of business, in which claims for compensatory and punitive damages are asserted, some for substantial amounts. We recognize an estimated loss from these loss contingencies when we believe it is probable that a loss has been incurred and the amount of the loss can be reasonably estimated. Some of the pending matters have been filed as purported class actions and some actions have been filed in certain jurisdictions that permit punitive damage awards that are disproportionate to the actual damages incurred. The amounts sought in certain of these actions are often large or indeterminate and the ultimate outcome of certain actions is difficult to predict. In the event of an adverse outcome in one or more of these matters, there is a possibility that the ultimate liability may be in excess of the liabilities we have established and could have a material adverse effect on our business, financial condition, results of operations and cash flows. In addition, the resolution of pending or future litigation may involve modifications to the terms of outstanding insurance policies or could impact the timing and amount of rate increases, which could adversely affect the future profitability of the related insurance policies. Based upon information presently available, and in light of legal, factual and other defenses available to the Company and its subsidiaries, the Company does not believe that it is probable that the ultimate liability from either pending or threatened legal actions, after consideration of existing loss provisions, will have a material adverse effect on the Company's consolidated financial condition, operating results or cash flows. However, given the inherent difficulty in predicting the outcome of legal proceedings, there exists the possibility that such legal actions could have a material adverse effect on the Company's consolidated financial condition, operating results or cash flows.
In addition to the inherent difficulty of predicting litigation outcomes, particularly those that will be decided by a jury, some matters purport to seek substantial or an unspecified amount of damages for unsubstantiated conduct spanning several years based on complex legal theories and damages models. The alleged damages typically are indeterminate or not factually supported in the complaint, and, in any event, the Company's experience indicates that monetary demands for damages often bear little relation to the ultimate loss. In some cases, plaintiffs are seeking to certify classes in the litigation and class certification either has been denied or is pending and we have filed oppositions to class certification or sought to decertify a prior class certification. In addition, for many of these cases: (i) there is uncertainty as to the outcome of pending appeals or motions; (ii) there are significant factual issues to be resolved; and/or (iii) there are novel legal issues presented. Accordingly, the Company cannot reasonably estimate the possible loss or range of loss in excess of amounts accrued, if any, or predict the timing of the eventual resolution of these matters. The Company reviews these matters on an ongoing basis. When assessing reasonably possible and probable outcomes, the Company bases its assessment on the expected ultimate outcome following all appeals.
Regulatory Examinations and Fines
Insurance companies face significant risks related to regulatory investigations and actions. Regulatory investigations generally result from matters related to sales or underwriting practices, payment of contingent or other sales commissions, claim payments and procedures, product design, product disclosure, additional premium charges for premiums paid on a periodic basis, denial or delay of benefits, charging excessive or impermissible fees on products, procedures related to canceling
CNO FINANCIAL GROUP, INC. AND SUBSIDIARIES
Notes to Consolidated Financial Statements
___________________
policies, changing the way cost of insurance charges are calculated for certain life insurance products or recommending unsuitable products to customers. We are, in the ordinary course of our business, subject to various examinations, inquiries and information requests from state, federal and other authorities. The ultimate outcome of these regulatory actions (including the costs of complying with information requests and policy reviews) cannot be predicted with certainty. In the event of an unfavorable outcome in one or more of these matters, the ultimate liability may be in excess of liabilities we have established and we could suffer significant reputational harm as a result of these matters, which could also have a material adverse effect on our business, financial condition, results of operations or cash flows.
In August 2011, we were notified of an examination to be done on behalf of a number of states for the purpose of determining compliance with unclaimed property laws by the Company and its subsidiaries. Such examination has included inquiries related to the use of data available on the U.S. Social Security Administration's Death Master File to identify instances where benefits under life insurance policies, annuities and retained asset accounts are payable. We are continuing to provide information to the examiners in response to their requests. A total of 38 states and the District of Columbia are currently participating in this examination.
Guaranty Fund Assessments
The balance sheet at December 31, 2014, included: (i) accruals of $23.7 million, representing our estimate of all known assessments that will be levied against the Company's insurance subsidiaries by various state guaranty associations based on premiums written through December 31, 2014; and (ii) receivables of $23.6 million that we estimate will be recovered through a reduction in future premium taxes as a result of such assessments. At December 31, 2013, such guaranty fund assessment accruals were $24.0 million and such receivables were $24.9 million. These estimates are subject to change when the associations determine more precisely the losses that have occurred and how such losses will be allocated among the insurance companies. We recognized expense for such assessments of $1.1 million, $2.7 million and $4.3 million in 2014, 2013 and 2012, respectively.
Guarantees
In accordance with the terms of the employment agreements of two of the Company's former chief executive officers, certain wholly-owned subsidiaries of the Company are the guarantors of the former executives' nonqualified supplemental retirement benefits. The liability for such benefits was $27.2 million and $25.9 million at December 31, 2014 and 2013, respectively, and is included in the caption "Other liabilities" in the consolidated balance sheet.
Leases and Certain Other Long-Term Commitments
The Company rents office space, equipment and computer software under noncancellable operating lease agreements. In addition, the Company has entered into certain sponsorship agreements which require future payments. Total expense pursuant to these lease and sponsorship agreements was $50.4 million, $44.3 million and $47.5 million in 2014, 2013 and 2012, respectively. Future required minimum payments as of December 31, 2014, were as follows (dollars in millions):
|
| | | |
| 2015 | $ | 47.3 |
|
| 2016 | 34.8 |
|
| 2017 | 21.2 |
|
| 2018 | 17.6 |
|
| 2019 | 6.9 |
|
| Thereafter | 11.1 |
|
| Total | $ | 138.9 |
|
CNO FINANCIAL GROUP, INC. AND SUBSIDIARIES
Notes to Consolidated Financial Statements
___________________
9. AGENT DEFERRED COMPENSATION PLAN
For our agent deferred compensation plan, it is our policy to immediately recognize changes in the actuarial benefit obligation resulting from either actual experience being different than expected or from changes in actuarial assumptions.
One of our insurance subsidiaries has a noncontributory, unfunded deferred compensation plan for qualifying members of its career agency force. Benefits are based on years of service and career earnings. The actuarial measurement date of this deferred compensation plan is December 31. The liability recognized in the consolidated balance sheet for the agent deferred compensation plan was $175.1 million and $142.7 million at December 31, 2014 and 2013, respectively. Expenses incurred on this plan were $36.3 million, $(2.9) million and $20.5 million during 2014, 2013 and 2012, respectively (including the recognition of gains (losses) of $(24.3) million, $17.2 million and $(7.5) million in 2014, 2013 and 2012, respectively, primarily resulting from: (i) changes in the discount rate assumption used to determine the deferred compensation plan liability to reflect current investment yields; and (ii) changes in mortality table assumptions). We purchased COLI as an investment vehicle to fund the agent deferred compensation plan. The COLI assets are not assets of the agent deferred compensation plan, and as a result, are accounted for outside the plan and are recorded in the consolidated balance sheet as other invested assets. The carrying value of the COLI assets was $157.6 million and $144.8 million at December 31, 2014 and 2013, respectively. Changes in the cash surrender value (which approximates net realizable value) of the COLI assets are recorded as net investment income and totaled $5.7 million, $19.7 million and $9.0 million in 2014, 2013 and 2012, respectively.
We used the following assumptions for the deferred compensation plan to calculate:
|
| | | | | |
| | 2014 | | 2013 |
| Benefit obligations: | | | |
| Discount rate | 4.15 | % | | 4.75 | % |
| Net periodic cost: | | | |
| Discount rate | 4.75 | % | | 4.00 | % |
The discount rate is based on the yield of a hypothetical portfolio of high quality debt instruments which could effectively settle plan benefits on a present value basis as of the measurement date. At December 31, 2014, for our deferred compensation plan for qualifying members of our career agency force, we assumed a 4.0 percent annual increase in compensation until the participant's assumed retirement date (ranging from ages 60 to 65 and completion of five years of service).
The benefits expected to be paid pursuant to our agent deferred compensation plan as of December 31, 2014 were as follows (dollars in millions):
|
| | | |
| 2015 | $ | 6.5 |
|
| 2016 | 6.8 |
|
| 2017 | 7.1 |
|
| 2018 | 7.7 |
|
| 2019 | 8.0 |
|
| 2020 - 2024 | 47.4 |
|
The Company has a qualified defined contribution plan for which substantially all employees are eligible. Company contributions, which match a portion of certain voluntary employee contributions to the plan, totaled $5.1 million, $4.6 million and $4.5 million in 2014, 2013 and 2012, respectively. Employer matching contributions are discretionary.
CNO FINANCIAL GROUP, INC. AND SUBSIDIARIES
Notes to Consolidated Financial Statements
___________________
10. DERIVATIVES
Our freestanding and embedded derivatives, which are not designated as hedging instruments, are summarized as follows (dollars in millions):
|
| | | | | | | | | | |
| | | | | Fair value |
| | | Balance sheet classification | | 2014 | | 2013 |
| Assets: | | | | | | |
| Fixed index call options | | Other invested assets | | $ | 107.2 |
| | $ | 156.2 |
|
| Interest futures | | Other invested assets | | — |
| | .2 |
|
| Total assets | | | | $ | 107.2 |
| | $ | 156.4 |
|
| Liabilities: | | | | | | |
| Interest futures | | Other invested assets | | $ | .2 |
| | $ | — |
|
| Fixed index annuities - embedded derivative | | Future policy benefits | | 1,081.5 |
| | 903.7 |
|
| Reinsurance payable - embedded derivative | | Future policy benefits | | — |
| | 1.8 |
|
| Total liabilities | | | | $ | 1,081.7 |
| | $ | 905.5 |
|
The activity associated with freestanding derivative instruments is measured as either the notional or the number of contracts. The activity associated with the fixed index annuity embedded derivatives are shown by the number of policies. The following table represents activity associated with derivative instruments as of the dates indicated:
|
| | | | | | | | | | | | | | | | | | |
| | | Measurement | | December 31, 2013 | | Additions | | Maturities/terminations | | December 31, 2014 |
| Interest futures | | Contracts | | 186 |
| | 4,847 |
| | (4,631 | ) | | 402 |
|
| Fixed index annuities - embedded derivative | | Policies | | 90,408 |
| | 9,830 |
| | (7,053 | ) | | 93,185 |
|
| Fixed index call options | | Notional (a) | | $ | 2,284.8 |
| | $ | 2,430.2 |
| | $ | (2,311.1 | ) | | $ | 2,403.9 |
|
_________________
(a) Dollars in millions.
CNO FINANCIAL GROUP, INC. AND SUBSIDIARIES
Notes to Consolidated Financial Statements
___________________
The following table provides the pre-tax gains (losses) recognized in net income for derivative instruments, which are not designated as hedges for the periods indicated (dollars in millions):
|
| | | | | | | | | | | | | | |
| | | Income statement classification | | 2014 | | 2013 | | 2012 |
| Fixed index call options | | Net investment income from policyholder and reinsurer accounts and other special-purpose portfolios | | $ | 69.5 |
| | $ | 177.5 |
| | $ | 25.5 |
|
| Interest futures | | Net realized investments gains (losses) | | (7.0 | ) | | (.4 | ) | | (.2 | ) |
| Fixed index annuities - embedded derivative | | Insurance policy benefits | | (73.5 | ) | | 49.3 |
| | (15.2 | ) |
| Reinsurance payable - embedded derivative | | Net investment income from policyholder and reinsurer accounts and other special-purpose portfolios | | (1.4 | ) | | 3.7 |
| | (2.4 | ) |
| Total | | | | $ | (12.4 | ) | | $ | 230.1 |
| | $ | 7.7 |
|
Derivative Counterparty Risk
If the counterparties to the call options fail to meet their obligations, we may recognize a loss. We limit our exposure to such a loss by diversifying among several counterparties believed to be strong and creditworthy. At December 31, 2014, all of our counterparties were rated "A-" or higher by S&P. The interest rate future contracts are effected through regulated exchanges. Such positions are marked to market and margined on a daily basis. The Company has minimal exposure to credit-related losses in the event of nonperformance.
The Company and its subsidiaries are parties to master netting arrangements with its counterparties related to entering into various derivative contracts. Exchange-traded derivatives require margin accounts which we offset.
The following table summarizes information related to derivatives with master netting arrangements or collateral as of December 31, 2014 and 2013 (dollars in millions):
|
| | | | | | | | | | | | | | | | | | | | | | | | | |
| | | | | | | | | | Gross amounts not offset in the balance sheet | | |
| | | | Gross amounts recognized | | Gross amounts offset in the balance sheet | | Net amounts of assets presented in the balance sheet | | Financial instruments | | Cash collateral received | | Net amount |
| December 31, 2014: | | |
| | Fixed index call options | | $ | 107.2 |
| | $ | — |
| | $ | 107.2 |
| | $ | — |
| | $ | — |
| | $ | 107.2 |
|
| | Interest futures | | (.2 | ) | | 1.5 |
| | 1.3 |
| | — |
| | — |
| | 1.3 |
|
| December 31, 2013: | | | | | | | | | | | | |
| | Fixed index call options | | 156.2 |
| | — |
| | 156.2 |
| | — |
| | — |
| | 156.2 |
|
| | Interest futures | | .2 |
| | .4 |
| | .6 |
| | — |
| | — |
| | .6 |
|
CNO FINANCIAL GROUP, INC. AND SUBSIDIARIES
Notes to Consolidated Financial Statements
___________________
Repurchase agreements
We may enter into agreements under which we sell securities subject to an obligation to repurchase the same securities. These repurchase agreements are accounted for as collateralized financing arrangements and not as a sale and subsequent repurchase of securities. The obligation to repurchase the securities is reflected as investment borrowings in the Company's consolidated balance sheet, while the securities underlying the repurchase agreements remain in the respective investment asset accounts. There is no offsetting or netting of the investment securities assets with the repurchase agreement liabilities. In addition, as the Company does not currently have any outstanding reverse repurchase agreements, there is no such offsetting to be done with the repurchase agreements.
The right of offset for a repurchase agreement resembles a secured borrowing, whereby the collateral would be used to settle the fair value of the repurchase agreement should the Company be in default under the agreement (e.g., fails to make an interest payment to the counterparty). If the counterparty were to default (e.g., declare bankruptcy), the Company could cancel the repurchase agreement (i.e., cease payment of principal and interest), and attempt collection on the amount of collateral value in excess of the repurchase agreement fair value. The collateral is held by a third party financial institution in the counterparty's custodial account. The counterparty has the right to sell or repledge the investment securities.
The following table summarizes information related to repurchase agreements as of December 31, 2014 (dollars in millions):
|
| | | | | | | | | | | | | | | | | | | | | | | | | |
| | | | | | | | | | Gross amounts not offset in the balance sheet | | |
| | | | Gross amounts of recognized liabilities | | Gross amounts offset in the balance sheet | | Net amounts of liabilities presented in the balance sheet | | Financial instruments | | Cash collateral pledged | | Net amount |
| December 31, 2014: | | |
| | Repurchase agreements (a) | | $ | 20.4 |
| | $ | — |
| | $ | 20.4 |
| | $ | 20.4 |
| | $ | — |
| | $ | — |
|
_________________
| |
| (a) | As of December 31, 2014, these agreements were collateralized by investment securities with a fair value of $25.3 million. There were no repurchase agreements outstanding at December 31, 2013. |
11. SHAREHOLDERS' EQUITY
Changes in the number of shares of common stock outstanding were as follows (shares in thousands):
|
| | | | | | | | | |
| | 2014 | | 2013 | | 2012 | |
| Balance, beginning of year | 220,324 |
| | 221,502 |
| | 241,305 |
| |
| Treasury stock purchased and retired | (18,489 | ) | | (8,949 | ) | | (21,533 | ) | |
| Conversion of 7.0% Debentures | — |
| | 4,739 |
| | — |
| |
| Stock options exercised | 916 |
| | 2,087 |
| | 1,191 |
| |
| Restricted and performance stock vested (a) | 573 |
| | 945 |
| | 539 |
| |
| Balance, end of year | 203,324 |
| | 220,324 |
| | 221,502 |
| |
____________________
| |
| (a) | In 2014, 2013 and 2012, such amount was reduced by 257 thousand, 472 thousand and 237 thousand shares, respectively, which were tendered to the Company for the payment of required federal and state tax withholdings owed on the vesting of restricted and performance stock. |
In May 2011, the Company announced a common share repurchase program of up to $100.0 million. In February 2012, June 2012, December 2012, December 2013 and November 2014, the Company's Board of Directors approved, in aggregate, an additional $1,200.0 million to repurchase the Company's outstanding securities. In 2014, 2013 and 2012 we repurchased 18.5
CNO FINANCIAL GROUP, INC. AND SUBSIDIARIES
Notes to Consolidated Financial Statements
___________________
million, 8.9 million and 21.5 million shares, respectively, of common stock for $319.1 million, $118.4 million and $180.2 million under the securities repurchase program. In addition, in September 2014, we repurchased all outstanding common stock warrants for $57.4 million under the securities repurchase program. Such warrants had been held by Paulson on behalf of several investment funds and accounts managed by them, and were issued in conjunction with a private sale of our common stock in 2009. In 2013, the Company also purchased $63.8 million aggregate principal amount of our 7.0% Debentures as further discussed in the note to the consolidated financial statements entitled "Notes Payable - Direct Corporate Obligations". Such purchases were made pursuant to our securities repurchase program. The Company had remaining repurchase authority of $420.9 million as of December 31, 2014.
In May 2012, we initiated a common stock dividend program. In 2014, 2013 and 2012, dividends declared and paid on common stock totaled $51.0 million ($0.24 per common share), $24.4 million ($0.11 per common share) and $13.9 million ($0.06 per common share), respectively. In March 2014, the Company increased its quarterly common stock dividend to $0.06 per share from $0.03 per share.
The Company has a long-term incentive plan which permits the grant of CNO incentive or non-qualified stock options, restricted stock awards, stock appreciation rights, performance shares or units and certain other equity-based awards to certain directors, officers and employees of the Company and certain other individuals who perform services for the Company. As of December 31, 2014, 8.6 million shares remained available for issuance under the plan. Our stock option awards are generally granted with an exercise price equal to the market price of the Company's stock on the date of grant. For options granted in 2006 and prior years, our stock option awards generally vested on a graded basis over a four year service term and expire ten years from the date of grant. Our stock option awards granted in 2007 through 2009 generally vested on a graded basis over a three year service term and expire five years from the date of grant. Our stock options granted in 2010 through 2014 generally vest on a graded basis over a three year service term and expire seven years from the date of grant. The vesting periods for our restricted stock awards range from immediate vesting to a period of three years.
A summary of the Company's stock option activity and related information for 2014 is presented below (shares in thousands; dollars in millions, except per share amounts):
|
| | | | | | | | | | | | |
| | Shares | | Weighted average exercise price | | Weighted average remaining life (in years) | | Aggregate intrinsic value |
| Outstanding at the beginning of the year | 5,579 |
| | $ | 10.64 |
| | | | |
| Options granted | 1,014 |
| | 19.10 |
| | | | |
| Exercised | (917 | ) | | 5.47 |
| | | | $ | 3.8 |
|
| Forfeited or terminated | (665 | ) | | 20.07 |
| | | | |
| Outstanding at the end of the year | 5,011 |
| | 12.04 |
| | 4.3 | | $ | 32.1 |
|
| Options exercisable at the end of the year | 2,030 |
| | | | 2.7 | | $ | 12.1 |
|
| Available for future grant | 8,571 |
| | | | | | |
CNO FINANCIAL GROUP, INC. AND SUBSIDIARIES
Notes to Consolidated Financial Statements
___________________
A summary of the Company's stock option activity and related information for 2013 is presented below (shares in thousands; dollars in millions, except per share amounts):
|
| | | | | | | | | | | | |
| | Shares | | Weighted average exercise price | | Weighted average remaining life (in years) | | Aggregate intrinsic value |
| Outstanding at the beginning of the year | 6,655 |
| | $ | 9.72 |
| | | | |
| Options granted | 1,447 |
| | 11.01 |
| | | | |
| Exercised | (2,087 | ) | | 7.27 |
| | | | $ | 6.0 |
|
| Forfeited or terminated | (436 | ) | | 13.95 |
| | | | |
| Outstanding at the end of the year | 5,579 |
| | 10.64 |
| | 4.0 | | $ | 32.5 |
|
| Options exercisable at the end of the year | 2,529 |
| | | | 2.1 | | $ | 13.9 |
|
| Available for future grant | 9,099 |
| | | | | | |
A summary of the Company's stock option activity and related information for 2012 is presented below (shares in thousands; dollars in millions, except per share amounts):
|
| | | | | | | | | | | | |
| | Shares | | Weighted average exercise price | | Weighted average remaining life (in years) | | Aggregate intrinsic value |
| Outstanding at the beginning of the year | 7,712 |
| | $ | 10.13 |
| | | | |
| Options granted | 1,389 |
| | 7.55 |
| | | | |
| Exercised | (1,191 | ) | | 3.14 |
| | | | $ | 2.7 |
|
| Forfeited or terminated | (1,255 | ) | | 16.13 |
| | | | |
| Outstanding at the end of the year | 6,655 |
| | 9.72 |
| | 3.4 | | $ | 30.2 |
|
| Options exercisable at the end of the year | 3,715 |
| | | | 1.7 | | $ | 15.5 |
|
| Available for future grant | 9,713 |
| | | | | | |
We recognized compensation expense related to stock options totaling $7.9 million ($5.1 million after income taxes) in 2014, $7.2 million ($4.7 million after income taxes) in 2013 and $6.7 million ($4.4 million after income taxes) in 2012. Compensation expense related to stock options reduced both basic and diluted earnings per share by two cents in each of the three years ended December 31, 2014. At December 31, 2014, the unrecognized compensation expense for non-vested stock options totaled $8.7 million which is expected to be recognized over a weighted average period of 1.7 years. Cash received by the Company from the exercise of stock options was $5.0 million, $15.1 million and $3.1 million during 2014, 2013 and 2012, respectively.
The fair value of each stock option grant is estimated on the date of grant using the Black-Scholes option valuation model with the following weighted average assumptions:
|
| | | | | | | | | | | |
| | 2014 | | 2013 | | 2012 |
| | Grants | | Grants | | Grants |
| Weighted average risk-free interest rates | 1.6 | % | | .8 | % | | .9 | % |
| Weighted average dividend yields | 1.3 | % | | .7 | % | | — | % |
| Volatility factors | 51 | % | | 107 | % | | 108 | % |
| Weighted average expected life (in years) | 4.8 |
| | 4.8 |
| | 4.7 |
|
| Weighted average fair value per share | $ | 7.65 |
| | $ | 8.02 |
| | $ | 5.76 |
|
CNO FINANCIAL GROUP, INC. AND SUBSIDIARIES
Notes to Consolidated Financial Statements
___________________
The risk-free interest rate is based on the U.S. Treasury yield curve in effect at the time of grant. The dividend yield is based on the Company's history and expectation of dividend payouts. Volatility factors are based on the weekly historical volatility of the Company's common stock equal to the expected life of the option or since our emergence from bankruptcy in September 2003. The expected life is based on the average of the graded vesting period and the contractual terms of the option.
The exercise price was equal to the market price of our stock on the date of grant for all options granted in 2014, 2013 and 2012.
The following table summarizes information about stock options outstanding at December 31, 2014 (shares in thousands):
|
| | | | | | | | | | | | | | | | |
| | | | | Options outstanding | | Options exercisable |
| Range of exercise prices | | Number outstanding | | Remaining life (in years) | | Average exercise price | | Number exercisable | | Average exercise price |
| $6.45 - $6.77 | | 521 |
| | 2.2 | | $ | 6.45 |
| | 520 |
| | $ | 6.45 |
|
| $7.38 - $7.74 | | 1,580 |
| | 3.8 | | 7.47 |
| | 1,027 |
| | 7.44 |
|
| $8.29 - $12.34 | | 1,396 |
| | 5.1 | | 10.78 |
| | 31 |
| | 8.29 |
|
| $12.74 - $18.27 | | 83 |
| | 5.9 | | 15.40 |
| | — |
| | — |
|
| $19.15 - $25.45 | | 1,431 |
| | 4.6 | | 20.18 |
| | 452 |
| | 22.41 |
|
| | | 5,011 |
| | | | | | 2,030 |
| | |
During 2014, 2013 and 2012, the Company granted .1 million, .2 million and .7 million restricted shares, respectively, of CNO common stock to certain directors, officers and employees of the Company at a weighted average fair value of $17.15 per share, $12.00 per share and $7.35 per share, respectively. The fair value of such grants totaled $1.9 million, $2.1 million and $5.0 million in 2014, 2013 and 2012, respectively. Such amounts are recognized as compensation expense over the vesting period of the restricted stock. A summary of the Company's non-vested restricted stock activity for 2014 is presented below (shares in thousands):
|
| | | | | | |
| | Shares | | Weighted average grant date fair value |
| Non-vested shares, beginning of year | 521 |
| | $ | 8.29 |
|
| Granted | 113 |
| | 17.15 |
|
| Vested | (396 | ) | | 9.22 |
|
| Forfeited | (2 | ) | | 10.19 |
|
| Non-vested shares, end of year | 236 |
| | 10.95 |
|
At December 31, 2014, the unrecognized compensation expense for non-vested restricted stock totaled $1.4 million which is expected to be recognized over a weighted average period of 1.6 years. At December 31, 2013, the unrecognized compensation expense for non-vested restricted stock totaled $2.5 million. We recognized compensation expense related to restricted stock awards totaling $3.0 million, $4.5 million and $4.5 million in 2014, 2013 and 2012, respectively. The fair value of restricted stock that vested during 2014, 2013 and 2012 was $3.7 million, $5.6 million and $4.4 million, respectively.
Authoritative guidance also requires us to estimate the amount of unvested stock-based awards that will be forfeited in future periods and reduce the amount of compensation expense recognized over the applicable service period to reflect this estimate. We periodically evaluate our forfeiture assumptions to more accurately reflect our actual forfeiture experience.
The Company does not currently recognize tax benefits resulting from tax deductions in excess of the compensation expense recognized because of NOLs which are available to offset future taxable income.
In 2014, 2013 and 2012 the Company granted performance units totaling 283,630, 424,400 and 406,500, respectively, pursuant to its long-term incentive plan to certain officers of the Company. The criteria for payment for such awards are based
CNO FINANCIAL GROUP, INC. AND SUBSIDIARIES
Notes to Consolidated Financial Statements
___________________
on certain company-wide performance levels that must be achieved within a specified performance time (generally three years), each as defined in the award. Unless antidilutive, the diluted weighted average shares outstanding would reflect the number of performance units expected to be issued, using the treasury stock method.
A summary of the Company's performance units is presented below (shares in thousands):
|
| | | | | | | | |
| | Total shareholder return awards | | Operating return on equity awards | | Pre-tax operating income awards |
| Awards outstanding at December 31, 2011 | — |
| | — |
| | 836 |
|
| Granted in 2012 | 203 |
| | — |
| | 203 |
|
| Forfeited | (10 | ) | | — |
| | (62 | ) |
| Awards outstanding at December 31, 2012 | 193 |
| | — |
| | 977 |
|
| Granted in 2013 | 212 |
| | 212 |
| | — |
|
| Additional shares issued pursuant to achieving certain performance criteria (a) | — |
| | — |
| | 223 |
|
| Shares vested in 2013 | — |
| | — |
| | (668 | ) |
| Forfeited | (23 | ) | | (8 | ) | | (62 | ) |
| Awards outstanding at December 31, 2013 | 382 |
| | 204 |
| | 470 |
|
| Granted in 2014 | 142 |
| | 142 |
| | — |
|
| Additional shares issued pursuant to achieving certain performance criteria (a) | — |
| | — |
| | 142 |
|
| Shares vested in 2014 | — |
| | — |
| | (434 | ) |
| Forfeited | (5 | ) | | (3 | ) | | (2 | ) |
| Awards outstanding at December 31, 2014 | 519 |
| | 343 |
| | 176 |
|
_________________________
(a) The performance units provide for a payout of up to 150 percent of the award if certain performance levels are achieved.
The grant date fair value of the performance units awarded was $5.2 million and $4.4 million in 2014 and 2013, respectively. We recognized compensation expense of $4.7 million, $3.4 million and $3.8 million in 2014, 2013 and 2012, respectively, related to the performance units.
As further discussed in the footnote to the consolidated financial statements entitled "Income Taxes", the Company's Board of Directors adopted the Section 382 Rights Agreement on January 20, 2009 and amended and extended the Section 382 Rights Agreement on December 6, 2011 and November 13, 2014. The Section 382 Rights Agreement, as amended, is designed to protect shareholder value by preserving the value of our tax assets primarily associated with NOLs. At the time the Section 382 Rights Agreement was adopted, the Company declared a dividend of one preferred share purchase right (a "Right") for each outstanding share of common stock. The dividend was payable on January 30, 2009, to the shareholders of record as of the close of business on that date and a Right is also attached to each share of CNO common stock issued after that date. Pursuant to the Section 382 Rights Agreement, as amended, each Right entitles the shareholder to purchase from the Company one one-thousandth of a share of Series C Junior Participating Preferred Stock, par value $.01 per share (the "Junior Preferred Stock") of the Company at a price of $25.00 per one one-thousandth of a share of Junior Preferred Stock. The description and terms of the Rights are set forth in the Section 382 Rights Agreement, as amended. The Rights would become exercisable in the event any person or group (subject to certain exemptions) becomes an owner of more than 4.99 percent of the outstanding stock of CNO (a "Threshold Holder") without the approval of the Board of Directors or an existing shareholder who is currently a Threshold Holder acquires additional shares exceeding one percent of our outstanding shares without prior approval from the Board of Directors.
CNO FINANCIAL GROUP, INC. AND SUBSIDIARIES
Notes to Consolidated Financial Statements
___________________
A reconciliation of net income and shares used to calculate basic and diluted earnings per share is as follows (dollars in millions and shares in thousands):
|
| | | | | | | | | | | |
| | 2014 | | 2013 | | 2012 |
| Net income (loss) for basic earnings per share | $ | 51.4 |
| | $ | 478.0 |
| | $ | 221.0 |
|
| Add: interest expense on 7.0% Debentures, net of income taxes | — |
| | 1.6 |
| | 12.2 |
|
| Net income (loss) for diluted earnings per share | $ | 51.4 |
| | $ | 479.6 |
| | $ | 233.2 |
|
| Shares: | |
| | |
| | |
| Weighted average shares outstanding for basic earnings per share | 212,917 |
| | 221,628 |
| | 233,685 |
|
| Effect of dilutive securities on weighted average shares: | |
| | | | |
| 7.0% Debentures | — |
| | 5,780 |
| | 44,037 |
|
| Stock options, restricted stock and performance units | 2,505 |
| | 2,776 |
| | 2,762 |
|
| Warrants (a) | 2,233 |
| | 2,518 |
| | 943 |
|
| Dilutive potential common shares | 4,738 |
| | 11,074 |
| | 47,742 |
|
| Weighted average shares outstanding for diluted earnings per share | 217,655 |
| | 232,702 |
| | 281,427 |
|
________
| |
| (a) | All outstanding warrants were repurchased in September 2014 as further discussed above. Accordingly, the warrants will have no dilutive effect in periods beginning after September 30, 2014. |
Basic earnings per common share is computed by dividing net income by the weighted average number of common shares outstanding for the period. Restricted shares (including our performance units) are not included in basic earnings per share until vested. Diluted earnings per share reflect the potential dilution that could occur if outstanding stock options and warrants were exercised and restricted stock was vested. The dilution from options, warrants and restricted shares is calculated using the treasury stock method. Under this method, we assume the proceeds from the exercise of the options and warrants (or the unrecognized compensation expense with respect to restricted stock and performance units) will be used to purchase shares of our common stock at the average market price during the period, reducing the dilutive effect of the exercise of the options and warrants (or the vesting of the restricted stock and performance units). Initially, the 7.0% Debentures were convertible into 182.1494 shares of our common stock for each $1,000 principal amount of 7.0% Debentures, which was equivalent to an initial conversion price of approximately $5.49 per share. The conversion rate was subject to adjustment following the occurrence of certain events (including the payment of dividends on our common stock) in accordance with the terms of an indenture dated as of October 16, 2009. On July 1, 2013, the Company issued a conversion right termination notice to holders of the 7.0% Debentures and the right to convert the 7.0% Debentures into shares of its common stock was terminated effective July 30, 2013 as further discussed in the note to the consolidated financial statements entitled "Notes Payable - Direct Corporate Obligations".
CNO FINANCIAL GROUP, INC. AND SUBSIDIARIES
Notes to Consolidated Financial Statements
___________________
12. OTHER OPERATING STATEMENT DATA
Insurance policy income consisted of the following (dollars in millions):
|
| | | | | | | | | | | |
| | 2014 | | 2013 | | 2012 |
| Direct premiums collected | $ | 3,856.2 |
| | $ | 3,966.0 |
| | $ | 3,883.1 |
|
| Reinsurance assumed | 34.5 |
| | 38.0 |
| | 70.4 |
|
| Reinsurance ceded | (187.9 | ) | | (240.5 | ) | | (237.1 | ) |
| Premiums collected, net of reinsurance | 3,702.8 |
| | 3,763.5 |
| | 3,716.4 |
|
| Change in unearned premiums | 9.1 |
| | (16.6 | ) | | 20.8 |
|
| Less premiums on interest-sensitive life and products without mortality and morbidity risk which are recorded as additions to insurance liabilities | (1,295.4 | ) | | (1,298.1 | ) | | (1,296.7 | ) |
| Premiums on traditional products with mortality or morbidity risk | 2,416.5 |
| | 2,448.8 |
| | 2,440.5 |
|
| Fees and surrender charges on interest-sensitive products | 213.2 |
| | 295.9 |
| | 314.9 |
|
| Insurance policy income | $ | 2,629.7 |
| | $ | 2,744.7 |
| | $ | 2,755.4 |
|
The four states with the largest shares of 2014 collected premiums were Florida (8.3 percent), Pennsylvania (6.7 percent), California (5.4 percent) and Texas (5.3 percent) . No other state accounted for more than five percent of total collected premiums.
Other operating costs and expenses were as follows (dollars in millions):
|
| | | | | | | | | | | |
| | 2014 | | 2013 | | 2012 |
| Commission expense | $ | 99.4 |
| | $ | 103.8 |
| | $ | 115.8 |
|
| Salaries and wages | 242.4 |
| | 234.0 |
| | 226.6 |
|
| Other | 461.0 |
| | 428.4 |
| | 476.9 |
|
| Total other operating costs and expenses | $ | 802.8 |
| | $ | 766.2 |
| | $ | 819.3 |
|
Changes in the present value of future profits were as follows (dollars in millions):
|
| | | | | | | | | | | |
| | 2014 | | 2013 | | 2012 |
| Balance, beginning of year | $ | 679.3 |
| | $ | 626.0 |
| | $ | 697.7 |
|
| Amortization | (76.2 | ) | | (92.0 | ) | | (93.5 | ) |
| Effect of reinsurance transaction | 5.0 |
| | — |
| | — |
|
| Amounts related to CLIC prior to being sold | (15.5 | ) | | — |
| | — |
|
| Amounts related to fair value adjustment of fixed maturities, available for sale | (103.2 | ) | | 145.3 |
| | 21.8 |
|
| Balance, end of year | $ | 489.4 |
| | $ | 679.3 |
| | $ | 626.0 |
|
Based on current conditions and assumptions as to future events on all policies inforce, the Company expects to amortize approximately 11 percent of the December 31, 2014 balance of the present value of future profits in 2015, 10 percent in 2016, 9 percent in 2017, 8 percent in 2018 and 7 percent in 2019. The discount rate used to determine the amortization of the present value of future profits averaged approximately 5 percent in the years ended December 31, 2014, 2013 and 2012.
In accordance with authoritative guidance, we are required to amortize the present value of future profits in relation to estimated gross profits for interest-sensitive life products and annuity products. Such guidance also requires that estimates of expected gross profits used as a basis for amortization be evaluated regularly, and that the total amortization recorded to date be
CNO FINANCIAL GROUP, INC. AND SUBSIDIARIES
Notes to Consolidated Financial Statements
___________________
adjusted by a charge or credit to the statement of operations, if actual experience or other evidence suggests that earlier estimates should be revised.
Changes in deferred acquisition costs were as follows (dollars in millions):
|
| | | | | | | | | | | |
| | 2014 | | 2013 | | 2012 |
| Balance, beginning of year | $ | 968.1 |
| | $ | 629.7 |
| | $ | 797.1 |
|
| Additions | 242.8 |
| | 222.8 |
| | 191.7 |
|
| Amortization | (171.2 | ) | | (204.3 | ) | | (195.5 | ) |
| Effect of reinsurance transaction | 24.0 |
| | — |
| | — |
|
| Amounts related to CLIC prior to being sold | (37.6 | ) | | — |
| | — |
|
| Amounts related to fair value adjustment of fixed maturities, available for sale | (255.5 | ) | | 315.9 |
| | (163.6 | ) |
| Other | — |
| | 4.0 |
| | — |
|
| Balance, end of year | $ | 770.6 |
| | $ | 968.1 |
| | $ | 629.7 |
|
13. CONSOLIDATED STATEMENT OF CASH FLOWS
The following disclosures supplement our consolidated statement of cash flows.
The following reconciles net income to net cash provided by operating activities (dollars in millions):
|
| | | | | | | | | | | |
| | 2014 | | 2013 | | 2012 |
| Cash flows from operating activities: | | | | | |
| Net income | $ | 51.4 |
| | $ | 478.0 |
| | $ | 221.0 |
|
| Adjustments to reconcile net income to net cash from operating activities: | | | |
| | |
| Amortization and depreciation | 274.2 |
| | 324.6 |
| | 315.0 |
|
| Income taxes | 119.7 |
| | (181.2 | ) | | (71.8 | ) |
| Insurance liabilities | 398.2 |
| | 465.8 |
| | 330.0 |
|
| Accrual and amortization of investment income | (148.3 | ) | | (276.3 | ) | | (100.7 | ) |
| Deferral of policy acquisition costs | (242.8 | ) | | (222.8 | ) | | (191.7 | ) |
| Net realized investment gains | (36.7 | ) | | (33.6 | ) | | (81.1 | ) |
| Payment to reinsurer pursuant to long-term care business reinsured | (590.3 | ) | | — |
| | — |
|
| Net loss on sale of subsidiary and (gain) loss on reinsurance transactions | 239.8 |
| | 98.4 |
| | — |
|
| Loss on extinguishment or modification of debt | .6 |
| | 65.4 |
| | 200.2 |
|
| Other | 56.0 |
| | 2.1 |
| | 14.0 |
|
| Net cash from operating activities | $ | 121.8 |
| (a) | $ | 720.4 |
| | $ | 634.9 |
|
______________________
| |
| (a) | Cash flows from operating activities reflect outflows in the 2014 period due to the payment to reinsurer to transfer certain long-term care business. |
CNO FINANCIAL GROUP, INC. AND SUBSIDIARIES
Notes to Consolidated Financial Statements
___________________
On July 1, 2014, Bankers Life recaptured the life business written by Bankers Life that was reinsured by Wilton Re in 2009. The following summarizes the impact of the recapture (dollars in millions):
|
| | | | |
| Investments | $ | 139.4 |
| (a) (b) |
| Cash | 7.7 |
| |
| Present value of future profits and deferred acquisition costs | 29.0 |
| (b) |
| Reinsurance receivables | (155.9 | ) | (b) |
| Other liabilities | 5.9 |
| (b) |
| Gain on reinsurance transaction (classified as "Net loss on sale of subsidiary and (gain) loss on reinsurance transactions") | 26.1 |
| |
| Income tax expense | 9.2 |
| |
| Gain on reinsurance transaction (net of income taxes) | $ | 16.9 |
| |
___________________
(a) Such amount has been reduced by a $28.0 million recapture fee.
(b) Such non-cash amounts have been excluded from the consolidated statement of cash flows.
Other non-cash items not reflected in the financing activities section of the consolidated statement of cash flows (dollars in millions):
|
| | | | | | | | | | | |
| | 2014 | | 2013 | | 2012 |
| Stock options, restricted stock and performance units | $ | 15.6 |
| | $ | 15.1 |
| | $ | 13.7 |
|
14. STATUTORY INFORMATION (BASED ON NON-GAAP MEASURES)
Statutory accounting practices prescribed or permitted by regulatory authorities for the Company's insurance subsidiaries differ from GAAP. The Company's insurance subsidiaries reported the following amounts to regulatory agencies, after appropriate elimination of intercompany accounts among such subsidiaries (dollars in millions):
|
| | | | | | | |
| | 2014 | | 2013 |
| Statutory capital and surplus | $ | 1,664.4 |
| | $ | 1,711.9 |
|
| Asset valuation reserve | 203.1 |
| | 233.9 |
|
| Interest maintenance reserve | 504.1 |
| | 582.4 |
|
| Total | $ | 2,371.6 |
| | $ | 2,528.2 |
|
Statutory capital and surplus included investments in upstream affiliates of $42.6 million and $52.4 million at December 31, 2014 and 2013, respectively, which were eliminated in the consolidated financial statements prepared in accordance with GAAP.
Statutory earnings build the capital required by ratings agencies and regulators. Statutory earnings, fees and interest paid by the insurance companies to the parent company create the "cash flow capacity" the parent company needs to meet its obligations, including debt service. The consolidated statutory net income (a non-GAAP measure) of our insurance subsidiaries was $374.3 million, $386.5 million and $350.4 million in 2014, 2013 and 2012, respectively. Included in such net income were net realized capital gains (losses), net of income taxes, of $(18.2) million, $19.0 million and $13.0 million in 2014, 2013 and 2012, respectively. In addition, such net income included pre-tax amounts for fees and interest paid to CNO or its non-life subsidiaries totaling $157.5 million, $159.7 million and $155.3 million in 2014, 2013 and 2012, respectively.
Insurance regulators may prohibit the payment of dividends or other payments by our insurance subsidiaries to parent companies if they determine that such payment could be adverse to our policyholders or contract holders. Otherwise, the ability of our insurance subsidiaries to pay dividends is subject to state insurance department regulations. Insurance regulations generally permit dividends to be paid from statutory earned surplus of the insurance company without regulatory approval for
CNO FINANCIAL GROUP, INC. AND SUBSIDIARIES
Notes to Consolidated Financial Statements
___________________
any 12-month period in amounts equal to the greater of (or in a few states, the lesser of): (i) statutory net gain from operations or statutory net income for the prior year; or (ii) 10 percent of statutory capital and surplus as of the end of the preceding year. This type of dividend is referred to as an "ordinary dividend". Any dividend in excess of these levels requires the approval of the director or commissioner of the applicable state insurance department and is referred to as an "extraordinary dividend". During 2014, our insurance subsidiaries paid extraordinary dividends of $227.0 million to CDOC, Inc. ("CDOC") (our wholly owned subsidiary and the immediate parent of Washington National and Conseco Life Insurance Company of Texas). The holding companies made capital contributions to insurance subsidiaries totaling $53.0 million in 2014.
Each of the immediate insurance subsidiaries of CDOC had negative earned surplus at December 31, 2014. Accordingly, any dividend payments from these subsidiaries require the approval of the director or commissioner of the applicable state insurance department. The payment of interest on surplus debentures requires either prior written notice or approval of the director or commissioner of the applicable state insurance department. Dividends and other payments from our non-insurance subsidiaries to CNO or CDOC do not require approval by any regulatory authority or other third party.
In accordance with an order from the Florida Office of Insurance Regulation, Washington National may not distribute funds to any affiliate or shareholder, except pursuant to agreements that have been approved, without prior notice to the Florida Office of Insurance Regulation. In addition, the risk-based capital ("RBC") and other capital requirements described below can also limit, in certain circumstances, the ability of our insurance subsidiaries to pay dividends.
RBC requirements provide a tool for insurance regulators to determine the levels of statutory capital and surplus an insurer must maintain in relation to its insurance and investment risks and the need for possible regulatory attention. The RBC requirements provide four levels of regulatory attention, varying with the ratio of the insurance company's total adjusted capital (defined as the total of its statutory capital and surplus, asset valuation reserve and certain other adjustments) to its RBC (as measured on December 31 of each year) as follows: (i) if a company's total adjusted capital is less than 100 percent but greater than or equal to 75 percent of its RBC, the company must submit a comprehensive plan to the regulatory authority proposing corrective actions aimed at improving its capital position (the "Company Action Level"); (ii) if a company's total adjusted capital is less than 75 percent but greater than or equal to 50 percent of its RBC, the regulatory authority will perform a special examination of the company and issue an order specifying the corrective actions that must be taken; (iii) if a company's total adjusted capital is less than 50 percent but greater than or equal to 35 percent of its RBC, the regulatory authority may take any action it deems necessary, including placing the company under regulatory control; and (iv) if a company's total adjusted capital is less than 35 percent of its RBC, the regulatory authority must place the company under its control. In addition, the RBC requirements provide for a trend test if a company's total adjusted capital is between 100 percent and 150 percent of its RBC at the end of the year. The trend test calculates the greater of the decrease in the margin of total adjusted capital over RBC: (i) between the current year and the prior year; and (ii) for the average of the last 3 years. It assumes that such decrease could occur again in the coming year. Any company whose trended total adjusted capital is less than 95 percent of its RBC would trigger a requirement to submit a comprehensive plan as described above for the Company Action Level. The 2014 statutory annual statements of each of our insurance subsidiaries reflect total adjusted capital in excess of the levels subjecting the subsidiaries to any regulatory action.
In addition, although we are under no obligation to do so, we may elect to contribute additional capital or retain greater amounts of capital to strengthen the surplus of certain insurance subsidiaries. Any election to contribute or retain additional capital could impact the amounts our insurance subsidiaries pay as dividends to the holding company. The ability of our insurance subsidiaries to pay dividends is also impacted by various criteria established by rating agencies to maintain or receive higher ratings and by the capital levels that we target for our insurance subsidiaries.
At December 31, 2014, the consolidated RBC ratio of our insurance subsidiaries exceeded the minimum RBC requirement included in our Senior Secured Credit Agreement. See the note to the consolidated financial statements entitled "Notes Payable - Direct Corporate Obligations" for further discussion of various financial ratios and balances we are required to maintain. We calculate the consolidated RBC ratio by assuming all of the assets, liabilities, capital and surplus and other aspects of the business of our insurance subsidiaries are combined together in one insurance subsidiary, with appropriate intercompany eliminations.
CNO FINANCIAL GROUP, INC. AND SUBSIDIARIES
Notes to Consolidated Financial Statements
___________________
15. SALE OF SUBSIDIARY
On March 2, 2014, CNO entered into a Stock Purchase Agreement (the "Stock Purchase Agreement") with Wilton Re, pursuant to which CNO agreed to sell to Wilton Re all of the issued and outstanding shares of CLIC. The transaction closed on July 1, 2014, after the receipt of insurance regulatory approvals and satisfaction of other customary closing conditions. After adjustments for transaction costs and post-closing adjustments, the transaction resulted in net cash proceeds of $224.9 million, including the impact of intercompany transactions completed in connection with the closing. In the first quarter of 2014, we recognized an estimated loss on the sale of CLIC of $298 million, net of income taxes. In the third and fourth quarters of 2014, we recognized a reduction to the loss on the sale of CLIC of $6 million and $2.9 million, respectively, to reflect the determination of the final sales price and net proceeds.
The loss on the sale of CLIC in 2014, is summarized below (dollars in millions):
|
| | | | |
| Net cash proceeds | | $ | 224.9 |
|
| Net assets being sold: | | |
| Investments | | 3,863.8 |
|
| Cash and cash equivalents | | 164.7 |
|
| Accrued investment income | | 42.7 |
|
| Present value of future profits | | 15.5 |
|
| Deferred acquisition costs | | 37.6 |
|
| Reinsurance receivables | | 307.4 |
|
| Income tax assets, net | | 84.4 |
|
| Other assets | | 2.8 |
|
| Liabilities for insurance products | | (3,201.3 | ) |
| Other liabilities | | (199.1 | ) |
| Investment borrowings | | (383.4 | ) |
| Accumulated other comprehensive income | | (240.5 | ) |
| Net assets being sold | | 494.6 |
|
| Loss before taxes | | (269.7 | ) |
| Tax expense related to the sale | | 14.2 |
|
| Valuation allowance release related to the tax on the sale | | (14.2 | ) |
| Valuation allowance increase related to the decrease in projected future taxable income | | 19.4 |
|
| Net loss | | $ | (289.1 | ) |
Because the tax basis of CLIC is lower than the net cash proceeds, the transaction generated a taxable gain and estimated tax expense of $14.2 million. Fully offsetting the tax is $14.2 million of a valuation allowance release pertaining to NOLs which may now be utilized. However, the disposition of CLIC is expected to result in a net reduction to CNO's taxable income in future periods which also required us to establish a valuation allowance of $19.4 million.
In connection with the closing of the transaction, CNO Services, LLC ("CNO Services"), an indirect wholly owned subsidiary of CNO, entered into a transition services agreement and a special support services agreement with Wilton Re, pursuant to which CNO Services will make available to Wilton Re and its affiliates, for a limited period of time, certain services required for the operation of CLIC's business following the closing. Under such agreements, we will receive $30 million in the year ending June 30, 2015 and $20 million in the year ending June 30, 2016. In addition, certain services will continue to be provided in the three years ending June 30, 2019 for an annual fee of $.2 million. The costs of the services provided to Wilton Re are expected to approximate the fees received under the agreements.
The Stock Purchase Agreement also provided that, at the closing, Bankers Life, an indirect wholly owned subsidiary of CNO, recapture the life insurance business written by Bankers Life that was reinsured by Wilton Re. The recapture agreement
CNO FINANCIAL GROUP, INC. AND SUBSIDIARIES
Notes to Consolidated Financial Statements
___________________
was conditioned on the concurrent consummation of the closing. On July 1, 2014, Bankers Life paid $28.0 million to recapture the life insurance business from Wilton Re and recognized a gain (net of income taxes) of $16.9 million in the third quarter of 2014 as a result of the recapture. Refer to the note to the consolidated financial statements entitled "Consolidated Statement of Cash Flows" for additional information.
16. BUSINESS SEGMENTS
Prior to 2014, the Company managed its business through the following operating segments: Bankers Life, Washington National and Colonial Penn, which are defined on the basis of product distribution; Other CNO Business, comprised primarily of products we no longer sell actively; and corporate operations, comprised of holding company activities and certain noninsurance company businesses. As a result of the sale of CLIC which was completed on July 1, 2014 and the coinsurance agreements to cede certain long-term care business effective December 31, 2013 (as further described in the note to the consolidated financial statements entitled "Summary of Significant Accounting Policies - Reinsurance"), management has changed the manner in which it disaggregates the Company's operations for making operating decisions and assessing performance. In periods prior to 2014: (i) the results in the Washington National segment have been adjusted to include the results from the business in the Other CNO Business segment that are being retained; (ii) the Other CNO Business segment included only the long-term care business that was ceded effective December 31, 2013 and the overhead expense of CLIC that is expected to continue after the completion of the sale; and (iii) the CLIC business being sold is excluded from our analysis of business segment results. Beginning on January 1, 2014: (i) the overhead expense of CLIC that is expected to continue after the completion of the sale has been reallocated primarily to the Bankers Life and Washington National segments; (ii) there is no longer an Other CNO Business segment; and (iii) the CLIC business being sold continues to be excluded from our analysis of business segment results. After the completion of the sale of CLIC: (i) the Bankers Life segment includes the results of certain life insurance business that was recaptured from Wilton Re; and (ii) the revenues and expenses associated with a transition services agreement and a special support services agreement with Wilton Re are included in our non-operating earnings. Our prior period segment disclosures have been revised to reflect management's current view of the Company's operating segments.
Effective January 1, 2015, we changed our definition of pre-tax operating income to exclude the impact of fair market value changes related to the agent deferred compensation plan, since such impacts are not indicative of our ongoing business and trends in our business. Prior periods have been revised to conform to our current presentation. Pre-tax income is not impacted by this change.
We measure segment performance by excluding the net loss on the sale of CLIC and gain on reinsurance transactions, the earnings of CLIC prior to being sold on July 1, 2014, net realized investment gains (losses), fair value changes in embedded derivative liabilities (net of related amortization), fair value changes in the agent deferred compensation plan, loss on extinguishment or modification of debt, other non-operating items consisting primarily of equity in earnings of certain non-strategic investments and earnings attributable to VIEs and income taxes ("pre-tax operating earnings") because we believe that this performance measure is a better indicator of the ongoing business and trends in our business. Our primary investment focus is on investment income to support our liabilities for insurance products as opposed to the generation of net realized investment gains (losses), and a long-term focus is necessary to maintain profitability over the life of the business.
The net loss on the sale of CLIC and gain on reinsurance transactions, the earnings of CLIC prior to being sold, net realized investment gains (losses), fair value changes in embedded derivative liabilities (net of related amortization), fair value changes in the agent deferred compensation plan, loss on extinguishment or modification of debt and equity in earnings of certain non-strategic investments and earnings attributable to VIEs depend on market conditions or represent unusual items that do not necessarily relate to the underlying business of our segments. Net realized investment gains (losses) and fair value changes in embedded derivative liabilities (net of related amortization) may affect future earnings levels since our underlying business is long-term in nature and changes in our investment portfolio may impact our ability to earn the assumed interest rates needed to maintain the profitability of our business.
CNO FINANCIAL GROUP, INC. AND SUBSIDIARIES
Notes to Consolidated Financial Statements
___________________
Operating information by segment was as follows (dollars in millions):
|
| | | | | | | | | | | |
| | 2014 | | 2013 | | 2012 |
| Revenues: | | | | | |
| Bankers Life: | | | | | |
| Insurance policy income: | | | | | |
| Annuities | $ | 26.0 |
| | $ | 28.9 |
| | $ | 28.4 |
|
| Health | 1,287.1 |
| | 1,311.2 |
| | 1,342.7 |
|
| Life | 338.6 |
| | 308.6 |
| | 286.3 |
|
| Net investment income (a) | 957.3 |
| | 1,005.7 |
| | 838.9 |
|
| Fee revenue and other income (a) | 29.3 |
| | 19.0 |
| | 15.2 |
|
| Total Bankers Life revenues | 2,638.3 |
| | 2,673.4 |
| | 2,511.5 |
|
| Washington National: | |
| | |
| | |
| Insurance policy income: | |
| | |
| | |
| Annuities | 4.0 |
| | 11.4 |
| | 9.6 |
|
| Health | 597.6 |
| | 587.1 |
| | 575.9 |
|
| Life | 24.4 |
| | 23.0 |
| | 23.4 |
|
| Net investment income (a) | 276.1 |
| | 296.9 |
| | 289.2 |
|
| Fee revenue and other income (a) | 1.1 |
| | .9 |
| | 1.1 |
|
| Total Washington National revenues | 903.2 |
| | 919.3 |
| | 899.2 |
|
| Colonial Penn: | |
| | |
| | |
| Insurance policy income: | |
| | |
| | |
| Health | 3.6 |
| | 4.3 |
| | 5.2 |
|
| Life | 242.4 |
| | 227.8 |
| | 212.6 |
|
| Net investment income (a) | 41.7 |
| | 40.0 |
| | 40.4 |
|
| Fee revenue and other income (a) | 1.0 |
| | .8 |
| | .7 |
|
| Total Colonial Penn revenues | 288.7 |
| | 272.9 |
| | 258.9 |
|
| Other CNO Business: | |
| | |
| | |
| Insurance policy income - health | — |
| | 24.1 |
| | 25.6 |
|
| Net investment income (a) | — |
| | 33.3 |
| | 32.9 |
|
| Total Other CNO Business revenues | — |
| | 57.4 |
| | 58.5 |
|
| Corporate operations: | |
| | |
| | |
| Net investment income | 14.9 |
| | 39.8 |
| | 62.4 |
|
| Fee and other income | 6.7 |
| | 6.2 |
| | 2.8 |
|
| Total corporate revenues | 21.6 |
| | 46.0 |
| | 65.2 |
|
| Total revenues | 3,851.8 |
| | 3,969.0 |
| | 3,793.3 |
|
(continued on next page)
CNO FINANCIAL GROUP, INC. AND SUBSIDIARIES
Notes to Consolidated Financial Statements
___________________
(continued from previous page)
|
| | | | | | | | | | | |
| | 2014 | | 2013 | | 2012 |
| Expenses: | | | | | |
| Bankers Life: | | | | | |
| Insurance policy benefits | $ | 1,667.6 |
| | $ | 1,788.7 |
| | $ | 1,642.9 |
|
| Amortization | 174.7 |
| | 187.5 |
| | 187.6 |
|
| Interest expense on investment borrowings | 7.9 |
| | 6.7 |
| | 5.3 |
|
| Other operating costs and expenses | 401.2 |
| | 380.0 |
| | 374.8 |
|
| Total Bankers Life expenses | 2,251.4 |
| | 2,362.9 |
| | 2,210.6 |
|
| Washington National: | |
| | |
| | |
| Insurance policy benefits | 536.2 |
| | 541.4 |
| | 500.6 |
|
| Amortization | 64.6 |
| | 64.9 |
| | 64.9 |
|
| Interest expense on investment borrowings | 1.7 |
| | 1.9 |
| | 2.8 |
|
| Other operating costs and expenses | 189.5 |
| | 170.5 |
| | 182.1 |
|
| Total Washington National expenses | 792.0 |
| | 778.7 |
| | 750.4 |
|
| Colonial Penn: | |
| | |
| | |
| Insurance policy benefits | 173.2 |
| | 165.7 |
| | 161.1 |
|
| Amortization | 15.3 |
| | 14.5 |
| | 15.0 |
|
| Other operating costs and expenses | 99.4 |
| | 105.2 |
| | 91.4 |
|
| Total Colonial Penn expenses | 287.9 |
| | 285.4 |
| | 267.5 |
|
| Other CNO Business: | |
| | |
| | |
| Insurance policy benefits | — |
| | 59.2 |
| | 63.2 |
|
| Other operating costs and expenses | — |
| | 25.8 |
| | 25.0 |
|
| Total Other CNO Business expenses | — |
| | 85.0 |
| | 88.2 |
|
| Corporate operations: | |
| | |
| | |
| Interest expense on corporate debt | 43.9 |
| | 51.3 |
| | 66.2 |
|
| Interest expense on borrowings of variable interest entities | — |
| | .1 |
| | 20.0 |
|
| Interest expense on investment borrowings | .1 |
| | — |
| | .4 |
|
| Other operating costs and expenses | 49.1 |
| | 43.1 |
| | 55.1 |
|
| Total corporate expenses | 93.1 |
| | 94.5 |
| | 141.7 |
|
| Total expenses | 3,424.4 |
| | 3,606.5 |
| | 3,458.4 |
|
| Pre-tax operating earnings by segment: | |
| | |
| | |
| Bankers Life | 386.9 |
| | 310.5 |
| | 300.9 |
|
| Washington National | 111.2 |
| | 140.6 |
| | 148.8 |
|
| Colonial Penn | .8 |
| | (12.5 | ) | | (8.6 | ) |
| Other CNO Business | — |
| | (27.6 | ) | | (29.7 | ) |
| Corporate operations | (71.5 | ) | | (48.5 | ) | | (76.5 | ) |
| Pre-tax operating earnings | $ | 427.4 |
| | $ | 362.5 |
| | $ | 334.9 |
|
___________________
| |
| (a) | It is not practicable to provide additional components of revenue by product or services. |
CNO FINANCIAL GROUP, INC. AND SUBSIDIARIES
Notes to Consolidated Financial Statements
___________________
A reconciliation of segment revenues and expenses to consolidated revenues and expenses and net income is as follows (dollars in millions):
|
| | | | | | | | | | | |
| | 2014 | | 2013 | | 2012 |
| Total segment revenues | $ | 3,851.8 |
| | $ | 3,969.0 |
| | $ | 3,793.3 |
|
| Net realized investment gains | 33.9 |
| | 33.4 |
| | 81.1 |
|
| Revenues related to certain non-strategic investments and earnings attributable to VIEs | 33.2 |
| | 32.2 |
| | — |
|
| Fee revenue related to transition and support services agreements | 15.0 |
| | — |
| | — |
|
| Revenues of CLIC prior to being sold | 210.8 |
| | 441.5 |
| | 468.3 |
|
| Consolidated revenues | 4,144.7 |
| | 4,476.1 |
| | 4,342.7 |
|
| | | | | | |
| Total segment expenses | 3,424.4 |
| | 3,606.5 |
| | 3,458.4 |
|
| Insurance policy benefits - fair value changes in embedded derivative liabilities | 48.5 |
| | (54.4 | ) | | 4.4 |
|
| Amortization related to fair value changes in embedded derivative liabilities | (12.5 | ) | | 19.0 |
| | (1.6 | ) |
| Amortization related to net realized investment gains | 1.0 |
| | 1.6 |
| | 6.5 |
|
| Expenses related to certain non-strategic investments and earnings attributable to VIEs | 41.2 |
| | 42.4 |
| | — |
|
| Loss on extinguishment or modification of debt | .6 |
| | 65.4 |
| | 200.2 |
|
| Net loss on sale of subsidiary and (gain) loss on reinsurance transactions | 239.8 |
| | 98.4 |
| | — |
|
| Other operating costs and expenses - fair value changes related to agent deferred compensation plan | 26.8 |
| | (15.8 | ) | | 10.0 |
|
| Expenses related to transition and support services agreements | 12.4 |
| | — |
| | — |
|
| Expenses of CLIC prior to being sold | 187.4 |
| | 408.2 |
| | 509.1 |
|
| Consolidated expenses | 3,969.6 |
| | 4,171.3 |
| | 4,187.0 |
|
| Income before tax | 175.1 |
| | 304.8 |
| | 155.7 |
|
| Income tax expense: | | | | | |
| Tax expense on period income | 159.2 |
| | 128.3 |
| | 106.2 |
|
| Valuation allowance for deferred tax assets and other tax items | (35.5 | ) | | (301.5 | ) | | (171.5 | ) |
| Net income | $ | 51.4 |
| | $ | 478.0 |
| | $ | 221.0 |
|
CNO FINANCIAL GROUP, INC. AND SUBSIDIARIES
Notes to Consolidated Financial Statements
___________________
Segment balance sheet information was as follows (dollars in millions):
|
| | | | | | | |
| | 2014 | | 2013 |
| Assets: | | | |
| Bankers Life | $ | 19,303.0 |
| | $ | 18,230.2 |
|
| Washington National | 8,207.9 |
| | 8,204.8 |
|
| Colonial Penn | 945.3 |
| | 891.1 |
|
| Other CNO Business | — |
| | 607.4 |
|
| Business of CLIC being sold | — |
| | 4,326.8 |
|
| Corporate operations | 2,728.0 |
| | 2,520.3 |
|
| Total assets | $ | 31,184.2 |
| | $ | 34,780.6 |
|
| Liabilities: | | | |
| Bankers Life | $ | 16,697.5 |
| | $ | 15,866.4 |
|
| Washington National | 6,778.8 |
| | 6,834.3 |
|
| Colonial Penn | 802.2 |
| | 766.6 |
|
| Other CNO Business | — |
| | 597.6 |
|
| Business of CLIC being sold | — |
| | 3,764.5 |
|
| Corporate operations | 2,217.5 |
| | 1,996.0 |
|
| Total liabilities | $ | 26,496.0 |
| | $ | 29,825.4 |
|
The following table presents selected financial information of our segments (dollars in millions):
|
| | | | | | | | | | | |
| Segment | Present value of future profits | | Deferred acquisition costs | | Insurance liabilities |
| 2014 | | | | | |
| Bankers Life | $ | 128.4 |
| | $ | 456.6 |
| | $ | 15,308.9 |
|
| Washington National | 314.2 |
| | 240.2 |
| | 6,228.8 |
|
| Colonial Penn | 46.8 |
| | 73.8 |
| | 771.0 |
|
| Total | $ | 489.4 |
| | $ | 770.6 |
| | $ | 22,308.7 |
|
| 2013 | | | | | |
| Bankers Life | $ | 263.2 |
| | $ | 627.8 |
| | $ | 14,575.0 |
|
| Washington National | 344.3 |
| | 232.2 |
| | 5,664.1 |
|
| Colonial Penn | 55.7 |
| | 67.4 |
| | 766.2 |
|
| Other CNO Business | — |
| | — |
| | 597.5 |
|
| Business of CLIC prior to being sold | 16.1 |
| | 40.7 |
| | 3,273.0 |
|
| Total | $ | 679.3 |
| | $ | 968.1 |
| | $ | 24,875.8 |
|
CNO FINANCIAL GROUP, INC. AND SUBSIDIARIES
Notes to Consolidated Financial Statements
___________________
17. QUARTERLY FINANCIAL DATA (UNAUDITED)
We compute earnings per common share for each quarter independently of earnings per share for the year. The sum of the quarterly earnings per share may not equal the earnings per share for the year because of: (i) transactions affecting the weighted average number of shares outstanding in each quarter; and (ii) the uneven distribution of earnings during the year. Quarterly financial data (unaudited) were as follows (dollars in millions, except per share data):
|
| | | | | | | | | | | | | | | |
| 2014 | 1st Qtr. | | 2nd Qtr. | | 3rd Qtr. | | 4th Qtr. |
| Revenues | $ | 1,084.7 |
| | $ | 1,093.0 |
| | $ | 967.0 |
| | $ | 1,000.0 |
|
| Income (loss) before income taxes | $ | (169.6 | ) | | $ | 114.4 |
| | $ | 154.4 |
| | $ | 75.9 |
|
| Income tax expense (benefit) | 58.4 |
| | 36.3 |
| | 37.0 |
| | (8.0 | ) |
| Net income (loss) | $ | (228.0 | ) | | $ | 78.1 |
| | $ | 117.4 |
| | $ | 83.9 |
|
| Earnings per common share: | | | | | | | |
| Basic: | | | | | | | |
| Net income (loss) | $ | (1.03 | ) | | $ | .36 |
| | $ | .56 |
| | $ | .41 |
|
| Diluted: | | | | | | | |
| Net income (loss) | $ | (1.03 | ) | | $ | .35 |
| | $ | .54 |
| | $ | .41 |
|
| | | | | | | | |
| 2013 | 1st Qtr. | | 2nd Qtr. | | 3rd Qtr. | | 4th Qtr. |
| Revenues | $ | 1,142.6 |
| | $ | 1,081.5 |
| | $ | 1,093.8 |
| | $ | 1,158.2 |
|
| Income before income taxes | $ | 34.6 |
| | $ | 114.7 |
| | $ | 114.4 |
| | $ | 41.1 |
|
| Income tax expense (benefit) | 22.7 |
| | 37.6 |
| | (168.6 | ) | | (64.9 | ) |
| Net income | $ | 11.9 |
| | $ | 77.1 |
| | $ | 283.0 |
| | $ | 106.0 |
|
| Earnings per common share: | | | | | | | |
| Basic: | | | | | | | |
| Net income | $ | .05 |
| | $ | .35 |
| | $ | 1.27 |
| | $ | .48 |
|
| Diluted: | | | | | | | |
| Net income | $ | .05 |
| | $ | .34 |
| | $ | 1.23 |
| | $ | .47 |
|
18. INVESTMENTS IN VARIABLE INTEREST ENTITIES
We have concluded that we are the primary beneficiary with respect to certain VIEs, which are consolidated in our financial statements. In consolidating the VIEs, we consistently use the financial information most recently distributed to investors in the VIE, which in one case, is less than two months prior to the end of our reporting period.
All of the VIEs are collateralized loan trusts that were established to issue securities to finance the purchase of corporate loans and other permitted investments (including two new VIEs which were consolidated in 2014, one new VIE which was consolidated in 2013 and one new VIE which was consolidated in 2012). The assets held by the trusts are legally isolated and not available to the Company. The liabilities of the VIEs are expected to be satisfied from the cash flows generated by the underlying loans held by the trusts, not from the assets of the Company. The scheduled repayment of the remaining principal balance of the borrowings related to the VIEs are as follows: $35.4 million in 2015; $64.5 million in 2018; $492.0 million in 2022; $381.8 million in 2024; and $326.9 million in 2026. The Company has no further commitments to the VIEs.
Certain of our insurance subsidiaries are noteholders of the VIEs. Another subsidiary of the Company is the investment manager for the VIEs. As such, it has the power to direct the most significant activities of the VIEs which materially impacts the economic performance of the VIEs.
CNO FINANCIAL GROUP, INC. AND SUBSIDIARIES
Notes to Consolidated Financial Statements
___________________
The following table provides supplemental information about the assets and liabilities of the VIEs which have been consolidated (dollars in millions):
|
| | | | | | | | | | | |
| | December 31, 2014 |
| | VIEs | | Eliminations | | Net effect on consolidated balance sheet |
| Assets: | | | | | |
| Investments held by variable interest entities | $ | 1,367.1 |
| | $ | — |
| | $ | 1,367.1 |
|
| Notes receivable of VIEs held by insurance subsidiaries | — |
| | (153.3 | ) | | (153.3 | ) |
| Cash and cash equivalents held by variable interest entities | 68.3 |
| | — |
| | 68.3 |
|
| Accrued investment income | 3.2 |
| | — |
| | 3.2 |
|
| Income tax assets, net | 18.1 |
| | (2.9 | ) | | 15.2 |
|
| Other assets | 14.2 |
| | (1.7 | ) | | 12.5 |
|
| Total assets | $ | 1,470.9 |
| | $ | (157.9 | ) | | $ | 1,313.0 |
|
| Liabilities: | |
| | |
| | |
|
| Other liabilities | $ | 61.2 |
| | $ | (6.1 | ) | | $ | 55.1 |
|
| Borrowings related to variable interest entities | 1,286.1 |
| | — |
| | 1,286.1 |
|
| Notes payable of VIEs held by insurance subsidiaries | 157.3 |
| | (157.3 | ) | | — |
|
| Total liabilities | $ | 1,504.6 |
| | $ | (163.4 | ) | | $ | 1,341.2 |
|
|
| | | | | | | | | | | |
| | December 31, 2013 |
| | VIEs | | Eliminations | | Net effect on consolidated balance sheet |
| Assets: | | | | | |
| Investments held by variable interest entities | $ | 1,046.7 |
| | $ | — |
| | $ | 1,046.7 |
|
| Notes receivable of VIEs held by insurance subsidiaries | — |
| | (108.5 | ) | | (108.5 | ) |
| Cash and cash equivalents held by variable interest entities | 104.3 |
| | — |
| | 104.3 |
|
| Accrued investment income | 1.9 |
| | — |
| | 1.9 |
|
| Income tax assets, net | 5.4 |
| | (2.5 | ) | | 2.9 |
|
| Other assets | 22.6 |
| | (.9 | ) | | 21.7 |
|
| Total assets | $ | 1,180.9 |
| | $ | (111.9 | ) | | $ | 1,069.0 |
|
| Liabilities: | |
| | |
| | |
|
| Other liabilities | $ | 66.0 |
| | $ | (4.0 | ) | | $ | 62.0 |
|
| Borrowings related to variable interest entities | 1,012.3 |
| | — |
| | 1,012.3 |
|
| Notes payable of VIEs held by insurance subsidiaries | 112.5 |
| | (112.5 | ) | | — |
|
| Total liabilities | $ | 1,190.8 |
| | $ | (116.5 | ) | | $ | 1,074.3 |
|
CNO FINANCIAL GROUP, INC. AND SUBSIDIARIES
Notes to Consolidated Financial Statements
___________________
The following table provides supplemental information about the revenues and expenses of the VIEs which have been consolidated in accordance with authoritative guidance, after giving effect to the elimination of our investment in the VIEs and investment management fees earned by a subsidiary of the Company (dollars in millions):
|
| | | | | | | | | | | |
| | 2014 | | 2013 | | 2012 |
| Revenues: | | | | | |
| Net investment income – policyholder and reinsurer accounts and other special-purpose portfolios | $ | 47.2 |
| | $ | 42.3 |
| | $ | 31.3 |
|
| Fee revenue and other income | 1.1 |
| | 1.8 |
| | 1.6 |
|
| Total revenues | 48.3 |
| | 44.1 |
| | 32.9 |
|
| Expenses: | | | | | |
| Interest expense | 30.1 |
| | 26.0 |
| | 20.0 |
|
| Other operating expenses | 1.2 |
| | 1.4 |
| | .6 |
|
| Total expenses | 31.3 |
| | 27.4 |
| | 20.6 |
|
| Income before net realized investment losses and income taxes | 17.0 |
| | 16.7 |
| | 12.3 |
|
| Net realized investment losses | (2.2 | ) | | (1.6 | ) | | (.4 | ) |
| Income before income taxes | $ | 14.8 |
| | $ | 15.1 |
| | $ | 11.9 |
|
The investment portfolios held by the VIEs are primarily comprised of commercial bank loans to corporate obligors which are almost entirely rated below-investment grade. At December 31, 2014, such loans had an amortized cost of $1,398.1 million; gross unrealized gains of $.5 million; gross unrealized losses of $31.5 million; and an estimated fair value of $1,367.1 million.
The following table sets forth the amortized cost and estimated fair value of the investments held by the VIEs at December 31, 2014, by contractual maturity. Actual maturities will differ from contractual maturities because borrowers may have the right to call or prepay obligations with or without penalties.
|
| | | | | | | |
| | Amortized cost | | Estimated fair value |
| | (Dollars in millions) |
| Due after one year through five years | $ | 417.2 |
| | $ | 411.3 |
|
| Due after five years through ten years | 980.9 |
| | 955.8 |
|
| Total | $ | 1,398.1 |
| | $ | 1,367.1 |
|
The following table sets forth the amortized cost and estimated fair value of those investments held by the VIEs with unrealized losses at December 31, 2014, by contractual maturity. Actual maturities will differ from contractual maturities because borrowers may have the right to call or prepay obligations with or without penalties.
|
| | | | | | | |
| | Amortized cost | | Estimated fair value |
| | (Dollars in millions) |
| Due after one year through five years | $ | 382.3 |
| | $ | 376.3 |
|
| Due after five years through ten years | 869.8 |
| | 844.3 |
|
| Total | $ | 1,252.1 |
| | $ | 1,220.6 |
|
CNO FINANCIAL GROUP, INC. AND SUBSIDIARIES
Notes to Consolidated Financial Statements
___________________
During 2014, the VIEs recognized net realized investment losses of $2.2 million from the sales of fixed maturities. During 2013, the VIEs recognized net realized investment losses of $1.6 million, which were comprised of $.5 million of net losses from the sales of fixed maturities, and $1.1 million of writedowns of investments for other than temporary declines in fair value recognized through net income. During 2012, the VIEs recognized net realized investment losses of $.4 million, which were comprised of $.4 million of net gains from the sales of fixed maturities, and $.8 million of writedowns of investments for other than temporary declines in fair value recognized through net income.
At December 31, 2014, there were no investments held by the VIEs that were in default.
During 2014, $38.7 million of investments held by the VIEs were sold which resulted in gross investment losses (before income taxes) of $2.4 million. During 2013, $11.1 million of investments held by the VIEs were sold which resulted in gross investment losses (before income taxes) of $.9 million. During 2012, $34.9 million of investments held by the VIEs were sold which resulted in gross investment losses (before income taxes) of $.3 million.
At December 31, 2014, the VIEs held: (i) investments with a fair value of $1,053.2 million and gross unrealized losses of $27.3 million that had been in an unrealized loss position for less than twelve months; and (ii) investments with a fair value of $167.4 million and gross unrealized losses of $4.2 million that had been in an unrealized loss position for greater than twelve months.
At December 31, 2013, the VIEs held: (i) investments with a fair value of $355.5 million and gross unrealized losses of $3.1 million that had been in an unrealized loss position for less than twelve months; and (ii) investments with a fair value of $7.9 million and gross unrealized losses of less than $.1 million that had been in an unrealized loss position for greater than twelve months.
The investments held by the VIEs are evaluated for other-than-temporary declines in fair value in a manner that is consistent with the Company's fixed maturities, available for sale.
In addition, the Company, in the normal course of business, makes passive investments in structured securities issued by VIEs for which the Company is not the investment manager. These structured securities include asset-backed securities, collateralized debt obligations, commercial mortgage-backed securities, residential mortgage-backed securities and collateralized mortgage obligations. Our maximum exposure to loss on these securities is limited to our cost basis in the investment. We have determined that we are not the primary beneficiary of these structured securities due to the relative size of our investment in comparison to the total principal amount of the individual structured securities and the level of credit subordination which reduces our obligation to absorb gains or losses.
At December 31, 2014, we held investments in various limited partnerships, in which we are not the primary beneficiary, totaling $36.3 million (classified as other invested assets). At December 31, 2014, we had unfunded commitments to these partnerships of $81.8 million. Our maximum exposure to loss on these investments is limited to the amount of our investment.
19. SUBSEQUENT EVENT
On February 10, 2015, we announced that we have entered into a comprehensive agreement with Cognizant forming a strategic partnership for technology delivery that is expected to accelerate our core IT process improvements and enable more rapid innovation. Under the agreement, Cognizant will, after the transition period, assume CNO’s application development, maintenance, and testing functions as well as select IT infrastructure operations. Cognizant will also take over all CNO operations located in Hyderabad, India. The partnership will result in the movement of approximately 640 IT positions from CNO to Cognizant, roughly 240 of which are U.S.-based.