
UNITED STATES
SECURITIES AND EXCHANGE COMMISSION
Washington, D.C. 20549
FORMN-CSRS
CERTIFIED SHAREHOLDER REPORT OF REGISTERED
MANAGEMENT INVESTMENT COMPANIES
Investment Company Act file number:811-21331
Wells Fargo Multi-Sector Income Fund
(Exact name of registrant as specified in charter)
525 Market St., San Francisco, CA 94105
(Address of principal executive offices) (Zip code)
Alexander Kymn
Wells Fargo Funds Management, LLC
525 Market St., San Francisco, CA 94105
(Name and address of agent for service)
Registrant’s telephone number, including area code:800-222-8222
Date of fiscal year end: October 31
Date of reporting period: April 30, 2019
| ITEM 1. | REPORT TO STOCKHOLDERS |
Semi-Annual Report
April 30, 2019

Wells Fargo Multi-Sector Income Fund (ERC)

Beginning on January 1, 2021, as permitted by new regulations adopted by the Securities and Exchange Commission, paper copies of the Wells Fargo Funds’ annual and semi-annual shareholder reports issued after this date will no longer be sent by mail, unless you specifically request paper copies of the reports. Instead, the reports will be made available on the Funds’ website, and you will be notified by mail each time a report is posted and provided with a website address to access the report.
If you already elected to receive shareholder reports electronically, you will not be affected by this change and you need not take any action. You may elect to receive shareholder reports and other communications from the Fund electronically at any time by contacting your financial intermediary (such as a broker-dealer or bank) or, if you are a direct investor, by calling 1-800-730-6001.
You may elect to receive all future reports in paper free of charge. If you invest through a financial intermediary, you can contact your financial intermediary to request that you continue to receive paper copies of your shareholder reports; if you invest directly with the Fund, you can call 1-800-730-6001. Your election to receive reports in paper will apply to all Wells Fargo Funds held in your account with your financial intermediary or, if you are a direct investor, to all Wells Fargo Funds that you hold.

Reduce clutter. Save trees.
Sign up for electronic delivery of prospectuses and shareholder reports atwellsfargo.com/advantagedelivery
Contents
The views expressed and any forward-looking statements are as of April 30, 2019, unless otherwise noted, and are those of the Fund managers and/or Wells Fargo Asset Management. Discussions of individual securities, or the markets generally, or any Wells Fargo Fund are not intended as individual recommendations. Future events or results may vary significantly from those expressed in any forward-looking statements. The views expressed are subject to change at any time in response to changing circumstances in the market. Wells Fargo Asset Management and the Fund disclaim any obligation to publicly update or revise any views expressed or forward-looking statements.
INVESTMENT PRODUCTS: NOT FDIC INSURED ◾ NO BANK GUARANTEE ◾ MAY LOSE VALUE
| | | | |
| 2 | | Wells Fargo Multi-Sector Income Fund | | Letter to shareholders (unaudited) |

Andrew Owen
President
Wells Fargo Funds
December’s S&P 500 Index performance was the worst since 1931.
Dear Shareholder:
We are pleased to offer you this semi-annual report for the Wells Fargo Multi-Sector Income Fund for the six-month period that ended April 30, 2019. In late 2018, investor concerns about U.S. interest rate policy, trade tensions, and geopolitical events drove equity losses and restrained bond returns. Thanks to a shift in U.S. Federal Reserve (Fed) policy and positive economic and business growth metrics during the first four months of 2019, stock and bond markets globally enjoyed a consistent move higher.
For the period, U.S. stocks, as measured by the S&P 500 Index,1 gained 9.76% and international stocks, as measured by the MSCI ACWI ex USA Index (Net),2 added 9.12%. Based on the MSCI EM Index (Net)3, emerging market stocks added 13.76%. For bond investors, the Bloomberg Barclays U.S. Aggregate Bond Index4 added 5.49% while the Bloomberg Barclays Global Aggregate ex-USD Index5 added 3.25%. The Bloomberg Barclays Municipal Bond Index6 added 5.68%, and the ICE BofAML U.S. High Yield Index7 gained 5.55%.
Conflicting data unsettled markets as 2018 ended.
November’s U.S. midterm elections shifted control of the House of Representatives from Republicans to Democrats, presaging potential partisan clashes. Third-quarter U.S. gross domestic product (GDP) was announced at an annualized 3.4% rate, lower than the second-quarter rate. Brexit efforts stalled ahead of the March 2019 deadline. The People’s Bank of China cut reserve requirement ratios, accelerated infrastructure spending, and cut taxes even as the value of the yuan declined to low levels last seen in 2008.
December’s S&P 500 Index performance was the worst since 1931. Globally, fixed-income investments fared better than stocks during the last two months of the year. The Fed increased the federal funds rate by 25 basis points (100 basis points equal 1.00%) in December 2018 to a target range of between 2.25% and 2.50% and softened its outlook for 2019 rate increases.
| 1 | The S&P 500 Index consists of 500 stocks chosen for market size, liquidity, and industry group representation. It is a market-value-weighted index with each stock’s weight in the index proportionate to its market value. You cannot invest directly in an index. |
| 2 | The Morgan Stanley Capital International (MSCI) All Country World Index (ACWI) ex USA Index (Net) is a free-float-adjusted market-capitalization-weighted index that is designed to measure the equity market performance of developed markets, excluding the United States and Canada. Source: MSCI. MSCI makes no express or implied warranties or representations and shall have no liability whatsoever with respect to any MSCI data contained herein. The MSCI data may not be further redistributed or used as a basis for other indices or any securities or financial products. This report is not approved, reviewed, or produced by MSCI. You cannot invest directly in an index. |
| 3 | The MSCI Emerging Markets (EM) Index (Net) is a free-float-adjusted market-capitalization-weighted index that is designed to measure large- and mid-cap equity market performance of emerging markets. The MSCI EM Index (Net) consists of the following 24 emerging market country indices: Brazil, Chile, China, Colombia, Czech Republic, Egypt, Greece, Hungary, India, Indonesia, Korea, Malaysia, Mexico, Pakistan, Peru, the Philippines, Poland, Qatar, Russia, South Africa, Taiwan, Thailand, Turkey, and the United Arab Emirates. You cannot invest directly in an index. |
| 4 | The Bloomberg Barclays U.S. Aggregate Bond Index is a broad-based benchmark that measures the investment-grade, U.S. dollar-denominated, fixed-rate taxable bond market, including Treasuries, government-related and corporate securities, mortgage-backed securities (agency fixed-rate and hybrid adjustable-rate mortgage pass-throughs), asset-backed securities, and commercial mortgage-backed securities. You cannot invest directly in an index. |
| 5 | The Bloomberg Barclays Global Aggregate ex-USD Index is an unmanaged index that provides a broad-based measure of the global investment-grade fixed-income markets excluding the U.S. dollar-denominated debt market. You cannot invest directly in an index. |
| 6 | The Bloomberg Barclays Municipal Bond Index is an unmanaged index composed of long-term tax-exempt bonds with a minimum credit rating of Baa. You cannot invest directly in an index. |
| 7 | The ICE BofAML U.S. High Yield Index is a market-capitalization-weighted index of domestic and Yankee high-yield bonds. The index tracks the performance of high-yield securities traded in the U.S. bond market. You cannot invest directly in an index. Copyright 2019. ICE Data Indices, LLC. All rights reserved. |
| | | | | | |
| Letter to shareholders (unaudited) | | Wells Fargo Multi-Sector Income Fund | | | 3 | |
The market climbs a wall of worry.
Investors entered 2019 with reasons to be concerned. A partial U.S. government shutdown driven by partisan spending and immigration policy disputes extended into January 2019. Investors expected high levels of stock market volatility to continue based on the VIX8.
January’s returns tended to support the investing adage that markets climb a wall of worry. The S&P 500 Index gained 8.01% for the month that ended January 31, 2019, its best monthly performance in 30 years. Returns for the MSCI ACWI ex USA Index (Net), the Bloomberg Barclays U.S. Aggregate Bond Index, and the Bloomberg Barclays Global Aggregate ex-USD Index also were positive. The Fed indicated that it would pause its program of regular rate increases during 2019 as inflation remained low.
In February 2019, concerns over slowing global growth reemerged. The Bureau of Economic Analysis announced fourth-quarter 2018 GDP grew at an annualized 2.2% rate, down from the 4.2% annualized rate for the second quarter and the 3.4% annualized rate for the third quarter. Analysts attributed the lower growth rate to a slowing housing market and larger trade deficit. The U.S. Department of Labor said that the economy created just 20,000 jobs in February 2019. In a February 2019 report, the Bank of England forecast the slowest growth since the financial crisis for 2019. China and the U.S., while putting future tariffs on hold for the time being, continued to wrangle over trade issues.
By the end of March 2019, the combination of dovish Fed sentiment and consistent, if not spectacular, economic and business metrics reinforced investors’ enthusiasm for equity investing. Monthly job creation data regained its momentum. Corporate profits, while lower than 2018’s lofty levels, were still solid. China announced a roughly $300 billion stimulus package through tax and fee cuts intended to reinvigorate economic growth.
During April 2019, the several broad-based U.S. equity indices reached or approached highs as investors drew confidence from favorable economic projections, sustained low inflation, and solid employment data. As expected, the Fed chose not to increase rates at its April 2019 meeting. The initial estimate of the first-quarter GDP showed the economy grew at an annualized rate of 3.20%, reflecting growth in business investment and exports. The favorable sentiment appeared to extend to investors’ outlooks for foreign investments as the MSCI ACWI ex USA Index (Net) gained 2.64% and the MSCI EM Index (Net) added 2.11%.
Don’t let short-term uncertainty derail long-term investment goals.
Periods of investment uncertainty can present challenges, but experience has taught us that maintaining long-term investment goals can be an effective way to plan for the future. Although diversification cannot guarantee an investment profit or prevent losses, we believe it can be an effective way to manage investment risk and potentially smooth out overall portfolio performance. We encourage investors to know their investments and to understand that appropriate levels of risk-taking may unlock opportunities.
January’s returns tended to support the investing adage that markets climb a wall of worry.
| 8 | The Chicago Board Options Exchange Market Volatility Index (VIX) is a popular measure of the implied volatility of S&P 500 Index options. It represents one measure of the market’s expectation of stock market volatility over the next 30-day period. You cannot invest directly in an index. |
| | | | |
| 4 | | Wells Fargo Multi-Sector Income Fund | | Letter to shareholders (unaudited) |
Thank you for choosing to invest with Wells Fargo Funds. We appreciate your confidence in us and remain committed to helping you meet your financial needs.
Sincerely,

Andrew Owen
President
Wells Fargo Funds
Notice to shareholders
On November 9, 2018, the Fund announced an extension of its open-market share repurchase program (the “Buyback Program”). Under the extended Buyback Program, the Fund may repurchase up to 10% of its outstanding shares during the period in open-market transactions beginning on January 1, 2019 and ending on December 31, 2019. The Fund’s Board of Trustees has delegated to Wells Fargo Funds Management, LLC, the Fund’s adviser, discretion to administer the Buyback Program including the determination of the amount and timing of repurchases in accordance with the best interests of the Fund and subject to applicable legal limitations.
The Fund’s managed distribution plan provides for the declaration of monthly distributions to common shareholders of the Fund at an annual minimum fixed rate of 9% based on the Fund’s average monthly NAV per share over the prior 12 months. Under the managed distribution plan, monthly distributions may be sourced from income, paid-in capital, and/or capital gains, if any. To the extent that sufficient investment income is not available on a monthly basis, the Fund may distribute paid-in capital and/or capital gains, if any, in order to maintain its managed distribution level. You should not draw any conclusions about the Fund’s investment performance from the amount of the Fund’s distributions or from the terms of the managed distribution plan. Shareholders may elect to reinvest distributions received pursuant to the managed distribution plan in the Fund under the existing dividend reinvestment plan, which is described later in this report.
For further information about your Fund, contact your investment professional, visit our website atwfam.com, or call us directly at1-800-222-8222.
This page is intentionally left blank.
| | | | |
| 6 | | Wells Fargo Multi-Sector Income Fund | | Performance highlights (unaudited) |
Investment objective
The Fund seeks a high level of current income consistent with limiting its overall exposure to domestic interest rate risk.
Strategy summary
The Fund allocates its assets between three separate investment strategies, or sleeves. Under normal market conditions, the Fund will allocate approximately 30%-70% of its total assets to a sleeve consisting of non-investment-grade (high yield) corporate debt, including floating-rate high yield bank loan securities; approximately 10%-40% to a sleeve of foreign debt securities, including emerging market debt; and approximately 10%-30% to a sleeve of adjustable-rate and fixed-rate mortgage-backed securities, and investment grade corporate bonds.
Adviser
Wells Fargo Funds Management, LLC
Subadvisers
Wells Capital Management Incorporated
Wells Fargo Asset Management (International), LLC
Portfolio managers
Christopher Y. Kauffman, CFA®‡
Michael Lee
Niklas Nordenfelt, CFA®‡
Alex Perrin
Phillip Susser
Lauren van Biljon, CFA®‡
Peter Wilson
Noah Wise, CFA®‡
Average annual total returns (%) as of April 30, 20191
| | | | | | | | | | | | | | | | |
| | | 6 months | | | 1 year | | | 5 year | | | 10 year | |
Based on market value | | | 12.73 | | | | 5.97 | | | | 6.05 | | | | 10.53 | |
Based on net asset value (NAV) | | | 6.88 | | | | 5.61 | | | | 5.28 | | | | 9.48 | |
Multi-Sector Income Blended Index2 | | | 5.80 | | | | 3.83 | | | | 3.21 | | | | 6.56 | |
ICE BofAML U.S. Cash Pay High Yield Index3 | | | 5.58 | | | | 6.74 | | | | 4.83 | | | | 10.09 | |
J.P. Morgan GBI-EM Global Diversified Composite Index4 | | | 7.00 | | | | -4.93 | | | | -0.97 | | | | 3.52 | |
Bloomberg Barclays Credit Bond Index5 | | | 6.90 | | | | 6.38 | | | | 3.46 | | | | 5.98 | |
Bloomberg Barclays U.S. Securitized Index6 | | | 4.92 | | | | 4.97 | | | | 2.46 | | | | 3.38 | |
J.P. Morgan Global Government Index (ex U.S.)7 | | | 3.70 | | | | -2.68 | | | | -0.34 | | | | 2.04 | |
Figures quoted represent past performance, which is no guarantee of future results, and do not reflect taxes that a shareholder may pay on fund distributions or the sales of fund shares. Investment return and principal value of an investment will fluctuate so that an investor’s shares, when sold, may be worth more or less than their original cost. Current performance may be lower or higher than the performance data quoted, which assumes the reinvestment of dividends and capital gains. Performance figures of the Fund do not reflect brokerage commissions that a shareholder would pay on the purchase and sale of shares. If taxes and such brokerage commissions had been reflected, performance would have been lower. To obtain performance information current to the most recent month-end, please call 1-800-222-8222.
The Fund’s annualized expense ratio for the six months ended April 30, 2019, was 2.32% which includes 1.35% of interest expense.
|
| Comparison of NAV vs. market value8 |
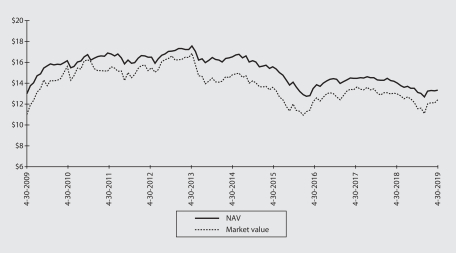
The Fund is leveraged through a revolving credit facility and also may incur leverage by issuing preferred shares in the future. The use of leverage results in certain risks, including, among others, the likelihood of greater volatility of net asset value and the market value of common shares. Foreign investments are especially volatile and can rise or fall dramatically due to differences in the political and economic conditions of the host country. These risks are generally intensified in emerging markets. Derivatives involve additional risks, including interest rate risk, credit risk, the risk of improper valuation, and the risk of noncorrelation to the relevant instruments that they are designed to hedge or closely track. Bond values fluctuate in response to the financial condition of individual issuers, general market and economic conditions, and changes in interest rates. Changes in market conditions and government policies may lead to periods of heightened volatility in the bond market and reduced liquidity for certain bonds held by the Fund. In general, when interest rates rise, bond values fall and investors may lose principal value. Interest rate changes and their impact on the Fund and its share price can be sudden and unpredictable. High-yield securities have a greater risk of default and tend to be more volatile than higher-rated debt securities. The Fund is exposed to mortgage- and asset-backed securities risk. This closed-end fund is no longer available as an initial public offering and is only offered through broker-dealers on the secondary market. A closed-end fund is not required to buy its shares back from investors upon request.
Please see footnotes on page 7.
| | | | | | |
| Performance highlights (unaudited) | | Wells Fargo Multi-Sector Income Fund | | | 7 | |
MANAGERS’ DISCUSSION
The Fund’s return based on market value was 12.73% for the six-month period that ended April 30, 2019. During the same period, the Fund’s return based on its net asset value (NAV) was 6.88%. On the basis of increases in the market value and NAV of its shares, the Fund outperformed the Multi-Sector Income Blended Index, which gained 5.80% over the same period.
A fairly consistent economic environment was the backdrop for fixed-income markets during the period.
For the six-month period that ended April 30, 2019, U.S. investment-grade corporate bonds, as measured by the Bloomberg Barclays U.S. Corporate Bond Index9, outperformed U.S. Treasury bonds of similar duration by approximately 147 basis points (bps; 100 bps equal 1.00%). Negative performance from November and December 2018 was more than offset by spread tightening seen in in the first four months of 2019 as the U.S. Federal Reserve (Fed) pivoted to a more dovish stance. Securitized sectors, as measured by the Bloomberg Barclays U.S. Securitized Index, also outperformed U.S. Treasuries of similar duration, with an excess return of approximately 16 bps. Outperformance was driven by the non-agency commercial mortgage-backed securities (CMBS) sector. The CMBS sector generated 188 bps of excess return compared with Treasuries of similar duration in 2019 through April 30, which more than compensated for 93 bps of negative excess return in November and December of 2018. Asset-backed securities (ABS) and private-label collateralized mortgage obligations also outperformed Treasuries over the most recent six-month period, with performance in 2019 through April 30 more than making up for the underperformance experienced in November and December of 2018. In general, lower-rated segments of these sectors posted larger positive excess returns when compared with bonds in the sectors that were rated AAA.
During the period, high-yield investing was supported by solid and consistent gross domestic product (GDP) growth, lack of aggressive issuance over the past several years, and the tail winds from tax reform in the U.S. high-yield spreads over Treasuries narrowed during the six-month period, offsetting a rise in interest rates. Over the six-month period, lower-quality bonds outperformed higher-rated issues—not unusual in the latter stages of an economic cycle when interest rates begin to rise.
The reporting period was a positive one for emerging markets, coinciding with a sharp move lower in U.S. bond yields. Weaker macroeconomic data prompted dovish turns from central banks in core developed markets, which supported higher-yielding markets and moved yields lower. Currencies were mixed versus the U.S. dollar, with strong gains in some (Mexican peso, Indonesian rupiah) contrasting with material weakness in others (Argentine peso, Turkish lira). The Fund maintained its tilt toward higher-yielding emerging markets over the reporting period. At a regional level, this is expressed by heavier weights in Asia and Latin America. Exposure to Indonesia was increased, and country duration was lengthened. After a period of strong gains, the Fund took profits on long-dated bonds from Mexico and New Zealand. In Mexico, holdings of a bond maturing in 2046 were switched to a bond maturing in 2029. In New Zealand, overall exposure was reduced by 2.3% alongside the switch from a bond maturing in 2037 to one maturing in 2029.
| | |
| Ten largest holdings (%) as of April 30, 201910 |
Malaysia, 4.23%, 6-30-2031 | | 3.07 |
Mexico, 8.50%, 5-31-2029 | | 2.64 |
Indonesia, 8.38%, 9-15-2026 | | 1.98 |
LPL Holdings Incorporated, 5.75%, 9-15-2025 | | 1.87 |
Colombia, 7.50%, 8-26-2026 | | 1.83 |
Indonesia, 8.25%, 5-15-2029 | | 1.57 |
India, 7.80%, 4-11-2021 | | 1.56 |
India, 7.16%, 5-20-2023 | | 1.48 |
NGPL PipeCo LLC, 7.77%, 12-15-2037 | | 1.44 |
Ancestry.com Incorporated, 5.74%, 10-19-2023 | | 1.44 |
Contributors to performance included securitized sectors, high-yield bond security selection, and selected countries.
Within the mortgage and corporate sleeve of the Fund, an overweight to corporate sectors generally was the largest contributor. Securitized holdings generally added value during the period with CMBS, ABS, and non-agency residential mortgage-backed securities (RMBS) the largest contributors. Agency mortgage-backed securities (MBS) contributed modestly.
Within the Fund’s high-yield portfolio sleeve, industry allocation was net positive over the period, led largely by allocations to energy, offset by negative selection. Outperformance within packaging and underweights to and positive selection within wirelines and metals/mining were the largest contributors. Ratings allocation benefited performance modestly, primarily from an underweight to bonds rated CCC.
Please see footnotes on page 7.
| | | | |
| 8 | | Wells Fargo Multi-Sector Income Fund | | Performance highlights (unaudited) |
|
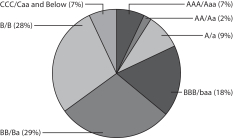
| Credit quality as of April 30, 201911 |
|
 |
Within the Fund’s allocation to international and emerging market bonds, exposure to the bond markets of India, Indonesia, and Brazil added the most value. At the currency level, several emerging market currencies made ground against the U.S. dollar over the reporting period. The Mexican peso, Indonesian rupiah, and Indian rupee performed particularly well.
Selected securities, sector allocations, and the strength of the U.S. dollar restrained performance.
The Fund’s mortgage/corporate credit sleeve holdings in certain residential MBS and CMBS positions modestly detracted from performance during the period due to security-specific prepayment and ratings changes.
The main detractors from Fund performance in the high-yield sleeve were selection and holdings in oil-field services, technology, health care, transportation services, and media/entertainment. Maturity allocations had little impact on performance over the period.
Within international and emerging market bonds, the Brazilian real traded with a weakening bias over the reporting period, and the Fund’s exposure thus detracted from overall performance. The holding of Malaysian government bonds was also a negative.
The management teams of the Fund’s portfolio sleeves have favorable market outlooks but remain risk-aware.
The Fund’s mortgage and corporate bond sleeve viewed credit fundamentals as relatively stable during the period as gross leverage and interest coverage were flat on a year-over-year basis while revenues and cash flow continued to grow. Profit margins remained near their recent highs. The demand/supply balance was generally favorable for the sector in the first quarter as issuance was a bit lower than year-ago levels while demand picked up from both foreign buyers and retail investors. From a valuation perspective, spread levels at quarter-end presented reasonably attractive carry—the incremental income generated by a bond when compared with Treasuries of comparable maturity—but not much potential for additional tightening in the view of the team. Consequently, the team anticipates targeting a neutral to modestly overweight position in the sector, with a bias toward mid- to high-BBB issues. Team members continue to believe that financials are attractive relative to industrials, though they see opportunities in select BBB-rated industrial names. Within securitized sectors, the team is focused on shorter-duration cash flows in the senior part of the capital structure as credit fundamentals remain stable. Approximately 64% of the mortgage/corporate bond sleeve exposure is in corporate credit and around 33% is in fixed-rate and floating-rate mortgage securities. The largest industry exposures in the credit sector include banks, media and entertainment, and technology companies.
The high-yield team believes economic fundamentals are on solid footing, with a healthy consumer offset by softness among cyclical areas of the economy. The initial first-quarter 2019 GDP report was above expectations with an annualized growth rate of 3.2%. Looking through the GDP data, the growth dynamics were less strong as a significant portion of the growth came from a build in inventories and a likely temporary decline in imports. Nonetheless, consumer spending is showing strong momentum, capital spending plans have recovered, and the most recent employment report improved confidence that the shock from the equity sell-off in late 2018 is wearing off. Furthermore, the decline in Treasury rates and the Fed’s signal of being on hold as opposed to raising rates in 2019 should improve home and auto sales or, at a minimum, stabilize the decline that those areas have been experiencing. Such conditions should be a positive backdrop for credit in an environment of relatively low and stable rates with solid but not overly strong economic growth or material inflationary pressure. A material slowdown in Europe and/or an escalation in the U.S.-China trade war pose possibly the most visible risks to the U.S. economy currently.
In the view of the team managing the Fund’s international and emerging market bond sleeve, tepid global growth and muted inflationary pressures provide a constructive backdrop for sovereign bond investing, and there have been good inflows into emerging markets so far in 2019. Trade tensions and geopolitical noise pose a risk, however, and have the potential to damage sentiment. Increased selectivity is key for the quarters ahead.
Please see footnotes on page 7.
| | | | | | |
| Performance highlights (unaudited) | | Wells Fargo Multi-Sector Income Fund | | | 9 | |
|
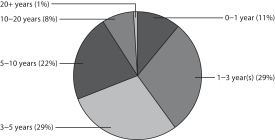
| Effective maturity distribution as of April 30, 201912 |
|
|
|
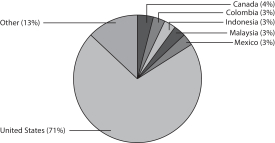
| Country allocation as of April 30, 201912 |
|
 |
| ‡ | CFA® and Chartered Financial Analyst® are trademarks owned by CFA Institute. |
| 1 | Total returns based on market value are calculated assuming a purchase of common stock on the first day and sale on the last day of the period reported. Total returns based on NAV are calculated based on the NAV at the beginning of the period and end of the period. Dividends and distributions, if any, are assumed for the purposes of these calculations to be reinvested at prices obtained under the Fund’s Automatic Dividend Reinvestment Plan. |
| 2 | Source: Wells Fargo Funds Management, LLC. The Multi-Sector Income Blended Index is composed of 60% ICE BofAML U.S. Cash Pay High Yield Index, 18% J.P. Morgan GBI-EM Global Diversified Composite Index, 7.5% Bloomberg Barclays Credit Bond Index, 7.5% Bloomberg Barclays U.S. Securitized Index, and 7% J.P. Morgan Global Government Bond Index (ex U.S.). |
| 3 | The ICE BofAML U.S. Cash Pay High Yield Index tracks the performance of U.S. dollar-denominated below investment grade corporate debt, currently in a coupon paying period, that is publicly issued in the U.S. domestic market. You cannot invest directly in an index. Copyright 2019. ICE Data Indices, LLC. All rights reserved. |
| 4 | The J.P. Morgan GBI-EM Global Diversified Composite Index is an unmanaged index of debt instruments of 31 emerging countries. You cannot invest directly in an index. |
| 5 | The Bloomberg Barclays Credit Bond Index is an unmanaged index of fixed income securities composed of securities from the Bloomberg Barclays Government/Corporate Bond Index, Mortgage-Backed Securities Index, and the Asset- Backed Securities Index. You cannot invest directly in an index. |
| 6 | The Bloomberg Barclays U.S. Securitized Index is an unmanaged composite of asset-backed securities, collateralized mortgage-backed securities (ERISA-eligible), and fixed-rate mortgage-backed securities. You cannot invest directly in an index. |
| 7 | The J.P. Morgan Global Government Bond Index (ex U.S.) measures the total return from investing in 12 developed government bond markets: Australia, Belgium, Canada, Denmark, France, Germany, Italy, Japan, the Netherlands, Spain, Sweden, and the U.K. You cannot invest directly in an index. |
| 8 | This chart does not reflect any brokerage commissions charged on the purchase and sale of the Fund’s common stock. Dividends and distributions paid by the Fund are included in the Fund’s average annual total returns but have the effect of reducing the Fund’s NAV. |
| 9 | The Bloomberg Barclays U.S. Corporate Bond Index is an unmanaged market-value-weighted index of investment-grade corporate fixed-rate debt issues with maturities of one year or more. You cannot invest directly in an index. |
| 10 | The ten largest holdings, excluding cash, cash equivalents and any money market funds, are calculated based on the value of the investments divided by total net assets of the Fund. Holdings are subject to change and may have changed since the date specified. |
| 11 | The credit quality distribution of portfolio holdings reflected in the chart is based on ratings from Standard & Poor’s, Moody’s Investors Service, and/or Fitch Ratings Ltd. Credit quality ratings apply to the underlying holdings of the Fund and not to the Fund itself. The percentages of the Fund’s portfolio with the ratings depicted in the chart are calculated based on the total market value of fixed income securities held by the Fund. If a security was rated by all three rating agencies, the middle rating was utilized. If rated by two of three rating agencies, the lower rating was utilized, and if rated by one of the rating agencies, that rating was utilized. Standard & Poor’s rates the creditworthiness of bonds, ranging from AAA (highest) to D (lowest). Ratings from A to CCC may be modified by the addition of a plus (+) or minus (-) sign to show relative standing within the rating categories. Standard & Poor’s rates the creditworthiness of short-term notes from SP-1 (highest) to SP-3 (lowest). Moody’s rates the creditworthiness of bonds, ranging from Aaa (highest) to C (lowest). Ratings Aa to B may be modified by the addition of a number 1 (highest) to 3 (lowest) to show relative standing within the ratings categories. Moody’s rates the creditworthiness of short-term U.S. tax-exempt municipal securities from MIG 1/VMIG 1 (highest) to SG (lowest). Fitch rates the creditworthiness of bonds, ranging from AAA (highest) to D (lowest). Credit quality distribution is subject to change and may have changed since the date specified. |
| 12 | Amounts are calculated based on the total long-term investments of the Fund. These amounts are subject to change and may have changed since the date specified. |
| | | | |
| 10 | | Wells Fargo Multi-Sector Income Fund | | Portfolio of investments—April 30, 2019 (unaudited) |
| | | | | | | | | | | | | | | | |
| Security name | | Interest rate | | | Maturity date | | | Principal | | | Value | |
|
Agency Securities: 1.26% | |
| | | | |
FHLMC (5 Year Treasury Constant Maturity +2.07%) ± | | | 3.54 | % | | | 9-1-2032 | | | $ | 764,166 | | | $ | 789,845 | |
| | | | |
FHLMC | | | 8.50 | | | | 7-1-2028 | | | | 25,980 | | | | 29,227 | |
| | | | |
FHLMC Series 1383 (1 Year Treasury Constant Maturity +2.25%) ± | | | 4.83 | | | | 2-1-2037 | | | | 156,320 | | | | 164,751 | |
| | | | |
FHLMC Series 196 Class A (1 Month LIBOR +0.80%) ± | | | 3.27 | | | | 12-15-2021 | | | | 2,341 | | | | 2,346 | |
| | | | |
FHLMC Series 2011-K16 Class B 144A±± | | | 4.76 | | | | 11-25-2046 | | | | 1,000,000 | | | | 1,039,524 | |
| | | | |
FHLMC Series 2012-K17 Class B 144A±± | | | 4.48 | | | | 12-25-2044 | | | | 675,000 | | | | 699,853 | |
| | | | |
FHLMC Series 2012-K18 Class B 144A±± | | | 4.40 | | | | 1-25-2045 | | | | 810,000 | | | | 837,896 | |
| | | | |
FHLMC Series 2012-K711 Class B 144A±± | | | 3.60 | | | | 8-25-2045 | | | | 264,000 | | | | 263,770 | |
| | | | |
FHLMC Series 2013-K30 Class B 144A±± | | | 3.67 | | | | 6-25-2045 | | | | 700,000 | | | | 711,496 | |
| | | | |
FHLMC Series 2390 Class FD (1 Month LIBOR +0.45%) ± | | | 2.92 | | | | 12-15-2031 | | | | 15,685 | | | | 15,715 | |
| | | | |
FHLMC Series 2567 Class FH (1 Month LIBOR +0.40%) ± | | | 2.87 | | | | 2-15-2033 | | | | 45,246 | | | | 44,920 | |
| | | | |
FHLMC Series K007 Class X1 ±±(c) | | | 1.20 | | | | 4-25-2020 | | | | 745,365 | | | | 5,066 | |
| | | | |
FHLMC Series K016 Class X1 ±±(c) | | | 1.63 | | | | 10-25-2021 | | | | 336,402 | | | | 10,587 | |
| | | | |
FHLMC Series K020 Class X1 ±±(c) | | | 1.54 | | | | 5-25-2022 | | | | 6,237,349 | | | | 223,538 | |
| | | | |
FNMA (6 Month LIBOR +1.64%) ± | | | 4.52 | | | | 9-1-2037 | | | | 42,533 | | | | 44,005 | |
| | | | |
FNMA | | | 6.00 | | | | 4-1-2033 | | | | 57,311 | | | | 58,734 | |
| | | | |
FNMA | | | 7.50 | | | | 2-1-2030 | | | | 18,934 | | | | 18,990 | |
| | | | |
FNMA | | | 7.50 | | | | 9-1-2030 | | | | 24,882 | | | | 24,990 | |
| | | | |
FNMA Series 1996-46 Class FA (1 Month LIBOR +0.50%) ± | | | 2.98 | | | | 8-25-2021 | | | | 1,110 | | | | 1,066 | |
| | | | |
FNMA Series 1997-20 Class IO ±±(c) | | | 1.84 | | | | 3-25-2027 | | | | 341,552 | | | | 6,925 | |
| | | | |
FNMA Series 2001-25 Class Z | | | 6.00 | | | | 6-25-2031 | | | | 72,630 | | | | 78,708 | |
| | | | |
FNMA Series 2001-35 Class F (1 Month LIBOR +0.60%) ± | | | 3.08 | | | | 7-25-2031 | | | | 3,714 | | | | 3,754 | |
| | | | |
FNMA Series 2001-57 Class F (1 Month LIBOR +0.50%) ± | | | 2.98 | | | | 6-25-2031 | | | | 3,739 | | | | 3,765 | |
| | | | |
FNMA Series 2002-77 Class FH (1 Month LIBOR +0.40%) ± | | | 2.88 | | | | 12-18-2032 | | | | 25,953 | | | | 26,021 | |
| | | | |
FNMA Series 2002-97 Class FR (1 Month LIBOR +0.55%) ± | | | 3.03 | | | | 1-25-2033 | | | | 6,372 | | | | 6,430 | |
| | | | |
FNMA Series G91-16 Class F (1 Month LIBOR +0.45%) ± | | | 2.94 | | | | 6-25-2021 | | | | 2,295 | | | | 2,301 | |
| | | | |
FNMA Series G92-17 Class F (1 Month LIBOR +1.05%) ± | | | 3.53 | | | | 3-25-2022 | | | | 11,441 | | | | 11,544 | |
| | | | |
GNMA | | | 6.50 | | | | 6-15-2028 | | | | 19,464 | | | | 21,209 | |
| |
Total Agency Securities (Cost $4,891,513) | | | | 5,146,976 | |
| | | | | | | | | | | | | | | | |
| | | | |
Asset-Backed Securities: 0.96% | | | | | | | | | | | | | | | | |
| | | | |
Asset-Backed Funding Certificates Series 2003-AHL1 Class A1 | | | 4.18 | | | | 3-25-2033 | | | | 139,764 | | | | 140,172 | |
| | | | |
Bear Stearns Asset Backed Securities Series 2002-2 Class A1 (1 Month LIBOR +0.66%) ± | | | 3.14 | | | | 10-25-2032 | | | | 134,542 | | | | 134,869 | |
| | | | |
Countrywide Asset Backed Certificates Series 2003-5 Class AF5 | | | 5.13 | | | | 2-25-2034 | | | | 78,446 | | | | 78,568 | |
| | | | |
CVS Pass-Through Trust Series T | | | 6.04 | | | | 12-10-2028 | | | | 447,984 | | | | 487,139 | |
| | | | |
Exeter Automobile Receivables Trust Series 15-3A Class D 144A | | | 6.55 | | | | 10-17-2022 | | | | 500,000 | | | | 514,530 | |
| | | | |
Five Guys Funding LLC Series 17-1A Class A2 144A | | | 4.60 | | | | 7-25-2047 | | | | 992,500 | | | | 1,024,896 | |
| | | | |
Mesa Trust Asset Backed Certificates Series 2001-5 Class A (1 Month LIBOR +0.80%) 144A± | | | 3.28 | | | | 12-25-2031 | | | | 9,971 | | | | 9,861 | |
| | | | |
MMAF Equipment Finance LLC Series 2017-AA Class A4 144A | | | 2.41 | | | | 8-16-2024 | | | | 170,000 | | | | 168,817 | |
| | | | |
Saxon Asset Securities Trust Series 2002-1 Class AF5 | | | 5.69 | | | | 12-25-2030 | | | | 109,973 | | | | 111,949 | |
| | | | |
Saxon Asset Securities Trust Series 2003-1 Class AF7 | | | 4.03 | | | | 6-25-2033 | | | | 318,835 | | | | 324,252 | |
| | | | |
Structured Asset Securities Corporation Series 1998-2 Class A (1 Month LIBOR +0.52%) ± | | | 3.00 | | | | 2-25-2028 | | | | 50,548 | | | | 50,406 | |
| | | | |
Structured Asset Securities Corporation Series 2002-9 Class A2 (1 Month LIBOR +0.60%) ± | | | 3.08 | | | | 10-25-2027 | | | | 29,701 | | | | 29,483 | |
| | | | |
Student Loan Consolidation Center Series 2011-1 Class A (1 Month LIBOR +1.22%) 144A± | | | 3.70 | | | | 10-25-2027 | | | | 338,162 | | | | 340,333 | |
| | | | |
World Financial Network Credit Card Master Trust Series 2016-C Class M | | | 1.98 | | | | 8-15-2023 | | | | 500,000 | | | | 497,618 | |
| |
Total Asset-Backed Securities (Cost $3,906,494) | | | | 3,912,893 | |
| | | | | | | | | | | | | | | | |
The accompanying notes are an integral part of these financial statements.
| | | | | | |
| Portfolio of investments—April 30, 2019 (unaudited) | | Wells Fargo Multi-Sector Income Fund | | | 11 | |
| | | | | | | | | | | | | | | | |
| Security name | | | | | | | | Shares | | | Value | |
| | | | |
Common Stocks: 0.00% | | | | | | | | | | | | | | | | |
| | | | |
Materials: 0.00% | | | | | | | | | | | | | | | | |
| | | | |
| Chemicals: 0.00% | | | | | | | | | | | | | | | | |
| | |
LyondellBasell Industries NV Class A | | | | 9 | | | $ | 794 | |
| | | | | | | | | | | | | | | | |
| |
Total Common Stocks (Cost $779) | | | | 794 | |
| | | | | | | | | | | | | | | | |
| | | | |
| | | Interest rate | | | Maturity date | | | Principal | | | | |
|
Corporate Bonds and Notes: 73.04% | |
|
Communication Services: 11.41% | |
|
| Diversified Telecommunication Services: 1.09% | |
| | | | |
AT&T Incorporated | | | 3.80 | % | | | 3-15-2022 | | | $ | 750,000 | | | | 769,114 | |
| | | | |
GCI Incorporated | | | 6.75 | | | | 6-1-2021 | | | | 1,000,000 | | | | 1,001,875 | |
| | | | |
Level 3 Financing Incorporated | | | 5.13 | | | | 5-1-2023 | | | | 975,000 | | | | 985,013 | |
| | | | |
Level 3 Financing Incorporated | | | 5.38 | | | | 8-15-2022 | | | | 300,000 | | | | 301,125 | |
| | | | |
Level 3 Financing Incorporated | | | 5.38 | | | | 1-15-2024 | | | | 700,000 | | | | 708,750 | |
| | | | |
Level 3 Financing Incorporated | | | 5.63 | | | | 2-1-2023 | | | | 500,000 | | | | 505,000 | |
| | | | |
Level 3 Financing Incorporated | | | 6.13 | | | | 1-15-2021 | | | | 175,000 | | | | 175,656 | |
| |
| | | | 4,446,533 | |
| | | | | | | | | | | | | | | | |
| | | | |
| Entertainment: 0.41% | | | | | | | | | | | | | | | | |
| | | | |
Live Nation Entertainment Incorporated 144A | | | 4.88 | | | | 11-1-2024 | | | | 1,400,000 | | | | 1,427,563 | |
| | | | |
Live Nation Entertainment Incorporated 144A | | | 5.63 | | | | 3-15-2026 | | | | 250,000 | | | | 260,625 | |
| |
| | | | 1,688,188 | |
| | | | | | | | | | | | | | | | |
| | | | |
| Media: 8.33% | | | | | | | | | | | | | | | | |
| | | | |
CCO Holdings LLC 144A | | | 4.00 | | | | 3-1-2023 | | | | 100,000 | | | | 100,250 | |
| | | | |
CCO Holdings LLC 144A | | | 5.00 | | | | 2-1-2028 | | | | 150,000 | | | | 149,813 | |
| | | | |
CCO Holdings LLC | | | 5.13 | | | | 2-15-2023 | | | | 100,000 | | | | 101,500 | |
| | | | |
CCO Holdings LLC 144A | | | 5.13 | | | | 5-1-2027 | | | | 450,000 | | | | 456,750 | |
| | | | |
CCO Holdings LLC | | | 5.25 | | | | 9-30-2022 | | | | 1,250,000 | | | | 1,270,313 | |
| | | | |
CCO Holdings LLC 144A | | | 5.38 | | | | 5-1-2025 | | | | 3,550,000 | | | | 3,674,250 | |
| | | | |
CCO Holdings LLC 144A | | | 5.50 | | | | 5-1-2026 | | | | 215,000 | | | | 221,880 | |
| | | | |
CCO Holdings LLC | | | 5.75 | | | | 9-1-2023 | | | | 50,000 | | | | 51,125 | |
| | | | |
CCO Holdings LLC 144A | | | 5.75 | | | | 2-15-2026 | | | | 3,375,000 | | | | 3,531,094 | |
| | | | |
CCO Holdings LLC 144A | | | 5.88 | | | | 4-1-2024 | | | | 1,250,000 | | | | 1,305,888 | |
| | | | |
Clear Channel Worldwide Holdings Incorporated 144A | | | 9.25 | | | | 2-15-2024 | | | | 25,000 | | | | 26,906 | |
| | | | |
CSC Holdings LLC 144A | | | 5.38 | | | | 7-15-2023 | | | | 1,395,000 | | | | 1,426,388 | |
| | | | |
CSC Holdings LLC 144A | | | 5.38 | | | | 2-1-2028 | | | | 425,000 | | | | 431,906 | |
| | | | |
CSC Holdings LLC 144A | | | 5.50 | | | | 5-15-2026 | | | | 1,275,000 | | | | 1,309,266 | |
| | | | |
CSC Holdings LLC 144A | | | 7.75 | | | | 7-15-2025 | | | | 2,030,000 | | | | 2,181,616 | |
| | | | |
DISH Network Corporation | | | 3.38 | | | | 8-15-2026 | | | | 1,300,000 | | | | 1,192,506 | |
| | | | |
EMI Music Publishing Group 144A | | | 7.63 | | | | 6-15-2024 | | | | 1,425,000 | | | | 1,510,500 | |
| | | | |
Gray Television Incorporated 144A | | | 5.13 | | | | 10-15-2024 | | | | 450,000 | | | | 457,875 | |
| | | | |
Gray Television Incorporated 144A | | | 5.88 | | | | 7-15-2026 | | | | 3,875,000 | | | | 3,993,691 | |
| | | | |
Gray Television Incorporated 144A | | | 7.00 | | | | 5-15-2027 | | | | 325,000 | | | | 350,898 | |
| | | | |
Interpublic Group of Companies | | | 4.00 | | | | 3-15-2022 | | | | 750,000 | | | | 767,492 | |
| | | | |
Lamar Media Corporation | | | 5.38 | | | | 1-15-2024 | | | | 375,000 | | | | 383,906 | |
| | | | |
Lamar Media Corporation 144A | | | 5.75 | | | | 2-1-2026 | | | | 100,000 | | | | 105,008 | |
| | | | |
National CineMedia LLC | | | 6.00 | | | | 4-15-2022 | | | | 1,900,000 | | | | 1,914,250 | |
The accompanying notes are an integral part of these financial statements.
| | | | |
| 12 | | Wells Fargo Multi-Sector Income Fund | | Portfolio of investments—April 30, 2019 (unaudited) |
| | | | | | | | | | | | | | | | |
| Security name | | Interest rate | | | Maturity date | | | Principal | | | Value | |
| | | | |
| Media(continued) | | | | | | | | | | | | | | | | |
| | | | |
Nexstar Broadcasting Group Incorporated 144A | | | 6.13 | % | | | 2-15-2022 | | | $ | 1,025,000 | | | $ | 1,039,094 | |
| | | | |
Nielsen Finance LLC 144A | | | 5.00 | | | | 4-15-2022 | | | | 175,000 | | | | 174,136 | |
| | | | |
Outfront Media Capital Corporation | | | 5.63 | | | | 2-15-2024 | | | | 20,000 | | | | 20,610 | |
| | | | |
Outfront Media Capital Corporation | | | 5.88 | | | | 3-15-2025 | | | | 775,000 | | | | 801,156 | |
| | | | |
Salem Media Group Incorporated 144A | | | 6.75 | | | | 6-1-2024 | | | | 2,200,000 | | | | 1,980,000 | |
| | | | |
The E.W. Scripps Company 144A | | | 5.13 | | | | 5-15-2025 | | | | 2,460,000 | | | | 2,337,000 | |
| | | | |
Time Warner Cable Incorporated | | | 4.00 | | | | 1-15-2022 | | | | 750,000 | | | | 772,538 | |
| |
| | | | 34,039,605 | |
| | | | | | | | | | | | | | | | |
| | | | |
| Wireless Telecommunication Services: 1.58% | | | | | | | | | | | | | | | | |
| | | | |
Sprint Capital Corporation | | | 6.88 | | | | 11-15-2028 | | | | 575,000 | | | | 550,203 | |
| | | | |
Sprint Capital Corporation | | | 8.75 | | | | 3-15-2032 | | | | 975,000 | | | | 1,023,750 | |
| | | | |
Sprint Communications Incorporated | | | 7.00 | | | | 8-15-2020 | | | | 225,000 | | | | 233,438 | |
| | | | |
T-Mobile USA Incorporated | | | 4.00 | | | | 4-15-2022 | | | | 650,000 | | | | 656,500 | |
| | | | |
T-Mobile USA Incorporated | | | 4.50 | | | | 2-1-2026 | | | | 125,000 | | | | 125,520 | |
| | | | |
T-Mobile USA Incorporated | | | 4.75 | | | | 2-1-2028 | | | | 425,000 | | | | 428,719 | |
| | | | |
T-Mobile USA Incorporated | | | 5.13 | | | | 4-15-2025 | | | | 425,000 | | | | 437,750 | |
| | | | |
T-Mobile USA Incorporated | | | 5.38 | | | | 4-15-2027 | | | | 1,500,000 | | | | 1,578,300 | |
| | | | |
T-Mobile USA Incorporated | | | 6.00 | | | | 3-1-2023 | | | | 300,000 | | | | 308,625 | |
| | | | |
T-Mobile USA Incorporated | | | 6.38 | | | | 3-1-2025 | | | | 975,000 | | | | 1,013,717 | |
| | | | |
T-Mobile USA Incorporated | | | 6.50 | | | | 1-15-2024 | | | | 80,000 | | | | 82,800 | |
| |
| | | | 6,439,322 | |
| | | | | | | | | | | | | | | | |
| | | | |
Consumer Discretionary: 8.14% | | | | | | | | | | | | | | | | |
| | | | |
| Auto Components: 1.56% | | | | | | | | | | | | | | | | |
| | | | |
Allison Transmission Incorporated 144A | | | 4.75 | | | | 10-1-2027 | | | | 650,000 | | | | 636,877 | |
| | | | |
Allison Transmission Incorporated 144A | | | 5.00 | | | | 10-1-2024 | | | | 2,250,000 | | | | 2,275,695 | |
| | | | |
Allison Transmission Incorporated 144A | | | 5.88 | | | | 6-1-2029 | | | | 400,000 | | | | 411,500 | |
| | | | |
Cooper Tire & Rubber Company | | | 7.63 | | | | 3-15-2027 | | | | 1,710,000 | | | | 1,812,600 | |
| | | | |
Cooper Tire & Rubber Company | | | 8.00 | | | | 12-15-2019 | | | | 600,000 | | | | 617,400 | |
| | | | |
Goodyear Tire & Rubber Company | | | 8.75 | | | | 8-15-2020 | | | | 468,000 | | | | 500,760 | |
| | | | |
Panther BF Aggregator 2 LP 144A%% | | | 6.25 | | | | 5-15-2026 | | | | 125,000 | | | | 130,475 | |
| |
| | | | 6,385,307 | |
| | | | | | | | | | | | | | | | |
| | | | |
| Distributors: 0.26% | | | | | | | | | | | | | | | | |
| | | | |
LKQ Corporation | | | 4.75 | | | | 5-15-2023 | | | | 1,075,000 | | | | 1,083,063 | |
| | | | | | | | | | | | | | | | |
| | | | |
| Diversified Consumer Services: 1.51% | | | | | | | | | | | | | | | | |
| | | | |
Carriage Services Incorporated 144A | | | 6.63 | | | | 6-1-2026 | | | | 575,000 | | | | 592,250 | |
| | | | |
Service Corporation International | | | 4.63 | | | | 12-15-2027 | | | | 650,000 | | | | 654,875 | |
| | | | |
Service Corporation International | | | 5.38 | | | | 5-15-2024 | | | | 100,000 | | | | 102,636 | |
| | | | |
Service Corporation International | | | 7.50 | | | | 4-1-2027 | | | | 3,400,000 | | | | 3,901,500 | |
| | | | |
Service Corporation International | | | 8.00 | | | | 11-15-2021 | | | | 850,000 | | | | 926,500 | |
| |
| | | | 6,177,761 | |
| | | | | | | | | | | | | | | | |
| | | | |
| Hotels, Restaurants & Leisure: 1.47% | | | | | | | | | | | | | | | | |
| | | | |
CCM Merger Incorporated 144A | | | 6.00 | | | | 3-15-2022 | | | | 3,553,000 | | | | 3,646,266 | |
| | | | |
Hilton Domestic Operating Company Incorporated 144A | | | 5.13 | | | | 5-1-2026 | | | | 425,000 | | | | 435,094 | |
| | | | |
Wyndham Hotels & Resorts Company 144A | | | 5.38 | | | | 4-15-2026 | | | | 1,875,000 | | | | 1,912,500 | |
| |
| | | | 5,993,860 | |
| | | | | | | | | | | | | | | | |
The accompanying notes are an integral part of these financial statements.
| | | | | | |
| Portfolio of investments—April 30, 2019 (unaudited) | | Wells Fargo Multi-Sector Income Fund | | | 13 | |
| | | | | | | | | | | | | | | | |
| Security name | | Interest rate | | | Maturity date | | | Principal | | | Value | |
| | | | |
| Internet & Direct Marketing Retail: 0.19% | | | | | | | | | | | | | | | | |
| | | | |
Expedia Incorporated | | | 5.95 | % | | | 8-15-2020 | | | $ | 750,000 | | | $ | 778,451 | |
| | | | | | | | | | | | | | | | |
| | | | |
| Multiline Retail: 0.15% | | | | | | | | | | | | | | | | |
| | | | |
Macy’s Retail Holdings Incorporated | | | 3.88 | | | | 1-15-2022 | | | | 600,000 | | | | 604,698 | |
| | | | | | | | | | | | | | | | |
| | | | |
| Specialty Retail: 2.45% | | | | | | | | | | | | | | | | |
| | | | |
Advance Auto Parts Incorporated | | | 4.50 | | | | 1-15-2022 | | | | 600,000 | | | | 620,551 | |
| | | | |
Asbury Automotive Group Incorporated | | | 6.00 | | | | 12-15-2024 | | | | 1,175,000 | | | | 1,213,188 | |
| | | | |
Group 1 Automotive Incorporated | | | 5.00 | | | | 6-1-2022 | | | | 200,000 | | | | 202,750 | |
| | | | |
Group 1 Automotive Incorporated 144A | | | 5.25 | | | | 12-15-2023 | | | | 1,500,000 | | | | 1,537,500 | |
| | | | |
Lithia Motors Incorporated 144A | | | 5.25 | | | | 8-1-2025 | | | | 945,000 | | | | 952,088 | |
| | | | |
Penske Auto Group Incorporated | | | 3.75 | | | | 8-15-2020 | | | | 540,000 | | | | 540,540 | |
| | | | |
Penske Auto Group Incorporated | | | 5.38 | | | | 12-1-2024 | | | | 2,150,000 | | | | 2,176,875 | |
| | | | |
Penske Auto Group Incorporated | | | 5.75 | | | | 10-1-2022 | | | | 1,155,000 | | | | 1,173,769 | |
| | | | |
Sonic Automotive Incorporated | | | 5.00 | | | | 5-15-2023 | | | | 849,000 | | | | 838,388 | |
| | | | |
Sonic Automotive Incorporated | | | 6.13 | | | | 3-15-2027 | | | | 775,000 | | | | 751,750 | |
| |
| | | | 10,007,399 | |
| | | | | | | | | | | | | | | | |
| | | | |
| Textiles, Apparel & Luxury Goods: 0.55% | | | | | | | | | | | | | | | | |
| | | | |
The William Carter Company 144A | | | 5.63 | | | | 3-15-2027 | | | | 825,000 | | | | 852,844 | |
| | | | |
Wolverine World Wide Incorporated 144A | | | 5.00 | | | | 9-1-2026 | | | | 1,411,000 | | | | 1,375,725 | |
| |
| | | | 2,228,569 | |
| | | | | | | | | | | | | | | | |
| | | | |
Consumer Staples: 1.50% | | | | | | | | | | | | | | | | |
| | | | |
| Beverages: 0.17% | | | | | | | | | | | | | | | | |
| | | | |
Cott Beverages Incorporated 144A | | | 5.50 | | | | 4-1-2025 | | | | 675,000 | | | | 683,438 | |
| | | | | | | | | | | | | | | | |
| | | | |
| Food Products: 1.09% | | | | | | | | | | | | | | | | |
| | | | |
B&G Foods Incorporated | | | 4.63 | | | | 6-1-2021 | | | | 300,000 | | | | 300,000 | |
| | | | |
B&G Foods Incorporated | | | 5.25 | | | | 4-1-2025 | | | | 1,050,000 | | | | 1,030,260 | |
| | | | |
Darling Ingredients Incorporated 144A | | | 5.25 | | | | 4-15-2027 | | | | 400,000 | | | | 407,000 | |
| | | | |
Kraft Heinz Foods Company | | | 3.50 | | | | 6-6-2022 | | | | 750,000 | | | | 759,105 | |
| | | | |
Lamb Weston Holdings Incorporated 144A | | | 4.63 | | | | 11-1-2024 | | | | 175,000 | | | | 177,604 | |
| | | | |
Pilgrim’s Pride Corporation 144A | | | 5.75 | | | | 3-15-2025 | | | | 1,305,000 | | | | 1,324,575 | |
| | | | |
Pilgrim’s Pride Corporation 144A | | | 5.88 | | | | 9-30-2027 | | | | 150,000 | | | | 154,875 | |
| | | | |
Prestige Brands Incorporated 144A | | | 6.38 | | | | 3-1-2024 | | | | 280,000 | | | | 289,100 | |
| |
| | | | 4,442,519 | |
| | | | | | | | | | | | | | | | |
| | | | |
| Household Products: 0.08% | | | | | | | | | | | | | | | | |
| | | | |
Central Garden & Pet Company | | | 5.13 | | | | 2-1-2028 | | | | 225,000 | | | | 213,750 | |
| | | | |
Spectrum Brands Incorporated | | | 5.75 | | | | 7-15-2025 | | | | 50,000 | | | | 51,063 | |
| | | | |
Spectrum Brands Incorporated | | | 6.63 | | | | 11-15-2022 | | | | 63,000 | | | | 64,405 | |
| |
| | | | 329,218 | |
| | | | | | | | | | | | | | | | |
| | | | |
| Tobacco: 0.16% | | | | | | | | | | | | | | | | |
| | | | |
Reynolds American Incorporated | | | 6.88 | | | | 5-1-2020 | | | | 650,000 | | | | 674,529 | |
| | | | | | | | | | | | | | | | |
The accompanying notes are an integral part of these financial statements.
| | | | |
| 14 | | Wells Fargo Multi-Sector Income Fund | | Portfolio of investments—April 30, 2019 (unaudited) |
| | | | | | | | | | | | | | | | |
| Security name | | Interest rate | | | Maturity date | | | Principal | | | Value | |
| | | | |
Energy: 14.95% | | | | | | | | | | | | | | | | |
| | | | |
| Energy Equipment & Services: 4.36% | | | | | | | | | | | | | | | | |
| | | | |
Bristow Group Incorporated | | | 6.25 | % | | | 10-15-2022 | | | $ | 3,855,000 | | | $ | 925,200 | |
| | | | |
Bristow Group Incorporated 144A | | | 8.75 | | | | 3-1-2023 | | | | 775,000 | | | | 651,000 | |
| | | | |
Diamond Offshore Drilling Incorporated | | | 4.88 | | | | 11-1-2043 | | | | 1,325,000 | | | | 851,313 | |
| | | | |
Era Group Incorporated | | | 7.75 | | | | 12-15-2022 | | | | 2,350,000 | | | | 2,303,000 | |
| | | | |
Hilcorp Energy Company 144A | | | 5.00 | | | | 12-1-2024 | | | | 1,450,000 | | | | 1,439,125 | |
| | | | |
Hilcorp Energy Company 144A | | | 5.75 | | | | 10-1-2025 | | | | 1,875,000 | | | | 1,889,063 | |
| | | | |
Hilcorp Energy Company 144A | | | 6.25 | | | | 11-1-2028 | | | | 350,000 | | | | 356,563 | |
| | | | |
NGPL PipeCo LLC 144A | | | 4.38 | | | | 8-15-2022 | | | | 350,000 | | | | 358,750 | |
| | | | |
NGPL PipeCo LLC 144A | | | 4.88 | | | | 8-15-2027 | | | | 550,000 | | | | 567,875 | |
| | | | |
NGPL PipeCo LLC 144A | | | 7.77 | | | | 12-15-2037 | | | | 4,785,000 | | | | 5,873,588 | |
| | | | |
Oceaneering International Incorporated | | | 6.00 | | | | 2-1-2028 | | | | 1,725,000 | | | | 1,688,344 | |
| | | | |
USA Compression Partners LP | | | 6.88 | | | | 4-1-2026 | | | | 850,000 | | | | 891,438 | |
| |
| | | | 17,795,259 | |
| | | | | | | | | | | | | | | | |
| | | | |
| Oil, Gas & Consumable Fuels: 10.59% | | | | | | | | | | | | | | | | |
| | | | |
Archrock Partners LP 144A | | | 6.88 | | | | 4-1-2027 | | | | 500,000 | | | | 520,625 | |
| | | | |
Carrizo Oil & Gas Incorporated | | | 8.25 | | | | 7-15-2025 | | | | 800,000 | | | | 814,000 | |
| | | | |
Cheniere Corpus Christi Holdings LLC | | | 5.13 | | | | 6-30-2027 | | | | 900,000 | | | | 938,250 | |
| | | | |
Cheniere Energy Partners LP | | | 5.25 | | | | 10-1-2025 | | | | 3,925,000 | | | | 4,003,500 | |
| | | | |
Cheniere Energy Partners LP 144A | | | 5.63 | | | | 10-1-2026 | | | | 300,000 | | | | 309,888 | |
| | | | |
Denbury Resources Incorporated | | | 6.38 | | | | 8-15-2021 | | | | 3,209,000 | | | | 2,663,470 | |
| | | | |
Denbury Resources Incorporated 144A | | | 9.25 | | | | 3-31-2022 | | | | 676,000 | | | | 684,450 | |
| | | | |
El Paso LLC | | | 6.50 | | | | 4-1-2020 | | | | 750,000 | | | | 773,658 | |
| | | | |
Energy Transfer Partners LP | | | 5.20 | | | | 2-1-2022 | | | | 750,000 | | | | 788,932 | |
| | | | |
EnLink Midstream Partners LP | | | 4.40 | | | | 4-1-2024 | | | | 3,200,000 | | | | 3,176,000 | |
| | | | |
EnLink Midstream Partners LP | | | 4.85 | | | | 7-15-2026 | | | | 600,000 | | | | 594,750 | |
| | | | |
EnLink Midstream Partners LP | | | 5.38 | | | | 6-1-2029 | | | | 50,000 | | | | 50,190 | |
| | | | |
Gulfport Energy Corporation | | | 6.00 | | | | 10-15-2024 | | | | 150,000 | | | | 131,532 | |
| | | | |
Kinder Morgan Energy Partners LP | | | 3.95 | | | | 9-1-2022 | | | | 750,000 | | | | 770,625 | |
| | | | |
Kinder Morgan Incorporated | | | 6.50 | | | | 9-15-2020 | | | | 285,000 | | | | 298,415 | |
| | | | |
Kinder Morgan Incorporated | | | 7.42 | | | | 2-15-2037 | | | | 800,000 | | | | 932,471 | |
| | | | |
Murphy Oil Corporation | | | 4.45 | | | | 12-1-2022 | | | | 1,250,000 | | | | 1,254,080 | |
| | | | |
Murphy Oil Corporation | | | 5.75 | | | | 8-15-2025 | | | | 185,000 | | | | 190,093 | |
| | | | |
Murphy Oil Corporation | | | 6.88 | | | | 8-15-2024 | | | | 850,000 | | | | 890,723 | |
| | | | |
Nabors Industries Incorporated | | | 0.75 | | | | 1-15-2024 | | | | 1,425,000 | | | | 1,026,531 | |
| | | | |
Nabors Industries Incorporated | | | 4.63 | | | | 9-15-2021 | | | | 750,000 | | | | 747,188 | |
| | | | |
Phillips 66 | | | 4.30 | | | | 4-1-2022 | | | | 625,000 | | | | 651,236 | |
| | | | |
Pioneer Natural Resources Company | | | 3.95 | | | | 7-15-2022 | | | | 750,000 | | | | 773,716 | |
| | | | |
Rockies Express Pipeline LLC 144A | | | 5.63 | | | | 4-15-2020 | | | | 2,625,000 | | | | 2,683,669 | |
| | | | |
Rockies Express Pipeline LLC 144A | | | 6.88 | | | | 4-15-2040 | | | | 1,974,000 | | | | 2,146,725 | |
| | | | |
Rockies Express Pipeline LLC 144A | | | 7.50 | | | | 7-15-2038 | | | | 240,000 | | | | 269,018 | |
| | | | |
Rose Rock Midstream LP | | | 5.63 | | | | 7-15-2022 | | | | 1,300,000 | | | | 1,288,625 | |
| | | | |
Rose Rock Midstream LP | | | 5.63 | | | | 11-15-2023 | | | | 825,000 | | | | 783,750 | |
| | | | |
SemGroup Corporation | | | 6.38 | | | | 3-15-2025 | | | | 3,425,000 | | | | 3,262,313 | |
| | | | |
SemGroup Corporation | | | 7.25 | | | | 3-15-2026 | | | | 1,000,000 | | | | 967,500 | |
| | | | |
Southern Star Central Corporation 144A | | | 5.13 | | | | 7-15-2022 | | | | 925,000 | | | | 930,966 | |
| | | | |
Southwestern Energy Company | | | 7.50 | | | | 4-1-2026 | | | | 400,000 | | | | 406,000 | |
| | | | |
Southwestern Energy Company | | | 7.75 | | | | 10-1-2027 | | | | 400,000 | | | | 405,000 | |
The accompanying notes are an integral part of these financial statements.
| | | | | | |
| Portfolio of investments—April 30, 2019 (unaudited) | | Wells Fargo Multi-Sector Income Fund | | | 15 | |
| | | | | | | | | | | | | | | | |
| Security name | | Interest rate | | | Maturity date | | | Principal | | | Value | |
| | | | |
| Oil, Gas & Consumable Fuels(continued) | | | | | | | | | | | | | | | | |
| | | | |
Summit Midstream Holdings LLC | | | 5.75 | % | | | 4-15-2025 | | | $ | 225,000 | | | $ | 207,563 | |
| | | | |
Tallgrass Energy Partners LP 144A | | | 5.50 | | | | 9-15-2024 | | | | 5,200,000 | | | | 5,356,000 | |
| | | | |
Tesoro Logistics LP | | | 6.38 | | | | 5-1-2024 | | | | 450,000 | | | | 472,781 | |
| | | | |
Ultra Resources Incorporated 144A | | | 7.13 | | | | 4-15-2025 | | | | 2,425,000 | | | | 351,625 | |
| | | | |
Williams Partners LP | | | 3.35 | | | | 8-15-2022 | | | | 750,000 | | | | 755,925 | |
| |
| | | | 43,271,783 | |
| | | | | | | | | | | | | | | | |
| | | | |
Financials: 5.99% | | | | | | | | | | | | | | | | |
| | | | |
| Banks: 0.48% | | | | | | | | | | | | | | | | |
| | | | |
Bank of America Corporation | | | 5.70 | | | | 1-24-2022 | | | | 250,000 | | | | 269,304 | |
| | | | |
Citigroup Incorporated | | | 4.13 | | | | 3-9-2021 | | | | 60,000 | | | | 60,825 | |
| | | | |
Citigroup Incorporated | | | 4.50 | | | | 1-14-2022 | | | | 250,000 | | | | 260,082 | |
| | | | |
Citigroup Incorporated | | | 6.13 | | | | 3-9-2028 | | | | 75,000 | | | | 83,531 | |
| | | | |
City National Bank | | | 5.38 | | | | 7-15-2022 | | | | 500,000 | | | | 534,374 | |
| | | | |
JPMorgan Chase & Company | | | 3.38 | | | | 5-1-2023 | | | | 750,000 | | | | 759,615 | |
| |
| | | | 1,967,731 | |
| | | | | | | | | | | | | | | | |
| | | | |
| Capital Markets: 0.42% | | | | | | | | | | | | | | | | |
| | | | |
ACE Securities Corporation (1 Month LIBOR +2.63%) ± | | | 5.10 | | | | 6-25-2033 | | | | 121,196 | | | | 121,153 | |
| | | | |
Blackstone Holdings Finance Company LLC 144A%% | | | 5.88 | | | | 3-15-2021 | | | | 750,000 | | | | 789,966 | |
| | | | |
Goldman Sachs Group Incorporated | | | 5.75 | | | | 1-24-2022 | | | | 750,000 | | | | 804,496 | |
| |
| | | | 1,715,615 | |
| | | | | | | | | | | | | | | | |
| | | | |
| Consumer Finance: 1.23% | | | | | | | | | | | | | | | | |
| | | | |
Ally Financial Incorporated | | | 8.00 | | | | 3-15-2020 | | | | 880,000 | | | | 916,300 | |
| | | | |
Discover Financial Services | | | 5.20 | | | | 4-27-2022 | | | | 750,000 | | | | 797,433 | |
| | | | |
FirstCash Incorporated 144A | | | 5.38 | | | | 6-1-2024 | | | | 575,000 | | | | 587,938 | |
| | | | |
General Motors Financial Company Incorporated | | | 3.70 | | | | 5-9-2023 | | | | 750,000 | | | | 753,501 | |
| | | | |
Navient Corporation | | | 8.00 | | | | 3-25-2020 | | | | 930,000 | | | | 963,713 | |
| | | | |
Springleaf Finance Corporation | | | 7.13 | | | | 3-15-2026 | | | | 925,000 | | | | 993,219 | |
| |
| | | | 5,012,104 | |
| | | | | | | | | | | | | | | | |
| | | | |
| Diversified Financial Services: 2.08% | | | | | | | | | | | | | | | | |
| | | | |
ING US Incorporated | | | 5.50 | | | | 7-15-2022 | | | | 327,000 | | | | 350,321 | |
| | | | |
LPL Holdings Incorporated 144A | | | 5.75 | | | | 9-15-2025 | | | | 7,500,000 | | | | 7,631,250 | |
| | | | |
Vantiv LLC 144A | | | 4.38 | | | | 11-15-2025 | | | | 500,000 | | | | 513,750 | |
| |
| | | | 8,495,321 | |
| | | | | | | | | | | | | | | | |
| | | | |
| Insurance: 1.78% | | | | | | | | | | | | | | | | |
| | | | |
American International Group Incorporated | | | 4.88 | | | | 6-1-2022 | | | | 750,000 | | | | 791,433 | |
| | | | |
AmWINS Group Incorporated 144A | | | 7.75 | | | | 7-1-2026 | | | | 1,125,000 | | | | 1,133,438 | |
| | | | |
Hartford Financial Services Group Incorporated | | | 5.13 | | | | 4-15-2022 | | | | 650,000 | | | | 691,602 | |
| | | | |
HUB International Limited 144A | | | 7.00 | | | | 5-1-2026 | | | | 500,000 | | | | 504,375 | |
| | | | |
Liberty Mutual Group Incorporated 144A | | | 4.57 | | | | 2-1-2029 | | | | 750,000 | | | | 787,407 | |
| | | | |
ProAssurance Corporation | | | 5.30 | | | | 11-15-2023 | | | | 750,000 | | | | 801,864 | |
| | | | |
Prudential Financial Incorporated (3 Month LIBOR +2.38%) ± | | | 4.50 | | | | 9-15-2047 | | | | 750,000 | | | | 735,000 | |
| | | | |
USIS Merger Subordinate Incorporated 144A | | | 6.88 | | | | 5-1-2025 | | | | 1,175,000 | | | | 1,170,594 | |
| | | | |
W.R. Berkley Corporation | | | 4.63 | | | | 3-15-2022 | | | | 650,000 | | | | 680,344 | |
| |
| | | | 7,296,057 | |
| | | | | | | | | | | | | | | | |
The accompanying notes are an integral part of these financial statements.
| | | | |
| 16 | | Wells Fargo Multi-Sector Income Fund | | Portfolio of investments—April 30, 2019 (unaudited) |
| | | | | | | | | | | | | | | | |
| Security name | | Interest rate | | | Maturity date | | | Principal | | | Value | |
| | | | |
Health Care: 7.87% | | | | | | | | | | | | | | | | |
| | | | |
| Biotechnology: 0.19% | | | | | | | | | | | | | | | | |
| | | | |
Amgen Incorporated | | | 3.63 | % | | | 5-15-2022 | | | $ | 750,000 | | | $ | 768,120 | |
| | | | | | | | | | | | | | | | |
| | | | |
| Health Care Equipment & Supplies: 1.10% | | | | | | | | | | | | | | | | |
| | | | |
Hill-Rom Holdings Incorporated 144A | | | 5.00 | | | | 2-15-2025 | | | | 400,000 | | | | 407,000 | |
| | | | |
Hill-Rom Holdings Incorporated 144A | | | 5.75 | | | | 9-1-2023 | | | | 200,000 | | | | 207,500 | |
| | | | |
Hologic Incorporated 144A | | | 4.38 | | | | 10-15-2025 | | | | 1,925,000 | | | | 1,906,953 | |
| | | | |
Hologic Incorporated 144A | | | 4.63 | | | | 2-1-2028 | | | | 225,000 | | | | 220,781 | |
| | | | |
Kinetics Concepts Incorporated 144A | | | 7.88 | | | | 2-15-2021 | | | | 1,247,000 | | | | 1,273,187 | |
| | | | |
Surgery Center Holdings Incorporated 144A | | | 6.75 | | | | 7-1-2025 | | | | 500,000 | | | | 465,000 | |
| |
| | | | 4,480,421 | |
| | | | | | | | | | | | | | | | |
| | | | |
| Health Care Providers & Services: 5.52% | | | | | | | | | | | | | | | | |
| | | | |
Acadia Healthcare Company Incorporated | | | 6.50 | | | | 3-1-2024 | | | | 190,000 | | | | 196,650 | |
| | | | |
Centene Corporation 144A | | | 5.38 | | | | 6-1-2026 | | | | 575,000 | | | | 600,156 | |
| | | | |
Centene Corporation | | | 6.13 | | | | 2-15-2024 | | | | 325,000 | | | | 340,438 | |
| | | | |
CHS Incorporated | | | 5.13 | | | | 8-1-2021 | | | | 2,350,000 | | | | 2,314,750 | |
| | | | |
Coventry Health Care Incorporated | | | 5.45 | | | | 6-15-2021 | | | | 750,000 | | | | 782,936 | |
| | | | |
Davita Incorporated | | | 5.00 | | | | 5-1-2025 | | | | 950,000 | | | | 929,518 | |
| | | | |
Express Scripts Holding Company | | | 3.90 | | | | 2-15-2022 | | | | 665,000 | | | | 681,224 | |
| | | | |
HCA Incorporated | | | 5.25 | | | | 6-15-2026 | | | | 325,000 | | | | 347,141 | |
| | | | |
HealthSouth Corporation | | | 5.75 | | | | 9-15-2025 | | | | 575,000 | | | | 590,226 | |
| | | | |
MEDNAX Incorporated 144A | | | 5.25 | | | | 12-1-2023 | | | | 475,000 | | | | 483,313 | |
| | | | |
MEDNAX Incorporated 144A | | | 6.25 | | | | 1-15-2027 | | | | 550,000 | | | | 561,000 | |
| | | | |
MPH Acquisition Holdings LLC 144A | | | 7.13 | | | | 6-1-2024 | | | | 2,861,000 | | | | 2,875,877 | |
| | | | |
MPT Operating Partnership LP | | | 5.00 | | | | 10-15-2027 | | | | 1,100,000 | | | | 1,102,750 | |
| | | | |
MPT Operating Partnership LP | | | 5.25 | | | | 8-1-2026 | | | | 1,575,000 | | | | 1,604,531 | |
| | | | |
MPT Operating Partnership LP | | | 6.38 | | | | 3-1-2024 | | | | 110,000 | | | | 115,830 | |
| | | | |
NVA Holdings Company 144A | | | 6.88 | | | | 4-1-2026 | | | | 200,000 | | | | 202,000 | |
| | | | |
Polaris Intermediate Corporation 144A | | | 8.50 | | | | 12-1-2022 | | | | 475,000 | | | | 472,625 | |
| | | | |
Select Medical Corporation | | | 6.38 | | | | 6-1-2021 | | | | 3,050,000 | | | | 3,053,813 | |
| | | | |
Tenet Healthcare Corporation | | | 4.63 | | | | 7-15-2024 | | | | 436,000 | | | | 437,228 | |
| | | | |
Tenet Healthcare Corporation | | | 6.00 | | | | 10-1-2020 | | | | 700,000 | | | | 723,625 | |
| | | | |
Vizient Incorporated 144A%% | | | 6.25 | | | | 5-15-2027 | | | | 175,000 | | | | 181,125 | |
| | | | |
Vizient Incorporated 144A | | | 10.38 | | | | 3-1-2024 | | | | 3,550,000 | | | | 3,829,030 | |
| | | | |
WellCare Health Plans Incorporated 144A | | | 5.38 | | | | 8-15-2026 | | | | 125,000 | | | | 130,913 | |
| |
| | | | 22,556,699 | |
| | | | | | | | | | | | | | | | |
| | | | |
| Health Care Technology: 0.60% | | | | | | | | | | | | | | | | |
| | | | |
Change Healthcare Holdings Incorporated 144A | | | 5.75 | | | | 3-1-2025 | | | | 1,950,000 | | | | 1,932,938 | |
| | | | |
Quintiles IMS Holdings Incorporated 144A | | | 4.88 | | | | 5-15-2023 | | | | 300,000 | | | | 304,875 | |
| | | | |
Quintiles IMS Holdings Incorporated 144A | | | 5.00 | | | | 10-15-2026 | | | | 225,000 | | | | 229,781 | |
| |
| | | | 2,467,594 | |
| | | | | | | | | | | | | | | | |
| | | | |
| Life Sciences Tools & Services: 0.26% | | | | | | | | | | | | | | | | |
| | | | |
Charles River Laboratories Incorporated 144A | | | 5.50 | | | | 4-1-2026 | | | | 275,000 | | | | 287,719 | |
| | | | |
Life Technologies Corporation | | | 6.00 | | | | 3-1-2020 | | | | 750,000 | | | | 769,262 | |
| |
| | | | 1,056,981 | |
| | | | | | | | | | | | | | | | |
The accompanying notes are an integral part of these financial statements.
| | | | | | |
| Portfolio of investments—April 30, 2019 (unaudited) | | Wells Fargo Multi-Sector Income Fund | | | 17 | |
| | | | | | | | | | | | | | | | |
| Security name | | Interest rate | | | Maturity date | | | Principal | | | Value | |
| | | | |
| Pharmaceuticals: 0.20% | | | | | | | | | | | | | | | | |
| | | | |
Bausch Health Companies Incorporated 144A | | | 5.75 | % | | | 8-15-2027 | | | $ | 75,000 | | | $ | 78,150 | |
| | | | |
Watson Pharmaceuticals Incorporated | | | 3.25 | | | | 10-1-2022 | | | | 750,000 | | | | 749,046 | |
| |
| | | | 827,196 | |
| | | | | | | | | | | | | | | | |
| | | | |
Industrials: 5.44% | | | | | | | | | | | | | | | | |
| | | | |
| Aerospace & Defense: 0.73% | | | | | | | | | | | | | | | | |
| | | | |
BAE Systems Holdings Incorporated 144A | | | 3.80 | | | | 10-7-2024 | | | | 1,000,000 | | | | 1,018,991 | |
| | | | |
L-3 Communications Corporation | | | 4.95 | | | | 2-15-2021 | | | | 750,000 | | | | 772,563 | |
| | | | |
RBS Global & Rexnord LLC 144A | | | 4.88 | | | | 12-15-2025 | | | | 1,200,000 | | | | 1,201,452 | |
| |
| | | | 2,993,006 | |
| | | | | | | | | | | | | | | | |
| | | | |
| Airlines: 0.87% | | | | | | | | | | | | | | | | |
| | | | |
Aviation Capital Group Corporation 144A | | | 6.75 | | | | 4-6-2021 | | | | 1,100,000 | | | | 1,173,282 | |
| | | | |
BBA US Holdings Incorporated 144A | | | 5.38 | | | | 5-1-2026 | | | | 2,025,000 | | | | 2,075,625 | |
| | | | |
Delta Air Lines Incorporated | | | 4.75 | | | | 11-7-2021 | | | | 314,041 | | | | 318,680 | |
| |
| | | | 3,567,587 | |
| | | | | | | | | | | | | | | | |
| | | | |
| Commercial Services & Supplies: 2.65% | | | | | | | | | | | | | | | | |
| | | | |
Advanced Disposal Services Incorporated 144A | | | 5.63 | | | | 11-15-2024 | | | | 1,750,000 | | | | 1,837,500 | |
| | | | |
Aramark Services Incorporated 144A | | | 5.00 | | | | 2-1-2028 | | | | 225,000 | | | | 229,005 | |
| | | | |
Aramark Services Incorporated | | | 5.13 | | | | 1-15-2024 | | | | 545,000 | | | | 563,394 | |
| | | | |
Covanta Holding Corporation | | | 5.88 | | | | 3-1-2024 | | | | 1,530,000 | | | | 1,573,988 | |
| | | | |
Covanta Holding Corporation | | | 5.88 | | | | 7-1-2025 | | | | 515,000 | | | | 527,875 | |
| | | | |
Covanta Holding Corporation | | | 6.00 | | | | 1-1-2027 | | | | 1,150,000 | | | | 1,170,125 | |
| | | | |
KAR Auction Services Incorporated 144A | | | 5.13 | | | | 6-1-2025 | | | | 4,950,000 | | | | 4,950,000 | |
| |
| | | | 10,851,887 | |
| | | | | | | | | | | | | | | | |
| | | | |
| Electrical Equipment: 0.13% | | | | | | | | | | | | | | | | |
| | | | |
Resideo Funding Incorporated 144A | | | 6.13 | | | | 11-1-2026 | | | | 500,000 | | | | 517,500 | |
| | | | | | | | | | | | | | | | |
| | | | |
| Industrial Conglomerates: 0.05% | | | | | | | | | | | | | | | | |
| | | | |
General Electric Capital Corporation | | | 4.65 | | | | 10-17-2021 | | | | 187,000 | | | | 193,717 | |
| | | | | | | | | | | | | | | | |
| | | | |
| Machinery: 0.71% | | | | | | | | | | | | | | | | |
| | | | |
Stevens Holding Company Incorporated 144A | | | 6.13 | | | | 10-1-2026 | | | | 1,425,000 | | | | 1,499,813 | |
| | | | |
Trimas Corporation 144A | | | 4.88 | | | | 10-15-2025 | | | | 1,391,000 | | | | 1,389,261 | |
| |
| | | | 2,889,074 | |
| | | | | | | | | | | | | | | | |
| | | | |
| Professional Services: 0.14% | | | | | | | | | | | | | | | | |
| | | | |
Verisk Analytics Incorporated | | | 5.80 | | | | 5-1-2021 | | | | 530,000 | | | | 559,812 | |
| | | | | | | | | | | | | | | | |
| | | | |
| Road & Rail: 0.16% | | | | | | | | | | | | | | | | |
| | | | |
TTX Company 144A | | | 2.60 | | | | 6-15-2020 | | | | 650,000 | | | | 649,076 | |
| | | | | | | | | | | | | | | | |
|
Information Technology: 5.96% | |
|
| Communications Equipment: 0.41% | |
| | | | |
CommScope Technologies Finance LLC 144A | | | 6.00 | | | | 6-15-2025 | | | | 825,000 | | | | 837,911 | |
| | | | |
CommScope Technologies Finance LLC 144A | | | 8.25 | | | | 3-1-2027 | | | | 50,000 | | | | 54,000 | |
| | | | |
Motorola Solutions Incorporated | | | 3.75 | | | | 5-15-2022 | | | | 750,000 | | | | 768,285 | |
| |
| | | | 1,660,196 | |
| | | | | | | | | | | | | | | | |
The accompanying notes are an integral part of these financial statements.
| | | | |
| 18 | | Wells Fargo Multi-Sector Income Fund | | Portfolio of investments—April 30, 2019 (unaudited) |
| | | | | | | | | | | | | | | | |
| Security name | | Interest rate | | | Maturity date | | | Principal | | | Value | |
| | | | |
| Electronic Equipment, Instruments & Components: 0.15% | | | | | | | | | | | | | | | | |
| | | | |
Keysight Technologies | | | 4.60 | % | | | 4-6-2027 | | | $ | 600,000 | | | $ | 622,440 | |
| | | | | | | | | | | | | | | | |
| | | | |
| IT Services: 2.03% | | | | | | | | | | | | | | | | |
| | | | |
Cardtronics Incorporated 144A | | | 5.50 | | | | 5-1-2025 | | | | 2,261,000 | | | | 2,227,085 | |
| | | | |
First Data Corporation 144A | | | 5.00 | | | | 1-15-2024 | | | | 950,000 | | | | 973,855 | |
| | | | |
First Data Corporation 144A | | | 5.38 | | | | 8-15-2023 | | | | 332,000 | | | | 339,437 | |
| | | | |
First Data Corporation 144A | | | 5.75 | | | | 1-15-2024 | | | | 375,000 | | | | 386,484 | |
| | | | |
Gartner Incorporated 144A | | | 5.13 | | | | 4-1-2025 | | | | 1,525,000 | | | | 1,561,936 | |
| | | | |
Infor Software Parent LLC (PIK at 7.88%) 144A¥ | | | 7.13 | | | | 5-1-2021 | | | | 550,000 | | | | 551,375 | |
| | | | |
Infor US Incorporated | | | 6.50 | | | | 5-15-2022 | | | | 550,000 | | | | 559,796 | |
| | | | |
Zayo Group LLC 144A | | | 5.75 | | | | 1-15-2027 | | | | 625,000 | | | | 634,375 | |
| | | | |
Zayo Group LLC | | | 6.38 | | | | 5-15-2025 | | | | 1,043,000 | | | | 1,061,252 | |
| |
| | | | 8,295,595 | |
| | | | | | | | | | | | | | | | |
| | | | |
| Software: 0.59% | | | | | | | | | | | | | | | | |
| | | | |
CDK Global Incorporated | | | 5.00 | | | | 10-15-2024 | | | | 225,000 | | | | 233,060 | |
| | | | |
CDK Global Incorporated | | | 5.88 | | | | 6-15-2026 | | | | 175,000 | | | | 184,188 | |
| | | | |
Fair Isaac Corporation 144A | | | 5.25 | | | | 5-15-2026 | | | | 950,000 | | | | 988,000 | |
| | | | |
SS&C Technologies Incorporated 144A | | | 5.50 | | | | 9-30-2027 | | | | 500,000 | | | | 512,813 | |
| | | | |
Symantec Corporation 144A | | | 5.00 | | | | 4-15-2025 | | | | 475,000 | | | | 484,337 | |
| |
| | | | 2,402,398 | |
| | | | | | | | | | | | | | | | |
| | | | |
| Technology Hardware, Storage & Peripherals: 2.78% | | | | | | | | | | | | | | | | |
| | | | |
Dell International LLC 144A | | | 5.88 | | | | 6-15-2021 | | | | 1,000,000 | | | | 1,018,387 | |
| | | | |
Dell International LLC 144A | | | 7.13 | | | | 6-15-2024 | | | | 4,525,000 | | | | 4,787,169 | |
| | | | |
Hewlett-Packard Company | | | 4.05 | | | | 9-15-2022 | | | | 750,000 | | | | 776,097 | |
| | | | |
NCR Corporation | | | 5.88 | | | | 12-15-2021 | | | | 5,000 | | | | 5,038 | |
| | | | |
NCR Corporation | | | 6.38 | | | | 12-15-2023 | | | | 4,650,000 | | | | 4,777,875 | |
| |
| | | | 11,364,566 | |
| | | | | | | | | | | | | | | | |
| | | | |
Materials: 2.38% | | | | | | | | | | | | | | | | |
| | | | |
| Chemicals: 0.28% | | | | | | | | | | | | | | | | |
| | | | |
Dow Chemical Company | | | 4.13 | | | | 11-15-2021 | | | | 750,000 | | | | 770,992 | |
| | | | |
Valvoline Incorporated | | | 5.50 | | | | 7-15-2024 | | | | 375,000 | | | | 384,375 | |
| |
| | | | 1,155,367 | |
| | | | | | | | | | | | | | | | |
| | | | |
| Containers & Packaging: 2.00% | | | | | | | | | | | | | | | | |
| | | | |
Ball Corporation | | | 4.88 | | | | 3-15-2026 | | | | 575,000 | | | | 595,844 | |
| | | | |
Ball Corporation | | | 5.00 | | | | 3-15-2022 | | | | 25,000 | | | | 26,000 | |
| | | | |
Ball Corporation | | | 5.25 | | | | 7-1-2025 | | | | 190,000 | | | | 201,163 | |
| | | | |
Berry Global Incorporated | | | 5.13 | | | | 7-15-2023 | | | | 350,000 | | | | 355,250 | |
| | | | |
Berry Global Incorporated | | | 6.00 | | | | 10-15-2022 | | | | 215,000 | | | | 221,450 | |
| | | | |
Crown Americas Capital Corporation V | | | 4.25 | | | | 9-30-2026 | | | | 100,000 | | | | 97,375 | |
| | | | |
Crown Americas Capital Corporation VI | | | 4.75 | | | | 2-1-2026 | | | | 975,000 | | | | 990,844 | |
| | | | |
Crown Cork & Seal Company Incorporated | | | 7.38 | | | | 12-15-2026 | | | | 35,000 | | | | 39,200 | |
| | | | |
Flex Acquisition Company Incorporated 144A | | | 6.88 | | | | 1-15-2025 | | | | 1,500,000 | | | | 1,410,000 | |
| | | | |
Flex Acquisition Company Incorporated 144A | | | 7.88 | | | | 7-15-2026 | | | | 275,000 | | | | 257,730 | |
The accompanying notes are an integral part of these financial statements.
| | | | | | |
| Portfolio of investments—April 30, 2019 (unaudited) | | Wells Fargo Multi-Sector Income Fund | | | 19 | |
| | | | | | | | | | | | | | | | |
| Security name | | Interest rate | | | Maturity date | | | Principal | | | Value | |
| | | | |
| Containers & Packaging(continued) | | | | | | | | | | | | | | | | |
| | | | |
Owens-Brockway Glass Container Incorporated 144A | | | 5.88 | % | | | 8-15-2023 | | | $ | 325,000 | | | $ | 340,031 | |
| | | | |
Owens-Illinois Incorporated 144A | | | 6.38 | | | | 8-15-2025 | | | | 2,375,000 | | | | 2,523,438 | |
| | | | |
Reynolds Group Issuer Incorporated 144A | | | 5.13 | | | | 7-15-2023 | | | | 675,000 | | | | 684,794 | |
| | | | |
Sealed Air Corporation 144A | | | 5.25 | | | | 4-1-2023 | | | | 325,000 | | | | 338,000 | |
| | | | |
Silgan Holdings Incorporated | | | 5.50 | | | | 2-1-2022 | | | | 75,000 | | | | 75,375 | |
| |
| | | | 8,156,494 | |
| | | | | | | | | | | | | | | | |
| | | | |
| Metals & Mining: 0.10% | | | | | | | | | | | | | | | | |
| | | | |
Indalex Holdings Corporation (a)† | | | 11.50 | | | | 2-1-2020 | | | | 3,108,611 | | | | 0 | |
| | | | |
Novelis Corporation 144A | | | 5.88 | | | | 9-30-2026 | | | | 400,000 | | | | 406,500 | |
| |
| | | | 406,500 | |
| | | | | | | | | | | | | | | | |
| | | | |
Real Estate: 4.31% | | | | | | | | | | | | | | | | |
| | | | |
| Equity REITs: 4.31% | �� | | | | | | | | | | | | | | | |
| | | | |
Alexandria Real Estate Company | | | 4.60 | | | | 4-1-2022 | | | | 650,000 | | | | 679,185 | |
| | | | |
American Tower Corporation | | | 5.90 | | | | 11-1-2021 | | | | 650,000 | | | | 696,322 | |
| | | | |
CoreCivic Incorporated | | | 5.00 | | | | 10-15-2022 | | | | 575,000 | | | | 575,000 | |
| | | | |
DDR Corporation | | | 4.70 | | | | 6-1-2027 | | | | 600,000 | | | | 619,237 | |
| | | | |
Equinix Incorporated | | | 5.75 | | | | 1-1-2025 | | | | 1,375,000 | | | | 1,426,563 | |
| | | | |
Equinix Incorporated | | | 5.88 | | | | 1-15-2026 | | | | 425,000 | | | | 448,375 | |
| | | | |
ESH Hospitality Incorporated 144A | | | 5.25 | | | | 5-1-2025 | | | | 1,750,000 | | | | 1,756,563 | |
| | | | |
Essex Portfolio LP | | | 3.63 | | | | 8-15-2022 | | | | 750,000 | | | | 763,608 | |
| | | | |
Iron Mountain Incorporated 144A | | | 5.25 | | | | 3-15-2028 | | | | 675,000 | | | | 664,875 | |
| | | | |
Iron Mountain Incorporated 144A | | | 5.38 | | | | 6-1-2026 | | | | 150,000 | | | | 148,500 | |
| | | | |
Iron Mountain Incorporated | | | 6.00 | | | | 8-15-2023 | | | | 2,500,000 | | | | 2,564,063 | |
| | | | |
Omega HealthCare Investors Incorporated | | | 4.50 | | | | 4-1-2027 | | | | 600,000 | | | | 608,171 | |
| | | | |
Sabra Health Care LP | | | 5.38 | | | | 6-1-2023 | | | | 900,000 | | | | 914,625 | |
| | | | |
Sabra Health Care LP | | | 5.50 | | | | 2-1-2021 | | | | 1,225,000 | | | | 1,235,719 | |
| | | | |
SBA Communications Corporation | | | 4.00 | | | | 10-1-2022 | | | | 225,000 | | | | 226,125 | |
| | | | |
SBA Communications Corporation | | | 4.88 | | | | 7-15-2022 | | | | 640,000 | | | | 648,800 | |
| | | | |
The Geo Group Incorporated | | | 5.13 | | | | 4-1-2023 | | | | 800,000 | | | | 750,000 | |
| | | | |
The Geo Group Incorporated | | | 5.88 | | | | 1-15-2022 | | | | 600,000 | | | | 591,000 | |
| | | | |
The Geo Group Incorporated | | | 5.88 | | | | 10-15-2024 | | | | 840,000 | | | | 768,600 | |
| | | | |
The Geo Group Incorporated | | | 6.00 | | | | 4-15-2026 | | | | 184,000 | | | | 164,680 | |
| | | | |
Ventas Realty LP | | | 4.25 | | | | 3-1-2022 | | | | 650,000 | | | | 670,647 | |
| | | | |
Welltower Incorporated | | | 5.25 | | | | 1-15-2022 | | | | 650,000 | | | | 686,858 | |
| |
| | | | 17,607,516 | |
| | | | | | | | | | | | | | | | |
| | | | |
Utilities: 5.09% | | | | | | | | | | | | | | | | |
| | | | |
| Electric Utilities: 0.53% | | | | | | | | | | | | | | | | |
| | | | |
Great Plains Energy Incorporated | | | 4.85 | | | | 6-1-2021 | | | | 750,000 | | | | 772,647 | |
| | | | |
NextEra Energy Operating Partners LP 144A | | | 4.25 | | | | 9-15-2024 | | | | 175,000 | | | | 175,569 | |
| | | | |
NextEra Energy Operating Partners LP 144A | | | 4.50 | | | | 9-15-2027 | | | | 1,250,000 | | | | 1,228,125 | |
| |
| | | | 2,176,341 | |
| | | | | | | | | | | | | | | | |
| | | | |
| Gas Utilities: 0.31% | | | | | | | | | | | | | | | | |
| | | | |
AmeriGas Partners LP | | | 5.75 | | | | 5-20-2027 | | | | 1,000,000 | | | | 1,032,500 | |
| | | | |
Suburban Propane Partners LP | | | 5.88 | | | | 3-1-2027 | | | | 225,000 | | | | 218,813 | |
| |
| | | | 1,251,313 | |
| | | | | | | | | | | | | | | | |
The accompanying notes are an integral part of these financial statements.
| | | | |
| 20 | | Wells Fargo Multi-Sector Income Fund | | Portfolio of investments—April 30, 2019 (unaudited) |
| | | | | | | | | | | | | | | | |
| Security name | | Interest rate | | | Maturity date | | | Principal | | | Value | |
| | | | |
| Independent Power & Renewable Electricity Producers: 4.05% | | | | | | | | | | | | | | | | |
| | | | |
NSG Holdings LLC 144A | | | 7.75 | % | | | 12-15-2025 | | | $ | 4,095,683 | | | $ | 4,402,860 | |
| | | | |
Pattern Energy Group Incorporated 144A | | | 5.88 | | | | 2-1-2024 | | | | 5,225,000 | | | | 5,382,847 | |
| | | | |
TerraForm Global Operating LLC 144A | | | 4.25 | | | | 1-31-2023 | | | | 3,025,000 | | | | 2,990,969 | |
| | | | |
TerraForm Power Operating LLC 144A | | | 5.00 | | | | 1-31-2028 | | | | 675,000 | | | | 665,719 | |
| | | | |
TerraForm Power Operating LLC 144A | | | 6.13 | | | | 3-1-2026 | | | | 1,175,000 | | | | 1,175,000 | |
| | | | |
TerraForm Power Operating LLC 144A | | | 6.63 | | | | 6-15-2025 | | | | 1,850,000 | | | | 1,933,250 | |
| |
| | | | 16,550,645 | |
| | | | | | | | | | | | | | | | |
| | | | |
| Multi-Utilities: 0.20% | | | | | | | | | | | | | | | | |
| | | | |
CMS Energy Corporation | | | 5.05 | | | | 3-15-2022 | | | | 750,000 | | | | 792,054 | |
| | | | | | | | | | | | | | | | |
| |
Total Corporate Bonds and Notes (Cost $298,173,778) | | | | 298,376,425 | |
| | | | | | | | | | | | | | | | |
| | | | |
Foreign Corporate Bonds and Notes @: 6.12% | | | | | | | | | | | | | | | | |
| | | | |
Financials: 6.12% | | | | | | | | | | | | | | | | |
| | | | |
| Banks: 6.06% | | | | | | | | | | | | | | | | |
| | | | |
European Investment Bank (BRL) | | | 7.25 | | | | 6-28-2021 | | | | 9,000,000 | | | | 2,339,344 | |
| | | | |
European Investment Bank (BRL) | | | 7.50 | | | | 4-13-2022 | | | | 9,000,000 | | | | 2,344,600 | |
| | | | |
European Investment Bank (ZAR) | | | 8.00 | | | | 5-5-2027 | | | | 21,000,000 | | | | 1,457,478 | |
| | | | |
European Investment Bank (ZAR) | | | 8.38 | | | | 7-29-2022 | | | | 40,000,000 | | | | 2,869,878 | |
| | | | |
European Investment Bank (ZAR) | | | 8.75 | | | | 8-18-2025 | | | | 20,000,000 | | | | 1,442,642 | |
| | | | |
European Investment Bank (ZAR) | | | 9.00 | | | | 3-31-2021 | | | | 17,400,000 | | | | 1,255,354 | |
| | | | |
International Bank for Reconstruction & Development (ZAR) | | | 7.00 | | | | 6-7-2023 | | | | 15,000,000 | | | | 1,028,766 | |
| | | | |
International Bank for Reconstruction & Development (BRL) | | | 7.50 | | | | 6-9-2021 | | | | 5,000,000 | | | | 1,303,971 | |
| | | | |
International Bank for Reconstruction & Development (BRL) | | | 8.25 | | | | 6-22-2023 | | | | 9,000,000 | | | | 2,382,791 | |
| | | | |
International Finance Corporation (BRL) | | | 7.50 | | | | 5-9-2022 | | | | 14,000,000 | | | | 3,658,009 | |
| | | | |
KfW (AUD) | | | 5.00 | | | | 3-19-2024 | | | | 1,300,000 | | | | 1,050,117 | |
| | | | |
KfW (ZAR) | | | 7.50 | | | | 11-10-2022 | | | | 36,000,000 | | | | 2,528,529 | |
| | | | |
Landwirtschaftliche Rentenbank (ZAR) | | | 8.25 | | | | 5-23-2022 | | | | 15,000,000 | | | | 1,074,799 | |
| |
| | | | 24,736,278 | |
| | | | | | | | | | | | | | | | |
| | | | |
| Diversified Financial Services: 0.06% | | | | | | | | | | | | | | | | |
| | | | |
AA Bond Company Limited (GBP) | | | 4.25 | | | | 7-31-2043 | | | | 200,000 | | | | 266,115 | |
| | | | | | | | | | | | | | | | |
| |
Total Foreign Corporate Bonds and Notes (Cost $26,614,672) | | | | 25,002,393 | |
| | | | | | | | | | | | | | | | |
| | | | |
Foreign Government Bonds @: 22.45% | | | | | | | | | | | | | | | | |
| | | | |
Colombia (COP) | | | 6.00 | | | | 4-28-2028 | | | | 6,800,000,000 | | | | 2,022,348 | |
| | | | |
Colombia (COP) | | | 7.00 | | | | 9-11-2019 | | | | 18,500,000,000 | | | | 5,775,479 | |
| | | | |
Colombia (COP) | | | 7.50 | | | | 8-26-2026 | | | | 22,725,000,000 | | | | 7,487,818 | |
| | | | |
India (INR) | | | 7.16 | | | | 5-20-2023 | | | | 420,000,000 | | | | 6,029,438 | |
| | | | |
India (INR) | | | 7.80 | | | | 4-11-2021 | | | | 435,000,000 | | | | 6,363,604 | |
| | | | |
Indonesia (IDR) | | | 7.50 | | | | 8-15-2032 | | | | 57,000,000,000 | | | | 3,754,504 | |
| | | | |
Indonesia (IDR) | | | 8.25 | | | | 5-15-2029 | | | | 88,615,000,000 | | | | 6,405,154 | |
| | | | |
Indonesia (IDR) | | | 8.38 | | | | 9-15-2026 | | | | 110,000,000,000 | | | | 8,070,434 | |
| | | | |
Malaysia (MYR) | | | 4.18 | | | | 7-15-2024 | | | | 19,850,000 | | | | 4,900,195 | |
| | | | |
Malaysia (MYR) | | | 4.23 | | | | 6-30-2031 | | | | 51,300,000 | | | | 12,550,937 | |
The accompanying notes are an integral part of these financial statements.
| | | | | | |
| Portfolio of investments—April 30, 2019 (unaudited) | | Wells Fargo Multi-Sector Income Fund | | | 21 | |
| | | | | | | | | | | | | | | | |
| Security name | | Interest rate | | | Maturity date | | | Principal | | | Value | |
| | | | |
Foreign Government Bonds @(continued) | | | | | | | | | | | | | | | | |
| | | | |
Mexico (MXN) | | | 5.75 | % | | | 3-5-2026 | | | | 117,000,000 | | | $ | 5,427,260 | |
| | | | |
Mexico (MXN) | | | 8.50 | | | | 5-31-2029 | | | | 200,000,000 | | | | 10,800,543 | |
| | | | |
New Zealand (NZD) | | | 3.00 | | | | 4-20-2029 | | | | 1,070,000 | | | | 785,044 | |
| | | | |
New Zealand (NZD) | | | 4.50 | | | | 4-15-2027 | | | | 3,085,000 | | | | 2,476,920 | |
| | | | |
Queensland Treasury (AUD) | | | 5.75 | | | | 7-22-2024 | | | | 4,100,000 | | | | 3,457,750 | |
| | | | |
Republic of Peru (PEN) | | | 6.35 | | | | 8-12-2028 | | | | 16,400,000 | | | | 5,393,678 | |
| |
Total Foreign Government Bonds (Cost $92,728,138) | | | | 91,701,106 | |
| | | | | | | | | | | | | | | | |
| | | | |
Loans: 20.55% | | | | | | | | | | | | | | | | |
| | | | |
Communication Services: 3.29% | | | | | | | | | | | | | | | | |
| | | | |
| Diversified Telecommunication Services: 0.73% | | | | | | | | | | | | | | | | |
| | | | |
Level 3 Financing Incorporated (1 Month LIBOR +2.25%) ± | | | 4.73 | | | | 2-22-2024 | | | $ | 555,420 | | | | 555,559 | |
| | | | |
Telesat Canada (3 Month LIBOR +2.50%) ± | | | 5.11 | | | | 11-17-2023 | | | | 2,423,377 | | | | 2,414,289 | |
| |
| | | | 2,969,848 | |
| | | | | | | | | | | | | | | | |
|
| Media: 2.45% | |
| | | | |
Ancestry.com Incorporated (1 Month LIBOR +3.25%) ± | | | 5.74 | | | | 10-19-2023 | | | | 5,861,965 | | | | 5,864,896 | |
| | | | |
Charter Communications Operating LLC (1 Month LIBOR +2.00%) ± | | | 4.49 | | | | 4-30-2025 | | | | 1,086,250 | | | | 1,088,173 | |
| | | | |
CSC Holdings LLC (1 Month LIBOR +2.50%) ± | | | 4.97 | | | | 1-25-2026 | | | | 148,500 | | | | 148,191 | |
| | | | |
Gray Television Incorporated (1 Month LIBOR +2.50%) ± | | | 4.98 | | | | 1-2-2026 | | | | 573,563 | | | | 574,423 | |
| | | | |
Hubbard Radio LLC (1 Month LIBOR +3.50%) ± | | | 5.99 | | | | 3-28-2025 | | | | 1,548,023 | | | | 1,541,568 | |
| | | | |
National CineMedia LLC (1 Month LIBOR +3.00%) ± | | | 5.50 | | | | 6-20-2025 | | | | 297,750 | | | | 296,169 | |
| | | | |
Neptune Finco Corporation (1 Month LIBOR +2.25%) ± | | | 4.72 | | | | 1-15-2026 | | | | 498,750 | | | | 496,132 | |
| |
| | | | 10,009,552 | |
| | | | | | | | | | | | | | | | |
| | | | |
| Wireless Telecommunication Services: 0.11% | | | | | | | | | | | | | | | | |
| | | | |
Sprint Communications Incorporated (1 Month LIBOR +2.50%) ± | | | 5.00 | | | | 2-2-2024 | | | | 441,000 | | | | 427,880 | |
| | | | | | | | | | | | | | | | |
| | | | |
Consumer Discretionary: 3.62% | | | | | | | | | | | | | | | | |
| | | | |
| Auto Components: 0.38% | | | | | | | | | | | | | | | | |
| | | | |
Allison Transmission Incorporated (1 Month LIBOR +2.00%) ± | | | 4.48 | | | | 3-30-2026 | | | | 1,036,245 | | | | 1,043,042 | |
| | | | |
Belron Finance US LLC (3 Month LIBOR +2.25%) ±‡ | | | 4.99 | | | | 11-7-2024 | | | | 296,250 | | | | 295,326 | |
| | | | |
Panther BF Aggregator 2 LP (1 Month LIBOR +3.50%) ±<‡ | | | 0.00 | | | | 3-18-2026 | | | | 225,000 | | | | 225,704 | |
| |
| | | | 1,564,072 | |
| | | | | | | | | | | | | | | | |
| | | | |
| Distributors: 0.59% | | | | | | | | | | | | | | | | |
| | | | |
Spin Holdco Incorporated (3 Month LIBOR +3.25%) ± | | | 5.85 | | | | 11-14-2022 | | | | 2,428,878 | | | | 2,397,011 | |
| | | | | | | | | | | | | | | | |
| | | | |
| Hotels, Restaurants & Leisure: 2.50% | | | | | | | | | | | | | | | | |
| | | | |
CCM Merger Incorporated (1 Month LIBOR +2.25%) ± | | | 4.73 | | | | 8-8-2021 | | | | 560,494 | | | | 560,213 | |
| | | | |
Four Seasons Holdings Incorporated (1 Month LIBOR +2.00%) ± | | | 4.48 | | | | 11-30-2023 | | | | 890,170 | | | | 889,850 | |
| | | | |
Greektown Holdings LLC (1 Month LIBOR +2.75%) ± | | | 5.23 | | | | 4-25-2024 | | | | 4,498,747 | | | | 4,495,013 | |
| | | | |
Montreign Operating Company LLC (3 Month LIBOR +8.25%) ±(a) | | | 10.88 | | | | 1-24-2023 | | | | 5,320,269 | | | | 4,256,215 | |
| |
| | | | 10,201,291 | |
| | | | | | | | | | | | | | | | |
| | | | |
| Internet & Direct Marketing Retail: 0.06% | | | | | | | | | | | | | | | | |
| | | | |
Shutterfly Incorporated (1 Month LIBOR +2.75%) ± | | | 5.24 | | | | 8-17-2024 | | | | 243,978 | | | | 243,138 | |
| | | | | | | | | | | | | | | | |
The accompanying notes are an integral part of these financial statements.
| | | | |
| 22 | | Wells Fargo Multi-Sector Income Fund | | Portfolio of investments—April 30, 2019 (unaudited) |
| | | | | | | | | | | | | | | | |
| Security name | | Interest rate | | | Maturity date | | | Principal | | | Value | |
| | | | |
| Specialty Retail: 0.09% | | | | | | | | | | | | | | | | |
| | | | |
ABC Supply Company Incorporated (1 Month LIBOR +2.00%) ± | | | 4.48 | % | | | 10-31-2023 | | | $ | 373,096 | | | $ | 369,675 | |
| | | | | | | | | | | | | | | | |
| | | | |
Consumer Staples: 0.06% | | | | | | | | | | | | | | | | |
| | | | |
| Food Products: 0.06% | | | | | | | | | | | | | | | | |
| | | | |
CHG PPC Parent LLC (1 Month LIBOR +2.75%) ±‡ | | | 5.23 | | | | 3-31-2025 | | | | 124,063 | | | | 123,986 | |
| | | | |
Prestige Brands Incorporated (1 Month LIBOR +2.00%) ± | | | 4.48 | | | | 1-26-2024 | | | | 127,375 | | | | 126,977 | |
| |
| | | | 250,963 | |
| | | | | | | | | | | | | | | | |
| | | | |
Energy: 1.39% | | | | | | | | | | | | | | | | |
| | | | |
| Energy Equipment & Services: 0.22% | | | | | | | | | | | | | | | | |
| | | | |
Hornbeck Offshore Services Incorporated (6 Month LIBOR +9.50%) ±‡ | | | 9.50 | | | | 2-5-2025 | | | | 1,126,250 | | | | 912,263 | |
| | | | | | | | | | | | | | | | |
| | | | |
| Oil, Gas & Consumable Fuels: 1.17% | | | | | | | | | | | | | | | | |
| | | | |
Encino Acquisition Partners Holdings LLC (1 Month LIBOR +6.75%) ±‡ | | | 9.23 | | | | 10-29-2025 | | | | 600,000 | | | | 558,000 | |
| | | | |
EPIC Crude Services LP (1 Month LIBOR +5.00%) ± | | | 7.49 | | | | 2-20-2026 | | | | 1,950,000 | | | | 1,938,632 | |
| | | | |
Grizzly Acquisitions Incorporated (3 Month LIBOR +3.25%) ± | | | 5.85 | | | | 10-1-2025 | | | | 373,125 | | | | 374,315 | |
| | | | |
Lucid Energy Group II Borrower LLC (1 Month LIBOR +3.00%) ± | | | 5.48 | | | | 2-17-2025 | | | | 222,750 | | | | 217,807 | |
| | | | |
Ultra Resources Incorporated (1 Month LIBOR +4.00%) ± | | | 6.49 | | | | 4-12-2024 | | | | 2,000,444 | | | | 1,688,715 | |
| |
| | | | 4,777,469 | |
| | | | | | | | | | | | | | | | |
|
Financials: 3.26% | |
|
| Capital Markets: 0.83% | |
| | | | |
Focus Financial Partners LLC (1 Month LIBOR +2.50%) ± | | | 4.98 | | | | 7-3-2024 | | | | 447,620 | | | | 448,739 | |
| | | | |
Global Business Travel Holdings Limited (3 Month LIBOR +2.50%) ±‡ | | | 5.19 | | | | 8-13-2025 | | | | 149,250 | | | | 149,250 | |
| | | | |
Neptune Finco Corporation (1 Month LIBOR +2.25%) ± | | | 4.72 | | | | 7-17-2025 | | | | 770,288 | | | | 766,329 | |
| | | | |
Russell Investments US Institutional Holdco Incorporated (3 Month LIBOR +3.25%) ± | | | 5.85 | | | | 6-1-2023 | | | | 588,608 | | | | 586,842 | |
| | | | |
Tortoise Borrower LLC (1 Month LIBOR +3.50%) ±‡ | | | 5.98 | | | | 1-31-2025 | | | | 198,995 | | | | 199,492 | |
| | | | |
VFH Parent LLC (2 Month LIBOR +3.50%) ± | | | 6.13 | | | | 1-3-2026 | | | | 250,000 | | | | 251,188 | |
| | | | |
Victory Capital Holdings Incorporated (1 Month LIBOR +2.75%) ±‡ | | | 5.23 | | | | 2-12-2025 | | | | 1,005,148 | | | | 1,004,525 | |
| |
| | | | 3,406,365 | |
| | | | | | | | | | | | | | | | |
| | | | |
| Consumer Finance: 0.01% | | | | | | | | | | | | | | | | |
| | | | |
TransUnion LLC (1 Month LIBOR +2.00%) ± | | | 4.48 | | | | 6-19-2025 | | | | 49,625 | | | | 49,584 | |
| | | | | | | | | | | | | | | | |
| | | | |
| Diversified Financial Services: 1.24% | | | | | | | | | | | | | | | | |
| | | | |
LPL Holdings Incorporated (1 Month LIBOR +2.25%) ±‡ | | | 4.74 | | | | 9-23-2024 | | | | 1,060,944 | | | | 1,062,270 | |
| | | | |
Nielsen Finance LLC (1 Month LIBOR +2.00%) ± | | | 4.47 | | | | 10-4-2023 | | | | 463,173 | | | | 461,033 | |
| | | | |
Resolute Investment Managers Incorporated (3 Month LIBOR +3.25%) ± | | | 5.85 | | | | 4-30-2022 | | | | 2,420,226 | | | | 2,429,302 | |
| | | | |
Resolute Investment Managers Incorporated (3 Month LIBOR +7.50%) ±‡ | | | 10.08 | | | | 4-30-2023 | | | | 1,090,000 | | | | 1,095,450 | |
| |
| | | | 5,048,055 | |
| | | | | | | | | | | | | | | | |
| | | | |
| Insurance: 1.18% | | | | | | | | | | | | | | | | |
| | | | |
Alliant Holdings Intermediate LLC (1 Month LIBOR +2.75%) ± | | | 5.24 | | | | 5-9-2025 | | | | 1,371,898 | | | | 1,346,325 | |
| | | | |
AmWINS Group Incorporated (1 Month LIBOR +2.75%) ± | | | 5.23 | | | | 1-25-2024 | | | | 883,877 | | | | 882,772 | |
| | | | |
Hub International Limited (3 Month LIBOR +2.75%) ± | | | 5.34 | | | | 4-25-2025 | | | | 1,240,625 | | | | 1,226,978 | |
| | | | |
Solera Holdings Incorporated (1 Month LIBOR +2.75%) ± | | | 5.23 | | | | 3-3-2023 | | | | 1,077,428 | | | | 1,078,193 | |
| | | | |
USI Incorporated (3 Month LIBOR +3.00%) ± | | | 5.60 | | | | 5-16-2024 | | | | 295,871 | | | | 292,765 | |
| |
| | | | 4,827,033 | |
| | | | | | | | | | | | | | | | |
The accompanying notes are an integral part of these financial statements.
| | | | | | |
| Portfolio of investments—April 30, 2019 (unaudited) | | Wells Fargo Multi-Sector Income Fund | | | 23 | |
| | | | | | | | | | | | | | | | |
| Security name | | Interest rate | | | Maturity date | | | Principal | | | Value | |
| | | | |
Health Care: 2.11% | | | | | | | | | | | | | | | | |
| | | | |
| Health Care Equipment & Supplies: 0.32% | | | | | | | | | | | | | | | | |
| | | | |
Kinetic Concepts Incorporated (3 Month LIBOR +3.25%) ± | | | 5.85 | % | | | 2-2-2024 | | | $ | 1,312,854 | | | $ | 1,315,730 | |
| | | | | | | | | | | | | | | | |
| | | | |
| Health Care Providers & Services: 1.03% | | | | | | | | | | | | | | | | |
| | | | |
MPH Acquisition Holdings LLC (3 Month LIBOR +2.75%) ± | | | 5.35 | | | | 6-7-2023 | | | | 429,539 | | | | 425,050 | |
| | | | |
Press Ganey Holdings Incorporated (1 Month LIBOR +2.75%) ± | | | 5.23 | | | | 10-23-2023 | | | | 2,165,811 | | | | 2,163,104 | |
| | | | |
Press Ganey Holdings Incorporated (1 Month LIBOR +6.50%) ± | | | 8.98 | | | | 10-21-2024 | | | | 516,856 | | | | 515,347 | |
| | | | |
Surgery Center Holdings Incorporated (1 Month LIBOR +3.25%) ± | | | 5.74 | | | | 9-2-2024 | | | | 519,553 | | | | 512,627 | |
| | | | |
Team Health Holdings Incorporated (1 Month LIBOR +2.75%) ±‡ | | | 5.23 | | | | 2-6-2024 | | | | 439,523 | | | | 411,503 | |
| | | | |
Vizient Incorporated (1 Month LIBOR +2.75%) ± | | | 5.23 | | | | 2-13-2023 | | | | 192,929 | | | | 192,757 | |
| |
| | | | 4,220,388 | |
| | | | | | | | | | | | | | | | |
| | | | |
| Health Care Technology: 0.16% | | | | | | | | | | | | | | | | |
| | | | |
Change Healthcare Holdings Incorporated (1 Month LIBOR +2.75%) ± | | | 5.23 | | | | 3-1-2024 | | | | 642,275 | | | | 641,928 | |
| | | | | | | | | | | | | | | | |
| | | | |
| Life Sciences Tools & Services: 0.07% | | | | | | | | | | | | | | | | |
| | | | |
Syneos Health Incorporated (1 Month LIBOR +2.00%) ± | | | 4.48 | | | | 8-1-2024 | | | | 302,030 | | | | 301,024 | |
| | | | | | | | | | | | | | | | |
| | | | |
| Pharmaceuticals: 0.53% | | | | | | | | | | | | | | | | |
| | | | |
Endo Finance LLC (1 Month LIBOR +4.25%) ± | | | 6.75 | | | | 4-29-2024 | | | | 291,495 | | | | 287,852 | |
| | | | |
Valeant Pharmaceuticals International Incorporated (1 Month LIBOR +3.00%) ± | | | 5.47 | | | | 6-2-2025 | | | | 1,865,682 | | | | 1,873,070 | |
| |
| | | | 2,160,922 | |
| | | | | | | | | | | | | | | | |
| | | | |
Industrials: 2.36% | | | | | | | | | | | | | | | | |
| | | | |
| Aerospace & Defense: 0.59% | | | | | | | | | | | | | | | | |
| | | | |
TransDigm Incorporated (1 Month LIBOR +2.50%) ± | | | 4.98 | | | | 8-22-2024 | | | | 2,430,441 | | | | 2,418,289 | |
| | | | | | | | | | | | | | | | |
| | | | |
| Commercial Services & Supplies: 0.86% | | | | | | | | | | | | | | | | |
| | | | |
Advanced Disposal Services Incorporated (1 Month LIBOR +2.25%) ± | | | 4.68 | | | | 11-10-2023 | | | | 1,153,408 | | | | 1,155,231 | |
| | | | |
Advantage Sales & Marketing LLC (1 Month LIBOR +3.25%) ± | | | 5.73 | | | | 7-25-2021 | | | | 222,173 | | | | 194,044 | |
| | | | |
Advantage Sales & Marketing LLC (1 Month LIBOR +6.50%) ± | | | 8.98 | | | | 7-25-2022 | | | | 1,250,000 | | | | 926,275 | |
| | | | |
KAR Auction Services Incorporated (3 Month LIBOR +2.50%) ± | | | 5.13 | | | | 3-9-2023 | | | | 152,819 | | | | 152,628 | |
| | | | |
WASH Multifamily Laundry Systems LLC (1 Month LIBOR +3.25%) ±‡ | | | 5.73 | | | | 5-14-2022 | | | | 1,126,598 | | | | 1,098,434 | |
| |
| | | | 3,526,612 | |
| | | | | | | | | | | | | | | | |
| | | | |
| Electrical Equipment: 0.13% | | | | | | | | | | | | | | | | |
| | | | |
Generac Power Systems Incorporated (1 Month LIBOR +1.75%) ±‡ | | | 4.25 | | | | 5-31-2023 | | | | 425,780 | | | | 425,780 | |
| | | | |
Resideo Funding Incorporated (3 Month LIBOR +2.00%) ±‡ | | | 4.61 | | | | 10-24-2025 | | | | 99,750 | | | | 99,625 | |
| |
| | | | 525,405 | |
| | | | | | | | | | | | | | | | |
| | | | |
| Machinery: 0.57% | | | | | | | | | | | | | | | | |
| | | | |
Columbus McKinnon Corporation (3 Month LIBOR +2.50%) ±‡ | | | 5.10 | | | | 1-31-2024 | | | | 826,602 | | | | 826,602 | |
| | | | |
Gates Global LLC (1 Month LIBOR +2.75%) ± | | | 5.23 | | | | 4-1-2024 | | | | 600,101 | | | | 600,725 | |
| | | | |
Harsco Corporation (1 Month LIBOR +2.25%) ±‡ | | | 4.75 | | | | 12-6-2024 | | | | 99,250 | | | | 99,498 | |
| | | | |
RBS Global Incorporated (1 Month LIBOR +2.00%) ± | | | 4.48 | | | | 8-21-2024 | | | | 679,688 | | | | 679,878 | |
| | | | |
Restaurant Technologies Incorporated (1 Month LIBOR +3.25%) ± | | | 5.73 | | | | 10-1-2025 | | | | 124,688 | | | | 124,843 | |
| |
| | | | 2,331,546 | |
| | | | | | | | | | | | | | | | |
The accompanying notes are an integral part of these financial statements.
| | | | |
| 24 | | Wells Fargo Multi-Sector Income Fund | | Portfolio of investments—April 30, 2019 (unaudited) |
| | | | | | | | | | | | | | | | |
| Security name | | Interest rate | | | Maturity date | | | Principal | | | Value | |
| | | | |
| Professional Services: 0.18% | | | | | | | | | | | | | | | | |
| | | | |
TransUnion (1 Month LIBOR +2.00%) ± | | | 4.48 | % | | | 4-10-2023 | | | $ | 715,090 | | | $ | 715,090 | |
| | | | | | | | | | | | | | | | |
| | | | |
| Trading Companies & Distributors: 0.03% | | | | | | | | | | | | | | | | |
| | | | |
Avolon TLB Borrower 1 LLC (1 Month LIBOR +2.00%) ± | | | 4.49 | | | | 1-15-2025 | | | | 142,431 | | | | 142,347 | |
| | | | | | | | | | | | | | | | |
| | | | |
Information Technology: 1.75% | | | | | | | | | | | | | | | | |
| | | | |
| Communications Equipment: 0.19% | | | | | | | | | | | | | | | | |
| | | | |
Ciena Corporation (1 Month LIBOR +2.00%) ± | | | 4.49 | | | | 9-26-2025 | | | | 273,625 | | | | 273,797 | |
| | | | |
CommScope Incorporated (1 Month LIBOR +3.25%) ± | | | 5.73 | | | | 4-6-2026 | | | | 500,000 | | | | 503,905 | |
| |
| | | | 777,702 | |
| | | | | | | | | | | | | | | | |
| | | | |
| Electronic Equipment, Instruments & Components: 0.55% | | | | | | | | | | | | | | | | |
| | | | |
Dell Incorporated (1 Month LIBOR +2.00%) ± | | | 4.49 | | | | 9-7-2023 | | | | 2,238,126 | | | | 2,238,126 | |
| | | | | | | | | | | | | | | | |
| | | | |
| IT Services: 0.85% | | | | | | | | | | | | | | | | |
| | | | |
Applied Systems Incorporated (1 Month LIBOR +3.00%) ± | | | 5.48 | | | | 9-19-2024 | | | | 394,746 | | | | 394,059 | |
| | | | |
First Data Corporation (1 Month LIBOR +2.00%) ± | | | 4.48 | | | | 4-26-2024 | | | | 1,775,000 | | | | 1,774,468 | |
| | | | |
Infor US Incorporated (1 Month LIBOR +2.75%) ± | | | 5.23 | | | | 2-1-2022 | | | | 774,947 | | | | 775,087 | |
| | | | |
Sophia Holding Finance LP (3 Month LIBOR +3.25%) ± | | | 5.85 | | | | 9-30-2022 | | | | 138,961 | | | | 138,986 | |
| | | | |
Wex Incorporated (1 Month LIBOR +2.25%) ± | | | 4.73 | | | | 6-30-2023 | | | | 398,974 | | | | 399,349 | |
| |
| | | | 3,481,949 | |
| | | | | | | | | | | | | | | | |
| | | | |
| Semiconductors & Semiconductor Equipment: 0.09% | | | | | | | | | | | | | | | | |
| | | | |
Micron Technology Incorporated (1 Month LIBOR +1.75%) ± | | | 4.24 | | | | 4-26-2022 | | | | 340,375 | | | | 340,630 | |
| | | | | | | | | | | | | | | | |
| | | | |
| Software: 0.07% | | | | | | | | | | | | | | | | |
| | | | |
SS&C Technologies Incorporated (1 Month LIBOR +2.25%) ± | | | 4.73 | | | | 4-16-2025 | | | | 290,296 | | | | 290,334 | |
| | | | | | | | | | | | | | | | |
| | | | |
Materials: 0.96% | | | | | | | | | | | | | | | | |
| | | | |
| Containers & Packaging: 0.96% | | | | | | | | | | | | | | | | |
| | | | |
Berry Plastics Corporation (1 Month LIBOR +2.00%) ± | | | 4.48 | | | | 10-1-2022 | | | | 387,258 | | | | 386,491 | |
| | | | |
Flex Acquisition Company Incorporated (3 Month LIBOR +3.25%) ± | | | 5.88 | | | | 6-29-2025 | | | | 744,375 | | | | 731,661 | |
| | | | |
Reynolds Group Holdings Incorporated (1 Month LIBOR +2.75%) ± | | | 5.23 | | | | 2-5-2023 | | | | 2,437,641 | | | | 2,440,761 | |
| | | | |
RING Container Technologies (1 Month LIBOR +2.75%) ± | | | 5.23 | | | | 10-31-2024 | | | | 370,499 | | | | 368,491 | |
| |
| | | | 3,927,404 | |
| | | | | | | | | | | | | | | | |
| | | | |
Real Estate: 1.33% | | | | | | | | | | | | | | | | |
| | | | |
| Equity REITs: 0.85% | | | | | | | | | | | | | | | | |
| | | | |
Blackstone Mortgage Trust Incorporated (1 Month LIBOR +2.50%) ±<‡ | | | 0.00 | | | | 4-23-2026 | | | | 150,000 | | | | 150,000 | |
| | | | |
ESH Hospitality Incorporated (1 Month LIBOR +2.00%) ± | | | 4.48 | | | | 8-30-2023 | | | | 1,133,750 | | | | 1,132,254 | |
| | | | |
MGM Growth Properties LLC (1 Month LIBOR +2.00%) ± | | | 4.48 | | | | 3-21-2025 | | | | 315,126 | | | | 314,845 | |
| | | | |
The Geo Group Incorporated (1 Month LIBOR +2.00%) ± | | | 4.49 | | | | 3-22-2024 | | | | 1,941,382 | | | | 1,875,259 | |
| |
| | | | 3,472,358 | |
| | | | | | | | | | | | | | | | |
The accompanying notes are an integral part of these financial statements.
| | | | | | |
| Portfolio of investments—April 30, 2019 (unaudited) | | Wells Fargo Multi-Sector Income Fund | | | 25 | |
| | | | | | | | | | | | | | | | |
| Security name | | Interest rate | | | Maturity date | | | Principal | | | Value | |
| | | | |
| Real Estate Management & Development: 0.52% | | | | | | | | | | | | | | | | |
| | | | |
Capital Automotive LP (1 Month LIBOR +2.50%) ± | | | 4.99 | % | | | 3-24-2024 | | | $ | 1,343,414 | | | $ | 1,339,223 | |
| | | | |
Capital Automotive LP (1 Month LIBOR +6.00%) ± | | | 8.48 | | | | 3-24-2025 | | | | 767,818 | | | | 769,546 | |
| |
| | | | 2,108,769 | |
| | | | | | | | | | | | | | | | |
| | | | |
Utilities: 0.38% | | | | | | | | | | | | | | | | |
| | | | |
| Independent Power & Renewable Electricity Producers: 0.38% | | | | | | | | | | | | | | | | |
| | | | |
TerraForm Power Operating LLC (1 Month LIBOR +2.00%) ±‡ | | | 4.48 | | | | 11-8-2022 | | | | 666,563 | | | | 664,063 | |
| | | | |
Vistra Energy Corporation (1 Month LIBOR +2.25%) ± | | | 4.73 | | | | 12-14-2023 | | | | 882,648 | | | | 884,193 | |
| |
| | | | 1,548,256 | |
| | | | | | | | | | | | | | | | |
| |
Total Loans (Cost $86,185,545) | | | | 83,939,008 | |
| | | | | | | | | | | | | | | | |
| | | | |
Non-Agency Mortgage-Backed Securities: 3.95% | | | | | | | | | | | | | | | | |
| | | | |
American Money Management Corporation Series 2015-16A Class AR (3 Month LIBOR +1.26%) 144A± | | | 3.86 | | | | 4-14-2029 | | | | 500,000 | | | | 499,994 | |
| | | | |
Argent Securities Incorporated Series 2004-W5 Class AV3B (1 Month LIBOR +0.90%) ± | | | 3.38 | | | | 4-25-2034 | | | | 48,174 | | | | 48,141 | |
| | | | |
Banc of America Commercial Mortgage Securities Incorporated Series 2006-03 Class AM ±± | | | 5.86 | | | | 7-10-2044 | | | | 547,504 | | | | 193,373 | |
| | | | |
Banc of America Commercial Mortgage Securities Incorporated Series 2007-1 Class AMFX ±± | | | 5.48 | | | | 1-15-2049 | | | | 119,385 | | | | 119,855 | |
| | | | |
Banc of America Funding Corporation Series 2005 Class 5-1A1 | | | 5.50 | | | | 9-25-2035 | | | | 181,049 | | | | 195,158 | |
| | | | |
Banc of America Funding Corporation Series 2005 Class D-A1 ±± | | | 4.69 | | | | 5-25-2035 | | | | 339,415 | | | | 356,582 | |
| | | | |
Banc of America Mortgage Securities Series 2003 Class 1A1 ±± | | | 5.00 | | | | 4-25-2033 | | | | 259,673 | | | | 253,920 | |
| | | | |
Benchmark Mortgage Trust Series 2018-B1 Class A2 | | | 3.57 | | | | 1-15-2051 | | | | 195,000 | | | | 200,337 | |
| | | | |
Bluemountain CLO Limited Series 2015-2A Class A1R (3 Month LIBOR +0.93%) 144A± | | | 3.53 | | | | 7-18-2027 | | | | 500,000 | | | | 497,835 | |
| | | | |
Centex Home Equity Series 2002-A Class AF6 | | | 5.54 | | | | 1-25-2032 | | | | 23,120 | | | | 23,377 | |
| | | | |
Centex Home Equity Series 2004-B Class AF6 | | | 4.69 | | | | 3-25-2034 | | | | 58,562 | | | | 59,597 | |
| | | | |
CIFC Funding Limited Series 2012-2RA Class A1 (3 Month LIBOR +0.80%) 144A± | | | 3.39 | | | | 1-20-2028 | | | | 485,000 | | | | 481,654 | |
| | | | |
Citigroup Commercial Mortgage Trust Series 2012-GC8 Class C 144A±± | | | 5.03 | | | | 9-10-2045 | | | | 1,000,000 | | | | 1,030,911 | |
| | | | |
Citigroup Commercial Mortgage Trust Series 2017-1500 Class A (1 Month LIBOR +0.85%) 144A± | | | 3.32 | | | | 7-15-2032 | | | | 750,000 | | | | 750,934 | |
| | | | |
Citigroup Commercial Mortgage Trust Series 2017-MDRB Class A (1 Month LIBOR +1.10%) 144A± | | | 3.57 | | | | 7-15-2030 | | | | 518,072 | | | | 515,181 | |
| | | | |
Citigroup Mortgage Loan Trust Incorporated Series 2003-HE3 Class A3 (1 Month LIBOR +0.76%) ± | | | 3.24 | | | | 12-25-2033 | | | | 10,038 | | | | 10,043 | |
| | | | |
Commercial Mortgage Trust Series 2012-CR2 Class C ±± | | | 4.99 | | | | 8-15-2045 | | | | 1,000,000 | | | | 1,023,806 | |
| | | | |
Commercial Mortgage Trust Series 2012-LC4 Class A4 | | | 3.29 | | | | 12-10-2044 | | | | 199,589 | | | | 202,007 | |
| | | | |
Commercial Mortgage Trust Series 2012-LC4 Class AM | | | 4.06 | | | | 12-10-2044 | | | | 500,000 | | | | 513,758 | |
| | | | |
Commercial Mortgage Trust Series 2012-LC4 Class C ±± | | | 5.72 | | | | 12-10-2044 | | | | 500,000 | | | | 518,430 | |
| | | | |
Countrywide Home Loans Series 2003-48 Class 2A2 ±± | | | 4.57 | | | | 10-25-2033 | | | | 48,603 | | | | 49,620 | |
| | | | |
Credit Suisse First Boston Mortgage Securities Series 2002-AR25 Class 1A1 ±± | | | 3.81 | | | | 9-25-2032 | | | | 410,826 | | | | 388,708 | |
| | | | |
Credit Suisse First Boston Mortgage Securities Series 2003-AR15 Class 3A1 ±± | | | 4.30 | | | | 6-25-2033 | | | | 62,646 | | | | 63,050 | |
| | | | |
Credit Suisse First Boston Mortgage Securities Series 2003-AR9 Class 2A2 ±± | | | 4.64 | | | | 3-25-2033 | | | | 19,202 | | | | 19,156 | |
| | | | |
Crown Point Limited Series 2015-3A Class A1AR (3 Month LIBOR +0.91%) 144A± | | | 3.51 | | | | 12-31-2027 | | | | 500,000 | | | | 498,329 | |
| | | | |
Global Mortgage Securitization Limited Series 2004-A Class A2 (1 Month LIBOR +0.32%) 144A± | | | 2.80 | | | | 11-25-2032 | | | | 71,508 | | | | 67,879 | |
| | | | |
GS Mortgage Securities Trust Series 2010-C1 Class X 144A±±(c) | | | 1.48 | | | | 8-10-2043 | | | | 4,960,114 | | | | 62,037 | |
The accompanying notes are an integral part of these financial statements.
| | | | |
| 26 | | Wells Fargo Multi-Sector Income Fund | | Portfolio of investments—April 30, 2019 (unaudited) |
| | | | | | | | | | | | | | | | |
| Security name | | Interest rate | | | Maturity date | | | Principal | | | Value | |
| | | | |
Non-Agency Mortgage-Backed Securities(continued) | | | | | | | | | | | | | | | | |
| | | | |
GS Mortgage Securities Trust Series 2012-GCJ7 Class XA ±±(c) | | | 2.36 | % | | | 5-10-2045 | | | $ | 3,000,466 | | | $ | 118,884 | |
| | | | |
GSAA Home Equity Trust Series 2004-5 Class AF5 | | | 4.33 | | | | 6-25-2034 | | | | 701 | | | | 700 | |
| | | | |
GSMPS Mortgage Loan Trust Series 2005-AHL Class M1 (1 Month LIBOR +0.65%) ± | | | 3.12 | | | | 4-25-2035 | | | | 1,598 | | | | 1,599 | |
| | | | |
GSMPS Mortgage Loan Trust Series 2006-1 Class A1 (1 Month LIBOR +0.30%) 144A± | | | 2.78 | | | | 3-25-2035 | | | | 34,232 | | | | 34,096 | |
| | | | |
JPMorgan Chase Commercial Mortgage Securities Trust Series 2007-CB18 Class AM ±± | | | 5.47 | | | | 6-12-2047 | | | | 860 | | | | 859 | |
| | | | |
JPMorgan Chase Commercial Mortgage Securities Trust Series 2007-CB18 Class AMFL (1 Month LIBOR +0.17%) ± | | | 2.66 | | | | 6-12-2047 | | | | 737 | | | | 737 | |
| | | | |
JPMorgan Chase Commercial Mortgage Securities Trust Series 2007-LDPX Class AM ±± | | | 5.46 | | | | 1-15-2049 | | | | 66,502 | | | | 66,543 | |
| | | | |
JPMorgan Chase Commercial Mortgage Securities Trust Series 2013-C17 Class B ±± | | | 5.05 | | | | 1-15-2047 | | | | 50,000 | | | | 53,427 | |
| | | | |
JPMorgan Mortgage Trust Series 2004-A3 Class 2A1 ±± | | | 4.45 | | | | 7-25-2034 | | | | 23,681 | | | | 24,162 | |
| | | | |
JPMorgan Mortgage Trust Series 2004-A3 Class 3A3 ±± | | | 4.07 | | | | 7-25-2034 | | | | 33,503 | | | | 34,026 | |
| | | | |
JPMorgan Mortgage Trust Series 2005-A3 Class 11A2 ±± | | | 4.64 | | | | 6-25-2035 | | | | 135,551 | | | | 139,616 | |
| | | | |
JPMorgan Mortgage Trust Series 2009-7 Class 2A1 144A±± | | | 6.00 | | | | 2-27-2037 | | | | 1,401 | | | | 1,397 | |
| | | | |
MASTR Adjustable Rate Mortgage Trust Series 2003-6 Class 3A1 ±± | | | 4.57 | | | | 12-25-2033 | | | | 215,876 | | | | 217,273 | |
| | | | |
MASTR Adjustable Rate Mortgage Trust Series 2003-6 Class 4A2 ±± | | | 4.27 | | | | 1-25-2034 | | | | 7,971 | | | | 7,943 | |
| | | | |
MASTR Adjustable Rate Mortgage Trust Series 2004-13 Class 3A7 ±± | | | 4.45 | | | | 11-21-2034 | | | | 10,081 | | | | 10,412 | |
| | | | |
MASTR Alternative Loans Trust Series 2005-1 Class 5A1 | | | 5.50 | | | | 1-25-2020 | | | | 2,670 | | | | 2,708 | |
| | | | |
MASTR Specialized Loan Trust Series 2005-3 Class A1 (1 Month LIBOR +0.36%) 144A± | | | 2.84 | | | | 11-25-2035 | | | | 91,283 | | | | 91,184 | |
| | | | |
Mid-State Trust Series 11 Class A1 | | | 4.86 | | | | 7-15-2038 | | | | 174,021 | | | | 182,866 | |
| | | | |
MLCC Mortgage Investors Incorporated Series 2003-G Class A2 (6 Month LIBOR +0.68%) ± | | | 3.57 | | | | 1-25-2029 | | | | 56,297 | | | | 56,413 | |
| | | | |
Montana Higher Education Student Assistance Corporation Series 2012-1 Class A2 (1 Month LIBOR +1.00%) ± | | | 3.59 | | | | 5-20-2030 | | | | 416,493 | | | | 417,668 | |
| | | | |
Morgan Stanley Bank of America Merrill Lynch Trust Series 2012-C5 Class XA 144A±±(c) | | | 1.62 | | | | 8-15-2045 | | | | 4,038,139 | | | | 150,647 | |
| | | | |
Morgan Stanley Bank of America Merrill Lynch Trust Series 2013-C11 Class A4 ±± | | | 4.30 | | | | 8-15-2046 | | | | 569,000 | | | | 599,229 | |
| | | | |
Morgan Stanley Bank of America Merrill Lynch Trust Series 2014-C17 Class A3 | | | 3.53 | | | | 8-15-2047 | | | | 300,000 | | | | 304,697 | |
| | | | |
Morgan Stanley Capital I Trust Series 2004-NC1 Class M1 (1 Month LIBOR +1.05%) ± | | | 3.53 | | | | 12-27-2033 | | | | 350,711 | | | | 350,915 | |
| | | | |
Morgan Stanley Capital I Trust Series 2012-C4 Class C 144A±± | | | 5.60 | | | | 3-15-2045 | | | | 900,000 | | | | 923,890 | |
| | | | |
Morgan Stanley Mortgage Loan Trust Series 2004-4 Class 2A ±± | | | 6.36 | | | | 9-25-2034 | | | | 32,820 | | | | 36,199 | |
| | | | |
New Century Home Equity Loan Trust Series 2004-3 Class M1 (1 Month LIBOR +0.93%) ± | | | 3.41 | | | | 11-25-2034 | | | | 1,118,626 | | | | 1,116,520 | |
| | | | |
Palmer Square Loan Funding Limited Series 2019-2A Class A1 (3 Month LIBOR +0.97%) 144A±%% | | | 3.49 | | | | 4-20-2027 | | | | 415,000 | | | | 415,000 | |
| | | | |
Provident Funding Mortgage Loan Series 2005-1 Class 2A1 ±± | | | 4.84 | | | | 5-25-2035 | | | | 6,541 | | | | 6,544 | |
| | | | |
RAIT Trust Series 2017-FL8 Class A (1 Month LIBOR +0.85%) 144A± | | | 3.32 | | | | 12-15-2037 | | | | 48,977 | | | | 48,942 | |
| | | | |
Sequoia Mortgage Trust Series 2003-1 Class 1A (1 Month LIBOR +0.76%) ± | | | 3.25 | | | | 4-20-2033 | | | | 9,404 | | | | 9,236 | |
| | | | |
SoFi Professional Loan Program LLC Series 2017-A Class A2B 144A | | | 2.40 | | | | 3-26-2040 | | | | 750,000 | | | | 736,924 | |
| | | | |
Stonemont Portfolio Trust Series 2017 Class A (1 Month LIBOR +0.85%) 144A± | | | 3.34 | | | | 8-20-2030 | | | | 453,426 | | | | 453,281 | |
| | | | |
Structured Adjustable Rate Mortgage Loan Trust Series 2004-2 Class 2A ±± | | | 4.56 | | | | 3-25-2034 | | | | 35,039 | | | | 34,773 | |
| | | | |
Terwin Mortgage Trust Series 2003-6HE Class A3 (1 Month LIBOR +1.14%) ± | | | 3.62 | | | | 11-25-2033 | | | | 159,555 | | | | 155,917 | |
| | | | |
Vendee Mortgage Trust Series 2003-2 Class IO ±±(c) | | | 0.67 | | | | 5-15-2033 | | | | 3,091,992 | | | | 90,783 | |
| | | | |
Washington Mutual Mortgage Trust Series 2004-RA4 Class 3A | | | 7.50 | | | | 7-25-2034 | | | | 89,567 | | | | 95,867 | |
| | | | |
Wind River CLO Limited Series 2013-2A Class BR (3 Month LIBOR +1.60%) 144A± | | | 4.20 | | | | 10-18-2030 | | | | 500,000 | | | | 494,569 | |
| |
Total Non-Agency Mortgage-Backed Securities (Cost $16,330,564) | | | | 16,130,118 | |
| | | | | | | | | | | | | | | | |
The accompanying notes are an integral part of these financial statements.
| | | | | | |
| Portfolio of investments—April 30, 2019 (unaudited) | | Wells Fargo Multi-Sector Income Fund | | | 27 | |
| | | | | | | | | | | | | | | | |
| Security name | | | | | Expiration date | | | Shares | | | Value | |
| | | | |
Rights: 0.06% | | | | | | | | | | | | | | | | |
| | | | |
Utilities: 0.06% | | | | | | | | | | | | | | | | |
| | | | |
| Independent Power & Renewable Electricity Producers: 0.06% | | | | | | | | | | | | | | | | |
| | | | |
Vistra Energy Corporation † | | | | | | | 12-31-2046 | | | | 327,375 | | | $ | 248,805 | |
| | | | | | | | | | | | | | | | |
| |
Total Rights (Cost $340,913) | | | | 248,805 | |
| | | | | | | | | | | | | | | | |
| | | | |
| | | Interest rate | | | Maturity date | | | Principal | | | | |
| Yankee Corporate Bonds and Notes: 8.81% | | | | | | | | | | | | | | | | |
| | | | |
Communication Services: 0.42% | | | | | | | | | | | | | | | | |
| | | | |
| Diversified Telecommunication Services: 0.09% | | | | | | | | | | | | | | | | |
| | | | |
Intelsat Luxembourg SA | | | 8.13 | % | | | 6-1-2023 | | | $ | 475,000 | | | | 359,219 | |
| | | | | | | | | | | | | | | | |
| | | | |
| Media: 0.18% | | | | | | | | | | | | | | | | |
| | | | |
WPP Finance 2010 | | | 3.63 | | | | 9-7-2022 | | | | 750,000 | | | | 755,727 | |
| | | | | | | | | | | | | | | | |
| | | | |
| Wireless Telecommunication Services: 0.15% | | | | | | | | | | | | | | | | |
| | | | |
Globo Communicacoes Participacoes SA 144A | | | 4.88 | | | | 4-11-2022 | | | | 595,000 | | | | 604,526 | |
| | | | | | | | | | | | | | | | |
| | | | |
Consumer Staples: 0.38% | | | | | | | | | | | | | | | | |
| | | | |
| Beverages: 0.19% | | | | | | | | | | | | | | | | |
| | | | |
Pernod Ricard SA 144A | | | 4.45 | | | | 1-15-2022 | | | | 760,000 | | | | 787,589 | |
| | | | | | | | | | | | | | | | |
| | | | |
| Tobacco: 0.19% | | | | | | | | | | | | | | | | |
| | | | |
BAT International Finance plc 144A | | | 3.25 | | | | 6-7-2022 | | | | 750,000 | | | | 750,953 | |
| | | | | | | | | | | | | | | | |
|
Energy: 1.43% | |
|
| Energy Equipment & Services: 0.37% | |
| | | | |
Ensco plc | | | 5.75 | | | | 10-1-2044 | | | | 2,320,000 | | | | 1,525,400 | |
| | | | | | | | | | | | | | | | |
| | | | |
| Oil, Gas & Consumable Fuels: 1.06% | | | | | | | | | | | | | | | | |
| | | | |
Baytex Energy Corporation 144A | | | 5.13 | | | | 6-1-2021 | | | | 1,450,000 | | | | 1,450,000 | |
| | | | |
Baytex Energy Corporation 144A | | | 5.63 | | | | 6-1-2024 | | | | 1,575,000 | | | | 1,492,313 | |
| | | | |
Griffin Coal Mining Company Limited 144A(a)† | | | 9.50 | | | | 12-1-2016 | | | | 1,122,015 | | | | 0 | |
| | | | |
Griffin Coal Mining Company Limited (a)† | | | 9.50 | | | | 12-1-2016 | | | | 91,731 | | | | 0 | |
| | | | |
Rockpoint Gas Storage 144A | | | 7.00 | | | | 3-31-2023 | | | | 1,375,000 | | | | 1,375,000 | |
| |
| | | | 4,317,313 | |
| | | | | | | | | | | | | | | | |
| | | | |
Financials: 2.80% | | | | | | | | | | | | | | | | |
| | | | |
| Banks: 0.90% | | | | | | | | | | | | | | | | |
| | | | |
ABN AMRO Bank NV 144A | | | 4.80 | | | | 4-18-2026 | | | | 750,000 | | | | 787,345 | |
| | | | |
Banco del Estado de Chile 144A | | | 3.88 | | | | 2-8-2022 | | | | 650,000 | | | | 661,869 | |
| | | | |
Corporación Andina de Fomento | | | 4.38 | | | | 6-15-2022 | | | | 958,000 | | | | 993,686 | |
| | | | |
Intelsat Connect Finance Company 144A | | | 9.50 | | | | 2-15-2023 | | | | 400,000 | | | | 371,000 | |
| | | | |
Nielsen Holding and Finance BV 144A | | | 5.00 | | | | 2-1-2025 | | | | 875,000 | | | | 864,063 | |
| |
| | | | 3,677,963 | |
| | | | | | | | | | | | | | | | |
The accompanying notes are an integral part of these financial statements.
| | | | |
| 28 | | Wells Fargo Multi-Sector Income Fund | | Portfolio of investments—April 30, 2019 (unaudited) |
| | | | | | | | | | | | | | | | |
| Security name | | Interest rate | | | Maturity date | | | Principal | | | Value | |
| | | | |
| Diversified Financial Services: 1.73% | | | | | | | | | | | | | | | | |
| | | | |
Intelsat Jackson Holdings SA | | | 5.50 | % | | | 8-1-2023 | | | $ | 5,275,000 | | | $ | 4,754,094 | |
| | | | |
Intelsat Jackson Holdings SA 144A | | | 8.50 | | | | 10-15-2024 | | | | 1,700,000 | | | | 1,677,688 | |
| | | | |
Tyco Electronics Group SA | | | 3.50 | | | | 2-3-2022 | | | | 625,000 | | | | 634,645 | |
| |
| | | | 7,066,427 | |
| | | | | | | | | | | | | | | | |
| | | | |
| Insurance: 0.17% | | | | | | | | | | | | | | | | |
| | | | |
Sompo International Holdings Limited | | | 7.00 | | | | 7-15-2034 | | | | 575,000 | | | | 706,387 | |
| | | | | | | | | | | | | | | | |
| | | | |
Health Care: 1.64% | | | | | | | | | | | | | | | | |
| | | | |
| Pharmaceuticals: 1.64% | | | | | | | | | | | | | | | | |
| | | | |
Bausch Health Companies Incorporated 144A | | | 5.50 | | | | 3-1-2023 | | | | 2,200,000 | | | | 2,208,250 | |
| | | | |
Bausch Health Companies Incorporated 144A | | | 5.50 | | | | 11-1-2025 | | | | 375,000 | | | | 383,790 | |
| | | | |
Bausch Health Companies Incorporated 144A | | | 5.88 | | | | 5-15-2023 | | | | 770,000 | | | | 775,929 | |
| | | | |
Bausch Health Companies Incorporated 144A | | | 6.13 | | | | 4-15-2025 | | | | 1,940,000 | | | | 1,964,250 | |
| | | | |
Bausch Health Companies Incorporated 144A | | | 6.50 | | | | 3-15-2022 | | | | 325,000 | | | | 336,375 | |
| | | | |
Bausch Health Companies Incorporated 144A | | | 7.00 | | | | 3-15-2024 | | | | 575,000 | | | | 605,906 | |
| | | | |
Bausch Health Companies Incorporated 144A | | | 8.50 | | | | 1-31-2027 | | | | 375,000 | | | | 408,516 | |
| |
| | | | 6,683,016 | |
| | | | | | | | | | | | | | | | |
| | | | |
Industrials: 1.05% | | | | | | | | | | | | | | | | |
| | | | |
| Commercial Services & Supplies: 0.59% | | | | | | | | | | | | | | | | |
| | | | |
Ritchie Brothers Auctioneers Incorporated 144A | | | 5.38 | | | | 1-15-2025 | | | | 2,350,000 | | | | 2,414,625 | |
| | | | | | | | | | | | | | | | |
| | | | |
| Electrical Equipment: 0.27% | | | | | | | | | | | | | | | | |
| | | | |
Sensata Technologies BV 144A | | | 5.00 | | | | 10-1-2025 | | | | 260,000 | | | | 266,500 | |
| | | | |
Sensata Technologies BV 144A | | | 6.25 | | | | 2-15-2026 | | | | 800,000 | | | | 845,000 | |
| |
| | | | 1,111,500 | |
| | | | | | | | | | | | | | | | |
| | | | |
| Road & Rail: 0.19% | | | | | | | | | | | | | | | | |
| | | | |
Canadian Pacific Railway Company | | | 4.50 | | | | 1-15-2022 | | | | 750,000 | | | | 777,382 | |
| | | | | | | | | | | | | | | | |
|
Information Technology: 0.12% | |
|
| Communications Equipment: 0.12% | |
| | | | |
Nielsen Holding and Finance BV 144A | | | 5.50 | | | | 10-1-2021 | | | | 465,000 | | | | 467,325 | |
| | | | | | | | | | | | | | | | |
| | | | |
Materials: 0.81% | | | | | | | | | | | | | | | | |
| | | | |
| Containers & Packaging: 0.55% | | | | | | | | | | | | | | | | |
| | | | |
Ardagh Packaging Finance plc 144A | | | 4.25 | | | | 9-15-2022 | | | | 375,000 | | | | 376,406 | |
| | | | |
Ardagh Packaging Finance plc 144A | | | 7.25 | | | | 5-15-2024 | | | | 725,000 | | | | 763,824 | |
| | | | |
OI European Group BV 144A | | | 4.00 | | | | 3-15-2023 | | | | 1,100,000 | | | | 1,086,250 | |
| |
| | | | 2,226,480 | |
| | | | | | | | | | | | | | | | |
| | | | |
| Metals & Mining: 0.26% | | | | | | | | | | | | | | | | |
| | | | |
Glencore Finance Canada Limited 144A | | | 4.25 | | | | 10-25-2022 | | | | 750,000 | | | | 774,000 | |
| | | | |
Vale Overseas Limited | | | 4.38 | | | | 1-11-2022 | | | | 296,000 | | | | 302,201 | |
| |
| | | | 1,076,201 | |
| | | | | | | | | | | | | | | | |
The accompanying notes are an integral part of these financial statements.
| | | | | | |
| Portfolio of investments—April 30, 2019 (unaudited) | | Wells Fargo Multi-Sector Income Fund | | | 29 | |
| | | | | | | | | | | | | | | | |
| Security name | | Interest rate | | | Maturity date | | | Principal | | | Value | |
| | | | |
Utilities: 0.16% | | | | | | | | | | | | | | | | |
| | | | |
| Electric Utilities: 0.16% | | | | | | | | | | | | | | | | |
| | | | |
Comision Federal de Electricidad 144A | | | 4.88 | % | | | 5-26-2021 | | | $ | 650,000 | | | $ | 664,632 | |
| | | | | | | | | | | | | | | | |
| |
Total Yankee Corporate Bonds and Notes (Cost $36,438,939) | | | | 35,972,665 | |
| | | | | | | | | | | | | | | | |
| | | | |
| | | Yield | | | | | | Shares | | | | |
| Short-Term Investments: 4.45% | | | | | | | | |
| |
| Investment Companies: 4.45% | | | | | |
| | | | |
Wells Fargo Government Money Market Fund Select
Class (l)(u)## | | | 2.36 | | | | | | | | 18,183,562 | | | | 18,183,562 | |
| | | | | | | | | | | | | | | | |
| | | | |
Total Short-Term Investments (Cost $18,183,562) | | | | | | | | | | | | | | | 18,183,562 | |
| | | | | | | | | | | | | | | | |
| | | | | | | | |
| Total investments in securities (Cost $583,794,897) | | | 141.65 | % | | | 578,614,745 | |
| | |
Other assets and liabilities, net | | | (41.65 | ) | | | (170,139,067 | ) |
| | | | | | | | |
| Total net assets | | | 100.00 | % | | $ | 408,475,678 | |
| | | | | | | | |
| ± | Variable rate investment. The rate shown is the rate in effect at period end. |
| 144A | The security may be resold in transactions exempt from registration, normally to qualified institutional buyers, pursuant to Rule 144A under the Securities Act of 1933. |
| ±± | The coupon of the security is adjusted based on the principal and interest payments received from the underlying pool of mortgages as well as the credit quality and the actual prepayment speed of the underlying mortgages. |
| (c) | Investment in an interest-only security entitles holders to receive only the interest payments on the underlying mortgages. The principal amount shown is the notional amount of the underlying mortgages. The rate represents the coupon rate. |
| < | All or a portion of the position represents an unfunded loan commitment. The rate represents current interest rate if the loan is partially funded. |
| %% | The security is issued on a when-issued basis. |
| ¥ | A payment-in-kind (PIK) security is a security in which the issuer may make interest or dividend payments in cash or additional securities. These additional securities generally have the same terms as the original holdings. |
| (a) | The security is fair valued in accordance with procedures approved by the Board of Trustees. |
| † | Non-income-earning security |
| @ | Foreign bond principal is denominated in the local currency of the issuer. |
| ‡ | Security is valued using significant unobservable inputs. |
| (l) | The issuer of the security is an affiliated person of the Fund as defined in the Investment Company Act of 1940. |
| (u) | The rate represents the 7-day annualized yield at period end. |
| ## | All or a portion of this security is segregated for when-issued and/or unfunded loans. |
Abbreviations:
| CLO | Collateralized loan obligation |
| FHLMC | Federal Home Loan Mortgage Corporation |
| FNMA | Federal National Mortgage Association |
| GNMA | Government National Mortgage Association |
| LIBOR | London Interbank Offered Rate |
| REIT | Real estate investment trust |
The accompanying notes are an integral part of these financial statements.
| | | | |
| 30 | | Wells Fargo Multi-Sector Income Fund | | Portfolio of investments—April 30, 2019 (unaudited) |
Investments in Affiliates
An affiliated investment is an investment in which the Fund owns at least 5% of the outstanding voting shares of the issuer or as a result of other relationships, such as the Fund and the issuer having the same investment manager. Transactions with issuers that were either affiliated persons of the Fund at the beginning of the period or the end of the period were as follows:
| | | | | | | | | | | | | | | | | | | | | | | | | | | | | | | | | | | | |
| | | Shares,
beginning of
period | | | Shares
purchased | | | Shares
sold | | | Shares,
end of
period | | | Net
realized
gains
(losses) | | | Net change in unrealized
gains
(losses) | | | Income
from
affiliated
securities | | | Value,
end
of period | | | % of net
assets | |
| | | | | | | | | |
Short-Term Investments | | | | | | | | | | | | | | | | | | | | | | | | | | | | | | | | | | | | |
Investment Companies | | | | | | | | | | | | | | | | | | | | | | | | | | | | | | | | | | | | |
Wells Fargo Government Money Market Fund Select Class | | | 8,394,594 | | | | 61,585,679 | | | | 51,796,711 | | | | 18,183,562 | | | $ | 0 | | | $ | 0 | | | $ | 114,204 | | | $ | 18,183,562 | | | | 4.45 | % |
The accompanying notes are an integral part of these financial statements.
| | | | | | |
| Statement of assets and liabilities—April 30, 2019 (unaudited) | | Wells Fargo Multi-Sector Income Fund | | | 31 | |
| | | | |
| | | | |
| |
Assets | | | | |
Investments in unaffiliated securities, at value (cost $565,611,335) | | $ | 560,431,183 | |
Investments in affiliated securities, at value (cost $18,183,562) | | | 18,183,562 | |
Foreign currency, at value (cost $123,113) | | | 123,109 | |
Receivable for investments sold | | | 108,824 | |
Principal paydown receivable | | | 12,299 | |
Receivable for interest | | | 8,479,356 | |
Prepaid expenses and other assets | | | 4,859 | |
| | | | |
Total assets | | | 587,343,192 | |
| | | | |
| |
Liabilities | | | | |
Secured borrowing payable | | | 173,000,000 | |
Dividends payable | | | 3,138,705 | |
Payable for investments purchased | | | 962,375 | |
Overdraft due to custodian bank | | | 352,059 | |
Advisory fee payable | | | 264,258 | |
Administration fee payable | | | 24,023 | |
Trustees’ fees and expenses payable | | | 5,001 | |
Accrued expenses and other liabilities | | | 1,121,093 | |
| | | | |
Total liabilities | | | 178,867,514 | |
| | | | |
Total net assets | | $ | 408,475,678 | |
| | | | |
| |
NET ASSETS CONSIST OF | | | | |
Paid-in capital | | $ | 455,232,360 | |
Total distributable loss | | | (46,756,682 | ) |
| | | | |
Total net assets | | $ | 408,475,678 | |
| | | | |
| |
NET ASSET VALUE PER SHARE | | | | |
Based on $408,475,678 divided by 30,716,046 shares issued and outstanding (100,000,000 shares authorized) | | | $13.30 | |
| | | | |
The accompanying notes are an integral part of these financial statements.
| | | | |
| 32 | | Wells Fargo Multi-Sector Income Fund | | Statement of operations—six months ended April 30, 2019 (unaudited) |
| | | | |
| | | | |
| |
Investment income | | | | |
Interest (net of foreign interest withholding taxes of $138,781) | | $ | 17,562,084 | |
Income from affiliated securities | | | 114,204 | |
Dividends | | | 18 | |
| | | | |
Total investment income | | | 17,676,306 | |
| | | | |
| |
Expenses | | | | |
Advisory fee | | | 1,590,887 | |
Administration fee | | | 144,626 | |
Custody and accounting fees | | | 136,075 | |
Professional fees | | | 33,095 | |
Shareholder report expenses | | | 26,370 | |
Trustees’ fees and expenses | | | 10,608 | |
Transfer agent fees | | | 17,501 | |
Interest expense | | | 2,740,296 | |
Other fees and expenses | | | 15,019 | |
| | | | |
Total expenses | | | 4,714,477 | |
| | | | |
Net investment income | | | 12,961,829 | |
| | | | |
| |
REALIZED AND UNREALIZED GAINS (LOSSES) ON INVESTMENTS | | | | |
| |
Net realized losses on: | | | | |
Unaffiliated securities | | | (1,724,778 | ) |
Foreign currency transactions | | | (228,834 | ) |
| | | | |
Net realized losses on investments | | | (1,953,612 | ) |
| | | | |
| |
Net change in unrealized gains (losses) on: | | | | |
Unaffiliated securities | | | 13,381,653 | |
Foreign currency transactions | | | 347 | |
| | | | |
Net change in unrealized gains on investments | | | 13,382,000 | |
| | | | |
Net realized and unrealized gains (losses) on investments | | | 11,428,388 | |
| | | | |
Net increase in net assets resulting from operations | | $ | 24,390,217 | |
| | | | |
The accompanying notes are an integral part of these financial statements.
| | | | | | |
| Statement of changes in net assets | | Wells Fargo Multi-Sector Income Fund | | | 33 | |
| | | | | | | | |
| | | Six months ended April 30, 2019
(unaudited) | | | Year ended October 31, 2018 | |
|
Operations | |
Net investment income | | $ | 12,961,829 | | | $ | 28,169,960 | |
Net realized losses on investments | | | (1,953,612 | ) | | | (12,997,364 | ) |
Net change in unrealized gains (losses) on investments | | | 13,382,000 | | | | (15,408,551 | ) |
| | | | |
Net increase (decrease) in net assets resulting from operations | | | 24,390,217 | | | | (235,955 | ) |
| | | | |
| | |
Distributions to shareholders from | | | | | | | | |
Net investment income and net realized gains | | | (19,311,709 | ) | | | (15,295,803 | ) |
Tax basis return of capital | | | 0 | | | | (27,375,294 | ) |
| | | | |
Total distributions to shareholders | | | (19,311,709 | ) | | | (42,671,097 | ) |
| | | | |
| |
Capital share transactions | | | | |
Cost of shares repurchased | | | (9,919,812 | ) | | | (43,599,996 | ) |
| | | | |
Total decrease in net assets | | | (4,841,304 | ) | | | (86,507,048 | ) |
| | | | |
| |
Net assets | | | | |
Beginning of period | | | 413,316,982 | | | | 499,824,030 | |
| | | | |
End of period | | $ | 408,475,678 | | | $ | 413,316,982 | |
| | | | |
The accompanying notes are an integral part of these financial statements.
| | | | |
| 34 | | Wells Fargo Multi-Sector Income Fund | | Statement of cash flows—six months ended April 30, 2019 (unaudited) |
| | | | |
| | | | |
| |
Cash flows from operating activities: | | | | |
Net increase in net assets resulting from operations | | $ | 24,390,217 | |
| |
Adjustments to reconcile net increase in net assets from operations to net cash provided by operating activities: | | | | |
Purchase of long-term securities | | | (52,251,970 | ) |
Proceeds from the sale of long-term securities | | | 92,410,572 | |
Paydowns | | | 2,562,086 | |
Amortization | | | (307,517 | ) |
Purchases and sales of short-term securities, net | | | (9,788,968 | ) |
Decrease in receivable for investments sold | | | 739,228 | |
Decrease in principal paydown receivable | | | 29,529 | |
Increase in receivable for interest | | | (469,619 | ) |
Decrease in prepaid expenses and other assets | | | 9,755 | |
Decrease in payable for investments purchased | | | (1,917,184 | ) |
Decrease in advisory fee payable | | | (20,356 | ) |
Decrease in administration fee payable | | | (1,851 | ) |
Increase in trustees’ fees and expenses payable | | | 4,162 | |
Decrease in accrued expenses and other liabilities | | | (215,363 | ) |
Litigation payments received | | | 553 | |
Net realized losses on investments | | | 1,724,778 | |
Net change in unrealized gains (losses) on investments | | | (13,382,000 | ) |
| | | | |
Net cash provided by operating activities | | | 43,516,052 | |
| | | | |
| |
Cash flows from financing activities: | | | | |
Decrease in secured borrowing payable | | | (14,000,000 | ) |
Cost of shares repurchased | | | (10,265,704 | ) |
Increase due to overdraft | | | 352,059 | |
Cash distributions paid | | | (19,536,574 | ) |
| | | | |
Net cash used in financing activities | | | (43,450,219 | ) |
| | | | |
Net increase in cash | | | 65,833 | |
| | | | |
| |
Cash (including foreign currency): | | | | |
Beginning of period | | $ | 57,276 | |
| | | | |
End of period | | $ | 123,109 | |
| | | | |
| |
Supplemental cash disclosure | | | | |
Cash paid for interest | | $ | 16,973,862 | |
| | | | |
The accompanying notes are an integral part of these financial statements.
| | | | | | |
| Financial highlights | | Wells Fargo Multi-Sector Income Fund | | | 35 | |
(For a share outstanding throughout each period)
| | | | | | | | | | | | | | | | | | | | | | | | |
| | | Six months ended
April 30, 2019 (unaudited) | | | Year ended October 31 | |
| | | 2018 | | | 2017 | | | 2016 | | | 2015 | | | 2014 | |
Net asset value, beginning of period | | | $13.10 | | | | $14.31 | | | | $14.35 | | | | $14.06 | | | | $16.10 | | | | $16.40 | |
Net investment income | | | 0.41 | | | | 0.85 | 1 | | | 0.97 | 1 | | | 1.08 | | | | 1.10 | 1 | | | 1.14 | 1 |
Net realized and unrealized gains (losses) on investments | | | 0.38 | | | | (0.92 | ) | | | 0.18 | | | | 0.33 | | | | (1.98 | ) | | | (0.24 | ) |
| | | | | | | | | | | | | | | | | | | | | | | | |
Total from investment operations | | | 0.79 | | | | (0.07 | ) | | | 1.15 | | | | 1.41 | | | | (0.88 | ) | | | 0.90 | |
Distributions to shareholders from | | | | | | | | | | | | | | | | | | | | | | | | |
Net investment income | | | (0.62 | ) | | | (0.46 | ) | | | (0.70 | ) | | | (0.97 | ) | | | (0.87 | ) | | | (0.91 | ) |
Tax basis return of capital | | | 0.00 | | | | (0.83 | ) | | | (0.53 | ) | | | (0.17 | ) | | | (0.29 | ) | | | (0.29 | ) |
| | | | | | | | | | | | | | | | | | | | | | | | |
Total distributions to shareholders | | | (0.62 | ) | | | (1.29 | ) | | | (1.23 | ) | | | (1.14 | ) | | | (1.16 | ) | | | (1.20 | ) |
Anti-dilutive effect of shares repurchased | | | 0.03 | | | | 0.15 | | | | 0.04 | | | | 0.02 | | | | 0.00 | | | | 0.00 | |
Net asset value, end of period | | | $13.30 | | | | $13.10 | | | | $14.31 | | | | $14.35 | | | | $14.06 | | | | $16.10 | |
Market value, end of period | | | $12.39 | | | | $11.57 | | | | $13.05 | | | | $12.66 | | | | $12.02 | | | | $14.19 | |
Total return based on market value2 | | | 12.73 | % | | | (1.91 | )% | | | 13.07 | % | | | 15.66 | % | | | (7.34 | )% | | | 6.55 | % |
Ratios to average net assets (annualized) | | | | | | | | | | | | | | | | | | | | | | | | |
Expenses3 | | | 2.32 | % | | | 2.14 | % | | | 1.68 | % | | | 1.39 | % | | | 1.24 | % | | | 1.21 | % |
Net investment income3 | | | 6.38 | % | | | 6.12 | % | | | 6.73 | % | | | 7.94 | % | | | 7.33 | % | | | 6.95 | % |
Supplemental data | | | | | | | | | | | | | | | | | | | | | | | | |
Portfolio turnover rate | | | 7 | % | | | 25 | % | | | 38 | % | | | 29 | % | | | 31 | % | | | 41 | % |
Net assets, end of period (000s omitted) | | | $408,476 | | | | $413,317 | | | | $499,824 | | | | $590,840 | | | | $591,226 | | | | $677,004 | |
| | | | | | |
Borrowings outstanding, end of period (000s omitted) | | | $173,352 | | | | $187,000 | | | | $187,000 | | | | $220,000 | | | | $230,000 | | | | $230,000 | |
Asset coverage per $1,000 of borrowing, end of period | | | $3,363 | | | | $3,210 | | | | $3,673 | | | | $3,686 | | | | $3,570 | | | | $3,944 | |
| 1 | Calculated based upon average shares outstanding |
| 2 | Total return is calculated assuming a purchase of common stock on the first day and sale on the last day of the period reported. Dividends and distributions, if any, are assumed for purposes of these calculations to be reinvested at prices obtained under the Fund’s Automatic Dividend Reinvestment Plan. Total return does not reflect brokerage commissions that a shareholder would pay on the purchase and sale of shares. Returns for periods of less than one year are not annualized. |
| 3 | Ratios include interest expense relating to interest associated with borrowings and/or leverage transactions as follows: |
| | | | |
Six months ended April 30, 2019 (unaudited) | | | 1.35 | % |
Year ended October 31, 2018 | | | 1.07 | % |
Year ended October 31, 2017 | | | 0.61 | % |
Year ended October 31, 2016 | | | 0.44 | % |
Year ended October 31, 2015 | | | 0.24 | % |
Year ended October 31, 2014 | | | 0.07 | % |
The accompanying notes are an integral part of these financial statements.
| | | | |
| 36 | | Wells Fargo Multi-Sector Income Fund | | Notes to financial statements (unaudited) |
1. ORGANIZATION
Wells Fargo Multi-Sector Income Fund (the “Fund”) was organized as a statutory trust under the laws of the state of Delaware on April 10, 2003 and is registered as a diversified closed-end management investment company under the Investment Company Act of 1940, as amended (the “1940 Act”). As an investment company, the Fund follows the accounting and reporting guidance in Financial Accounting Standards Board (“FASB”) Accounting Standards Codification Topic 946, Financial Services – Investment Companies.
2. SIGNIFICANT ACCOUNTING POLICIES
The following significant accounting policies, which are consistently followed in the preparation of the financial statements of the Fund, are in conformity with U.S. generally accepted accounting principles which require management to make estimates and assumptions that affect the reported amounts of assets and liabilities, disclosure of contingent assets and liabilities at the date of the financial statements, and the reported amounts of revenues and expenses during the reporting period. Actual results could differ from those estimates.
Securities valuation
All investments are valued each business day as of the close of regular trading on the New York Stock Exchange (generally 4 p.m. Eastern Time), although the Fund may deviate from this calculation time under unusual or unexpected circumstances.
Debt securities are valued at the evaluated bid price provided by an independent pricing service (e.g. taking into account various factors, including yields, maturities, or credit ratings) or, if a reliable price is not available, the quoted bid price from an independent broker-dealer.
Equity securities that are listed on a foreign or domestic exchange or market are valued at the official closing price or, if none, the last sales price. If no sale occurs on the principal exchange or market that day, a fair value price will be determined in accordance with the Fund’s Valuation Procedures.
The values of securities denominated in foreign currencies are translated into U.S. dollars at rates provided by an independent foreign currency pricing source at a time each business day specified by the Wells Fargo Asset Management Pricing Committee at Wells Fargo Funds Management, LLC (“Funds Management”).
Investments in registered open-end investment companies are valued at net asset value.
Investments which are not valued using any of the methods discussed above are valued at their fair value, as determined in good faith by the Board of Trustees of the Fund. The Board of Trustees has established a Valuation Committee comprised of the Trustees and has delegated to it the authority to take any actions regarding the valuation of portfolio securities that the Valuation Committee deems necessary or appropriate, including determining the fair value of portfolio securities, unless the determination has been delegated to the Wells Fargo Asset Management Pricing Committee. The Board of Trustees retains the authority to make or ratify any valuation decisions or approve any changes to the Valuation Procedures as it deems appropriate. On a quarterly basis, the Board of Trustees receives reports on any valuation actions taken by the Valuation Committee or the Wells Fargo Asset Management Pricing Committee which may include items for ratification.
Foreign currency translation
The accounting records of the Fund are maintained in U.S. dollars. The values of other assets and liabilities denominated in foreign currencies are translated into U.S. dollars at rates provided by an independent foreign currency pricing source at a time each business day specified by the Wells Fargo Asset Management Pricing Committee. Purchases and sales of securities, and income and expenses are converted at the rate of exchange on the respective dates of such transactions. Net realized foreign exchange gains or losses arise from sales of foreign currencies, currency gains or losses realized between the trade and settlement dates on securities transactions, and the difference between the amounts of dividends, interest and foreign withholding taxes recorded and the U.S. dollar equivalent of the amounts actually paid or received. Net unrealized foreign exchange gains and losses arise from changes in the fair value of assets and liabilities other than investments in securities resulting from changes in exchange rates. The changes in net assets arising from changes in exchange rates of securities and the changes in net assets resulting from changes in market prices of securities are not separately presented. Such changes are included in net realized and unrealized gains or losses from investments.
| | | | | | |
| Notes to financial statements (unaudited) | | Wells Fargo Multi-Sector Income Fund | | | 37 | |
When-issued transactions
The Fund may purchase securities on a forward commitment or when-issued basis. The Fund records a when-issued transaction on the trade date and will segregate assets in an amount at least equal in value to the Fund’s commitment to purchase when-issued securities. Securities purchased on a when-issued basis are marked-to-market daily and the Fund begins earning interest on the settlement date. Losses may arise due to changes in the market value of the underlying securities or if the counterparty does not perform under the contract.
Loans
The Fund may invest in direct debt instruments which are interests in amounts owed to lenders by corporate or other borrowers. The loans pay interest at rates which are periodically reset by reference to a base lending rate plus a spread. Investments in loans may be in the form of participations in loans or assignments of all or a portion of loans from third parties. When the Fund purchases participations, it generally has no rights to enforce compliance with the terms of the loan agreement with the borrower. As a result, the Fund assumes the credit risk of both the borrower and the lender that is selling the participation. When the Fund purchases assignments from lenders, it acquires direct rights against the borrower on the loan and may enforce compliance by the borrower with the terms of the loan agreement. Loans may include fully funded term loans or unfunded loan commitments, which are contractual obligations for future funding.
Security transactions and income recognition
Securities transactions are recorded on a trade date basis. Realized gains or losses are recorded on the basis of identified cost.
Interest income is accrued daily and bond discounts are accreted and premiums are amortized daily. To the extent debt obligations are placed on non-accrual status, any related interest income may be reduced by writing off interest receivables when the collection of all or a portion of interest has been determined to be doubtful based on consistently applied procedures and the fair value has decreased. If the issuer subsequently resumes interest payments or when the collectability of interest is reasonably assured, the debt obligation is removed from non-accrual status.
Dividend income is recognized on the ex-dividend date.
Income from foreign securities is recorded net of foreign taxes withheld where recovery of such taxes is not assured.
Distributions to shareholders
Under a monthly distribution plan, the Fund pays distributions to shareholders at an annual minimum fixed rate of 9% based on the Fund’s average monthly net asset value per share over the prior 12 months. The monthly distributions may be sourced from income, paid-in capital, and/or capital gains, if any. To the extent that sufficient investment income is not available on a monthly basis, the Fund may distribute paid-in capital and/or capital gains, if any, in order to maintain its managed distribution level.
Distributions to shareholders from net investment income and any net realized gains are recorded on the ex-dividend date. Such distributions are determined in accordance with income tax regulations and may differ from U.S. generally accepted accounting principles. Dividend sources are estimated at the time of declaration. The tax character of distributions is determined as of the Fund’s fiscal year end. Therefore, a portion of the Fund’s distributions made prior to the Fund’s fiscal year end may be categorized as a tax return of capital at year end.
Federal and other taxes
The Fund intends to continue to qualify as a regulated investment company by distributing substantially all of its investment company taxable income and any net realized capital gains (after reduction for capital loss carryforwards) sufficient to relieve it from all, or substantially all, federal income taxes. Accordingly, no provision for federal income taxes was required.
The Fund’s income and federal excise tax returns and all financial records supporting those returns for the prior three fiscal years are subject to examination by the federal and Delaware revenue authorities. Management has analyzed the Fund’s tax positions taken on federal, state, and foreign tax returns for all open tax years and does not believe that there are any uncertain tax positions that require recognition of a tax liability.
As of April 30, 2019, the aggregate cost of all investments for federal income tax purposes was $608,089,801 and the unrealized gains (losses) consisted of:
| | | | |
| |
Gross unrealized gains | | $ | 13,193,277 | |
| |
Gross unrealized losses | | | (42,668,333 | ) |
| |
Net unrealized losses | | $ | (29,475,056 | ) |
| | | | |
| 38 | | Wells Fargo Multi-Sector Income Fund | | Notes to financial statements (unaudited) |
As of October 31, 2018, the Fund had capital loss carryforwards which consist of $11,604,833 in short-term capital losses and $14,769,863 in long-term capital losses.
3. FAIR VALUATION MEASUREMENTS
Fair value measurements of investments are determined within a framework that has established a fair value hierarchy based upon the various data inputs utilized in determining the value of the Fund’s investments. The three-level hierarchy gives the highest priority to unadjusted quoted prices in active markets for identical assets or liabilities (Level 1) and the lowest priority to unobservable inputs (Level 3). The Fund’s investments are classified within the fair value hierarchy based on the lowest level of input that is significant to the fair value measurement. The inputs are summarized into three broad levels as follows:
| ∎ | | Level 1 – quoted prices in active markets for identical securities |
| ∎ | | Level 2 – other significant observable inputs (including quoted prices for similar securities, interest rates, prepayment speeds, credit risk, etc.) |
| ∎ | | Level 3 – significant unobservable inputs (including the Fund’s own assumptions in determining the fair value of investments) |
The inputs or methodologies used for valuing investments in securities are not necessarily an indication of the risk associated with investing in those securities.
The following is a summary of the inputs used in valuing the Fund’s assets and liabilities as of April 30, 2019:
| | | | | | | | | | | | | | | | |
| | | | |
| | | Quoted prices
(Level 1) | | | Other significant
observable inputs
(Level 2) | | | Significant
unobservable inputs
(Level 3) | | | Total | |
| | | | |
Assets | | | | | | | | | | | | | | | | |
Investments in: | | | | | | | | | | | | | | | | |
| | | | |
Agency securities | | $ | 0 | | | $ | 5,146,976 | | | $ | 0 | | | $ | 5,146,976 | |
| | | | |
Asset-backed securities | | | 0 | | | | 3,912,893 | | | | 0 | | | | 3,912,893 | |
| | | | |
Common stocks | | | | | | | | | | | | | | | | |
| | | | |
Materials | | | 794 | | | | 0 | | | | 0 | | | | 794 | |
| | | | |
Corporate bonds and notes | | | 0 | | | | 298,376,425 | | | | 0 | | | | 298,376,425 | |
| | | | |
Foreign corporate bonds and notes | | | 0 | | | | 25,002,393 | | | | 0 | | | | 25,002,393 | |
| | | | |
Foreign government bonds | | | 0 | | | | 91,701,106 | | | | 0 | | | | 91,701,106 | |
| | | | |
Loans | | | 0 | | | | 74,537,237 | | | | 9,401,771 | | | | 83,939,008 | |
| | | | |
Non-agency mortgage-backed securities | | | 0 | | | | 16,130,118 | | | | 0 | | | | 16,130,118 | |
| | | | |
Rights | | | | | | | | | | | | | | | | |
| | | | |
Utilities | | | 0 | | | | 248,805 | | | | 0 | | | | 248,805 | |
| | | | |
Yankee corporate bonds and notes | | | 0 | | | | 35,972,665 | | | | 0 | | | | 35,972,665 | |
| | | | |
Short-term investments | | | | | | | | | | | | | | | | |
| | | | |
Investment companies | | | 18,183,562 | | | | 0 | | | | 0 | | | | 18,183,562 | |
| | | | |
Total assets | | $ | 18,184,356 | | | $ | 551,028,618 | | | $ | 9,401,771 | | | $ | 578,614,745 | |
Additional sector, industry or geographic detail is included in the Portfolio of Investments.
| | | | | | |
| Notes to financial statements (unaudited) | | Wells Fargo Multi-Sector Income Fund | | | 39 | |
The following is a reconciliation of assets in which significant unobservable inputs (Level 3) were used in determining fair value:
| | | | |
| |
| | | Loans | |
Balance as of October 31, 2018 | | $ | 14,613,791 | |
| |
Accrued discounts (premiums) | | | 2,127 | |
| |
Realized losses | | | (113,041 | ) |
| |
Change in unrealized gains (losses) | | | (478,381 | ) |
| |
Purchases | | | 1,683,364 | |
| |
Sales | | | (4,439,369 | ) |
| |
Transfers into Level 3 | | | 2,063,412 | |
| |
Transfers out of Level 3 | | | (3,930,132 | ) |
| |
Balance as of April 30, 2019 | | $ | 9,401,771 | |
| |
Change in unrealized gains (losses) relating to securities still held at April 30, 2019 | | $ | (478,656 | ) |
The loan obligations in the Level 3 table were valued using indicative broker quotes. These indicative broker quotes are considered Level 3 inputs. Quantitative unobservable inputs used by the brokers are often proprietary and not provided to the Fund and therefore the disclosure that would address these inputs is not included above.
4. TRANSACTIONS WITH AFFILIATES
Advisory fee
Funds Management, an indirect wholly owned subsidiary of Wells Fargo & Company (“Wells Fargo”) is the adviser to the Fund and is entitled to receive a fee at an annual rate of 0.55% of the Fund’s average daily total assets. Total assets consist of net assets of the Fund plus borrowings or other leverage for investment purposes to the extent excluded in calculating net assets.
Funds Management has retained the services of certain subadvisers to provide daily portfolio management to the Fund. The fees for subadvisory services are borne by Funds Management. Wells Capital Management Incorporated, an affiliate of Funds Management and an indirect, wholly owned subsidiary of Wells Fargo, is a subadviser to the Fund and is entitled to receive a fee from Funds Management at an annual rate of 0.30% of the Fund’s average daily total assets. Wells Fargo Asset Management (International), LLC, an affiliate of Funds Management and an indirect, wholly owned subsidiary of Wells Fargo, is also a subadviser to the Fund and is entitled to receive a fee from Funds Management at an annual rate of 0.10% of the Fund’s average daily total assets.
Administration fee
Funds Management also serves as the administrator to the Fund, providing the Fund with a wide range of administrative services necessary to the operation of the Fund. Funds Management is entitled to receive an annual administration fee from the Fund equal to 0.05% of the Fund’s average daily total assets.
Interfund transactions
The Fund may purchase or sell portfolio investment securities to certain other Wells Fargo affiliates pursuant to Rule 17a-7 under the 1940 Act and under procedures adopted by the Board of Trustees. The procedures have been designed to ensure that these interfund transactions, which do not incur broker commissions, are effected at current market prices.
5. CAPITAL SHARE TRANSACTIONS
The Fund has authorized capital of 100,000,000 shares with no par value. For the six months ended April 30, 2019 and the year ended October 31, 2018, the Fund did not issue any shares.
On November 9, 2018, the Fund announced an extension of its open-market share repurchase program (the “Buyback Program”). Under the Buyback Program, the Fund may to repurchase up to 10% of its outstanding shares in open-market transactions beginning on January 1, 2019 and ending on December 31, 2019. The Fund’s Board of Trustees had delegated to Funds Management full discretion to administer the Buyback Program including the determination of the amount and timing of repurchases in accordance with the best interests of the Fund and subject to applicable legal limitations. During the six months ended April 30, 2019, the Fund purchased 826,455 of its shares on the open-market at a total cost of $9,919,812 (weighted average price per share of $11.99). The weighted average discount of these repurchased shares was 9.34 %.
| | | | |
| 40 | | Wells Fargo Multi-Sector Income Fund | | Notes to financial statements (unaudited) |
6. BORROWINGS
The Fund has borrowed $173,000,000 through a revolving credit facility administered by a major financial institution (the “Facility”). The Facility has a commitment amount of $230,000,000 with no specific contract expiration date but the Facility can be terminated upon 180 days’ notice. The Fund is charged interest at London Interbank Offered Rate (LIBOR) plus 0.70% and a commitment fee of 0.30% of the average daily unutilized amount of the commitment which may be waived if the amount drawn on the Facility is over 75% of the committed amount. The financial institution holds a security interest in all the assets of the Fund as collateral for the borrowing. Based on the nature of the terms of the Facility and comparative market rates, the carrying amount of the borrowings at April 30, 2019 approximates its fair value. If measured at fair value, the borrowings would be categorized as a Level 2 under the fair value hierarchy.
During the six months ended April 30, 2019, the Fund had average borrowings outstanding of $173,696,133 at an average interest rate of 3.18% and paid interest in the amount of $2,740,296, which represents 1.35% of its average daily net assets (on an annualized basis).
7. INVESTMENT PORTFOLIO TRANSACTIONS
Purchases and sales of investments, excluding U.S. government obligations (if any) and short-term securities, for the six months ended April 30, 2019 were $42,551,122 and $74,609,460, respectively.
As of April 30, 2019, the Fund had unfunded term loan commitments of $372,375.
8. INDEMNIFICATION
Under the Fund’s organizational documents, the officers and Trustees have been granted certain indemnification rights against certain liabilities that may arise out of performance of their duties to the Fund. Additionally, in the normal course of business, the Fund may enter into contracts with service providers that contain a variety of indemnification clauses. The Fund’s maximum exposure under these arrangements is dependent on future claims that may be made against the Fund and, therefore, cannot be estimated.
9. NEW ACCOUNTING PRONOUNCEMENTS
In August 2018, FASB issued Accounting Standards Update (“ASU”) No. 2018-13, Fair Value Measurement (Topic 820)Disclosure Framework—Changes to the Disclosure Requirements for Fair Value Measurement.ASU 2018-13 updates the disclosure requirements for fair value measurements by modifying or removing certain disclosures and adding certain new disclosures. The amendments are effective for fiscal years, and interim periods within those fiscal years, beginning after December 15, 2019. Early adoption is permitted. Management has adopted the removal and modification of disclosures early, as permitted, and will adopt the additional new disclosures at the effective date.
In March 2017, FASB issued ASU No. 2017-08,Premium Amortization on Purchased Callable Debt Securities. ASU 2017-08 shortens the amortization period for certain callable debt securities held at a premium. The amendments require the premium to be amortized to the earliest call date. The amendments do not require an accounting change for securities held at a discount; the discount continues to be amortized to maturity. ASU 2017-08 is effective for fiscal years beginning after December 15, 2018 and for interim periods within those fiscal years. Management is currently evaluating the potential impact of this new guidance to the financial statements.
10. SUBSEQUENT DISTRIBUTIONS
The Fund declared the following distributions to common shareholders:
| | | | | | |
| Declaration date | | Record date | | Payable date | | Per share amount |
| | | |
| April 26, 2019 | | May 14, 2019 | | June 3, 2019 | | $0.10054 |
| | | |
| May 22, 2019 | | June 14, 2019 | | July 1, 2019 | | 0.10006 |
These distributions are not reflected in the accompanying financial statements.
| | | | | | |
| Other information (unaudited) | | Wells Fargo Multi-Sector Income Fund | | | 41 | |
PROXY VOTING INFORMATION
A description of the policies and procedures used to determine how to vote proxies relating to portfolio securities is available, upon request, by calling1-800-222-8222, visiting our website atwfam.com, or visiting the SEC website at sec.gov. Information regarding how the Fund voted proxies relating to portfolio securities during the most recent 12-month period ended June 30 is available on the Fund’s website atwfam.comor by visiting the SEC website at sec.gov.
PORTFOLIO HOLDINGS INFORMATION
The complete portfolio holdings for the Fund are publicly available monthly on the Fund’s website (wfam.com), on a one-month delayed basis. The Fund files its complete schedule of portfolio holdings with the SEC for the first and third quarters of each fiscal year on Form N-Q, which is available by visiting the SEC website at sec.gov. In addition, the Fund’s Form N-Q may be reviewed and copied at the SEC’s Public Reference Room in Washington, DC, and at regional offices in New York City, at 233 Broadway, and in Chicago, at 175 West Jackson Boulevard, Suite 900. Information about the Public Reference Room may be obtained by calling1-800-SEC-0330.
| | | | |
| 42 | | Wells Fargo Multi-Sector Income Fund | | Other information (unaudited) |
BOARD OF TRUSTEES AND OFFICERS
The following table provides basic information about the Board of Trustees (the “Trustees”) and Officers of the Fund. Each of the Trustees and Officers1 listed below acts in identical capacities for each fund in the Wells Fargo family of funds, which consists of 151 mutual funds comprising the Wells Fargo Funds Trust, Wells Fargo Variable Trust, Wells Fargo Master Trust, and four closed-end funds, including the Fund (collectively the “Fund Complex”). The mailing address of each Trustee and Officer is 525 Market Street, 12th Floor, San Francisco, CA 94105. The Board of Trustees is classified into three classes of which one is elected annually. Each Trustee serves a three-year term concurrent with the class from which the Trustee is elected. Each Officer serves an indefinite term.
Independent Trustees
| | | | | | |
Name and year of birth | | Position held and
length of service | | Principal occupations during past five years or longer | | Current other
public company or
investment company
directorships |
|
| Class I - Non-Interested Trustees to serve until 2020 Annual Meeting of Shareholders |
| | | |
Isaiah Harris, Jr. (Born 1952) | | Trustee, since 2010; Audit Committee Chairman, since 2019 | | Retired. Chairman of the Board of CIGNA Corporation since 2009, and Director since 2005. From 2003 to 2011, Director of Deluxe Corporation. Prior thereto, President and CEO of BellSouth Advertising and Publishing Corp. from 2005 to 2007, President and CEO of BellSouth Enterprises from 2004 to 2005 and President of BellSouth Consumer Services from 2000 to 2003. Emeritus member of the Iowa State University Foundation Board of Governors. Emeritus Member of the Advisory Board of Iowa State University School of Business. Advisory Board Member, Palm Harbor Academy (private school). Advisory Board Member, Child Evangelism Fellowship (non-profit). Mr. Harris is a certified public accountant (inactive status). | | CIGNA Corporation |
| | | |
David F. Larcker (Born 1950) | | Trustee, since 2010 | | James Irvin Miller Professor of Accounting at the Graduate School of Business, Stanford University, Director of the Corporate Governance Research Initiative and Senior Faculty of The Rock Center for Corporate Governance since 2006. From 2005 to 2008, Professor of Accounting at the Graduate School of Business, Stanford University. Prior thereto, Ernst & Young Professor of Accounting at The Wharton School, University of Pennsylvania from 1985 to 2005. | | N/A |
| | | |
Olivia S. Mitchell (Born 1953) | | Trustee, since 2010; Nominating and Governance Committee Chairman, since 2018 | | International Foundation of Employee Benefit Plans Professor, Wharton School of the University of Pennsylvania since 1993. Director of Wharton’s Pension Research Council and Boettner Center on Pensions & Retirement Research, and Research Associate at the National Bureau of Economic Research. Previously, Cornell University Professor from 1978 to 1993. | | N/A |
|
| Class II - Non-Interested Trustees to serve until 2021 Annual Meeting of Shareholders |
| | | |
William R. Ebsworth (Born 1957) | | Trustee, since 2015 | | Retired. From 1984 to 2013, equities analyst, portfolio manager, research director and chief investment officer at Fidelity Management and Research Company in Boston, Tokyo, and Hong Kong, and retired in 2013 as Chief Investment Officer of Fidelity Strategic Advisers, Inc. where he led a team of investment professionals managing client assets. Prior thereto, Board member of Hong Kong Securities Clearing Co., Hong Kong Options Clearing Corp., the Thailand International Fund, Ltd., Fidelity Investments Life Insurance Company, and Empire Fidelity Investments Life Insurance Company. Audit Committee Chair and Investment Committee Chair of the Vincent Memorial Hospital Endowment (non-profit organization). Mr. Ebsworth is a CFA® charterholder. | | N/A |
| | | |
Jane A. Freeman (Born 1953) | | Trustee, since 2015; Chair Liaison, since 2018 | | Retired. From 2012 to 2014 and 1999 to 2008, Chief Financial Officer of Scientific Learning Corporation. From 2008 to 2012, Ms. Freeman provided consulting services related to strategic business projects. Prior to 1999, Portfolio Manager at Rockefeller & Co. and Scudder, Stevens & Clark. Board member of the Harding Loevner Funds from 1996 to 2014, serving as both Lead Independent Director and chair of the Audit Committee. Board member of the Russell Exchange Traded Funds Trust from 2011 to 2012 and the chair of the Audit Committee. Ms. Freeman is a Board Member of The Ruth Bancroft Garden (non-profit organization). She is also an inactive Chartered Financial Analyst. | | N/A |
| | | | | | |
| Other information (unaudited) | | Wells Fargo Multi-Sector Income Fund | | | 43 | |
| | | | | | |
Name and year of birth | | Position held and
length of service | | Principal occupations during past five years or longer | | Current other
public company or
investment company
directorships |
| | | |
Judith M. Johnson (Born 1949) | | Trustee, since 2010; Audit Committee Chairman, from 2010 to 2018 | | Retired. Prior thereto, Chief Executive Officer and Chief Investment Officer of Minneapolis Employees Retirement Fund from 1996 to 2008. Ms. Johnson is an attorney, certified public accountant and a certified managerial accountant. | | N/A |
|
| Class III - Non-Interested Trustees to serve until 2022 Annual Meeting of Shareholders |
| | | |
Timothy J. Penny (Born 1951) | | Trustee, since 2010; Chairman, since 2018 | | President and Chief Executive Officer of Southern Minnesota Initiative Foundation, a non-profit organization, since 2007. Member of the Board of Trustees of NorthStar Education Finance, Inc., a non-profit organization, since 2007. | | N/A |
| | | |
James G. Polisson (Born 1959) | | Trustee, since 2018 | | Retired. Chief Marketing Officer, Source (ETF) UK Services, Ltd, from 2015 to 2017. From 2012 to 2015, Principal of The Polisson Group, LLC, a management consulting, corporate advisory and principal investing company. Chief Executive Officer and Managing Director at Russell Investments, Global Exchange Traded Funds from 2010 to 2012. Managing Director of Barclays Global Investors from 1998 to 2010 and Global Chief Marketing Officer for iShares and Barclays Global Investors from 2000 to 2010. Trustee of the San Francisco Mechanics’ Institute, a non-profit organization, from 2013 to 2015. Board member of the Russell Exchange Traded Fund Trust from 2011 to 2012. Director of Barclays Global Investors Holdings Deutschland GmbH from 2006 to 2009. Mr. Polisson is an attorney and has a retired status with the Massachusetts and District of Columbia Bar Associations. | | N/A |
| | | |
Pamela Wheelock (Born 1959) | | Trustee, since 2018 | | Board member of the Destination Medical Center Economic Development Agency, Rochester, Minnesota since 2019. Chief Operating Officer, Twin Cities Habitat for Humanity from 2017 to 2019. Vice President of University Services, University of Minnesota from 2012 to 2016. Prior thereto, on the Board of Directors, Governance Committee and Finance Committee for the Minnesota Philanthropy Partners (Saint Paul Foundation) from 2012 to 2018, Interim Chief Executive Officer of Blue Cross Blue Shield of Minnesota from 2011 to 2012, Chairman of the Board from 2009 to 2012 and Board Director from 2003 to 2015. Vice President, Leadership and Community Engagement, Bush Foundation, Saint Paul, Minnesota (a private foundation) from 2009 to 2011. Executive Vice President and Chief Financial Officer, Minnesota Sports and Entertainment from 2004 to 2009 and Senior Vice President from 2002 to 2004. Executive Vice President of the Minnesota Wild Foundation from 2004 to 2008. Commissioner of Finance, State of Minnesota, from 1999 to 2002. Currently Board Chair of the Minnesota Wild Foundation since 2010. | | N/A |
| | | | |
| 44 | | Wells Fargo Multi-Sector Income Fund | | Other information (unaudited) |
Officers
| | | | | | |
Name and year of birth | | Position held and
length of service | | Principal occupations during past five years or longer | | |
| | | |
Andrew Owen (Born 1960) | | President, since 2017 | | Executive Vice President of Wells Fargo & Company and Head of Affiliated Managers, Wells Fargo Asset Management, since 2014. In addition, Mr. Owen is currently President, Chief Executive Officer and Director of Wells Fargo Funds Management, LLC since 2017. Prior thereto, Executive Vice President responsible for marketing, investments and product development for Wells Fargo Funds Management, LLC, from 2009 to 2014. | | |
| | | |
Jeremy DePalma1 (Born 1974) | | Treasurer, since 2012 | | Senior Vice President of Wells Fargo Funds Management, LLC since 2009. Senior Vice President of Evergreen Investment Management Company, LLC from 2008 to 2010 and head of the Fund Reporting and Control Team within Fund Administration from 2005 to 2010. | | |
| | | |
Alexander Kymn (Born 1973) | | Secretary, since 2018; Chief Legal Officer, since 2018 | | Senior Company Counsel of Wells Fargo Bank, N.A. since 2018 (previously Senior Counsel from 2007 to 2018). Vice President of Wells Fargo Funds Management, LLC from 2008 to 2014. | | |
| | | |
Michael H. Whitaker (Born 1967) | | Chief Compliance Officer, since 2016 | | Senior Vice President and Chief Compliance Officer since 2016. Senior Vice President and Chief Compliance Officer for Fidelity Investments from 2007 to 2016. | | |
| | | |
David Berardi (Born 1975) | | Assistant Treasurer, since 2009 | | Vice President of Wells Fargo Funds Management, LLC since 2009. Vice President of Evergreen Investment Management Company, LLC from 2008 to 2010. Manager of Fund Reporting and Control for Evergreen Investment Management Company, LLC from 2004 to 2010. | | |
| 1 | Jeremy DePalma acts as Treasurer of 86 funds and Assistant Treasurer of 65 funds in the Fund Complex. |
| | | | | | |
| Automatic dividend reinvestment plan | | Wells Fargo Multi-Sector Income Fund | | | 45 | |
AUTOMATIC DIVIDEND REINVESTMENT PLAN
All common shareholders are eligible to participate in the Automatic Dividend Reinvestment Plan (“the Plan”). Pursuant to the Plan, unless a common shareholder is ineligible or elects otherwise, all cash dividends and capital gains distributions are automatically reinvested by Computershare Trust Company, N.A., as agent for shareholders in administering the Plan (“Plan Agent”), in additional common shares of the Fund. Whenever the Fund declares an ordinary income dividend or a capital gain dividend (collectively referred to as “dividends”) payable either in shares or in cash, nonparticipants in the Plan will receive cash, and participants in the Plan will receive the equivalent in common shares. The shares are acquired by the Plan Agent for the participant’s account, depending upon the circumstances described below, either (i) through receipt of additional unissued but authorized common shares from the Fund (“newly issued common shares”) or (ii) by purchase of outstanding common shares on the open-market (open-market purchases) on the NYSE Amex or elsewhere. If, on the payment date for any dividend or distribution, the net asset value per share of the common shares is equal to or less than the market price per common share plus estimated brokerage commissions (“market premium”), the Plan Agent will invest the amount of such dividend or distribution in newly issued shares on behalf of the participant. The number of newly issued common shares to be credited to the participant’s account will be determined by dividing the dollar amount of the dividend by the net asset value per share on the date the shares are issued, provided that the maximum discount from the then current market price per share on the date of issuance may not exceed 5%. If on the dividend payment date the net asset value per share is greater than the market value (“market discount”), the Plan Agent will invest the dividend amount in shares acquired on behalf of the participant in open-market purchases. There will be no brokerage charges with respect to shares issued directly by the Fund as a result of dividends or capital gains distributions payable either in shares or in cash. However, each participant will pay a pro rata share of brokerage commissions incurred with respect to the Plan Agent’s open-market purchases in connection with the reinvestment of dividends. The automatic reinvestment of dividends and distributions will not relieve participants of any federal, state or local income tax that may be payable (or required to be withheld) on such dividends. All correspondence concerning the Plan should be directed to the Plan Agent at 505000, Louisville, Kentucky 40233 or by calling 1-800-730-6001.
This page is intentionally left blank.
This page is intentionally left blank.
This page is intentionally left blank.

Transfer Agent, Registrar, Shareholder Servicing
Agent & Dividend Disbursing Agent
Computershare Trust Company, N.A.
P.O. Box 505000
Louisville, Kentucky 40233
1-800-730-6001
Website: wfam.com
Wells Fargo Asset Management (WFAM) is the trade name for certain investment advisory/ management firms owned by Wells Fargo & Company. These firms include but are not limited to Wells Capital Management Incorporated and Wells Fargo Funds Management, LLC. Certain products managed by WFAM entities are distributed by Wells Fargo Funds Distributor, LLC (a broker-dealer and Member FINRA).
This material is for general informational and educational purposes only and is NOT intended to provide investment advice or a recommendation of any kind—including a recommendation for any specific investment, strategy, or plan.
INVESTMENT PRODUCTS: NOT FDIC INSURED ◾ NO BANK GUARANTEE ◾ MAY LOSE VALUE
© 2019 Wells Fargo Funds Management, LLC. All rights reserved.
| | |
 | | 402352 06-19 SMSI/SAR159 04-19 |
Not applicable.
| ITEM 3. | AUDIT COMMITTEE FINANCIAL EXPERT |
Not applicable.
| ITEM 4. | PRINCIPAL ACCOUNTANT FEES AND SERVICES |
Not applicable.
| ITEM 5. | AUDIT COMMITTEE OF LISTED REGISTRANTS |
Not applicable.
A Portfolio of Investments for Wells Fargo Multi-Sector Income Fund is included as part of the report to shareholders filed under Item 1 of this Form.
| ITEM 7. | DISCLOSURE OF PROXY VOTING POLICIES AND PROCEDURES FORCLOSED-END MANAGEMENT INVESTMENT COMPANIES |
Not applicable.
| ITEM 8. | PORTFOLIO MANAGERS OFCLOSED-END MANAGEMENT INVESTMENT COMPANIES |
Not applicable.
| ITEM 9. | PURCHASES OF EQUITY SECURITIES BYCLOSED-END MANAGEMEENT INVESTMENT COMPANY AND AFFILIATED PURCHASERS |
| | | | | | | | | | | | | | | | |
Period | | (a)
Total
Number
of Shares
Purchased | | | (b)
Average
Price Paid
per Share | | | (c)
Total Number of
Shares Purchased
as Part of Publicly
Announced Plans
or Programs | | | (d)
Maximum
Number of
Shares that
May Yet Be
Purchased
Under the
Plans or
Programs | |
11/1/2018 to 11/30/2018 | | | 91,007 | | | | 11.71 | | | | 91,007 | | | | 5,778 | |
12/1/2017 to 12/31/2017 | | | 0 | | | | 0 | | | | 0 | | | | 5,778 | |
1/1/2019 to 1/31/2019 | | | 246,431 | | | | 11.57 | | | | 246,431 | | | | 2,898,718 | |
2/1/2019 to 2/28/2019 | | | 0 | | | | 0 | | | | 0 | | | | 2,898,718 | |
3/1/2019 to 3/31/2019 | | | 99,595 | | | | 12.16 | | | | 99,595 | | | | 2,799,123 | |
4/1/2019 to 4/30/19 | | | 389,422 | | | | 12.27 | | | | 389,422 | | | | 2,409,701 | |
Total | | | 826,455 | | | | 12.00 | | | | 826,455 | | | | 2,409,701 | |
On November 9, 2018, the Fund announced an extension of its open-market share repurchase program (the “Buyback Program”). Under the extended Buyback Program, the Fund may repurchase up to 10% of its outstanding shares during the period in open-market transactions beginning on January 1, 2019 and ending on December 31, 2019.
| ITEM 10. | SUBMISSION OF MATTERS TO A VOTE OF SECURITY HOLDERS |
There have been no material changes to the procedures by which shareholders may recommend nominees to the registrant’s Board of Trustees that have been implemented since the registrant’s last provided disclosure in response to the requirements of this Item.
| ITEM 11. | CONTROLS AND PROCEDURES |
(a) The President and Treasurer have concluded that the Wells Fargo Multi-Sector Income Fund disclosure controls and procedures (as defined in Rule30a-3(c) under the Investment Company Act of 1940) provide reasonable assurances that material information relating to the registrant is made known to them by the appropriate persons, based on their evaluation of these controls and procedures as of a date within 90 days of the filing of this report.
(b) There were no significant changes in the registrant’s internal controls over financial reporting (as defined in Rule30a-3(d) under the Investment Company Act of 1940) that occurred during the most recent fiscal quarter of the period covered by this report that materially affected, or is reasonably likely to materially affect, the registrant’s internal control over financial reporting.
| ITEM 12. | DISCLOSURES OF SECURITIES LENDING ACTIVITES FORCLOSED-END MANAGEMENT INVESTMENT COMPANIES |
Not applicable.
(a)(1) Not applicable
(a)(2) Certification pursuant to Rule30a-2(a) under the Investment Company Act of 1940 (17 CFR270.30a-2(a)) is filed and attached hereto as Exhibit 99.CERT.
(b) Certification pursuant to Rule30a-2(b) under the Investment Company Act of 1940 (17 CFR270.30a-2(b)) is filed and attached hereto as Exhibit 99.906CERT.
SIGNATURES
Pursuant to the requirements of the Securities Exchange Act of 1934 and the Investment Company Act of 1940, the registrant has duly caused this report to be signed on its behalf by the undersigned, thereunto duly authorized.
| | |
| Wells Fargo Multi-Sector Income Fund |
| |
| By: | | |
| | /s/ Andrew Owen |
| |
| | Andrew Owen |
| | President |
| |
| Date: | | June 26, 2019 |
Pursuant to the requirements of the Securities Exchange Act of 1934 and the Investment Company Act of 1940, this report has been signed below by the following persons on behalf of the registrant and in the capacities and on the date indicated.
| | |
| Wells Fargo Multi-Sector Income Fund |
| |
| By: | | |
| | /s/ Andrew Owen |
| |
| | Andrew Owen |
| | President |
| |
| Date: | | June 26, 2019 |
| |
| By: | | |
| | /s/ Jeremy DePalma |
| |
| | Jeremy DePalma |
| | Treasurer |
| |
| Date: | | June 26, 2019 |