
UNITED STATES
SECURITIES AND EXCHANGE COMMISSION
Washington, D.C. 20549
FORMN-CSRS
CERTIFIED SHAREHOLDER REPORT OF REGISTERED
MANAGEMENT INVESTMENT COMPANIES
Investment Company Act file number:811-21331
Wells Fargo Multi-Sector Income Fund
(Exact name of registrant as specified in charter)
525 Market St., San Francisco, CA 94105
(Address of principal executive offices) (Zip code)
Catherine Kennedy
Wells Fargo Funds Management, LLC
525 Market St., San Francisco, CA 94105
(Name and address of agent for service)
Registrant’s telephone number, including area code:800-222-8222
Date of fiscal year end: October 31
Date of reporting period: April 30, 2020
ITEM 1. REPORT TO STOCKHOLDERS
Semi-Annual Report
April 30, 2020
Wells Fargo
Multi-Sector Income Fund (ERC)
Beginning on January 1, 2021, as permitted by new regulations adopted by the Securities and Exchange Commission, paper copies of the Wells Fargo Funds’ annual and semi-annual shareholder reports issued after this date will no longer be sent by mail, unless you specifically request paper copies of the reports. Instead, the reports will be made available on the Funds’ website, and you will be notified by mail each time a report is posted and provided with a website address to access the report.
If you already elected to receive shareholder reports electronically, you will not be affected by this change and you need not take any action. You may elect to receive shareholder reports and other communications from the Fund electronically at any time by contacting your financial intermediary (such as a broker-dealer or bank) or, if you are a direct investor, by calling 1-800-730-6001.
You may elect to receive all future reports in paper free of charge. If you invest through a financial intermediary, you can contact your financial intermediary to request that you continue to receive paper copies of your shareholder reports; if you invest directly with the Fund, you can call 1-800-730-6001. Your election to receive reports in paper will apply to all Wells Fargo Funds held in your account with your financial intermediary or, if you are a direct investor, to all Wells Fargo Funds that you hold.
|
|
|
Reduce clutter. Save trees. |
Sign up for electronic delivery of prospectuses and shareholder reports atwellsfargo.com/advantagedelivery |
The views expressed and any forward-looking statements are as of April 30, 2020, unless otherwise noted, and are those of the Fund managers and/or Wells Fargo Asset Management. Discussions of individual securities, or the markets generally, or any Wells Fargo Fund are not intended as individual recommendations. Future events or results may vary significantly from those expressed in any forward-looking statements. The views expressed are subject to change at any time in response to changing circumstances in the market. Wells Fargo Asset Management and the Fund disclaim any obligation to publicly update or revise any views expressed or forward-looking statements.
INVESTMENT PRODUCTS: NOT FDIC INSURED ◾ NO BANK GUARANTEE ◾ MAY LOSE VALUE
Wells Fargo Multi-Sector Income Fund | 1
Letter to shareholders (unaudited)

Andrew Owen
President
Wells Fargo Funds
“The period began with a tailwind created by central bank support.”
Dear Shareholder:
We are pleased to offer you this semi-annual report for the Wells Fargo Multi-Sector Income Fund for the six-month period that ended April 30, 2020. Global stock markets saw earlier gains erased in February and March as governments took unprecedented measures to stop the spread of the coronavirus at the expense of short-term economic output. Markets rebounded in April to lessen the losses as central banks attempted to bolster capital markets and confidence. Fixed-income markets performed better, with the exception of high-yield bonds, as U.S. bonds overall achieved modest gains.
For the six-month period, U.S. stocks, based on the S&P 500 Index,1 returned -3.16% and international stocks, as measured by the MSCI ACWI ex USA Index (Net),2 fell 13.22%. The MSCI EM Index (Net)3 lost 10.50%. For bond investors, the Bloomberg Barclays U.S. Aggregate Bond Index4 added 4.86%, the Bloomberg Barclays Global Aggregate ex-USD Index5 returned -0.97%, the Bloomberg Barclays Municipal Bond Index6 returned -1.33%, and the ICE BofA U.S. High Yield Index7 lost 7.68%.
The period began with a tailwind created by central bank support.
The period began with a tailwind that had been created by U.S. Federal Reserve (Fed) rate cuts in the summer and early fall. Equity markets rallied in November despite ongoing geopolitical risks. Hopes for a U.S.-China trade deal buoyed investor confidence. U.S. business sentiment edged up, and manufacturing and services activity rose. With that positive backdrop, developed market equities outpaced those in emerging markets, and U.S. stocks outperformed non-U.S. stocks overall. While consumer confidence and purchasing manager activity rose in the eurozone, China reported weakening manufacturing and consumer data. Bond yields rose marginally, leading to slightly negative returns for global government and investment-grade corporate bonds.
Financial markets ended 2019 with a boost from the U.S. and China accord on a Phase One trade deal. That, along with the landslide win by the pro-Brexit U.K. Conservative Party in a national election and ongoing central bank support, gave investors greater confidence. U.S. economic indicators were positive overall, with the exception of manufacturing activity and business confidence. Consumer confidence was resilient, fed by a robust labor market, tame inflation, and lower interest rates, which boosted housing affordability and stimulated homebuyer activity. The impeachment of U.S. President Donald Trump had little impact on markets. Meanwhile, slowing Chinese economic activity, partly attributable to the trade war, led to further government stimulus at year-end through lower reserve ratios, allowing banks to lend more money.
The year-end rally continued in early January 2020. However, capital market volatility spiked in late January on concerns over the potential impact of the coronavirus on the
| 1 | The S&P 500 Index consists of 500 stocks chosen for market size, liquidity, and industry group representation. It is a market-value-weighted index with each stock’s weight in the index proportionate to its market value. You cannot invest directly in an index. |
| 2 | The Morgan Stanley Capital International (MSCI) All Country World Index (ACWI) ex USA Index (Net) is a free-float-adjusted market-capitalization-weighted index that is designed to measure the equity market performance of developed markets, excluding the United States. Source: MSCI. MSCI makes no express or implied warranties or representations and shall have no liability whatsoever with respect to any MSCI data contained herein. The MSCI data may not be further redistributed or used as a basis for other indices or any securities or financial products. This report is not approved, reviewed, or produced by MSCI. You cannot invest directly in an index. |
| 3 | The MSCI Emerging Markets (EM) Index (Net) is a free-float-adjusted market-capitalization-weighted index that is designed to measure equity market performance of emerging markets. You cannot invest directly in an index. |
| 4 | The Bloomberg Barclays U.S. Aggregate Bond Index is a broad-based benchmark that measures the investment-grade, U.S. dollar-denominated, fixed-rate taxable bond market, including Treasuries, government-related and corporate securities, mortgage-backed securities (agency fixed-rate and hybrid adjustable-rate mortgage pass-throughs), asset-backed securities, and commercial mortgage-backed securities. You cannot invest directly in an index. |
| 5 | The Bloomberg Barclays Global Aggregate ex-USD Index is an unmanaged index that provides a broad-based measure of the global investment-grade fixed-income markets excluding the U.S. dollar-denominated debt market. You cannot invest directly in an index. |
| 6 | The Bloomberg Barclays Municipal Bond Index is an unmanaged index composed of long-term tax-exempt bonds with a minimum credit rating of Baa. You cannot invest directly in an index. |
| 7 | The ICE BofA U.S. High Yield Index is a market-capitalization-weighted index of domestic and Yankee high-yield bonds. The index tracks the performance of high-yield securities traded in the U.S. bond market. You cannot invest directly in an index. Copyright 2020. ICE Data Indices, LLC. All rights reserved. |
2 | Wells Fargo Multi-Sector Income Fund
Letter to shareholders (unaudited)
global economy and stock markets. With sentiment somewhat souring, perceived safe havens did well in January. The U.S. dollar and Japanese yen both rose, and government bonds outperformed equities. While the S&P 500 Index held its ground, emerging market equities tumbled, including those in Asia.
In February, the coronavirus became the major market focus. Fears of the virus’s impact on global growth led to expectations of increased global central bank monetary policy support. That led the 10-year U.S. Treasury yield to fall to an all-time low of 1.1% by the end of the month. Although equity markets initially shrugged off concerns about the outbreak, focusing instead on strong fourth-quarter earnings and improving business confidence in January, market sentiment turned sharply lower toward month-end. Oil prices tumbled as Russia and the Organization of the Petroleum Exporting Countries compounded a major decline in oil demand with a brutal price war, causing the price of West Texas Intermediate crude oil to fall 13% in February alone.
The global spread of the coronavirus led many countries to clamp down on social and business-related activity in order to contain the virus from causing even greater devastation and overwhelming the health care system. This abrupt stoppage of economic activity led to the sharp deceleration of global output, sending economies into a deep contraction. Central bank responses were swift, as they slashed interest rates and expanded quantitative easing programs to restore liquidity and confidence to the markets. In the U.S., the Fed launched several lending programs, funding investment-grade bonds, money market mutual funds, and commercial paper while purchasing Treasuries, mortgage-backed securities, and overnight repurchase agreements. Meanwhile, stock markets tumbled quickly into a bear market, ending the longest bull stock market in U.S. history.
Markets rebounded strongly in April after the extreme volatility of the previous two months, with the S&P 500 Index gaining 12.8% for the month and the MSCI ACWI ex USA Index (Net) returning 7.6%. The rebound was fueled by unprecedented stimulus measures taken by governments and central banks to buffer the economic damage created by mass shutdowns to try to contain the virus’s spread. The U.S. economy contracted by an annualized 4.8% pace in the first quarter, with 30 million new unemployment insurance claims in six weeks. In the eurozone, first-quarter real gross domestic product (GDP) shrank 3.8%, with the composite April Flash Purchasing Managers’ Index, a monthly survey of purchasing managers, falling to an all-time low of 13.5. The European Central Bank expanded its quantitative easing to include the purchase of additional government bonds of countries with the greatest virus-related need, including Italy and Spain. China’s first-quarter GDP fell by 6.8% year over year. However, retail sales, production, and investment showed signs of recovery. Extreme oil price volatility continued as global supply far exceeded demand.
Don’t let short-term uncertainty derail long-term investment goals.
Periods of investment uncertainty can present challenges, but experience has taught us that maintaining long-term investment goals can be an effective way to plan for the future. Although diversification cannot guarantee an investment profit or prevent losses, we believe it can be an effective way to manage investment risk and potentially smooth out overall portfolio performance. We encourage investors to know their investments and to understand that appropriate levels of risk-taking may unlock opportunities.
Thank you for choosing to invest with Wells Fargo Funds. We appreciate your confidence in us and remain committed to helping you meet your financial needs.
Sincerely,

Andrew Owen
President
Wells Fargo Funds
“The global spread of the coronavirus led many countries to clamp down on social and business-related activity in order to contain the virus from causing even greater devastation and overwhelming the health care system.”
|
|
|
For further information about your Fund, contact your investment professional, visit our website at wfam.com, or call us directly at1-800-222-8222. |
Wells Fargo Multi-Sector Income Fund | 3
Letter to shareholders (unaudited)
Notice to Shareholders
| | ∎ | | On November 22, 2019, the Fund announced a renewal of its open-market share repurchase program (the “Buyback Program”). Under the renewed Buyback Program, the Fund may repurchase up to 10% of its outstanding shares in open- market transactions during the period beginning January 1, 2020 and ending on December 31, 2020. The Fund’s Board of Trustees has delegated to Wells Fargo Funds Management, LLC, the Fund’s adviser, discretion to administer the Buyback Program, including the determination of the amount and timing of repurchases in accordance with the best interests of the Fund and subject to applicable legal limitations. |
| | ∎ | | The Fund’s managed distribution plan provides for the declaration of monthly distributions to common shareholders of the Fund at an annual minimum fixed rate of 9% based on the Fund’s average monthly net asset value per share over the prior 12 months. Under the managed distribution plan, monthly distributions may be sourced from income,paid-in capital, and/or capital gains, if any. To the extent that sufficient investment income is not available on a monthly basis, the Fund may distributepaid-in capital and/or capital gains, if any, in order to maintain its managed distribution level. You should not draw any conclusions about the Fund’s investment performance from the amount of the Fund’s distributions or from the terms of the managed distribution plan. Shareholders may elect to reinvest distributions received pursuant to the managed distribution plan in the Fund under the existing dividend reinvestment plan, which is described later in this report. |
4 | Wells Fargo Multi-Sector Income Fund
This page is intentionally left blank.
Performance highlights (unaudited)
Investment objective
The Fund seeks a high level of current income consistent with limiting its overall exposure to domestic interest rate risk.
Strategy summary
The Fund allocates its assets between three separate investment strategies, or sleeves. Under normal market conditions, the Fund will allocate approximately30%-70% of its total assets to a sleeve consisting of noninvestment-grade (high yield) corporate debt, including floating-rate high yield bank loan securities; approximately10%-40% to a sleeve of foreign debt securities, including emerging market debt; and approximately10%-30% to a sleeve of adjustable-rate and fixed-rate mortgage-backed securities, and investment grade corporate bonds.
Adviser
Wells Fargo Funds Management, LLC
Subadvisers
Wells Capital Management Incorporated
Wells Fargo Asset Management (International), Limited
Portfolio managers
Christopher Y. Kauffman, CFA®‡
Michael Lee
Niklas Nordenfelt, CFA®‡
Alex Perrin
Phillip Susser
Lauren van Biljon, CFA®‡
Peter Wilson
Noah Wise, CFA®‡
Average annual total returns (%) as of April 30, 20201
| | | | | | | | | | | | | | | | |
| | | | |
| | | 6 months | | | 1 year | | | 5 year | | | 10 year | |
| | | | | |
| Based on market value | | | -16.73 | | | | -10.69 | | | | 3.67 | | | | 4.59 | |
| | | | | |
| Based on net asset value (NAV) | | | -11.21 | | | | -7.50 | | | | 3.14 | | | | 5.34 | |
| | | | | |
| Multi-Sector Income Blended Index2 | | | -6.02 | | | | -2.01 | | | | 2.83 | | | | 4.25 | |
| | | | | |
| Bloomberg Barclays Credit Bond Index3 | | | 1.77 | | | | 9.37 | | | | 4.33 | | | | 5.04 | |
| | | | | |
| Bloomberg Barclays U.S. Securitized Index4 | | | 3.65 | | | | 7.66 | | | | 3.07 | | | | 3.36 | |
| | | | | |
| ICE BofA U.S. Cash Pay High Yield Index5 | | | -7.64 | | | | -5.21 | | | | 3.20 | | | | 5.66 | |
| | | | | |
| ICE BofA U.S. High Yield Constrained Index6 | | | -7.69 | | | | -5.27 | | | | 3.20 | | | | 5.65 | |
| | | | | |
| J.P. MorganGBI-EM Global Diversified Composite Index7 | | | -9.91 | | | | -2.68 | | | | 0.44 | | | | 0.72 | |
| | | | | |
| J.P. Morgan Global Government Bond Index (ex U.S.)8 | | | -0.73 | | | | 4.60 | | | | 2.52 | | | | 1.78 | |
Figures quoted represent past performance, which is no guarantee of future results, and do not reflect taxes that a shareholder may pay on an investment in a fund. Investment return and principal value of an investment will fluctuate so that an investor’s shares, when redeemed may be worth more or less than their original cost. Current performance may be lower or higher than the performance data quoted, which assumes the reinvestment of dividends and capital gains. Performance figures of the Fund do not reflect brokerage commissions that a shareholder would pay on the purchase and sale of shares. If taxes and such brokerage commissions had been reflected, performance would have been lower. To obtain performance information current to the most recentmonth-end, please call1-800-222-8222.
The Fund’s annualized expense ratio for the six months ended April 30, 2020, was 2.16% which includes 1.17% of interest expense.
|
|
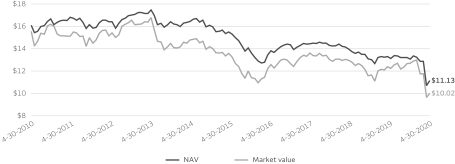
| Comparison of NAV vs. market value9 |
|
|
The Fund is leveraged through a revolving credit facility and also may incur leverage by issuing preferred shares in the future. The use of leverage results in certain risks, including, among others, the likelihood of greater volatility of the net asset value and the market value of common shares. Foreign investments are especially volatile and can rise or fall dramatically due to differences in the political and economic conditions of the host country. These risks are generally intensified in emerging markets. Derivatives involve additional risks, including interest rate risk, credit risk, the risk of improper valuation, and the risk ofnon-correlation to the relevant instruments that they are designed to hedge or closely track. Bond values fluctuate in response to the financial condition of individual issuers, general market and economic conditions, and changes in interest rates. Changes in market conditions and government policies may lead to periods of heightened volatility in the bond market and reduced liquidity for certain bonds held by the Fund. In general, when interest rates rise, bond values fall and investors may lose principal value. Interest rate changes and their impact on the Fund and its share price can be sudden and unpredictable. High-yield securities have a greater risk of default and tend to be more volatile than higher-rated debt securities. The Fund is exposed to mortgage- and asset-backed securities risk. Thisclosed-end fund is no longer available as an initial public offering and is only offered through broker/dealers on the secondary market. Aclosed-end fund is not required to buy back its shares from investors upon request.
Please see footnotes on page 9.
6 | Wells Fargo Multi-Sector Income Fund
Performance highlights (unaudited)
MANAGERS’ DISCUSSION
The Fund’s return based on market value was-16.73% for thesix-month period that ended April 30, 2020. During the same period, the Fund’s return based on its net asset value (NAV) was-11.21%. Based on its NAV based returns, the Fund underperformed the Multi-Sector Income Blended Index, which returned-6.02% for thesix-month period.
Tumultuous period led to wide-scale investment losses.
The reporting period covered a tumultuous period in international markets, with the slow grind of 2019 morphing into a dramatic economic collapse in the first quarter of 2020 as several market-moving events hit at once. The spread of the coronavirus caused cascading economic and societal shutdowns. Oil prices nosedived in the wake of a Saudi Arabia-Russia disagreement on production targets. Finally, a global shortage of U.S. dollars caused severe dislocations in market pricing and liquidity. These events took a heavy toll on risk assets—including emerging markets—with currencies materially underperforming local-currency bond markets.
There were several changes to the Fund’s positioning within international and emerging market bonds. Thinner valuations and concerns over external accounts prompted a reduction in exposure to Colombia (5.9% decline in exposure), Brazil(-3.8%), and Peru(-4.6%). This allowed increased allocations to sovereign bonds in India (+9.5%) and Romania (+5.2%). Changes to interest rate positioning were echoed at the currency level. Overall duration was reduced as a defensive measure.
The Fund’s international/emerging market return based on market value was-8.19% for thesix-month period that ended April 30, 2020.
During the period, high-yield bonds returned-7.69% (as measured by the ICE BofA U.S. High Yield Constrained Index) with a positive return in three months through January 2020 followed by a decline in February and a fall of more than 11.5% in March and a mild rebound in April. Spread widening over the period more than offset a decline in Treasury yields and the yield on the index increased. Not surprisingly in thisrisk-off environment, lower-rated bonds underperformed higher-rated high-yield bonds.
For thesix-month period, corporate bonds andnon-agency securitized sectors significantly underperformed U.S. Treasuries. Spreads in all risk products widened in March as a result of escalating concern over the economic impact of the coronavirus pandemic, then retraced a portion of the underperformance in April due to large-scale U.S. Federal Reserve (Fed) intervention. Over the period, the Bloomberg Barclays U.S. Corporate Bond Index10 widened 92 basis points (bps; 100 bps equal 1.00%), underperforming like-duration U.S. Treasuries by 7.20%. TheBBB-rated component of the index widened 123 bps, trailing like-duration Treasuries by 9.23%. Securitized sectors delivered mixed performance over the period, with agency mortgage-backed securities tightening 10 bps with 0.22% excess returns (over like-duration Treasuries) driven by massive Fed bond buying in the sector, while credit securitized sectors all materially underperformed like-duration Treasuries. Conduit commercial mortgage-backed securities (CMBS) spreads widened 149 bps, withBBB-rated bonds widening by more than 800 bps.AAA-rated asset-backed securities (ABS) and residential mortgage-backed securities (MBS) sectors widened 118 bps and 160 bps, respectively.
| | | | |
|
| Ten largest holdings(%) as of April 30, 202011 | |
| | |
India, 7.32%,1-28-2024 | | | 3.03 | |
| | |
Romania, 3.25%,4-29-2024 | | | 3.03 | |
| | |
Mexico, 8.50%,5-31-2029 | | | 2.80 | |
| | |
Malaysia, 4.23%,6-30-2031 | | | 2.79 | |
| | |
Indonesia, 8.38%,9-15-2026 | | | 2.27 | |
| | |
Colombia, 7.50%,8-26-2026 | | | 1.83 | |
| | |
Russia, 6.90%,5-23-2029 | | | 1.72 | |
| | |
Russia, 6.50%,2-28-2024 | | | 1.62 | |
| | |
Malaysia, 4.18%,7-15-2026 | | | 1.47 | |
| | |
Mexico, 5.75%,3-5-2026 | | | 1.44 | |
|
|
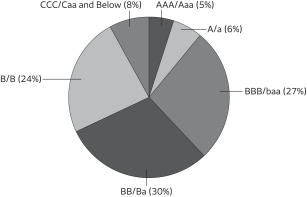
| Credit qualityas of April 30, 202012 |
|
 |
Detractors from performance included high-yield energy credits, emerging market securities, and various securitized sectors.
Energy exploration and production, cable/satellite,oil-field services, midstream, and media/entertainment were the largest detractors from performance. Longer-dated and lower-rated credits, as discussed above, underperformed.
Please see footnotes on page 9.
Wells Fargo Multi-Sector Income Fund | 7
Performance highlights (unaudited)
Emerging market currencies struggled over the reporting period. Exposure to the Brazilian real, Mexican peso, and South African rand were drags on performance. Positions in the bond markets of Brazil, Indonesia, Colombia, and South Africa underperformed.
Within securitized sectors, the largest detractor was the Fund’s allocation to subordinatenon-agency CMBS. Allocations tonon-agency residential MBS and ABS sectors also detracted. Within corporate sectors, the Fund’s overweight to financials andBBB-rated bonds detracted. The Fund’s use of leverage had a negative impact on total return performance during this reporting period.
Contributors to performance were led by high-yield wireless and pharmaceutical issues and select countries.
Wireless, pharmaceuticals, and wireline companies were the largest contributors to performance over thesix-month period that ended April 30, 2020. In general, higher-quality and lower-yielding bonds outperformed the broader portfolio.
Exposure to the bond markets of Malaysia, Mexico, India, and Russia added value as yields fell. The Malaysian ringgit held its ground versus the U.S. dollar better than its emerging market peers, and exposure added to performance.
Within securitized sectors,out-of-benchmark holdings in agency collateralized mortgage obligations and MBS were small contributors. In corporate sectors, an overweight to industrials and utilities also contributed.
The Fund’s management teams see a mix of concerns, risks, and opportunities.
Going into 2020, the market was supported by solid and consistent gross domestic product growth, lack of aggressive issuance over the past several years, and a relatively low default rate. As a result, spreads were tighter than long-term averages as they generally have been over the past few years. However, as is often the case, these periods of calm end with an unexpected surprise.
This January, the surprise came in the form of the coronavirus. The reaction to the spread of the coronavirus has raised fears that consumer behavior will be altered, resulting in a global economic recession. To the extent that consumers and businesses adjust their behavior to avoid social interaction whether byshelter-in-place orders or by many individual decisions, the more likely that economic activity slows. Indeed, this behavior can be self-reinforcing as slower economic activity reduces personal income, which can further reduce demand. In response, the government and central banks have engaged in unprecedented fiscal and monetary stimulus. At this point, there is significant uncertainty regarding the length and severity of the health crisis and the medium- to long-term impact of the stimulus and money printing. Most, if not all, businesses have been affected by the virus and most have been hurt. However, with the large economic stimulus, liquidity is available for those companies that investors believe are solvent. For example, net issuance in the high-yield bond market in April was $37.7 billion, the third-largest month on record.
The high-yield bond market, which has a meaningful exposure to the energy sector, was also hurt by a poorly timed oil price war, leading Saudi Arabia to significantly increase production at a time of a coronavirus-induced demand shock. This led to a significant fall in oil prices and energy bond prices. More recently, Organization of the Petroleum Exporting Countries has agreed to supply reductions, which we believe will gradually reduce the oversupply of oil and help the recovery in energy bond prices.
The Fund’s high-yield bond management team expects more volatility as market expectations for the length and severity of theshelter-in-place orders, changes in behavior, recession probabilities, and individual company results vary through the year. Ultimately, the team is optimistic that life will return to “normal” ideally as a result of a cure or vaccine, and at that point the team would expect the high-yield and equity markets to return to long-term trading levels.
The Fund’s international and emerging market bond sleeve management team sees a highly uncertain global outlook, with investors and governments alike revising forecasts daily and working with assumptions that are close to ethereal. It appears that increased accommodation from central banks and governments is here to stay. Emerging market yield curves have steepened materially as lower short-term rates and increased longer-term issuance collide. Sustained gains on emerging market currencies would likely need equity markets to find a floor and start to recover. Renewed U.S.-China frictions pose a material risk to the already poor global economic outlook.
While there is still substantial uncertainty regarding the pace and extent to which the U.S. economy will begin to open, the Fund’s mortgage/corporate bond sleeve management team believes that current valuations in certain corporate and securitized sectors reflect overly pessimistic outcomes and represent attractive risk-adjusted opportunities. Within securitized sectors, the team sees value in certain CMBS securities collateralized by property types likely to withstand the current economic downturn. They also see opportunities in residential MBS and ABS securities where structural enhancements make credit losses unlikely.
The mortgage/corporate bond sleeve has an overweight allocation to credit due to historically attractive valuations that compensate for a wide range of downside scenarios. While spread recovery may take time to realize, adding credit opportunistically at current levels has historically resulted in very good long-term returns.
The management team continues to favor financials over industrials within the mortgage/corporate bond segment, given the former’s favorable fundamentals and the latter’s higher leverage levels. Lower event risk in the financial space is also favorable.
Please see footnotes on page 9.
8 | Wells Fargo Multi-Sector Income Fund
Performance highlights (unaudited)
Utilities have lagged this year due to deteriorating credit metrics, elevated issuance, and ongoing regulatory risks, and this may present a pocket of opportunity. The taxable municipal sector is beginning to look a bit more attractive following market dislocations.
Approximately 64% of the mortgage/corporate sleeve’s exposure is in corporate credit and around 36% is in fixed-rate and floating-rate mortgage securities. The largest industry exposures in the credit sector include insurance, energy, banking, and technology companies.
|
|
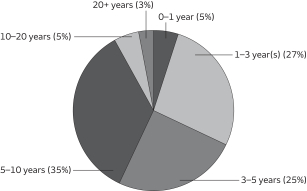
| Effective maturity distributionas of April 30, 202013 |
|
 |
|
|
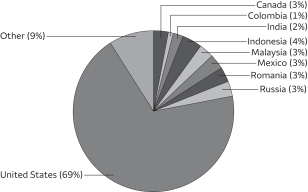
| Country allocation as of April 30, 202014 |
|
 |
| ‡ | CFA® and Chartered Financial Analyst®are trademarks owned by CFA Institute. |
| 1 | Total returns based on market value are calculated assuming a purchase of common stock on the first day and a sale on the last day of the period reported. Total returns based on NAV are calculated based on the NAV at the beginning of the period and at the end of the period. Dividends and distributions, if any, are assumed for the purposes of these calculations to be reinvested at prices obtained under the Fund’s Automatic Dividend Reinvestment Plan. |
| 2 | Source: Wells Fargo Funds Management, LLC. The Multi-Sector Income Blended Index is composed of 60% ICE BofA U.S. High Yield Constrained Index, 18% J.P. MorganGBI-EM Global Diversified Composite Index, 7.5% Bloomberg Barclays Credit Bond Index, 7.5% Bloomberg Barclays U.S. Securitized Index, and 7% J.P. Morgan Global Government Bond Index (ex U.S.). Prior to October 15, 2019, the Multi-Sector Income Blended Index was composed of 60% ICE BofA U.S. Cash Pay High Yield Index, 18% J.P. MorganGBI-EM Global Diversified Composite Index, 7.5% Bloomberg Barclays Credit Bond Index, 7.5% Bloomberg Barclays U.S. Securitized Index, and 7% J.P. Morgan Global Government Bond Index (ex U.S.). You cannot invest directly in an index. |
| 3 | The Bloomberg Barclays Credit Bond Index is an unmanaged index of fixed income securities composed of securities from the Bloomberg Barclays Government/Corporate Bond Index, Mortgage-Backed Securities Index, and the Asset-Backed Securities Index. You cannot invest directly in an index. |
| 4 | The Bloomberg Barclays U.S. Securitized Index is an unmanaged composite of asset-backed securities, collateralized mortgage-backed securities (ERISA eligible), and fixed-rate mortgage-backed securities. You cannot invest directly in an index. |
| 5 | The ICE BofA U.S. Cash Pay High Yield Index tracks the performance of U.S. dollar-denominated below investment grade corporate debt, currently in a coupon paying period, that is publicly issued in the U.S. domestic market. You cannot invest directly in an index. |
| 6 | The ICE BofA U.S. High Yield Constrained Index is a market-value-weighted index of all domestic and Yankee high-yield bonds, including deferred interest bonds andpayment-in-kind securities. Issues included in the index have maturities of one year or more and have a credit rating lower thanBBB-/Baa3 but are not in default. The ICE BofA U.S. High Yield Constrained Index limits any individual issuer to a maximum of 2% benchmark exposure. You cannot invest directly in an index. Copyright 2020. ICE Data Indices, LLC. All rights reserved. |
| 7 | The J.P. MorganGBI-EM Global Diversified Composite Index is an unmanaged index of debt instruments of 31 emerging countries. You cannot invest directly in an index. |
| 8 | The J.P. Morgan Global Government Bond Index (ex U.S.) measures the total return from investing in 12 developed government bond markets: Australia, Belgium, Canada, Denmark, France, Germany, Italy, Japan, the Netherlands, Spain, Sweden, and the U.K. You cannot invest directly in an index. |
| 9 | This chart does not reflect any brokerage commissions charged on the purchase and sale of the Fund’s common stock. Dividends and distributions paid by the Fund are included in the Fund’s average annual total returns but have the effect of reducing the Fund’s NAV. |
| 10 | The Bloomberg Barclays U.S. Corporate Bond Index measures the investment grade, fixed-rate, taxable corporate bond market. It includes USD-denominated securities publically issued by U.S. and non-U.S. industrial, utility and financial issuers. You cannot invest directly in an index. |
| 11 | The ten largest holdings, excluding cash, cash equivalents and any money market funds, are calculated based on the value of the investments divided by total net assets of the Fund. Holdings are subject to change and may have changed since the date specified. |
| 12 | The credit quality distribution of portfolio holdings reflected in the chart is based on ratings from Standard & Poor’s, Moody’s Investors Service, and/or Fitch Ratings Ltd. Credit quality ratings apply to the underlying holdings of the Fund and not to the Fund itself. The percentages of the Fund’s portfolio with the ratings depicted in the chart are calculated based on the total market value of fixed income securities held by the Fund. If a security was rated by all three rating agencies, the middle rating was utilized. If rated by two of three rating agencies, the lower rating was utilized, and if rated by one of the rating agencies, that rating was utilized. Standard & Poor’s rates the creditworthiness of bonds, ranging from AAA (highest) to D (lowest). Ratings from A to CCC may be modified by the addition of a plus (+) or minus (-) sign to show relative standing within the rating categories. Standard & Poor’s rates the creditworthiness of short-term notes fromSP-1 (highest) toSP-3 (lowest). Moody’s rates the creditworthiness of bonds, ranging from Aaa (highest) to C (lowest). Ratings Aa to B may be modified by the addition of a number 1 (highest) to 3 (lowest) to show relative standing within the ratings categories. Moody’s rates the creditworthiness of short-term U.S.tax-exempt municipal securities from MIG 1/VMIG 1 (highest) to SG (lowest). Fitch rates the creditworthiness of bonds, ranging from AAA (highest) to D (lowest). Credit quality distribution is subject to change and may have changed since the date specified. |
| 13 | Amounts are calculated based on the fixed income securities held by the Fund. These amounts are subject to change and may have changed since the date specified. |
| 14 | Amounts are calculated based on the total long-term investments of the Fund. These amounts are subject to change and may have changed since the date specified. |
Wells Fargo Multi-Sector Income Fund | 9
Portfolio of investments—April 30, 2020 (unaudited)
| | | | | | | | | | | | | | | | |
| | | Interest
rate | | | Maturity
date | | | Principal | | | Value | |
| Agency Securities: 1.18% | |
FHLMC (5 Year Treasury Constant Maturity +2.07%)± | | | 3.56 | % | | | 9-1-2032 | | | $ | 603,772 | | | $ | 607,461 | |
FHLMC | | | 8.50 | | | | 7-1-2028 | | | | 20,380 | | | | 23,423 | |
FHLMC Series 1383 (1 Year Treasury Constant Maturity +2.25%)± | | | 3.98 | | | | 2-1-2037 | | | | 130,096 | | | | 136,258 | |
FHLMC Series2012-K17 Class B 144A±± | | | 4.47 | | | | 12-25-2044 | | | | 675,000 | | | | 693,758 | |
FHLMC Series2012-K18 Class B 144A±± | | | 4.39 | | | | 1-25-2045 | | | | 810,000 | | | | 811,439 | |
FHLMC Series2013-K30 Class B 144A±± | | | 3.67 | | | | 6-25-2045 | | | | 700,000 | | | | 720,408 | |
FHLMC Series 2390 Class FD (1 Month LIBOR +0.45%)± | | | 1.26 | | | | 12-15-2031 | | | | 13,309 | | | | 13,045 | |
FHLMC Series 2567 Class FH (1 Month LIBOR +0.40%)± | | | 1.21 | | | | 2-15-2033 | | | | 38,761 | | | | 37,797 | |
FHLMC Series 3987 Class CI (c) | | | 3.50 | | | | 6-15-2026 | | | | 3,916,880 | | | | 141,913 | |
FHLMC Series K016 Class X1±±(c) | | | 1.63 | | | | 10-25-2021 | | | | 319,824 | | | | 5,647 | |
FHLMC Series K020 Class X1±±(c) | | | 1.50 | | | | 5-25-2022 | | | | 5,957,193 | | | | 138,431 | |
FNMA (6 Month LIBOR +1.64%)± | | | 3.52 | | | | 9-1-2037 | | | | 29,989 | | | | 30,206 | |
FNMA | | | 6.00 | | | | 4-1-2033 | | | | 54,211 | | | | 56,660 | |
FNMA | | | 7.50 | | | | 2-1-2030 | | | | 14,297 | | | | 14,404 | |
FNMA | | | 7.50 | | | | 9-1-2030 | | | | 19,296 | | | | 19,442 | |
FNMA Series1996-46 Class FA (1 Month LIBOR +0.50%)± | | | 0.99 | | | | 8-25-2021 | | | | 67 | | | | 67 | |
FNMA Series1997-20 Class IO±±(c) | | | 1.84 | | | | 3-25-2027 | | | | 191,544 | | | | 4,194 | |
FNMA Series2001-25 Class Z | | | 6.00 | | | | 6-25-2031 | | | | 61,093 | | | | 69,125 | |
FNMA Series2001-35 Class F (1 Month LIBOR +0.60%)± | | | 1.09 | | | | 7-25-2031 | | | | 3,139 | | | | 3,067 | |
FNMA Series2001-57 Class F (1 Month LIBOR +0.50%)± | | | 0.99 | | | | 6-25-2031 | | | | 3,161 | | | | 3,168 | |
FNMA Series2002-77 Class FH (1 Month LIBOR +0.40%)± | | | 1.12 | | | | 12-18-2032 | | | | 21,326 | | | | 20,796 | |
FNMA Series2002-97 Class FR (1 Month LIBOR +0.55%)± | | | 1.04 | | | | 1-25-2033 | | | | 5,258 | | | | 5,115 | |
FNMA SeriesG91-16 Class F (1 Month LIBOR +0.45%)± | | | 0.94 | | | | 6-25-2021 | | | | 337 | | | | 336 | |
FNMA SeriesG92-17 Class F (1 Month LIBOR +1.05%)± | | | 1.54 | | | | 3-25-2022 | | | | 4,356 | | | | 4,350 | |
GNMA | | | 6.50 | | | | 6-15-2028 | | | | 16,647 | | | | 18,456 | |
GNMA Series2019-H06 Class HI±±(c) | | | 1.69 | | | | 4-20-2069 | | | | 7,312,309 | | | | 361,192 | |
| |
Total Agency Securities (Cost $3,787,832) | | | | 3,940,158 | |
| | | | | |
|
| Asset-Backed Securities: 0.77% | |
Asset-Backed Funding Certificates Series 2003-AHL1 Class A1 | | | 4.18 | | | | 3-25-2033 | | | | 135,236 | | | | 134,615 | |
Bear Stearns Asset Backed Securities Series2002-2 Class A1 (1 Month LIBOR +0.66%)± | | | 1.61 | | | | 10-25-2032 | | | | 116,144 | | | | 112,798 | |
CVS Pass-Through Trust Series T | | | 6.04 | | | | 12-10-2028 | | | | 412,175 | | | | 452,198 | |
Exeter Automobile Receivables Trust Series15-3A Class D 144A | | | 6.55 | | | | 10-17-2022 | | | | 432,011 | | | | 432,442 | |
Five Guys Funding LLC Series17-1A Class A2 144A | | | 4.60 | | | | 7-25-2047 | | | | 992,500 | | | | 938,844 | |
Mesa Trust Asset Backed Certificates Series2001-5 Class A (1 Month LIBOR +0.80%) 144A± | | | 1.75 | | | | 12-25-2031 | | | | 7,825 | | | | 7,587 | |
MMAF Equipment Finance LLC Series2017-AA Class A4 144A | | | 2.41 | | | | 8-16-2024 | | | | 170,000 | | | | 170,607 | |
Saxon Asset Securities Trust Series2002-1 Class AF5 | | | 5.56 | | | | 12-25-2030 | | | | 97,094 | | | | 97,017 | |
Structured Asset Securities Corporation Series1998-2 Class A (1 Month LIBOR +0.52%)± | | | 1.47 | | | | 2-25-2028 | | | | 6,024 | | | | 5,992 | |
Structured Asset Securities Corporation Series2002-9 Class A2 (1 Month LIBOR +0.60%)± | | | 1.55 | | | | 10-25-2027 | | | | 18,531 | | | | 18,319 | |
Student Loan Consolidation Center Series2011-1 Class A (1 Month LIBOR +1.22%) 144A± | | | 2.17 | | | | 10-25-2027 | | | | 212,639 | | | | 212,326 | |
| |
Total Asset-Backed Securities (Cost $2,683,517) | | | | 2,582,745 | |
| | | | | |
| | | | |
| | | | | | | | | | | | | | | | |
| | | | | | | | | Shares | | | | |
| Common Stocks: 0.17% | |
|
Energy: 0.17% | |
|
| Energy Equipment & Services: 0.17% | |
Bristow Group Incorporated (a)† | | | | 42,370 | | | | 326,709 | |
Bristow Group Incorporated (a)† | | | | 30,068 | | | | 231,851 | |
| | | | |
| | | | | | | | | | | | | | | 558,560 | |
| | | | | | | | | | | | | | | | |
The accompanying notes are an integral part of these financial statements.
10 | Wells Fargo Multi-Sector Income Fund
Portfolio of investments—April 30, 2020 (unaudited)
| | | | | | | | | | | | | | | | |
| | | | | | | | | Shares | | | Value | |
|
Materials: 0.00% | |
|
| Chemicals: 0.00% | |
LyondellBasell Industries NV Class A | | | | 9 | | | $ | 522 | |
| | | | | | | | | |
| |
Total Common Stocks (Cost $5,851,782) | | | | 559,082 | |
| | | | | |
| | | | |
| | | | | | | | | | | | | | | | |
| | | Interest
rate | | | Maturity
date | | | Principal | | | | |
| Corporate Bonds and Notes: 68.84% | |
|
Communication Services: 11.91% | |
|
| Diversified Telecommunication Services: 0.88% | |
AT&T Incorporated | | | 4.00 | % | | | 1-15-2022 | | | $ | 750,000 | | | | 782,265 | |
Level 3 Financing Incorporated | | | 5.13 | | | | 5-1-2023 | | | | 975,000 | | | | 972,563 | |
Level 3 Financing Incorporated | | | 5.38 | | | | 1-15-2024 | | | | 700,000 | | | | 705,250 | |
Level 3 Financing Incorporated | | | 5.63 | | | | 2-1-2023 | | | | 500,000 | | | | 500,760 | |
| | | | |
| | | | | | | | | | | | | | | 2,960,838 | |
| | | | | | | | | | | | | | | | |
|
| Interactive Media & Services: 0.04% | |
Match Group Incorporated 144A | | | 4.13 | | | | 8-1-2030 | | | | 125,000 | | | | 121,250 | |
| | | | | | | | | | | | | | | | |
|
| Media: 9.06% | |
Block Communications Incorporated 144A | | | 4.88 | | | | 3-1-2028 | | | | 150,000 | | | | 149,250 | |
CCO Holdings LLC 144A | | | 4.00 | | | | 3-1-2023 | | | | 100,000 | | | | 100,710 | |
CCO Holdings LLC 144A | | | 4.50 | | | | 8-15-2030 | | | | 550,000 | | | | 552,750 | |
CCO Holdings LLC 144A | | | 4.50 | | | | 5-1-2032 | | | | 250,000 | | | | 248,359 | |
CCO Holdings LLC 144A | | | 5.00 | | | | 2-1-2028 | | | | 150,000 | | | | 154,500 | |
CCO Holdings LLC 144A | | | 5.13 | | | | 5-1-2027 | | | | 450,000 | | | | 467,258 | |
CCO Holdings LLC 144A | | | 5.38 | | | | 5-1-2025 | | | | 3,550,000 | | | | 3,640,303 | |
CCO Holdings LLC 144A | | | 5.75 | | | | 2-15-2026 | | | | 2,500,000 | | | | 2,606,500 | |
CCO Holdings LLC 144A | | | 5.88 | | | | 4-1-2024 | | | | 200,000 | | | | 205,740 | |
Charter Communications Operating LLC | | | 5.05 | | | | 3-30-2029 | | | | 675,000 | | | | 791,836 | |
Cinemark USA Incorporated 144A | | | 8.75 | | | | 5-1-2025 | | | | 75,000 | | | | 75,563 | |
CSC Holdings LLC 144A | | | 5.38 | | | | 7-15-2023 | | | | 745,000 | | | | 753,381 | |
CSC Holdings LLC 144A | | | 5.38 | | | | 2-1-2028 | | | | 425,000 | | | | 443,721 | |
CSC Holdings LLC 144A | | | 5.50 | | | | 5-15-2026 | | | | 1,275,000 | | | | 1,319,625 | |
CSC Holdings LLC 144A | | | 7.75 | | | | 7-15-2025 | | | | 2,030,000 | | | | 2,117,046 | |
Diamond Sports Group LLC 144A | | | 5.38 | | | | 8-15-2026 | | | | 175,000 | | | | 133,000 | |
Diamond Sports Group LLC 144A | | | 6.63 | | | | 8-15-2027 | | | | 175,000 | | | | 95,813 | |
DISH Network Corporation | | | 3.38 | | | | 8-15-2026 | | | | 1,300,000 | | | | 1,053,780 | |
Gray Television Incorporated 144A | | | 5.13 | | | | 10-15-2024 | | | | 450,000 | | | | 443,250 | |
Gray Television Incorporated 144A | | | 5.88 | | | | 7-15-2026 | | | | 3,875,000 | | | | 3,720,000 | |
Gray Television Incorporated 144A | | | 7.00 | | | | 5-15-2027 | | | | 325,000 | | | | 327,340 | |
Interpublic Group of Companies | | | 4.00 | | | | 3-15-2022 | | | | 750,000 | | | | 766,810 | |
Lamar Media Corporation 144A | | | 3.75 | | | | 2-15-2028 | | | | 800,000 | | | | 736,500 | |
Lamar Media Corporation 144A | | | 4.00 | | | | 2-15-2030 | | | | 800,000 | | | | 736,000 | |
Lamar Media Corporation | | | 5.75 | | | | 2-1-2026 | | | | 100,000 | | | | 101,710 | |
Nexstar Broadcasting Incorporated 144A | | | 5.63 | | | | 7-15-2027 | | | | 2,000,000 | | | | 1,910,000 | |
Nielsen Finance LLC 144A | | | 5.00 | | | | 4-15-2022 | | | | 1,725,000 | | | | 1,699,315 | |
Outfront Media Capital Corporation 144A | | | 4.63 | | | | 3-15-2030 | | | | 675,000 | | | | 615,938 | |
Outfront Media Capital Corporation 144A | | | 5.00 | | | | 8-15-2027 | | | | 25,000 | | | | 23,873 | |
Outfront Media Capital Corporation | | | 5.63 | | | | 2-15-2024 | | | | 20,000 | | | | 19,850 | |
QVC Incorporated | | | 4.75 | | | | 2-15-2027 | | | | 150,000 | | | | 137,250 | |
Salem Media Group Incorporated 144A | | | 6.75 | | | | 6-1-2024 | | | | 2,600,000 | | | | 2,028,000 | |
Scripps Escrow Incorporated 144A | | | 5.88 | | | | 7-15-2027 | | | | 100,000 | | | | 84,500 | |
The E.W. Scripps Company 144A | | | 5.13 | | | | 5-15-2025 | | | | 2,460,000 | | | | 2,074,272 | |
| | | | |
| | | | | | | | | | | | | | | 30,333,743 | |
| | | | | | | | | | | | | | | | |
The accompanying notes are an integral part of these financial statements.
Wells Fargo Multi-Sector Income Fund | 11
Portfolio of investments—April 30, 2020 (unaudited)
| | | | | | | | | | | | | | | | |
| | | Interest
rate | | | Maturity
date | | | Principal | | | Value | |
| Wireless Telecommunication Services: 1.93% | |
Connect U.S. Finco LLC 144A | | | 6.75 | % | | | 10-1-2026 | | | $ | 375,000 | | | $ | 358,125 | |
Sprint Capital Corporation | | | 6.88 | | | | 11-15-2028 | | | | 175,000 | | | | 210,761 | |
Sprint Capital Corporation | | | 8.75 | | | | 3-15-2032 | | | | 975,000 | | | | 1,369,875 | |
Sprint Spectrum Company 144A | | | 5.15 | | | | 9-20-2029 | | | | 750,000 | | | | 828,750 | |
T-Mobile USA Incorporated | | | 4.50 | | | | 2-1-2026 | | | | 125,000 | | | | 128,788 | |
T-Mobile USA Incorporated | | | 4.75 | | | | 2-1-2028 | | | | 425,000 | | | | 446,259 | |
T-Mobile USA Incorporated | | | 5.13 | | | | 4-15-2025 | | | | 425,000 | | | | 430,313 | |
T-Mobile USA Incorporated | | | 5.38 | | | | 4-15-2027 | | | | 1,500,000 | | | | 1,597,350 | |
T-Mobile USA Incorporated | | | 6.38 | | | | 3-1-2025 | | | | 975,000 | | | | 1,000,594 | |
T-Mobile USA Incorporated | | | 6.50 | | | | 1-15-2024 | | | | 80,000 | | | | 81,792 | |
| | | | |
| | | | | | | | | | | | | | | 6,452,607 | |
| | | | | | | | | | | | | | | | |
|
Consumer Discretionary: 8.77% | |
|
| Auto Components: 1.63% | |
Allison Transmission Incorporated 144A | | | 4.75 | | | | 10-1-2027 | | | | 650,000 | | | | 604,500 | |
Allison Transmission Incorporated 144A | | | 5.00 | | | | 10-1-2024 | | | | 2,250,000 | | | | 2,160,000 | |
Allison Transmission Incorporated 144A | | | 5.88 | | | | 6-1-2029 | | | | 400,000 | | | | 387,812 | |
Cooper Tire & Rubber Company | | | 7.63 | | | | 3-15-2027 | | | | 1,710,000 | | | | 1,701,450 | |
Goodyear Tire & Rubber Company | | | 8.75 | | | | 8-15-2020 | | | | 468,000 | | | | 469,755 | |
Panther BF Aggregator 2 LP 144A | | | 6.25 | | | | 5-15-2026 | | | | 125,000 | | | | 125,350 | |
| | | | |
| | | | | | | | | | | | | | | 5,448,867 | |
| | | | | | | | | | | | | | | | |
|
| Automobiles: 0.34% | |
Ford Motor Company | | | 4.75 | | | | 1-15-2043 | | | | 1,500,000 | | | | 956,250 | |
Ford Motor Company | | | 9.00 | | | | 4-22-2025 | | | | 100,000 | | | | 97,250 | |
Ford Motor Company | | | 9.63 | | | | 4-22-2030 | | | | 100,000 | | | | 98,250 | |
| | | | |
| | | | | | | | | | | | | | | 1,151,750 | |
| | | | | | | | | | | | | | | | |
|
| Diversified Consumer Services: 2.06% | |
Carriage Services Incorporated 144A | | | 6.63 | | | | 6-1-2026 | | | | 1,700,000 | | | | 1,676,370 | |
Service Corporation International | | | 4.63 | | | | 12-15-2027 | | | | 650,000 | | | | 664,437 | |
Service Corporation International | | | 7.50 | | | | 4-1-2027 | | | | 3,400,000 | | | | 3,672,000 | |
Service Corporation International | | | 8.00 | | | | 11-15-2021 | | | | 850,000 | | | | 892,500 | |
| | | | |
| | | | | | | | | | | | | | | 6,905,307 | |
| | | | | | | | | | | | | | | | |
|
| Hotels, Restaurants & Leisure: 1.68% | |
CCM Merger Incorporated 144A | | | 6.00 | | | | 3-15-2022 | | | | 3,698,000 | | | | 3,494,610 | |
Hilton Domestic Operating Company Incorporated | | | 4.88 | | | | 1-15-2030 | | | | 100,000 | | | | 95,750 | |
Wyndham Hotels & Resorts Company 144A | | | 5.38 | | | | 4-15-2026 | | | | 1,875,000 | | | | 1,715,625 | |
Yum! Brands Incorporated 144A | | | 4.75 | | | | 1-15-2030 | | | | 150,000 | | | | 153,000 | |
Yum! Brands Incorporated 144A | | | 7.75 | | | | 4-1-2025 | | | | 150,000 | | | | 163,519 | |
| | | | |
| | | | | | | | | | | | | | | 5,622,504 | |
| | | | | | | | | | | | | | | | |
|
| Internet & Direct Marketing Retail: 0.23% | |
Expedia Incorporated | | | 5.95 | | | | 8-15-2020 | | | | 750,000 | | | | 755,541 | |
| | | | | | | | | | | | | | | | |
|
| Multiline Retail: 0.17% | |
Macy’s Retail Holdings Incorporated | | | 3.88 | | | | 1-15-2022 | | | | 600,000 | | | | 493,872 | |
Nordstrom Incorporated 144A | | | 8.75 | | | | 5-15-2025 | | | | 55,000 | | | | 59,017 | |
| | | | |
| | | | | | | | | | | | | | | 552,889 | |
| | | | | | | | | | | | | | | | |
The accompanying notes are an integral part of these financial statements.
12 | Wells Fargo Multi-Sector Income Fund
Portfolio of investments—April 30, 2020 (unaudited)
| | | | | | | | | | | | | | | | |
| | | Interest
rate | | | Maturity
date | | | Principal | | | Value | |
| Specialty Retail: 2.03% | |
Advance Auto Parts Incorporated | | | 4.50 | % | | | 1-15-2022 | | | $ | 600,000 | | | $ | 618,108 | |
Asbury Automotive Group Incorporated 144A | | | 4.50 | | | | 3-1-2028 | | | | 400,000 | | | | 335,880 | |
Asbury Automotive Group Incorporated 144A | | | 4.75 | | | | 3-1-2030 | | | | 387,000 | | | | 324,248 | |
Group 1 Automotive Incorporated | | | 5.00 | | | | 6-1-2022 | | | | 200,000 | | | | 190,500 | |
Lithia Motors Incorporated 144A | | | 5.25 | | | | 8-1-2025 | | | | 945,000 | | | | 914,288 | |
Lithia Motors Incorporated 144A | | | 4.63 | | | | 12-15-2027 | | | | 150,000 | | | | 141,750 | |
Penske Auto Group Incorporated | | | 3.75 | | | | 8-15-2020 | | | | 540,000 | | | | 535,275 | |
Penske Auto Group Incorporated | | | 5.38 | | | | 12-1-2024 | | | | 2,150,000 | | | | 1,977,355 | |
Penske Auto Group Incorporated | | | 5.75 | | | | 10-1-2022 | | | | 1,155,000 | | | | 1,105,913 | |
Sonic Automotive Incorporated | | | 6.13 | | | | 3-15-2027 | | | | 775,000 | | | | 666,500 | |
| | | | |
| | | | | | | | | | | | | | | 6,809,817 | |
| | | | | | | | | | | | | | | | |
|
| Textiles, Apparel & Luxury Goods: 0.63% | |
The William Carter Company 144A | | | 5.63 | | | | 3-15-2027 | | | | 825,000 | | | | 836,352 | |
Wolverine World Wide Incorporated 144A | | | 5.00 | | | | 9-1-2026 | | | | 1,326,000 | | | | 1,271,455 | |
| | | | |
| | | | | | | | | | | | | | | 2,107,807 | |
| | | | | | | | | | | | | | | | |
|
Consumer Staples: 1.21% | |
|
| Beverages: 0.20% | |
Cott Beverages Incorporated 144A | | | 5.50 | | | | 4-1-2025 | | | | 675,000 | | | | 678,375 | |
| | | | | | | | | | | | | | | | |
|
| Food & Staples Retailing: 0.09% | |
Albertsons Companies Incorporated 144A | | | 4.63 | | | | 1-15-2027 | | | | 150,000 | | | | 150,750 | |
Albertsons Companies Incorporated 144A | | | 4.88 | | | | 2-15-2030 | | | | 150,000 | | | | 152,063 | |
| | | | |
| | | | | | | | | | | | | | | 302,813 | |
| | | | | | | | | | | | | | | | |
|
| Food Products: 0.71% | |
Darling Ingredients Incorporated 144A | | | 5.25 | | | | 4-15-2027 | | | | 500,000 | | | | 503,800 | |
Pilgrim’s Pride Corporation 144A | | | 5.75 | | | | 3-15-2025 | | | | 1,305,000 | | | | 1,318,220 | |
Pilgrim’s Pride Corporation 144A | | | 5.88 | | | | 9-30-2027 | | | | 150,000 | | | | 151,793 | |
Prestige Brands Incorporated 144A | | | 5.13 | | | | 1-15-2028 | | | | 100,000 | | | | 101,150 | |
Prestige Brands Incorporated 144A | | | 6.38 | | | | 3-1-2024 | | | | 280,000 | | | | 287,700 | |
| | | | |
| | | | | | | | | | | | | | | 2,362,663 | |
| | | | | | | | | | | | | | | | |
|
| Household Products: 0.02% | |
Spectrum Brands Incorporated | | | 5.75 | | | | 7-15-2025 | | | | 50,000 | | | | 49,875 | |
| | | | | | | | | | | | | | | | |
|
| Tobacco: 0.19% | |
Reynolds American Incorporated | | | 6.88 | | | | 5-1-2020 | | | | 650,000 | | | | 650,000 | |
| | | | | | | | | | | | | | | | |
|
Energy: 12.70% | |
|
| Energy Equipment & Services: 2.00% | |
Bristow Group Incorporated (a)† | | | 6.25 | | | | 10-15-2022 | | | | 3,855,000 | | | | 0 | |
Diamond Offshore Drilling Incorporated † | | | 4.88 | | | | 11-1-2043 | | | | 1,325,000 | | | | 142,703 | |
Era Group Incorporated | | | 7.75 | | | | 12-15-2022 | | | | 2,350,000 | | | | 2,138,500 | |
Hilcorp Energy Company 144A | | | 5.00 | | | | 12-1-2024 | | | | 1,450,000 | | | | 819,250 | |
Hilcorp Energy Company 144A | | | 5.75 | | | | 10-1-2025 | | | | 1,875,000 | | | | 1,045,313 | |
Hilcorp Energy Company 144A | | | 6.25 | | | | 11-1-2028 | | | | 350,000 | | | | 181,125 | |
NGPL PipeCo LLC 144A | | | 4.38 | | | | 8-15-2022 | | | | 350,000 | | | | 351,009 | |
NGPL PipeCo LLC 144A | | | 7.77 | | | | 12-15-2037 | | | | 410,000 | | | | 450,690 | |
Oceaneering International Incorporated | | | 6.00 | | | | 2-1-2028 | | | | 1,725,000 | | | | 886,219 | |
USA Compression Partners LP | | | 6.88 | | | | 4-1-2026 | | | | 850,000 | | | | 684,250 | |
| | | | |
| | | | | | | | | | | | | | | 6,699,059 | |
| | | | | | | | | | | | | | | | |
The accompanying notes are an integral part of these financial statements.
Wells Fargo Multi-Sector Income Fund | 13
Portfolio of investments—April 30, 2020 (unaudited)
| | | | | | | | | | | | | | | | |
| | | Interest
rate | | | Maturity
date | | | Principal | | | Value | |
| Oil, Gas & Consumable Fuels: 10.70% | |
Antero Midstream Partners LP 144A | | | 5.75 | % | | | 1-15-2028 | | | $ | 1,830,000 | | | $ | 1,345,050 | |
Antero Resources Corporation | | | 5.38 | | | | 11-1-2021 | | | | 400,000 | | | | 357,750 | |
Apache Corporation | | | 4.25 | | | | 1-15-2030 | | | | 40,000 | | | | 30,752 | |
Apache Corporation | | | 4.38 | | | | 10-15-2028 | | | | 750,000 | | | | 596,184 | |
Apache Corporation | | | 4.75 | | | | 4-15-2043 | | | | 1,700,000 | | | | 1,161,296 | |
Archrock Partners LP 144A | | | 6.25 | | | | 4-1-2028 | | | | 150,000 | | | | 111,750 | |
Archrock Partners LP 144A | | | 6.88 | | | | 4-1-2027 | | | | 500,000 | | | | 375,000 | |
Boardwalk Pipelines LP | | | 4.80 | | | | 5-3-2029 | | | | 750,000 | | | | 659,603 | |
Buckeye Partners LP | | | 5.85 | | | | 11-15-2043 | | | | 1,125,000 | | | | 821,250 | |
Callon Petroleum Company | | | 8.25 | | | | 7-15-2025 | | | | 1,760,000 | | | | 316,800 | |
Callon Petroleum Company | | | 6.25 | | | | 4-15-2023 | | | | 350,000 | | | | 69,650 | |
Cheniere Corpus Christi Holdings LLC | | | 5.13 | | | | 6-30-2027 | | | | 900,000 | | | | 897,361 | |
Cheniere Energy Partners LP 144A | | | 4.50 | | | | 10-1-2029 | | | | 400,000 | | | | 369,000 | |
Cheniere Energy Partners LP | | | 5.25 | | | | 10-1-2025 | | | | 3,075,000 | | | | 2,935,395 | |
Cheniere Energy Partners LP | | | 5.63 | | | | 10-1-2026 | | | | 300,000 | | | | 286,680 | |
Denbury Resources Incorporated | | | 6.38 | | | | 12-31-2024 | | | | 802,000 | | | | 105,491 | |
Denbury Resources Incorporated 144A | | | 7.75 | | | | 2-15-2024 | | | | 1,123,000 | | | | 202,140 | |
Denbury Resources Incorporated 144A | | | 9.00 | | | | 5-15-2021 | | | | 2,400,000 | | | | 432,000 | |
Denbury Resources Incorporated 144A | | | 9.25 | | | | 3-31-2022 | | | | 676,000 | | | | 121,680 | |
Energy Transfer Partners LP | | | 5.20 | | | | 2-1-2022 | | | | 750,000 | | | | 756,110 | |
EnLink Midstream LLC | | | 5.38 | | | | 6-1-2029 | | | | 2,225,000 | | | | 1,379,500 | |
EnLink Midstream Partners LP | | | 4.40 | | | | 4-1-2024 | | | | 450,000 | | | | 283,500 | |
EnLink Midstream Partners LP | | | 5.05 | | | | 4-1-2045 | | | | 1,575,000 | | | | 637,875 | |
EnLink Midstream Partners LP | | | 5.45 | | | | 6-1-2047 | | | | 950,000 | | | | 385,938 | |
EnLink Midstream Partners LP | | | 5.60 | | | | 4-1-2044 | | | | 750,000 | | | | 300,000 | |
Enviva Partners LP 144A | | | 6.50 | | | | 1-15-2026 | | | | 1,025,000 | | | | 1,073,688 | |
Gulfport Energy Corporation | | | 6.00 | | | | 10-15-2024 | | | | 2,150,000 | | | | 1,069,625 | |
Kinder Morgan Energy Partners LP | | | 3.95 | | | | 9-1-2022 | | | | 750,000 | | | | 776,803 | |
Kinder Morgan Incorporated | | | 6.50 | | | | 9-15-2020 | | | | 285,000 | | | | 288,280 | |
Kinder Morgan Incorporated | | | 7.42 | | | | 2-15-2037 | | | | 800,000 | | | | 855,917 | |
MPLX LP 144A | | | 6.38 | | | | 5-1-2024 | | | | 450,000 | | | | 459,293 | |
Murphy Oil Corporation | | | 4.75 | | | | 9-15-2029 | | | | 75,000 | | | | 77,228 | |
Murphy Oil Corporation | | | 5.75 | | | | 8-15-2025 | | | | 185,000 | | | | 127,650 | |
Murphy Oil Corporation | | | 5.88 | | | | 12-1-2027 | | | | 150,000 | | | | 101,805 | |
Nabors Industries Incorporated | | | 4.63 | | | | 9-15-2021 | | | | 78,000 | | | | 49,429 | |
Occidental Petroleum Corporation | | | 4.63 | | | | 6-15-2045 | | | | 1,825,000 | | | | 1,117,813 | |
Occidental Petroleum Corporation | | | 5.55 | | | | 3-15-2026 | | | | 700,000 | | | | 541,520 | |
Occidental Petroleum Corporation | | | 6.20 | | | | 3-15-2040 | | | | 425,000 | | | | 303,875 | |
Occidental Petroleum Corporation | | | 6.45 | | | | 9-15-2036 | | | | 4,000,000 | | | | 2,920,000 | |
Occidental Petroleum Corporation | | | 6.60 | | | | 3-15-2046 | | | | 500,000 | | | | 370,000 | |
Phillips 66 | | | 4.30 | | | | 4-1-2022 | | | | 625,000 | | | | 651,798 | |
Pioneer Natural Resources Company | | | 3.95 | | | | 7-15-2022 | | | | 750,000 | | | | 761,058 | |
Rockies Express Pipeline LLC 144A | | | 3.60 | | | | 5-15-2025 | | | | 750,000 | | | | 676,875 | |
Rockies Express Pipeline LLC 144A | | | 4.80 | | | | 5-15-2030 | | | | 750,000 | | | | 641,250 | |
Rockies Express Pipeline LLC 144A | | | 4.95 | | | | 7-15-2029 | | | | 475,000 | | | | 422,750 | |
Rockies Express Pipeline LLC 144A | | | 6.88 | | | | 4-15-2040 | | | | 2,024,000 | | | | 1,778,590 | |
Rockies Express Pipeline LLC 144A | | | 7.50 | | | | 7-15-2038 | | | | 240,000 | | | | 210,600 | |
Southwestern Energy Company | | | 7.50 | | | | 4-1-2026 | | | | 400,000 | | | | 358,192 | |
Southwestern Energy Company | | | 7.75 | | | | 10-1-2027 | | | | 975,000 | | | | 848,445 | |
Tallgrass Energy Partners LP 144A | | | 5.50 | | | | 9-15-2024 | | | | 3,850,000 | | | | 2,926,000 | |
Ultra Resources Incorporated 144A† | | | 7.13 | | | | 4-15-2025 | | | | 2,425,000 | | | | 243 | |
Western Midstream Operating LP | | | 4.05 | | | | 2-1-2030 | | | | 600,000 | | | | 547,500 | |
Western Midstream Operating LP | | | 5.25 | | | | 2-1-2050 | | | | 45,000 | | | | 35,438 | |
Western Midstream Operating LP | | | 5.30 | | | | 3-1-2048 | | | | 1,000,000 | | | | 752,500 | |
Whiting Petroleum Corporation † | | | 1.25 | | | | 4-1-2020 | | | | 1,833,000 | | | | 164,970 | |
| | | | |
| | | | | | | | | | | | | | | 35,846,890 | |
| | | | | | | | | | | | | | | | |
The accompanying notes are an integral part of these financial statements.
14 | Wells Fargo Multi-Sector Income Fund
Portfolio of investments—April 30, 2020 (unaudited)
| | | | | | | | | | | | | | | | |
| | | Interest
rate | | | Maturity
date | | | Principal | | | Value | |
| Financials: 7.76% | |
|
| Banks: 1.29% | |
Bank of America Corporation | | | 5.70 | % | | | 1-24-2022 | | | $ | 250,000 | | | $ | 268,242 | |
Citigroup Incorporated | | | 4.50 | | | | 1-14-2022 | | | | 250,000 | | | | 262,479 | |
Citigroup Incorporated (U.S. SOFR +3.23%)±(s) | | | 4.70 | | | | 1-30-2025 | | | | 750,000 | | | | 652,500 | |
Citigroup Incorporated | | | 6.13 | | | | 3-9-2028 | | | | 75,000 | | | | 76,875 | |
City National Bank | | | 5.38 | | | | 7-15-2022 | | | | 500,000 | | | | 537,819 | |
International Finance Corporation | | | 7.50 | | | | 5-9-2022 | | | | 4,000,000 | | | | 790,460 | |
International Finance Corporation | | | 7.50 | | | | 5-9-2022 | | | | 5,000,000 | | | | 988,074 | |
JPMorgan Chase & Company (3 Month LIBOR +3.25%)± | | | 5.15 | | | | 12-29-2049 | | | | 750,000 | | | | 738,750 | |
| | | | |
| | | | | | | | | | | | | | | 4,315,199 | |
| | | | | | | | | | | | | | | | |
|
| Capital Markets: 0.25% | |
ACE Securities Corporation (1 Month LIBOR +2.63%)± | | | 3.57 | | | | 6-25-2033 | | | | 52,102 | | | | 52,070 | |
Goldman Sachs Group Incorporated | | | 5.75 | | | | 1-24-2022 | | | | 750,000 | | | | 802,681 | |
| | | | |
| | | | | | | | | | | | | | | 854,751 | |
| | | | | | | | | | | | | | | | |
|
| Consumer Finance: 2.12% | |
Discover Financial Services | | | 5.20 | | | | 4-27-2022 | | | | 750,000 | | | | 776,465 | |
FirstCash Incorporated 144A | | | 5.38 | | | | 6-1-2024 | | | | 300,000 | | | | 300,750 | |
Ford Motor Credit Company LLC | | | 4.39 | | | | 1-8-2026 | | | | 1,450,000 | | | | 1,247,000 | |
Ford Motor Credit Company LLC | | | 5.11 | | | | 5-3-2029 | | | | 2,175,000 | | | | 1,870,500 | |
Springleaf Finance Corporation | | | 5.38 | | | | 11-15-2029 | | | | 625,000 | | | | 518,869 | |
Springleaf Finance Corporation | | | 6.13 | | | | 3-15-2024 | | | | 750,000 | | | | 703,208 | |
Springleaf Finance Corporation | | | 6.63 | | | | 1-15-2028 | | | | 100,000 | | | | 88,250 | |
Springleaf Finance Corporation | | | 7.13 | | | | 3-15-2026 | | | | 925,000 | | | | 857,336 | |
Synchrony Financial | | | 5.15 | | | | 3-19-2029 | | | | 750,000 | | | | 741,765 | |
| | | | |
| | | | | | | | | | | | | | | 7,104,143 | |
| | | | | | | | | | | | | | | | |
|
| Diversified Financial Services: 1.10% | |
LPL Holdings Incorporated 144A | | | 5.75 | | | | 9-15-2025 | | | | 3,700,000 | | | | 3,672,250 | |
| | | | | | | | | | | | | | | | |
|
| Insurance: 2.95% | |
American International Group Incorporated | | | 4.88 | | | | 6-1-2022 | | | | 750,000 | | | | 800,030 | |
AmWINS Group Incorporated 144A | | | 7.75 | | | | 7-1-2026 | | | | 1,625,000 | | | | 1,673,750 | |
Assurant Incorporated | | | 3.70 | | | | 2-22-2030 | | | | 750,000 | | | | 716,778 | |
Athene Holding Limited | | | 4.13 | | | | 1-12-2028 | | | | 750,000 | | | | 709,203 | |
Brighthouse Financial Incorporated | | | 4.70 | | | | 6-22-2047 | | | | 850,000 | | | | 731,634 | |
HUB International Limited 144A | | | 7.00 | | | | 5-1-2026 | | | | 550,000 | | | | 542,548 | |
Liberty Mutual Group Incorporated 144A | | | 4.57 | | | | 2-1-2029 | | | | 750,000 | | | | 840,235 | |
ProAssurance Corporation | | | 5.30 | | | | 11-15-2023 | | | | 750,000 | | | | 808,753 | |
Prudential Financial Incorporated (3 Month LIBOR +2.38%)± | | | 4.50 | | | | 9-15-2047 | | | | 750,000 | | | | 716,250 | |
Sammons Financial Group Incorporated 144A | | | 4.45 | | | | 5-12-2027 | | | | 750,000 | | | | 808,678 | |
USI Incorporated 144A | | | 6.88 | | | | 5-1-2025 | | | | 850,000 | | | | 852,125 | |
W.R. Berkley Corporation | | | 4.63 | | | | 3-15-2022 | | | | 650,000 | | | | 676,308 | |
| | | | |
| | | | | | | | | | | | | | | 9,876,292 | |
| | | | | | | | | | | | | | | | |
|
| Thrifts & Mortgage Finance: 0.05% | |
Ladder Capital Finance LLLP 144A | | | 4.25 | | | | 2-1-2027 | | | | 50,000 | | | | 34,750 | |
Ladder Capital Finance LLLP 144A | | | 5.25 | | | | 3-15-2022 | | | | 150,000 | | | | 123,750 | |
| | | | |
| | | | | | | | | | | | | | | 158,500 | |
| | | | | | | | | | | | | | | | |
The accompanying notes are an integral part of these financial statements.
Wells Fargo Multi-Sector Income Fund | 15
Portfolio of investments—April 30, 2020 (unaudited)
| | | | | | | | | | | | | | | | |
| | | Interest
rate | | | Maturity
date | | | Principal | | | Value | |
| Health Care: 6.27% | |
|
| Health Care Equipment & Supplies: 1.04% | |
Hill-Rom Holdings Incorporated 144A | | | 4.38 | % | | | 9-15-2027 | | | $ | 475,000 | | | $ | 480,938 | |
Hill-Rom Holdings Incorporated 144A | | | 5.00 | | | | 2-15-2025 | | | | 400,000 | | | | 408,000 | |
Hologic Incorporated 144A | | | 4.38 | | | | 10-15-2025 | | | | 1,925,000 | | | | 1,933,855 | |
Hologic Incorporated 144A | | | 4.63 | | | | 2-1-2028 | | | | 225,000 | | | | 228,375 | |
Surgery Center Holdings Incorporated 144A | | | 6.75 | | | | 7-1-2025 | | | | 500,000 | | | | 427,225 | |
| | | | |
| | | | | | | | | | | | | | | 3,478,393 | |
| | | | | | | | | | | | | | | | |
|
| Health Care Providers & Services: 4.16% | |
Centene Corporation 144A | | | 5.38 | | | | 8-15-2026 | | | | 125,000 | | | | 133,138 | |
Cigna Corporation 144A | | | 3.90 | | | | 2-15-2022 | | | | 315,000 | | | | 327,841 | |
CommonSpirit Health AGM Insured | | | 3.82 | | | | 10-1-2049 | | | | 750,000 | | | | 750,599 | |
Community Health Systems Incorporated 144A | | | 6.63 | | | | 2-15-2025 | | | | 1,925,000 | | | | 1,766,188 | |
Encompass Health Corporation | | | 4.50 | | | | 2-1-2028 | | | | 125,000 | | | | 125,238 | |
Encompass Health Corporation | | | 4.75 | | | | 2-1-2030 | | | | 125,000 | | | | 125,016 | |
HCA Incorporated | | | 5.25 | | | | 6-15-2026 | | | | 325,000 | | | | 362,150 | |
HealthSouth Corporation | | | 5.75 | | | | 9-15-2025 | | | | 575,000 | | | | 583,625 | |
MEDNAX Incorporated 144A | | | 6.25 | | | | 1-15-2027 | | | | 550,000 | | | | 497,992 | |
MPH Acquisition Holdings LLC 144A | | | 7.13 | | | | 6-1-2024 | | | | 2,861,000 | | | | 2,549,780 | |
MPT Operating Partnership LP | | | 4.63 | | | | 8-1-2029 | | | | 325,000 | | | | 323,174 | |
MPT Operating Partnership LP | | | 5.00 | | | | 10-15-2027 | | | | 1,100,000 | | | | 1,122,000 | |
MPT Operating Partnership LP | | | 5.25 | | | | 8-1-2026 | | | | 1,575,000 | | | | 1,590,750 | |
MPT Operating Partnership LP | | | 6.38 | | | | 3-1-2024 | | | | 110,000 | | | | 113,596 | |
Polaris Intermediate Corporation 144A | | | 8.50 | | | | 12-1-2022 | | | | 475,000 | | | | 397,813 | |
Select Medical Corporation 144A | | | 6.25 | | | | 8-15-2026 | | | | 900,000 | | | | 859,500 | |
Tenet Healthcare Corporation | | | 4.63 | | | | 7-15-2024 | | | | 436,000 | | | | 430,245 | |
Tenet Healthcare Corporation 144A | | | 4.88 | | | | 1-1-2026 | | | | 1,025,000 | | | | 1,015,058 | |
Tenet Healthcare Corporation 144A | | | 5.13 | | | | 11-1-2027 | | | | 225,000 | | | | 222,188 | |
Tenet Healthcare Corporation | | | 7.00 | | | | 8-1-2025 | | | | 300,000 | | | | 278,880 | |
Tenet Healthcare Corporation 144A | | | 7.50 | | | | 4-1-2025 | | | | 150,000 | | | | 161,325 | |
Vizient Incorporated 144A | | | 6.25 | | | | 5-15-2027 | | | | 175,000 | | | | 183,873 | |
| | | | |
| | | | | | | | | | | | | | | 13,919,969 | |
| | | | | | | | | | | | | | | | |
|
| Health Care Technology: 0.84% | |
Change Healthcare Holdings Incorporated 144A | | | 5.75 | | | | 3-1-2025 | | | | 2,375,000 | | | | 2,322,085 | |
IQVIA Incorporated 144A | | | 5.00 | | | | 10-15-2026 | | | | 225,000 | | | | 231,930 | |
IQVIA Incorporated 144A | | | 5.00 | | | | 5-15-2027 | | | | 250,000 | | | | 256,798 | |
| | | | |
| | | | | | | | | | | | | | | 2,810,813 | |
| | | | | | | | | | | | | | | | |
|
| Life Sciences Tools & Services: 0.11% | |
Charles River Laboratories Incorporated 144A | | | 4.25 | | | | 5-1-2028 | | | | 75,000 | | | | 75,656 | |
Charles River Laboratories Incorporated 144A | | | 5.50 | | | | 4-1-2026 | | | | 150,000 | | | | 154,260 | |
Ortho-Clinical Diagnostics Incorporated 144A | | | 7.25 | | | | 2-1-2028 | | | | 150,000 | | | | 134,625 | |
| | | | |
| | | | | | | | | | | | | | | 364,541 | |
| | | | | | | | | | | | | | | | |
|
| Pharmaceuticals: 0.12% | |
Bausch Health Companies Incorporated 144A | | | 8.50 | | | | 1-31-2027 | | | | 375,000 | | | | 413,400 | |
| | | | | | | | | | | | | | | | |
|
| Industrials: 6.40% | |
|
| Aerospace & Defense: 1.43% | |
L3Harris Technologies Incorporated 144A | | | 4.95 | | | | 2-15-2021 | | | | 750,000 | | | | 762,631 | |
RBS Global & Rexnord LLC 144A | | | 4.88 | | | | 12-15-2025 | | | | 1,704,000 | | | | 1,661,400 | |
Signature Aviation US Holdings Incorporated 144A | | | 4.00 | | | | 3-1-2028 | | | | 600,000 | | | | 510,000 | |
Signature Aviation US Holdings Incorporated 144A | | | 5.38 | | | | 5-1-2026 | | | | 2,025,000 | | | | 1,868,063 | |
| | | | |
| | | | | | | | | | | | | | | 4,802,094 | |
| | | | | | | | | | | | | | | | |
The accompanying notes are an integral part of these financial statements.
16 | Wells Fargo Multi-Sector Income Fund
Portfolio of investments—April 30, 2020 (unaudited)
| | | | | | | | | | | | | | | | |
| | | Interest
rate | | | Maturity
date | | | Principal | | | Value | |
| Air Freight & Logistics: 0.12% | |
Cargo Aircraft Management Company 144A | | | 4.75 | % | | | 2-1-2028 | | | $ | 425,000 | | | $ | 396,844 | |
| | | | | | | | | | | | | | | | |
|
| Airlines: 0.08% | |
Delta Air Lines Incorporated | | | 4.75 | | | | 11-7-2021 | | | | 251,938 | | | | 251,757 | |
| | | | | | | | | | | | | | | | |
|
| Commercial Services & Supplies: 2.89% | |
Advanced Disposal Services Incorporated 144A | | | 5.63 | | | | 11-15-2024 | | | | 1,750,000 | | | | 1,811,250 | |
Covanta Holding Corporation | | | 5.88 | | | | 3-1-2024 | | | | 1,530,000 | | | | 1,503,225 | |
Covanta Holding Corporation | | | 5.88 | | | | 7-1-2025 | | | | 515,000 | | | | 498,263 | |
Covanta Holding Corporation | | | 6.00 | | | | 1-1-2027 | | | | 575,000 | | | | 552,000 | |
IAA Spinco Incorporated 144A | | | 5.50 | | | | 6-15-2027 | | | | 1,700,000 | | | | 1,696,260 | |
KAR Auction Services Incorporated 144A | | | 5.13 | | | | 6-1-2025 | | | | 4,200,000 | | | | 3,622,542 | |
| | | | |
| | | | | | | | | | | | | | | 9,683,540 | |
| | | | | | | | | | | | | | | | |
|
| Industrial Conglomerates: 0.21% | |
General Electric Capital Corporation | | | 4.65 | | | | 10-17-2021 | | | | 187,000 | | | | 194,231 | |
General Electric Company | | | 4.63 | | | | 1-7-2021 | | | | 505,000 | | | | 513,463 | |
| | | | |
| | | | | | | | | | | | | | | 707,694 | |
| | | | | | | | | | | | | | | | |
|
| Machinery: 1.05% | |
Navistar International Corporation 144A | | | 9.50 | | | | 5-1-2025 | | | | 125,000 | | | | 130,938 | |
Stevens Holding Company Incorporated 144A | | | 6.13 | | | | 10-1-2026 | | | | 1,425,000 | | | | 1,428,135 | |
Trimas Corporation 144A | | | 4.88 | | | | 10-15-2025 | | | | 1,997,000 | | | | 1,954,564 | |
| | | | |
| | | | | | | | | | | | | | | 3,513,637 | |
| | | | | | | | | | | | | | | | |
|
| Professional Services: 0.16% | |
Verisk Analytics Incorporated | | | 5.80 | | | | 5-1-2021 | | | | 530,000 | | | | 551,302 | |
| | | | | | | | | | | | | | | | |
|
| Trading Companies & Distributors: 0.46% | |
Fortress Transportation & Infrastructure Investors LLC 144A | | | 6.50 | | | | 10-1-2025 | | | | 1,875,000 | | | | 1,537,500 | |
| | | | | | | | | | | | | | | | |
|
| Information Technology: 5.78% | |
|
| Communications Equipment: 0.23% | |
CommScope Technologies Finance LLC 144A | | | 6.00 | | | | 6-15-2025 | | | | 825,000 | | | | 734,168 | |
CommScope Technologies Finance LLC 144A | | | 8.25 | | | | 3-1-2027 | | | | 50,000 | | | | 48,000 | |
| | | | |
| | | | | | | | | | | | | | | 782,168 | |
| | | | | | | | | | | | | | | | |
|
| Electronic Equipment, Instruments & Components: 0.20% | |
Keysight Technologies | | | 4.60 | | | | 4-6-2027 | | | | 600,000 | | | | 670,765 | |
| | | | | | | | | | | | | | | | |
|
| IT Services: 1.47% | |
Cardtronics Incorporated 144A | | | 5.50 | | | | 5-1-2025 | | | | 2,850,000 | | | | 2,707,500 | |
Gartner Incorporated 144A | | | 5.13 | | | | 4-1-2025 | | | | 1,525,000 | | | | 1,572,656 | |
Infor US Incorporated | | | 6.50 | | | | 5-15-2022 | | | | 550,000 | | | | 550,495 | |
Tempo Acquisition LLC 144A%% | | | 5.75 | | | | 6-1-2025 | | | | 75,000 | | | | 75,000 | |
| | | | |
| | | | | | | | | | | | | | | 4,905,651 | |
| | | | | | | | | | | | | | | | |
|
| Semiconductors & Semiconductor Equipment: 0.28% | |
Broadcom Corporation | | | 3.50 | | | | 1-15-2028 | | | | 750,000 | | | | 759,865 | |
Qorvo Incorporated 144A | | | 4.38 | | | | 10-15-2029 | | | | 175,000 | | | | 174,344 | |
| | | | |
| | | | | | | | | | | | | | | 934,209 | |
| | | | | | | | | | | | | | | | |
The accompanying notes are an integral part of these financial statements.
Wells Fargo Multi-Sector Income Fund | 17
Portfolio of investments—April 30, 2020 (unaudited)
| | | | | | | | | | | | | | | | |
| | | Interest
rate | | | Maturity
date | | | Principal | | | Value | |
| Software: 0.91% | |
CDK Global Incorporated 144A | | | 5.25 | % | | | 5-15-2029 | | | $ | 175,000 | | | $ | 178,500 | |
Fair Isaac Corporation 144A | | | 4.00 | | | | 6-15-2028 | | | | 100,000 | | | | 99,250 | |
Fair Isaac Corporation 144A | | | 5.25 | | | | 5-15-2026 | | | | 1,000,000 | | | | 1,032,500 | |
NortonLifeLock Incorporated 144A | | | 5.00 | | | | 4-15-2025 | | | | 475,000 | | | | 477,969 | |
SS&C Technologies Incorporated 144A | | | 5.50 | | | | 9-30-2027 | | | | 500,000 | | | | 512,500 | |
VMware Incorporated | | | 3.90 | | | | 8-21-2027 | | | | 750,000 | | | | 759,665 | |
| | | | |
| | | | | | | | | | | | | | | 3,060,384 | |
| | | | | | | | | | | | | | | | |
|
| Technology Hardware, Storage & Peripherals: 2.69% | |
Dell International LLC 144A | | | 7.13 | | | | 6-15-2024 | | | | 3,200,000 | | | | 3,315,840 | |
Diamond 1 Finance Corporation 144A | | | 6.02 | | | | 6-15-2026 | | | | 750,000 | | | | 811,470 | |
Hewlett-Packard Company | | | 4.05 | | | | 9-15-2022 | | | | 750,000 | | | | 783,280 | |
NCR Corporation | | | 6.38 | | | | 12-15-2023 | | | | 3,900,000 | | | | 3,948,750 | |
NCR Corporation 144A | | | 8.13 | | | | 4-15-2025 | | | | 150,000 | | | | 159,000 | |
| | | | |
| | | | | | | | | | | | | | | 9,018,340 | |
| | | | | | | | | | | | | | | | |
|
Materials: 2.56% | |
|
| Chemicals: 0.05% | |
Valvoline Incorporated 144A | | | 4.25 | | | | 2-15-2030 | | | | 175,000 | | | | 170,188 | |
| | | | | | | | | | | | | | | | |
|
| Containers & Packaging: 2.16% | |
Ball Corporation | | | 5.00 | | | | 3-15-2022 | | | | 25,000 | | | | 26,188 | |
Ball Corporation | | | 5.25 | | | | 7-1-2025 | | | | 190,000 | | | | 209,475 | |
Berry Global Incorporated 144A | | | 4.88 | | | | 7-15-2026 | | | | 500,000 | | | | 510,719 | |
Berry Global Incorporated | | | 5.13 | | | | 7-15-2023 | | | | 350,000 | | | | 352,188 | |
Berry Global Incorporated 144A | | | 5.63 | | | | 7-15-2027 | | | | 175,000 | | | | 180,688 | |
Berry Global Incorporated | | | 6.00 | | | | 10-15-2022 | | | | 107,000 | | | | 107,000 | |
Crown Americas Capital Corporation V | | | 4.25 | | | | 9-30-2026 | | | | 100,000 | | | | 100,205 | |
Crown Americas Capital Corporation VI | | | 4.75 | | | | 2-1-2026 | | | | 975,000 | | | | 1,001,813 | |
Crown Cork & Seal Company Incorporated | | | 7.38 | | | | 12-15-2026 | | | | 750,000 | | | | 821,250 | |
Flex Acquisition Company Incorporated 144A | | | 6.88 | | | | 1-15-2025 | | | | 1,500,000 | | | | 1,452,675 | |
Flex Acquisition Company Incorporated 144A | | | 7.88 | | | | 7-15-2026 | | | | 275,000 | | | | 264,000 | |
Owens-Brockway Packaging Incorporated 144A | | | 5.88 | | | | 8-15-2023 | | | | 325,000 | | | | 328,250 | |
Owens-Brockway Packaging Incorporated 144A | | | 6.38 | | | | 8-15-2025 | | | | 800,000 | | | | 812,000 | |
Sealed Air Corporation 144A | | | 5.25 | | | | 4-1-2023 | | | | 325,000 | | | | 334,880 | |
Silgan Holdings Incorporated 144A | | | 4.13 | | | | 2-1-2028 | | | | 750,000 | | | | 736,875 | |
| | | | |
| | | | | | | | | | | | | | | 7,238,206 | |
| | | | | | | | | | | | | | | | |
|
| Metals & Mining: 0.25% | |
Indalex Holdings Corporation (a)† | | | 11.50 | | | | 2-1-2021 | | | | 2,990,596 | | | | 0 | |
Kaiser Aluminum Corporation 144A | | | 4.63 | | | | 3-1-2028 | | | | 300,000 | | | | 279,300 | |
Kaiser Aluminum Corporation 144A | | | 6.50 | | | | 5-1-2025 | | | | 175,000 | | | | 178,281 | |
Novelis Corporation 144A | | | 5.88 | | | | 9-30-2026 | | | | 400,000 | | | | 388,920 | |
| | | | |
| | | | | | | | | | | | | | | 846,501 | |
| | | | | | | | | | | | | | | | |
|
| Paper & Forest Products: 0.10% | |
Clearwater Paper Corporation 144A | | | 5.38 | | | | 2-1-2025 | | | | 350,000 | | | | 328,125 | |
| | | | | | | | | | | | | | | | |
|
Real Estate: 1.46% | |
|
| Equity REITs: 1.46% | |
CoreCivic Incorporated | | | 5.00 | | | | 10-15-2022 | | | | 575,000 | | | | 552,518 | |
Equinix Incorporated | | | 5.88 | | | | 1-15-2026 | | | | 425,000 | | | | 441,405 | |
Iron Mountain Incorporated 144A | | | 5.38 | | | | 6-1-2026 | | | | 150,000 | | | | 149,250 | |
Omega HealthCare Investors Incorporated | | | 4.50 | | | | 4-1-2027 | | | | 600,000 | | | | 576,150 | |
The accompanying notes are an integral part of these financial statements.
18 | Wells Fargo Multi-Sector Income Fund
Portfolio of investments—April 30, 2020 (unaudited)
| | | | | | | | | | | | | | | | |
| | | Interest
rate | | | Maturity
date | | | Principal | | | Value | |
|
| Equity REITs (continued) | |
SBA Communications Corporation 144A | | | 3.88 | % | | | 2-15-2027 | | | $ | 300,000 | | | $ | 306,375 | |
SBA Communications Corporation | | | 4.00 | | | | 10-1-2022 | | | | 225,000 | | | | 226,193 | |
SITE Centers Corporation | | | 4.70 | | | | 6-1-2027 | | | | 600,000 | | | | 610,790 | |
The Geo Group Incorporated | | | 5.13 | | | | 4-1-2023 | | | | 800,000 | | | | 670,000 | |
The Geo Group Incorporated | | | 5.88 | | | | 1-15-2022 | | | | 600,000 | | | | 555,000 | |
The Geo Group Incorporated | | | 5.88 | | | | 10-15-2024 | | | | 840,000 | | | | 663,600 | |
The Geo Group Incorporated | | | 6.00 | | | | 4-15-2026 | | | | 184,000 | | | | 139,380 | |
| | | | |
| | | | | | | | | | | | | | | 4,890,661 | |
| | | | | | | | | | | | | | | | |
|
Utilities: 4.02% | |
|
| Electric Utilities: 0.90% | |
Evergy Incorporated | | | 4.85 | | | | 6-1-2021 | | | | 750,000 | | | | 769,631 | |
NextEra Energy Operating Partners LP 144A | | | 4.25 | | | | 7-15-2024 | | | | 775,000 | | | | 788,795 | |
NextEra Energy Operating Partners LP 144A | | | 4.25 | | | | 9-15-2024 | | | | 175,000 | | | | 177,625 | |
NextEra Energy Operating Partners LP 144A | | | 4.50 | | | | 9-15-2027 | | | | 1,250,000 | | | | 1,282,813 | |
| | | | |
| | | | | | | | | | | | | | | 3,018,864 | |
| | | | | | | | | | | | | | | | |
|
| Independent Power & Renewable Electricity Producers: 2.88% | |
NSG Holdings LLC 144A | | | 7.75 | | | | 12-15-2025 | | | | 2,770,183 | | | | 2,790,959 | |
Pattern Energy Group Incorporated 144A | | | 5.88 | | | | 2-1-2024 | | | | 3,225,000 | | | | 3,257,250 | |
TerraForm Power Operating LLC 144A | | | 4.25 | | | | 1-31-2023 | | | | 2,025,000 | | | | 2,074,613 | |
TerraForm Power Operating LLC 144A | | | 4.75 | | | | 1-15-2030 | | | | 800,000 | | | | 818,000 | |
TerraForm Power Operating LLC 144A | | | 5.00 | | | | 1-31-2028 | | | | 675,000 | | | | 708,102 | |
| | | | |
| | | | | | | | | | | | | | | 9,648,924 | |
| | | | | | | | | | | | | | | | |
|
| Multi-Utilities: 0.24% | |
CMS Energy Corporation | | | 5.05 | | | | 3-15-2022 | | | | 750,000 | | | | 792,351 | |
| | | | | | | | | | | | | | | | |
| |
Total Corporate Bonds and Notes (Cost $252,389,123) | | | | 230,530,551 | |
| | | | | |
|
| Foreign Corporate Bonds and Notes: 4.26% | |
|
Financials: 4.26% | |
|
| Banks: 4.19% | |
European Investment Bank | | | 7.25 | | | | 6-28-2021 | | | BRL | 9,000,000 | | | | 1,733,748 | |
European Investment Bank | | | 8.00 | | | | 5-5-2027 | | | ZAR | 21,000,000 | | | | 1,219,406 | |
European Investment Bank | | | 8.38 | | | | 7-29-2022 | | | ZAR | 40,000,000 | | | | 2,310,809 | |
European Investment Bank | | | 8.75 | | | | 8-18-2025 | | | ZAR | 20,000,000 | | | | 1,205,471 | |
European Investment Bank | | | 9.00 | | | | 3-31-2021 | | | ZAR | 17,400,000 | | | | 975,519 | |
International Bank for Reconstruction & Development | | | 7.00 | | | | 6-7-2023 | | | ZAR | 15,000,000 | | | | 854,415 | |
International Bank for Reconstruction & Development | | | 7.50 | | | | 6-9-2021 | | | BRL | 5,000,000 | | | | 963,037 | |
International Bank for Reconstruction & Development | | | 8.25 | | | | 6-22-2023 | | | BRL | 9,000,000 | | | | 1,826,348 | |
KfW | | | 7.50 | | | | 11-10-2022 | | | ZAR | 36,000,000 | | | | 2,070,134 | |
Landwirtschaftliche Rentenbank | | | 8.25 | | | | 5-23-2022 | | | ZAR | 15,000,000 | | | | 854,495 | |
| | | | |
| | | | | | | | | | | | | | | 14,013,382 | |
| | | | | | | | | | | | | | | | |
|
| Diversified Financial Services: 0.07% | |
AA Bond Company Limited | | | 4.25 | | | | 7-31-2043 | | | GBP | 200,000 | | | | 248,110 | |
| | | | | | | | | | | | | | | | |
| |
Total Foreign Corporate Bonds and Notes (Cost $19,150,864) | | | | 14,261,492 | |
| | | | | |
|
| Foreign Government Bonds: 25.86% | |
Colombia | | | 7.50 | | | | 8-26-2026 | | | COP | 22,725,000,000 | | | | 6,126,720 | |
India | | | 7.32 | | | | 1-28-2024 | | | INR | 710,000,000 | | | | 10,151,029 | |
The accompanying notes are an integral part of these financial statements.
Wells Fargo Multi-Sector Income Fund | 19
Portfolio of investments—April 30, 2020 (unaudited)
| | | | | | | | | | | | | | | | |
| | | Interest
rate | | | Maturity
date | | | Principal | | | Value | |
|
| Foreign Government Bonds (continued) | |
Indonesia | | | 7.50 | % | | | 8-15-2032 | | | IDR | 57,000,000,000 | | | $ | 3,616,195 | |
Indonesia | | | 8.25 | | | | 5-15-2029 | | | IDR | 58,615,000,000 | | | | 3,999,612 | |
Indonesia | | | 8.38 | | | | 9-15-2026 | | | IDR | 110,000,000,000 | | | | 7,616,807 | |
Malaysia | | | 4.18 | | | | 7-15-2024 | | | MYR | 19,850,000 | | | | 4,915,778 | |
Malaysia | | | 4.23 | | | | 6-30-2031 | | | MYR | 36,300,000 | | | | 9,362,133 | |
Mexico | | | 5.75 | | | | 3-5-2026 | | | MXN | 117,000,000 | | | | 4,813,452 | |
Mexico | | | 8.50 | | | | 5-31-2029 | | | MXN | 200,000,000 | | | | 9,368,076 | |
Republic of Trinidad and Tobago 144A | | | 4.50 | | | | 8-4-2026 | | | TTD | 750,000 | | | | 695,625 | |
Romania | | | 3.25 | | | | 4-29-2024 | | | RON | 46,000,000 | | | | 10,145,783 | |
Romania | | | 5.00 | | | | 2-12-2029 | | | RON | 20,000,000 | | | | 4,572,723 | |
Russia | | | 6.50 | | | | 2-28-2024 | | | RUB | 390,000,000 | | | | 5,443,999 | |
Russia | | | 6.90 | | | | 5-23-2029 | | | RUB | 400,000,000 | | | | 5,762,253 | |
| |
Total Foreign Government Bonds (Cost $92,538,358) | | | | 86,590,185 | |
| | | | | |
|
Loans: 18.40% | |
|
Communication Services: 3.53% | |
|
| Diversified Telecommunication Services: 0.32% | |
Level 3 Financing Incorporated (1 Month LIBOR +1.75%)± | | | 2.15 | | | | 3-1-2027 | | | $ | 374,717 | | | | 358,166 | |
Telesat Canada (1 Month LIBOR +2.75%)± | | | 3.16 | | | | 12-7-2026 | | | | 748,125 | | | | 702,923 | |
| | | | |
| | | | | | | | | | | | | | | 1,061,089 | |
| | | | | | | | | | | | | | | | |
|
| Interactive Media & Services: 1.03% | |
Ancestry.com Incorporated (1 Month LIBOR +4.25%)± | | | 4.66 | | | | 8-27-2026 | | | | 3,669,633 | | | | 3,170,563 | |
Buzz Merger Sub Limited (1 Month LIBOR +2.75%)± | | | 3.15 | | | | 1-29-2027 | | | | 275,000 | | | | 261,250 | |
| | | | |
| | | | | | | | | | | | | | | 3,431,813 | |
| | | | | | | | | | | | | | | | |
|
| Media: 1.94% | |
Block Communications Incorporated (4 Month LIBOR +2.25%)±‡ | | | 3.70 | | | | 2-25-2027 | | | | 600,000 | | | | 558,000 | |
CSC Holdings LLC (1 Month LIBOR +2.25%)± | | | 3.06 | | | | 7-17-2025 | | | | 762,428 | | | | 724,185 | |
CSC Holdings LLC (1 Month LIBOR +2.25%)± | | | 3.06 | | | | 1-15-2026 | | | | 493,750 | | | | 468,445 | |
CSC Holdings LLC (1 Month LIBOR +2.50%)± | | | 3.31 | | | | 4-15-2027 | | | | 147,755 | | | | 140,394 | |
Diamond Sports Group LLC (1 Month LIBOR +3.25%)± | | | 3.82 | | | | 8-24-2026 | | | | 398,000 | | | | 322,961 | |
Gray Television Incorporated (1 Month LIBOR +2.50%)± | | | 3.49 | | | | 1-2-2026 | | | | 488,545 | | | | 458,826 | |
Hubbard Radio LLC (3 Month LIBOR +3.50%)± | | | 4.50 | | | | 3-28-2025 | | | | 1,406,490 | | | | 1,054,867 | |
Montreign Operating Company LLC (1 Month LIBOR +2.25%)±‡ | | | 2.65 | | | | 3-22-2021 | | | | 1,445,025 | | | | 1,228,271 | |
Nexstar Broadcasting Incorporated (1 Month LIBOR +2.75%)± | | | 3.73 | | | | 9-18-2026 | | | | 1,200,781 | | | | 1,124,232 | |
Nielsen Finance LLC (1 Month LIBOR +2.00%)± | | | 2.86 | | | | 10-4-2023 | | | | 458,446 | | | | 440,058 | |
| | | | |
| | | | | | | | | | | | | | | 6,520,239 | |
| | | | | | | | | | | | | | | | |
|
| Wireless Telecommunication Services: 0.24% | |
Inmarsat plc (1 Month LIBOR +4.50%)± | | | 5.50 | | | | 12-11-2026 | | | | 875,000 | | | | 797,711 | |
| | | | | | | | | | | | | | | | |
|
Consumer Discretionary: 1.56% | |
|
| Auto Components: 0.44% | |
Allison Transmission Incorporated (1 Month LIBOR +1.75%)± | | | 2.37 | | | | 3-29-2026 | | | | 1,028,473 | | | | 987,334 | |
Belron Finance US LLC (3 Month LIBOR +2.25%)±‡ | | | 3.99 | | | | 11-7-2024 | | | | 293,250 | | | | 277,121 | |
Panther BF Aggregator 2 LP (1 Month LIBOR +3.50%)± | | | 3.90 | | | | 4-30-2026 | | | | 223,875 | | | | 202,159 | |
| | | | |
| | | | | | | | | | | | | | | 1,466,614 | |
| | | | | | | | | | | | | | | | |
|
| Distributors: 0.66% | |
Spin Holdco Incorporated (1 Month LIBOR +3.25%)± | | | 4.25 | | | | 11-14-2022 | | | | 2,404,156 | | | | 2,197,399 | |
| | | | | | | | | | | | | | | | |
The accompanying notes are an integral part of these financial statements.
20 | Wells Fargo Multi-Sector Income Fund
Portfolio of investments—April 30, 2020 (unaudited)
| | | | | | | | | | | | | | | | |
| | | Interest
rate | | | Maturity
date | | | Principal | | | Value | |
| Hotels, Restaurants & Leisure: 0.38% | |
CCM Merger Incorporated (1 Month LIBOR +2.25%)± | | | 3.00 | % | | | 8-8-2021 | | | $ | 496,562 | | | $ | 457,706 | |
Four Seasons Holdings Incorporated (1 Month LIBOR +2.00%)± | | | 2.40 | | | | 11-30-2023 | | | | 881,063 | | | | 814,067 | |
| | | | |
| | | | | | | | | | | | | | | 1,271,773 | |
| | | | | | | | | | | | | | | | |
|
| Specialty Retail: 0.08% | |
Rent-A-Center Incorporated (3 Month LIBOR +4.50%)±‡ | | | 5.44 | | | | 8-5-2026 | | | | 298,500 | | | | 283,575 | |
| | | | | | | | | | | | | | | | |
|
Consumer Staples: 0.65% | |
|
| Food Products: 0.61% | |
Atkins Nutritionals Holdings II Incorporated (1 Month LIBOR +3.75%)±‡ | | | 4.75 | | | | 7-7-2024 | | | | 218,135 | | | | 211,046 | |
B&G Foods Incorporated (1 Month LIBOR +2.50%)± | | | 2.90 | | | | 10-10-2026 | | | | 298,500 | | | | 287,867 | |
CHG PPC Parent LLC (1 Month LIBOR +2.75%)±‡ | | | 3.15 | | | | 3-31-2025 | | | | 122,813 | | | | 112,988 | |
Prestige Brands Incorporated (1 Month LIBOR +2.00%)± | | | 2.40 | | | | 1-26-2024 | | | | 1,474,781 | | | | 1,433,487 | |
| | | | |
| | | | | | | | | | | | | | | 2,045,388 | |
| | | | | | | | | | | | | | | | |
|
| Household Products: 0.04% | |
Reynolds Consumer Products LLC (1 Month LIBOR +1.75%)± | | | 2.15 | | | | 2-4-2027 | | | | 150,000 | | | | 144,305 | |
| | | | | | | | | | | | | | | | |
|
Energy: 0.84% | |
|
| Oil, Gas & Consumable Fuels: 0.84% | |
Buckeye Partners LP (1 Month LIBOR +2.75%)± | | | 3.77 | | | | 11-1-2026 | | | | 150,000 | | | | 140,157 | |
Encino Acquisition Partners Holdings LLC (1 Month LIBOR +6.75%)± | | | 7.75 | | | | 10-29-2025 | | | | 600,000 | | | | 256,002 | |
EPIC Crude Services LP (3 Month LIBOR +5.00%)± | | | 6.62 | | | | 3-2-2026 | | | | 1,950,000 | | | | 1,164,150 | |
Ultra Resources Incorporated (3 Month LIBOR +4.00%)± | | | 5.45 | | | | 4-12-2024 | | | | 1,982,193 | | | | 1,259,942 | |
| | | | |
| | | | | | | | | | | | | | | 2,820,251 | |
| | | | | | | | | | | | | | | | |
|
Financials: 5.02% | |
|
| Capital Markets: 1.41% | |
Focus Financial Partners LLC (1 Month LIBOR +2.00%)± | | | 2.40 | | | | 7-3-2024 | | | | 740,837 | | | | 699,165 | |
Global Business Travel Holdings Limited (3 Month LIBOR +2.50%)±‡ | | | 4.21 | | | | 8-13-2025 | | | | 147,750 | | | | 130,020 | |
Nexus Buyer LLC (1 Month LIBOR +3.75%)± | | | 4.58 | | | | 11-9-2026 | | | | 698,250 | | | | 676,723 | |
Russell Investments US Institutional Holdco Incorporated (6 Month LIBOR +2.75%) ± | | | 3.82 | | | | 6-1-2023 | | | | 521,259 | | | | 474,888 | |
VFH Parent LLC (1 Month LIBOR +3.00%)± | | | 3.86 | | | | 3-1-2026 | | | | 858,017 | | | | 828,844 | |
Victory Capital Management Incorporated (3 Month LIBOR +2.50%)± | | | 3.94 | | | | 7-1-2026 | | | | 1,994,182 | | | | 1,894,473 | |
| | | | |
| | | | | | | | | | | | | | | 4,704,113 | |
| | | | | | | | | | | | | | | | |
|
| Consumer Finance: 0.19% | |
TransUnion LLC (1 Month LIBOR +1.75%)± | | | 2.15 | | | | 11-16-2026 | | | | 664,475 | | | | 635,511 | |
| | | | | | | | | | | | | | | | |
|
| Diversified Financial Services: 1.59% | |
Jefferies Finance LLC (1 Month LIBOR +3.25%)± | | | 3.69 | | | | 6-3-2026 | | | | 347,375 | | | | 307,427 | |
LPL Holdings Incorporated (1 Month LIBOR +1.75%)± | | | 2.24 | | | | 11-12-2026 | | | | 766,411 | | | | 731,286 | |
Resolute Investment Managers Incorporated (3 Month LIBOR +3.25%)±‡ | | | 4.70 | | | | 4-30-2022 | | | | 2,394,079 | | | | 2,262,404 | |
Resolute Investment Managers Incorporated (3 Month LIBOR +7.50%)±‡ | | | 8.50 | | | | 4-30-2023 | | | | 1,090,000 | | | | 967,375 | |
Stonepeak Lonestar Holdings LLC (3 Month LIBOR +4.50%)± | | | 5.63 | | | | 10-19-2026 | | | | 1,247,906 | | | | 1,055,654 | |
| | | | |
| | | | | | | | | | | | | | | 5,324,146 | |
| | | | | | | | | | | | | | | | |
|
| Insurance: 1.76% | |
Alliant Holdings Intermediate LLC (1 Month LIBOR +2.75%)± | | | 3.15 | | | | 5-9-2025 | | | | 1,358,075 | | | | 1,265,726 | |
AmWINS Group Incorporated (1 Month LIBOR +2.75%)± | | | 3.75 | | | | 1-25-2024 | | | | 874,823 | | | | 843,522 | |
BroadStreet Partners Incorporated (1 Month LIBOR +3.25%)± | | | 3.65 | | | | 1-27-2027 | | | | 498,590 | | | | 467,054 | |
HUB International Limited (2 Month LIBOR +3.00%)± | | | 4.02 | | | | 4-25-2025 | | | | 1,228,125 | | | | 1,148,014 | |
The accompanying notes are an integral part of these financial statements.
Wells Fargo Multi-Sector Income Fund | 21
Portfolio of investments—April 30, 2020 (unaudited)
| | | | | | | | | | | | | | | | |
| | | Interest
rate | | | Maturity
date | | | Principal | | | Value | |
|
| Insurance (continued) | |
HUB International Limited (3 Month LIBOR +4.00%)± | | | 5.69 | % | | | 4-25-2025 | | | $ | 698,250 | | | $ | 667,695 | |
Solera Holdings Incorporated (3 Month LIBOR +2.75%)± | | | 4.36 | | | | 3-3-2023 | | | | 1,066,321 | | | | 1,008,814 | |
USI Incorporated (1 Month LIBOR +3.00%)± | | | 3.40 | | | | 5-16-2024 | | | | 292,867 | | | | 275,172 | |
USI Incorporated (1 Month LIBOR +4.00%)± | | | 4.40 | | | | 12-2-2026 | | | | 224,438 | | | | 213,357 | |
| | | | |
| | | | | | | | | | | | | | | 5,889,354 | |
| | | | | | | | | | | | | | | | |
|
| Mortgage REITs: 0.07% | |
Blackstone Mortgage Trust Incorporated (1 Month LIBOR +2.25%)±‡ | | | 2.65 | | | | 4-23-2026 | | | | 148,877 | | | | 136,222 | |
Starwood Property Trust Incorporated (1 Month LIBOR +2.50%)±‡ | | | 2.90 | | | | 7-27-2026 | | | | 124,375 | | | | 112,248 | |
| | | | |
| | | | | | | | | | | | | | | 248,470 | |
| | | | | | | | | | | | | | | | |
|
Health Care: 1.12% | |
|
| Health Care Providers & Services: 0.35% | |
MPH Acquisition Holdings LLC (3 Month LIBOR +2.75%)± | | | 4.20 | | | | 6-7-2023 | | | | 429,539 | | | | 394,373 | |
Surgery Center Holdings Incorporated (1 Month LIBOR +3.25%)± | | | 4.25 | | | | 9-3-2024 | | | | 514,278 | | | | 457,707 | |
Team Health Holdings Incorporated (1 Month LIBOR +2.75%)± | | | 3.75 | | | | 2-6-2024 | | | | 435,038 | | | | 318,756 | |
| | | | |
| | | | | | | | | | | | | | | 1,170,836 | |
| | | | | | | | | | | | | | | | |
|
| Health Care Technology: 0.14% | |
Change Healthcare Holdings Incorporated (3 Month LIBOR +2.50%)± | | | 3.50 | | | | 3-1-2024 | | | | 499,580 | | | | 480,221 | |
| | | | | | | | | | | | | | | | |
|
| Life Sciences Tools & Services: 0.07% | |
Syneos Health Incorporated (1 Month LIBOR +1.75%)± | | | 2.15 | | | | 8-1-2024 | | | | 236,183 | | | | 227,548 | |
| | | | | | | | | | | | | | | | |
|
| Pharmaceuticals: 0.56% | |
Endo Finance LLC (1 Month LIBOR +4.25%)± | | | 5.00 | | | | 4-29-2024 | | | | 288,529 | | | | 261,661 | |
Valeant Pharmaceuticals International Incorporated (1 Month LIBOR +3.00%)± | | | 3.72 | | | | 6-2-2025 | | | | 1,663,987 | | | | 1,607,827 | |
| | | | |
| | | | | | | | | | | | | | | 1,869,488 | |
| | | | | | | | | | | | | | | | |
|
Industrials: 2.26% | |
|
| Aerospace & Defense: 0.30% | |
TransDigm Incorporated (1 Month LIBOR +2.25%)± | | | 2.65 | | | | 8-22-2024 | | | | 1,159,077 | | | | 1,012,094 | |
| | | | | | | | | | | | | | | | |
|
| Commercial Services & Supplies: 0.99% | |
Advanced Disposal Services Incorporated (1 Month LIBOR +2.25%)± | | | 3.00 | | | | 11-10-2023 | | | | 1,134,962 | | | | 1,119,515 | |
IAA Spinco Incorporated (1 Month LIBOR +2.25%)± | | | 3.25 | | | | 6-28-2026 | | | | 943,313 | | | | 889,072 | |
KAR Auction Services Incorporated (1 Month LIBOR +2.25%)±‡ | | | 2.88 | | | | 9-19-2026 | | | | 39,898 | | | | 36,108 | |
NorthRiver Midstream Finance LP (3 Month LIBOR +3.25%)± | | | 4.68 | | | | 10-1-2025 | | | | 369,375 | | | | 296,290 | |
WASH Multifamily Laundry Systems LLC (1 Month LIBOR +3.25%)±‡ | | | 4.25 | | | | 5-14-2022 | | | | 948,741 | | | | 844,379 | |
WASH Multifamily Laundry Systems LLC (1 Month LIBOR +3.25%)±‡ | | | 4.25 | | | | 5-14-2022 | | | | 166,153 | | | | 147,876 | |
| | | | |
| | | | | | | | | | | | | | | 3,333,240 | |
| | | | | | | | | | | | | | | | |
|
| Construction Materials: 0.12% | |
American Builders & Contractors Supply Company Incorporated (1 Month LIBOR +2.00%)± | | | 2.40 | | | | 1-15-2027 | | | | 447,750 | | | | 418,552 | |
| | | | | | | | | | | | | | | | |
|
| Electrical Equipment: 0.12% | |
Generac Power Systems Incorporated (1 Month LIBOR +1.75%)± | | | 2.73 | | | | 12-13-2026 | | | | 402,045 | | | | 389,312 | |
| | | | | | | | | | | | | | | | |
|
| Machinery: 0.65% | |
Altra Industrial Motion Corporation (1 Month LIBOR +2.00%)± | | | 2.40 | | | | 10-1-2025 | | | | 621,946 | | | | 584,629 | |
Columbus McKinnon Corporation (3 Month LIBOR +2.50%)±‡ | | | 3.95 | | | | 1-31-2024 | | | | 690,516 | | | | 655,990 | |
Gates Global LLC (1 Month LIBOR +2.75%)± | | | 3.75 | | | | 4-1-2024 | | | | 594,008 | | | | 545,323 | |
The accompanying notes are an integral part of these financial statements.
22 | Wells Fargo Multi-Sector Income Fund
Portfolio of investments—April 30, 2020 (unaudited)
| | | | | | | | | | | | | | | | |
| | | Interest
rate | | | Maturity
date | | | Principal | | | Value | |
|
| Machinery (continued) | |
Ingersoll-Rand Public Limited Company (1 Month LIBOR +1.75%)± | | | 2.15 | % | | | 3-1-2027 | | | $ | 300,000 | | | $ | 284,100 | |
Restaurant Technologies Incorporated (3 Month LIBOR +3.25%)± | | | 4.70 | | | | 10-1-2025 | | | | 123,438 | | | | 108,419 | |
| | | | |
| | | | | | | | | | | | | | | 2,178,461 | |
| | | | | | | | | | | | | | | | |
|
| Professional Services: 0.08% | |
The Dun & Bradstreet Corporation (1 Month LIBOR +4.00%)± | | | 4.49 | | | | 2-6-2026 | | | | 275,000 | | | | 256,438 | |
| | | | | | | | | | | | | | | | |
|
| Information Technology: 1.76% | |
|
| Communications Equipment: 0.22% | |
Ciena Corporation (1 Month LIBOR +1.75%)± | | | 2.47 | | | | 9-26-2025 | | | | 271,569 | | | | 267,224 | |
CommScope Incorporated (1 Month LIBOR +3.25%)± | | | 3.65 | | | | 4-6-2026 | | | | 497,500 | | | | 466,585 | |
| | | | |
| | | | | | | | | | | | | | | 733,809 | |
| | | | | | | | | | | | | | | | |
|
| Electronic Equipment, Instruments & Components: 0.63% | |
Dell International LLC (1 Month LIBOR +2.00%)± | | | 2.75 | | | | 9-19-2025 | | | | 2,147,806 | | | | 2,089,815 | |
| | | | | | | | | | | | | | | | |
|
| IT Services: 0.56% | |
Applied Systems Incorporated (3 Month LIBOR +3.25%)± | | | 4.70 | | | | 9-19-2024 | | | | 390,849 | | | | 373,659 | |
Fiserv Investment Solutions Incorporated (3 Month LIBOR +4.75%)±‡ | | | 6.44 | | | | 2-18-2027 | | | | 275,000 | | | | 261,250 | |
Infor US Incorporated (1 Month LIBOR +2.75%)± | | | 3.75 | | | | 2-1-2022 | | | | 768,329 | | | | 753,600 | |
Sophia Holding Finance LP (3 Month LIBOR +3.25%)± | | | 4.70 | | | | 9-30-2022 | | | | 131,709 | | | | 126,770 | |
WEX Incorporated (1 Month LIBOR +2.25%)± | | | 2.65 | | | | 5-15-2026 | | | | 394,985 | | | | 370,496 | |
| | | | |
| | | | | | | | | | | | | | | 1,885,775 | |
| | | | | | | | | | | | | | | | |
|
| Software: 0.35% | |
Emerald Topco Incorporated (1 Month LIBOR +3.50%)± | | | 4.26 | | | | 7-24-2026 | | | | 995,000 | | | | 932,315 | |
SS&C Technologies Incorporated (1 Month LIBOR +1.75%)± | | | 2.15 | | | | 4-16-2025 | | | | 146,266 | | | | 140,432 | |
SS&C Technologies Incorporated (1 Month LIBOR +1.75%)± | | | 2.15 | | | | 4-16-2025 | | | | 104,371 | | | | 100,208 | |
| | | | |
| | | | | | | | | | | | | | | 1,172,955 | |
| | | | | | | | | | | | | | | | |
|
Materials: 1.16% | |
|
| Containers & Packaging: 1.10% | |
Berry Global Incorporated (1 Month LIBOR +2.00%)± | | | 2.83 | | | | 10-1-2022 | | | | 387,258 | | | | 376,771 | |
Flex Acquisition Company Incorporated (3 Month LIBOR +3.25%)± | | | 4.68 | | | | 6-29-2025 | | | | 733,889 | | | | 683,250 | |
Reynolds Group Holdings Incorporated (1 Month LIBOR +2.75%)± | | | 3.15 | | | | 2-5-2023 | | | | 2,412,680 | | | | 2,295,568 | |
RING Container Technologies (1 Month LIBOR +2.75%)±‡ | | | 3.15 | | | | 10-31-2024 | | | | 364,214 | | | | 324,150 | |
| | | | |
| | | | | | | | | | | | | | | 3,679,739 | |
| | | | | | | | | | | | | | | | |
|
| Paper & Forest Products: 0.06% | |
Clearwater Paper Corporation (6 Month LIBOR +3.25%)±‡ | | | 4.25 | | | | 7-26-2026 | | | | 199,500 | | | | 194,513 | |
| | | | | | | | | | | | | | | | |
|
Real Estate: 0.50% | |
|
| Equity REITs: 0.50% | |
The Geo Group Incorporated (1 Month LIBOR +2.00%)± | | | 2.75 | | | | 3-22-2024 | | | | 1,921,572 | | | | 1,694,827 | |
| | | | | | | | | | | | | | | | |
| |
Total Loans (Cost $68,157,826) | | | | 61,629,374 | |
| | | | | |
|
| Non-Agency Mortgage-Backed Securities: 5.25% | |
American Money Management Corporation Series2015-16A Class AR (3 Month LIBOR +1.26%) 144A± | | | 2.57 | | | | 4-14-2029 | | | | 500,000 | | | | 485,197 | |
Banc of America Commercial Mortgage Securities Incorporated Series2006-03 Class AM±± | | | 5.86 | | | | 7-10-2044 | | | | 519,101 | | | | 131,654 | |
Banc of America Funding Corporation Series 2005Class 5-1A1 | | | 5.50 | | | | 9-25-2035 | | | | 144,449 | | | | 148,681 | |
The accompanying notes are an integral part of these financial statements.
Wells Fargo Multi-Sector Income Fund | 23
Portfolio of investments—April 30, 2020 (unaudited)
| | | | | | | | | | | | | | | | |
| | | Interest
rate | | | Maturity
date | | | Principal | | | Value | |
|
| Non-Agency Mortgage-Backed Securities (continued) | |
Banc of America Funding Corporation Series 2005Class D-A1±± | | | 4.33 | % | | | 5-25-2035 | | | $ | 230,443 | | | $ | 220,068 | |
Banc of America Merrill Lynch Commercial Mortgage IncorporatedSeries 2017-BNK6 Class D 144A | | | 3.10 | | | | 7-15-2060 | | | | 1,000,000 | | | | 633,168 | |
Banc of America Mortgage Securities Series 2003 Class 1A1±± | | | 3.87 | | | | 4-25-2033 | | | | 259,673 | | | | 237,847 | |
Benchmark Mortgage Trust Series2018-B1 Class A2 | | | 3.57 | | | | 1-15-2051 | | | | 195,000 | | | | 202,290 | |
Bluemountain CLO Limited Series2015-2A Class A1R (3 Month LIBOR +0.93%) 144A± | | | 2.07 | | | | 7-18-2027 | | | | 496,769 | | | | 485,443 | |
Centex Home Equity Series2002-A Class AF6 | | | 5.54 | | | | 1-25-2032 | | | | 17,408 | | | | 17,514 | |
Centex Home Equity Series2004-B Class AF6 | | | 4.69 | | | | 3-25-2034 | | | | 25,824 | | | | 25,910 | |
Citigroup Commercial Mortgage Trust Series2012-GC8 Class C 144A±± | | | 5.04 | | | | 9-10-2045 | | | | 1,000,000 | | | | 847,947 | |
Citigroup Commercial Mortgage Trust Series 2017-MDRB Class A (1 Month LIBOR +1.10%) 144A± | | | 1.91 | | | | 7-15-2030 | | | | 394,694 | | | | 371,618 | |
Commercial Mortgage Trust Series2012-CR2 Class C±± | | | 4.99 | | | | 8-15-2045 | | | | 1,000,000 | | | | 915,342 | |
Commercial Mortgage Trust Series2012-CR4 Class B 144A | | | 3.70 | | | | 10-15-2045 | | | | 1,000,000 | | | | 705,349 | |
Commercial Mortgage Trust Series2012-CR5 Class E 144A±± | | | 4.46 | | | | 12-10-2045 | | | | 1,000,000 | | | | 786,626 | |
Commercial Mortgage Trust Series2012-LC4 Class A4 | | | 3.29 | | | | 12-10-2044 | | | | 193,527 | | | | 195,587 | |
Commercial Mortgage Trust Series2012-LC4 Class AM | | | 4.06 | | | | 12-10-2044 | | | | 500,000 | | | | 509,070 | |
Commercial Mortgage Trust Series2012-LC4 Class C±± | | | 5.72 | | | | 12-10-2044 | | | | 500,000 | | | | 483,239 | |
Commercial Mortgage Trust Series 2013-LC13 Class D 144A±± | | | 5.46 | | | | 8-10-2046 | | | | 1,103,000 | | | | 899,110 | |
Countrywide Home Loans Series2003-48 Class 2A2±± | | | 4.29 | | | | 10-25-2033 | | | | 36,899 | | | | 35,550 | |
Credit Suisse First Boston Mortgage Securities Series 2002-AR25 Class 1A1±± | | | 3.45 | | | | 9-25-2032 | | | | 286,765 | | | | 255,498 | |
Credit Suisse First Boston Mortgage Securities Series 2003-AR15 Class 3A1±± | | | 4.16 | | | | 6-25-2033 | | | | 54,910 | | | | 50,808 | |
Credit Suisse First Boston Mortgage Securities Series2003-AR9 Class 2A2±± | | | 3.75 | | | | 3-25-2033 | | | | 12,079 | | | | 10,913 | |
Credit Suisse First Boston Mortgage Securities Series2014-USA Class D 144A | | | 4.37 | | | | 9-15-2037 | | | | 750,000 | | | | 616,613 | |
Crown Point Limited Series2015-3A Class A1AR (3 Month LIBOR +0.91%) 144A± | | | 2.13 | | | | 12-31-2027 | | | | 287,618 | | | | 282,957 | |
Global Mortgage Securitization Limited Series2004-A Class A2 (1 Month LIBOR +0.32%) 144A± | | | 0.81 | | | | 11-25-2032 | | | | 55,404 | | | | 51,026 | |
Goldman Sachs Mortgage Securities Trust Series 2019-GSA1 Class C±± | | | 3.93 | | | | 11-10-2052 | | | | 1,000,000 | | | | 730,793 | |
Goldman Sachs Mortgage Securities Trust Series 2020-DUNE Class D (1 Month LIBOR +1.90%) 144A± | | | 2.71 | | | | 12-15-2036 | | | | 1,000,000 | | | | 779,640 | |
Goldman Sachs Mortgage Securities Trust Series2010-C1 Class X 144A±±(c) | | | 1.36 | | | | 8-10-2043 | | | | 2,330,899 | | | | 28,975 | |
Goldman Sachs Mortgage Securities Trust Series 2012-GCJ7 Class XA±±(c) | | | 2.35 | | | | 5-10-2045 | | | | 2,720,395 | | | | 64,824 | |
GSAA Home Equity Trust Series2004-5 Class AF5 | | | 4.30 | | | | 6-25-2034 | | | | 318 | | | | 313 | |
GSMPS Mortgage Loan Trust Series2006-1 Class A1 (1 Month LIBOR +0.30%) 144A± | | | 0.79 | | | | 3-25-2035 | | | | 8,440 | | | | 8,365 | |
JPMorgan Chase Commercial Mortgage Securities Trust Series2012-C6 Class E 144A±± | | | 5.33 | | | | 5-15-2045 | | | | 520,000 | | | | 340,885 | |
JPMorgan Chase Commercial Mortgage Securities Trust Series2013-C17 Class B ±± | | | 5.05 | | | | 1-15-2047 | | | | 50,000 | | | | 51,336 | |
JPMorgan Mortgage Trust Series2004-A3 Class 2A1±± | | | 4.92 | | | | 7-25-2034 | | | | 12,937 | | | | 12,357 | |
JPMorgan Mortgage Trust Series2004-A3 Class 3A3±± | | | 4.04 | | | | 7-25-2034 | | | | 28,117 | | | | 25,259 | |
JPMorgan Mortgage Trust Series2005-A3 Class 11A2±± | | | 4.14 | | | | 6-25-2035 | | | | 93,554 | | | | 88,919 | |
MASTR Adjustable Rate Mortgage Trust Series2003-6 Class 3A1±± | | | 3.80 | | | | 12-25-2033 | | | | 146,021 | | | | 144,151 | |
MASTR Adjustable Rate Mortgage Trust Series2003-6 Class 4A2±± | | | 3.93 | | | | 1-25-2034 | | | | 5,748 | | | | 5,650 | |
MASTR Adjustable Rate Mortgage Trust Series2004-13 Class 3A7±± | | | 4.68 | | | | 11-21-2034 | | | | 7,231 | | | | 6,990 | |
MASTR Alternative Loans Trust Series2005-1 Class 5A1 | | | 5.50 | | | | 3-25-2036 | | | | 466 | | | | 467 | |
Mid-State Trust Series 11 Class A1 | | | 4.86 | | | | 7-15-2038 | | | | 151,532 | | | | 153,724 | |
MLCC Mortgage Investors Incorporated Series2003-G Class A2 (6 Month LIBOR +0.68%)± | | | 2.57 | | | | 1-25-2029 | | | | 44,070 | | | | 41,995 | |
Montana Higher Education Student Assistance Corporation Series2012-1 Class A2 (1 Month LIBOR +1.00%)± | | | 1.72 | | | | 5-20-2030 | | | | 310,593 | | | | 307,068 | |
Morgan Stanley Bank of America Merrill Lynch Trust Series2012-C5 Class XA 144A±±(c) | | | 1.58 | | | | 8-15-2045 | | | | 3,776,444 | | | | 91,624 | |
Morgan Stanley Bank of America Merrill Lynch Trust Series2013-C10 Class D 144A±± | | | 4.22 | | | | 7-15-2046 | | | | 1,000,000 | | | | 459,195 | |
The accompanying notes are an integral part of these financial statements.
24 | Wells Fargo Multi-Sector Income Fund
Portfolio of investments—April 30, 2020 (unaudited)
| | | | | | | | | | | | | | | | |
| | | Interest rate | | | Maturity
date | | | Principal | | | Value | |
|
| Non-Agency Mortgage-Backed Securities (continued) | |
Morgan Stanley Bank of America Merrill Lynch Trust Series2013-C11 Class A4±± | | | 4.30 | % | | | 8-15-2046 | | | $ | 569,000 | | | $ | 605,613 | |
Morgan Stanley Bank of America Merrill Lynch Trust Series2013-C7 Class D 144A±± | | | 4.38 | | | | 2-15-2046 | | | | 692,000 | | | | 479,214 | |
Morgan Stanley Capital I Trust Series2012-C4 Class C 144A±± | | | 5.60 | | | | 3-15-2045 | | | | 900,000 | | | | 827,349 | |
Morgan Stanley Mortgage Loan Trust Series2004-4 Class 2A±± | | | 6.38 | | | | 9-25-2034 | | | | 25,682 | | | | 27,466 | |
New Century Home Equity Loan Trust Series2004-3 Class M1 (1 Month LIBOR +0.93%)± | | | 1.88 | | | | 11-25-2034 | | | | 1,006,232 | | | | 911,920 | |
Palmer Square Loan Funding Limited Series2019-2A Class A1 (3 Month LIBOR +0.97%) 144A± | | | 2.11 | | | | 4-20-2027 | | | | 312,623 | | | | 305,838 | |
Provident Funding Mortgage Loan Series2005-1 Class 2A1±± | | | 3.95 | | | | 5-25-2035 | | | | 1,013 | | | | 1,010 | |
Sequoia Mortgage Trust Series2003-1 Class 1A (1 Month LIBOR +0.76%) ± | | | 1.48 | | | | 4-20-2033 | | | | 7,224 | | | | 6,715 | |
SFAVE Commercial Mortgage Securities Trust Series 2015-5AVE Class D 144A±± | | | 4.53 | | | | 1-5-2043 | | | | 1,000,000 | | | | 708,871 | |
Structured Adjustable Rate Mortgage Loan Trust Series2004-2 Class 2A ±± | | | 3.85 | | | | 3-25-2034 | | | | 31,886 | | | | 28,125 | |
Terwin Mortgage Trust Series2003-6HE Class A3 (1 Month LIBOR +1.14%) ± | | | 2.09 | | | | 11-25-2033 | | | | 154,468 | | | | 140,790 | |
Vendee Mortgage Trust Series2003-2 Class IO±±(c) | | | 0.66 | | | | 5-15-2033 | | | | 2,491,823 | | | | 50,018 | |
Washington Mutual Mortgage Trust Series2004-RA4 Class 3A | | | 7.50 | | | | 7-25-2034 | | | | 69,880 | | | | 73,406 | |
Wind River CLO Limited Series2013-2A Class BR (3 Month LIBOR +1.60%) 144A± | | | 2.74 | | | | 10-18-2030 | | | | 500,000 | | | | 453,742 | |
| |
TotalNon-Agency Mortgage-Backed Securities (Cost $21,283,681) | | | | 17,567,632 | |
| | | | | |
| | | | |
| | | | | | | | | | | | | | | | |
| | | Dividend yield | | | | | | Shares | | | | |
| Preferred Stocks: 0.88% | |
|
Energy: 0.88% | |
|
| Energy Equipment & Services: 0.88% | |
Bristow Group Incorporated (PIK at 10.00%) 144A(a)†¥ | | | 10.00 | | | | | | | | 12,322 | | | | 492,239 | |
Bristow Group Incorporated (PIK at 10.00%) (a)†¥ | | | 10.00 | | | | | | | | 61,352 | | | | 2,450,888 | |
| |
Total Preferred Stocks (Cost $2,231,350) | | | | 2,943,127 | |
| | | | | |
| | | | |
| | | | | | | | | | | | | | | | |
| | | | | | Expiration
date | | | | | | | |
|
Rights: 0.10% | |
|
| Utilities: 0.10% | |
|
| Independent Power & Renewable Electricity Producers: 0.10% | |
Vistra Energy Corporation † | | | | | | | 12-31-2046 | | | | 327,375 | | | | 327,375 | |
| | | | | | | | | | | | | | | | |
| |
Total Rights (Cost $339,487) | | | | 327,375 | |
| | | | | |
| | | | |
| | | | | | | | | | | | | | | | |
| | | Interest rate | | | Maturity
date | | | Principal | | | | |
| Yankee Corporate Bonds and Notes: 8.46% | |
|
Communication Services: 0.53% | |
|
| Diversified Telecommunication Services: 0.14% | |
Intelsat Connect Finance Company 144A† | | | 9.50 | | | | 2-15-2023 | | | $ | 400,000 | | | | 76,000 | |
Intelsat Luxembourg SA † | | | 8.13 | | | | 6-1-2023 | | | | 1,050,000 | | | | 84,000 | |
Telesat Canada Incorporated 144A | | | 6.50 | | | | 10-15-2027 | | | | 325,000 | | | | 306,313 | |
| | | | |
| | | | | | | | | | | | | | | 466,313 | |
| | | | | | | | | | | | | | | | |
The accompanying notes are an integral part of these financial statements.
Wells Fargo Multi-Sector Income Fund | 25
Portfolio of investments—April 30, 2020 (unaudited)
| | | | | | | | | | | | | | | | |
| | | Interest
rate | | | Maturity
date | | | Principal | | | Value | |
| Media: 0.39% | |
Nielsen Holding and Finance BV 144A | | | 5.00 | % | | | 2-1-2025 | | | $ | 875,000 | | | $ | 844,375 | |
Nielsen Holding and Finance BV 144A | | | 5.50 | | | | 10-1-2021 | | | | 465,000 | | | | 459,769 | |
| | | | |
| | | | | | | | | | | | | | | 1,304,144 | |
| | | | | | | | | | | | | | | | |
|
| Consumer Staples: 0.24% | |
|
| Beverages: 0.24% | |
Pernod Ricard SA 144A | | | 4.45 | | | | 1-15-2022 | | | | 760,000 | | | | 796,534 | |
| | | | | | | | | | | | | | | | |
|
| Energy: 0.69% | |
|
| Energy Equipment & Services: 0.05% | |
Valaris plc | | | 5.75 | | | | 10-1-2044 | | | | 2,320,000 | | | | 185,600 | |
| | | | | | | | | | | | | | | | |
|
| Oil, Gas & Consumable Fuels: 0.64% | |
Baytex Energy Corporation 144A | | | 5.63 | | | | 6-1-2024 | | | | 1,575,000 | | | | 582,750 | |
Baytex Energy Corporation 144A | | | 8.75 | | | | 4-1-2027 | | | | 2,500,000 | | | | 950,000 | |
Griffin Coal Mining Company Limited 144A†(a) | | | 9.50 | | | | 12-1-2016 | | | | 1,110,230 | | | | 0 | |
Griffin Coal Mining Company Limited †(a) | | | 9.50 | | | | 12-1-2016 | | | | 90,767 | | | | 0 | |
Husky Energy Incorporated | | | 4.40 | | | | 4-15-2029 | | | | 750,000 | | | | 607,572 | |
| | | | |
| | | | | | | | | | | | | | | 2,140,322 | |
| | | | | | | | | | | | | | | | |
|
Financials: 3.09% | |
|
| Banks: 0.98% | |
ABN AMRO Bank NV 144A | | | 4.80 | | | | 4-18-2026 | | | | 750,000 | | | | 811,082 | |
Banco del Estado de Chile 144A | | | 3.88 | | | | 2-8-2022 | | | | 650,000 | | | | 662,977 | |
Corporación Andina de Fomento | | | 4.38 | | | | 6-15-2022 | | | | 958,000 | | | | 1,005,910 | |
Perrigo Finance Unlimited Company | | | 4.38 | | | | 3-15-2026 | | | | 750,000 | | | | 800,923 | |
| | | | |
| | | | | | | | | | | | | | | 3,280,892 | |
| | | | | | | | | | | | | | | | |
|
| Diversified Financial Services: 1.52% | |
Intelsat Jackson Holdings SA † | | | 5.50 | | | | 8-1-2023 | | | | 4,725,000 | | | | 2,566,266 | |
Intelsat Jackson Holdings SA 144A† | | | 8.50 | | | | 10-15-2024 | | | | 1,700,000 | | | | 986,000 | |
Sensata Technologies UK Financing Company plc 144A | | | 6.25 | | | | 2-15-2026 | | | | 800,000 | | | | 826,000 | |
Trivium Packaging Finance BV 144A | | | 5.50 | | | | 8-15-2026 | | | | 300,000 | | | | 307,500 | |
Trivium Packaging Finance BV 144A | | | 8.50 | | | | 8-15-2027 | | | | 150,000 | | | | 156,750 | |
Tyco Electronics Group SA | | | 3.50 | | | | 2-3-2022 | | | | 225,000 | | | | 233,538 | |
| | | | |
| | | | | | | | | | | | | | | 5,076,054 | |
| | | | | | | | | | | | | | | | |
|
| Insurance: 0.59% | |
Allied World Assurance Company Holdings Limited | | | 4.35 | | | | 10-29-2025 | | | | 385,000 | | | | 402,136 | |
Fairfax Financials Holdings Limited | | | 4.85 | | | | 4-17-2028 | | | | 750,000 | | | | 757,608 | |
Sompo International Holdings Limited | | | 7.00 | | | | 7-15-2034 | | | | 575,000 | | | | 815,994 | |
| | | | |
| | | | | | | | | | | | | | | 1,975,738 | |
| | | | | | | | | | | | | | | | |
|
Health Care: 1.94% | |
|
| Pharmaceuticals: 1.94% | |
Bausch Health Companies Incorporated 144A | | | 5.00 | | | | 1-30-2028 | | | | 250,000 | | | | 239,325 | |
Bausch Health Companies Incorporated 144A | | | 5.50 | | | | 3-1-2023 | | | | 683,000 | | | | 676,170 | |
Bausch Health Companies Incorporated 144A | | | 5.50 | | | | 11-1-2025 | | | | 375,000 | | | | 389,813 | |
Bausch Health Companies Incorporated 144A | | | 5.88 | | | | 5-15-2023 | | | | 103,000 | | | | 102,228 | |
Bausch Health Companies Incorporated 144A | | | 6.13 | | | | 4-15-2025 | | | | 1,940,000 | | | | 1,960,613 | |
Bausch Health Companies Incorporated 144A | | | 7.00 | | | | 3-15-2024 | | | | 575,000 | | | | 596,672 | |
Bausch Health Companies Incorporated 144A | | | 7.00 | | | | 1-15-2028 | | | | 100,000 | | | | 103,750 | |
Bausch Health Companies Incorporated 144A | | | 7.25 | | | | 5-30-2029 | | | | 50,000 | | | | 53,359 | |
The accompanying notes are an integral part of these financial statements.
26 | Wells Fargo Multi-Sector Income Fund
Portfolio of investments—April 30, 2020 (unaudited)
| | | | | | | | | | | | | | | | |
| | | Interest
rate | | | Maturity
date | | | Principal | | | Value | |
|
| Pharmaceuticals (continued) | |
Teva Pharmaceutical Finance Netherlands III BV | | | 4.10 | % | | | 10-1-2046 | | | $ | 750,000 | | | $ | 585,000 | |
Teva Pharmaceutical Finance Netherlands III BV | | | 6.75 | | | | 3-1-2028 | | | | 1,750,000 | | | | 1,799,875 | |
| | | | |
| | | | | | | | | | | | | | | 6,506,805 | |
| | | | | | | | | | | | | | | | |
|
Industrials: 1.02% | |
|
| Commercial Services & Supplies: 0.71% | |
Ritchie Brothers Auctioneers Incorporated 144A | | | 5.38 | | | | 1-15-2025 | | | | 2,350,000 | | | | 2,373,468 | |
| | | | | | | | | | | | | | | | |
|
| Electrical Equipment: 0.08% | |
Sensata Technologies BV 144A | | | 5.00 | | | | 10-1-2025 | | | | 260,000 | | | | 258,596 | |
| | | | | | | | | | | | | | | | |
|
| Road & Rail: 0.23% | |
Canadian Pacific Railway Company | | | 4.50 | | | | 1-15-2022 | | | | 750,000 | | | | 781,594 | |
| | | | | | | | | | | | | | | | |
|
Materials: 0.61% | |
|
| Containers & Packaging: 0.38% | |
Ardagh Packaging Finance plc 144A | | | 4.13 | | | | 8-15-2026 | | | | 75,000 | | | | 73,313 | |
Ardagh Packaging Finance plc 144A | | | 5.25 | | | | 4-30-2025 | | | | 125,000 | | | | 128,435 | |
OI European Group BV 144A | | | 4.00 | | | | 3-15-2023 | | | | 1,100,000 | | | | 1,061,500 | |
| | | | |
| | | | | | | | | | | | | | | 1,263,248 | |
| | | | | | | | | | | | | | | | |
|
| Metals & Mining: 0.23% | |
Glencore Finance Canada Limited 144A | | | 4.25 | | | | 10-25-2022 | | | | 750,000 | | | | 768,675 | |
| | | | | | | | | | | | | | | | |
|
| Utilities: 0.34% | |
|
| Electric Utilities: 0.19% | |
Comision Federal de Electricidad 144A | | | 4.88 | | | | 5-26-2021 | | | | 650,000 | | | | 653,250 | |
| | | | | | | | | | | | | | | | |
|
| Multi-Utilities: 0.15% | |
Veolia Environnement SA | | | 6.75 | | | | 6-1-2038 | | | | 350,000 | | | | 490,221 | |
| | | | | | | | | | | | | | | | |
| |
Total Yankee Corporate Bonds and Notes (Cost $36,017,333) | | | | 28,321,454 | |
| | | | | |
| | | | |
| | | | | | | | | | | | | | | | |
| | | Yield | | | | | | Shares | | | | |
| Short-Term Investments: 2.31% | | | | | | | | | | | | |
| | | | |
| Investment Companies: 2.31% | | | | | | | | | | | | |
Wells Fargo Government Money Market Fund Select Class (l)(u)## | | | 0.19 | | | | | | | | 7,738,551 | | | | 7,738,551 | |
| | | | | | | | | | | | | | | | |
| | | | |
Total Short-Term Investments (Cost $7,738,551) | | | | | | | | | | | | | | | 7,738,551 | |
| | | | | |
| | | | | | | | |
| Total investments in securities (Cost $512,169,704) | | | 136.48 | % | | | 456,991,726 | |
| | |
Other assets and liabilities, net | | | (36.48 | ) | | | (122,130,980 | ) |
| | | | | | | | |
| Total net assets | | | 100.00 | % | | $ | 334,860,746 | |
| | | | | | | | |
| ± | Variable rate investment. The rate shown is the rate in effect at period end. |
| 144A | The security may be resold in transactions exempt from registration, normally to qualified institutional buyers, pursuant to Rule 144A under the Securities Act of 1933. |
| ±± | The coupon of the security is adjusted based on the principal and interest payments received from the underlying pool of mortgages as well as the credit quality and the actual prepayment speed of the underlying mortgages. |
| (c) | Investment in an interest-only security entitles holders to receive only the interest payments on the underlying mortgages. The principal amount shown is the notional amount of the underlying mortgages. The rate represents the coupon rate. |
| (a) | The security is fair valued in accordance with procedures approved by the Board of Trustees. |
| † | Non-income-earning security |
| (s) | Security is perpetual in nature and has no stated maturity date. The date shown reflects the next call date. |
The accompanying notes are an integral part of these financial statements.
Wells Fargo Multi-Sector Income Fund | 27
Portfolio of investments—April 30, 2020 (unaudited)
| %% | The security is purchased on a when-issued basis. |
| ‡ | Security is valued using significant unobservable inputs. |
| ¥ | Apayment-in-kind (PIK) security is a security in which the issuer may make interest or dividend payments in cash or additional securities or a combination of both. The rate shown is the rate in effect at period end. |
| (l) | The issuer of the security is an affiliated person of the Fund as defined in the Investment Company Act of 1940. |
| (u) | The rate represents the7-day annualized yield at period end. |
| ## | All or a portion of this security is segregated for when-issued securities. |
Abbreviations:
| AGM | Assured Guaranty Municipal |
| FHLMC | Federal Home Loan Mortgage Corporation |
| FNMA | Federal National Mortgage Association |
| GNMA | Government National Mortgage Association |
| LIBOR | London Interbank Offered Rate |
| REIT | Real estate investment trust |
| SOFR | Secured Overnight Financing Rate |
| TTD | Trinidad and Tobago dollar |
Investments in Affiliates
An affiliated investment is an investment in which the Fund owns at least 5% of the outstanding voting shares of the issuer or as a result of other relationships, such as the Fund and the issuer having the same investment manager. Transactions with issuers that were either affiliated persons of the Fund at the beginning of the period or the end of the period were as follows:
| | | | | | | | | | | | | | | | | | | | | | | | | | | | | | | | | | | | |
| | | Shares, beginning of period | | | Shares purchased | | | Shares sold | | | Shares, end of period | | | Net realized gains (losses) | | | Net change in unrealized gains (losses) | | | Income from affiliated securities | | | Value, end of
period | | | % of net assets | |
| | | | | | | | | |
| Short-Term Investments | | | | | | | | | | | | | | | | | | | | | | | | | | | |
Investment Companies | | | | | | | | | | | | | | | | | | | | | | | | | | | | | | | | | | | | |
Wells Fargo Government Money Market Fund Select Class | | | 25,641,491 | | | | 68,202,540 | | | | (86,105,480 | ) | | | 7,738,551 | | | $ | 0 | | | $ | 0 | | | $ | 113,733 | | | $ | 7,738,551 | | | | 2.31 | % |
The accompanying notes are an integral part of these financial statements.
28 | Wells Fargo Multi-Sector Income Fund
Statement of assets and liabilities—April 30, 2020 (unaudited)
| | | | |
| | | | |
| |
Assets | | | | |
Investments in unaffiliated securities, at value (cost $504,431,153) | | $ | 449,253,175 | |
Investments in affiliated securities, at value (cost $7,738,551) | | | 7,738,551 | |
Foreign currency, at value (cost $334,382) | | | 338,587 | |
Receivable for investments sold | | | 4,342,358 | |
Principal paydown receivable | | | 6,928 | |
Receivable for interest and dividends | | | 6,648,063 | |
Prepaid expenses and other assets | | | 586 | |
| | | | |
Total assets | | | 468,328,248 | |
| | | | |
| |
Liabilities | | | | |
Secured borrowing payable | | | 125,500,000 | |
Payable for investments purchased | | | 2,544,644 | |
Payable for Fund shares repurchased | | | 320,316 | |
Advisory fee payable | | | 225,998 | |
Dividends payable | | | 3,021,301 | |
Administration fee payable | | | 20,545 | |
Trustees’ fees and expenses payable | | | 8,525 | |
Accrued expenses and other liabilities | | | 1,826,173 | |
| | | | |
Total liabilities | | | 133,467,502 | |
| | | | |
Total net assets | | $ | 334,860,746 | |
| | | | |
| |
Net assets consist of | | | | |
Paid-in capital | | $ | 432,400,192 | |
Total distributable loss | | | (97,539,446 | ) |
| | | | |
Total net assets | | $ | 334,860,746 | |
| | | | |
| |
Net asset value per share | | | | |
Based on $334,860,746 divided by 30,080,436 shares issued and outstanding (100,000,000 shares authorized) | | | $11.13 | |
| | | | |
The accompanying notes are an integral part of these financial statements.
Wells Fargo Multi-Sector Income Fund | 29
Statement of operations—six months ended April 30, 2020 (unaudited)
| | | | |
| | | | |
| |
Investment income | | | | |
Interest (net of foreign withholding taxes of $153,274) | | $ | 15,352,656 | |
Income from affiliated securities | | | 113,733 | |
Dividends | | | 28,982 | |
| | | | |
Total investment income | | | 15,495,371 | |
| | | | |
| |
Expenses | | | | |
Advisory fee | | | 1,518,951 | |
Administration fee | | | 138,086 | |
Custody and accounting fees | | | 136,376 | |
Professional fees | | | 30,920 | |
Shareholder report expenses | | | 20,080 | |
Trustees’ fees and expenses | | | 10,969 | |
Transfer agent fees | | | 17,598 | |
Interest expense | | | 2,216,133 | |
Other fees and expenses | | | 16,695 | |
| | | | |
Total expenses | | | 4,105,808 | |
| | | | |
Net investment income | | | 11,389,563 | |
| | | | |
| |
Realized and unrealized gains (losses) on investments | | | | |
Net realized losses on | | | | |
Unaffiliated securities | | | (4,200,534 | ) |
Foreign currency transactions | | | (429,746 | ) |
| | | | |
Net realized losses on investments | | | (4,630,280 | ) |
| | | | |
| |
Net change in unrealized gains (losses) on investments | | | | |
Unaffiliated securities | | | (52,726,900 | ) |
Foreign currency transactions | | | 4,208 | |
| | | | |
Net change in unrealized gains (losses) on investments | | | (52,722,692 | ) |
| | | | |
Net realized and unrealized gains (losses) on investments | | | (57,352,972 | ) |
| | | | |
Net decrease in net assets resulting from operations | | $ | (45,963,409 | ) |
| | | | |
The accompanying notes are an integral part of these financial statements.
30 | Wells Fargo Multi-Sector Income Fund
Statement of changes in net assets
| | | | | | | | |
| | | Six months ended
April 30, 2020
(unaudited) | | | Year ended
October 31, 2019 | |
| | |
Operations | | | | | | | | |
Net investment income | | $ | 11,389,563 | | | $ | 25,190,415 | |
Net realized losses on investments | | | (4,630,280 | ) | | | (4,494,937 | ) |
Net change in unrealized gains (losses) on investments | | | (52,722,692 | ) | | | 19,217,800 | |
| | | | |
Net increase (decrease) in net assets resulting from operations | | | (45,963,409 | ) | | | 39,913,278 | |
| | | | |
| | |
Distributions to shareholders from | | | | | | | | |
Net investment income and net realized gains | | | (18,146,849 | ) | | | (21,507,276 | ) |
Tax basis return of capital | | | 0 | | | | (16,147,325 | ) |
| | | | |
Total distributions to shareholders | | | (18,146,849 | ) | | | (37,654,601 | ) |
| | | | |
| |
Capital share transactions | | | | |
Cost of shares repurchased | | | (4,935,965 | ) | | | (11,668,690 | ) |
| | | | |
Total decrease in net assets | | | (69,046,223 | ) | | | (9,410,013 | ) |
| | | | |
| |
Net assets | | | | |
Beginning of period | | | 403,906,969 | | | | 413,316,982 | |
| | | | |
End of period | | $ | 334,860,746 | | | $ | 403,906,969 | |
| | | | |
The accompanying notes are an integral part of these financial statements.
Wells Fargo Multi-Sector Income Fund | 31
Statement of cash flows—six months ended April 30, 2020 (unaudited)
| | | | |
| | | | |
|
Cash flows from operating activities: | |
Net decrease in net assets resulting from operations | | $ | (45,963,409 | ) |
| |
Adjustments to reconcile net decrease in net assets from operations to net cash provided by operating activities: | | | | |
Purchase of long-term securities | | | (98,977,290 | ) |
Proceeds from the sales of long-term securities | | | 146,080,463 | |
Paydowns | | | 1,044,377 | |
Amortization | | | (136,797 | ) |
Purchases and sales of short-term securities, net | | | 17,902,940 | |
Increase in receivable for investments sold | | | (3,967,851 | ) |
Increase in principal paydown receivable | | | (438 | ) |
Decrease in receivable for interest and dividends | | | 603,938 | |
Decrease in prepaid expenses and other assets | | | 11,167 | |
Decrease in payable for investments purchased | | | (2,816,966 | ) |
Decrease in advisory fee payable | | | (43,425 | ) |
Decrease in administration fee payable | | | (3,948 | ) |
Increase in trustees’ fees and expenses payable | | | 4,881 | |
Decrease in accrued expenses and other liabilities | | | (43,285 | ) |
Litigation payments received | | | 114 | |
Net realized losses on investments | | | 4,200,534 | |
Net change in unrealized gains (losses) on investments | | | 52,722,692 | |
| | | | |
Net cash provided by operating activities | | | 70,617,697 | |
| | | | |
| |
Cash flows from financing activities: | | | | |
Decrease in secured borrowing payable | | | (47,500,000 | ) |
Cost of shares repurchased | | | (4,615,649 | ) |
Cash distributions paid | | | (18,163,535 | ) |
| | | | |
Net cash used in financing activities | | | (70,279,184 | ) |
| | | | |
Net increase in cash | | | 338,513 | |
| | | | |
| |
Cash (including foreign currency): | | | | |
Beginning of period | | $ | 74 | |
| | | | |
End of period | | $ | 338,587 | |
| | | | |
| |
Supplemental cash disclosure | | | | |
Cash paid for interest | | $ | 2,409,894 | |
| | | | |
The accompanying notes are an integral part of these financial statements.
32 | Wells Fargo Multi-Sector Income Fund
Financial highlights
(For a share outstanding throughout each period)
| | | | | | | | | | | | | | | | | | | | | | | | |
| | | Six months ended
April 30, 2020
(unaudited) | | | Year ended October 31 | |
| | | 2019 | | | 2018 | | | 2017 | | | 2016 | | | 2015 | |
Net asset value, beginning of period | | | $13.21 | | | | $13.10 | | | | $14.31 | | | | $14.35 | | | | $14.06 | | | | $16.10 | |
Net investment income | | | 0.37 | 1 | | | 0.81 | 1 | | | 0.85 | 1 | | | 0.97 | 1 | | | 1.08 | | | | 1.10 | 1 |
Net realized and unrealized gains (losses) on investments | | | (1.91 | ) | | | 0.48 | | | | (0.92 | ) | | | 0.18 | | | | 0.33 | | | | (1.98 | ) |
| | | | | | | | | | | | | | | | | | | | | | | | |
Total from investment operations | | | (1.54 | ) | | | 1.29 | | | | (0.07 | ) | | | 1.15 | | | | 1.41 | | | | (0.88 | ) |
Distributions to shareholders from | | | | | | | | | | | | | | | | | | | | | | | | |
Net investment income | | | (0.59 | ) | | | (0.70 | ) | | | (0.46 | ) | | | (0.70 | ) | | | (0.97 | ) | | | (0.87 | ) |
Tax basis return of capital | | | 0.00 | | | | (0.52 | ) | | | (0.83 | ) | | | (0.53 | ) | | | (0.17 | ) | | | (0.29 | ) |
| | | | | | | | | | | | | | | | | | | | | | | | |
Total distributions to shareholders | | | (0.59 | ) | | | (1.22 | ) | | | (1.29 | ) | | | (1.23 | ) | | | (1.14 | ) | | | (1.16 | ) |
Anti-dilutive effect of shares repurchased | | | 0.05 | | | | 0.04 | | | | 0.15 | | | | 0.04 | | | | 0.02 | | | | 0.00 | |
Net asset value, end of period | | | $11.13 | | | | $13.21 | | | | $13.10 | | | | $14.31 | | | | $14.35 | | | | $14.06 | |
Market value, end of period | | | $10.02 | | | | $12.67 | | | | $11.57 | | | | $13.05 | | | | $12.66 | | | | $12.02 | |
Total return based on market value2 | | | (16.73 | )% | | | 20.91 | % | | | (1.91 | )% | | | 13.07 | % | | | 15.66 | % | | | (7.34 | )% |
Ratios to average net assets (annualized) | | | | | | | | | | | | | | | | | | | | | | | | |
Expenses3 | | | 2.16 | % | | | 2.29 | % | | | 2.14 | % | | | 1.68 | % | | | 1.39 | % | | | 1.24 | % |
Net investment income3 | | | 5.99 | % | | | 6.17 | % | | | 6.12 | % | | | 6.73 | % | | | 7.94 | % | | | 7.33 | % |
Supplemental data | | | | | | | | | | | | | | | | | | | | | | | | |
Portfolio turnover rate | | | 15 | % | | | 26 | % | | | 25 | % | | | 38 | % | | | 29 | % | | | 31 | % |
Net assets, end of period (000s omitted) | | | $334,861 | | | | $403,907 | | | | $413,317 | | | | $499,824 | | | | $590,840 | | | | $591,226 | |
Borrowings outstanding, end of period (000s omitted) | | | $125,500 | | | | $173,000 | | | | $187,000 | | | | $187,000 | | | | $220,000 | | | | $230,000 | |
Asset coverage per $1,000 of borrowing, end of period | | | $3,668 | | | | $3,335 | | | | $3,210 | | | | $3,673 | | | | $3,686 | | | | $3,570 | |
| 1 | Calculated based upon average shares outstanding |
| 2 | Total return is calculated assuming a purchase of common stock on the first day and a sale on the last day of the period reported. Dividends and distributions, if any, are assumed for purposes of these calculations to be reinvested at prices obtained under the Fund’s Automatic Dividend Reinvestment Plan. Total return does not reflect brokerage commissions that a shareholder would pay on the purchase and sale of shares. Returns for periods of less than one year are not annualized. |
| 3 | Ratios include interest expense relating to interest associated with borrowings and/or leverage transactions as follows: |
| | | | |
Six months ended April 30, 2020 (unaudited) | | | 1.17 | % |
Year ended October 31, 2019 | | | 1.32 | % |
Year ended October 31, 2018 | | | 1.07 | % |
Year ended October 31, 2017 | | | 0.61 | % |
Year ended October 31, 2016 | | | 0.44 | % |
Year ended October 31, 2015 | | | 0.24 | % |
The accompanying notes are an integral part of these financial statements.
Wells Fargo Multi-Sector Income Fund | 33
Notes to financial statements (unaudited)
1. ORGANIZATION
Wells Fargo Multi-Sector Income Fund (the “Fund”) was organized as a statutory trust under the laws of the state of Delaware on April 10, 2003 and is registered as a diversifiedclosed-end management investment company under the Investment Company Act of 1940, as amended (the “1940 Act”). As an investment company, the Fund follows the accounting and reporting guidance in Financial Accounting Standards Board(“FASB”)Accounting Standards Codification Topic 946, Financial Services – Investment Companies.
2. SIGNIFICANT ACCOUNTING POLICIES
The following significant accounting policies, which are consistently followed in the preparation of the financial statements of the Fund, are in conformity with U.S. generally accepted accounting principles which require management to make estimates and assumptions that affect the reported amounts of assets and liabilities, disclosure of contingent assets and liabilities at the date of the financial statements, and the reported amounts of revenues and expenses during the reporting period. Actual results could differ from those estimates.
Securities valuation
All investments are valued each business day as of the close of regular trading on the New York Stock Exchange (generally 4 p.m. Eastern Time), although the Fund may deviate from this calculation time under unusual or unexpected circumstances.
Debt securities are valued at the evaluated bid price provided by an independent pricing service (e.g. taking into account various factors, including yields, maturities, or credit ratings) or, if a reliable price is not available, the quoted bid price from an independent broker-dealer.
Equity securities that are listed on a foreign or domestic exchange or market are valued at the official closing price or, if none, the last sales price. If no sale occurs on the principal exchange or market that day, a fair value price will be determined in accordance with the Fund’s Valuation Procedures.
The values of securities denominated in foreign currencies are translated into U.S. dollars at rates provided by an independent foreign currency pricing source at a time each business day specified by the Wells Fargo Asset Management Pricing Committee at Wells Fargo Funds Management, LLC (“Funds Management”).
Investments in registeredopen-end investment companies are valued at net asset value.
Investments which are not valued using any of the methods discussed above are valued at their fair value, as determined in good faith by the Board of Trustees of the Fund. The Board of Trustees has established a Valuation Committee comprised of the Trustees and has delegated to it the authority to take any actions regarding the valuation of portfolio securities that the Valuation Committee deems necessary or appropriate, including determining the fair value of portfolio securities, unless the determination has been delegated to the Wells Fargo Asset Management Pricing Committee. The Board of Trustees retains the authority to make or ratify any valuation decisions or approve any changes to the Valuation Procedures as it deems appropriate. On a quarterly basis, the Board of Trustees receives reports on any valuation actions taken by the Valuation Committee or the Wells Fargo Asset Management Pricing Committee which may include items for ratification.
Foreign currency translation
The accounting records of the Fund are maintained in U.S. dollars. The values of other assets and liabilities denominated in foreign currencies are translated into U.S. dollars at rates provided by an independent foreign currency pricing source at a time each business day specified by the Wells Fargo Asset Management Pricing Committee. Purchases and sales of securities, and income and expenses are converted at the rate of exchange on the respective dates of such transactions. Net realized foreign exchange gains or losses arise from sales of foreign currencies, currency gains or losses realized between the trade and settlement dates on securities transactions, and the difference between the amounts of dividends, interest and foreign withholding taxes recorded and the U.S. dollar equivalent of the amounts actually paid or received. Net unrealized foreign exchange gains and losses arise from changes in the fair value of assets and liabilities other than investments in securities resulting from changes in exchange rates. The changes in net assets arising from changes in exchange rates of securities and the changes in net assets resulting from changes in market prices of securities are not separately presented. Such changes are included in net realized and unrealized gains or losses from investments.
When-issued transactions
The Fund may purchase securities on a forward commitment or when-issued basis. The Fund records a when-issued transaction on the trade date and will segregate assets in an amount at least equal in value to the Fund’s commitment to purchase when-issued securities. Securities purchased on a when-issued basis aremarked-to-market daily and the Fund begins earning interest on the settlement date. Losses may arise due to changes in the market value of the underlying securities or if the counterparty does not perform under the contract.
34 | Wells Fargo Multi-Sector Income Fund
Notes to financial statements (unaudited)
Loans
The Fund may invest in direct debt instruments which are interests in amounts owed to lenders by corporate or other borrowers. The loans pay interest at rates which are periodically reset by reference to a base lending rate plus a spread. Investments in loans may be in the form of participations in loans or assignments of all or a portion of loans from third parties. When the Fund purchases participations, it generally has no rights to enforce compliance with the terms of the loan agreement with the borrower. As a result, the Fund assumes the credit risk of both the borrower and the lender that is selling the participation. When the Fund purchases assignments from lenders, it acquires direct rights against the borrower on the loan and may enforce compliance by the borrower with the terms of the loan agreement. Loans may include fully funded term loans or unfunded loan commitments, which are contractual obligations for future funding.
Security transactions and income recognition
Securities transactions are recorded on a trade date basis. Realized gains or losses are recorded on the basis of identified cost.
Interest income is accrued daily and bond discounts are accreted and premiums are amortized daily. To the extent debt obligations are placed onnon-accrual status, any related interest income may be reduced by writing off interest receivables when the collection of all or a portion of interest has been determined to be doubtful based on consistently applied procedures and the fair value has decreased. If the issuer subsequently resumes interest payments or when the collectability of interest is reasonably assured, the debt obligation is removed fromnon-accrual status. Paydown gains and losses are included in interest income.
Dividend income is recognized on theex-dividend date.
Income from foreign securities is recorded net of foreign taxes withheld where recovery of such taxes is not assured.
Distributions to shareholders
Under a managed distribution plan, the Fund pays distributions to shareholders at an annual minimum fixed rate of 9% based on the Fund’s average monthly net asset value per share over the prior 12 months. The monthly distributions may be sourced from income,paid-in capital, and/or capital gains, if any. To the extent that sufficient investment income is not available on a monthly basis, the Fund may distributepaid-in capital and/or capital gains, if any, in order to maintain its managed distribution level.
Distributions to shareholders from net investment income and any net realized gains are recorded on theex-dividend date. Such distributions are determined in accordance with income tax regulations and may differ from U.S. generally accepted accounting principles. Dividend sources are estimated at the time of declaration. The tax character of distributions is determined as of the Fund’s fiscal year end. Therefore, a portion of the Fund’s distributions made prior to the Fund’s fiscal year end may be categorized as a tax return of capital at year end.
Federal and other taxes
The Fund intends to continue to qualify as a regulated investment company by distributing substantially all of its investment company taxable income and any net realized capital gains (after reduction for capital loss carryforwards) sufficient to relieve it from all, or substantially all, federal income taxes. Accordingly, no provision for federal income taxes was required.
The Fund’s income and federal excise tax returns and all financial records supporting those returns for the prior three fiscal years are subject to examination by the federal and Delaware revenue authorities. Management has analyzed the Fund’s tax positions taken on federal, state, and foreign tax returns for all open tax years and does not believe that there are any uncertain tax positions that require recognition of a tax liability.
As of April 30, 2020, the aggregate cost of all investments for federal income tax purposes was $517,940,796 and the unrealized gains (losses) consisted of:
| | | | |
| |
Gross unrealized gains | | $ | 10,940,011 | |
| |
Gross unrealized losses | | | (71,889,081 | ) |
| |
Net unrealized losses | | $ | (60,949,070 | ) |
As of October 31, 2019, the Fund had capital loss carryforwards which consist of $11,587,736 in short-term capital losses and $13,265,614 in long-term capital losses.
3. FAIR VALUATION MEASUREMENTS
Fair value measurements of investments are determined within a framework that has established a fair value hierarchy based upon the various data inputs utilized in determining the value of the Fund’s investments. The three-level hierarchy gives the highest priority to unadjusted quoted prices in active markets for identical assets or liabilities (Level 1) and the lowest priority to
Wells Fargo Multi-Sector Income Fund | 35
Notes to financial statements (unaudited)
unobservable inputs (Level 3). The Fund’s investments are classified within the fair value hierarchy based on the lowest level of input that is significant to the fair value measurement. The inputs are summarized into three broad levels as follows:
| ∎ | | Level 1 – quoted prices in active markets for identical securities |
| ∎ | | Level 2 – other significant observable inputs (including quoted prices for similar securities, interest rates, prepayment speeds, credit risk, etc.) |
| ∎ | | Level 3 – significant unobservable inputs (including the Fund’s own assumptions in determining the fair value of investments) |
The inputs or methodologies used for valuing investments in securities are not necessarily an indication of the risk associated with investing in those securities.
The following is a summary of the inputs used in valuing the Fund’s assets and liabilities as of April 30, 2020:
| | | | | | | | | | | | | | | | |
| | | | |
| | | Quoted prices
(Level 1) | | | Other significant
observable inputs
(Level 2) | | | Significant
unobservable inputs
(Level 3) | | | Total | |
| | | | |
Assets | | | | | | | | | | | | | | | | |
Investments in: | | | | | | | | | | | | | | | | |
| | | | |
Agency securities | | $ | 0 | | | $ | 3,940,158 | | | $ | 0 | | | $ | 3,940,158 | |
| | | | |
Asset-backed securities | | | 0 | | | | 2,582,745 | | | | 0 | | | | 2,582,745 | |
| | | | |
Common stocks | | | | | | | | | | | | | | | | |
| | | | |
Energy | | | 0 | | | | 558,560 | | | | 0 | | | | 558,560 | |
| | | | |
Materials | | | 522 | | | | 0 | | | | 0 | | | | 522 | |
| | | | |
Corporate bonds and notes | | | 0 | | | | 230,530,551 | | | | 0 | | | | 230,530,551 | |
| | | | |
Foreign corporate bonds and notes | | | 0 | | | | 14,261,492 | | | | 0 | | | | 14,261,492 | |
| | | | |
Foreign government bonds | | | 0 | | | | 86,590,185 | | | | 0 | | | | 86,590,185 | |
| | | | |
Loans | | | 0 | | | | 52,885,838 | | | | 8,743,536 | | | | 61,629,374 | |
| | | | |
Non-agency mortgage-backed securities | | | 0 | | | | 17,567,632 | | | | 0 | | | | 17,567,632 | |
| | | | |
Preferred stocks | | | | | | | | | | | | | | | | |
| | | | |
Energy | | | 0 | | | | 2,943,127 | | | | 0 | | |
| 2,943,127
|
|
| | | | |
Rights | | | | | | | | | | | | | | | | |
| | | | |
Utilities | | | 0 | | | | 327,375 | | | | 0 | | | | 327,375 | |
| | | | |
Yankee corporate bonds and notes | | | 0 | | | | 28,321,454 | | | | 0 | | | | 28,321,454 | |
| | | | |
Short-term investments | | | | | | | | | | | | | | | | |
| | | | |
Investment companies | | | 7,738,551 | | | | 0 | | | | 0 | | | | 7,738,551 | |
| | | | |
Total assets | | $ | 7,739,073 | | | $ | 440,509,117 | | | $ | 8,743,536 | | | $ | 456,991,726 | |
Additional sector, industry or geographic detail is included in the Portfolio of Investments.
The following is a reconciliation of assets in which significant unobservable inputs (Level 3) were used in determining fair value:
| | | | | | | | | | | | | | | | |
| | | | |
| | | Loans | | | Common stocks | | | Preferred stocks | | | Total | |
Balance as of October 31, 2019 | | $ | 10,841,245 | | | $ | 1,389,651 | | | $ | 2,858,404 | | | $ | 15,089,300 | |
| | | | |
Accrued discounts (premiums) | | | 5,544 | | | | 0 | | | | 0 | | | | 5,544 | |
| | | | |
Realized gains (losses) | | | (396,531 | ) | | | 0 | | | | 0 | | | | (396,531 | ) |
| | | | |
Change in unrealized gains (losses) | | | (523,215 | ) | | | (830,995 | ) | | | 84,562 | | | | (1,269,648 | ) |
| | | | |
Purchases | | | 2,687,098 | | | | 0 | | | | 0 | | | | 2,687,098 | |
| | | | |
Sales | | | (2,197,124 | ) | | | 0 | | | | 0 | | | | (2,197,124 | ) |
| | | | |
Transfers into Level 3 | | | 2,899,784 | | | | 0 | | | | 0 | | | | 2,899,784 | |
| | | | |
Transfers out of Level 3 | | | (4,573,265 | ) | | | (558,656 | ) | | | (2,942,966 | ) | | | (8,074,887 | ) |
| | | | |
Balance as of April 30, 2020 | | $ | 8,743,536 | | | $ | 0 | | | $ | 0 | | | $ | 8,743,536 | |
| | | | |
Change in unrealized gains (losses) relating to securities still held at April 30, 2020 | | $ | (590,030 | ) | | $ | 0 | | | $ | 0 | | | $ | (590,030 | ) |
36 | Wells Fargo Multi-Sector Income Fund
Notes to financial statements (unaudited)
The loan obligations in the Level 3 table were valued using indicative broker quotes. These indicative broker quotes are considered Level 3 inputs. Quantitative unobservable inputs used by the brokers are often proprietary and not provided to the Fund and therefore the disclosure that would address these inputs is not included above.
4. TRANSACTIONS WITH AFFILIATES
Advisory fee
Funds Management, an indirect wholly owned subsidiary of Wells Fargo & Company (“Wells Fargo”) is the adviser to the Fund and is entitled to receive a fee at an annual rate of 0.55% of the Fund’s average daily total assets. Total assets consist of net assets of the Fund plus borrowings or other leverage for investment purposes to the extent excluded in calculating net assets.
Funds Management has retained the services of subadvisers to provide daily portfolio management to the Fund. The fees for subadvisory services are borne by Funds Management. Wells Capital Management Incorporated, an affiliate of Funds Management and an indirect, wholly owned subsidiary of Wells Fargo, is a subadviser to the Fund and is entitled to receive a fee from Funds Management at an annual rate of 0.30% of the Fund’s average daily total assets. Wells Fargo Asset Management (International) Limited, an affiliate of Funds Management and an indirect, wholly owned subsidiary of Wells Fargo, is also a subadviser to the Fund and is entitled to receive a fee from Funds Management at an annual rate of 0.10% of the Fund’s average daily total assets.
Administration fee
Funds Management also serves as the administrator to the Fund, providing the Fund with a wide range of administrative services necessary to the operation of the Fund. Funds Management is entitled to receive an annual administration fee from the Fund equal to 0.05% of the Fund’s average daily total assets.
Interfund transactions
The Fund may purchase or sell portfolio investment securities to certain other Wells Fargo affiliates pursuant to Rule17a-7 under the 1940 Act and under procedures adopted by the Board of Trustees. The procedures have been designed to ensure that these interfund transactions, which do not incur broker commissions, are effected at current market prices.
5. CAPITAL SHARE TRANSACTIONS
The Fund has authorized capital of 100,000,000 shares with no par value. For the six months ended April 30, 2020 and the year ended October 31, 2019, the Fund did not issue any shares.
On November 22, 2019, the Fund announced a renewal of its open-market share repurchase program (the “Buyback Program”). Under the Buyback Program, the Fund is authorized to repurchase up to 10% of its outstanding shares in open-market transactions beginning on January 1, 2020 and ending on December 31, 2020. The Fund’s Board of Trustees delegated to Funds Management full discretion to administer the Buyback Program, including the determination of the amount and timing of repurchases in accordance with the best interests of the Fund and subject to applicable legal limitations. During the six months ended April 30, 2020, the Fund purchased 493,150 of its shares on the open-market at a total cost of $4,935,965 (weighted average price per share of $9.99). The weighted average discount of these repurchased shares was 10.32%.
6. BORROWINGS
The Fund has borrowed $125,500,000 through a revolving credit facility administered by a major financial institution (the “Facility”). The Facility has a commitment amount of $173,000,000 with no specific contract expiration date but the Facility can be terminated upon 180 days’ notice. The Fund is charged interest at London Interbank Offered Rate (LIBOR) plus 0.65% and a commitment fee of 0.30% of the average daily unutilized amount of the commitment which may be waived if the amount drawn on the Facility is over 75% of the committed amount. The financial institution holds a security interest in all the assets of the Fund as collateral for the borrowing. Based on the nature of the terms of the Facility and comparative market rates, the carrying amount of the borrowings at April 30, 2020 approximates its fair value. If measured at fair value, the borrowings would be categorized as a Level 2 under the fair value hierarchy.
During the six months ended April 30, 2020, the Fund had average borrowings outstanding of $161,406,593 (on an annualized basis) at an average interest rate of 2.76% and paid interest in the amount of $2,216,133 which represents 1.17% of its average daily net assets.
Wells Fargo Multi-Sector Income Fund | 37
Notes to financial statements (unaudited)
7. INVESTMENT PORTFOLIO TRANSACTIONS
Purchases and sales of investments, excluding U.S. government obligations (if any) and short-term securities, for the six months ended April 30, 2020 were $76,717,530 and $110,683,443, respectively.
8. INDEMNIFICATION
Under the Fund’s organizational documents, the officers and Trustees have been granted certain indemnification rights against certain liabilities that may arise out of performance of their duties to the Fund. The Fund has entered into a separate agreement with each Trustee that converts indemnification rights currently existing under the Fund’s organizational documents into contractual rights that cannot be changed in the future without the consent of the Trustee. Additionally, in the normal course of business, the Fund may enter into contracts with service providers that contain a variety of indemnification clauses. The Fund’s maximum exposure under these arrangements is dependent on future claims that may be made against the Fund and, therefore, cannot be estimated.
9. NEW ACCOUNTING PRONOUNCEMENT
In August 2018, FASB issued Accounting Standards Update (“ASU”)No. 2018-13, Fair Value Measurement (Topic 820)Disclosure Framework—Changes to the Disclosure Requirements for Fair Value Measurement.ASU2018-13 updates the disclosure requirements for fair value measurements by modifying or removing certain disclosures and adding certain new disclosures. The amendments are effective for fiscal years, and interim periods within those fiscal years, beginning after December 15, 2019. Early adoption is permitted. Management has adopted the removal and modification of disclosures early, as permitted, and will adopt the additional new disclosures at the effective date.
10. CORONAVIRUS(COVID-19) PANDEMIC
On March 11, 2020, the World Health Organization announced that it had made the assessment that coronavirus disease 2019(“COVID-19”) is a pandemic. The impacts ofCOVID-19 are adversely affecting the entire global economy, individual companies and investment products, and the market in general. There is significant uncertainty around the extent and duration of business disruptions related toCOVID-19 and the impacts may be short term or may last for an extended period of time. The risk of further spreading ofCOVID-19 has led to significant uncertainty and volatility in the financial markets. The value of the Fund and the securities in which the Fund invests have generally been adversely affected by impacts caused byCOVID-19.
11. SUBSEQUENT DISTRIBUTIONS
The Fund declared the following distributions to common shareholders:
| | | | | | |
| Declaration date | | Record date | | Payable date | | Per share amount |
| | | |
| April 24, 2020 | | May 12, 2020 | | June 1, 2020 | | $0.09816 |
| | | |
| May 28, 2020 | | June 15, 2020 | | July 1, 2020 | | 0.09664 |
These distributions are not reflected in the accompanying financial statements.
38 | Wells Fargo Multi-Sector Income Fund
Other information (unaudited)
PROXY VOTING INFORMATION
A description of the policies and procedures used to determine how to vote proxies relating to portfolio securities is available, upon request, by calling1-800-222-8222, visiting our website atwfam.com, or visiting the SEC website at sec.gov. Information regarding how the proxies related to portfolio securities were voted during the most recent12-month period ended June 30 is available on the website atwfam.com or by visiting the SEC website at sec.gov.
ANNUAL MEETING OF SHAREHOLDERS
On February 10, 2020, an Annual Meeting of Shareholders for the Fund was held to consider the following proposal. The results of the proposal are indicated below.
Proposal 1– Election of trustees:
| | | | | | |
| Shares voted “For” | | Isaiah Harris, Jr. | | | 26,628,577 | |
| | |
| Shares voted “Withhold” | | | | | 734,044 | |
| | |
| Shares voted “For” | | David F. Larcker | | | 26,214,944 | |
| | |
| Shares voted “Withhold” | | | | | 1,147,677 | |
| | |
| Shares voted “For” | | Olivia S. Mitchell | | | 26,508,717 | |
| | |
| Shares voted “Withhold” | | | | | 853,904 | |
| | |
| Shares voted “For” | | Pamela Wheelock | | | 26,515,417 | |
| Shares voted “Withhold” | | | | | 847,204 | |
QUARTERLY PORTFOLIO HOLDINGS INFORMATION
The Fund files its complete schedule of portfolio holdings with the SEC for the first and third quarters of each fiscal year as an exhibit to its reports on FormN-PORT. Shareholders may view the filed FormN-PORT by visiting the SEC website at sec.gov.
Wells Fargo Multi-Sector Income Fund | 39
Other information (unaudited)
BOARD OF TRUSTEES AND OFFICERS
The following table provides basic information about the Board of Trustees (the “Trustees”) and Officers of the Fund. Each of the Trustees and Officers1 listed below acts in identical capacities for each fund in the Wells Fargo family of funds, which consists of 147 mutual funds comprising the Wells Fargo Funds Trust, Wells Fargo Variable Trust, Wells Fargo Master Trust, and fourclosed-end funds, including the Fund (collectively the “Fund Complex”). The mailing address of each Trustee and Officer is 525 Market Street, 12th Floor, San Francisco, CA 94105. The Board of Trustees is classified into three classes of which one is elected annually. Each Trustee serves a three-year term concurrent with the class from which the Trustee is elected. Each Officer serves an indefinite term.
Independent Trustees
| | | | | | |
Name and
year of birth | | Position held and
length of service | | Principal occupations during past five years or longer | | Current other
public company or
investment
company
directorships |
|
| Class I -Non-Interested Trustees to serve until 2023 Annual Meeting of Shareholders |
| | | |
Isaiah Harris, Jr. (Born 1952) | | Trustee, since 2010; Audit Committee Chairman, since 2019 | | Retired. Chairman of the Board of CIGNA Corporation since 2009, and Director since 2005. From 2003 to 2011, Director of Deluxe Corporation. Prior thereto, President and CEO of BellSouth Advertising and Publishing Corp. from 2005 to 2007, President and CEO of BellSouth Enterprises from 2004 to 2005 and President of BellSouth Consumer Services from 2000 to 2003. Emeritus member of the Iowa State University Foundation Board of Governors. Emeritus Member of the Advisory Board of Iowa State University School of Business. Advisory Board Member, Palm Harbor Academy (private school). Advisory Board Member, Child Evangelism Fellowship(non-profit). Mr. Harris is a certified public accountant (inactive status). | | CIGNA Corporation |
| | | |
David F. Larcker (Born 1950) | | Trustee, since 2010 | | James Irvin Miller Professor of Accounting at the Graduate School of Business, Stanford University, Director of the Corporate Governance Research Initiative and Senior Faculty of The Rock Center for Corporate Governance since 2006. From 2005 to 2008, Professor of Accounting at the Graduate School of Business, Stanford University. Prior thereto, Ernst & Young Professor of Accounting at The Wharton School, University of Pennsylvania from 1985 to 2005. | | N/A |
| | | |
Olivia S. Mitchell (Born 1953) | | Trustee, since 2010; Nominating and Governance Committee Chairman, since 2018 | | International Foundation of Employee Benefit Plans Professor, Wharton School of the University of Pennsylvania since 1993. Director of Wharton’s Pension Research Council and Boettner Center on Pensions & Retirement Research, and Research Associate at the National Bureau of Economic Research. Previously, Cornell University Professor from 1978 to 1993. | | N/A |
|
| Class II -Non-Interested Trustees to serve until 2021 Annual Meeting of Shareholders |
| | | |
William R. Ebsworth (Born 1957) | | Trustee, since 2015 | | Retired. From 1984 to 2013, equities analyst, portfolio manager, research director and chief investment officer at Fidelity Management and Research Company in Boston, Tokyo, and Hong Kong, and retired in 2013 as Chief Investment Officer of Fidelity Strategic Advisers, Inc. where he led a team of investment professionals managing client assets. Prior thereto, Board member of Hong Kong Securities Clearing Co., Hong Kong Options Clearing Corp., the Thailand International Fund, Ltd., Fidelity Investments Life Insurance Company, and Empire Fidelity Investments Life Insurance Company. Audit Committee Chair and Investment Committee Chair of the Vincent Memorial Hospital Endowment(non-profit organization). Mr. Ebsworth is a CFA® charterholder. | | N/A |
40 | Wells Fargo Multi-Sector Income Fund
Other information (unaudited)
| | | | | | |
Name and
year of birth | | Position held and
length of service | | Principal occupations during past five years or longer | | Current other
public company or
investment
company
directorships |
| | | |
Jane A. Freeman (Born 1953) | | Trustee, since 2015; Chair Liaison, since 2018 | | Retired. From 2012 to 2014 and 1999 to 2008, Chief Financial Officer of Scientific Learning Corporation. From 2008 to 2012, Ms. Freeman provided consulting services related to strategic business projects. Prior to 1999, Portfolio Manager at Rockefeller & Co. and Scudder, Stevens & Clark. Board member of the Harding Loevner Funds from 1996 to 2014, serving as both Lead Independent Director and chair of the Audit Committee. Board member of the Russell Exchange Traded Funds Trust from 2011 to 2012 and the chair of the Audit Committee. Ms. Freeman is also an inactive Chartered Financial Analyst. | | N/A |
| | | |
Judith M. Johnson (Born 1949) | | Trustee, since 2010; Audit Committee Chairman, from 2010 to 2018 | | Retired. Prior thereto, Chief Executive Officer and Chief Investment Officer of Minneapolis Employees Retirement Fund from 1996 to 2008. Ms. Johnson is an attorney, certified public accountant and a certified managerial accountant. | | N/A |
|
| Class III -Non-Interested Trustees to serve until 2022 Annual Meeting of Shareholders |
| | | |
Timothy J. Penny (Born 1951) | | Trustee, since 2010; Chairman, since 2018 | | President and Chief Executive Officer of Southern Minnesota Initiative Foundation, anon-profit organization, since 2007. Member of the Board of Trustees of NorthStar Education Finance, Inc., anon-profit organization, since 2007. | | N/A |
| | | |
James G. Polisson (Born 1959) | | Trustee, since 2018 | | Retired. Chief Marketing Officer, Source (ETF) UK Services, Ltd, from 2015 to 2017. From 2012 to 2015, Principal of The Polisson Group, LLC, a management consulting, corporate advisory and principal investing company. Chief Executive Officer and Managing Director at Russell Investments, Global Exchange Traded Funds from 2010 to 2012. Managing Director of Barclays Global Investors from 1998 to 2010 and Global Chief Marketing Officer for iShares and Barclays Global Investors from 2000 to 2010. Trustee of the San Francisco Mechanics’ Institute, anon-profit organization, from 2013 to 2015. Board member of the Russell Exchange Traded Fund Trust from 2011 to 2012. Director of Barclays Global Investors Holdings Deutschland GmbH from 2006 to 2009. Mr. Polisson is an attorney and has a retired status with the Massachusetts and District of Columbia Bar Associations. | | N/A |
| | | |
Pamela Wheelock (Born 1959) | | Trustee, since January 2020; previously Trustee from January 2018 to July 2019 | | Board member of the Destination Medical Center Economic Development Agency, Rochester, Minnesota since 2019 and Interim President of the McKnight Foundation since 2020. Acting Commissioner, Minnesota Department of Human Services, July 2019 through September 2019. Human Services Manager (part-time), Minnesota Department of Human Services, October 2019 through December 2019. Chief Operating Officer, Twin Cities Habitat for Humanity from 2017 to 2019. Vice President of University Services, University of Minnesota from 2012 to 2016. Prior thereto, on the Board of Directors, Governance Committee and Finance Committee for the Minnesota Philanthropy Partners (Saint Paul Foundation) from 2012 to 2018, Interim Chief Executive Officer of Blue Cross Blue Shield of Minnesota from 2011 to 2012, Chairman of the Board from 2009 to 2012 and Board Director from 2003 to 2015. Vice President, Leadership and Community Engagement, Bush Foundation, Saint Paul, Minnesota (a private foundation) from 2009 to 2011. Executive Vice President and Chief Financial Officer, Minnesota Sports and Entertainment from 2004 to 2009 and Senior Vice President from 2002 to 2004. Executive Vice President of the Minnesota Wild Foundation from 2004 to 2008. Commissioner of Finance, State of Minnesota, from 1999 to 2002. Currently Board Chair of the Minnesota Wild Foundation since 2010. | | N/A |
Wells Fargo Multi-Sector Income Fund | 41
Other information (unaudited)
Officers
| | | | |
Name and year of birth | | Position held and length of service | | Principal occupations during past five years or longer |
| | |
Andrew Owen (Born 1960) | | President, since 2017 | | Executive Vice President of Wells Fargo & Company and Head of Affiliated Managers, Wells Fargo Asset Management, since 2014. In addition, Mr. Owen is currently President, Chief Executive Officer and Director of Wells Fargo Funds Management, LLC since 2017. Prior thereto, Executive Vice President responsible for marketing, investments and product development for Wells Fargo Funds Management, LLC, from 2009 to 2014. |
| | |
Jeremy DePalma1 (Born 1974) | | Treasurer, since 2012 | | Senior Vice President of Wells Fargo Funds Management, LLC since 2009. Senior Vice President of Evergreen Investment Management Company, LLC from 2008 to 2010 and head of the Fund Reporting and Control Team within Fund Administration from 2005 to 2010. |
| | |
Michelle Rhee (Born 1966) | | Chief Legal Officer, since 2019 | | Secretary of Wells Fargo Funds Management, LLC, Chief Legal Counsel of Wells Fargo Asset Management and Assistant General Counsel of Wells Fargo Bank, N.A. since 2018. Associate General Counsel and Managing Director of Bank of America Corporation from 2004 to 2018. |
| | |
Catherine Kennedy (Born 1969) | | Secretary, since 2019 | | Vice President of Wells Fargo Funds Management, LLC and Senior Counsel of the Wells Fargo Legal Department since 2010. Vice President and Senior Counsel of Evergreen Investment Management Company, LLC from 1998 to 2010. |
| | |
Michael H. Whitaker (Born 1967) | | Chief Compliance Officer, since 2016 | | Chief Compliance Officer of Wells Fargo Asset Management since 2016. Senior Vice President and Chief Compliance Officer for Fidelity Investments from 2007 to 2016. |
| | |
David Berardi (Born 1975) | | Assistant Treasurer, since 2009 | | Vice President of Wells Fargo Funds Management, LLC since 2009. Vice President of Evergreen Investment Management Company, LLC from 2008 to 2010. Manager of Fund Reporting and Control for Evergreen Investment Management Company, LLC from 2004 to 2010. |
| 1 | Jeremy DePalma acts as Treasurer of 82 funds and Assistant Treasurer of 65 funds in the Fund Complex. |
42 | Wells Fargo Multi-Sector Income Fund
Automatic dividend reinvestment plan
AUTOMATIC DIVIDEND REINVESTMENT PLAN
All common shareholders are eligible to participate in the Automatic Dividend Reinvestment Plan (“the Plan”). Pursuant to the Plan, unless a common shareholder is ineligible or elects otherwise, all cash dividends and capital gains distributions are automatically reinvested by Computershare Trust Company, N.A., as agent for shareholders in administering the Plan (“Plan Agent”), in additional common shares of the Fund. Whenever the Fund declares an ordinary income dividend or a capital gain dividend (collectively referred to as “dividends”) payable either in shares or in cash, nonparticipants in the Plan will receive cash, and participants in the Plan will receive the equivalent in common shares. The shares are acquired by the Plan Agent for the participant’s account, depending upon the circumstances described below, either (i) through receipt of additional unissued but authorized common shares from the Fund (“newly issued common shares”) or (ii) by purchase of outstanding common shares on the open-market (open-market purchases) on the NYSE Amex or elsewhere. If, on the payment date for any dividend or distribution, the net asset value per share of the common shares is equal to or less than the market price per common share plus estimated brokerage commissions (“market premium”), the Plan Agent will invest the amount of such dividend or distribution in newly issued shares on behalf of the participant. The number of newly issued common shares to be credited to the participant’s account will be determined by dividing the dollar amount of the dividend by the net asset value per share on the date the shares are issued, provided that the maximum discount from the then current market price per share on the date of issuance may not exceed 5%. If on the dividend payment date the net asset value per share is greater than the market value (“market discount”), the Plan Agent will invest the dividend amount in shares acquired on behalf of the participant in open-market purchases. There will be no brokerage charges with respect to shares issued directly by the Fund as a result of dividends or capital gains distributions payable either in shares or in cash. However, each participant will pay a pro rata share of brokerage commissions incurred with respect to the Plan Agent’s open-market purchases in connection with the reinvestment of dividends. The automatic reinvestment of dividends and distributions will not relieve participants of any federal, state or local income tax that may be payable (or required to be withheld) on such dividends. All correspondence concerning the Plan should be directed to the Plan Agent at P.O. Box 30170, College Station, Texas 77842-3170 or by calling1-800-730-6001.
Wells Fargo Multi-Sector Income Fund | 43
This page is intentionally left blank.

Transfer Agent, Registrar, Shareholder Servicing
Agent & Dividend Disbursing Agent
Computershare Trust Company, N.A.
P.O. Box 505000
Louisville, Kentucky 40233
1-800-730-6001
Website:wfam.com

Wells Fargo Asset Management (WFAM) is the trade name for certain investment advisory/management firms owned by Wells Fargo & Company. These firms include but are not limited to Wells Capital Management Incorporated and Wells Fargo Funds Management, LLC. Certain products managed by WFAM entities are distributed by Wells Fargo Funds Distributor, LLC (a broker-dealer and Member FINRA).
This material is for general informational and educational purposes only and is NOT intended to provide investment advice or a recommendation of any kind—including a recommendation for any specific investment, strategy, or plan.
INVESTMENT PRODUCTS: NOT FDIC INSURED ◾ NO BANK GUARANTEE ◾ MAY LOSE VALUE
© 2019 Wells Fargo & Company. All rights reserved.
PAR-0620-01720 06-20
SMSI/SAR159 04-20
ITEM 2. CODE OF ETHICS
Not applicable.
ITEM 3. AUDIT COMMITTEE FINANCIAL EXPERT
Not applicable.
ITEM 4. PRINCIPAL ACCOUNTANT FEES AND SERVICES
Not applicable.
ITEM 5. AUDIT COMMITTEE OF LISTED REGISTRANTS
Not applicable.
ITEM 6. INVESTMENTS
A Portfolio of Investments for Wells Fargo Multi-Sector Income Fund is included as part of the report to shareholders filed under Item 1 of this Form.
ITEM 7. DISCLOSURE OF PROXY VOTING POLICIES AND PROCEDURES FORCLOSED-END MANAGEMENT INVESTMENT COMPANIES
Not applicable.
ITEM 8. PORTFOLIO MANAGERS OFCLOSED-END MANAGEMENT INVESTMENT COMPANIES
Not applicable.
ITEM 9. PURCHASES OF EQUITY SECURITIES BYCLOSED-END MANAGEMEENT INVESTMENT COMPANY AND AFFILIATED PURCHASERS
| | | | | | | | | | | | | | | | |
Period | | (a)
Total
Number of
Shares
Purchased | | | (b)
Average
Price Paid
per Share | | | (c)
Total Number
of Shares
Purchased as
Part of Publicly
Announced
Plans or
Programs | | | (d)
Maximum
Number of
Shares that May
Yet Be
Purchased
Under the Plans
or Programs | |
11/1/2019 to 11/30/2019 | | | 0 | | | | 0 | | | | 0 | | | | 2,267,241 | |
12/1/2019 to 12/31/2019 | | | 0 | | | | 0 | | | | 0 | | | | 2,267,241 | |
1/1/2020 to 1/31/2020 | | | 0 | | | | 0 | | | | 0 | | | | 3,057,359 | |
2/1/2020 to 2/29/2020 | | | 0 | | | | 0 | | | | 0 | | | | 3,057,359 | |
3/1/2020 to 3/31/2020 | | | 105,893 | | | | 10.73 | | | | 105,893 | | | | 2,951,466 | |
4/1/2020 to 4/30/2020 | | | 387,257 | | | | 9.79 | | | | 387,257 | | | | 2,564,209 | |
| | | | | | | | | | | | | | | | |
Total | | | 493,150 | | | | 10.26 | | | | 493,150 | | | | 2,564,209 | |
| | | | | | | | | | | | | | | | |
On November 22, 2019, the Fund announced a renewal of its open-market share repurchase program (the “Buyback Program”). Under the renewed Buyback Program, the Fund may repurchase up to 10% of its outstanding shares in open-market transactions during the period beginning January 1, 2020 and ending on December 31, 2020
ITEM 10. SUBMISSION OF MATTERS TO A VOTE OF SECURITY HOLDERS
There have been no material changes to the procedures by which shareholders may recommend nominees to the registrant’s Board of Trustees that have been implemented since the registrant’s last provided disclosure in response to the requirements of this Item.
ITEM 11. CONTROLS AND PROCEDURES
(a) The President and Treasurer have concluded that the Wells Fargo Multi-Sector Income Fund disclosure controls and procedures (as defined in Rule30a-3(c) under the Investment Company Act of 1940) provide reasonable assurances that material information relating to the registrant is made known to them by the appropriate persons, based on their evaluation of these controls and procedures as of a date within 90 days of the filing of this report.
(b) There were no significant changes in the registrant’s internal controls over financial reporting (as defined in Rule30a-3(d) under the Investment Company Act of 1940) that occurred during the most recent fiscal half-year of the period covered by this report that materially affected, or is reasonably likely to materially affect, the registrant’s internal control over financial reporting.
ITEM 12. DISCLOSURES OF SECURITIES LENDING ACTIVITES FORCLOSED-END MANAGEMENT INVESTMENT COMPANIES
Not applicable.
ITEM 13. EXHIBITS
(a)(1) Not applicable.
(a)(2)Certifications pursuant to Section 302 of the Sarbanes-Oxley Act of 2002.
(b)Certifications pursuant to Section 906 of the Sarbanes-Oxley Act of 2002.
SIGNATURES
Pursuant to the requirements of the Securities Exchange Act of 1934 and the Investment Company Act of 1940, the registrant has duly caused this report to be signed on its behalf by the undersigned, thereunto duly authorized.
| | |
| Wells Fargo Multi-Sector Income Fund |
| |
| By: | | |
| |
| | /s/ Andrew Owen |
| |
| | Andrew Owen |
| | President |
| |
| Date: | | June 26, 2020 |
Pursuant to the requirements of the Securities Exchange Act of 1934 and the Investment Company Act of 1940, this report has been signed below by the following persons on behalf of the registrant and in the capacities and on the date indicated.
| | |
| Wells Fargo Multi-Sector Income Fund |
| |
| By: | | |
| |
| | /s/ Andrew Owen |
| |
| | Andrew Owen |
| | President |
| |
| Date: | | June 26, 2020 |
| |
| By: | | |
| |
| | /s/ Jeremy DePalma |
| |
| | Jeremy DePalma |
| | Treasurer |
| |
| Date: | | June 26, 2020 |