UNITED STATES
SECURITIES AND EXCHANGE COMMISSION
Washington, D.C. 20549
FORM N-CSRS
CERTIFIED SHAREHOLDER REPORT OF REGISTERED
MANAGEMENT INVESTMENT COMPANIES
Investment Company Act file number: 811-21331
Allspring Multi-Sector Income Fund
(Exact name of registrant as specified in charter)
1415 Vantage Park Drive, 3rd Floor, Charlotte, NC 28203
(Address of principal executive offices) (Zip code)
Mathew Prasse
Allspring Funds Management, LLC
1415 Vantage Park Drive, 3rd Floor, Charlotte, NC 28203
(Name and address of agent for service)
Registrant’s telephone number, including area code: 800-222-8222
Date of fiscal year end: October 31
Date of reporting period: April 30, 2023
ITEM 1. REPORT TO STOCKHOLDERS
2
Allspring Multi-Sector Income Fund (ERC)
Semi-Annual Report
April 30, 2023
The views expressed and any forward-looking statements are as of April 30, 2023, unless otherwise noted, and are those of the Fund’s portfolio managers and/or Allspring Global Investments. Discussions of individual securities or the markets generally are not intended as individual recommendations. Future events or results may vary significantly from those expressed in any forward-looking statements. The views expressed are subject to change at any time in response to changing circumstances in the market. Allspring Global Investments disclaims any obligation to publicly update or revise any views expressed or forward-looking statements.
Allspring Multi-Sector Income Fund | 1
Letter to shareholders (unaudited)
Andrew Owen
President
Allspring Funds
Dear Shareholder:
We are pleased to offer you this semi-annual report for the Allspring Multi-Sector Income Fund for the six-month period that ended April 30, 2023. Globally, stocks and bonds rebounded strongly despite ongoing volatility. While navigating persistently high inflation and the impact of ongoing aggressive central bank rate hikes, markets rallied on signs of declining inflation, anticipation of an end to the central bank monetary tightening cycle, and the stimulating impact of China removing its strict COVID-19 lockdowns in December. For the six-month period, domestic U.S. and global stocks and bonds had strong results. After suffering deep and broad losses through 2022, recent fixed income performance benefited from a base of higher yields that have the potential to generate higher income.
For the period, U.S. stocks, based on the S&P 500 Index,1 returned 8.63%. International stocks, as measured by the MSCI ACWI ex USA Index (Net),2 gained 20.65% while the MSCI EM Index (Net) (USD),3 returned 16.36%. Among bond indexes, the Bloomberg U.S. Aggregate Bond Index4 returned 6.91%, the Bloomberg Global Aggregate ex-USD Index (unhedged)5 gained 10.55%, the Bloomberg Municipal Bond Index6 gained 7.65%, and the ICE BofA U.S. High Yield Index7 returned 5.92%.
Despite high inflation and central bank rate hikes, markets rally.
Stocks and bonds rallied in November after earlier volatility. Economic news was encouraging, driven by U.S. labor market strength. Although central banks kept increasing rates, hopes rose for an easing in the pace of rate hikes and a possible end to central bank monetary tightening in 2023. Although inflation remained at record highs in the eurozone, we began to see signs of a possible decline in inflationary pressures as U.S. inflation moderated, with a 7.1% annual price rise in November and a monthly price increase of just 0.1%. China’s economic data remained weak, reflecting its zero-COVID-19 policy.
Financial markets cooled in December, with U.S. equities posting negative overall results in response to a weakening U.S. dollar. Fixed income securities ended one of their worst years ever, with flat overall monthly returns as markets weighed the hopes for an end to the monetary tightening cycle with the reality that central banks had not completed their jobs yet. U.S. Consumer Price Index (CPI)8 data showed a strong consistent trend downward, which brought down the 12-month CPI to 6.5% in December from 9.1% in June. Other countries and regions reported still-high but declining inflation rates as the year wound down.
1
The S&P 500 Index consists of 500 stocks chosen for market size, liquidity, and industry group representation. It is a market-value-weighted index with each stock’s weight in the index proportionate to its market value. You cannot invest directly in an index.
2
The Morgan Stanley Capital International (MSCI) All Country World Index (ACWI) ex USA Index (Net) is a free-float-adjusted market-capitalization-weighted index that is designed to measure the equity market performance of developed and emerging markets, excluding the U.S. Source: MSCI. MSCI makes no express or implied warranties or representations and shall have no liability whatsoever with respect to any MSCI data contained herein. The MSCI data may not be further redistributed or used as a basis for other indexes or any securities or financial products. This report is not approved, reviewed, or produced by MSCI. You cannot invest directly in an index.
3
The MSCI Emerging Markets (EM) Index (Net) (USD) is a free-float-adjusted market-capitalization-weighted index that is designed to measure the equity market performance of emerging markets. You cannot invest directly in an index.
4
The Bloomberg U.S. Aggregate Bond Index is a broad-based benchmark that measures the investment-grade, U.S.-dollar-denominated, fixed-rate taxable bond market, including Treasuries, government-related and corporate securities, mortgage-backed securities (agency fixed-rate and hybrid adjustable-rate mortgage pass-throughs), asset-backed securities, and commercial mortgage-backed securities. You cannot invest directly in an index.
5
The Bloomberg Global Aggregate ex-USD Index (unhedged) is an unmanaged index that provides a broad-based measure of the global investment-grade fixed-income markets excluding the U.S.-dollar-denominated debt market. You cannot invest directly in an index.
6
The Bloomberg Municipal Bond Index is an unmanaged index composed of long-term tax-exempt bonds with a minimum credit rating of Baa. You cannot invest directly in an index.
7
The ICE BofA U.S. High Yield Index is a market-capitalization-weighted index of domestic and Yankee high yield bonds. The index tracks the performance of high yield securities traded in the U.S. bond market. You cannot invest directly in an index. Copyright 2023. ICE Data Indices, LLC. All rights reserved.
8
The U.S. Consumer Price Index (CPI) is a measure of the average change over time in the prices paid by urban consumers for a market basket of consumer goods and services. You cannot invest directly in an index.
2 | Allspring Multi-Sector Income Fund
Letter to shareholders (unaudited)
The year 2023 began with a rally across global equities and fixed income securities. Investor optimism rose in response to data indicating declining inflation rates and the reopening of China’s economy with the abrupt end to its zero-COVID-19 policy. The U.S. reported surprisingly strong job gains—employers added more than 500,000 jobs—and unemployment fell to 3.4%, the lowest level since 1969. Meanwhile, wage growth, seen as a potential contributor to ongoing high inflation, continued to moderate. All eyes remained fixed on the Federal Reserve (Fed) and on how many more rate hikes remain in this tightening cycle. The 0.25% federal funds rate hike announced in January was the Fed’s smallest rate increase since March 2022.
Financial markets declined in February as investors responded unfavorably to resilient economic data. The takeaway: Central banks will likely continue their monetary tightening cycle for longer than markets had priced in. In this environment—where strong economic data is seen as bad news—the resilient U.S. labor market was seen as a negative while the inflation rate has not been falling quickly enough for the Fed, which raised interest rates by 0.25% in early February. Meanwhile, the Bank of England and the European Central Bank both raised rates by 0.50%.
The collapse of Silicon Valley Bank in March, the second-largest banking failure in U.S. history, led to a classic bank run that spread to Europe where Switzerland’s Credit Suisse was taken over by its rival, UBS. The banking industry turmoil created an additional challenge for central banks in balancing inflationary concerns against potential economic weakening. Meanwhile, recent data pointed to economic strength in the U.S., Europe, and China. And China’s economy continued to rebound after the removal of its COVID-19 lockdown. Inflation rates in the U.S., the U.K., and Europe all remained higher than central bank targets, leading to additional rate hikes in March.
Economic data released in April pointed to global resilience, as Purchasing Managers Indexes1 in the U.S., U.K., and eurozone beat expectations, and China reported first-quarter annualized economic growth of 4.5%. Despite banking industry stress, developed market stocks had monthly gains. The U.S. labor market remained strong, with a 3.5% jobless rate and monthly payroll gains above 200,000. However, uncertainty and inflationary concerns weighed on investors in the U.S. and abroad.
Don’t let short-term uncertainty derail long-term investment goals.
Periods of investment uncertainty can present challenges, but experience has taught us that maintaining long-term investment goals can be an effective way to plan for the future. Although diversification cannot guarantee an investment profit or prevent losses, we believe it can be an effective way to manage investment risk and potentially smooth out overall portfolio performance. We encourage investors to know their investments and to understand that appropriate levels of risk-taking may unlock opportunities.
Thank you for choosing to invest with Allspring Funds. We appreciate your confidence in us and remain committed to helping you meet your financial needs.
Sincerely,
Andrew Owen
President
Allspring Funds
“ The collapse of Silicon Valley Bank in March, the second-largest banking failure in U.S. history, led to a classic bank run that spread to Europe where Switzerland’s Credit Suisse was taken over by its rival, UBS. ”
For further information about your fund, contact your investment professional, visit our website at allspringglobal.com, or call us directly at 1-800-222-8222.
1
The Purchasing Managers Index (PMI) is an index of the prevailing direction of economic trends in the manufacturing and service sectors. You cannot invest directly in an index.
Allspring Multi-Sector Income Fund | 3
Letter to shareholders (unaudited)
|
• On November 16, 2022, the Fund announced a renewal of its open-market share repurchase program (the “Buyback Program”). Under the renewed Buyback Program, the Fund may repurchase up to 5% of its outstanding shares in open market transactions during the period beginning on January 1, 2023 and ending on December 31, 2023. The Fund’s Board of Trustees has delegated to Allspring Funds Management, LLC, the Fund’s adviser, discretion to administer the Buyback Program, including the determination of the amount and timing of repurchases in accordance with the best interests of the Fund and subject to applicable legal limitations. |
• The Fund’s managed distribution plan provides for the declaration of monthly distributions to common shareholders of the Fund at an annual minimum fixed rate of 8% based on the Fund’s average monthly net asset value per share over the prior 12 months. Under the managed distribution plan, monthly distributions may be sourced from income, paid-in capital, and/or capital gains, if any. To the extent that sufficient investment income is not available on a monthly basis, the Fund may distribute paid-in capital and/or capital gains, if any, in order to maintain its managed distribution level. You should not draw any conclusions about the Fund’s investment performance from the amount of the Fund’s distributions or from the terms of the managed distribution plan. Shareholders may elect to reinvest distributions received pursuant to the managed distribution plan in the Fund under the existing dividend reinvestment plan, which is described later in this report. |
4 | Allspring Multi-Sector Income Fund
This page is intentionally left blank.
Performance highlights (unaudited)
Performance highlights
| The Fund seeks a high level of current income consistent with limiting its overall exposure to domestic interest rate risk. |
| The Fund allocates its assets between three separate investment strategies, or sleeves. Under normal market conditions, the Fund allocates approximately 30%-70% of its total assets to a sleeve consisting of below investment-grade (high yield) debt; approximately 10%-40% to a sleeve of foreign debt securities, including emerging market debt; and approximately 10%-30% to a sleeve of adjustable-rate and fixed-rate mortgage-backed securities, and investment-grade corporate bonds. |
| Allspring Funds Management, LLC |
| Allspring Global Investments, LLC |
| Allspring Global Investments (UK) Limited |
| Christopher Y. Kauffman, CFA, Chris Lee, CFA, Michael Lee, Alex Perrin, Michael J. Schueller, CFA, Lauren van Biljon, CFA, Noah Wise, CFA |
Average annual total returns (%) as of April 30, 20231 |
| | | | |
| | | | |
Based on net asset value (NAV) | | | | |
Multi-Sector Income Blended Index2 | | | | |
Bloomberg U.S. Credit Bond Index3 | | | | |
Bloomberg U.S. Securitized Index4 | | | | |
ICE BofA U.S. High Yield Constrained Index5 | | | | |
J.P. Morgan GBI-EM Global Diversified Composite Index6 | | | | |
J.P. Morgan Global Government Bond Index (ex U.S.)7 | | | | |
Figures quoted represent past performance, which is no guarantee of future results, and do not reflect taxes that a shareholder may pay on an investment in a fund. Investment return and principal value of an investment will fluctuate so that an investor’s shares, when sold, may be worth more or less than their original cost. Current performance may be lower or higher than the performance data quoted, which assumes the reinvestment of dividends and capital gains. Performance figures of the Fund do not reflect brokerage commissions that a shareholder would pay on the purchase and sale of shares. If taxes and such brokerage commissions had been reflected, performance would have been lower. To obtain performance information current to the most recent month-end, please call 1-800-222-8222.
The Fund’s annualized expense ratio for the six months ended April 30, 2023, was 3.14% which includes 2.25% of interest expense.
|
| Total returns based on market value are calculated assuming a purchase of common stock on the first day and a sale on the last day of the period reported. Total returns based on NAV are calculated based on the NAV at the beginning of the period and at the end of the period. Dividends and distributions, if any, are assumed for the purposes of these calculations to be reinvested at prices obtained under the Fund’s Automatic Dividend Reinvestment Plan. |
| Source: Allspring Funds Management, LLC. The Multi-Sector Income Blended Index is composed of 60% ICE BofA U.S. High Yield Constrained Index, 18% J.P. Morgan GBI-EM Global Diversified Composite Index, 7.5% Bloomberg U.S. Credit Bond Index, 7.5% Bloomberg U.S. Securitized Index, and 7% J.P. Morgan Global Government Bond Index (ex U.S.). You cannot invest directly in an index. |
| The Bloomberg U.S. Credit Bond Index is an unmanaged index of fixed income securities composed of securities from the Bloomberg Government/Corporate Bond Index, Mortgage-Backed Securities Index, and the Asset-Backed Securities Index. You cannot invest directly in an index. |
| The Bloomberg U.S. Securitized Index is an unmanaged composite of asset-backed securities, collateralized mortgage-backed securities (ERISA eligible), and fixed-rate mortgage-backed securities. You cannot invest directly in an index. |
| The ICE BofA U.S. High Yield Constrained Index is a market-value-weighted index of all domestic and Yankee high-yield bonds, including deferred interest bonds and payment-in-kind securities. Issues included in the index have maturities of one year or more and have a credit rating lower than BBB-/Baa3 but are not in default. The ICE BofA U.S. High Yield Constrained Index limits any individual issuer to a maximum of 2% benchmark exposure. You cannot invest directly in an index. Copyright 2023. ICE Data Indices, LLC. All rights reserved. |
| The J.P. Morgan GBI-EM Global Diversified Composite Index is an unmanaged index of debt instruments of 31 emerging countries. You cannot invest directly in an index. |
| The J.P. Morgan Global Government Bond Index (ex U.S.) measures the total return from investing in 12 developed government bond markets: Australia, Belgium, Canada, Denmark, France, Germany, Italy, Japan, the Netherlands, Spain, Sweden, and the U.K. You cannot invest directly in an index. |
CFA® and Chartered Financial Analyst® are trademarks owned by CFA Institute. |
6 | Allspring Multi-Sector Income Fund
Performance highlights (unaudited)
Growth of $10,000 investment as of April 30, 20231 |
| The chart compares the performance of the Fund for the most recent ten years with the Multi-Sector Income Blended Index, Bloomberg U.S. Credit Bond Index, Bloomberg U.S. Securitized Index, ICE BofA U.S. High Yield Constrained Index, J.P. Morgan GBI-EM Global Diversified Composite Index and J.P. Morgan Global Government Bond Index (ex U.S.). The chart assumes a hypothetical investment of $10,000 investment and reflects all operating expenses of the Fund. |
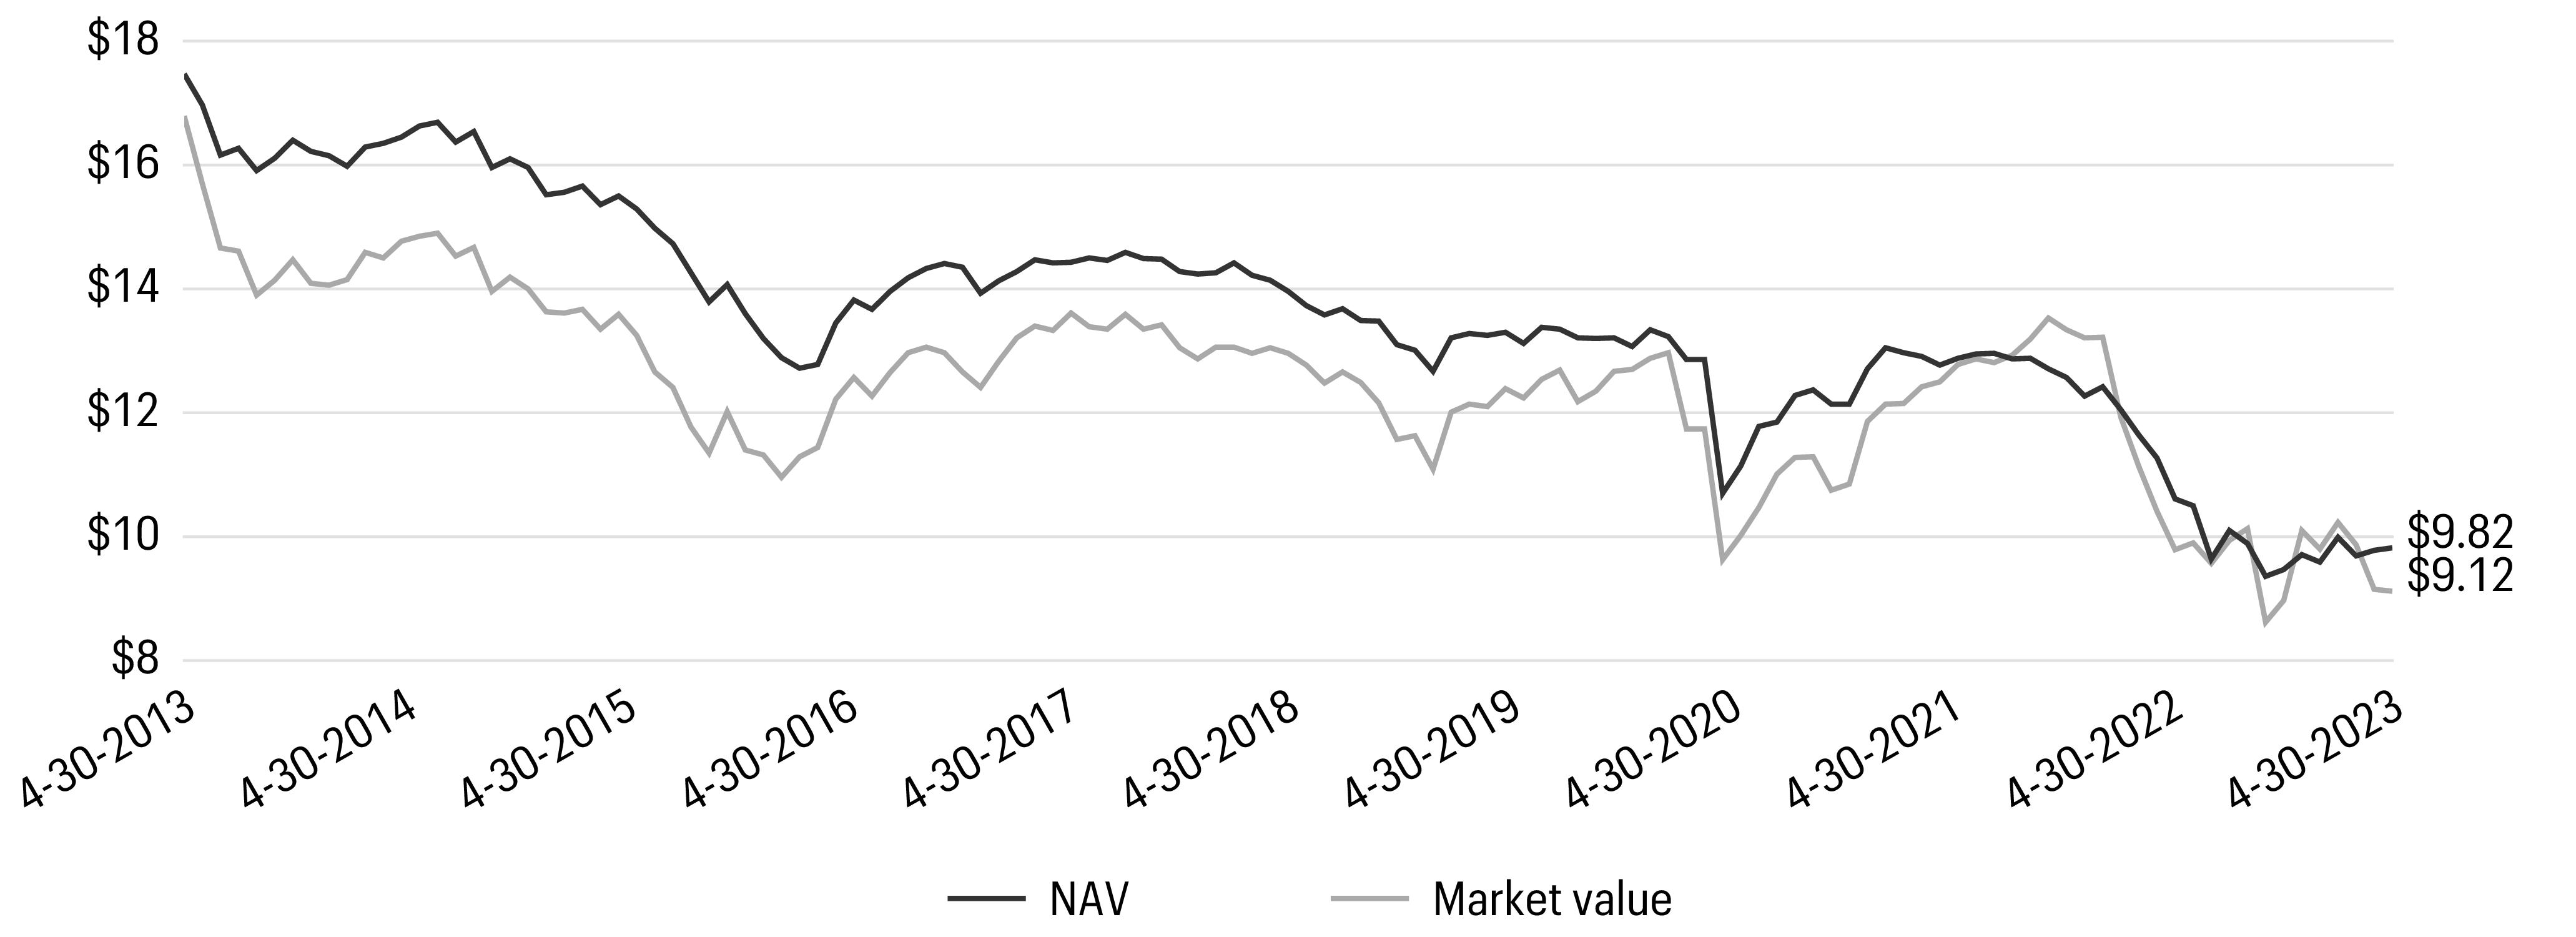
Comparison of NAV vs. market value1 |
| This chart does not reflect any brokerage commissions charged on the purchase and sale of the Fund’s common stock. Dividends and distributions paid by the Fund are included in the Fund’s average annual total returns but have the effect of reducing the Fund’s NAV. |
Allspring Multi-Sector Income Fund | 7
Performance highlights (unaudited)
Risk summary
This closed-end fund is no longer available as an initial public offering and is only offered through broker-dealers on the secondary market. A closed-end fund is not required to buy its shares back from investors upon request. Shares of the Fund may trade at either a premium or discount relative to the Fund’s net asset value, and there can be no assurance that any discount will decrease. The values of, and/or the income generated by, securities held by the Fund may decline due to general market conditions or other factors, including those directly involving the issuers of such securities. Debt securities are subject to credit risk and interest rate risk, and high yield securities and unrated securities of similar credit quality have a much greater risk of default and their values tend to be more volatile than higher-rated securities with similar maturities. Foreign investments may contain more risk due to the inherent risks associated with changing political climates, foreign market instability, and foreign currency fluctuations. Risks of foreign investing are magnified in emerging or developing markets. The Fund is exposed to mortgage- and asset-backed securities risk. The Fund is leveraged through a revolving credit facility and also may incur leverage by issuing preferred shares in the future. The use of leverage results in certain risks, including, among others, the likelihood of greater volatility of the net asset value and the market value of common shares. Derivatives involve additional risks, including interest rate risk, credit risk, the risk of improper valuation, and the risk of non-correlation to the relevant instruments that they are designed to hedge or closely track.
8 | Allspring Multi-Sector Income Fund
Performance highlights (unaudited)
MANAGER’S DISCUSSION
Overview
The Fund’s return based on market value was 6.24% for the six-month period that ended April 30, 2023. During the same period, the Fund’s return based on its net asset value (NAV) was 8.36%. Based on its market value, the Fund underperformed, but based on its NAV, it outperformed the Multi-Sector Income Blended Index, which returned 8.28% for the period.
Spreads tightened during the six-month period as market volatility continued.
For the six-month period that ended April 30, 2023, spreads (the difference in yields over Treasuries) in investment-grade corporate and securitized sectors tightened on average by 21 basis points (bps; 100 bps equal 1.00%) and 7 bps, respectively. High yield bond spreads tightened 12 bps. Lower-rated commercial mortgage-backed securities (CMBS) were among the worst-performing sectors, with AA-rated securities widening 55 bps and BBB-rated securities widening 345 bps.
A hawkish Federal Reserve (Fed) resulted in continued high interest rate volatility, contributing in part to the financials sector instability in the spring of 2023. Meanwhile, economic growth has decelerated, which, coupled with inflation, has placed the economy at risk of recession, or even stagflation. Yields in the high yield market peaked at nearly 10% in October but have since moderated to roughly 8.5%, while the bond default rate rose from 1.2% in October 2022 to 2.2% in April 2023.
It was a pivotal six months for global bond markets, with a peak in inflation breathing new life into fixed income. Disinflation took hold across both developed and emerging markets, bringing the prospect of an end to monetary policy tightening. Bond yields have moved materially lower (albeit in fits and starts). The U.S. dollar weakened, boosting returns on international allocations when translated into U.S. dollars.
Ten largest holdings (%) as of April 30, 20231 |
| |
| |
Indonesia, 7.00%, 9-15-2030 | |
Romania, 3.65%, 9-24-2031 | |
Geo Group, Inc., 12.11%, 3-23-2027 | |
Hungary, 1.50%, 4-22-2026 | |
| |
Colombia TES, 7.50%, 8-26-2026 | |
International Bank for Reconstruction & Development, 9.50%, 2-9-2029 | |
New Zealand, 3.50%, 4-14-2033 | |
| Figures represent the percentage of the Fund’s net assets. Holdings are subject to change and may have changed since the date specified. |
The Fund’s international allocation shifted to Eastern Europe and New Zealand.
Over the reporting period, the international/emerging markets portion of the Fund used its cash balance to add to positions in Eastern Europe (Hungary and Romania) and establish a new position in New Zealand. Within the existing position in Latin America, the managers diversified holdings by reducing exposure to quasi-sovereign issuance in Brazil and
adding to sovereign bond holdings in Colombia and Mexico. Overall sleeve duration nudged slightly higher, with the focus on taking advantage of opportunities in individual markets as they arose.
Credit quality as of April 30, 20231 |
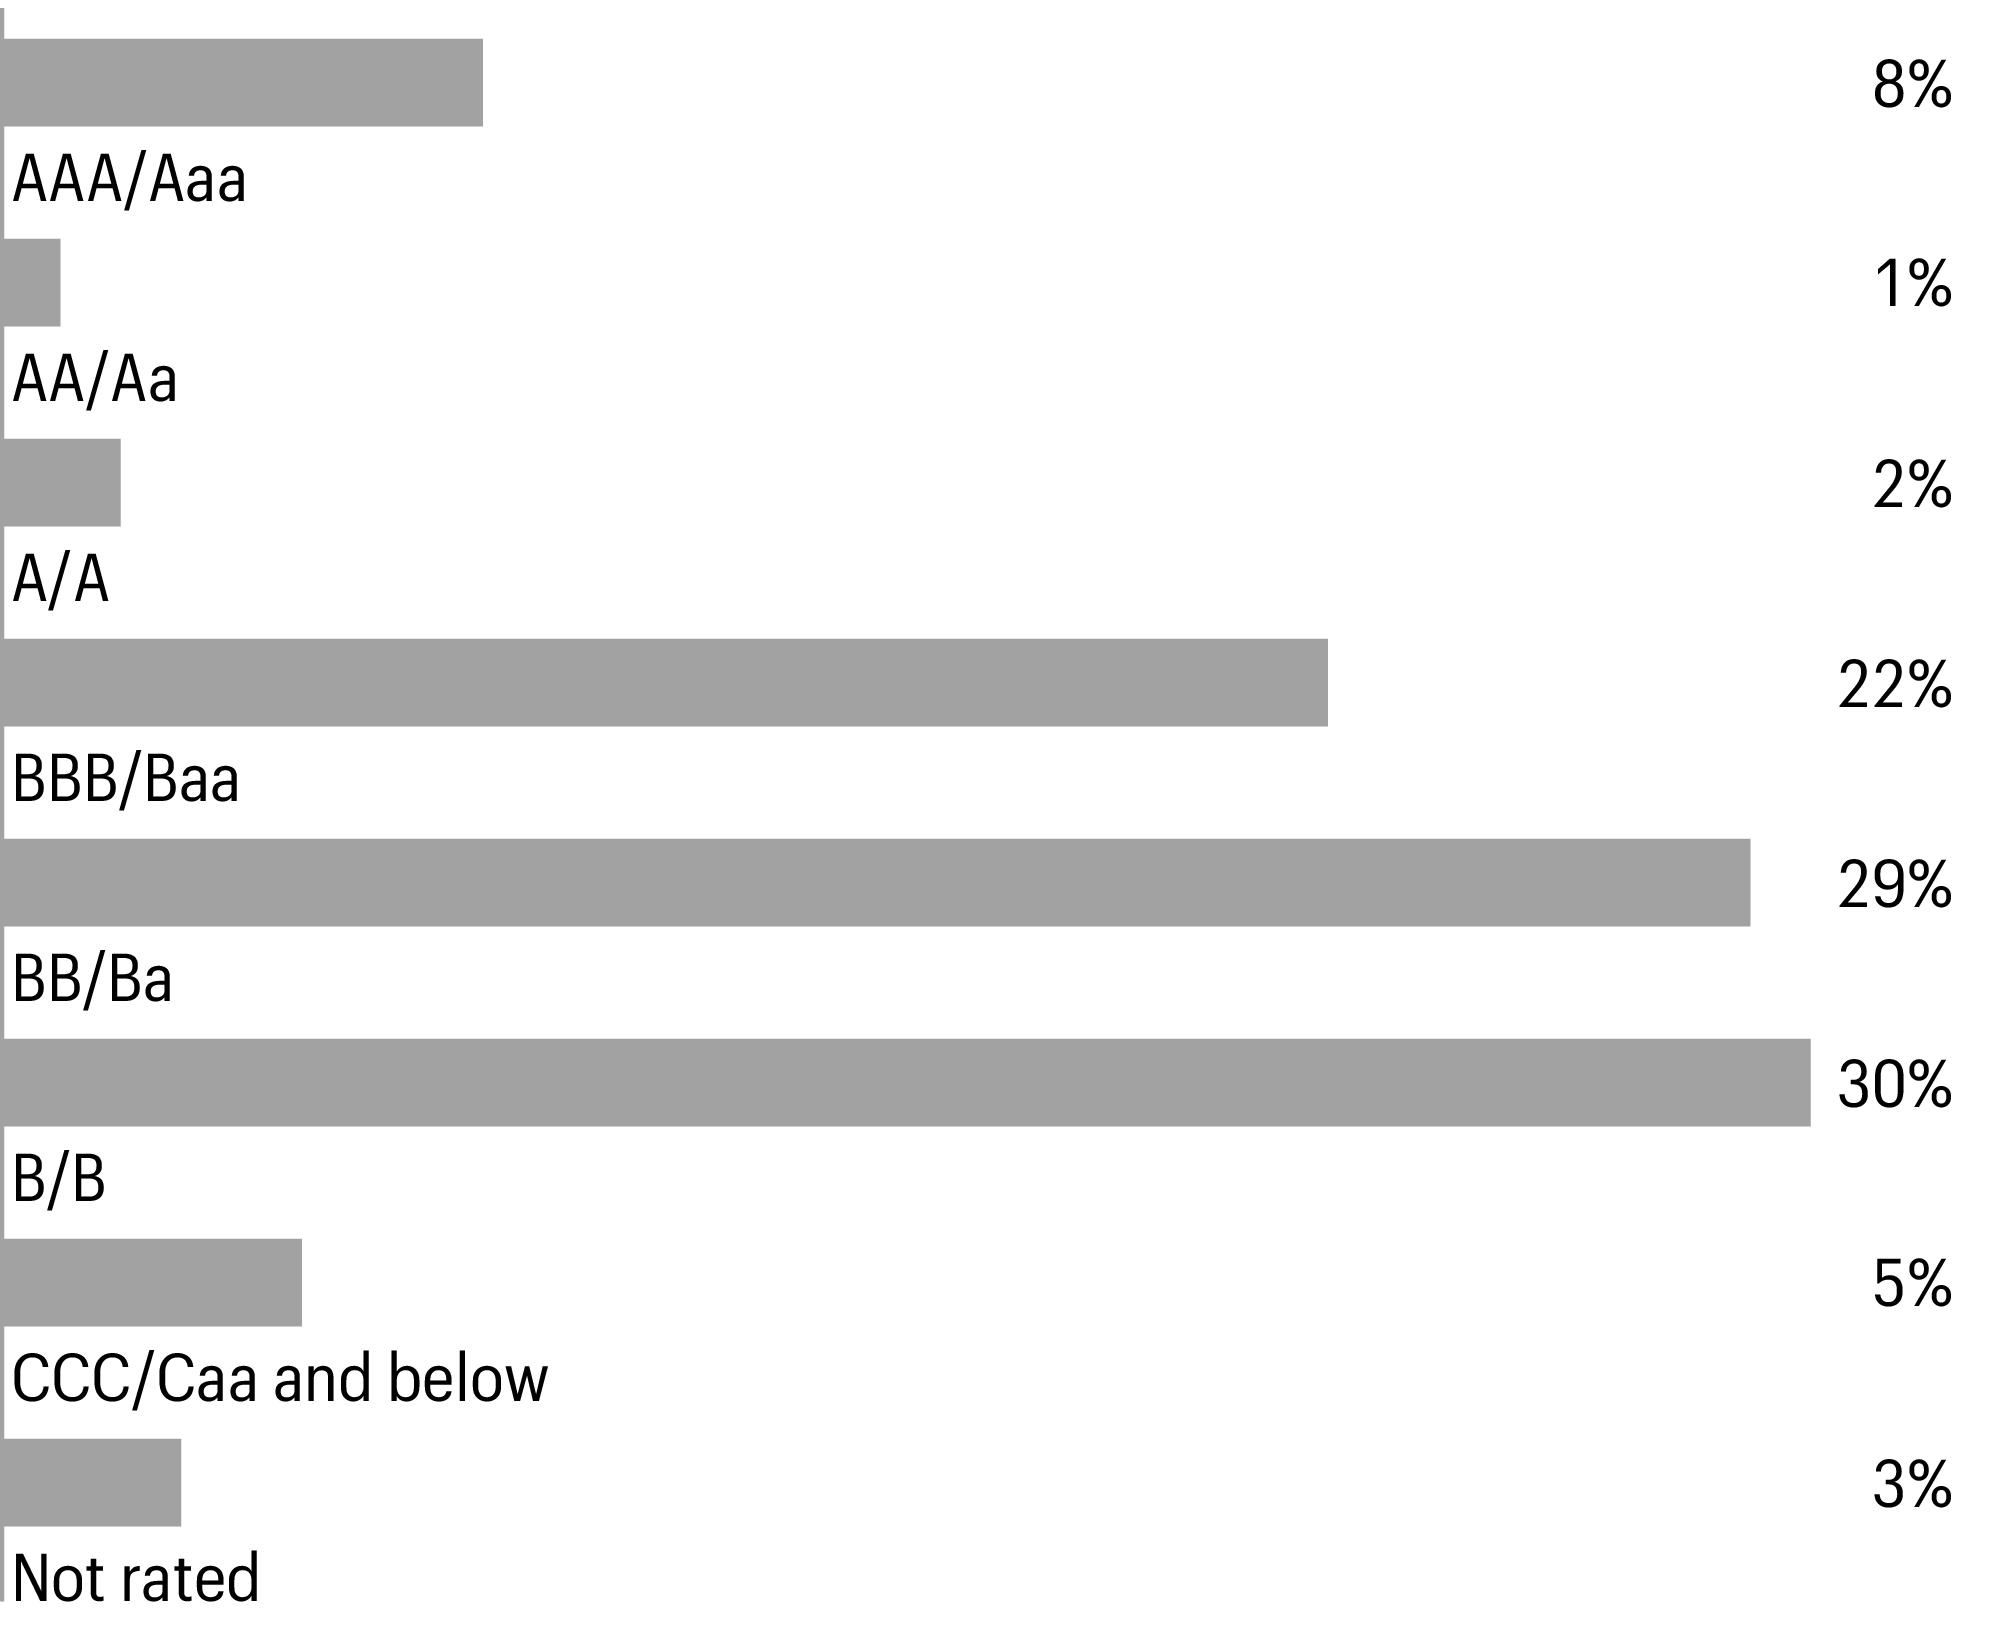
| The credit quality distribution of portfolio holdings reflected in the chart is based on ratings from Standard & Poor’s, Moody’s Investors Service, and/or Fitch Ratings Ltd. Credit quality ratings apply to the underlying holdings of the Fund and not to the Fund itself. The percentages of the portfolio with the ratings depicted in the chart are calculated based on the market value of fixed income securities held by the Fund. If a security was rated by all three rating agencies, the middle rating was utilized. If rated by two of the three rating agencies, the lower rating was utilized, and if rated by one of the rating agencies, that rating was utilized. Standard & Poor’s rates the creditworthiness of bonds, ranging from AAA (highest) to D (lowest). Ratings from A to CCC may be modified by the addition of a plus (+) or minus (-) sign to show relative standing within the rating categories. Standard & Poor’s rates the creditworthiness of short-term notes from SP-1 (highest) to SP-3 (lowest). Moody’s rates the creditworthiness of bonds, ranging from Aaa (highest) to C (lowest). Ratings Aa to B may be modified by the addition of a number 1 (highest) to 3 (lowest) to show relative standing within the ratings categories. Moody’s rates the creditworthiness of short-term U.S. tax-exempt municipal securities from MIG 1/VMIG 1 (highest) to SG (lowest). Fitch rates the creditworthiness of bonds, ranging from AAA (highest) to D (lowest). Credit quality distribution is subject to change and may have changed since the date specified. |
Collateralized loan obligations (CLOs) and asset-backed securities (ABS) contributed along with higher-quality high yield and Eastern European holdings.
Within securitized sectors, the Fund’s allocation to CLOs and esoteric ABS contributed to performance. Within corporate sectors, security selection in the industrials sector contributed.
Allspring Multi-Sector Income Fund | 9
Performance highlights (unaudited)
Since October 2022, as rates have risen and spreads have widened, the high yield bond sleeve reinvested some of its shorter-maturity, higher-quality holdings into a combination of higher-yielding shorter maturities and higher-quality, longer maturities. Cable and satellite and property and casualty insurance were our two best-performing sectors, while our media entertainment and health care holdings were our worst. Fly Leasing and Dish Network were our best-performing individual credits while Resolute Investment Managers and QVC* were the worst.
Eastern European positions were among the best performers in the international bond sleeve over the reporting period, with sovereign bonds in Hungary and Romania rallying significantly. The other top performers were positions in Colombia and Mexico.
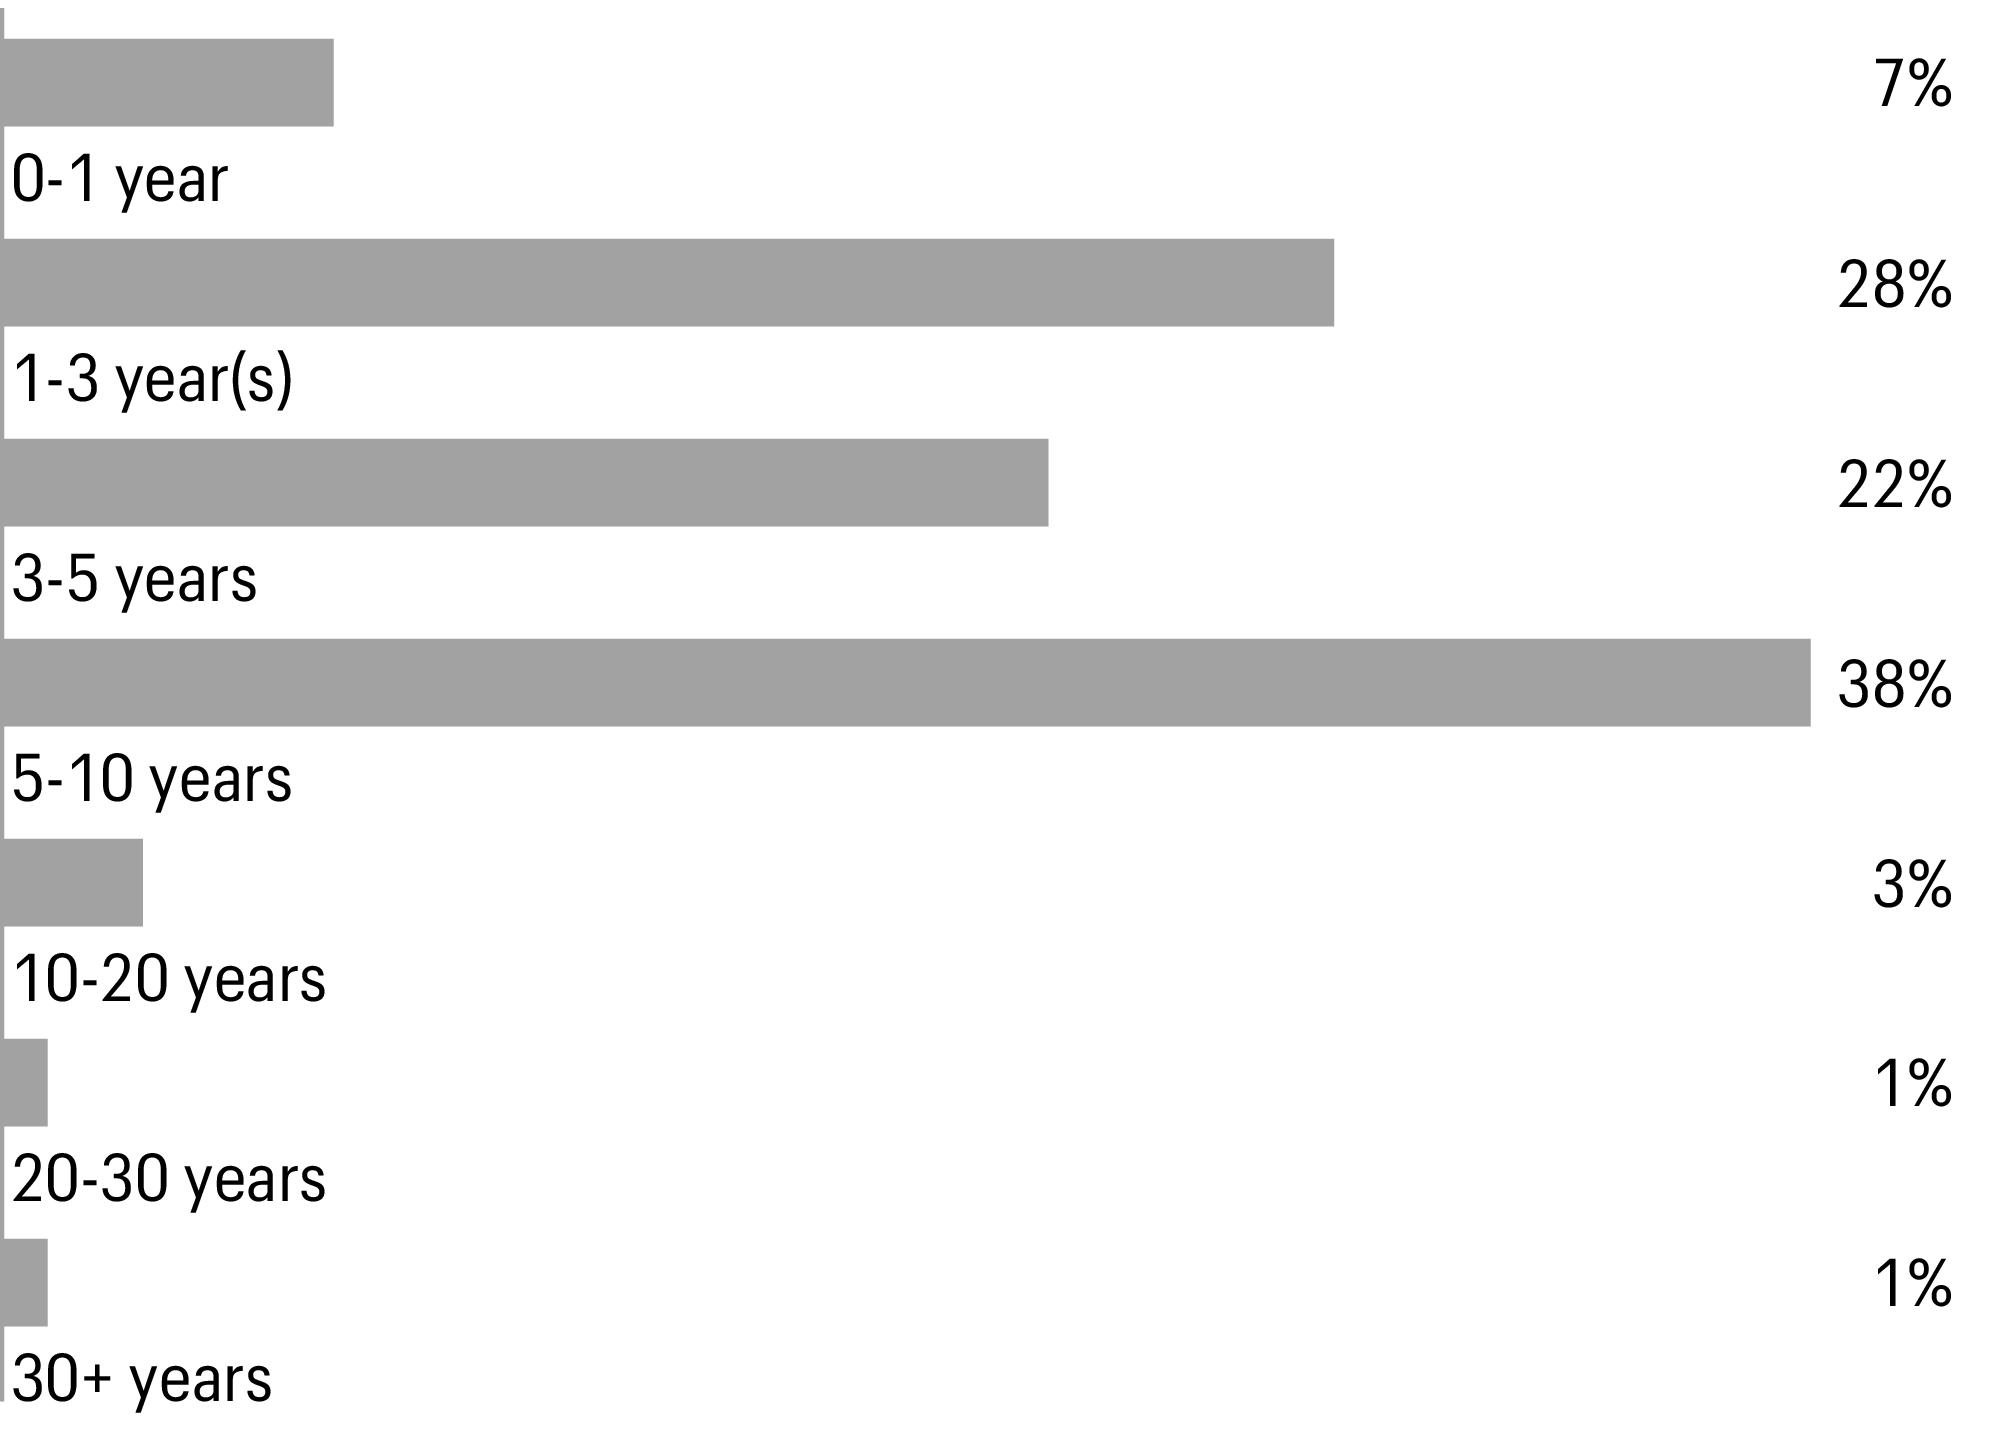
Effective maturity distribution as of April 30, 20231 |
| Figures represent the percentage of the Fund’s fixed-income securities. Allocations are subject to change and may have changed since the date specified. |
Leverage impact
The Fund’s use of leverage through bank borrowings had a positive impact on total return performance during this reporting period as it magnified gains. As of April 30, 2023, the Fund had approximately 30% in leverage as a percent of total assets.
Detractors included BBB-rated CMBS and a mix of international bonds.
Within securitized sectors, the primary detractor was the Fund’s allocation to BBB-rated mezzanine CMBS. An allocation to private-label collateralized mortgage obligations (CMOs) detracted to a smaller extent. In corporate sectors, security selection within financials was the largest detractor.
Among international bonds, the underperformers were a mix of lower-beta** (less volatile) and higher-beta (more volatile) names, with yields in China and South Africa steady and yields in Brazil rising modestly.
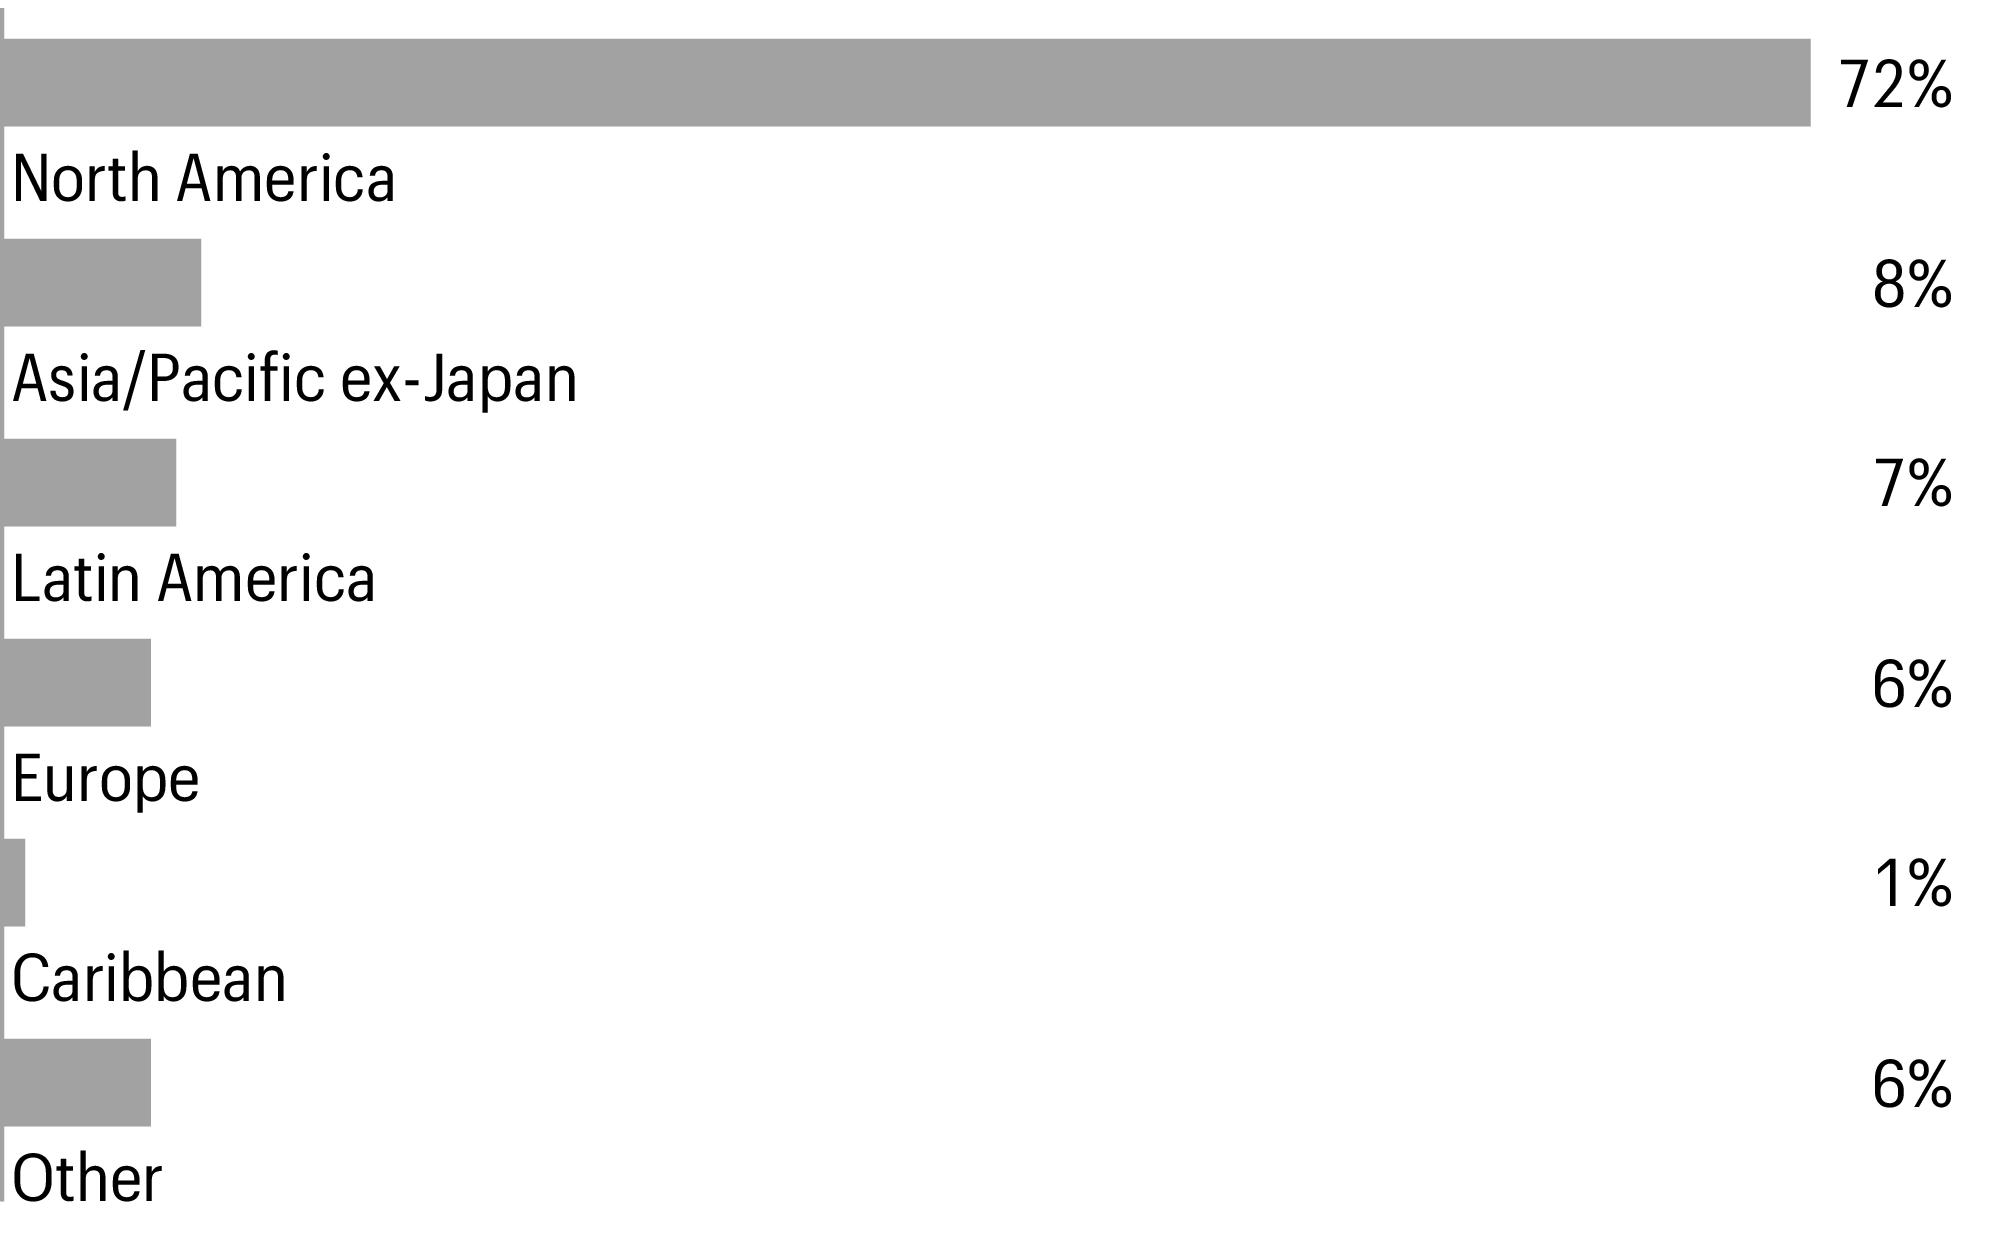
Geographic allocation as of April 30, 20231 |
| Figures represent the percentage of the Fund’s long-term investments. Allocations are subject to change and may have changed since the date specified. |
The outlook is mixed as recession risks climb while the Fed is expected to end rate hikes.
We believe the Fed is close to reaching a terminal federal funds rate with a 25-bp rate hike in May and possibly an additional hike in June. The cumulative impact of monetary policy tightening combined with tightening credit conditions brought on by the recent banking crisis is likely to continue to weigh on economic conditions. Recession risks continue to climb and we believe credit conditions will continue to weaken, pressuring spreads wider as inflation and the Fed’s efforts to combat it remain a substantial challenge for the economy. As a result, the mortgage/corporate credit sleeve may be inclined to move up in quality. Global monetary policy trends will remain a headwind requiring close scrutiny, and as always, we will remain vigilant in our focus on risk given today’s unusual economic and market dynamics.
Within securitized sectors, we see value in certain ABS sectors, mezzanine private-label CMOs, and select CMBS deals. Our outlook has turned more cautious on corporate credit where valuations do not reflect worsening fundamentals.
Approximately 48% of the mortgage/corporate sleeve’s exposure is in corporate credit and 47% is in fixed-rate and floating-rate mortgage securities. The largest industry exposure in the credit sectors remains insurance, banking, and technology, while ABS and CMBS remain the largest weights within the securitized sector.
The Fed hiked rates for what may be the final time this cycle while retaining a hawkish bias. Rates are in restrictive territory and will likely remain higher for longer. The potential for further banking stress or volatility relating to resolution of the debt ceiling crisis remains a near-term risk and will likely keep high yield spreads range-bound until resolved. Significant concerns remain that 500 bps of rate hikes in the past year will precipitate a recession as the effect of tighter monetary policy circulates through the economy.
*
This security was no longer held at the end of the reporting period.
**
Beta measures fund volatility relative to general market movements. It is a standardized measure of systematic risk in comparison with a specified index. The benchmark beta is 1.00 by definition. Beta is based on historical performance and does not represent future results.
10 | Allspring Multi-Sector Income Fund
Performance highlights (unaudited)
High yield spreads would likely move wider in a recession but would have room to rally should inflation normalize and should the economy muddle through. Yields, being near the high end of the post-Global Financial Crisis range, provide a valuation offset to buffer the market. Relative to previous credit cycles, today’s high yield market has more BB-rated and fewer CCC-rated companies. High yield issuers also have stronger balance sheets than in past cycles. In summary, we believe these conditions merit a moderately defensive stance combined with a few opportunistic value ideas incorporated into the portfolio to try to take advantage of the elevated volatility experienced over the past six months.
The outlook for international fixed income is more constructive than it has been for some time, with the relentless 2022 sell-off catapulting yields to levels not seen for quite some time. Growing divergence in domestic macroeconomics could offer relative-value opportunities to investors across the global stage. The months ahead could see more rapid disinflation as base effects from food and energy prices come into play, and this could be supportive for sovereign bonds. Political risk remains something to monitor.
Allspring Multi-Sector Income Fund | 11
Portfolio of investments—April 30, 2023 (unaudited)
| | | | | |
| | | | | | |
FHLMC (5 Year Treasury Constant Maturity +2.11%) ± | | | | | | |
FHLMC (1 Year Treasury Constant Maturity +2.25%) ± | | | | | | |
FHLMC Series 2567 Class FH (1 Month LIBOR +0.40%) ± | | | | | | |
FHLMC Series 2390 Class FD (1 Month LIBOR +0.45%) ± | | | | | | |
| | | | | | |
FNMA Series 1997-20 Class IO ƒ±± | | | | | | |
FNMA Series 2002-77 Class FH (1 Month LIBOR +0.40%) ± | | | | | | |
FNMA Series 2001-57 Class F (1 Month LIBOR +0.50%) ± | | | | | | |
FNMA Series 2002-97 Class FR (1 Month LIBOR +0.55%) ± | | | | | | |
FNMA Series 2001-35 Class F (1 Month LIBOR +0.60%) ± | | | | | | |
FNMA Series 2001-25 Class Z | | | | | | |
| | | | | | |
GNMA Series 2019-H06 Class HI ƒ±± | | | | | | |
| | | | | | |
Total agency securities (Cost $525,259) | | | | | | |
Asset-backed securities: 4.08% | | | | | | |
ABFC Trust Series 2003-AHL1 Class A1 | | | | | | |
ACRES Commercial Realty Ltd. Series 2021-FL2 Class A (1 Month LIBOR +1.40%) 144A± | | | | | | |
Aqua Finance Trust Series 2021-A Class A 144A | | | | | | |
Bear Stearns Asset-Backed Securities Trust Series 2002-2 Class A1 (1 Month LIBOR +0.66%) ± | | | | | | |
BRSP Ltd. Series 2021-FL1 Class A (1 Month LIBOR +1.15%) 144A± | | | | | | |
Centex Home Equity Loan Trust Series 2002-A Class AF6 | | | | | | |
DT Auto Owner Trust Series 2019-2A Class D 144A | | | | | | |
Five Guys Funding LLC Series 2017-1A Class A2 144A | | | | | | |
GSAA Home Equity Trust Series 2004-5 Class AF5 | | | | | | |
HGI CRE CLO Ltd. Series 2021-FL1 Class A (1 Month LIBOR +1.05%) 144A± | | | | | | |
Home Partners Of America Trust Series 2021-1 Class D 144A | | | | | | |
MESA Trust Series 2001-5 Class A (1 Month LIBOR +0.80%) 144A± | | | | | | |
MF1 Ltd. Series 2022-FL8 Class C (30 Day Average U.S. SOFR +2.20%) 144A± | | | | | | |
Mid-State Trust XI Series 11 Class A1 | | | | | | |
New Century Home Equity Loan Trust Series 2004-3 Class M1 (1 Month LIBOR +0.93%) ± | | | | | | |
Octane Receivables Trust Series 2022-1A Class A2 144A | | | | | | |
Parallel Ltd. Series 2021-1A Class D (3 Month LIBOR +3.45%) 144A± | | | | | | |
PFS Financing Corp. Series 2021-A Class A 144A | | | | | | |
Sound Point Clo VIII-R Ltd. Series 2015-1RA Class BR (3 Month LIBOR +1.55%) 144A± | | | | | | |
Starwood Ltd. Series 2022-FL3 Class A (30 Day Average U.S. SOFR +1.35%) 144A± | | | | | | |
The accompanying notes are an integral part of these financial statements.
12 | Allspring Multi-Sector Income Fund
Portfolio of investments—April 30, 2023 (unaudited)
| | | | | |
Asset-backed securities (continued) | | | | | | |
Terwin Mortgage Trust Series TMTS Series 2003-6HE Class A3 (1 Month LIBOR +1.14%) ± | | | | | | |
TRTX Issuer Ltd. Series 2022-FL5 Class A (30 Day Average U.S. SOFR +1.65%) 144A± | | | | | | |
Westgate Resorts LLC Series 2022-1A Class C 144A | | | | | | |
Total asset-backed securities (Cost $11,712,414) | | | | | | |
| | | | | |
| | | | | | |
| | | | | | |
Energy equipment & services: 0.15% | | | | | | |
| | | | | | |
Oil, gas & consumable fuels: 0.18% | | | | | | |
| | | | | | |
| | | | | | |
Mortgage real estate investment trusts (REITs): 0.12% | | | | | | |
Starwood Property Trust, Inc. | | | | | | |
Total common stocks (Cost $853,421) | | | | | | |
| | | | | |
Corporate bonds and notes: 67.70% | | | | | | |
| | | | | | |
| | | | | | |
| | | | | | |
| | | | | | |
| | | | | | |
Clear Channel Outdoor Holdings, Inc. 144A | | | | | | |
Outfront Media Capital LLC/Outfront Media Capital Corp. 144A | | | | | | |
Outfront Media Capital LLC/Outfront Media Capital Corp. 144A | | | | | | |
| | | | | | |
| | | | | | |
| | | | | | |
| | | | | | |
Cablevision Lightpath LLC 144A | | | | | | |
Cablevision Lightpath LLC 144A | | | | | | |
Match Group Holdings II LLC 144A | | | | | | |
Uber Technologies, Inc. 144A | | | | | | |
Uber Technologies, Inc. 144A | | | | | | |
| | | | | | |
| | | | | | |
CCO Holdings LLC/CCO Holdings Capital Corp. 144A | | | | | | |
The accompanying notes are an integral part of these financial statements.
Allspring Multi-Sector Income Fund | 13
Portfolio of investments—April 30, 2023 (unaudited)
| | | | | |
| | | | | | |
CCO Holdings LLC/CCO Holdings Capital Corp. 144A | | | | | | |
CCO Holdings LLC/CCO Holdings Capital Corp. | | | | | | |
CCO Holdings LLC/CCO Holdings Capital Corp. 144A | | | | | | |
CCO Holdings LLC/CCO Holdings Capital Corp. 144A | | | | | | |
Charter Communications Operating LLC/Charter Communications Operating Capital | | | | | | |
| | | | | | |
| | | | | | |
| | | | | | |
Directv Financing LLC/Directv Financing Co.-Obligor, Inc. 144A | | | | | | |
| | | | | | |
Gray Escrow II, Inc. 144A | | | | | | |
Gray Television, Inc. 144A | | | | | | |
| | | | | | |
Scripps Escrow II, Inc. 144A | | | | | | |
Scripps Escrow II, Inc. 144A | | | | | | |
Scripps Escrow, Inc. 144A | | | | | | |
Sirius XM Radio, Inc. 144A | | | | | | |
Townsquare Media, Inc. 144A | | | | | | |
| | | | | | |
Telecommunications: 0.60% | | | | | | |
CommScope Technologies LLC 144A | | | | | | |
| | | | | | |
Sprint Spectrum Co. LLC/Sprint Spectrum Co. II LLC/Sprint Spectrum Co. III LLC 144A | | | | | | |
| | | | | | |
Consumer, cyclical: 12.55% | | | | | | |
| | | | | | |
American Airlines, Inc./AAdvantage Loyalty IP Ltd. 144A | | | | | | |
American Airlines, Inc./AAdvantage Loyalty IP Ltd. 144A | | | | | | |
Hawaiian Airlines Pass-Through Certificates Series 2013-1 Class 1A | | | | | | |
Hawaiian Brand Intellectual Property Ltd./HawaiianMiles Loyalty Ltd. 144A | | | | | | |
Mileage Plus Holdings LLC/Mileage Plus Intellectual Property Assets Ltd. 144A | | | | | | |
Spirit Loyalty Cayman Ltd./Spirit IP Cayman Ltd. 144A | | | | | | |
| | | | | | |
| | | | | | |
| | | | | | |
Auto manufacturers: 2.00% | | | | | | |
Allison Transmission, Inc. 144A | | | | | | |
| | | | | | |
| | | | | | |
The accompanying notes are an integral part of these financial statements.
14 | Allspring Multi-Sector Income Fund
Portfolio of investments—April 30, 2023 (unaudited)
| | | | | |
Auto manufacturers (continued) | | | | | | |
Ford Motor Credit Co. LLC | | | | | | |
Ford Motor Credit Co. LLC | | | | | | |
Ford Motor Credit Co. LLC | | | | | | |
Ford Motor Credit Co. LLC | | | | | | |
| | | | | | |
Auto parts & equipment: 0.29% | | | | | | |
| | | | | | |
Distribution/wholesale: 0.55% | | | | | | |
G-III Apparel Group Ltd. 144A | | | | | | |
| | | | | | |
| | | | | | |
Churchill Downs, Inc. 144A | | | | | | |
Churchill Downs, Inc. 144A | | | | | | |
| | | | | | |
| | | | | | |
| | | | | | |
Live Nation Entertainment, Inc. 144A | | | | | | |
Live Nation Entertainment, Inc. 144A | | | | | | |
Live Nation Entertainment, Inc. 144A | | | | | | |
| | | | | | |
| | | | | | |
Toll Brothers Finance Corp. | | | | | | |
| | | | | | |
| | | | | | |
| | | | | | |
Carnival Holdings Bermuda Ltd. 144A | | | | | | |
| | | | | | |
| | | | | | |
| | | | | | |
| | | | | | |
| | | | | | |
Bath & Body Works, Inc. 144A | | | | | | |
Dave & Buster’s, Inc. 144A | | | | | | |
| | | | | | |
LSF9 Atlantis Holdings LLC/Victra Finance Corp. 144A | | | | | | |
Macy’s Retail Holdings LLC 144A | | | | | | |
Macy’s Retail Holdings LLC 144A | | | | | | |
| | | | | | |
NMG Holding Co., Inc./Neiman Marcus Group LLC 144A | | | | | | |
| | | | | | |
The accompanying notes are an integral part of these financial statements.
Allspring Multi-Sector Income Fund | 15
Portfolio of investments—April 30, 2023 (unaudited)
| | | | | |
| | | | | | |
PetSmart, Inc./PetSmart Finance Corp. 144A | | | | | | |
PetSmart, Inc./PetSmart Finance Corp. 144A | | | | | | |
| | | | | | |
Consumer, non-cyclical: 6.20% | | | | | | |
Commercial services: 4.73% | | | | | | |
Allied Universal Holdco LLC/Allied Universal Finance Corp. 144A | | | | | | |
Allied Universal Holdco LLC/Allied Universal Finance Corp. 144A | | | | | | |
| | | | | | |
MPH Acquisition Holdings LLC 144A | | | | | | |
MPH Acquisition Holdings LLC 144A | | | | | | |
PECF USS Intermediate Holding III Corp. 144A | | | | | | |
Prime Security Services Borrower LLC/Prime Finance, Inc. 144A | | | | | | |
| | | | | | |
| | | | | | |
Service Corp. International | | | | | | |
| | | | | | |
| | | | | | |
Healthcare-services: 1.36% | | | | | | |
| | | | | | |
CHS/Community Health Systems, Inc. 144A | | | | | | |
CHS/Community Health Systems, Inc. 144A | | | | | | |
| | | | | | |
Pediatrix Medical Group, Inc. 144A | | | | | | |
Select Medical Corp. 144A | | | | | | |
| | | | | | |
| | | | | | |
| | | | | | |
| | | | | | |
| | | | | | |
Energy-alternate sources: 2.47% | | | | | | |
Enviva Partners LP/Enviva Partners Finance Corp. 144A | | | | | | |
TerraForm Power Operating LLC 144A | | | | | | |
TerraForm Power Operating LLC 144A | | | | | | |
| | | | | | |
| | | | | | |
Aethon United BR LP/Aethon United Finance Corp. 144A | | | | | | |
| | | | | | |
Encino Acquisition Partners Holdings LLC 144A | | | | | | |
Hilcorp Energy I LP/Hilcorp Finance Co. 144A | | | | | | |
Hilcorp Energy I LP/Hilcorp Finance Co. 144A | | | | | | |
Hilcorp Energy I LP/Hilcorp Finance Co. 144A | | | | | | |
The accompanying notes are an integral part of these financial statements.
16 | Allspring Multi-Sector Income Fund
Portfolio of investments—April 30, 2023 (unaudited)
| | | | | |
| | | | | | |
Hilcorp Energy I LP/Hilcorp Finance Co. 144A | | | | | | |
Hilcorp Energy I LP/Hilcorp Finance Co. 144A | | | | | | |
| | | | | | |
Occidental Petroleum Corp. | | | | | | |
| | | | | | |
| | | | | | |
| | | | | | |
| | | | | | |
Oil & gas services: 2.17% | | | | | | |
Archrock Partners LP/Archrock Partners Finance Corp. 144A | | | | | | |
Archrock Partners LP/Archrock Partners Finance Corp. 144A | | | | | | |
| | | | | | |
Oceaneering International, Inc. | | | | | | |
Oceaneering International, Inc. | | | | | | |
USA Compression Partners LP/USA Compression Finance Corp. | | | | | | |
USA Compression Partners LP/USA Compression Finance Corp. | | | | | | |
| | | | | | |
| | | | | | |
| | | | | | |
| | | | | | |
CQP Holdco LP/BIP-V Chinook Holdco LLC 144A | | | | | | |
| | | | | | |
| | | | | | |
| | | | | | |
EnLink Midstream LLC 144A | | | | | | |
EnLink Midstream LLC 144A | | | | | | |
EnLink Midstream Partners LP | | | | | | |
EnLink Midstream Partners LP | | | | | | |
EQM Midstream Partners LP 144A | | | | | | |
EQM Midstream Partners LP 144A | | | | | | |
Harvest Midstream I LP 144A | | | | | | |
Hess Midstream Operations LP 144A | | | | | | |
| | | | | | |
Plains All American Pipeline LP/PAA Finance Corp. | | | | | | |
Rockies Express Pipeline LLC 144A | | | | | | |
Rockies Express Pipeline LLC 144A | | | | | | |
Tallgrass Energy Partners LP/Tallgrass Energy Finance Corp. 144A | | | | | | |
Tallgrass Energy Partners LP/Tallgrass Energy Finance Corp. 144A | | | | | | |
The accompanying notes are an integral part of these financial statements.
Allspring Multi-Sector Income Fund | 17
Portfolio of investments—April 30, 2023 (unaudited)
| | | | | |
| | | | | | |
Venture Global Calcasieu Pass LLC 144A | | | | | | |
Venture Global Calcasieu Pass LLC 144A | | | | | | |
| | | | | | |
| | | | | | |
| | | | | | |
Citigroup, Inc. Series V (U.S. SOFR +3.23%) ʊ± | | | | | | |
JPMorgan Chase & Co. Series Q (3 Month LIBOR +3.25%) ʊ± | | | | | | |
| | | | | | |
Diversified financial services: 5.04% | | | | | | |
Enact Holdings, Inc. 144A | | | | | | |
| | | | | | |
| | | | | | |
| | | | | | |
| | | | | | |
| | | | | | |
| | | | | | |
| | | | | | |
Oppenheimer Holdings, Inc. | | | | | | |
| | | | | | |
Rocket Mortgage LLC/Rocket Mortgage Co.-Issuer, Inc. 144A | | | | | | |
Rocket Mortgage LLC/Rocket Mortgage Co.-Issuer, Inc. 144A | | | | | | |
| | | | | | |
United Wholesale Mortgage LLC 144A | | | | | | |
United Wholesale Mortgage LLC 144A | | | | | | |
| | | | | | |
| | | | | | |
Allied World Assurance Co. Holdings Ltd. | | | | | | |
| | | | | | |
| | | | | | |
AssuredPartners, Inc. 144A | | | | | | |
| | | | | | |
Brighthouse Financial, Inc. | | | | | | |
BroadStreet Partners, Inc. 144A | | | | | | |
Liberty Mutual Group, Inc. 144A | | | | | | |
| | | | | | |
Prudential Financial, Inc. (3 Month LIBOR +2.38%) ± | | | | | | |
Sammons Financial Group, Inc. 144A | | | | | | |
| | | | | | |
| | | | | | |
| | | | | | |
GLP Capital LP/GLP Financing II, Inc. | | | | | | |
The accompanying notes are an integral part of these financial statements.
18 | Allspring Multi-Sector Income Fund
Portfolio of investments—April 30, 2023 (unaudited)
| | | | | |
| | | | | | |
HAT Holdings I LLC/HAT Holdings II LLC 144A | | | | | | |
HAT Holdings I LLC/HAT Holdings II LLC 144A | | | | | | |
HAT Holdings I LLC/HAT Holdings II LLC 144A | | | | | | |
| | | | | | |
| | | | | | |
Ladder Capital Finance Holdings LLLP/Ladder Capital Finance Corp. 144A | | | | | | |
Ladder Capital Finance Holdings LLLP/Ladder Capital Finance Corp. 144A | | | | | | |
Ladder Capital Finance Holdings LLLP/Ladder Capital Finance Corp. 144A | | | | | | |
MPT Operating Partnership LP/MPT Finance Corp. | | | | | | |
Omega Healthcare Investors, Inc. | | | | | | |
| | | | | | |
| | | | | | |
| | | | | | |
| | | | | | |
| | | | | | |
Starwood Property Trust, Inc. 144A | | | | | | |
Starwood Property Trust, Inc. | | | | | | |
| | | | | | |
| | | | | | |
| | | | | | |
| | | | | | |
| | | | | | |
Spirit AeroSystems, Inc. 144A | | | | | | |
Spirit AeroSystems, Inc. 144A | | | | | | |
| | | | | | |
| | | | | | |
Building materials: 0.60% | | | | | | |
Camelot Return Merger Sub, Inc. 144A | | | | | | |
| | | | | | |
Keysight Technologies, Inc. | | | | | | |
Hand/machine tools: 0.51% | | | | | | |
Werner FinCo LP/Werner FinCo, Inc. 144A | | | | | | |
Machinery-diversified: 0.57% | | | | | | |
Chart Industries, Inc. 144A | | | | | | |
Chart Industries, Inc. 144A | | | | | | |
TK Elevator U.S. Newco, Inc. 144A | | | | | | |
| | | | | | |
Packaging & containers: 1.22% | | | | | | |
Ardagh Metal Packaging Finance USA LLC/Ardagh Metal Packaging Finance PLC 144A | | | | | | |
The accompanying notes are an integral part of these financial statements.
Allspring Multi-Sector Income Fund | 19
Portfolio of investments—April 30, 2023 (unaudited)
| | | | | |
Packaging & containers (continued) | | | | | | |
| | | | | | |
Clearwater Paper Corp. 144A | | | | | | |
Clydesdale Acquisition Holdings, Inc. 144A | | | | | | |
| | | | | | |
Trucking & leasing: 0.94% | | | | | | |
Fortress Transportation & Infrastructure Investors LLC 144A | | | | | | |
Fortress Transportation & Infrastructure Investors LLC 144A | | | | | | |
Fortress Transportation & Infrastructure Investors LLC 144A | | | | | | |
| | | | | | |
| | | | | | |
| | | | | | |
Dell International LLC/EMC Corp. | | | | | | |
| | | | | | |
| | | | | | |
| | | | | | |
| | | | | | |
| | | | | | |
Cloud Software Group, Inc. | | | | | | |
SS&C Technologies, Inc. 144A | | | | | | |
| | | | | | |
| | | | | | |
| | | | | | |
| | | | | | |
NextEra Energy Operating Partners LP 144A | | | | | | |
NSG Holdings LLC/NSG Holdings, Inc. 144A | | | | | | |
Pattern Energy Operations LP/Pattern Energy Operations, Inc. 144A | | | | | | |
| | | | | | |
Vistra Corp. (5 Year Treasury Constant Maturity +5.74%) 144Aʊ± | | | | | | |
Vistra Operations Co. LLC 144A | | | | | | |
Vistra Operations Co. LLC 144A | | | | | | |
| | | | | | |
Total corporate bonds and notes (Cost $198,081,610) | | | | | | |
Foreign corporate bonds and notes: 7.73% | | | | | | |
Government securities: 7.73% | | | | | | |
| | | | | | |
| | | | | | |
European Bank for Reconstruction & Development | | | | | | |
| | | | | | |
The accompanying notes are an integral part of these financial statements.
20 | Allspring Multi-Sector Income Fund
Portfolio of investments—April 30, 2023 (unaudited)
| | | | | |
Multi-national (continued) | | | | | | |
| | | | | | |
| | | | | | |
International Bank for Reconstruction & Development | | | | | | |
International Bank for Reconstruction & Development | | | | | | |
International Bank for Reconstruction & Development | | | | | | |
International Bank for Reconstruction & Development | | | | | | |
International Bank for Reconstruction & Development | | | | | | |
International Bank for Reconstruction & Development | | | | | | |
| | | | | | |
Total foreign corporate bonds and notes (Cost $24,069,371) | | | | | | |
Foreign government bonds: 23.72% | | | | | | |
| | | | | | |
| | | | | | |
| | | | | | |
| | | | | | |
| | | | | | |
| | | | | | |
| | | | | | |
| | | | | | |
| | | | | | |
| | | | | | |
| | | | | | |
| | | | | | |
| | | | | | |
| | | | | | |
Total foreign government bonds (Cost $73,624,370) | | | | | | |
| | | | | | |
| | | | | | |
| | | | | | |
Clear Channel Outdoor Holdings, Inc. (U.S. SOFR 3 Month +3.50%) ± | | | | | | |
| | | | | | |
Arches Buyer, Inc. (U.S. SOFR 1 Month +3.25%) ± | | | | | | |
| | | | | | |
Hubbard Radio LLC (1 Month LIBOR +4.25%) ± | | | | | | |
Telecommunications: 0.80% | | | | | | |
Connect Finco Sarl (1 Month LIBOR +3.50%) ± | | | | | | |
Intelsat Jackson Holdings SA (U.S. SOFR 6 Month +4.50%) ± | | | | | | |
| | | | | | |
The accompanying notes are an integral part of these financial statements.
Allspring Multi-Sector Income Fund | 21
Portfolio of investments—April 30, 2023 (unaudited)
| | | | | |
Consumer, cyclical: 2.82% | | | | | | |
| | | | | | |
American Airlines, Inc. (3 Month LIBOR +4.75%) ˂± | | | | | | |
Mileage Plus Holdings LLC (3 Month LIBOR +5.25%) ± | | | | | | |
SkyMiles IP Ltd. (U.S. SOFR 3 Month +3.75%) ˂± | | | | | | |
| | | | | | |
Auto parts & equipment: 0.07% | | | | | | |
Clarios Global LP (1 Month LIBOR +3.25%) ± | | | | | | |
| | | | | | |
Dave & Buster’s, Inc. (U.S. SOFR 1 Month +5.00%) ± | | | | | | |
PetSmart, Inc. (U.S. SOFR 1 Month +3.75%) ± | | | | | | |
| | | | | | |
Consumer, non-cyclical: 4.43% | | | | | | |
Commercial services: 2.37% | | | | | | |
Allied Universal Holdco LLC (U.S. SOFR 1 Month +3.75%) ± | | | | | | |
Geo Group, Inc. (U.S. SOFR 1 Month +7.13%) ± | | | | | | |
| | | | | | |
| | | | | | |
B&G Foods, Inc. (1 Month LIBOR +2.50%) ˂± | | | | | | |
Healthcare-products: 0.94% | | | | | | |
Bausch & Lomb, Inc. (U.S. SOFR 1 Month +3.25%) ± | | | | | | |
Medline Borrower LP (U.S. SOFR 1 Month +3.25%) ± | | | | | | |
| | | | | | |
Healthcare-services: 0.49% | | | | | | |
Surgery Center Holdings, Inc. (1 Month LIBOR +3.75%) ± | | | | | | |
| | | | | | |
Oil & gas services: 0.66% | | | | | | |
ChampionX Corp. (U.S. SOFR 1 Month +3.25%) ± | | | | | | |
| | | | | | |
AL NGPL Holdings LLC (3 Month LIBOR +3.75%) ± | | | | | | |
GIP II Blue Holding LP (3 Month LIBOR +4.50%) ˂± | | | | | | |
M6 ETX Holdings II Midco LLC (U.S. SOFR 1 Month +4.50%) ± | | | | | | |
NorthRiver Midstream Finance LP (3 Month LIBOR +3.25%) ± | | | | | | |
Prairie ECI Acquiror LP (1 Month LIBOR +4.75%) ± | | | | | | |
Whitewater Whistler Holdings, LLC (U.S. SOFR 1 Month +3.25%) ± | | | | | | |
| | | | | | |
The accompanying notes are an integral part of these financial statements.
22 | Allspring Multi-Sector Income Fund
Portfolio of investments—April 30, 2023 (unaudited)
| | | | | |
| | | | | | |
Diversified financial services: 1.45% | | | | | | |
Resolute Investment Managers, Inc. (3 Month LIBOR +4.25%) ± | | | | | | |
Resolute Investment Managers, Inc. (3 Month LIBOR +8.00%) ౠ| | | | | | |
Russell Investments U.S. Institutional Holdco, Inc. (U.S. SOFR 1 Month +3.50%) ± | | | | | | |
| | | | | | |
| | | | | | |
Asurion LLC (1 Month LIBOR +3.25%) ˂± | | | | | | |
Asurion LLC (1 Month LIBOR +5.25%) ± | | | | | | |
Broadstreet Partners, Inc. (U.S. SOFR 1 Month +4.00%) ˂± | | | | | | |
Hub International Ltd. (U.S. LIBOR 3 Month +4.00%) ± | | | | | | |
| | | | | | |
| | | | | | |
Claros Mortgage Trust, Inc. (U.S. SOFR 1 Month +4.50%) ± | | | | | | |
Starwood Property Trust, Inc. (U.S. SOFR 1 Month +3.25%) ± | | | | | | |
| | | | | | |
| | | | | | |
| | | | | | |
Spirit Aerosystems, Inc. (U.S. SOFR 1 Month +4.50%) ± | | | | | | |
Building materials: 0.65% | | | | | | |
Cornerstone Building Brands, Inc. (U.S. SOFR 1 Month +3.25%) ± | | | | | | |
Environmental control: 0.21% | | | | | | |
MIP V Waste Holdings LLC (1 Month LIBOR +3.25%) ˂± | | | | | | |
Machinery-diversified: 0.40% | | | | | | |
Chart Industries, Inc. (U.S. SOFR 1 Month +3.75%) ± | | | | | | |
Vertical U.S. Newco, Inc. (3 Month LIBOR +3.50%) ± | | | | | | |
| | | | | | |
Metal fabricate/hardware: 0.50% | | | | | | |
Werner FinCo LP (3 Month LIBOR +4.00%) ± | | | | | | |
Packaging & containers: 0.58% | | | | | | |
Clydesdale Acquisition Holdings, Inc. (U.S. SOFR 1 Month +4.18%) ± | | | | | | |
| | | | | | |
| | | | | | |
NCR Corp. (3 Month LIBOR +2.50%) ± | | | | | | |
The accompanying notes are an integral part of these financial statements.
Allspring Multi-Sector Income Fund | 23
Portfolio of investments—April 30, 2023 (unaudited)
| | | | | |
| | | | | | |
Applied Systems, Inc. (U.S. LIBOR 3 Month +4.50%) ˂± | | | | | | |
Athenahealth Group, Inc. (U.S. SOFR 3 Month +3.50%) ± | | | | | | |
Athenahealth Group, Inc. (U.S. SOFR 1 Month +3.50%) ± | | | | | | |
Genesys Cloud Services Holdings II LLC (1 Month LIBOR +4.00%) ˂± | | | | | | |
| | | | | | |
Total loans (Cost $55,535,660) | | | | | | |
Non-agency mortgage-backed securities: 4.30% | | | | | | |
Banc of America Funding Trust Series 2005-5 Class 1A1 | | | | | | |
Banc of America Funding Trust Series 2005-D Class A1 ±± | | | | | | |
Banc of America Mortgage Trust Series 2003-C Class 1A1 ±± | | | | | | |
Bank Series 2017-BNK6 Class D 144A | | | | | | |
BX Trust Series 2022-CLS Class C 144A | | | | | | |
BX Trust Series 2021-ARIA Class A (1 Month LIBOR +0.90%) 144A± | | | | | | |
CHL Mortgage Pass-Through Trust Series 2003-48 Class 2A2 ±± | | | | | | |
Citigroup Commercial Mortgage Trust Series 2012-GC8 Class C 144A±± | | | | | | |
COMM Mortgage Trust Series 2012-LC4 Class C ±± | | | | | | |
Credit Suisse First Boston Mortgage Securities Corp. Series 2002-AR25 Class 1A1 ±± | | | | | | |
Credit Suisse First Boston Mortgage Securities Corp. Series 2003-AR9 Class 2A2 ±± | | | | | | |
Credit Suisse First Boston Mortgage Securities Corp. Series 2003-AR15 Class 3A1 ±± | | | | | | |
CSMC OA LLC Series 2014-USA Class D 144A | | | | | | |
FREMF Mortgage Trust Series 2013-K30 Class B 144A±± | | | | | | |
Global Mortgage Securitization Ltd. Series 2004-A Class A2 (1 Month LIBOR +0.32%) 144A± | | | | | | |
GS Mortgage Securities Corportation Trust Series 2020- DUNE Class D (1 Month LIBOR +1.90%) 144A± | | | | | | |
GS Mortgage Securities Trust Series 2010-C1 Class X 144Aƒ±± | | | | | | |
GS Mortgage Securities Trust Series 2019-GSA1 Class C ±± | | | | | | |
Hudsons Bay Simon JV Trust Series 2015-HB10 Class A10 144A | | | | | | |
JP Morgan Mortgage Trust Series 2004-A3 Class 2A1 ±± | | | | | | |
JP Morgan Mortgage Trust Series 2004-A3 Class 3A3 ±± | | | | | | |
JP Morgan Mortgage Trust Series 2005-A3 Class 11A2 ±± | | | | | | |
JPMBB Commercial Mortgage Securities Trust Series 2013- C17 Class B ±± | | | | | | |
Master Alternative Loans Trust Series 2005-1 Class 5A1 | | | | | | |
MASTR Adjustable Rate Mortgages Trust Series 2003-6 Class 3A1 ±± | | | | | | |
The accompanying notes are an integral part of these financial statements.
24 | Allspring Multi-Sector Income Fund
Portfolio of investments—April 30, 2023 (unaudited)
| | | | | |
Non-agency mortgage-backed securities (continued) | | | | | | |
MASTR Adjustable Rate Mortgages Trust Series 2003-6 Class 4A2 ±± | | | | | | |
MASTR Adjustable Rate Mortgages Trust Series 2004-13 Class 3A7 ±± | | | | | | |
Merrill Lynch Mortgage Investors Trust Series 2003-G Class A2 (6 Month LIBOR +0.68%) ± | | | | | | |
MFA Trust Series 2022-NQM1 Class M1 144A±± | | | | | | |
Morgan Stanley Bank of America Merrill Lynch Trust Series 2013-C7 Class D 144A±± | | | | | | |
Morgan Stanley Bank of America Merrill Lynch Trust Series 2013-C11 Class A4 ±± | | | | | | |
Morgan Stanley Capital I Trust Series 2014-150E Class A 144A | | | | | | |
Morgan Stanley Mortgage Loan Trust Series 2004-4 Class 2A ±± | | | | | | |
Sequoia Mortgage Trust Series 2003-1 Class 1A (1 Month LIBOR +0.76%) ± | | | | | | |
SFAVE Commercial Mortgage Securities Trust Series 2015- 5AVE Class D 144A±± | | | | | | |
Structured Adjustable Rate Mortgage Loan Trust Series 2004-2 Class 2A ±± | | | | | | |
Vendee Mortgage Trust Series 2003-2 Class IO ƒ±± | | | | | | |
Verus Securitization Trust Series 2021-1 Class A2 144A±± | | | | | | |
Washington Mutual MSC Mortgage Pass-Through Certificates Trust Series 2004-RA4 Class 3A | | | | | | |
WFLD Mortgage Trust Series 2014-MONT Class B 144A±± | | | | | | |
Total non-agency mortgage-backed securities (Cost $13,733,435) | | | | | | |
| | | | | |
| | | | | | |
Communication services: 0.00% | | | | | | |
Diversified telecommunication services: 0.00% | | | | | | |
Intelsat Jackson Holdings SA Series A Contingent Value Rights ♦† | | | | | | |
Intelsat Jackson Holdings SA Series B Contingent Value Rights ♦† | | | | | | |
| | | | | | |
| | | | | |
Yankee corporate bonds and notes: 10.58% | | | | | | |
| | | | | | |
| | | | | | |
| | | | | | |
The accompanying notes are an integral part of these financial statements.
Allspring Multi-Sector Income Fund | 25
Portfolio of investments—April 30, 2023 (unaudited)
| | | | | |
| | | | | | |
| | | | | | |
Telecommunications: 0.00% | | | | | | |
Intelsat Jackson Holdings SA ♦† | | | | | | |
Consumer, cyclical: 4.05% | | | | | | |
| | | | | | |
Air Canada Pass-Through Trust Series 2020-1 Class C 144A | | | | | | |
Auto parts & equipment: 0.19% | | | | | | |
Adient Global Holdings Ltd. 144A | | | | | | |
| | | | | | |
Genm Capital Labuan Ltd. 144A | | | | | | |
| | | | | | |
| | | | | | |
| | | | | | |
| | | | | | |
| | | | | | |
Royal Caribbean Cruises Ltd. 144A | | | | | | |
Royal Caribbean Cruises Ltd. 144A | | | | | | |
Royal Caribbean Cruises Ltd. 144A | | | | | | |
Royal Caribbean Cruises Ltd. 144A | | | | | | |
Royal Caribbean Cruises Ltd. 144A | | | | | | |
| | | | | | |
| | | | | | |
1011778 BC ULC/New Red Finance, Inc. 144A | | | | | | |
Consumer, non-cyclical: 0.93% | | | | | | |
| | | | | | |
Grifols Escrow Issuer SA 144A | | | | | | |
| | | | | | |
Teva Pharmaceutical Finance Netherlands III BV | | | | | | |
Teva Pharmaceutical Finance Netherlands III BV | | | | | | |
Teva Pharmaceutical Finance Netherlands III BV | | | | | | |
| | | | | | |
| | | | | | |
| | | | | | |
Northriver Midstream Finance LP 144A | | | | | | |
| | | | | | |
| | | | | | |
| | | | | | |
The accompanying notes are an integral part of these financial statements.
26 | Allspring Multi-Sector Income Fund
Portfolio of investments—April 30, 2023 (unaudited)
| | | | | |
| | | | | | |
Macquarie Group Ltd. (U.S. SOFR +2.21%) 144A± | | | | | | |
NatWest Group PLC (5 Year Treasury Constant Maturity +2.35%) ± | | | | | | |
| | | | | | |
Diversified financial services: 0.93% | | | | | | |
Castlelake Aviation Finance DAC 144A | | | | | | |
Macquarie Airfinance Holdings Ltd. | | | | | | |
| | | | | | |
| | | | | | |
Fairfax Financial Holdings Ltd. | | | | | | |
Sompo International Holdings Ltd. | | | | | | |
| | | | | | |
| | | | | | |
| | | | | | |
Sensata Technologies BV 144A | | | | | | |
Sensata Technologies BV 144A | | | | | | |
| | | | | | |
Trucking & leasing: 0.63% | | | | | | |
| | | | | | |
| | | | | | |
| | | | | | |
Broadcom Corp./Broadcom Cayman Finance Ltd. | | | | | | |
| | | | | | |
| | | | | | |
| | | | | | |
| | | | | | |
| | | | | | |
Total yankee corporate bonds and notes (Cost $31,249,561) | | | | | | |
Yankee government bonds: 0.27% | | | | | | |
Trinidad & Tobago Government International Bonds 144A | | | | | | |
Total yankee government bonds (Cost $747,452) | | | | | | |
The accompanying notes are an integral part of these financial statements.
Allspring Multi-Sector Income Fund | 27
Portfolio of investments—April 30, 2023 (unaudited)
| | | | | |
Short-term investments: 3.66% | | | | | | |
Investment companies: 3.66% | | | | | | |
Allspring Government Money Market Fund Select Class ♠∞## | | | | | | |
Total short-term investments (Cost $10,083,703) | | | | | | |
Total investments in securities (Cost $420,216,256) | | | | | | |
Other assets and liabilities, net | | | | | | |
| | | | | | |
| Variable rate investment. The rate shown is the rate in effect at period end. |
| Investment in an interest-only security that entitles holders to receive only the interest payments on the underlying mortgages. The principal amount shown is the notional amount of the underlying mortgages. The rate represents the coupon rate. |
| The coupon of the security is adjusted based on the principal and/or interest payments received from the underlying pool of mortgages as well as the credit quality and the actual prepayment speed of the underlying mortgages. The rate shown is the rate in effect at period end. |
| The security may be resold in transactions exempt from registration, normally to qualified institutional buyers, pursuant to Rule 144A under the Securities Act of 1933. |
| Non-income-earning security |
| Security is perpetual in nature and has no stated maturity date. The date shown reflects the next call date. |
| All or a portion of this security is segregated for unfunded loans. |
| All or a portion of the position represents an unfunded loan commitment. The rate represents the current interest rate if the loan is partially funded. |
| Security is valued using significant unobservable inputs. |
| The security is fair valued in accordance with Allspring Funds Management’s valuation procedures, as the Board-designated valuation designee. |
| The issuer of the security is an affiliated person of the Fund as defined in the Investment Company Act of 1940. |
| The rate represents the 7-day annualized yield at period end. |
|
| |
| |
| |
| Federal Home Loan Mortgage Corporation |
| Federal National Mortgage Association |
| Government National Mortgage Association |
| |
| |
| |
| London Interbank Offered Rate |
| |
| |
| Real estate investment trust |
| |
| Secured Overnight Financing Rate |
| |
Investments in affiliates
An affiliated investment is an investment in which the Fund owns at least 5% of the outstanding voting shares of the issuer or as a result of other relationships, such as the Fund and the issuer having the same adviser or investment manager. Transactions with issuers that were affiliates of the Fund at the end of the period were as follows:
| | | | | Net
change in
unrealized
gains
(losses) | | | Income
from
affiliated
securities |
| | | | | | | | |
Allspring Government Money Market Fund Select Class | | | | | | | | |
The accompanying notes are an integral part of these financial statements.
28 | Allspring Multi-Sector Income Fund
Statement of assets and liabilities—April 30, 2023 (unaudited)
Financial statements
Statement of assets and liabilities
| |
Investments in unaffiliated securities, at value (cost $410,132,553) | |
Investments in affiliated securities, at value (cost $10,083,703) | |
| |
Foreign currency, at value (cost $113,062) | |
Receivable for dividends and interest | |
Receivable for investments sold | |
Principal paydown receivable | |
Prepaid expenses and other assets | |
| |
| |
Secured borrowing payable | |
Payable for investments purchased | |
| |
| |
Administration fee payable | |
Trustees’ fees and expenses payable | |
Accrued expenses and other liabilities | |
| |
| |
| |
| |
| |
| |
Net asset value per share | |
Based on $275,569,039 divided by 28,066,291 shares issued and outstanding (100,000,000 shares authorized) | |
The accompanying notes are an integral part of these financial statements.
Allspring Multi-Sector Income Fund | 29
Statement of operations—six months ended April 30, 2023 (unaudited)
Statement of operations
| |
Interest (net of foreign withholding taxes of $74,558) | |
Income from affiliated securities | |
| |
| |
| |
| |
| |
Custody and accounting fees | |
| |
Shareholder report expenses | |
Trustees’ fees and expenses | |
| |
| |
| |
| |
| |
Realized and unrealized gains (losses) on investments | |
Net realized gains (losses) on | |
| |
Foreign currency and foreign currency translations | |
Net realized losses on investments | |
Net change in unrealized gains (losses) on | |
| |
Foreign currency and foreign currency translations | |
Net change in unrealized gains (losses) on investments | |
Net realized and unrealized gains (losses) on investments | |
Net increase in net assets resulting from operations | |
The accompanying notes are an integral part of these financial statements.
30 | Allspring Multi-Sector Income Fund
Statement of changes in net assets
Statement of changes in net assets
| Six months ended
April 30, 2023
(unaudited) | Year ended
October 31, 2022 |
| | | | |
| | | | |
Net realized losses on investments | | | | |
Net change in unrealized gains (losses) on investments | | | | |
Net increase (decrease) in net assets resulting from operations | | | | |
Distributions to shareholders from | | | | |
Net investment income and net realized gains | | | | |
Tax basis return of capital | | | | |
Total distributions to shareholders | | | | |
Capital share transactions | | | | |
Net asset value of common shares issued under the Automatic Dividend Reinvestment Plan | | | | |
Cost of shares repurchased | | | | |
Net increase (decrease) from capital share transactions | | | | |
Total increase (decrease) in net assets | | | | |
| | | | |
| | | | |
| | | | |
The accompanying notes are an integral part of these financial statements.
Allspring Multi-Sector Income Fund | 31
Statement of cash flows—six months ended April 30, 2023 (unaudited)
Statement of cash flows
Cash flows from operating activities | |
Net increase in net assets resulting from operations | |
Adjustments to reconcile net increase in net assets from operations to net cash provided by operating activities | |
Purchases of long-term securities | |
Proceeds from the sales of long-term securities | |
| |
| |
Purchases and sales of short-term securities, net | |
Increase in receivable for investments sold | |
Decrease in principal paydown receivable | |
Increase in receivable for dividends and interest | |
Increase in prepaid expenses and other assets | |
Increase in payable for investments purchased | |
Decrease in trustees’ fees and expenses payable | |
Decrease in advisory fee payable | |
Decrease in administration fees payable | |
Decrease in accrued expenses and other liabilities | |
Proceeds from foreign currency transactions | |
Net realized losses on unaffiliated securities | |
Net realized gains on foreign currency and foreign currency translations | |
Net change in unrealized gains (losses) on unaffiliated securities | |
Net change in unrealized gain (losses) on foreign currency and foreign currency translations | |
Net cash provided by operating activities | |
Cash flows from financing activities | |
| |
Net cash used in financing activities | |
| |
Cash (including foreign currency) | |
| |
| |
Supplemental cash disclosure | |
| |
Supplemental non-cash financing disclosure | |
Reinvestment of dividends | |
The accompanying notes are an integral part of these financial statements.
32 | Allspring Multi-Sector Income Fund
Financial highlights
(For a share outstanding throughout each period)
| Six months ended
April 30, 2023
(unaudited) | |
| | | | | |
Net asset value, beginning of period | | | | | | |
| | | | | | |
Net realized and unrealized gains (losses) on investments | | | | | | |
Total from investment operations | | | | | | |
Distributions to shareholders from | | | | | | |
| | | | | | |
Tax basis return of capital | | | | | | |
Total distributions to shareholders | | | | | | |
Anti-dilutive effect of shares repurchased | | | | | | |
Net asset value, end of period | | | | | | |
Market value, end of period | | | | | | |
Total return based on market value3 | | | | | | |
Ratios to average net assets (annualized) | | | | | | |
| | | | | | |
| | | | | | |
| | | | | | |
| | | | | | |
Net assets, end of period (000s omitted) | | | | | | |
Borrowings outstanding, end of period (000s omitted) | | | | | | |
Asset coverage per $1,000 of borrowing, end of period | | | | | | |
| Ratios include interest expense relating to interest associated with borrowings and/or leverage transactions as follows: |
Six months ended April 30, 2023 (unaudited) | |
Year ended October 31, 2022 | |
Year ended October 31, 2021 | |
Year ended October 31, 2020 | |
Year ended October 31, 2019 | |
Year ended October 31, 2018 | |
| Calculated based upon average shares outstanding |
| Amount is less than $0.005. |
| Total return is calculated assuming a purchase of common stock on the first day and a sale on the last day of the period reported. Dividends and distributions, if any, are assumed for purposes of these calculations to be reinvested at prices obtained under the Fund’s Automatic Dividend Reinvestment Plan. Total return does not reflect brokerage commissions that a shareholder would pay on the purchase and sale of shares. |
The accompanying notes are an integral part of these financial statements.
Allspring Multi-Sector Income Fund | 33
Notes to financial statements (unaudited)
Notes to financial statements
Allspring Multi-Sector Income Fund (the “Fund”) was organized as a statutory trust under the laws of the state of Delaware on April 10, 2003 and is registered as a diversified closed-end management investment company under the Investment Company Act of 1940, as amended (the “1940 Act”). As an investment company, the Fund follows the accounting and reporting guidance in Financial Accounting Standards Board (“FASB”) Accounting Standards Codification Topic 946, Financial Services – Investment Companies.
2.
SIGNIFICANT ACCOUNTING POLICIES
The following significant accounting policies, which are consistently followed in the preparation of the financial statements of the Fund, are in conformity with U.S. generally accepted accounting principles which require management to make estimates and assumptions that affect the reported amounts of assets and liabilities, disclosure of contingent assets and liabilities at the date of the financial statements, and the reported amounts of income and expenses during the reporting period. Actual results could differ from those estimates.
Securities valuation
All investments are valued each business day as of the close of regular trading on the New York Stock Exchange (generally 4 p.m. Eastern Time), although the Funds may deviate from this calculation time under unusual or unexpected circumstances.
Debt securities are valued at the evaluated bid price provided by an independent pricing service (e.g. taking into account various factors, including yields, maturities, or credit ratings) or, if a reliable price is not available, the quoted bid price from an independent broker-dealer.
Equity securities that are listed on a foreign or domestic exchange or market are valued at the official closing price or, if none, the last sales price.
The values of securities denominated in foreign currencies are translated into U.S. dollars at rates provided by an independent foreign currency pricing source at a time each business day specified by the Valuation Committee at Allspring Funds Management, LLC (“Allspring Funds Management”).
Investments in registered open-end investment companies (other than those listed on a foreign or domestic exchange or market) are valued at net asset value.
Investments which are not valued using any of the methods discussed above are valued at their fair value, as determined in good faith by Allspring Funds Management, which was named the valuation designee by the Board of Trustees. As the valuation designee, Allspring Funds Management is responsible for day-to-day valuation activities for the Allspring Funds. In connection with these responsibilities, Allspring Funds Management has established a Valuation Committee and has delegated to it the authority to take any actions regarding the valuation of portfolio securities that the Valuation Committee deems necessary or appropriate, including determining the fair value of portfolio securities. On a quarterly basis, the Board of Trustees receives reports of valuation actions taken by the Valuation Committee. On at least an annual basis, the Board of Trustees receives an assessment of the adequacy and effectiveness of Allspring Funds Management’s process for determining the fair value of the portfolio of investments.
Foreign currency translation
The accounting records of the Fund are maintained in U.S. dollars. The values of other assets and liabilities denominated in foreign currencies are translated into U.S. dollars at rates provided by an independent foreign currency pricing source at a time each business day specified by the Valuation Committee. Purchases and sales of securities, and income and expenses are converted at the rate of exchange on the respective dates of such transactions. Net realized foreign exchange gains or losses arise from sales of foreign currencies, currency gains or losses realized between the trade and settlement dates on securities transactions, and the difference between the amounts of dividends, interest and foreign withholding taxes recorded and the U.S. dollar equivalent of the amounts actually paid or received. Net unrealized foreign exchange gains and losses arise from changes in the fair value of assets and liabilities other than investments in securities resulting from changes in exchange rates. The changes in net assets arising from changes in exchange rates of securities and the changes in net assets resulting from changes in market prices of securities are not separately presented. Such changes are included in net realized and unrealized gains or losses from investments.
When-issued transactions
The Fund may purchase securities on a forward commitment or when-issued basis. The Fund records a when-issued transaction on the trade date and will segregate assets in an amount at least equal in value to the Fund’s commitment to purchase when-issued securities. Securities purchased on a when-issued basis are marked-to-market daily and the Fund begins earning interest on the settlement date. Losses may arise due to changes in the market value of the underlying securities or if the counterparty does not perform under the contract.
Loans
The Fund may invest in direct debt instruments which are interests in amounts owed to lenders by corporate or other borrowers. The loans pay interest at rates which are periodically reset by reference to a base lending rate plus a spread. Investments in loans may be in the form of participations in loans or assignments of all or a portion of loans from third parties. When the Fund purchases participations, it generally has no rights to enforce compliance with the terms of the loan agreement with the borrower. As a result, the Fund assumes the credit risk of both the borrower and the lender that is selling the
34 | Allspring Multi-Sector Income Fund
Notes to financial statements (unaudited)
participation. When the Fund purchases assignments from lenders, it acquires direct rights against the borrower on the loan and may enforce compliance by the borrower with the terms of the loan agreement. Loans may include fully funded term loans or unfunded loan commitments, which are contractual obligations for future funding.
Security transactions and income recognition
Securities transactions are recorded on a trade date basis. Realized gains or losses are recorded on the basis of identified cost.
Interest income is accrued daily and bond discounts are accreted and premiums are amortized daily. To the extent debt obligations are placed on non-accrual status, any related interest income may be reduced by writing off interest receivables when the collection of all or a portion of interest has been determined to be doubtful based on consistently applied procedures and the fair value has decreased. If the issuer subsequently resumes interest payments or when the collectability of interest is reasonably assured, the debt obligation is removed from non-accrual status. Paydown gains and losses are included in interest income.
Dividend income is recognized on the ex-dividend date.
Income is recorded net of foreign taxes withheld where recovery of such taxes is not assured.
Distributions to shareholders
Under a managed distribution plan, the Fund pays monthly distributions to shareholders at an annual minimum fixed rate of 8% based on the Fund’s average monthly net asset value per share over the prior 12 months. The monthly distributions may be sourced from income, paid-in capital, and/or capital gains, if any. To the extent that sufficient investment income is not available on a monthly basis, the Fund may distribute paid-in capital and/ or capital gains, if any, in order to maintain its managed distribution level.
Distributions to shareholders from net investment income and net realized gains, if any, are recorded on the ex-dividend date. Such distributions are determined in accordance with income tax regulations and may differ from U.S. generally accepted accounting principles. Dividend sources are estimated at the time of declaration. The tax character of distributions is determined as of the Fund’s fiscal year end. Therefore, a portion of the Fund’s distributions made prior to the Fund’s fiscal year end may be categorized as a tax return of capital at year end.
Federal and other taxes
The Fund intends to continue to qualify as a regulated investment company by distributing substantially all of its investment company taxable income and any net realized capital gains (after reduction for capital loss carryforwards) sufficient to relieve it from all, or substantially all, federal income taxes. Accordingly, no provision for federal income taxes was required.
The Fund’s income and federal excise tax returns and all financial records supporting those returns for the prior three fiscal years are subject to examination by the federal and Delaware revenue authorities. Management has analyzed the Fund’s tax positions taken on federal, state, and foreign tax returns, as applicable, for all open tax years and does not believe that there are any uncertain tax positions that require recognition of a tax liability.
As of April 30, 2023, the aggregate cost of all investments for federal income tax purposes was $422,595,175 and the unrealized gains (losses) consisted of:
As of October 31, 2022, the Fund had capital loss carryforwards which consisted of $17,651,068 in short-term capital losses and $36,224,903 in long-term capital losses.
3.
FAIR VALUATION MEASUREMENTS
Fair value measurements of investments are determined within a framework that has established a fair value hierarchy based upon the various data inputs utilized in determining the value of the Fund’s investments. The three-level hierarchy gives the highest priority to unadjusted quoted prices in active markets for identical assets or liabilities (Level 1) and the lowest priority to unobservable inputs (Level 3). The Fund’s investments are classified within the fair value hierarchy based on the lowest level of input that is significant to the fair value measurement. The inputs are summarized into three broad levels as follows:
•Level 1—quoted prices in active markets for identical securities
•Level 2—other significant observable inputs (including quoted prices for similar securities, interest rates, prepayment speeds, credit risk, etc.)
•Level 3—significant unobservable inputs (including the Fund’s own assumptions in determining the fair value of investments)
The inputs or methodologies used for valuing investments in securities are not necessarily an indication of the risk associated with investing in those securities.
Allspring Multi-Sector Income Fund | 35
Notes to financial statements (unaudited)
The following is a summary of the inputs used in valuing the Fund’s assets and liabilities as of April 30, 2023:
| | Other significant
observable inputs
(Level 2) | Significant
unobservable inputs
(Level 3) | |
| | | | |
| | | | |
| | | | |
| | | | |
| | | | |
| | | | |
| | | | |
Corporate bonds and notes | | | | |
Foreign corporate bonds and notes | | | | |
| | | | |
| | | | |
Non-agency mortgage-backed securities | | | | |
| | | | |
| | | | |
Yankee corporate bonds and notes | | | | |
| | | | |
| | | | |
| | | | |
| | | | |
Additional sector, industry or geographic detail, if any, is included in the Portfolio of Investments.
For the six months ended April 30, 2023, the Fund had no material transfers into/out of Level 3.
4.
TRANSACTIONS WITH AFFILIATES
Advisory fee
Allspring Funds Management, a wholly owned subsidiary of Allspring Global Investments Holdings, LLC, a holding company indirectly owned by certain private funds of GTCR LLC and Reverence Capital Partners, L.P., is the adviser to the Fund and is entitled to receive a fee at an annual rate of 0.55% of the Fund’s average daily total assets. Total assets consist of the net assets of the Fund plus borrowings or other leverage for investment purposes to the extent excluded in calculating net assets.
Allspring Funds Management has retained the services of subadvisers to provide daily portfolio management to the Fund. The fee for subadvisory services is borne by Allspring Funds Management. Allspring Global Investments, LLC, an affiliate of Allspring Funds Management and a wholly owned subsidiary of Allspring Global Investments Holdings, LLC, is a subadviser to the Fund and is entitled to receive a fee from Allspring Funds Management at an annual rate of 0.30% of the Fund’s average daily total assets. Allspring Global Investments (UK) Limited, an affiliate of Allspring Funds Management and wholly owned subsidiary of Allspring Global Investments Holdings, LLC, is also a subadviser to the Fund and is entitled to receive a fee from Allspring Funds Management at an annual rate of 0.10% of the Fund’s average daily total assets.
Administration fee
Allspring Funds Management also serves as the administrator to the Fund, providing the Fund with a wide range of administrative services necessary to the operation of the Fund. Allspring Funds Management is entitled to receive an annual administration fee from the Fund equal to 0.05% of the Fund’s average daily total assets.
Interfund transactions
The Fund may purchase or sell portfolio investment securities to certain affiliates pursuant to Rule 17a-7 under the 1940 Act and under procedures adopted by the Board of Trustees. The procedures have been designed to ensure that these interfund transactions, which do not incur broker commissions, are effected at current market prices.
5.
CAPITAL SHARE TRANSACTIONS
The Fund has authorized capital of 100,000,000 shares with no par value. For the six months ended April 30, 2023 and year ended October 31, 2022, the Fund issued 18,979 and 34,494 shares, respectively.
Under an open-market share repurchase program (the “Buyback Program”), the Fund is authorized to repurchase up to 5% of its outstanding shares in open market transactions. The Fund’s Board of Trustees has delegated to Allspring Funds Management full discretion to administer the Buyback Program
36 | Allspring Multi-Sector Income Fund
Notes to financial statements (unaudited)
including the determination of the amount and timing of repurchases in accordance with the best interests of the Fund and subject to applicable legal limitations. During the six months ended April 30, 2023, the Fund did not repurchase any of its shares under the open-market share repurchase program. During the year ended October 31, 2022, the Fund purchased 71,217 of its shares on the open market at a total cost of $674,908.
The Fund has borrowed $119,000,000 through a revolving credit facility administered by a major financial institution (the “Facility”). The Facility has a commitment amount of up to $119,000,000. The Fund is charged interest at the 1 Month Secured Overnight Financing Rate (SOFR) plus a spread and a commitment fee based on the unutilized amount of the commitment amount. The financial institution holds a security interest in all the assets of the Fund as collateral for the borrowing. Based on the nature of the terms of the Facility and comparative market rates, the carrying amount of the borrowings at April 30, 2023 approximates its fair value. If measured at fair value, the borrowings would be categorized as a Level 2 under the fair value hierarchy.
During the six months ended April 30, 2023, the Fund had average borrowings outstanding of $119,000,000 (on an annualized basis)at an average interest rate of 5.16% and recorded interest in the amount of $3,045,151, which represents 2.25% of its average daily net assets (on an annualized basis).
7.
INVESTMENT PORTFOLIO TRANSACTIONS
Purchases and sales of investments, excluding U.S. government obligations (if any) and short-term securities, for the six months ended April 30, 2023 were $90,893,543 and $75,424,359, respectively.
As of April 30, 2023, the Fund had the following unfunded loan commitments:
| | |
American Airlines, Inc., 10.00%, 4-20-2028 | | |
Applied Systems, Inc., 9.40%, 9-18-2026 | | |
Asurion LLC, 8.27%, 12-23-2026 | | |
B&G Foods, Inc., 7.52%, 10-10-2026 | | |
Broadstreet Partners, Inc., 8.99%, 4-27-2029 | | |
Genesys Cloud Services Holdings II LLC, 9.02%, 12-1-2027 | | |
GIP II Blue Holding LP, 9.66%, 9-29-2028 | | |
MIP V Waste Holdings LLC, 8.27%, 12-8-2028 | | |
SkyMiles IP Ltd., 8.80%, 10-20-2027 | | |
| | |
Under the Fund’s organizational documents, the officers and Trustees have been granted certain indemnification rights against certain liabilities that may arise out of performance of their duties to the Fund. The Fund has entered into a separate agreement with each Trustee that converts indemnification rights currently existing under the Fund’s organizational documents into contractual rights that cannot be changed in the future without the consent of the Trustee. Additionally, in the normal course of business, the Fund may enter into contracts with service providers that contain a variety of indemnification clauses. The Fund’s maximum exposure under these arrangements is dependent on future claims that may be made against the Fund and, therefore, cannot be estimated.
9.
SUBSEQUENT DISTRIBUTIONS
Under the managed distribution plan, the Fund declared the following distributions to common shareholders:
These distributions are not reflected in the accompanying financial statements.
Allspring Multi-Sector Income Fund | 37
Other information (unaudited)
Other information
Proxy voting information
A description of the policies and procedures used to determine how to vote proxies relating to portfolio securities is available without charge, upon request, by calling 1-800-222-8222, visiting our website at allspringglobal.com, or visiting the SEC website at sec.gov. Information regarding how the proxies related to portfolio securities were voted during the most recent 12-month period ended June 30 is available on the website at allspringglobal.com or by visiting the SEC website at sec.gov.
Annual meeting of shareholders
On February 6, 2023, an Annual Meeting of Shareholders for the Fund was held to consider the following proposal. The results of the proposal are indicated below.
Proposal 1 – Election of trustees:
Quarterly portfolio holdings information
The Fund files its complete schedule of portfolio holdings with the SEC for the first and third quarters of each fiscal year as an exhibit to its reports on Form N-PORT. Shareholders may view the filed Form N-PORT by visiting the SEC website at sec.gov.
Delaware statutory trust act – control share acquisitions
Because the Fund is organized as a Delaware statutory trust, it is subject to the control share acquisition statute (the “Control Share Statute”) contained in Subchapter III of the Delaware Statutory Trust Act (the “DSTA”), which became automatically applicable to listed closed-end funds, such as the Fund, upon its effective date of August 1, 2022 (the “Effective Date”).
The Control Share Statute provides for a series of voting power thresholds above which shares are considered control shares. The first such threshold is 10% or more, but less than 15%, of all voting power. Voting power is defined by the Control Share Statute as the power to directly or indirectly exercise or direct the exercise of the voting power of Fund shares in the election of trustees. Whether a voting power threshold is met is determined by aggregating the holdings of the acquirer as well as those of its “associates,” as defined by the Control Share Statute.
Once a threshold is reached, an acquirer has no voting rights under the DSTA or the governing documents of the Fund with respect to shares acquired in excess of that threshold (i.e., the “control shares”) unless approved by shareholders or exempted by the Fund’s Board of Trustees. Approval by shareholders requires the affirmative vote of two-thirds of all votes entitled to be cast on the matter, excluding shares held by the acquirer and its associates as well as shares held by certain insiders of the Fund. The Control Share Statute provides procedures for an acquirer to request a shareholder meeting for the purpose of considering whether voting rights shall be accorded to control shares. Further approval by the Fund’s shareholders would be required with respect to additional acquisitions of control shares above the next applicable threshold level. In addition, the Fund’s Board of Trustees is permitted, but not obligated to, exempt specific acquisitions or classes of acquisitions of control shares, either in advance or retroactively.
The Control Share Statute does not retroactively apply to acquisitions of shares that occurred prior to the Effective Date. However, such shares will be aggregated with any shares acquired after the Effective Date for purposes of determining whether a voting power threshold is exceeded, resulting in the newly acquired shares constituting control shares.
The Control Share Statute requires shareholders to disclose to the Fund any control share acquisition within 10 days of such acquisition and, upon request, to provide any information that the Fund’s Board of Trustees reasonably believes is necessary or desirable to determine whether a control share acquisition has occurred.
The foregoing is only a summary of certain aspects of the Control Share Statute. Shareholders should consult their own legal counsel to determine the application of the Control Share Statute with respect to their shares of the Fund and any subsequent acquisitions of shares.
38 | Allspring Multi-Sector Income Fund
Other information (unaudited)
BOARD OF TRUSTEES AND OFFICERS
The following table provides basic information about the Board of Trustees (the “Trustees”) and Officers of the Fund. Each of the Trustees and Officers listed below acts in identical capacities for each fund in the Allspring family of funds, which consists of 127 mutual funds comprising the Allspring Funds Trust, Allspring Variable Trust, Allspring Master Trust, and four closed-end funds, including the Fund (collectively the “Fund Complex”). The mailing address of each Trustee and Officer is 1415 Vantage Park Drive, 3rd Floor, Charlotte, NC 28203. The Board of Trustees is classified into three classes of which one is elected annually. Each Trustee serves a three-year term concurrent with the class from which the Trustee is elected. Each Officer serves an indefinite term.
Independent Trustees
| | Principal occupations during past five years or longer | Current other
public company or
investment
company
directorships |
Class I - Non-Interested Trustees to serve until 2026 Annual Meeting of Shareholders |
Isaiah Harris, Jr.
(Born 1952) | Trustee,
since 2010;
Audit Committee Chair,
since 2019 | Retired. Member of the Advisory Board of CEF of East Central Florida. Chairman of the Board of CIGNA Corporation from 2009 to 2021, and Director from 2005 to 2008. From 2003 to 2011, Director of Deluxe Corporation. Prior thereto, President and CEO of BellSouth Advertising and Publishing Corp. from 2005 to 2007, President and CEO of BellSouth Enterprises from 2004 to 2005 and President of BellSouth Consumer Services from 2000 to 2003. Emeritus member of the Iowa State University Foundation Board of Governors. Emeritus Member of the Advisory Board of Iowa State University School of Business. Advisory Board Member, Palm Harbor Academy (private school). Advisory Board Member, Fellowship of Christian Athletes. Mr. Harris is a certified public accountant (inactive status). | |
David F. Larcker
(Born 1950) | | Distinguished Visiting Fellow at the Hoover Institution since 2022. James Irvin Miller Professor of Accounting at the Graduate School of Business (Emeritus), Stanford University, Director of the Corporate Governance Research Initiative and Senior Faculty of The Rock Center for Corporate Governance since 2006. From 2005 to 2008, Professor of Accounting at the Graduate School of Business, Stanford University. Prior thereto, Ernst & Young Professor of Accounting at The Wharton School, University of Pennsylvania from 1985 to 2005. | |
Olivia S. Mitchell
(Born 1953) | Trustee,
since 2010;
Nominating and Governance Committee Chair,
since 2018 | International Foundation of Employee Benefit Plans Professor since 1993, Wharton School of the University of Pennsylvania. Director of Wharton’s Pension Research Council and Boettner Center on Pensions & Retirement Research, and Research Associate at the National Bureau of Economic Research. Previously taught at Cornell University from 1978 to 1993. | |
Class II - Non-Interested Trustees to serve until 2024 Annual Meeting of Shareholders |
William R. Ebsworth
(Born 1957) | | Retired. From 1984 to 2013, equities analyst, portfolio manager, research director and chief investment officer at Fidelity Management and Research Company in Boston, Tokyo, and Hong Kong, and retired in 2013 as Chief Investment Officer of Fidelity Strategic Advisers, Inc. where he led a team of investment professionals managing client assets. Prior thereto, Board member of Hong Kong Securities Clearing Co., Hong Kong Options Clearing Corp., the Thailand International Fund, Ltd., Fidelity Investments Life Insurance Company, and Empire Fidelity Investments Life Insurance Company. Audit Committee Chair and Investment Committee Chair of the Vincent Memorial Hospital Foundation (non-profit organization). Mr. Ebsworth is a CFA charterholder. | |
Jane A. Freeman
(Born 1953) | Trustee,
since 2015;
Chair Liaison,
since 2018 | Retired. From 2012 to 2014 and 1999 to 2008, Chief Financial Officer of Scientific Learning Corporation. From 2008 to 2012, Ms. Freeman provided consulting services related to strategic business projects. Prior to 1999, Portfolio Manager at Rockefeller & Co. and Scudder, Stevens & Clark. Board member of the Harding Loevner Funds from 1996 to 2014, serving as both Lead Independent Director and chair of the Audit Committee. Board member of the Russell Exchange Traded Funds Trust from 2011 to 2012 and the chair of the Audit Committee. Ms. Freeman is also an inactive Chartered Financial Analyst. | |
Allspring Multi-Sector Income Fund | 39
Other information (unaudited)
| Position held and length of service* | Principal occupations during past five years or longer | Current other public company or investment company directorships |
Class III - Non-Interested Trustees to serve until 2025 Annual Meeting of Shareholders |
Timothy J. Penny
(Born 1951) | Trustee,
since 2010;
Chair,
since 2018 | President and Chief Executive Officer of Southern Minnesota Initiative Foundation, a non-profit organization, since 2007. Vice Chair of the Economic Club of Minnesota, since 2007. Co-Chair of the Committee for a Responsible Federal Budget, since 1995. Member of the Board of Trustees of NorthStar Education Finance, Inc., a non-profit organization, from 2007-2022. Senior Fellow of the University of Minnesota Humphrey Institute from 1995 to 2017. | |
James G. Polisson
(Born 1959) | | Retired. Chief Marketing Officer, Source (ETF) UK Services, Ltd, from 2015 to 2017. From 2012 to 2015, Principal of The Polisson Group, LLC, a management consulting, corporate advisory and principal investing company. Chief Executive Officer and Managing Director at Russell Investments, Global Exchange Traded Funds from 2010 to 2012. Managing Director of Barclays Global Investors from 1998 to 2010 and Global Chief Marketing Officer for iShares and Barclays Global Investors from 2000 to 2010. Trustee of the San Francisco Mechanics’ Institute, a non- profit organization, from 2013 to 2015. Board member of the Russell Exchange Traded Fund Trust from 2011 to 2012. Director of Barclays Global Investors Holdings Deutschland GmbH from 2006 to 2009. Mr. Polisson is an attorney and has a retired status with the Massachusetts and District of Columbia Bar Associations. | |
Pamela Wheelock
(Born 1959) | Trustee,
since January 2020;
previously Trustee from
January 2018 to
July 2019 | Retired. Executive and Senior Financial leadership positions in the public, private and nonprofit sectors. Interim President and CEO, McKnight Foundation, 2020. Interim Commissioner, Minnesota Department of Human Services, 2019. Chief Operating Officer, Twin Cities Habitat for Humanity, 2017-2019. Vice President for University Services, University of Minnesota, 2012- 2016. Interim President and CEO, Blue Cross and Blue Shield of Minnesota, 2011-2012. Executive Vice-President and Chief Financial Officer, Minnesota Wild, 2002-2008. Commissioner, Minnesota Department of Finance, 1999-2002. Chair of the Board of Directors of Destination Medical Center Corporation. Board member of the Minnesota Wild Foundation. | |
| Length of service dates reflect the Trustee’s commencement of service with the Trust’s predecessor entities, where applicable. |
40 | Allspring Multi-Sector Income Fund
Other information (unaudited)
Officers1
| Position held and
length of service | Principal occupations during past five years or longer |
| | President and Chief Executive Officer of Allspring Funds Management, LLC since 2017 and Head of Global Fund Governance of Allspring Global Investments since 2022. Prior thereto, co-president of Galliard Capital Management, LLC, an affiliate of Allspring Funds Management, LLC, from 2019 to 2022 and Head of Affiliated Managers, Allspring Global Investments, from 2014 to 2019 and Executive Vice President responsible for marketing, investments and product development for Allspring Funds Management, LLC, from 2009 to 2014. |
Jeremy DePalma
(Born 1974) | Treasurer,
since 2012
(for certain funds in
the Fund Complex);
since 2021 (for
the remaining funds in the Fund Complex) | Senior Vice President of Allspring Funds Management, LLC since 2009. Senior Vice President of Evergreen Investment Management Company, LLC from 2008 to 2010 and head of the Fund Reporting and Control Team within Fund Administration from 2005 to 2010. |
Christopher Baker
(Born 1976) | Chief Compliance Officer,
since 2022 | Global Chief Compliance Officer for Allspring Global Investments since 2022. Prior thereto, Chief Compliance Officer for State Street Global Advisors from 2018 to 2021. Senior Compliance Officer for the State Street divisions of Alternative Investment Solutions, Sector Solutions, and Global Marketing from 2015 to 2018. From 2010 to 2015 Vice President, Global Head of Investment and Marketing Compliance for State Street Global Advisors. |
Matthew Prasse
(Born 1983) | Chief Legal Officer,
since 2022;
Secretary,
since 2021 | Senior Counsel of the Allspring Legal Department since 2021. Senior Counsel of the Wells Fargo Legal Department from 2018 to 2021. Previously, Counsel for Barings LLC from 2015 to 2018. Prior to joining Barings, Associate at Morgan, Lewis & Bockius LLP from 2008 to 2015. |
1 For those Officers with tenures at Allspring Global Investments and/or Allspring Funds Management, LLC that began prior to 2021, such tenures include years of service during which these businesses/entities were known as Wells Fargo Asset Management and Wells Fargo Funds Management, LLC, respectively.
Allspring Multi-Sector Income Fund | 41
Automatic dividend reinvestment plan
AUTOMATIC DIVIDEND REINVESTMENT PLAN
All common shareholders are eligible to participate in the Automatic Dividend Reinvestment Plan (“the Plan”). Pursuant to the Plan, unless a common shareholder is ineligible or elects otherwise, all cash dividends and capital gains distributions are automatically reinvested by Computershare Trust Company, N.A., as agent for shareholders in administering the Plan (“Plan Agent”), in additional common shares of the Fund. Whenever the Fund declares an ordinary income dividend or a capital gain dividend (collectively referred to as “dividends”) payable either in shares or in cash, nonparticipants in the Plan will receive cash, and participants in the Plan will receive the equivalent in common shares. The shares are acquired by the Plan Agent for the participant’s account, depending upon the circumstances described below, either (i) through receipt of additional unissued but authorized common shares from the Fund (“newly issued common shares”) or (ii) by purchase of outstanding common shares on the open-market (open-market purchases) on the NYSE Amex or elsewhere. If, on the payment date for any dividend or distribution, the net asset value per share of the common shares is equal to or less than the market price per common share plus estimated brokerage commissions (“market premium”), the Plan Agent will invest the amount of such dividend or distribution in newly issued shares on behalf of the participant. The number of newly issued common shares to be credited to the participant’s account will be determined by dividing the dollar amount of the dividend by the net asset value per share on the date the shares are issued, provided that the maximum discount from the then current market price per share on the date of issuance may not exceed 5%. If on the dividend payment date the net asset value per share is greater than the market value (“market discount”), the Plan Agent will invest the dividend amount in shares acquired on behalf of the participant in open-market purchases. There will be no brokerage charges with respect to shares issued directly by the Fund as a result of dividends or capital gains distributions payable either in shares or in cash. However, each participant will pay a pro rata share of brokerage commissions incurred with respect to the Plan Agent’s open-market purchases in connection with the reinvestment of dividends. The automatic reinvestment of dividends and distributions will not relieve participants of any federal, state or local income tax that may be payable (or required to be withheld) on such dividends. All correspondence concerning the Plan should be directed to the Plan Agent at P.O. Box 505000, Louisville, Kentucky 40233 or by calling 1-800-730-6001.
42 | Allspring Multi-Sector Income Fund
This page is intentionally left blank.
This page is intentionally left blank.
Transfer Agent, Registrar, Shareholder Servicing
Agent & Dividend Disbursing Agent
Computershare Trust Company, N.A.
P.O. Box 505000
Louisville, Kentucky 40233
1-800-730-6001
Website: allspringglobal.com
Allspring Global InvestmentsTM is the trade name for the asset management firms of Allspring Global Investments Holdings, LLC, a holding company indirectly owned by certain private funds of GTCR LLC and Reverence Capital Partners, L.P. These firms include but are not limited to Allspring Global Investments, LLC, and Allspring Funds Management, LLC. Certain products managed by Allspring entities are distributed by Allspring Funds Distributor, LLC (a broker-dealer and Member FINRA/SIPC).
This material is for general informational and educational purposes only and is NOT intended to provide investment advice or a recommendation of any kind - including a recommendation for any specific investment, strategy, or plan.
© 2023 Allspring Global Investments Holdings, LLC. All rights reserved.
ALL-05052023-uibl2tzt 06-23
SAR159 04-23
ITEM 2. CODE OF ETHICS
Not applicable.
ITEM 3. AUDIT COMMITTEE FINANCIAL EXPERT
Not applicable.
ITEM 4. PRINCIPAL ACCOUNTANT FEES AND SERVICES
Not applicable.
ITEM 5. AUDIT COMMITTEE OF LISTED REGISTRANTS
Not applicable.
ITEM 6. INVESTMENTS
A Portfolio of Investments for Allspring Multi-Sector Income Fund is included as part of the report to shareholders filed under Item 1 of this Form.
ITEM 7. DISCLOSURE OF PROXY VOTING POLICIES AND PROCEDURES FOR CLOSED-END MANAGEMENT INVESTMENT COMPANIES
Not applicable.
ITEM 8. PORTFOLIO MANAGERS OF CLOSED-END MANAGEMENT INVESTMENT COMPANIES PORTFOLIO MANAGERS
Not applicable.
ITEM 9. PURCHASES OF EQUITY SECURITIES BY CLOSED-END MANAGEMENT INVESTMENT COMPANY AND AFFILIATED PURCHASERS
| | | | | | | | | | | | | | | | |
Period | | (a) Total
Number of
Shares
Purchased | | | (b)
Average
Price Paid
per Share | | | (c) Total
Number of
Shares
Purchased as
Part of Publicly
Announced
Plans or
Programs | | | (d) Maximum
Number of Shares
that May Yet Be
Purchased Under
the Plans or
Programs | |
11/1/2022 to 11/30/2022 | | | 0 | | | | 0 | | | | 0 | | | | 2,737,991 | |
12/1/2022 to 12/31/2022 | | | 0 | | | | 0 | | | | 0 | | | | 2,737,991 | |
1/1/2023 to 1/31/2023 | | | 0 | | | | 0 | | | | 0 | | | | 1,402,608 | |
2/1/2023 to 2/28/2023 | | | 0 | | | | 0 | | | | 0 | | | | 1,402,608 | |
3/1/2023 to 3/31/2023 | | | 0 | | | | 0 | | | | 0 | | | | 1,402,608 | |
4/1/2023 to 4/30/2023 | | | 0 | | | | 0 | | | | 0 | | | | 1,402,608 | |
Total | | | 0 | | | | 0 | | | | 0 | | | | 1,402,608 | |
3
On November 16, 2022, the Fund announced a renewal of its open-market share repurchase program (the “Buyback Program”). Under the renewed Buyback Program, the Fund may repurchase up to 5% of its outstanding shares in open market transactions during the period beginning on January 1, 2023 and ending on December 31, 2023. The Fund’s Board of Trustees has delegated to Allspring Funds Management, LLC, the Fund’s adviser, discretion to administer the Buyback Program, including the determination of the amount and timing of repurchases in accordance with the best interests of the Fund and subject to applicable legal limitations.
ITEM 10. SUBMISSION OF MATTERS TO A VOTE OF SECURITY HOLDERS
There have been no material changes to the procedures by which shareholders may recommend nominees to the registrant’s Board of Trustees that have been implemented since the registrant’s last provided disclosure in response to the requirements of this Item.
ITEM 11. CONTROLS AND PROCEDURES
(a) The President and Treasurer have concluded that the Allspring Multi-Sector Income Fund (the “Fund”) disclosure controls and procedures (as defined in Rule 30a-3(c) under the Investment Company Act of 1940) provide reasonable assurances that material information relating to the Fund is made known to them by the appropriate persons based on their evaluation of these controls and procedures as of a date within 90 days of the filing of this report.
(b) There were no significant changes in the Fund’s internal controls over financial reporting (as defined in Rule 30a-3(d) under the Investment Company Act of 1940) that occurred during the most recent fiscal half-year of the period covered by this report that materially affected, or is reasonably likely to materially affect, the registrant’s internal control over financial reporting.
ITEM 12. DISCLOSURES OF SECURITIES LENDING ACTIVITES FOR CLOSED-END MANAGEMENT INVESTMENT COMPANIES
Not applicable.
ITEM 13. EXHIBITS
(a)(1) Not applicable.
(a)(2) Certifications pursuant to Section 302 of the Sarbanes-Oxley Act of 2002.
(a)(3) Not applicable.
(a)(4) Not applicable.
(b) Certifications pursuant to Section 906 of the Sarbanes-Oxley Act of 2002.
4
SIGNATURES
Pursuant to the requirements of the Securities Exchange Act of 1934 and the Investment Company Act of 1940, the registrant has duly caused this report to be signed on its behalf by the undersigned, thereunto duly authorized.
| | |
| Allspring Multi-Sector Income Fund |
| |
| By: | | /s/ Andrew Owen |
| | Andrew Owen |
| | President |
|
| Date: June 27, 2023 |
Pursuant to the requirements of the Securities Exchange Act of 1934 and the Investment Company Act of 1940, this report has been signed below by the following persons on behalf of the registrant and in the capacities and on the date indicated.
| | |
| Allspring Multi-Sector Income Fund |
| |
| By: | | /s/ Andrew Owen |
| | Andrew Owen |
| | President |
|
| Date: June 27, 2023 |
| |
| By: | | /s/ Jeremy DePalma |
| | Jeremy DePalma |
| | Treasurer |
|
| Date: June 27, 2023 |