UNITED STATES SECURITIES AND EXCHANGE COMMISSION
Washington, D.C. 20549
FORM N-CSR
CERTIFIED SHAREHOLDER REPORT OF REGISTERED MANAGEMENT
INVESTMENT COMPANIES
| Investment Company Act file number: | 811-21335 |
| |
| Exact name of registrant as specified in charter: | Optimum Fund Trust |
| |
| Address of principal executive offices: | 610 Market Street |
| Philadelphia, PA 19106 |
| |
| Name and address of agent for service: | David F. Connor, Esq. |
| 610 Market Street |
| Philadelphia, PA 19106 |
| |
| Registrant’s telephone number, including area code: | (800) 523-1918 |
| |
| Date of fiscal year end: | March 31 |
| |
| Date of reporting period: | March 31, 2021 |
Table of Contents
Item 1. Reports to Stockholders

Annual report
Optimum Fixed Income Fund
Optimum International Fund
Optimum Large Cap Growth Fund
Optimum Large Cap Value Fund
Optimum Small-Mid Cap Growth Fund
Optimum Small-Mid Cap Value Fund
March 31, 2021
Beginning on or about June 1, 2021, as permitted by regulations adopted by the Securities and Exchange Commission, paper copies of your Fund’s shareholder reports will no longer be sent to you by mail, unless you specifically request them from the Fund or from your financial intermediary, such as a broker/dealer, bank, or insurance company. Instead, you will be notified by mail each time a report is posted on the website and provided with a link to access the report. If you have already elected to receive shareholder reports electronically, you will not be affected by this change and you do not need to take any action. You may elect to receive paper copies of all future shareholder reports free of charge. You can inform the Fund that you wish to continue receiving paper copies of your shareholder reports by contacting us at 800 914-0278. If you own these shares through a financial intermediary, you may contact your financial intermediary to elect to continue to receive paper copies of your shareholder reports. Your election to receive reports in paper will apply to all funds held with the Optimum Funds or your financial intermediary. |
Carefully consider the Funds’ investment objectives, risk factors, charges, and expenses before investing. This and other information can be found in the Funds’ prospectus and their summary prospectuses, which may be obtained by visiting optimummutualfunds.com/literature or calling 800 914-0278. Investors should read the prospectus and, if available, the summary prospectus carefully before investing.
Table of Contents
Table of contents
Other than Macquarie Bank Limited (MBL), none of the entities noted are authorized deposit-taking institutions for the purposes of the Banking Act 1959 (Commonwealth of Australia). The obligations of these entities do not represent deposits or other liabilities of MBL. MBL does not guarantee or otherwise provide assurance in respect of the obligations of these entities, unless noted otherwise.
The Funds are governed by US laws and regulations.
Unless otherwise noted, views expressed herein are current as of March 31, 2021, and subject to change for events occurring after such date.
The Funds are not FDIC insured and are not guaranteed. It is possible to lose the principal amount invested.
Macquarie Investment Management (MIM) is the marketing name for certain companies comprising the asset management division of Macquarie Group. Investment products and advisory services are distributed and offered by and referred through affiliates which include Delaware Distributors, L.P., a registered broker/dealer and member of the Financial Industry Regulatory Authority (FINRA) and Macquarie Investment Management Business Trust (MIMBT), a Securities and Exchange Commission (SEC)-registered investment advisor. Investment advisory services are provided by a series of MIMBT. Macquarie Group refers to Macquarie Group Limited and its subsidiaries and affiliates worldwide.
All third-party marks cited are the property of their respective owners.
© 2021 Macquarie Management Holdings, Inc.
Table of Contents
Portfolio management reviews
Optimum Fixed Income Fund
April 6, 2021 (Unaudited)
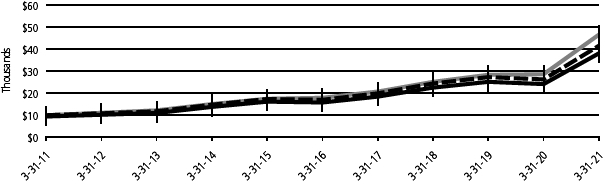
| Performance review (for the year ended March 31, 2021) | | | | |
| Optimum Fixed Income Fund (Institutional Class shares) | | 1-year return | | +5.37% |
| Optimum Fixed Income Fund (Class A shares) | | 1-year return | | +5.21% |
| Bloomberg Barclays US Aggregate Index (benchmark) | | 1-year return | | +0.71% |
Past performance does not guarantee future results.
For complete, annualized performance for Optimum Fixed Income Fund, please see the table on page 18.
Institutional Class shares are not subject to a sales charge and are offered for sale exclusively to certain eligible investors. In addition, Institutional Class shares pay no distribution and service fee.
The performance of Class A shares excludes the applicable sales charge. Both Institutional Class shares and Class A shares reflect the reinvestment of all distributions.
Index performance returns do not reflect any management fees, transaction costs, or expenses. Indices are unmanaged and one cannot invest directly in an index.
Fund objective
The Fund seeks a high level of income and may also seek growth of capital.
Advisor
Delaware Management Company (DMC)
Sub-advisor
Pacific Investment Management Company LLC (PIMCO)
Market review
Shortly into the Fund’s fiscal year, in the second calendar quarter of 2020, risk appetites began to improve considerably following positive developments that included the easing of COVID-19-related lockdown measures, improving economic data, and continued fiscal and monetary policy support. Global equities rallied, credit spreads tightened considerably, and the US dollar weakened. International government bond yield moves were broadly mixed, with yield curves steepening in some regions, as longer-term rates rose while central bank activity generally anchored short-term rates at low levels. Economic data pointed to recovery under way: Global Purchasing Managers’ Indices (PMIs) improved following sharp declines, unemployment fell from record peaks, and global central banks and policymakers reaffirmed commitments to supportive policy and quantitative easing (QE) measures. Geopolitical tensions also garnered headlines, as social unrest spread across the United States.
Despite an uptick in volatility toward the end of the third calendar quarter of 2020, risk assets broadly gained amid a rebound in economic data, heightened optimism around a potential COVID-19 vaccine, and ongoing global policy support. Risk appetites were generally robust, though concerns regarding the pandemic and the likelihood of US fiscal stimulus contributed to some reversal late in September. Still, global equities rose, credit spreads tightened, and the US dollar weakened relative to other developed market currencies. Although global economic data continued to improve, there were some signs of weakness that underscored the fragile nature of the global economic recovery. US labor market data indicated gradual improvement and core inflation rose, while consumer sentiment lagged and small businesses largely struggled to reopen. Concerns persisted as the global COVID-19 case count surpassed 33 million and deaths surpassed one million during the quarter. US-China tensions re-escalated. Brexit headlines and ongoing US election news added to the political uncertainty.
In the fourth calendar quarter of 2020, vaccine approvals, more policy stimulus, and clarity on US election results bolstered market optimism. Improving US labor market data outpaced expectations, even though total job gains had not yet recovered all the jobs lost in March and April of 2020. US equity markets largely ignored renewed lockdowns and the economic recovery’s decelerating pace. Credit spreads tightened, and the US dollar weakened. Most types of broad credit spreads finished 2020 only modestly wider. Demand concerns continued to plague sectors such as energy. Various other geopolitical topics also made headlines. Joe Biden was affirmed as president, and two runoff elections in Georgia gave Democrats control of the Senate. Also of note, the Trump administration hardened its rhetoric and policy against China, fueling further tensions, and a trade deal between the United Kingdom and the European Union alleviated some lingering Brexit concerns.
The new calendar year started off on uneven footing as market sentiment oscillated between optimism for recovery and uncertainty over the pace of vaccinations and new lockdown restrictions. Adding to volatility, erratic retail trading activity dominated headlines, while some corporate earnings disappointed. Sovereign bond yields climbed and global equities generally rose as markets digested expectations for both higher growth and inflation. Repricing in market expectations for the US Federal Reserve’s rate policy and the Biden administration’s large fiscal support proposal contributed to higher yields. Vaccination programs progressed globally, and winter lockdowns showed signs of slowing COVID-19 infection rates that had surged from holiday gatherings. That said, while the pace of the rollout picked up in the US, the UK, and Israel, supply-related delays and new COVID variants remained sources of concern.
The Fund’s fiscal year contained both one of the most distressed periods in modern economic history and an equally swift market
1
Table of Contents
Portfolio management reviews
Optimum Fixed Income Fund
recovery. The period brought about the greatest pandemic of modern times, featuring market disruptions and economic distress on a scale comparable only to the start of the Great Depression, against the backdrop of immense human suffering and sociopolitical distress. Yet the fiscal year also saw rapid and effective global monetary and fiscal intervention, including support of securities ranging from US Treasurys and agency mortgage-backed securities (MBS) to corporate bonds, exchange-traded funds (ETFs), and trillions of dollars’ worth of global fiscal stimulus implemented mere weeks after the pandemic’s onset.
While the loss of human life was immense, modern technology delivered vaccines with generally high efficacy rates by the end of 2020. More so, despite the significant sociopolitical headwinds, including racial inequities brought to the fore in the US, concern over an orderly handover of power in the White House, and a violent attack on the US Capitol, the political shift in the US delivered an additional $1.9 trillion of American stimulus likely to help lift the global economy. As a result, by March 31, 2021, yield spreads ended near all-time tight levels and interest rates moved significantly above the record lows of the summer of 2020.
Source: Bloomberg, unless noted otherwise.
Fund performance
For the fiscal year ended March 31, 2021, Optimum Fixed Income Fund outperformed its benchmark index, the Bloomberg Barclays US Aggregate Index, with positive results from each of the Fund’s component parts, managed by DMC and PIMCO. The following remarks describe factors that affected relative performance within these respective portions.
DMC
For the fiscal year, DMC’s portion of Optimum Fixed Income Fund outperformed the Fund’s benchmark, the Bloomberg Barclays US Aggregate Index.
DMC believes its portfolio management strategy was well suited for managing a highly volatile environment. By design, during periods of tight spreads and high liquidity, such as before the pandemic, DMC builds a liquid capital reserve of Treasurys, agency MBS, and cash by reducing risks in areas such as high yield, investment grade corporates, and emerging markets debt. Conversely, as COVID-19 struck in March 2020, DMC shifted gears by seeking to capture opportunities in dislocated markets across the entire investable universe.
In its portion of the Fund, DMC initially increased the allocation to investment grade corporate bonds by roughly 10 percentage points, focusing on individual issuers’ liquidity and the ability of their business models to survive the fallout from the pandemic. With further government support and greater clarity around health mitigation strategies, DMC also increased allocations to US dollar-denominated emerging market issuers and high yield issuers. Early in 2021, to help mitigate near-term potential inflationary pressures, DMC increased its Treasury inflation-protected securities (TIPS) exposure by roughly 5.5 percentage points and shifted its duration focus from modest long duration at the pandemic’s peak to modest short duration after interest rates reached historic lows. These strategies collectively benefited from the eventual recovery in spread sectors, increase in inflationary expectations, and rise in interest rates.
As a result, all three major levers of excess return contributed to performance in DMC’s portion of the Fund: sector allocation, yield curve management, and security selection.
Specifically, DMC’s risk management approach to yield curve positioning benefited from the yield curve steepening late in the fiscal year and its shift to a modest short duration from a modest long duration initially benefited from the decline in interest rates and, eventually, the increase in the 10-year US Treasury yield, from 0.5% to 1.7% by fiscal year end.
DMC’s shift to overweight investment grade corporates starting in March 2020, and the subsequent increase in its allocation to high yield and emerging markets debt, were the key contributors to sector returns in DMC’s portion of the Fund. DMC monetized returns in investment grade corporates by the end of 2020 and into 2021 by reducing the allocation by roughly 10 percentage points once spreads returned to near all-time tights, shifting more to agency MBS to increase portfolio liquidity and reduce credit risk. Simultaneously, DMC chose to maintain the higher allocation to high yield and emerging markets debt in its portion of the Fund as it believed these should continue to benefit from the strong reflationary tailwinds early in 2021.
At the security level, key contributors included issuers DMC had identified as well-positioned survivors within COVID-19-affected sectors, such as Delta Air Lines Inc. in the airlines sector. Selection within energy, including Marathon Oil Corp., benefited from the eventual recovery in oil prices combined with issuer resilience and liquidity. DMC continues to hold these securities in its portion of the Fund.
By contrast, certain decisions detracted from performance in DMC’s portion of the Fund. An underweight to agency MBS, as a source of funding for the higher yielding sectors, modestly detracted because the sector produced strong returns while DMC lightened the exposure in its portion of the Fund.
In addition, DMC’s underweight to more defensive segments such as government-related issuers, including agencies and taxable municipal
2
Table of Contents
bonds, detracted from returns because these securities outperformed duration-equivalent Treasurys.
Because of the fiscal year’s timing relative to the pandemic, most issuers outperformed government benchmarks. Thus, the individual detractors in DMC’s portion of the Fund largely were more defensive securities that didn’t experience as full a recovery, such as certain utility securities within corporates. In addition, while DMC takes a diversified approach to security selection within emerging markets, limited exposures to issuers that struggled during the pandemic, such as Republic of Argentina bonds and Aerovias de Mexico SA de CV, modestly detracted from performance in DMC’s portion of the Fund.
During the fiscal year, DMC used a variety of derivatives, including Treasury futures used primarily as a tool to manage yield curve risk. It also used credit default swaps and currency hedges. The use of derivatives added slightly more than 0.50 percentage points to performance for DMC’s portion of the Fund for the fiscal year.
PIMCO
For the fiscal year, PIMCO’s portion of the Fund outperformed its benchmark, the Bloomberg Barclays US Aggregate Index.
Interest rate strategies contributed to performance for PIMCO’s portion of the Fund. US yield curve positioning was beneficial, including an underweight to long-term rates, as intermediate and long-end US Treasury yields rose over the fiscal year. An underweight to front-end rates partially offset this, as short rates fell. Non-US interest rate strategies contributed to performance in PIMCO’s portion of the Fund, including an overweight to Italian duration and short exposure to UK interest rates. An allocation to Canadian duration modestly detracted from performance as Canadian yields rose.
Spread sector strategies added to returns in PIMCO’s portion of the Fund during the fiscal year. Holdings of nonagency mortgages contributed to performance amid broader market stabilization and continued strong fundamentals, while security selection within commercial mortgage-backed securities (CMBS) detracted from performance in PIMCO’s portion of the Fund. Relative value positioning within agency MBS also contributed to performance for PIMCO. An allocation to US TIPS contributed to performance as inflation expectations rose, and holdings of energy-related emerging market quasi-sovereign external debt also aided performance. Credit strategies detracted overall as the negative effect of an underweight to investment grade corporate credit more than offset contributions from an allocation to high yield corporate credit.
Currency strategies were neutral overall for performance in PIMCO’s portion of the Fund. A long-dollar bias relative to a basket of Latin American emerging market currencies detracted from performance, while exposure to the British pound contributed to returns.
At fiscal year end, PIMCO continued to favor US interest rate exposure relative to other developed markets, including the UK. While rates may still drift higher, PIMCO’s management believes much of the move is likely behind us and that the extent of steepening could make the middle of the curve (medium-term bonds) attractive. PIMCO maintained a broad underweight to corporate credit and continued to have a bias toward liquid and high-quality names, while de-emphasizing generic corporate credit exposure. PIMCO continued to favor diversified spread exposure and agency MBS, given their appealing valuations, in PIMCO’s view. It also continued to favor senior positions in mortgage credit given the asset’s inherent fundamental strength and the deleveraging nature. PIMCO is focused on maintaining a high level of liquidity in its portion of the Fund.
PIMCO used several types of derivatives to seek to manage risks associated with market volatility and interest rate risk. However, the use of credit default swaps, forwards, futures, interest rate swaps, options, and swaptions did not have a material impact on performance during the fiscal year within PIMCO’s portion of the Fund.
3
Table of Contents
Portfolio management reviews
Optimum International Fund
April 6, 2021 (Unaudited)
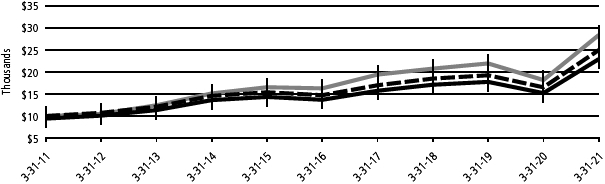
| Performance review (for the year ended March 31, 2021) |
| Optimum International Fund (Institutional Class shares)* | | 1-year return | | +58.48% |
| Optimum International Fund (Class A shares)* | | 1-year return | | +58.04% |
| MSCI ACWI ex USA Index (net) (benchmark) | | 1-year return | | +49.41% |
| MSCI ACWI ex USA Index (gross) (benchmark) | | 1-year return | | +50.03% |
Past performance does not guarantee future results.
For complete, annualized performance for Optimum International Fund, please see the table on page 21.
Institutional Class shares are not subject to a sales charge and are offered for sale exclusively to certain eligible investors. In addition, Institutional Class shares pay no distribution and service fee.
The performance of Class A shares excludes the applicable sales charge. Both Institutional Class shares and Class A shares reflect the reinvestment of all distributions. Index performance returns do not reflect any management fees, transaction costs, or expenses. Indices are unmanaged and one cannot invest directly in an index.
*Total returns for the report period presented in the table differs from the return in “Financial highlights.” The total returns presented in the above table are calculated based on the net asset value (NAV) at which shareholder transactions were processed. The total returns presented in “Financial highlights” are calculated in the same manner, but also takes into account certain adjustments that are necessary under US generally accepted accounting principles (US GAAP) required in the annual report.
Investment objective
The Fund seeks long-term growth of capital and may also seek income.
Advisor
Delaware Management Company (DMC)
Sub-advisors
Acadian Asset Management LLC (Acadian)
EARNEST Partners LLC (EARNEST)
Market review
The Fund’s fiscal year ended March 31, 2021, began following markets’ most challenging quarter since the depths of the 2008 global financial crisis. In the first quarter of 2020, prior to the start of the Fund’s fiscal year, financial markets had plunged precipitously as investors reacted to the worldwide economic shutdowns imposed to curtail the rapidly spreading COVID-19 pandemic. Worldwide, governments and central banks responded just as rapidly with unprecedented levels of fiscal and monetary stimulus.
Given the sizable fiscal stimulus, economies began to recover during the Fund’s fiscal year, albeit slowly. Broad uncertainty about the speed and scope of recovery persisted throughout the period. Equity investors displayed no hesitancy, however, and markets responded enthusiastically to the monetary support provided by central banks, underscoring an apparent disconnect with economic reality and the true prospects of recovery. Such support, while swift and substantial, may have obscured several downside risks and set expectations that governments will continue to flood economies with aid.
Nonetheless, the arrival of a COVID-19 vaccine in December spurred investor optimism further and encouraged a risk rally into sectors that had been beaten down earlier in the year. Equities were further buoyed by central banks’ commitments to remain accommodative for the foreseeable future, the 11th-hour Brexit deal, and the US election results. Still, global trade dynamics remained in flux, further disrupted by China’s efforts to disentangle itself from global supply chains.
Global equity markets continued to ascend in the first calendar quarter of 2021 as investors gained confidence in the global economy’s ability to adapt to the ongoing coronavirus pandemic. International equity markets, as represented by the MSCI ACWI (All Country World Index) ex USA Index (net), rose 3.5% for the quarter and finished the 12-month period up 49.4%.
As the fiscal year ended, investors were looking beyond the near-term effects of the pandemic, incorporating the global vaccination rollout, continued government stimulus measures, and the adaptability of global businesses into projections of future earnings growth. The decrease in new case numbers, relaxation of business restrictions, and a continued low interest rate environment buoyed retail sales. In the United States, progress on the rollout of vaccinations continued. By the end of the fiscal year, more than 15% of the US population had received a COVID-19 vaccine. Many areas of the economy experienced expanded activity as the government’s stimulus measures supported new purchases of durable goods and home prices reached record highs.
Source: Bloomberg, unless noted otherwise.
Fund performance
For the fiscal year ended March 31, 2021, Optimum International Fund outperformed its benchmark, the MSCI ACWI ex USA Index. Both Acadian’s and EARNEST’s portions of the Fund outperformed the benchmark, generally on the strength of positive stock selection. Acadian’s portion of the Fund benefited from stock selection and an overweight position in South Korea, along with favorable stock selection in the United Kingdom. At the sector level, Acadian’s portion of the Fund benefited from stock selection in the consumer discretionary sector and stock selection and an overweight in the
4
Table of Contents
information technology (IT) sector. Stock selection in Switzerland and the Netherlands detracted from performance in Acadian’s portion of the Fund, as did stock selection and an overweight to the healthcare sector. EARNEST’s portion of the Fund benefited from its allocations to both emerging and developed market countries. On a sector basis, EARNEST’s portion of the Fund benefited from its investments in consumer discretionary, communication services, and materials. Consumer staples and healthcare detracted from performance for EARNEST’s portion of the Fund.
Acadian
Acadian focuses on its disciplined, value-focused, multifactor approach and manages its portion of the Fund with what it views as consistency, objectivity, and appropriate risk controls. Acadian believes that the coronavirus pandemic has created a new set of challenges for global equities and that the current situation is fluid and evolving. In these circumstances, Acadian’s approach is to maintain a calm and measured perspective, removing human emotion. Acadian believes it would be counterproductive to overreact to exceptional conditions by making wholesale changes to its portion of the Fund.
South Korean consumer electronics company LG Electronics Inc. was a leading contributor to performance in Acadian’s portion of the Fund. Shares jumped in December 2020 after the company announced a joint venture with Canadian auto parts maker Magna International Inc. to develop key components for electric cars.
A holding in Australian miner Fortescue Metals Group Ltd. also contributed significantly to performance for Acadian’s portion of the Fund, as the company benefited from rising iron-ore prices.
A position in Swiss pharmaceutical company Roche Holding AG was a significant detractor from performance in Acadian’s portion of the Fund for the fiscal year. Roche is a leading global healthcare company engaged in the development, manufacturing, and marketing of drugs, advanced biologics, and medical devices. Roche generates most of its revenue from the sale of pharmaceuticals. Its diagnostics division is smaller but has been faster growing. While the company’s COVID-19 antibody tests filled a necessary market need, third-quarter drug sales fell short of expectations. Nonetheless, at period end, Acadian maintained a positive view of Roche.
A lack of exposure to Taiwanese chipmaker Taiwan Semiconductor Manufacturing Co. Ltd. proved costly to Acadian’s portion of the Fund. The company benefited over the past year from higher demand for semiconductor chips. At period end, Acadian maintained a positive view of Taiwan Semiconductor, though considered the shares to be overvalued.
EARNEST
As a bottom-up (stock-by-stock), fundamental manager, EARNEST looks beyond the quarter-over-quarter noise of the market and strives to position its portion of the Fund for growth over a full market cycle. As a function of its bottom-up investment process the portfolio continues to express a relative overweight to developed countries.
Barclays PLC, a multinational investment bank and financial services company headquartered in the UK, was a leading contributor to performance in EARNEST’s portion of Fund. Despite year-over-year revenue contraction, recent results indicate Barclays’ performance fared considerably more favorably than consensus estimates. Barclays continued to generate attractive returns in its UK business, and EARNEST believes the company is well positioned to execute its long-term growth strategy.
Eurofins Scientific SE was another leading contributor in EARNEST’s portion of the Fund for the fiscal year. Eurofins Scientific is a healthcare company that offers testing and laboratory services to support clinical trials for discovery pharmaceuticals. During the pandemic, Eurofins Scientific benefited both from increased drug trials as companies raced to find a viable cure and from increased demand for widespread testing.
Banco Bradesco S.A., the second-largest private sector bank in Brazil in terms of total assets, was a significant detractor from performance in EARNEST’s portion of the Fund. The bank offers a variety of traditional services from lending to credit cards to insurance. Headquartered in Brazil, the company has more than 5,000 bank branches worldwide. COVID-19 impaired borrowers’ ability to make loan payments and many investors reacted negatively to bank stocks on the notion that nonperforming loans would increase and ultimately reduce profitability. Banco Bradesco was not immune to this dynamic. Its shares finished the Fund’s fiscal year with an absolute gain but trailed the benchmark’s strong return.
TravelSky Technology Ltd. also detracted from performance in EARNEST’s portion of the Fund. The company is a leading provider of IT and commercial services in China’s air travel and tourism industry. Its clients include airlines, airports, travel agencies, and individual and corporate travel consumers. During the onset of the pandemic, air travel in China fell from 85 million passengers a day to less than 10 million passengers a day. The valuation of the shares contracted to levels that suggested bookings would remain significantly depressed. EARNEST initially purchased the stock at what it viewed as an attractive valuation and, while it appreciated on an absolute basis during the fiscal year, the gain fell short of the benchmark’s return.
5
Table of Contents
Portfolio management reviews
Optimum International Fund
Overall, Optimum International Fund used derivatives, including foreign currency exchange contracts, during the fiscal year. However, these had a minimal effect on performance.
6
Table of Contents
Portfolio management reviews
Optimum Large Cap Growth Fund
April 6, 2021 (Unaudited)
| Performance review (for the year ended March 31, 2021) |
| Optimum Large Cap Growth Fund (Institutional Class shares) | | 1-year return | | +58.11% |
| Optimum Large Cap Growth Fund (Class A shares) | | 1-year return | | +57.75% |
| Russell 1000® Growth Index (benchmark) | | 1-year return | | +62.74% |
Past performance does not guarantee future results.
For complete, annualized performance for Optimum Large Cap Growth Fund, please see the table on page 24.
Institutional Class shares are not subject to a sales charge and are offered for sale exclusively to certain eligible investors. In addition, Institutional Class shares pay no distribution and service fee.
The performance of Class A shares excludes the applicable sales charge. Both Institutional Class shares and Class A shares reflect the reinvestment of all distributions.
Index performance returns do not reflect any management fees, transaction costs, or expenses. Indices are unmanaged and one cannot invest directly in an index.
Fund objective
The Fund seeks long-term growth of capital.
Advisor
Delaware Management Company (DMC)
Sub-advisors
ClearBridge Investments, LLC (ClearBridge)
T. Rowe Price Associates, Inc. (T. Rowe Price)
Market review
Following the pandemic-induced, severe selloff in March 2020, US equities staged a remarkable recovery during the Fund’s fiscal year ended March 31, 2021. Equities had sold off suddenly and steeply when investor concern over the spread of COVID-19 was quickly followed by stringent worldwide economic shutdowns. Just as quickly, both governments and central banks around the world responded with unprecedented levels of fiscal and monetary stimulus that had investors flocking back to the markets.
Worldwide, economies were slower to respond. Restrictions on travel, dining, entertainment, and other group gatherings and activities led to severe economic losses. Many governments provided relief to prevent a severe depression from taking hold. In the United States, the initial round of fiscal stimulus – including direct payments to individuals, enhanced unemployment benefits, and a payroll protection program for small businesses – was followed by two additional rounds of relief in December 2020 and March 2021. The availability of a COVID-19 vaccine in November buoyed investors but did little to stimulate the economy given the relatively slow initial rollout. Gradually, however, signs of economic recovery became apparent as restrictions on economic activity were reduced and employment gains were notched.
During the Fund’s fiscal year, the large-cap S&P 500® Index advanced 56.35%, in large part because of the monetary support the US Federal Reserve provided. Growth outperformed value stocks by historically wide margins for the first half of the period, but a cyclical comeback driven by vaccine development and hopes for an economic reopening caused value to rally in the second half of the period. For the fiscal year, the Russell 1000 Growth Index gained 62.74% while the Russell 1000® Value Index rose 56.09%.
Source: Bloomberg, unless noted otherwise.
Fund performance
Optimum Large Cap Growth Fund underperformed its benchmark, the Russell 1000 Growth Index, for the Fund’s fiscal year ended March 31, 2021. Although ClearBridge and T. Rowe Price both generated positive absolute returns in their respective portions of the Fund, each underperformed relative to the benchmark, citing adverse stock selection and, in ClearBridge’s portion of the Fund, adverse sector allocation decisions as well. Stock selection in the information technology (IT) and consumer discretionary sectors and an underweight to IT also detracted from relative performance in Clearbridge’s portion of the Fund. Overall sector selection helped performance for T. Rowe Price’s portion of the Fund, with IT, consumer discretionary, and utilities detracting while communication services, consumer staples, and real estate contributed.
ClearBridge
ClearBridge normally invests in equity securities (or other instruments with similar economic characteristics) of US companies with large market capitalizations. ClearBridge’s core holdings are large-cap companies that it believes to be dominant in their industries owing to product, distribution, or service strength.
IT was the leading sector detractor from performance in ClearBridge’s portion of the Fund for the fiscal year, with two companies in particular responsible. salesforce.com Inc. is a leading software-as-a-service (SaaS) provider of customer relationship management solutions. Negative reaction to the company’s proposed acquisition of messaging platform Slack Technologies Inc. weighed on shares, especially in the fourth quarter of 2020 when investors perceived that salesforce overpaid for this acquisition. Early indications, however, suggest the deal will allow Slack to accelerate its penetration in the enterprise market.
7
Table of Contents
Portfolio management reviews
Optimum Large Cap Growth Fund
Splunk Inc. is a maker of data monitoring, analysis, and security software applications for enterprises. A broad giveback in growth stocks, continued confusion around the company’s shift to a subscription model, which affects revenue recognition, and poor communication about disappointing results late in 2020 hurt the stock. Nevertheless, Splunk remains one of the fastest-growing SaaS businesses with its transition to the cloud well ahead of plan.
An underweight to Apple Inc. also hurt relative performance in the first three quarters of the period. Apple’s size in the benchmark had grown so large that holding a benchmark weight or taking an active position would have invalidated the effort to maintain a diversified portfolio, in ClearBridge’s view.
Partially offsetting those results in the IT sector was NVIDIA Corp., a significant contributor to ClearBridge’s portion of the Fund. NVIDIA is a developer of graphics processing units for use in gaming, visual design, and artificial intelligence. The company delivered strong quarterly results throughout the year and raised earnings guidance primarily because of stronger gaming trends and resilience in data center growth.
The industrials sector was the primary contributor to results, led by strong operating results from United Parcel Service Inc. Under a new CEO, UPS has thrived through the pandemic and become a more efficient business.
The healthcare sector also helped performance for ClearBridge’s portion of the Fund. Thermo Fisher Scientific Inc., which played a key role in virus testing and supplies during the COVID-19 lockdowns, also contributed significantly. Not owning several of the largest biopharmaceutical stocks that underperformed for the year also helped ClearBridge’s portion of the Fund.
T. Rowe Price
T. Rowe Price normally invests in stocks of large-cap companies with one or more of the following characteristics: strong cash flow and an above-average rate of earnings growth, the ability to sustain earnings momentum during economic downturns, and occupation of a lucrative niche in the economy and ability to expand even during times of slow economic growth. As the country and the world work to return to normal, T. Rowe Price continues to monitor several key market themes.
First, T. Rowe Price believes there will be periods of volatility especially because much of the recovery has been priced into markets. Second, politics and the Biden administration’s emerging priorities will likely remain in the spotlight. Third, disruption caused by new technologies will continue, which in turn should create style dispersions among equity classes. Finally, T. Rowe Price is keeping a vigilant eye out for signs of inflation. While it appears almost certain there will be no disinflation in the near term, markets will also no longer have the tailwind of falling rates longer term, although they could remain at historically low levels if the inflation impulse fades.
IT was the leading relative underperformer in T. Rowe Price’s portion of the Fund, due primarily to weak stock choices including Fidelity National Information Services Inc. Despite less exposure to the costs of acquiring new merchants and more exposure to ecommerce relative to its peers, shares of the company underperformed as social distancing measures weighed on merchant-payment volumes.
Consumer discretionary also underperformed owing to weak stock picks such as Alibaba Group Holding Ltd. An overweight position only partially offset this, however. Despite impressive growth and market share gains for its core ecommerce business, shares of Alibaba traded lower due to persistent regulatory pressure on the company that included an antitrust investigation and the cancellation of the Ant Group initial public offering, a company in which Alibaba owns a 33% stake.
An overweight allocation to the utilities sector detracted from relative results. In contrast, communication services contributed as a result of stock selection, including positions in Snap Inc. and Sea Ltd., and an overweight exposure. Shares of Snap gained over the past 12 months due to increased user growth and engagement in response to social distancing measures, as well as higher advertiser demand and a mix shift toward higher-priced advertising solutions. Shares of Sea also traded higher over the past 12 months as both its gaming and ecommerce businesses experienced accelerating growth, aided by coronavirus-related tailwinds reinforcing a shift toward digitalization.
T. Rowe Price’s lack of exposure to the consumer staples sector also aided relative performance, as the defensive sector lagged the market in a risk-on environment. A significant underweight to real estate also contributed to relative returns.
Overall, Optimum Large Cap Growth Fund used derivatives, including foreign currency exchange contracts, during the fiscal year. However, these had a minimal effect on performance.
8
Table of Contents
Portfolio management reviews
Optimum Large Cap Value Fund
April 6, 2021 (Unaudited)
| Performance review (for the year ended March 31, 2021) | | | | |
| Optimum Large Cap Value Fund (Institutional Class shares) | | 1-year return | | +51.11% |
| Optimum Large Cap Value Fund (Class A shares) | | 1-year return | | +50.73% |
| Russell 1000® Value Index (benchmark) | | 1-year return | | +56.09% |
Past performance does not guarantee future results.
For complete, annualized performance for Optimum Large Cap Value Fund, please see the table on page 27.
Institutional Class shares are not subject to a sales charge and are offered for sale exclusively to certain eligible investors. In addition, Institutional Class shares pay no distribution and service fee.
The performance of Class A shares excludes the applicable sales charge. Both Institutional Class shares and Class A shares reflect the reinvestment of all distributions.
Index performance returns do not reflect any management fees, transaction costs, or expenses. Indices are unmanaged and one cannot invest directly in an index.
Investment objective
The Fund seeks long-term growth of capital and may also seek income.
Advisor
Delaware Management Company (DMC)
Sub-advisors
Massachusetts Financial Services Company (MFS)
Rothschild & Co
Market review
Financial markets experienced an extraordinarily sharp selloff early in the Fund’s fiscal year as pandemic-related concerns gripped investors. Governments and central banks responded quickly, however, with unprecedented levels of fiscal and monetary stimulus, promoting an unusually rapid recovery. As the fiscal year ended, it appeared that the global economy experienced the shortest – albeit the deepest and steepest – recession in the postwar period. For the fiscal year ended March 31, 2021, the Fund’s benchmark, the Russell 1000 Value Index gained 56.09%.
Nonetheless, as of fiscal year end, the recovery remains subject to an unusually large degree of uncertainty because of questions about the evolution of new coronavirus variants, what their impacts will be, and how quickly effective vaccines can be manufactured and distributed. It remains to be seen whether enough people will get vaccinated to create so-called herd immunity.
The economic stimulus programs proved largely successful in helping to restore market function, ease volatility, and promote a sustained rebound. In the middle of the fiscal year, the US Federal Reserve adopted a new, flexible, average-inflation-targeting framework, which is expected to keep the federal funds rate low for longer than under its previous model. Due to relatively manageable external liabilities and persistently low inflation, even emerging market countries were able to implement countercyclical policies –a departure from the usual market-dictated response to “risk off” crises.
Oil prices rose late in the Fund’s fiscal year as Saudi Arabia cut production and optimism grew that global growth would increase as vaccines become more widely available. The rally helped support the bonds of shale-oil producers, as their ability to service debt improved. Prices of many raw materials also rebounded strongly as the global manufacturing sector proved quite resilient during the pandemic.
Investors’ focus turned to the threat of inflation resulting from the monumental levels of economic stimulus and the unleashing of pandemic-induced, pent-up demand. In response to these concerns, global government bond yields have risen materially in recent months, and market leadership has shifted from a handful of mega-cap technology companies to a broader array of small-cap and value stocks. At the same time, signs of excess investor enthusiasm have been seen in pockets of the market, such as stocks that are popular with users of online message boards and equities issued by special purpose acquisition companies (SPACs).
Source: Bloomberg, unless noted otherwise.
Fund performance
Optimum Large Cap Value Fund underperformed its benchmark, the Russell 1000 Value Index, for the fiscal year ended March 31, 2021. While Rothschild & Co’s portion of the Fund slightly outperformed the benchmark return, MFS’s portion of the Fund significantly underperformed. Stock selection in the industrials and utilities sectors and an underweight position relative to the benchmark in the consumer discretionary sector detracted from performance in MFS’s portion of the Fund. MFS’s cash position during the period also detracted from performance. Stock selection in information technology and an underweight allocation to both the real estate and communication services sectors benefited MFS’s portion of the Fund. In Rothschild & Co’s portion of the Fund, stock selection was favorable and the primary driver of positive relative performance in the information technology (IT), consumer discretionary, and industrials sectors. Stock selection in the real estate, healthcare, and
9
Table of Contents
Portfolio management reviews
Optimum Large Cap Value Fund
materials sectors detracted from performance in Rothschild & Co’s portion of the Fund, as did a modest cash position.
MFS
MFS has maintained a consistent investment approach since the inception of the strategy it uses to manage its portion of the Fund. For its portion of the Fund, MFS uses a long-term time horizon in making investment decisions. MFS maintains a disciplined investment philosophy and process that is always focused on investing in high-quality companies trading at what it views as inexpensive valuations. MFS continued to assess the impact of significant changes to the global economic outlook and equity markets because of the ongoing pandemic and hopeful signs of recovery.
MFS held an overweight position in global security company Northrop Grumman Corp. that detracted from performance for the fiscal year. The company is engaged in the provision of security services including cybersecurity for computers and communications. Northrop Grumman is also involved in aerospace systems, designing, and producing manned aircraft, spacecraft, and high-energy laser systems., MFS’s position in defense contractor Lockheed Martin Corp., also in the industrials sector, detracted from performance in its portion of the Fund.
In the utilities sector, overweight positions in power provider FirstEnergy Corp., power and natural gas distributor Duke Energy Corp., and retail electric services provider The Southern Co. weighed on relative returns in MFS’s portion of the Fund. The sector suffered significant declines as power consumption flagged during the pandemic while utility companies generally carried relatively high levels of debt. MFS exited its position in First Energy during the fiscal year.
Overweight positions in pharmaceutical company Merck & Co. Inc. and diversified medical products maker Johnson & Johnson also hindered performance in MFS’s portion of the Fund. MFS’s holding in global food company Nestlé S.A. and its lack of a position in The Walt Disney Co. likewise detracted from performance.
In the IT sector, MFS’s portion of the Fund benefited from the timing of its ownership of semiconductor company Texas Instruments Inc. and of semiconductor solutions provider NXP Semiconductors NV, based in the Netherlands.
Within the communications sector, the lack of a position in telecommunications provider AT&T Inc. and an underweight position in telecommunications services provider Verizon Communications Inc. benefited MFS’s portion of the Fund.
Overweight positions in financial services firm Goldman Sachs Group Inc. and global diversified technology and multi-industrial company Johnson Controls International PLC also contributed to performance in MFS’s portion of the Fund. The lack of positions in investment firm Berkshire Hathaway Inc., biotech firm Gilead Sciences Inc., retailer Walmart Inc., and household products maker Procter & Gamble Co. also added to relative performance in MFS’s portion of the Fund.
Rothschild & Co
Rothschild & Co employs an integrated approach that balances quantitative analysis, fundamental research, and risk management guidelines to identify stocks of companies it believes possess attractive relative valuation and an ability to exceed market expectations. Rothschild & Co’s investment process has been stable through many market cycles, maintaining a consistent approach even as economic and market environments fluctuate. That said, the market environment experienced during the most recent fiscal year was largely unprecedented, reflecting the pandemic and the resulting government and central bank fiscal and monetary support. Rothschild & Co believes such environments characterized by volatility can unearth opportunities as pricing inefficiencies develop at the stock level.
In Rothschild & Co’s portion of the Fund, the leading contributors to performance during the fiscal year included infrastructure construction company Quanta Services Inc. The company provides specialized services to electric utilities, cable operators, and telecommunication companies. As such, Rothschild & Co believes the company remains well positioned as the Biden administration pushes for the largest infrastructure bill in decades.
ON Semiconductor Corp. was another leading contributor during the period. With large exposure to cyclical end-markets such as auto, industrials, 5G infrastructure, and cloud computing, ON Semiconductor appears well positioned to benefit from the broad macroeconomic recovery, in Rothschild & Co’s view. The company appointed Hassane El-Khoury as CEO in December 2020. Given his prior success as CEO of Cypress Semiconductor Corp., investors viewed El-Khoury’s appointment favorably. Rothschild & Co believes he will focus his efforts on accelerating revenue growth, rationalizing the manufacturing footprint, and driving margin expansion.
Merck & Co. Inc. was a significant detractor from performance in Rothschild & Co’s portion of the Fund during the fiscal year. Although earnings expectations continued to rise, Merck’s shares suffered from multiple compression. Keytruda, the company’s key oncology asset, has had success in treating lung and other forms of cancer. Unfortunately, this success contributed to product concentration risk, as Keytruda now accounts for nearly 40% of Merck’s revenue. In addition, given the relatively high valuations of acquisition targets, the company has been hesitant to put its strong balance sheet to work to help meaningfully diversify its portfolio. We believe the new
10
Table of Contents
CEO will focus on diversification and help improve the visibility of the company’s inhouse pipeline potential.
Xcel Energy Inc., a regulated utility that has significant operating leverage to renewables investment in the United States, was another significant detractor from performance in Rothschild & Co’s portion of the Fund. As a defensive, yield-oriented stock, Xcel Energy trailed during a risk-on market that favored stocks leveraged to a cyclical recovery. Rothschild & Co continues to hold Xcel Energy in its portion of the Fund, given its view that Xcel has above-average growth prospects relative to peer regulated utilities.
Overall, Optimum Large Cap Value Fund used derivatives, including foreign currency exchange contracts, during the fiscal year. However, these had a minimal effect on performance.
11
Table of Contents
Portfolio management reviews
Optimum Small-Mid Cap Growth Fund
April 6, 2021 (Unaudited)
| Performance review (for the year ended March 31, 2021) | | | | |
| Optimum Small-Mid Cap Growth Fund (Institutional Class shares) | | 1-year return | | +110.06% |
| Optimum Small-Mid Cap Growth Fund (Class A shares) | | 1-year return | | +109.54% |
| Russell 2500TM Growth Index (benchmark) | | 1-year return | | +87.50% |
Past performance does not guarantee future results.
For complete, annualized performance for Optimum Small-Mid Cap Growth Fund, please see the table on page 30.
Institutional Class shares are not subject to a sales charge and are offered for sale exclusively to certain eligible investors. In addition, Institutional Class shares pay no distribution and service fee.
The performance of Class A shares excludes the applicable sales charge. Both Institutional Class shares and Class A shares reflect the reinvestment of all distributions.
Index performance returns do not reflect any management fees, transaction costs, or expenses. Indices are unmanaged and one cannot invest directly in an index.
Investment objective
The Fund seeks long-term growth of capital.
Advisor
Delaware Management Company (DMC)
Sub-advisors
Columbus Circle Investors (CCI)
Peregrine Capital Management, LLC (PCM)
Market review
The 12-month period covering the Fund’s fiscal year ended March 31, 2021, was unlike anything investors have seen in modern times. Aggressive fiscal and monetary support in the United States and globally provided a tailwind as financial markets recovered from extreme volatility just before the Fund’s performance period began and the world responded initially to the coronavirus pandemic with widespread shutdowns.
Despite extremely high unemployment rates last spring and unprecedented highs and lows on economic measures such as gross domestic product (GDP), investor optimism grew as the world acclimated to a period full of uncertainty and large swaths of economic disruption.
By the fall and early winter, news of successful vaccine tests and a resolution to the US presidential election were followed by a more proactive approach to dealing with the COVID-19 crisis in the US. This included Congressional passage of additional measures to address economic hardships and advance distribution of the vaccines.
In terms of investment styles, growth stocks, dominated by large technology stocks that benefited from work-from-home trends, performed well early in the 12-month period. However, value and cyclical stocks took leadership as prospects grew for a reopening of the US economy. Overall, small-caps easily outpaced large-caps, as the Russell 2000® Index returned an eye-popping 94.85% versus the Russell 1000® Index’s 60.59% gain for the 12 months ended March 31, 2021.
Source: Bloomberg, unless noted otherwise.
Fund performance
Optimum Small-Mid Cap Growth Fund outperformed its benchmark, the Russell 2500 Growth Index, for the fiscal year. CCI’s portion of the Fund outperformed the benchmark, led by stock selection in the healthcare and consumer discretionary sectors. PCM’s portion of the Fund also outpaced the benchmark, led by stock selection in the industrials and financials sectors.
CCI
CCI uses a growth-oriented investment philosophy of “positive momentum and positive surprise” in which it strives to invest in what it views as good companies getting stronger and in companies whose fundamentals have the potential to exceed investor expectations.
CCI’s portion of the Fund had an excellent year as optimism that increased availability and distribution of COVID-19 vaccines would soon drive a return to normal life combined with the Federal Reserve’s continued accommodative monetary policy to drive strong gains. While CCI was encouraged by the strong start to 2021, the fiscal year was really a tale of two halves. The first half was marked by strong outperformance of secularly driven, positively surprising growth stories, typical of CCI’s investment discipline, that were broadly rewarded for strong fundamentals during the onset of the COVID-19 pandemic, a period of uncertainty where growth was scarce.
The second half of the fiscal year, however, was aided by the addition of several growth stories to CCI’s portfolio that benefited from a broader reopening and improvement of the US economy. CCI was particularly encouraged by the outperformance during this period given the unfavorable backdrop, as expectations for a cyclical rebound drove value to outperform growth across the market capitalization spectrum.
12
Table of Contents
Horizon Therapeutics PLC, a pharmaceutical company focused on treatments for rare and rheumatic diseases, was CCI’s largest contributor for the fiscal year. Tepezza, the first US Food and Drug Administration (FDA)-approved therapy for thyroid eye disease, a debilitating condition with no previous existing treatments, has been an unequivocal success, while Krystexxa, a treatment for uncontrolled gout, continues to show robust demand. In addition, recent share performance was bolstered by a pause in the Phase 2 trial of a competitor’s drug candidate on safety concerns, while the company’s synergistic acquisition of Viela Bio, a biotechnology company with a portfolio of rare autoimmune disease candidates, including commercial drug Uplizna, was received favorably.
SVB Financial Group, a regional bank providing a wide range of financial services targeted primarily to businesses in technology and life sciences was the second largest contributor. The company is reaping the benefits of its differentiated business model as investments in technology firms reach record highs across a variety of industries. It is also one of the most asset-sensitive banks in the country, which CCI thinks positions it well for future interest rate increases.
Avalara Inc., a leading provider of cloud-based tax compliance software, detracted the most from performance for CCI’s portion of the Fund as shares declined despite continued robust fundamentals that supported CCI’s investment thesis. CCI attributes the decline in shares to profit taking in the software group and other highly valued growth stocks, as the market rotated towards cyclical and value shares more likely to benefit from an improvement in the economy during the March quarter. CCI exited its position to fund more attractive ideas.
Amicus Therapeutics Inc., a biotechnology company focused on rare metabolic diseases, also detracted from performance. Shares declined to CCI’s point of sale after Phase 3 data from the PROPEL trial of AT-GAA in Pompe Disease, a condition characterized by severe muscle weakness, missed its primary end point of six-minutes’ walk distance by two meters. Although the study exceeded its secondary end point of forced vital capacity, a measure of respiratory function, which may suggest the drug candidate is still viable, CCI chose to exit its position.
CCI’s portion of the Fund remains most overweight the consumer discretionary sector, including stocks tied to leisure trends that are seen as likely to benefit from consumers looking for experiences outside of their homes after the COVID-19 pandemic. CCI’s portion of the Fund also holds several consumer growth stories tied to economic recovery in the housing and retail markets. Additionally, it continues to be overweight financials, including holdings tied to secular trends within technology and those that will benefit from the recent rise in interest rates. Conversely, CCI remains most underweight healthcare and information technology (IT) stocks, largely because of previously reducing names with, in CCI’s assessment, less favorable risk-reward in favor of more compelling stories in other sectors.
PCM
The industrials and financials sectors were the largest contributors to performance for PCM’s portion of the Fund during the fiscal year. Strength in industrials was broad-based across many of PCM’s holdings in the sector. These stocks sharply recovered from the COVID-19-related market lows of March 2020 due to improved economic visibility and increased likelihood of a large government stimulus and infrastructure bill. In the financial sector, improving economic visibility also drove strong performance of PCM’s bank, capital markets, and insurance holdings in the period.
Technology and consumer discretionary were the largest detractors from performance for PCM’s portion of the Fund. Weakness in technology was driven by PCM’s semiconductor and software holdings, which trailed the larger and more richly valued benchmark names where PCM is underweight due to its valuation discipline. PCM’s underweight to the consumer discretionary sector was also a headwind to performance in the period.
The leading contributor to PCM’s portion of the Fund for the fiscal year was Immunomedics Inc., a biotechnology company focused on the development of antibody-based treatments for various cancers. Following the FDA approval of its product, Trodelvy, the company announced a very strong start to commercialization, which attracted the attention of strategic acquirers looking to bolster their oncology platforms. Gilead Sciences acquired the company for a significant premium in September.
Another contributor to PCM’s portion of the Fund was ASGN Inc., which provides IT staffing services as well as government IT services. After being undeservedly punished during the onset of the COVID-19 pandemic, the stock sharply rebounded during the fiscal year as demand in the company’s core IT staffing and government services businesses proved much more resilient than investors originally thought. The company’s large Fortune 500 clients in the IT staffing business were reluctant to pull back IT-related spending during the pandemic, while the government business provided essential services that saw no negative impact from the pandemic.
The leading detractor from performance in PCM’s portion of the Fund was Strategic Education Inc., a leading provider of online education, targeting masters and post-secondary degrees across a wide variety of specialties. The company had demonstrated a strong track record of topline growth and margin improvement following its formation through the merger of Capella and Strayer Education. However, enrollment growth slowed during the fiscal year as new
13
Table of Contents
Portfolio management reviews
Optimum Small-Mid Cap Growth Fund
students were more reluctant to start a degree program amid the COVID-19-related turmoil. This news, along with a larger acquisition that required equity financing, led the shares to underperform for the period. PCM eliminated the position during the fiscal year.
Another detractor from performance in PCM’s portion of the Fund was Theravance Biopharma Inc., a biopharmaceutical company focused on the development of novel therapeutics in the respiratory and gastrointestinal space. The company’s strong development capabilities have yielded many marketed drugs including Trelegy, a multibillion-dollar chronic obstructive pulmonary disease (COPD) drug marketed by GlaxoSmithKline PLC, where the company receives a royalty which is then used to advance its owned pipeline. However, pipeline delays resulting from the COVID-19 pandemic temporarily pushed back the timing of clinical trial readouts expected in 2020 into the second half of 2021, which caused the stock to underperform for the fiscal year.
PCM’s process focuses on rapidly growing small-cap companies trading at valuations that do not yet reflect that strong growth. PCM is currently most overweight companies in the industrials and financial services sector that it expects to benefit from the anticipated improvement in economic growth and company fundamentals. Conversely, PCM’s portion of the Fund is most underweight the technology and consumer discretionary sectors, where it believes valuations are less attractive.
14
Table of Contents
Portfolio management reviews
Optimum Small-Mid Cap Value Fund
April 6, 2021 (Unaudited)
| Performance review (for the year ended March 31, 2021) | | | | | |
| Optimum Small-Mid Cap Value Fund (Institutional Class shares) | | 1-year return | | +86.63 | % |
| Optimum Small-Mid Cap Value Fund (Class A shares) | | 1-year return | | +86.21 | % |
| Russell 2500™ Value Index (benchmark) | | 1-year return | | +87.47 | % |
Past performance does not guarantee future results.
For complete, annualized performance for Optimum Small-Mid Cap Value Fund, please see the table on page 33.
Institutional Class shares are not subject to a sales charge and are offered for sale exclusively to certain eligible investors. In addition, Institutional Class shares pay no distribution and service fee.
The performance of Class A shares excludes the applicable sales charge. Both Institutional Class shares and Class A shares reflect the reinvestment of all distributions.
Index performance returns do not reflect any management fees, transaction costs, or expenses. Indices are unmanaged and one cannot invest directly in an index.
Fund objective
The Fund seeks long-term growth of capital.
Advisor
Delaware Management Company (DMC)
Sub-advisors
LSV Asset Management (LSV)
Cardinal Capital Management LLC (Cardinal)
The Board of the Trustees of the Fund approved the appointment of Cardinal as a sub-advisor to the Fund during the fiscal year. Cardinal replaced Westwood Management Corp. (Westwood) as a sub-advisor to Optimum Small-Mid Cap Value Fund. Please see the supplement to the Fund’s prospectus, dated October 5, 2020, for more information.
Market review
The stock market transitioned from one extreme to another as spring turned to summer in 2020. The sharp sell-off in March just before the start of the Fund’s fiscal year, driven by the spread of COVID-19, quickly reversed with a strong rally in stocks as monetary and fiscal stimulus were announced and began to find their way to those who desperately needed relief. The unprecedented nature of the pandemic triggered an equally unprecedented response.
In aggregate, the US fiscal and monetary stimulus announced through the fall of 2020 amounted to $9.5 trillion, more than 40% of the country’s annual gross domestic product (GDP). As these programs were announced and implemented, investors began to rotate into the riskiest areas of the market, driven by the belief that there would be additional stimulus should things take a turn for the worse. Macroeconomic data and fundamental results continued to be materially affected by the pandemic while the market climbed higher.
Unemployment peaked at 15% at the end of April. However, the efforts to reopen businesses saw that figure nearly cut in half by October. Similarly, corporate profits began to recover as the summer progressed and companies adapted to the new environment.
Together, these helped push equities swiftly higher as investors projected better times ahead even as the current situation remained highly challenged.
The stock market’s months-long rally accelerated significantly in the fourth quarter of 2020 and into 2021 as the hope for an effective COVID-19 vaccine became a reality. Investors reacted to the vaccine news and the passage of a second stimulus package by investing in a significant amount of small-cap value exchange-traded funds (ETFs), which caused stocks with the smallest market capitalizations, return on equity (ROE), and earnings to outperform. In addition, companies that had been hurt by economic lockdowns saw their stocks rebound sharply, while those that had benefited from people staying at home saw their stock prices lag.
Source: Bloomberg, unless noted otherwise.
Fund performance
Optimum Small-Mid Cap Value Fund slightly underperformed its benchmark, the Russell 2500 Value Index, for the fiscal year ended March 31, 2021. LSV’s portion of the Fund outperformed the benchmark for the fiscal year, benefiting from its deeper value and smaller-size biases. Westwood’s portion of the Fund trailed the benchmark because of poor sector positioning. Favorable stock selection partially offset this, however. Cardinal, which took over from Westwood in mid-October, also underperformed the benchmark because of its relative underexposure to high-flying commodity-sensitive and highly cyclical stocks, which rallied late in the fiscal year.
LSV
The positive impact of LSV’s portion of the Fund relative to the benchmark was evident in both sector and stock selection. LSV’s portfolio was underweight utilities and real estate, the weakest-performing sectors, and overweight consumer discretionary, the strongest-performing sector. Many of LSV’s retail stocks bounced back strongly after big declines in March 2020.
The two biggest contributors to relative performance were Sonic Automotive Inc., the fifth largest auto retailer in the United States,
15
Table of Contents
Portfolio management reviews
Optimum Small-Mid Cap Value Fund
and sporting goods retailer Dick’s Sporting Goods Inc. Both stocks benefited from an improved economic outlook along with positive news on vaccines. LSV’s portion of the Fund continues to own both stocks as LSV believes that valuations remain reasonably compelling. Restaurant company Brinker International Inc. was also a large contributor to relative performance. LSV eventually sold the stock when its valuation profile became less compelling.
The two largest detractors were Piedmont Office Realty Trust Inc., an office real estate investment trust (REIT) that did not keep up with the market, and Huntington Ingalls Industries Inc., America’s largest military ship-building company. Both stocks remain attractively valued by LSV’s model and LSV believes they are well positioned to benefit from the improving economic outlook.
While it is too early to know if an inflection point has been reached where value stocks can have a sustainable rally, prior periods, such as March 2000 and March 2009, indicate that mean reversion can happen swiftly. LSV has advocated for some time now about what it views as the attractive valuations of the quality companies it owns. LSV’s portion of the Fund continues to trade at valuations close to historical lows and the valuation gap between value and growth based on multiple metrics is at its widest level in many years. LSV believes the growth expectations of the deep value companies it owns have been far too pessimistic. These companies are generating cash, paying dividends, buying back stock, have insider buying activity, and no observable deterioration in quality relative to growth stocks.
As the COVID-19 vaccination rollout continues and economic activity picks up, LSV looks for the stocks in its portion of the Fund to continue to benefit, as they have in recent quarters. At the end of the fiscal period, the Fund was overweight information technology, financials, and consumer staples stocks and underweight industrials, real estate, and energy.
Westwood
During the period of time that Westwood was a sub-advisor to the Fund, the relative underperformance of Westwood’s portion of the Fund came from allocation headwinds that favorable selections only partially offset. Sector positioning, including a modest cash position and an underweight in consumer discretionary, detracted given the sharp recovery seen from recent market lows.
Westwood employs a consistent and disciplined approach that seeks to provide attractive long-term, risk-adjusted returns while protecting capital during unfavorable market periods. Westwood’s stock selection is driven by extensive research to identify companies that Westwood believes lie at the intersection of quality and value and possess both attractive valuations and strong prospects for future cash generation and earnings while maintaining strong balance sheets.
Security selection was strongly positive in some of the hardest hit areas of the market earlier in the year, including energy, materials, and consumer discretionary. However, an underweight to consumer discretionary along with a modest cash position more than offset the positives given the sharp rally that unfolded. Energy, which faced both reduced demand from the pandemic as well as oversupply issues, saw increased cooperation from the Organization of the Petroleum Exporting Countries Plus (OPEC+) in balancing the global market and rallied in tandem with crude oil prices. Materials also moved higher on the prospects for a strong recovery in economic activity from the stimulus efforts both in the US and abroad. In contrast, less favorable selections in financials and industrials served as an offset. Several industries and securities that had fared well initially in the pandemic were pressured as investors rotated into those with greater economic sensitivity, and in many cases, the riskiest and most leveraged within those sectors. Given Westwood’s focus on the intersection of quality and value, this created a challenging period for performance overall.
During the period, three standout performers for Westwood’s portion of the Fund were WPX Energy, IAA Inc., and Williams-Sonoma Inc. WPX Energy benefited from the recovery in crude oil prices, with strong management execution, leading to an eventual value-creating merger with another peer energy producer. IAA gained as the firm adapted its business model of auctioning and selling used and salvaged cars to an online format. As driving resumed, this helped bolster demand for its services and saw results far exceed consensus forecasts. Williams-Sonoma shares moved higher as home-bound consumers transitioned their purchasing to its ecommerce platforms at an increasing rate, sending sales markedly higher and boosting its cash generation.
Three detractors from performance for Westwood’s portion of the Fund were Avista Corp., Hudson Pacific Properties Inc., and Washington Federal Inc. Avista saw an increase in bad debt expense, as consumers affected by the pandemic struggled to pay their utility bills, pressuring shares. Additionally, investors rotated away from more defensive areas of the market. Hudson Pacific Properties fell on concerns over reduced long-term demand for its office properties, largely located in San Francisco and the west coast, as more employees work from home. Washington Federal declined as the repricing of its assets was choppier than expected, amid the broader rotation into more asset-sensitive banks within the sector.
16
Table of Contents
Cardinal
Cardinal’s portion of the Fund lagged the benchmark. Cardinal’s focus on owning high-quality businesses and its lower exposure to commodity-sensitive and highly cyclical stocks drove its relative underperformance.
In managing its portion of the Fund’s assets, Cardinal employs a cash-flow-oriented investment process. Cardinal believes that a company’s stock price is ultimately determined by its ability to generate excess cash flow and redeploy that cash to enhance shareholder value. The investment process is based on detailed five-year projections that include an analysis of the company’s financials and interviews with the company’s management. Cardinal looks for companies with significant free cash flow, stable and predictable business models, and competent management.
Stock selection in the materials and industrials sectors was the primary detractor from relative performance. In the materials sector, the share price of consumer goods packaging company Silgan Holdings Inc. lagged the sector’s greater-than-40% increase. Silgan’s business is largely insensitive to raw material prices and has benefited from consumers staying at home.
The share price of agricultural chemical supplier FMC Corp. lagged as its business grew nicely despite pandemic-related headwinds but is unlikely to benefit meaningfully from an acceleration in economic activity, in Cardinal’s view. The company also reported weaker-than-expected quarterly results due to a drought in Brazil, logistics issues related to COVID-19, and customs issues. FMC’s guidance for the first quarter of 2021 was lackluster though it did not materially change expectations for the entire year.
In the industrials sector, the share price of KAR Auction Services Inc., which provides auction and other services to the wholesale used car market, lagged after KAR announced disappointing fourth-quarter results and guidance for 2021. Sharply elevated used car prices caused auto dealers to sell trade-ins and vehicles coming off lease themselves, which reduced KAR’s auction volumes. In addition, an extended pandemic-related moratorium on auto repossessions further reduced volumes. Despite their near-term impact, Cardinal expects both supply constraints will prove transitory.
Stock selection in the healthcare sector and both stock selection and a higher weighting in financials contributed to relative performance. In healthcare, shares of the biopharmaceutical firm Ligand Pharmaceuticals Inc. rose sharply along with other heavily shorted stocks as hedge funds with large short positions in more speculative names were forced to reduce their exposures to other names after experiencing heavy losses. The portfolio managers sold 60% of the position in January and the balance in February as the stock more than doubled and reached Cardinal’s price target. The stock price of healthcare technology solutions provider Change Healthcare Inc. rose after UnitedHealth Group announced an agreement to acquire the company at a 40% premium. The Change position represented more than 3% of the portfolio at the end of 2020. Cardinal began trimming the position at the end of January as it believed a topping bid was unlikely and, although there are provisions in the merger agreement to address antitrust concerns, they exist.
In the financials sector, Cardinal had notably strong relative performance in the diversified financials industry group. The stock prices of the portfolio’s bank holdings outpaced peers and increased more than 70% due to a more optimistic credit outlook and depressed valuations. A notable contributor in financials was the West Coast commercial bank PacWest Bancorp, whose shares rose significantly and outperformed peers after its earnings beat expectations on a lower-than-expected loan loss provision and after it announced a niche lending acquisition. As a result, its recent significant valuation discount started to dissipate.
17
Table of Contents
Performance summaries
Optimum Fixed Income Fund
March 31, 2021 (Unaudited)
The performance quoted represents past performance and does not guarantee future results. Investment return and principal value of an investment will fluctuate so that shares, when redeemed, may be worth more or less than their original cost. Current performance may be lower or higher than the performance quoted. Please obtain the performance data for the most recent month end by calling 800 914-0278 or visiting our website at optimummutualfunds.com/performance.
| Fund and benchmark performance1,2 | Average annual total returns through March 31, 2021 | |
| | 1 year | | 5 year | | 10 year | |
| Class A (Est. August 1, 2003) | | | | | | | |
| Excluding sales charge | | +5.21% | | +3.52% | | +3.17% | |
| Including sales charge | | +0.43% | | +2.57% | | +2.69% | |
| Class C (Est. August 1, 2003) | | | | | | | |
| Excluding sales charge | | +4.30% | | +2.73% | | +2.42% | |
| Including sales charge | | +3.30% | | +2.73% | | +2.42% | |
| Institutional Class (Est. August 1, 2003) | | | | | | | |
| Excluding sales charge | | +5.37% | | +3.77% | | +3.44% | |
| Including sales charge | | +5.37% | | +3.77% | | +3.44% | |
| Bloomberg Barclays US Aggregate Index | | +0.71% | | +3.10% | | +3.44% | |
| 1 | Returns reflect the reinvestment of all distributions and are presented both with and without the applicable sales charges described below. Returns do not reflect the deduction of taxes the shareholder would pay on Fund distributions or redemptions of Fund shares. |
Expense limitations were in effect for certain classes during some or all of the periods shown in the “Fund and benchmark performance” graph. The current expenses for each class are listed on the “Fund expense ratios” table on the next page. Performance would have been lower had expense limitations not been in effect.
Institutional Class shares are not subject to a sales charge and are offered for sale exclusively to certain eligible investors. In addition, Institutional Class shares pay no distribution and service fee.
Class A shares are sold with a maximum front-end sales charge of up to 4.50%, and have an annual distribution and service fee of up to 0.25% of average daily net assets. Performance for Class A shares, excluding sales charges, assumes that no front-end sales charge applied.
Class C shares are sold with a contingent deferred sales charge of 1.00% if redeemed during the first 12 months. They are also subject to an annual distribution and service fee of up to 1.00% of average daily net assets.
Performance for Class C shares, excluding sales charges, assumes either that contingent deferred sales charges did not apply or that the investment was not redeemed.
The “Fund and benchmark performance” table and the “Performance of a $10,000 investment” graph do not reflect the deduction of taxes the shareholder would pay on Fund distributions or redemptions of Fund shares.
| 2 | The Fund’s expense ratios, as described in the most recent prospectus, are disclosed in the “Fund expense ratios” table on the next page. Delaware Management Company has agreed to reimburse certain expenses and/or waive certain fees in order to prevent total fund operating expenses (excluding any 12b-1 fees and certain other expenses) from exceeding 0.85% of the Fund’s average daily net assets from April 1, 2020 through March 31, 2021.* Please see the most recent prospectus and any applicable supplement(s) for additional information on these fee waivers and/or reimbursements. |
18
Table of Contents
| Fund expense ratios | | Class A | | Class C | | Institutional Class |
| Total annual operating expenses (without fee waivers) | | 1.07% | | 1.82% | | 0.82% |
| Net expenses (including fee waivers, if any) | | 1.07% | | 1.82% | | 0.82% |
| Type of waiver | | Contractual | | Contractual | | Contractual |
| * | The aggregate contractual waiver period covering this report is from July 29, 2019 to July 29, 2021. |
Fixed income securities and bond funds can lose value, and investors can lose principal, as interest rates rise. They also may be affected by economic conditions that hinder an issuer’s ability to make interest and principal payments on its debt.
The Fund may also be subject to prepayment risk, the risk that the principal of a bond that is held by a portfolio will be prepaid prior to maturity, at the time when interest rates are lower than what the bond was paying. A portfolio may then have to reinvest that money at a lower interest rate.
High yielding, non-investment-grade bonds (junk bonds) involve higher risk than investment grade bonds.
The high yield secondary market is particularly susceptible to liquidity problems when institutional investors, such as mutual funds and certain other financial institutions, temporarily stop buying bonds for regulatory, financial, or other reasons. In addition, a less liquid secondary market makes it more difficult for the Fund to obtain precise valuations of the high yield securities in its portfolio.
Securities in the lowest of the rating categories considered to be investment grade (that is, Baa or BBB) have some speculative characteristics.
This document may mention bond ratings published by nationally recognized statistical rating organizations (NRSROs) Standard & Poor’s, Moody’s Investors Service, and Fitch, Inc. For securities rated by an NRSRO other than S&P, the rating is converted to the equivalent S&P credit rating. Bonds rated AAA are rated as having the highest quality and are generally considered to have the lowest degree of investment risk. Bonds rated AA are considered to be of high quality, but with a slightly higher degree of risk than bonds rated AAA. Bonds rated A are considered to have many favorable investment qualities, though they are somewhat more susceptible to adverse economic conditions. Bonds rated BBB are believed to be of medium-grade quality and generally riskier over the long term.
Bonds rated BB, B, and CCC are regarded as having significant speculative characteristics, with BB indicating the least degree of speculation of the three.
If and when the Fund invests in forward foreign currency contracts or uses other investments to hedge against currency risks, the Fund will be subject to special risks, including counterparty risk.
The Fund may invest in derivatives, which may involve additional expenses and are subject to risk, including the risk that an underlying security or securities index moves in the opposite direction from what the portfolio manager anticipated. A derivatives transaction depends upon the counterparties’ ability to fulfill their contractual obligations.
Portfolio turnover is a measure of how frequently the managers buy and sell assets within a fund over a particular period. It is usually reported for a 12-month time period.
The disruptions caused by natural disasters, pandemics, or similar events could prevent the Fund from executing advantageous investment decisions in a timely manner and could negatively impact the Fund’s ability to achieve its investment objective and the value of the Fund’s investments.
(continues) 19
Table of Contents
Performance summaries
Optimum Fixed Income Fund
Performance of a $10,000 investment1
Average annual total returns from March 31, 2011 through March 31, 2021
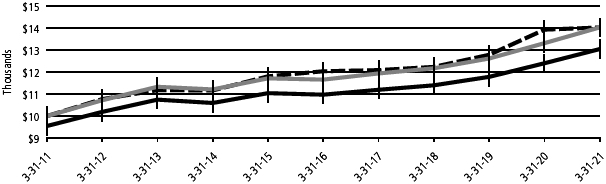
| For period beginning March 31, 2011 through March 31, 2021 | | Starting value | | Ending value |
 | Optimum Fixed Income Fund — Institutional Class shares | | | $ | 10,000 | | | | $ | 14,028 | |
 | Bloomberg Barclays US Aggregate Index | | | $ | 10,000 | | | | $ | 14,025 | |
 | Optimum Fixed Income Fund — Class A shares | | | $ | 9,550 | | | | $ | 13,045 | |
| 1 | The “Performance of $10,000 investment” graph assumes $10,000 invested in Class A and Institutional Class shares of the Fund on March 31, 2011, and includes the effect of a 4.50% front-end sales charge (for Class A shares) and the reinvestment of all distributions. The graph does not reflect the deduction of taxes the shareholders would pay on Fund distributions or redemptions of Fund shares. Expense limitations were in effect for some or all of the periods shown. Performance would have been lower had expense limitations not been in effect. Current expenses are listed in the “Fund expense ratios” table on page 19. Please note additional details on pages 18 through 20. |
The graph also assumes $10,000 invested in the Bloomberg Barclays US Aggregate Index as of March 31, 2011. The Bloomberg Barclays US Aggregate Index is a broad composite that tracks the investment grade domestic bond market.
The Purchasing Managers’ Indices (PMIs), mentioned on page 1, are indicators of the economic health of a country’s manufacturing sector. A PMI reading above 50% indicates that the manufacturing economy is generally expanding; below 50% indicates that it is generally contracting.
Index performance returns do not reflect any management fees, transaction costs, or expenses. Indices are unmanaged and one cannot invest directly in an index. Past performance is not a guarantee of future results.
Performance of other Fund classes will vary due to different charges and expenses.
Stock symbols and CUSIP numbers
| | Nasdaq | | |
| | symbols | | CUSIPs |
| Class A | | OAFIX | | 246118681 |
| Class C | | OCFIX | | 246118665 |
| Institutional Class | | OIFIX | | 246118657 |
20
Table of Contents
Performance summaries
Optimum International Fund
March 31, 2021 (Unaudited)
The performance quoted represents past performance and does not guarantee future results. Investment return and principal value of an investment will fluctuate so that shares, when redeemed, may be worth more or less than their original cost. Current performance may be lower or higher than the performance quoted. Please obtain the performance data for the most recent month end by calling 800 914-0278 or visiting our website at optimummutualfunds.com/performance.
| Fund and benchmark performance1,2 | | Average annual total returns through March 31, 2021 |
| | 1 year | | 5 year | | 10 year |
| Class A (Est. August 1, 2003) | | | | | | |
| Excluding sales charge | | +58.04%* | | +10.26% | | +5.47% |
| Including sales charge | | +48.91% | | +8.96% | | +4.85% |
| Class C (Est. August 1, 2003) | | | | | | |
| Excluding sales charge | | +56.92% | | +9.45% | | +4.70% |
| Including sales charge | | +55.92% | | +9.45% | | +4.70% |
| Institutional Class (Est. August 1, 2003) | | | | | | |
| Excluding sales charge | | +58.48%* | | +10.54% | | +5.76% |
| Including sales charge | | +58.48% | | +10.54% | | +5.76% |
| MSCI ACWI ex USA Index (net) | | +49.41% | | +9.76% | | +4.93% |
| MSCI ACWI ex USA Index (gross) | | +50.03% | | +10.28% | | +5.41% |
| * | Total returns for the report period presented in the table differs from the return in “Financial highlights.” The total returns presented in the above table are calculated based on the net asset value (NAV) at which shareholder transactions were processed. The total returns presented in “Financial highlights” are calculated in the same manner, but also takes into account certain adjustments that are necessary under US generally accepted accounting principles (US GAAP) required in the annual report. |
| 1 | Returns reflect the reinvestment of all distributions and are presented both with and without the applicable sales charges described below. Returns do not reflect the deduction of taxes the shareholder would pay on Fund distributions or redemptions of Fund shares. |
Expense limitations were in effect for certain classes during some or all of the periods shown in the “Fund and benchmark performance” graph. The current expenses for each class are listed on the “Fund expense ratios” table on the next page. Performance would have been lower had expense limitations not been in effect.
Institutional Class shares are not subject to a sales charge and are offered for sale exclusively to certain eligible investors. In addition, Institutional Class shares pay no distribution and service fee.
Class A shares are sold with a maximum front-end sales charge of up to 5.75%, and have an annual distribution and service fee of up to 0.25% of average daily net assets. Performance for Class A shares, excluding sales charges, assumes that no front-end sales charge applied.
Class C shares are sold with a contingent deferred sales charge of 1.00% if redeemed during the first 12 months. They are also subject to an annual distribution and service fee of up to 1.00% of average daily net assets.
Performance for Class C shares, excluding sales charges, assumes either that contingent deferred sales charges did not apply or that the investment was not redeemed.
The “Fund and benchmark performance” table and the “Performance of a $10,000 investment” graph do not reflect the deduction of taxes the shareholder would pay on Fund distributions or redemptions of Fund shares.
| 2 | The Fund’s expense ratios, as described in the most recent prospectus, are disclosed in the “Fund expense ratios” table on the next page. Delaware Management Company has agreed to reimburse certain expenses and/or waive certain fees in order to prevent total fund operating expenses (excluding any 12b-1 fees and certain other expenses) from exceeding 1.17% of the Fund’s average daily net assets from July 29, 2020 through March 31, 2021. From April 1, 2020 through July 28, 2020, the expense waiver was 1.12% of the Fund’s average daily net assets.* Please see the most recent prospectus and any applicable supplement(s) for additional information on these fee waivers and/or reimbursements. |
(continues) 21
Table of Contents
Performance summaries
Optimum International Fund
| Fund expense ratios | | Class A | | Class C | | Institutional Class |
| Total annual operating expenses (without fee waivers) | | 1.39% | | 2.14% | | 1.14% |
| Net expenses (including fee waivers, if any) | | 1.39% | | 2.14% | | 1.14% |
| Type of waiver | | Contractual | | Contractual | | Contractual |
| * | The aggregate contractual waiver period covering this report is from July 29, 2019 to July 29, 2021. |
International investments entail risks including fluctuation in currency values, differences in accounting principles, or economic or political instability. Investing in emerging markets can be riskier than investing in established foreign markets due to increased volatility, lower trading volume, and higher risk of market closures. In many emerging markets, there is substantially less publicly available information and the available information may be incomplete or misleading. Legal claims are generally more difficult to pursue.
The Fund may invest in derivatives, which may involve additional expenses and are subject to risk, including the risk that an underlying security or securities index moves in the opposite direction from what the portfolio manager anticipated. A derivatives transaction depends upon the counterparties’ ability to fulfill their contractual obligations.
There is no guarantee that dividend-paying stocks will continue to pay dividends.
The disruptions caused by natural disasters, pandemics, or similar events could prevent the Fund from executing advantageous investment decisions in a timely manner and could negatively impact the Fund’s ability to achieve its investment objective and the value of the Fund’s investments.
Performance of a $10,000 investment1
Average annual total returns from March 31, 2011 through March 31, 2021
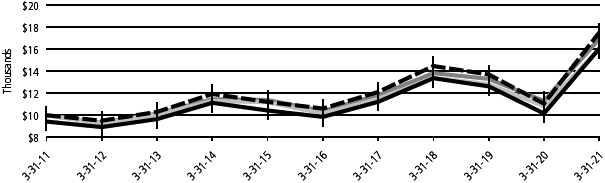
| For period beginning March 31, 2011 through March 31, 2021 | | Starting value | | Ending value |
| Optimum International Fund — Institutional Class shares | | | $ | 10,000 | | | | $ | 17,514 | |
 | MSCI ACWI ex USA Index (gross) | | | $ | 10,000 | | | | $ | 16,942 | |
| Optimum International Fund — Class A shares | | | $ | 9,425 | | | | $ | 16,056 | |
| MSCI ACWI ex USA Index (net) | | | $ | 10,000 | | | | $ | 15,974 | |
| 1 | The “Performance of $10,000 investment” graph assumes $10,000 invested in Class A and Institutional Class shares of the Fund on March 31, 2011, and includes the effect of a 5.75% front-end sales charge (for Class A shares) and the reinvestment of all distributions. The graph does not reflect the deduction of taxes the shareholders would pay on Fund distributions or redemptions of Fund shares. Expense limitations were in effect for some or all of the periods shown. Performance would have been lower had expense limitations not been in effect. Current expenses are listed in the “Fund expense ratios” table above. Please note additional details on pages 21 through 23. |
22
Table of Contents
The graph also assumes $10,000 invested in the MSCI ACWI ex USA Index as of March 31, 2011. The MSCI ACWI ex USA Index is a free float-adjusted market capitalization weighted index that is designed to measure equity market performance across developed and emerging markets worldwide, excluding the United States. Index “gross” return approximates the maximum possible dividend reinvestment. Index “net” return approximates the minimum possible dividend reinvestment, after deduction of withholding tax at the highest possible rate.
Index performance returns do not reflect any management fees, transaction costs, or expenses. Indices are unmanaged and one cannot invest directly in an index. Past performance is not a guarantee of future results.
Performance of other Fund classes will vary due to different charges and expenses.
Stock symbols and CUSIP numbers
| | Nasdaq | | |
| | symbols | | CUSIPs |
| Class A | | OAIEX | | 246118731 |
| Class C | | OCIEX | | 246118715 |
| Institutional Class | | OOIIX | | 246118699 |
(continues) 23
Table of Contents
Performance summaries
Optimum Large Cap Growth Fund
March 31, 2021 (Unaudited)
The performance quoted represents past performance and does not guarantee future results. Investment return and principal value of an investment will fluctuate so that shares, when redeemed, may be worth more or less than their original cost. Current performance may be lower or higher than the performance quoted. Please obtain the performance data for the most recent month end by calling 800 914-0278 or visiting our website at optimummutualfunds.com/performance.
| Fund and benchmark performance1,2 | | Average annual total returns through March 31, 2021 |
| | 1 year | | 5 year | | 10 year |
| Class A (Est. August 1, 2003) | | | | | | |
| Excluding sales charge | | +57.75% | | +19.25% | | +14.99% |
| Including sales charge | | +48.64% | | +17.85% | | +14.31% |
| Class C (Est. August 1, 2003) | | | | | | |
| Excluding sales charge | | +56.56% | | +18.35% | | +14.16% |
| Including sales charge | | +55.56% | | +18.35% | | +14.16% |
| Institutional Class (Est. August 1, 2003) | | | | | | |
| Excluding sales charge | | +58.11% | | +19.55% | | +15.31% |
| Including sales charge | | +58.11% | | +19.55% | | +15.31% |
| Russell 1000 Growth Index | | +62.74% | | +21.05% | | +16.63% |
| 1 | Returns reflect the reinvestment of all distributions and are presented both with and without the applicable sales charges described below. Returns do not reflect the deduction of taxes the shareholder would pay on Fund distributions or redemptions of Fund shares. |
Expense limitations were in effect for certain classes during some or all of the periods shown in the “Fund and benchmark performance” graph. The current expenses for each class are listed on the “Fund expense ratios” table on the next page. Performance would have been lower had expense limitations not been in effect.
Institutional Class shares are not subject to a sales charge and are offered for sale exclusively to certain eligible investors. In addition, Institutional Class shares pay no distribution and service fee.
Class A shares are sold with a maximum front-end sales charge of up to 5.75%, and have an annual distribution and service fee of up to 0.25% of average daily net assets. Performance for Class A shares, excluding sales charges, assumes that no front-end sales charge applied.
Class C shares are sold with a contingent deferred sales charge of 1.00% if redeemed during the first 12 months. They are also subject to an annual distribution and service fee of up to 1.00% of average daily net assets.
Performance for Class C shares, excluding sales charges, assumes either that contingent deferred sales charges did not apply or that the investment was not redeemed.
The “Fund and benchmark performance” table and the “Performance of a $10,000 investment” graph do not reflect the deduction of taxes the shareholder would pay on Fund distributions or redemptions of Fund shares.
| 2 | The Fund’s expense ratios, as described in the most recent prospectus, are disclosed in the “Fund expense ratios” table on the next page. Delaware Management Company has agreed to reimburse certain expenses and/or waive certain fees in order to prevent total fund operating expenses (excluding any 12b-1 fees and certain other expenses) from exceeding 1.02% of the Fund’s average daily net assets from April 1, 2020 through March 31, 2021.* Please see the most recent prospectus and any applicable supplement(s) for additional information on these fee waivers and/or reimbursements. |
24
Table of Contents
| Fund expense ratios | | Class A | | Class C | | Institutional Class |
| Total annual operating expenses (without fee waivers) | | 1.24% | | 1.99% | | 0.99% |
| Net expenses (including fee waivers, if any) | | 1.24% | | 1.99% | | 0.99% |
| Type of waiver | | Contractual | | Contractual | | Contractual |
| * | The aggregate contractual waiver period covering this report is from July 29, 2019 to July 29, 2021. |
REIT investments are subject to many of the risks associated with direct real estate ownership, including change in economic conditions, credit risk, and interest rate fluctuations. A REIT fund’s tax status as a regulated investment company could be jeopardized if it holds real estate directly, as a result of defaults or receive rental income from real estate holdings.
The disruptions caused by natural disasters, pandemics, or similar events could prevent the Fund from executing advantageous investment decisions in a timely manner and could negatively impact the Fund’s ability to achieve its investment objective and the value of the Fund’s investments.
Performance of a $10,000 investment1
Average annual total returns from March 31, 2011 through March 31, 2021
| For period beginning March 31, 2011 through March 31, 2021 | | Starting value | | Ending value |
 | Russell 1000 Growth Index | | $10,000 | | $28,622 |
 | Optimum Large Cap Growth Fund — Institutional Class shares | | $10,000 | | $26,275 |
 | Optimum Large Cap Growth Fund — Class A shares | | $ 9,425 | | $24,149 |
| 1 | The “Performance of $10,000 investment” graph assumes $10,000 invested in Class A and Institutional Class shares of the Fund on March 31, 2011, and includes the effect of a 5.75% front-end sales charge (for Class A shares) and the reinvestment of all distributions. The graph does not reflect the deduction of taxes the shareholders would pay on Fund distributions or redemptions of Fund shares. Expense limitations were in effect for some or all of the periods shown. Performance would have been lower had expense limitations not been in effect. Current expenses are listed in the “Fund expense ratios” table above. Please note additional details on pages 24 through 26. |
The graph also assumes $10,000 invested in the Russell 1000 Growth Index as of March 31, 2011. The Russell 1000 Growth Index measures the performance of the large-cap growth segment of the US equity universe. It includes those Russell 1000 companies with higher price-to-book ratios and higher forecasted growth values.
The Russell 1000 Value Index, mentioned on page 7, measures the performance of the large-cap value segment of the US equity universe. It includes those Russell 1000 companies with lower price-to-book ratios and lower forecasted growth values.
The S&P 500 Index, mentioned on page 7, measures the performance of 500 mostly large-cap stocks weighted by market value, and is often used to represent performance of the US stock market.
(continues) 25
Table of Contents
Performance summaries
Optimum Large Cap Growth Fund
Frank Russell Company is the source and owner of the trademarks, service marks and copyrights related to the Russell Indexes. Russell® is a trademark of Frank Russell Company.
Index performance returns do not reflect any management fees, transaction costs, or expenses. Indices are unmanaged and one cannot invest directly in an index. Past performance is not a guarantee of future results.
Performance of other Fund classes will vary due to different charges and expenses.
Stock symbols and CUSIP numbers
| | Nasdaq | | |
| | symbols | | CUSIPs |
| Class A | | OALGX | | 246118707 |
| Class C | | OCLGX | | 246118889 |
| Institutional Class | | OILGX | | 246118871 |
26
Table of Contents
Performance summaries
Optimum Large Cap Value Fund
March 31, 2021 (Unaudited)
The performance quoted represents past performance and does not guarantee future results. Investment return and principal value of an investment will fluctuate so that shares, when redeemed, may be worth more or less than their original cost. Current performance may be lower or higher than the performance quoted. Please obtain the performance data for the most recent month end by calling 800 914-0278 or visiting our website at optimummutualfunds.com/performance.
| Fund and benchmark performance1,2 | | Average annual total returns through March 31, 2021 |
| | 1 year | | 5 year | | 10 year |
| Class A (Est. August 1, 2003) | | | | | | |
| Excluding sales charge | | +50.73% | | +10.85% | | +9.29% |
| Including sales charge | | +42.02% | | +9.55% | | +8.65% |
| Class C (Est. August 1, 2003) | | | | | | |
| Excluding sales charge | | +49.61% | | +10.02% | | +8.50% |
| Including sales charge | | +48.61% | | +10.02% | | +8.50% |
| Institutional Class (Est. August 1, 2003) | | | | | | |
| Excluding sales charge | | +51.11% | | +11.13% | | +9.58% |
| Including sales charge | | +51.11% | | +11.13% | | +9.58% |
| Russell 1000 Value Index | | +56.09% | | +11.74% | | +10.99% |
| 1 | Returns reflect the reinvestment of all distributions and are presented both with and without the applicable sales charges described below. Returns do not reflect the deduction of taxes the shareholder would pay on Fund distributions or redemptions of Fund shares. |
Expense limitations were in effect for certain classes during some or all of the periods shown in the “Fund and benchmark performance” graph. The current expenses for each class are listed on the “Fund expense ratios” table on the next page. Performance would have been lower had expense limitations not been in effect.
Institutional Class shares are not subject to a sales charge and are offered for sale exclusively to certain eligible investors. In addition, Institutional Class shares pay no distribution and service fee.
Class A shares are sold with a maximum front-end sales charge of up to 5.75%, and have an annual distribution and service fee of up to 0.25% of average daily net assets. Performance for Class A shares, excluding sales charges, assumes that no front-end sales charge applied.
Class C shares are sold with a contingent deferred sales charge of 1.00% if redeemed during the first 12 months. They are also subject to an annual distribution and service fee of up to 1.00% of average daily net assets.
Performance for Class C shares, excluding sales charges, assumes either that contingent deferred sales charges did not apply or that the investment was not redeemed.
The “Fund and benchmark performance” table and the “Performance of a $10,000 investment” graph do not reflect the deduction of taxes the shareholder would pay on Fund distributions or redemptions of Fund shares.
| 2 | The Fund’s expense ratios, as described in the most recent prospectus, are disclosed in the “Fund expense ratios” table on the next page. Delaware Management Company has agreed to reimburse certain expenses and/or waive certain fees in order to prevent total fund operating expenses (excluding any 12b-1 fees and certain other expenses) from exceeding 0.97% of the Fund’s average daily net assets from April 1, 2020 through March 31, 2021.* Please see the most recent prospectus and any applicable supplement(s) for additional information on these fee waivers and/or reimbursements. |
(continues) 27
Table of Contents
Performance summaries
Optimum Large Cap Value Fund
| Fund expense ratios | | Class A | | Class C | | Institutional Class |
| Total annual operating expenses (without fee waivers) | | 1.20% | | 1.95% | | 0.95% |
| Net expenses (including fee waivers, if any) | | 1.20% | | 1.95% | | 0.95% |
| Type of waiver | | Contractual | | Contractual | | Contractual |
| * | The aggregate contractual waiver period covering this report is from July 29, 2019 to July 29, 2021. |
The disruptions caused by natural disasters, pandemics, or similar events could prevent the Fund from executing advantageous investment decisions in a timely manner and could negatively impact the Fund’s ability to achieve its investment objective and the value of the Fund’s investments.
Performance of a $10,000 investment1
Average annual total returns from March 31, 2011 through March 31, 2021
| For period beginning March 31, 2011 through March 31, 2021 | | Starting value | | Ending value |
| Russell 1000 Value Index | | $10,000 | | $28,372 |
| Optimum Large Cap Value Fund — Institutional Class shares | | $10,000 | | $24,973 |
| Optimum Large Cap Value Fund — Class A shares | | $ 9,425 | | $22,917 |
| 1 | The “Performance of $10,000 investment” graph assumes $10,000 invested in Class A and Institutional Class shares of the Fund on March 31, 2011, and includes the effect of a 5.75% front-end sales charge (for Class A shares) and the reinvestment of all distributions. The graph does not reflect the deduction of taxes the shareholders would pay on Fund distributions or redemptions of Fund shares. Expense limitations were in effect for some or all of the periods shown. Performance would have been lower had expense limitations not been in effect. Current expenses are listed in the “Fund expense ratios” table above. Please note additional details on pages 27 through 29. |
The graph also assumes $10,000 invested in the Russell 1000 Value Index as of March 31, 2011. The Russell 1000 Value Index measures the performance of the large-cap value segment of the US equity universe. It includes those Russell 1000 companies with lower price-to-book ratios and lower forecasted growth values.
Frank Russell Company is the source and owner of the trademarks, service marks and copyrights related to the Russell Indexes. Russell® is a trademark of Frank Russell Company.
Index performance returns do not reflect any management fees, transaction costs, or expenses. Indices are unmanaged and one cannot invest directly in an index. Past performance is not a guarantee of future results.
Performance of other Fund classes will vary due to different charges and expenses.
28
Table of Contents
Stock symbols and CUSIP numbers
| | Nasdaq | | |
| | symbols | | CUSIPs |
| Class A | | OALVX | | 246118863 |
| Class C | | OCLVX | | 246118848 |
| Institutional Class | | OILVX | | 246118830 |
(continues) 29
Table of Contents
Performance summaries
Optimum Small-Mid Cap Growth Fund
March 31, 2021 (Unaudited)
The performance quoted represents past performance and does not guarantee future results. Investment return and principal value of an investment will fluctuate so that shares, when redeemed, may be worth more or less than their original cost. Current performance may be lower or higher than the performance quoted. Please obtain the performance data for the most recent month end by calling 800 914-0278 or visiting our website at optimummutualfunds.com/performance.
| Fund and benchmark performance1,2 | | Average annual total returns through March 31, 2021 |
| | 1 year | | 5 year | | 10 year |
| Class A (Est. August 1, 2003) | | | | | | |
| Excluding sales charge | | +109.54% | | +23.07% | | +13.39% |
| Including sales charge | | +97.50% | | +21.62% | | +12.72% |
| Class C (Est. August 1, 2003) | | | | | | |
| Excluding sales charge | | +108.02% | | +22.15% | | +12.58% |
| Including sales charge | | +107.02% | | +22.15% | | +12.58% |
| Institutional Class (Est. August 1, 2003) | | | | | | |
| Excluding sales charge | | +110.06% | | +23.37% | | +13.71% |
| Including sales charge | | +110.06% | | +23.37% | | +13.71% |
| Russell 2500 Growth Index | | +87.50% | | +19.91% | | +14.20% |
| 1 | Returns reflect the reinvestment of all distributions and are presented both with and without the applicable sales charges described below. Returns do not reflect the deduction of taxes the shareholder would pay on Fund distributions or redemptions of Fund shares. |
Expense limitations were in effect for certain classes during some or all of the periods shown in the “Fund and benchmark performance” graph. The current expenses for each class are listed on the “Fund expense ratios” table on the next page. Performance would have been lower had expense limitations not been in effect.
Institutional Class shares are not subject to a sales charge and are offered for sale exclusively to certain eligible investors. In addition, Institutional Class shares pay no distribution and service fee.
Class A shares are sold with a maximum front-end sales charge of up to 5.75%, and have an annual distribution and service fee of up to 0.25% of average daily net assets. Performance for Class A shares, excluding sales charges, assumes that no front-end sales charge applied.
Class C shares are sold with a contingent deferred sales charge of 1.00% if redeemed during the first 12 months. They are also subject to an annual distribution and service fee of up to 1.00% of average daily net assets.
Performance for Class C shares, excluding sales charges, assumes either that contingent deferred sales charges did not apply or that the investment was not redeemed.
The “Fund and benchmark performance” table and the “Performance of a $10,000 investment” graph do not reflect the deduction of taxes the shareholder would pay on Fund distributions or redemptions of Fund shares.
| 2 | The Fund’s expense ratios, as described in the most recent prospectus, are disclosed in the “Fund expense ratios” table on the next page. Delaware Management Company has agreed to reimburse certain expenses and/or waive certain fees in order to prevent total fund operating expenses (excluding any 12b-1 fees and certain other expenses) from exceeding 1.32% of the Fund’s average daily net assets from July 29, 2020 through March 31, 2021. From April 1, 2020 through July 28, 2020, the expense waiver was 1.29% of the Fund’s average daily net assets.* Please see the most recent prospectus and any applicable supplement(s) for additional information on these fee waivers and/or reimbursements. |
30
Table of Contents
| Fund expense ratios | | Class A | | Class C | | Institutional Class |
| Total annual operating expenses (without fee waivers) | | 1.63% | | 2.38% | | 1.38% |
| Net expenses (including fee waivers, if any) | | 1.57% | | 2.32% | | 1.32% |
| Type of waiver | | Contractual | | Contractual | | Contractual |
| * | The aggregate contractual waiver period covering this report is from July 29, 2019 to July 29, 2021. |
Investments in small and/or medium-sized companies typically exhibit greater risk and higher volatility than larger, more established companies.
The disruptions caused by natural disasters, pandemics, or similar events could prevent the Fund from executing advantageous investment decisions in a timely manner and could negatively impact the Fund’s ability to achieve its investment objective and the value of the Fund’s investments.
Performance of a $10,000 investment1
Average annual total returns from March 31, 2011 through March 31, 2021
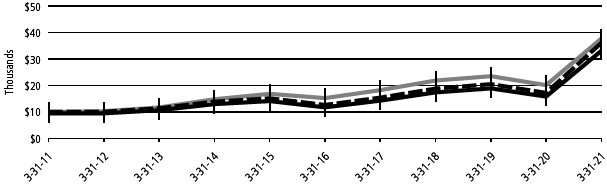
| For period beginning March 31, 2011 through March 31, 2021 | | Starting value | | Ending value |
| Russell 2500 Growth Index | | | $ | 10,000 | | | | $ | 37,743 | |
| Optimum Small-Mid Cap Growth Fund — Institutional Class shares | | | $ | 10,000 | | | | $ | 36,125 | |
| Optimum Small-Mid Cap Growth Fund — Class A shares | | | $ | 9,425 | | | | $ | 33,119 | |
| 1 | The “Performance of $10,000 investment” graph assumes $10,000 invested in Class A and Institutional Class shares of the Fund on March 31, 2011, and includes the effect of a 5.75% front-end sales charge (for Class A shares) and the reinvestment of all distributions. The graph does not reflect the deduction of taxes the shareholders would pay on Fund distributions or redemptions of Fund shares. Expense limitations were in effect for some or all of the periods shown. Performance would have been lower had expense limitations not been in effect. Current expenses are listed in the “Fund expense ratios” table above. Please note additional details on pages 30 through 32. |
The graph also assumes $10,000 invested in the Russell 2500 Growth Index as of March 31, 2011. The Russell 2500 Growth Index measures the performance of the small- to mid-cap growth segment of the US equity universe. It includes those Russell 2500 companies with higher price-to-book ratios and higher forecasted growth values.
The Russell 2000 Index, mentioned on page 12, measures the performance of the small-cap segment of the US equity universe.
The Russell 1000 Index, mentioned on page 12, measures the performance of the large-cap segment of the US equity universe.
Frank Russell Company is the source and owner of the trademarks, service marks, and copyrights related to the Russell Indexes. Russell® is a trademark of Frank Russell Company.
(continues) 31
Table of Contents
Performance summaries
Optimum Small-Mid Cap Growth Fund
Index performance returns do not reflect any management fees, transaction costs, or expenses. Indices are unmanaged and one cannot invest directly in an index. Past performance is not a guarantee of future results.
Performance of other Fund classes will vary due to different charges and expenses.
Stock symbols and CUSIP numbers
| | Nasdaq | | |
| | symbols | | CUSIPs |
| Class A | | OASGX | | 246118822 |
| Class C | | OCSGX | | 246118798 |
| Institutional Class | | OISGX | | 246118780 |
32
Table of Contents
Performance summaries
Optimum Small-Mid Cap Value Fund
March 31, 2021 (Unaudited)
The performance quoted represents past performance and does not guarantee future results. Investment return and principal value of an investment will fluctuate so that shares, when redeemed, may be worth more or less than their original cost. Current performance may be lower or higher than the performance quoted. Please obtain the performance data for the most recent month end by calling 800 914-0278 or visiting our website at optimummutualfunds.com/performance.
| Fund and benchmark performance1,2 | | Average annual total returns through March 31, 2021 |
| | 1 year | | 5 year | | 10 year |
| Class A (Est. August 1, 2003) | | | | | | |
| Excluding sales charge | | +86.21% | | +9.74% | | +6.85% |
| Including sales charge | | +75.50% | | +8.45% | | +6.21% |
| Class C (Est. August 1, 2003) | | | | | | |
| Excluding sales charge | | +84.75% | | +8.91% | | +6.08% |
| Including sales charge | | +83.75% | | +8.91% | | +6.08% |
| Institutional Class (Est. August 1, 2003) | | | | | | |
| Excluding sales charge | | +86.63% | | +10.00% | | +7.14% |
| Including sales charge | | +86.63% | | +10.00% | | +7.14% |
| Russell 2500 Value Index | | +87.47% | | +12.15% | | +10.23% |
| 1 | Returns reflect the reinvestment of all distributions and are presented both with and without the applicable sales charges described below. Returns do not reflect the deduction of taxes the shareholder would pay on Fund distributions or redemptions of Fund shares. |
Expense limitations were in effect for certain classes during some or all of the periods shown in the “Fund and benchmark performance” graph. The current expenses for each class are listed on the “Fund expense ratios” table on the next page. Performance would have been lower had expense limitations not been in effect.
Institutional Class shares are not subject to a sales charge and are offered for sale exclusively to certain eligible investors. In addition, Institutional Class shares pay no distribution and service fee.
Class A shares are sold with a maximum front-end sales charge of up to 5.75%, and have an annual distribution and service fee of up to 0.25% of average daily net assets. Performance for Class A shares, excluding sales charges, assumes that no front-end sales charge applied.
Class C shares are sold with a contingent deferred sales charge of 1.00% if redeemed during the first 12 months. They are also subject to an annual distribution and service fee of up to 1.00% of average daily net assets.
Performance for Class C shares, excluding sales charges, assumes either that contingent deferred sales charges did not apply or that the investment was not redeemed.
The “Fund and benchmark performance” table and the “Performance of a $10,000 investment” graph do not reflect the deduction of taxes the shareholder would pay on Fund distributions or redemptions of Fund shares.
| 2 | The Fund’s expense ratios, as described in the most recent prospectus, are disclosed in the “Fund expense ratios” table on the next page. Delaware Management Company has agreed to reimburse certain expenses and/or waive certain fees in order to prevent total fund operating expenses (excluding any 12b-1 fees and certain other expenses) from exceeding 1.25% of the Fund’s average daily net assets from July 29, 2020 through March 31, 2021. From April 1, 2020 through July 28, 2020, the expense waiver was 1.22% of the Fund’s average daily net assets.* Please see the most recent prospectus and any applicable supplement(s) for additional information on these fee waivers and/or reimbursements. |
(continues) 33
Table of Contents
Performance summaries
Optimum Small-Mid Cap Value Fund
| Fund expense ratios | | Class A | | Class C | | Institutional Class |
| Total annual operating expenses (without fee waivers) | | 1.52% | | 2.27% | | 1.27% |
| Net expenses (including fee waivers, if any) | | 1.50% | | 2.25% | | 1.25% |
| Type of waiver | | Contractual | | Contractual | | Contractual |
| * | The aggregate contractual waiver period covering this report is from July 29, 2019 to July 29, 2021. |
Investments in small and/or medium-sized companies typically exhibit greater risk and higher volatility than larger, more established companies.
The disruptions caused by natural disasters, pandemics, or similar events could prevent the Fund from executing advantageous investment decisions in a timely manner and could negatively impact the Fund’s ability to achieve its investment objective and the value of the Fund’s investments.
Performance of a $10,000 investment1
Average annual total returns from March 31, 2011 through March 31, 2021
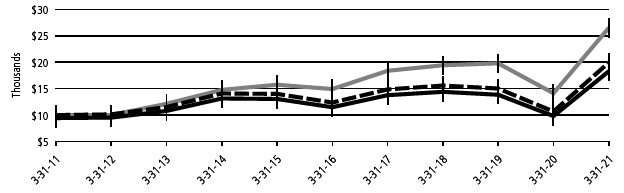
| For period beginning March 31, 2011 through March 31, 2021 | | Starting value | | Ending value |
| Russell 2500 Value Index | | | $10,000 | | | | $26,476 | |
| Optimum Small-Mid Cap Value Fund — Institutional Class shares | | | $10,000 | | | | $19,923 | |
| Optimum Small-Mid Cap Value Fund — Class A shares | | | $9,425 | | | | $18,274 | |
| 1 | The “Performance of $10,000 investment” graph assumes $10,000 invested in Class A and Institutional Class shares of the Fund on March 31, 2011, and includes the effect of a 5.75% front-end sales charge (for Class A shares) and the reinvestment of all distributions. The graph does not reflect the deduction of taxes the shareholders would pay on Fund distributions or redemptions of Fund shares. Expense limitations were in effect for some or all of the periods shown. Performance would have been lower had expense limitations not been in effect. Current expenses are listed in the “Fund expense ratios” table above. Please note additional details on pages 33 through 35. |
The graph also assumes $10,000 invested in the Russell 2500 Value Index as of March 31, 2011. The Russell 2500 Value Index measures the performance of the small- to mid-cap value segment of the US equity universe. It includes those Russell 2500 companies with lower price-to-book ratios and lower forecasted growth values.
Frank Russell Company is the source and owner of the trademarks, service marks, and copyrights related to the Russell Indexes. Russell® is a trademark of Frank Russell Company.
Index performance returns do not reflect any management fees, transaction costs, or expenses. Indices are unmanaged and one cannot invest directly in an index. Past performance is not a guarantee of future results.
Performance of other Fund classes will vary due to different charges and expenses.
34
Table of Contents
Stock symbols and CUSIP numbers
| | Nasdaq | | |
| | symbols | | CUSIPs |
| Class A | | OASVX | | 246118772 |
| Class C | | OCSVX | | 246118756 |
| Institutional Class | | OISVX | | 246118749 |
(continues) 35
Table of Contents
Disclosure of Fund expenses
For the six-month period from October 1, 2020 to March 31, 2021 (Unaudited)
As a shareholder of a Fund, you incur two types of costs: (1) transaction costs, including sales charges (loads) on purchase payments, reinvested dividends, or other distributions; redemption fees; and exchange fees; and (2) ongoing costs, including management fees; distribution and service (12b-1) fees; and other Fund expenses. The following examples are intended to help you understand your ongoing costs (in dollars) of investing in a Fund and to compare these costs with the ongoing costs of investing in other mutual funds.
The examples are based on an investment of $1,000 invested at the beginning of the period and held for the entire six-month period from October 1, 2020 to March 31, 2021.
Actual Expenses
The first section of the tables shown, “Actual Fund return,” provides information about actual account values and actual expenses. You may use the information in this section of the table, together with the amount you invested, to estimate the expenses that you paid over the period. Simply divide your account value by $1,000 (for example, an $8,600 account value divided by $1,000 = 8.6), then multiply the result by the number in the first section under the heading entitled “Expenses Paid During Period” to estimate the expenses you paid on your account during this period.
Hypothetical Example for Comparison Purposes
The second section of the tables shown, “Hypothetical 5% return,” provides information about hypothetical account values and hypothetical expenses based on the Funds’ actual expense ratios and an assumed rate of return of 5% per year before expenses, which is not the Funds’ actual return. The hypothetical account values and expenses may not be used to estimate the actual ending account balance or expenses you paid for the period. You may use this information to compare the ongoing costs of investing in each Fund and other funds. To do so, compare this 5% hypothetical example with the 5% hypothetical examples that appear in the shareholder reports of the other funds.
Please note that the expenses shown in the tables are meant to highlight your ongoing costs only and do not reflect any transactional costs, such as sales charges (loads), redemption fees, or exchange fees. Therefore, the second section of each table is useful in comparing ongoing costs only, and will not help you determine the relative total costs of owning different funds. In addition, if these transactional costs were included, your costs would have been higher. The Funds’ expenses shown in the tables reflect fee waivers in effect and assume reinvestment of all dividends and distributions.
Optimum Fixed Income Fund
Expense analysis of an investment of $1,000
| | | | | | | | | | | | | Expenses |
| | | | | | | | | | | | | Paid |
| | Beginning | | Ending | | | | | | | During |
| | Account | | Account | | Annualized | | Period |
| | Value | | Value | | Expense | | 10/1/20 to |
| | 10/1/20 | | 3/31/21 | | Ratio | | 3/31/21* |
| Actual Fund return† | | | | | | | | | |
| Class A | | $ | 1,000.00 | | $ | 984.80 | | | 1.06 | % | | | $ | 5.25 | |
| Class C | | | 1,000.00 | | | 980.20 | | | 1.81 | % | | | | 8.94 | |
| Institutional Class | | | 1,000.00 | | | 985.30 | | | 0.81 | % | | | | 4.01 | |
| Hypothetical 5% return (5% return before expenses) | | | | | | |
| Class A | | $ | 1,000.00 | | $ | 1,019.65 | | | 1.06 | % | | | $ | 5.34 | |
| Class C | | | 1,000.00 | | | 1,015.91 | | | 1.81 | % | | | | 9.10 | |
| Institutional Class | | | 1,000.00 | | | 1,020.89 | | | 0.81 | % | | | | 4.08 | |
Optimum International Fund
Expense analysis of an investment of $1,000
| | | | | | | | | | | | | Expenses |
| | | | | | | | | | | | | Paid |
| | Beginning | | Ending | | | | | | | During |
| | Account | | Account | | Annualized | | Period |
| | Value | | Value | | Expense | | 10/1/20 to |
| | 10/1/20 | | 3/31/21 | | Ratio | | 3/31/21* |
| Actual Fund return† | | | | | | | | | | | | | |
| Class A | | $ | 1,000.00 | | $ | 1,301.50 | | | 1.34 | % | | | | $ | 7.69 | |
| Class C | | | 1,000.00 | | | 1,296.10 | | | 2.09 | % | | | | | 11.96 | |
| Institutional Class | | | 1,000.00 | | | 1,303.50 | | | 1.09 | % | | | | | 6.26 | |
| Hypothetical 5% return (5% return before expenses) | | | | | | | |
| Class A | | $ | 1,000.00 | | $ | 1,018.25 | | | 1.34 | % | | | | $ | 6.74 | |
| Class C | | | 1,000.00 | | | 1,014.51 | | | 2.09 | % | | | | | 10.50 | |
| Institutional Class | | | 1,000.00 | | | 1,019.50 | | | 1.09 | % | | | | | 5.49 | |
36
Table of Contents
Optimum Large Cap Growth Fund
Expense analysis of an investment of $1,000
| | | | | | | | | | | | | Expenses |
| | | | | | | | | | | | | Paid |
| | Beginning | | Ending | | | | | | | During |
| | Account | | Account | | Annualized | | Period |
| | Value | | Value | | Expense | | 10/1/20 to |
| | 10/1/20 | | 3/31/21 | | Ratio | | 3/31/21* |
| Actual Fund return† | | | | | | | | | | | | | |
| Class A | | $ | 1,000.00 | | $ | 1,106.60 | | | 1.23 | % | | | | $ | 6.46 | |
| Class C | | | 1,000.00 | | | 1,102.40 | | | 1.98 | % | | | | | 10.38 | |
| Institutional Class | | | 1,000.00 | | | 1,107.90 | | | 0.98 | % | | | | | 5.15 | |
| Hypothetical 5% return (5% return before expenses) | | | | | | | |
| Class A | | $ | 1,000.00 | | $ | 1,018.80 | | | 1.23 | % | | | | $ | 6.19 | |
| Class C | | | 1,000.00 | | | 1,015.06 | | | 1.98 | % | | | | | 9.95 | |
| Institutional Class | | | 1,000.00 | | | 1,020.04 | | | 0.98 | % | | | | | 4.94 | |
Optimum Large Cap Value Fund
Expense analysis of an investment of $1,000
| | | | | | | | | | | | | Expenses |
| | | | | | | | | | | | | Paid |
| | Beginning | | Ending | | | | | | | During |
| | Account | | Account | | Annualized | | Period |
| | Value | | Value | | Expense | | 10/1/20 to |
| | 10/1/20 | | 3/31/21 | | Ratio | | 3/31/21* |
| Actual Fund return† | | | | | | | | | | | | | |
| Class A | | $ | 1,000.00 | | $ | 1,253.20 | | | 1.18 | % | | | | $ | 6.63 | |
| Class C | | | 1,000.00 | | | 1,248.50 | | | 1.93 | % | | | | | 10.82 | |
| Institutional Class | | | 1,000.00 | | | 1,254.50 | | | 0.93 | % | | | | | 5.23 | |
| Hypothetical 5% return (5% return before expenses) | | | | | | | |
| Class A | | $ | 1,000.00 | | $ | 1,019.05 | | | 1.18 | % | | | | $ | 5.94 | |
| Class C | | | 1,000.00 | | | 1,015.31 | | | 1.93 | % | | | | | 9.70 | |
| Institutional Class | | | 1,000.00 | | | 1,020.29 | | | 0.93 | % | | | | | 4.68 | |
Optimum Small-Mid Cap Growth Fund
Expense analysis of an investment of $1,000
| | | | | | | | | | | | | Expenses |
| | | | | | | | | | | | | Paid |
| | Beginning | | Ending | | | | | | | During |
| | Account | | Account | | Annualized | | Period |
| | Value | | Value | | Expense | | 10/1/20 to |
| | 10/1/20 | | 3/31/21 | | Ratio | | 3/31/21* |
| Actual Fund return† | | | | | | | | | | | | | |
| Class A | | $ | 1,000.00 | | $ | 1,360.80 | | | 1.57 | % | | | | $ | 9.24 | |
| Class C | | | 1,000.00 | | | 1,355.20 | | | 2.32 | % | | | | | 13.62 | |
| Institutional Class | | | 1,000.00 | | | 1,362.10 | | | 1.32 | % | | | | | 7.77 | |
| Hypothetical 5% return (5% return before expenses) | | | | | | | |
| Class A | | $ | 1,000.00 | | $ | 1,017.10 | | | 1.57 | % | | | | $ | 7.90 | |
| Class C | | | 1,000.00 | | | 1,013.36 | | | 2.32 | % | | | | | 11.65 | |
| Institutional Class | | | 1,000.00 | | | 1,018.35 | | | 1.32 | % | | | | | 6.64 | |
Optimum Small-Mid Cap Value Fund
Expense analysis of an investment of $1,000
| | | | | | | | | | | | | Expenses |
| | | | | | | | | | | | | Paid |
| | Beginning | | Ending | | | | | | | During |
| | Account | | Account | | Annualized | | Period |
| | Value | | Value | | Expense | | 10/1/20 to |
| | 10/1/20 | | 3/31/21 | | Ratio | | 3/31/21* |
| Actual Fund return† | | | | | | | | | | | | | |
| Class A | | $ | 1,000.00 | | $ | 1,493.90 | | | 1.51 | % | | | | $ | 9.39 | |
| Class C | | | 1,000.00 | | | 1,487.10 | | | 2.26 | % | | | | | 14.01 | |
| Institutional Class | | | 1,000.00 | | | 1,495.00 | | | 1.26 | % | | | | | 7.84 | |
| Hypothetical 5% return (5% return before expenses) | | | | | | | |
| Class A | | $ | 1,000.00 | | $ | 1,017.40 | | | 1.51 | % | | | | $ | 7.59 | |
| Class C | | | 1,000.00 | | | 1,013.66 | | | 2.26 | % | | | | | 11.35 | |
| Institutional Class | | | 1,000.00 | | | 1,018.65 | | | 1.26 | % | | | | | 6.34 | |
| * | “Expenses Paid During Period” are equal to the relevant Fund’s annualized expense ratio, multiplied by the average account value over the period, multiplied by 182/365 (to reflect the one-half year period). |
| † | Because actual returns reflect only the most recent six-month period, the returns shown may differ significantly from fiscal year returns. |
In addition to the Funds’ expenses reflected above, each Fund also indirectly bears its portion of the fees and expenses of the investment companies (Underlying Funds) in which it invests. The tables above do not reflect the expenses of the Underlying Funds.
(continues) 37
Table of Contents
Security type / sector allocations
Optimum Fixed Income Fund
As of March 31, 2021 (Unaudited)
Sector designations may be different from the sector designations presented in other Fund materials. The sector designations may represent the investment manager or sub-advisor’s internal sector classifications, which may result in the sector designations for one fund being different from another fund’s sector designations.
| | Percentage |
| Security type / sector | | of net assets |
| Agency Asset-Backed Securities | | | 0.03 | % | |
| Agency Collateralized Mortgage Obligations | | | 3.00 | % | |
| Agency Commercial Mortgage-Backed | | | | | |
| Securities | | | 0.41 | % | |
| Agency Mortgage-Backed Securities | | | 23.03 | % | |
| Collateralized Debt Obligations | | | 4.00 | % | |
| Corporate Bonds | | | 34.24 | % | |
| Banking | | | 10.07 | % | |
| Basic Industry | | | 1.91 | % | |
| Brokerage | | | 0.33 | % | |
| Capital Goods | | | 1.02 | % | |
| Communications | | | 4.41 | % | |
| Consumer Cyclical | | | 2.14 | % | |
| Consumer Non-Cyclical | | | 3.52 | % | |
| Energy | | | 3.76 | % | |
| Finance Companies | | | 1.51 | % | |
| Insurance | | | 0.42 | % | |
| Real Estate Investment Trusts | | | 0.69 | % | |
| Technology | | | 0.87 | % | |
| Transportation | | | 1.16 | % | |
| Utilities | | | 2.43 | % | |
| Municipal Bonds | | | 0.60 | % | |
| Non-Agency Asset-Backed Securities | | | 2.29 | % | |
| Non-Agency Collateralized Mortgage | | | | | |
| Obligations | | | 1.96 | % | |
| Non-Agency Commercial Mortgage-Backed | | | | | |
| Securities | | | 4.36 | % | |
| Loan Agreements | | | 3.15 | % | |
| Regional Bond | | | 0.08 | % | |
| Sovereign Bonds | | | 3.42 | % | |
| Supranational Banks | | | 0.04 | % | |
| US Treasury Obligations | | | 27.32 | % | |
| Common Stock | | | 0.00 | % | |
| Preferred Stock | | | 0.02 | % | |
| Options Purchased | | | 0.02 | % | |
| Short-Term Investments | | | 9.81 | % | |
| Options Written | | | (0.01 | %) | |
| Total Value of Securities | | | 117.77 | % | |
| Liabilities Net of Receivables and Other | | | | | |
| Assets | | | (17.77 | %) | |
| Total Net Assets | | | 100.00 | % | |
38
Table of Contents
Security type / sector and country allocations
Optimum International Fund
As of March 31, 2021 (Unaudited)
Sector designations may be different from the sector designations presented in other Fund materials. The sector designations may represent the investment manager or sub-advisor’s internal sector classifications, which may result in the sector designations for one fund being different from another fund’s sector designations.
| | Percentage |
| Security type / country | | of net assets |
| Common Stock by Country | | 96.34 | % |
| Australia | | 3.17 | % |
| Austria | | 1.88 | % |
| Belgium | | 0.49 | % |
| Brazil | | 3.47 | % |
| Canada | | 3.85 | % |
| Chile | | 0.56 | % |
| China/Hong Kong | | 10.04 | % |
| Colombia | | 1.00 | % |
| Denmark | | 1.79 | % |
| Egypt | | 0.00 | % |
| Finland | | 0.69 | % |
| France | | 3.03 | % |
| Germany | | 7.96 | % |
| Greece | | 0.01 | % |
| Hungary | | 0.25 | % |
| India | | 2.16 | % |
| Indonesia | | 0.02 | % |
| Ireland | | 1.18 | % |
| Israel | | 0.57 | % |
| Italy | | 1.48 | % |
| Japan | | 7.63 | % |
| Luxembourg | | 1.07 | % |
| Malaysia | | 0.12 | % |
| Malta | | 0.16 | % |
| Mexico | | 0.70 | % |
| Netherlands | | 5.14 | % |
| New Zealand | | 0.39 | % |
| Norway | | 2.59 | % |
| Philippines | | 0.02 | % |
| Poland | | 0.75 | % |
| Republic of Korea | | 6.15 | % |
| Russia | | 0.02 | % |
| Singapore | | 0.76 | % |
| South Africa | | 0.59 | % |
| Spain | | 1.02 | % |
| Sweden | | 3.16 | % |
| Switzerland | | 6.21 | % |
| Taiwan | | 7.12 | % |
| Thailand | | 0.31 | % |
| Turkey | | 0.31 | % |
| Ukraine | | 0.43 | % |
| United Kingdom | | 5.34 | % |
| United States | | 2.75 | % |
| Preferred Stock | | 1.47 | % |
| Rights | | 0.01 | % |
| Short-Term Investments | | 1.50 | % |
| Securities Lending Collateral | | 1.79 | % |
| Total Value of Securities | | 101.11 | % |
| Obligation to Return | | | |
| Securities Lending | | | |
| Collateral | | (1.79 | %) |
| Receivables and Other Assets Net of | | | |
| Liabilities | | 0.68 | % |
| Total Net Assets | | 100.00 | % |
| | | |
| | | Percentage |
| Common stock and preferred stock by sector | | of net assets |
| Communication Services | | 5.22 | % |
| Consumer Discretionary | | 14.44 | % |
| Consumer Staples | | 3.46 | % |
| Energy | | 4.71 | % |
| Financials | | 14.87 | % |
| Healthcare | | 12.70 | % |
| Industrials | | 11.12 | % |
| Information Technology | | 18.96 | % |
| Materials | | 11.36 | % |
| Real Estate | | 0.52 | % |
| Utilities | | 0.45 | % |
| Total | | 97.81 | % |
(continues) 39
Table of Contents
Security type / sector allocations and top 10 equity holdings
Optimum Large Cap Growth Fund
As of March 31, 2021 (Unaudited)
Sector designations may be different from the sector designations presented in other Fund materials. The sector designations may represent the investment manager or sub-advisor’s internal sector classifications, which may result in the sector designations for one fund being different from another fund’s sector designations.
| | Percentage |
| Security type / sector | | of net assets |
| Common Stock ◆ | | 98.94 | % |
| Communication Services | | 15.99 | % |
| Consumer Discretionary | | 22.67 | % |
| Consumer Staples | | 1.13 | % |
| Financials | | 0.77 | % |
| Healthcare | | 11.74 | % |
| Industrials | | 7.61 | % |
| Information Technology* | | 37.47 | % |
| Materials | | 0.84 | % |
| Real Estate | | 0.72 | % |
| Convertible Preferred Stock | | 0.09 | % |
| Short-Term Investments | | 1.10 | % |
| Total Value of Securities | | 100.13 | % |
| Liabilities Net of Receivables and Other | | | |
| Assets | | (0.13 | %) |
| Total Net Assets | | 100.00 | % |
| ◆ | Narrow industries are utilized for compliance purposes for diversification whereas broad sectors are used for financial reporting. |
| * | To monitor compliance with Optimum Large Cap Growth Fund’s concentration guidelines as described in the Fund’s Prospectus and Statement of Additional Information, the Information Technology sector (as disclosed herein for financial reporting purposes) is subdivided into a variety of “industries” (in accordance with the requirements of the Investment Company Act of 1940, as amended). The Information Technology sector consisted of Commercial Services, Computers, Diversified Financial Services, Internet, Office/Business Equipment, Semiconductors, and Software. As of March 31, 2021, such amounts, as percentage of total net assets, were 1.44%, 4.73%, 5.30%, 1.18%, 0.13%, 6.12%, and 18.57%, respectively. The percentage in any such single industry will comply with the Fund’s concentration policy even if the percentages in the Information Technology sector for financial reporting purposes may exceed 25%. |
Holdings are for informational purposes only and are subject to change at any time. They are not a recommendation to buy, sell, or hold any security.
| | Percentage |
| Top 10 equity holdings | | of net assets |
| Amazon.com | | 9.33 | % |
| Microsoft | | 6.82 | % |
| Facebook Class A | | 5.83 | % |
| Apple | | 4.73 | % |
| Visa Class A | | 3.65 | % |
| UnitedHealth Group | | 2.61 | % |
| salesforce.com | | 2.04 | % |
| Alphabet Class A | | 1.88 | % |
| Alibaba Group Holding ADR | | 1.77 | % |
| Alphabet Class C | | 1.59 | % |
40
Table of Contents
Security type / sector allocations and top 10 equity holdings
Optimum Large Cap Value Fund
As of March 31, 2021 (Unaudited)
Sector designations may be different from the sector designations presented in other Fund materials. The sector designations may represent the investment manager or sub-advisor’s internal sector classifications, which may result in the sector designations for one fund being different from another fund’s sector designations.
| | Percentage |
| Security type / sector | | of net assets |
| Common Stock | | 98.16 | % |
| Communication Services | | 5.74 | % |
| Consumer Discretionary | | 4.68 | % |
| Consumer Staples | | 5.32 | % |
| Energy | | 3.65 | % |
| Financials | | 24.34 | % |
| Healthcare | | 16.85 | % |
| Industrials | | 16.18 | % |
| Information Technology | | 9.58 | % |
| Materials | | 4.04 | % |
| Real Estate | | 2.04 | % |
| Utilities | | 5.74 | % |
| Short-Term Investments | | 1.78 | % |
| Total Value of Securities | | 99.94 | % |
| Receivables and Other Assets Net of | | | |
| Liabilities | | 0.06 | % |
| Total Net Assets | | 100.00 | % |
Holdings are for informational purposes only and are subject to change at any time. They are not a recommendation to buy, sell, or hold any security.
| | Percentage |
| Top 10 equity holdings | | of net assets |
| JPMorgan Chase & Co. | | 4.13 | % |
| Johnson & Johnson | | 2.96 | % |
| Comcast Class A | | 2.66 | % |
| Medtronic | | 2.33 | % |
| Honeywell International | | 2.05 | % |
| Duke Energy | | 1.80 | % |
| Bank of America | | 1.71 | % |
| Thermo Fisher Scientific | | 1.71 | % |
| Cigna | | 1.69 | % |
| BlackRock | | 1.52 | % |
(continues) 41
Table of Contents
Security type / sector allocations and top 10 equity holdings
Optimum Small-Mid Cap Growth Fund
As of March 31, 2021 (Unaudited)
Sector designations may be different from the sector designations presented in other Fund materials. The sector designations may represent the investment manager or sub-advisor’s internal sector classifications, which may result in the sector designations for one fund being different from another fund’s sector designations.
| | Percentage |
| Security type / sector | | of net assets |
| Common Stock ◆ | | 97.17 | % |
| Communication Services | | 1.57 | % |
| Consumer Discretionary | | 14.70 | % |
| Consumer Staples | | 4.20 | % |
| Financials | | 9.56 | % |
| Healthcare* | | 25.17 | % |
| Industrials | | 16.55 | % |
| Information Technology | | 23.02 | % |
| Materials | | 1.80 | % |
| Real Estate | | 0.60 | % |
| Convertible Preferred Stock | | 0.16 | % |
| Warrant | | 0.00 | % |
| Short-Term Investments | | 2.78 | % |
| Total Value of Securities | | 100.11 | % |
| Liabilities Net of Receivables and Other | | | |
| Assets | | (0.11 | %) |
| Total Net Assets | | 100.00 | % |
| ◆ | Narrow industries are utilized for compliance purposes for diversification whereas broad sectors are used for financial reporting. |
| * | To monitor compliance with Optimum Small-Mid Cap Growth Fund’s concentration guidelines as described in the Fund’s Prospectus and Statement of Additional Information, the Healthcare sector (as disclosed herein for financial reporting purposes) is subdivided into a variety of “industries” (in accordance with the requirements of the Investment Company Act of 1940, as amended). The Healthcare sector consisted of Biotechnology, Commercial Services, Healthcare-Products, Healthcare-Services, Pharmaceuticals, Retail, and Software. As of March 31, 2021, such amounts, as percentage of total net assets, were 6.08%, 0.70%, 10.64%, 2.74%, 3.66%, 0.25%, and 1.10%, respectively. The percentage in any such single industry will comply with the Fund’s concentration policy even if the percentages in the Healthcare sector for financial reporting purposes may exceed 25%. |
Holdings are for informational purposes only and are subject to change at any time. They are not a recommendation to buy, sell, or hold any security.
| | Percentage |
| Top 10 equity holdings | | of net assets |
| Zendesk | | 1.85 | % |
| SVB Financial Group | | 1.84 | % |
| Horizon Therapeutics | | 1.80 | % |
| Nuance Communications | | 1.65 | % |
| Axonics Modulation Technologies | | 1.60 | % |
| ASGN | | 1.43 | % |
| Chart Industries | | 1.41 | % |
| elf Beauty | | 1.28 | % |
| Floor & Decor Holdings Class A | | 1.24 | % |
| Natera | | 1.22 | % |
42
Table of Contents
Security type / sector allocations and top 10 equity holdings
Optimum Small-Mid Cap Value Fund
As of March 31, 2021 (Unaudited)
Sector designations may be different from the sector designations presented in other Fund materials. The sector designations may represent the investment manager or sub-advisor’s internal sector classifications, which may result in the sector designations for one fund being different from another fund’s sector designations.
| | Percentage |
| Security type / sector | | of net assets |
| Common Stock | | 97.85 | % |
| Communication Services | | 4.08 | % |
| Consumer Discretionary | | 9.07 | % |
| Consumer Staples | | 4.76 | % |
| Energy | | 2.01 | % |
| Financials | | 20.37 | % |
| Healthcare | | 4.76 | % |
| Industrials | | 15.77 | % |
| Information Technology | | 14.39 | % |
| Materials | | 11.31 | % |
| Real Estate | | 9.68 | % |
| Utilities | | 1.65 | % |
| Limited Partnerships | | 0.38 | % |
| Short-Term Investments | | 1.71 | % |
| Total Value of Securities | | 99.94 | % |
| Receivables and Other Assets Net of | | | |
| Liabilities | | 0.06 | % |
| Total Net Assets | | 100.00 | % |
Holdings are for informational purposes only and are subject to change at any time. They are not a recommendation to buy, sell, or hold any security.
| | Percentage |
| Top 10 equity holdings | | of net assets |
| J2 Global | | 2.66 | % |
| PacWest Bancorp | | 2.47 | % |
| Silgan Holdings | | 2.32 | % |
| Nexstar Media Group Class A | | 2.13 | % |
| FMC | | 2.03 | % |
| Silicon Motion Technology ADR | | 1.90 | % |
| Medical Properties Trust | | 1.88 | % |
| Starwood Property Trust | | 1.75 | % |
| Lithia Motors Class A | | 1.74 | % |
| Gaming and Leisure Properties | | 1.73 | % |
(continues) 43
Table of Contents
Schedules of investments
Optimum Fixed Income Fund
March 31, 2021
| | | | | Principal
amount° | | | Value (US $) |
| Agency Asset-Backed Securities – 0.03% | | | | | |
| SLM Student Loan Trust | | | | | |
| | Series 2003-11 A6 | | | | | |
| | 144A 0.734% | | | | | |
| | (LIBOR03M + 0.55%) | | | | | |
| | 12/15/25 #, ● | | 135,145 | | $ | 135,127 |
| | Series 2008-9 A | | | | | |
| | 1.718% (LIBOR03M | | | | | |
| | + 1.50%) 4/25/23 ● | | 669,276 | | | 674,549 |
| Total Agency Asset-Backed Securities | | | | | |
| (cost $805,473) | | | | | 809,676 |
| | | | | | | |
| Agency Collateralized Mortgage Obligations – 3.00% | | | | | |
| Fannie Mae Connecticut | | | | | |
| | Avenue Securities | | | | | |
| | Series 2017-C03 1M2 | | | | | |
| | 3.109% (LIBOR01M | | | | | |
| | + 3.00%) 10/25/29 ● | | 6,303,869 | | | 6,444,265 |
| | Series 2017-C04 2M2 | | | | | |
| | 2.959% (LIBOR01M | | | | | |
| | + 2.85%) 11/25/29 ● | | 359,425 | | | 363,748 |
| | Series 2018-C01 1M2 | | | | | |
| | 2.359% (LIBOR01M | | | | | |
| | + 2.25%, Floor | | | | | |
| | 2.25%) 7/25/30 ● | | 1,083,987 | | | 1,084,666 |
| | Series 2018-C02 2M2 | | | | | |
| | 2.309% (LIBOR01M | | | | | |
| | + 2.20%, Floor | | | | | |
| | 2.20%) 8/25/30 ● | | 408,079 | | | 407,560 |
| | Series 2018-C03 1M2 | | | | | |
| | 2.259% (LIBOR01M | | | | | |
| | + 2.15%, Floor | | | | | |
| | 2.15%) 10/25/30 ● | | 542,516 | | | 540,223 |
| | Series 2018-C05 1M2 | | | | | |
| | 2.459% (LIBOR01M | | | | | |
| | + 2.35%, Floor | | | | | |
| | 2.35%) 1/25/31 ● | | 425,703 | | | 425,703 |
| Fannie Mae Grantor | | | | | |
| | Trust | | | | | |
| | Series 1999-T2 A1 | | | | | |
| | 7.50% 1/19/39 ● | | 4,601 | | | 5,000 |
| | Series 2004-T1 1A2 | | | | | |
| | 6.50% 1/25/44 | | 4,389 | | | 5,137 |
| Fannie Mae REMIC Trust | | | | | |
| | Series 2004-W11 1A2 | | | | | |
| | 6.50% 5/25/44 | | 30,064 | | | 35,312 |
| | Series 2004-W15 1A1 | | | | | |
| | 6.00% 8/25/44 | | 23,338 | | | 26,835 |
| Fannie Mae REMICs | | | | | |
| | Series 1999-19 PH | | | | | |
| | 6.00% 5/25/29 | | 42,482 | | | 48,004 |
| | Series 2001-14 Z | | | | | |
| | 6.00% 5/25/31 | | 2,592 | | | 2,894 |
| | Series 2007-30 OE | | | | | |
| | 1.784% | | | | | |
| | 4/25/37 Ω, ^ | | 1,647,206 | | | 1,370,494 |
| | Series 2008-24 ZA | | | | | |
| | 5.00% 4/25/38 | | 6,398,069 | | | 7,271,480 |
| | Series 2009-2 AS | | | | | |
| | 5.591% (5.70% | | | | | |
| | minus LIBOR01M, | | | | | |
| | Cap 5.70%) | | | | | |
| | 2/25/39 Σ, ● | | 350,121 | | | 55,754 |
| | Series 2009-68 SA | | | | | |
| | 6.641% (6.75% | | | | | |
| | minus LIBOR01M, | | | | | |
| | Cap 6.75%) | | | | | |
| | 9/25/39 Σ, ● | | 140,981 | | | 24,066 |
| | Series 2011-118 DC | | | | | |
| | 4.00% 11/25/41 | | 466,051 | | | 498,925 |
| | Series 2017-40 GZ | | | | | |
| | 3.50% 5/25/47 | | 379,556 | | | 406,621 |
| | Series 2017-77 HZ | | | | | |
| | 3.50% 10/25/47 | | 539,066 | | | 565,675 |
| | Series 2017-95 FA | | | | | |
| | 0.465% (LIBOR01M | | | | | |
| | + 0.35%, Floor | | | | | |
| | 0.35%) 11/25/47 ● | | 342,823 | | | 342,095 |
| Freddie Mac REMICs | | | | | |
| | Series 2165 PE | | | | | |
| | 6.00% 6/15/29 | | 37,420 | | | 42,466 |
| | Series 3143 BC | | | | | |
| | 5.50% 2/15/36 | | 1,010,245 | | | 1,173,748 |
| | Series 3289 SA | | | | | |
| | 6.644% (6.75% | | | | | |
| | minus LIBOR01M, | | | | | |
| | Cap 6.75%) | | | | | |
| | 3/15/37 Σ, ● | | 434,037 | | | 89,308 |
| | Series 4676 KZ | | | | | |
| | 2.50% 7/15/45 | | 369,424 | | | 376,305 |
| Freddie Mac Structured | | | | | |
| | Agency Credit Risk | | | | | |
| | Debt Notes | | | | | |
| | Series 2017-DNA1 M2 | | | | | |
| | 3.359% (LIBOR01M | | | | | |
| | + 3.25%, Floor | | | | | |
| | 3.25%) 7/25/29 ● | | 713,860 | | | 733,553 |
| | Series 2017-DNA3 M2 | | | | | |
| | 2.609% (LIBOR01M | | | | | |
| | + 2.50%) 3/25/30 ● | | 315,000 | | | 320,980 |
| | Series 2018-HQA1 M2 | | | | | |
| | 2.409% (LIBOR01M | | | | | |
| | + 2.30%) 9/25/30 ● | | 747,796 | | | 747,796 |
44
Table of Contents
| | | | | Principal
amount° | | | Value (US $) |
| Agency Collateralized Mortgage Obligations (continued) | | | | | |
| Freddie Mac Structured | | | | | |
| | Agency Credit Risk | | | | | |
| | REMIC Trust | | | | | |
| | Series 2019-DNA4 M2 | | | | | |
| | 144A 2.059% | | | | | |
| | (LIBOR01M + 1.95%) | | | | | |
| | 10/25/49 #, ● | | 1,045,615 | | $ | 1,044,634 |
| | Series 2019-HQA4 M2 | | | | | |
| | 144A 2.159% | | | | | |
| | (LIBOR01M + 2.05%) | | | | | |
| | 11/25/49 #, ● | | 992,433 | | | 992,433 |
| | Series 2020-DNA2 M1 | | | | | |
| | 144A 0.859% | | | | | |
| | (LIBOR01M + 0.75%, | | | | | |
| | Floor 0.75%) | | | | | |
| | 2/25/50 #, ● | | 913,218 | | | 912,968 |
| | Series 2020-DNA2 M2 | | | | | |
| | 144A 1.959% | | | | | |
| | (LIBOR01M + 1.85%, | | | | | |
| | Floor 1.85%) | | | | | |
| | 2/25/50 #, ● | | 500,000 | | | 498,062 |
| | Series 2020-DNA6 M2 | | | | | |
| | 144A 2.017% (SOFR | | | | | |
| | + 2.00%) | | | | | |
| | 12/25/50 #, ● | | 3,600,000 | | | 3,584,474 |
| | Series 2020-HQA2 M1 | | | | | |
| | 144A 1.209% | | | | | |
| | (LIBOR01M + 1.10%) | | | | | |
| | 3/25/50 #, ● | | 1,208,942 | | | 1,209,512 |
| | Series 2021-DNA1 M2 | | | | | |
| | 144A 1.817% (SOFR | | | | | |
| | + 1.80%) | | | | | |
| | 1/25/51 #, ● | | 7,000,000 | | | 6,903,616 |
| | Series 2021-HQA1 M2 | | | | | |
| | 144A 2.267% (SOFR | | | | | |
| | + 2.25%) | | | | | |
| | 8/25/33 #, ● | | 7,000,000 | | | 6,921,234 |
| Freddie Mac Structured | | | | | |
| | Agency Credit Risk | | | | | |
| | Trust | | | | | |
| | Series 2018-HQA2 M1 | | | | | |
| | 144A 0.859% | | | | | |
| | (LIBOR01M + 0.75%) | | | | | |
| | 10/25/48 #, ● | | 249,693 | | | 249,692 |
| Freddie Mac Structured | | | | | |
| | Pass Through | | | | | |
| | Certificates | | | | | |
| | Series T-54 2A 6.50% | | | | | |
| | 2/25/43 ♦ | | 11,254 | | | 13,206 |
| | Series T-58 2A 6.50% | | | | | |
| | 9/25/43 ♦ | | 4,674 | | | 5,393 |
| GNMA | | | | | |
| | Series 2008-65 SB | | | | | |
| | 5.889% (6.00% | | | | | |
| | minus LIBOR01M, | | | | | |
| | Cap 6.00%) | | | | | |
| | 8/20/38 Σ, ● | | 380,801 | | | 57,302 |
| | Series 2009-2 SE | | | | | |
| | 5.709% (5.82% | | | | | |
| | minus LIBOR01M, | | | | | |
| | Cap 5.82%) | | | | | |
| | 1/20/39 Σ, ● | | 1,236,463 | | | 191,675 |
| | Series 2011-H21 FT | | | | | |
| | 0.79% (H15T1Y + | | | | | |
| | 0.70%, Cap 15.25%, | | | | | |
| | Floor 0.70%) | | | | | |
| | 10/20/61 ● | | 5,293,301 | | | 5,274,936 |
| | Series 2011-H23 FA | | | | | |
| | 0.82% (LIBOR01M + | | | | | |
| | 0.70%, Cap 11.00%, | | | | | |
| | Floor 0.70%) | | | | | |
| | 10/20/61 ● | | 3,470,017 | | | 3,499,858 |
| | Series 2012-H08 FB | | | | | |
| | 0.72% (LIBOR01M + | | | | | |
| | 0.60%, Cap 11.00%, | | | | | |
| | Floor 0.60%) | | | | | |
| | 3/20/62 ● | | 543,824 | | | 546,670 |
| | Series 2012-H18 NA | | | | | |
| | 0.64% (LIBOR01M + | | | | | |
| | 0.52%, Cap 10.50%, | | | | | |
| | Floor 0.52%) | | | | | |
| | 8/20/62 ● | | 314,064 | | | 315,554 |
| | Series 2012-H29 SA | | | | | |
| | 0.635% (LIBOR01M | | | | | |
| | + 0.515%, Cap | | | | | |
| | 12.00%, Floor | | | | | |
| | 0.515%) 10/20/62 ● | | 3,443,181 | | | 3,463,072 |
| | Series 2013-113 LY | | | | | |
| | 3.00% 5/20/43 | | 173,000 | | | 183,058 |
| | Series 2015-H10 FA | | | | | |
| | 0.72% (LIBOR01M + | | | | | |
| | 0.60%, Cap 7.50%) | | | | | |
| | 4/20/65 ● | | 11,034,654 | | | 11,134,852 |
| | Series 2015-H11 FC | | | | | |
| | 0.67% (LIBOR01M + | | | | | |
| | 0.55%, Cap 7.50%, | | | | | |
| | Floor 0.55%) | | | | | |
| | 5/20/65 ● | | 1,355,263 | | | 1,362,202 |
| | Series 2015-H12 FB | | | | | |
| | 0.72% (LIBOR01M + | | | | | |
| | 0.60%, Cap 7.50%, | | | | | |
| | Floor 0.60%) | | | | | |
| | 5/20/65 ● | | 5,594,996 | | | 5,644,125 |
45
Table of Contents
Schedules of investments
Optimum Fixed Income Fund
| | | | | Principal
amount° | | | Value (US $) |
| Agency Collateralized Mortgage Obligations (continued) | | | | | |
| GNMA | | | | | |
| | Series 2015-H20 FB | | | | | |
| | 0.72% (LIBOR01M + | | | | | |
| | 0.60%, Cap 7.50%, | | | | | |
| | Floor 0.60%) | | | | | |
| | 8/20/65 ● | | 1,543,904 | | $ | 1,558,565 |
| | Series 2015-H30 FD | | | | | |
| | 0.72% (LIBOR01M + | | | | | |
| | 0.60%, Cap 11.00%, | | | | | |
| | Floor 0.60%) | | | | | |
| | 10/20/65 ● | | 92,781 | | | 93,396 |
| | Series 2016-H06 FD | | | | | |
| | 1.04% (LIBOR01M + | | | | | |
| | 0.92%, Cap 7.50%, | | | | | |
| | Floor 0.92%) | | | | | |
| | 7/20/65 ● | | 1,553,579 | | | 1,582,699 |
| | Series 2017-34 DY | | | | | |
| | 3.50% 3/20/47 | | 230,000 | | | 251,046 |
| | Series 2017-130 YJ | | | | | |
| | 2.50% 8/20/47 | | 270,000 | | | 279,564 |
| | Series 2017-163 ZK | | | | | |
| | 3.50% 11/20/47 | | 3,710,642 | | | 3,959,331 |
| Total Agency Collateralized Mortgage Obligations | | | | | |
| (cost $83,351,625) | | | | | 85,141,742 |
| | | | | | | |
| Agency Commercial Mortgage-Backed Securities – 0.41% | | | | | |
| Freddie Mac Multifamily | | | | | |
| | Structured Pass | | | | | |
| | Through Certificates | | | | | |
| | Series X3FX A2FX | | | | | |
| | 3.00% 6/25/27 ♦ | | 1,070,000 | | | 1,150,181 |
| FREMF Mortgage Trust | | | | | |
| | Series 2011-K15 B | | | | | |
| | 144A 4.986% | | | | | |
| | 8/25/44 #, ● | | 75,000 | | | 75,744 |
| | Series 2012-K18 B | | | | | |
| | 144A 4.184% | | | | | |
| | 1/25/45 #, ● | | 1,000,000 | | | 1,025,763 |
| | Series 2012-K22 B | | | | | |
| | 144A 3.686% | | | | | |
| | 8/25/45 #, ● | | 665,000 | | | 690,882 |
| | Series 2013-K24 B | | | | | |
| | 144A 3.507% | | | | | |
| | 11/25/45 #, ● | | 3,675,000 | | | 3,821,384 |
| | Series 2013-K25 C | | | | | |
| | 144A 3.62% | | | | | |
| | 11/25/45 #, ● | | 500,000 | | | 518,394 |
| | Series 2014-K716 B | | | | | |
| | 144A 3.903% | | | | | |
| | 8/25/47 #, ● | | 500,000 | | | 502,424 |
| | Series 2014-K717 B | | | | | |
| | 144A 3.625% | | | | | |
| | 11/25/47 #, ● | | 1,225,000 | | | 1,237,883 |
| | Series 2014-K717 C | | | | | |
| | 144A 3.625% | | | | | |
| | 11/25/47 #, ● | | 1,290,000 | | | 1,300,225 |
| | Series 2016-K53 B | | | | | |
| | 144A 4.021% | | | | | |
| | 3/25/49 #, ● | | 280,000 | | | 308,067 |
| | Series 2016-K722 B | | | | | |
| | 144A 3.847% | | | | | |
| | 7/25/49 #, ● | | 425,000 | | | 448,075 |
| | Series 2017-K71 B | | | | | |
| | 144A 3.753% | | | | | |
| | 11/25/50 #, ● | | 470,000 | | | 505,776 |
| Total Agency Commercial Mortgage-Backed Securities | | | | | |
| (cost $11,211,677) | | | | | 11,584,798 |
| | | | | | | |
| Agency Mortgage-Backed Securities – 23.03% | | | | | |
| Fannie Mae | | | | | |
| | 5.50% 3/1/37 | | 6,136 | | | 6,747 |
| | 5.50% 7/1/37 | | 2,736 | | | 2,850 |
| Fannie Mae S.F. 15 yr | | | | | |
| | 2.00% 3/1/36 | | 7,826,330 | | | 8,055,680 |
| | 2.00% 3/1/36 | | 4,000,000 | | | 4,127,727 |
| Fannie Mae S.F. 20 yr | | | | | |
| | 2.00% 3/1/41 | | 3,575,369 | | | 3,624,149 |
| | 2.00% 4/1/41 | | 1,607,000 | | | 1,628,924 |
| Fannie Mae S.F. 30 yr | | | | | |
| | 2.00% 12/1/50 | | 12,534,013 | | | 12,529,828 |
| | 2.00% 1/1/51 | | 6,817,311 | | | 6,810,461 |
| | 2.00% 2/1/51 | | 4,503,365 | | | 4,501,028 |
| | 2.00% 3/1/51 | | 7,374,227 | | | 7,365,434 |
| | 2.50% 10/1/50 | | 1,175,673 | | | 1,207,563 |
| | 2.50% 1/1/51 | | 4,010,877 | | | 4,119,671 |
| | 2.50% 2/1/51 | | 4,527,879 | | | 4,650,697 |
| | 2.50% 4/1/51 | | 4,739,000 | | | 4,867,545 |
| | 3.00% 10/1/42 | | 1,727,997 | | | 1,855,372 |
| | 3.00% 4/1/43 | | 709,989 | | | 754,855 |
| | 3.00% 11/1/46 | | 7,827,557 | | | 8,233,115 |
| | 3.00% 1/1/47 | | 2,611,677 | | | 2,763,386 |
| | 3.00% 11/1/48 | | 2,227,419 | | | 2,329,886 |
| | 3.00% 10/1/49 | | 2,339,080 | | | 2,442,269 |
| | 3.00% 12/1/49 | | 5,448,702 | | | 5,750,212 |
| | 3.00% 3/1/50 | | 7,966,451 | | | 8,384,810 |
| | 3.00% 6/1/50 | | 3,525,826 | | | 3,673,163 |
| | 3.00% 7/1/50 | | 15,945,290 | | | 16,713,317 |
| | 3.00% 8/1/50 | | 6,006,449 | | | 6,297,605 |
| | 3.00% 9/1/50 | | 2,380,720 | | | 2,484,806 |
| | 3.50% 7/1/47 | | 3,002,710 | | | 3,252,245 |
| | 3.50% 12/1/47 | | 747,964 | | | 793,547 |
| | 3.50% 1/1/48 | | 1,653,613 | | | 1,753,863 |
46
Table of Contents
| | | | | Principal
amount° | | | Value (US $) |
| Agency Mortgage-Backed Securities (continued) | | | | | |
| Fannie Mae S.F. 30 yr | | | | | |
| | 3.50% 2/1/48 | | 2,631,031 | | $ | 2,825,247 |
| | 3.50% 7/1/48 | | 2,376,277 | | | 2,515,684 |
| | 3.50% 11/1/48 | | 1,972,729 | | | 2,086,542 |
| | 3.50% 1/1/50 | | 4,132,249 | | | 4,365,420 |
| | 3.50% 3/1/50 | | 1,626,970 | | | 1,722,122 |
| | 4.00% 10/1/40 | | 12,493 | | | 13,767 |
| | 4.00% 11/1/40 | | 61,798 | | | 68,047 |
| | 4.00% 3/1/46 | | 75,437 | | | 82,371 |
| | 4.00% 4/1/47 | | 816,342 | | | 896,732 |
| | 4.00% 6/1/48 | | 3,924,501 | | | 4,289,577 |
| | 4.00% 9/1/48 | | 6,188,786 | | | 6,651,522 |
| | 4.00% 10/1/48 | | 3,820,306 | | | 4,206,697 |
| | 4.00% 1/1/49 | | 105,870 | | | 113,559 |
| | 4.00% 3/1/49 | | 307,763 | | | 330,054 |
| | 4.00% 6/1/49 | | 1,012,098 | | | 1,102,082 |
| | 4.50% 5/1/35 | | 42,032 | | | 46,527 |
| | 4.50% 8/1/35 | | 73,165 | | | 81,376 |
| | 4.50% 9/1/35 | | 91,852 | | | 102,370 |
| | 4.50% 5/1/39 | | 271,774 | | | 305,861 |
| | 4.50% 6/1/40 | | 191,312 | | | 212,525 |
| | 4.50% 7/1/40 | | 235,937 | | | 255,376 |
| | 4.50% 2/1/41 | | 893,361 | | | 1,001,922 |
| | 4.50% 4/1/41 | | 38,985 | | | 43,413 |
| | 4.50% 1/1/42 | | 2,846,514 | | | 3,190,511 |
| | 4.50% 10/1/45 | | 814,108 | | | 904,928 |
| | 4.50% 5/1/46 | | 470,804 | | | 528,069 |
| | 4.50% 4/1/48 | | 1,049,619 | | | 1,181,873 |
| | 4.50% 7/1/48 | | 335,411 | | | 365,398 |
| | 4.50% 8/1/48 | | 243,246 | | | 264,402 |
| | 4.50% 9/1/48 | | 402,813 | | | 444,843 |
| | 4.50% 12/1/48 | | 540,158 | | | 588,501 |
| | 4.50% 1/1/49 | | 5,455,468 | | | 6,038,425 |
| | 4.50% 1/1/50 | | 1,527,934 | | | 1,676,757 |
| | 5.00% 3/1/34 | | 1,291 | | | 1,491 |
| | 5.00% 4/1/34 | | 5,819 | | | 6,767 |
| | 5.00% 8/1/34 | | 12,136 | | | 14,086 |
| | 5.00% 4/1/35 | | 3,020 | | | 3,397 |
| | 5.00% 12/1/37 | | 1,474 | | | 1,706 |
| | 5.00% 3/1/38 | | 78,118 | | | 90,495 |
| | 5.00% 6/1/38 | | 2,687 | | | 2,982 |
| | 5.00% 2/1/39 | | 3,818 | | | 4,222 |
| | 5.00% 5/1/40 | | 70,119 | | | 81,033 |
| | 5.00% 7/1/47 | | 536,557 | | | 623,587 |
| | 5.50% 12/1/33 | | 8,616 | | | 9,656 |
| | 5.50% 2/1/35 | | 194,604 | | | 228,679 |
| | 5.50% 5/1/44 | | 9,627,007 | | | 11,264,388 |
| | 6.00% 9/1/36 | | 10,824 | | | 12,267 |
| | 6.00% 8/1/38 | | 30,023 | | | 33,896 |
| | 6.00% 12/1/38 | | 4,538 | | | 5,415 |
| | 6.00% 6/1/41 | | 1,440,520 | | | 1,720,767 |
| | 6.00% 7/1/41 | | 4,893,291 | | | 5,848,209 |
| | 6.00% 1/1/42 | | 1,227,812 | | | 1,466,879 |
| | 6.50% 11/1/33 | | 1,727 | | | 1,957 |
| | 6.50% 2/1/36 | | 29,276 | | | 34,350 |
| | 6.50% 3/1/36 | | 51,667 | | | 59,025 |
| | 6.50% 6/1/36 | | 50,121 | | | 58,712 |
| | 6.50% 2/1/38 | | 17,434 | | | 20,195 |
| | 6.50% 11/1/38 | | 3,663 | | | 4,342 |
| Fannie Mae S.F. 30 yr | | | | | |
| | TBA | | | | | |
| | 2.00% 4/1/51 | | 33,388,000 | | | 33,325,398 |
| | 2.00% 6/1/51 | | 15,600,000 | | | 15,510,422 |
| | 2.50% 4/1/51 | | 12,636,000 | | | 12,966,708 |
| | 2.50% 5/1/51 | | 16,600,000 | | | 16,998,788 |
| | 2.50% 6/1/51 | | 55,000,000 | | | 56,200,975 |
| | 3.00% 5/1/51 | | 220,800,000 | | | 230,028,756 |
| | 4.50% 4/1/51 | | 6,100,000 | | | 6,640,422 |
| Freddie Mac ARM | | | | | |
| | 2.00% (LIBOR12M + | | | | | |
| | 1.625%, Cap | | | | | |
| | 10.50%, Floor | | | | | |
| | 1.625%) 2/1/38 ● | | 13,893 | | | 13,899 |
| | 3.93% (LIBOR12M + | | | | | |
| | 2.18%, Cap | | | | | |
| | 10.539%, Floor | | | | | |
| | 2.18%) 5/1/37 ● | | 90,192 | | | 96,934 |
| Freddie Mac S.F. 15 yr | | | | | |
| | 1.50% 3/1/36 | | 5,687,949 | | | 5,727,770 |
| | 2.00% 12/1/35 | | 5,932,824 | | | 6,121,420 |
| Freddie Mac S.F. 20 yr | | | | | |
| | 2.00% 3/1/41 | | 4,096,248 | | | 4,152,133 |
| | 2.00% 4/1/41 | | 3,668,000 | | | 3,718,044 |
| | 5.50% 10/1/23 | | 6,249 | | | 6,964 |
| | 5.50% 8/1/24 | | 3,560 | | | 3,970 |
| Freddie Mac S.F. 30 yr | | | | | |
| | 2.50% 10/1/50 | | 3,246,653 | | | 3,348,632 |
| | 2.50% 2/1/51 | | 1,786,031 | | | 1,849,140 |
| | 3.00% 11/1/49 | | 4,138,974 | | | 4,317,548 |
| | 3.00% 12/1/49 | | 957,745 | | | 1,000,259 |
| | 3.00% 1/1/50 | | 1,036,373 | | | 1,089,439 |
| | 3.00% 12/1/50 | | 247,676 | | | 263,306 |
| | 3.50% 8/1/48 | | 44,733 | | | 47,287 |
| | 3.50% 9/1/48 | | 3,219,230 | | | 3,431,106 |
| | 3.50% 11/1/48 | | 7,112,138 | | | 7,673,956 |
| | 4.00% 12/1/45 | | 702,156 | | | 778,415 |
| | 4.00% 7/1/47 | | 304,337 | | | 328,632 |
| | 4.00% 10/1/47 | | 2,814,441 | | | 3,036,521 |
| | 4.50% 8/1/48 | | 1,667,847 | | | 1,831,036 |
| | 4.50% 1/1/49 | | 1,120,685 | | | 1,252,161 |
| | 4.50% 3/1/49 | | 402,324 | | | 439,677 |
| | 4.50% 4/1/49 | | 1,432,446 | | | 1,584,916 |
47
Table of Contents
Schedules of investments
Optimum Fixed Income Fund
| | | | | | | Principal
amount° | | | Value (US $) |
| Agency Mortgage-Backed Securities (continued) | | | | | | | |
| Freddie Mac S.F. 30 yr | | | | | | | |
| | 4.50% 8/1/49 | | | | 2,824,952 | | $ | 3,134,961 |
| | 5.50% 9/1/41 | | | | 2,095,662 | | | 2,459,583 |
| | 6.50% 11/1/33 | | | | 17,461 | | | 20,090 |
| | 6.50% 1/1/35 | | | | 48,763 | | | 58,014 |
| | 7.00% 1/1/38 | | | | 7,198 | | | 7,911 |
| GNMA I S.F. 30 yr | | | | | | | |
| | 3.00% 3/15/50 | | | | 1,069,433 | | | 1,120,046 |
| GNMA II S.F. 30 yr | | | | | | | |
| | 5.50% 5/20/37 | | | | 64,914 | | | 74,050 |
| | 6.00% 4/20/34 | | | | 2,894 | | | 3,203 |
| GNMA S.F. 30 yr TBA | | | | | | | |
| | 3.00% 4/20/51 | | | | 14,111,000 | | | 14,700,244 |
| | 4.00% 4/20/51 | | | | 6,000,000 | | | 6,405,000 |
| Total Agency Mortgage-Backed Securities | | | | | | | |
| (cost $652,062,742) | | | | | | | 652,849,494 |
| | | | | | | | | |
| Collateralized Debt Obligations – 4.00% | | | | | | | |
| Adagio V CLO DAC | | | | | | | |
| | Series V-A ARR 144A | | | | | | | |
| | 0.72% (EUR003M + | | | | | | | |
| | 0.72%, Floor 0.72%) | | | | | | | |
| | 10/15/31 #, ● | | EUR | | 1,100,000 | | | 1,289,648 |
| AMMC CLO 16 | | | | | | | |
| | Series 2015-16A AR2 | | | | | | | |
| | 144A 1.167% | | | | | | | |
| | (LIBOR03M + 0.98%, | | | | | | | |
| | Floor 0.98%) | | | | | | | |
| | 4/14/29 #, ● | | | | 1,400,000 | | | 1,399,649 |
| AMMC CLO 21 | | | | | | | |
| | Series 2017-21A A | | | | | | | |
| | 144A 1.452% | | | | | | | |
| | (LIBOR03M + 1.25%) | | | | | | | |
| | 11/2/30 #, ● | | | | 2,400,000 | | | 2,406,607 |
| Apex Credit CLO | | | | | | | |
| | Series 2018-1A A2 | | | | | | | |
| | 144A 1.248% | | | | | | | |
| | (LIBOR03M + 1.03%) | | | | | | | |
| | 4/25/31 #, ● | | | | 2,400,000 | | | 2,344,690 |
| Aqueduct European CLO | | | | | | | |
| | DAC | | | | | | | |
| | Series 2017-1A AR | | | | | | | |
| | 144A 0.64% | | | | | | | |
| | (EUR003M + 0.64%, | | | | | | | |
| | Floor 0.64%) | | | | | | | |
| | 7/20/30 #, ● | | EUR | | 1,900,000 | | | 2,249,357 |
| Ares European CLO | | | | | | | |
| | Series 7A A1RR 144A | | | | | | | |
| | 0.66% (EUR003M + | | | | | | | |
| | 0.66%, Floor 0.66%) | | | | | | | |
| | 10/15/30 #, ≠, ● | | EUR | | 1,300,000 | | | 1,524,510 |
| Ares European CLO XIV | | | | | | | |
| | DAC | | | | | | | |
| | Series 14A A 144A | | | | | | | |
| | 1.12% (EUR003M + | | | | | | | |
| | 1.12%, Floor 1.12%) | | | | | | | |
| | 10/21/33 #, ● | | EUR | | 3,750,000 | | | 4,440,502 |
| Atlas Senior Loan Fund | | | | | | | |
| | X | | | | | | | |
| | Series 2018-10A A | | | | | | | |
| | 144A 1.331% | | | | | | | |
| | (LIBOR03M + 1.09%) | | | | | | | |
| | 1/15/31 #, ● | | | | 1,473,303 | | | 1,474,823 |
| Atrium XII | | | | | | | |
| | Series 12A AR 144A | | | | | | | |
| | 1.052% (LIBOR03M | | | | | | | |
| | + 0.83%) | | | | | | | |
| | 4/22/27 #, ● | | | | 2,373,617 | | | 2,373,021 |
| Bain Capital Euro DAC | | | | | | | |
| | Series 2018-2A AR | | | | | | | |
| | 144A 0.74% | | | | | | | |
| | (EUR003M + 0.74%, | | | | | | | |
| | Floor 0.74%) | | | | | | | |
| | 1/20/32 #, ≠, ● | | EUR | | 1,300,000 | | | 1,524,510 |
| Blackrock European CLO | | | | | | | |
| | VII DAC | | | | | | | |
| | Series 7A AR 144A | | | | | | | |
| | 0.62% (EUR003M + | | | | | | | |
| | 0.62%, Floor 0.62%) | | | | | | | |
| | 10/15/31 #, ● | | EUR | | 2,200,000 | | | 2,605,094 |
| Cairn CLO IV | | | | | | | |
| | Series 2014-4A ARRR | | | | | | | |
| | 144A 0.60% | | | | | | | |
| | (EUR003M + 0.60%, | | | | | | | |
| | Floor 0.60%) | | | | | | | |
| | 4/30/31 #, ● | | EUR | | 1,600,000 | | | 1,875,851 |
| Catamaran CLO | | | | | | | |
| | Series 2013-1A AR | | | | | | | |
| | 144A 1.063% | | | | | | | |
| | (LIBOR03M + 0.85%) | | | | | | | |
| | 1/27/28 #, ● | | | | 2,464,322 | | | 2,463,957 |
| CFIP CLO | | | | | | | |
| | Series 2017-1A A | | | | | | | |
| | 144A 1.443% | | | | | | | |
| | (LIBOR03M + 1.22%) | | | | | | | |
| | 1/18/30 #, ● | | | | 2,300,000 | | | 2,303,912 |
| Crown Point CLO 5 | | | | | | | |
| | Series 2018-5A A | | | | | | | |
| | 144A 1.163% | | | | | | | |
| | (LIBOR03M + 0.94%) | | | | | | | |
| | 7/17/28 #, ● | | | | 314,167 | | | 313,694 |
48
Table of Contents
| | | | | Principal | | | |
| | | | | | amount° | | Value (US $) |
| Collateralized Debt Obligations (continued) | | | | | | | |
| CVC Cordatus Loan | | | | | | | |
| Fund VII DAC | | | | | | | |
| Series 7A ARR 144A | | | | | | | |
| 0.63% (EUR003M + | | | | | | | |
| 0.63%, Floor 0.63%) | | | | | | | |
| 9/15/31 #, ● | | EUR | | 1,200,000 | | $ | 1,420,961 |
| Dryden 36 Senior Loan | | | | | | | |
| Fund | | | | | | | |
| Series 2014-36A AR3 | | | | | | | |
| 144A 1.261% | | | | | | | |
| (LIBOR03M + 1.02%, | | | | | | | |
| Floor 1.02%) | | | | | | | |
| 4/15/29 #, ● | | | | 3,600,000 | | | 3,601,674 |
| Dryden XXVII-R Euro | | | | | | | |
| CLO | | | | | | | |
| Series 2017-27A AR | | | | | | | |
| 144A 0.66% | | | | | | | |
| (EUR003M + 0.66%, | | | | | | | |
| Floor 0.66%) | | | | | | | |
| 4/15/33 #, ● | | EUR | | 2,200,000 | | | 2,579,295 |
| Euro-Galaxy III CLO DAC | | | | | | | |
| Series 2013-3A ARRR | | | | | | | |
| 144A 0.62% | | | | | | | |
| (EUR003M + 0.62%, | | | | | | | |
| Floor 0.62%) | | | | | | | |
| 4/24/34 #, ● | | EUR | | 4,000,000 | | | 4,689,627 |
| Galaxy XXI CLO | | | | | | | |
| Series 2015-21A AR | | | | | | | |
| 144A 1.244% | | | | | | | |
| (LIBOR03M + 1.02%) | | | | | | | |
| 4/20/31 #, ● | | | | 1,650,000 | | | 1,651,303 |
| Harvest CLO XVI DAC | | | | | | | |
| Series 16A ARR 144A | | | | | | | |
| 0.64% (EUR003M + | | | | | | | |
| 0.64%, Floor 0.64%) | | | | | | | |
| 10/15/31 #, ● EUR | | | | 2,000,000 | | | 2,368,268 |
| Harvest CLO XXI DAC | | | | | | | |
| Series 21A A2R 144A | | | | | | | |
| 1.04% 7/15/31 # EUR | | | | 250,000 | | | 293,175 |
| Invesco Euro CLO I DAC | | | | | | | |
| Series 1A A1R 144A | | | | | | | |
| 0.65% (EUR003M + | | | | | | | |
| 0.65%, Floor 0.65%) | | | | | | | |
| 7/15/31 #, ● | | EUR | | 250,000 | | | 292,986 |
| Jamestown CLO VII | | | | | | | |
| Series 2015-7A A1R | | | | | | | |
| 144A 1.048% | | | | | | | |
| (LIBOR03M + 0.83%, | | | | | | | |
| Floor 0.83%) | | | | | | | |
| 7/25/27 #, ● | | | | 275,706 | | | 275,637 |
| Jubilee CLO | | | | | | | |
| Series 2014-11A ARR | | | | | | | |
| 144A 0.61% | | | | | | | |
| (EUR003M + 0.61%, | | | | | | | |
| Floor 0.61%) | | | | | | | |
| 4/15/30 #, ≠, ● | | EUR | | 1,700,000 | | | 1,993,092 |
| Series 2014-12A ARRR | | | | | | | |
| 144A 0.60% | | | | | | | |
| (EUR003M + 0.60%, | | | | | | | |
| Floor 0.60%) | | | | | | | |
| 4/15/30 #, ● | | EUR | | 600,000 | | | 703,444 |
| Series 2016-17A A1RR | | | | | | | |
| 144A 0.65% | | | | | | | |
| (EUR003M + 0.65%, | | | | | | | |
| Floor 0.65%) | | | | | | | |
| 4/15/31 #, ≠ | | | | 1,400,000 | | | 1,641,370 |
| Series 2016-17A A2RR | | | | | | | |
| 144A 0.65% | | | | | | | |
| (EUR003M + 0.65%, | | | | | | | |
| Floor 0.65%) | | | | | | | |
| 4/15/31 #, ● | | EUR | | 500,000 | | | 586,203 |
| Laurelin DAC | | | | | | | |
| Series 2016-1A ARR | | | | | | | |
| 144A 0.72% | | | | | | | |
| (EUR003M + 0.72%, | | | | | | | |
| Floor 0.72%) | | | | | | | |
| 10/20/31 #, ≠, ● | | EUR | | 2,100,000 | | | 2,462,670 |
| LCM XV | | | | | | | |
| Series 15A AR2 144A | | | | | | | |
| 1.00% (LIBOR03M + | | | | | | | |
| 1.00%, Floor 1.00%) | | | | | | | |
| 7/20/30 #, ≠, ● | | | | 3,300,000 | | | 3,299,175 |
| Man GLG Euro CLO | | | | | | | |
| Series 6A A 144A | | | | | | | |
| 0.90% (EUR003M + | | | | | | | |
| 0.90%, Floor 0.90%) | | | | | | | |
| 10/15/32 #, ● | | EUR | | 250,000 | | | 292,955 |
| Man GLG Euro CLO III | | | | | | | |
| DAC | | | | | | | |
| Series 3A AR 144A | | | | | | | |
| 0.68% (EUR003M + | | | | | | | |
| 0.68%, Floor 0.68%) | | | | | | | |
| 10/15/30 #, ● | | EUR | | 1,100,000 | | | 1,289,648 |
| Man GLG Euro CLO V | | | | | | | |
| DAC | | | | | | | |
| Series 5A A1R 144A | | | | | | | |
| 0.69% (EUR003M + | | | | | | | |
| 0.69%, Floor 0.69%) | | | | | | | |
| 12/15/31 #, ● | | EUR | | 1,900,000 | | | 2,249,854 |
| Man GLG US CLO | | | | | | | |
| Series 2018-1A A1R | | | | | | | |
| 144A 1.364% | | | | | | | |
| (LIBOR03M + 1.14%) | | | | | | | |
| 4/22/30 #, ● | | | | 3,000,000 | | | 3,003,441 |
49
Table of Contents
Schedules of investments
Optimum Fixed Income Fund
| | | | | | Principal | | | |
| | | | | amount° | | Value (US $) |
| Collateralized Debt Obligations (continued) | | | | | | | |
| Marathon CLO | | | | | | | |
| Series 2021-16A A1A | | | | | | | |
| 144A 1.399% | | | | | | | |
| (LIBOR03M + 1.20%, | | | | | | | |
| Floor 1.20%) | | | | | | | |
| 4/15/34 #, ● | | | | 1,250,000 | | $ | 1,249,688 |
| Marathon CLO V | | | | | | | |
| Series 2013-5A A1R | | | | | | | |
| 144A 1.052% | | | | | | | |
| (LIBOR03M + 0.87%) | | | | | | | |
| 11/21/27 #, ● | | | | 641,010 | | | 638,681 |
| Midocean Credit CLO | | | | | | | |
| VIII | | | | | | | |
| Series 2018-8A A1 | | | | | | | |
| 144A 1.332% | | | | | | | |
| (LIBOR03M + 1.15%) | | | | | | | |
| 2/20/31 #, ● | | | | 1,750,000 | | | 1,749,562 |
| Midocean Credit CLO IX | | | | | | | |
| Series 2018-9A A1 | | | | | | | |
| 144A 1.374% | | | | | | | |
| (LIBOR03M + 1.15%, | | | | | | | |
| Floor 1.15%) | | | | | | | |
| 7/20/31 #, ● | | | | 1,250,000 | | | 1,254,204 |
| Monarch Grove CLO | | | | | | | |
| Series 2018-1A A1 | | | | | | | |
| 144A 1.098% | | | | | | | |
| (LIBOR03M + 0.88%) | | | | | | | |
| 1/25/28 #, ● | | | | 3,320,858 | | | 3,309,703 |
| Mountain View CLO X | | | | | | | |
| Series 2015-10A AR | | | | | | | |
| 144A 1.045% | | | | | | | |
| (LIBOR03M + 0.82%, | | | | | | | |
| Floor 0.82%) | | | | | | | |
| 10/13/27 #, ● | | | | 1,483,879 | | | 1,484,485 |
| Oak Hill European Credit | | | | | | | |
| Partners IV DAC | | | | | | | |
| Series 2015-4A A1RE | | | | | | | |
| 144A 0.73% | | | | | | | |
| (EUR003M + 0.73%, | | | | | | | |
| Floor 0.73%) | | | | | | | |
| 1/20/32 #, ● | | EUR | | 300,000 | | | 351,041 |
| OCP CLO | | | | | | | |
| Series 2015-9A A1R | | | | | | | |
| 144A 1.041% | | | | | | | |
| (LIBOR03M + 0.80%) | | | | | | | |
| 7/15/27 #, ● | | | | 601,176 | | | 601,273 |
| Series 2015-10A A1R | | | | | | | |
| 144A 1.035% | | | | | | | |
| (LIBOR03M + 0.82%) | | | | | | | |
| 10/26/27 #, ● | | | | 1,351,177 | | | 1,349,383 |
| Series 2017-13A A1A | | | | | | | |
| 144A 1.501% | | | | | | | |
| (LIBOR03M + 1.26%) | | | | | | | |
| 7/15/30 #, ● | | | | 1,000,000 | | | 1,001,142 |
| OZLM XVI | | | | | | | |
| Series 2017-16A A1R | | | | | | | |
| 144A 1.227% | | | | | | | |
| (LIBOR03M + 1.03%, | | | | | | | |
| Floor 1.03%) | | | | | | | |
| 5/16/30 #, ● | | | | 2,600,000 | | | 2,599,350 |
| Palmer Square European | | | | | | | |
| Loan Funding DAC | | | | | | | |
| Series 2020-2A A | | | | | | | |
| 144A 0.87% | | | | | | | |
| (EUR003M + 0.87%, | | | | | | | |
| Floor 0.87%) | | | | | | | |
| 2/15/30 #, ● | | EUR | | 2,000,000 | | | 2,366,328 |
| Signal Peak CLO 5 | | | | | | | |
| Series 2018-5A A | | | | | | | |
| 144A 1.328% | | | | | | | |
| (LIBOR03M + 1.11%, | | | | | | | |
| Floor 1.11%) | | | | | | | |
| 4/25/31 #, ● | | | | 1,800,000 | | | 1,803,146 |
| Sound Point CLO XIV | | | | | | | |
| Series 2016-3A AR2 | | | | | | | |
| 144A 1.161% | | | | | | | |
| (LIBOR03M + 0.99%, | | | | | | | |
| Floor 0.99%) | | | | | | | |
| 1/23/29 #, ● | | | | 6,600,000 | | | 6,601,525 |
| Sound Point CLO XVI | | | | | | | |
| Series 2017-2A AR | | | | | | | |
| 144A 0.98% | | | | | | | |
| (LIBOR03M + 0.98%) | | | | | | | |
| 7/25/30 #, ≠, ● | | | | 4,400,000 | | | 4,398,900 |
| Sounds Point CLO IV-R | | | | | | | |
| Series 2013-3RA A | | | | | | | |
| 144A 1.373% | | | | | | | |
| (LIBOR03M + 1.15%, | | | | | | | |
| Floor 1.15%) | | | | | | | |
| 4/18/31 #, ● | | | | 1,000,000 | | | 997,860 |
| TICP CLO I | | | | | | | |
| Series 2015-1A AR | | | | | | | |
| 144A 1.024% | | | | | | | |
| (LIBOR03M + 0.80%) | | | | | | | |
| 7/20/27 #, ● | | | | 766,834 | | | 765,311 |
| Venture 34 CLO | | | | | | | |
| Series 2018-34A A | | | | | | | |
| 144A 1.471% | | | | | | | |
| (LIBOR03M + 1.23%, | | | | | | | |
| Floor 1.23%) | | | | | | | |
| 10/15/31 #, ● | | | | 2,500,000 | | | 2,504,267 |
| Venture 42 CLO | | | | | | | |
| Series 2021-42A A1A | | | | | | | |
| 144A 1.13% | | | | | | | |
| (LIBOR03M + 1.13%, | | | | | | | |
| Floor 1.13%) | | | | | | | |
| 4/15/34 #, ≠, ● | | | | 1,300,000 | | | 1,299,675 |
50
Table of Contents
| | | | | | Principal | | | |
| | | | | | | amount° | | Value (US $) |
| Collateralized Debt Obligations (continued) | | | | | | | |
| Venture XVI CLO | | | | | | | |
| | Series 2014-16A ARR | | | | | | | |
| | 144A 1.091% | | | | | | | |
| | (LIBOR03M + 0.85%, | | | | | | | |
| | Floor 0.85%) | | | | | | | |
| | 1/15/28 #, ● | | | | 849,299 | | $ | 847,154 |
| Venture XVII CLO | | | | | | | |
| | Series 2014-17A ARR | | | | | | | |
| | 144A 1.121% | | | | | | | |
| | (LIBOR03M + 0.88%) | | | | | | | |
| | 4/15/27 #, ● | | | | 349,041 | | | 348,088 |
| Venture XX CLO | | | | | | | |
| | Series 2015-20A AR | | | | | | | |
| | 144A 1.061% | | | | | | | |
| | (LIBOR03M + 0.82%) | | | | | | | |
| | 4/15/27 #, ● | | | | 980,931 | | | 979,817 |
| Venture XXIV CLO | | | | | | | |
| | Series 2016-24A ARR | | | | | | | |
| | 144A 1.124% | | | | | | | |
| | (LIBOR03M + 0.90%, | | | | | | | |
| | Floor 0.90%) | | | | | | | |
| | 10/20/28 #, ● | | | | 500,000 | | | 499,875 |
| Venture XXVI CLO | | | | | | | |
| | Series 2017-26A AR | | | | | | | |
| | 144A 1.324% | | | | | | | |
| | (LIBOR03M + 1.10%, | | | | | | | |
| | Floor 1.10%) | | | | | | | |
| | 1/20/29 #, ● | | | | 3,400,000 | | | 3,399,143 |
| Vibrant CLO VII | | | | | | | |
| | Series 2017-7A A1R | | | | | | | |
| | 144A 1.04% | | | | | | | |
| | (LIBOR03M + 1.04%, | | | | | | | |
| | Floor 1.04%) | | | | | | | |
| | 9/15/30 #, ≠, ● | | | | 4,500,000 | | | 4,500,000 |
| Voya CLO | | | | | | | |
| | Series 2014-3A A1R | | | | | | | |
| | 144A 0.938% | | | | | | | |
| | (LIBOR03M + 0.72%) | | | | | | | |
| | 7/25/26 #, ● | | | | 121,356 | | | 121,285 |
| WhiteHorse IX | | | | | | | |
| | Series 2014-9A AR | | | | | | | |
| | 144A 1.383% | | | | | | | |
| | (LIBOR03M + 1.16%) | | | | | | | |
| | 7/17/26 #, ● | | | | 6,660 | | | 6,658 |
| Z Capital Credit Partners | | | | | | | |
| | CLO | | | | | | | |
| | Series 2015-1A A1R | | | | | | | |
| | 144A 1.173% | | | | | | | |
| | (LIBOR03M + 0.95%, | | | | | | | |
| | Floor 0.95%) | | | | | | | |
| | 7/16/27 #, ● | | | | 1,146,388 | | | 1,144,316 |
| Total Collateralized Debt Obligations | | | | | | | |
| (cost $114,330,496) | | | | | | | 113,456,463 |
| | | | | | | | | |
| Corporate Bonds – 34.24% | | | | | | | |
| Banking – 10.07% | | | | | | | |
| Akbank TAS 144A | | | | | | | |
| | 6.80% 2/6/26 # | | | | 610,000 | | | 610,262 |
| Banco Bilbao Vizcaya | | | | | | | |
| | Argentaria | | | | | | | |
| | 5.875% 9/24/23 µ, ψ | | EUR | | 400,000 | | | 500,637 |
| | 8.875% 4/14/21 µ, ψ | | EUR | | 1,200,000 | | | 1,411,224 |
| Banco Continental 144A | | | | | | | |
| | 2.75% 12/10/25 # | | | | 915,000 | | | 902,254 |
| Banco de Bogota 144A | | | | | | | |
| | 6.25% 5/12/26 # | | | | 405,000 | | | 455,119 |
| Banco Industrial 144A | | | | | | | |
| | 4.875% 1/29/31 #, µ | | | | 695,000 | | | 717,063 |
| Banco Mercantil del | | | | | | | |
| | Norte 144A 8.375% | | | | | | | |
| | 10/14/30 #, µ, ψ | | | | 475,000 | | | 554,532 |
| Banco Nacional de | | | | | | | |
| | Panama 144A 2.50% | | | | | | | |
| | 8/11/30 # | | | | 200,000 | | | 185,960 |
| Banco Santander | | | | | | | |
| | 2.958% 3/25/31 | | | | 1,000,000 | | | 995,084 |
| | 6.25% 9/11/21 µ, ψ | | EUR | | 1,300,000 | | | 1,557,859 |
| Banco Santander Mexico | | | | | | | |
| | 144A 5.95% | | | | | | | |
| | 10/1/28 #, µ | | | | 280,000 | | | 302,568 |
| Bangkok Bank 144A | | | | | | | |
| | 5.00% | | | | | | | |
| | 9/23/25 #, µ, ψ | | | | 480,000 | | | 506,246 |
| Bank Leumi Le-Israel | | | | | | | |
| | 144A 3.275% | | | | | | | |
| | 1/29/31 #, µ | | | | 1,370,000 | | | 1,397,221 |
| Bank of America | | | | | | | |
| | 1.658% 3/11/27 µ | | | | 1,900,000 | | | 1,907,087 |
| | 1.898% 7/23/31 µ | | | | 3,095,000 | | | 2,909,707 |
| | 2.625% 4/19/21 | | | | 1,000,000 | | | 1,000,932 |
| | 2.676% 6/19/41 µ | | | | 5,120,000 | | | 4,803,870 |
| | 2.831% 10/24/51 µ | | | | 380,000 | | | 349,549 |
| | 3.55% 3/5/24 µ | | | | 2,100,000 | | | 2,216,276 |
| | 3.864% 7/23/24 µ | | | | 2,200,000 | | | 2,357,145 |
| | 3.974% 2/7/30 µ | | | | 3,400,000 | | | 3,777,459 |
| | 4.125% 1/22/24 | | | | 200,000 | | | 218,716 |
| | 4.30% 1/28/25 µ, ψ | | | | 900,000 | | | 904,500 |
| Bank of China 144A | | | | | | | |
| | 5.00% 11/13/24 # | | | | 710,000 | | | 798,250 |
| Bank of Georgia 144A | | | | | | | |
| | 6.00% 7/26/23 # | | | | 890,000 | | | 949,662 |
| Bank of New York | | | | | | | |
| | Mellon 4.70% | | | | | | | |
| | 9/20/25 µ, ψ | | | | 2,560,000 | | | 2,780,032 |
| Bank of Nova Scotia | | | | | | | |
| | 1.875% 4/26/21 | | | | 4,500,000 | | | 4,504,428 |
51
Table of Contents
Schedules of investments
Optimum Fixed Income Fund
| | | | | | | Principal | | | |
| | | | | | amount° | | Value (US $) |
| Corporate Bonds (continued) | | | | | | | |
| Banking (continued) | | | | | | | |
| Barclays | | | | | | | |
| | 1.574% (LIBOR03M | | | | | | | |
| | + 1.38%) 5/16/24 ● | | | | 1,800,000 | | $ | 1,826,285 |
| | 2.667% 3/10/32 µ | | | | 1,025,000 | | | 1,001,842 |
| | 3.375% 4/2/25 µ | | EUR | | 500,000 | | | 640,672 |
| | 4.61% 2/15/23 µ | | | | 700,000 | | | 723,353 |
| | 4.972% 5/16/29 µ | | | | 3,000,000 | | | 3,452,671 |
| | 5.20% 5/12/26 | | | | 2,979,000 | | | 3,375,028 |
| | 6.375% | | | | | | | |
| | 12/15/25 µ, ψ | | GBP | | 500,000 | | | 758,154 |
| | 7.125% 6/15/25 µ, ψ | | GBP | | 1,800,000 | | | 2,800,400 |
| Barclays Bank 7.625% | | | | | | | |
| | 11/21/22 | | | | 439,000 | | | 481,920 |
| BBVA Bancomer 144A | | | | | | | |
| | 5.125% 1/18/33 #, µ | | | | 410,000 | | | 422,831 |
| BBVA USA 3.875% | | | | | | | |
| | 4/10/25 | | | | 1,145,000 | | | 1,251,710 |
| BDO Unibank 2.125% | | | | | | | |
| | 1/13/26 | | | | 795,000 | | | 808,736 |
| BNP Paribas | | | | | | | |
| | 144A 3.052% | | | | | | | |
| | 1/13/31 #, µ | | | | 2,600,000 | | | 2,667,269 |
| | 144A 4.705% | | | | | | | |
| | 1/10/25 #, µ | | | | 1,600,000 | | | 1,760,471 |
| | 144A 7.375% | | | | | | | |
| | 8/19/25 #, µ, ψ | | | | 700,000 | | | 812,486 |
| | 7.375% 8/19/25 µ, ψ | | | | 500,000 | | | 580,347 |
| Citigroup | | | | | | | |
| | 3.20% 10/21/26 | | | | 1,000,000 | | | 1,075,366 |
| | 4.00% 12/10/25 µ, ψ | | | | 1,400,000 | | | 1,417,150 |
| | 4.044% 6/1/24 µ | | | | 1,800,000 | | | 1,929,910 |
| | 4.05% 7/30/22 | | | | 150,000 | | | 156,802 |
| | 4.075% 4/23/29 µ | | | | 3,400,000 | | | 3,784,840 |
| Citizens Bank 2.55% | | | | | | | |
| | 5/13/21 | | | | 950,000 | | | 950,449 |
| Cooperatieve Rabobank | | | | | | | |
| | 0.645% (LIBOR03M | | | | | | | |
| | + 0.43%) 4/26/21 ● | | | | 500,000 | | | 500,156 |
| | 3.75% 7/21/26 | | | | 1,350,000 | | | 1,473,741 |
| | 4.375% 8/4/25 | | | | 2,000,000 | | | 2,216,231 |
| Credit Suisse Group | | | | | | | |
| | 144A 2.593% | | | | | | | |
| | 9/11/25 #, µ | | | | 1,105,000 | | | 1,146,425 |
| | 3.80% 6/9/23 | | | | 2,300,000 | | | 2,441,769 |
| | 144A 3.869% | | | | | | | |
| | 1/12/29 #, µ | | | | 1,065,000 | | | 1,143,333 |
| | 144A 4.194% | | | | | | | |
| | 4/1/31 #, µ | | | | 4,045,000 | | | 4,405,224 |
| | 144A 4.207% | | | | | | | |
| | 6/12/24 #, µ | | | | 410,000 | | | 438,065 |
| | 144A 4.50% | | | | | | | |
| | 9/3/30 #, µ, ψ | | | | 820,000 | | | 770,800 |
| | 144A 5.25% | | | | | | | |
| | 2/11/27 #, µ, ψ | | | | 885,000 | | | 896,062 |
| | 144A 6.25% | | | | | | | |
| | 12/18/24 #, µ, ψ | | | | 2,000,000 | | | 2,134,222 |
| | 144A 6.375% | | | | | | | |
| | 8/21/26 #, µ, ψ | | | | 1,900,000 | | | 2,025,086 |
| Credit Suisse Group | | | | | | | |
| | Funding Guernsey | | | | | | | |
| | 3.80% 9/15/22 | | | | 3,350,000 | | | 3,490,132 |
| DBS Group Holdings | | | | | | | |
| | 144A 4.52% | | | | | | | |
| | 12/11/28 #, µ | | | | 530,000 | | | 575,007 |
| Deutsche Bank | | | | | | | |
| | 2.129% 11/24/26 µ | | | | 700,000 | | | 702,224 |
| | 3.547% 9/18/31 µ | | | | 4,135,000 | | | 4,274,883 |
| | 3.729% 1/14/32 µ | | | | 3,115,000 | | | 3,024,074 |
| | 3.961% 11/26/25 µ | | | | 5,700,000 | | | 6,177,121 |
| | 4.25% 10/14/21 | | | | 2,000,000 | | | 2,037,411 |
| | 5.00% 2/14/22 | | | | 3,100,000 | | | 3,209,951 |
| Development Bank of | | | | | | | |
| | Mongolia 144A | | | | | | | |
| | 7.25% 10/23/23 # | | | | 710,000 | | | 771,074 |
| Emirates NBD Bank | | | | | | | |
| | 2.625% 2/18/25 | | | | 495,000 | | | 519,243 |
| Fifth Third Bancorp | | | | | | | |
| | 2.55% 5/5/27 | | | | 1,201,000 | | | 1,250,826 |
| | 3.65% 1/25/24 | | | | 790,000 | | | 851,601 |
| | 3.95% 3/14/28 | | | | 1,119,000 | | | 1,265,971 |
| Fifth Third Bank 3.85% | | | | | | | |
| | 3/15/26 | | | | 835,000 | | | 920,420 |
| Goldman Sachs Group | | | | | | | |
| | 0.523% 3/8/23 | | | | 700,000 | | | 700,208 |
| | 0.673% 3/8/24 µ | | | | 700,000 | | | 699,718 |
| | 1.431% 3/9/27 µ | | | | 2,000,000 | | | 1,983,031 |
| | 1.992% 1/27/32 µ | | | | 3,240,000 | | | 3,077,620 |
| | 3.20% 2/23/23 | | | | 2,200,000 | | | 2,302,773 |
| | 3.50% 4/1/25 | | | | 1,220,000 | | | 1,322,249 |
| | 4.223% 5/1/29 µ | | | | 4,700,000 | | | 5,275,793 |
52
Table of Contents
| | | | | | | Principal | | | |
| | | | | | amount° | | Value (US $) |
| Corporate Bonds (continued) | | | | | | | |
| Banking (continued) | | | | | | | |
| HSBC Holdings | | | | | | | |
| | 1.189% (LIBOR03M | | | | | | | |
| | + 1.00%) 5/18/24 ● | | | | 1,000,000 | | $ | 1,010,677 |
| | 1.589% 5/24/27 µ | | | | 2,200,000 | | | 2,166,657 |
| | 2.848% 6/4/31 µ | | | | 2,700,000 | | | 2,703,506 |
| | 4.00% 3/9/26 µ, ψ | | | | 400,000 | | | 399,000 |
| | 4.30% 3/8/26 | | | | 200,000 | | | 224,033 |
| | 4.70% 3/9/31 µ, ψ | | | | 500,000 | | | 493,750 |
| ICICI Bank 144A 4.00% | | | | | | | |
| | 3/18/26 # | | | | 535,000 | | | 577,666 |
| Intesa Sanpaolo | | | | | | | |
| | 144A 4.00% | | | | | | | |
| | 9/23/29 # | | | | 1,300,000 | | | 1,393,643 |
| | 7.75% 1/11/27 µ, ψ | | EUR | | 200,000 | | | 287,932 |
| JPMorgan Chase & Co. | | | | | | | |
| | 1.04% 2/4/27 µ | | | | 700,000 | | | 683,055 |
| | 1.118% (LIBOR03M | | | | | | | |
| | + 0.90%) 4/25/23 ● | | | | 1,000,000 | | | 1,007,821 |
| | 1.953% 2/4/32 µ | | | | 725,000 | | | 687,736 |
| | 2.522% 4/22/31 µ | | | | 1,605,000 | | | 1,602,909 |
| | 3.109% 4/22/41 µ | | | | 670,000 | | | 667,640 |
| | 3.22% 3/1/25 µ | | | | 500,000 | | | 533,663 |
| | 4.005% 4/23/29 µ | | | | 900,000 | | | 1,004,596 |
| | 4.023% 12/5/24 µ | | | | 4,730,000 | | | 5,133,644 |
| | 4.60% 2/1/25 µ, ψ | | | | 1,185,000 | | | 1,199,812 |
| | 5.00% 8/1/24 µ, ψ | | | | 1,650,000 | | | 1,706,988 |
| Lloyds Banking Group | | | | | | | |
| | 2.438% 2/5/26 µ | | | | 300,000 | | | 310,862 |
| | 2.858% 3/17/23 µ | | | | 2,900,000 | | | 2,961,829 |
| | 3.50% 4/1/26 µ | | EUR | | 200,000 | | | 265,037 |
| Mitsubishi UFJ Financial | | | | | | | |
| | Group | | | | | | | |
| | 1.244% (LIBOR03M | | | | | | | |
| | + 1.06%) 9/13/21 ● | | | | 1,354,000 | | | 1,359,822 |
| | 2.193% 2/25/25 | | | | 1,700,000 | | | 1,754,529 |
| | 2.559% 2/25/30 | | | | 1,800,000 | | | 1,800,848 |
| | 3.218% 3/7/22 | | | | 500,000 | | | 513,277 |
| Mizrahi Tefahot Bank | | | | | | | |
| | 144A 3.077% | | | | | | | |
| | 4/7/31 #, µ | | | | 555,000 | | | 555,208 |
| Mizuho Financial Group | | | | | | | |
| | 1.324% (LIBOR03M | | | | | | | |
| | + 1.14%) 9/13/21 ● | | | | 1,900,000 | | | 1,909,114 |
| | 2.226% 5/25/26 µ | | | | 1,600,000 | | | 1,647,065 |
| | 2.591% 5/25/31 µ | | | | 2,000,000 | | | 1,997,689 |
| Morgan Stanley | | | | | | | |
| | 1.413% (LIBOR03M | | | | | | | |
| | + 1.22%) 5/8/24 ● | | | | 2,010,000 | | | 2,042,033 |
| | 1.794% 2/13/32 µ | | | | 90,000 | | | 84,077 |
| | 2.188% 4/28/26 µ | | | | 3,705,000 | | | 3,830,359 |
| | 2.50% 4/21/21 | | | | 3,500,000 | | | 3,503,445 |
| | 3.625% 1/20/27 | | | | 4,000,000 | | | 4,392,467 |
| | 5.00% 11/24/25 | | | | 3,125,000 | | | 3,595,278 |
| Nationwide Building | | | | | | | |
| | Society | | | | | | | |
| | 144A 3.766% | | | | | | | |
| | 3/8/24 #, µ | | | | 800,000 | | | 845,529 |
| | 144A 4.302% | | | | | | | |
| | 3/8/29 #, µ | | | | 5,200,000 | | | 5,761,014 |
| Natwest Group | | | | | | | |
| | 1.664% (LIBOR03M | | | | | | | |
| | + 1.47%) 5/15/23 ● | | | | 1,000,000 | | | 1,011,737 |
| | 3.498% 5/15/23 µ | | | | 500,000 | | | 515,479 |
| | 4.80% 4/5/26 | | | | 5,000,000 | | | 5,675,725 |
| | 5.125% 5/12/27 µ, ψ | | GBP | | 500,000 | | | 725,909 |
| | 8.625% 8/15/21 µ, ψ | | | | 5,900,000 | | | 6,053,223 |
| PNC Bank | | | | | | | |
| | 2.70% 11/1/22 | | | | 250,000 | | | 258,785 |
| | 4.05% 7/26/28 | | | | 2,400,000 | | | 2,684,661 |
| PNC Financial Services | | | | | | | |
| | Group 2.60% | | | | | | | |
| | 7/23/26 | | | | 2,845,000 | | | 3,007,574 |
| QNB Finance | | | | | | | |
| | 2.625% 5/12/25 | | | | 760,000 | | | 788,659 |
| | 3.50% 3/28/24 | | | | 625,000 | | | 665,941 |
| Santander UK | | | | | | | |
| | 3.40% 6/1/21 | | | | 500,000 | | | 502,388 |
| | 3.75% 11/15/21 | | | | 200,000 | | | 204,207 |
| Santander UK Group | | | | | | | |
| | Holdings | | | | | | | |
| | 3.823% 11/3/28 µ | | | | 3,200,000 | | | 3,496,896 |
| | 7.375% 6/24/22 µ, ψ | | GBP | | 2,200,000 | | | 3,183,823 |
| Shinhan Financial Group | | | | | | | |
| | 144A 3.34% | | | | | | | |
| | 2/5/30 #, µ | | | | 410,000 | | | 428,433 |
| Societe Generale 144A | | | | | | | |
| | 4.25% 4/14/25 # | | | | 3,600,000 | | | 3,901,070 |
| Sumitomo Mitsui | | | | | | | |
| | Financial Group | | | | | | | |
| | 1.474% 7/8/25 | | | | 2,600,000 | | | 2,603,818 |
| SVB Financial Group | | | | | | | |
| | 1.80% 2/2/31 | | | | 775,000 | | | 716,153 |
| | 4.10% 2/15/31 µ, ψ | | | | 2,390,000 | | | 2,397,469 |
53
Table of Contents
Schedules of investments
Optimum Fixed Income Fund
| | | | | | | Principal | | | |
| | | | | | amount° | | Value (US $) |
| Corporate Bonds (continued) | | | | | |
| Banking (continued) | | | | | | | |
| Truist Bank | | | | | | | |
| | 2.25% 3/11/30 | | | | 2,095,000 | | $ | 2,046,664 |
| | 2.636% 9/17/29 µ | | | | 5,182,000 | | | 5,434,778 |
| Truist Financial 4.95% | | | | | | | |
| | 9/1/25 µ, ψ | | | | 1,465,000 | | | 1,591,356 |
| UBS | | | | | | | |
| | 5.125% 5/15/24 | | | | 200,000 | | | 220,651 |
| | 7.625% 8/17/22 | | | | 500,000 | | | 545,176 |
| UBS Group | | | | | | | |
| | 144A 1.364% | | | | | | | |
| | 1/30/27 #, µ | | | | 400,000 | | | 394,452 |
| | 144A 2.014% | | | | | | | |
| | (LIBOR03M + 1.78%) | | | | | |
| | 4/14/21 #, ● | | | | 400,000 | | | 400,179 |
| | 144A 3.00% | | | | | | | |
| | 4/15/21 # | | | | 2,400,000 | | | 2,401,865 |
| | 144A 3.126% | | | | | | | |
| | 8/13/30 #, µ | | | | 2,000,000 | | | 2,097,519 |
| | 144A 4.125% | | | | | | | |
| | 9/24/25 # | | | | 2,940,000 | | | 3,265,952 |
| | 7.125% 8/10/21 µ, ψ | | 540,000 | | | 550,936 |
| UniCredit | | | | | | | |
| | 144A 4.134% | | | | | | | |
| | (LIBOR03M + 3.90%) | | | | | |
| | 1/14/22 #, ● | | | | 2,200,000 | | | 2,254,487 |
| | 7.50% 6/3/26 µ, ψ | | EUR | | 600,000 | | | 834,357 |
| | 144A 7.83% | | | | | | | |
| | 12/4/23 # | | | | 2,900,000 | | | 3,381,899 |
| | 9.25% 6/3/22 µ, ψ | | EUR | | 200,000 | | | 255,774 |
| US Bancorp | | | | | | | |
| | 1.45% 5/12/25 | | | | 1,565,000 | | | 1,587,338 |
| | 3.375% 2/5/24 | | | | 2,915,000 | | | 3,143,186 |
| | 3.60% 9/11/24 | | | | 1,275,000 | | | 1,392,970 |
| | 3.95% 11/17/25 | | | | 2,820,000 | | | 3,155,526 |
| US Bank 3.40% | | | | | | | |
| | 7/24/23 | | | | 815,000 | | | 870,730 |
| USB Capital IX 3.50% | | | | | | | |
| | (LIBOR03M + 1.02%) | | | | | |
| | 6/1/21 ψ, ● | | | | 415,000 | | | 399,437 |
| Virgin Money UK | | | | | | | |
| | 3.375% 4/24/26 µ | | GBP | | 100,000 | | | 145,779 |
| | 4.00% 9/25/26 µ | | GBP | | 800,000 | | | 1,200,399 |
| | 4.00% 9/3/27 µ | | GBP | | 100,000 | | | 151,579 |
| Wells Fargo & Co. | | | | | | | |
| | 3.196% 6/17/27 µ | | | | 900,000 | | | 965,333 |
| | 3.584% 5/22/28 µ | | | | 5,300,000 | | | 5,783,206 |
| | 3.90% 3/15/26 µ, ψ | | | | 3,380,000 | | | 3,415,574 |
| | | | | | | | | 285,598,040 |
| Basic Industry — 1.91% | | | | | | | |
| AngloGold Ashanti | | | | | | | |
| | Holdings 3.75% | | | | | | | |
| | 10/1/30 | | | | 595,000 | | | 604,545 |
| Avient 144A 5.75% | | | | | | | |
| | 5/15/25 # | | | | 60,000 | | | 63,825 |
| Braskem Netherlands | | | | | | | |
| | Finance 4.50% | | | | | | | |
| | 1/10/28 | | | | 800,000 | | | 823,288 |
| Corp Nacional del Cobre | | | | | | | |
| | de Chile | | | | | | | |
| | 144A 3.15% | | | | | | | |
| | 1/14/30 # | | | | 2,770,000 | | | 2,877,473 |
| | 144A 4.25% | | | | | | | |
| | 7/17/42 # | | | | 200,000 | | | 217,115 |
| CSN Inova Ventures | | | | | | | |
| | 144A 6.75% | | | | | | | |
| | 1/28/28 # | | | | 1,695,000 | | | 1,798,268 |
| CSN Islands XII 144A | | | | | | | |
| | 7.00% 6/23/21 #, ψ | | | | 290,000 | | | 291,299 |
| Equate Petrochemical | | | | | | | |
| | 144A 4.25% | | | | | | | |
| | 11/3/26 # | | | | 445,000 | | | 485,148 |
| First Quantum Minerals | | | | | | | |
| | 144A 6.875% | | | | | | | |
| | 10/15/27 # | | | | 360,000 | | | 386,550 |
| | 144A 7.50% | | | | | | | |
| | 4/1/25 # | | | | 2,740,000 | | | 2,832,475 |
| Freeport-McMoRan | | | | | | | |
| | 5.45% 3/15/43 | | | | 1,670,000 | | | 2,012,116 |
| Fresnillo 144A 4.25% | | | | | | | |
| | 10/2/50 # | | | | 380,000 | | | 374,053 |
| GC Treasury Center | | | | | | | |
| | 144A 4.30% | | | | | | | |
| | 3/18/51 # | | | | 635,000 | | | 649,911 |
| Georgia-Pacific | | | | | | | |
| | 144A 1.75% | | | | | | | |
| | 9/30/25 # | | | | 925,000 | | | 941,716 |
| | 144A 2.10% | | | | | | | |
| | 4/30/27 # | | | | 735,000 | | | 747,908 |
| | 144A 2.30% | | | | | | | |
| | 4/30/30 # | | | | 1,660,000 | | | 1,655,670 |
| | 8.00% 1/15/24 | | | | 2,242,000 | | | 2,688,259 |
| Gold Fields Orogen | | | | | | | |
| | Holdings BVI 144A | | | | | | | |
| | 6.125% 5/15/29 # | | | | 715,000 | | | 840,125 |
| GUSAP III 144A 4.25% | | | | | | | |
| | 1/21/30 # | | | | 745,000 | | | 785,431 |
| Huntsman International | | | | | | | |
| | 5.125% 11/15/22 | | | | 1,000,000 | | | 1,055,185 |
| ICL Group 144A 6.375% | | | | | | | |
| | 5/31/38 # | | | | 1,245,000 | | | 1,587,375 |
54
Table of Contents
| | | | | | | Principal | | | |
| | | | | | amount° | | Value (US $) |
| Corporate Bonds (continued) | | | | | |
| Basic Industry (continued) | | | | | |
| INEOS Styrolution Group | | | | | |
| | 144A 2.25% | | | | | | | |
| | 1/16/27 # | | EUR | | 500,000 | | $ | 572,400 |
| Inversiones CMPC 144A | | | | | |
| | 4.75% 9/15/24 # | | | | 560,000 | | | 615,098 |
| LyondellBasell Industries | | | | | |
| | 4.625% 2/26/55 | | | | 2,615,000 | | | 2,917,944 |
| Methanex 5.25% | | | | | | | |
| | 12/15/29 | | | | 2,515,000 | | | 2,598,775 |
| Metinvest 144A 7.65% | | | | | |
| | 10/1/27 # | | | | 616,000 | | | 665,148 |
| Minera Mexico 144A | | | | | | | |
| | 4.50% 1/26/50 # | | | | 770,000 | | | 794,263 |
| Newmont | | | | | | | |
| | 2.25% 10/1/30 | | | | 2,615,000 | | | 2,549,528 |
| | 2.80% 10/1/29 | | | | 3,850,000 | | | 3,964,012 |
| Nutrition & Biosciences | | | | | |
| | 144A 3.268% | | | | | | | |
| | 11/15/40 # | | | | 3,330,000 | | | 3,288,420 |
| OCP | | | | | | | |
| | 144A 4.50% | | | | | | | |
| | 10/22/25 # | | | | 704,000 | | | 747,687 |
| | 144A 6.875% | | | | | | | |
| | 4/25/44 # | | | | 210,000 | | | 245,228 |
| Olin | | | | | | | |
| | 5.00% 2/1/30 | | | | 1,840,000 | | | 1,931,632 |
| | 5.625% 8/1/29 | | | | 705,000 | | | 761,280 |
| Phosagro OAO via | | | | | | | |
| | Phosagro Bond | | | | | | | |
| | Funding DAC 144A | | | | | |
| | 3.949% 4/24/23 # | | 380,000 | | | 393,332 |
| Sasol Financing USA | | | | | | | |
| | 4.375% 9/18/26 | | | | 580,000 | | | 593,137 |
| | 5.875% 3/27/24 | | | | 2,450,000 | | | 2,604,595 |
| Sociedad Quimica y | | | | | | | |
| | Minera de Chile 144A | | | | | |
| | 3.625% 4/3/23 # | | | | 495,000 | | | 518,461 |
| Vale Overseas 3.75% | | | | | |
| | 7/8/30 | | | | 1,690,000 | | | 1,767,140 |
| Vedanta Resources | | | | | | | |
| | Finance II 144A | | | | | | | |
| | 8.95% 3/11/25 # | | | | 2,485,000 | | | 2,377,872 |
| Volcan Cia Minera 144A | | | | | |
| | 4.375% 2/11/26 # | | 615,000 | | | 631,122 |
| | | | | | | | | 54,254,809 |
| Brokerage — 0.33% | | | | | | | |
| Banco BTG Pactual | | | | | | | |
| | 144A 2.75% | | | | | | | |
| | 1/11/26 # | | | | 215,000 | | | 203,928 |
| | 144A 4.50% | | | | | | | |
| | 1/10/25 # | | | | 525,000 | | | 537,330 |
| Charles Schwab | | | | | | | |
| | 4.00% 6/1/26 µ, ψ | | 950,000 | | | 966,435 |
| | 4.00% 12/1/30 µ, ψ | | 820,000 | | | 807,085 |
| | 5.375% 6/1/25 µ, ψ | | 2,495,000 | | | 2,762,389 |
| Jefferies Group | | | | | | | |
| | 4.15% 1/23/30 | | | | 2,205,000 | | | 2,425,491 |
| | 6.45% 6/8/27 | | | | 331,000 | | | 413,126 |
| | 6.50% 1/20/43 | | | | 880,000 | | | 1,127,410 |
| | | | | | | | | 9,243,194 |
| Capital Goods — 1.02% | | | | | |
| Abertis Infraestructuras | | | | | |
| | Finance 3.248% | | | | | | | |
| | 11/24/25 µ, ψ | | EUR | | 1,500,000 | | | 1,806,043 |
| Aeropuertos Argentina | | | | | |
| | 2000 PIK 144A | | | | | | | |
| | 9.375% 2/1/27 #, * | | 726,249 | | | 584,630 |
| ARD Finance PIK 144A | | | | | |
| | 6.50% 6/30/27 #, > | | 1,170,000 | | | 1,229,963 |
| Bioceanico Sovereign | | | | | | | |
| | Certificate 144A | | | | | | | |
| | 2.884% 6/5/34 #, ^ | | 580,605 | | | 436,568 |
| Boeing 1.95% 2/1/24 | | 2,000,000 | | | 2,050,286 |
| Bombardier 144A | | | | | | | |
| | 6.00% 10/15/22 # | | 310,000 | | | 310,581 |
| Caterpillar 2.60% | | | | | | | |
| | 4/9/30 | | | | 25,000 | | | 25,620 |
| Cemex | | | | | | | |
| | 144A 3.875% | | | | | | | |
| | 7/11/31 # | | | | 600,000 | | | 586,830 |
| | 144A 7.375% | | | | | | | |
| | 6/5/27 # | | | | 545,000 | | | 617,894 |
| Covanta Holding 5.00% | | | | | |
| | 9/1/30 | | | | 590,000 | | | 596,638 |
| Heathrow Funding 144A | | | | | |
| | 4.875% 7/15/23 # | | 200,000 | | | 201,975 |
| HTA Group 144A 7.00% | | | | | |
| | 12/18/25 # | | | | 755,000 | | | 804,792 |
| Hutama Karya Persero | | | | | |
| | 144A 3.75% | | | | | | | |
| | 5/11/30 # | | | | 454,000 | | | 477,312 |
| IHS Netherlands Holdco | | | | | |
| | 144A 7.125% | | | | | | | |
| | 3/18/25 # | | | | 565,000 | | | 593,956 |
| Klabin Austria 144A | | | | | | | |
| | 7.00% 4/3/49 # | | | | 460,000 | | | 550,896 |
| Mauser Packaging | | | | | | | |
| | Solutions Holding | | | | | | | |
| | 144A 5.50% | | | | | | | |
| | 4/15/24 # | | | | 2,960,000 | | | 3,004,400 |
55
Table of Contents
Schedules of investments
Optimum Fixed Income Fund
| | | | | | | Principal | | | |
| | | | | | amount° | | Value (US $) |
| Corporate Bonds (continued) | | | | | | | |
| Capital Goods (continued) | | | | | | | |
| Otis Worldwide | | | | | | | |
| | 3.112% 2/15/40 | | | | 1,173,000 | | $ | 1,158,041 |
| | 3.362% 2/15/50 | | | | 202,000 | | | 197,871 |
| PowerTeam Services | | | | | | | |
| | 144A 9.033% | | | | | | | |
| | 12/4/25 # | | | | 1,680,000 | | | 1,856,400 |
| Reynolds Group Issuer | | | | | | | |
| | 144A 4.00% | | | | | | | |
| | 10/15/27 # | | | | 2,730,000 | | | 2,678,813 |
| Rolls-Royce 144A | | | | | | | |
| | 5.75% 10/15/27 # | | | | 1,000,000 | | | 1,065,300 |
| Rutas 2 and 7 Finance | | | | | | | |
| | 144A 3.295% | | | | | | | |
| | 9/30/36 #, ^ | | | | 410,000 | | | 293,150 |
| Standard Industries | | | | | | | |
| | 144A 3.375% | | | | | | | |
| | 1/15/31 # | | | | 1,083,000 | | | 1,027,496 |
| | 144A 5.00% | | | | | | | |
| | 2/15/27 # | | | | 309,000 | | | 322,712 |
| Teledyne Technologies | | | | | | | |
| | 2.25% 4/1/28 | | | | 1,980,000 | | | 1,971,724 |
| | 2.75% 4/1/31 | | | | 1,730,000 | | | 1,725,949 |
| TransDigm | | | | | | | |
| | 5.50% 11/15/27 | | | | 1,175,000 | | | 1,218,040 |
| | 144A 6.25% | | | | | | | |
| | 3/15/26 # | | | | 748,000 | | | 793,968 |
| UltraTech Cement 144A | | | | | | | |
| | 2.80% 2/16/31 # | | | | 660,000 | | | 621,196 |
| | | | | | | | | 28,809,044 |
| Communications — 4.41% | | | | | | | |
| Alibaba Group Holding | | | | | | | |
| | 2.70% 2/9/41 | | | | 750,000 | | | 682,367 |
| Altice Financing 144A | | | | | | | |
| | 5.00% 1/15/28 # | | | | 2,040,000 | | | 2,017,050 |
| Altice France 144A | | | | | | | |
| | 2.125% 2/15/25 # | | EUR | | 1,900,000 | | | 2,155,716 |
| Altice France Holding | | | | | | | |
| | 144A 6.00% | | | | | | | |
| | 2/15/28 # | | | | 1,550,000 | | | 1,530,075 |
| Amazon.com | | | | | | | |
| | 1.20% 6/3/27 | | | | 620,000 | | | 607,080 |
| | 1.50% 6/3/30 | | | | 1,000,000 | | | 954,095 |
| | 3.15% 8/22/27 | | | | 1,700,000 | | | 1,861,658 |
| AT&T | | | | | | | |
| | 144A 2.55% | | | | | | | |
| | 12/1/33 # | | | | 2,673,000 | | | 2,540,433 |
| | 3.10% 2/1/43 | | | | 1,264,000 | | | 1,182,136 |
| | 3.50% 6/1/41 | | | | 1,680,000 | | | 1,660,785 |
| | 144A 3.50% | | | | | | | |
| | 9/15/53 # | | | | 1,590,000 | | | 1,472,131 |
| B2W Digital 144A | | | | | | | |
| | 4.375% 12/20/30 # | | | | 740,000 | | | 724,186 |
| British | | | | | | | |
| | Telecommunications | | | | | | | |
| | 144A 3.25% | | | | | | | |
| | 11/8/29 # | | | | 1,700,000 | | | 1,781,204 |
| C&W Senior Financing | | | | | | | |
| | 144A 7.50% | | | | | | | |
| | 10/15/26 # | | | | 1,125,000 | | | 1,194,362 |
| CCO Holdings | | | | | | | |
| | 144A 4.50% | | | | | | | |
| | 8/15/30 # | | | | 500,000 | | | 510,228 |
| | 144A 5.00% | | | | | | | |
| | 2/1/28 # | | | | 900,000 | | | 952,785 |
| Charter Communications | | | | | | | |
| | Operating | | | | | | | |
| | 3.70% 4/1/51 | | | | 2,675,000 | | | 2,506,342 |
| | 4.464% 7/23/22 | | | | 4,330,000 | | | 4,516,999 |
| | 4.80% 3/1/50 | | | | 835,000 | | | 897,856 |
| | 4.908% 7/23/25 | | | | 430,000 | | | 487,740 |
| | 5.05% 3/30/29 | | | | 7,005,000 | | | 8,059,539 |
| Clear Channel Outdoor | | | | | | | |
| | Holdings 144A | | | | | | | |
| | 7.75% 4/15/28 # | | | | 420,000 | | | 416,168 |
| Clear Channel | | | | | | | |
| | Worldwide Holdings | | | | | | | |
| | 9.25% 2/15/24 | | | | 477,000 | | | 497,117 |
| Comcast | | | | | | | |
| | 3.20% 7/15/36 | | | | 1,830,000 | | | 1,912,945 |
| | 3.70% 4/15/24 | | | | 2,970,000 | | | 3,244,534 |
| | 3.75% 4/1/40 | | | | 445,000 | | | 488,918 |
| Connect Finco 144A | | | | | | | |
| | 6.75% 10/1/26 # | | | | 1,740,000 | | | 1,855,345 |
| CSC Holdings | | | | | | | |
| | 144A 3.375% | | | | | | | |
| | 2/15/31 # | | | | 975,000 | | | 920,156 |
| | 144A 4.625% | | | | | | | |
| | 12/1/30 # | | | | 890,000 | | | 876,650 |
| Digicel Group 0.5 PIK | | | | | | | |
| | 10.00% 4/1/24 * | | | | 339,979 | | | 331,437 |
| Discovery | | | | | | | |
| | Communications | | | | | | | |
| | 144A 4.00% | | | | | | | |
| | 9/15/55 # | | | | 1,525,000 | | | 1,503,858 |
| | 4.125% 5/15/29 | | | | 5,735,000 | | | 6,342,867 |
| | 5.20% 9/20/47 | | | | 2,655,000 | | | 3,152,462 |
| Fox 3.666% 1/25/22 | | | | 900,000 | | | 923,872 |
| JD.com 3.875% | | | | | | | |
| | 4/29/26 | | | | 525,000 | | | 570,658 |
| Level 3 Financing 144A | | | | | | | |
| | 3.625% 1/15/29 # | | | | 1,165,000 | | | 1,130,778 |
56
Table of Contents
| | | | | | Principal | | | |
| | | | | | | amount° | | Value (US $) |
| Corporate Bonds (continued) | | | | | | | |
| Communications (continued) | | | | | | | |
| Meituan 144A 3.05% | | | | | | | |
| | 10/28/30 # | | | | 785,000 | | $ | 764,449 |
| MercadoLibre 2.375% | | | | | | | |
| | 1/14/26 | | | | 470,000 | | | 467,359 |
| Millicom International | | | | | | | |
| | Cellular 144A 4.50% | | | | | | | |
| | 4/27/31 # | | | | 410,000 | | | 427,140 |
| Ooredoo International | | | | | | | |
| | Finance 144A 5.00% | | | | | | | |
| | 10/19/25 # | | | | 270,000 | | | 310,729 |
| Prosus 144A 3.832% | | | | | | | |
| | 2/8/51 # | | | | 620,000 | | | 545,906 |
| Sable International | | | | | | | |
| | Finance 144A 5.75% | | | | | | | |
| | 9/7/27 # | | | | 245,000 | | | 258,934 |
| Sprint | | | | | | | |
| | 7.25% 9/15/21 | | | | 300,000 | | | 307,905 |
| | 7.625% 3/1/26 | | | | 200,000 | | | 245,243 |
| Sprint Spectrum 144A | | | | | | | |
| | 4.738% 3/20/25 # | | | | 1,465,000 | | | 1,573,154 |
| Telefonica Celular del | | | | | | | |
| | Paraguay 144A | | | | | | | |
| | 5.875% 4/15/27 # | | | | 395,000 | | | 418,698 |
| Tencent Holdings | | | | | | | |
| | 144A 1.135% | | | | | | | |
| | (LIBOR03M + 0.91%) | | | | | | | |
| | 4/11/24 #, ● | | | | 200,000 | | | 200,230 |
| | 144A 3.28% | | | | | | | |
| | 4/11/24 # | | | | 645,000 | | | 687,750 |
| Terrier Media Buyer | | | | | | | |
| | 144A 8.875% | | | | | | | |
| | 12/15/27 # | | | | 2,285,000 | | | 2,463,059 |
| Time Warner Cable | | | | | | | |
| | 7.30% 7/1/38 | | | | 2,120,000 | | | 2,951,157 |
| Time Warner | | | | | | | |
| | Entertainment | | | | | | | |
| | 8.375% 3/15/23 | | | | 1,415,000 | | | 1,623,012 |
| T-Mobile USA | | | | | | | |
| | 144A 1.50% | | | | | | | |
| | 2/15/26 # | | | | 2,915,000 | | | 2,892,015 |
| | 144A 2.55% | | | | | | | |
| | 2/15/31 # | | | | 550,000 | | | 539,517 |
| | 144A 3.00% | | | | | | | |
| | 2/15/41 # | | | | 1,400,000 | | | 1,302,035 |
| | 144A 3.30% | | | | | | | |
| | 2/15/51 # | | | | 1,500,000 | | | 1,403,730 |
| | 144A 3.50% | | | | | | | |
| | 4/15/25 # | | | | 895,000 | | | 966,493 |
| | 144A 3.75% | | | | | | | |
| | 4/15/27 # | | | | 1,255,000 | | | 1,373,171 |
| | 144A 3.875% | | | | | | | |
| | 4/15/30 # | | | | 4,540,000 | | | 4,933,209 |
| Turk Telekomunikasyon | | | | | |
| | 144A 6.875% | | | | | | | |
| | 2/28/25 # | | | | 700,000 | | | 744,836 |
| Turkcell Iletisim | | | | | | | |
| | Hizmetleri 144A | | | | | | | |
| | 5.80% 4/11/28 # | | | | 585,000 | | | 592,704 |
| VEON Holdings 144A | | | | | |
| | 3.375% 11/25/27 # | | 760,000 | | | 752,765 |
| Verizon Communications | | | | | |
| | 1.298% (LIBOR03M | | | | | |
| | + 1.10%) 5/15/25 ● | | 3,200,000 | | | 3,273,257 |
| | 2.10% 3/22/28 | | | | 1,630,000 | | | 1,637,863 |
| | 2.55% 3/21/31 | | | | 1,840,000 | | | 1,839,939 |
| | 3.40% 3/22/41 | | | | 930,000 | | | 945,465 |
| | 3.55% 3/22/51 | | | | 915,000 | | | 915,394 |
| | 4.125% 3/16/27 | | | | 1,500,000 | | | 1,700,301 |
| | 4.50% 8/10/33 | | | | 6,325,000 | | | 7,353,747 |
| ViacomCBS | | | | | | | |
| | 4.375% 3/15/43 | | | | 2,945,000 | | | 3,182,414 |
| | 4.95% 1/15/31 | | | | 1,955,000 | | | 2,308,364 |
| Vmed O2 UK Financing I | | | | | |
| | 144A 4.25% | | | | | | | |
| | 1/31/31 # | | | | 1,885,000 | | | 1,837,121 |
| Vodafone Group | | | | | | | |
| | 4.25% 9/17/50 | | | | 1,070,000 | | | 1,180,840 |
| | 4.875% 6/19/49 | | | | 4,385,000 | | | 5,218,730 |
| VTR Comunicaciones | | | | | | | |
| | 144A 4.375% | | | | | | | |
| | 4/15/29 # | | | | 685,000 | | | 689,795 |
| Zayo Group Holdings | | | | | | | |
| | 144A 6.125% | | | | | | | |
| | 3/1/28 # | | | | 725,000 | | | 745,278 |
| Ziggo Bond | | | | | | | |
| | 144A 3.375% | | | | | | | |
| | 2/28/30 # | | EUR | | 500,000 | | | 579,402 |
| | 144A 5.125% | | | | | | | |
| | 2/28/30 # | | | | 300,000 | | | 307,125 |
| | | | | | | | | 124,922,767 |
| Consumer Cyclical — 2.14% | | | | | |
| Allison Transmission | | | | | | | |
| | 144A 5.875% | | | | | | | |
| | 6/1/29 # | | | | 1,295,000 | | | 1,417,624 |
| BMW US Capital 144A | | | | | |
| | 3.40% 8/13/21 # | | | | 300,000 | | | 303,399 |
| Boyd Gaming 4.75% | | | | | | | |
| | 12/1/27 | | | | 2,086,000 | | | 2,130,025 |
| Caesars Entertainment | | | | | |
| | 144A 6.25% | | | | | | | |
| | 7/1/25 # | | | | 1,420,000 | | | 1,515,523 |
| Carnival 144A 7.625% | | | | | |
| | 3/1/26 # | | | | 1,748,000 | | | 1,880,061 |
57
Table of Contents
Schedules of investments
Optimum Fixed Income Fund
| | | | | | | Principal | | | |
| | | | | | amount° | | Value (US $) |
| Corporate Bonds (continued) | | | | | |
| Consumer Cyclical (continued) | | | | | |
| Daimler Finance North | | | | | | | |
| | America | | | | | | | |
| | 144A 1.094% | | | | | | | |
| | (LIBOR03M + 0.90%) | | | | | |
| | 2/15/22 #, ● | | | | 1,100,000 | | $ | 1,107,512 |
| | 144A 2.00% | | | | | | | |
| | 7/6/21 # | | | | 400,000 | | | 401,693 |
| | 144A 2.20% | | | | | | | |
| | 10/30/21 # | | | | 200,000 | | | 202,130 |
| | 144A 3.40% | | | | | | | |
| | 2/22/22 # | | | | 500,000 | | | 513,166 |
| | 144A 3.75% | | | | | | | |
| | 11/5/21 # | | | | 300,000 | | | 305,961 |
| Ford Motor Credit | | | | | | | |
| | 1.463% (LIBOR03M | | | | | | | |
| | + 1.27%) 3/28/22 ● | | | | 400,000 | | | 397,457 |
| | 1.744% 7/19/24 | | EUR | | 100,000 | | | 118,073 |
| | 2.33% 11/25/25 | | EUR | | 100,000 | | | 120,586 |
| | 2.386% 2/17/26 | | EUR | | 500,000 | | | 603,856 |
| | 2.748% 6/14/24 | | GBP | | 100,000 | | | 139,215 |
| | 2.90% 2/16/28 | | | | 765,000 | | | 735,930 |
| | 3.25% 9/15/25 | | EUR | | 1,000,000 | | | 1,249,249 |
| | 3.55% 10/7/22 | | | | 1,500,000 | | | 1,538,430 |
| | 4.535% 3/6/25 | | GBP | | 1,100,000 | | | 1,620,705 |
| | 4.542% 8/1/26 | | | | 5,205,000 | | | 5,514,437 |
| | 5.125% 6/16/25 | | | | 600,000 | | | 648,750 |
| Future Retail 144A | | | | | | | |
| | 5.60% 1/22/25 # | | | | 565,000 | | | 464,340 |
| General Motors | | | | | | | |
| | 5.00% 10/1/28 | | | | 939,000 | | | 1,076,765 |
| | 5.40% 10/2/23 | | | | 685,000 | | | 744,225 |
| | 6.125% 10/1/25 | | | | 685,000 | | | 806,290 |
| | 6.60% 4/1/36 | | | | 982,000 | | | 1,276,487 |
| General Motors Financial | | | | | |
| | 1.075% (LIBOR03M | | | | | | | |
| | + 0.85%) 4/9/21 ● | | | | 500,000 | | | 500,041 |
| | 2.35% 1/8/31 | | | | 540,000 | | | 516,351 |
| | 5.20% 3/20/23 | | | | 231,000 | | | 250,612 |
| | 5.25% 3/1/26 | | | | 2,570,000 | | | 2,945,988 |
| | 5.70% 9/30/30 µ, ψ | | | | 1,780,000 | | | 1,926,850 |
| Hilton Domestic | | | | | | | |
| | Operating | | | | | | | |
| | 144A 3.625% | | | | | | | |
| | 2/15/32 # | | | | 700,000 | | | 680,295 |
| | 144A 4.00% | | | | | | | |
| | 5/1/31 # | | | | 2,300,000 | | | 2,304,313 |
| Hyundai Capital America | | | | | | | |
| | 144A 3.50% | | | | | | | |
| | 11/2/26 # | | | | 515,000 | | | 553,353 |
| Marriott International | | | | | | | |
| | 3.50% 10/15/32 | | | | 900,000 | | | 935,230 |
| McDonald’s 0.649% | | | | | | | |
| | (LIBOR03M + 0.43%) | | | | | | | |
| | 10/28/21 ● | | | | 2,300,000 | | | 2,305,311 |
| MGM China Holdings | | | | | | | |
| | 144A 4.75% | | | | | | | |
| | 2/1/27 # | | | | 525,000 | | | 533,531 |
| MGM Resorts | | | | | | | |
| | International 4.75% | | | | | | | |
| | 10/15/28 | | | | 1,215,000 | | | 1,257,215 |
| Nissan Motor | | | | | | | |
| | 144A 3.043% | | | | | | | |
| | 9/15/23 # | | | | 1,800,000 | | | 1,884,294 |
| | 144A 4.345% | | | | | | | |
| | 9/17/27 # | | | | 600,000 | | | 653,054 |
| | 144A 4.81% | | | | | | | |
| | 9/17/30 # | | | | 200,000 | | | 219,604 |
| Nissan Motor | | | | | | | |
| | Acceptance | | | | | | | |
| | 144A 2.80% | | | | | | | |
| | 1/13/22 # | | | | 200,000 | | | 203,074 |
| | 144A 3.65% | | | | | | | |
| | 9/21/21 # | | | | 300,000 | | | 303,986 |
| | 144A 3.875% | | | | | | | |
| | 9/21/23 # | | | | 3,000,000 | | | 3,200,727 |
| Royal Caribbean Cruises | | | | | | | |
| | 144A 5.50% | | | | | | | |
| | 4/1/28 # | | | | 1,270,000 | | | 1,277,938 |
| Sands China | | | | | | | |
| | 3.80% 1/8/26 | | | | 400,000 | | | 426,868 |
| | 4.375% 6/18/30 | | | | 490,000 | | | 519,542 |
| | 5.40% 8/8/28 | | | | 1,800,000 | | | 2,060,892 |
| Scientific Games | | | | | | | |
| | International 144A | | | | | | | |
| | 8.25% 3/15/26 # | | | | 1,890,000 | | | 2,030,247 |
| Six Flags Entertainment | | | | | | | |
| | 144A 4.875% | | | | | | | |
| | 7/31/24 # | | | | 1,225,000 | | | 1,238,781 |
| Toyota Industries 144A | | | | | | | |
| | 3.11% 3/12/22 # | | | | 1,600,000 | | | 1,638,307 |
| Turkiye Sise ve Cam | | | | | | | |
| | Fabrikalari 144A | | | | | | | |
| | 6.95% 3/14/26 # | | | | 570,000 | | | 611,005 |
| Volkswagen Group of | | | | | | | |
| | America Finance | | | | | | | |
| | 144A 1.051% | | | | | | | |
| | (LIBOR03M + 0.86%) | | | | | | | |
| | 9/24/21 #, ● | | | | 1,500,000 | | | 1,505,512 |
| | 144A 4.00% | | | | | | | |
| | 11/12/21 # | | | | 500,000 | | | 510,987 |
| Wolverine World Wide | | | | | | | |
| | 144A 5.00% | | | | | | | |
| | 9/1/26 # | | | | 400,000 | | | 406,750 |
58
Table of Contents
| | | | | | | Principal | | | |
| | | | | | amount° | | Value (US $) |
| Corporate Bonds (continued) | | | | | |
| Consumer Cyclical (continued) | | | | | |
| Wynn Macau 144A | | | | | | | |
| | 5.625% 8/26/28 # | | | | 440,000 | | $ | 460,757 |
| | | | | | | | | 60,693,304 |
| Consumer Non-Cyclical – 3.52% | | | | | |
| AbbVie | | | | | | | |
| | 2.85% 5/14/23 | | | | 900,000 | | | 939,039 |
| | 2.95% 11/21/26 | | | | 2,650,000 | | | 2,823,544 |
| | 3.20% 5/14/26 | | | | 500,000 | | | 540,524 |
| | 3.25% 10/1/22 | | | | 300,000 | | | 310,393 |
| | 3.45% 3/15/22 | | | | 1,000,000 | | | 1,023,203 |
| | 3.75% 11/14/23 | | | | 1,200,000 | | | 1,293,111 |
| | 4.05% 11/21/39 | | | | 3,193,000 | | | 3,579,599 |
| Adani Ports & Special | | | | | | | |
| | Economic Zone 144A | | | | | | | |
| | 3.10% 2/2/31 # | | | | 1,185,000 | | | 1,125,846 |
| Amgen 2.20% 2/21/27 | | | | 3,300,000 | | | 3,387,095 |
| Anheuser-Busch InBev | | | | | | | |
| | Worldwide | | | | | | | |
| | 4.15% 1/23/25 | | | | 1,945,000 | | | 2,162,616 |
| | 4.50% 6/1/50 | | | | 2,240,000 | | | 2,545,828 |
| Auna 144A 6.50% | | | | | | | |
| | 11/20/25 # | | | | 690,000 | | | 736,806 |
| Bacardi 144A 4.45% | | | | | | | |
| | 5/15/25 # | | | | 500,000 | | | 556,337 |
| BAT Capital 2.259% | | | | | | | |
| | 3/25/28 | | | | 1,500,000 | | | 1,478,247 |
| BAT International | | | | | | | |
| | Finance 1.668% | | | | | | | |
| | 3/25/26 | | | | 1,065,000 | | | 1,054,864 |
| Bausch Health 144A | | | | | | | |
| | 6.25% 2/15/29 # | | | | 3,257,000 | | | 3,466,753 |
| Bellis Acquisition 144A | | | | | | | |
| | 3.25% 2/16/26 # | | GBP | | 3,300,000 | | | 4,575,084 |
| Biogen 3.15% 5/1/50 | | | | 3,195,000 | | | 2,939,576 |
| Boston Scientific | | | | | | | |
| | 3.375% 5/15/22 | | | | 400,000 | | | 413,010 |
| | 4.00% 3/1/29 | | | | 3,300,000 | | | 3,673,187 |
| Centene | | | | | | | |
| | 3.375% 2/15/30 | | | | 1,000,000 | | | 1,010,935 |
| | 144A 5.375% | | | | | | | |
| | 8/15/26 # | | | | 745,000 | | | 787,763 |
| CVS Health | | | | | | | |
| | 1.875% 2/28/31 | | | | 320,000 | | | 300,839 |
| | 3.75% 4/1/30 | | | | 780,000 | | | 851,832 |
| | 4.30% 3/25/28 | | | | 6,944,000 | | | 7,890,139 |
| | 4.78% 3/25/38 | | | | 1,030,000 | | | 1,217,750 |
| | 5.05% 3/25/48 | | | | 5,000 | | | 6,148 |
| CVS Pass Through Trust | | | | | | | |
| | 144A 5.773% | | | | | | | |
| | 1/10/33 #, ◆ | | | | 68,684 | | | 79,947 |
| Danone 144A 2.589% | | | | | | | |
| | 11/2/23 # | | | | 1,500,000 | | | 1,566,331 |
| Equifax 1.064% | | | | | | | |
| | (LIBOR03M + 0.87%) | | | | | | | |
| | 8/15/21 ● | | | | 700,000 | | | 701,653 |
| Gilead Sciences 4.15% | | | | | | | |
| | 3/1/47 | | | | 3,305,000 | | | 3,680,652 |
| Global Payments | | | | | | | |
| | 2.65% 2/15/25 | | | | 1,839,000 | | | 1,933,244 |
| | 2.90% 5/15/30 | | | | 593,000 | | | 605,828 |
| | 3.20% 8/15/29 | | | | 3,380,000 | | | 3,563,674 |
| HCA | | | | | | | |
| | 4.125% 6/15/29 | | | | 3,400,000 | | | 3,771,693 |
| | 7.58% 9/15/25 | | | | 30,000 | | | 35,850 |
| IHS Markit 3.625% | | | | | | | |
| | 5/1/24 | | | | 600,000 | | | 644,634 |
| Imperial Brands Finance | | | | | | | |
| | 144A 3.75% | | | | | | | |
| | 7/21/22 # | | | | 470,000 | | | 485,706 |
| JBS Investments II 144A | | | | | | | |
| | 5.75% 1/15/28 # | | | | 385,000 | | | 406,718 |
| Kernel Holding 144A | | | | | | | |
| | 6.50% 10/17/24 # | | | | 375,000 | | | 399,165 |
| MHP 144A 7.75% | | | | | | | |
| | 5/10/24 # | | | | 520,000 | | | 558,446 |
| Minerva Luxembourg | | | | | | | |
| | 144A 4.375% | | | | | | | |
| | 3/18/31 # | | | | 800,000 | | | 783,100 |
| New York and | | | | | | | |
| | Presbyterian Hospital | | | | | | | |
| | 4.063% 8/1/56 | | | | 690,000 | | | 801,857 |
| Pernod Ricard 144A | | | | | | | |
| | 4.25% 7/15/22 # | | | | 150,000 | | | 156,921 |
| Pilgrim’s Pride 144A | | | | | | | |
| | 5.875% 9/30/27 # | | | | 1,458,000 | | | 1,564,361 |
| Prestige Brands 144A | | | | | | | |
| | 3.75% 4/1/31 # | | | | 965,000 | | | 922,781 |
| Prime Security Services | | | | | | | |
| | Borrower 144A | | | | | | | |
| | 6.25% 1/15/28 # | | | | 3,020,000 | | | 3,148,048 |
| Rede D’or Finance 144A | | | | | | | |
| | 4.50% 1/22/30 # | | | | 710,000 | | | 698,044 |
| Regeneron | | | | | | | |
| | Pharmaceuticals | | | | | | | |
| | 1.75% 9/15/30 | | | | 825,000 | | | 763,963 |
| Royalty Pharma 144A | | | | | | | |
| | 1.75% 9/2/27 # | | | | 7,625,000 | | | 7,411,250 |
| Takeda Pharmaceutical | | | | | | | |
| | 2.05% 3/31/30 | | | | 1,315,000 | | | 1,268,413 |
| | 3.025% 7/9/40 | | | | 985,000 | | | 954,720 |
| | 3.175% 7/9/50 | | | | 985,000 | | | 943,412 |
59
Table of Contents
Schedules of investments
Optimum Fixed Income Fund
| | | | | | | Principal | | | |
| | | | | | amount° | | Value (US $) |
| Corporate Bonds (continued) | | | | | |
| Consumer Non-Cyclical (continued) | | | | | |
| Tenet Healthcare | | | | | | | |
| | 5.125% 5/1/25 | | | | 2,395,000 | | $ | 2,431,644 |
| | 144A 6.125% | | | | | | | |
| | 10/1/28 # | | | | 1,815,000 | | | 1,896,675 |
| Teva Pharmaceutical | | | | | | | |
| | Finance Netherlands II | | | | | | | |
| | 1.125% 10/15/24 | | EUR | | 300,000 | | | 334,427 |
| Teva Pharmaceutical | | | | | | | |
| | Finance Netherlands | | | | | | | |
| | III 6.75% 3/1/28 | | | | 1,066,000 | | | 1,199,596 |
| Ulker Biskuvi Sanayi | | | | | | | |
| | 144A 6.95% | | | | | | | |
| | 10/30/25 # | | | | 1,055,000 | | | 1,109,290 |
| United Rentals North | | | | | | | |
| | America 3.875% | | | | | | | |
| | 2/15/31 | | | | 869,000 | | | 874,974 |
| Universal Health Services | | | | | | | |
| | 144A 5.00% | | | | | | | |
| | 6/1/26 # | | | | 210,000 | | | 215,998 |
| Viatris | | | | | | | |
| | 144A 1.65% | | | | | | | |
| | 6/22/25 # | | | | 320,000 | | | 321,450 |
| | 144A 2.30% | | | | | | | |
| | 6/22/27 # | | | | 265,000 | | | 267,597 |
| | 144A 2.70% | | | | | | | |
| | 6/22/30 # | | | | 1,940,000 | | | 1,918,045 |
| | 144A 4.00% | | | | | | | |
| | 6/22/50 # | | | | 450,000 | | | 459,752 |
| Zimmer Biomet Holdings | | | | | | | |
| | 3.15% 4/1/22 | | | | 300,000 | | | 306,498 |
| | | | | | | | | 99,876,425 |
| Energy – 3.76% | | | | | | | |
| Abu Dhabi Crude Oil | | | | | | | |
| | Pipeline 144A 4.60% | | | | | | | |
| | 11/2/47 # | | | | 330,000 | | | 373,539 |
| BP Capital Markets | | | | | | | |
| | 4.875% 3/22/30 µ, Ψ | | | | 2,465,000 | | | 2,646,794 |
| Chevron USA 3.90% | | | | | | | |
| | 11/15/24 | | | | 565,000 | | | 622,406 |
| CNX Resources 144A | | | | | | | |
| | 6.00% 1/15/29 # | | | | 2,785,000 | | | 2,899,338 |
| Crestwood Midstream | | | | | | | |
| | Partners 144A 6.00% | | | | | | | |
| | 2/1/29 # | | | | 1,737,000 | | | 1,714,202 |
| Ecopetrol | | | | | | | |
| | 5.375% 6/26/26 | | | | 360,000 | | | 404,330 |
| | 6.875% 4/29/30 | | | | 635,000 | | | 774,325 |
| Enable Midstream | | | | | | | |
| | Partners 4.95% | | | | | | | |
| | 5/15/28 | | | | 700,000 | | | 772,333 |
| Energean Israel Finance | | | | | | | |
| | 144A 4.875% | | | | | | | |
| | 3/30/26 # | | | | 660,000 | | | 665,362 |
| Energy Transfer | | | | | | | |
| | 5.25% 4/15/29 | | | | 1,100,000 | | | 1,252,927 |
| | 5.50% 6/1/27 | | | | 3,200,000 | | | 3,695,051 |
| | 6.25% 4/15/49 | | | | 4,420,000 | | | 5,199,256 |
| Energy Transfer Partners | | | | | | | |
| | 5.00% 10/1/22 | | | | 1,500,000 | | | 1,576,088 |
| EnfraGen Energia Sur | | | | | | | |
| | 144A 5.375% | | | | | | | |
| | 12/30/30 # | | | | 845,000 | | | 833,588 |
| Enterprise Products | | | | | | | |
| | Operating 3.20% | | | | | | | |
| | 2/15/52 | | | | 4,365,000 | | | 3,993,036 |
| EQT 7.625% 2/1/25 | | | | 1,100,000 | | | 1,267,508 |
| Equinor 1.75% 1/22/26 | | | | 655,000 | | | 670,652 |
| Galaxy Pipeline Assets | | | | | | | |
| | Bidco | | | | | | | |
| | 144A 1.75% | | | | | | | |
| | 9/30/27 # | | | | 1,385,000 | | | 1,386,502 |
| | 144A 2.625% | | | | | | | |
| | 3/31/36 # | | | | 1,475,000 | | | 1,414,237 |
| | 144A 2.94% | | | | | | | |
| | 9/30/40 # | | | | 745,000 | | | 720,664 |
| Gazprom via Gaz | | | | | | | |
| | Finance 144A 3.25% | | | | | | | |
| | 2/25/30 # | | | | 535,000 | | | 512,765 |
| Geopark | | | | | | | |
| | 144A 5.50% | | | | | | | |
| | 1/17/27 # | | | | 645,000 | | | 655,610 |
| | 144A 6.50% | | | | | | | |
| | 9/21/24 # | | | | 200,000 | | | 207,369 |
| Greenko Solar Mauritius | | | | | | | |
| | 144A 5.95% | | | | | | | |
| | 7/29/26 # | | | | 540,000 | | | 578,745 |
| Indika Energy Capital IV | | | | | | | |
| | 144A 8.25% | | | | | | | |
| | 10/22/25 # | | | | 395,000 | | | 417,416 |
| KazMunayGas National | | | | | | | |
| | JSC 144A 6.375% | | | | | | | |
| | 10/24/48 # | | | | 121,000 | | | 155,021 |
| KazTransGas JSC 144A | | | | | | | |
| | 4.375% 9/26/27 # | | | | 2,256,000 | | | 2,520,760 |
| Kinder Morgan 3.60% | | | | | | | |
| | 2/15/51 | | | | 1,205,000 | | | 1,124,758 |
| Kinder Morgan Energy | | | | | | | |
| | Partners 5.00% | | | | | | | |
| | 10/1/21 | | | | 620,000 | | | 626,696 |
60
Table of Contents
| | | | | Principal | | | |
| | | | amount° | | Value (US $) |
| Corporate Bonds (continued) | | | | | |
| Energy (continued) | | | | | |
| Lukoil Securities 144A | | | | | |
| | 3.875% 5/6/30 # | | 2,230,000 | | $ | 2,302,586 |
| Marathon Oil 4.40% | | | | | |
| | 7/15/27 | | 7,615,000 | | | 8,389,442 |
| MPLX | | | | | |
| | 1.75% 3/1/26 | | 685,000 | | | 686,520 |
| | 4.125% 3/1/27 | | 2,000,000 | | | 2,221,941 |
| Murphy Oil 5.875% | | | | | |
| | 12/1/27 | | 2,587,000 | | | 2,537,692 |
| NuStar Logistics | | | | | |
| | 5.625% 4/28/27 | | 205,000 | | | 214,834 |
| | 6.375% 10/1/30 | | 2,337,000 | | | 2,531,263 |
| Oil and Gas Holding | | | | | |
| | 144A 7.625% | | | | | |
| | 11/7/24 # | | 200,000 | | | 223,280 |
| ONEOK | | | | | |
| | 4.35% 3/15/29 | | 1,500,000 | | | 1,637,271 |
| | 7.50% 9/1/23 | | 2,840,000 | | | 3,239,941 |
| PDC Energy 5.75% | | | | | |
| | 5/15/26 | | 1,205,000 | | | 1,251,392 |
| Pertamina Persero 144A | | | | | |
| | 3.65% 7/30/29 # | | 197,000 | | | 206,850 |
| Petrobras Global Finance | | | | | |
| | 5.999% 1/27/28 | | 3,500,000 | | | 3,850,000 |
| | 6.75% 6/3/50 | | 640,000 | | | 684,336 |
| | 6.85% 6/5/15 | | 1,700,000 | | | 1,750,150 |
| | 7.25% 3/17/44 | | 600,000 | | | 688,080 |
| Petroleos Mexicanos | | | | | |
| | 5.95% 1/28/31 | | 600,000 | | | 577,137 |
| | 6.49% 1/23/27 | | 1,213,000 | | | 1,269,502 |
| | 6.50% 1/23/29 | | 934,000 | | | 945,147 |
| | 6.75% 9/21/47 | | 230,000 | | | 196,020 |
| Petronas Capital | | | | | |
| | 144A 3.50% | | | | | |
| | 4/21/30 # | | 440,000 | | | 471,557 |
| | 144A 4.55% | | | | | |
| | 4/21/50 # | | 700,000 | | | 831,797 |
| | 144A 4.80% | | | | | |
| | 4/21/60 # | | 1,100,000 | | | 1,392,665 |
| PTTEP Treasury Center | | | | | |
| | 144A 2.587% | | | | | |
| | 6/10/27 # | | 695,000 | | | 715,718 |
| Rio Oil Finance Trust | | | | | |
| | Series 2014-1 9.25% | | | | | |
| | 7/6/24 | | 116,133 | | | 129,199 |
| Sabine Pass Liquefaction | | | | | |
| | 5.625% 3/1/25 | | 1,455,000 | | | 1,664,513 |
| | 5.75% 5/15/24 | | 8,496,000 | | | 9,591,563 |
| | 6.25% 3/15/22 | | 400,000 | | | 415,508 |
| Saudi Arabian Oil | | | | | |
| | 144A 3.50% | | | | | |
| | 11/24/70 # | | 505,000 | | | 449,200 |
| | 144A 4.25% | | | | | |
| | 4/16/39 # | | 530,000 | | | 572,848 |
| SEPLAT Petroleum | | | | | |
| | Development 144A | | | | | |
| | 7.75% 4/1/26 # | | 560,000 | | | 562,100 |
| Southwestern Energy | | | | | |
| | 7.75% 10/1/27 | | 2,050,000 | | | 2,194,781 |
| Targa Resources Partners | | | | | |
| | 5.375% 2/1/27 | | 1,530,000 | | | 1,590,251 |
| Tengizchevroil Finance | | | | | |
| | Co International | | | | | |
| | 144A 2.625% | | | | | |
| | 8/15/25 # | | 484,000 | | | 489,899 |
| Tennessee Gas Pipeline | | | | | |
| | 144A 2.90% | | | | | |
| | 3/1/30 # | | 8,165,000 | | | 8,139,473 |
| Transportadora de Gas | | | | | |
| | del Sur 144A 6.75% | | | | | |
| | 5/2/25 # | | 370,000 | | | 320,328 |
| Tullow Oil 144A 7.00% | | | | | |
| | 3/1/25 # | | 365,000 | | | 310,250 |
| UEP Penonome II 144A | | | | | |
| | 6.50% 10/1/38 # | | 555,000 | | | 561,599 |
| Woodside Finance 144A | | | | | |
| | 3.70% 9/15/26 # | | 400,000 | | | 427,104 |
| YPF 144A 8.50% | | | | | |
| | 6/27/29 # | | 985,000 | | | 631,996 |
| | | | | | | 106,547,011 |
| Finance Companies – 1.51% | | | | | |
| AerCap Ireland Capital | | | | | |
| | DAC | | | | | |
| | 1.75% 1/30/26 | | 590,000 | | | 573,440 |
| | 3.50% 1/15/25 | | 300,000 | | | 314,805 |
| | 3.65% 7/21/27 | | 2,700,000 | | | 2,835,486 |
| | 4.45% 10/1/25 | | 1,200,000 | | | 1,304,699 |
| | 4.45% 4/3/26 | | 150,000 | | | 162,469 |
| | 4.50% 9/15/23 | | 460,000 | | | 495,004 |
| | 4.625% 7/1/22 | | 1,100,000 | | | 1,150,827 |
| | 4.625% 10/15/27 | | 745,000 | | | 818,136 |
| | 6.50% 7/15/25 | | 1,350,000 | | | 1,574,389 |
| Air Lease | | | | | |
| | 2.875% 1/15/26 | | 2,050,000 | | | 2,128,519 |
| | 3.00% 2/1/30 | | 2,850,000 | | | 2,793,605 |
| | 3.375% 7/1/25 | | 670,000 | | | 708,397 |
| | 4.25% 2/1/24 | | 900,000 | | | 977,129 |
| Aircastle 4.125% | | | | | |
| | 5/1/24 | | 2,500,000 | | | 2,643,206 |
61
Table of Contents
Schedules of investments
Optimum Fixed Income Fund
| | | | | | | Principal | | | |
| | | | | | amount° | | Value (US $) |
| Corporate Bonds (continued) | | | | | |
| Finance Companies (continued) | | | | | |
| ASG Finance Designated | | | | | | | |
| | Activity 144A 7.875% | | | | | | | |
| | 12/3/24 # | | | | 545,000 | | $ | 519,113 |
| Aviation Capital Group | | | | | | | |
| | 144A 3.875% | | | | | | | |
| | 5/1/23 # | | | | 1,000,000 | | | 1,044,381 |
| BOC Aviation | | | | | | | |
| | 2.375% 9/15/21 | | | | 600,000 | | | 602,475 |
| | 144A 2.625% | | | | | | | |
| | 9/17/30 # | | | | 580,000 | | | 559,208 |
| | 3.00% 5/23/22 | | | | 300,000 | | | 304,995 |
| DAE Funding | | | | | | | |
| | 144A 1.625% | | | | | | | |
| | 2/15/24 # | | | | 1,500,000 | | | 1,483,125 |
| | 144A 3.375% | | | | | | | |
| | 3/20/28 # | | | | 2,330,000 | | | 2,319,930 |
| | 3.375% 3/20/28 | | | | 2,700,000 | | | 2,688,331 |
| DAE Sukuk DIFC 144A | | | | | | | |
| | 3.75% 2/15/26 # | | | | 527,000 | | | 543,798 |
| GATX 0.915% | | | | | | | |
| | (LIBOR03M + 0.72%) | | | | | | | |
| | 11/5/21 ● | | | | 2,100,000 | | | 2,107,263 |
| GE Capital UK Funding | | | | | | | |
| | Unlimited 5.875% | | | | | | | |
| | 1/18/33 | | GBP | | 300,000 | | | 560,845 |
| Goodman HK Finance | | | | | | | |
| | 4.375% 6/19/24 | | | | 1,095,000 | | | 1,192,526 |
| Kaisa Group Holdings | | | | | | | |
| | 9.375% 6/30/24 | | | | 630,000 | | | 606,334 |
| Logicor Financing 3.25% | | | | | | | |
| | 11/13/28 | | EUR | | 3,400,000 | | | 4,641,244 |
| OneMain Finance | | | | | | | |
| | 6.125% 3/15/24 | | | | 1,500,000 | | | 1,621,875 |
| ORIX 3.20% 1/19/22 | | | | 500,000 | | | 510,420 |
| Park Aerospace Holdings | | | | | | | |
| | 144A 5.25% | | | | | | | |
| | 8/15/22 # | | | | 135,000 | | | 141,770 |
| Samhallsbyggnadsbolaget | | | | | | | |
| | i Norden 1.125% | | | | | | | |
| | 9/4/26 | | EUR | | 900,000 | | | 1,078,376 |
| Shimao Group Holdings | | | | | | | |
| | 5.60% 7/15/26 | | | | 790,000 | | | 852,732 |
| SMBC Aviation Capital | | | | | | | |
| | Finance DAC 144A | | | | | | | |
| | 3.00% 7/15/22 # | | | | 400,000 | | | 409,896 |
| Yuzhou Group Holdings | | | | | | | |
| | 7.70% 2/20/25 | | | | 510,000 | | | 444,944 |
| | | | | | | | | 42,713,692 |
| Insurance – 0.42% | | | | | | | |
| AIA Group | | | | | | | |
| | 144A 3.375% | | | | | | | |
| | 4/7/30 # | | | | 375,000 | | | 400,977 |
| | 144A 3.90% | | | | | | | |
| | 4/6/28 # | | | | 1,000,000 | | | 1,093,691 |
| Ambac Assurance 144A | | | | | | | |
| | 5.10% #, ** | | | | 29,743 | | | 40,896 |
| Ambac LSNI 144A | | | | | | | |
| | 6.00% (LIBOR03M + | | | | | | | |
| | 5.00%) 2/12/23 #, ● | | | | 108,935 | | | 109,344 |
| AssuredPartners 144A | | | | | | | |
| | 7.00% 8/15/25 # | | | | 978,000 | | | 1,013,907 |
| Athene Global Funding | | | | | | | |
| | 144A 1.424% | | | | | | | |
| | (LIBOR03M + 1.23%) | | | | | | | |
| | 7/1/22 #, ● | | | | 700,000 | | | 707,631 |
| Athora Netherlands | | | | | | | |
| | 2.375% 5/17/24 | | EUR | | 2,100,000 | | | 2,551,688 |
| Brighthouse Financial | | | | | | | |
| | 5.625% 5/15/30 | | | | 850,000 | | | 997,374 |
| Fairfax Financial | | | | | | | |
| | Holdings 4.625% | | | | | | | |
| | 4/29/30 | | | | 1,000,000 | | | 1,093,386 |
| GTCR AP Finance 144A | | | | | | | |
| | 8.00% 5/15/27 # | | | | 417,000 | | | 448,796 |
| MetLife 3.85% | | | | | | | |
| | 9/15/25 µ, Ψ | | | | 1,520,000 | | | 1,573,200 |
| Prudential Financial | | | | | | | |
| | 3.70% 3/13/51 | | | | 1,660,000 | | | 1,760,509 |
| | | | | | | | | 11,791,399 |
| Real Estate Investment Trusts – 0.69% | | | | | |
| American Tower | | | | | | | |
| | 3.00% 6/15/23 | | | | 600,000 | | | 631,568 |
| | 3.375% 5/15/24 | | | | 500,000 | | | 536,369 |
| American Tower Trust | | | | | | | |
| | #1 144A 3.07% | | | | | | | |
| | 3/15/48 # | | | | 1,285,000 | | | 1,301,588 |
| Crown Castle | | | | | | | |
| | International | | | | | | | |
| | 3.80% 2/15/28 | | | | 2,115,000 | | | 2,306,755 |
| | 4.30% 2/15/29 | | | | 2,745,000 | | | 3,079,932 |
| CubeSmart 3.00% | | | | | | | |
| | 2/15/30 | | | | 1,153,000 | | | 1,172,785 |
| CyrusOne 1.45% | | | | | | | |
| | 1/22/27 | | EUR | | 1,400,000 | | | 1,656,896 |
| EPR Properties 4.50% | | | | | | | |
| | 6/1/27 | | | | 1,700,000 | | | 1,745,670 |
| Equinix 5.375% | | | | | | | |
| | 5/15/27 | | | | 350,000 | | | 376,462 |
| GLP Capital 4.00% | | | | | | | |
| | 1/15/30 | | | | 2,600,000 | | | 2,709,525 |
62
Table of Contents
| | | | | | | Principal | | | |
| | | | | | amount° | | Value (US $) |
| Corporate Bonds (continued) | | | | | |
| Real Estate Investment Trusts (continued) | | | | | |
| Iron Mountain 144A | | | | | | | |
| | 5.25% 7/15/30 # | | | | 1,085,000 | | $ | 1,120,859 |
| MGM Growth Properties | | | | | | | |
| | Operating Partnership | | | | | | | |
| | 5.75% 2/1/27 | | | | 145,000 | | | 160,080 |
| MPT Operating | | | | | | | |
| | Partnership 3.692% | | | | | | | |
| | 6/5/28 | | GBP | | 1,600,000 | | | 2,303,118 |
| Trust Fibra UNO 144A | | | | | | | |
| | 5.25% 1/30/26 # | | | | 560,000 | | | 620,623 |
| | | | | | | | | 19,722,230 |
| Technology – 0.87% | | | | | | | |
| Black Knight InfoServ | | | | | | | |
| | 144A 3.625% | | | | | | | |
| | 9/1/28 # | | | | 1,145,000 | | | 1,126,520 |
| Broadcom | | | | | | | |
| | 3.459% 9/15/26 | | | | 2,353,000 | | | 2,526,549 |
| | 4.11% 9/15/28 | | | | 1,052,000 | | | 1,151,902 |
| CommScope | | | | | | | |
| | Technologies 144A | | | | | | | |
| | 5.00% 3/15/27 # | | | | 1,798,000 | | | 1,784,524 |
| Dell International | | | | | | | |
| | 144A 5.45% | | | | | | | |
| | 6/15/23 # | | | | 600,000 | | | 655,969 |
| | 144A 6.02% | | | | | | | |
| | 6/15/26 # | | | | 400,000 | | | 473,952 |
| Fiserv 3.50% 7/1/29 | | | | 3,500,000 | | | 3,780,385 |
| NXP | | | | | | | |
| | 144A 2.70% | | | | | | | |
| | 5/1/25 # | | | | 180,000 | | | 188,921 |
| | 144A 3.40% | | | | | | | |
| | 5/1/30 # | | | | 350,000 | | | 370,148 |
| | 144A 3.875% | | | | | | | |
| | 6/18/26 # | | | | 3,250,000 | | | 3,582,165 |
| | 144A 4.30% | | | | | | | |
| | 6/18/29 # | | | | 142,000 | | | 159,087 |
| | 144A 4.625% | | | | | | | |
| | 6/1/23 # | | | | 1,000,000 | | | 1,083,769 |
| | 144A 4.875% | | | | | | | |
| | 3/1/24 # | | | | 3,280,000 | | | 3,647,035 |
| Oracle | | | | | | | |
| | 2.875% 3/25/31 | | | | 1,360,000 | | | 1,385,560 |
| | 3.65% 3/25/41 | | | | 740,000 | | | 749,871 |
| | 3.95% 3/25/51 | | | | 740,000 | | | 764,178 |
| SK Hynix 144A 2.375% | | | | | | | |
| | 1/19/31 # | | | | 1,275,000 | | | 1,208,238 |
| | | | | | | | | 24,638,773 |
| Transportation – 1.16% | | | | | | | |
| Aerovias de Mexico | | | | | | | |
| | 144A 7.00% | | | | | | | |
| | 2/5/25 #, ‡ | | | | 855,000 | | | 468,113 |
| American Airlines | | | | | | | |
| | 2015-1 Class A Pass | | | | | | | |
| | Through Trust | | | | | | | |
| | 3.375% 11/1/28 ◆ | | | | 1,017,716 | | | 991,335 |
| American Airlines | | | | | | | |
| | 2016-3 Class AA Pass | | | | | | | |
| | Through Trust 3.00% | | | | | | | |
| | 4/15/30 ◆ | | | | 1,068,413 | | | 1,080,174 |
| American Airlines | | | | | | | |
| | 2019-1 Class AA Pass | | | | | | | |
| | Through Trust 3.15% | | | | | | | |
| | 8/15/33 ◆ | | | | 94,586 | | | 94,139 |
| Ashtead Capital 144A | | | | | | | |
| | 5.25% 8/1/26 # | | | | 400,000 | | | 420,640 |
| Azul Investments 144A | | | | | | | |
| | 5.875% 10/26/24 # | | | | 830,000 | | | 732,952 |
| British Airways 2018-1 | | | | | | | |
| | Class AA Pass | | | | | | | |
| | Through Trust 144A | | | | | | | |
| | 3.80% 3/20/33 #, ◆ | | | | 1,275,259 | | | 1,328,874 |
| Delta Air Lines | | | | | | | |
| | 3.625% 3/15/22 | | | | 500,000 | | | 505,663 |
| | 144A 7.00% | | | | | | | |
| | 5/1/25 # | | | | 5,800,000 | | | 6,686,162 |
| | 7.375% 1/15/26 | | | | 1,734,000 | | | 2,029,607 |
| Delta Air Lines 2007-1 | | | | | | | |
| | Class A Pass Through | | | | | | | |
| | Trust 6.821% | | | | | | | |
| | 2/10/24 ◆ | | | | 168,481 | | | 176,136 |
| Doric Nimrod Air Finance | | | | | | | |
| | Alpha 2012-1 Class A | | | | | | | |
| | Pass Through Trust | | | | | | | |
| | 144A 5.125% | | | | | | | |
| | 11/30/24 #, ◆ | | | | 533,320 | | | 531,664 |
| ERAC USA Finance | | | | | | | |
| | 144A 2.70% | | | | | | | |
| | 11/1/23 # | | | | 300,000 | | | 315,063 |
| | 144A 4.50% | | | | | | | |
| | 8/16/21 # | | | | 200,000 | | | 203,014 |
| Kansas City Southern | | | | | | | |
| | 3.00% 5/15/23 | | | | 500,000 | | | 521,618 |
| Lima Metro Line | | | | | | | |
| | 2 Finance 144A | | | | | | | |
| | 4.35% 4/5/36 # | | | | 695,000 | | | 737,054 |
| Mileage Plus Holdings | | | | | | | |
| | 144A 6.50% | | | | | | | |
| | 6/20/27 # | | | | 3,375,000 | | | 3,704,063 |
| Movida Europe 144A | | | | | | | |
| | 5.25% 2/8/31 # | | | | 490,000 | | | 470,750 |
63
Table of Contents
Schedules of investments
Optimum Fixed Income Fund
| | | | | | Principal | | | |
| | | | | | | amount° | | Value (US $) |
| Corporate Bonds (continued) | | | | | | | |
| Transportation (continued) | | | | | | | |
| Penske Truck Leasing | | | | | | | |
| | 144A 3.95% | | | | | | | |
| | 3/10/25 # | | | | 1,000,000 | | $ | 1,092,452 |
| | 144A 4.45% | | | | | | | |
| | 1/29/26 # | | | | 2,100,000 | | | 2,354,317 |
| | 144A 4.875% | | | | | | | |
| | 7/11/22 # | | | | 300,000 | | | 316,382 |
| Southwest Airlines | | | | | | | |
| | 5.125% 6/15/27 | | | | 2,425,000 | | | 2,790,149 |
| | 5.25% 5/4/25 | | | | 2,380,000 | | | 2,709,986 |
| Union Pacific 3.25% | | | | | | | |
| | 2/5/50 | | | | 765,000 | | | 754,729 |
| United Airlines 2020-1 | | | | | | | |
| | Class A Pass Through | | | | | | | |
| | Trust 5.875% | | | | | | | |
| | 4/15/29 ◆ | | | | 1,463,738 | | | 1,626,034 |
| US Airways 2012-2 Class | | | | | | | |
| | A Pass Through Trust | | | | | | | |
| | 4.625% 12/3/26 ◆ | | | | 368,368 | | | 348,279 |
| | | | | | | | | 32,989,349 |
| Utilities – 2.43% | | | | | | | |
| Adani Electricity Mumbai | | | | | | | |
| | 144A 3.949% | | | | | | | |
| | 2/12/30 # | | | | 475,000 | | | 480,011 |
| AEP Texas 2.40% | | | | | | | |
| | 10/1/22 | | | | 200,000 | | | 205,479 |
| AES Gener 144A | | | | | | | |
| | 7.125% 3/26/79 #, µ | | | | 605,000 | | | 650,898 |
| American Transmission | | | | | | | |
| | Systems 144A 5.25% | | | | | | | |
| | 1/15/22 # | | | | 1,955,000 | | | 2,016,622 |
| Calpine | | | | | | | |
| | 144A 4.50% | | | | | | | |
| | 2/15/28 # | | | | 453,000 | | | 457,485 |
| | 144A 5.00% | | | | | | | |
| | 2/1/31 # | | | | 1,535,000 | | | 1,500,463 |
| | 144A 5.125% | | | | | | | |
| | 3/15/28 # | | | | 454,000 | | | 456,754 |
| Centrais Eletricas | | | | | | | |
| | Brasileiras | | | | | | | |
| | 144A 3.625% | | | | | | | |
| | 2/4/25 # | | | | 200,000 | | | 201,756 |
| | 144A 4.625% | | | | | | | |
| | 2/4/30 # | | | | 565,000 | | | 565,904 |
| Cikarang Listrindo 144A | | | | | | | |
| | 4.95% 9/14/26 # | | | | 540,000 | | | 553,527 |
| Clean Renewable Power | | | | | | | |
| | Mauritius 144A | | | | | | | |
| | 4.25% 3/25/27 # | | | | 815,000 | | | 823,150 |
| CLP Power Hong Kong | | | | | | | |
| | Financing 2.875% | | | | | | | |
| | 4/26/23 | | | | 240,000 | | | 249,653 |
| Duke Energy 4.875% | | | | | | | |
| | 9/16/24 µ, ψ | | | | 2,330,000 | | | 2,467,470 |
| Duke Energy Indiana | | | | | | | |
| | 3.25% 10/1/49 | | | | 1,265,000 | | | 1,250,690 |
| Electricite de France | | | | | | | |
| | 2.875% | | | | | | | |
| | 12/15/26 µ, ψ | | EUR | | 1,400,000 | | | 1,712,424 |
| Enel Finance | | | | | | | |
| | International 144A | | | | | | | |
| | 2.875% 5/25/22 # | | | | 1,100,000 | | | 1,128,394 |
| Engie Energia Chile | | | | | | | |
| | 144A 4.50% | | | | | | | |
| | 1/29/25 # | | | | 515,000 | | | 561,505 |
| ENN Energy Holdings | | | | | | | |
| | 144A 2.625% | | | | | | | |
| | 9/17/30 # | | | | 605,000 | | | 582,339 |
| Entergy 4.00% 7/15/22 | | | | 300,000 | | | 311,644 |
| Entergy Arkansas 4.20% | | | | | | | |
| | 4/1/49 | | | | 870,000 | | | 976,235 |
| Entergy Louisiana | | | | | | | |
| | 4.95% 1/15/45 | | | | 235,000 | | | 254,999 |
| Entergy Mississippi | | | | | | | |
| | 3.85% 6/1/49 | | | | 1,465,000 | | | 1,541,625 |
| Entergy Texas 3.55% | | | | | | | |
| | 9/30/49 | | | | 700,000 | | | 698,510 |
| Essential Utilities | | | | | | | |
| | 2.704% 4/15/30 | | | | 695,000 | | | 701,896 |
| | 3.351% 4/15/50 | | | | 675,000 | | | 654,966 |
| Evergy 4.85% 6/1/21 | | | | 225,000 | | | 225,000 |
| Evergy Kansas Central | | | | | | | |
| | 3.45% 4/15/50 | | | | 1,185,000 | | | 1,204,027 |
| Exelon 2.45% 4/15/21 | | | | 200,000 | | | 200,113 |
| FirstEnergy 3.35% | | | | | | | |
| | 7/15/22 | | | | 200,000 | | | 203,077 |
| FirstEnergy Transmission | | | | | | | |
| | 144A 4.55% | | | | | | | |
| | 4/1/49 # | | | | 875,000 | | | 924,205 |
| Infraestructura | | | | | | | |
| | Energetica Nova | | | | | | | |
| | 144A 3.75% | | | | | | | |
| | 1/14/28 # | | | | 225,000 | | | 239,906 |
| | 144A 4.875% | | | | | | | |
| | 1/14/48 # | | | | 595,000 | | | 594,042 |
| Israel Electric 144A | | | | | | | |
| | 5.00% 11/12/24 # | | | | 532,000 | | | 598,726 |
| Kallpa Generacion 144A | | | | | | | |
| | 4.125% 8/16/27 # | | | | 870,000 | | | 928,064 |
64
Table of Contents
| | | | Principal | | | |
| | | | | amount° | | Value (US $) |
| Corporate Bonds (continued) | | | | | |
| Utilities (continued) | | | | | |
| Louisville Gas and | | | | | |
| | Electric 4.25% | | | | | |
| | 4/1/49 | | 2,685,000 | | $ | 3,064,396 |
| Mong Duong Finance | | | | | |
| | Holdings 144A | | | | | |
| | 5.125% 5/7/29 # | | 995,000 | | | 1,002,627 |
| NextEra Energy Capital | | | | | |
| | Holdings | | | | | |
| | 0.55% (SOFR + | | | | | |
| | 0.54%) 3/1/23 ● | | 100,000 | | | 100,279 |
| | 0.65% 3/1/23 | | 2,800,000 | | | 2,809,484 |
| | 2.403% 9/1/21 | | 1,700,000 | | | 1,714,717 |
| NiSource 5.65% | | | | | |
| | 6/15/23 µ, ψ | | 875,000 | | | 904,531 |
| Oryx Funding 144A | | | | | |
| | 5.80% 2/3/31 # | | 660,000 | | | 684,338 |
| Pacific Gas and Electric | | | | | |
| | 1.573% (LIBOR03M | | | | | |
| | + 1.375%) | | | | | |
| | 11/15/21 ● | | 2,200,000 | | | 2,204,408 |
| | 2.10% 8/1/27 | | 9,195,000 | | | 9,015,829 |
| | 2.50% 2/1/31 | | 735,000 | | | 694,070 |
| | 3.25% 6/1/31 | | 420,000 | | | 419,041 |
| | 3.30% 3/15/27 | | 700,000 | | | 730,693 |
| | 3.30% 8/1/40 | | 1,796,000 | | | 1,631,242 |
| | 3.50% 6/15/25 | | 400,000 | | | 424,450 |
| | 3.50% 8/1/50 | | 1,100,000 | | | 957,858 |
| | 4.50% 7/1/40 | | 1,100,000 | | | 1,118,103 |
| Pedernales Electric | | | | | |
| | Cooperative 144A | | | | | |
| | 6.202% 11/15/32 # | | 620,000 | | | 736,007 |
| Perusahaan Listrik | | | | | |
| | Negara | | | | | |
| | 144A 3.875% | | | | | |
| | 7/17/29 # | | 605,000 | | | 635,934 |
| | 144A 4.125% | | | | | |
| | 5/15/27 # | | 300,000 | | | 322,925 |
| | 144A 5.25% | | | | | |
| | 5/15/47 # | | 540,000 | | | 594,675 |
| PG&E 5.25% 7/1/30 | | 2,970,000 | | | 3,151,913 |
| Saudi Electricity Global | | | | | |
| | Sukuk Co. 4 4.222% | | | | | |
| | 1/27/24 | | 715,000 | | | 774,023 |
| Sempra Energy 4.875% | | | | | |
| | 10/15/25 µ, ψ | | 1,055,000 | | | 1,131,488 |
| Southern California | | | | | |
| | Edison | | | | | |
| | 3.65% 2/1/50 | | 1,525,000 | | | 1,511,248 |
| | 4.00% 4/1/47 | | 880,000 | | | 907,956 |
| | 4.875% 3/1/49 | | 2,330,000 | | | 2,711,223 |
| Systems Energy | | | | | |
| | Resources 2.14% | | | | | |
| | 12/9/25 | | 800,000 | | | 781,760 |
| Trans-Allegheny | | | | | |
| | Interstate Line 144A | | | | | |
| | 3.85% 6/1/25 # | | 165,000 | | | 177,210 |
| Vistra Operations 144A | | | | | |
| | 5.50% 9/1/26 # | | 1,784,000 | | | 1,850,900 |
| | | | | | | 68,884,887 |
| Total Corporate Bonds | | | | | |
| (cost $934,509,441) | | | | | 970,684,924 |
| | | | | | | |
| Municipal Bonds – 0.60% | | | | | |
| American Municipal | | | | | |
| | Power, Ohio | | | | | |
| (Combined Hydroelectric | | | | | |
| | Projects - Build | | | | | |
| | America Bonds) | | | | | |
| | Series B 8.084% | | | | | |
| | 2/15/50 | | 1,500,000 | | | 2,583,180 |
| Chicago, Illinois Transit | | | | | |
| | Authority Sales Tax | | | | | |
| | Receipts Revenue | | | | | |
| (Pension Funding) | | | | | |
| | Series A 6.899% | | | | | |
| | 12/1/40 | | 1,800,000 | | | 2,517,318 |
| (Retiree Health Care | | | | | |
| | Funding) Series B | | | | | |
| | 6.899% 12/1/40 | | 1,800,000 | | | 2,517,318 |
| New Jersey | | | | | |
| | Transportation Trust | | | | | |
| | Fund Authority | | | | | |
| (Build America Bonds) | | | | | |
| | Series C 5.754% 12/15/28 | | 1,590,000 | | | 1,896,441 |
| New York State Urban | | | | | |
| | Development | | | | | |
| (Build America Bonds) | | | | | |
| | Series E 5.77% | | | | | |
| | 3/15/39 | | 800,000 | | | 976,240 |
| Municipal Electric | | | | | |
| | Authority of Georgia | | | | | |
| (Build America Bonds | | | | | |
| | Plant Vogtle Units 3 & | | | | | |
| | 4 Project) 6.655% | | | | | |
| | 4/1/57 | | 1,767,000 | | | 2,550,417 |
| New York City, New York | | | | | |
| | Transitional Finance | | | | | |
| | Authority Future Tax | | | | | |
| | Secured Revenue | | | | | |
| (Build America Bonds) | | | | | |
| | Subordinate Series A-1 | | | | | |
| | 5.508% 8/1/37 | | 700,000 | | | 915,348 |
65
Table of Contents
Schedules of investments
Optimum Fixed Income Fund
| | | | Principal | | | |
| | | | | amount° | | Value (US $) |
| Municipal Bonds (continued) | | | | | |
| Oregon State Taxable | | | | | |
| | Pension | | | | | |
| | 5.892% 6/1/27 | | 30,000 | | $ | 36,631 |
| South Carolina Public | | | | | |
| | Service Authority | | | | | |
| (Santee Cooper) Series D | | | | | |
| | 4.77% 12/1/45 | | 145,000 | | | 174,271 |
| California State Various | | | | | |
| | Purposes | | | | | |
| (High-Speed Passenger | | | | | |
| | Train Bonds) Series C | | | | | |
| | 0.891% (LIBOR01M | | | | | |
| | + 0.78%) 4/1/47 ● | | 1,250,000 | | | 1,251,187 |
| Pennsylvania Higher | | | | | |
| | Education Assistance | | | | | |
| | Agency Revenue | | | | | |
| (Student Loans) | | | | | |
| | Series 2006-2 A-3 | | | | | |
| | 0.348% (LIBOR03M | | | | | |
| | + 0.13%) 10/25/36 ● | | 373,695 | | | 367,074 |
| West Virginia Tobacco | | | | | |
| | Settlement Finance | | | | | |
| | Authority | | | | | |
| | (Class 1 Senior | | | | | |
| | Current Interest | | | | | |
| | Bonds) | | | | | |
| | Series A | | | | | |
| | 1.82% 6/1/26 | | 250,000 | | | 251,760 |
| | Series A | | | | | |
| | 2.351% 6/1/28 | | 300,000 | | | 303,480 |
| | Series A | | | | | |
| | 2.551% 6/1/29 | | 300,000 | | | 304,758 |
| | Series A | | | | | |
| | 2.951% 6/1/31 | | 500,000 | | | 503,465 |
| Total Municipal Bonds | | | | | |
| (cost $15,465,312) | | | | | 17,148,888 |
| | | | | | | |
| Non-Agency Asset-Backed Securities – 2.29% | | | | | |
| ABFC Trust | | | | | |
| | Series 2006-HE1 A2D | | | | | |
| | 0.329% (LIBOR01M | | | | | |
| | + 0.22%, Floor | | | | | |
| | 0.22%) 1/25/37 ● | | 308,626 | | | 218,820 |
| Argent Securities Trust | | | | | |
| | Series 2006-M1 A2C | | | | | |
| | 0.259% (LIBOR01M | | | | | |
| | + 0.15%, Floor | | | | | |
| | 0.15%) 7/25/36 ● | | 1,194,578 | | | 514,532 |
| | Series 2006-W4 A2C | | | | | |
| | 0.429% (LIBOR01M | | | | | |
| | + 0.32%, Floor | | | | | |
| | 0.32%) 5/25/36 ● | | 626,476 | | | 233,181 |
| Bear Stearns Asset- | | | | | |
| | Backed Securities I | | | | | |
| | Trust | | | | | |
| | Series 2005-FR1 M2 | | | | | |
| | 1.114% (LIBOR01M | | | | | |
| | + 1.005%, Floor | | | | | |
| | 1.005%) 6/25/35 ● | | 1,502,634 | | | 1,490,920 |
| Bear Stearns Asset- | | | | | |
| | Backed Securities | | | | | |
| | Trust | | | | | |
| | Series 2007-SD1 22A1 | | | | | |
| | 2.829% 10/25/36 ● | | 111,445 | | | 76,957 |
| Bear Stearns Second | | | | | |
| | Lien Trust | | | | | |
| | Series 2007-SV1A M2 | | | | | |
| | 144A 1.459% | | | | | |
| | (LIBOR01M + 1.35%, | | | | | |
| | Cap 11.00%, Floor | | | | | |
| | 1.35%) 1/25/36 #, ● | | 115,737 | | | 115,536 |
| Centex Home Equity | | | | | |
| | Loan Trust | | | | | |
| | Series 2002-A AF6 | | | | | |
| | 5.54% 1/25/32 | | 378 | | | 390 |
| CIT Mortgage Loan Trust | | | | | |
| | Series 2007-1 1M1 | | | | | |
| | 144A 1.609% | | | | | |
| | (LIBOR01M + 1.50%, | | | | | |
| | Floor 1.50%) | | | | | |
| | 10/25/37 #, ● | | 3,600,000 | | | 3,666,062 |
| Citicorp Residential | | | | | |
| | Mortgage Trust | | | | | |
| | Series 2006-3 A5 | | | | | |
| | 5.076% 11/25/36 ● | | 588,250 | | | 605,490 |
| Countrywide Asset- | | | | | |
| | Backed Certificates | | | | | |
| | Series 2004-3 2A | | | | | |
| | 0.509% (LIBOR01M | | | | | |
| | + 0.40%, Floor | | | | | |
| | 0.40%) 8/25/34 ● | | 39,030 | | | 37,686 |
| | Series 2006-1 AF6 | | | | | |
| | 4.551% 7/25/36 ● | | 89,912 | | | 91,520 |
| | Series 2006-26 2A4 | | | | | |
| | 0.329% (LIBOR01M | | | | | |
| | + 0.22%, Floor | | | | | |
| | 0.22%) 6/25/37 ● | | 1,707,721 | | | 1,654,167 |
| | Series 2007-6 2A4 | | | | | |
| | 0.419% (LIBOR01M | | | | | |
| | + 0.31%, Floor | | | | | |
| | 0.31%) 9/25/37 ● | | 924,317 | | | 777,932 |
| CWABS Asset-Backed | | | | | |
| | Certificates Trust | | | | | |
| | Series 2005-3 MV7 | | | | | |
| | 2.059% (LIBOR01M | | | | | |
| | + 1.95%, Floor | | | | | |
| | 1.95%) 8/25/35 ● | | 4,200,000 | | | 4,303,872 |
66
Table of Contents
| | | | Principal | | |
| | | | | amount° | | Value (US $) |
| Non-Agency Asset-Backed Securities (continued) | | | | | |
| CWABS Asset-Backed | | | | | |
| | Certificates Trust | | | | | |
| | Series 2006-11 1AF6 | | | | | |
| | 6.15% 9/25/46 ● | | 77,430 | | $ | 79,842 |
| | Series 2006-17 2A2 | | | | | |
| | 0.259% (LIBOR01M | | | | | |
| | + 0.15%, Floor | | | | | |
| | 0.15%) 3/25/47 ● | | 1,061,139 | | | 1,044,020 |
| DataBank Issuer | | | | | |
| | Series 2021-1A A2 | | | | | |
| | 144A 2.06% | | | | | |
| | 2/27/51 # | | 1,600,000 | | | 1,586,107 |
| Discover Card Execution | | | | | |
| | Note Trust | | | | | |
| | Series 2019-A1 A1 | | | | | |
| | 3.04% 7/15/24 | | 400,000 | | | 408,803 |
| EquiFirst Mortgage Loan | | | | | |
| | Trust | | | | | |
| | Series 2004-2 M7 | | | | | |
| | 3.109% (LIBOR01M | | | | | |
| | + 3.00%, Floor | | | | | |
| | 3.00%) 10/25/34 ● | | 662,361 | | | 691,136 |
| First Franklin Mortgage | | | | | |
| | Loan Trust | | | | | |
| | Series 2006-FF5 2A3 | | | | | |
| | 0.429% (LIBOR01M | | | | | |
| | + 0.32%, Floor | | | | | |
| | 0.32%) 4/25/36 ● | | 687,074 | | | 666,944 |
| Ford Credit Auto Lease | | | | | |
| | Trust | | | | | |
| | Series 2021-A B | | | | | |
| | 0.47% 5/15/24 | | 1,300,000 | | | 1,295,182 |
| Fremont Home Loan | | | | | |
| | Trust | | | | | |
| | Series 2004-B M1 | | | | | |
| | 0.979% (LIBOR01M | | | | | |
| | + 0.87%, Floor | | | | | |
| | 0.87%) 5/25/34 ● | | 2,355,931 | | | 2,309,726 |
| GE-WMC Mortgage | | | | | |
| | Securities Trust | | | | | |
| | Series 2006-1 A2B | | | | | |
| | 0.409% (LIBOR01M | | | | | |
| | + 0.30%, Floor | | | | | |
| | 0.30%) 8/25/36 ● | | 1,919,836 | | | 1,172,335 |
| GSAMP Trust | | | | | |
| | Series 2006-FM3 A2D | | | | | |
| | 0.339% (LIBOR01M | | | | | |
| | + 0.23%, Floor | | | | | |
| | 0.23%) 11/25/36 ● | | 908,018 | | | 561,077 |
| | Series 2007-SEA1 A | | | | | |
| | 144A 0.409% | | | | | |
| | (LIBOR01M + 0.30%, | | | | | |
| | Floor 0.30%) | | | | | |
| | 12/25/36 #, ● | | 690,775 | | | 670,667 |
| Hardee’s Funding | | | | | |
| | Series 2018-1A A2II | | | | | |
| | 144A 4.959% | | | | | |
| | 6/20/48 # | | 487,500 | | | 512,411 |
| Harley-Davidson | | | | | |
| | Motorcycle Trust | | | | | |
| | Series 2020-A A2A | | | | | |
| | 1.83% 1/17/23 | | 234,950 | | | 235,519 |
| HOA Funding | | | | | |
| | Series 2014-1A A2 | | | | | |
| | 144A 4.846% | | | | | |
| | 8/20/44 # | | 1,222,350 | | | 1,208,574 |
| Home Equity Mortgage | | | | | |
| | Loan Asset-Backed | | | | | |
| | Trust | | | | | |
| | Series 2007-A 2A3 | | | | | |
| | 0.349% (LIBOR01M | | | | | |
| | + 0.24%, Floor | | | | | |
| | 0.24%) 4/25/37 ● | | 1,278,574 | | | 974,429 |
| HSI Asset Securitization | | | | | |
| | Trust | | | | | |
| | Series 2006-HE1 2A1 | | | | | |
| | 0.159% (LIBOR01M | | | | | |
| | + 0.05%, Floor | | | | | |
| | 0.05%) 10/25/36 ● | | 24,932 | | | 12,987 |
| Hyundai Auto | | | | | |
| | Receivables Trust | | | | | |
| | Series 2020-C A2 | | | | | |
| | 0.26% 9/15/23 | | 300,000 | | | 300,056 |
| JPMorgan Mortgage | | | | | |
| | Acquisition Trust | | | | | |
| | Series 2006-CW2 AV5 | | | | | |
| | 0.349% (LIBOR01M | | | | | |
| | + 0.24%, Floor | | | | | |
| | 0.24%) 8/25/36 ● | | 469,284 | | | 463,874 |
| Long Beach Mortgage | | | | | |
| | Loan Trust | | | | | |
| | Series 2006-1 2A4 | | | | | |
| | 0.709% (LIBOR01M | | | | | |
| | + 0.60%, Floor | | | | | |
| | 0.60%) 2/25/36 ● | | 2,784,725 | | | 2,529,336 |
| | Series 2006-7 1A | | | | | |
| | 0.264% (LIBOR01M | | | | | |
| | + 0.155%, Floor | | | | | |
| | 0.155%) 8/25/36 ● | | 2,709,393 | | | 1,727,224 |
| Mercedes-Benz Auto | | | | | |
| | Lease Trust | | | | | |
| | Series 2019-B A2 | | | | | |
| | 2.01% 12/15/21 | | 32,603 | | | 32,624 |
67
Table of Contents
Schedules of investments
Optimum Fixed Income Fund
| | | | Principal | | | |
| | | | | amount° | | Value (US $) |
| Non-Agency Asset-Backed Securities (continued) | | | | | |
| Mercedes-Benz Auto | | | | | |
| | Lease Trust | | | | | |
| | Series 2020-A A2 | | | | | |
| | 1.82% 3/15/22 | | 159,007 $ | | $ | 159,336 |
| Mercedes-Benz Master | | | | | |
| | Owner Trust | | | | | |
| | Series 2019-BA A | | | | | |
| | 144A 2.61% | | | | | |
| | 5/15/24 # | | 500,000 | | | 512,781 |
| Morgan Stanley ABS | | | | | |
| | Capital I Trust | | | | | |
| | Series 2007-HE1 A2C | | | | | |
| | 0.259% (LIBOR01M | | | | | |
| | + 0.15%, Floor | | | | | |
| | 0.15%) 11/25/36 ● | | 4,400,022 | | | 3,224,146 |
| | Series 2007-HE5 A2D | | | | | |
| | 0.449% (LIBOR01M | | | | | |
| | + 0.34%, Floor | | | | | |
| | 0.34%) 3/25/37 ● | | 3,197,314 | | | 1,788,236 |
| New Century Home | | | | | |
| | Equity Loan Trust | | | | | |
| | Series 2005-1 M2 | | | | | |
| | 0.829% (LIBOR01M | | | | | |
| | + 0.72%, Cap | | | | | |
| | 12.50%, Floor | | | | | |
| | 0.72%) 3/25/35 ● | | 233,600 | | | 231,579 |
| Nissan Auto Lease Trust | | | | | |
| | Series 2020-A A2A | | | | | |
| | 1.80% 5/16/22 | | 485,658 | | | 486,532 |
| Option One Mortgage | | | | | |
| | Loan Trust | | | | | |
| | Series 2005-1 M1 | | | | | |
| | 0.889% (LIBOR01M | | | | | |
| | + 0.78%, Floor | | | | | |
| | 0.78%) 2/25/35 ● | | 1,617,422 | | | 1,610,775 |
| | Series 2007-4 2A4 | | | | | |
| | 0.419% (LIBOR01M | | | | | |
| | + 0.31%, Floor | | | | | |
| | 0.31%) 4/25/37 ● | | 5,781,522 | | | 4,059,904 |
| PFS Financing | | | | | |
| | Series 2020-G A | | | | | |
| | 144A 0.97% | | | | | |
| | 2/15/26 # | | 2,000,000 | | | 2,007,957 |
| | Series 2021-A A 144A | | | | | |
| | 0.71% 4/15/26 # | | 1,800,000 | | | 1,790,814 |
| RAAC Trust | | | | | |
| | Series 2005-SP2 2A | | | | | |
| | 0.709% (LIBOR01M | | | | | |
| | + 0.30%, Cap | | | | | |
| | 14.00%, Floor | | | | | |
| | 0.60%) 6/25/44 ● | | 277,543 | | | 250,926 |
| RAMP Trust | | | | | |
| | Series 2007-RZ1 A2 | | | | | |
| | 0.269% (LIBOR01M | | | | | |
| | + 0.16%, Cap | | | | | |
| | 14.00%, Floor | | | | | |
| | 0.16%) 2/25/37 ● | | 15,611 | | | 15,602 |
| Sofi Professional Loan | | | | | |
| | Program | | | | | |
| | Series 2016-F A2 | | | | | |
| | 144A 3.02% | | | | | |
| | 2/25/40 # | | 181,644 | | | 187,449 |
| Soundview Home Loan | | | | | |
| | Trust | | | | | |
| | Series 2006-OPT1 2A4 | | | | | |
| | 0.379% (LIBOR01M | | | | | |
| | + 0.27%, Floor | | | | | |
| | 0.27%) 3/25/36 ● | | 231,893 | | | 227,123 |
| Structured Asset | | | | | |
| | Investment Loan Trust | | | | | |
| | Series 2003-BC2 M1 | | | | | |
| | 1.489% (LIBOR01M | | | | | |
| | + 1.38%, Floor | | | | | |
| | 1.38%) 4/25/33 ● | | 15,778 | | | 15,814 |
| Structured Asset | | | | | |
| | Securities Mortgage | | | | | |
| | Loan Trust | | | | | |
| | Series 2006-BC1 A6 | | | | | |
| | 0.379% (LIBOR01M | | | | | |
| | + 0.27%, Floor | | | | | |
| | 0.27%) 3/25/36 ● | | 1,303,722 | | | 1,234,354 |
| | Series 2006-BC2 A1 | | | | | |
| | 0.264% (LIBOR01M | | | | | |
| | + 0.155%, Floor | | | | | |
| | 0.155%) 9/25/36 ● | | 3,753,438 | | | 2,937,086 |
| Tesla Auto Lease Trust | | | | | |
| | Series 2021-A A2 | | | | | |
| | 144A 0.36% | | | | | |
| | 3/20/25 # | | 310,000 | | | 309,966 |
| Towd Point Mortgage | | | | | |
| | Trust | | | | | |
| | Series 2017-1 A1 | | | | | |
| | 144A 2.75% | | | | | |
| | 10/25/56 #, ● | | 571,179 | | | 580,929 |
| | Series 2017-2 A1 | | | | | |
| | 144A 2.75% | | | | | |
| | 4/25/57 #, ● | | 71,719 | | | 72,792 |
| | Series 2017-4 M1 | | | | | |
| | 144A 3.25% | | | | | |
| | 6/25/57 #, ● | | 615,000 | | | 643,717 |
| | Series 2018-1 A1 | | | | | |
| | 144A 3.00% | | | | | |
| | 1/25/58 #, ● | | 354,551 | | | 365,142 |
68
Table of Contents
| | | | Principal | | | |
| | | | | amount° | | Value (US $) |
| Non-Agency Asset-Backed Securities (continued) | | | | | |
| Towd Point Mortgage | | | | | |
| | Trust | | | | | |
| | Series 2019-4 A1 | | | | | |
| | 144A 2.90% | | | | | |
| | 10/25/59 #, ● | | 9,097,932 | | $ | 9,504,734 |
| Wendy’s Funding | | | | | |
| | Series 2018-1A A2I | | | | | |
| | 144A 3.573% | | | | | |
| | 3/15/48 # | | 464,400 | | | 477,361 |
| Total Non-Agency Asset-Backed Securities | | | | | |
| (cost $63,493,633) | | | | | 64,964,993 |
| | | | | | | |
| Non-Agency Collateralized Mortgage Obligations – | | | | | |
| 1.96% | | | | | |
| Alternative Loan Trust | | | | | |
| | Resecuritization | | | | | |
| | Series 2008-2R 3A1 | | | | | |
| | 6.00% 8/25/37 ● | | 949,963 | | | 716,654 |
| ARM Mortgage Trust | | | | | |
| | Series 2004-5 3A1 | | | | | |
| | 2.458% 4/25/35 ● | | 3,708 | | | 3,703 |
| | Series 2005-10 3A31 | | | | | |
| | 2.723% 1/25/36 ● | | 97,463 | | | 95,442 |
| | Series 2006-2 1A4 | | | | | |
| | 3.338% 5/25/36 ● | | 454,953 | | | 444,536 |
| Banc of America Funding | | | | | |
| | Trust | | | | | |
| | Series 2005-E 7A1 | | | | | |
| | 1.887% (COF 11 + | | | | | |
| | 1.43%, Floor 1.43%) | | | | | |
| | 6/20/35 ● | | 88,135 | | | 77,447 |
| | Series 2006-I 1A1 | | | | | |
| | 2.455% 12/20/36 ● | | 137,870 | | | 142,820 |
| Banc of America | | | | | |
| | Mortgage Trust | | | | | |
| | Series 2003-D 2A1 | | | | | |
| | 4.403% 5/25/33 ● | | 77,790 | | | 80,556 |
| Bear Stearns ARM Trust | | | | | |
| | Series 2003-5 2A1 | | | | | |
| | 2.945% 8/25/33 ● | | 23,114 | | | 23,329 |
| Chase Mortgage Finance | | | | | |
| | Trust | | | | | |
| | Series 2005-A1 3A1 | | | | | |
| | 2.97% 12/25/35 ● | | 53,691 | | | 52,815 |
| CHL Mortgage Pass | | | | | |
| | Through Trust | | | | | |
| | Series 2007-4 1A1 | | | | | |
| | 6.00% 5/25/37 ◆ | | 804,570 | | | 551,040 |
| Connecticut Avenue | | | | | |
| | Securities Trust | | | | | |
| | Series 2018-R07 1M2 | | | | | |
| | 144A 2.509% | | | | | |
| | (LIBOR01M + 2.40%) | | | | | |
| | 4/25/31 #, ● | | 473,319 | | | 474,060 |
| Connecticut Avenue | | | | | |
| | Securities Trust | | | | | |
| | Series 2019-R01 2M2 | | | | | |
| | 144A 2.559% | | | | | |
| | (LIBOR01M + 2.45%) | | | | | |
| | 7/25/31 #, ● | | 299,038 | | | 299,599 |
| | Series 2019-R02 1M2 | | | | | |
| | 144A 2.409% | | | | | |
| | (LIBOR01M + 2.30%, | | | | | |
| | Floor 2.30%) | | | | | |
| | 8/25/31 #, ● | | 1,521,210 | | | 1,523,658 |
| | Series 2019-R07 1M2 | | | | | |
| | 144A 2.209% | | | | | |
| | (LIBOR01M + 2.10%) | | | | | |
| | 10/25/39 #, ● | | 2,036,980 | | | 2,038,444 |
| | Series 2020-R01 1M2 | | | | | |
| | 144A 2.159% | | | | | |
| | (LIBOR01M + 2.05%, | | | | | |
| | Floor 2.05%) | | | | | |
| | 1/25/40 #, ● | | 2,500,000 | | | 2,496,374 |
| CSMC Mortgage-Backed | | | | | |
| | Trust | | | | | |
| | Series 2005-1R 2A5 | | | | | |
| | 144A 5.75% | | | | | |
| | 12/26/35 # | | 794,292 | | | 705,115 |
| | Series 2007-1 5A14 | | | | | |
| | 6.00% 2/25/37 | | 185,215 | | | 164,480 |
| | Series 2007-3 4A6 | | | | | |
| | 0.359% (LIBOR01M | | | | | |
| | + 0.25%, Cap | | | | | |
| | 7.00%, Floor 0.25%) | | | | | |
| | 4/25/37 ● | | 144,288 | | | 123,257 |
| | Series 2007-3 4A12 | | | | | |
| | 6.641% (6.75% | | | | | |
| | minus LIBOR01M, | | | | | |
| | Cap 6.75%) | | | | | |
| | 4/25/37 Σ, ● | | 144,288 | | | 33,294 |
| | Series 2007-3 4A15 | | | | | |
| | 5.50% 4/25/37 | | 64,068 | | | 60,568 |
| GMACM Mortgage Loan | | | | | |
| | Trust | | | | | |
| | Series 2006-J1 A1 | | | | | |
| | 5.75% 4/25/36 | | 23,144 | | | 23,014 |
| GSR Mortgage Loan | | | | | |
| | Trust | | | | | |
| | Series 2007-AR1 2A1 | | | | | |
| | 2.908% 3/25/47 ● | | 475,804 | | | 384,091 |
| JPMorgan Alternative | | | | | |
| | Loan Trust | | | | | |
| | Series 2007-A2 11A1 | | | | | |
| | 0.289% (LIBOR01M | | | | | |
| | + 0.18%, Cap | | | | | |
| | 11.50%, Floor | | | | | |
| | 0.18%) 6/25/37 ● | | 3,780,675 | | | 2,683,111 |
69
Table of Contents
Schedules of investments
Optimum Fixed Income Fund
| | | | | | Principal | | | |
| | | | | | | amount° | | Value (US $) |
| Non-Agency Collateralized Mortgage | | | | | | | |
| Obligations (continued) | | | | | | | |
| JPMorgan Mortgage | | | | | | | |
| | Trust | | | | | | | |
| | Series 2006-A6 2A4L | | | | | | | |
| | 3.13% 10/25/36 ● | | | | 246,476 | | $ | 223,360 |
| | Series 2006-A7 2A2 | | | | | | | |
| | 3.057% 1/25/37 ● | | | | 52,681 | | | 49,418 |
| | Series 2007-A1 6A1 | | | | | | | |
| | 3.155% 7/25/35 ● | | | | 61,940 | | | 63,067 |
| | Series 2014-2 B1 | | | | | | | |
| | 144A 3.411% | | | | | | | |
| | 6/25/29 #, ● | | | | 38,714 | | | 39,789 |
| | Series 2014-2 B2 | | | | | | | |
| | 144A 3.411% | | | | | | | |
| | 6/25/29 #, ● | | | | 38,714 | | | 39,633 |
| | Series 2015-4 B1 | | | | | | | |
| | 144A 3.601% | | | | | | | |
| | 6/25/45 #, ● | | | | 648,252 | | | 672,882 |
| | Series 2015-4 B2 | | | | | | | |
| | 144A 3.601% | | | | | | | |
| | 6/25/45 #, ● | | | | 277,063 | | | 285,985 |
| | Series 2015-5 B2 | | | | | | | |
| | 144A 2.482% | | | | | | | |
| | 5/25/45 #, ● | | | | 550,093 | | | 564,653 |
| | Series 2015-6 B1 | | | | | | | |
| | 144A 3.55% | | | | | | | |
| | 10/25/45 #, ● | | | | 279,541 | | | 289,629 |
| | Series 2015-6 B2 | | | | | | | |
| | 144A 3.55% | | | | | | | |
| | 10/25/45 #, ● | | | | 271,986 | | | 280,440 |
| | Series 2016-4 B1 | | | | | | | |
| | 144A 3.847% | | | | | | | |
| | 10/25/46 #, ● | | | | 210,275 | | | 219,848 |
| | Series 2016-4 B2 | | | | | | | |
| | 144A 3.847% | | | | | | | |
| | 10/25/46 #, ● | | | | 383,150 | | | 397,568 |
| | Series 2017-1 B3 | | | | | | | |
| | 144A 3.509% | | | | | | | |
| | 1/25/47 #, ● | | | | 905,831 | | | 920,663 |
| | Series 2017-2 A3 | | | | | | | |
| | 144A 3.50% | | | | | | | |
| | 5/25/47 #, ● | | | | 118,512 | | | 120,258 |
| | Series 2020-2 A3 | | | | | | | |
| | 144A 3.50% | | | | | | | |
| | 7/25/50 #, ● | | | | 472,136 | | | 481,376 |
| | Series 2020-5 A3 | | | | | | | |
| | 144A 3.00% | | | | | | | |
| | 12/25/50 #, ● | | | | 2,575,257 | | | 2,604,731 |
| | Series 2020-7 A3 | | | | | | | |
| | 144A 3.00% | | | | | | | |
| | 1/25/51 #, ● | | | | 1,113,778 | | | 1,126,827 |
| | Series 2021-1 A3 | | | | | | | |
| | 144A 2.50% | | | | | | | |
| | 6/25/51 #, ● | | | | 1,077,599 | | | 1,090,648 |
| Lanark Master Issuer | | | | | | | |
| | Series 2019-1A 1A1 | | | | | | | |
| | 144A 0.952% | | | | | | | |
| | (LIBOR03M + 0.77%) | | | | | | | |
| | 12/22/69 #, ● | | | | 453,333 | | | 453,985 |
| Lehman Mortgage Trust | | | | | | | |
| | Series 2007-10 2A2 | | | | | | | |
| | 6.50% 1/25/38 | | | | 1,310,869 | | | 677,846 |
| Ludgate Funding | | | | | | | |
| | Series 2006-1X A2A | | | | | | | |
| | 0.26% (BP0003M + | | | | | | | |
| | 0.19%) 12/1/60 ● | | GBP | | 1,289,215 | | | 1,716,997 |
| | Series 2008-W1X A1 | | | | | | | |
| | 0.69% (BP0003M + | | | | | | | |
| | 0.60%) 1/1/61 ● | | GBP | | 536,149 | | | 725,927 |
| Mansard Mortgages | | | | | | | |
| | Series 2007-1X A2 | | | | | | | |
| | 0.208% (BP0003M + | | | | | | | |
| | 0.18%) 4/15/47 ● | | GBP | | 598,558 | | | 793,296 |
| MASTR Alternative Loan | | | | | | | |
| | Trust | | | | | | | |
| | Series 2004-3 8A1 | | | | | | | |
| | 7.00% 4/25/34 | | | | 1,337 | | | 1,364 |
| | Series 2004-5 6A1 | | | | | | | |
| | 7.00% 6/25/34 | | | | 20,312 | | | 21,094 |
| MASTR ARM Trust | | | | | | | |
| | Series 2004-4 4A1 | | | | | | | |
| | 2.851% 5/25/34 ● | | | | 46,222 | | | 47,302 |
| Merrill Lynch Mortgage | | | | | | | |
| | Investors Trust | | | | | | | |
| | Series 2004-A1 2A2 | | | | | | | |
| | 2.432% 2/25/34 ● | | | | 2,647 | | | 2,723 |
| Morgan Stanley | | | | | | | |
| | Residential Mortgage | | | | | | | |
| | Loan Trust | | | | | | | |
| | Series 2020-1 A2A | | | | | | | |
| | 144A 2.50% | | | | | | | |
| | 12/25/50 #, ● | | | | 972,525 | | | 986,733 |
| | Series 2021-1 A2 | | | | | | | |
| | 144A 2.50% | | | | | | | |
| | 3/25/51 #, ● | | | | 850,000 | | | 862,750 |
| New Residential | | | | | | | |
| | Mortgage Loan Trust | | | | | | | |
| | Series 2018-RPL1 A1 | | | | | | | |
| | 144A 3.50% | | | | | | | |
| | 12/25/57 #, ● | | | | 243,899 | | | 255,055 |
| | Series 2019-RPL3 A1 | | | | | | | |
| | 144A 2.75% | | | | | | | |
| | 7/25/59 #, ● | | | | 4,902,380 | | | 5,109,737 |
| RALI Series Trust | | | | | | | |
| | Series 2007-QA5 2A1 | | | | | | | |
| | 5.726% 9/25/37 ● | | | | 2,657,762 | | | 2,288,541 |
70
Table of Contents
| | | | | | Principal | | | |
| | | | | | | amount° | | Value (US $) |
| Non-Agency Collateralized Mortgage | | | | | | | |
| Obligations (continued) | | | | | | | |
| RALI Series Trust | | | | | | | |
| | Series 2007-QH8 A | | | | | | | |
| | 1.272% 10/25/37 ● | | | | 1,588,607 | | $ | 1,524,657 |
| RCKT Mortgage Trust | | | | | | | |
| | Series 2021-1 A1 | | | | | | | |
| | 144A 2.50% | | | | | | | |
| | 3/25/51 #, ● | | | | 900,000 | | | 919,980 |
| Reperforming Loan | | | | | | | |
| | REMIC Trust | | | | | | | |
| | Series 2006-R1 AF1 | | | | | | | |
| | 144A 0.458% | | | | | | | |
| | (LIBOR01M + 0.34%, | | | | | | | |
| | Cap 9.50%, Floor | | | | | | | |
| | 0.34%) 1/25/36 #, ● | | | | 767,054 | | | 744,889 |
| RFMSI Series Trust | | | | | | | |
| | Series 2004-S9 2A1 | | | | | | | |
| | 4.75% 12/25/19 | | | | 28 | | | 29 |
| Sequoia Mortgage Trust | | | | | | | |
| | Series 2004-5 A3 | | | | | | | |
| | 0.82% (LIBOR06M + | | | | | | | |
| | 0.56%, Cap 11.50%, | | | | | | | |
| | Floor 0.56%) | | | | | | | |
| | 6/20/34 ● | | | | 112,173 | | | 111,101 |
| | Series 2007-1 4A1 | | | | | | | |
| | 3.112% 9/20/46 ● | | | | 318,067 | | | 247,550 |
| | Series 2015-1 B2 | | | | | | | |
| | 144A 3.893% | | | | | | | |
| | 1/25/45 #, ● | | | | 227,257 | | | 233,468 |
| | Series 2017-5 B2 | | | | | | | |
| | 144A 3.828% | | | | | | | |
| | 8/25/47 #, ● | | | | 3,032,018 | | | 3,180,681 |
| | Series 2019-CH1 A1 | | | | | | | |
| | 144A 4.50% | | | | | | | |
| | 3/25/49 #, ● | | | | 150,478 | | | 152,346 |
| | Series 2020-4 A2 | | | | | | | |
| | 144A 2.50% | | | | | | | |
| | 11/25/50 #, ● | | | | 886,955 | | | 897,695 |
| Structured ARM Loan | | | | | | | |
| | Trust | | | | | | | |
| | Series 2006-1 7A4 | | | | | | | |
| | 3.123% 2/25/36 ● | | | | 169,370 | | | 163,166 |
| Structured Asset | | | | | | | |
| | Mortgage | | | | | | | |
| | Investments II Trust | | | | | | | |
| | Series 2005-AR5 A2 | | | | | | | |
| | 0.61% (LIBOR01M + | | | | | | | |
| | 0.50%, Cap 11.00%, | | | | | | | |
| | Floor 0.50%) | | | | | | | |
| | 7/19/35 ● | | | | 203,253 | | | 196,544 |
| Trinity Square | | | | | | | |
| | Series 2021-1A A | | | | | | | |
| | 144A 0.897% | | | | | | | |
| | (SONIA3M + 0.85%) | | | | | | | |
| | 7/15/59 #, ● | | GBP | | 4,200,000 | | | 5,790,693 |
| WaMu Mortgage Pass | | | | | | | |
| | Through Certificates | | | | | | | |
| | Trust | | | | | | | |
| | Series 2005-AR16 1A3 | | | | | | | |
| | 2.742% | | | | | | | |
| | 12/25/35 ◆, ● | | | | 238,640 | | | 240,818 |
| | Series 2007-HY1 3A3 | | | | | | | |
| | 3.18% 2/25/37 ◆, ● | | | | 163,992 | | | 161,588 |
| | Series 2007-HY7 4A1 | | | | | | | |
| | 3.325% | | | | | | | |
| | 7/25/37 ◆, ● | | | | 325,899 | | | 326,065 |
| Wells Fargo Mortgage- | | | | | | | |
| | Backed Securities | | | | | | | |
| | Trust | | | | | | | |
| | Series 2006-AR5 2A1 | | | | | | | |
| | 2.803% 4/25/36 ● | | | | 16,605 | | | 16,440 |
| | Series 2006-AR11 A6 | | | | | | | |
| | 3.132% 8/25/36 ● | | | | 162,599 | | | 160,167 |
| | Series 2020-1 A1 | | | | | | | |
| | 144A 3.00% | | | | | | | |
| | 12/25/49 #, ● | | | | 330,159 | | | 335,351 |
| | Series 2020-3 A1 | | | | | | | |
| | 144A 3.00% | | | | | | | |
| | 6/25/50 #, ● | | | | 2,693,851 | | | 2,739,090 |
| | Series 2020-4 A1 | | | | | | | |
| | 144A 3.00% | | | | | | | |
| | 7/25/50 #, ● | | | | 724,466 | | | 736,988 |
| Total Non-Agency Collateralized Mortgage | | | | | | | |
| Obligations | | | | | | | |
| (cost $56,488,959) | | | | | | | 55,490,838 |
| | | | | | | | | |
| Non-Agency Commercial Mortgage-Backed Securities – | | | | | | | |
| 4.36% | | | | | | | |
| BANK | | | | | | | |
| | Series 2017-BNK5 A5 | | | | | | | |
| | 3.39% 6/15/60 | | | | 1,430,000 | | | 1,554,874 |
| | Series 2017-BNK5 B | | | | | | | |
| | 3.896% 6/15/60 ● | | | | 605,000 | | | 656,671 |
| | Series 2017-BNK7 A5 | | | | | | | |
| | 3.435% 9/15/60 | | | | 1,110,000 | | | 1,210,707 |
| | Series 2019-BN20 A3 | | | | | | | |
| | 3.011% 9/15/62 | | | | 8,000,000 | | | 8,409,604 |
| | Series 2019-BN21 A5 | | | | | | | |
| | 2.851% 10/17/52 | | | | 2,100,000 | | | 2,181,597 |
| Benchmark Mortgage | | | | | | | |
| | Trust | | | | | | | |
| | Series 2018-B1 A5 | | | | | | | |
| | 3.666% 1/15/51 ● | | | | 2,310,000 | | | 2,546,318 |
| | Series 2020-B17 A5 | | | | | | | |
| | 2.289% 3/15/53 | | | | 3,460,000 | | | 3,438,951 |
| | Series 2020-B20 A5 | | | | | | | |
| | 2.034% 10/15/53 | | | | 10,650,000 | | | 10,328,195 |
71
Table of Contents
Schedules of investments
Optimum Fixed Income Fund
| | | | Principal | | | |
| | | | | amount° | | Value (US $) |
| Non-Agency Commercial Mortgage-Backed | | | | | |
| Securities (continued) | | | | | |
| Benchmark Mortgage | | | | | |
| | Trust | | | | | |
| | Series 2020-B21 A5 | | | | | |
| | 1.978% 12/17/53 | | 650,000 | | $ | 626,628 |
| | Series 2020-B22 A5 | | | | | |
| | 1.973% 1/15/54 | | 650,000 | | | 624,656 |
| | Series 2021-B24 A5 | | | | | |
| | 2.584% 3/15/54 | | 5,990,000 | | | 6,064,048 |
| Cantor Commercial Real | | | | | |
| | Estate Lending | | | | | |
| | Series 2019-CF1 A5 | | | | | |
| | 3.786% 5/15/52 | | 2,340,000 | | | 2,579,406 |
| | Series 2019-CF2 A5 | | | | | |
| | 2.874% 11/15/52 | | 4,000,000 | | | 4,175,101 |
| | Series 2019-CF3 A4 | | | | | |
| | 3.006% 1/15/53 | | 800,000 | | | 845,635 |
| CD Mortgage Trust | | | | | |
| | Series 2017-CD6 B | | | | | |
| | 3.911% 11/13/50 ● | | 440,000 | | | 466,902 |
| | Series 2019-CD8 A4 | | | | | |
| | 2.912% 8/15/57 | | 8,775,000 | | | 9,106,449 |
| CFCRE Commercial | | | | | |
| | Mortgage Trust | | | | | |
| | Series 2016-C7 A3 | | | | | |
| | 3.839% 12/10/54 | | 3,100,000 | | | 3,415,024 |
| Citigroup Commercial | | | | | |
| | Mortgage Trust | | | | | |
| | Series 2014-GC25 A4 | | | | | |
| | 3.635% 10/10/47 | | 785,000 | | | 849,493 |
| | Series 2015-GC27 A5 | | | | | |
| | 3.137% 2/10/48 | | 1,400,000 | | | 1,494,363 |
| | Series 2016-P3 A4 | | | | | |
| | 3.329% 4/15/49 | | 1,305,000 | | | 1,405,705 |
| | Series 2017-C4 A4 | | | | | |
| | 3.471% 10/12/50 | | 635,000 | | | 692,239 |
| | Series 2019-C7 A4 | | | | | |
| | 3.102% 12/15/72 | | 6,450,000 | | | 6,824,928 |
| COMM Mortgage Trust | | | | | |
| | Series 2013-WWP A2 | | | | | |
| | 144A 3.424% | | | | | |
| | 3/10/31 # | | 1,100,000 | | | 1,155,432 |
| | Series 2014-CR20 AM | | | | | |
| | 3.938% 11/10/47 | | 2,225,000 | | | 2,397,329 |
| | Series 2015-3BP A | | | | | |
| | 144A 3.178% | | | | | |
| | 2/10/35 # | | 605,000 | | | 642,213 |
| | Series 2015-CR23 A4 | | | | | |
| | 3.497% 5/10/48 | | 780,000 | | | 847,439 |
| | Series 2016-CR28 A4 | | | | | |
| | 3.762% 2/10/49 | | 2,330,000 | | | 2,566,124 |
| DB-JPM Mortgage Trust | | | | | |
| | Series 2016-C1 A4 | | | | | |
| | 3.276% 5/10/49 | | 900,000 | | | 967,691 |
| GS Mortgage Securities | | | | | |
| | Trust | | | | | |
| | Series 2015-GC32 A4 | | | | | |
| | 3.764% 7/10/48 | | 1,000,000 | | | 1,096,491 |
| | Series 2017-GS5 A4 | | | | | |
| | 3.674% 3/10/50 | | 1,280,000 | | | 1,410,476 |
| | Series 2017-GS6 A3 | | | | | |
| | 3.433% 5/10/50 | | 1,935,000 | | | 2,101,834 |
| | Series 2018-GS9 A4 | | | | | |
| | 3.992% 3/10/51 ● | | 570,000 | | | 637,968 |
| | Series 2019-GC39 A4 | | | | | |
| | 3.567% 5/10/52 | | 1,250,000 | | | 1,365,384 |
| | Series 2019-GC42 A4 | | | | | |
| | 3.001% 9/1/52 | | 5,000,000 | | | 5,265,816 |
| | Series 2020-GC47 A5 | | | | | |
| | 2.377% 5/12/53 | | 716,000 | | | 717,459 |
| JPM-BB Commercial | | | | | |
| | Mortgage Securities | | | | | |
| | Trust | | | | | |
| | Series 2015-C31 A3 | | | | | |
| | 3.801% 8/15/48 | | 8,967,272 | | | 9,794,641 |
| | Series 2015-C33 A4 | | | | | |
| | 3.77% 12/15/48 | | 570,000 | | | 627,438 |
| JPM-DB Commercial | | | | | |
| | Mortgage Securities | | | | | |
| | Trust | | | | | |
| | Series 2016-C2 A4 | | | | | |
| | 3.144% 6/15/49 | | 1,640,000 | | | 1,749,638 |
| | Series 2016-C4 A3 | | | | | |
| | 3.141% 12/15/49 | | 1,065,000 | | | 1,144,836 |
| | Series 2017-C7 A5 | | | | | |
| | 3.409% 10/15/50 | | 2,395,000 | | | 2,604,036 |
| JPMorgan Chase | | | | | |
| | Commercial Mortgage | | | | | |
| | Securities Trust | | | | | |
| | Series 2013-LC11 B | | | | | |
| | 3.499% 4/15/46 | | 355,000 | | | 354,039 |
| | Series 2016-JP2 AS | | | | | |
| | 3.056% 8/15/49 | | 1,250,000 | | | 1,305,670 |
| | Series 2016-WIKI A | | | | | |
| | 144A 2.798% | | | | | |
| | 10/5/31 # | | 705,000 | | | 706,960 |
| | Series 2016-WIKI B | | | | | |
| | 144A 3.201% | | | | | |
| | 10/5/31 # | | 690,000 | | | 691,903 |
| LB-UBS Commercial | | | | | |
| | Mortgage Trust | | | | | |
| | Series 2006-C6 AJ | | | | | |
| | 5.452% 9/15/39 ● | | 420,352 | | | 243,603 |
72
Table of Contents
| | | | Principal | | | |
| | | | | amount° | | Value (US $) |
| Non-Agency Commercial Mortgage-Backed | | | | | |
| Securities (continued) | | | | | |
| Morgan Stanley Bank of | | | | | |
| | America Merrill Lynch | | | | | |
| | Trust | | | | | |
| | Series 2015-C26 A5 | | | | | |
| | 3.531% 10/15/48 | | 960,000 | | $ | 1,050,935 |
| | Series 2015-C27 ASB | | | | | |
| | 3.557% 12/15/47 | | 2,043,858 | | | 2,161,830 |
| | Series 2016-C29 A4 | | | | | |
| | 3.325% 5/15/49 | | 1,445,000 | | | 1,559,154 |
| Morgan Stanley Capital I | | | | | |
| | Trust | | | | | |
| | Series 2014-CPT AM | | | | | |
| | 144A 3.402% | | | | | |
| | 7/13/29 #, ● | | 2,200,000 | | | 2,199,749 |
| | Series 2019-L3 A4 | | | | | |
| | 3.127% 11/15/52 | | 1,000,000 | | | 1,054,702 |
| UBS-Barclays | | | | | |
| | Commercial Mortgage | | | | | |
| | Trust | | | | | |
| | Series 2013-C5 B | | | | | |
| | 144A 3.649% | | | | | |
| | 3/10/46 #, ● | | 480,000 | | | 487,326 |
| Wells Fargo Commercial | | | | | |
| | Mortgage Trust | | | | | |
| | Series 2014-LC18 A5 | | | | | |
| | 3.405% 12/15/47 | | 275,000 | | | 297,079 |
| | Series 2015-NXS3 A4 | | | | | |
| | 3.617% 9/15/57 | | 510,000 | | | 558,290 |
| | Series 2016-BNK1 A3 | | | | | |
| | 2.652% 8/15/49 | | 1,220,000 | | | 1,281,658 |
| | Series 2017-C38 A5 | | | | | |
| | 3.453% 7/15/50 | | 905,000 | | | 985,324 |
| | Series 2020-C58 A4 | | | | | |
| | 2.092% 7/15/53 | | 2,300,000 | | | 2,233,263 |
| Total Non-Agency Commercial Mortgage- | | | | | |
| Backed Securities | | | | | |
| (cost $121,304,585) | | | | | 123,761,224 |
| | | | | | | |
| Loan Agreements – 3.15% | | | | | |
| Acrisure Tranche B | | | | | |
| | 3.703% (LIBOR03M | | | | | |
| | + 3.50%) 2/15/27 ● | | 411,379 | | | 407,162 |
| Advantage Sales & | | | | | |
| | Marketing 1st Lien | | | | | |
| | 6.00% (LIBOR03M + | | | | | |
| | 5.25%) 10/28/27 ● | | 1,381,538 | | | 1,381,661 |
| American Airlines | | | | | |
| | Tranche B 2.106% | | | | | |
| | (LIBOR01M + 2.00%) | | | | | |
| | 12/14/23 ● | | 519,013 | | | 495,807 |
| Applied Systems 1st Lien | | | | | |
| | 3.50% (LIBOR03M + | | | | | |
| | 3.00%) 9/19/24 ● | | 847,433 | | | 853,788 |
| Applied Systems 2nd | | | | | |
| | Lien 6.25% | | | | | |
| | (LIBOR03M + 5.50%) | | | | | |
| | 9/19/25 ● | | 2,110,000 | | | 2,125,825 |
| Aramark Services | | | | | |
| | Tranche B-3 1.859% | | | | | |
| | (LIBOR01M + 1.75%) | | | | | |
| | 3/11/25 ● | | 359,075 | | | 355,869 |
| Array Technologies | | | | | |
| | 3.75% (LIBOR01M + | | | | | |
| | 3.25%) 10/14/27 ● | | 811,391 | | | 811,898 |
| Aruba Investments | | | | | |
| | Holdings 1st Lien | | | | | |
| | 4.75% (LIBOR03M + | | | | | |
| | 4.00%) 11/24/27 ● | | 355,000 | | | 356,331 |
| Aruba Investments | | | | | |
| | Holdings 2nd Lien | | | | | |
| | 8.50% (LIBOR03M + | | | | | |
| | 7.75%) 11/24/28 ● | | 355,000 | | | 358,550 |
| AssuredPartners 3.609% | | | | | |
| | (LIBOR01M + 3.50%) | | | | | |
| | 2/12/27 ● | | 945,470 | | | 936,162 |
| Avantor Tranche B-4 | | | | | |
| | 3.25% (LIBOR01M + | | | | | |
| | 2.25%) 11/8/27 ● | | 832,913 | | | 834,266 |
| Ball Metalpack Finco | | | | | |
| | 2nd Lien 9.75% | | | | | |
| | (LIBOR03M + 8.75%) | | | | | |
| | 7/31/26 ● | | 79,000 | | | 75,050 |
| Bausch Health 3.109% | | | | | |
| | (LIBOR01M + 3.00%) | | | | | |
| | 6/2/25 ● | | 268,192 | | | 267,599 |
| Berry Global Tranche Z | | | | | |
| | 1.898% (LIBOR03M | | | | | |
| | + 1.75%) 7/1/26 ● | | 689,741 | | | 684,299 |
| Blue Ribbon 1st Lien | | | | | |
| | 5.137% (LIBOR03M | | | | | |
| | + 3.00%) 11/15/21 ● | | 370,723 | | | 363,656 |
| Boxer Parent 3.859% | | | | | |
| | (LIBOR01M + 3.75%) | | | | | |
| | 10/2/25 ● | | 339,490 | | | 338,429 |
| Buckeye Partners Tranche | | | | | |
| | B 1st Lien 2.359% | | | | | |
| | (LIBOR03M + 2.25%) | | | | | |
| | 11/1/26 ● | | 304,206 | | | 302,959 |
| BW Gas & | | | | | |
| | Convenience Holdings | | | | | |
| | Tranche B TBD | | | | | |
| | 3/17/28 X | | 1,055,000 | | | 1,056,319 |
| BWay Holding 3.443% | | | | | |
| | (LIBOR03M + 3.25%) | | | | | |
| | 4/3/24 ● | | 154,783 | | | 151,577 |
73
Table of Contents
Schedules of investments
Optimum Fixed Income Fund
| | | | | | | Principal | | | |
| | | | | | amount° | | Value (US $) |
| Loan Agreements (continued) | | | | | | | |
| Caesars Resort | | | | | | | |
| | Collection Tranche B | | | | | | | |
| | TBD 12/23/24 X | | | | 1,600,000 | | $ | 1,577,000 |
| Caesars Resort | | | | | | | |
| | Collection Tranche | | | | | | | |
| | B-1 4.609% | | | | | | | |
| | (LIBOR01M + 4.50%) | | | | | | | |
| | 7/21/25 ● | | | | 2,192,025 | | | 2,199,011 |
| Calpine | | | | | | | |
| | 2.11% (LIBOR01M + | | | | | | | |
| | 2.00%) 4/5/26 ● | | | | 245,625 | | | 243,322 |
| | 2.61% (LIBOR01M + | | | | | | | |
| | 2.50%) 12/2/27 ● | | | | 258,178 | | | 257,026 |
| Camelot US Acquisition l | | | | | | | |
| | 4.00% (LIBOR01M + | | | | | | | |
| | 3.00%) 10/30/26 ● | | | | 648,375 | | | 648,375 |
| Carnival 8.50% | | | | | | | |
| | (LIBOR01M + 7.50%) | | | | | | | |
| | 6/30/25 ● | | | | 496,250 | | | 513,619 |
| CenturyLink Tranche B | | | | | | | |
| | 2.359% (LIBOR01M | | | | | | | |
| | + 2.25%) 3/15/27 ● | | | | 994,962 | | | 984,780 |
| Change Healthcare | | | | | | | |
| | Holdings 3.50% | | | | | | | |
| | (LIBOR01M + 2.50%) | | | | | | | |
| | 3/1/24 ● | | | | 180,312 | | | 180,290 |
| Charter Communications | | | | | | | |
| | Operating Tranche | | | | | | | |
| | B2 1.87% | | | | | | | |
| | (LIBOR01M + 1.75%) | | | | | | | |
| | 2/1/27 ● | | | | 483,625 | | | 481,721 |
| Chemours Tranche B-2 | | | | | | | |
| | 1.86% (LIBOR01M + | | | | | | | |
| | 1.75%) 4/3/25 ● | | | | 889,719 | | | 872,370 |
| CityCenter Holdings | | | | | | | |
| | 3.00% (LIBOR01M + | | | | | | | |
| | 2.25%) 4/18/24 ● | | | | 902,987 | | | 892,890 |
| Connect US Finco | | | | | | | |
| | 4.50% (LIBOR01M + | | | | | | | |
| | 3.50%) 12/11/26 ● | | | | 642,510 | | | 640,904 |
| Core & Main 3.75% | | | | | | | |
| | (LIBOR03M + 2.75%) | | | | | | | |
| | 8/1/24 ● | | | | 538,308 | | | 537,467 |
| Coty Tranche A TBD | | | | | | | |
| | 4/5/23 X | | | | 1,700,000 | | | 1,942,090 |
| CSC Holdings | | | | | | | |
| | 2.356% (LIBOR01M | | | | | | | |
| | + 2.25%) 7/17/25 ● | | | | 312,813 | | | 308,981 |
| | 2.606% (LIBOR01M | | | | | | | |
| | + 2.50%) 4/15/27 ● | | | | 288,399 | | | 285,593 |
| DaVita Tranche B-1 | | | | | | | |
| | 1.859% (LIBOR01M | | | | | | | |
| | + 1.75%) 8/12/26 ● | | | | 796,890 | | | 793,293 |
| EFS Cogen Holdings I | | | | | | | |
| | Tranche B 4.50% | | | | | | | |
| | (LIBOR03M + 3.50%) | | | | | | | |
| | 10/1/27 ● | | | | 648,398 | | | 647,066 |
| Ensemble RCM 3.962% | | | | | | | |
| | (LIBOR03M + 3.75%) | | | | | | | |
| | 8/3/26 ● | | | | 362,480 | | | 362,405 |
| Epicor Software | | | | | | | |
| | Tranche C 4.00% | | | | | | | |
| | (LIBOR01M + 3.25%) | | | | | | | |
| | 7/30/27 ● | | | | 1,328,325 | | | 1,326,526 |
| Epicor Software 2nd Lien | | | | | | | |
| | 8.75% (LIBOR01M + | | | | | | | |
| | 7.75%) 7/31/28 ● | | | | 735,000 | | | 761,950 |
| ESH Hospitality 2.109% | | | | | | | |
| | (LIBOR01M + 2.00%) | | | | | | | |
| | 9/18/26 ● | | | | 459,597 | | | 457,171 |
| ExamWorks Group | | | | | | | |
| | Tranche B-1 4.25% | | | | | | | |
| | (LIBOR03M + 3.25%) | | | | | | | |
| | 7/27/23 ● | | | | 718,153 | | | 718,859 |
| Frontier Communications | | | | | | | |
| | 5.75% (LIBOR01M + | | | | | | | |
| | 4.75%) 10/8/21 ● | | | | 1,370,000 | | | 1,374,281 |
| Garda World Security | | | | | | | |
| | Tranche B-2 4.25% | | | | | | | |
| | (LIBOR01M + 4.25%) | | | | | | | |
| | 10/30/26 ● | | | | 191,971 | | | 192,291 |
| Gardner Denver | | | | | | | |
| | Tranche B-1 1.859% | | | | | | | |
| | (LIBOR03M + 1.75%) | | | | | | | |
| | 3/1/27 ● | | | | 672,523 | | | 665,798 |
| Global Medical | | | | | | | |
| | Response 5.75% | | | | | | | |
| | (LIBOR03M + 4.75%) | | | | | | | |
| | 10/2/25 ● | | | | 2,019,937 | | | 2,016,465 |
| Granite US Holdings | | | | | | | |
| | Tranche B 4.203% | | | | | | | |
| | (LIBOR03M + 4.00%) | | | | | | | |
| | 9/30/26 ● | | | | 136,150 | | | 135,980 |
| Gray Television | | | | | | | |
| | Tranche B-2 2.365% | | | | | | | |
| | (LIBOR01M + 2.25%) | | | | | | | |
| | 2/7/24 ● | | | | 1,018,322 | | | 1,013,469 |
| Grupo Aeromexico | | | | | | | |
| | 9.00% (LIBOR03M + | | | | | | | |
| | 8.00%) 12/31/21 =, | | | | | | | |
| | ● | | | | 1,300,000 | | | 1,300,000 |
| | 13.50% (LIBOR03M | | | | | | | |
| | + 12.50%) | | | | | | | |
| | 8/19/22 =, ● | | | | 1,057,614 | | | 1,057,614 |
74
Table of Contents
| | | | | | | Principal | | | |
| | | | | | amount° | | Value (US $) |
| Loan Agreements (continued) | | | | | | | |
| Hamilton Projects | | | | | | | |
| | Acquiror 5.75% | | | | | | | |
| | (LIBOR03M + 4.75%) | | | | | | | |
| | 6/17/27 ● | | | | 1,870,863 | | $ | 1,879,281 |
| HCA Tranche B-12 | | | | | | | |
| | 1.859% (LIBOR01M | | | | | | | |
| | + 1.75%) 3/13/25 ● | | | | 1,285,548 | | | 1,286,955 |
| Heartland Dental | | | | | | | |
| | 3.609% (LIBOR01M | | | | | | | |
| | + 3.50%) 4/30/25 ● | | | | 830,732 | | | 818,848 |
| Hilton Worldwide | | | | | | | |
| | Finance Tranche B-2 | | | | | | | |
| | 1.868% (LIBOR01M | | | | | | | |
| | + 1.75%) 6/22/26 ● | | | | 1,172,387 | | | 1,163,154 |
| HUB International | | | | | | | |
| | 2.965% (LIBOR03M | | | | | | | |
| | + 2.75%) 4/25/25 ● | | | | 729,375 | | | 719,965 |
| Informatica 3.359% | | | | | | | |
| | (LIBOR01M + 3.25%) | | | | | | | |
| | 2/25/27 ● | | | | 1,304,134 | | | 1,295,576 |
| Informatica 2nd Lien | | | | | | | |
| | 7.125% 2/25/25 | | | | 1,018,000 | | | 1,043,026 |
| Invictus 1st Lien 3.109% | | | | | | | |
| | (LIBOR01M + 3.00%) | | | | | | | |
| | 3/28/25 ● | | | | 217,281 | | | 215,380 |
| IQVIA Tranche B-3 | | | | | | | |
| | 1.953% (LIBOR03M | | | | | | | |
| | + 1.75%) 6/11/25 ● | | | | 539,738 | | | 537,444 |
| IRB Holding 4.25% | | | | | | | |
| | (LIBOR03M + 3.25%) | | | | | | | |
| | 12/15/27 ● | | | | 2,493,750 | | | 2,491,301 |
| Iron Mountain | | | | | | | |
| | Information | | | | | | | |
| | Management | | | | | | | |
| | Tranche B 1.859% | | | | | | | |
| | (LIBOR01M + 1.75%) | | | | | | | |
| | 1/2/26 ● | | | | 617,388 | | | 610,056 |
| JBS USA LUX 2.109% | | | | | | | |
| | (LIBOR01M + 2.00%) | | | | | | | |
| | 5/1/26 ● | | | | 161,700 | | | 160,750 |
| Kenan Advantage Group | | | | | | | |
| | Tranche B TBD | | | | | | | |
| | 3/12/26 X | | | | 463,838 | | | 462,533 |
| LS Group OpCo | | | | | | | |
| | Acquisition 4.25% | | | | | | | |
| | (LIBOR03M + 3.50%) | | | | | | | |
| | 11/2/27 ● | | | | 837,900 | | | 840,693 |
| Milano Acquisition | | | | | | | |
| | Tranche B 4.75% | | | | | | | |
| | (LIBOR03M + 4.00%) | | | | | | | |
| | 10/1/27 ● | | | | 1,206,975 | | | 1,203,958 |
| Mileage Plus Holdings | | | | | | | |
| | 6.25% (LIBOR03M + | | | | | | | |
| | 5.25%) 6/21/27 ● | | | | 1,000,000 | | | 1,064,514 |
| Numericable US Tranche | | | | | | | |
| | B-11 2.859% | | | | | | | |
| | (LIBOR01M + 2.75%) | | | | | | | |
| | 7/31/25 ● | | | | 348,229 | | | 341,845 |
| Numericable US Tranche | | | | | | | |
| | B-13 4.198% | | | | | | | |
| | (LIBOR03M + 4.00%) | | | | | | | |
| | 8/14/26 ● | | | | 131,963 | | | 131,715 |
| ON Semiconductor | | | | | | | |
| | Tranche B-4 2.109% | | | | | | | |
| | (LIBOR01M + 2.00%) | | | | | | | |
| | 9/19/26 ● | | | | 1,274,770 | | | 1,273,895 |
| Penn National Gaming | | | | | | | |
| | Tranche B-1 3.00% | | | | | | | |
| | (LIBOR01M + 2.25%) | | | | | | | |
| | 10/15/25 ● | | | | 875,617 | | | 872,772 |
| Peraton Tranche B 1st | | | | | | | |
| | Lien 4.50% | | | | | | | |
| | (LIBOR03M + 3.75%) | | | | | | | |
| | 2/1/28 ● | | | | 382,259 | | | 382,419 |
| PG&E Tranche B 3.50% | | | | | | | |
| | (LIBOR03M + 3.00%) | | | | | | | |
| | 6/23/25 ● | | | | 1,960,188 | | | 1,961,413 |
| PQ 4.00% (LIBOR03M + | | | | | | | |
| | 3.00%) 2/7/27 ● | | | | 410,862 | | | 411,632 |
| PQ Tranche B 2.462% | | | | | | | |
| | (LIBOR03M + 2.25%) | | | | | | | |
| | 2/8/27 ● | | | | 534,032 | | | 531,028 |
| Prestige Brands Tranche | | | | | | | |
| | B-4 2.115% | | | | | | | |
| | (LIBOR01M + 2.00%) | | | | | | | |
| | 1/26/24 ● | | | | 271,615 | | | 271,785 |
| Pretium PKG Holdings | | | | | | | |
| | 1st Lien 4.75% | | | | | | | |
| | (LIBOR06M + 4.00%) | | | | | | | |
| | 11/5/27 ● | | | | 598,500 | | | 598,750 |
| Prime Security Services | | | | | | | |
| | Borrower Tranche B-1 | | | | | | | |
| | 3.50% (LIBOR01M + | | | | | | | |
| | 2.75%) 9/23/26 ● | | | | 409,460 | | | 407,998 |
| RealPage TBD 2/18/28 X | | | | 1,000,000 | | | 996,458 |
| Reynolds Group | | | | | | | |
| | Holdings Tranche | | | | | | | |
| | B-2 3.359% | | | | | | | |
| | (LIBOR01M + 3.25%) | | | | | | | |
| | 2/5/26 ● | | | | 473,813 | | | 469,222 |
| RP Crown Parent | | | | | | | |
| | Tranche B-1 4.00% | | | | | | | |
| | (LIBOR01M + 3.00%) | | | | | | | |
| | 2/2/26 ● | | | | 972,650 | | | 974,474 |
| Russell Investments US | | | | | | | |
| | Institutional Holdco | | | | | | | |
| | 4.00% (LIBOR06M + | | | | | | | |
| | 3.00%) 5/30/25 ● | | | | 425,673 | | | 424,183 |
75
Table of Contents
Schedules of investments
Optimum Fixed Income Fund
| | | | | | | Principal | | | |
| | | | | | amount° | | Value (US $) |
| Loan Agreements (continued) | | | | | | | |
| Ryan Specialty Group | | | | | | | |
| | Tranche B-1 3.75% | | | | | | | |
| | (LIBOR01M + 3.00%) | | | | | | | |
| | 9/1/27 ● | | | | 592,025 | | $ | 593,505 |
| Scientific Games | | | | | | | |
| | International Tranche | | | | | | | |
| | B-5 2.859% | | | | | | | |
| | (LIBOR01M + 2.75%) | | | | | | | |
| | 8/14/24 ● | | | | 1,789,937 | | | 1,757,718 |
| Sinclair Television Group | | | | | | | |
| | Tranche B 2.36% | | | | | | | |
| | (LIBOR01M + 2.25%) | | | | | | | |
| | 1/3/24 ● | | | | 1,306,423 | | | 1,300,544 |
| Solenis International 1st | | | | | | | |
| | Lien 4.19% | | | | | | | |
| | (LIBOR03M + 4.00%) | | | | | | | |
| | 6/26/25 ● | | | | 579,019 | | | 578,114 |
| Spirit Aerosystems | | | | | | | |
| | 6.00% (LIBOR01M + | | | | | | | |
| | 5.25%) 1/15/25 ● | | | | 783,038 | | | 789,889 |
| SS&C Technologies | | | | | | | |
| | Tranche B-3 1.859% | | | | | | | |
| | (LIBOR01M + 1.75%) | | | | | | | |
| | 4/16/25 ● | | | | 221,136 | | | 219,201 |
| SS&C Technologies | | | | | | | |
| | Tranche B-4 1.859% | | | | | | | |
| | (LIBOR01M + 1.75%) | | | | | | | |
| | 4/16/25 ● | | | | 165,112 | | | 163,677 |
| Stars Group Holdings | | | | | | | |
| | 3.703% (LIBOR03M | | | | | | | |
| | + 3.50%) 7/10/25 ● | | | | 128,954 | | | 129,357 |
| Syncsort Tranche B 1st | | | | | | | |
| | Lien TBD 3/20/28 X | | | | 1,355,000 | | | 1,352,459 |
| Tecta America 4.609% | | | | | | | |
| | (LIBOR01M + 4.50%) | | | | | | | |
| | 11/20/25 ● | | | | 202,517 | | | 201,504 |
| Telenet Financing | | | | | | | |
| | Tranche AR 2.106% | | | | | | | |
| | (LIBOR01M + 2.00%) | | | | | | | |
| | 4/30/28 ● | | | | 545,000 | | | 538,911 |
| Terrier Media Buyer | | | | | | | |
| | Tranche B 3.609% | | | | | | | |
| | (LIBOR01M + 3.50%) | | | | | | | |
| | 12/17/26 ● | | | | 516,476 | | | 512,562 |
| Titan | | | | | | | |
| | Acquisition 3.267% | | | | | | | |
| | (LIBOR03M + 3.00%) | | | | | | | |
| | 3/28/25 ● | | | | 56,744 | | | 55,715 |
| Transdigm Tranche F | | | | | | | |
| | 2.359% (LIBOR01M | | | | | | | |
| | + 2.25%) 12/9/25 ● | | | | 591,701 | | | 580,136 |
| TricorBraun | | | | | | | |
| | 3.75% (LIBOR06M + | | | | | | | |
| | 3.25%) 3/3/28 ● | | | | 395,941 | | | 392,941 |
| TricorBraun | | | | | | | |
| | 3.75% (LIBOR06M + | | | | | | | |
| | 3.25%) 3/3/28 ● | | | | 2,969 | | | 2,948 |
| UKG 4.00% (LIBOR03M | | | | | | | |
| | + 3.25%) 5/4/26 ● | | | | 3,457,647 | | | 3,460,077 |
| Ultimate Software Group | | | | | | | |
| | 1st Lien 3.859% | | | | | | | |
| | (LIBOR01M + 3.75%) | | | | | | | |
| | 5/4/26 ● | | | | 1,956,609 | | | 1,956,474 |
| United Rentals (North | | | | | | | |
| | America) 1.859% | | | | | | | |
| | (LIBOR01M + 1.75%) | | | | | | | |
| | 10/31/25 ● | | | | 48,750 | | | 48,963 |
| US Foods 1.859% | | | | | | | |
| | (LIBOR01M + 1.75%) | | | | | | | |
| | 6/27/23 ● | | | | 3,290,508 | | | 3,251,907 |
| USI 3.453% (LIBOR03M | | | | | | | |
| | + 3.25%) 12/2/26 ● | | | | 165,604 | | | 164,185 |
| USI Tranche B 3.203% | | | | | | | |
| | (LIBOR03M + 3.00%) | | | | | | | |
| | 5/16/24 ● | | | | 1,407,251 | | | 1,392,802 |
| USIC Holdings Tranche B | | | | | | | |
| | 4.00% (LIBOR01M + | | | | | | | |
| | 3.00%) 12/8/23 ● | | | | 473,861 | | | 472,578 |
| Vertical Midco Tranche B | | | | | | | |
| | 4.478% (LIBOR03M | | | | | | | |
| | + 4.25%) 7/30/27 ● | | | | 1,181,436 | | | 1,185,374 |
| Vistra Operations 1.86% | | | | | | | |
| | (LIBOR01M + 1.75%) | | | | | | | |
| | 12/31/25 ● | | | | 518,690 | | | 515,648 |
| Whole Earth Brands | | | | | | | |
| | 5.50% (LIBOR03M + | | | | | | | |
| | 4.50%) 2/2/28 ● | | | | 680,000 | | | 676,600 |
| Zayo Group Holdings | | | | | | | |
| | TBD 3/9/27 X | | | | 3,300,000 | | | 3,277,755 |
| Zekelman Industries | | | | | | | |
| | 2.11% (LIBOR01M + | | | | | | | |
| | 2.00%) 1/24/27 ● | | | | 271,817 | | | 268,816 |
| Total Loan Agreements | | | | | | | |
| (cost $88,613,861) | | | | | | | 89,229,197 |
| | | | | | | | | | |
| Regional Bond — 0.08%Δ | | | | | | | |
| Spain — 0.08% | | | | | | | |
| Autonomous Community | | | | | | | |
| | of Catalonia | | | | | | | |
| | 4.90% 9/15/21 | | EUR | | 1,800,000 | | | 2,160,993 |
| | | | | | | | | 2,160,993 |
| Total Regional Bond | | | | | | | |
| (cost $2,011,841) | | | | | | | 2,160,993 |
76
Table of Contents
| | | | | | | Principal | | | |
| | | | | | amount° | | Value (US $) |
| Sovereign Bonds – 3.42%Δ | | | | | | | |
| Albania – 0.01% | | | | | | | |
| Albania Government | | | | | | | |
| | International Bond | | | | | | | |
| | 144A 3.50% | | | | | | | |
| | 6/16/27 # | | EUR | | 150,000 | | $ | 187,710 |
| | | | | | | | | 187,710 |
| Angola – 0.01% | | | | | | | |
| Angolan Government | | | | | | | |
| | International Bonds | | | | | | | |
| | 144A 8.25% 5/9/28 | | | | | | | |
| | # | | | | 200,000 | | | 192,470 |
| | 8.25% 5/9/28 | | | | 200,000 | | | 192,470 |
| | | | | | | | | 384,940 |
| Argentina – 0.01% | | | | | | | |
| Argentine Republic | | | | | | | |
| | Government | | | | | | | |
| | International Bonds | | | | | | | |
| | 0.125% 7/9/30 ~ | | | | 645,050 | | | 217,092 |
| | 0.125% 7/9/35 ~ | | | | 674,580 | | | 202,718 |
| | 1.00% 7/9/29 | | | | 57,007 | | | 20,551 |
| | | | | | | | | 440,361 |
| Armenia – 0.01% | | | | | | | |
| Republic of Armenia | | | | | | | |
| | International Bond | | | | | | | |
| | 144A 3.60% | | | | | | | |
| | 2/2/31 # | | | | 200,000 | | | 183,928 |
| | | | | | | | | 183,928 |
| Azerbaijan – 0.01% | | | | | | | |
| Republic of Azerbaijan | | | | | | | |
| | International Bond | | | | | | | |
| | 144A 3.50% | | | | | | | |
| | 9/1/32 # | | | | 319,000 | | | 316,125 |
| | | | | | | | | 316,125 |
| Bahrain – 0.01% | | | | | | | |
| Bahrain Government | | | | | | | |
| | International Bond | | | | | | | |
| | 144A 7.375% | | | | | | | |
| | 5/14/30 # | | | | 300,000 | | | 334,140 |
| | | | | | | | | 334,140 |
| Bermuda – 0.01% | | | | | | | |
| Bermuda Government | | | | | | | |
| | International Bond | | | | | | | |
| | 144A 2.375% | | | | | | | |
| | 8/20/30 # | | | | 200,000 | | | 196,500 |
| | | | | | | | | 196,500 |
| Brazil – 0.81% | | | | | | | |
| Brazil Letras do Tesouro | | | | | | | |
| | Nacional | | | | | | | |
| | 3.666% 10/1/21 ^ | | BRL | | 47,200,000 | | | 8,219,555 |
| | 4.071% 1/1/22 ^ | | BRL | | 82,700,000 | | | 14,203,345 |
| Brazilian Government | | | | | |
| | International Bonds | | | | | |
| | 3.875% 6/12/30 | | | | 223,000 | | | 216,725 |
| | 4.75% 1/14/50 | | | | 233,000 | | | 212,163 |
| | | | | | | | | 22,851,788 |
| Chile – 0.02% | | | | | | | |
| Chile Government | | | | | | | |
| | International Bonds | | | | | |
| | 2.55% 1/27/32 | | | | 258,000 | | | 260,632 |
| | 3.50% 1/25/50 | | | | 200,000 | | | 204,140 |
| | | | | | | | | 464,772 |
| Colombia – 0.02% | | | | | | | |
| Colombia Government | | | | | |
| | International Bonds | | | | | |
| | 3.00% 1/30/30 | | | | 272,000 | | | 266,899 |
| | 4.00% 2/26/24 | | | | 202,000 | | | 215,034 |
| | 5.00% 6/15/45 | | | | 200,000 | | | 213,832 |
| | | | | | | | | 695,765 |
| Cyprus – 0.05% | | | | | | | |
| Cyprus Government | | | | | | | |
| | International Bond | | | | | |
| | 3.875% 5/6/22 | | EUR | | 1,200,000 | | | 1,472,976 |
| | | | | | | | | 1,472,976 |
| Dominican Republic – 0.05% | | | | | |
| Dominican Republic | | | | | | | |
| | International Bonds | | | | | |
| | 144A 4.50% 1/30/30 | | | | | |
| | # | | | | 367,000 | | | 371,587 |
| | 144A 4.875% | | | | | | | |
| | 9/23/32 # | | | | 450,000 | | | 460,125 |
| | 144A 6.00% 7/19/28 | | | | | |
| | # | | | | 435,000 | | | 491,115 |
| | | | | | | | | 1,322,827 |
| Ecuador – 0.01% | | | | | | | |
| Ecuador Government | | | | | | | |
| | International Bonds | | | | | |
| | 144A 0.50% 7/31/30 | | | | | |
| | #, ~ | | | | 125,307 | | | 73,619 |
| | 144A 0.50% 7/31/35 | | | | | |
| | #, ~ | | | | 328,384 | | | 151,057 |
| | 144A 0.50% 7/31/40 | | | | | |
| | #, ~ | | | | 278,501 | | | 121,148 |
| | 144A 6.61% 7/31/30 | | | | | |
| | #, ^ | | | | 35,470 | | | 14,366 |
| | | | | | | | | 360,190 |
77
Table of Contents
Schedules of investments
Optimum Fixed Income Fund
| | | | | | | Principal | | | |
| | | | | | amount° | | | Value (US $) |
| Sovereign Bonds Δ(continued) | | | |
| Egypt – 0.14% | | | | | | | |
| Egypt Government | | | | | | | |
| | International Bonds | | | | | | | |
| | 144A 5.577% | | | | | | | |
| | 2/21/23 # | | | | 2,620,000 | | $ | 2,733,197 |
| | 144A 5.75% 5/29/24 | | | | | | | |
| | # | | | | 591,000 | | | 621,443 |
| | 7.903% 2/21/48 | | | | 400,000 | | | 377,786 |
| | 144A 8.70% 3/1/49 | | | | | | | |
| | # | | | | 359,000 | | | 360,893 |
| | | | | | | | | 4,093,319 |
| El Salvador – 0.01% | | | | | | | |
| El Salvador Government | | | | | | | |
| | International Bond | | | | | | | |
| | 144A 7.125% | | | | | | | |
| | 1/20/50 # | | | | 275,000 | | | 246,813 |
| | | | | | | | | 246,813 |
| Gabon – 0.01% | | | | | | | |
| Gabon Government | | | | | | | |
| | International Bond | | | | | | | |
| | 144A 6.625% | | | | | | | |
| | 2/6/31 # | | | | 200,000 | | | 193,761 |
| | | | | | | | | 193,761 |
| Ghana – 0.01% | | | | | | | |
| Ghana Government | | | | | | | |
| | International Bond | | | | | | | |
| | 144A 7.75% | | | | | | | |
| | 4/7/29 # | | | | 230,000 | | | 228,275 |
| | | | | | | | | 228,275 |
| Guatemala – 0.02% | | | | | | | |
| Guatemala Government | | | | | | | |
| | Bond | | | | | | | |
| | 144A 4.875% | | | | | | | |
| | 2/13/28 # | | | | 400,000 | | | 442,000 |
| | | | | | | | | 442,000 |
| Honduras – 0.01% | | | | | | | |
| Honduras Government | | | | | | | |
| | International Bond | | | | | | | |
| | 144A 5.625% | | | | | | | |
| | 6/24/30 # | | | | 300,000 | | | 315,000 |
| | | | | | | | | 315,000 |
| Indonesia – 0.10% | | | | | | | |
| Indonesia Government | | | | | | | |
| | International Bond | | | | | | | |
| | 144A 4.625% | | | | | | | |
| | 4/15/43 # | | | | 200,000 | | | 222,462 |
| Indonesia Treasury Bond | | | | | | | |
| | 6.125% 5/15/28 | | IDR | | 40,390,000,000 | | | 2,700,110 |
| | | | | | | | | 2,922,572 |
| Israel – 0.54% | | | | | | | |
| Israel Government Bonds | | | | | | | |
| | 0.05% 11/30/21 ● | | ILS | | 8,900,000 | | | 2,662,333 |
| | 5.50% 1/31/22 | | ILS | | 10,300,000 | | | 3,222,263 |
| Israel Government | | | | | | | |
| | International Bonds | | | | | | | |
| | 2.75% 7/3/30 | | | | 1,200,000 | | | 1,258,554 |
| | 3.875% 7/3/50 | | | | 200,000 | | | 220,404 |
| Israel Treasury Bill | | | | | | | |
| | 0.00% 11/30/21 ^ | | ILS | | 5,300,000 | | | 1,585,830 |
| Makam Treasury Bills | | | | | | | |
| | 0.00% 6/2/21 ^ | | ILS | | 1,300,000 | | | 388,919 |
| | 0.00% 3/2/22 ^ | | ILS | | 13,700,000 | | | 4,118,073 |
| State of Israel | | | | | | | |
| | 3.375% 1/15/50 | | | | 200,000 | | | 202,500 |
| | 3.80% 5/13/60 | | | | 1,600,000 | | | 1,719,000 |
| | | | | | | | | 15,377,876 |
| Ivory Coast – 0.02% | | | | | | | |
| Ivory Coast Government | | | | | | | |
| | International Bond | | | | | | | |
| | 144A 6.125% | | | | | | | |
| | 6/15/33 # | | | | 590,000 | | | 604,779 |
| | | | | | | | | 604,779 |
| Jordan – 0.01% | | | | | | | |
| Jordan Government | | | | | | | |
| | International Bond | | | | | | | |
| | 144A 4.95% | | | | | | | |
| | 7/7/25 # | | | | 200,000 | | | 206,114 |
| | | | | | | | | 206,114 |
| Kazakhstan – 0.01% | | | | | | | |
| Kazakhstan Government | | | | | | | |
| | International Bond | | | | | | | |
| | 144A 6.50% | | | | | | | |
| | 7/21/45 # | | | | 207,000 | | | 294,267 |
| | | | | | | | | 294,267 |
| Kenya – 0.01% | | | | | | | |
| Kenya Government | | | | | | | |
| | International Bond | | | | | | | |
| | 144A 8.00% | | | | | | | |
| | 5/22/32 # | | | | 200,000 | | | 212,909 |
| | | | | | | | | 212,909 |
| Kuwait – 0.12% | | | | | | | |
| Kuwait International | | | | | | | |
| | Government Bond | | | | | | | |
| | 2.75% 3/20/22 | | | | 3,400,000 | | | 3,477,248 |
| | | | | | | | | 3,477,248 |
78
Table of Contents
| | | | | | Principal | | | |
| | | | | | amount° | | Value (US $) |
| Sovereign Bonds Δ(continued) | | | | |
| Lebanon – 0.00% | | | | | | | |
| | Lebanon Government | | | | | | | |
| | International Bond | | | | | | | |
| | 6.25% 5/27/22 ‡ | | | | 582,000 | | $ | 71,514 |
| | | | | | | | | 71,514 |
| Malaysia – 0.10% | | | | | | | |
| Malaysia Government | | | | | | | |
| | Bond | | | | | | | |
| | 3.955% 9/15/25 | | MYR | | 10,859,000 | | | 2,759,807 |
| | | | | | | | | 2,759,807 |
| Mexico – 0.02% | | | | | | | |
| Mexico Government | | | | | | | |
| | International Bond | | | | | | | |
| | 4.60% 2/10/48 | | | | 458,000 | | | 470,803 |
| | | | | | | | | 470,803 |
| Mongolia – 0.01% | | | | | | | |
| Mongolia Government | | | | | | | |
| | International Bond | | | | | | | |
| | 144A 5.625% | | | | | | | |
| | 5/1/23 # | | | | 306,000 | | | 320,865 |
| | | | | | | | | 320,865 |
| Morocco – 0.02% | | | | | | | |
| Morocco Government | | | | | | | |
| | International Bonds | | | | | | | |
| | 144A 1.375% | | | | | | | |
| | 3/30/26 # | | EUR | | 150,000 | | | 177,212 |
| | 144A 2.375% | | | | | | | |
| | 12/15/27 # | | | | 300,000 | | | 290,957 |
| | | | | | | | | 468,169 |
| Nigeria – 0.02% | | | | | | | |
| Nigeria Government | | | | | | | |
| | International Bond | | | | | | | |
| | 144A 7.875% | | | | | | | |
| | 2/16/32 # | | | | 537,000 | | | 554,589 |
| | | | | | | | | 554,589 |
| North Macedonia – 0.01% | | | | | |
| North Macedonia | | | | | | | |
| | Government | | | | | | | |
| | International Bond | | | | | | | |
| | 144A 3.675% | | | | | | | |
| | 6/3/26 # | | EUR | | 150,000 | | | 193,270 |
| | | | | | | | | 193,270 |
| Oman – 0.01% | | | | | | | |
| Oman Government | | | | | | | |
| | International Bond | | | | | | | |
| | 144A 6.75% | | | | | | | |
| | 1/17/48 # | | | | 343,000 | | | 328,395 |
| | | | | | | | | 328,395 |
| Panama – 0.04% | | | | | | | |
| Panama Government | | | | | | | |
| | International Bonds | | | | |
| | 3.16% 1/23/30 | | | | 452,000 | | | 471,054 |
| | 144A 3.75% 4/17/26 | | | | |
| | # | | | | 580,000 | | | 623,712 |
| | | | | | | | | 1,094,766 |
| Paraguay – 0.16% | | | | | | | |
| Paraguay Government | | | | |
| | International Bonds | | | | |
| | 144A 4.95% 4/28/31 | | | | |
| | # | | | | 3,600,000 | | | 4,086,036 |
| | 144A 5.40% 3/30/50 | | | | |
| | # | | | | 403,000 | | | 455,999 |
| | | | | | | | | 4,542,035 |
| Peru – 0.02% | | | | | | | |
| Peruvian Government | | | | |
| | International Bonds | | | | |
| | 2.844% 6/20/30 | | | | 512,000 | | | 521,098 |
| | 5.625% 11/18/50 | | | | 35,000 | | | 46,452 |
| | | | | | | | | 567,550 |
| Philippines – 0.01% | | | | | | | |
| Philippine Government | | | | |
| | International Bond | | | | |
| | 2.457% 5/5/30 | | | | 300,000 | | | 303,975 |
| | | | | | | | | 303,975 |
| Qatar – 0.15% | | | | | | | |
| Qatar Government | | | | | | | |
| | International Bonds | | | | |
| | 144A 3.40% 4/16/25 | | | | |
| | # | | | | 200,000 | | | 217,625 |
| | 144A 4.00% 3/14/29 | | | | |
| | # | | | | 725,000 | | | 824,811 |
| | 144A 4.40% 4/16/50 | | | | |
| | # | | | | 400,000 | | | 465,230 |
| | 5.103% 4/23/48 | | | | 2,200,000 | | | 2,787,919 |
| | | | | | | | | 4,295,585 |
| Republic of Vietnam – 0.01% | | | | |
| Vietnam Government | | | | | | | |
| | International Bond | | | | |
| | 144A 4.80% | | | | | | | |
| | 11/19/24 # | | | | 200,000 | | | 224,479 |
| | | | | | | | | 224,479 |
| Romania – 0.10% | | | | | | | |
| Romanian Government | | | | |
| | International Bonds | | | | |
| | 144A 2.625% | | | | | | | |
| | 12/2/40 # | | EUR | | 123,000 | | | 143,424 |
| | 144A 3.00% 2/14/31 | | | | |
| | # | | | | 2,410,000 | | | 2,415,410 |
79
Table of Contents
Schedules of investments
Optimum Fixed Income Fund
| | | | | | Principal | | | |
| | | | | | amount° | | Value (US $) |
| Sovereign Bonds Δ(continued) | | | | | |
| Romania (continued) | | | | | | | |
| | Romanian Government | | | | | | | |
| | International Bonds | | | | | | | |
| | 144A 3.375% | | | | | | | |
| | 1/28/50 # | | EUR | | 223,000 | | $ | 274,617 |
| | | | | | | | | 2,833,451 |
| Russia – 0.04% | | | | | | | |
| Russian Foreign Bond - | | | | | | | |
| | Eurobonds | | | | | | | |
| | 144A 4.25% 6/23/27 | | | | | | | |
| | # | | | | 600,000 | | | 657,827 |
| | 144A 4.375% | | | | | | | |
| | 3/21/29 # | | | | 200,000 | | | 219,102 |
| | 144A 5.25% 6/23/47 | | | | | | | |
| | # | | | | 200,000 | | | 237,825 |
| | | | | | | | | 1,114,754 |
| Saudi Arabia – 0.36% | | | | | | | |
| Saudi Government | | | | | | | |
| | International Bonds | | | | | | | |
| | 2.375% 10/26/21 | | | | 1,000,000 | | | 1,011,100 |
| | 144A 2.875% 3/4/23 | | | | | | | |
| | # | | | | 2,200,000 | | | 2,289,672 |
| | 144A 2.90% | | | | | | | |
| | 10/22/25 # | | | | 200,000 | | | 212,360 |
| | 144A 3.625% 3/4/28 | | | | | | | |
| | # | | | | 741,000 | | | 806,723 |
| | 4.50% 10/26/46 | | | | 800,000 | | | 882,468 |
| | 144A 4.50% | | | | | | | |
| | 10/26/46 # | | | | 800,000 | | | 882,468 |
| | 144A 5.00% 4/17/49 | | | | | | | |
| | # | | | | 3,500,000 | | | 4,153,069 |
| | | | | | | | | 10,237,860 |
| Senegal – 0.01% | | | | | | | |
| Senegal Government | | | | | | | |
| | International Bond | | | | | | | |
| | 144A 6.75% | | | | | | | |
| | 3/13/48 # | | | | 210,000 | | | 200,327 |
| | | | | | | | | 200,327 |
| Serbia – 0.01% | | | | | | | |
| Serbia International | | | | | | | |
| | Bonds | | | | | | | |
| | 144A 2.125% | | | | | | | |
| | 12/1/30 # | | | | 200,000 | | | 184,920 |
| | 144A 3.125% | | | | | | | |
| | 5/15/27 # | | EUR | | 100,000 | | | 130,117 |
| | | | | | | | | 315,037 |
| South Africa – 0.12% | | | | |
| Republic of South Africa | | | | | |
| | Government | | | | | | | |
| | International Bonds | | | | | |
| | 4.85% 9/30/29 | | | | 3,000,000 | | | 3,026,040 |
| | 5.75% 9/30/49 | | | | 200,000 | | | 184,661 |
| | 5.875% 6/22/30 | | | | 268,000 | | | 287,521 |
| | | | | | | | | 3,498,222 |
| Sri Lanka – 0.01% | | | | | | | |
| Sri Lanka Government | | | | | |
| | International Bond | | | | | |
| | 144A 6.20% | | | | | | | |
| | 5/11/27 # | | | | 453,000 | | | 279,542 |
| | | | | | | | | 279,542 |
| Trinidad and Tobago – 0.01% | | | | | |
| Trinidad & Tobago | | | | | | | |
| | Government | | | | | | | |
| | International Bond | | | | | |
| | 144A 4.50% | | | | | | | |
| | 6/26/30 # | | | | 200,000 | | | 202,752 |
| | | | | | | | | 202,752 |
| Turkey – 0.02% | | | | | | | |
| Turkey Government | | | | | | | |
| | International Bonds | | | | | |
| | 5.75% 5/11/47 | | | | 200,000 | | | 163,015 |
| | 7.625% 4/26/29 | | | | 500,000 | | | 515,440 |
| | | | | | | | | 678,455 |
| Ukraine – 0.05% | | | | | | | |
| Ukraine Government | | | | | | | |
| | International Bonds | | | | | |
| | 144A 7.75% 9/1/26 | | | | | |
| | # | | | | 804,000 | | | 874,030 |
| | 144A 9.75% 11/1/28 | | | | | |
| | # | | | | 515,000 | | | 601,285 |
| | | | | | | | | 1,475,315 |
| United Kingdom – 0.00% | | | | | |
| United Kingdom Gilt | | | | | | | |
| | 1.75% 9/7/22 | | GBP | | 100,000 | | | 141,263 |
| | | | | | | | | 141,263 |
| Uruguay – 0.05% | | | | | | | |
| Uruguay Government | | | | | |
| | International Bonds | | | | | |
| | 4.375% 1/23/31 | | | | 1,131,000 | | | 1,314,963 |
| | 4.50% 8/14/24 | | | | 57,000 | | | 61,846 |
| | | | | | | | | 1,376,809 |
80
Table of Contents
| | | | | | Principal | | | |
| | | | | | | amount° | | Value (US $) |
| Sovereign Bonds Δ(continued) | | | | |
| Uzbekistan – 0.02% | | | | | | |
| Republic of Uzbekistan | | | | | |
| | Bond | | | | | | | |
| | 144A 5.375% | | | | | | | |
| | 2/20/29 # | | | | 448,000 | | $ | 491,133 |
| | | | | | | | | 491,133 |
| Total Sovereign Bonds | | | | |
| (cost $95,553,670) | | | | | 96,867,677 |
| | |
| Supranational Banks – 0.04% | | | | |
| Banco Latinoamericano | | | | |
| | de Comercio Exterior | | | | |
| | 144A 2.375% | | | | | | | |
| | 9/14/25 # | | | | 200,000 | | | 204,578 |
| Banque Ouest Africaine | | | | | |
| | de Developpement | | | | |
| | 144A 2.75% | | | | | | | |
| | 1/22/33 # | | EUR | | 200,000 | | | 242,337 |
| | 144A 4.70% | | | | | | | |
| | 10/22/31 # | | | | 301,000 | | | 321,639 |
| | 144A 5.00% | | | | | | | |
| | 7/27/27 # | | | | 406,000 | | | 450,047 |
| Total Supranational Banks | | | | | |
| (cost $1,139,214) | | | | | 1,218,601 |
| |
| US Treasury Obligations – 27.32% | | | |
| US Treasury Bonds | | | | | | |
| | 1.25% 5/15/50 | | | | 1,800,000 | | | 1,358,930 |
| | 1.375% 11/15/40 | | | | 14,345,000 | | | 12,206,698 |
| | 1.375% 8/15/50 | | | | 1,300,000 | | | 1,014,812 |
| | 1.625% 11/15/50 | | | | 21,825,000 | | | 18,193,185 |
| | 1.875% 2/15/41 | | | | 9,900,000 | | | 9,220,922 |
| | 1.875% 2/15/51 | | | | 20,105,000 | | | 17,846,330 |
| | 2.00% 2/15/50 | | | | 16,000,000 | | | 14,637,813 |
| | 2.50% 2/15/45 | | | | 37,100,000 | | | 37,889,826 |
| | 2.75% 8/15/42 | | | | 900,000 | | | 965,830 |
| | 2.75% 11/15/42 | | | | 1,400,000 | | | 1,500,953 |
| | 2.875% 5/15/43 | | | | 2,200,000 | | | 2,407,625 |
| | 2.875% 8/15/45 | | | | 16,700,000 | | | 18,241,488 |
| | 3.00% 5/15/47 | | | | 900,000 | | | 1,007,754 |
| | 3.00% 8/15/48 | | | | 3,770,000 | | | 4,232,119 |
| | 3.125% 5/15/48 | | | | 1,490,000 | | | 1,709,309 |
| US Treasury Inflation | | | | | |
| | Indexed Notes | | | | | | | |
| | 0.125% 7/15/30 | | | | 24,700,253 | | | 26,832,709 |
| | 0.875% 1/15/29 | | | | 9,634,428 | | | 11,055,633 |
| | 1.75% 1/15/28 | | | | 12,885,758 | | | 15,506,223 |
| | 2.375% 1/15/25 | | | | 9,436,564 | | | 11,057,953 |
| | 2.375% 1/15/27 | | | | 1,686,243 | | | 2,065,603 |
| | 2.50% 1/15/29 | | | | 36,551 | | | 46,796 |
| | US Treasury Notes | | | | | | | |
| | 0.50% 2/28/26 | | | | 19,200,000 | | | 18,826,500 |
| | 0.50% 4/30/27 | | | | 10,900,000 | | | 10,441,860 |
| | 0.50% 6/30/27 | | | | 12,900,000 | | | 12,313,705 |
| | 0.50% 10/31/27 | | | | 13,200,000 | | | 12,504,422 |
| | 0.625% 5/15/30 | | | | 10,300,000 | | | 9,375,414 |
| | 0.625% 8/15/30 | | | | 13,800,000 | | | 12,508,407 |
| | 0.75% 3/31/26 | | | | 41,665,000 | | | 41,305,314 |
| | 0.75% 1/31/28 | | | | 1,155,000 | | | 1,107,537 |
| | 0.875% 11/15/30 | | | | 16,600,000 | | | 15,355,000 |
| | 1.125% 8/31/21 ∞ | | | | 13,800,000 | | | 13,863,105 |
| | 1.125% 2/28/27 | | | | 16,900,000 | | | 16,856,760 |
| | 1.125% 2/15/31 | | | | 89,960,000 | | | 85,005,174 |
| | 1.25% 8/31/24 | | | | 25,600,000 | | | 26,270,500 |
| | 1.50% 1/31/27 | | | | 1,700,000 | | | 1,733,967 |
| | 1.50% 2/15/30 | | | | 24,700,000 | | | 24,401,864 |
| | 1.625% 9/30/26 | | | | 8,300,000 | | | 8,551,432 |
| | 1.625% 10/31/26 | | | | 12,900,000 | | | 13,277,174 |
| | 1.75% 12/31/26 | | | | 10,900,000 | | | 11,282,990 |
| | 1.875% 7/31/22 | | | | 39,700,000 | | | 40,636,674 |
| | 1.875% 8/31/24 ∞ | | | | 2,170,000 | | | 2,273,372 |
| | 2.00% 10/31/21 ∞ | | | | 1,600,000 | | | 1,618,219 |
| | 2.00% 11/30/22 ∞ | | | | 7,700,000 | | | 7,938,820 |
| | 2.00% 6/30/24 | | | | 7,700,000 | | | 8,091,768 |
| | 2.125% 3/31/24 ∞ | | | | 2,010,000 | | | 2,116,271 |
| | 2.125% 11/30/24 | | | | 11,130,000 | | | 11,767,584 |
| | 2.25% 11/15/24 | | | | 11,030,000 | | | 11,708,388 |
| | 2.25% 3/31/26 | | | | 24,500,000 | | | 26,088,193 |
| | 2.375% 2/29/24 | | | | 4,000,000 | | | 4,237,266 |
| | 2.375% 8/15/24 ∞ | | | | 1,820,000 | | | 1,937,482 |
| | 2.375% 4/30/26 | | | | 10,900,000 | | | 11,674,709 |
| | 2.50% 1/31/24 | | | | 2,790,000 | | | 2,962,141 |
| | 2.50% 2/28/26 | | | | 3,700,000 | | | 3,984,799 |
| | 2.625% 3/31/25 | | | | 12,700,000 | | | 13,694,420 |
| | 2.75% 7/31/23 | | | | 46,200,000 | | | 48,931,395 |
| | 2.875% 11/30/23 ∞ | | | | 2,500,000 | | | 2,672,803 |
| | 2.875% 7/31/25 | | | | 15,500,000 | | | 16,910,440 |
| | 2.875% 11/30/25 | | | | 8,100,000 | | | 8,858,584 |
| US Treasury Strip | | | | | |
| | Principal | | | | | | | |
| | 2.26% 5/15/44 ^ | | | | 4,290,000 | | | 2,443,166 |
| Total US Treasury Obligations | | | | | |
| (cost $782,607,543) | | | | | | 774,526,130 |
| | | | | | | |
| | | | | | Number of | | | |
| | | | | | shares | | | |
| Common Stock – 0.00% | | | | | |
| Century Communications =, † | | 1,975,000 | | | 0 |
| Total Common Stock | | | | | |
| (cost $59,790) | | | | | | 0 |
81
Table of Contents
Schedules of investments
Optimum Fixed Income Fund
| | | | | | Number of | | | |
| | | | | | | shares | | Value (US $) |
| Preferred Stock – 0.02% | | | | |
| General Electric 3.514% | | | | | |
| | (LIBOR03M + 3.33%) | | | | | |
| | **, ● | | | | 300,000 | | $ | 283,875 |
| USB Realty 144A | | | | | | | |
| | 1.388% | | | | | | | |
| | LIBOR03M + 1.147% | | | | | | |
| | #, **, ● | | | | 500,000 | | | 388,750 |
| Total Preferred Stock | | | | | | | |
| (cost $748,688) | | | | | | | 672,625 |
| | | |
| | | | | | Number of | | | |
| | | | | | contracts | | | |
| Options Purchased – 0.02% | | | | |
| Put Swaptions – 0.02% | | | | | | | |
| 10 yr IRS pay a fixed rate | | | | | |
| | 1.80% and receive a | | | | | |
| | floating rate based on | | | | | |
| | 3-month USD-ICE | | | | | | | |
| | LIBOR expiration date | | | | | |
| | 9/29/21, notional | | | | | |
| | amount | | | | | | | |
| | 53,460,000 (MSCI) | | | | 29,700,000 | | | 761,116 |
| Options Purchased | | | | | | |
| (premium paid $653,400) | | | | | 761,116 |
| | | |
| | | | | | | Number of | | | |
| | | | | | shares | | | |
| Short-Term Investments – 9.81% | | | |
| Money Market Mutual Funds – 4.29% | | | |
| BlackRock FedFund – | | | | | | |
| | Institutional Shares | | | | | |
| | (seven-day effective | | | | | |
| | yield 0.01%) | | | | 30,404,060 | | | 30,404,060 |
| Fidelity Investments | | | | | |
| | Money Market | | | | | | | |
| | Government Portfolio | | | | | |
| | – Class I (seven-day | | | | | | | |
| | effective yield 0.01%) | | 30,404,060 | | | 30,404,060 |
| GS Financial Square | | | | | | |
| | Government Fund – | | | | | |
| | Institutional Shares | | | | | | | |
| | (seven-day effective | | | | | | | |
| | yield 0.03%) | | | | 30,404,060 | | | 30,404,060 |
| Morgan Stanley | | | | | | | |
| | Government Portfolio | | | | | | | |
| | – Institutional Share | | | | | | | |
| | Class (seven-day | | | | | | | |
| | effective yield 0.00%) | | | | 30,404,060 | | $ | 30,404,060 |
| | | | | | | | | 121,616,240 |
| | |
| | | | | | Principal | | | |
| | | | | | amount° | | | |
| Repurchase Agreements – 3.89% | | | | |
| US Treasury repurchase | | | | | | |
| | agreement with J.P. | | | | | | | |
| | Morgan Securities | | | | | | | |
| | 0.01%, dated | | | | | | | |
| | 3/31/21, to be | | | | | | | |
| | repurchased 4/5/21, | | | | | | | |
| | repurchase price | | | | | | | |
| | $55,700,062 (collateralized | | | | | | |
| | by US government | | | | | | | |
| | obligation; 0.125% | | | | | | | |
| | 10/15/25; market | | | | | | | |
| | value $56,780,922) | | | | 55,700,000 | | | 55,700,000 |
| US Treasury repurchase | | | | | | |
| | agreement with J.P. | | | | | | | |
| | Morgan Securities | | | | | | | |
| | 0.02%, dated | | | | | | | |
| | 3/30/21, to be | | | | | | | |
| | repurchased 4/1/21, | | | | | | | |
| | repurchase price | | | | | | | |
| | $54,600,030 (collateralized | | | | | |
| | by US government | | | | | | | |
| | obligation; 3.33% | | | | | | | |
| | 11/15/44; market | | | | | | | |
| | value $55,594,721) | | | | 54,600,000 | | | 54,600,000 |
| | | | | | | | | 110,300,000 |
| US Treasury Obligation – 1.63%≠ | | | | | |
| US Treasury Bill 0.04% | | | | | | |
| | 9/23/21 | | | 46,200,000 | | | 46,194,669 |
| | | | | | | | | 46,194,669 |
| Total Short-Term Investments | | | | |
| (cost $278,107,257) | | | | | | 278,110,909 |
| Total Value of Securities Before Options | | | |
| Written–117.78% | | | | | | |
| (cost $3,302,519,207) | | | | | | 3,339,440,288 |
82
Table of Contents
| | | | Number of | | | | |
| | | | | contracts | | Value (US $) | |
| Options Written – (0.01%) | | | | | | |
| Equity Put Options – (0.00%) | | | | | |
| Fannie Mae strike price | | | | | | |
| | $98.45, expiration | | | | | | |
| | date 5/6/21, notional | | | | | | |
| | amount | | | | | | |
| | ($689,171,875) | | (7,000,000) | | $ | (27,974 | ) |
| | | | | | | (27,974 | ) |
| Futures Call Options – (0.00%) | | | | | |
| Euribor 3 yr Bonds strike | | | | | | |
| | price $99, expiration | | | | | | |
| | date 4/16/21, | | | | | | |
| | notional amount | | | | | | |
| | ($2,178,000,000) | | | | | | |
| | (Exchange-Traded) | | (22) | | | (138 | ) |
| | | | | | | (138 | ) |
| Futures Put Options – (0.00%) | | | | | |
| Euribor 3 yr Bonds strike | | | | | | |
| | price $98.50, | | | | | | |
| | expiration date | | | | | | |
| | 4/16/21, notional | | | | | | |
| | amount | | | | | | |
| | ($2,167,000,000) | | | | | | |
| | (Exchange-Traded) | | (22) | | | (7,013 | ) |
| | | | | | | (7,013 | ) |
| Put Swaptions – (0.01%) | | | | | |
| 10 yr IRS pay a fixed rate | | | | | | |
| | 2.30% and receive a | | | | | | |
| | floating rate based on | | | | | | |
| | 3-month USD-ICE | | | | | | |
| | LIBOR expiration date | | | | | | |
| | 9/29/21, notional | | | | | | |
| | amount | | | | | | |
| | (68,310,000) (MSCI) | | (29,700,000) | | | (259,209 | ) |
| CDX.ITRX.EUR 34 5 yr | | | | | |
| | strike price $0.75, | | | | | | |
| | expiration date | | | | | | |
| | 5/19/21, notional | | | | | | |
| | amount | | | | | | |
| | (13,425,000) (BNP) | | (17,900,000) | | | (4,295 | ) |
| CDX.ITRX.EUR 34 5 yr | | | | | |
| | strike price $0.80, | | | | | | |
| | expiration date | | | | | | |
| | 5/19/21, notional | | | | | | |
| | amount | | | | | | |
| | (3,200,000) (BNP) | | (4,000,000) | | | (829 | ) |
| CDX.NA.HY 35 5 yr | | | | | |
| | strike price $103, | | | | | | |
| | expiration date | | | | | | |
| | 5/19/21, notional | | | | | | |
| | amount | | | | | | |
| | (545,900,000) (CITI) | | (5,300,000) | | | (9,396 | ) |
| CDX.NA.IG 35 5 yr strike | | | | | |
| | price $0.80, | | | | | |
| | expiration date | | | | | |
| | 5/19/21, notional | | | | | | |
| | amount (21,280,000) | | | | | | |
| | (JPMCB) | | (26,600,000) | | | (4,647 | ) |
| | | | | | | (278,376 | ) |
| Total Options Written | | | | | |
| (premium received $363,005) | | | $ | (313,501 | ) |
| ° | Principal amount shown is stated in USD unless noted that the security is denominated in another currency. |
| ~ | Step-up bond that pays an initial coupon rate for the first period and then a higher coupon rate for the following periods. Stated rate in effect at March 31, 2021. |
| Δ | Securities have been classified by country of origin. |
| = | The value of this security was determined using significant unobservable inputs and is reported as a Level 3 security in the disclosure table located in Note 3 in “Notes to financial statements.” |
| X | This loan will settle after March 31, 2021, at which time the interest rate, based on the LIBOR and the agreed upon spread on trade date, will be reflected. |
| ‡ | Non-income producing security. Security is currently in default. |
| ** | Perpetual security with no stated maturity date. |
| > | PIK. 100% of the income received was in the form of cash. |
| * | PIK. 100% of the income received was in the form of principal. |
| ψ | Perpetual security. Maturity date represents next call date. |
| µ | Fixed to variable rate investment. The rate shown reflects the fixed rate in effect at March 31, 2021. Rate will reset at a future date. |
| ≠ | The rate shown is the effective yield at the time of purchase. |
| ◆ | Pass Through Agreement. Security represents the contractual right to receive a proportionate amount of underlying payments due to the counterparty pursuant to various agreements related to the rescheduling of obligations and the exchange of certain notes. |
| Σ | Interest only security. An interest only security is the interest only portion of a fixed income security, which is separated and sold individually from the principal portion of the security. |
83
Table of Contents
Schedules of investments
Optimum Fixed Income Fund
| ∧ | Zero-coupon security. The rate shown is the effective yield at the time of purchase. |
| Ω | Principal only security. A principal only security is the principal only portion of a fixed income security which is separated and sold individually from the interest portion of the security. |
| ● | Variable rate investment. Rates reset periodically. Rate shown reflects the rate in effect at March 31, 2021. For securities based on a published reference rate and spread, the reference rate and spread are indicated in their descriptions. The reference rate descriptions (i.e. LIBOR03M, LIBOR06M, etc.) used in this report are identical for different securities, but the underlying reference rates may differ due to the timing of the reset period. Certain variable rate securities are not based on a published reference rate and spread but are determined by the issuer or agent and are based on current market conditions, or for mortgage-backed securities, are impacted by the individual mortgages which are paying off over time. These securities do not indicate a reference rate and spread in their descriptions. |
| # | Security exempt from registration under Rule 144A of the Securities Act of 1933, as amended. At March 31, 2021, the aggregate value of Rule 144A securities was $566,394,447, which represents 19.98% of the Fund’s net assets. See Note 10 in “Notes to financial statements.” |
| ∞ | Fully or partially pledged as collateral for futures and swap contracts. |
| † | Non-income producing security. |
Unfunded Loan Commitments
The Fund may invest in floating rate loans. In connection with these investments, the Fund may also enter into unfunded corporate loan commitments (commitments). Commitments may obligate the Fund to furnish temporary financing to a borrower until permanent financing can be arranged. In connection with these commitments, the Fund earns a commitment fee, typically set as a percentage of the commitment amount. The following unfunded loan commitments were outstanding at March 31, 2021:
| Borrower | | Principal
Amount | | Commitment | | Value | | Unrealized
Appreciation
(Depreciation) |
| Peraton TBD 2/24/28 | | $672,741 | | $669,377 | | $673,021 | | | $3,644 | | |
| TricorBraun 3.75% (LIBOR06M + 3.25%) 3/3/28 | | 86,090 | | 86,090 | | 85,436 | | | (654 | ) | |
The following foreign currency exchange contracts, futures contracts, and swap contracts were outstanding at March 31, 2021:1
Foreign Currency Exchange Contracts
| Counterparty | | Currency to
Receive (Deliver) | | In Exchange For | | Settlement
Date | | | Unrealized
Appreciation | | | Unrealized
Depreciation | |
| BAML | | BRL | | 18,169,801 | | | | USD | | (3,280,309 | ) | | | 5/4/21 | | $ | — | | $ | (58,962 | ) |
| BAML | | EUR | | 3,457,000 | | | | USD | | (4,060,433 | ) | | | 4/7/21 | | | — | | | (5,822 | ) |
| BAML | | EUR | | (19,665,000 | ) | | | USD | | 23,110,660 | | | | 5/4/21 | | | 33,089 | | | — | |
| BAML | | GBP | | 3,561,000 | | | | USD | | (4,890,383 | ) | | | 4/7/21 | | | 18,918 | | | — | |
| BAML | | GBP | | (10,312,000 | ) | | | USD | | 14,163,114 | | | | 5/5/21 | | | — | | | (54,642 | ) |
| BAML | | INR | | 23,338,266 | | | | USD | | (316,328 | ) | | | 6/16/21 | | | — | | | (1,309 | ) |
| BAML | | JPY | | 106,100,000 | | | | USD | | (959,161 | ) | | | 5/7/21 | | | — | | | (567 | ) |
| BAML | | MXN | | (129,443,000 | ) | | | USD | | 6,277,114 | | | | 4/14/21 | | | — | | | (46,175 | ) |
| BAML | | ZAR | | 18,642,714 | | | | USD | | (1,225,100 | ) | | | 6/15/21 | | | 25,086 | | | — | |
| BNP | | BRL | | (77,000,000 | ) | | | USD | | 13,560,396 | | | | 1/4/22 | | | 277,332 | | | — | |
| BNP | | EUR | | (3,457,000 | ) | | | USD | | 4,109,202 | | | | 4/7/21 | | | 54,591 | | | — | |
| BNP | | EUR | | (36,417,000 | ) | | | USD | | 42,825,412 | | | | 5/4/21 | | | 88,778 | | | — | |
| BNP | | GBP | | (3,561,000 | ) | | | USD | | 4,887,710 | | | | 4/7/21 | | | — | | | (21,591 | ) |
| BNP | | ILS | | (5,301,590 | ) | | | USD | | 1,632,262 | | | | 11/30/21 | | | 39,161 | | | — | |
| BNP | | KRW | | (128,438,975 | ) | | | USD | | 114,243 | | | | 6/16/21 | | | 344 | | | — | |
| BNP | | MXN | | 131,589,000 | | | | USD | | (6,482,951 | ) | | | 6/2/21 | | | — | | | (90,469 | ) |
| CITI | | ILS | | (1,300,000 | ) | | | USD | | 394,746 | | | | 6/2/21 | | | 5,570 | | | — | |
| CITI | | ILS | | (8,901,825 | ) | | | USD | | 2,748,896 | | | | 11/30/21 | | | 73,942 | | | — | |
| CITI | | ILS | | (10,869,075 | ) | | | USD | | 3,329,438 | | | | 1/31/22 | | | 59,192 | | | — | |
84
Table of Contents
Foreign Currency Exchange Contracts
| Counterparty | | Currency to
Receive (Deliver) | | In Exchange For | | Settlement
Date | | Unrealized
Appreciation | | Unrealized
Depreciation |
| CITI | | ILS | | (13,700,190 | ) | | | USD | | 4,182,700 | | | | | 3/2/22 | | | $ | 58,071 | | $ | — | |
| CITI | | TRY | | (18,350,000 | ) | | | USD | | 2,191,699 | | | | | 4/1/21 | | | | — | | | (28,928 | ) |
| JPMCB | | BRL | | (47,200,000 | ) | | | USD | | 8,349,389 | | | | | 10/4/21 | | | | 108,433 | | | — | |
| JPMCB | | BRL | | (5,700,000 | ) | | | USD | | 997,113 | | | | | 1/4/22 | | | | 13,822 | | | — | |
| JPMCB | | EUR | | (1,190,000 | ) | | | USD | | 1,420,180 | | | | | 4/28/21 | | | | 23,857 | | | — | |
| JPMCB | | MXN | | (2,772,000 | ) | | | USD | | 134,470 | | | | | 4/14/21 | | | | — | | | (942 | ) |
| JPMCB | | ZAR | | 83,311,967 | | | | USD | | (5,468,995 | ) | | | | 6/15/21 | | | | 117,930 | | | — | |
| Total Foreign Currency Exchange Contracts | | | | | | | | | | | | | | | | | | $ | 998,116 | | $ | (309,407 | ) |
Futures Contracts
Exchange-Traded
| Contracts to Buy (Sell) | | Notional
Amount | | | Notional
Cost
(Proceeds) | | | Expiration
Date | | Value/
Unrealized
Appreciation | | Value/
Unrealized
Depreciation | | Variation
Margin
Due from
(Due to)
Brokers |
| 143 | | Euro-BTP | | $ | 25,038,705 | | | $ | 25,035,921 | | | | 6/8/21 | | | $ | 2,784 | | $ | — | | | $ | 46,929 | |
| (76) | | Euro-Bund | | | (15,265,364 | ) | | | (15,281,321 | ) | | | 6/8/21 | | | | 15,957 | | | — | | | | (24,931 | ) |
| (35) | | Long 10 yr Gilt | | | (6,156,345 | ) | | | (6,226,270 | ) | | | 6/28/21 | | | | 69,925 | | | — | | | | (171 | ) |
| (645) | | US Treasury 5 yr Notes | | | (79,591,992 | ) | | | (80,609,019 | ) | | | 6/30/21 | | | | 1,017,027 | | | — | | | | 105,819 | |
| 287 | | US Treasury 10 yr Notes | | | 37,579,062 | | | | 38,530,149 | | | | 6/21/21 | | | | — | | | (951,087 | ) | | | (71,750 | ) |
| (189) | | US Treasury 10 yr Notes | | | (24,747,188 | ) | | | (25,189,361 | ) | | | 6/21/21 | | | | 442,173 | | | — | | | | 47,250 | |
| (11) | | US Treasury 10 yr Ultra Notes | | | (1,580,563 | ) | | | (1,636,137 | ) | | | 6/21/21 | | | | 55,574 | | | — | | | | 3,781 | |
| 337 | | US Treasury Long Bonds | | | 52,098,094 | | | | 54,199,563 | | | | 6/21/21 | | | | — | | | (2,101,469 | ) | | | (147,437 | ) |
| 10 | | US Treasury Ultra Bonds | | | 1,812,188 | | | | 1,903,687 | | | | 6/21/21 | | | | — | | | (91,499 | ) | | | (11,563 | ) |
| Total Futures Contracts | | | | | | $ | (9,272,788 | ) | | | | | | $ | 1,603,440 | | $ | (3,144,055 | ) | | $ | (52,073 | ) |
Swap Contracts
CDS Contracts1
Counterparty/
Reference Obligation/
Termination Date/
Payment Frequency | | Notional
Amount2 | | Annual Protection
Payments | | Value | | Upfront
Payments
Paid
(Received) | | Unrealized
Appreciation3 | | Unrealized
Depreciation3 | | Variation Margin
Due from
(Due to) Brokers |
Centrally Cleared:
Protection Sold
Moody’s Ratings: | | | | | | | | | | | | | | | | | | | | | | | | |
| AT&T 2.45% | | | | | | | | | | | | | | | | | | | | | | | | |
| | 5/15/18 Baa2 6/20/24- | | | | | | | | | | | | | | | | | | | | | | | | |
| Quarterly | | 1,800,000 | | | 1.000 | % | | | $ | 31,456 | | $ | (3,163 | ) | | $ | 34,619 | | $ | — | | $ | (9,116 | ) |
| British Telecom 5.75% | | | | | | | | | | | | | | | | | | | | | | | | |
| 12/7/28 Baa2 | | | | | | | | | | | | | | | | | | | | | | | | |
| 12/20/24-Quarterly | | EUR 2,800,000 | | | 1.000 | % | | | | 62,003 | | | 6,094 | | | | 55,909 | | | — | | | (19,640 | ) |
| CDX.ITRX.EUR.344 | | | | | | | | | | | | | | | | | | | | | | | | |
| 12/20/25-Quarterly | | EUR 17,500,000 | | | 1.000 | % | | | | 543,391 | | | 442,150 | | | | 101,241 | | | — | | | (2,040 | ) |
| CDX.NA.HY.355 | | | | | | | | | | | | | | | | | | | | | | | | |
| 12/20/25-Quarterly | | 2,200,000 | | | 5.000 | % | | | | 199,622 | | | 174,202 | | | | 25,420 | | | — | | | (111,303 | ) |
| CDX.NA.HY.365 | | | | | | | | | | | | | | | | | | | | | | | | |
| 6/22/26-Quarterly | | 1,800,000 | | | 5.000 | % | | | | 160,636 | | | 155,526 | | | | 5,110 | | | — | | | 117,506 | |
85
Table of Contents
Schedules of investments
Optimum Fixed Income Fund
Counterparty/
Reference Obligation/
Termination Date/
Payment Frequency | | Notional
Amount2 | | Annual Protection
Payments | | Value | | Upfront
Payments
Paid
(Received) | | Unrealized
Appreciation3 | | Unrealized
Depreciation3 | | Variation Margin
Due from
(Due to) Brokers |
Protection Sold
Moody’s Ratings
(continued): | | | | | | | | | | | | | | | | | | | | | | | | |
| CDX.NA.IG.356 12/20/25- | | | | | | | | | | | | | | | | | | | | | | | | |
| | Quarterly | | 21,000,000 | | | 1.000 | % | | | $ | 502,016 | | $ | 472,937 | | $ | 29,079 | | $ | — | | | $ | (129,864 | ) |
| CDX.NA.IG.366 | | | | | | | | | | | | | | | | | | | | | | | | |
| 6/20/26-Quarterly | | 15,700,000 | | | 1.000 | % | | | | 367,097 | | | 344,963 | | | 22,134 | | | — | | | | 143,681 | |
| | | | | | | | | | | 1,866,221 | | | 1,592,709 | | | 273,512 | | | — | | | | (10,776 | ) |
Over-The-Counter:
Protection Purchased/
Moody’s Ratings: | | | | | | | | | | | | | | | | | | | | | | | | |
| JPMCB Mexico 10.375% | | | | | | | | | | | | | | | | | | | | | | | | |
| 9/20/22 Baa2 6/22/26- | | | | | | | | | | | | | | | | | | | | | | | | |
| Quarterly | | 2,085,000 | | | 1.000 | % | | | | 14,636 | | | 16,294 | | | — | | | (1,658 | ) | | | — | |
| JPMCB Republic of | | | | | | | | | | | | | | | | | | | | | | | | |
| Colombia 10.375% | | | | | | | | | | | | | | | | | | | | | | | | |
| 12/31/24 Baa2 | | | | | | | | | | | | | | | | | | | | | | | | |
| 6/22/26-Quarterly | | 2,090,000 | | | 1.000 | % | | | | 36,902 | | | 36,902 | | | — | | | — | | | | — | |
Protection Sold
Moody’s Ratings: | | | | | | | | | | | | | | | | | | | | | | | | |
| BAML Republic of | | | | | | | | | | | | | | | | | | | | | | | | |
| Colombia 10.375% | | | | | | | | | | | | | | | | | | | | | | | | |
| 1/28/33 Baa2 6/20/21- | | | | | | | | | | | | | | | | | | | | | | | | |
| Quarterly | | 100,000 | | | 1.000 | % | | | | 156 | | | (143 | ) | | 299 | | | — | | | | — | |
| BAML Republic of | | | | | | | | | | | | | | | | | | | | | | | | |
| Colombia 10.375% | | | | | | | | | | | | | | | | | | | | | | | | |
| 1/28/33 Baa2 6/20/22- | | | | | | | | | | | | | | | | | | | | | | | | |
| Quarterly | | 250,000 | | | 1.000 | % | | | | 1,637 | | | (928 | ) | | 2,565 | | | — | | | | — | |
| BNP Republic of Colombia | | | | | | | | | | | | | | | | | | | | | | | | |
| 10.375% | | | | | | | | | | | | | | | | | | | | | | | | |
| 1/28/33 Baa2 6/20/21- | | | | | | | | | | | | | | | | | | | | | | | | |
| Quarterly | | 200,000 | | | 1.000 | % | | | | 312 | | | (290 | ) | | 602 | | | — | | | | — | |
| CITI Barclays Bank 1.75% | | | | | | | | | | | | | | | | | | | | | | | | |
| 1/8/25 AAA | | | | | | | | | | | | | | | | | | | | | | | | |
| 12/20/21-Quarterly | | EUR 1,400,000 | | | 1.000 | % | | | | 9,406 | | | 6,844 | | | 2,562 | | | — | | | | — | |
| CITI Republic of Brazil | | | | | | | | | | | | | | | | | | | | | | | | |
| 4.25% 1/7/25 Ba2 | | | | | | | | | | | | | | | | | | | | | | | | |
| 6/20/22-Quarterly | | 100,000 | | | 1.000 | % | | | | 99 | | | (1,543 | ) | | 1,642 | | | — | | | | — | |
| CITI Republic of Colombia | | | | | | | | | | | | | | | | | | | | | | | | |
| 10.375% 1/28/33 | | | | | | | | | | | | | | | | | | | | | | | | |
| Baa2 12/20/24- | | | | | | | | | | | | | | | | | | | | | | | | |
| Quarterly | | 200,000 | | | 1.000 | % | | | | 117 | | | 553 | | | — | | | (436 | ) | | | — | |
| DB CMBX.NA.AAA7 | | | | | | | | | | | | | | | | | | | | | | | | |
| 10/17/57-Monthly | | 14,200,000 | | | 0.500 | % | | | | 126,250 | | | (841,140 | ) | | 967,390 | | | — | | | | — | |
| GSC Republic of Brazil | | | | | | | | | | | | | | | | | | | | | | | | |
| 4.25% 1/7/25 Ba2 | | | | | | | | | | | | | | | | | | | | | | | | |
| 6/20/22-Quarterly | | 500,000 | | | 1.000 | % | | | | 494 | | | (7,919 | ) | | 8,413 | | | — | | | | — | |
86
Table of Contents
Counterparty/
Reference Obligation/
Termination Date/
Payment Frequency | | Notional
Amount2 | | Annual Protection
Payments | | Value | | Upfront
Payments
Paid
(Received) | | Unrealized
Appreciation3 | | Unrealized
Depreciation3 | | Variation Margin
Due from
(Due to) Brokers |
Protection Sold
Moody’s Ratings
(continued): | | | | | | | | | | | | | | | | | | | | | | | | | | |
| GSC Republic of Colombia | | | | | | | | | | | | | | | | | | | | | | | | | | |
| | 10.375% | | | | | | | | | | | | | | | | | | | | | | | | | | |
| 1/28/33 Baa2 6/20/21- | | | | | | | | | | | | | | | | | | | | | | | | | | |
| Quarterly | | 3,300,000 | | | 1.000 | % | | | $ | 5,141 | | | $ | (4,311 | ) | | $ | 9,452 | | $ | — | | | $ | — | |
| JPMCB HOCHTIEF 1.75% | | | | | | | | | | | | | | | | | | | | | | | | | | |
| 3/7/2025 BBB | | | | | | | | | | | | | | | | | | | | | | | | | | |
| 12/20/25-Quarterly | | EUR 2,200,000 | | | 5.000 | % | | | | 485,716 | | | | 493,275 | | | | — | | | (7,559 | ) | | | — | |
| JPMCB Republic of | | | | | | | | | | | | | | | | | | | | | | | | | | |
| Colombia 10.375% | | | | | | | | | | | | | | | | | | | | | | | | | | |
| 1/28/33 Baa2 6/20/21- | | | | | | | | | | | | | | | | | | | | | | | | | | |
| Quarterly | | 100,000 | | | 1.000 | % | | | | 156 | | | | (145 | ) | | | 301 | | | — | | | | — | |
| JPMCB Republic of South | | | | | | | | | | | | | | | | | | | | | | | | | | |
| Africa 5.50% | | | | | | | | | | | | | | | | | | | | | | | | | | |
| 3/9/20 Baa3 | | | | | | | | | | | | | | | | | | | | | | | | | | |
| 12/20/23-Quarterly | | 700,000 | | | 1.000 | % | | | | (8,711 | ) | | | (18,399 | ) | | | 9,688 | | | — | | | | — | |
| | | | | | | | | | | 672,311 | | | | (320,950 | ) | | | 1,002,914 | | | (9,653 | ) | | | — | |
| Total CDS Contracts | | | | | | | | | $ | 2,538,532 | | | $ | 1,271,759 | | | $ | 1,276,426 | | $ | (9,653 | ) | | $ | (10,776 | ) |
IRS Contracts8
Reference
Obligation/
Termination Date/
Payment Frequency
(Fixed Rate/
Floating Rate) | | Notional Amount2 | | Fixed/
Floating
Interest
Rate
Paid
(Received) | | Value | | Upfront
Payments
Paid
(Received) | | Unrealized
Appreciation3 | | Unrealized
Depreciation3 | | Variation Margin
Due from
(Due to Brokers) |
| Centrally Cleared: | | | | | | | | | | | | | | | | | | | | | | | | | |
| 1 yr IRS9 3/24/23- | | | | | | | | | | | | | | | | | | | | | | | | | |
| | (28 Days/ | | | | | (5.66 | )%/ | | | | | | | | | | | | | | | | | | | |
| 28 Days) | | MXN 1,450,000,000 | | | 4.797 | % | | | $ | 60,729 | | | $ | 9,767 | | $ | 50,962 | | $ | — | | | $ | 52,962 | |
| 2 yr IRS10 6/28/21- | | | | | | | | | | | | | | | | | | | | | | | | | |
| (Semiannually/ | | | | | 1.45 | %/ | | | | | | | | | | | | | | | | | | | |
| Quarterly) | | 30,100,000 | | | (0.193 | )% | | | | (91,104 | ) | | | — | | | — | | | (91,104 | ) | | | 111,214 | |
| 2 yr IRS11 1/3/22- | | | | | | | | | | | | | | | | | | | | | | | | | |
| (At Maturity/ At | | | | | 3.36 | %/ | | | | | | | | | | | | | | | | | | | |
| Maturity) | | BRL 612,400,000 | | | (2.57 | )% | | | | (287,955 | ) | | | 12,756 | | | — | | | (300,711 | ) | | | (71,424 | ) |
| 2 yr IRS11 1/3/22- | | | | | | | | | | | | | | | | | | | | | | | | | |
| (At Maturity/ At | | | | | 3.364 | %/ | | | | | | | | | | | | | | | | | | | |
| Maturity) | | BRL 306,100,000 | | | (2.54 | )% | | | | (206,685 | ) | | | — | | | — | | | (206,685 | ) | | | (41,571 | ) |
| 2 yr IRS11 1/3/22- | | | | | | | | | | | | | | | | | | | | | | | | | |
| (At Maturity/ At | | | | | 2.886 | %/ | | | | | | | | | | | | | | | | | | | |
| Maturity) | | BRL 9,000,000 | | | (2.15 | )% | | | | 16,482 | | | | — | | | 16,482 | | | — | | | | 1,861 | |
| 2 yr IRS11 1/3/22- | | | | | | | | | | | | | | | | | | | | | | | | | |
| (At Maturity/ At | | | | | 2.883 | %/ | | | | | | | | | | | | | | | | | | | |
| Maturity) | | BRL 11,300,000 | | | (2.15 | )% | | | | 20,770 | | | | — | | | 20,770 | | | — | | | | 7,845 | |
| 2 yr IRS11 1/3/22- | | | | | | | | | | | | | | | | | | | | | | | | | |
| (At Maturity/ At | | | | | 2.859 | %/ | | | | | | | | | | | | | | | | | | | |
| Maturity) | | BRL 69,100,000 | | | (2.15 | )% | | | | 127,470 | | | | — | | | 127,470 | | | — | | | | 9,145 | |
87
Table of Contents
Schedules of investments
Optimum Fixed Income Fund
IRS Contracts8
Reference
Obligation/
Termination Date/
Payment Frequency
(Fixed Rate/
Floating Rate) | | Notional Amount2 | | Fixed/
Floating
Interest
Rate
Paid
(Received) | | Value | | Upfront
Payments
Paid
(Received) | | Unrealized
Appreciation3 | | Unrealized
Depreciation3 | | Variation Margin
Due from
(Due to Brokers) |
| Centrally Cleared (continued): | | | | | | | | | | | | | | | | | | | | | | | | | |
| 2 yr IRS11 1/3/22- | | | | | | | | | | | | | | | | | | | | | | | | | |
| | (At Maturity/ At | | | | | 2.871 | %/ | | | | | | | | | | | | | | | | | | | |
| Maturity) | | BRL 29,900,000 | | | (2.14 | )% | | | $ | 56,181 | | $ | — | | | $ | 56,181 | | $ | — | | | $ | 5,160 | |
| 2 yr IRS11 1/3/22- | | | | | | | | | | | | | | | | | | | | | | | | | |
| (At Maturity/ At | | | | | 2.87 | %/ | | | | | | | | | | | | | | | | | | | |
| Maturity) | | BRL 42,200,000 | | | (2.15 | )% | | | | 79,604 | | | 25 | | | | 79,579 | | | — | | | | 7,286 | |
| 2 yr IRS11 1/3/22- | | | | | | | | | | | | | | | | | | | | | | | | | |
| (At Maturity/ At | | | | | 2.85 | %/ | | | | | | | | | | | | | | | | | | | |
| Maturity) | | BRL 175,200,000 | | | (2.18 | )% | | | | 337,710 | | | 789 | | | | 336,921 | | | — | | | | 30,464 | |
| 2 yr IRS11 1/3/22- | | | | | | | | | | | | | | | | | | | | | | | | | |
| (At Maturity/ At | | | | | 2.86 | %/ | | | | | | | | | | | | | | | | | | | |
| Maturity) | | BRL 28,300,000 | | | (2.13 | )% | | | | 54,425 | | | 1,007 | | | | 53,418 | | | — | | | | 4,908 | |
| 2 yr IRS11 1/3/22- | | | | | | | | | | | | | | | | | | | | | | | | | |
| (At Maturity/ At | | | | | 2.86 | %/ | | | | | | | | | | | | | | | | | | | |
| Maturity) | | BRL 23,200,000 | | | (2.12 | )% | | | | 44,767 | | | 19 | | | | 44,748 | | | — | | | | 4,026 | |
| 2 yr IRS11 1/3/22- | | | | | | | | | | | | | | | | | | | | | | | | | |
| (At Maturity/ At | | | | | 2.88 | %/ | | | | | | | | | | | | | | | | | | | |
| Maturity) | | BRL 11,500,000 | | | (2.12 | )% | | | | 21,797 | | | — | | | | 21,797 | | | — | | | | 1,983 | |
| 2 yr IRS11 1/3/22- | | | | | | | | | | | | | | | | | | | | | | | | | |
| (At Maturity/ At | | | | | 3.55 | %/ | | | | | | | | | | | | | | | | | | | |
| Maturity) | | BRL 147,400,000 | | | (2.045 | )% | | | | (197,210 | ) | | 10,770 | | | | — | | | (207,980 | ) | | | (40,501 | ) |
| 2 yr IRS11 1/3/22- | | | | | | | | | | | | | | | | | | | | | | | | | |
| (At Maturity/ At | | | | | 3.70 | %/ | | | | | | | | | | | | | | | | | | | |
| Maturity) | | BRL 198,000,000 | | | (2.00 | )% | | | | (190,174 | ) | | (40,943 | ) | | | — | | | (149,231 | ) | | | (29,303 | ) |
| 2 yr IRS12 3/3/22- | | | | | | | | | | | | | | | | | | | | | | | | | |
| (Semiannually/ | | | | | (1.27 | )%/ | | | | | | | | | | | | | | | | | | | |
| Quarterly) | | CAD 8,800,000 | | | 0.438 | % | | | | 51,891 | | | — | | | | 51,891 | | | — | | | | (24,931 | ) |
| 2 yr IRS12 3/3/22- | | | | | | | | | | | | | | | | | | | | | | | | | |
| (Semiannually/ | | | | | (1.273 | )%/ | | | | | | | | | | | | | | | | | | | |
| Quarterly) | | CAD 2,400,000 | | | 0.438 | % | | | | 14,196 | | | — | | | | 14,196 | | | — | | | | (6,852 | ) |
| 2 yr IRS12 6/17/22- | | | | | | | | | | | | | | | | | | | | | | | | | |
| (Semiannually/ | | | | | (1.50 | )%/ | | | | | | | | | | | | | | | | | | | |
| Quarterly) | | CAD 4,000,000 | | | 0.438 | % | | | | 39,323 | | | 9,284 | | | | 30,039 | | | — | | | | (37,026 | ) |
| 2yr IRS10 3/30/23- | | | | | | | | | | | | | | | | | | | | | | | | | |
| (Semiannually/ | | | | | 0.25 | %/ | | | | | | | | | | | | | | | | | | | |
| Quarterly) | | 7,600,000 | | | (0.199 | )% | | | | 4,943 | | | (51 | ) | | | 4,994 | | | — | | | | (1,306 | ) |
| 3 yr IRS10 6/20/21- | | | | | | | | | | | | | | | | | | | | | | | | | |
| (Semiannually/ | | | | | 1.75 | %/ | | | | | | | | | | | | | | | | | | | |
| Quarterly) | | 17,800,000 | | | (0.187 | )% | | | | (61,649 | ) | | 33,847 | | | | — | | | (95,496 | ) | | | 85,698 | |
| 5 yr IRS10 3/3/25- | | | | | | | | | | | | | | | | | | | | | | | | | |
| (Semiannually/ | | | | | (0.64 | )%/ | | | | | | | | | | | | | | | | | | | |
| Quarterly) | | 42,100,000 | | | 0.189 | % | | | | (794,947 | ) | | — | | | | — | | | (794,947 | ) | | | (43,877 | ) |
| 5 yr IRS12 3/3/25- | | | | | | | | | | | | | | | | | | | | | | | | | |
| (Semiannually/ | | | | | (1.29 | )%/ | | | | | | | | | | | | | | | | | | | |
| Quarterly) | | CAD 800,000 | | | 0.438 | % | | | | 2,387 | | | — | | | | 2,387 | | | — | | | | (1,775 | ) |
88
Table of Contents
| IRS Contracts8 | | | | | | | | | | | | | | | | | | | | | | | | |
| Reference | | | | Fixed/ | | | | | | | | | | | | | | | | | | | |
| Obligation/ | | | | Floating | | | | | | | | | | | | | | | | | | | |
| Termination Date/ | | | | Interest | | | | | | Upfront | | | | | | | | | | | |
| Payment Frequency | | | | Rate | | | | | | Payments | | | | | | | | | Variation Margin |
| (Fixed Rate/ | | | | Paid | | | | | | Paid | | Unrealized | | Unrealized | | Due from |
| Floating Rate) | | Notional Amount2 | | (Received) | | Value | | (Received) | | Appreciation3 | | Depreciation3 | | (Due to Brokers) |
| Centrally Cleared (continued): | | | | | | | | | | | | | | | | | | | | | | |
| 5 yr IRS12 3/3/25- | | | | | | | | | | | | | | | | | | | | | | | | |
| (Semiannually/ | | | | (1.275 | )%/ | | | | | | | | | | | | | | | | | | | |
| Quarterly) | | CAD 2,600,000 | | 0.438 | % | | $ | 6,553 | | | $ | — | | | $ | 6,553 | | $ | — | | | $ | (4,599 | ) |
| 5 yr IRS12 3/3/25- | | | | | | | | | | | | | | | | | | | | | | | | |
| (Semiannually/ | | | | (1.276 | )%/ | | | | | | | | | | | | | | | | | | | |
| Quarterly) | | CAD 1,600,000 | | 0.438 | % | | | 4,082 | | | | — | | | | 4,082 | | | — | | | | (2,854 | ) |
| 5 yr IRS12 3/3/25- | | | | | | | | | | | | | | | | | | | | | | | | |
| (Semiannually/ | | | | (1.22 | )%/ | | | | | | | | | | | | | | | | | | | |
| Quarterly) | | CAD 2,900,000 | | 0.438 | % | | | 2,380 | | | | — | | | | 2,380 | | | — | | | | (2,803 | ) |
| 5 yr IRS12 3/4/25- | | | | | | | | | | | | | | | | | | | | | | | | |
| (Semiannually/ | | | | (1.235 | )%/ | | | | | | | | | | | | | | | | | | | |
| Quarterly) | | CAD 20,500,000 | | 0.438 | % | | | 26,325 | | | | 7,538 | | | | 18,787 | | | — | | | | (33,094 | ) |
| 5 yr IRS13 9/16/25- | | | | | | | | | | | | | | | | | | | | | | | | |
| (Semiannually/ | | | | 0.50 | %/ | | | | | | | | | | | | | | | | | | | |
| Semiannually) | | GBP 15,800,000 | | (0.048 | )% | | | (91,566 | ) | | | (2,612 | ) | | | — | | | (88,954 | ) | | | (93,917 | ) |
| 5 yr IRS14 6/16/26- | | | | | | | | | | | | | | | | | | | | | | | | |
| (Annually/ | | | | 0 | %/ | | | | | | | | | | | | | | | | | | | |
| Annually) | | GBP 28,400,000 | | (0.048 | )% | | | 967,383 | | | | (14,596 | ) | | | 981,979 | | | — | | | | (77,675 | ) |
| 7 yr IRS10 | | | | | | | | | | | | | | | | | | | | | | | | |
| 12/16/22- | | | | | | | | | | | | | | | | | | | | | | | | |
| (Semiannually/ | | | | 2.25 | %/ | | | | | | | | | | | | | | | | | | | |
| Quarterly) | | 41,600,000 | | (2.41 | )% | | | (1,422,451 | ) | | | 272,789 | | | | — | | | (1,695,240 | ) | | | 669,108 | |
| 10 yr IRS10 3/3/25- | | | | | | | | | | | | | | | | | | | | | | | | |
| (Semiannually/ | | | | (1.80 | )%/ | | | | | | | | | | | | | | | | | | | |
| Quarterly) | | 8,600,000 | | 0.202 | % | | | (103,338 | ) | | | — | | | | — | | | (103,338 | ) | | | (20,134 | ) |
| 30 yr IRS10 | | | | | | | | | | | | | | | | | | | | | | | | |
| 3/30/51- | | | | | | | | | | | | | | | | | | | | | | | | |
| (Semiannually/ | | | | 1.15 | %/ | | | | | | | | | | | | | | | | | | | |
| Quarterly) | | 600,000 | | (0.199 | )% | | | 145,162 | | | | 12,963 | | | | 132,199 | | | — | | | | 5,749 | |
| Total IRS Contracts | | | | | | | $ | (1,362,519 | ) | | $ | 313,352 | | | $ | 2,057,815 | | $ | (3,733,686 | ) | | $ | 463,767 | |
The use of foreign currency exchange contracts, futures contracts, and swap contracts involves elements of market risk and risks in excess of the amounts disclosed in these financial statements. The notional amounts and foreign currency exchange contracts presented above represent the Fund’s total exposure in such contracts, whereas only the net unrealized appreciation (depreciation) and variation margin are reflected in the Fund’s net assets.
89
Table of Contents
Schedules of investments
Optimum Fixed Income Fund
| 1 | A CDS contract is a risk-transfer instrument through which one party (purchaser of protection) transfers to another party (seller of protection) the financial risk of a credit event (as defined in the CDS agreement), as it relates to a particular reference security or basket of securities (such as an index). Periodic payments (receipts) on such contracts are accrued daily and recorded as unrealized losses (gains) on swap contracts. Upon payment (receipt), such amounts are recorded as realized losses (gains) on swap contracts. Upfront payments made or received in connection with CDS contracts are amortized over the expected life of the CDS contracts as unrealized losses (gains) on swap contracts. The change in value of CDS contracts is recorded daily as unrealized appreciation or depreciation. A realized gain or loss is recorded upon a credit event (as defined in the CDS agreement) or the maturity or termination of the CDS agreement. |
| 2 | Notional amount shown is stated in USD unless noted that the swap is denominated in another currency. |
| 3 | Unrealized appreciation (depreciation) does not include periodic interest payments (receipt) on swap contracts accrued daily in the amount of $(523,337). |
| 4 | Markit’s iTraxx Europe Subordinated Financials Index, or the ITRX EUR SUB FIN, is comprised of 25 Financial entities from the Markit iTraxx® Europe Index referencing subordinated debt. |
| 5 | Markit’s North America High Yield CDX Index, or the CDX.NA.HY Index, is composed of 100 liquid North American entities with high yield credit ratings that trade is in the CDS market. |
| 6 | Markit’s North America Investment Grade Index, or the CDX.NA.IG Index, is composed of 125 liquid North American entities with investment grade credit ratings that trade in the CDS market. |
| 7 | Markit’s CMBX Index, or the CMBX.NA Index, is a synthetic tradable index referencing a basket of 25 commercial mortgage-backed securities in North America. Credit-quality rating are measured on a scale that generally ranges from AAA (highest) to BB (lowest). US Agency and US Agency mortgage-backed securities appear under US Government. |
| 8 | An IRS agreement is an exchange of interest rates between counterparties. Periodic payments (receipt) on such contracts are accrued daily and recorded as unrealized appreciation (depreciation) on swap contracts. Upon periodic payment (receipt) or termination of the contract, such amounts are recorded as realized gains (losses) on swap contracts. |
| 9 | Rate resets based on MXIBTIIE. |
| 10 | Rate resets based on LIBOR03M. |
| 11 | Rate paid based on Brazil CETIP Interbank Deposit. |
| 12 | Rate resets based on CAD0003M. |
| 13 | Rate resets based on BP0006M. |
| 14 | Rate resets based on BP0012M. |
| Summary of abbreviations: |
| ABS – Asset-Backed Security |
| ARM – Adjustable Rate Mortgage |
| BAML – Bank of America Merrill Lynch |
| BB – Barclays Bank |
| BNP – BNP Paribas |
| BP0003M – 3 Month Sterling LIBOR Interest Rate |
| BP0012M – 12 Month Sterling LIBOR Interest Rate |
| BTP – Buoni del Tesoro Poliennali |
| CDS – Credit Default Swap |
| CDX.ITRX.EUR – Credit Default Swap Index iTraxx Europe |
| CDX.NA.HY – Credit Default Swap Index North America High Yield |
| CDX.NA.IG – Credit Default Swap Index North America Investment Grade |
| CITI – Citigroup |
| CLO – Collateralized Loan Obligation |
| COF 11 – Cost of Funds for the 11th District of San Francisco |
| DAC – Designated Activity Company |
| DB – Deutsche Bank |
| DIFC – Dubai International Financial Centre |
| EUR003M – EURIBOR EUR 3 Month |
| EURIBOR – Euro interbank offered rate |
| FREMF – Freddie Mac Multifamily |
| GNMA – Government National Mortgage Association |
| GS – Goldman Sachs |
| GSC – Goldman Sachs Bank USA |
| H15T1Y – US Treasury Yield Curve Rate T Note Constant Maturity 1 Year |
| ICE – Intercontinental Exchange, Inc. |
| IRS – Interest Rate Swap |
| JPM – JPMorgan |
| JPMCB – JPMorgan Chase Bank |
| JSC – Joint Stock Company |
| LIBOR – London interbank offered rate |
| LIBOR01M – ICE LIBOR USD 1 Month |
| LIBOR03M – ICE LIBOR USD 3 Month |
| LIBOR06M – ICE LIBOR USD 6 Month |
| LIBOR12M – ICE LIBOR USD 12 Month |
| MASTR – Mortgage Asset Securitization Transactions, Inc. |
| MSCI – Morgan Stanley Capital International |
| MXIBTIIE – Mexico 28 days interbank rate |
| PIK – Payment-in-kind |
90
Table of Contents
| Summary of abbreviations: (continued) |
| REMIC – Real Estate Mortgage Investment Conduit |
| S.F. – Single Family |
| SOFR – Secured Overnight Financing Rate |
| SONIA3M – 3 Month Sterling Overnight Indexed Average |
| TBA – To be announced |
| TBD – To be determined |
| yr – Year |
| Summary of currencies: |
| BRL – Brazilian Real |
| CAD – Canadian Dollar |
| EUR – European Monetary Unit |
| GBP – British Pound Sterling |
| IDR – Indonesia Rupiah |
| ILS – Israel Shekel |
| INR – Indian Rupee |
| JPY – Japanese Yen |
| KRW – South Korean Won |
| MXN – Mexican Peso |
| MYR – Malaysia Ringgit |
| TRY – Turkish Lira |
| USD – US Dollar |
| ZAR – South Africa Rand |
See accompanying notes, which are an integral part of the financial statements.
91
Table of Contents
Schedules of investments
Optimum International Fund
March 31, 2021
| | | Number of | | | |
| | | | shares | | Value (US $) |
| Common Stock – 96.34%Δ | | | | | |
| Australia – 3.17% | | | | | |
| BlueScope Steel | | 31,075 | | $ | 456,718 |
| Fortescue Metals Group | | 308,701 | | | 4,687,132 |
| Mineral Resources | | 32,509 | | | 938,798 |
| Rio Tinto | | 65,334 | | | 5,495,907 |
| Rio Tinto (London Stock | | | | | |
| Exchange) | | 45,343 | | | 3,469,297 |
| Rio Tinto ADR * | | 119,936 | | | 9,313,030 |
| South32 | | 2,417,891 | | | 5,160,591 |
| | | | | | 29,521,473 |
| Austria – 1.88% | | | | | |
| ANDRITZ | | 22,143 | | | 995,578 |
| Erste Group Bank † | | 173,751 | | | 5,892,676 |
| Lenzing † | | 1,953 | | | 250,557 |
| OMV | | 101,992 | | | 5,174,156 |
| voestalpine | | 123,294 | | | 5,108,254 |
| Zumtobel Group † | | 4,993 | | | 45,906 |
| | | | | | 17,467,127 |
| Belgium – 0.49% | | | | | |
| bpost † | | 12,776 | | | 122,107 |
| Galapagos † | | 46,061 | | | 3,571,520 |
| UCB | | 9,511 | | | 904,776 |
| | | | | | 4,598,403 |
| Brazil – 3.47% | | | | | |
| AES Brasil Energia | | 28,100 | | | 86,866 |
| Ambev | | 2,088,600 | | | 5,684,730 |
| Banco Bradesco ADR | | 1,307,423 | | | 6,144,888 |
| Cia Siderurgica Nacional | | 198,800 | | | 1,332,597 |
| Energisa | | 254,300 | | | 2,043,472 |
| Eternit † | | 110,600 | | | 368,624 |
| Klabin | | 858,200 | | | 4,195,973 |
| Marfrig Global Foods † | | 327,900 | | | 1,021,802 |
| Petroleo Brasileiro ADR | | 627,395 | | | 5,320,310 |
| Porto Seguro | | 23,300 | | | 194,682 |
| SLC Agricola | | 204,300 | | | 1,622,451 |
| Sul America | | 371,797 | | | 2,264,346 |
| Transmissora Alianca de | | | | | |
| Energia Eletrica | | 292,500 | | | 2,031,882 |
| | | | | | 32,312,623 |
| Canada – 3.85% | | | | | |
| Canfor † | | 12,800 | | | 265,126 |
| Cascades | | 47,304 | | | 592,100 |
| Cervus Equipment | | 2,551 | | | 32,093 |
| Constellation Software | | 3,700 | | | 5,167,222 |
| Finning International | | 8,100 | | | 205,997 |
| Intertape Polymer Group | | 4,366 | | | 97,277 |
| Linamar | | 4,800 | | | 282,989 |
| Magna International | | 150,755 | | | 13,277,284 |
| Quebecor Class B | | 1,626 | | | 43,655 |
| Restaurant Brands | | | | | |
| International * | | 103,623 | | | 6,735,495 |
| Royal Bank of Canada | | 91,800 | | | 8,464,125 |
| Stella-Jones | | 2,100 | | | 85,190 |
| Transcontinental Class A | | 23,000 | | | 404,838 |
| West Fraser Timber | | 3,300 | | | 237,410 |
| Western Forest Products | | 11,580 | | | 16,678 |
| | | | | | 35,907,479 |
| Chile – 0.56% | | | | | |
| Sociedad Quimica y | | | | | |
| Minera de Chile ADR | | 99,099 | | | 5,259,184 |
| | | | | | 5,259,184 |
| China/Hong Kong – 10.04% | | | | | |
| 360 DigiTech ADR † | | 12,862 | | | 334,541 |
| Agricultural Bank of | | | | | |
| China Class H | | 2,992,000 | | | 1,196,939 |
| Alibaba Group Holding | | | | | |
| ADR † | | 1,952 | | | 442,577 |
| Angang Steel Class H | | 180,000 | | | 89,837 |
| Anhui Conch Cement | | | | | |
| Class H | | 613,000 | | | 3,985,947 |
| Asia Cement China | | | | | |
| Holdings | | 393,862 | | | 403,787 |
| Baidu ADR † | | 29,380 | | | 6,391,619 |
| Baoshan Iron & Steel | | | | | |
| Class A | | 2,277,900 | | | 2,807,846 |
| Beijing Yanjing Brewery | | | | | |
| Class A | | 1,148,044 | | | 1,285,529 |
| Build King Holdings | | 162,736 | | | 22,817 |
| BYD Class H * | | 138,500 | | | 2,937,787 |
| China Construction Bank | | | | | |
| Class H | | 10,038,000 | | | 8,444,517 |
| China Everbright Bank | | | | | |
| Class H | | 744,000 | | | 324,431 |
| China Life Insurance | | | | | |
| Class H | | 1,759,000 | | | 3,633,802 |
| China Merchants Bank | | | | | |
| Class H | | 102,500 | | | 782,518 |
| China Minsheng | | | | | |
| Banking Class H | | 1,035,000 | | | 600,436 |
| China Petroleum & | | | | | |
| Chemical Class H | | 6,530,000 | | | 3,477,470 |
| China South Publishing | | | | | |
| & Media Group | | | | | |
| Class A | | 594,845 | | | 951,933 |
92
Table of Contents
| | | Number of | | | |
| | | | shares | | Value (US $) |
| Common StockΔ (continued) | | | | | |
| China/Hong Kong (continued) | | | | | |
| Chinese Universe | | | | | |
| Publishing and Media | | | | | |
| Group Class A | | 78,000 | | $ | 125,776 |
| CITIC | | 1,480,703 | | | 1,401,831 |
| Fangda Special Steel | | | | | |
| Technology Class A | | 332,500 | | | 453,478 |
| Fufeng Group † | | 160,000 | | | 57,627 |
| Guangxi Liugong | | | | | |
| Machinery Class A | | 343,600 | | | 517,890 |
| HBIS Resources Class A | | 152,840 | | | 541,410 |
| Huaibei Mining Holdings | | | | | |
| Class A | | 254,800 | | | 439,243 |
| Huayu Automotive | | | | | |
| Systems Class A | | 564,200 | | | 2,372,997 |
| Industrial & Commercial | | | | | |
| Bank of China Class H | | 4,029,705 | | | 2,892,393 |
| JNBY Design | | 77,000 | | | 137,675 |
| Kingboard Laminates | | | | | |
| Holdings | | 326,000 | | | 705,332 |
| Lee & Man Paper | | | | | |
| Manufacturing | | 465,000 | | | 427,670 |
| Lenovo Group | | 2,858,000 | | | 4,065,999 |
| Li Ning | | 340,000 | | | 2,208,616 |
| Liuzhou Iron & Steel | | | | | |
| Class A | | 204,700 | | | 201,733 |
| Nanjing Iron & Steel | | | | | |
| Class A | | 2,612,700 | | | 1,542,509 |
| Offshore Oil Engineering | | | | | |
| Class A | | 1,526,600 | | | 1,054,996 |
| Opple Lighting Class A | | 123,800 | | | 537,883 |
| PAX Global Technology | | 113,000 | | | 121,371 |
| Perfect World Class A | | 1,068,500 | | | 3,224,246 |
| SAIC Motor Corp Class A | | 789,500 | | | 2,369,102 |
| Sanquan Food Class A | | 104,500 | | | 360,609 |
| SGIS Songshan Class A | | 1,550,800 | | | 1,152,158 |
| Shandong Nanshan | | | | | |
| Aluminum Class A | | 4,151,000 | | | 2,184,737 |
| Shandong Publishing & | | | | | |
| Media Class A | | 188,800 | | | 171,375 |
| Shanghai Construction | | | | | |
| Group Class A | | 1,556,800 | | | 719,619 |
| Shanghai Fengyuzhu | | | | | |
| Culture and | | | | | |
| Technology Class A † | | 69,000 | | | 205,158 |
| Shanghai Fosun | | | | | |
| Pharmaceutical Group | | | | | |
| Class H * | | 1,109,000 | | | 4,728,953 |
| Shanghai Zijiang | | | | | |
| Enterprise Group | | | | | |
| Class A | | 585,965 | | | 427,294 |
| Sinopec Engineering | | | | | |
| Group Class H | | 34,001 | | | 18,763 |
| Sinopharm Group | | | | | |
| Class H | | 1,094,800 | | | 2,650,356 |
| Sinotruk Hong Kong | | 488,052 | | | 1,462,756 |
| Tangshan Sanyou | | | | | |
| Chemical Industries | | | | | |
| Class A | | 520,900 | | | 860,617 |
| Techtronic Industries | | 42,000 | | | 718,540 |
| Tencent Holdings | | 10,000 | | | 784,657 |
| TravelSky Technology | | | | | |
| Class H | | 1,737,000 | | | 4,062,034 |
| Weibo ADR † | | 90,846 | | | 4,584,089 |
| Xinyangfeng Agricultural | | | | | |
| Technology Class A | | 554,500 | | | 1,504,890 |
| Xinyu Iron & Steel | | | | | |
| Class A | | 1,486,800 | | | 1,301,942 |
| Yonggao Class A | | 364,100 | | | 391,595 |
| Zhejiang Runtu Class A | | 328,450 | | | 491,548 |
| Zhejiang Semir Garment | | | | | |
| Class A | | 616,978 | | | 953,469 |
| Zhejiang Weixing New | | | | | |
| Building Materials | | | | | |
| Class A | | 78,700 | | | 303,274 |
| | | | | | 93,552,543 |
| Colombia – 1.00% | | | | | |
| Bancolombia ADR | | 145,226 | | | 4,645,780 |
| Ecopetrol | | 7,258,724 | | | 4,690,210 |
| | | | | | 9,335,990 |
| Denmark – 1.79% | | | | | |
| AP Moller - Maersk | | | | | |
| Class B | | 2,025 | | | 4,703,957 |
| D/S Norden | | 1,513 | | | 35,063 |
| Demant † | | 18,826 | | | 797,469 |
| GN Store Nord | | 2,806 | | | 220,915 |
| H. Lundbeck | | 48,234 | | | 1,647,784 |
| Novo Nordisk Class B | | 136,276 | | | 9,232,587 |
| | | | | | 16,637,775 |
| Egypt – 0.00% | | | | | |
| ElSewedy Electric | | 76,312 | | | 43,794 |
| | | | | | 43,794 |
| Finland – 0.69% | | | | | |
| Kone Class B | | 71,959 | | | 5,878,351 |
| Orion Class A | | 3,147 | | | 135,256 |
93
Table of Contents
Schedules of investments
Optimum International Fund
| | | Number of | | | |
| | | | shares | | Value (US $) |
| Common StockΔ (continued) | | | | | |
| Finland (continued) | | | | | |
| Orion Class B | | 5,885 | | $ | 235,819 |
| Revenio Group | | 1,620 | | | 96,129 |
| Suominen | | 4,922 | | | 33,131 |
| Vincit | | 3,740 | | | 42,105 |
| | | | | | 6,420,791 |
| France – 3.03% | | | | | |
| BioMerieux | | 9,582 | | | 1,219,194 |
| Capgemini | | 40,808 | | | 6,943,839 |
| Faurecia † | | 1,591 | | | 84,733 |
| Ipsen | | 7,085 | | | 607,773 |
| IPSOS | | 23,199 | | | 876,016 |
| Publicis Groupe | | 37,173 | | | 2,268,568 |
| Safran † | | 48,397 | | | 6,586,437 |
| Sartorius Stedim Biotech | | 6,566 | | | 2,704,222 |
| Sodexo † | | 70,136 | | | 6,726,281 |
| Valneva † | | 12,555 | | | 156,066 |
| Virbac † | | 331 | | | 85,202 |
| | | | | | 28,258,331 |
| Germany – 7.96% | | | | | |
| BASF | | 59,199 | | | 4,917,902 |
| Bayerische Motoren | | | | | |
| Werke | | 69,218 | | | 7,181,282 |
| Carl Zeiss Meditec | | 10,210 | | | 1,538,565 |
| Cliq Digital | | 790 | | | 31,128 |
| Continental † | | 51,068 | | | 6,749,315 |
| Covestro | | 89,695 | | | 6,031,327 |
| Daimler | | 85,768 | | | 7,645,096 |
| Dermapharm Holding | | 3,040 | | | 217,501 |
| Deutsche Bank † | | 339,822 | | | 4,060,012 |
| Deutsche Post | | 141,938 | | | 7,776,576 |
| Gerresheimer | | 4,419 | | | 438,929 |
| Hella & Co. † | | 2,265 | | | 127,018 |
| HelloFresh † | | 2,587 | | | 192,948 |
| Hornbach Baumarkt | | 1,211 | | | 50,912 |
| Hornbach Holding AG & | | | | | |
| Co. | | 1,099 | | | 107,228 |
| Merck | | 44,473 | | | 7,603,978 |
| MTU Aero Engines | | 21,163 | | | 4,980,943 |
| Siemens | | 59,001 | | | 9,686,666 |
| Stabilus | | 526 | | | 37,010 |
| Vonovia | | 69,559 | | | 4,543,552 |
| Wacker Chemie | | 1,511 | | | 215,026 |
| | | | | | 74,132,914 |
| Greece – 0.01% | | | | | |
| Thrace Plastics Holding | | | | | |
| and Co. | | 17,069 | | | 89,075 |
| | | | | | 89,075 |
| Hungary – 0.25% | | | | | |
| MOL Hungarian Oil | | | | | |
| & Gas † | | 43,528 | | | 315,166 |
| OTP Bank † | | 44,217 | | | 1,889,999 |
| Richter Gedeon | | 4,364 | | | 128,666 |
| | | | | | 2,333,831 |
| India – 2.16% | | | | | |
| Bharat Electronics | | 265,651 | | | 454,537 |
| HCL Technologies | | 65,486 | | | 880,133 |
| HDFC Bank ADR † | | 87,848 | | | 6,824,911 |
| ICICI Bank ADR † | | 446,484 | | | 7,157,138 |
| Infosys | | 50,356 | | | 942,224 |
| Karnataka Bank † | | 100,431 | | | 83,929 |
| Oracle Financial Services | | | | | |
| Software | | 1,076 | | | 47,078 |
| Repco Home Finance | | 10,286 | | | 47,418 |
| Wipro | | 654,784 | | | 3,708,999 |
| | | | | | 20,146,367 |
| Indonesia – 0.02% | | | | | |
| Japfa Comfeed | | | | | |
| Indonesia | | 1,057,800 | | | 139,826 |
| | | | | | 139,826 |
| Ireland – 1.18% | | | | | |
| ICON † | | 55,762 | | | 10,949,984 |
| | | | | | 10,949,984 |
| Israel – 0.57% | | | | | |
| Albaad Massuot Yitzhak | | 2,063 | | | 45,381 |
| Check Point Software | | | | | |
| Technologies † | | 47,205 | | | 5,285,544 |
| Isracard | | 7 | | | 24 |
| | | | | | 5,330,949 |
| Italy – 1.48% | | | | | |
| Banca Mediolanum † | | 33,210 | | | 313,510 |
| De’ Longhi | | 5,910 | | | 238,692 |
| DiaSorin | | 2,160 | | | 346,519 |
| Leonardo * | | 679,490 | | | 5,501,369 |
| Mediaset † | | 218,942 | | | 630,072 |
| Prysmian | | 207,290 | | | 6,735,996 |
| | | | | | 13,766,158 |
| Japan – 7.63% | | | | | |
| A&A Material | | 1,800 | | | 18,045 |
| Aica Kogyo | | 1,800 | | | 64,863 |
| Aichi Bank | | 1,500 | | | 40,912 |
| Akatsuki | | 900 | | | 36,374 |
| ASKUL | | 6,400 | | | 244,498 |
| BML | | 2,200 | | | 75,999 |
| Canon | | 10,000 | | | 226,010 |
| Capcom | | 74,400 | | | 2,415,606 |
94
Table of Contents
| | | Number of | | | |
| | | | shares | | Value (US $) |
| Common StockΔ (continued) | | | | | |
| Japan (continued) | | | | | |
| Chukyo Bank | | 2,200 | | $ | 34,930 |
| Daiken | | 2,200 | | | 43,791 |
| Daikin Industries | | 13,400 | | | 2,701,179 |
| Daito Trust Construction | | 2,900 | | | 336,031 |
| Denso | | 137,200 | | | 9,103,711 |
| Disco | | 2,600 | | | 815,986 |
| Doshisha | | 6,100 | | | 103,076 |
| France Bed Holdings | | 4,700 | | | 41,132 |
| Fujikura † | | 71,500 | | | 350,639 |
| Fujitsu | | 30,300 | | | 4,378,415 |
| GLOBERIDE | | 1,900 | | | 73,357 |
| Glory | | 2,400 | | | 51,587 |
| GS Yuasa | | 2,800 | | | 75,864 |
| GungHo Online | | | | | |
| Entertainment | | 3,700 | | | 73,048 |
| Hitachi | | 141,600 | | | 6,399,335 |
| Honda Motor | | 26,100 | | | 782,352 |
| Hyakujushi Bank | | 2,700 | | | 41,210 |
| Iida Group Holdings | | 9,700 | | | 234,429 |
| Internet Initiative Japan | | 9,400 | | | 220,557 |
| Japan Post Holdings † | | 56,200 | | | 500,813 |
| Kajima | | 9,100 | | | 129,114 |
| Kanamoto | | 1,800 | | | 46,835 |
| Kanematsu | | 3,100 | | | 41,604 |
| KDDI | | 140,300 | | | 4,301,815 |
| Kokuyo | | 6,300 | | | 97,523 |
| K’s Holdings | | 14,000 | | | 192,314 |
| Mazda Motor † | | 95,500 | | | 777,972 |
| Mitsubishi Electric | | 125,400 | | | 1,910,021 |
| Mixi | | 73,700 | | | 1,843,748 |
| Nihon Kohden | | 5,400 | | | 157,525 |
| Nikon | | 73,900 | | | 690,779 |
| Nintendo | | 12,500 | | | 6,977,873 |
| Nippon Telegraph & | | | | | |
| Telephone | | 181,700 | | | 4,663,729 |
| Nissan Motor † | | 403,900 | | | 2,246,665 |
| Nitori Holdings | | 6,200 | | | 1,199,684 |
| Nojima | | 2,200 | | | 55,872 |
| Nomura Holdings | | 140,300 | | | 736,694 |
| Panasonic | | 84,200 | | | 1,082,490 |
| Paramount Bed Holdings | | 2,200 | | | 46,752 |
| Pilot | | 1,700 | | | 54,197 |
| Sakai Chemical Industry † | | 2,200 | | | 41,785 |
| Secom | | 57,300 | | | 4,819,462 |
| Studio Alice | | 1,500 | | | 28,368 |
| Sumitomo Forestry | | 11,100 | | | 239,193 |
| Sumitomo Rubber | | | | | |
| Industries | | 32,500 | | | 383,044 |
| Suzuken | | 2,300 | | | 89,840 |
| Suzuki Motor | | 6,600 | | | 299,526 |
| T&D Holdings | | 11,600 | | | 149,393 |
| Takamatsu Construction | | | | | |
| Group | | 2,200 | | | 42,838 |
| T-Gaia | | 30,550 | | | 528,917 |
| TOKAI Holdings | | 10,700 | | | 92,384 |
| Tokio Marine Holdings | | 6,600 | | | 313,832 |
| Tokyo Electron | | 4,300 | | | 1,817,087 |
| Toshiba | | 12,900 | | | 435,728 |
| Toyota Motor | | 48,600 | | | 3,781,780 |
| TS Tech | | 3,800 | | | 56,592 |
| Tsurumi Manufacturing | | 1,500 | | | 24,588 |
| TV Asahi Holdings | | 3,000 | | | 56,383 |
| Vital KSK Holdings | | 4,600 | | | 32,778 |
| Yokohama Rubber | | 4,100 | | | 73,317 |
| Yondoshi Holdings | | 3,400 | | | 59,110 |
| ZOZO | | 34,000 | | | 1,004,109 |
| | | | | | 71,107,009 |
| Luxembourg – 1.07% | | | | | |
| Eurofins Scientific † | | 98,522 | | | 9,417,401 |
| RTL Group † | | 9,587 | | | 561,684 |
| | | | | | 9,979,085 |
| Malaysia – 0.12% | | | | | |
| AMMB Holdings | | 524,200 | | | 370,410 |
| Hong Leong Financial | | | | | |
| Group | | 60,700 | | | 255,009 |
| Magni-Tech Industries | | 48,000 | | | 26,972 |
| Public Bank Bhd | | 218,000 | | | 220,813 |
| Sime Darby | | 258,000 | | | 149,331 |
| Unisem M | | 57,100 | | | 105,758 |
| | | | | | 1,128,293 |
| Malta – 0.16% | | | | | |
| Kindred Group SDR † | | 86,361 | | | 1,519,867 |
| | | | | | 1,519,867 |
| Mexico – 0.70% | | | | | |
| Alpek | | 329,744 | | | 308,457 |
| Credito Real † | | 75,575 | | | 35,755 |
| Grupo Financiero | | | | | |
| Banorte Class O † | | 968,500 | | | 5,460,976 |
| Grupo Financiero | | | | | |
| Inbursa Class O † | | 485,392 | | | 439,571 |
| Ternium ADR † | | 7,359 | | | 285,823 |
| | | | | | 6,530,582 |
| Netherlands – 5.14% | | | | | |
| ASML Holding (New | | | | | |
| York Shares) | | 28,917 | | | 17,531,969 |
95
Table of Contents
Schedules of investments
Optimum International Fund
| | | Number of | | | |
| | | | shares | | Value (US $) |
| Common StockΔ (continued) | | | | | |
| Netherlands (continued) | | | | | |
| BE Semiconductor | | | | | |
| Industries | | 17,860 | | $ | 1,496,270 |
| Brunel International † | | 4,916 | | | 63,646 |
| Heineken | | 57,864 | | | 5,945,640 |
| Koninklijke Ahold | | | | | |
| Delhaize | | 32,941 | | | 917,460 |
| Koninklijke Philips † | | 155,398 | | | 8,870,300 |
| Randstad † | | 7,003 | | | 492,581 |
| Royal Dutch Shell | | | | | |
| Class A | | 352,296 | | | 6,940,710 |
| Wolters Kluwer | | 64,780 | | | 5,630,712 |
| | | | | | 47,889,288 |
| New Zealand – 0.39% | | | | | |
| Fisher & Paykel | | | | | |
| Healthcare | | 139,202 | | | 3,120,720 |
| Fisher & Paykel | | | | | |
| Healthcare (Australian | | | | | |
| Securities Exchange) | | 15,629 | | | 348,889 |
| Fletcher Building | | 18,647 | | | 92,203 |
| Skellerup Holdings | | 13,497 | | | 40,156 |
| | | | | | 3,601,968 |
| Norway – 2.59% | | | | | |
| DNB † | | 394,826 | | | 8,401,388 |
| Equinor ADR * | | 407,863 | | | 7,937,014 |
| Norsk Hydro | | 1,215,637 | | | 7,782,897 |
| | | | | | 24,121,299 |
| Philippines – 0.02% | | | | | |
| BDO Unibank | | 49,800 | | | 104,653 |
| Ginebra San Miguel | | 33,690 | | | 35,365 |
| LT Group | | 174,300 | | | 48,479 |
| | | | | | 188,497 |
| Poland – 0.75% | | | | | |
| Alior Bank † | | 31,648 | | | 184,191 |
| Asseco Poland † | | 20,652 | | | 353,267 |
| Bank Handlowy w | | | | | |
| Warszawie † | | 6,409 | | | 63,573 |
| Bank Millennium † | | 161,514 | | | 154,652 |
| Bank Polska Kasa Opieki † | | 49,578 | | | 885,953 |
| Budimex | | 525 | | | 40,651 |
| Grupa Azoty † | | 13,065 | | | 99,676 |
| Jastrzebska Spolka | | | | | |
| Weglowa † | | 47,702 | | | 357,050 |
| LiveChat Software | | 2,654 | | | 84,484 |
| mBank † | | 12,310 | | | 667,847 |
| Neuca | | 226 | | | 39,917 |
| Powszechna Kasa | | | | | |
| Oszczednosci Bank | | | | | |
| �� Polski † | | 366,302 | | | 3,033,747 |
| Powszechny Zaklad | | | | | |
| Ubezpieczen † | | 91,817 | | | 792,267 |
| TEN Square Games | | 2,060 | | | 270,017 |
| | | | | | 7,027,292 |
| Republic of Korea – 6.15% | | | | | |
| AfreecaTV | | 2,975 | | | 206,351 |
| BNK Financial Group | | 55,107 | | | 330,618 |
| Coway | | 5,419 | | | 313,624 |
| DGB Financial Group | | 8,243 | | | 61,472 |
| DL Holdings | | 3,439 | | | 265,882 |
| F&F | | 2,881 | | | 324,566 |
| Gravity ADR † | | 176 | | | 20,240 |
| Hana Financial Group | | 9,782 | | | 369,931 |
| Handsome | | 3,352 | | | 120,248 |
| Hankook Tire & | | | | | |
| Technology | | 4,929 | | | 213,623 |
| Hyosung | | 4,412 | | | 346,567 |
| Hyosung TNC | | 1,024 | | | 518,447 |
| Hyundai Engineering & | | | | | |
| Construction | | 5,660 | | | 220,299 |
| Hyundai Mobis | | 3,960 | | | 1,021,710 |
| iMarketKorea | | 4,641 | | | 37,194 |
| JB Financial Group | | 37,570 | | | 217,436 |
| KB Financial Group | | 31,468 | | | 1,562,626 |
| Kia | | 64,729 | | | 4,741,360 |
| KIWOOM Securities | | 2,947 | | | 328,095 |
| Kolon Industries | | 3,419 | | | 180,655 |
| Korea Petrochemical Ind | | 394 | | | 113,317 |
| KT | | 147,921 | | | 3,692,307 |
| KT ADR † | | 210,130 | | | 2,614,017 |
| LG Display † | | 135,766 | | | 2,729,116 |
| LG Electronics | | 37,556 | | | 4,977,601 |
| LG Innotek | | 1,944 | | | 352,986 |
| NH Investment & | | | | | |
| Securities | | 60,594 | | | 623,742 |
| NPC | | 13,519 | | | 49,871 |
| POSCO | | 13,355 | | | 3,776,099 |
| Samsung Card | | 13,434 | | | 408,925 |
| Samsung Electronics | | 269,893 | | | 19,411,787 |
| Samsung Securities | | 25,793 | | | 899,080 |
| Shinhan Financial Group | | 188,967 | | | 6,252,984 |
| | | | | | 57,302,776 |
| Russia – 0.02% | | | | | |
| Evraz | | 20,349 | | | 162,147 |
| | | | | | 162,147 |
96
Table of Contents
| | | Number of | | | |
| | | | shares | | Value (US $) |
| Common StockΔ (continued) | | | | | |
| Singapore – 0.76% | | | | | |
| DBS Group Holdings | | 306,500 | | $ | 6,559,720 |
| IGG | | 192,000 | | | 247,468 |
| Jardine Cycle & Carriage | | 13,751 | | | 230,103 |
| | | | | | 7,037,291 |
| South Africa – 0.59% | | | | | |
| AECI | | 18,805 | | | 131,839 |
| African Rainbow | | | | | |
| Minerals | | 5,071 | | | 95,548 |
| Anglo American | | 78,755 | | | 3,086,149 |
| Kumba Iron Ore | | 18,634 | | | 768,211 |
| Motus Holdings | | 19,058 | | | 111,159 |
| Ninety One | | 16,741 | | | 54,442 |
| Omnia Holdings † | | 7,530 | | | 24,998 |
| Sappi † | | 50,166 | | | 156,242 |
| Shoprite Holdings | | 12,704 | | | 135,234 |
| Sibanye Stillwater | | 193,946 | | | 854,098 |
| Telkom | | 21,065 | | | 60,455 |
| | | | | | 5,478,375 |
| Spain – 1.02% | | | | | |
| Amadeus IT Group † | | 128,259 | | | 9,081,715 |
| Laboratorios | | | | | |
| Farmaceuticos Rovi | | 4,805 | | | 259,202 |
| Pharma Mar | | 1,570 | | | 182,181 |
| | | | | | 9,523,098 |
| Sweden – 3.16% | | | | | |
| Betsson † | | 47,340 | | | 439,335 |
| Bilia Class A † | | 4,415 | | | 65,415 |
| Electrolux Class B | | 118,661 | | | 3,290,761 |
| Epiroc Class A | | 30,577 | | | 692,525 |
| Getinge Class B | | 50,752 | | | 1,409,221 |
| Husqvarna Class B | | 219,559 | | | 3,162,613 |
| Kinnevik Class B † | | 40,539 | | | 1,970,912 |
| Paradox Interactive | | 4 | | | 90 |
| Ratos Class B | | 3,051 | | | 16,573 |
| Swedish Match | | 12,180 | | | 950,864 |
| Telefonaktiebolaget LM | | | | | |
| Ericsson Class B | | 514,455 | | | 6,806,620 |
| Telefonaktiebolaget LM | | | | | |
| Ericsson ADR | | 497,534 | | | 6,562,473 |
| Volvo Class B | | 160,455 | | | 4,058,477 |
| | | | | | 29,425,879 |
| Switzerland – 6.21% | | | | | |
| Adecco Group | | 22,556 | | | 1,518,768 |
| Credit Suisse Group † | | 191,085 | | | 2,001,930 |
| Credit Suisse Group ADR | | 144,183 | | | 1,528,340 |
| Kuehne + Nagel | | | | | |
| International | | 9,764 | | | 2,786,172 |
| Logitech International | | 52,187 | | | 5,474,072 |
| Novartis | | 136,858 | | | 11,695,520 |
| Novartis ADR | | 68,826 | | | 5,883,246 |
| Roche Holding | | 57,269 | | | 18,507,979 |
| Schindler Holding | | 304 | | | 89,288 |
| Sonova Holding † | | 614 | | | 162,668 |
| Swatch Group | | 3,500 | | | 1,006,877 |
| Tecan Group † | | 421 | | | 186,814 |
| UBS Group | | 393,395 | | | 6,091,452 |
| Zehnder Group | | 11,237 | | | 895,251 |
| | | | | | 57,828,377 |
| Taiwan – 7.12% | | | | | |
| Acer | | 2,665,000 | | | 2,937,450 |
| ASE Technology Holding | | 2,247,671 | | | 8,468,252 |
| Asia Polymer | | 181,000 | | | 156,051 |
| Asustek Computer | | 137,000 | | | 1,788,543 |
| C Sun Manufacturing | | 113,000 | | | 192,472 |
| Chicony Electronics | | 79,000 | | | 281,025 |
| ChipMOS Technologies | | 1,427,000 | | | 2,213,043 |
| Elan Microelectronics | | 47,500 | | | 325,456 |
| Evergreen Marine Corp. | | | | | |
| Taiwan † | | 374,000 | | | 596,397 |
| Formosa Chemicals & | | | | | |
| Fibre | | 354,000 | | | 1,086,826 |
| General Interface | | | | | |
| Solution Holding | | 140,000 | | | 615,778 |
| Gigabyte Technology | | 8,000 | | | 27,982 |
| Himax Technologies ADR † | | 57,372 | | | 783,128 |
| Hon Hai | | | | | |
| Precision Industry | | 1,195,000 | | | 5,193,285 |
| Lite-On Technology | | 594,000 | | | 1,307,370 |
| MediaTek | | 174,000 | | | 5,909,158 |
| Micro-Star International | | 415,000 | | | 2,530,754 |
| Nantex Industry | | 332,000 | | | 1,279,921 |
| Novatek | | | | | |
| Microelectronics | | 205,000 | | | 4,131,181 |
| Phison Electronics | | 38,000 | | | 650,580 |
| Pou Chen | | 712,000 | | | 823,468 |
| Qualipoly Chemical | | 114,000 | | | 136,842 |
| Quanta Computer | | 1,012,000 | | | 3,475,835 |
| Radiant Opto-Electronics | | 536,000 | | | 2,385,729 |
| Realtek Semiconductor | | 149,000 | | | 2,579,680 |
| Sanyang Motor | | 157,000 | | | 170,574 |
| Silicon Motion | | | | | |
| Technology ADR | | 27,362 | | | 1,625,029 |
| Sitronix Technology | | 5,000 | | | 41,881 |
| Synnex Technology | | | | | |
| International | | 144,000 | | | 275,050 |
97
Table of Contents
Schedules of investments
Optimum International Fund
| | | Number of | | | |
| | | | shares | | Value (US $) |
| Common StockΔ (continued) | | | | | |
| Taiwan (continued) | | | | | |
| Taiwan Semiconductor | | | | | |
| Manufacturing | | 456,000 | | $ | 9,381,138 |
| United Microelectronics | | 216,000 | | | 380,023 |
| Winbond Electronics | | 702,000 | | | 725,791 |
| Wistron | | 1,592,000 | | | 1,869,134 |
| Yuanta Financial Holding | | 2,494,080 | | | 1,966,733 |
| | | | | | 66,311,559 |
| Thailand – 0.31% | | | | | |
| AAPICO Hitech NVDR | | 112,700 | | | 77,538 |
| Krung Thai Bank NVDR | | 1,077,430 | | | 420,629 |
| Siam Commercial Bank | | | | | |
| NVDR | | 519,300 | | | 1,852,862 |
| Somboon Advance | | | | | |
| Technology NVDR | | 107,200 | | | 63,462 |
| Thai Union Group NVDR | | 829,100 | | | 390,009 |
| Workpoint | | | | | |
| Entertainment NVDR | | 142,600 | | | 88,982 |
| | | | | | 2,893,482 |
| Turkey – 0.31% | | | | | |
| Akbank TAS | | 94,566 | | | 53,712 |
| Arcelik | | 361,106 | | | 1,463,273 |
| Ford Otomotiv Sanayi | | 33,017 | | | 772,919 |
| Haci Omer Sabanci | | | | | |
| Holding | | 328,815 | | | 342,464 |
| Petkim Petrokimya | | | | | |
| Holding † | | 36,766 | | | 25,602 |
| Tofas Turk Otomobil | | | | | |
| Fabrikasi | | 65,503 | | | 262,575 |
| | | | | | 2,920,545 |
| Ukraine – 0.43% | | | | | |
| Ferrexpo | | 781,368 | | | 4,035,168 |
| | | | | | 4,035,168 |
| United Kingdom – 5.34% | | | | | |
| BAE Systems | | 849,767 | | | 5,916,018 |
| Barclays | | 4,039,953 | | | 10,354,776 |
| Bloomsbury Publishing | | 7,978 | | | 31,456 |
| BP ADR | | 52,987 | | | 1,290,233 |
| CNH Industrial † | | 204,468 | | | 3,163,892 |
| Craneware | | 1,127 | | | 33,404 |
| Diageo | | 158,887 | | | 6,548,249 |
| Dignity † | | 11,611 | | | 105,646 |
| Dixons Carphone † | | 24,758 | | | 48,774 |
| Entain † | | 416,813 | | | 8,722,707 |
| GAN † | | 9,278 | | | 168,860 |
| Indivior † | | 339,509 | | | 594,420 |
| Just Group † | | 116,103 | | | 161,820 |
| Kingfisher † | | 93,630 | | | 410,856 |
| Mission Group | | 18,617 | | | 20,789 |
| Ninety One | | 13,874 | | | 45,675 |
| RELX | | 233,503 | | | 5,865,417 |
| Unilever | | 112,194 | | | 6,273,441 |
| | | | | | 49,756,433 |
| United States – 2.75% | | | | | |
| Atlassian Class A † | | 5,085 | | | 1,071,715 |
| Carnival † | | 330,135 | | | 8,761,783 |
| Core Laboratories * | | 174,357 | | | 5,019,738 |
| Everest Re Group | | 20,287 | | | 5,027,321 |
| Inmode † | | 24,240 | | | 1,754,249 |
| James Hardie Industries | | | | | |
| CDI | | 23,324 | | | 705,795 |
| Jasper Infotech =, †, π | | 1,420 | | | 203,917 |
| Jasper Infotech Series G | | | | | |
| =, †, π | | 470 | | | 67,494 |
| Tenaris | | 233,437 | | | 2,631,300 |
| Viemed Healthcare † | | 39,000 | | | 396,610 |
| | | | | | 25,639,922 |
| Total Common Stock | | | | | |
| (cost $764,253,470) | | | | | 897,612,849 |
| | | | | | |
| Preferred Stock – 1.47%Δ | | | | | |
| Brazil – 0.25% | | | | | |
| Braskem Class A †, ** | | 294,300 | | | 2,089,352 |
| Cia Ferro Ligas da Bahia | | | | | |
| 2.74% ** | | 10,200 | | | 61,831 |
| Taurus Armas †, ** | | 40,700 | | | 161,248 |
| | | | | | 2,312,431 |
| Germany – 1.22% | | | | | |
| Sartorius 0.17% ** | | 9,714 | | | 4,843,711 |
| Schaeffler 5.75% ** | | 50,164 | | | 445,911 |
| Volkswagen 2.03% ** | | 21,717 | | | 6,076,552 |
| | | | | | 11,366,174 |
| Total Preferred Stock | | | | | |
| (cost $13,698,023) | | | | | 13,678,605 |
| | | | | | |
| Rights – 0.01%Δ | | | | | |
| Brazil – 0.00% | | | | | |
| Eternit, expiration date | | | | | |
| 5/3/2021 † | | 21,623 | | | 28,390 |
| | | | | | 28,390 |
98
Table of Contents
| | | | | Number of
shares | | | Value (US $) |
| RightsΔ (continued) | | | | | |
| Chile – 0.01% | | | | | |
| Sociedad Quimica y | | | | | |
| | Minera de Chile, | | | | | |
| | expiration date 4/26/ | | | | | |
| | 21 † | | 16,644 | | $ | 51,596 |
| | | | | | | 51,596 |
| Total Rights | | | | | |
| (cost $0) | | | | | 79,986 |
| | | | | | | |
| Short-Term Investments – 1.50% | | | | | |
| Money Market Mutual Funds – 1.50% | | | | | |
| BlackRock FedFund – | | | | | |
| | Institutional Shares | | | | | |
| | (seven-day effective | | | | | |
| | yield 0.01%) | | 3,497,580 | | | 3,497,580 |
| Fidelity Investments | | | | | |
| | Money Market | | | | | |
| | Government Portfolio | | | | | |
| | – Class I (seven-day | | | | | |
| | effective yield 0.01%) | | 3,497,578 | | | 3,497,578 |
| GS Financial Square | | | | | |
| | Government Fund – | | | | | |
| | Institutional Shares | | | | | |
| | (seven-day effective | | | | | |
| | yield 0.03%) | | 3,497,578 | | | 3,497,578 |
| Morgan Stanley | | | | | |
| | Government Portfolio | | | | | |
| | – Institutional Share | | | | | |
| | Class (seven-day | | | | | |
| | effective yield 0.00%) | | 3,497,579 | | | 3,497,579 |
| Total Short-Term Investments | | | | | |
| (cost $13,990,315) | | | | | 13,990,315 |
| Total Value of Securities Before Securities Lending Collateral–99.32% | | | | | |
| (cost $791,941,808) | | | | | 925,361,755 |
| | | | | | | |
| | | | Principal
amount° | | | |
| Securities Lending Collateral*** – 1.79% | | | | | |
| Certificates of Deposit – 0.16% | | | | | |
| National Australia Bank | | | | | |
| | (London) | | | | | |
| | 0.07% 4/1/2021 | | 750,000 | | | 750,000 |
| Royal Bank of Canada | | | | | |
| | (Toronto) | | | | | |
| | 0.02% 4/1/2021 | | 750,000 | | | 750,000 |
| | | | | | | 1,500,000 |
| Repurchase Agreements - 1.63% | | | | | |
| Bank of Montreal | | | | | |
| | 0.00%, dated | | | | | |
| | 3/31/21, to be | | | | | |
| | repurchased on | | | | | |
| | 4/1/21, repurchase | | | | | |
| | price $3,876,828 | | | | | |
| | (collateralized by US | | | | | |
| | government | | | | | |
| | obligations | | | | | |
| | 0.125%-2.625% | | | | | |
| | 10/31/21-10/15/25; | | | | | |
| | market value | | | | | |
| | $3,954,368) | | 3,876,828 | | | 3,876,828 |
| Bank of Nova Scotia | | | | | |
| | 0.01%, dated | | | | | |
| | 3/31/21, to be | | | | | |
| | repurchased on | | | | | |
| | 4/1/21, repurchase | | | | | |
| | price $3,876,829 | | | | | |
| | (collateralized by US | | | | | |
| | government | | | | | |
| | obligations | | | | | |
| | 0.00%-8.00% | | | | | |
| | 4/1/21-10/31/25; | | | | | |
| | market value | | | | | |
| | $3,954,370) | | 3,876,828 | | | 3,876,828 |
| BofA Securities | | | | | |
| | 0.00%, dated | | | | | |
| | 3/31/21, to be | | | | | |
| | repurchased on | | | | | |
| | 4/1/21, repurchase | | | | | |
| | price $3,876,828 | | | | | |
| | (collateralized by US | | | | | |
| | government | | | | | |
| | obligations 2.00% | | | | | |
| | 11/30/22; market | | | | | |
| | value $3,954,368) | | 3,876,828 | | | 3,876,828 |
99
Table of Contents
Schedules of investments
Optimum International Fund
| | | | | Principal
amount° | | | Value (US $) |
| Securities Lending Collateral*** (continued) | | | | | |
| Repurchase Agreements (continued) | | | | | |
| JP Morgan Securities | | | | | |
| | 0.01%, dated | | | | | |
| | 3/31/21, to be | | | | | |
| | repurchased on | | | | | |
| | 4/1/21, repurchase | | | | | |
| | price $3,526,124 | | | | | |
| | (collateralized by US | | | | | |
| | government | | | | | |
| | obligations | | | | | |
| | 0.125%-2.50% | | | | | |
| | 1/15/22-2/15/26; | | | | | |
| | market value | | | | | |
| | $3,596,645) | | 3,526,123 | | $ | 3,526,123 |
| | | | | | | 15,156,607 |
| Total Securities Lending Collateral | | | | | |
| (cost $16,656,607) | | | | | 16,656,607 |
| Total Value of Securities-101.11% | | | | | |
| (cost $808,598,415) | | | | $ | 942,018,362◼ |
| Δ | Securities have been classified by country of origin. Aggregate classification by business sector has been presented on page 39 in “Security type / country and sector allocations.” |
| * | Fully or partially on loan. |
| † | Non-income producing security. |
| = | The value of this security was determined using significant unobservable inputs and is reported as a Level 3 security in the disclosure table located in Note 3 in “Notes to financial statements.” |
| π | Restricted security. These investments are in securities not registered under the Securities Act of 1933, as amended, and have certain restrictions on resale which may limit their liquidity. At March 31, 2021, the aggregate value of restricted securities was $271,411, which represented 0.03% of the Fund’s net assets. See Note 10 in “Notes to financial statements” and the table below, for additional details on restricted securities. |
| ** | Perpetual security with no stated maturity date. |
| ○ | Principal amount shown is stated in USD unless noted that the security is denominated in another currency. |
| *** | See Note 8 in “Notes to financial statements” for additional information on securities lending collateral and non-cash collateral. |
| ◼ | Includes $29,141,339 of securities loaned for which the counterparty pledged additional non-cash collateral valued at $13,355,239. |
Restricted Securities
| Investments | | Date of Acquisition | | Cost | | Value |
| Jasper Infotech | | | 5/7/14 | | | $ | 999,482 | | $ | 203,917 |
| Jasper Infotech Series G | | | 10/29/14 | | | | 396,443 | | | 67,494 |
| Total | | | | | | $ | 1,395,925 | | $ | 271,411 |
The following foreign currency exchange contracts were outstanding at March 31, 2021:1
Foreign Currency Exchange Contracts
| Counterparty | | Currency to
Receive (Deliver) | | In Exchange For | | Settlement
Date | | Unrealized
Appreciation | | Unrealized
Depreciation |
| BBH | | EUR | | (770,037 | ) | | | USD | | 902,068 | | | | 4/1/21 | | $ | — | | $ | (974 | ) |
| BBH | | EUR | | 48,893 | | | | USD | | (57,430 | ) | | | 4/6/21 | | | — | | | (86 | ) |
| BBH | | EUR | | 404,699 | | | | USD | | (474,263 | ) | | | 4/1/21 | | | 338 | | | — | |
| BBH | | GBP | | 248,341 | | | | USD | | (340,808 | ) | | | 4/1/21 | | | 1,556 | | | — | |
| BBH | | GBP | | 358,589 | | | | USD | | (494,467 | ) | | | 4/6/21 | | | — | | | (107 | ) |
| Total Foreign Currency Exchange Contracts | | | | | | | | | | | | $ | 1,894 | | $ | (1,167 | ) |
The use of foreign currency exchange contracts involves elements of market risk and risks in excess of the amounts disclosed in the financial statements. The foreign currency exchange contracts presented above represent the Fund’s total exposure in such contracts, whereas only the net unrealized appreciation (depreciation) is reflected in the Fund’s net assets.
1See Note 7 in “Notes to financial statements.”
Summary of abbreviations:
ADR – American Depositary Receipt
AG – Aktiengesellschaft
BBH – Brown Brothers Harriman & Co.
100
Table of Contents
Summary of abbreviations: (continued)
CDI – CHESS Depositary Interest
GS – Goldman Sachs
NVDR – Non-Voting Depositary Receipt
SDR – Special Drawing Right
Summary of currencies:
EUR – European Monetary Unit
GBP – British Pound Sterling
USD – US Dollar
See accompanying notes, which are an integral part of the financial statements.
101
Table of Contents
Schedules of investments
Optimum Large Cap Growth Fund
March 31, 2021
| | | | | Number of
shares | | | Value (US $) |
| Common Stock – 98.94% ♦ | | | | | |
| Communication Services – 15.99% | | | | | |
| Activision Blizzard | | 37,750 | | $ | 3,510,750 |
| Alphabet Class A † | | 17,600 | | | 36,300,352 |
| Alphabet Class C † | | 14,810 | | | 30,636,410 |
| Comcast Class A | | 222,450 | | | 12,036,769 |
| Facebook Class A † | | 382,735 | | | 112,726,939 |
| IAC † | | 7,116 | | | 1,539,262 |
| Kuaishou Technology | | | | | |
| | 144A #, † | | 12,500 | | | 434,134 |
| Match Group † | | 50,063 | | | 6,877,655 |
| Netflix † | | 39,995 | | | 20,863,792 |
| Pinterest Class A † | | 50,787 | | | 3,759,762 |
| Playtika Holding † | | 54,466 | | | 1,482,020 |
| ROBLOX Class A † | | 13,045 | | | 845,707 |
| Sea ADR † | | 122,159 | | | 27,269,554 |
| Snap Class A † | | 346,579 | | | 18,122,616 |
| Spotify Technology † | | 20,067 | | | 5,376,953 |
| Tencent Holdings | | 113,400 | | | 8,898,007 |
| Walt Disney † | | 99,010 | | | 18,269,325 |
| | | | | | | 308,950,007 |
| Consumer Discretionary – 22.67% | | | | | |
| Advance Auto Parts | | 77,730 | | | 14,262,678 |
| Airbnb Class B =, †, π | | 73,482 | | | 13,547,890 |
| Alibaba Group Holding | | | | | |
| | ADR † | | 151,055 | | | 34,248,700 |
| Amazon.com † | | 58,230 | | | 180,168,278 |
| Aptiv | | 126,282 | | | 17,414,288 |
| Booking Holdings † | | 8,544 | | | 19,906,153 |
| Carvana † | | 14,581 | | | 3,826,054 |
| Chipotle Mexican Grill † | | 4,114 | | | 5,845,254 |
| Coupang † | | 51,198 | | | 2,526,621 |
| DoorDash Class A † | | 30,822 | | | 4,041,689 |
| DraftKings Class A † | | 65,261 | | | 4,002,457 |
| Farfetch Class A † | | 87,763 | | | 4,653,194 |
| Ferrari | | 39,731 | | | 8,314,904 |
| Home Depot | | 79,550 | | | 24,282,638 |
| JD Health International | | | | | |
| | 144A #, † | | 9,250 | | | 132,668 |
| Las Vegas Sands † | | 90,142 | | | 5,477,028 |
| Lululemon Athletica † | | 23,272 | | | 7,137,755 |
| | NIKE Class B | | 64,216 | | | 8,533,664 |
| Ross Stores | | 116,967 | | | 14,025,513 |
| Tesla † | | 39,573 | | | 26,431,994 |
| Tractor Supply | | 73,110 | | | 12,946,319 |
| Ulta Beauty † | | 55,415 | | | 17,132,656 |
| Wynn Resorts † | | 71,982 | | | 9,024,383 |
| | | | | | | 437,882,778 |
| Consumer Staples – 1.13% | | | | | |
| Anheuser-Busch | | | | | |
| | InBev ADR | | 126,790 | | | 7,968,752 |
| Monster Beverage † | | 152,880 | | | 13,925,839 |
| | | | | | | 21,894,591 |
| Financials – 0.77% | | | | | |
| Chubb | | 6,847 | | | 1,081,620 |
| MSCI Class A | | 4,853 | | | 2,034,766 |
| S&P Global | | 17,002 | | | 5,999,496 |
| Tradeweb Markets | | | | | |
| | Class A | | 27,138 | | | 2,008,212 |
| XP Class A † | | 98,669 | | | 3,716,861 |
| | | | | | | 14,840,955 |
| Healthcare – 11.74% | | | | | |
| Alcon (New York Stock | | | | | |
| | Exchange) † | | 168,080 | | | 11,795,854 |
| Align Technology † | | 3,200 | | | 1,732,896 |
| Amgen | | 83,750 | | | 20,837,838 |
| Anthem | | 21,253 | | | 7,628,764 |
| Argenx ADR † | | 7,080 | | | 1,949,761 |
| AstraZeneca ADR | | 108,800 | | | 5,409,536 |
| Avantor † | | 105,805 | | | 3,060,939 |
| BioMarin | | | | | |
| | Pharmaceutical † | | 94,190 | | | 7,112,287 |
| Cigna | | 52,161 | | | 12,609,400 |
| Eli Lilly and Co. | | 58,560 | | | 10,940,179 |
| HCA Healthcare | | 43,450 | | | 8,183,373 |
| Humana | | 9,516 | | | 3,989,583 |
| Incyte † | | 38,961 | | | 3,166,361 |
| Intuitive Surgical † | | 17,124 | | | 12,653,609 |
| Stryker | | 50,895 | | | 12,397,004 |
| Thermo Fisher Scientific | | 50,530 | | | 23,060,881 |
| UnitedHealth Group | | 135,514 | | | 50,420,694 |
| Vertex | | | | | |
| | Pharmaceuticals † | | 38,267 | | | 8,223,196 |
| Zoetis | | 137,230 | | | 21,610,980 |
| | | | | | | 226,783,135 |
| Industrials – 7.61% | | | | | |
| Airbus † | | 32,414 | | | 3,669,669 |
| Cintas | | 19,309 | | | 6,590,355 |
| Clarivate † | | 55,676 | | | 1,469,290 |
| Cummins | | 17,615 | | | 4,564,223 |
| Equifax | | 5,497 | | | 995,672 |
| FedEx | | 33,675 | | | 9,565,047 |
| Generac Holdings † | | 8,100 | | | 2,652,345 |
| IHS Markit | | 171,806 | | | 16,627,385 |
| Norfolk Southern | | 10,008 | | | 2,687,348 |
| Parker-Hannifin | | 964 | | | 304,074 |
| Raytheon Technologies | | 178,690 | | | 13,807,376 |
| Roper Technologies | | 29,830 | | | 12,031,632 |
| Southwest Airlines † | | 56,084 | | | 3,424,489 |
102
Table of Contents
| | | | Number of
shares | | | Value (US $) |
| Common Stock ♦ (continued) | | | | | |
| Industrials (continued) | | | | | |
| Teledyne Technologies † | | 21,110 | | $ | 8,732,151 |
| TransUnion | | 46,991 | | | 4,229,190 |
| Uber Technologies † | | 353,645 | | | 19,277,189 |
| United Parcel Service | | | | | |
| Class B | | 121,780 | | | 20,701,382 |
| WW Grainger | | 39,170 | | | 15,704,428 |
| | | | | | 147,033,245 |
| Information Technology – 37.47% | | | | | |
| Adobe † | | 58,940 | | | 28,018,308 |
| Advanced Micro | | | | | |
| Devices † | | 97,650 | | | 7,665,525 |
| Affirm Holdings † | | 4,704 | | | 332,667 |
| Afterpay † | | 59,441 | | | 4,582,564 |
| Akamai Technologies † | | 120,295 | | | 12,258,060 |
| Apple | | 748,482 | | | 91,427,076 |
| ASML Holding | | 41,485 | | | 25,611,180 |
| Atlassian Class A † | | 53,600 | | | 11,296,736 |
| Avalara † | | 23,515 | | | 3,137,606 |
| Black Knight † | | 60,735 | | | 4,493,783 |
| Coupa Software † | | 4,268 | | | 1,086,121 |
| Datadog Class A † | | 29,055 | | | 2,421,444 |
| Fidelity National | | | | | |
| Information Services | | 174,996 | | | 24,606,188 |
| Fiserv † | | 102,564 | | | 12,209,219 |
| Global Payments | | 52,423 | | | 10,567,428 |
| Intuit | | 45,710 | | | 17,509,673 |
| Mastercard Class A | | 76,418 | | | 27,208,629 |
| Microsoft | | 559,045 | | | 131,806,040 |
| Nutanix Class A † | | 205,330 | | | 5,453,565 |
| NVIDIA | | 55,057 | | | 29,396,584 |
| NXP Semiconductors | | 66,900 | | | 13,469,646 |
| Palo Alto Networks † | | 55,070 | | | 17,735,844 |
| Paycom Software † | | 6,297 | | | 2,330,268 |
| PayPal Holdings † | | 47,869 | | | 11,624,508 |
| QUALCOMM | | 169,480 | | | 22,471,353 |
| salesforce.com † | | 186,038 | | | 39,415,871 |
| ServiceNow † | | 22,313 | | | 11,158,954 |
| Shopify Class A † | | 3,568 | | | 3,947,992 |
| Snowflake Class A † | | 3,058 | | | 701,138 |
| Splunk † | | 160,892 | | | 21,797,648 |
| StoneCo Class A † | | 36,566 | | | 2,238,570 |
| Taiwan Semiconductor | | | | | |
| Manufacturing ADR | | 65,747 | | | 7,776,555 |
| Texas Instruments | | 62,260 | | | 11,766,517 |
| Visa Class A | | 333,132 | | | 70,534,038 |
| VMware Class A † | | 81,170 | | | 12,212,026 |
| Wix.com † | | 4,294 | | | 1,198,971 |
| Workday Class A † | | 60,025 | | | 14,912,011 |
| Zebra Technologies | | | | | |
| Class A † | | 5,165 | | | 2,505,955 |
| Zoom Video | | | | | |
| Communications | | | | | |
| Class A † | | 15,785 | | | 5,071,563 |
| | | | | | 723,957,824 |
| Materials – 0.84% | | | | | |
| Ecolab | | 58,280 | | | 12,476,000 |
| Linde | | 13,260 | | | 3,714,656 |
| | | | | | 16,190,656 |
| Real Estate – 0.72% | | | | | |
| Equinix | | 20,500 | | | 13,931,595 |
| | | | | | 13,931,595 |
| Total Common Stock | | | | | |
| (cost $1,131,414,883) | | | | | 1,911,464,786 |
| | | | | | | |
| Convertible Preferred Stock – 0.09% | | | | | |
| Magic Leap Series C =, | | | | | |
| †, π | | 43,435 | | | 100,044 |
| WeWork Companies | | | | | |
| Series E =, †, π | | 20,913 | | | 235,058 |
| Xiaoju Kuaizhi =, †, π | | 32,416 | | | 1,357,452 |
| Total Convertible Preferred Stock | | | | | |
| (cost $2,577,306) | | | | | 1,692,554 |
| | | | | | |
| Short-Term Investments – 1.10% | | | | | |
| Money Market Mutual Funds – 1.10% | | | |
| BlackRock FedFund – | | | | | |
| Institutional Shares | | | | | |
| (seven-day effective | | | | | |
| yield 0.01%) | | 5,301,614 | | | 5,301,614 |
| Fidelity Investments | | | | | |
| Money Market | | | | | |
| Government Portfolio | | | | | |
| – Class I (seven-day | | | | | |
| effective yield 0.01%) | | 5,301,617 | | | 5,301,617 |
| GS Financial Square | | | | | |
| Government Fund – | | | | | |
| Institutional Shares | | | | | |
| (seven-day effective | | | | | |
| yield 0.03%) | | 5,301,617 | | | 5,301,617 |
103
Table of Contents
Schedules of investments
Optimum Large Cap Growth Fund
| | | | Number of | | | |
| | | | | shares | | Value (US $) |
| Short-Term Investments (continued) | | | |
| Money Market Mutual Funds (continued) | | | |
| Morgan Stanley | | | | |
| | Government Portfolio | | | | | |
| | – Institutional Share | | | | | |
| | Class (seven-day | | | | | |
| | effective yield 0.00%) | | 5,301,616 | | $ | 5,301,616 |
| Total Short-Term Investments | | | | |
| (cost $21,206,464) | | | | | 21,206,464 |
| Total Value of | | | | | |
| Securities–100.13% | | | | | |
| (cost $1,155,198,653) | | | | $ | 1,934,363,804 |
|
| ◆ | Narrow industries are utilized for compliance purposes for diversification whereas broad sectors are used for financial reporting. |
| † | Non-income producing security. |
| # | Security exempt from registration under Rule 144A of the Securities Act of 1933, as amended. At March 31, 2021, the aggregate value of Rule 144A securities was $566,802, which represents 0.03% of the Fund’s net assets. See Note 10 in “Notes to financial statements.” |
| = | The value of this security was determined using significant unobservable inputs and is reported as a Level 3 security in the disclosure table located in Note 3 in “Notes to financial statements.” |
| π | Restricted security. These investments are in securities not registered under the Securities Act of 1933, as amended, and have certain restrictions on resale which may limit their liquidity. At March 31, 2021, the aggregate value of restricted securities was $15,240,444, which represented 0.79% of the Fund’s net assets. See Note 10 in “Notes to financial statements” and the following table, for additional details on restricted securities. |
Restricted Securities
| Investments | | Date of Acquisition | | Cost | | Value |
| Airbnb Class B | | 12/10/20 | | $ | 2,208,800 | | $ | 13,547,890 |
| Magic Leap | | 1/20/16 | | | 1,000,438 | | | 100,044 |
| WeWork Companies Series E | | 6/23/15 | | | 687,820 | | | 235,058 |
| Xiaoju Kuaizhi | | 10/19/15 | | | 889,048 | | | 1,357,452 |
| Total | | | | $ | 4,786,106 | | $ | 15,240,444 |
The following foreign currency exchange contracts were outstanding at March 31, 2021:1
Foreign Currency Exchange Contracts
| | Currency to | | | | | Settlement | | Unrealized |
| Counterparty | | Receive (Deliver) | | In Exchange For | | Date | | Depreciation |
| BNYM | | HKD | | (841,425) | | USD | 108,231 | | 4/7/21 | | $ | (4) |
The use of foreign currency exchange contracts involves elements of market risk and risks in excess of the amounts disclosed in the financial statements. The foreign currency exchange contract presented above represents the Fund’s total exposure in such contracts, whereas only the net unrealized appreciation (depreciation) is reflected in the Fund’s net assets.
1See Note 7 in “Notes to financial statements.”
Summary of abbreviations:
ADR – American Depositary Receipt
BNYM – Bank of New York Mellon
GS – Goldman Sachs
MSCI – Morgan Stanley Capital International
S&P – Standard & Poor’s Financial Services LLC
Summary of currencies:
HKD – Hong Kong Dollar
USD – US Dollar
See accompanying notes, which are an integral part of the financial statements.
104
Table of Contents
Optimum Large Cap Value Fund
March 31, 2021
| | | | Number of | | | |
| | | | | shares | | Value (US $) |
| Common Stock – 98.16% | | | | |
| Communication Services – 5.74% | | | | |
| Alphabet Class A † | 10,882 | | $ | 22,444,343 |
| Comcast Class A | | 894,202 | | | 48,385,270 |
| Verizon | | | | | |
| | Communications | | 346,511 | | | 20,149,615 |
| Walt Disney † | 72,549 | | | 13,386,741 |
| | | | | | | 104,365,969 |
| Consumer Discretionary – 4.68% | | | | |
| AutoZone † | | 7,527 | | | 10,570,166 |
| Darden Restaurants | | 66,301 | | | 9,414,742 |
| General Motors † | | 247,751 | | | 14,235,772 |
| Lowe’s | | 130,316 | | | 24,783,497 |
| Marriott International | | | | | |
| | Class A † | | 23,863 | | | 3,534,349 |
| PulteGroup | | 120,359 | | | 6,311,626 |
| Target | | 81,679 | | | 16,178,160 |
| | | | | | 85,028,312 |
| Consumer Staples – 5.32% | | | | |
| Archer-Daniels-Midland | | 83,744 | | | 4,773,408 |
| Colgate-Palmolive | | 70,917 | | | 5,590,387 |
| Diageo | | 301,717 | | | 12,434,737 |
| J M Smucker | | 19,204 | | | 2,429,882 |
| Kimberly-Clark | | 50,763 | | | 7,058,595 |
| Mondelez International | | | | | |
| | Class A | | 157,212 | | | 9,201,618 |
| Nestle | | 123,532 | | | 13,768,038 |
| PepsiCo | | 116,885 | | | 16,533,383 |
| Philip Morris | | | | | |
| | International | | 47,824 | | | 4,243,902 |
| Procter & Gamble | | 53,488 | | | 7,243,880 |
| Reckitt Benckiser Group | | 64,887 | | | 5,812,670 |
| Tyson Foods Class A | | 101,589 | | | 7,548,063 |
| | | | | | 96,638,563 |
| Energy – 3.65% | | | | | |
| Chevron | | 191,937 | | | 20,113,078 |
| ConocoPhillips | | 377,481 | | | 19,995,169 |
| EOG Resources | | 209,379 | | | 15,186,259 |
| Phillips 66 | | 79,905 | | | 6,515,454 |
| Pioneer Natural | | | | | |
| | Resources | | 28,754 | | | 4,566,710 |
| | | | | | | 66,376,670 |
| Financials – 24.34% | | | | | |
| Allstate | | 82,359 | | | 9,463,049 |
| American Express | | 143,358 | | | 20,276,555 |
| Aon Class A | | 89,967 | | | 20,702,306 |
| Bank of America | | 804,752 | | | 31,135,855 |
| Berkshire Hathaway | | | | | |
| | Class B † | | 40,256 | | | 10,284,200 |
| BlackRock | | 36,640 | | | 27,625,094 |
| Charles Schwab | | 211,365 | | | 13,776,771 |
| Chubb | | 112,561 | | | 17,781,261 |
| Citigroup | | 274,257 | | | 19,952,197 |
| Goldman Sachs Group | | 35,084 | | | 11,472,468 |
| Hartford Financial | | | | | |
| | Services Group | | 153,083 | | | 10,224,414 |
| Intercontinental | | | | | |
| | Exchange | | 101,038 | | | 11,283,924 |
| JPMorgan Chase & Co. | | 493,592 | | | 75,139,510 |
| Marsh & McLennan | | 133,101 | | | 16,211,702 |
| Moody’s | | 15,962 | | | 4,766,413 |
| Morgan Stanley | | 130,209 | | | 10,112,031 |
| Nasdaq | | 88,266 | | | 13,015,704 |
| PNC Financial Services | | | | | |
| | Group | | 65,122 | | | 11,423,050 |
| Progressive | | 82,558 | | | 7,893,370 |
| Prudential Financial | | 140,703 | | | 12,818,043 |
| State Street | | 178,786 | | | 15,019,812 |
| T Rowe Price Group | | 18,018 | | | 3,091,889 |
| Travelers | | 134,705 | | | 20,259,632 |
| Truist Financial | | 366,287 | | | 21,361,858 |
| US Bancorp | | 236,383 | | | 13,074,344 |
| Wells Fargo & Co. | | 367,313 | | | 14,350,919 |
| | | | | | | 442,516,371 |
| Healthcare – 16.85% | | | | | |
| Abbott Laboratories | | 119,259 | | | 14,291,999 |
| AbbVie | | 100,383 | | | 10,863,448 |
| AmerisourceBergen | | 88,612 | | | 10,462,419 |
| Boston Scientific † | | 219,673 | | | 8,490,361 |
| Bristol-Myers Squibb | | 223,315 | | | 14,097,876 |
| Cigna | | 127,209 | | | 30,751,504 |
| Danaher | | 62,427 | | | 14,051,069 |
| Eli Lilly and Co. | | 46,443 | | | 8,676,481 |
| Hill-Rom Holdings | | 79,442 | | | 8,776,752 |
| Johnson & Johnson | | 327,553 | | | 53,833,335 |
| McKesson | | 43,915 | | | 8,565,182 |
| Medtronic | | 358,360 | | | 42,333,067 |
| Merck & Co. | | 285,353 | | | 21,997,863 |
| Pfizer | | 364,184 | | | 13,194,386 |
| Roche Holding | | 11,229 | | | 3,628,946 |
| Thermo Fisher Scientific | | 67,954 | | | 31,012,846 |
| UnitedHealth Group | | 30,485 | | | 11,342,554 |
| | | | | | | 306,370,088 |
| Industrials – 16.18% | | | | | |
| Canadian National | | | | | |
| | Railway | | 48,141 | | | 5,583,393 |
| Caterpillar | | 61,847 | | | 14,340,464 |
| Eaton | | 101,354 | | | 14,015,231 |
| Emerson Electric | | 110,632 | | | 9,981,219 |
105
Table of Contents
Schedules of investments
Optimum Large Cap Value Fund
| | | Number of | | | |
| | | | shares | | Value (US $) |
| Common Stock (continued) | | | | | |
| Industrials (continued) | | | | | |
| Equifax | | 47,926 | | $ | 8,680,836 |
| Honeywell International | | 171,846 | | | 37,302,611 |
| Illinois Tool Works | | 71,384 | | | 15,812,984 |
| Johnson Controls | | | | | |
| | International | | 202,387 | | | 12,076,432 |
| Kansas City Southern | | 54,007 | | | 14,253,528 |
| Lockheed Martin | | 42,403 | | | 15,667,909 |
| Masco | | 120,130 | | | 7,195,787 |
| Northrop Grumman | | 84,020 | | | 27,192,233 |
| Otis Worldwide | | 38,704 | | | 2,649,289 |
| Owens Corning | | 93,412 | | | 8,602,311 |
| Parker-Hannifin | | 53,245 | | | 16,795,070 |
| Quanta Services | | 151,103 | | | 13,294,042 |
| Raytheon Technologies | | 77,407 | | | 5,981,239 |
| Southwest Airlines † | | 180,732 | | | 11,035,496 |
| Stanley Black & Decker | | 55,189 | | | 11,019,588 |
| Textron | | 167,230 | | | 9,378,258 |
| Trane Technologies | | 119,836 | | | 19,840,048 |
| Union Pacific | | 61,601 | | | 13,577,476 |
| | | | | | 294,275,444 |
| Information Technology – 9.58% | | | | | |
| Accenture Class A | | 83,190 | | | 22,981,238 |
| Analog Devices | | 43,003 | | | 6,668,905 |
| Apple | | 40,342 | | | 4,927,775 |
| Broadcom | | 19,147 | | | 8,877,698 |
| Cisco Systems | | 198,485 | | | 10,263,659 |
| Fidelity National | | | | | |
| | Information Services | | 75,897 | | | 10,671,877 |
| Fiserv † | | 109,760 | | | 13,065,831 |
| Global Payments | | 64,676 | | | 13,037,388 |
| Intel | | 254,706 | | | 16,301,184 |
| Micron Technology † | | 146,381 | | | 12,912,268 |
| Microsoft | | 36,786 | | | 8,673,035 |
| NXP Semiconductors | | 40,778 | | | 8,210,243 |
| ON Semiconductor ��� | | 319,790 | | | 13,306,462 |
| Texas Instruments | | 128,773 | | | 24,336,809 |
| | | | | | 174,234,372 |
| Materials – 4.04% | | | | | |
| Air Products and | | | | | |
| | Chemicals | | 43,221 | | | 12,159,796 |
| DuPont de Nemours | | 76,931 | | | 5,945,228 |
| Huntsman | | 302,974 | | | 8,734,740 |
| International Flavors & | | | | | |
| | Fragrances | | 14,693 | | | 2,051,290 |
| Martin Marietta | | | | | |
| | Materials | | 35,734 | | | 12,000,192 |
| PPG Industries | | 102,947 | | | 15,468,816 |
| Sherwin-Williams | | 13,658 | | | 10,079,741 |
| Westrock | | 135,958 | | | 7,076,614 |
| | | | | | 73,516,417 |
| Real Estate – 2.04% | | | | | |
| American Tower | | 31,517 | | | 7,534,454 |
| Boston Properties | | 76,561 | | | 7,752,567 |
| Equity LifeStyle | | | | | |
| | Properties | | 90,962 | | | 5,788,822 |
| Prologis | | 122,483 | | | 12,983,198 |
| Public Storage | | 12,490 | | | 3,082,032 |
| | | | | | 37,141,073 |
| Utilities – 5.74% | | | | | |
| American Electric Power | | 79,532 | | | 6,736,360 |
| Dominion Energy | | 173,149 | | | 13,152,398 |
| DTE Energy | | 95,777 | | | 12,751,750 |
| Duke Energy | | 338,452 | | | 32,670,772 |
| NextEra Energy | | 92,888 | | | 7,023,262 |
| Southern | | 245,302 | | | 15,247,972 |
| Xcel Energy | | 252,955 | | | 16,824,037 |
| | | | | | 104,406,551 |
| Total Common Stock | | | | | |
| (cost $1,213,733,622) | | | | | 1,784,869,830 |
| |
| Short-Term Investments – 1.78% | | | |
| Money Market Mutual Funds – 1.78% | | | |
| BlackRock FedFund – | | | | | |
| | Institutional Shares | | | | | |
| | (seven-day effective | | | | | |
| | yield 0.01%) | | 8,120,363 | | | 8,120,363 |
| Fidelity Investments | | | | | |
| | Money Market | | | | | |
| | Government Portfolio | | | | | |
| | – Class I (seven-day | | | | | |
| | effective yield 0.01%) | | 8,120,363 | | | 8,120,363 |
| GS Financial Square | | | | | |
| | Government Fund – | | | | | |
| | Institutional Shares | | | | | |
| | (seven-day effective | | | | | |
| | yield 0.03%) | | 8,120,363 | | | 8,120,363 |
| Morgan Stanley | | | | | |
| | Government Portfolio | | | | | |
| | – Institutional Share | | | | | |
| | Class (seven-day | | | | | |
| | effective yield 0.00%) | | 8,120,363 | | | 8,120,363 |
| Total Short-Term Investments | | | | | |
| (cost $32,481,452) | | | | | 32,481,452 |
| Total Value of | | | | | |
| Securities–99.94% | | | | | |
| (cost $1,246,215,074) | | | | $ | 1,817,351,282 |
| † | Non-income producing security. |
106
Table of Contents
Summary of abbreviations:
GS – Goldman Sachs
See accompanying notes, which are an integral part of the financial statements.
107
Table of Contents
Schedules of investments
Optimum Small-Mid Cap Growth Fund
March 31, 2021
| | | Number of | | | |
| | | | shares | | Value (US $) |
| Common Stock – 97.17% ◆ | | | | | |
| Communication Services – 1.57% | | | | | |
| Cardlytics † | | 32,137 | | $ | 3,525,429 |
| Lions Gate | | | | | |
| | Entertainment | | | | | |
| | Class B † | | 105,210 | | | 1,357,209 |
| Zillow Group Class A † | | 29,317 | | | 3,851,667 |
| Zynga Class A † | | 305,184 | | | 3,115,929 |
| | | | | | 11,850,234 |
| Consumer Discretionary – 14.70% | | | |
| American Eagle | | | | | |
| | Outfitters | | 94,217 | | | 2,754,905 |
| Burlington Stores † | | 9,039 | | | 2,700,853 |
| Caesars Entertainment † | | 93,047 | | | 8,136,960 |
| Callaway Golf | | 80,709 | | | 2,158,966 |
| Cheesecake Factory † | | 109,574 | | | 6,411,175 |
| Deckers Outdoor † | | 24,843 | | | 8,208,624 |
| Extended Stay America | | 153,948 | | | 3,040,473 |
| Five Below † | | 32,366 | | | 6,175,109 |
| Floor & Decor Holdings | | | | | |
| | Class A † | | 98,503 | | | 9,405,066 |
| Fox Factory Holding † | | 19,377 | | | 2,462,042 |
| International Game | | | | | |
| | Technology † | | 154,284 | | | 2,476,258 |
| Media General CVR =, † | | 49,291 | | | 0 |
| Melco Resorts & | | | | | |
| | Entertainment ADR † | | 142,538 | | | 2,837,932 |
| Monro | | 26,545 | | | 1,746,661 |
| Newell Brands | | 168,120 | | | 4,502,254 |
| Norwegian Cruise Line | | | | | |
| | Holdings † | | 236,957 | | | 6,537,644 |
| Ollie’s Bargain Outlet | | | | | |
| | Holdings † | | 30,867 | | | 2,685,429 |
| Papa John’s | | | | | |
| | International | | 24,411 | | | 2,163,791 |
| Penn National Gaming † | | 42,971 | | | 4,505,080 |
| Revolve Group † | | 72,366 | | | 3,251,404 |
| Shake Shack Class A † | | 65,076 | | | 7,338,620 |
| Skyline Champion † | | 61,860 | | | 2,799,784 |
| Sleep Number † | | 27,122 | | | 3,891,736 |
| Sonos † | | 154,724 | | | 5,797,508 |
| Tapestry † | | 126,555 | | | 5,215,331 |
| Ulta Beauty † | | 12,928 | | | 3,996,950 |
| | | | | | 111,200,555 |
| Consumer Staples – 4.20% | | | | | |
| Coty Class A † | | 531,486 | | | 4,788,689 |
| elf Beauty † | | 359,417 | | | 9,643,158 |
| Hain Celestial Group † | | 196,757 | | | 8,578,605 |
| Performance Food | | | | | |
| | Group † | | 151,801 | | | 8,745,256 |
| | | | | | 31,755,708 |
| Financials – 9.56% | | | | | |
| Ally Financial | | 164,884 | | | 7,454,406 |
| Argo Group | | | | | |
| | International | | | | | |
| | Holdings | | 42,281 | | | 2,127,580 |
| BRP Group Class A † | | 96,792 | | | 2,637,582 |
| Essent Group | | 70,393 | | | 3,342,964 |
| Evercore Class A | | 22,843 | | | 3,009,337 |
| Focus Financial Partners | | | | | |
| | Class A † | | 69,677 | | | 2,899,957 |
| Goosehead Insurance | | | | | |
| | Class A | | 33,191 | | | 3,557,411 |
| OneMain Holdings | | 136,735 | | | 7,345,404 |
| Open Lending Class A † | | 44,388 | | | 1,572,223 |
| Palomar Holdings † | | 46,360 | | | 3,107,974 |
| Pinnacle Financial | | | | | |
| | Partners | | 65,508 | | | 5,807,939 |
| Stifel Financial | | 56,055 | | | 3,590,883 |
| SVB Financial Group † | | 28,233 | | | 13,937,503 |
| Tradeweb Markets | | | | | |
| | Class A | | 86,843 | | | 6,426,382 |
| Triumph Bancorp † | | 41,992 | | | 3,249,761 |
| Virtu Financial Class A | | 72,213 | | | 2,242,214 |
| | | | | | 72,309,520 |
| Healthcare – 25.17% | | | | | |
| Achilles Therapeutics | | | | | |
| | ADR † | | 55,247 | | | 914,338 |
| Adaptive | | | | | |
| | Biotechnologies † | | 46,446 | | | 1,869,916 |
| Aerie Pharmaceuticals † | | 187,569 | | | 3,351,858 |
| Allscripts Healthcare | | | | | |
| | Solutions † | | 160,614 | | | 2,411,619 |
| Alphatec Holdings † | | 356,446 | | | 5,628,282 |
| Amicus Therapeutics † | | 113,357 | | | 1,119,967 |
| AMN Healthcare | | | | | |
| | Services † | | 36,994 | | | 2,726,458 |
| Arena Pharmaceuticals † | | 24,098 | | | 1,672,160 |
| Arrowhead | | | | | |
| | Pharmaceuticals † | | 44,080 | | | 2,922,945 |
| AtriCure † | | 54,559 | | | 3,574,706 |
| Avantor † | | 142,491 | | | 4,122,265 |
| Axonics Modulation | | | | | |
| | Technologies † | | 202,202 | | | 12,109,878 |
| Axsome Therapeutics † | | 20,805 | | | 1,177,979 |
108
Table of Contents
| | | Number of | | | |
| | | | shares | | Value (US $) |
| Common Stock◆ (continued) | | | | | |
| Healthcare (continued) | | | | | |
| Biohaven | | | | | |
| Pharmaceutical | | | | | |
| Holding † | | 59,226 | | $ | 4,048,097 |
| Black Diamond | | | | | |
| Therapeutics † | | 30,208 | | | 732,846 |
| Blueprint Medicines † | | 41,383 | | | 4,023,669 |
| Cardiovascular | | | | | |
| Systems † | | 61,011 | | | 2,339,162 |
| Cerus † | | 241,084 | | | 1,448,915 |
| ChemoCentryx † | | 29,642 | | | 1,518,856 |
| CONMED | | 26,904 | | | 3,513,393 |
| Constellation | | | | | |
| Pharmaceuticals † | | 45,681 | | | 1,068,479 |
| Cytokinetics † | | 73,261 | | | 1,704,051 |
| Denali Therapeutics † | | 40,499 | | | 2,312,493 |
| Emergent BioSolutions † | | 23,138 | | | 2,149,752 |
| Evolent Health Class A † | | 124,483 | | | 2,514,557 |
| Exact Sciences † | | 46,002 | | | 6,062,143 |
| Fate Therapeutics † | | 61,678 | | | 5,085,351 |
| Haemonetics † | | 33,407 | | | 3,708,511 |
| HealthEquity † | | 37,501 | | | 2,550,068 |
| Horizon Therapeutics † | | 147,913 | | | 13,613,912 |
| ICON † | | 17,178 | | | 3,373,244 |
| Immunovant † | | 50,351 | | | 807,630 |
| Inspire Medical | | | | | |
| Systems † | | 36,601 | | | 7,576,041 |
| Insulet † | | 33,335 | | | 8,697,768 |
| Ionis Pharmaceuticals † | | 28,374 | | | 1,275,695 |
| Iovance | | | | | |
| Biotherapeutics † | | 39,188 | | | 1,240,692 |
| Mirati Therapeutics † | | 20,719 | | | 3,549,165 |
| NanoString | | | | | |
| Technologies † | | 26,916 | | | 1,768,650 |
| Natera † | | 91,040 | | | 9,244,202 |
| Novocure † | | 11,979 | | | 1,583,384 |
| Oak Street Health † | | 52,366 | | | 2,841,903 |
| Omnicell † | | 31,310 | | | 4,066,230 |
| OptimizeRx † | | 38,774 | | | 1,890,232 |
| Pacira BioSciences † | | 31,915 | | | 2,236,922 |
| PetIQ † | | 79,600 | | | 2,806,696 |
| Phreesia † | | 40,357 | | | 2,102,600 |
| PRA Health Sciences † | | 19,797 | | | 3,035,474 |
| Repligen † | | 18,678 | | | 3,631,190 |
| SI-BONE † | | 229,290 | | | 7,293,715 |
| Silk Road Medical † | | 61,141 | | | 3,096,792 |
| Syneos Health † | | 68,483 | | | 5,194,435 |
| Tabula Rasa | | | | | |
| HealthCare † | | 27,847 | | | 1,282,354 |
| Tactile Systems | | | | | |
| Technology † | | 45,875 | | | 2,499,729 |
| Theravance Biopharma † | | 80,381 | | | 1,640,576 |
| Turning Point | | | | | |
| Therapeutics † | | 15,875 | | | 1,501,616 |
| Ultragenyx | | | | | |
| Pharmaceutical † | | 18,649 | | | 2,123,375 |
| US Physical Therapy | | 19,428 | | | 2,022,455 |
| | | | | | 190,379,391 |
| Industrials – 16.55% | | | | | |
| A O Smith | | 18,676 | | | 1,262,684 |
| Advanced Drainage | | | | | |
| Systems | | 27,974 | | | 2,892,232 |
| Allegiant Travel † | | 28,355 | | | 6,920,321 |
| Altra Industrial Motion | | 94,970 | | | 5,253,740 |
| ASGN † | | 112,979 | | | 10,782,716 |
| Atkore † | | 35,733 | | | 2,569,203 |
| AZEK † | | 72,986 | | | 3,069,061 |
| Boise Cascade | | 61,603 | | | 3,685,708 |
| Chart Industries † | | 74,844 | | | 10,654,043 |
| Clarivate † | | 111,663 | | | 2,946,787 |
| CNH Industrial † | | 149,350 | | | 2,335,834 |
| Dycom Industries † | | 22,599 | | | 2,098,317 |
| FTI Consulting † | | 17,617 | | | 2,468,318 |
| Generac Holdings † | | 9,993 | | | 3,272,208 |
| Hayward Holdings † | | 130,189 | | | 2,197,590 |
| IAA † | | 36,215 | | | 1,996,895 |
| ICF International | | 39,174 | | | 3,423,808 |
| Ingersoll Rand † | | 76,088 | | | 3,744,291 |
| JetBlue Airways † | | 339,313 | | | 6,901,626 |
| KAR Auction Services † | | 87,723 | | | 1,315,845 |
| KBR | | 87,365 | | | 3,353,942 |
| Knight-Swift | | | | | |
| Transportation | | | | | |
| Holdings | | 49,323 | | | 2,371,943 |
| Kratos Defense & | | | | | |
| Security Solutions † | | 89,257 | | | 2,434,931 |
| Masonite International † | | 29,833 | | | 3,437,955 |
| Mercury Systems † | | 34,874 | | | 2,463,848 |
| Middleby † | | 20,174 | | | 3,343,841 |
| Oshkosh | | 36,449 | | | 4,325,038 |
| PGT Innovations † | | 88,435 | | | 2,232,984 |
| Schneider National | | | | | |
| Class B | | 91,408 | | | 2,282,458 |
| Spirit AeroSystems | | | | | |
| Holdings Class A | | 41,372 | | | 2,012,748 |
| SPX † | | 73,389 | | | 4,276,377 |
| Sun Country Airlines | | | | | |
| Holdings † | | 66,472 | | | 2,278,660 |
109
Table of Contents
Schedules of investments
Optimum Small-Mid Cap Growth Fund
| | | Number of | | | |
| | | | shares | | Value (US $) |
| Common Stock◆ (continued) | | | | | |
| Industrials (continued) | | | | | |
| Trex † | | 68,937 | | $ | 6,310,493 |
| Wabash National | | 117,970 | | | 2,217,836 |
| Woodward | | 17,218 | | | 2,077,007 |
| | | | | | 125,211,288 |
| Information Technology – 23.02% | | | | | |
| Ambarella † | | 80,393 | | | 8,070,653 |
| Anaplan † | | 149,153 | | | 8,031,889 |
| Arista Networks † | | 21,407 | | | 6,462,559 |
| Black Knight † | | 48,744 | | | 3,606,569 |
| Box Class A † | | 161,674 | | | 3,712,035 |
| Ciena † | | 85,494 | | | 4,678,232 |
| Cloudera † | | 162,519 | | | 1,977,856 |
| CMC Materials | | 14,385 | | | 2,543,124 |
| CommScope Holding † | | 183,607 | | | 2,820,204 |
| Cornerstone | | | | | |
| OnDemand † | | 55,090 | | | 2,400,822 |
| Cree † | | 53,102 | | | 5,741,919 |
| CyberArk Software † | | 22,725 | | | 2,939,252 |
| Enphase Energy † | | 29,478 | | | 4,780,152 |
| Evo Payments Class A † | | 85,573 | | | 2,354,969 |
| First Solar † | | 36,948 | | | 3,225,560 |
| Five9 † | | 19,869 | | | 3,106,121 |
| FormFactor † | | 51,117 | | | 2,305,888 |
| Littelfuse | | 34,538 | | | 9,133,229 |
| LiveRamp Holdings † | | 62,208 | | | 3,227,351 |
| Lumentum Holdings † | | 34,990 | | | 3,196,337 |
| MACOM Technology | | | | | |
| Solutions Holdings † | | 112,285 | | | 6,514,776 |
| MaxLinear † | | 92,790 | | | 3,162,283 |
| Mimecast † | | 57,042 | | | 2,293,659 |
| MongoDB † | | 12,926 | | | 3,456,800 |
| Nuance | | | | | |
| Communications † | | 285,552 | | | 12,461,489 |
| Onto Innovation † | | 47,358 | | | 3,111,894 |
| PagerDuty † | | 98,892 | | | 3,978,425 |
| PAR Technology † | | 37,268 | | | 2,437,700 |
| PTC † | | 44,096 | | | 6,069,814 |
| RingCentral Class A † | | 17,287 | | | 5,149,452 |
| Silicon Motion | | | | | |
| Technology ADR | | 42,642 | | | 2,532,508 |
| Sprout Social Class A † | | 42,577 | | | 2,459,248 |
| SS&C Technologies | | | | | |
| Holdings | | 69,976 | | | 4,889,223 |
| Talend ADR † | | 26,252 | | | 1,670,677 |
| Teradyne | | 58,202 | | | 7,082,019 |
| Verra Mobility † | | 98,915 | | | 1,338,815 |
| WEX † | | 10,791 | | | 2,257,693 |
| Zendesk † | | 105,563 | | | 13,999,765 |
| Zscaler † | | 14,862 | | | 2,551,360 |
| Zuora Class A † | | 164,983 | | | 2,441,748 |
| | | | | | 174,174,069 |
| Materials – 1.80% | | | | | |
| Element Solutions | | 428,175 | | | 7,831,321 |
| Orion Engineered | | | | | |
| Carbons † | | 135,165 | | | 2,665,454 |
| Steel Dynamics | | 61,927 | | | 3,143,414 |
| | | | | | 13,640,189 |
| Real Estate – 0.60% | | | | | |
| QTS Realty Trust Class A | | 32,693 | | | 2,028,274 |
| Ryman Hospitality | | | | | |
| Properties † | | 32,803 | | | 2,542,560 |
| | | | | | 4,570,834 |
| Total Common Stock | | | | | |
| (cost $546,137,235) | | | | | 735,091,788 |
| | | | | | |
| Convertible Preferred Stock – 0.16% | | | | | |
| Honest Series D =, †, π | | 15,249 | | | 457,470 |
| MarkLogic Series F =, †, π | | 83,588 | | | 777,368 |
| Total Convertible Preferred Stock | | | | | |
| (cost $1,668,525) | | | | | 1,234,838 |
| | | | | | |
| Warrant – 0.00% | | | | | |
| DraftKings strike price | | | | | |
| $25, expiration date | | | | | |
| 4/23/25 †, π | | 399 | | | 11,555 |
| Total Warrant | | | | | |
| (cost $0) | | | | | 11,555 |
| | | | | | |
| Short-Term Investments – 2.78% | | | | | |
| Money Market Mutual Funds – 2.78% | | | | | |
| BlackRock FedFund – | | | | | |
| Institutional Shares | | | | | |
| (seven-day effective | | | | | |
| yield 0.01%) | | 5,247,612 | | | 5,247,612 |
| Fidelity Investments | | | | | |
| Money Market | | | | | |
| Government Portfolio | | | | | |
| – Class I (seven-day | | | | | |
| effective yield 0.01%) | | 5,247,613 | | | 5,247,613 |
| GS Financial Square | | | | | |
| Government Fund – | | | | | |
| Institutional Shares | | | | | |
| (seven-day effective | | | | | |
| yield 0.03%) | | 5,247,613 | | | 5,247,613 |
110
Table of Contents
| | | Number of | | | |
| | | | shares | | Value (US $) |
| Short-Term Investments (continued) | | | | | |
| Money Market Mutual Funds (continued) | | | | | |
| Morgan Stanley | | | | | |
| Government Portfolio | | | | | |
| – Institutional Share | | | | | |
| Class (seven-day | | | | | |
| effective yield 0.00%) | | 5,247,612 | | $ | 5,247,612 |
| Total Short-Term Investments | | | | | |
| (cost $20,990,450) | | | | | 20,990,450 |
| Total Value of | | | | | |
| Securities–100.11% | | | | | |
| (cost $568,796,210) | | | | $ | 757,328,631 |
| ◆ | Narrow industries are utilized for compliance purposes for diversification whereas broad sectors are used for financial reporting. |
| † | Non-income producing security. |
| = | The value of this security was determined using significant unobservable inputs and is reported as a Level 3 security in the disclosure table located in Note 3 in “Notes to financial statements.” |
| π | Restricted security. These investments are in securities not registered under the Securities Act of 1933, as amended, and have certain restrictions on resale which may limit their liquidity. At March 31, 2021, the aggregate value of restricted securities was $1,246,393, which represented 0.16% of the Fund’s net assets. The Fund has various registration rights (exercisable under a variety of circumstances) with respect to these securities. See Note 10 in “Notes to financial statements” and the following table for additional details on restricted securities. |
Summary of abbreviations:
USD – US Dollar
Restricted Securities
| Investments | | Date of Acquisition | | Cost | | Value |
| DraftKings strike price $25, expiration date | | | | | | | | |
| 4/23/25 | | 5/18/20 | | $ | — | | $ | 11,555 |
| Honest Series D | | 8/3/15 | | | 697,718 | | | 457,470 |
| MarkLogic Series F | | 4/27/15 | | | 970,807 | | | 777,368 |
| Total | | | | $ | 1,668,525 | | $ | 1,246,393 |
Summary of abbreviations:
ADR – American Depositary Receipt
CVR – Contingent Voting Rights
GS – Goldman Sachs
See accompanying notes, which are an integral part of the financial statements.
111
Table of Contents
Schedules of investments
Optimum Small-Mid Cap Value Fund
March 31, 2021
| | | Number of | | | |
| | | | shares | | Value (US $) |
| Common Stock – 97.85% | | | | | |
| Communication Services – 4.08% | | | | | |
| AMC Networks | | | | | |
| Class A † | | 30,800 | | $ | 1,637,328 |
| Cars.com † | | 56,200 | | | 728,352 |
| Entercom | | | | | |
| Communications | | | | | |
| Class A † | | 206,300 | | | 1,083,075 |
| Gray Television † | | 65,200 | | | 1,199,680 |
| John Wiley & Sons | | | | | |
| Class A | | 118,577 | | | 6,426,873 |
| Lumen Technologies | | 93,300 | | | 1,245,555 |
| Nexstar Media Group | | | | | |
| Class A | | 108,620 | | | 15,253,507 |
| ViacomCBS Class B | | 37,200 | | | 1,677,720 |
| | | | | | 29,252,090 |
| Consumer Discretionary – 9.07% | | | | | |
| American Axle & | | | | | |
| Manufacturing | | | | | |
| Holdings † | | 114,200 | | | 1,103,172 |
| BorgWarner | | 41,200 | | | 1,910,032 |
| Brunswick | | 21,300 | | | 2,031,381 |
| Capri Holdings † | | 15,000 | | | 765,000 |
| Dick’s Sporting Goods | | 47,100 | | | 3,586,665 |
| Foot Locker | | 41,900 | | | 2,356,875 |
| Goodyear Tire & | | | | | |
| Rubber † | | 70,000 | | | 1,229,900 |
| H&R Block | | 40,400 | | | 880,720 |
| Harley-Davidson | | 43,800 | | | 1,756,380 |
| Haverty Furniture | | 43,900 | | | 1,632,641 |
| Helen of Troy † | | 15,675 | | | 3,302,096 |
| Kohl’s | | 25,100 | | | 1,496,211 |
| Lear | | 11,700 | | | 2,120,625 |
| Lithia Motors Class A | | 31,950 | | | 12,463,375 |
| Malibu Boats Class A † | | 22,900 | | | 1,824,672 |
| MDC Holdings | | 54,648 | | | 3,246,091 |
| Modine Manufacturing † | | 76,800 | | | 1,134,336 |
| Nordstrom † | | 28,400 | | | 1,075,508 |
| ODP † | | 29,100 | | | 1,259,739 |
| Penske Automotive | | | | | |
| Group | | 28,619 | | | 2,296,389 |
| PulteGroup | | 53,000 | | | 2,779,320 |
| PVH † | | 8,800 | | | 930,160 |
| Sally Beauty Holdings † | | 65,000 | | | 1,308,450 |
| Shoe Carnival | | 200 | | | 12,376 |
| Sleep Number † | | 14,600 | | | 2,094,954 |
| Sonic Automotive | | | | | |
| Class A | | 53,300 | | | 2,642,081 |
| Tenneco Class A † | | 26,400 | | | 283,008 |
| Toll Brothers | | 49,500 | | | 2,808,135 |
| Travel + Leisure | | 12,500 | | | 764,500 |
| Whirlpool | | 17,600 | | | 3,878,160 |
| | | | | | 64,972,952 |
| Consumer Staples – 4.76% | | | | | |
| Energizer Holdings | | 32,000 | | | 1,518,720 |
| Hostess Brands † | | 613,671 | | | 8,800,042 |
| Ingles Markets Class A | | 35,400 | | | 2,182,410 |
| Ingredion | | 30,700 | | | 2,760,544 |
| J M Smucker | | 25,500 | | | 3,226,515 |
| Molson Coors Beverage | | | | | |
| Class B † | | 46,900 | | | 2,398,935 |
| Nu Skin Enterprises | | | | | |
| Class A | | 16,800 | | | 888,552 |
| Pilgrim’s Pride † | | 76,400 | | | 1,817,556 |
| Spectrum Brands | | | | | |
| Holdings | | 64,862 | | | 5,513,270 |
| Sprouts Farmers | | | | | |
| Market † | | 92,100 | | | 2,451,702 |
| Universal | | 25,300 | | | 1,492,447 |
| Weis Markets | | 18,500 | | | 1,045,620 |
| | | | | | 34,096,313 |
| Energy – 2.01% | | | | | |
| Arch Resources † | | 10,300 | | | 428,480 |
| HollyFrontier | | 49,600 | | | 1,774,688 |
| Laredo Petroleum † | | 5,360 | | | 161,122 |
| National Energy Services | | | | | |
| Reunited † | | 118,000 | | | 1,459,660 |
| PBF Energy Class A † | | 50,100 | | | 708,915 |
| Pioneer Natural | | | | | |
| Resources | | 31,675 | | | 5,030,623 |
| Southwestern Energy † | | 230,000 | | | 1,069,500 |
| Viper Energy Partners | | 164,800 | | | 2,399,488 |
| World Fuel Services | | 39,900 | | | 1,404,480 |
| | | | | | 14,436,956 |
| Financials – 20.37% | | | | | |
| Ally Financial | | 91,200 | | | 4,123,152 |
| American Financial | | | | | |
| Group | | 27,780 | | | 3,169,698 |
| Annaly Capital | | | | | |
| Management | | 209,800 | | | 1,804,280 |
| Apollo Commercial Real | | | | | |
| Estate Finance | | 77,600 | | | 1,084,072 |
| Ares Capital | | 85,300 | | | 1,595,963 |
| Associated Banc-Corp | | 121,500 | | | 2,592,810 |
| Assured Guaranty | | 34,400 | | | 1,454,432 |
| Banco Latinoamericano | | | | | |
| de Comercio Exterior | | | | | |
| Class E | | 59,900 | | | 906,287 |
| BankUnited | | 34,200 | | | 1,503,090 |
112
Table of Contents
| | | Number of | | | |
| | | | shares | | Value (US $) |
| Common Stock (continued) | | | | | |
| Financials (continued) | | | | | |
| Berkshire Hills Bancorp | | 44,099 | | $ | 984,290 |
| BGC Partners Class A | | 1,397,800 | | | 6,751,374 |
| Brightsphere Investment | | | | | |
| Group | | 84,400 | | | 1,720,072 |
| Cathay General Bancorp | | 33,600 | | | 1,370,208 |
| CIT Group | | 43,900 | | | 2,261,289 |
| Citizens Financial Group | | 63,200 | | | 2,790,280 |
| CNA Financial | | 85,600 | | | 3,820,328 |
| CNO Financial Group | | 144,200 | | | 3,502,618 |
| Columbia Banking | | | | | |
| System | | 236,906 | | | 10,208,280 |
| Customers Bancorp † | | 58,809 | | | 1,871,302 |
| eHealth † | | 11,000 | | | 800,030 |
| Essent Group | | 26,800 | | | 1,272,732 |
| Everest Re Group | | 6,300 | | | 1,561,203 |
| First American Financial | | 38,200 | | | 2,164,030 |
| First Busey | | 70,400 | | | 1,805,760 |
| First Horizon | | 200,800 | | | 3,395,528 |
| First Merchants | | 136,069 | | | 6,327,208 |
| FS KKR Capital | | 57,750 | | | 1,145,182 |
| Hancock Whitney | | 31,300 | | | 1,314,913 |
| Hanmi Financial | | 56,800 | | | 1,120,664 |
| Heritage Insurance | | | | | |
| Holdings | | 27,300 | | | 302,484 |
| HomeStreet | | 39,900 | | | 1,758,393 |
| Hope Bancorp | | 122,400 | | | 1,843,344 |
| Lincoln National | | 33,300 | | | 2,073,591 |
| MGIC Investment | | 107,200 | | | 1,484,720 |
| New Mountain Finance | | 95,300 | | | 1,181,720 |
| New Residential | | | | | |
| Investment | | 109,700 | | | 1,234,125 |
| Oaktree Specialty | | | | | |
| Lending | | 4,294 | | | 26,623 |
| OFG Bancorp | | 60,700 | | | 1,373,034 |
| Pacific Premier Bancorp | | 151,645 | | | 6,587,459 |
| PacWest Bancorp | | 464,534 | | | 17,721,972 |
| Preferred Bank | | 20,500 | | | 1,305,440 |
| Prospect Capital | | 160,841 | | | 1,233,650 |
| Radian Group | | 69,500 | | | 1,615,875 |
| Reinsurance Group of | | | | | |
| America | | 17,800 | | | 2,243,690 |
| Santander Consumer | | | | | |
| USA Holdings | | 88,500 | | | 2,394,810 |
| Starwood Property Trust | | 506,686 | | | 12,535,412 |
| Synovus Financial | | 55,900 | | | 2,557,425 |
| TCF Financial | | 26,000 | | | 1,207,960 |
| Universal Insurance | | | | | |
| Holdings | | 41,300 | | | 592,242 |
| Unum Group | | 75,700 | | | 2,106,731 |
| Veritex Holdings | | 44,700 | | | 1,462,584 |
| Victory Capital Holdings | | | | | |
| Class A | | 39,300 | | | 1,004,508 |
| Voya Financial | | 25,200 | | | 1,603,728 |
| Zions Bancorp | | 74,400 | | | 4,089,024 |
| | | | | | 145,961,619 |
| Healthcare – 4.76% | | | | | |
| Catalyst | | | | | |
| Pharmaceuticals † | | 119,100 | | | 549,051 |
| Change Healthcare † | | 112,460 | | | 2,485,366 |
| DaVita † | | 22,800 | | | 2,457,156 |
| Hill-Rom Holdings | | 21,700 | | | 2,397,416 |
| Innoviva † | | 86,900 | | | 1,038,455 |
| Jazz Pharmaceuticals † | | 24,720 | | | 4,063,226 |
| Lannett † | | 44,200 | | | 233,376 |
| MEDNAX † | | 32,100 | | | 817,587 |
| Owens & Minor | | 49,800 | | | 1,871,982 |
| Quest Diagnostics | | 11,600 | | | 1,488,744 |
| Select Medical | | | | | |
| Holdings † | | 74,600 | | | 2,543,860 |
| Syneos Health † | | 131,392 | | | 9,966,083 |
| United Therapeutics † | | 10,700 | | | 1,789,789 |
| Universal Health Services | | | | | |
| Class B | | 17,920 | | | 2,390,349 |
| | | | | | 34,092,440 |
| Industrials – 15.77% | | | | | |
| ABM Industries | | 22,900 | | | 1,168,129 |
| ACCO Brands | | 146,000 | | | 1,232,240 |
| Acuity Brands | | 13,900 | | | 2,293,500 |
| Alaska Air Group † | | 24,800 | | | 1,716,408 |
| Allison Transmission | | | | | |
| Holdings | | 55,500 | | | 2,266,065 |
| Apogee Enterprises | | 36,200 | | | 1,479,856 |
| ArcBest | | 27,300 | | | 1,921,101 |
| Atkore † | | 107,948 | | | 7,761,461 |
| Atlas Air Worldwide | | | | | |
| Holdings † | | 24,100 | | | 1,456,604 |
| BWX Technologies | | 152,051 | | | 10,026,243 |
| Colfax † | | 280,762 | | | 12,300,183 |
| CoreCivic † | | 56,200 | | | 508,610 |
| Covenant Logistics | | | | | |
| Group † | | 49,201 | | | 1,013,049 |
| Crane | | 20,600 | | | 1,934,546 |
| Deluxe | | 29,800 | | | 1,250,408 |
| Ennis | | 45,800 | | | 977,830 |
| Hawaiian Holdings † | | 45,300 | | | 1,208,151 |
| Herman Miller | | 46,400 | | | 1,909,360 |
| Hillenbrand | | 31,174 | | | 1,487,312 |
113
Table of Contents
Schedules of investments
Optimum Small-Mid Cap Value Fund
| | | Number of | | | |
| | | shares | | Value (US $) |
| Common Stock (continued) | | | | | |
| Industrials (continued) | | | | | |
| | Huntington Ingalls | | | | | |
| Industries | | 12,300 | | $ | 2,531,955 |
| JetBlue Airways † | | 109,300 | | | 2,223,162 |
| Kaman | | 104,600 | | | 5,364,934 |
| KAR Auction Services † | | 482,682 | | | 7,240,230 |
| ManpowerGroup | | 26,300 | | | 2,601,070 |
| MasTec † | | 18,400 | | | 1,724,080 |
| Moog Class A | | 24,000 | | | 1,995,600 |
| Oshkosh | | 24,800 | | | 2,942,768 |
| Owens Corning | | 22,400 | | | 2,062,816 |
| Primoris Services | | 66,384 | | | 2,199,302 |
| Snap-on | | 9,300 | | | 2,145,882 |
| Teledyne Technologies † | | 15,200 | | | 6,287,480 |
| Textron | | 33,800 | | | 1,895,504 |
| Timken | | 37,000 | | | 3,003,290 |
| Trinity Industries | | 175,216 | | | 4,991,904 |
| Triton International | | 43,700 | | | 2,403,063 |
| XPO Logistics † | | 61,024 | | | 7,524,259 |
| | | | | | 113,048,355 |
| Information Technology – 14.39% | | | | | |
| ACI Worldwide † | | 273,678 | | | 10,413,448 |
| Amdocs | | 31,400 | | | 2,202,710 |
| Amkor Technology | | 102,600 | | | 2,432,646 |
| Arrow Electronics † | | 18,700 | | | 2,072,334 |
| Avaya Holdings † | | 47,400 | | | 1,328,622 |
| BM Technologies =, † | | 9,050 | | | 98,369 |
| Ciena † | | 26,900 | | | 1,471,968 |
| Cirrus Logic † | | 10,400 | | | 881,816 |
| Cognyte Software † | | 150,418 | | | 4,183,125 |
| Concentrix † | | 8,900 | | | 1,332,508 |
| CSG Systems | | | | | |
| International | | 18,200 | | | 816,998 |
| Diodes † | | 10,500 | | | 838,320 |
| Ebix | | 33,273 | | | 1,065,734 |
| Euronet Worldwide † | | 42,676 | | | 5,902,091 |
| J2 Global † | | 158,961 | | | 19,053,065 |
| Jabil | | 74,000 | | | 3,859,840 |
| Juniper Networks | | 67,300 | | | 1,704,709 |
| Methode Electronics | | 33,100 | | | 1,389,538 |
| NCR † | | 67,500 | | | 2,561,625 |
| NetApp | | 32,700 | | | 2,376,309 |
| NETGEAR † | | 23,600 | | | 969,960 |
| OSI Systems † | | 3,400 | | | 326,740 |
| Sanmina † | | 59,300 | | | 2,453,834 |
| Seagate Technology | | 17,100 | | | 1,312,425 |
| Silicon Motion | | | | | |
| Technology ADR | | 229,101 | | | 13,606,308 |
| Sykes Enterprises † | | 45,700 | | | 2,014,456 |
| SYNNEX | | 20,400 | | | 2,342,736 |
| TTM Technologies † | | 84,100 | | | 1,219,450 |
| Ultra Clean Holdings † | | 38,400 | | | 2,228,736 |
| Verint Systems † | | 174,714 | | | 7,947,740 |
| Western Union | | 51,400 | | | 1,267,524 |
| Xerox Holdings | | 61,300 | | | 1,487,751 |
| | | | | | 103,163,435 |
| Materials – 11.31% | | | | | |
| Arconic † | | 9,000 | | | 228,510 |
| Ashland Global | | | | | |
| Holdings | | 104,697 | | | 9,293,953 |
| Axalta Coating | | | | | |
| Systems † | | 358,496 | | | 10,604,312 |
| Berry Global Group † | | 42,300 | | | 2,597,220 |
| Cabot | | 33,903 | | | 1,777,873 |
| Celanese | | 14,200 | | | 2,127,302 |
| Chemours | | 49,500 | | | 1,381,545 |
| Domtar | | 32,500 | | | 1,200,875 |
| Eastman Chemical | | 19,400 | | | 2,136,328 |
| FMC | | 131,800 | | | 14,578,398 |
| Greif Class A | | 34,400 | | | 1,960,800 |
| Huntsman | | 70,700 | | | 2,038,281 |
| Kronos Worldwide | | 4,500 | | | 68,850 |
| O-I Glass † | | 59,800 | | | 881,452 |
| Reliance Steel & | | | | | |
| Aluminum | | 21,500 | | | 3,274,235 |
| Schweitzer-Mauduit | | | | | |
| International | | 32,700 | | | 1,601,319 |
| Silgan Holdings | | 396,464 | | | 16,663,382 |
| Steel Dynamics | | 57,300 | | | 2,908,548 |
| Trinseo | | 22,200 | | | 1,413,474 |
| Valvoline | | 71,400 | | | 1,861,398 |
| Westrock | | 48,000 | | | 2,498,400 |
| | | | | | 81,096,455 |
| Real Estate – 9.68% | | | | | |
| American Assets Trust | | 37,200 | | | 1,206,768 |
| Apple Hospitality REIT | | 68,979 | | | 1,005,024 |
| Brixmor Property Group | | 108,900 | | | 2,203,047 |
| CareTrust REIT | | 57,900 | | | 1,348,201 |
| City Office REIT | | 93,700 | | | 995,094 |
| Diversified Healthcare | | | | | |
| Trust | | 123,300 | | | 589,374 |
| Franklin Street | | | | | |
| Properties | | 93,612 | | | 510,185 |
| Gaming and Leisure | | | | | |
| Properties | | 292,644 | | | 12,416,885 |
| Howard Hughes † | | 84,200 | | | 8,009,946 |
| Industrial Logistics | | | | | |
| Properties Trust | | 63,789 | | | 1,475,439 |
114
Table of Contents
| | | Number of | | | |
| | | shares | | Value (US $) |
| Common Stock (continued) | | | | | |
| Real Estate (continued) | | | | | |
| | Invitation Homes | | 73,815 | | $ | 2,361,342 |
| Kite Realty Group Trust | | 80,900 | | | 1,560,561 |
| Medical Properties Trust | | 632,300 | | | 13,455,344 |
| National Health | | | | | |
| Investors | | 20,100 | | | 1,452,828 |
| Newmark Group | | | | | |
| Class A | | 495,528 | | | 4,957,758 |
| Office Properties Income | | | | | |
| Trust | | 45,688 | | | 1,257,334 |
| Omega Healthcare | | | | | |
| Investors | | 39,200 | | | 1,435,896 |
| Piedmont Office Realty | | | | | |
| Trust Class A | | 78,300 | | | 1,360,071 |
| Preferred Apartment | | | | | |
| Communities Class A | | 72,100 | | | 710,185 |
| Retail Properties of | | | | | |
| America Class A | | 73,900 | | | 774,472 |
| Retail Value | | 5,741 | | | 107,414 |
| RPT Realty | | 104,000 | | | 1,186,640 |
| Sabra Health Care REIT | | 112,200 | | | 1,947,792 |
| Service Properties Trust | | 104,300 | | | 1,236,998 |
| SITE Centers | | 50,650 | | | 686,814 |
| Summit Hotel | | | | | |
| Properties † | | 63,000 | | | 640,080 |
| Tanger Factory Outlet | | | | | |
| Centers | | 61,400 | | | 928,982 |
| VEREIT | | 61,580 | | | 2,378,220 |
| Xenia Hotels & Resorts † | | 60,500 | | | 1,179,750 |
| | | | | | 69,378,444 |
| Utilities – 1.65% | | | | | |
| MDU Resources Group | | 75,400 | | | 2,383,394 |
| National Fuel Gas | | 55,200 | | | 2,759,448 |
| NRG Energy | | 64,400 | | | 2,429,812 |
| UGI | | 45,200 | | | 1,853,652 |
| Vistra | | 136,200 | | | 2,408,016 |
| | | | | | 11,834,322 |
| Total Common Stock | | | | | |
| (cost $560,247,491) | | | | | 701,333,381 |
| | | | | | | |
| Limited Partnerships – 0.38% | | | | | |
| Rattler Midstream | | 253,600 | | | 2,695,768 |
| Total Limited Partnerships | | | | | |
| (cost $1,679,739) | | | | | 2,695,768 |
| | | | | | |
| Short-Term Investments – 1.71% | | | | | |
| Money Market Mutual Funds – 1.71% | | | | | |
| BlackRock FedFund – | | | | | |
| Institutional Shares | | | | | |
| (seven-day effective | | | | | |
| yield 0.01%) | | 3,069,475 | | | 3,069,475 |
| Fidelity Investments | | | | | |
| Money Market | | | | | |
| Government Portfolio | | | | | |
| – Class I (seven-day | | | | | |
| effective yield 0.01%) | | 3,069,475 | | | 3,069,475 |
| GS Financial Square | | | | | |
| Government Fund – | | | | | |
| Institutional Shares | | | | | |
| (seven-day effective | | | | | |
| yield 0.03%) | | 3,069,475 | | | 3,069,475 |
| Morgan Stanley | | | | | |
| Government Portfolio | | | | | |
| – Institutional Share | | | | | |
| Class (seven-day | | | | | |
| effective yield 0.00%) | | 3,069,474 | | | 3,069,474 |
| Total Short-Term Investments | | | | | |
| (cost $12,277,899) | | | | | 12,277,899 |
| Total Value of | | | | | |
| Securities–99.94% | | | | | |
| (cost $574,205,129) | | | | $ | 716,307,048 |
| † | Non-income producing security. |
| = | The value of this security was determined using significant unobservable inputs and is reported as a Level 3 security in the disclosure table located in Note 3 in “Notes to financial statements.” |
Summary of abbreviations:
ADR – American Depositary Receipt
GS – Goldman Sachs
REIT – Real Estate Investment Trust
See accompanying notes, which are an integral part of the financial statements.
115
Table of Contents
Statements of assets and liabilities
Optimum Fund Trust
March 31, 2021
| | | Optimum | | Optimum | | | Optimum | | Optimum | | Optimum | | Optimum |
| | | Fixed Income | | International | | | Large Cap | | Large Cap | | Small-Mid Cap | | Small-Mid Cap |
| | | Fund | | Fund | | Growth Fund | | Value Fund | | Growth Fund | | Value Fund |
| Assets: | | | | | | | | | | | | | | | | | | |
| | Investments, at value*,† | | $ | 3,339,440,288 | | $ | 925,361,755 | | $ | 1,934,363,804 | | $ | 1,817,351,282 | | $ | 757,328,631 | | $ | 716,307,048 |
| Short-term investments held | | | | | | | | | | | | | | | | | | |
| as collateral for loaned | | | | | | | | | | | | | | | | | | |
| securities, at value= | | | — | | | 16,656,607 | | | — | | | — | | | — | | | — |
| Cash | | | 7,540,516 | | | 3,908,006 | | | — | | | — | | | — | | | — |
| Cash collateral due from | | | | | | | | | | | | | | | | | | |
| brokers | | | 3,243,571 | | | — | | | — | | | — | | | — | | | — |
| Foreign currencies, at valueΔ | | | 4,330,244 | | | 305,536 | | | 189 | | | — | | | — | | | — |
| Receivable for securities sold | | | 398,691,525 | | | 3,922,461 | | | 2,920,549 | | | 498,167 | | | 1,059,748 | | | 617,627 |
| Dividends and interest | | | | | | | | | | | | | | | | | | |
| receivable | | | 13,711,485 | | | 2,663,649 | | | 233,500 | | | 1,921,243 | | | 60,122 | | | 1,013,064 |
| Receivable for fund shares | | | | | | | | | | | | | | | | | | |
| sold | | | 5,287,578 | | | 1,686,547 | | | 3,403,876 | | | 3,188,421 | | | 1,454,100 | | | 1,277,721 |
| Unrealized appreciation on | | | | | | | | | | | | | | | | | | |
| over the counter credit | | | | | | | | | | | | | | | | | | |
| default swap contracts | | | 1,002,914 | | | — | | | — | | | — | | | — | | | — |
| Unrealized appreciation on | | | | | | | | | | | | | | | | | | |
| foreign currency exchange | | | | | | | | | | | | | | | | | | |
| contracts | | | 998,116 | | | 1,894 | | | — | | | — | | | — | | | — |
| Variation margin due from | | | | | | | | | | | | | | | | | | |
| brokers on centrally cleared | | | | | | | | | | | | | | | | | | |
| interest rate swap contracts | | | 463,767 | | | — | | | — | | | — | | | — | | | — |
| Swap payments receivable | | | 175,223 | | | — | | | — | | | — | | | — | | | — |
| Variation margin due from | | | | | | | | | | | | | | | | | | |
| HSBC on futures contracts | | | 51,031 | | | — | | | — | | | — | | | — | | | — |
| Foreign tax reclaims | | | | | | | | | | | | | | | | | | |
| receivable | | | — | | | 1,807,780 | | | 37,176 | | | 334,128 | | | — | | | — |
| Securities lending income | | | | | | | | | | | | | | | | | | |
| receivable | | | — | | | 6,959 | | | — | | | — | | | — | | | — |
| Total Assets | | | 3,774,936,258 | | | 956,321,194 | | | 1,940,959,094 | | | 1,823,293,241 | | | 759,902,601 | | | 719,215,460 |
116
Table of Contents
| | | Optimum | | Optimum | | Optimum | | Optimum | | Optimum | | Optimum |
| | | Fixed Income | | International | | Large Cap | | Large Cap | | Small-Mid Cap | | Small-Mid Cap |
| | | Fund | | Fund | | Growth Fund | | Value Fund | | Growth Fund | | Value Fund |
| Liabilities: | | | | | | | | | | | | | | | | | | |
| | Options written, at valueΣ | | | 313,501 | | | — | | | — | | | — | | | — | | | — |
| Due to custodian | | | — | | | — | | | 295,471 | | | 247,962 | | | 127,510 | | | 107,353 |
| Payable for securities | | | | | | | | | | | | | | | | | | |
| purchased | | | 927,043,655 | | | 6,050,026 | | | 4,530,300 | | | 617,687 | | | 1,435,527 | | | 548,428 |
| Cash collateral due to brokers | | | 4,901,000 | | | — | | | — | | | — | | | — | | | — |
| Payable for fund shares | | | | | | | | | | | | | | | | | | |
| redeemed | | | 3,637,644 | | | 1,101,228 | | | 2,369,513 | | | 2,386,411 | | | 959,865 | | | 1,020,861 |
| Investment management fees | | | | | | | | | | | | | | | | | | |
| payable to affiliates | | | 1,158,953 | | | 474,137 | | | 1,178,479 | | | 1,013,735 | | | 654,941 | | | 589,476 |
| Swap payments payable | | | 573,326 | | | — | | | — | | | — | | | — | | | — |
| Other accrued expenses | | | 457,213 | | | 183,141 | | | 197,063 | | | 148,047 | | | 27,502 | | | 57,711 |
| Dividend disbursing and | | | | | | | | | | | | | | | | | | |
| transfer agent fees and | | | | | | | | | | | | | | | | | | |
| expenses payable to | | | | | | | | | | | | | | | | | | |
| affiliates | | | 421,204 | | | 115,621 | | | 312,139 | | | 287,433 | | | 112,893 | | | 110,806 |
| Upfront payments received on | | | | | | | | | | | | | | | | | | |
| over the counter credit | | | | | | | | | | | | | | | | | | |
| default swap contracts | | | 320,950 | | | — | | | — | | | — | | | — | | | — |
| Unrealized depreciation on | | | | | | | | | | | | | | | | | | |
| foreign currency exchange | | | | | | | | | | | | | | | | | | |
| contracts | | | 309,407 | | | 1,167 | | | 4 | | | — | | | — | | | — |
| Interest payable | | | 146,451 | | | — | | | — | | | — | | | — | | | — |
| Administration expenses | | | | | | | | | | | | | | | | | | |
| payable to affiliates | | | 121,014 | | | 33,219 | | | 89,680 | | | 82,581 | | | 32,435 | | | 31,835 |
| Variation margin due to | | | | | | | | | | | | | | | | | | |
| Credit Suisse on futures | | | | | | | | | | | | | | | | | | |
| contracts | | | 103,104 | | | — | | | — | | | — | | | — | | | — |
| Distribution fees payable to | | | | | | | | | | | | | | | | | | |
| affiliates | | | 78,481 | | | 20,694 | | | 72,969 | | | 63,238 | | | 13,693 | | | 10,623 |
| Trustees’ fees and expenses | | | | | | | | | | | | | | | | | | |
| payable to affiliates | | | 70,566 | | | 23,138 | | | 47,802 | | | 45,527 | | | 18,259 | | | 17,711 |
| Accounting fees payable to | | | | | | | | | | | | | | | | | | |
| affiliates | | | 15,288 | | | 4,443 | | | 11,417 | | | 10,541 | | | 4,346 | | | 4,272 |
| Variation margin due to | | | | | | | | | | | | | | | | | | |
| brokers on centrally cleared | | | | | | | | | | | | | | | | | | |
| credit default swap | | | | | | | | | | | | | | | | | | |
| contracts | | | 10,776 | | | — | | | — | | | — | | | — | | | — |
| Unrealized depreciation on | | | | | | | | | | | | | | | | | | |
| over the counter credit | | | | | | | | | | | | | | | | | | |
| default swap contracts | | | 9,653 | | | — | | | — | | | — | | | — | | | — |
| Obligation to return securities | | | | | | | | | | | | | | | | | | |
| lending collateral | | | — | | | 16,655,539 | | | — | | | — | | | — | | | — |
| Other liabilities | | | — | | | 1,073 | | | — | | | — | | | — | | | — |
| Total Liabilities | | | 939,692,186 | | | 24,663,426 | | | 9,104,837 | | | 4,903,162 | | | 3,386,971 | | | 2,499,076 |
| Total Net Assets | | $ | 2,835,244,072 | | $ | 931,657,768 | | $ | 1,931,854,257 | | $ | 1,818,390,079 | | $ | 756,515,630 | | $ | 716,716,384 |
117
Table of Contents
Statements of assets and liabilities
Optimum Fund Trust
| | Optimum | | Optimum | | Optimum | | Optimum | | Optimum | | Optimum |
| | Fixed Income | | International | | Large Cap | | Large Cap | | Small-Mid Cap | | Small-Mid Cap |
| | Fund | | Fund | | Growth Fund | | Value Fund | | Growth Fund | | Value Fund |
| Net Assets Consist of: | | | | | | | | | | | | | | | | | | | | | | | | |
| Paid-in capital | | $ | 2,788,780,786 | | | $ | 771,416,997 | | | $ | 940,647,117 | | | $ | 1,164,786,947 | | | $ | 435,360,138 | | | $ | 544,933,481 | |
| Total distributable earnings | | | | | | | | | | | | | | | | | | | | | | | | |
| (loss) | | | 46,463,286 | | | | 160,240,771 | | | | 991,207,140 | | | | 653,603,132 | | | | 321,155,492 | | | | 171,782,903 | |
| Total Net Assets | | $ | 2,835,244,072 | | | $ | 931,657,768 | | | $ | 1,931,854,257 | | | $ | 1,818,390,079 | | | $ | 756,515,630 | | | $ | 716,716,384 | |
| Net Asset Value | | | | | | | | | | | | | | | | | | | | | | | | |
| | | | | | | | | | | | | | | | | | | | | | | | | |
| Class A: | | | | | | | | | | | | | | | | | | | | | | | | |
| Net assets | | $ | 24,141,552 | | | $ | 7,493,736 | | | $ | 27,906,423 | | | $ | 23,729,563 | | | $ | 5,016,294 | | | $ | 3,765,094 | |
| Shares of beneficial interest | | | | | | | | | | | | | | | | | | | | | | | | |
| outstanding, unlimited | | | | | | | | | | | | | | | | | | | | | | | | |
| authorization, no par | | | 2,490,005 | | | | 486,611 | | | | 1,240,877 | | | | 1,203,269 | | | | 277,960 | | | | 252,153 | |
| Net asset value per share | | $ | 9.70 | | | $ | 15.40 | | | $ | 22.49 | | | $ | 19.72 | | | $ | 18.05 | | | $ | 14.93 | |
| Sales charge | | | 4.50 | % | | | 5.75 | % | | | 5.75 | % | | | 5.75 | % | | | 5.75 | % | | | 5.75 | % |
| Offering price per share, equal to | | | | | | | | | | | | | | | | | | | | | | | | |
| net asset value per share / | | | | | | | | | | | | | | | | | | | | | | | | |
| (1 - sales charge) | | $ | 10.16 | | | $ | 16.34 | | | $ | 23.86 | | | $ | 20.92 | | | $ | 19.15 | | | $ | 15.84 | |
| | | | | | | | | | | | | | | | | | | | | | | | | |
| Class C: | | | | | | | | | | | | | | | | | | | | | | | | |
| Net assets | | $ | 85,821,328 | | | $ | 22,366,939 | | | $ | 79,209,064 | | | $ | 69,778,417 | | | $ | 14,371,570 | | | $ | 11,353,895 | |
| Shares of beneficial interest | | | | | | | | | | | | | | | | | | | | | | | | |
| outstanding, unlimited | | | | | | | | | | | | | | | | | | | | | | | | |
| authorization, no par | | | 8,852,894 | | | | 1,492,876 | | | | 4,493,899 | | | | 3,589,208 | | | | 1,070,171 | | | | 888,223 | |
| Net asset value per share | | $ | 9.69 | | | $ | 14.98 | | | $ | 17.63 | | | $ | 19.44 | | | $ | 13.43 | | | $ | 12.78 | |
| | | | | | | | | | | | | | | | | | | | | | | | | |
| Institutional Class: | | | | | | | | | | | | | | | | | | | | | | | | |
| Net assets | | $ | 2,725,281,192 | | | $ | 901,797,093 | | | $ | 1,824,738,770 | | | $ | 1,724,882,099 | | | $ | 737,127,766 | | | $ | 701,597,395 | |
| Shares of beneficial interest | | | | | | | | | | | | | | | | | | | | | | | | |
| outstanding, unlimited | | | | | | | | | | | | | | | | | | | | | | | | |
| authorization, no par | | | 281,419,128 | | | | 58,107,856 | | | | 73,606,147 | | | | 87,240,446 | | | | 36,188,609 | | | | 44,004,481 | |
| Net asset value per share | | $ | 9.68 | | | $ | 15.52 | | | $ | 24.79 | | | $ | 19.77 | | | $ | 20.37 | | | $ | 15.94 | |
____________________ | | | | | | | | | | | | | | | | | | | | | | | | |
| *Investments, at cost | | $ | 3,302,519,207 | | | $ | 791,941,808 | | | $ | 1,155,198,653 | | | $ | 1,246,215,074 | | | $ | 568,796,210 | | | $ | 574,205,129 | |
| †Including securities on loan | | | — | | | | 29,141,339 | | | | — | | | | — | | | | — | | | | — | |
| =Short-term investments held as | | | | | | | | | | | | | | | | | | | | | | | | |
| collateral for loaned securities, at | | | | | | | | | | | | | | | | | | | | | | | | |
| cost | | | — | | | | 16,656,607 | | | | — | | | | — | | | | — | | | | — | |
| ΔForeign currencies, at cost | | | 4,338,440 | | | | 304,806 | | | | 196 | | | | — | | | | — | | | | — | |
| ΣPremium received | | | (363,005 | ) | | | — | | | | — | | | | — | | | | — | | | | — | |
See accompanying notes, which are an integral part of the financial statements.
118
Table of Contents
Statements of operations
Optimum Fund Trust
Year ended March 31, 2021
| | Optimum | | Optimum | | Optimum | | Optimum | | Optimum | | Optimum | |
| | Fixed Income | | International | | Large Cap | | Large Cap | | Small-Mid Cap | | Small-Mid Cap | |
| | Fund | | Fund | | Growth Fund | | Value Fund | | Growth Fund | | Value Fund | |
| Investment Income: | | | | | | | | | | | | | | | | | | | |
| Interest | | $ | 68,761,906 | | $ | — | | $ | 28 | | $ | 159 | | $ | — | | $ | 13 | |
| Dividends | | | 19,203 | | | 15,975,873 | | | 11,449,990 | | | 35,946,185 | | | 2,432,677 | | | 16,911,647 | |
| Securities lending income | | | — | | | 142,774 | | | — | | | — | | | — | | | — | |
| Foreign tax withheld | | | — | | | (1,742,704 | ) | | (80,005 | ) | | (125,776 | ) | | — | | | (7,790 | ) |
| | | 68,781,109 | | | 14,375,943 | | | 11,370,013 | | | 35,820,568 | | | 2,432,677 | | | 16,903,870 | |
| | | | | | | | | | | | | | | | | | | | |
| Expenses: | | | | | | | | | | | | | | | | | | | |
| Management fees | | | 13,283,425 | | | 4,205,043 | | | 13,340,894 | | | 10,371,924 | | | 6,449,430 | | | 5,036,325 | |
| Distribution expenses — Class A | | | 63,498 | | | 16,231 | | | 69,392 | | | 51,606 | | | 11,651 | | | 7,305 | |
| Distribution expenses — Class C | | | 884,365 | | | 191,963 | | | 782,746 | | | 603,256 | | | 135,023 | | | 88,836 | |
| Dividend disbursing and transfer agent fees | | | | | | | | | | | | | | | | | | | |
| and expenses | | | 4,839,448 | | | 1,031,659 | | | 3,558,245 | | | 2,928,180 | | | 1,161,540 | | | 987,331 | |
| Administration expenses | | | 1,389,787 | | | 293,976 | | | 1,020,029 | | | 838,907 | | | 330,476 | | | 280,601 | |
| Accounting fees | | | 583,570 | | | 152,667 | | | 436,359 | | | 365,476 | | | 166,864 | | | 147,342 | |
| Reports and statements to shareholders | | | | | | | | | | | | | | | | | | | |
| expenses | | | 356,771 | | | 7,508 | | | 245,874 | | | 170,062 | | | 76,538 | | | 80,949 | |
| Trustees’ fees and expenses | | | 308,941 | | | 62,039 | | | 221,056 | | | 170,707 | | | 69,452 | | | 56,651 | |
| Professional fees | | | 214,489 | | | 67,314 | | | 164,849 | | | 124,661 | | | 75,348 | | | 60,855 | |
| Pricing fees | | | 187,330 | | | 45,884 | | | 3,407 | | | 2,209 | | | 21,608 | | | 3,085 | |
| Custodian fees | | | 122,581 | | | 235,657 | | | 52,423 | | | 33,779 | | | 22,455 | | | 7,176 | |
| Interest expense | | | 113,994 | | | — | | | — | | | — | | | — | | | — | |
| Registration fees | | | 89,703 | | | 53,873 | | | 68,846 | | | 69,616 | | | 51,544 | | | 55,581 | |
| Insurance fees | | | 53,635 | | | 10,839 | | | 37,299 | | | 32,620 | | | 12,182 | | | 10,609 | |
| Tax services | | | 5,867 | | | 19,570 | | | 1,128 | | | 344 | | | 726 | | | 694 | |
| Other | | | 38,356 | | | 15,110 | | | 27,261 | | | 24,708 | | | 15,447 | | | 17,178 | |
| | | 22,535,760 | | | 6,409,333 | | | 20,029,808 | | | 15,788,055 | | | 8,600,284 | | | 6,840,518 | |
| Less expenses waived | | | — | | | (51,694 | ) | | — | | | — | | | (144,088 | ) | | (67,001 | ) |
| Less expenses paid indirectly | | | (740 | ) | | (675 | ) | | (838 | ) | | (828 | ) | | (807 | ) | | (809 | ) |
| Total operating expenses | | | 22,535,020 | | | 6,356,964 | | | 20,028,970 | | | 15,787,227 | | | 8,455,389 | | | 6,772,708 | |
| Net Investment Income (Loss) | | | 46,246,089 | | | 8,018,979 | | | (8,658,957 | ) | | 20,033,341 | | | (6,022,712 | ) | | 10,131,162 | |
119
Table of Contents
Statements of operations
Optimum Fund Trust
| | Optimum | | Optimum | | Optimum | | Optimum | | Optimum | | Optimum |
| | Fixed Income | | International | | Large Cap | | Large Cap | | Small-Mid Cap | | Small-Mid Cap |
| | Fund | | Fund | | Growth Fund | | Value Fund | | Growth Fund | | Value Fund |
| Net Realized and Unrealized Gain (Loss): | | | | | | | | | | | | | | | | | | |
| Net realized gain (loss) on: | | | | | | | | | | | | | | | | | | |
| Investments | | $ | 67,812,744 | | $ | 24,046,145 | | $ | 307,821,800 | | $ | 72,806,107 | | $ | 217,906,476 | | $ | 46,112,806 |
| Foreign currencies | | | 739,133 | | | 1,810,369 | | | 2,699 | | | (20,300 | ) | | — | | | — |
| Foreign currency exchange contracts | | | (3,752,048 | ) | | (822,221 | ) | | 16,732 | | | (501 | ) | | — | | | — |
| Futures contracts | | | (1,501,096 | ) | | — | | | — | | | — | | | — | | | — |
| Options written | | | 134,077 | | | — | | | — | | | — | | | — | | | — |
| Options purchased | | | (2,432 | ) | | — | | | — | | | — | | | — | | | — |
| Swap contracts | | | (1,295,590 | ) | | — | | | — | | | — | | | — | | | — |
| Net realized gain | | | 62,134,788 | | | 25,034,293 | | | 307,841,231 | | | 72,785,306 | | | 217,906,476 | | | 46,112,806 |
| | | | | | | | | | | | | | | | | | | |
| Net change in unrealized appreciation | | | | | | | | | | | | | | | | | | |
| (depreciation) of: | | | | | | | | | | | | | | | | | | |
| Investments | | | 18,262,177 | | | 213,224,208 | | | 528,955,918 | | | 562,229,440 | | | 224,979,499 | | | 279,835,046 |
| Foreign currencies | | | 139,515 | | | 83,349 | | | (4,742 | ) | | 3,325 | | | — | | | — |
| Foreign currency exchange contracts | | | 2,389,763 | | | 791 | | | 3,550 | | | — | | | — | | | — |
| Futures contracts | | | (3,742,026 | ) | | — | | | — | | | — | | | — | | | — |
| Options purchased | | | 130,317 | | | — | | | — | | | — | | | — | | | — |
| Options written | | | 29,699 | | | — | | | — | | | — | | | — | | | — |
| Swap contracts | | | 4,795,961 | | | — | | | — | | | — | | | — | | | — |
| Net change in unrealized appreciation | | | | | | | | | | | | | | | | | | |
| (depreciation) | | | 22,005,406 | | | 213,308,348 | | | 528,954,726 | | | 562,232,765 | | | 224,979,499 | | | 279,835,046 |
| Net Realized and Unrealized Gain | | | 84,140,194 | | | 238,342,641 | | | 836,795,957 | | | 635,018,071 | | | 442,885,975 | | | 325,947,852 |
| Net Increase in Net Assets Resulting | | | | | | | | | | | | | | | | | | |
| from Operations | | $ | 130,386,283 | | $ | 246,361,620 | | $ | 828,137,000 | | $ | 655,051,412 | | $ | 436,863,263 | | $ | 336,079,014 |
See accompanying notes, which are an integral part of the financial statements.
120
Table of Contents
Statements of changes in net assets
Optimum Fund Trust
| | Optimum | | Optimum | |
| | Fixed Income | | International | |
| | Fund | | Fund | |
| | Year ended | | Year ended | |
| | 3/31/21 | | 3/31/20 | | 3/31/21 | | 3/31/20 | |
| Increase (Decrease) in Net Assets from Operations: | | | | | | | | | | | | | |
| Net investment income | | $ | 46,246,089 | | $ | 57,371,981 | | $ | 8,018,979 | | $ | 9,945,342 | |
| Net realized gain | | | 62,134,788 | | | 85,601,229 | | | 25,034,293 | | | 6,990,042 | |
| Net change in unrealized appreciation (depreciation) | | | 22,005,406 | | | (13,190,042 | ) | | 213,308,348 | | | (121,070,513 | ) |
| Net increase (decrease) in net assets resulting from operations | | | 130,386,283 | | | 129,783,168 | | | 246,361,620 | | | (104,135,129 | ) |
| | | | | | | | | | | | | | |
| Dividends and Distributions to Shareholders from: | | | | | | | | | | | | | |
| Distributable earnings: | | | | | | | | | | | | | |
| Class A | | | (1,182,087 | ) | | (729,200 | ) | | (139,401 | ) | | (129,231 | ) |
| Class C | | | (3,495,380 | ) | | (1,874,420 | ) | | (288,872 | ) | | (242,141 | ) |
| Institutional Class | | | (127,667,475 | ) | | (74,081,149 | ) | | (12,652,253 | ) | | (11,340,289 | ) |
| | | (132,344,942 | ) | | (76,684,769 | ) | | (13,080,526 | ) | | (11,711,661 | ) |
| | | | | | | | | | | | | | |
| Capital Share Transactions: | | | | | | | | | | | | | |
| Proceeds from shares sold: | | | | | | | | | | | | | |
| Class A | | | 2,166,663 | | | 964,454 | | | 521,008 | | | 365,421 | |
| Class C | | | 6,494,263 | | | 4,145,725 | | | 1,512,024 | | | 950,756 | |
| Institutional Class | | | 596,611,343 | | | 400,165,847 | | | 344,491,714 | | | 78,228,473 | |
| | | | | | | | | | | | | | |
| Net asset value of shares issued upon reinvestment of dividends and | | | | | | | | | | | | | |
| distributions: | | | | | | | | | | | | | |
| Class A | | | 1,181,575 | | | 728,902 | | | 139,195 | | | 128,801 | |
| Class C | | | 3,488,865 | | | 1,872,172 | | | 288,146 | | | 241,693 | |
| Institutional Class | | | 127,196,433 | | | 73,976,714 | | | 12,637,812 | | | 11,327,444 | |
| | | 737,139,142 | | | 481,853,814 | | | 359,589,899 | | | 91,242,588 | |
| Capital Share Transactions: | | | | | | | | | | | | | |
| Cost of shares redeemed: | | | | | | | | | | | | | |
| Class A | | | (4,154,651 | ) | | (4,124,455 | ) | | (1,059,088 | ) | | (1,277,785 | ) |
| Class C | | | (10,267,325 | ) | | (14,614,057 | ) | | (2,734,121 | ) | | (3,722,127 | ) |
| Institutional Class | | | (375,098,517 | ) | | (395,449,735 | ) | | (84,611,754 | ) | | (97,166,739 | ) |
| | | (389,520,493 | ) | | (414,188,247 | ) | | (88,404,963 | ) | | (102,166,651 | ) |
| Increase (decrease) in net assets derived from capital share | | | | | | | | | | | | | |
| transactions | | | 347,618,649 | | | 67,665,567 | | | 271,184,936 | | | (10,924,063 | ) |
| Net Increase (Decrease) in Net Assets | | | 345,659,990 | | | 120,763,966 | | | 504,466,030 | | | (126,770,853 | ) |
| | | | | | | | | | | | | | |
| Net Assets: | | | | | | | | | | | | | |
| Beginning of year | | | 2,489,584,082 | | | 2,368,820,116 | | | 427,191,738 | | | 553,962,591 | |
| End of year | | $ | 2,835,244,072 | | $ | 2,489,584,082 | | $ | 931,657,768 | | $ | 427,191,738 | |
121
Table of Contents
Statements of changes in net assets
Optimum Fund Trust
| | Optimum | | Optimum | |
| | Large Cap | | Large Cap | |
| | Growth Fund | | Value Fund | |
| | Year ended | | Year ended | |
| | 3/31/21 | | 3/31/20 | | 3/31/21 | | 3/31/20 | |
| Increase (Decrease) in Net Assets from Operations: | | | | | | | | | | | | | |
| Net investment income (loss) | | $ | (8,658,957 | ) | $ | (3,099,534 | ) | $ | 20,033,341 | | $ | 22,771,277 | |
| Net realized gain | | | 307,841,231 | | | 112,006,615 | | | 72,785,306 | | | 30,650,070 | |
| Net change in unrealized appreciation (depreciation) | | | 528,954,726 | | | (161,142,853 | ) | | 562,232,765 | | | (265,765,729 | ) |
| Net increase (decrease) in net assets resulting from operations | | | 828,137,000 | | | (52,235,772 | ) | | 655,051,412 | | | (212,344,382 | ) |
| | | | | | | | | | | | | | |
| Dividends and Distributions to Shareholders from: | | | | | | | | | | | | | |
| Distributable earnings: | | | | | | | | | | | | | |
| Class A | | | (2,330,191 | ) | | (894,659 | ) | | (227,116 | ) | | (580,399 | ) |
| Class C | | | (8,141,363 | ) | | (3,088,118 | ) | | (325,729 | ) | | (1,222,359 | ) |
| Institutional Class | | | (145,275,414 | ) | | (49,312,858 | ) | | (20,704,214 | ) | | (44,171,546 | ) |
| | | (155,746,968 | ) | | (53,295,635 | ) | | (21,257,059 | ) | | (45,974,304 | ) |
| | | | | | | | | | | | | | |
| Capital Share Transactions: | | | | | | | | | | | | | |
| Proceeds from shares sold: | | | | | | | | | | | | | |
| Class A | | | 529,522 | | | 484,165 | | | 1,374,919 | | | 553,769 | |
| Class C | | | 913,806 | | | 696,294 | | | 3,507,516 | | | 1,257,878 | |
| Institutional Class | | | 237,257,735 | | | 205,139,697 | | | 285,934,921 | | | 217,968,202 | |
| | | | | | | | | | | | | | |
| Net asset value of shares issued upon reinvestment of dividends | | | | | | | | | | | | | |
| and distributions: | | | | | | | | | | | | | |
| Class A | | | 2,329,081 | | | 894,314 | | | 227,019 | | | 580,160 | |
| Class C | | | 8,119,104 | | | 3,081,679 | | | 324,729 | | | 1,219,320 | |
| Institutional Class | | | 144,795,123 | | | 49,223,354 | | | 20,646,682 | | | 44,100,170 | |
| | | 393,944,371 | | | 259,519,503 | | | 312,015,786 | | | 265,679,499 | |
| Capital Share Transactions: | | | | | | | | | | | | | |
| Cost of shares redeemed: | | | | | | | | | | | | | |
| Class A | | | (7,068,584 | ) | | (7,135,138 | ) | | (3,159,329 | ) | | (4,477,827 | ) |
| Class C | | | (18,345,652 | ) | | (18,250,705 | ) | | (7,822,979 | ) | | (12,256,335 | ) |
| Institutional Class | | | (587,462,462 | ) | | (326,372,554 | ) | | (401,061,413 | ) | | (273,883,143 | ) |
| | | (612,876,698 | ) | | (351,758,397 | ) | | (412,043,721 | ) | | (290,617,305 | ) |
| Decrease in net assets derived from capital share transactions | | | (218,932,327 | ) | | (92,238,894 | ) | | (100,027,935 | ) | | (24,937,806 | ) |
| Net Increase (Decrease) in Net Assets | | | 453,457,705 | | | (197,770,301 | ) | | 533,766,418 | | | (283,256,492 | ) |
| | | | | | | | | | | | | | |
| Net Assets: | | | | | | | | | | | | | |
| Beginning of year | | | 1,478,396,552 | | | 1,676,166,853 | | | 1,284,623,661 | | | 1,567,880,153 | |
| End of year | | $ | 1,931,854,257 | | $ | 1,478,396,552 | | $ | 1,818,390,079 | | $ | 1,284,623,661 | |
122
Table of Contents
| | Optimum | | Optimum | |
| | Small-Mid Cap | | Small-Mid Cap | |
| | Growth Fund | | Value Fund | |
| | Year ended | | Year ended | |
| | 3/31/21 | | 3/31/20 | | 3/31/21 | | 3/31/20 | |
| Increase (Decrease) in Net Assets from Operations: | | | | | | | | | | | | | |
| Net investment income (loss) | | $ | (6,022,712 | ) | $ | (4,581,761 | ) | $ | 10,131,162 | | $ | 5,438,299 | |
| Net realized gain (loss) | | | 217,906,476 | | | 55,801,297 | | | 46,112,806 | | | (1,337,248 | ) |
| Net change in unrealized appreciation (depreciation) | | | 224,979,499 | | | (132,276,278 | ) | | 279,835,046 | | | (155,870,859 | ) |
| Net increase (decrease) in net assets resulting from operations | | | 436,863,263 | | | (81,056,742 | ) | | 336,079,014 | | | (151,769,808 | ) |
| | | | | | | | | | | | | | |
| Dividends and Distributions to Shareholders from: | | | | | | | | | | | | | |
| Distributable earnings: | | | | | | | | | | | | | |
| Class A | | | (794,941 | ) | | (409,951 | ) | | (134,611 | ) | | (88,053 | ) |
| Class C | | | (2,933,106 | ) | | (1,452,655 | ) | | (421,984 | ) | | (243,686 | ) |
| Institutional Class | | | (95,066,679 | ) | | (44,812,148 | ) | | (23,951,424 | ) | | (16,364,520 | ) |
| | | (98,794,726 | ) | | (46,674,754 | ) | | (24,508,019 | ) | | (16,696,259 | ) |
| | | | | | | | | | | | | | |
| Capital Share Transactions: | | | | | | | | | | | | | |
| Proceeds from shares sold: | | | | | | | | | | | | | |
| Class A | | | 92,640 | | | 108,914 | | | 520,361 | | | 152,875 | |
| Class C | | | 157,088 | | | 136,873 | | | 1,367,421 | | | 520,687 | |
| Institutional Class | | | 156,669,492 | | | 76,485,837 | | | 128,890,149 | | | 92,797,943 | |
| | | | | | | | | | | | | | |
| Net asset value of shares issued upon reinvestment of dividends and | | | | | | | | | | | | | |
| distributions: | | | | | | | | | | | | | |
| Class A | | | 793,823 | | | 409,440 | | | 134,484 | | | 87,962 | |
| Class C | | | 2,929,999 | | | 1,451,859 | | | 420,931 | | | 243,369 | |
| Institutional Class | | | 94,747,412 | | | 44,772,511 | | | 23,930,685 | | | 16,347,235 | |
| | | 255,390,454 | | | 123,365,434 | | | 155,264,031 | | | 110,150,071 | |
| Capital Share Transactions: | | | | | | | | | | | | | |
| Cost of shares redeemed: | | | | | | | | | | | | | |
| Class A | | | (1,566,133 | ) | | (1,029,204 | ) | | (540,067 | ) | | (669,099 | ) |
| Class C | | | (4,487,246 | ) | | (2,393,796 | ) | | (1,519,315 | ) | | (1,527,614 | ) |
| Institutional Class | | | (249,624,233 | ) | | (86,251,169 | ) | | (122,727,590 | ) | | (84,406,655 | ) |
| | | (255,677,612 | ) | | (89,674,169 | ) | | (124,786,972 | ) | | (86,603,368 | ) |
| Increase (decrease) in net assets derived from capital share | | | | | | | | | | | | | |
| transactions | | | (287,158 | ) | | 33,691,265 | | | 30,477,059 | | | 23,546,703 | |
| Net Increase (Decrease) in Net Assets | | | 337,781,379 | | | (94,040,231 | ) | | 342,048,054 | | | (144,919,364 | ) |
| | | | | | | | | | | | | | |
| Net Assets: | | | | | | | | | | | | | |
| Beginning of year | | | 418,734,251 | | | 512,774,482 | | | 374,668,330 | | | 519,587,694 | |
| End of year | | $ | 756,515,630 | | $ | 418,734,251 | | $ | 716,716,384 | | $ | 374,668,330 | |
123
Table of Contents
Financial highlights
Optimum Fixed Income Fund Class A
Selected data for each share of the Fund outstanding throughout each period were as follows:
| | Year ended |
| | 3/31/21 | | 3/31/20 | | 3/31/19 | | 3/31/18 | | 3/31/17 |
| Net asset value, beginning of period | | $ | 9.67 | | | $ | 9.46 | | | $ | 9.35 | | | $ | 9.39 | | | $ | 9.37 | |
| | | | | | | | | | | | | | | | | | | | | |
| Income (loss) from investment operations: | | | | | | | | | | | | | | | | | | | | |
| Net investment income1 | | | 0.15 | | | | 0.21 | | | | 0.23 | | | | 0.22 | | | | 0.20 | |
| Net realized and unrealized gain (loss) | | | 0.37 | | | | 0.29 | | | | 0.08 | | | | (0.05 | ) | | | — | 2 |
| Total from investment operations | | | 0.52 | | | | 0.50 | | | | 0.31 | | | | 0.17 | | | | 0.20 | |
| | | | | | | | | | | | | | | | | | | | | |
| Less dividends and distributions from: | | | | | | | | | | | | | | | | | | | | |
| Net investment income | | | (0.15 | ) | | | (0.23 | ) | | | (0.20 | ) | | | (0.21 | ) | | | (0.18 | ) |
| Net realized gain | | | (0.34 | ) | | | (0.06 | ) | | | — | | | | — | | | | — | |
| Total dividends and distributions | | | (0.49 | ) | | | (0.29 | ) | | | (0.20 | ) | | | (0.21 | ) | | | (0.18 | ) |
| | | | | | | | | | | | | | | | | | | | | |
| Net asset value, end of period | | $ | 9.70 | | | $ | 9.67 | | | $ | 9.46 | | | $ | 9.35 | | | $ | 9.39 | |
| | | | | | | | | | | | | | | | | | | | | |
| Total return3 | | | 5.21% | | | | 5.24% | 4 | | | 3.37% | | | | 1.81% | | | | 2.03% | 5 |
| | | | | | | | | | | | | | | | | | | | | |
| Ratios and supplemental data: | | | | | | | | | | | | | | | | | | | | |
| Net assets, end of period (000 omitted) | | $ | 24,142 | | | $ | 24,827 | | | $ | 26,613 | | | $ | 30,150 | | | $ | 33,838 | |
| Ratio of expenses to average net assets6 | | | 1.06% | | | | 1.07% | | | | 1.08% | | | | 1.10% | | | | 1.17% | |
| Ratio of expenses to average net assets prior to fees waived6 | | | 1.06% | | | | 1.07% | | | | 1.08% | | | | 1.10% | | | | 1.18% | |
| Ratio of net investment income to average net assets | | | 1.52% | | | | 2.11% | | | | 2.43% | | | | 2.29% | | | | 2.12% | |
| Ratio of net investment income to average net assets prior to | | | | | | | | | | | | | | | | | | | | |
| fees waived | | | 1.52% | | | | 2.11% | | | | 2.43% | | | | 2.29% | | | | 2.11% | |
| Portfolio turnover | | | 217% | 7 | | | 361% | 7 | | | 453% | | | | 403% | | | | 419% | |
| 1 | The average shares outstanding have been applied for per share information. |
| 2 | Amount is less than $0.005 per share. |
| 3 | Total return is based on the change in net asset value of a share during the period and assumes reinvestment of dividends and distributions at net asset value and does not reflect the impact of a sales charge. |
| 4 | General Motors term loan litigation was included in total return. If excluded, the impact on the total return would be 0.04% lower. See Note 12 in “Notes to financial statements.” |
| 5 | Total return during the period reflects a waiver by the manager. Performance would have been lower had the waiver not been in effect. |
| 6 | Expense ratios do not include expenses of the Underlying Funds in which the Fund invests. |
| 7 | The Fund accounts for mortgage dollar roll transactions, when applicable, as purchases and sales which, as a result, can increase its portfolio turnover rate. |
See accompanying notes, which are an integral part of the financial statements.
124
Table of Contents
Optimum Fixed Income Fund Class C
Selected data for each share of the Fund outstanding throughout each period were as follows:
| | Year ended |
| | 3/31/21 | | 3/31/20 | | 3/31/19 | | 3/31/18 | | 3/31/17 |
| Net asset value, beginning of period | | $ | 9.67 | | | $ | 9.45 | | | $ | 9.34 | | | $ | 9.38 | | | $ | 9.37 | |
| | | | | | | | | | | | | | | | | | | | | |
| Income (loss) from investment operations: | | | | | | | | | | | | | | | | | | | | |
| Net investment income1 | | | 0.08 | | | | 0.13 | | | | 0.16 | | | | 0.15 | | | | 0.13 | |
| Net realized and unrealized gain (loss) | | | 0.35 | | | | 0.30 | | | | 0.07 | | | | (0.05 | ) | | | (0.01 | ) |
| Total from investment operations | | | 0.43 | | | | 0.43 | | | | 0.23 | | | | 0.10 | | | | 0.12 | |
| | | | | | | | | | | | | | | | | | | | | |
| Less dividends and distributions from: | | | | | | | | | | | | | | | | | | | | |
| Net investment income | | | (0.07 | ) | | | (0.15 | ) | | | (0.12 | ) | | | (0.14 | ) | | | (0.11 | ) |
| Net realized gain | | | (0.34 | ) | | | (0.06 | ) | | | — | | | | — | | | | — | |
| Total dividends and distributions | | | (0.41 | ) | | | (0.21 | ) | | | (0.12 | ) | | | (0.14 | ) | | | (0.11 | ) |
| | | | | | | | | | | | | | | | | | | | | |
| Net asset value, end of period | | $ | 9.69 | | | $ | 9.67 | | | $ | 9.45 | | | $ | 9.34 | | | $ | 9.38 | |
| | | | | | | | | | | | | | | | | | | | | |
| Total return2 | | | 4.30% | | | | 4.55% | 3 | | | 2.52% | | | | 1.06% | | | | 1.27% | 4 |
| | | | | | | | | | | | | | | | | | | | | |
| Ratios and supplemental data: | | | | | | | | | | | | | | | | | | | | |
| Net assets, end of period (000 omitted) | | $ | 85,821 | | | $ | 85,853 | | | $ | 92,295 | | | $ | 105,194 | | | $ | 124,024 | |
| Ratio of expenses to average net assets5 | | | 1.81% | | | | 1.82% | | | | 1.83% | | | | 1.85% | | | | 1.92% | |
| Ratio of expenses to average net assets prior to fees waived5 | | | 1.81% | | | | 1.82% | | | | 1.83% | | | | 1.85% | | | | 1.93% | |
| Ratio of net investment income to average net assets | | | 0.77% | | | | 1.36% | | | | 1.68% | | | | 1.54% | | | | 1.37% | |
| Ratio of net investment income to average net assets | | | | | | | | | | | | | | | | | | | | |
| prior to fees waived | | | 0.77% | | | | 1.36% | | | | 1.68% | | | | 1.54% | | | | 1.36% | |
| Portfolio turnover | | | 217% | 6 | | | 361% | 6 | | | 453% | | | | 403% | | | | 419% | |
| 1 | The average shares outstanding have been applied for per share information. |
| 2 | Total return is based on the change in net asset value of a share during the period and assumes reinvestment of dividends and distributions at net asset value and does not reflect the impact of a sales charge. |
| 3 | General Motors term loan litigation was included in total return. If excluded, the impact on the total return would be 0.04% lower. See Note 12 in “Notes to financial statements.” |
| 4 | Total return during the period reflects a waiver by the manager. Performance would have been lower had the waiver not been in effect. |
| 5 | Expense ratios do not include expenses of the Underlying Funds in which the Fund invests. |
| 6 | The Fund accounts for mortgage dollar roll transactions, when applicable, as purchases and sales which, as a result, can increase its portfolio turnover rate. |
See accompanying notes, which are an integral part of the financial statements.
125
Table of Contents
Financial highlights
Optimum Fixed Income Fund Institutional Class
Selected data for each share of the Fund outstanding throughout each period were as follows:
| | Year ended |
| | 3/31/21 | | 3/31/20 | | 3/31/19 | | 3/31/18 | | 3/31/17 |
| Net asset value, beginning of period | | $ | 9.66 | | | $ | 9.45 | | | $ | 9.34 | | | $ | 9.39 | | | $ | 9.37 | |
| | | | | | | | | | | | | | | | | | | | | |
| Income (loss) from investment operations: | | | | | | | | | | | | | | | | | | | | |
| Net investment income1 | | | 0.18 | | | | 0.23 | | | | 0.25 | | | | 0.24 | | | | 0.23 | |
| Net realized and unrealized gain (loss) | | | 0.36 | | | | 0.29 | | | | 0.08 | | | | (0.05 | ) | | | (0.01 | ) |
| Total from investment operations | | | 0.54 | | | | 0.52 | | | | 0.33 | | | | 0.19 | | | | 0.22 | |
| | | | | | | | | | | | | | | | | | | | | |
| Less dividends and distributions from: | | | | | | | | | | | | | | | | | | | | |
| Net investment income | | | (0.18 | ) | | | (0.25 | ) | | | (0.22 | ) | | | (0.24 | ) | | | (0.20 | ) |
| Net realized gain | | | (0.34 | ) | | | (0.06 | ) | | | — | | | | — | | | | — | |
| Total dividends and distributions | | | (0.52 | ) | | | (0.31 | ) | | | (0.22 | ) | | | (0.24 | ) | | | (0.20 | ) |
| | | | | | | | | | | | | | | | | | | | | |
| Net asset value, end of period | | $ | 9.68 | | | $ | 9.66 | | | $ | 9.45 | | | $ | 9.34 | | | $ | 9.39 | |
| | | | | | | | | | | | | | | | | | | | | |
| Total return2 | | | 5.37% | | | | 5.52% | 3 | | | 3.65% | | | | 1.96% | | | | 2.40% | 4 |
| | | | | | | | | | | | | | | | | | | | | |
| Ratios and supplemental data: | | | | | | | | | | | | | | | | | | | | |
| Net assets, end of period (000 omitted) | | $ | 2,725,281 | | | $ | 2,378,904 | | | $ | 2,249,912 | | | $ | 1,882,394 | | | $ | 1,725,289 | |
| Ratio of expenses to average net assets5 | | | 0.81% | | | | 0.82% | | | | 0.83% | | | | 0.85% | | | | 0.92% | |
| Ratio of expenses to average net assets prior to fees waived5 | | | 0.81% | | | | 0.82% | | | | 0.83% | | | | 0.85% | | | | 0.93% | |
| Ratio of net investment income to average net assets | | | 1.77% | | | | 2.36% | | | | 2.68% | | | | 2.54% | | | | 2.37% | |
| Ratio of net investment income to average net assets prior to | | | | | | | | | | | | | | | | | | | | |
| fees waived | | | 1.77% | | | | 2.36% | | | | 2.68% | | | | 2.54% | | | | 2.36% | |
| Portfolio turnover | | | 217% | 6 | | | 361% | 6 | | | 453% | | | | 403% | | | | 419% | |
| 1 | The average shares outstanding have been applied for per share information. |
| 2 | Total return is based on the change in net asset value of a share during the period and assumes reinvestment of dividends and distributions at net asset value. |
| 3 | General Motors term loan litigation was included in total return. If excluded, the impact on the total return would be 0.04% lower. See Note 12 in “Notes to financial statements.” |
| 4 | Total return during the period reflects a waiver by the manager. Performance would have been lower had the waiver not been in effect. |
| 5 | Expense ratios do not include expenses of the Underlying Funds in which the Fund invests. |
| 6 | The Fund accounts for mortgage dollar roll transactions, when applicable, as purchases and sales which, as a result, can increase its portfolio turnover rate. |
See accompanying notes, which are an integral part of the financial statements.
126
Table of Contents
Optimum International Fund Class A
Selected data for each share of the Fund outstanding throughout each period were as follows:
| | Year ended |
| | 3/31/21 | | 3/31/20 | | 3/31/19 | | 3/31/18 | | 3/31/17 |
| Net asset value, beginning of period | | $ | 9.93 | | | $ | 12.59 | | | $ | 14.42 | | | $ | 12.27 | | | $ | 10.95 | |
| | | | | | | | | | | | | | | | | | | | | |
| Income (loss) from investment operations: | | | | | | | | | | | | | | | | | | | | |
| Net investment income1 | | | 0.16 | | | | 0.20 | | | | 0.17 | | | | 0.12 | | | | 0.11 | |
| Net realized and unrealized gain (loss) | | | 5.59 | | | | (2.61 | ) | | | (1.00 | ) | | | 2.29 | | | | 1.31 | |
| Total from investment operations | | | 5.75 | | | | (2.41 | ) | | | (0.83 | ) | | | 2.41 | | | | 1.42 | |
| | | | | | | | | | | | | | | | | | | | | |
| Less dividends and distributions from: | | | | | | | | | | | | | | | | | | | | |
| Net investment income | | | (0.12 | ) | | | (0.21 | ) | | | (0.18 | ) | | | (0.11 | ) | | | (0.10 | ) |
| Net realized gain | | | (0.16 | ) | | | (0.04 | ) | | | (0.82 | ) | | | (0.15 | ) | | | — | |
| Total dividends and distributions | | | (0.28 | ) | | | (0.25 | ) | | | (1.00 | ) | | | (0.26 | ) | | | (0.10 | ) |
| | | | | | | | | | | | | | | | | | | | | |
| Net asset value, end of period | | $ | 15.40 | | | $ | 9.93 | | | $ | 12.59 | | | $ | 14.42 | | | $ | 12.27 | |
| | | | | | | | | | | | | | | | | | | | | |
| Total return2 | | | 58.20% | 3 | | | (19.62% | )3 | | | (5.33% | ) | | | 19.74% | 3 | | | 13.08% | |
| | | | | | | | | | | | | | | | | | | | | |
| Ratios and supplemental data: | | | | | | | | | | | | | | | | | | | | |
| Net assets, end of period (000 omitted) | | $ | 7,494 | | | $ | 5,121 | | | $ | 7,275 | | | $ | 8,704 | | | $ | 8,680 | |
| Ratio of expenses to average net assets4 | | | 1.34% | | | | 1.37% | | | | 1.37% | | | | 1.36% | | | | 1.48% | |
| Ratio of expenses to average net assets prior to fees waived4 | | | 1.35% | | | | 1.39% | | | | 1.37% | | | | 1.36% | | | | 1.48% | |
| Ratio of net investment income to average net assets | | | 1.21% | | | | 1.62% | | | | 1.30% | | | | 0.90% | | | | 0.93% | |
| Ratio of net investment income to average net assets prior to | | | | | | | | | | | | | | | | | | | | |
| fees waived | | | 1.20% | | | | 1.60% | | | | 1.30% | | | | 0.90% | | | | 0.93% | |
| Portfolio turnover | | | 71% | | | | 51% | | | | 63% | | | | 52% | | | | 68% | |
| 1 | The average shares outstanding have been applied for per share information. |
| 2 | Total return is based on the change in net asset value of a share during the period and assumes reinvestment of dividends and distributions at net asset value and does not reflect the impact of a sales charge. |
| 3 | Total return during the period reflects a waiver by the manager. Performance would have been lower had the waiver not been in effect. |
| 4 | Expense ratios do not include expenses of the Underlying Funds in which the Fund invests. |
See accompanying notes, which are an integral part of the financial statements.
127
Table of Contents
Financial highlights
Optimum International Fund Class C
Selected data for each share of the Fund outstanding throughout each period were as follows:
| | Year ended |
| | 3/31/21 | | 3/31/20 | | 3/31/19 | | 3/31/18 | | 3/31/17 |
| Net asset value, beginning of period | | $ | 9.68 | | | $ | 12.27 | | | $ | 14.06 | | | $ | 11.98 | | | $ | 10.69 | |
| | | | | | | | | | | | | | | | | | | | | |
| Income (loss) from investment operations: | | | | | | | | | | | | | | | | | | | | |
| Net investment income1 | | | 0.06 | | | | 0.11 | | | | 0.07 | | | | 0.02 | | | | 0.02 | |
| Net realized and unrealized gain (loss) | | | 5.43 | | | | (2.54 | ) | | | (0.98 | ) | | | 2.23 | | | | 1.30 | |
| Total from investment operations | | | 5.49 | | | | (2.43 | ) | | | (0.91 | ) | | | 2.25 | | | | 1.32 | |
| | | | | | | | | | | | | | | | | | | | | |
| Less dividends and distributions from: | | | | | | | | | | | | | | | | | | | | |
| Net investment income | | | (0.03 | ) | | | (0.12 | ) | | | (0.06 | ) | | | (0.02 | ) | | | (0.03 | ) |
| Net realized gain | | | (0.16 | ) | | | (0.04 | ) | | | (0.82 | ) | | | (0.15 | ) | | | — | |
| Total dividends and distributions | | | (0.19 | ) | | | (0.16 | ) | | | (0.88 | ) | | | (0.17 | ) | | | (0.03 | ) |
| | | | | | | | | | | | | | | | | | | | | |
| Net asset value, end of period | | $ | 14.98 | | | $ | 9.68 | | | $ | 12.27 | | | $ | 14.06 | | | $ | 11.98 | |
| | | | | | | | | | | | | | | | | | | | | |
| Total return2 | | | 56.92% | 3 | | | (20.16% | )3 | | | (6.07% | ) | | | 18.82% | 3 | | | 12.32% | |
| | | | | | | | | | | | | | | | | | | | | |
| Ratios and supplemental data: | | | | | | | | | | | | | | | | | | | | |
| Net assets, end of period (000 omitted) | | $ | 22,367 | | | $ | 15,138 | | | $ | 21,763 | | | $ | 28,046 | | | $ | 29,544 | |
| Ratio of expenses to average net assets4 | | | 2.09% | | | | 2.12% | | | | 2.12% | | | | 2.11% | | | | 2.23% | |
| Ratio of expenses to average net assets prior to fees waived4 | | | 2.10% | | | | 2.14% | | | | 2.12% | | | | 2.11% | | | | 2.23% | |
| Ratio of net investment income to average net assets | | | 0.46% | | | | 0.87% | | | | 0.55% | | | | 0.15% | | | | 0.18% | |
| Ratio of net investment income to average net assets | | | | | | | | | | | | | | | | | | | | |
| prior to fees waived | | | 0.45% | | | | 0.85% | | | | 0.55% | | | | 0.15% | | | | 0.18% | |
| Portfolio turnover | | | 71% | | | | 51% | | | | 63% | | | | 52% | | | | 68% | |
| 1 | The average shares outstanding have been applied for per share information. |
| 2 | Total return is based on the change in net asset value of a share during the period and assumes reinvestment of dividends and distributions at net asset value and does not reflect the impact of a sales charge. |
| 3 | Total return during the period reflects a waiver by the manager. Performance would have been lower had the waiver not been in effect. |
| 4 | Expense ratios do not include expenses of the Underlying Funds in which the Fund invests. |
See accompanying notes, which are an integral part of the financial statements.
128
Table of Contents
Optimum International Fund Institutional Class
Selected data for each share of the Fund outstanding throughout each period were as follows:
| | Year ended |
| | 3/31/21 | | 3/31/20 | | 3/31/19 | | 3/31/18 | | 3/31/17 |
| Net asset value, beginning of period | | $ | 10.00 | | | $ | 12.68 | | | $ | 14.52 | | | $ | 12.35 | | | $ | 11.02 | |
| |
| Income (loss) from investment operations: | | | | | | | | | | | | | | | | | | | | |
| Net investment income1 | | | 0.19 | | | | 0.24 | | | | 0.21 | | | | 0.16 | | | | 0.14 | |
| Net realized and unrealized gain (loss) | | | 5.64 | | | | (2.63 | ) | | | (1.02 | ) | | | 2.31 | | | | 1.32 | |
| Total from investment operations | | | 5.83 | | | | (2.39 | ) | | | (0.81 | ) | | | 2.47 | | | | 1.46 | |
| |
| Less dividends and distributions from: | | | | | | | | | | | | | | | | | | | | |
| Net investment income | | | (0.15 | ) | | | (0.25 | ) | | | (0.21 | ) | | | (0.15 | ) | | | (0.13 | ) |
| Net realized gain | | | (0.16 | ) | | | (0.04 | ) | | | (0.82 | ) | | | (0.15 | ) | | | — | |
| Total dividends and distributions | | | (0.31 | ) | | | (0.29 | ) | | | (1.03 | ) | | | (0.30 | ) | | | (0.13 | ) |
| |
| Net asset value, end of period | | $ | 15.52 | | | $ | 10.00 | | | $ | 12.68 | | | $ | 14.52 | | | $ | 12.35 | |
| |
| Total return2 | | | 58.64% | 3 | | | (19.44% | )3 | | | (5.09% | ) | | | 20.05% | 3 | | | 13.36% | |
| |
| Ratios and supplemental data: | | | | | | | | | | | | | | | | | | | | |
| Net assets, end of period (000 omitted) | | $ | 901,797 | | | $ | 406,933 | | | $ | 524,925 | | | $ | 629,934 | | | $ | 525,431 | |
| Ratio of expenses to average net assets4 | | | 1.09% | | | | 1.12% | | | | 1.12% | | | | 1.11% | | | | 1.23% | |
| Ratio of expenses to average net assets prior to fees waived4 | | | 1.10% | | | | 1.14% | | | | 1.12% | | | | 1.11% | | | | 1.23% | |
| Ratio of net investment income to average net assets | | | 1.46% | | | | 1.87% | | | | 1.55% | | | | 1.15% | | | | 1.18% | |
| Ratio of net investment income to average net assets prior to | | | | | | | | | | | | | | | | | | | | |
| fees waived | | | 1.45% | | | | 1.85% | | | | 1.55% | | | | 1.15% | | | | 1.18% | |
| Portfolio turnover | | | 71% | | | | 51% | | | | 63% | | | | 52% | | | | 68% | |
| 1 | The average shares outstanding have been applied for per share information. |
| 2 | Total return is based on the change in net asset value of a share during the period and assumes reinvestment of dividends and distributions at net asset value. |
| 3 | Total return during the period reflects a waiver by the manager. Performance would have been lower had the waiver not been in effect. |
| 4 | Expense ratios do not include expenses of the Underlying Funds in which the Fund invests. |
See accompanying notes, which are an integral part of the financial statements.
129
Table of Contents
Financial highlights
Optimum Large Cap Growth Fund Class A
Selected data for each share of the Fund outstanding throughout each period were as follows:
| | Year ended |
| | 3/31/21 | | 3/31/20 | | 3/31/19 | | 3/31/18 | | 3/31/17 |
| Net asset value, beginning of period | | $ | 15.51 | | | $ | 16.70 | | | $ | 17.22 | | | $ | 16.84 | | | $ | 14.97 | |
| |
| Income (loss) from investment operations: | | | | | | | | | | | | | | | | | | | | |
| Net investment loss1 | | | (0.14 | ) | | | (0.07 | ) | | | (0.03 | ) | | | (0.06 | ) | | | (0.06 | ) |
| Net realized and unrealized gain (loss) | | | 9.03 | | | | (0.53 | ) | | | 1.82 | | | | 3.70 | | | | 2.52 | |
| Total from investment operations | | | 8.89 | | | | (0.60 | ) | | | 1.79 | | | | 3.64 | | | | 2.46 | |
| |
| Less dividends and distributions from: | | | | | | | | | | | | | | | | | | | | |
| Net realized gain | | | (1.91 | ) | | | (0.59 | ) | | | (2.31 | ) | | | (3.26 | ) | | | (0.59 | ) |
| Total dividends and distributions | | | (1.91 | ) | | | (0.59 | ) | | | (2.31 | ) | | | (3.26 | ) | | | (0.59 | ) |
| |
| Net asset value, end of period | | $ | 22.49 | | | $ | 15.51 | | | $ | 16.70 | | | $ | 17.22 | | | $ | 16.84 | |
| |
| Total return2 | | | 57.75% | | | | (4.03% | ) | | | 11.60% | | | | 22.17% | 3 | | | 16.83% | 3 |
| |
| Ratios and supplemental data: | | | | | | | | | | | | | | | | | | | | |
| Net assets, end of period (000 omitted) | | $ | 27,906 | | | $ | 22,363 | | | $ | 29,605 | | | $ | 32,254 | | | $ | 32,215 | |
| Ratio of expenses to average net assets4 | | | 1.23% | | | | 1.24% | | | | 1.25% | | | | 1.26% | | | | 1.35% | |
| Ratio of expenses to average net assets prior to fees waived4 | | | 1.23% | | | | 1.24% | | | | 1.25% | | | | 1.26% | | | | 1.38% | |
| Ratio of net investment loss to average net assets | | | (0.65% | ) | | | (0.38% | ) | | | (0.19% | ) | | | (0.31% | ) | | | (0.35% | ) |
| Ratio of net investment loss to average net assets prior to fees | | | | | | | | | | | | | | | | | | | | |
| waived | | | (0.65% | ) | | | (0.38% | ) | | | (0.19% | ) | | | (0.31% | ) | | | (0.38% | ) |
| Portfolio turnover | | | 27% | | | | 29% | | | | 25% | | | | 77% | 5 | | | 52% | |
| 1 | The average shares outstanding have been applied for per share information. |
| 2 | Total return is based on the change in net asset value of a share during the period and assumes reinvestment of dividends and distributions at net asset value and does not reflect the impact of a sales charge. |
| 3 | Total return during the period reflects a waiver by the manager. Performance would have been lower had the waiver not been in effect. |
| 4 | Expense ratios do not include expenses of the Underlying Funds in which the Fund invests. |
| 5 | As a result of ClearBridge Investments, LLC replacing Fred Alger Management Inc. as one of the sub-advisors to Optimum Large Cap Growth Fund during the Fund’s fiscal year ending March 31, 2018, the Fund’s portfolio turnover rate increased during the year ended March 31, 2018. |
See accompanying notes, which are an integral part of the financial statements.
130
Table of Contents
Optimum Large Cap Growth Fund Class C
Selected data for each share of the Fund outstanding throughout each period were as follows:
| | Year ended |
| | 3/31/21 | | 3/31/20 | | 3/31/19 | | 3/31/18 | | 3/31/17 |
| Net asset value, beginning of period | | $ | 12.52 | | | $ | 13.68 | | | $ | 14.62 | | | $ | 14.81 | | | $ | 13.34 | |
| |
| Income (loss) from investment operations: | | | | | | | | | | | | | | | | | | | | |
| Net investment loss1 | | | (0.24 | ) | | | (0.16 | ) | | | (0.14 | ) | | | (0.17 | ) | | | (0.15 | ) |
| Net realized and unrealized gain (loss) | | | 7.26 | | | | (0.41 | ) | | | 1.51 | | | | 3.24 | | | | 2.21 | |
| Total from investment operations | | | 7.02 | | | | (0.57 | ) | | | 1.37 | | | | 3.07 | | | | 2.06 | |
| |
| Less dividends and distributions from: | | | | | | | | | | | | | | | | | | | | |
| Net realized gain | | | (1.91 | ) | | | (0.59 | ) | | | (2.31 | ) | | | (3.26 | ) | | | (0.59 | ) |
| Total dividends and distributions | | | (1.91 | ) | | | (0.59 | ) | | | (2.31 | ) | | | (3.26 | ) | | | (0.59 | ) |
| |
| Net asset value, end of period | | $ | 17.63 | | | $ | 12.52 | | | $ | 13.68 | | | $ | 14.62 | | | $ | 14.81 | |
| |
| Total return2 | | | 56.56% | | | | (4.71% | ) | | | 10.74% | | | | 21.30% | 3 | | | 15.88% | 3 |
| |
| Ratios and supplemental data: | | | | | | | | | | | | | | | | | | | | |
| Net assets, end of period (000 omitted) | | $ | 79,209 | | | $ | 63,237 | | | $ | 83,010 | | | $ | 97,658 | | | $ | 105,082 | |
| Ratio of expenses to average net assets4 | | | 1.98% | | | | 1.99% | | | | 2.00% | | | | 2.01% | | | | 2.10% | |
| Ratio of expenses to average net assets prior to fees waived4 | | | 1.98% | | | | 1.99% | | | | 2.00% | | | | 2.01% | | | | 2.13% | |
| Ratio of net investment loss to average net assets | | | (1.40% | ) | | | (1.13% | ) | | | (0.94% | ) | | | (1.06% | ) | | | (1.10% | ) |
| Ratio of net investment loss to average net assets prior to fees | | | | | | | | | | | | | | | | | | | | |
| waived | | | (1.40% | ) | | | (1.13% | ) | | | (0.94% | ) | | | (1.06% | ) | | | (1.13% | ) |
| Portfolio turnover | | | 27% | | | | 29% | | | | 25% | | | | 77% | 5 | | | 52% | |
| 1 | The average shares outstanding have been applied for per share information. |
| 2 | Total return is based on the change in net asset value of a share during the period and assumes reinvestment of dividends and distributions at net asset value and does not reflect the impact of a sales charge. |
| 3 | Total return during the period reflects a waiver by the manager. Performance would have been lower had the waiver not been in effect. |
| 4 | Expense ratios do not include expenses of the Underlying Funds in which the Fund invests. |
| 5 | As a result of ClearBridge Investments, LLC replacing Fred Alger Management Inc. as one of the sub-advisors to Optimum Large Cap Growth Fund during the Fund’s fiscal year ending March 31, 2018, the Fund’s portfolio turnover rate increased during the year ended March 31, 2018. |
See accompanying notes, which are an integral part of the financial statements.
131
Table of Contents
Financial highlights
Optimum Large Cap Growth Fund Institutional Class
Selected data for each share of the Fund outstanding throughout each period were as follows:
| | Year ended |
| | 3/31/21 | | 3/31/20 | | 3/31/19 | | 3/31/18 | | 3/31/17 |
| Net asset value, beginning of period | | $ | 16.93 | | | $ | 18.13 | | | $ | 18.46 | | | $ | 17.81 | | | $ | 15.76 | |
| |
| Income (loss) from investment operations: | | | | | | | | | | | | | | | | | | | | |
| Net investment income (loss)1 | | | (0.09 | ) | | | (0.02 | ) | | | 0.01 | | | | (0.01 | ) | | | (0.02 | ) |
| Net realized and unrealized gain (loss) | | | 9.86 | | | | (0.59 | ) | | | 1.97 | | | | 3.92 | | | | 2.66 | |
| Total from investment operations | | | 9.77 | | | | (0.61 | ) | | | 1.98 | | | | 3.91 | | | | 2.64 | |
| |
| Less dividends and distributions from: | | | | | | | | | | | | | | | | | | | | |
| Net realized gain | | | (1.91 | ) | | | (0.59 | ) | | | (2.31 | ) | | | (3.26 | ) | | | (0.59 | ) |
| Total dividends and distributions | | | (1.91 | ) | | | (0.59 | ) | | | (2.31 | ) | | | (3.26 | ) | | | (0.59 | ) |
| |
| Net asset value, end of period | | $ | 24.79 | | | $ | 16.93 | | | $ | 18.13 | | | $ | 18.46 | | | $ | 17.81 | |
| |
| Total return2 | | | 58.11% | | | | (3.77% | ) | | | 11.86% | | | | 22.50% | 3 | | | 17.14% | 3 |
| |
| Ratios and supplemental data: | | | | | | | | | | | | | | | | | | | | |
| Net assets, end of period (000 omitted) | | $ | 1,824,739 | | | $ | 1,392,797 | | | $ | 1,563,552 | | | $ | 1,610,343 | | | $ | 1,348,419 | |
| Ratio of expenses to average net assets4 | | | 0.98% | | | | 0.99% | | | | 1.00% | | | | 1.01% | | | | 1.10% | |
| Ratio of expenses to average net assets prior to fees waived4 | | | 0.98% | | | | 0.99% | | | | 1.00% | | | | 1.01% | | | | 1.13% | |
| Ratio of net investment income (loss) to average net assets | | | (0.40% | ) | | | (0.13% | ) | | | 0.06% | | | | (0.06% | ) | | | (0.10% | ) |
| Ratio of net investment income (loss) to average net assets prior | | | | | | | | | | | | | | | | | | | | |
| to fees waived | | | (0.40% | ) | | | (0.13% | ) | | | 0.06% | | | | (0.06% | ) | | | (0.13% | ) |
| Portfolio turnover | | | 27% | | | | 29% | | | | 25% | | | | 77% | 5 | | | 52% | |
| 1 | The average shares outstanding have been applied for per share information. |
| 2 | Total return is based on the change in net asset value of a share during the period and assumes reinvestment of dividends and distributions at net asset value. |
| 3 | Total return during the period reflects a waiver by the manager. Performance would have been lower had the waiver not been in effect. |
| 4 | Expense ratios do not include expenses of the Underlying Funds in which the Fund invests. |
| 5 | As a result of ClearBridge Investments, LLC replacing Fred Alger Management Inc. as one of the sub-advisors to Optimum Large Cap Growth Fund during the Fund’s fiscal year ending March 31, 2018, the Fund’s portfolio turnover rate increased during the year ended March 31, 2018. |
See accompanying notes, which are an integral part of the financial statements.
132
Table of Contents
Optimum Large Cap Value Fund Class A
Selected data for each share of the Fund outstanding throughout each period were as follows:
| | Year ended |
| | 3/31/21 | | 3/31/20 | | 3/31/19 | | 3/31/18 | | 3/31/17 |
| Net asset value, beginning of period | | $ | 13.22 | | | $ | 15.83 | | | $ | 15.89 | | | $ | 15.42 | | | $ | 15.13 | |
| |
| Income (loss) from investment operations: | | | | | | | | | | | | | | | | | | | | |
| Net investment income1 | | | 0.17 | | | | 0.20 | | | | 0.19 | | | | 0.17 | | | | 0.17 | |
| Net realized and unrealized gain (loss) | | | 6.52 | | | | (2.37 | ) | | | 0.38 | | | | 1.19 | | | | 2.04 | |
| Total from investment operations | | | 6.69 | | | | (2.17 | ) | | | 0.57 | | | | 1.36 | | | | 2.21 | |
| |
| Less dividends and distributions from: | | | | | | | | | | | | | | | | | | | | |
| Net investment income | | | (0.10 | ) | | | (0.20 | ) | | | (0.18 | ) | | | (0.16 | ) | | | (0.18 | ) |
| Net realized gain | | | (0.09 | ) | | | (0.24 | ) | | | (0.45 | ) | | | (0.73 | ) | | | (1.74 | ) |
| Total dividends and distributions | | | (0.19 | ) | | | (0.44 | ) | | | (0.63 | ) | | | (0.89 | ) | | | (1.92 | ) |
| |
| Net asset value, end of period | | $ | 19.72 | | | $ | 13.22 | | | $ | 15.83 | | | $ | 15.89 | | | $ | 15.42 | |
| |
| Total return2 | | | 50.73% | | | | (14.37% | ) | | | 3.79% | | | | 8.68% | | | | 14.99% | 3 |
| |
| Ratios and supplemental data: | | | | | | | | | | | | | | | | | | | | |
| Net assets, end of period (000 omitted) | | $ | 23,730 | | | $ | 17,123 | | | $ | 23,742 | | | $ | 26,448 | | | $ | 28,739 | |
| Ratio of expenses to average net assets4 | | | 1.19% | | | | 1.20% | | | | 1.20% | | | | 1.21% | | | | 1.33% | |
| Ratio of expenses to average net assets prior to fees waived4 | | | 1.19% | | | | 1.20% | | | | 1.20% | | | | 1.21% | | | | 1.34% | |
| Ratio of net investment income to average net assets | | | 1.04% | | | | 1.19% | | | | 1.23% | | | | 1.05% | | | | 1.06% | |
| Ratio of net investment income to average net assets prior to | | | | | | | | | | | | | | | | | | | | |
| fees waived | | | 1.04% | | | | 1.19% | | | | 1.23% | | | | 1.05% | | | | 1.05% | |
| Portfolio turnover | | | 20% | | | | 23% | | | | 22% | | | | 25% | | | | 82% | 5 |
| 1 | The average shares outstanding have been applied for per share information. |
| 2 | Total return is based on the change in net asset value of a share during the period and assumes reinvestment of dividends and distributions at net asset value and does not reflect the impact of a sales charge. |
| 3 | Total return during the period reflects a waiver by the manager. Performance would have been lower had the waiver not been in effect. |
| 4 | Expense ratios do not include expenses of the Underlying Funds in which the Fund invests. |
| 5 | As a result of Rothschild & Co replacing Herndon Capital Management, LLC as one of the sub-advisors to Optimum Large Cap Value Fund during the Fund’s fiscal year ending March 31, 2017, the Fund’s portfolio turnover rate increased substantially during the year ended March 31, 2017. |
See accompanying notes, which are an integral part of the financial statements.
133
Table of Contents
Financial highlights
Optimum Large Cap Value Fund Class C
Selected data for each share of the Fund outstanding throughout each period were as follows:
| | Year ended |
| | 3/31/21 | | 3/31/20 | | 3/31/19 | | 3/31/18 | | 3/31/17 |
| Net asset value, beginning of period | | $ | 13.06 | | | $ | 15.65 | | | $ | 15.69 | | | $ | 15.25 | | | $ | 14.99 | |
| |
| Income (loss) from investment operations: | | | | | | | | | | | | | | | | | | | | |
| Net investment income1 | | | 0.05 | | | | 0.07 | | | | 0.07 | | | | 0.05 | | | | 0.05 | |
| Net realized and unrealized gain (loss) | | | 6.42 | | | | (2.35 | ) | | | 0.38 | | | | 1.17 | | | | 2.01 | |
| Total from investment operations | | | 6.47 | | | | (2.28 | ) | | | 0.45 | | | | 1.22 | | | | 2.06 | |
| |
| Less dividends and distributions from: | | | | | | | | | | | | | | | | | | | | |
| Net investment income | | | — | | | | (0.07 | ) | | | (0.04 | ) | | | (0.05 | ) | | | (0.06 | ) |
| Net realized gain | | | (0.09 | ) | | | (0.24 | ) | | | (0.45 | ) | | | (0.73 | ) | | | (1.74 | ) |
| Total dividends and distributions | | | (0.09 | ) | | | (0.31 | ) | | | (0.49 | ) | | | (0.78 | ) | | | (1.80 | ) |
| |
| Net asset value, end of period | | $ | 19.44 | | | $ | 13.06 | | | $ | 15.65 | | | $ | 15.69 | | | $ | 15.25 | |
| |
| Total return2 | | | 49.61% | | | | (15.04% | ) | | | 3.05% | | | | 7.82% | | | | 14.13% | 3 |
| |
| Ratios and supplemental data: | | | | | | | | | | | | | | | | | | | | |
| Net assets, end of period (000 omitted) | | $ | 69,778 | | | $ | 50,036 | | | $ | 69,415 | | | $ | 82,610 | | | $ | 95,495 | |
| Ratio of expenses to average net assets4 | | | 1.94% | | | | 1.95% | | | | 1.95% | | | | 1.96% | | | | 2.08% | |
| Ratio of expenses to average net assets prior to fees waived4 | | | 1.94% | | | | 1.95% | | | | 1.95% | | | | 1.96% | | | | 2.09% | |
| Ratio of net investment income to average net assets | | | 0.29% | | | | 0.44% | | | | 0.48% | | | | 0.30% | | | | 0.31% | |
| Ratio of net investment income to average net assets | | | | | | | | | | | | | | | | | | | | |
| prior to fees waived | | | 0.29% | | | | 0.44% | | | | 0.48% | | | | 0.30% | | | | 0.30% | |
| Portfolio turnover | | | 20% | | | | 23% | | | | 22% | | | | 25% | | | | 82% | 5 |
| 1 | The average shares outstanding have been applied for per share information. |
| 2 | Total return is based on the change in net asset value of a share during the period and assumes reinvestment of dividends and distributions at net asset value and does not reflect the impact of a sales charge. |
| 3 | Total return during the period reflects a waiver by the manager. Performance would have been lower had the waiver not been in effect. |
| 4 | Expense ratios do not include expenses of the Underlying Funds in which the Fund invests. |
| 5 | As a result of Rothschild & Co replacing Herndon Capital Management, LLC as one of the sub-advisors to Optimum Large Cap Value Fund during the Fund’s fiscal year ending March 31, 2017, the Fund’s portfolio turnover rate increased substantially during the year ended March 31, 2017. |
See accompanying notes, which are an integral part of the financial statements.
134
Table of Contents
Optimum Large Cap Value Fund Institutional Class
Selected data for each share of the Fund outstanding throughout each period were as follows:
| | Year ended |
| | 3/31/21 | | 3/31/20 | | 3/31/19 | | 3/31/18 | | 3/31/17 |
| Net asset value, beginning of period | | $ | 13.25 | | | $ | 15.87 | | | $ | 15.93 | | | $ | 15.46 | | | $ | 15.16 | |
| |
| Income (loss) from investment operations: | | | | | | | | | | | | | | | | | | | | |
| Net investment income1 | | | 0.21 | | | | 0.24 | | | | 0.23 | | | | 0.21 | | | | 0.20 | |
| Net realized and unrealized gain (loss) | | | 6.54 | | | | (2.38 | ) | | | 0.38 | | | | 1.19 | | | | 2.06 | |
| Total from investment operations | | | 6.75 | | | | (2.14 | ) | | | 0.61 | | | | 1.40 | | | | 2.26 | |
| |
| Less dividends and distributions from: | | | | | | | | | | | | | | | | | | | | |
| Net investment income | | | (0.14 | ) | | | (0.24 | ) | | | (0.22 | ) | | | (0.20 | ) | | | (0.22 | ) |
| Net realized gain | | | (0.09 | ) | | | (0.24 | ) | | | (0.45 | ) | | | (0.73 | ) | | | (1.74 | ) |
| Total dividends and distributions | | | (0.23 | ) | | | (0.48 | ) | | | (0.67 | ) | | | (0.93 | ) | | | (1.96 | ) |
| |
| Net asset value, end of period | | $ | 19.77 | | | $ | 13.25 | | | $ | 15.87 | | | $ | 15.93 | | | $ | 15.46 | |
| |
| Total return2 | | | 51.11% | | | | (14.19% | ) | | | 4.08% | | | | 8.90% | | | | 15.30% | 3 |
| |
| Ratios and supplemental data: | | | | | | | | | | | | | | | | | | | | |
| Net assets, end of period (000 omitted) | | $ | 1,724,882 | | | $ | 1,217,465 | | | $ | 1,474,723 | | | $ | 1,372,505 | | | $ | 1,217,722 | |
| Ratio of expenses to average net assets4 | | | 0.94% | | | | 0.95% | | | | 0.95% | | | | 0.96% | | | | 1.08% | |
| Ratio of expenses to average net assets prior to fees waived4 | | | 0.94% | | | | 0.95% | | | | 0.95% | | | | 0.96% | | | | 1.09% | |
| Ratio of net investment income to average net assets | | | 1.29% | | | | 1.44% | | | | 1.48% | | | | 1.30% | | | | 1.31% | |
| Ratio of net investment income to average net assets prior to | | | | | | | | | | | | | | | | | | | | |
| fees waived | | | 1.29% | | | | 1.44% | | | | 1.48% | | | | 1.30% | | | | 1.30% | |
| Portfolio turnover | | | 20% | | | | 23% | | | | 22% | | | | 25% | | | | 82% | 5 |
| 1 | The average shares outstanding have been applied for per share information. |
| 2 | Total return is based on the change in net asset value of a share during the period and assumes reinvestment of dividends and distributions at net asset value. |
| 3 | Total return during the period reflects a waiver by the manager. Performance would have been lower had the waiver not been in effect. |
| 4 | Expense ratios do not include expenses of the Underlying Funds in which the Fund invests. |
| 5 | As a result of Rothschild & Co replacing Herndon Capital Management, LLC as one of the sub-advisors to Optimum Large Cap Value Fund during the Fund’s fiscal year ending March 31, 2017, the Fund’s portfolio turnover rate increased substantially during the year ended March 31, 2017. |
See accompanying notes, which are an integral part of the financial statements.
135
Table of Contents
Financial highlights
Optimum Small-Mid Cap Growth Fund Class A
Selected data for each share of the Fund outstanding throughout each period were as follows:
| | Year ended |
| | 3/31/21 | | 3/31/20 | | 3/31/19 | | 3/31/18 | | 3/31/17 |
| Net asset value, beginning of period | | $ | 10.17 | | | $ | 13.43 | | | $ | 15.51 | | | $ | 13.31 | | | $ | 10.95 | |
| |
| Income (loss) from investment operations: | | | | | | | | | | | | | | | | | | | | |
| Net investment loss1 | | | (0.18 | ) | | | (0.15 | ) | | | (0.17 | ) | | | (0.16 | ) | | | (0.14 | ) |
| Net realized and unrealized gain (loss) | | | 10.98 | | | | (1.77 | ) | | | 1.20 | | | | 3.03 | | | | 2.50 | |
| Total from investment operations | | | 10.80 | | | | (1.92 | ) | | | 1.03 | | | | 2.87 | | | | 2.36 | |
| |
| Less dividends and distributions from: | | | | | | | | | | | | | | | | | | | | |
| Net realized gain | | | (2.92 | ) | | | (1.34 | ) | | | (3.11 | ) | | | (0.67 | ) | | | — | |
| Total dividends and distributions | | | (2.92 | ) | | | (1.34 | ) | | | (3.11 | ) | | | (0.67 | ) | | | — | |
| |
| Net asset value, end of period | | $ | 18.05 | | | $ | 10.17 | | | $ | 13.43 | | | $ | 15.51 | | | $ | 13.31 | |
| |
| Total return2 | | | 109.54% | | | | (16.32% | ) | | | 8.69% | | | | 21.88% | | | | 21.55% | |
| |
| Ratios and supplemental data: | | | | | | | | | | | | | | | | | | | | |
| Net assets, end of period (000 omitted) | | $ | 5,016 | | | $ | 3,241 | | | $ | 4,788 | | | $ | 5,414 | | | $ | 5,293 | |
| Ratio of expenses to average net assets3 | | | 1.56% | | | | 1.54% | | | | 1.54% | | | | 1.55% | | | | 1.58% | |
| Ratio of expenses to average net assets prior to fees waived3 | | | 1.58% | | | | 1.63% | | | | 1.65% | | | | 1.63% | | | | 1.79% | |
| Ratio of net investment loss to average net assets | | | (1.18% | ) | | | (1.11% | ) | | | (1.11% | ) | | | (1.07% | ) | | | (1.16% | ) |
| Ratio of net investment loss to average net assets prior to fees | | | | | | | | | | | | | | | | | | | | |
| waived | | | (1.20% | ) | | | (1.20% | ) | | | (1.22% | ) | | | (1.15% | ) | | | (1.37% | ) |
| Portfolio turnover | | | 111% | | | | 93% | | | | 82% | | | | 89% | | | | 180% | 4 |
| 1 | The average shares outstanding have been applied for per share information. |
| 2 | Total return is based on the change in net asset value of a share during the period and assumes reinvestment of dividends and distributions at net asset value and does not reflect the impact of a sales charge. Total return during all of the periods shown reflects a waiver by the manager. Performance would have been lower had the waiver not been in effect. |
| 3 | Expense ratios do not include expenses of the Underlying Funds in which the Fund invests. |
| 4 | As a result of Peregrine Capital Management, LLC and Columbus Circle Investors replacing Columbia Wanger Asset Management and Wellington Management as the sub-advisors to Optimum Small-Mid Cap Growth Fund during the Fund’s fiscal year ending March 31, 2017, the Fund’s portfolio turnover rate increased substantially during the year ended March 31, 2017. |
See accompanying notes, which are an integral part of the financial statements.
136
Table of Contents
Optimum Small-Mid Cap Growth Fund Class C
Selected data for each share of the Fund outstanding throughout each period were as follows:
| | Year ended |
| | 3/31/21 | | 3/31/20 | | 3/31/19 | | 3/31/18 | | 3/31/17 |
| Net asset value, beginning of period | | $ | 8.02 | | | $ | 10.94 | | | $ | 13.32 | | | $ | 11.59 | | | $ | 9.61 | |
| |
| Income (loss) from investment operations: | | | | | | | | | | | | | | | | | | | | |
| Net investment loss1 | | | (0.23 | ) | | | (0.20 | ) | | | (0.24 | ) | | | (0.23 | ) | | | (0.20 | ) |
| Net realized and unrealized gain (loss) | | | 8.56 | | | | (1.38 | ) | | | 0.97 | | | | 2.63 | | | | 2.18 | |
| Total from investment operations | | | 8.33 | | | | (1.58 | ) | | | 0.73 | | | | 2.40 | | | | 1.98 | |
| |
| Less dividends and distributions from: | | | | | | | | | | | | | | | | | | | | |
| Net realized gain | | | (2.92 | ) | | | (1.34 | ) | | | (3.11 | ) | | | (0.67 | ) | | | — | |
| Total dividends and distributions | | | (2.92 | ) | | | (1.34 | ) | | | (3.11 | ) | | | (0.67 | ) | | | — | |
| |
| Net asset value, end of period | | $ | 13.43 | | | $ | 8.02 | | | $ | 10.94 | | | $ | 13.32 | | | $ | 11.59 | |
| |
| Total return2 | | | 108.02% | | | | (16.95% | ) | | | 7.81% | | | | 21.06% | | | | 20.60% | |
| |
| Ratios and supplemental data: | | | | | | | | | | | | | | | | | | | | |
| Net assets, end of period (000 omitted) | | $ | 14,372 | | | $ | 9,353 | | | $ | 13,510 | | | $ | 15,925 | | | $ | 16,668 | |
| Ratio of expenses to average net assets3 | | | 2.31% | | | | 2.29% | | | | 2.29% | | | | 2.30% | | | | 2.33% | |
| Ratio of expenses to average net assets prior to fees waived3 | | | 2.33% | | | | 2.38% | | | | 2.40% | | | | 2.38% | | | | 2.54% | |
| Ratio of net investment loss to average net assets | | | (1.93% | ) | | | (1.86% | ) | | | (1.86% | ) | | | (1.82% | ) | | | (1.91% | ) |
| Ratio of net investment loss to average net assets prior to fees | | | | | | | | | | | | | | | | | | | | |
| waived | | | (1.95% | ) | | | (1.95% | ) | | | (1.97% | ) | | | (1.90% | ) | | | (2.12% | ) |
| Portfolio turnover | | | 111% | | | | 93% | | | | 82% | | | | 89% | | | | 180% | 4 |
| 1 | The average shares outstanding have been applied for per share information. |
| 2 | Total return is based on the change in net asset value of a share during the period and assumes reinvestment of dividends and distributions at net asset value and does not reflect the impact of a sales charge. Total return during all of the periods shown reflects a waiver by the manager. Performance would have been lower had the waiver not been in effect. |
| 3 | Expense ratios do not include expenses of the Underlying Funds in which the Fund invests. |
| 4 | As a result of Peregrine Capital Management, LLC and Columbus Circle Investors replacing Columbia Wanger Asset Management and Wellington Management as the sub-advisors to Optimum Small-Mid Cap Growth Fund during the Fund’s fiscal year ending March 31, 2017, the Fund’s portfolio turnover rate increased substantially during the year ended March 31, 2017. |
See accompanying notes, which are an integral part of the financial statements.
137
Table of Contents
Financial highlights
Optimum Small-Mid Cap Growth Fund Institutional Class
Selected data for each share of the Fund outstanding throughout each period were as follows:
| | Year ended |
| | 3/31/21 | | 3/31/20 | | 3/31/19 | | 3/31/18 | | 3/31/17 |
| Net asset value, beginning of period | | $ | 11.25 | | | $ | 14.69 | | | $ | 16.63 | | | $ | 14.19 | | | $ | 11.65 | |
| |
| Income (loss) from investment operations: | | | | | | | | | | | | | | | | | | | | |
| Net investment loss1 | | | (0.16 | ) | | | (0.12 | ) | | | (0.14 | ) | | | (0.13 | ) | | | (0.12 | ) |
| Net realized and unrealized gain (loss) | | | 12.20 | | | | (1.98 | ) | | | 1.31 | | | | 3.24 | | | | 2.66 | |
| Total from investment operations | | | 12.04 | | | | (2.10 | ) | | | 1.17 | | | | 3.11 | | | | 2.54 | |
| |
| Less dividends and distributions from: | | | | | | | | | | | | | | | | | | | | |
| Net realized gain | | | (2.92 | ) | | | (1.34 | ) | | | (3.11 | ) | | | (0.67 | ) | | | — | |
| Total dividends and distributions | | | (2.92 | ) | | | (1.34 | ) | | | (3.11 | ) | | | (0.67 | ) | | | — | |
| |
| Net asset value, end of period | | $ | 20.37 | | | $ | 11.25 | | | $ | 14.69 | | | $ | 16.63 | | | $ | 14.19 | |
| |
| Total return2 | | | 110.06% | | | | (16.14% | ) | | | 8.97% | | | | 22.22% | | | | 21.80% | |
| |
| Ratios and supplemental data: | | | | | | | | | | | | | | | | | | | | |
| Net assets, end of period (000 omitted) | | $ | 737,128 | | | $ | 406,140 | | | $ | 494,476 | | | $ | 494,894 | | | $ | 420,279 | |
| Ratio of expenses to average net assets3 | | | 1.31% | | | | 1.29% | | | | 1.29% | | | | 1.30% | | | | 1.33% | |
| Ratio of expenses to average net assets prior to fees waived3 | | | 1.33% | | | | 1.38% | | | | 1.40% | | | | 1.38% | | | | 1.54% | |
| Ratio of net investment loss to average net assets | | | (0.93% | ) | | | (0.86% | ) | | | (0.86% | ) | | | (0.82% | ) | | | (0.91% | ) |
| Ratio of net investment loss to average net assets prior to fees | | | | | | | | | | | | | | | | | | | | |
| waived | | | (0.95% | ) | | | (0.95% | ) | | | (0.97% | ) | | | (0.90% | ) | | | (1.12% | ) |
| Portfolio turnover | | | 111% | | | | 93% | | | | 82% | | | | 89% | | | | 180% | 4 |
| 1 | The average shares outstanding have been applied for per share information. |
| 2 | Total return is based on the change in net asset value of a share during the period and assumes reinvestment of dividends and distributions at net asset value. Total return during all of the periods shown reflects a waiver by the manager. Performance would have been lower had the waiver not been in effect. |
| 3 | Expense ratios do not include expenses of the Underlying Funds in which the Fund invests. |
| 4 | As a result of Peregrine Capital Management, LLC and Columbus Circle Investors replacing Columbia Wanger Asset Management and Wellington Management as the sub-advisors to Optimum Small-Mid Cap Growth Fund during the Fund’s fiscal year ending March 31, 2017, the Fund’s portfolio turnover rate increased substantially during the year ended March 31, 2017. |
See accompanying notes, which are an integral part of the financial statements.
138
Table of Contents
Optimum Small-Mid Cap Value Fund Class A
Selected data for each share of the Fund outstanding throughout each period were as follows:
| | Year ended |
| | 3/31/21 | | 3/31/20 | | 3/31/19 | | 3/31/18 | | 3/31/17 |
| Net asset value, beginning of period | | $ | 8.36 | | | $ | 12.14 | | | $ | 13.66 | | | $ | 13.77 | | | $ | 11.53 | |
| | | | | | | | | | | | | | | | | | | | | |
| Income (loss) from investment operations: | | | | | | | | | | | | | | | | | | | | |
| Net investment income1 | | | 0.19 | | | | 0.10 | | | | 0.11 | | | | 0.06 | | | | 0.08 | |
| Net realized and unrealized gain (loss) | | | 6.92 | | | | (3.50 | ) | | | (0.69 | ) | | | 0.59 | | | | 2.21 | |
| Total from investment operations | | | 7.11 | | | | (3.40 | ) | | | (0.58 | ) | | | 0.65 | | | | 2.29 | |
| | | | | | | | | | | | | | | | | | | | | |
| Less dividends and distributions from: | | | | | | | | | | | | | | | | | | | | |
| Net investment income | | | (0.09 | ) | | | (0.11 | ) | | | (0.06 | ) | | | (0.07 | ) | | | (0.05 | ) |
| Net realized gain | | | (0.45 | ) | | | (0.27 | ) | | | (0.88 | ) | | | (0.69 | ) | | | — | |
| Total dividends and distributions | | | (0.54 | ) | | | (0.38 | ) | | | (0.94 | ) | | | (0.76 | ) | | | (0.05 | ) |
| | | | | | | | | | | | | | | | | | | | | |
| Net asset value, end of period | | $ | 14.93 | | | $ | 8.36 | | | $ | 12.14 | | | $ | 13.66 | | | $ | 13.77 | |
| | | | | | | | | | | | | | | | | | | | | |
| Total return2 | | | 86.21% | | | | (29.10% | ) | | | (3.83% | ) | | | 4.59% | | | | 19.84% | |
| | | | | | | | | | | | | | | | | | | | | |
| Ratios and supplemental data: | | | | | | | | | | | | | | | | | | | | |
| Net assets, end of period (000 omitted) | | $ | 3,765 | | | $ | 1,970 | | | $ | 3,266 | | | $ | 3,856 | | | $ | 4,279 | |
| Ratio of expenses to average net assets3 | | | 1.49% | | | | 1.47% | | | | 1.46% | | | | 1.48% | | | | 1.51% | |
| Ratio of expenses to average net assets prior to fees waived3 | | | 1.50% | | | | 1.52% | | | | 1.54% | | | | 1.54% | | | | 1.71% | |
| Ratio of net investment income to average net assets | | | 1.65% | | | | 0.79% | | | | 0.87% | | | | 0.40% | | | | 0.64% | |
| Ratio of net investment income to average net assets prior to | | | | | | | | | | | | | | | | | | | | |
| fees waived | | | 1.64% | | | | 0.74% | | | | 0.79% | | | | 0.34% | | | | 0.44% | |
| Portfolio turnover | | | 85% | 4 | | | 33% | | | | 32% | | | | 31% | | | | 30% | |
| 1 | The average shares outstanding have been applied for per share information. |
| 2 | Total return is based on the change in net asset value of a share during the period and assumes reinvestment of dividends and distributions at net asset value and does not reflect the impact of a sales charge. Total return during all of the periods shown reflects a waiver by the manager. Performance would have been lower had the waiver not been in effect. |
| 3 | Expense ratios do not include expenses of the Underlying Funds in which the Fund invests. |
| 4 | As a result of Cardinal Capital Management LLC replacing Westwood Management Corp. as one of the sub-advisors to Optimum Small-Mid Cap Value Fund during the Fund’s fiscal year ending March 31, 2021, the Fund’s portfolio turnover rate increased during the year ended March 31, 2021. |
See accompanying notes, which are an integral part of the financial statements.
139
Table of Contents
Financial highlights
Optimum Small-Mid Cap Value Fund Class C
Selected data for each share of the Fund outstanding throughout each period were as follows:
| | Year ended |
| | 3/31/21 | | 3/31/20 | | 3/31/19 | | 3/31/18 | | 3/31/17 |
| Net asset value, beginning of period | | $ | 7.22 | | | $ | 10.54 | | | $ | 12.01 | | | $ | 12.21 | | | $ | 10.27 | |
| | | | | | | | | | | | | | | | | | | | | |
| Income (loss) from investment operations: | | | | | | | | | | | | | | | | | | | | |
| Net investment income (loss)1 | | | 0.09 | | | | — | 2 | | | 0.01 | | | | (0.04 | ) | | | (0.01 | ) |
| Net realized and unrealized gain (loss) | | | 5.94 | | | | (3.02 | ) | | | (0.60 | ) | | | 0.53 | | | | 1.95 | |
| Total from investment operations | | | 6.03 | | | | (3.02 | ) | | | (0.59 | ) | | | 0.49 | | | | 1.94 | |
| | | | | | | | | | | | | | | | | | | | | |
| Less dividends and distributions from: | | | | | | | | | | | | | | | | | | | | |
| Net investment income | | | (0.02 | ) | | | (0.03 | ) | | | — | | | | — | | | | — | |
| Net realized gain | | | (0.45 | ) | | | (0.27 | ) | | | (0.88 | ) | | | (0.69 | ) | | | — | |
| Total dividends and distributions | | | (0.47 | ) | | | (0.30 | ) | | | (0.88 | ) | | | (0.69 | ) | | | — | |
| | | | | | | | | | | | | | | | | | | | | |
| Net asset value, end of period | | $ | 12.78 | | | $ | 7.22 | | | $ | 10.54 | | | $ | 12.01 | | | $ | 12.21 | |
| | | | | | | | | | | | | | | | | | | | | |
| Total return3 | | | 84.75% | | | | (29.65% | ) | | | (4.50% | ) | | | 3.85% | | | | 18.89% | |
| | | | | | | | | | | | | | | | | | | | | |
| Ratios and supplemental data: | | | | | | | | | | | | | | | | | | | | |
| Net assets, end of period (000 omitted) | | $ | 11,354 | | | $ | 6,042 | | | $ | 9,508 | | | $ | 12,030 | | | $ | 14,268 | |
| Ratio of expenses to average net assets4 | | | 2.24% | | | | 2.22% | | | | 2.21% | | | | 2.23% | | | | 2.26% | |
| Ratio of expenses to average net assets prior to fees waived4 | | | 2.25% | | | | 2.27% | | | | 2.29% | | | | 2.29% | | | | 2.46% | |
| Ratio of net investment income (loss) to average net assets | | | 0.90% | | | | 0.04% | | | | 0.12% | | | | (0.35% | ) | | | (0.11% | ) |
| Ratio of net investment income (loss) to average net assets prior | | | | | | | | | | | | | | | | | | | | |
| to fees waived | | | 0.89% | | | | (0.01% | ) | | | 0.04% | | | | (0.41% | ) | | | (0.31% | ) |
| Portfolio turnover | | | 85% | 5 | | | 33% | | | | 32% | | | | 31% | | | | 30% | |
| 1 | The average shares outstanding have been applied for per share information. |
| 2 | Amount is less than $0.005 per share. |
| 3 | Total return is based on the change in net asset value of a share during the period and assumes reinvestment of dividends and distributions at net asset value and does not reflect the impact of a sales charge. Total return during all of the periods shown reflects a waiver by the manager. Performance would have been lower had the waiver not been in effect. |
| 4 | Expense ratios do not include expenses of the Underlying Funds in which the Fund invests. |
| 5 | As a result of Cardinal Capital Management LLC replacing Westwood Management Corp. as one of the sub-advisors to Optimum Small-Mid Cap Value Fund during the Fund’s fiscal year ending March 31, 2021, the Fund’s portfolio turnover rate increased during the year ended March 31, 2021. |
See accompanying notes, which are an integral part of the financial statements.
140
Table of Contents
Optimum Small-Mid Cap Value Fund Institutional Class
Selected data for each share of the Fund outstanding throughout each period were as follows:
| | Year ended |
| | 3/31/21 | | 3/31/20 | | 3/31/19 | | 3/31/18 | | 3/31/17 |
| Net asset value, beginning of period | | $ | 8.90 | | | $ | 12.90 | | | $ | 14.45 | | | $ | 14.52 | | | $ | 12.16 | |
| | | | | | | | | | | | | | | | | | | | | |
| Income (loss) from investment operations: | | | | | | | | | | | | | | | | | | | | |
| Net investment income1 | | | 0.23 | | | | 0.14 | | | | 0.16 | | | | 0.10 | | | | 0.12 | |
| Net realized and unrealized gain (loss) | | | 7.37 | | | | (3.73 | ) | | | (0.73 | ) | | | 0.63 | | | | 2.32 | |
| Total from investment operations | | | 7.60 | | | | (3.59 | ) | | | (0.57 | ) | | | 0.73 | | | | 2.44 | |
| | | | | | | | | | | | | | | | | | | | | |
| Less dividends and distributions from: | | | | | | | | | | | | | | | | | | | | |
| Net investment income | | | (0.11 | ) | | | (0.14 | ) | | | (0.10 | ) | | | (0.11 | ) | | | (0.08 | ) |
| Net realized gain | | | (0.45 | ) | | | (0.27 | ) | | | (0.88 | ) | | | (0.69 | ) | | | — | |
| Total dividends and distributions | | | (0.56 | ) | | | (0.41 | ) | | | (0.98 | ) | | | (0.80 | ) | | | (0.08 | ) |
| | | | | | | | | | | | | | | | | | | | | |
| Net asset value, end of period | | $ | 15.94 | | | $ | 8.90 | | | $ | 12.90 | | | $ | 14.45 | | | $ | 14.52 | |
| | | | | | | | | | | | | | | | | | | | | |
| Total return2 | | | 86.63% | | | | (28.92% | ) | | | (3.55% | ) | | | 4.87% | | | | 20.05% | |
| | | | | | | | | | | | | | | | | | | | | |
| Ratios and supplemental data: | | | | | | | | | | | | | | | | | | | | |
| Net assets, end of period (000 omitted) | | $ | 701,597 | | | $ | 366,656 | | | $ | 506,814 | | | $ | 442,808 | | | $ | 406,327 | |
| Ratio of expenses to average net assets3 | | | 1.24% | | | | 1.22% | | | | 1.21% | | | | 1.23% | | | | 1.26% | |
| Ratio of expenses to average net assets prior to fees waived3 | | | 1.25% | | | | 1.27% | | | | 1.29% | | | | 1.29% | | | | 1.46% | |
| Ratio of net investment income to average net assets | | | 1.90% | | | | 1.04% | | | | 1.12% | | | | 0.65% | | | | 0.89% | |
| Ratio of net investment income to average net assets prior to | | | | | | | | | | | | | | | | | | | | |
| fees waived | | | 1.89% | | | | 0.99% | | | | 1.04% | | | | 0.59% | | | | 0.69% | |
| Portfolio turnover | | | 85% | 4 | | | 33% | | | | 32% | | | | 31% | | | | 30% | |
| 1 | The average shares outstanding have been applied for per share information. |
| 2 | Total return is based on the change in net asset value of a share during the period and assumes reinvestment of dividends and distributions at net asset value. Total return during all of the periods shown reflects a waiver by the manager. Performance would have been lower had the waiver not been in effect. |
| 3 | Expense ratios do not include expenses of the Underlying Funds in which the Fund invests. |
| 4 | As a result of Cardinal Capital Management LLC replacing Westwood Management Corp. as one of the sub-advisors to Optimum Small-Mid Cap Value Fund during the Fund’s fiscal year ending March 31, 2021, the Fund’s portfolio turnover rate increased during the year ended March 31, 2021. |
See accompanying notes, which are an integral part of the financial statements.
141
Table of Contents
Notes to financial statements
Optimum Fund Trust
March 31, 2021
Optimum Fund Trust (Trust) is organized as a Delaware statutory trust and offers six series: Optimum Fixed Income Fund, Optimum International Fund, Optimum Large Cap Growth Fund, Optimum Large Cap Value Fund, Optimum Small-Mid Cap Growth Fund, and Optimum Small-Mid Cap Value Fund, (each, a Fund, or together, the Funds). The Trust is an open-end investment company. Each Fund is considered diversified under the Investment Company Act of 1940, as amended (1940 Act), and offers Class A, Class C, and Institutional Class shares. Class A shares are sold with a maximum front-end sales charge of 4.50% for Optimum Fixed Income Fund and 5.75% for Optimum International Fund, Optimum Large Cap Growth Fund, Optimum Large Cap Value Fund, Optimum Small-Mid Cap Growth Fund, and Optimum Small-Mid Cap Value Fund. Class C shares are sold with a contingent deferred sales charge (CDSC) of 1.00%, which will be incurred if redeemed during the first 12 months. Institutional Class shares are not subject to a sales charge and are offered for sale exclusively to certain eligible investors.
1. Significant Accounting Policies
Each Fund follows accounting and reporting guidance under Financial Accounting Standards Board (FASB) Accounting Standards Codification Topic 946, Financial Services — Investment Companies. The following accounting policies are in accordance with US generally accepted accounting principles (US GAAP) and are consistently followed by the Funds.
Security Valuation — Equity securities, except those traded on the Nasdaq Stock Market LLC (Nasdaq), are valued at the last quoted sales price as of the time of the regular close of the New York Stock Exchange on the valuation date. Equity securities traded on the Nasdaq are valued in accordance with the Nasdaq Official Closing Price, which may not be the last sales price. If, on a particular day, an equity security does not trade, the mean between the bid and ask prices will be used, which approximates fair value. Equity securities listed on a foreign exchange are normally valued at the last quoted sales price on the valuation date. US government and agency securities are valued at the mean between the bid and ask prices, which approximates fair value. Other debt securities, credit default swap (CDS) contracts, interest rate swap contracts, CDS and interest rate swap options contracts (swaptions) are valued based upon valuations provided by an independent pricing service or broker/counterparty and reviewed by management. To the extent current market prices are not available, the pricing service may take into account developments related to the specific security, as well as transactions in comparable securities. Valuations for fixed income securities utilize matrix systems, which reflect such factors as security prices, yields, maturities, and ratings, and are supplemented by dealer and exchange quotations. For asset-backed securities, collateralized mortgage obligations (CMOs), commercial mortgage securities, and US government agency mortgage securities, pricing vendors utilize matrix pricing which considers prepayment speed, attributes of the collateral, yield or price of bonds of comparable quality, coupon, maturity, and type as well as broker/dealer-supplied prices. Swap prices are derived using daily swap curves and models that incorporate a number of market data factors, such as discounted cash flows, trades, and values of the underlying reference instruments. Foreign currency exchange contracts and foreign cross currency exchange contracts are valued at the mean between the bid and the ask prices, which approximates fair value. Interpolated values are derived when the settlement date of the contract is an interim date for which quotations are not available. Futures contracts and options on futures contracts are valued at the daily quoted settlement prices. Exchange-traded options are valued at the last reported sale price or, if no sales are reported, at the mean between the last reported bid and ask prices, which approximates fair value. Open-end investment company securities are valued at net asset value (NAV) per share, as reported by the underlying investment company. Investments in repurchase agreements are generally valued at par, which approximates fair value, each business day. Generally, other securities and assets for which market quotations are not readily available are valued at fair value as determined in good faith under the direction of the Trust’s Board of Trustees (Board). In determining whether market quotations are readily available or fair valuation will be used, various factors will be taken into consideration, such as market closures or suspension of trading in a security. Each Fund may use fair value pricing more frequently for securities traded primarily in non-US markets because, among other things, most foreign markets close well before each Fund values its securities, generally as of 4:00pm Eastern time. The earlier close of these foreign markets gives rise to the possibility that significant events, including broad market moves, government actions or pronouncements, aftermarket trading, or news events may have occurred in the interim. Whenever such a significant event occurs, each Fund may value foreign securities using fair value prices based on third-party vendor modeling tools (international fair value pricing). Restricted securities are valued at fair value using methods approved by the Board.
Federal and Foreign Income Taxes — No provision for federal income taxes has been made as each Fund intends to continue to qualify for federal income tax purposes as a regulated investment company under Subchapter M of the Internal Revenue Code of 1986, as amended, and make the requisite distributions to shareholders. Each Fund evaluates tax positions taken or expected to be taken in the course of preparing each Fund’s tax returns to determine whether the tax positions are “more-likely-than-not” of being sustained by the applicable tax authority. Tax positions not deemed to meet the “more-likely-than-not” threshold are recorded as a tax benefit or expense in the current year. Management has analyzed each Fund’s tax positions taken or expected to be taken on each Fund’s federal income tax returns through the
142
Table of Contents
year ended March 31, 2021 and for all open tax years (years ended March 31, 2018–March 31, 2020), and has concluded that no provision for federal income tax is required in each Fund’s financial statements. In regard to foreign taxes only, each Fund has open tax years in certain foreign countries in which it invests that may date back to the inception of each Fund. If applicable, each Fund recognize interest accrued on unrecognized tax benefits in interest expense and penalties in “Other” on the “Statements of operations.” During the year ended March 31, 2021, the Funds did not incur any interest or tax penalties.
Class Accounting — Investment income, common expenses, and realized and unrealized gain (loss) on investments are allocated to the various classes of each Fund on the basis of daily net assets of each class. Distribution expenses relating to a specific class are charged directly to that class.
Repurchase Agreements — Each Fund may purchase certain US government securities subject to the counterparty’s agreement to repurchase them at an agreed upon date and price. The counterparty will be required on a daily basis to maintain the value of the collateral subject to the agreement at not less than the repurchase price (including accrued interest). The agreements are conditioned upon the collateral being deposited under the Federal Reserve book-entry system with each Fund’s custodian or a third-party sub-custodian. In the event of default or bankruptcy by the other party to the agreement, retention of the collateral may be subject to legal proceedings. All open repurchase agreements as of the date of this report were entered into on March 31, 2021, and matured by April 5, 2021.
Reverse Repurchase Agreements — Optimum Fixed Income Fund may enter into reverse repurchase agreements. In a reverse repurchase agreement, the Fund sells securities to a bank or broker/dealer and agrees to repurchase the securities at an agreed upon date and price. The Fund will maintain in a segregated account, cash, cash equivalents, or US government securities in an amount sufficient to cover its obligations under reverse repurchase agreements with broker/dealers (but no collateral is required on reverse repurchase agreements with banks). The Fund will subject its investments in reverse repurchase agreements to the borrowing provisions set forth in the 1940 Act. The use of reverse repurchase agreements by the Fund creates leverage, which increases the Fund’s investment risk. If the income and gains on securities purchased with the proceeds of reverse repurchase agreements exceed the costs of the agreements, the Fund’s earnings or NAV will increase faster than otherwise would be the case; conversely, if the income and gains fail to exceed the costs, earnings or NAV would decline faster than otherwise would be the case. During the year ended March 31, 2021, the Fund did not enter into any reverse repurchase agreements.
Short Sales — Optimum Large Cap Value Fund may make short sales in an attempt to protect against declines in an individual security or the overall market, to manage duration, or for such other purposes consistent with the Fund’s investment objective and strategies. Typically, short sales are transactions in which the Fund sells a security it does not own and, at the time a short sale is effected, the Fund incurs an obligation to replace the security borrowed at whatever its price may be at the time the Fund purchases it for delivery to the lender. The price at such time may be more or less than the price at which the security was sold by the Fund. When a short sale transaction is closed out by delivery of the security, any gain or loss on the transaction generally is taxable as short-term capital gain or loss. Until the security is replaced, the Fund is required to pay the lender amounts equal to any dividends or interest that accrue during the period of the loan. To borrow the security, the Fund also may be required to pay a premium, which would increase the cost of the security sold. The proceeds of the short sale, and potentially additional margin, will be retained by the broker from whom the security is borrowed, to the extent necessary to meet margin requirements, until the short position is closed out. At March 31, 2021, there were no open short sales in the Fund.
To Be Announced Trades (TBA) — Optimum Fixed Income Fund may contract to purchase or sell securities for a fixed price at a transaction date beyond the customary settlement period (examples: when issued, delayed delivery, forward commitment, or TBA transactions) consistent with the Fund’s ability to manage its investment portfolio and meet redemption requests. These transactions involve a commitment by the Fund to purchase or sell securities for a predetermined price or yield with payment and delivery taking place more than three days in the future, or after a period longer than the customary settlement period for that type of security. No interest will be earned by the Fund on such purchases until the securities are delivered or the transaction is completed; however, the market value may change prior to delivery. At March 31, 2021, the Fund received $1,145,000 cash collateral for TBA trades, which is included in “Cash collateral due to brokers” on the “Statements of assets and liabilities.”
Mortgage Dollar Rolls — Roll-timing strategies can be used where the Fund seeks to extend the expiration or maturity of a position, such as a TBA security on an underlying asset, by closing out the position before expiration and opening a new position with respect to substantially the same underlying asset with a later expiration date. TBA securities purchased or sold are reflected on the Statements of assets and liabilities as an asset or liability, respectively.
(continues) 143
Table of Contents
Notes to financial statements
Optimum Fund Trust
1. Significant Accounting Policies (continued)
Foreign Currency Transactions — Transactions denominated in foreign currencies are recorded at the prevailing exchange rates on the valuation date in accordance with the Funds’ prospectus. The value of all assets and liabilities denominated in foreign currencies is translated daily into US dollars at the exchange rate of such currencies against the US dollar. Transaction gains or losses resulting from changes in exchange rates during the reporting period or upon settlement of the foreign currency transaction are reported in operations for the current period. The Funds generally bifurcate that portion of realized gains and losses on investments in debt securities which is due to changes in foreign exchange rates from that which is due to changes in market prices of debt securities. That portion of gains (losses), attributable to changes in foreign exchange rates, is included on the “Statements of operations” under “Net realized gain (loss) on foreign currencies.” For foreign equity securities, the realized gains and losses are included on the “Statements of operations” under “Net realized and unrealized gain (loss) on investments.” The Funds report certain foreign currency related transactions as components of realized gains (losses) for financial reporting purposes, whereas such components are treated as ordinary income (loss) for federal income tax purposes.
Use of Estimates — The preparation of financial statements in conformity with US GAAP requires management to make estimates and assumptions that affect the fair value of investments, the reported amounts of assets and liabilities and disclosure of contingent assets and liabilities at the date of the financial statements, and the reported amounts of revenues and expenses during the reporting period. Actual results could differ from those estimates and the differences could be material.
Other — Expenses directly attributable to a Fund are charged directly to that Fund. Other expenses common to various funds within the Trust are generally allocated among such funds on the basis of average net assets. Management fees and certain other expenses are paid monthly. Security transactions are recorded on the date the securities are purchased or sold (trade date) for financial reporting purposes. Costs used in calculating realized gains and losses on the sale of investment securities are those of the specific securities sold. Dividend income is recorded on the ex-dividend date and interest income is recorded on the accrual basis. Discounts and premiums on debt securities are accreted or amortized to interest income, respectively, over the lives of the respective securities using the effective interest method. Premiums on callable debt securities are amortized to interest income to the earliest call date using the effective interest method. Realized gains (losses) on paydowns of asset- and mortgage-backed securities are classified as interest income. Distributions received from investments in real estate investment trusts (REITs) are recorded as dividend income on the ex-dividend date, subject to reclassification upon notice of the character of such distributions by the issuer, which are estimated. Distributions received from investments in master limited partnerships are recorded as return of capital on investments on the ex-dividend date. Foreign dividends are also recorded on the ex-dividend date or as soon after the ex-dividend date that the Funds are aware of such dividends, net of all tax withholdings, a portion of which may be reclaimable. Withholding taxes and reclaims on foreign dividends and interest have been recorded in accordance with the Funds’ understanding of the applicable country’s tax rules and rates. Each Fund may pay foreign capital gains taxes on certain foreign securities held, which are reported as components of realized losses for financial reporting purposes, whereas such components are treated as ordinary loss for federal income tax purposes. Each Fund declares and pays distributions from net investment income and net realized gain on investments, if any, at least annually. The Funds may distribute more frequently, if necessary for tax purposes. Dividends and distributions, if any, are recorded on the ex-dividend date.
Each Fund receives earnings credits from its custodian when positive cash balances are maintained, which may be used to offset custody fees. The expenses paid under this arrangement are included on the “Statements of operations” under “Custodian fees” with the corresponding expenses offset included under “Less expenses paid indirectly.” There were no such earnings credits for the year ended March 31, 2021.
Each Fund receives earnings credits from its transfer agent when positive cash balances are maintained, which may be used to offset transfer agent fees. If the amount earned is greater than $1, the expenses paid under this arrangement are included on the “Statements of operations” under “Dividend disbursing and transfer agent fees and expenses” with the corresponding expenses offset included under “Less expenses paid indirectly.” For the year ended March 31, 2021, each Fund earned the following amounts under this arrangement:
| Fund | | Earnings Credits |
| Optimum Fixed Income Fund | | $ | 740 | |
| Optimum International Fund | | | 675 | |
| Optimum Large Cap Growth Fund | | | 838 | |
| Optimum Large Cap Value Fund | | | 828 | |
| Optimum Small-Mid Cap Growth Fund | | | 807 | |
| Optimum Small-Mid Cap Value Fund | | | 809 | |
144
Table of Contents
2. Investment Management, Administration Agreements, and Other Transactions with Affiliates
Delaware Management Company (DMC), a series of Macquarie Investment Management Business Trust, furnishes investment management services to each Fund and has full discretion and responsibility, subject to the overall supervision of the Board, to select and contract with one or more investment sub-advisors to manage the investment operations and composition of each Fund, and to render investment advice for each Fund, including the purchase, retention, and dispositions of investments, securities, and cash contained in each Fund. The investment management agreement obligates DMC to implement decisions with respect to the allocation or reallocation of each Fund’s assets among one or more current or additional sub-advisors, and to monitor the sub-advisors’ compliance with the relevant Fund’s investment objective, policies and restrictions. DMC pays the sub-advisors out of its fees, which are calculated daily and paid monthly.
In accordance with the terms of its respective investment management agreement, DMC is entitled to receive an annual fee equal to the following percentage rates of the average daily net assets of each Fund, which is calculated daily and paid monthly:
| Optimum Fixed Income Fund | 0.6000% of net assets up to $500 million |
| | 0.5500% of net assets from $500 million to $1 billion |
| 0.5000% of net assets from $1 billion to $1.5 billion |
| 0.4500% of net assets from $1.5 billion to $2 billion |
| 0.4250% of net assets from $2 billion to $2.5 billion |
| 0.4000% of net assets from $2.5 billion to $5 billion |
| 0.3750% of net assets over $5 billion |
| |
| Optimum International Fund | 0.7500% of net assets up to $500 million |
| 0.7150% of net assets from $500 million to $1 billion |
| 0.7000% of net assets from $1 billion to $1.5 billion |
| 0.6750% of net assets from $1.5 billion to $2 billion |
| 0.6500% of net assets from $2 billion to $2.5 billion |
| 0.6000% of net assets over $2.5 billion |
| |
| Optimum Large Cap Growth Fund | 0.7500% of net assets up to $500 million |
| 0.7000% of net assets from $500 million to $1 billion |
| 0.6500% of net assets from $1 billion to $1.5 billion |
| 0.6250% of net assets from $1.5 billion to $2 billion |
| 0.6000% of net assets from $2 billion to $2.5 billion |
| 0.5750% of net assets from $2.5 billion to $5 billion |
| 0.5500% of net assets over $5 billion |
| |
| Optimum Large Cap Value Fund | 0.7000% of net assets up to $500 million |
| 0.6500% of net assets from $500 million to $1 billion |
| 0.6000% of net assets from $1 billion to $1.5 billion |
| 0.5750% of net assets from $1.5 billion to $2 billion |
| 0.5500% of net assets from $2 billion to $2.5 billion |
| 0.5250% of net assets from 2.5 billion to $5 billion |
| 0.5000% of net assets over $5 billion |
| |
| Optimum Small-Mid Cap Growth Fund | 1.1000% of net assets up to $250 million |
| 1.0000% of net assets from $250 million to $500 million |
| 0.9000% of net assets from $500 million to $750 million |
| 0.8000% of net assets from $750 million to $1 billion |
| 0.7500% of net assets from $1 billion to $1.5 billion |
| 0.7000% of net assets over $1.5 billion |
Table of Contents
Notes to financial statements
Optimum Fund Trust
2. Investment Management, Administration Agreements, and Other Transactions with Affiliates (continued)
| Optimum Small-Mid Cap Value Fund | 1.0000% of net assets up to $250 million |
| 0.9000% of net assets from $250 million to $500 million |
| 0.8000% of net assets from $500 million to $750 million |
| 0.7500% of net assets from $750 million to $1 billion |
| 0.7000% of net assets from $1 billion to $1.5 billion |
| 0.6500% of net assets over $1.5 billion |
DMC has entered into sub-advisory agreements for the Trust as follows: Optimum Fixed Income Fund – Pacific Investment Management Company, LLC (PIMCO); Optimum International Fund – Acadian Asset Management LLC (Acadian), and EARNEST Partners, LLC (EARNEST); Optimum Large Cap Growth Fund – T. Rowe Price Associates, Inc. (T. Rowe Price) and ClearBridge Investments LLC (ClearBridge); Optimum Large Cap Value Fund – Massachusetts Financial Services Company (MFS) and Rothschild & Co (Rothschild); Optimum Small-Mid Cap Growth Fund – Columbus Circle Investors (CCI) and Peregrine Capital Management, LLC (PCM); Optimum Small-Mid Cap Value Fund – LSV Asset Management (LSV) and effective October 22, 2020 Cardinal Capital Management LLC (Cardinal). Prior to October 22, 2020, Westwood Management Corp. was also a sub-advisor for Optimum Small-Mid Cap Value Fund.
DMC has contractually agreed to waive all or a portion, if any, of its management fee and/or pay/reimburse expenses (excluding any distribution and service (12b-1) fees, acquired fund fees and expenses, taxes, interest, short sale dividend and interest expenses, brokerage fees, certain insurance costs, and nonroutine expenses or costs, including, but not limited to, those relating to reorganizations, litigation, conducting shareholder meetings, and liquidations), in order to prevent total annual fund operating expenses from exceeding the following percentage of each Fund’s average daily net assets. These expense waivers and reimbursements may be terminated only by agreement of DMC and each Fund. These waivers and reimbursements are accrued daily and received monthly.
| | Operating expense | | Operating expense |
| | limitation as | | limitation as |
| | a percentage | | a percentage |
| | of average | | of average |
| | daily net assets | | daily net assets |
| | (per annum) | | (per annum) |
| | for the period | | for the period |
| Fund | | July 29, 2020 – July 29, 2021 | | July 29, 2019 – July 28, 2020 |
| Optimum Fixed Income Fund | | 0.85% | | 0.85% |
| Optimum International Fund | | 1.17% | | 1.12% |
| Optimum Large Cap Growth Fund | | 1.02% | | 1.02% |
| Optimum Large Cap Value Fund | | 0.97% | | 0.97% |
| Optimum Small-Mid Cap Growth Fund | | 1.32% | | 1.29% |
| Optimum Small-Mid Cap Value Fund | | 1.25% | | 1.22% |
Delaware Investments Fund Services Company (DIFSC), an affiliate of DMC, provides fund accounting and financial administrative oversight services to the Trust. These services include overseeing the Funds’ pricing process, the calculation and payment of Fund expenses, and financial reporting in shareholder reports, registration statements and other regulatory filings. DIFSC also manages the process for the payment of dividends and distribution and dissemination of Funds’ NAV and performance data. For these services the Funds pay DIFSC an asset-based fee, plus certain out-of-pocket expenses and transactional charges. DIFSC’s fees are calculated daily and paid monthly based on the aggregate daily net assets of the Trust at the following annual rates: 0.0075% of the first $3.5 billion; 0.0070% of the next $2 billion; 0.0060% of the next $2 billion; and 0.0050% of aggregate average daily net assets in excess of $7.5 billion. The fees payable to DIFSC under the service agreement
146
Table of Contents
described above are allocated among all funds in the Trust on a relative NAV basis. These amounts are included on the “Statements of operations” under “Accounting fees.” For the year ended March 31, 2021, each Fund was charged for these services as follows:
| Fund | | Fees |
| Optimum Fixed Income Fund | | $ | 178,352 |
| Optimum International Fund | | | 40,829 |
| Optimum Large Cap Growth Fund | | | 131,887 |
| Optimum Large Cap Value Fund | | | 109,157 |
| Optimum Small-Mid Cap Growth Fund | | | 45,400 |
| Optimum Small-Mid Cap Value Fund | | | 39,141 |
DIFSC provides the Trust with administrative services including: preparation, filing and maintaining governing documents; preparation of materials and reports for the Board; and preparation and filing of registration statements and other regulatory filings. For these administrative services, the Trust pays DIFSC the following fee as a percentage of the Trust’s average daily net assets (plus out-of-pocket expenses): 0.0525% of assets up to $7.5 billion; 0.0475% of assets from $7.5 billion to $10 billion; 0.0425% of assets from $10 billion to $12 billion; 0.0375% of assets from $12 billion to $14 billion and 0.0325% of assets over $14 billion.
DIFSC is also the shareholder servicing, dividend disbursing, and transfer agent for each Fund. For these services, the Trust pays DIFSC a fee at an annual rate of 0.18% of the Trust’s total average daily net assets, subject to a minimum fee of $2,000 per class per fund each month, plus out-of-pocket expenses. Pursuant to a sub-transfer agency agreement between DIFSC and BNY Mellon Investment Servicing (US) Inc. (BNYMIS), BNYMIS provides certain sub-transfer agency services to the Funds. Sub-transfer agency fees are paid by the Funds and are also included on the “Statements of operations” under “Dividend disbursing and transfer agent fees and expenses.” The fees that are calculated daily and paid as invoices are received on a monthly or quarterly basis.
Delaware Distributors, L.P. (DDLP), an affiliate of DMC, serves as the national distributor of each Fund’s shares pursuant to a Distribution Agreement. Pursuant to the Distribution Agreement and Rule 12b-1 plan, each Fund pays DDLP an annual 12b-1 fee of 0.25% of the average daily net assets of the Class A shares and 1.00% of the average daily net assets of the Class C shares. The fees are calculated daily and paid monthly. Institutional Class shares do not pay 12b-1 fees.
For the year ended March 31, 2021, DDLP earned commissions on sales of Class A shares for each Fund as follows:
| Fund | | Commissions |
| Optimum Fixed Income Fund | | $ | 13,145 | |
| Optimum International Fund | | | 451 | |
| Optimum Large Cap Growth Fund | | | 2,086 | |
| Optimum Large Cap Value Fund | | | 1,750 | |
| Optimum Small-Mid Cap Growth Fund | | | 181 | |
| Optimum Small-Mid Cap Value Fund | | | 395 | |
For the year ended March 31, 2021, DDLP received gross CDSC commissions on redemptions of each Fund’s Class C shares, and these commissions were entirely used to offset upfront commissions previously paid by DDLP to broker/dealers on sales of those shares. The amounts received were as follows:
| Fund | | Class C |
| Optimum Fixed Income Fund | | $ | 1,055 | |
| Optimum International Fund | | | 236 | |
| Optimum Large Cap Growth Fund | | | 425 | |
| Optimum Large Cap Value Fund | | | 751 | |
| Optimum Small-Mid Cap Growth Fund | | | 52 | |
| Optimum Small-Mid Cap Value Fund | | | 83 | |
DMC, DIFSC and DDLP are indirect, wholly owned subsidiaries of Macquarie Management Holdings, Inc. Certain officers of DMC, DIFSC, and DDLP are officers and/or Trustees of the Trust. These officers and Trustees are paid no compensation by the Funds.
Table of Contents
Notes to financial statements
Optimum Fund Trust
2. Investment Management, Administration Agreements, and Other Transactions with Affiliates (continued)
In addition to the management fees and other expenses of a Fund, a Fund indirectly bears the investment management fees and other expenses of the investment companies (Underlying Funds) in which it invests. The amount of these fees and expenses incurred indirectly by a Fund will vary based upon the expense and fee levels of the Underlying Funds and the number of shares that are owned of the Underlying Funds at different times.
3. Investments
For the year ended March 31, 2021, each Fund made purchases and sales of investments securities other than short-term investments as follows:
| | Purchases | | | | | Sales | | | |
| | other than | | Purchases of | | other than | | Sales of |
| | US government | | US government | | US government | | US government |
| Fund | | securities | | securities | | securities | | securities |
| Optimum Fixed Income Fund | | $ | 861,832,318 | | | $ | 5,415,537,271 | | $ | 843,078,577 | | | $ | 5,672,882,000 |
| Optimum International Fund | | | 652,999,411 | | | | — | | | 397,132,790 | | | | — |
| Optimum Large Cap Growth Fund | | | 506,843,911 | | | | — | | | 874,870,575 | | | | — |
| Optimum Large Cap Value Fund | | | 313,224,977 | | | | — | | | 428,661,362 | | | | — |
| Optimum Small-Mid Cap Growth Fund | | | 681,120,881 | | | | — | | | 796,420,535 | | | | — |
| Optimum Small-Mid Cap Value Fund | | | 458,077,497 | | | | — | | | 443,577,040 | | | | — |
The tax cost of investments and derivatives includes adjustments to net unrealized appreciation (depreciation) which may not necessarily be the final tax cost basis adjustments, but approximate the tax basis unrealized gains and losses that may be realized and distributed to shareholders. At March 31, 2021, the cost and unrealized appreciation (depreciation) of investments and derivatives for federal income tax purposes for each Fund were as follows:
| | | | | Aggregate | | Aggregate | | | | |
| | | | | unrealized | | unrealized | | Net unrealized |
| | Cost of | | appreciation | | depreciation | | appreciation |
| | investments | | of investments | | of investments | | of investments |
| Fund | | and derivatives | | and derivatives | | and derivatives | | and derivatives |
| Optimum Fixed Income Fund | | $ | 3,306,323,626 | | $ | 83,678,206 | | | $ | (52,136,049 | ) | | $ | 31,542,157 | |
| Optimum International Fund | | | 811,108,792 | | | 157,509,215 | | | | (26,598,918 | ) | | | 130,910,297 | |
| Optimum Large Cap Growth Fund | | | 1,160,688,522 | | | 798,617,233 | | | | (24,941,955 | ) | | | 773,675,278 | |
| Optimum Large Cap Value Fund | | | 1,247,754,520 | | | 579,856,213 | | | | (10,259,451 | ) | | | 569,596,762 | |
| Optimum Small-Mid Cap Growth Fund | | | 571,205,646 | | | 197,605,220 | | | | (11,482,235 | ) | | | 186,122,985 | |
| Optimum Small-Mid Cap Value Fund | | | 575,297,789 | | | 164,788,916 | | | | (23,779,657 | ) | | | 141,009,259 | |
US GAAP defines fair value as the price that each Fund would receive to sell an asset or pay to transfer a liability in an orderly transaction between market participants at the measurement date under current market conditions. A three-level hierarchy for fair value measurements has been established based upon the transparency of inputs to the valuation of an asset or liability. Inputs may be observable or unobservable and refer broadly to the assumptions that market participants would use in pricing the asset or liability. Observable inputs reflect the assumptions market participants would use in pricing the asset or liability based on market data obtained from sources independent of the reporting entity. Unobservable inputs reflect the reporting entity’s own assumptions about the assumptions that market participants would use in pricing the asset or liability based on the best information available under the circumstances. Each Fund’s investment in its entirety is assigned a level based upon the observability of the inputs which are significant to the overall valuation. The three-level hierarchy of inputs is summarized as follows:
| Level 1 – | Inputs are quoted prices in active markets for identical investments. (Examples: equity securities, open-end investment companies, futures contracts, and exchange-traded options contracts) |
| | |
| Level 2 – | Other observable inputs, including, but not limited to: quoted prices for similar assets or liabilities in markets that are active, quoted prices for identical or similar assets or liabilities in markets that are not active, inputs other than quoted prices that are observable for |
148
Table of Contents
| | the assets or liabilities (such as interest rates, yield curves, volatilities, prepayment speeds, loss severities, credit risks, and default rates) or other market-corroborated inputs. (Examples: debt securities, government securities, swap contracts, foreign currency exchange contracts, foreign securities utilizing international fair value pricing, broker-quoted securities, and fair valued securities) |
| | |
| Level 3 – | Significant unobservable inputs, including each Fund’s own assumptions used to determine the fair value of investments. (Examples: broker-quoted securities and fair valued securities) |
Level 3 investments are valued using significant unobservable inputs. Each Fund may also use an income-based valuation approach in which the anticipated future cash flows of the investment are discounted to calculate fair value. Discounts may also be applied due to the nature or duration of any restrictions on the disposition of the investments. Valuations may also be based upon current market prices of securities that are comparable in coupon, rating, maturity, and industry. The derived value of a Level 3 investment may not represent the value which is received upon disposition and this could impact the results of operations.
| | Optimum Fixed Income Fund |
| | Level 1 | | Level 2 | | Level 3 | | Total |
| Securities | | | | | | | | | | | | | | | |
| Assets: | | | | | | | | | | | | | | | |
| Agency Asset-Backed Securities | | $ | — | | | $ | 809,676 | | | $ | — | | $ | 809,676 | |
| Agency Collateralized Mortgage | | | | | | | | | | | | | | | |
| Obligations | | | — | | | | 85,141,742 | | | | — | | | 85,141,742 | |
| Agency Commercial Mortgage- | | | | | | | | | | | | | | | |
| Backed Securities | | | — | | | | 11,584,798 | | | | — | | | 11,584,798 | |
| Agency Mortgage-Backed | | | | | | | | | | | | | | | |
| Securities | | | — | | | | 652,849,494 | | | | — | | | 652,849,494 | |
| Collateralized Debt Obligations | | | — | | | | 113,456,463 | | | | — | | | 113,456,463 | |
| Common Stock | | | — | | | | — | | | | — | | | — | |
| Corporate Bonds | | | — | | | | 970,684,924 | | | | — | | | 970,684,924 | |
| Loan Agreements1 | | | — | | | | 86,871,583 | | | | 2,357,614 | | | 89,229,197 | |
| Municipal Bonds | | | — | | | | 17,148,888 | | | | — | | | 17,148,888 | |
| Non-Agency Asset-Backed | | | | | | | | | | | | | | | |
| Securities | | | — | | | | 64,964,993 | | | | — | | | 64,964,993 | |
| Non-Agency Collateralized | | | | | | | | | | | | | | | |
| Mortgage Obligations | | | — | | | | 55,490,838 | | | | — | | | 55,490,838 | |
| Non-Agency Commercial | | | | | | | | | | | | | | | |
| Mortgage-Backed Securities | | | — | | | | 123,761,224 | | | | — | | | 123,761,224 | |
| Preferred Stock | | | — | | | | 672,625 | | | | — | | | 672,625 | |
| Regional Bond | | | — | | | | 2,160,993 | | | | — | | | 2,160,993 | |
| Sovereign Bonds | | | — | | | | 96,867,677 | | | | — | | | 96,867,677 | |
| Supranational Banks | | | — | | | | 1,218,601 | | | | — | | | 1,218,601 | |
| US Treasury Obligations | | | — | | | | 774,526,130 | | | | — | | | 774,526,130 | |
| Options Purchased | | | — | | | | 761,116 | | | | — | | | 761,116 | |
| Short-Term Investments1 | | | 121,616,240 | | | | 156,494,669 | | | | — | | | 278,110,909 | |
| Total Value of Securities Before | | | | | | | | | | | | | | | |
| Options Written | | $ | 121,616,240 | | | $ | 3,215,466,434 | | | $ | 2,357,614 | | $ | 3,339,440,288 | |
| Liabilities: | | | | | | | | | | | | | | | |
| Options Written | | | (7,151 | ) | | | (306,350 | ) | | | — | | | (313,501 | ) |
Table of Contents
Notes to financial statements
Optimum Fund Trust
3. Investments (continued)
| | Optimum Fixed Income Fund |
| | Level 1 | | Level 2 | | Level 3 | | Total |
| Derivatives2 | | | | | | | | | | | | | | | | | |
| Assets: | | | | | | | | | | | | | | | | | |
| Centrally Cleared Credit Default | | | | | | | | | | | | | | | | | |
| Swaps | | $ | — | | | $ | 273,512 | | | | $ | — | | | $ | 273,512 | |
| Centrally Cleared Interest Rate | | | | | | | | | | | | | | | | | |
| Swaps | | | — | | | | 2,057,815 | | | | | — | | | | 2,057,815 | |
| Futures Contracts | | | 1,603,440 | | | | — | | | | | — | | | | 1,603,440 | |
| OTC Credit Default Swaps | | | — | | | | 1,002,914 | | | | | — | | | | 1,002,914 | |
| Foreign Currency Exchange | | | | | | | | | | | | | | | | | |
| Contracts | | | — | | | | 998,116 | | | | | — | | | | 998,116 | |
| Liabilities: | | | | | | | | | | | | | | | | | |
| Centrally Cleared Interest Rate | | | | | | | | | | | | | | | | | |
| Swaps | | $ | — | | | $ | (3,733,686 | ) | | | $ | — | | | $ | (3,733,686 | ) |
| Foreign Currency Exchange | | | | | | | | | | | | | | | | | |
| Contracts | | | — | | | | (309,407 | ) | | | | — | | | | (309,407 | ) |
| Futures Contracts | | | (3,144,055 | ) | | | — | | | | | — | | | | (3,144,055 | ) |
| OTC Credit Default Swaps | | | — | | | | (9,653 | ) | | | | — | | | | (9,653 | ) |
| 1 | Security type is valued across multiple levels. Level 1 investments represent exchange-traded investments, Level 2 investments represent investments with observable inputs or matrix-priced investments, and Level 3 investments represent investments without observable inputs. The amounts attributed to Level 1 investments, Level 2 investments, and Level 3 investments represent the following percentages of the total market value of these security types: |
| | Level 1 | | Level 2 | | Level 3 | | Total |
| Loan Agreements | | — | | | 97.36% | | 2.64 | % | | 100.00% |
| Short-Term Investments | | 43.73 | % | | 56.27% | | — | | | 100.00% |
| 2 | Foreign currency exchange contracts, futures contracts, and swap contracts are valued at the unrealized appreciation (depreciation) on the instrument at the year end. |
150
Table of Contents
| | Optimum International Fund |
| | Level 1 | | Level 2 | | Level 3 | | Total |
| Securities | | | | | | | | | | | | | | |
| Assets: | | | | | | | | | | | | | | |
| Common Stock | | | | | | | | | | | | | | |
| Communication Services | | $ | 48,660,153 | | $ | — | | | $ | — | | $ | 48,660,153 | |
| Consumer Discretionary | | | 128,040,499 | | | — | | | | — | | | 128,040,499 | |
| Consumer Staples | | | 31,927,604 | | | — | | | | 271,411 | | | 32,199,015 | |
| Energy | | | 43,851,303 | | | — | | | | — | | | 43,851,303 | |
| Financials | | | 138,585,874 | | | — | | | | — | | | 138,585,874 | |
| Healthcare | | | 113,483,798 | | | — | | | | — | | | 113,483,798 | |
| Industrials | | | 103,459,354 | | | — | | | | — | | | 103,459,354 | |
| Information Technology | | | 176,604,348 | | | — | | | | — | | | 176,604,348 | |
| Materials | | | 103,686,702 | | | — | | | | — | | | 103,686,702 | |
| Real Estate | | | 4,879,583 | | | — | | | | — | | | 4,879,583 | |
| Utilities | | | 4,162,220 | | | — | | | | — | | | 4,162,220 | |
| Preferred Stock | | | 13,678,605 | | | — | | | | — | | | 13,678,605 | |
| Rights | | | 79,986 | | | — | | | | — | | | 79,986 | |
| Short-Term Investments | | | 13,990,315 | | | — | | | | — | | | 13,990,315 | |
| Securities Lending Collateral | | | — | | | 16,656,607 | | | | — | | | 16,656,607 | |
| Total Value of Securities | | $ | 925,090,344 | | $ | 16,656,607 | | | $ | 271,411 | | $ | 942,018,362 | |
| |
| Derivatives1 | | | | | | | | | | | | | | |
| Assets: | | | | | | | | | | | | | | |
| Foreign Currency Exchange | | | | | | | | | | | | | | |
| Contracts | | $ | — | | $ | 1,894 | | | $ | — | | $ | 1,894 | |
| Liabilities: | | | | | | | | | | | | | | |
| Foreign Currency Exchange | | | | | | | | | | | | | | |
| Contracts | | $ | — | | $ | (1,167 | ) | | $ | — | | $ | (1,167 | ) |
| 1 | Foreign currency exchange contracts and futures contracts are valued at the unrealized appreciation (depreciation) on the instrument at the year end. |
Table of Contents
Notes to financial statements
Optimum Fund Trust
3. Investments (continued)
| | Optimum Large Cap Growth Fund |
| | Level 1 | | Level 2 | | Level 3 | | Total |
| Securities | | | | | | | | | | | | | | | | |
| Assets: | | | | | | | | | | | | | | | | |
| Common Stock | | | | | | | | | | | | | | | | |
| Communication Services | | $ | 308,950,007 | | | $ | — | | | | $ | — | | $ | 308,950,007 | |
| Consumer Discretionary | | | 424,334,888 | | | | — | | | | | 13,547,890 | | | 437,882,778 | |
| Consumer Staples | | | 21,894,591 | | | | — | | | | | — | | | 21,894,591 | |
| Financials | | | 14,840,955 | | | | — | | | | | — | | | 14,840,955 | |
| Healthcare | | | 226,783,135 | | | | — | | | | | — | | | 226,783,135 | |
| Industrials | | | 147,033,245 | | | | — | | | | | — | | | 147,033,245 | |
| Information Technology | | | 723,957,824 | | | | — | | | | | — | | | 723,957,824 | |
| Materials | | | 16,190,656 | | | | — | | | | | — | | | 16,190,656 | |
| Real Estate | | | 13,931,595 | | | | — | | | | | — | | | 13,931,595 | |
| Convertible Preferred Stock | | | — | | | | — | | | | | 1,692,554 | | | 1,692,554 | |
| Short-Term Investments | | | 21,206,464 | | | | — | | | | | — | | | 21,206,464 | |
| Total Value of Securities | | $ | 1,919,123,360 | | | $ | — | | | | $ | 15,240,444 | | $ | 1,934,363,804 | |
| |
| Derivatives1 | | | | | | | | | | | | | | | | |
| Liabilities: | | | | | | | | | | | | | | | | |
| Foreign Currency Exchange | | | | | | | | | | | | | | | | |
| Contracts | | $ | — | | | $ | (4 | ) | | | $ | — | | $ | (4 | ) |
| 1 | Foreign currency exchange contracts and futures contracts are valued at the unrealized appreciation (depreciation) on the instrument at the year end. |
| | | | | | | | | | | Optimum Large |
| | | | | | | | | | | Cap Value Fund |
| | | | | | | | | | | Level 1 |
| Securities | | | | | | | | | | | | |
| Assets: | | | | | | | | | | | | |
| Common Stock | | | | | | | | | | | $ | 1,784,869,830 |
| Short-Term Investments | | | | | | | | | | | | 32,481,452 |
| Total Value of Securities | | | | | | | | | | | $ | 1,817,351,282 |
| |
| | Optimum Small-Mid Cap Growth Fund |
| | Level 1 | | Level 2 | | Level 3 | | Total |
| Securities | | | | | | | | | | | | |
| Assets: | | | | | | | | | | | | |
| Common Stock | | $ | 735,091,788 | | $ | — | | $ | — | | $ | 735,091,788 |
| Convertible Preferred Stock | | | — | | | — | | | 1,234,838 | | | 1,234,838 |
| Warrant | | | — | | | 11,555 | | | — | | | 11,555 |
| Short-Term Investments | | | 20,990,450 | | | — | | | — | | | 20,990,450 |
| Total Value of Securities | | $ | 756,082,238 | | $ | 11,555 | | $ | 1,234,838 | | $ | 757,328,631 |
152
Table of Contents
| | Optimum Small-Mid Cap Value Fund |
| | Level 1 | | Level 3 | | Total |
| Securities | | | | | | | | | |
| Assets: | | | | | | | | | |
| Common Stock | | | | | | | | | |
| Communication Services | | $ | 29,252,090 | | $ | — | | $ | 29,252,090 |
| Consumer Discretionary | | | 64,972,952 | | | — | | | 64,972,952 |
| Consumer Staples | | | 34,096,313 | | | — | | | 34,096,313 |
| Energy | | | 14,436,956 | | | — | | | 14,436,956 |
| Financials | | | 145,961,619 | | | — | | | 145,961,619 |
| Healthcare | | | 34,092,440 | | | — | | | 34,092,440 |
| Industrials | | | 113,048,355 | | | — | | | 113,048,355 |
| Information Technology | | | 103,065,066 | | | 98,369 | | | 103,163,435 |
| Materials | | | 81,096,455 | | | — | | | 81,096,455 |
| Real Estate | | | 69,378,444 | | | — | | | 69,378,444 |
| Utilities | | | 11,834,322 | | | — | | | 11,834,322 |
| Limited Partnerships | | | 2,695,768 | | | — | | | 2,695,768 |
| Short-Term Investments | | | 12,277,899 | | | — | | | 12,277,899 |
| Total Value of Securities | | $ | 716,208,679 | | $ | 98,369 | | $ | 716,307,048 |
Securities valued at zero on the “Schedules of investments” are considered to be Level 3 investments in these tables.
As a result of utilizing international fair value pricing at March 31, 2021, a portion of Optimum International Fund’s common stock investments were categorized as Level 2.
During the year ended March 31, 2021, there were no transfers into or out of Level 3 investments. Each Fund’s policy is to recognize transfers into or out of Level 3 investments based on fair value at the beginning of the reporting period.
A reconciliation of Level 3 investments is presented when a Fund has a significant amount of Level 3 investments at the beginning, interim, or end of the year in relation to that Fund’s net assets. Management has determined not to provide a reconciliation of Level 3 investments as the Level 3 investments were not considered significant to the Fund’s net assets at the beginning, interim, or end of the period. Management has determined not to provide additional disclosure on Level 3 inputs since the Level 3 investments were not considered significant to each Fund’s net assets at the end of the period. There were no Level 3 investments during the year ended March 31, 2021 for Optimum Large Cap Value Fund and Optimum Small-Mid Cap Value Fund.
Table of Contents
Notes to financial statements
Optimum Fund Trust
4. Dividend and Distribution Information
Income and long-term capital gain distributions are determined in accordance with federal income tax regulations, which may differ from US GAAP. Additionally, distributions from net gains on foreign currency transactions and net short-term gains on sales of investment securities are treated as ordinary income for federal income tax purposes. The tax character of dividends and distributions paid during the years ended March 31, 2021 and 2020 were as follows:
| | | | | Long-term | | | |
| | Ordinary | | capital | | | |
| | income | | gains | | Total |
| Year ended March 31, 2021: | | | | | | | | | |
| Optimum Fixed Income Fund | | $ | 119,848,146 | | $ | 12,496,796 | | $ | 132,344,942 |
| Optimum International Fund | | | 6,228,330 | | | 6,852,196 | | | 13,080,526 |
| Optimum Large Cap Growth Fund | | | — | | | 155,746,968 | | | 155,746,968 |
| Optimum Large Cap Value Fund | | | 12,631,808 | | | 8,625,251 | | | 21,257,059 |
| Optimum Small-Mid Cap Growth Fund | | | 38,827,917 | | | 59,966,809 | | | 98,794,726 |
| Optimum Small-Mid Cap Value Fund | | | 12,935,594 | | | 11,572,425 | | | 24,508,019 |
| | | | | | | | | | |
| Year ended March 31, 2020: | | | | | | | | | |
| Optimum Fixed Income Fund | | | 76,684,769 | | | — | | | 76,684,769 |
| Optimum International Fund | | | 10,230,184 | | | 1,481,477 | | | 11,711,661 |
| Optimum Large Cap Growth Fund | | | 1,269,941 | | | 52,025,694 | | | 53,295,635 |
| Optimum Large Cap Value Fund | | | 23,390,255 | | | 22,584,049 | | | 45,974,304 |
| Optimum Small-Mid Cap Growth Fund | | | — | | | 46,674,754 | | | 46,674,754 |
| Optimum Small-Mid Cap Value Fund | | | 5,729,379 | | | 10,966,880 | | | 16,696,259 |
5. Components of Net Assets on a Tax Basis
As of March 31, 2021, the components of net assets on a tax basis were as follows:
| | Optimum | | Optimum | | Optimum |
| | Fixed Income | | International | | Large Cap |
| | Fund | | Fund | | Growth Fund |
| Shares of beneficial interest | | $ | 2,788,780,786 | | $ | 771,416,997 | | $ | 940,647,117 |
| Undistributed ordinary income | | | 13,333,431 | | | 9,960,151 | | | 36,304,860 |
| Undistributed long-term capital gains | | | 1,587,698 | | | 19,370,323 | | | 181,227,002 |
| Unrealized appreciation (depreciation) of investments, foreign currencies, and derivatives | | | 31,542,157 | | | 130,910,297 | | | 773,675,278 |
| Net assets | | $ | 2,835,244,072 | | $ | 931,657,768 | | $ | 1,931,854,257 |
| | | | | | | | | | |
| | Optimum | | Optimum | | Optimum |
| | Large Cap | | Small-Mid Cap | | Small-Mid Cap |
| | Value Fund | | Growth Fund | | Value Fund |
| Shares of beneficial interest | | $ | 1,164,786,947 | | $ | 435,360,138 | | $ | 544,933,481 |
| Undistributed ordinary income | | | 13,953,236 | | | 77,553,079 | | | 24,426,969 |
| Undistributed long-term capital gains | | | 70,053,134 | | | 57,479,428 | | | 6,346,675 |
| Unrealized appreciation (depreciation) of investments, foreign currencies, and derivatives | | | 569,596,762 | | | 186,122,985 | | | 141,009,259 |
| Net assets | | $ | 1,818,390,079 | | $ | 756,515,630 | | $ | 716,716,384 |
The differences between book basis and tax basis components of net assets are primarily attributable to tax deferral of losses on wash sales, tax deferral of losses on straddles, mark-to-market of foreign currency exchange contracts, mark-to-market of futures contracts, tax treatment of passive foreign investment companies (PFICs) and securities no longer considered PFICs, tax treatment of swap contracts, contingent payment debt instruments, amortization of premium on convertible securities, and partnership interest.
154
Table of Contents
For financial reporting purposes, capital accounts are adjusted to reflect the tax character of permanent book/tax differences. Reclassifications are primarily due to the tax treatment of net operating losses. Results of operations and net assets were not affected by these reclassifications. For the year ended March 31, 2021, the Funds had no reclassifications.
6. Capital Shares
Transactions in capital shares were as follows:
| | Optimum | | | Optimum | | | Optimum | |
| | Fixed Income | | | International | | | Large Cap | |
| | Fund | | | Fund | | | Growth Fund | |
| | Year ended | | | Year ended | | | Year ended | |
| | 3/31/21 | | | 3/31/20 | | | 3/31/21 | | | 3/31/20 | | | 3/31/21 | | | 3/31/20 | |
| Shares sold: | | | | | | | | | | | | | | | | | | |
| Class A | | 214,344 | | | 99,307 | | | 42,548 | | | 29,664 | | | 24,623 | | | 27,776 | |
| Class C | | 645,634 | | | 427,411 | | | 127,165 | | | 79,516 | | | 59,129 | | | 50,010 | |
| Institutional Class | | 59,553,466 | | | 41,078,600 | | | 23,034,645 | | | 6,252,880 | | | 10,104,392 | | | 10,786,020 | |
| | | | | | | | | | | | | | | | | | | |
| Shares issued upon reinvestment of dividends and distributions: | | | | | | | | | | | | | | | | | | |
| Class A | | 118,632 | | | 75,769 | | | 9,957 | | | 9,908 | | | 107,133 | | | 50,214 | |
| Class C | | 349,586 | | | 194,209 | | | 21,141 | | | 19,031 | | | 475,357 | | | 213,857 | |
| Institutional Class | | 12,796,422 | | | 7,705,908 | | | 897,572 | | | 865,351 | | | 6,045,725 | | | 2,533,369 | |
| | 73,678,084 | | | 49,581,204 | | | 24,133,028 | | | 7,256,350 | | | 16,816,359 | | | 13,661,246 | |
| | | | | | | | | | | | | | | | | | | |
| Shares redeemed: | | | | | | | | | | | | | | | | | | |
| Class A | | (409,360 | ) | | (422,469 | ) | | (81,487 | ) | | (101,947 | ) | | (332,565 | ) | | (409,222 | ) |
| Class C | | (1,018,927 | ) | | (1,506,687 | ) | | (219,798 | ) | | (307,757 | ) | | (1,092,060 | ) | | (1,279,915 | ) |
| Institutional Class | | (37,110,081 | ) | | (40,696,765 | ) | | (6,500,763 | ) | | (7,847,584 | ) | | (24,816,099 | ) | | (17,288,342 | ) |
| | (38,538,368 | ) | | (42,625,921 | ) | | (6,802,048 | ) | | (8,257,288 | ) | | (26,240,724 | ) | | (18,977,479 | ) |
| Net increase (decrease) | | 35,139,716 | | | 6,955,283 | | | 17,330,980 | | | (1,000,938 | ) | | (9,424,365 | ) | | (5,316,233 | ) |
(continues) 155
Table of Contents
Notes to financial statements
Optimum Fund Trust
6. Capital Shares (continued)
| | Optimum | | | Optimum | | | Optimum | |
| | Large Cap | | | Small-Mid Cap | | | Small-Mid Cap | |
| | Value Fund | | | Growth Fund | | | Value Fund | |
| | Year ended | | | Year ended | | | Year ended | |
| | 3/31/21 | | | 3/31/20 | | | 3/31/21 | | | 3/31/20 | | | 3/31/21 | | | 3/31/20 | |
| Shares sold: | | | | | | | | | | | | | | | | | | |
| Class A | | 84,485 | | | 34,211 | | | 5,922 | | | 8,470 | | | 51,196 | | | 14,917 | |
| Class C | | 219,348 | | | 80,064 | | | 15,837 | | | 13,386 | | | 159,035 | | | 59,504 | |
| Institutional Class | | 16,814,763 | | | 13,269,139 | | | 8,228,182 | | | 5,366,655 | | | 10,278,203 | | | 7,472,621 | |
| | | | | | | | | | | | | | | | | | | |
| Shares issued upon reinvestment of dividends and distributions: | | | | | | | | | | | | | | | | | | |
| Class A | | 12,892 | | | 33,400 | | | 49,092 | | | 32,188 | | | 10,785 | | | 6,835 | |
| Class C | | 18,663 | | | 70,891 | | | 242,952 | | | 144,464 | | | 39,339 | | | 21,846 | |
| Institutional Class | | 1,170,447 | | | 2,534,493 | | | 5,194,485 | | | 3,184,389 | | | 1,799,300 | | | 1,194,101 | |
| | 18,320,598 | | | 16,022,198 | | | 13,736,470 | | | 8,749,552 | | | 12,337,858 | | | 8,769,824 | |
| | | | | | | | | | | | | | | | | | | |
| Shares redeemed: | | | | | | | | | | | | | | | | | | |
| Class A | | (189,771 | ) | | (271,716 | ) | | (95,622 | ) | | (78,586 | ) | | (45,527 | ) | | (54,972 | ) |
| Class C | | (480,996 | ) | | (755,122 | ) | | (354,223 | ) | | (226,952 | ) | | (147,145 | ) | | (146,488 | ) |
| Institutional Class | | (22,650,816 | ) | | (16,840,601 | ) | | (13,320,837 | ) | | (6,132,923 | ) | | (9,272,923 | ) | | (6,741,374 | ) |
| | (23,321,583 | ) | | (17,867,439 | ) | | (13,770,682 | ) | | (6,438,461 | ) | | (9,465,595 | ) | | (6,942,834 | ) |
| Net increase (decrease) | | (5,000,985 | ) | | (1,845,241 | ) | | (34,212 | ) | | 2,311,091 | | | 2,872,263 | | | 1,826,990 | |
Certain shareholders may exchange shares of one class for shares of another class in the same Fund. These exchange transactions are included as subscriptions and redemptions in the tables above and on the previous page and the “Statements of changes in net assets.” For the years ended March 31, 2021 and 2020 each Fund had the following exchange transactions.
| | Exchange Redemptions | | Exchange Subscriptions | | | |
| | | | | | | | | | Institutional | | | |
| | Class A | | Class C | | Class | | | |
| | Shares | | Shares | | Shares | | Value |
| Optimum Fixed Income Fund | | | | | | | | | | | | | | | |
| Year ended | | | | | | | | | | | | | | | |
| 3/31/21 | | | — | | | | 3,186 | | | | 3,174 | | | $ | 32,437 |
| Year ended | | | | | | | | | | | | | | | |
| 3/31/20 | | | 8,125 | | | | 3,062 | | | | 11,192 | | | | 108,165 |
| | | | | | | | | | | | | | | | |
| Optimum International Fund | | | | | | | | | | | | | | | |
| Year ended | | | | | | | | | | | | | | | |
| 3/31/21 | | | 620 | | | | 2,101 | | | | 2,642 | | | | 31,911 |
| Year ended | | | | | | | | | | | | | | | |
| 3/31/20 | | | 4,408 | | | | 132 | | | | 4,503 | | | | 58,108 |
156
Table of Contents
| | Exchange | | | | | | | |
| | Redemptions | | Exchange Subscriptions | | | |
| | | | | | | | | | Institutional | | | |
| | Class A | | Class C | | Class | | | |
| | Shares | | Shares | | Shares | | Value |
| Optimum Large Cap Growth Fund | | | | | | | | | | | | | | | |
| Year ended | | | | | | | | | | | | | | | |
| 3/31/21 | | | 1,661 | | | | 7,430 | | | | 6,993 | | | $ | 155,238 |
| Year ended | | | | | | | | | | | | | | | |
| 3/31/20 | | | 14,729 | | | | 318 | | | | 13,776 | | | | 263,452 |
| | | | | | | | | | | | | | | | |
| Optimum Large Cap Value Fund | | | | | | | | | | | | | | | |
| Year ended | | | | | | | | | | | | | | | |
| 3/31/21 | | | 1,559 | | | | 2,273 | | | | 3,783 | | | | 60,996 |
| Year ended | | | | | | | | | | | | | | | |
| 3/31/20 | | | 12,545 | | | | 266 | | | | 12,777 | | | | 213,257 |
| | | | | | | | | | | | | | | | |
| Optimum Small-Mid Cap Growth Fund | | | | | | | | | | | | | | | |
| Year ended | | | | | | | | | | | | | | | |
| 3/31/21 | | | 272 | | | | 200 | | | | 386 | | | | 6,215 |
| Year ended | | | | | | | | | | | | | | | |
| 3/31/20 | | | 1,993 | | | | 56 | | | | 1,861 | | | | 27,404 |
| | | | | | | | | | | | | | | | |
| Optimum Small-Mid Cap Value Fund | | | | | | | | | | | | | | | |
| Year ended | | | | | | | | | | | | | | | |
| 3/31/21 | | | 338 | | | | 470 | | | | 697 | | | | 8,045 |
| Year ended | | | | | | | | | | | | | | | |
| 3/31/20 | | | 1,120 | | | | 130 | | | | 1,160 | | | | 15,190 |
7. Derivatives
US GAAP requires disclosures that enable investors to understand: (1) how and why an entity uses derivatives; (2) how they are accounted for; and (3) how they affect an entity’s results of operations and financial position.
Foreign Currency Exchange Contracts — Each Fund may enter into foreign currency exchange contracts and foreign cross currency exchange contracts as a way of managing foreign exchange rate risk. Each Fund may enter into these contracts to fix the US dollar value of a security that it has agreed to buy or sell for the period between the date the trade was entered into and the date the security is delivered and paid for. Each Fund may also enter into these contracts to hedge the US dollar value of securities it already owns that are denominated in foreign currencies. In addition, each Fund may enter into these contracts to facilitate or expedite the settlement of portfolio transactions. The change in value is recorded as an unrealized gain or loss. When the contract is closed, a realized gain or loss is recorded equal to the difference between the value of the contract at the time it was opened and the value at the time it was closed.
The use of foreign currency exchange contracts and foreign cross currency exchange contracts does not eliminate fluctuations in the underlying prices of the securities, but does establish a rate of exchange that can be achieved in the future. Although foreign currency exchange contracts and foreign cross currency exchange contracts limit the risk of loss due to an unfavorable change in the value of the hedged currency, they also limit any potential gain that might result should the value of the currency change favorably. In addition, each Fund could be exposed to risks if the counterparties to the contracts are unable to meet the terms of their contracts. Each Fund’s maximum risk of loss from counterparty credit risk is the value of its currency exchanged with the counterparty. The risk is generally mitigated by having a netting arrangement between the Funds and the counterparty and by the posting of collateral by the counterparty to the Funds to cover the Funds’ exposure to the counterparty.
During the year ended March 31, 2021, Optimum Fixed Income Fund used foreign currency exchange contracts to hedge the US dollar value of securities it already owns that are denominated in foreign currencies.
(continues) 157
Table of Contents
Notes to financial statements
Optimum Fund Trust
7. Derivatives (continued)
During the year ended March 31, 2021, Optimum International Fund, Optimum Large Cap Growth Fund, and Optimum Large Cap Value Fund each used foreign currency exchange contracts to facilitate or expedite the settlement of portfolio transactions. Optimum International Fund also used foreign currency exchange contracts to fix the US dollar value of a security between trade date and settlement date.
Futures Contracts — A futures contract is an agreement in which the writer (or seller) of the contract agrees to deliver to the buyer an amount of cash or securities equal to a specific dollar amount times the difference between the value of a specific security or index at the close of the last trading day of the contract and the price at which the agreement is made. Optimum Fixed Income Fund may use futures in the normal course of pursuing its investment objective. Optimum Fixed Income Fund may invest in futures contracts to hedge its existing portfolio securities against fluctuations in value caused by changes in interest rates or market conditions. Upon entering into a futures contract, the Fund deposits cash or pledges US government securities to a broker, equal to the minimum “initial margin” requirements of the exchange on which the contract is traded. Subsequent payments are received from the broker or paid to the broker each day, based on the daily fluctuation in the market value of the contract. These receipts or payments are known as “variation margin” and are recorded daily by the Fund as unrealized gains or losses until the contracts are closed. When the contracts are closed, the Fund records a realized gain or loss equal to the difference between the value of the contract at the time it was opened and the value at the time it was closed. Risks of entering into futures contracts include potential imperfect correlation between the futures contracts and the underlying securities and the possibility of an illiquid secondary market for these instruments. When investing in futures, there is reduced counterparty credit risk to the Fund because futures are exchange-traded and the exchange’s clearinghouse, as counterparty to all exchange-traded futures, guarantees against default. The Fund posted securities collateral valued at $2,068,719 and $328,000 cash collateral as margin for open futures contracts. Securities collateral are presented on the “Schedules of investments.”
During the year ended March 31, 2021, Optimum Fixed Income Fund used futures contracts to hedge the Fund’s existing portfolio securities against fluctuations in value caused by changes in interest rates or market conditions, as a cash management tool, and to facilitate investments in portfolio securities.
Options Contracts — Optimum Fixed Income Fund may enter into options contracts in the normal course of pursuing its investment objective. The Fund may buy or write options contracts for any number of reasons, including without limitation: to manage the Fund’s exposure to changes in securities prices caused by interest rates or market conditions and foreign currencies; as an efficient means of adjusting the Fund’s overall exposure to certain markets; to protect the value of portfolio securities; and as a cash management tool. The Fund may buy or write call or put options on securities, futures, swaps, swaptions, financial indices, and foreign currencies. When the Fund buys an option, a premium is paid and an asset is recorded and adjusted on a daily basis to reflect the current market value of the option purchased. When the Fund writes an option, a premium is received and a liability is recorded and adjusted on a daily basis to reflect the current market value of the option written. Premiums received from writing options that expire unexercised are treated by the Fund on the expiration date as realized gains. The difference between the premium received and the amount paid on effecting a closing purchase transaction, including brokerage commissions, is treated as realized gain or loss. If a call option is exercised, the premium is added to the proceeds from the sale of the underlying security in determining whether the Fund has a realized gain or loss. If a put option is exercised, the premium reduces the cost basis of the securities purchased by the Fund. The Fund, as writer of an option, bears the market risk of an unfavorable change in the price of the security underlying the written option. When writing options, the Fund is subject to minimal counterparty risk because the counterparty is only obligated to pay premiums and does not bear the market risk of an unfavorable market change.
During the year ended March 31, 2021, Optimum Fixed Income Fund used options contracts to manage the Fund’s exposure to changes in securities prices caused by interest rates or market conditions, to adjust the Fund’s overall exposure to certain markets, and to receive premiums for writing options.
Swap Contracts — Optimum Fixed Income Fund may enter into currency swap contracts, index swap contracts, inflation swaps, interest rate swap contracts, and CDS contracts in the normal course of pursuing its investment objective. The Fund may invest in interest rate swaps to manage the Fund’s sensitivity to interest rates or to hedge against changes in interest rates. The Fund may use currency swaps to protect against currency fluctuations. The Fund may use inflation swaps to hedge the inflation risk in nominal bonds, thereby creating synthetic inflation-indexed bonds. The Fund may enter into CDS contracts in order to hedge against a credit event, to enhance total return or to gain exposure to certain securities or markets. The Fund will not be permitted to enter into any swap transactions unless, at the time of entering into
158
Table of Contents
such transactions, the unsecured long-term debt of the actual counterparty, combined with any credit enhancements, is rated at least BBB- by Standard & Poor’s Financial Services LLC (S&P) or Baa3 by Moody’s Investors Service, Inc. (Moody’s) or is determined to be of equivalent credit quality by DMC.
Interest Rate Swaps. An interest rate swap contract is an exchange of interest rates between counterparties. In one instance, an interest rate swap involves payments received by Optimum Fixed Income Fund from another party based on a variable or floating interest rate, in return for making payments based on a fixed interest rate. An interest rate swap can also work in reverse with the Fund receiving payments based on a fixed interest rate and making payments based on a variable or floating interest rate. Interest rate swaps may be used to adjust the Fund’s sensitivity to interest rates or to hedge against changes in interest rates. Periodic payments on such contracts are accrued daily and recorded as unrealized appreciation (depreciation) on swap contracts. Upon periodic payment (receipt) or termination of the contract, such amounts are recorded as realized gains or losses on swap contracts. The Fund’s maximum risk of loss from counterparty credit risk is the discounted net value of the cash flows to be received from/paid to the counterparty over the interest rate swap contract’s remaining life, to the extent that the amount is positive. This risk is mitigated by (1) for bilateral swap contracts, having a netting arrangement between the Fund and the counterparty and by the posting of collateral by the counterparty to the Fund to cover the Fund’s exposure to the counterparty and (2) for cleared swaps, trading these instruments through a central counterparty.
During the year ended March 31, 2021, Optimum Fixed Income Fund used interest rate swap contracts to manage the Fund’s sensitivity to interest rates or to hedge against changes in interest rates.
Credit Default Swaps. A CDS contract is a risk-transfer instrument through which one party (purchaser of protection) transfers to another party (seller of protection) the financial risk of a credit event (as defined in the CDS agreement), as it relates to a particular reference security or basket of securities (such as an index). In exchange for the protection offered by the seller of protection, the purchaser of protection agrees to pay the seller of protection a periodic amount at a stated rate that is applied to the notional amount of the CDS contract. In addition, an upfront payment may be made or received by the Fund in connection with an unwinding or assignment of a CDS contract. Upon the occurrence of a credit event, the seller of protection would pay the par (or other agreed-upon) value of the reference security (or basket of securities) to the counterparty. Credit events generally include, among others, bankruptcy, failure to pay, and obligation default.
During the year ended March 31, 2021, Optimum Fixed Income Fund entered into CDS contracts as a purchaser and seller of protection, as a hedge against credit events. Periodic payments (receipts) on such contracts are accrued daily and recorded as unrealized losses (gains) on swap contracts. Upon payment (receipt), such amounts are recorded as realized losses (gains) on swap contracts. Upfront payments made or received in connection with CDS contracts are amortized over the expected life of the CDS contracts as unrealized losses (gains) on swap contracts. The change in value of CDS contracts is recorded daily as unrealized appreciation or depreciation. A realized gain or loss is recorded upon a credit event (as defined in the CDS agreement) or the maturity or termination of the agreement. Initial margin and variation margin are posted to central counterparties for centrally cleared CDS basket trades, as determined by the applicable central counterparty.
As disclosed in the footnotes to the “Schedules of investments,” at March 31, 2021, the notional value of the protection sold was EUR20,300,000 and USD42,500,000, which reflects the maximum potential amount Optimum Fixed Income Fund would have been required to make as a seller of credit protection if a credit event had occurred. In addition to serving as the source of the current value of the securities, the quoted market prices and resulting market values for credit default swap agreements on securities and credit indices serve as an indicator of the current status of the payment/performance risk and represent the likelihood of an expected liability (or profit) for the credit derivative if the swap agreement has been closed/sold as of the period end. Increasing market values, in absolute terms when compared to the notional amount of the swap, represent a deterioration of the reference entity’s credit soundness and a greater likelihood of risk of default or other credit event occurring as defined under the terms of the agreement. At March 31, 2021, there were no recourse provisions with third parties to recover any amounts paid under the credit derivative agreement (including any purchased credit protection) nor was any collateral held by the Fund and other third parties which the Fund can obtain in the occurrence of a credit event. At March 31, 2021, net unrealized appreciation of the protection sold was $1,268,431.
CDS contracts may involve greater risks than if Optimum Fixed Income Fund had invested in the reference obligation directly. CDS contracts are subject to general market risk, liquidity risk, counterparty risk, and credit risk. The Fund’s maximum risk of loss from counterparty credit risk, either as the seller of protection or the buyer of protection, is the fair value of the contract. This risk is mitigated by (1) for bilateral swap contracts, having a netting arrangement between the Fund and the counterparty and by the posting of collateral by the counterparty to the Fund to cover the Fund’s exposure to the counterparty, and (2) for cleared swaps, trading these instruments through a central counterparty.
(continues) 159
Table of Contents
Notes to financial statements
Optimum Fund Trust
7. Derivatives (continued)
During the year ended March 31, 2021, Optimum Fixed Income Fund used CDS contracts to hedge against credit events and to gain exposure to certain securities or markets.
Swaps Generally. For centrally cleared swaps, payments are received from the broker or paid to the broker each day, based on the daily fluctuation in the market value of the contract. These receipts or payments are known as “variation margin” and are recorded by Optimum Fixed Income Fund as unrealized gains or losses until the contracts are closed. When the contracts are closed, Optimum Fixed Income Fund records a realized gain or loss equal to the difference between the value of the contract at the time it was opened and the value at the time it was closed. The value of open swaps may differ from that which would be realized in the event Optimum Fixed Income Fund terminated its position in the contract on a given day. Risks of entering into these contracts include the potential inability of the counterparty to meet the terms of the contracts. This type of risk is generally limited to the amount of favorable movement in the value of the underlying security, instrument or basket of instruments, if any, at the day of default. Risks also arise from potential losses from adverse market movements and such losses could exceed the unrealized amounts shown on the “Schedules of investments.”
At March 31, 2021, for bilateral derivative contracts, Optimum Fixed Income Fund posted $2,423,571 cash collateral for certain centrally cleared derivatives, which is included in “Cash collateral due from brokers” on the “Statements of assets and liabilities.” The Fund also posted $7,548,765 in securities collateral comprised of US treasury obligations for certain open centrally cleared derivative contracts. At March 31, 2021, for bilateral derivative contracts, the Fund received $3,756,000 in cash collateral, which is included in “Cash collateral due to brokers” on the “Statements of assets and liabilities.” Cash collateral is included on the “Statements of assets and liabilities” and securities collateral is presented on the “Schedules of investments.”
Fair values of derivative instruments as of March 31, 2021 were as follows:
| | Optimum Fixed Income Fund |
| | Asset Derivatives Fair Value |
| | | | | | Interest | | | | | | | | |
| Statement of Assets and | | Currency | | Rate | | Credit | | | | |
| Liabilities Location | | Contracts | | Contracts | | Contracts | | Total |
| Unrealized appreciation on foreign currency exchange contracts | | $ | 998,116 | | | $ | — | | | $ | — | | | $ | 998,116 | |
| Variation margin due from broker on futures contracts* | | | 88,666 | | | | 1,514,774 | | | | — | | | | 1,603,440 | |
| Variation margin due from brokers on centrally cleared credit | | | | | | | | | | | | | | | | |
| default swap contracts* | | | — | | | | — | | | | 273,512 | | | | 273,512 | |
| Variation margin due from brokers on centrally cleared interest | | | | | | | | | | | | | | | | |
| rate swap contracts* | | | — | | | | 2,057,815 | | | | — | | | | 2,057,815 | |
| Unrealized appreciation on over the counter credit default swap | | | | | | | | | | | | | | | | |
| contracts | | | — | | | | — | | | | 1,002,914 | | | | 1,002,914 | |
| Total | | $ | 1,086,782 | | | $ | 3,572,589 | | | $ | 1,276,426 | | | $ | 5,935,797 | |
| | Liability Derivatives Fair Value |
| | | | | | Interest | | | | | | | | |
| Statement of Assets and | | Currency | | Rate | | Credit | | | | |
| Liabilities Location | | Contracts | | Contracts | | Contracts | | Total |
| Unrealized depreciation on foreign currency exchange contracts | | $ | (309,407 | ) | | $ | — | | | $ | — | | | $ | (309,407 | ) |
| Variation margin due from broker on futures contracts* | | | — | | | | (3,144,055 | ) | | | — | | | | (3,144,055 | ) |
| Variation margin due to brokers on centrally cleared interest rate | | | | | | | | | | | | | | | | |
| swap contracts* | | | — | | | | (3,733,686 | ) | | | — | | | | (3,733,686 | ) |
| Unrealized depreciation on over the counter credit default swap | | | | | | | | | | | | | | | | |
| contracts | | | — | | | | — | | | | (9,653 | ) | | | (9,653 | ) |
| Total | | $ | (309,407 | ) | | $ | (6,877,741 | ) | | $ | (9,653 | ) | | $ | 7,196,801 | |
| * | Includes cumulative appreciation (depreciation) of futures contracts, centrally cleared CDS contracts, and centrally cleared swap contracts from the date the contracts were opened through March 31, 2021. Only current day variation margin is reported on Optimum Fixed Income Fund’s “Statements of assets and liabilities.” |
160
Table of Contents
The effect of derivative instruments on Optimum Fixed Income Fund’s “Statement of operations” for the year ended March 31, 2021 was as follows:
| | Optimum Fixed Income Fund | | | | |
| | Net Realized Gain (Loss) on: | | | | |
| | Foreign | | | | | | | | | | | | | | | | | | | | | |
| | Currency | | | | | | | | | | | | | | | | | | | | | |
| | Exchange | | Futures | | Options | | Options | | Swap | | | | |
| | Contracts | | Contracts | | Purchased | | Written | | Contracts | | Total |
| Currency | | | | | | | | | | | | | | | | | | | | | | | | | |
| contracts | | $ | (3,752,048 | ) | | $ | — | | | | $ | — | | | | $ | 3,765 | | $ | 104,525 | | | $ | (3,643,758 | ) |
| Interest rate | | | | | | | | | | | | | | | | | | | | | | | | | |
| contracts | | | — | | | | (1,506,586 | ) | | | | (2,432 | ) | | | | 71,172 | | | (1,327,975 | ) | | | (2,765,821 | ) |
| Equity | | | | | | | | | | | | | | | | | | | | | | | | | |
| contracts | | | — | | | | 5,490 | | | | | — | | | | | — | | | — | | | | 5,490 | |
| Credit | | | | | | | | | | | | | | | | | | | | | | | | | |
| contracts | | | — | | | | — | | | | | — | | | | | 59,140 | | | (72,140 | ) | | | (13,000 | ) |
| Total | | $ | (3,752,048 | ) | | $ | (1,501,096 | ) | | | $ | (2,432 | ) | | | $ | 134,077 | | $ | (1,295,590 | ) | | $ | (6,417,089 | ) |
| | Net Change in Unrealized Appreciation (Depreciation) of: | | | | |
| | Foreign | | | | | | | | | | | | | | | | | | | | | |
| | Currency | | | | | | | | | | | | | | | | | | | | | |
| | Exchange | | Futures | | Options | | Options | | Swap | | | | |
| | Contracts | | Contracts | | Purchased | | Written | | Contracts | | Total |
| Currency | | | | | | | | | | | | | | | | | | | | | | | | |
| contracts | | $ | 2,389,763 | | $ | 833,018 | | | | $ | — | | | $ | (97 | ) | | $ | — | | | $ | 3,222,684 | |
| Interest rate | | | | | | | | | | | | | | | | | | | | | | | | |
| contracts | | | — | | | (4,570,514 | ) | | | | — | | | | (42,900 | ) | | | 2,188,205 | | | | (2,425,209 | ) |
| Equity | | | | | | | | | | | | | | | | | | | | | | | | |
| contracts | | | — | | | (4,530 | ) | | | | — | | | | 21,244 | | | | — | | | | 16,714 | |
| Credit | | | | | | | | | | | | | | | | | | | | | | | | |
| contracts | | | — | | | — | | | | | 130,317 | | | | 51,452 | | | | 2,607,756 | | | | 2,789,525 | |
| Total | | $ | 2,389,763 | | $ | (3,742,026 | ) | | | $ | 130,317 | | | $ | 29,699 | | | $ | 4,795,961 | | | $ | 3,603,714 | |
During the year ended March 31, 2021, Optimum International Fund, Optimum Large Cap Growth Fund, and Optimum Large Cap Value Fund experienced net realized and unrealized gains or losses attributable to foreign currency holdings, which are disclosed on the “Statements of assets and liabilities” and/or “Statements of operations.”
(continues) 161
Table of Contents
Notes to financial statements
Optimum Fund Trust
7. Derivatives (continued)
The table below summarizes the average balance of derivative holdings by the Fund during the year ended March 31, 2021:
| | Long Derivative Volume |
| | Optimum | | Optimum | | Optimum | | Optimum |
| | Fixed Income | | International | | Large Cap | | Large Cap |
| | Fund | | Fund | | Growth Fund | | Value Fund |
| Foreign currency exchange contracts | | | | | | | | | | | | | | |
| (average notional value) | | USD | $ | 13,983,483 | | USD | $ | 1,488,242 | | USD | 56,481 | | USD | 9,051 |
| Futures contracts (average notional | | | | | | | | | | | | | | |
| value) | | | | 173,444,569 | | | | — | | | — | | | — |
| Options contracts (average notional | | | | | | | | | | | | | | |
| value)* | | | | 30,377 | | | | — | | | — | | | — |
| CDS contracts (average notional | | | | | | | | | | | | | | |
| value)** | | EUR | | 12,944,444 | | | | — | | | — | | | — |
| | USD | | 14,771,496 | | | | — | | | — | | | — |
| Interest rate swap contracts (average | | | | | | | | | | | | | | |
| notional value)*** | | BRL | | 426,142,460 | | | | — | | | — | | | — |
| | CAD | | 43,600,000 | | | | — | | | — | | | — |
| | GBP | | 5,141,270 | | | | — | | | — | | | — |
| | MXN | | 28,769,841 | | | | — | | | — | | | — |
| | USD | | 5,599,939 | | | | — | | | — | | | — |
| | | |
| | Short Derivative Volume |
| | Optimum | | Optimum | | Optimum | | Optimum |
| | Fixed Income | | International | | Large Cap | | Large Cap |
| | Fund | | Fund | | Growth Fund | | Value Fund |
| Foreign currency exchange contracts | | | | | | | | | | | | | | |
| (average notional value) | | USD | | 55,396,273 | | USD | | 657,539 | | USD | 41,044 | | USD | 24,546 |
| Futures contracts (average notional | | | | | | | | | | | | | | |
| value) | | | | 141,902,286 | | | | — | | | — | | | — |
| Options contracts (average notional | | | | | | | | | | | | | | |
| value)* | | | | 63,659 | | | | — | | | — | | | — |
| CDS contracts (average notional | | | | | | | | | | | | | | |
| value)** | | EUR | | 4,165,873 | | | | — | | | — | | | — |
| | USD | $ | 65,027,313 | | | | — | | | — | | | — |
| Interest rate swap contracts (average | | | | | | | | | | | | | | |
| notional value)*** | | BRL | | 101,191,667 | | | | — | | | — | | | — |
| | GBP | | 39,579,365 | | | | — | | | — | | | — |
| | USD | | 100,855,952 | | | | — | | | — | | | — |
| * | Long represents purchased options and short represents written options. |
| ** | Long represents buying protection and short represents selling protection. |
| *** | Long represents receiving fixed interest payments and short represents paying fixed interest payments. |
8. Offsetting
Each Fund entered into an International Swaps and Derivatives Association, Inc. Master Agreement (ISDA Master Agreement) or a similar agreement with certain of its derivative contract counterparties in order to better define its contractual rights and to secure rights that will help each Fund mitigate its counterparty risk. An ISDA Master Agreement is a bilateral agreement between each Fund and a counterparty that governs certain over-the-counter (OTC) derivatives and foreign exchange contracts and typically contains, among other things, collateral posting
162
Table of Contents
items and netting provisions in the event of a default and/or termination event. Under an ISDA Master Agreement, each Fund may, under certain circumstances, offset with the counterparty certain derivative financial instruments’ payables and/or receivables with collateral held and/or posted and create one single net payment. The provisions of the ISDA Master Agreement typically permit a single net payment in the event of default (close-out), including the bankruptcy or insolvency of the counterparty. However, bankruptcy or insolvency laws of a particular jurisdiction may impose restrictions on or prohibitions against the right of offset in bankruptcy, insolvency, or other events.
For financial reporting purposes, each Fund does not offset derivative assets and derivative liabilities that are subject to netting arrangements on the “Statements of assets and liabilities.”
At March 31, 2021, the Funds had the following assets and liabilities subject to offsetting provisions:
Offsetting of Financial Assets and Liabilities and Derivative Assets and Liabilities
Optimum Fixed Income Fund
| | | | | | | Gross Value of | | | | | | |
| | Gross Value of | | Derivative | | | | | | |
| Counterparty | | Derivative Asset | | Liability | | Net Position |
| Bank of America Merrill Lynch | | | $ | 79,957 | | | | $ | (167,477 | ) | | | | $ | (87,520 | ) | |
| BNP Paribas | | | | 477,449 | | | | | (112,060 | ) | | | | | 365,389 | | |
| Citigroup | | | | 215,433 | | | | | (29,364 | ) | | | | | 186,069 | | |
| Deutsche Bank | | | | 967,390 | | | | | — | | | | | | 967,390 | | |
| Goldman Sachs | | | | 17,865 | | | | | — | | | | | | 17,865 | | |
| JPMorgan Chase Bank | | | | 294,388 | | | | | (10,159 | ) | | | | | 284,229 | | |
| Morgan Stanley Capital International | | | | 107,716 | | | | | (23,095 | ) | | | | | 84,621 | | |
| Total | | | $ | 2,160,198 | | | | $ | (342,155 | ) | | | | $ | 1,818,043 | | |
| | | | | | | | Fair Value of | | | | | | | | Fair Value of | | | | | | | | | | | |
| | | | | | | | Non-Cash | | Cash Collateral | | Non-Cash | | Cash Collateral | | | | | | |
| Counterparty | | Net Position | | Collateral Received | | Received(a) | | Collateral Pledged | | Pledged | | Net Exposure(b) |
| Bank of America Merrill Lynch | | | $ | (87,520 | ) | | | | $ | — | | | | $ | — | | | | | $ | — | | | | $ | — | | | | $ | (87,520 | ) | |
| BNP Paribas | | | | 365,389 | | | | | | — | | | | | (365,389 | ) | | | | | — | | | | | — | | | | | — | | |
| Citigroup | | | | 186,069 | | | | | | — | | | | | (150,000 | ) | | | | | — | | | | | — | | | | | 36,069 | | |
| Deutsche Bank | | | | 967,390 | | | | | | — | | | | | (180,000 | ) | | | | | — | | | | | — | | | | | 787,390 | | |
| Goldman Sachs | | | | 17,865 | | | | | | — | | | | | — | | | | | | — | | | | | — | | | | | 17,865 | | |
| JPMorgan Chase Bank | | | | 284,229 | | | | | | — | | | | | (284,229 | ) | | | | | — | | | | | — | | | | | — | | |
| Morgan Stanley Capital | | | | | | | | | | | | | | | | | | | | | | | | | | | | | | | | | |
| International | | | | 84,621 | | | | | | — | | | | | (84,621 | ) | | | | | — | | | | | — | | | | | — | | |
| Total | | | $ | 1,818,043 | | | | | $ | — | | | | $ | (1,064,239 | ) | | | | $ | — | | | | $ | — | | | | $ | 753,804 | | |
| Optimum International Fund | | | | | | | | | | | | |
| | | | | | | | | | Gross Value of | | |
| | | | | | | | Gross Value of | | Derivative | | |
| Counterparty | | | | | | | | Derivative Asset | | Liability | | Net Position |
| Brown Brothers Harriman | | | | | | | | $1,894 | | $(1,167) | | $727 |
| | | | | | | | | | | | | |
| | | | Fair Value of | | | | Fair Value of | | | | |
| | | | Non-Cash | | Cash Collateral | | Non-Cash | | Cash Collateral | | |
| Counterparty | | Net Position | | Collateral Received | | Received(a) | | Collateral Pledged | | Pledged | | Net Exposure(b) |
| Brown Brothers Harriman | | $727 | | $— | | $— | | $— | | $— | | $727 |
| | | | | | | | | | | | | |
| Optimum Large Cap Growth Fund | | | | | | | | | | | | |
| | | | | | | | | | Gross Value of | | |
| | | | | | | | Gross Value of | | Derivative | | |
| Counterparty | | | | | | | | Derivative Asset | | Liability | | Net Position |
| Bank of New York Mellon | | | | | | | | $— | | $(4) | | $(4) |
(continues) 163
Table of Contents
Notes to financial statements
Optimum Fund Trust
8. Offsetting (continued)
| | | | Fair Value of | | | | Fair Value of | | | | |
| | | | Non-Cash | | Cash Collateral | | Non-Cash | | Cash Collateral | | |
| Counterparty | | Net Position | | Collateral Received | | Received(a) | | Collateral Pledged | | Pledged | | Net Exposure(b) |
| Bank of New York Mellon | | $(4) | | $— | | $— | | $— | | $— | | $(4) |
Master Repurchase Agreements
Repurchase agreements are entered into by each Fund under master repurchase agreements (each, an MRA). The MRA permits each Fund, under certain circumstances including an event of default (such as bankruptcy or insolvency), to offset payables and/or receivables with collateral held by and/or posted to the counterparty. As a result, one single net payment is created. Bankruptcy or insolvency laws of a particular jurisdiction may impose restrictions on or prohibitions against such a right of offset in the event of the MRA counterparty’s bankruptcy or insolvency. Based on the terms of the MRA, each Fund receives securities as collateral with a market value in excess of the repurchase price at maturity. Upon a bankruptcy or insolvency of the MRA counterparty, each Fund would recognize a liability with respect to such excess collateral. The liability reflects each Fund’s obligation under bankruptcy law to return the excess to the counterparty. As of March 31, 2021, the following table is a summary of each Fund’s repurchase agreements by counterparty which are subject to offset under an MRA:
| | Optimum Fixed Income Fund |
| | | | Fair Value of | | | | | | |
| | | | Non-Cash | | Cash | | | | |
| | Repurchase | | Collateral | | Collateral | | Net Collateral | | Net |
| Counterparty | | Agreements | | Received(a) | | Received | | Received | | Exposure(b) |
| JPMorgan Chase Bank | | $110,300,000 | | $(110,300,000) | | $— | | $(110,300,000) | | $— |
Securities Lending
Securities lending transactions are entered into by Optimum International Fund under master securities lending agreements (each, an MSLA) which provide the right, in the event of default (including bankruptcy or insolvency), for the non-defaulting party to liquidate the collateral and calculate a net exposure to the defaulting party or request additional collateral. In the event that a borrower defaults, the Fund, as lender, would offset the market value of the collateral received against the market value of the securities loaned. When the value of the collateral is greater than that of the market value of the securities loaned, the lender is left with a net amount payable to the defaulting party. However, bankruptcy or insolvency laws of a particular jurisdiction may impose restrictions on or prohibitions against such a right of offset in the event of an MSLA counterparty’s bankruptcy or insolvency. Under the MSLA, the borrower can resell or re-pledge the loaned securities, and the Fund can reinvest cash collateral, or, upon an event of default, resell, or re-pledge the collateral (See also Note 9).
As of March 31, 2021, the following table is a summary of Optimum International Fund’s securities lending agreements by counterparty which are subject to offset under an MSLA:
| | | | | | Fair Value of | | | | |
| | Securities | | Cash | | Non-Cash | | Net | | |
| | Loaned | | Collateral | | Collateral | | Collateral | | |
| Counterparty | | at Value | | Received(a) | | Received | | Received | | Net Exposure(b) |
| Bank of New York Mellon | | $29,141,339 | | $(15,786,100) | | $(13,355,239) | | $(29,141,339) | | $— |
| (a) | The value of the related collateral exceeded the value of the derivatives, repurchase agreements, and securities lending transactions as of March 31, 2021, as applicable. |
| (b) | Net exposure represents the receivable (payable) that would be due from (to) the counterparty in the event of default. |
9. Securities Lending
Each Fund, along with other funds in the Delaware Funds, may lend its securities pursuant to a security lending agreement (Lending Agreement) with The Bank of New York Mellon (BNY Mellon). At the time a security is loaned, the borrower must post collateral equal to the required percentage of the market value of the loaned security, including any accrued interest. The required percentage is: (1) 102% with respect to US securities and foreign securities that are denominated and payable in US dollars; and (2) 105% with respect to foreign securities. With respect
164
Table of Contents
to each loan, if on any business day the aggregate market value of securities collateral plus cash collateral held is less than the aggregate market value of the securities which are the subject of such loan, the borrower will be notified to provide additional collateral by the end of the following business day, which, together with the collateral already held, will be not less than the applicable initial collateral requirements for such security loan. If the aggregate market value of securities collateral and cash collateral held with respect to a security loan exceeds the applicable initial collateral requirement, upon the request of the borrower, BNY Mellon must return enough collateral to the borrower by the end of the following business day to reduce the value of the remaining collateral to the applicable initial collateral requirement for such security loan. As a result of the foregoing, the value of the collateral held with respect to a loaned security on any particular day, may be more or less than the value of the security on loan. The collateral percentage with respect to the market value of the loaned security is determined by the security lending agent.
Cash collateral received by each fund of the Trust is generally invested in a series of individual separate accounts, each corresponding to a fund. The investment guidelines permit each separate account to hold certain securities that would be considered eligible securities for a money market fund. Cash collateral received is generally invested in government securities; certain obligations issued by government sponsored enterprises; repurchase agreements collateralized by US Treasury securities; obligations issued by the central government of any Organization for Economic Cooperation and Development (OECD) country or its agencies, instrumentalities, or establishments; obligations of supranational organizations; commercial paper, notes, bonds, and other debt obligations; certificates of deposit, time deposits, and other bank obligations; and asset-backed securities. A fund can also accept US government securities and letters of credit (non-cash collateral) in connection with securities loans.
In the event of default or bankruptcy by the lending agent, realization and/or retention of the collateral may be subject to legal proceedings. In the event the borrower fails to return loaned securities and the collateral received is insufficient to cover the value of the loaned securities and provided such collateral shortfall is not the result of investment losses, the lending agent has agreed to pay the amount of the shortfall to each Fund or, at the discretion of the lending agent, replace the loaned securities. Each Fund continues to record dividends or interest, as applicable, on the securities loaned and is subject to changes in value of the securities loaned that may occur during the term of the loan. Each Fund has the right under the Lending Agreement to recover the securities from the borrower on demand. With respect to security loans collateralized by non-cash collateral, each Fund receives loan premiums paid by the borrower. With respect to security loans collateralized by cash collateral, the earnings from the collateral investments are shared among each Fund, the security lending agent, and the borrower. Each Fund records security lending income net of allocations to the security lending agent and the borrower.
Each Fund may incur investment losses as a result of investing securities lending collateral. This could occur if an investment in the collateral investment account defaulted or became impaired. Under those circumstances, the value of each Fund’s cash collateral account may be less than the amount each Fund would be required to return to the borrowers of the securities and each Fund would be required to make up for this shortfall.
During the year ended March 31, 2021, Optimum Fixed Income Fund, Optimum Large Cap Growth Fund, Optimum Large Cap Value Fund, Optimum Small-Mid Cap Growth Fund, and Optimum Small-Mid Cap Value Fund had no securities on loan.
The following table reflects a breakdown of transactions accounted for as secured borrowings, the gross obligation by the type of collateral pledged, and the remaining contractual maturity of those transactions as of March 31, 2021 for Optimum International Fund:
| | Overnight | | | | | | Between | | | | | | |
| | and | | Under | | 30 & | | Over | | |
| Securities Lending Transactions | | continuous | | 30 days | | 90 days | | 90 Days | | Total |
| Certificates of Deposit and Repurchase Agreements | | $16,656,607 | | $ | — | | | $ | — | | | $ | — | | | $16,656,607 |
| US Government Debt (Treasury Bills, Notes, and Bonds) | | 13,355,239 | | | — | | | | — | | | | — | | | 13,355,239 |
At March 31, 2021, the value of securities on loan for Optimum International Fund was $29,141,339, for which the Fund received cash collateral of $16,655,539 and non-cash collateral with a fair value of $13,355,239. At March 31, 2021, the value of invested collateral was $16,656,607. Investments purchased with cash collateral are presented on the “Schedules of investments” under the caption “Securities Lending Collateral.”
(continues) 165
Table of Contents
Notes to financial statements
Optimum Fund Trust
10. Credit and Market Risk
Beginning in January 2020, global financial markets have experienced and may continue to experience significant volatility resulting from the spread of a novel coronavirus known as COVID-19. The outbreak of COVID-19 has resulted in travel and border restrictions, quarantines, supply chain disruptions, lower consumer demand and general market uncertainty. The effects of COVID-19 have and may continue to adversely affect the global economy, the economies of certain nations, and individual issuers, all of which may negatively impact the Funds’ performance.
Investments in equity securities in general are subject to market risks that may cause their prices to fluctuate over time. Fluctuations in the value of equity securities in which the Funds invests will cause the NAV of the Funds to fluctuate.
Some countries in which the Funds may invest require governmental approval for the repatriation of investment income, capital, or the proceeds of sales of securities by foreign investors. In addition, if there is deterioration in a country’s balance of payments or for other reasons, a country may impose temporary restrictions on foreign capital remittances abroad.
The securities exchanges of certain foreign markets are substantially smaller, less liquid, and more volatile than the major securities markets in the US. Consequently, acquisition and disposition of securities by the Funds may be inhibited. In addition, a significant portion of the aggregate market value of securities listed on the major securities exchanges in emerging markets is held by a smaller number of investors. This may limit the number of shares available for acquisition or disposition by the Funds.
When interest rates rise, fixed income securities (i.e. debt obligations) generally will decline in value. These declines in value are greater for fixed income securities with longer maturities or durations.
IBOR is the risk that changes related to the use of the London interbank offered rate (LIBOR) and other interbank offered rate (collectively, “IBORs” ) could have adverse impacts on financial instruments that reference LIBOR (or the corresponding IBOR). The abandonment of LIBOR could affect the value and liquidity of instruments that reference LIBOR. The use of alternative reference rate products may impact investment strategy performance. These risks may also apply with respect to changes in connection with other IBORs, such as the euro overnight index average (EONIA), which are also the subject of recent reform.
Optimum Fixed Income Fund invests in high yield fixed income securities, which are securities rated lower than BBB- by S&P and lower than Baa3 by Moody’s, or similarly rated by another nationally recognized statistical rating organization. Investments in these higher yielding securities are generally accompanied by a greater degree of credit risk than higher rated securities. Additionally, lower rated securities may be more susceptible to adverse economic and competitive industry conditions than investment grade securities.
Optimum Fixed Income Fund invests in bank loans and other securities that may subject it to direct indebtedness risk, the risk that the Fund will not receive payment of principal, interest, and other amounts due in connection with these investments and will depend primarily on the financial condition of the borrower. Loans that are fully secured offer the Fund more protection than unsecured loans in the event of nonpayment of scheduled interest or principal, although there is no assurance that the liquidation of collateral from a secured loan would satisfy the corporate borrower’s obligation, or that the collateral can be liquidated. Some loans or claims may be in default at the time of purchase. Certain of the loans and the other direct indebtedness acquired by the Fund may involve revolving credit facilities or other standby financing commitments that obligate the Fund to pay additional cash on a certain date or on demand. These commitments may require the Fund to increase its investment in a company at a time when the Fund might not otherwise decide to do so (including at a time when the company’s financial condition makes it unlikely that such amounts will be repaid). To the extent that the Fund is committed to advance additional funds, it will at all times hold and maintain cash or other high grade debt obligations in an amount sufficient to meet such commitments. When a loan agreement is purchased, the Fund may pay an assignment fee. On an ongoing basis, the Fund may receive a commitment fee based on the undrawn portion of the underlying line of credit portion of a loan agreement. Prepayment penalty fees are received upon the prepayment of a loan agreement by the borrower. Prepayment penalty, facility, commitment, consent, and amendment fees are recorded to income as earned or paid.
As the Fund may be required to rely upon another lending institution to collect and pass on to the Fund amounts payable with respect to the loan and to enforce the Fund’s rights under the loan and other direct indebtedness, an insolvency, bankruptcy, or reorganization of the lending institution may delay or prevent the Fund from receiving such amounts. The highly leveraged nature of many loans may make them especially vulnerable to adverse changes in economic or market conditions. Investments in such loans and other direct indebtedness may involve additional risk to the Fund.
166
Table of Contents
Optimum Fixed Income Fund invests in certain obligations that may have liquidity protection designed to ensure that the receipt of payments due on the underlying security is timely. Such protection may be provided through guarantees, insurance policies, or letters of credit obtained by the issuer or sponsor through third parties, through various means of structuring the transaction or through a combination of such approaches. The Fund will not pay any additional fees for such credit support, although the existence of credit support may increase the price of a security.
Optimum Fixed Income Fund invests in fixed income securities whose value is derived from an underlying pool of mortgages or consumer loans. The value of these securities is sensitive to changes in economic conditions, including delinquencies and/or defaults, and may be adversely affected by shifts in the market’s perception of the issuers and changes in interest rates. Investors receive principal and interest payments as the underlying mortgages and consumer loans are paid back. Some of these securities are CMOs. CMOs are debt securities issued by US government agencies or by financial institutions and other mortgage lenders, which are collateralized by a pool of mortgages held under an indenture. Prepayment of mortgages may shorten the stated maturity of the obligations and can result in a loss of premium, if any has been paid. Certain of these securities may be stripped (securities which provide only the principal or interest feature of the underlying security). The yield to maturity on an interest-only CMO is extremely sensitive not only to changes in prevailing interest rates, but also to the rate of principal payments (including prepayments) on the related underlying mortgage assets. A rapid rate of principal payments may have a material adverse effect on the Fund’s yield to maturity. If the underlying mortgage assets experience greater than anticipated prepayments of principal, the Fund may fail to fully recoup its initial investment in these securities even if the securities are rated in the highest rating categories.
Optimum Small-Mid Cap Growth Fund and Optimum Small-Mid Cap Value Fund invest a significant portion of their assets in small- and mid-sized companies. Investments in small- and mid-sized companies may be more volatile than investments in larger companies for a number of reasons, which include more limited financial resources or a dependence on narrow product lines.
Optimum Large Cap Growth Fund, Optimum Large Cap Value Fund, Optimum Small-Mid Cap Growth Fund, and Optimum Small-Mid Cap Value Fund may invest in REITs and are subject to the risks associated with that industry. If a Fund holds real estate directly or receives rental income directly from real estate holdings, its tax status as a regulated investment company may be jeopardized. There were no direct real estate holdings during the year ended March 31, 2021. The Funds’ REIT holdings are also affected by interest rate changes, particularly if the REITs they hold use floating rate debt to finance their ongoing operations. The Funds also invests in real estate acquired as a result of ownership of securities or other instruments, including issuers that invest, deal, or otherwise engage in transactions in real estate or interests therein. These instruments may include interests in private equity limited partnerships or limited liability companies that hold real estate investments (Real Estate Limited Partnerships). The Funds will limit their investments in Real Estate Limited Partnerships to 5% of their total assets at the time of purchase.
Optimum Large Cap Growth Fund, Optimum Large Cap Value Fund, and Optimum Small-Mid Cap Growth Fund invested in growth stocks (such as those in the technology sector), which reflect projections of future earnings and revenue. These prices may rise or fall dramatically depending on whether those projections are met. These companies’ stock prices may be more volatile, particularly over the short-term.
Each Fund may invest up to 15% of its net assets in illiquid securities, which may include securities with contractual restrictions on resale, securities exempt from registration under Rule 144A promulgated under the Securities Act of 1933, as amended (1933 Act), and other securities which may not be readily marketable. The Funds may also invest in securities exempt from registration under Section 4(a)(2) of the 1933 Act, which exempts from registration transactions by an issuer not involving any public offering. The relative illiquidity of these securities may impair each Fund from disposing of them in a timely manner and at a fair price when it is necessary or desirable to do so. While maintaining oversight, the Trust’s Board has delegated to DMC, the day-to-day functions of determining whether individual securities are liquid for purposes of the Funds’ limitation on investments in illiquid securities. Securities eligible for resale pursuant to Rule 144A, which are determined to be liquid, are not subject to the Funds’ 15% limit on investments in illiquid securities. Rule 144A and 4(a)(2) have been identified on the “Schedules of investments.”
11. Contractual Obligations
Each Fund enters into contracts in the normal course of business that contain a variety of indemnifications. Each Fund’s maximum exposure under these arrangements is unknown. However, each Fund has not had prior claims or losses pursuant to these contracts. Management has reviewed each Fund’s existing contracts and expects the risk of loss to be remote.
(continues) 167
Table of Contents
Notes to financial statements
Optimum Fund Trust
12. General Motors Term Loan Litigation
Optimum Fixed Income Fund received notice of a litigation proceeding related to a General Motors Corporation (G.M.) term loan participation previously held by the Fund in 2009. Because it was believed that the Fund was a secured creditor, the Fund received the full principal on the loans in 2009 after the G.M. bankruptcy. However, based upon a US Court of Appeals ruling, the Motors Liquidation Company Avoidance Action Trust is seeking to recover such amounts arguing that the Fund is an unsecured creditor and, as an unsecured creditor, the Fund should not have received payment in full. Based upon available information related to the litigation and the Fund’s potential exposure, the Fund recorded a contingent liability of $1,385,788 and an asset of $415,736 based on the potential recoveries by the estate that resulted in a net decrease in the Fund’s NAV to reflect this potential recovery.
During the year, the plaintiff and the term loan lenders, which included the Fund, reached an agreement that resolved the disputes. The parties agreed to terms of a settlement agreement and presented the settlement agreement to the court for approval at a hearing on June 12, 2019. The court approved the settlement documentation and dismissed the case on July 2, 2019. The court’s approval of the settlement and dismissal of the case with prejudice became final on July 16, 2019.
The contingent liability and other asset were removed in connection with the case being settled, which resulted in the Fund recognizing a gain in the amount of the liability reversed.
13. Recent Accounting Pronouncements
In August 2018, FASB issued an Accounting Standards Update (ASU), ASU 2018-13, which changes certain fair value measurement disclosure requirements. ASU 2018-13, in addition to other modifications and additions, removes the requirement to disclose the amount and reasons for transfers between Level 1 and Level 2 of the fair value hierarchy, the policy for the timing of transfers between levels and the valuation process for Level 3 fair value measurements. ASU 2018-13 is effective for fiscal years, and interim periods within those fiscal years, beginning after December 15, 2019. Management has implemented ASU 2018-13 on the financial statements.
In March 2020, FASB issued ASU 2020-04, Reference Rate Reform (Topic 848) – Facilitation of the Effects of Reference Rate Reform on Financial Reporting. The amendments in ASU 2020-04 provide optional temporary financial reporting relief from the effect of certain types of contract modifications due to the planned discontinuation of LIBOR and other interbank-offered based reference rates as of the end of 2021. ASU 2020-04 is effective for certain reference rate-related contract modifications that occur during the period March 12, 2020 through December 31, 2022. As of the financial reporting period, Management is evaluating the impact of applying this ASU.
14. Subsequent Events
On December 2, 2020, Waddell & Reed Financial, Inc. (WDR), the parent company of Ivy Investment Management Company, the investment adviser of the Ivy Funds Complex (the Ivy Funds), and Macquarie Management Holdings, Inc., the U.S. holding company for Macquarie Group Limited’s U.S. asset management business (Macquarie), announced that they had entered into an agreement whereby Macquarie would acquire the investment management business of WDR (the “Transaction”). The Transaction closed on April 30, 2021. The Ivy Funds, as part of Delaware Funds by Macquarie, are now managed by DMC and distributed by DDLP. DMC and DDLP are also the investment manager and distributor, respectively, of the Optimum Fund Trust.
Effective April 28, 2021, Baillie Gifford Overseas Limited replaced EARNEST Partners LLC as a sub-advisor for the Optimum International Fund.
Management has determined that no other material events or transactions occurred subsequent to March 31, 2021, that would require recognition or disclosure in the Funds’ financial statements.
168
Table of Contents
Report of independent
registered public accounting firm
To the Board of Trustees of Optimum Fund Trust and Shareholders of Optimum Fixed Income Fund, Optimum International Fund, Optimum Large Cap Growth Fund, Optimum Large Cap Value Fund, Optimum Small-Mid Cap Growth Fund and Optimum Small-Mid Cap Value Fund
Opinions on the Financial Statements
We have audited the accompanying statements of assets and liabilities, including the schedules of investments, of Optimum Fixed Income Fund, Optimum International Fund, Optimum Large Cap Growth Fund, Optimum Large Cap Value Fund, Optimum Small-Mid Cap Growth Fund and Optimum Small-Mid Cap Value Fund (constituting Optimum Fund Trust, hereafter collectively referred to as the “Funds”) as of March 31, 2021, the related statements of operations for the year ended March 31, 2021, the statements of changes in net assets for each of the two years in the period ended March 31, 2021, including the related notes, and the financial highlights for each of the five years in the period ended March 31, 2021 (collectively referred to as the “financial statements”). In our opinion, the financial statements present fairly, in all material respects, the financial position of each of the Funds as of March 31, 2021, the results of each of their operations for the year then ended, the changes in each of their net assets for each of the two years in the period ended March 31, 2021 and the financial highlights for each of the five years in the period ended March 31, 2021 in conformity with accounting principles generally accepted in the United States of America.
Basis for Opinions
These financial statements are the responsibility of the Funds’ management. Our responsibility is to express an opinion on the Funds’ financial statements based on our audits. We are a public accounting firm registered with the Public Company Accounting Oversight Board (United States) (PCAOB) and are required to be independent with respect to the Funds in accordance with the U.S. federal securities laws and the applicable rules and regulations of the Securities and Exchange Commission and the PCAOB.
We conducted our audits of these financial statements in accordance with the standards of the PCAOB. Those standards require that we plan and perform the audit to obtain reasonable assurance about whether the financial statements are free of material misstatement, whether due to error or fraud.
Our audits included performing procedures to assess the risks of material misstatement of the financial statements, whether due to error or fraud, and performing procedures that respond to those risks. Such procedures included examining, on a test basis, evidence regarding the amounts and disclosures in the financial statements. Our audits also included evaluating the accounting principles used and significant estimates made by management, as well as evaluating the overall presentation of the financial statements. Our procedures included confirmation of securities owned as of March 31, 2021 by correspondence with the custodian, transfer agents and brokers; when replies were not received from brokers, we performed other auditing procedures. We believe that our audits provide a reasonable basis for our opinions.
/s/PricewaterhouseCoopers LLP
Philadelphia, Pennsylvania
May 20, 2021
We have served as the auditor of one or more investment companies in Optimum Fund Trust since 2010.
169
Table of Contents
Other Fund information
(Unaudited)
Optimum Fund Trust
Tax Information
The information set forth below is for the Fund’s fiscal year as required by federal income tax laws. Shareholders, however, must report distributions on a calendar year basis for income tax purposes, which may include distributions for portions of two fiscal years of the Fund. Accordingly, the information needed by shareholders for income tax purposes will be sent to them in January of each year. Please consult your tax advisor for proper treatment of this information.
All disclosures are based on financial information available as of the date of this annual report and, accordingly are subject to change. For any and all items requiring reporting, it is the intention of the Fund to report the maximum amount permitted under the Internal Revenue Code and the regulations thereunder.
For the fiscal year ended March 31, 2021, the Fund reports distributions paid during the year as follows:
| | (A) | | | | | | | | | | |
| | Long-Term | | (B) | | | | | | |
| | Capital Gains | | Ordinary Income | | Total | | (C) |
| | Distributions | | Distributions | | Distributions | | Qualifying |
| | (Tax Basis) | | (Tax Basis) | | (Tax Basis) | | Dividends1 |
| Optimum Fixed Income Fund | | | 9.44 | % | | | 90.56 | % | | 100.00% | | | — | |
| Optimum International Fund | | | 52.38 | % | | | 47.62 | % | | 100.00% | | | — | |
| Optimum Large Cap Growth Fund | | | 100.00 | % | | | — | | | 100.00% | | | — | |
| Optimum Large Cap Value Fund | | | 40.58 | % | | | 59.42 | % | | 100.00% | | | 100.00 | % |
| Optimum Small-Mid Cap Growth Fund | | | 60.70 | % | | | 39.30 | % | | 100.00% | | | 5.69 | % |
| Optimum Small-Mid Cap Value Fund | | | 47.22 | % | | | 52.78 | % | | 100.00% | | | 66.26 | % |
____________________
| (A) | and (B) are based on a percentage of the Fund’s total distributions. |
| (C) | is based on the Fund’s ordinary income distributions. |
| 1 | Qualified dividends represent dividends which qualify for the corporate dividends received deduction. |
| * | For the fiscal year ended March 31, 2021, certain dividends paid by the Funds may be subject to a maximum tax rate of 20%. The percentage of dividends paid by the Funds from ordinary income reported as qualified income are as reported in the following table. Complete information will be computed and reported in conjunction with your 2020 Form 1099-DIV. |
| Optimum | | Optimum | | Optimum | | Optimum | | Optimum | | Optimum |
| Fixed Income | | International | | Large Cap | | Large Cap | | Small-Mid Cap | | Small-Mid Cap |
| Fund | | Fund | | Growth Fund | | Value Fund | | Growth Fund | | Value Fund |
| — | | 100.00% | | — | | 100.00% | | 6.06% | | 66.02% |
For the fiscal year ended March 31, 2021, certain distributions paid by the Funds, determined to be Qualified Interest Income or Qualified Short- Term Capital Gains may be subject to relief from US tax withholding for foreign shareholders, as provided by the American Jobs Creation Act of 2004; the Tax Relief Unemployment Insurance Reauthorization, and Job Creations Act of 2010; and as extended by the American Taxpayer Relief Act of 2012. For the fiscal year ended March 31, 2021, the Funds have reported maximum distributions of Qualified Interest Income and Qualified Short-Term Capital Gains as follows:
| | | | | | Qualified |
| | Qualified | | Short-Term |
| | Interest Income | | Capital Gains |
| Optimum Fixed Income Fund | | $ | 44,578,325 | | | $ | 38,673,865 |
| Optimum International Fund | | | — | | | | 4,561,182 |
| Optimum Large Cap Value Fund | | | — | | | | 1,855,274 |
| Optimum Small-Mid Cap Growth Fund | | | — | | | | 116,380,996 |
| Optimum Small-Mid Cap Value Fund | | | — | | | | 25,201,046 |
Optimum International Fund intends to pass through foreign tax credits in the maximum amount of $1,102,199. The gross foreign source income earned during the fiscal year 2021 by the Fund was $15,975,873.
170
Table of Contents
The percentage of the ordinary dividends reported by Optimum Fixed Income Fund that is treated as a Section 163(j) interest dividend and thus is eligible to be treated as interest income for purposes of Section 163(j) and the regulations thereunder is 48.59%.
Board consideration of Sub-Advisory Agreement with Baillie Gifford Overseas Limited at meeting held March 24, 2021
At a meeting held March 24, 2021, the Board of Trustees, including a majority of disinterested or independent Trustees, approved a Sub-Advisory Agreement (the “Sub-Advisory Agreement”) between Delaware Management Company (“DMC” or “Management”) and Baillie Gifford Overseas Limited (“Baillie Gifford”) for Optimum International Fund (the “Fund”). Baillie Gifford replaced EARNEST Partners LLC (“Earnest”) as a sub-advisor to the Fund as of April 28, 2021.
In reaching the decision to approve the Sub-Advisory Agreement, the Board considered and reviewed information about Baillie Gifford, including its personnel, operations, and financial condition, which had been provided by Baillie Gifford. The Board also reviewed material furnished by DMC (with the assistance of its consultant, LPL Financial LLC (“LPL”)), including: a memorandum from DMC reviewing the Sub-Advisory Agreement and the various services proposed to be rendered by Baillie Gifford; research and analysis concerning DMC’s proposal of Baillie Gifford; a description of Baillie Gifford’s proposed sub-advisory fees under the Sub-Advisory Agreement, along with fees that Baillie Gifford charges other comparable investment companies or accounts; information concerning Baillie Gifford’s organizational structure and the experience of its investment management personnel; a “due diligence” summary report describing various material items in relation to Baillie Gifford’s personnel, organization and policies; copies of Baillie Gifford’s Form ADV, compliance policies and procedures and its Code of Ethics; and a copy of the Sub-Advisory Agreement.
In considering such materials, the Independent Trustees received assistance and advice from and met separately with independent counsel. In this regard, the Independent Trustees reviewed with independent legal counsel their duties and obligations in connection with the review of the Sub-Advisory Agreement and discussed, in detail, the matters related to such approval. The materials prepared by Management specifically in connection with the approval of the Sub-Advisory Agreement were sent to the Independent Trustees in advance of the Meeting. While attention was given to all information furnished, the following discusses some primary factors relevant to the Board’s decision. This discussion of the information and factors considered by the Board (as well as the discussion above) is not intended to be exhaustive, but rather summarizes certain factors considered by the Board. In view of the wide variety of factors considered, the Board did not, unless otherwise noted, find it practicable to quantify or otherwise assign relative weights to the following factors. In addition, individual Trustees may have assigned different weights to various factors.
Nature, extent, and quality of services. In considering the nature, extent, and quality of the services to be provided by Baillie Gifford, the Board specifically considered that the Sub-Advisory Agreement contains substantially similar provisions to those in the prior Earnest sub-advisory agreement, except for the provisions relating to the sub-advisory fees and to Baillie Gifford’s domicile of Scotland. The Board reviewed materials provided by Baillie Gifford regarding the experience and qualifications of personnel who will be responsible for managing the portion of Optimum International Fund to be sub-advised by Baillie Gifford. The Board also placed weight on the projected performance of a representative Baillie Gifford portfolio that utilized the investment process and parameters that would be employed by Baillie Gifford on behalf of its portion of Optimum International Fund (the “Baillie Gifford Account”). The Board also considered that Baillie Gifford would serve as a sub-advisor of Optimum International Fund with another sub-advisor, Acadian Asset Management LLC (“Acadian”). The Board considered the compatibility of the two sub-advisors’ investment philosophies and methodologies that they would each employ for Optimum International Fund. Lastly, the Board took into account that Baillie Gifford has historically focused on providing downside market risk protection for its clients. Based upon these considerations, the Board was satisfied with the nature and quality of the overall services to be provided by Baillie Gifford to Optimum International Fund and its shareholders and was confident in the abilities of Baillie Gifford to provide quality services to Optimum International Fund and its shareholders.
Investment performance. The Board reviewed information on the projected performance of the Baillie Gifford Account over various time periods. The Board also reviewed a “combination analysis” showing various performance metrics that would have resulted from combining the performance of the Baillie Gifford Account with the performance of Acadian in managing its portion of Optimum International Fund over various time periods. The Board noted Management’s belief, based on the historical combination analysis, that the investment strategy to be employed by Baillie Gifford on behalf of its portion of Optimum International Fund would be a good complement to that followed by Acadian, and Baillie Gifford’s investment strategy would provide a better balance to Acadian’s investment philosophy as compared the investment strategy utilized by Earnest. The Board believed such information and analysis evidenced the benefits to Optimum International Fund and quality of portfolio management services expected to be provided by Baillie Gifford under the Sub-Advisory Agreement.
Table of Contents
Other Fund information
(Unaudited)
Optimum Fund Trust
Board consideration of Sub-Advisory Agreement with Baillie Gifford Overseas Limited at meeting held March 24, 2021
Sub-advisory fees. In considering the appropriateness of the sub-advisory fees to be charged by Baillie Gifford, the Board reviewed and considered the sub-advisory fees in light of the nature, extent and quality of the sub-advisory services to be provided by Baillie Gifford, as more fully described above. The Board noted that Baillie Gifford’s sub-advisory fees are paid by DMC and are not additional fees borne by Optimum International Fund. The Board also noted that the sub-advisory fees to be paid by DMC to Baillie Gifford were the product of arms-length negotiations between DMC and Baillie Gifford, and the Board considered the allocation of the investment management fees charged to the Fund between DMC and Baillie Gifford in light of the nature, extent and quality of the investment management services provided, and to be provided by, DMC and Baillie Gifford. In particular, the Board was provided with a description of fees to be charged by Baillie Gifford under the Sub-Advisory Agreement for Optimum International Fund, which showed them to be slightly higher than the sub-advisory fees charged by Earnest under its sub-advisory agreement at the Fund’s current amount of assets under management. The Board discussed the impact that the differences in fees would have on DMC’s profitability. The Board also was provided with information showing that Baillie Gifford’s sub-advisory fees for Optimum International Fund were competitive with those charged by Baillie Gifford to other comparable investment companies or accounts, and was informed by Management that Baillie Gifford’s sub-advisory fees were competitive with fees of other investment managers being considered as possible sub-advisors to the Fund. The Board also noted that the management fee paid by Optimum International Fund to DMC would stay the same at current asset levels. Based upon such facts, the Board believed that the fees to be charged by Baillie Gifford under the Sub-Advisory Agreement were acceptable in relation to the services being provided.
Profitability, economies of scale, and fall-out benefits. Information about Baillie Gifford’s profitability from its relationship with Optimum International Fund was not available because it had not begun to provide services to Optimum International Fund. The Trustees noted that economies of scale are shared with Optimum International Fund and its shareholders through investment management fee breakpoints so that as Optimum International Fund grows in size, its effective investment management fee rate declines. The Board was also provided with information on potential fall-out benefits derived or to be derived by Baillie Gifford in connection with its relationship to Optimum International Fund, such as soft dollar arrangements and commissions paid to affiliated broker/dealers, as applicable.
172
Table of Contents
Board of trustees and officers addendum
Optimum Fund Trust
A mutual fund is governed by a Board of Trustees, which has oversight responsibility for the management of a fund’s business affairs. Trustees establish procedures and oversee and review the performance of the investment manager, the distributor and others that perform services for the fund. The independent fund trustees, in particular, are advocates for shareholder interests. The following is a list of the Trustees and Officers of the Trust with certain background and related information.
| | | | | | | | Number of | | Other |
| | | | | | Principal | | Portfolios in Fund | | Directorships |
| Name, | | Position(s) | | | | Occupation(s) | | Complex1 Overseen | | Held by |
| Address, | | Held with | | Length of Time | | During | | by Trustee | | Trustee |
| and Birth Date | | Fund(s) | | Served | | Past 5 Years | | or Officer | | or Officer |
| INTERESTED TRUSTEES | | | | | | | | | | |
| |
| Brett W. Wright2 | | Trustee, President, and | | Since March 29, 2019 | | Head of Client Solutions Group, Macquarie | | 6 | | None |
| 610 Market Street | | Chief Executive Officer | | | | Investment Management — Americas | | | | |
| Philadelphia, PA 19106 | | | | | | (2016-Present) | | | | |
| February 1970 | | | | | | Head of Third-Party Distribution — Macquarie | | | | |
| | | | | | Investment Management3 | | | | |
| | | | | | (2014-2016) | | | | |
| |
| Robert Pettman2 | | Trustee | | Since June 21, 2019 | | Executive Vice President, Product and Platform | | 6 | | None |
| 610 Market Street | | | | | | Management | | | | |
| Philadelphia, PA 19106 | | | | | | (2005-Present) | | | | |
| June 1979 | | | | | | | | | | |
| |
| INDEPENDENT TRUSTEES | | | | | | | | |
| |
| Robert J. Christian | | Chairman and Trustee | | Chairman since | | Private Investor | | 6 | | Trustee — FundVantage |
| 610 Market Street | | | | March 19, 2009 | | (2006-Present) | | | | Trust (34 mutual funds) |
| Philadelphia, PA 19106 | | | | Trustee since | | | | | | (2007-Present) |
| February 1949 | | | | November 1, 2007 | | | | | | Trustee — Third Avenue |
| | | | | | | | | | Trust (3 mutual funds) |
| | | | | | | | | | (2019-Present) |
| | | | | | | | | | Trustee — Third Avenue |
| | | | | | | | | | Variable Series Trust |
| | | | | | | | | | (1 mutual fund) |
| | | | | | | | | | (2019-Present) |
| |
| Durant Adams Hunter | | Trustee | | Since July 17, 2003 | | Managing Partner — Ridgeway Partners | | 6 | | None |
| 610 Market Street | | | | | | (Executive recruiting) | | | | |
| Philadelphia, PA 19106 | | | | | | (2004-Present) | | | | |
| November 1948 | | | | | | | | | | |
| |
| Pamela J. Moret | | Trustee | | Since October 1, 2013 | | Private Investor | | 6 | | Director — Blue Cross |
| 610 Market Street | | | | | | (2015–Present) | | | | Blue Shield of Minnesota |
| Philadelphia, PA 19106 | | | | | | Chief Executive Officer — brightpeak financial | | | | (2014-Present) |
| February 1956 | | | | | | (2011-2015) | | | | |
| | | | | | Senior Vice President — Thrivent Financial for | | | | |
| | | | | | Lutherans | | | | |
| | | | | | (2002-2015) | | | | |
| |
| Stephen P. Mullin | | Trustee | | Since July 17, 2003 | | President — Econsult Solutions, Inc. (2013- | | 6 | | None |
| 610 Market Street | | | | | | Present) | | | | |
| Philadelphia, PA 19106 | | | | | | | | | | |
| February 1956 | | | | | | | | | | |
| |
| Robert A. Rudell | | Trustee | | Since July 17, 2003 | | Private Investor | | 6 | | Director and Independent |
| 610 Market Street | | | | | | (2002-Present) | | | | Chairman — Heartland |
| Philadelphia, PA 19106 | | | | | | | | | | Funds (3 mutual funds) |
| September 1948 | | | | | | | | | | (2005-Present) |
| |
| Jon Socolofsky | | Trustee | | Since July 17, 2003 | | Private Investor | | 6 | | None |
| 610 Market Street | | | | | | (2002-Present) | | | | |
| Philadelphia, PA 19106 | | | | | | President — H&S Enterprises of Minocqua, | | | | |
| March 1946 | | | | | | LLC (Commercial real estate developer) | | | | |
| | | | | | (2005-2019) | | | | |
Table of Contents
Board of trustees and officers addendum
Optimum Fund Trust
| | | | | | | | Number of | | Other |
| | | | | | Principal | | Portfolios in Fund | | Directorships |
| Name, | | Position(s) | | | | Occupation(s) | | Complex1 Overseen | | Held by |
| Address, | | Held with | | Length of Time | | During | | by Trustee | | Trustee |
| and Birth Date | | Fund(s) | | Served | | Past 5 Years | | or Officer | | or Officer |
| |
| Susan M. Stalnecker | | Trustee | | Since December 14, | | Senior Advisor — Boston Consulting Group | | 6 | | Trustee — Duke University |
| 610 Market Street | | | | 2016 | | (2016-Present) | | | | Health System, Audit |
| Philadelphia, PA 19106 | | | | | | Vice President — Productivity & Shared | | | | Committee member |
| January 1953 | | | | | | Services — E.I. du Pont de Nemours and | | | | (2010-Present) |
| | | | | | Company | | | | Director — Leidos |
| | | | | | (2012-2016) | | | | (2016-Present) |
| | | | | | | | | | Director — Bioventus |
| | | | | | | | | | (2018-Present) |
| |
| OFFICERS | | | | | | | | | | |
| |
| David F. Connor | | Senior Vice President, | | Senior Vice President | | David F. Connor has served in various | | 6 | | None4 |
| 610 Market Street | | General Counsel, and | | since May 2013; General | | capacities at different times at Macquarie | | | | |
| Philadelphia, PA 19106 | | Secretary | | Counsel since May 2015; | | Investment Management.3 | | | | |
| December 1963 | | | | Secretary since October | | | | | | |
| | | | 2005 | | | | | | |
| |
| Daniel V. Geatens | | Senior Vice President, | | Since | | Daniel V. Geatens has served in various | | 6 | | None4 |
| 610 Market Street | | Treasurer, and Chief | | September 20, 2007 | | capacities at different times at Macquarie | | | | |
| Philadelphia, PA 19106 | | Financial Officer | | | | Investment Management.3 | | | | |
| October 1972 | | | | | | | | | | |
| |
| Richard Salus | | Senior Vice President | | Since January 1, 2006 | | Richard Salus has served in various capacities | | 6 | | None4 |
| 610 Market Street | | | | | | at different times at Macquarie Investment | | | | |
| Philadelphia, PA 19106 | | | | | | Management.3 | | | | |
| October 1963 | | | | | | | | | | |
| 1 | The term “Fund Complex” refers to the Funds in the Optimum Fund Trust. |
| 2 | “Interested persons” of the Funds by virtue of their executive and management positions or relationships with the Fund’s service providers or sub-service providers. |
| 3 | Macquarie Investment Management is the marketing name for Macquarie Management Holdings, Inc. and its subsidiaries, including the Fund’s(s’) investment advisor, principal underwriter, and its transfer agent. Mr. Geatens also serves as the Chief financial Officer and Treasurer for Macquarie Global Infrastructure Total Return Fund Inc., which has an affiliated investment manager. |
| 4 | Messrs. Connor, Geatens, and Salus also serve in similar capacities for the Delaware Funds® by Macquarie, a fund complex that has the same manager, principal underwriter, and transfer agent as the Trust. |
The Statement of Additional Information for the Funds includes additional information about the Trustees and Officers and is available, without charge, upon request by calling your financial advisor or 800 914-0278.
174
Table of Contents
About the organization
This annual report is for the information of Optimum Fund Trust shareholders, but it may be used with prospective investors when preceded or accompanied by a current prospectus for Optimum Fund Trust and the fact sheet for the most recently completed calendar quarter. The prospectus sets forth details about charges, expenses, investment objectives, and operating policies of the investment company. You should read the prospectus carefully before you invest. The figures in this report represent past results that are not a guarantee of future results. The return and principal value of an investment in the investment company will fluctuate so that shares, when redeemed, may be worth more or less than their original cost.
| Board of trustees | Affiliated officers | Investment manager |
| | Delaware Management Company, a series |
| Brett Wright | David F. Connor | of Macquarie Investment Management |
| Head of Client Solutions Group, Macquarie | Senior Vice President, | Business Trust, Philadelphia, PA |
| Asset Management – Americas | General Counsel, and Secretary | |
| Optimum Fund Trust | National distributor |
| Robert Pettman | Philadelphia, PA | Delaware Distributors, L.P. |
| Executive Vice President, Product and | | Philadelphia, PA |
| Platform Management | Daniel V. Geatens | |
| Senior Vice President, Treasurer, | Shareholder servicing, dividend |
| Robert J. Christian | and Chief Financial Officer | disbursing, and transfer agent |
| Private Investor | Optimum Fund Trust | Delaware Investments Fund |
| | Philadelphia, PA | Services Company |
| Durant Adams Hunter | | 610 Market Street |
| Managing Partner – Ridgeway Partners | Richard Salus | Philadelphia, PA 19106-2354 |
| Senior Vice President | |
| Pamela J. Moret | Optimum Fund Trust | For shareholders, securities dealers |
| Private Investor | Philadelphia, PA | and financial institutions |
| | representatives |
| Stephen P. Mullin | | 800 914-0278 |
| President – Econsult Solutions, Inc. | | |
| | Website |
| Robert A. Rudell | | optimummutualfunds.com |
| Private Investor | | |
| | | |
| Jon Socolofsky | | |
| Private Investor | | |
| |
| Susan M. Stalnecker | | |
| Senior Advisor – Boston Consulting | | |
| Group | | |
| Each Fund files its complete schedule of portfolio holdings with the Securities and Exchange Commission (SEC) for the first and third quarters of each fiscal year on Form N-PORT. Each Fund’s Forms N-PORT, as well as a description of the policies and procedures that the Funds use to determine how to vote proxies (if any) relating to portfolio securities, are available without charge (i) upon request, by calling 800 914-0278; and (ii) on the SEC’s website at sec.gov. In addition, a description of the policies and procedures that the Funds use to determine how to vote proxies (if any) relating to portfolio securities and the Schedules of Investments included in the Funds’ most recent Form N-PORT are available without charge on the Funds’ website at optimummutualfunds.com/literature. Each Fund’s Forms N-PORT may be reviewed and copied at the SEC’s Public Reference Room in Washington, D.C.; information on the operation of the Public Reference Room may be obtained by calling 800 SEC-0330. Information (if any) regarding how the Funds voted proxies relating to portfolio securities during the most recently disclosed 12-month period ended June 30 is available without charge (i) through the Funds’ website at optimummutualfunds.com/proxy; and (ii) on the SEC’s website at sec.gov. |
175
Item 2. Code of Ethics
The registrant has adopted a code of ethics that applies to the registrant’s principal executive officer, principal financial officer, principal accounting officer or controller, or persons performing similar functions, regardless of whether these individuals are employed by the registrant or a third party. A copy of the registrant’s Code of Business Ethics has been posted on the Optimum Mutual Funds’ Internet Web site at www.optimummutualfunds.com. Any amendments to the Code of Business Ethics, and information on any waiver from its provisions granted by the registrant, will also be posted on this Web site within five business days of such amendment or waiver and will remain on the Web site for at least 12 months.
Item 3. Audit Committee Financial Expert
The registrant’s Board of Trustees/Directors has determined that certain members of the registrant’s Audit Committee are audit committee financial experts, as defined below. For purposes of this item, an “audit committee financial expert” is a person who has the following attributes:
a. An understanding of generally accepted accounting principles and financial statements;
b. The ability to assess the general application of such principles in connection with the accounting for estimates, accruals, and reserves;
c. Experience preparing, auditing, analyzing, or evaluating financial statements that present a breadth and level of complexity of accounting issues that are generally comparable to the breadth and complexity of issues that can reasonably be expected to be raised by the registrant’s financial statements, or experience actively supervising one or more persons engaged in such activities;
d. An understanding of internal controls and procedures for financial reporting; and
e. An understanding of audit committee functions.
An “audit committee financial expert” shall have acquired such attributes through:
a. Education and experience as a principal financial officer, principal accounting officer, controller, public accountant, or auditor or experience in one or more positions that involve the performance of similar functions;
b. Experience actively supervising a principal financial officer, principal accounting officer, controller, public accountant, auditor, or person performing similar functions;
c. Experience overseeing or assessing the performance of companies or public accountants with respect to the preparation, auditing, or evaluation of financial statements; or
d. Other relevant experience.
The registrant’s Board of Trustees/Directors has also determined that each member of the registrant’s Audit Committee is independent. In order to be “independent” for purposes of this item, the Audit Committee member may not: (i) other than in his or her capacity as a member of the Board of Trustees/Directors or any committee thereof, accept directly or indirectly any consulting, advisory or other compensatory fee from the issuer; or (ii) be an “interested person” of the registrant as defined in Section 2(a)(19) of the Investment Company Act of 1940.
The names of the audit committee financial experts on the registrant’s Audit Committee are set forth below:
Robert J. Christian
Robert A. Rudell
Jon E. Socolofsky
Susan M. Stalnecker
Item 4. Principal Accountant Fees and Services
(a) Audit fees.
The aggregate fees billed for services provided to the registrant by its independent auditors for the audit of the registrant’s annual financial statements and for services normally provided by the independent auditors in connection with statutory and regulatory filings or engagements were $159,180 for the fiscal year ended March 31, 2021.
The aggregate fees billed for services provided to the registrant by its independent auditors for the audit of the registrant’s annual financial statements and for services normally provided by the independent auditors in connection with statutory and regulatory filings or engagements were $159,155 for the fiscal year ended March 31, 2020.
(b) Audit-related fees.
The aggregate fees billed by the registrant’s independent auditors for services relating to the performance of the audit of the registrant’s financial statements and not reported under paragraph (a) of this Item were $0 for the fiscal year ended March 31, 2021.
The aggregate fees billed by the registrant’s independent auditors for services relating to the performance of the audit of the financial statements of the registrant’s investment adviser and other service providers under common control with the adviser and that relate directly to the operations or financial reporting of the registrant were $903,282 for the registrant’s fiscal year ended March 31, 2021. The percentage of these fees relating to services approved by the registrant’s Audit Committee pursuant to the de minimis exception from the pre-approval requirement in Rule 2-01(c)(7)(i)(C) of Regulation S-X was 0%. These audit-related services were as follows: year-end audit procedures; group reporting and subsidiary statutory audits.
The aggregate fees billed by the registrant’s independent auditors for services relating to the performance of the audit of the registrant’s financial statements and not reported under paragraph (a) of this Item were $0 for the fiscal year ended March 31, 2020.
The aggregate fees billed by the registrant’s independent auditors for services relating to the performance of the audit of the financial statements of the registrant’s investment adviser and other service providers under common control with the adviser and that relate directly to the operations or financial reporting of the registrant were $909,000 for the registrant’s fiscal year ended March 31, 2020. The percentage of these fees relating to services approved by the registrant’s Audit Committee pursuant to the de minimis exception from the pre-approval requirement in Rule 2-01(c)(7)(i)(C) of Regulation S-X was 0%. These audit-related services were as follows: year end audit procedures; group reporting and subsidiary statutory audits.
(c) Tax fees.
The aggregate fees billed by the registrant’s independent auditors for tax-related services provided to the registrant were $29,175 for the fiscal year ended March 31, 2021. The percentage of these fees relating to services approved by the registrant’s Audit Committee pursuant to the de minimis exception from the pre-approval requirement in Rule 2-01(c)(7)(i)(C) of Regulation S-X was 0%. These tax-related services were as follows: review of income tax returns and review of annual excise distribution calculations.
The aggregate fees billed by the registrant’s independent auditors for tax-related services provided to the registrant’s investment adviser and other service providers under common control with the adviser and that relate directly to the operations or financial reporting of the registrant were $0 for the registrant’s fiscal year ended March 31, 2021.
The aggregate fees billed by the registrant’s independent auditors for tax-related services provided to the registrant were $29,175 for the fiscal year ended March 31, 2020. The percentage of these fees relating to services approved by the registrant’s Audit Committee pursuant to the de minimis exception from the pre-approval requirement in Rule 2-01(c)(7)(i)(C) of Regulation S-X was 0%. These tax-related services were as follows: review of income tax returns and review of annual excise distribution calculations.
The aggregate fees billed by the registrant’s independent auditors for tax-related services provided to the registrant’s investment adviser and other service providers under common control with the adviser and that relate directly to the operations or financial reporting of the registrant were $0 for the registrant’s fiscal year ended March 31, 2020.
(d) All other fees.
The aggregate fees billed for all services provided by the independent auditors to the registrant other than those set forth in paragraphs (a), (b) and (c) of this Item were $0 for the fiscal year ended March 31, 2021.
The aggregate fees billed for all services other than those set forth in paragraphs (b) and (c) of this Item provided by the registrant’s independent auditors to the registrant’s adviser and other service providers under common control with the adviser and that relate directly to the operations or financial reporting of the registrant were $0 for the registrant’s fiscal year ended March 31, 2021. The percentage of these fees relating to services approved by the registrant’s Audit Committee pursuant to the de minimis exception from the pre-approval requirement in Rule 2-01(c)(7)(i)(C) of Regulation S-X was 0%.
The aggregate fees billed for all services provided by the independent auditors to the registrant other than those set forth in paragraphs (a), (b) and (c) of this Item were $0 for the fiscal year ended March 31, 2019.
The aggregate fees billed for all services other than those set forth in paragraphs (b) and (c) of this Item provided by the registrant’s independent auditors to the registrant’s adviser and other service providers under common control with the adviser and that relate directly to the operations or financial reporting of the registrant were $0 for the registrant’s fiscal year ended March 31, 2020. The percentage of these fees relating to services approved by the registrant’s Audit Committee pursuant to the de minimis exception from the pre-approval requirement in Rule 2-01(c)(7)(i)(C) of Regulation S-X was 0%.
(e) The registrant’s Audit Committee has established pre-approval policies and procedures as permitted by Rule 2-01(c)(7)(i)(B) of Regulation S-X (the “Pre-Approval Policy”) with respect to services provided by the registrant’s independent auditors. Pursuant to the Pre-Approval Policy, the Audit Committee has pre-approved the services set forth in the table below with respect to the registrant up to the specified fee limits. Certain fee limits are based on aggregate fees to the registrant and other registrants within the Optimum Fund Trust.
| Service | Range of Fees |
| Audit Services | |
| Statutory audits or financial audits for new Funds | up to $50,000 per Fund |
Services associated with SEC registration statements (e.g., Form N-1A, Form N-14, etc.), periodic reports and other documents filed with the SEC or other documents issued in connection with securities offerings (e.g., comfort letters for closed-end Fund offerings, consents), and assistance in responding to SEC comment letters | up to $10,000 per Fund |
Consultations by Fund management as to the accounting or disclosure treatment of transactions or events and/or the actual or potential impact of final or proposed rules, standards or interpretations by the SEC, FASB, or other regulatory or standard-setting bodies (Note: Under SEC rules, some consultations may be considered “audit-related services” rather than “audit services”) | up to $25,000 in the aggregate |
Audit-Related Services | |
Consultations by Fund management as to the accounting or disclosure treatment of transactions or events and /or the actual or potential impact of final or proposed rules, standards or interpretations by the SEC, FASB, or other regulatory or standard-setting bodies (Note: Under SEC rules, some consultations may be considered “audit services” rather than “audit-related services”) | up to $25,000 in the aggregate |
Tax Services | |
U.S. federal, state and local and international tax planning and advice (e.g., consulting on statutory, regulatory or administrative developments, evaluation of Funds’ tax compliance function, etc.) | up to $25,000 in the aggregate |
U.S. federal, state and local tax compliance (e.g., excise distribution reviews, etc.) | up to $5,000 per Fund |
Review of federal, state, local and international income, franchise and other tax returns | up to $5,000 per Fund |
Under the Pre-Approval Policy, the Audit Committee has also pre-approved the services set forth in the table below with respect to the registrant’s investment adviser and other entities controlling, controlled by or under common control with the investment adviser that provide ongoing services to the registrant (the “Control Affiliates”) up to the specified fee limit. This fee limit is based on aggregate fees to the investment adviser and its Control Affiliates.
| Service | Range of Fees |
| Non-Audit Services | |
| Services associated with periodic reports and other documents filed with the SEC and assistance in responding to SEC comment letters | up to $10,000 in the aggregate |
The Pre-Approval Policy requires the registrant’s independent auditors to report to the Audit Committee at each of its regular meetings regarding all services initiated since the last such report was rendered, including those services authorized by the Pre-Approval Policy.
(f) Not applicable.
(g) The aggregate non-audit fees billed by the registrant’s independent auditors for services rendered to the registrant and to its investment adviser and other service providers under common control with the adviser were $8,455,000 and $4,687,000 for the registrant’s fiscal years ended March 31, 2021 and March 31, 2020, respectively.
(h) In connection with its selection of the independent auditors, the registrant’s Audit Committee has considered the independent auditors’ provision of non-audit services to the registrant’s investment adviser and other service providers under common control with the adviser that were not required to be pre-approved pursuant to Rule 2-01(c)(7)(ii) of Regulation S-X. The Audit Committee has determined that the independent auditors’ provision of these services is compatible with maintaining the auditors’ independence.
Item 5. Audit Committee of Listed Registrants
Not applicable.
Item 6. Investments
(a) Included as part of report to shareholders filed under Item 1 of this Form N-CSR.
(b) Divestment of securities in accordance with Section 13(c) of the Investment Company Act of 1940.
Not applicable.
Item 7. Disclosure of Proxy Voting Policies and Procedures for Closed-End Management Investment Companies
Not applicable.
Item 8. Portfolio Managers of Closed-End Management Investment Companies
Not applicable.
Item 9. Purchases of Equity Securities by Closed-End Management Investment Company and Affiliated Purchasers
Not applicable.
Item 10. Submission of Matters to a Vote of Security Holders
Not applicable.
Item 11. Controls and Procedures
The registrant’s principal executive officer and principal financial officer have evaluated the registrant’s disclosure controls and procedures within 90 days of the filing of this report and have concluded that they are effective in providing reasonable assurance that the information required to be disclosed by the registrant in its reports or statements filed under the Securities Exchange Act of 1934 is recorded, processed, summarized and reported within the time periods specified in the rules and forms of the Securities and Exchange Commission.
There were no significant changes in the registrant’s internal control over financial reporting that occurred during the second fiscal quarter of the period covered by the report to stockholders included herein (i.e., the registrant’s fourth fiscal quarter) that have materially affected, or are reasonably likely to materially affect, the registrant’s internal control over financial reporting.
Item 12. Disclosure of Securities Lending Activities for Closed-End Management Investment Companies
Not applicable
Item 13. Exhibits
(a) (1) Code of Ethics
Not applicable.
(2) Certifications of Principal Executive Officer and Principal Financial Officer pursuant to Rule 30a-2 under the Investment Company Act of 1940 are attached hereto as Exhibit 99.CERT.
(3) Written solicitations to purchase securities pursuant to Rule 23c-1 under the Securities Exchange Act of 1934.
Not applicable.
(b) Certifications pursuant to Section 906 of the Sarbanes-Oxley Act of 2002 are furnished herewith as Exhibit 99.906CERT.
SIGNATURES
Pursuant to the requirements of the Securities Exchange Act of 1934 and the Investment Company Act of 1940, the registrant has duly caused this report to be signed on its behalf, by the undersigned, thereunto duly authorized.
OPTIMUM FUND TRUST
| BRETT W. WRIGHT |
| By: | Brett W. Wright |
| Title: | President and Chief Executive Officer |
| Date: | June 4, 2021 |
Pursuant to the requirements of the Securities Exchange Act of 1934 and the Investment Company Act of 1940, this report has been signed below by the following persons on behalf of the registrant and in the capacities and on the dates indicated.
| BRETT W. WRIGHT |
| By: | Brett W. Wright |
| Title: | President and Chief Executive Officer |
| Date: | June 4, 2021 |
| |
| DANIEL V. GEATENS |
| By: | Daniel V. Geatens |
| Title: | Chief Financial Officer |
| Date: | June 4, 2021 |