SCHEDULE 14A
(Rule 14a-101)
INFORMATION REQUIRED IN PROXY STATEMENT
SCHEDULE 14A INFORMATION
Proxy Statement Pursuant to Section 14(a) of the
Securities Exchange Act of 1934
(Amendment No. )
Filed by the Registrant ☒ Filed by a Party other than the Registrant ☐
Check the appropriate box:
| | |
| ☐ | | Preliminary Proxy Statement |
| |
| ☐ | | Confidential, for Use of the Commission Only (as permitted by Rule 14a-6(e)(2)) |
| |
| ☐ | | Definitive Proxy Statement |
| |
| ☒ | | Definitive Additional Materials |
| |
| ☐ | | Soliciting Material Pursuant to Section 240.14a-11(c) or Section 240.14a-12 |
WESTERN ASSET GLOBAL HIGH INCOME FUND INC.
(Name of Registrant as Specified in Its Charter)
Payment of Filing Fee (Check the appropriate box):
| | | | |
| |
| ☒ | | No fee required. |
| |
| ☐ | | Fee computed on table below per Exchange Act Rules 14a-6(i)(1) and 0-11. |
| | |
| | (1) | | Title of each class of securities to which transaction applies: |
| | (2) | | Aggregate number of securities to which transaction applies: |
| | (3) | | Per unit price or other underlying value of transaction computed pursuant to Exchange Act Rule 0-11 (set forth the amount on which the filing fee is calculated and state how it was determined): |
| | (4) | | Proposed maximum aggregate value of transaction: |
| | (5) | | Total fee paid: |
| |
| ☐ | | Fee paid previously with preliminary materials. |
| |
| ☐ | | Check box if any part of the fee is offset as provided by Exchange Act Rule 0-11(a)(2) and identify the filing for which the offsetting fee was paid previously. Identify the previous filing by the registration statement number, or the Form or Schedule and the date of its filing. |
| | |
| | (1) | | Amount Previously Paid: |
| | (2) | | Form, Schedule or Registration Statement No.: |
| | (3) | | Filing Party: |
| | (4) | | Date Filed: |
Western Asset Global High Income Fund (EHI) & Western Asset High Income Fund II (HIX) Consistent Track Record of Delivering Strong Stockholder Returns OCTOBER 2019 1Western Asset Global High Income Fund (EHI) & Western Asset High Income Fund II (HIX) Consistent Track Record of Delivering Strong Stockholder Returns OCTOBER 2019 1
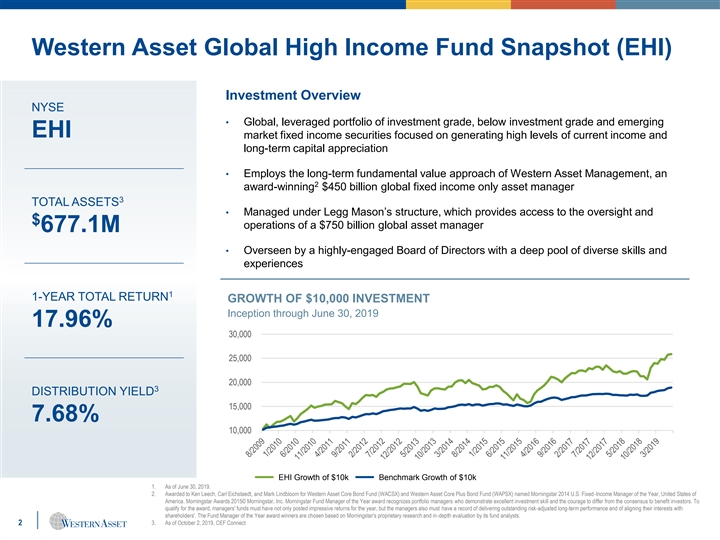
Western Asset Global High Income Fund Snapshot (EHI) Investment Overview NYSE • Global, leveraged portfolio of investment grade, below investment grade and emerging EHI market fixed income securities focused on generating high levels of current income and long-term capital appreciation • Employs the long-term fundamental value approach of Western Asset Management, an 2 award-winning $450 billion global fixed income only asset manager 3 TOTAL ASSETS • Managed under Legg Mason’s structure, which provides access to the oversight and $ operations of a $750 billion global asset manager 677.1M • Overseen by a highly-engaged Board of Directors with a deep pool of diverse skills and experiences 1 1-YEAR TOTAL RETURN GROWTH OF $10,000 INVESTMENT Inception through June 30, 2019 17.96% 30,000 25,000 20,000 3 DISTRIBUTION YIELD 15,000 7.68% 10,000 EHI Growth of $10k Benchmark Growth of $10k 1. As of June 30, 2019. 2. Awarded to Ken Leech, Carl Eichstaedt, and Mark Lindbloom for Western Asset Core Bond Fund (WACSX) and Western Asset Core Plus Bond Fund (WAPSX) named Morningstar 2014 U.S. Fixed-Income Manager of the Year, United States of America. Morningstar Awards 2015© Morningstar, Inc. Morningstar Fund Manager of the Year award recognizes portfolio managers who demonstrate excellent investment skill and the courage to differ from the consensus to benefit investors. To qualify for the award, managers' funds must have not only posted impressive returns for the year, but the managers also must have a record of delivering outstanding risk-adjusted long-term performance and of aligning their interests with shareholders'. The Fund Manager of the Year award winners are chosen based on Morningstar's proprietary research and in-depth evaluation by its fund analysts. 2 3. As of October 2, 2019, CEF ConnectWestern Asset Global High Income Fund Snapshot (EHI) Investment Overview NYSE • Global, leveraged portfolio of investment grade, below investment grade and emerging EHI market fixed income securities focused on generating high levels of current income and long-term capital appreciation • Employs the long-term fundamental value approach of Western Asset Management, an 2 award-winning $450 billion global fixed income only asset manager 3 TOTAL ASSETS • Managed under Legg Mason’s structure, which provides access to the oversight and $ operations of a $750 billion global asset manager 677.1M • Overseen by a highly-engaged Board of Directors with a deep pool of diverse skills and experiences 1 1-YEAR TOTAL RETURN GROWTH OF $10,000 INVESTMENT Inception through June 30, 2019 17.96% 30,000 25,000 20,000 3 DISTRIBUTION YIELD 15,000 7.68% 10,000 EHI Growth of $10k Benchmark Growth of $10k 1. As of June 30, 2019. 2. Awarded to Ken Leech, Carl Eichstaedt, and Mark Lindbloom for Western Asset Core Bond Fund (WACSX) and Western Asset Core Plus Bond Fund (WAPSX) named Morningstar 2014 U.S. Fixed-Income Manager of the Year, United States of America. Morningstar Awards 2015© Morningstar, Inc. Morningstar Fund Manager of the Year award recognizes portfolio managers who demonstrate excellent investment skill and the courage to differ from the consensus to benefit investors. To qualify for the award, managers' funds must have not only posted impressive returns for the year, but the managers also must have a record of delivering outstanding risk-adjusted long-term performance and of aligning their interests with shareholders'. The Fund Manager of the Year award winners are chosen based on Morningstar's proprietary research and in-depth evaluation by its fund analysts. 2 3. As of October 2, 2019, CEF Connect
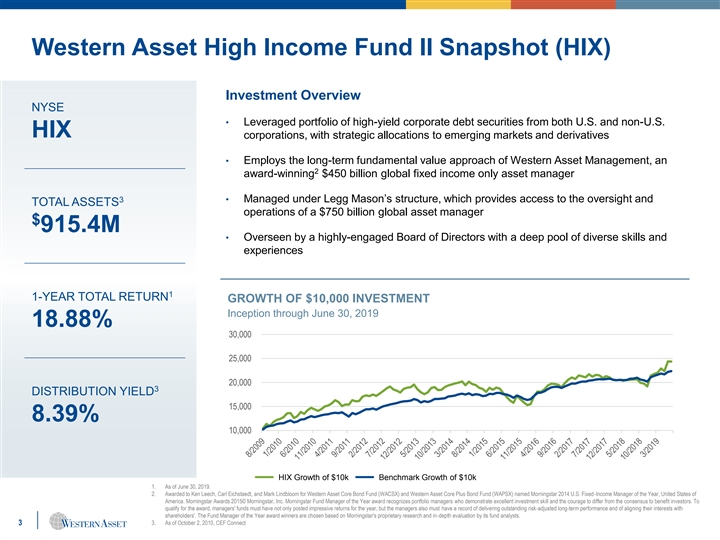
Western Asset High Income Fund II Snapshot (HIX) Investment Overview NYSE • Leveraged portfolio of high-yield corporate debt securities from both U.S. and non-U.S. HIX corporations, with strategic allocations to emerging markets and derivatives • Employs the long-term fundamental value approach of Western Asset Management, an 2 award-winning $450 billion global fixed income only asset manager 3 • Managed under Legg Mason’s structure, which provides access to the oversight and TOTAL ASSETS operations of a $750 billion global asset manager $ 915.4M • Overseen by a highly-engaged Board of Directors with a deep pool of diverse skills and experiences 1 1-YEAR TOTAL RETURN GROWTH OF $10,000 INVESTMENT Inception through June 30, 2019 18.88% 30,000 25,000 20,000 3 DISTRIBUTION YIELD 15,000 8.39% 10,000 HIX Growth of $10k Benchmark Growth of $10k 1. As of June 30, 2019. 2. Awarded to Ken Leech, Carl Eichstaedt, and Mark Lindbloom for Western Asset Core Bond Fund (WACSX) and Western Asset Core Plus Bond Fund (WAPSX) named Morningstar 2014 U.S. Fixed-Income Manager of the Year, United States of America. Morningstar Awards 2015© Morningstar, Inc. Morningstar Fund Manager of the Year award recognizes portfolio managers who demonstrate excellent investment skill and the courage to differ from the consensus to benefit investors. To qualify for the award, managers' funds must have not only posted impressive returns for the year, but the managers also must have a record of delivering outstanding risk-adjusted long-term performance and of aligning their interests with shareholders'. The Fund Manager of the Year award winners are chosen based on Morningstar's proprietary research and in-depth evaluation by its fund analysts. 3 3. As of October 2, 2010, CEF ConnectWestern Asset High Income Fund II Snapshot (HIX) Investment Overview NYSE • Leveraged portfolio of high-yield corporate debt securities from both U.S. and non-U.S. HIX corporations, with strategic allocations to emerging markets and derivatives • Employs the long-term fundamental value approach of Western Asset Management, an 2 award-winning $450 billion global fixed income only asset manager 3 • Managed under Legg Mason’s structure, which provides access to the oversight and TOTAL ASSETS operations of a $750 billion global asset manager $ 915.4M • Overseen by a highly-engaged Board of Directors with a deep pool of diverse skills and experiences 1 1-YEAR TOTAL RETURN GROWTH OF $10,000 INVESTMENT Inception through June 30, 2019 18.88% 30,000 25,000 20,000 3 DISTRIBUTION YIELD 15,000 8.39% 10,000 HIX Growth of $10k Benchmark Growth of $10k 1. As of June 30, 2019. 2. Awarded to Ken Leech, Carl Eichstaedt, and Mark Lindbloom for Western Asset Core Bond Fund (WACSX) and Western Asset Core Plus Bond Fund (WAPSX) named Morningstar 2014 U.S. Fixed-Income Manager of the Year, United States of America. Morningstar Awards 2015© Morningstar, Inc. Morningstar Fund Manager of the Year award recognizes portfolio managers who demonstrate excellent investment skill and the courage to differ from the consensus to benefit investors. To qualify for the award, managers' funds must have not only posted impressive returns for the year, but the managers also must have a record of delivering outstanding risk-adjusted long-term performance and of aligning their interests with shareholders'. The Fund Manager of the Year award winners are chosen based on Morningstar's proprietary research and in-depth evaluation by its fund analysts. 3 3. As of October 2, 2010, CEF Connect

Delivering on the Fund’s Investment Objectives (EHI) • Increased the Fund’s distribution payout each of the last three quarters 1 • 5-year average annualized yield of 8.40% is above the Lipper peer group average of 8.03% as of Driving High August 31, 2019 Current Income • Recently announced an increase in dividends that would raise distribution yield from 7.75% as of August 31, 2019 to 7.82% at the August 31, 2019 market price 2 1 3 • Outperformed Lipper peer group averages over 1-, 3- and 5-year periods, and key benchmark Generating Strong averages over 1-, 3- and 10-year periods on a market price basis Total Stockholder • 10.8% annualized market price return and a 9.5% annualized net asset value return over 10-year Returns 4 period • Taking steps to help narrow the discount Reducing Discount Between Stock • Reduced discount by almost 50% since the start of the year Price and NAV • Completed re-purchase of over $10.1 million in shares outstanding • Comprises eight highly-qualified members: seven are independent, half are women Experienced, Independent and • Committed to ongoing refreshment; added a new independent director in the beginning of 2019; 50% of the Board is new as of 2013 Diverse Board of Directors • Board regularly evaluates opportunities to reduce NAV discount Highly-Engaged Board Overseeing the Successful Execution of Our Strategy to Drive Strong Distributions and Stockholder Returns 1. The Funds’ Lipper peer group refers to the peer group of high-yield, levered closed-end funds as selected by Lipper, an independent nationally recognized provider of investment company information. 2. The Funds’ performance is based on the price of the Fund’s securities, which are listed for trading on the NYSE. 3. The benchmark is based on a blend, in equal parts, of the Bloomberg Barclays U.S. Corporate High Yield — 2% Issuer Cap Index, the Bloomberg Barclays U.S. Aggregate Index, and the JPMorgan Emerging Markets Bond Index Global (EMBI Global). Please note that an investor cannot invest directly in an index. Additional information about the indexes can be found in the Fund’s annual shareholder report. Additional information about the Fund’s performance and about the history of the Board and 4 the Fund’s management generating strong investor returns is included in the Fund’s Proxy Statement and in the Fund’s annual shareholder report. 4. As of June 30, 2019.Delivering on the Fund’s Investment Objectives (EHI) • Increased the Fund’s distribution payout each of the last three quarters 1 • 5-year average annualized yield of 8.40% is above the Lipper peer group average of 8.03% as of Driving High August 31, 2019 Current Income • Recently announced an increase in dividends that would raise distribution yield from 7.75% as of August 31, 2019 to 7.82% at the August 31, 2019 market price 2 1 3 • Outperformed Lipper peer group averages over 1-, 3- and 5-year periods, and key benchmark Generating Strong averages over 1-, 3- and 10-year periods on a market price basis Total Stockholder • 10.8% annualized market price return and a 9.5% annualized net asset value return over 10-year Returns 4 period • Taking steps to help narrow the discount Reducing Discount Between Stock • Reduced discount by almost 50% since the start of the year Price and NAV • Completed re-purchase of over $10.1 million in shares outstanding • Comprises eight highly-qualified members: seven are independent, half are women Experienced, Independent and • Committed to ongoing refreshment; added a new independent director in the beginning of 2019; 50% of the Board is new as of 2013 Diverse Board of Directors • Board regularly evaluates opportunities to reduce NAV discount Highly-Engaged Board Overseeing the Successful Execution of Our Strategy to Drive Strong Distributions and Stockholder Returns 1. The Funds’ Lipper peer group refers to the peer group of high-yield, levered closed-end funds as selected by Lipper, an independent nationally recognized provider of investment company information. 2. The Funds’ performance is based on the price of the Fund’s securities, which are listed for trading on the NYSE. 3. The benchmark is based on a blend, in equal parts, of the Bloomberg Barclays U.S. Corporate High Yield — 2% Issuer Cap Index, the Bloomberg Barclays U.S. Aggregate Index, and the JPMorgan Emerging Markets Bond Index Global (EMBI Global). Please note that an investor cannot invest directly in an index. Additional information about the indexes can be found in the Fund’s annual shareholder report. Additional information about the Fund’s performance and about the history of the Board and 4 the Fund’s management generating strong investor returns is included in the Fund’s Proxy Statement and in the Fund’s annual shareholder report. 4. As of June 30, 2019.
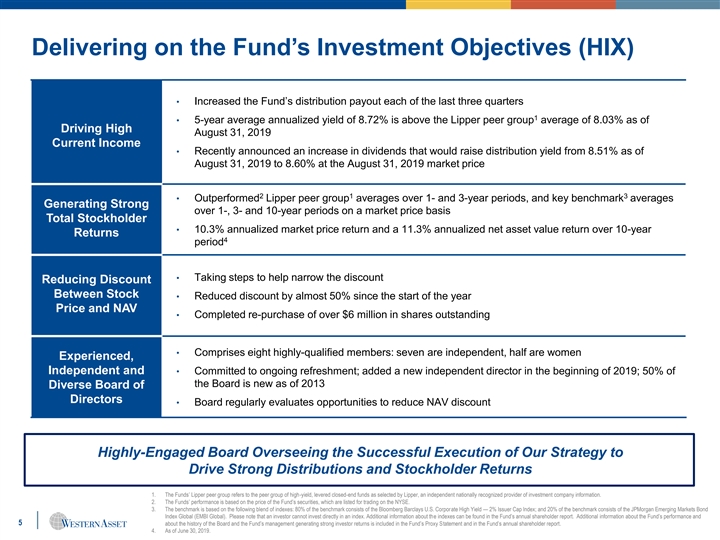
Delivering on the Fund’s Investment Objectives (HIX) • Increased the Fund’s distribution payout each of the last three quarters 1 • 5-year average annualized yield of 8.72% is above the Lipper peer group average of 8.03% as of Driving High August 31, 2019 Current Income • Recently announced an increase in dividends that would raise distribution yield from 8.51% as of August 31, 2019 to 8.60% at the August 31, 2019 market price 2 1 3 • Outperformed Lipper peer group averages over 1- and 3-year periods, and key benchmark averages Generating Strong over 1-, 3- and 10-year periods on a market price basis Total Stockholder • 10.3% annualized market price return and a 11.3% annualized net asset value return over 10-year Returns 4 period • Taking steps to help narrow the discount Reducing Discount Between Stock • Reduced discount by almost 50% since the start of the year Price and NAV • Completed re-purchase of over $6 million in shares outstanding • Comprises eight highly-qualified members: seven are independent, half are women Experienced, Independent and • Committed to ongoing refreshment; added a new independent director in the beginning of 2019; 50% of the Board is new as of 2013 Diverse Board of Directors • Board regularly evaluates opportunities to reduce NAV discount Highly-Engaged Board Overseeing the Successful Execution of Our Strategy to Drive Strong Distributions and Stockholder Returns 1. The Funds’ Lipper peer group refers to the peer group of high-yield, levered closed-end funds as selected by Lipper, an independent nationally recognized provider of investment company information. 2. The Funds’ performance is based on the price of the Fund’s securities, which are listed for trading on the NYSE. 3. The benchmark is based on the following blend of indexes: 80% of the benchmark consists of the Bloomberg Barclays U.S. Corporate High Yield — 2% Issuer Cap Index; and 20% of the benchmark consists of the JPMorgan Emerging Markets Bond Index Global (EMBI Global). Please note that an investor cannot invest directly in an index. Additional information about the indexes can be found in the Fund’s annual shareholder report. Additional information about the Fund’s performance and 5 about the history of the Board and the Fund’s management generating strong investor returns is included in the Fund’s Proxy Statement and in the Fund’s annual shareholder report. 4. As of June 30, 2019.Delivering on the Fund’s Investment Objectives (HIX) • Increased the Fund’s distribution payout each of the last three quarters 1 • 5-year average annualized yield of 8.72% is above the Lipper peer group average of 8.03% as of Driving High August 31, 2019 Current Income • Recently announced an increase in dividends that would raise distribution yield from 8.51% as of August 31, 2019 to 8.60% at the August 31, 2019 market price 2 1 3 • Outperformed Lipper peer group averages over 1- and 3-year periods, and key benchmark averages Generating Strong over 1-, 3- and 10-year periods on a market price basis Total Stockholder • 10.3% annualized market price return and a 11.3% annualized net asset value return over 10-year Returns 4 period • Taking steps to help narrow the discount Reducing Discount Between Stock • Reduced discount by almost 50% since the start of the year Price and NAV • Completed re-purchase of over $6 million in shares outstanding • Comprises eight highly-qualified members: seven are independent, half are women Experienced, Independent and • Committed to ongoing refreshment; added a new independent director in the beginning of 2019; 50% of the Board is new as of 2013 Diverse Board of Directors • Board regularly evaluates opportunities to reduce NAV discount Highly-Engaged Board Overseeing the Successful Execution of Our Strategy to Drive Strong Distributions and Stockholder Returns 1. The Funds’ Lipper peer group refers to the peer group of high-yield, levered closed-end funds as selected by Lipper, an independent nationally recognized provider of investment company information. 2. The Funds’ performance is based on the price of the Fund’s securities, which are listed for trading on the NYSE. 3. The benchmark is based on the following blend of indexes: 80% of the benchmark consists of the Bloomberg Barclays U.S. Corporate High Yield — 2% Issuer Cap Index; and 20% of the benchmark consists of the JPMorgan Emerging Markets Bond Index Global (EMBI Global). Please note that an investor cannot invest directly in an index. Additional information about the indexes can be found in the Fund’s annual shareholder report. Additional information about the Fund’s performance and 5 about the history of the Board and the Fund’s management generating strong investor returns is included in the Fund’s Proxy Statement and in the Fund’s annual shareholder report. 4. As of June 30, 2019.

Board has Overseen Delivery of Strong Total Stockholder Returns (EHI)… 1 Total Returns 18% 18% The Fund has 2 outperformed Lipper 3 peer group 12% 12% averages and 4 benchmarks across 6% 6% key timeframes 0% 0% 1 Year 3 Years 10 Years 1 Year 3 Years 5 Years EHI Performance Lipper Peer Group Performance EHI Performance Benchmark Performance … And Consistent Above-Market Distributions… The Fund actively Delivered average Increased the Fund’s Maintains a higher- maintains a high-quality annualized distribution payout quality portfolio 5 portfolio, which results distribution of 8.40% each of the last three than the average Levered in relatively steady over the last five years, quarters High Yield Closed End distributions to greater than the peer Fund due to the 3 stockholders over time group yield of 8.03% Investment Grade over the same period component of its index 1. As of June 30, 2019. 2. The Fund’s performance is based on the price of the Fund’s securities, which are listed for trading on the NYSE. 3. The Fund’s Lipper peer group refers to the peer group of high-yield, levered closed-end funds as selected by Lipper, an independent nationally recognized provider of investment company information. 4. The benchmark is based on a blend, in equal parts, of the Bloomberg Barclays U.S. Corporate High Yield — 2% Issuer Cap Index, the Bloomberg Barclays U.S. Aggregate Index, and the JPMorgan Emerging Markets Bond Index Global (EMBI Global). Please note that an investor cannot invest directly in an index. Additional information about the indexes can be found in the Fund’s annual shareholder report. Additional information about the Fund’s performance and about the history of the Board and 6 the Fund’s management generating strong investor returns is included in the Fund’s Proxy Statement and in the Fund’s annual shareholder report. 5. As of August 31, 2019.Board has Overseen Delivery of Strong Total Stockholder Returns (EHI)… 1 Total Returns 18% 18% The Fund has 2 outperformed Lipper 3 peer group 12% 12% averages and 4 benchmarks across 6% 6% key timeframes 0% 0% 1 Year 3 Years 10 Years 1 Year 3 Years 5 Years EHI Performance Lipper Peer Group Performance EHI Performance Benchmark Performance … And Consistent Above-Market Distributions… The Fund actively Delivered average Increased the Fund’s Maintains a higher- maintains a high-quality annualized distribution payout quality portfolio 5 portfolio, which results distribution of 8.40% each of the last three than the average Levered in relatively steady over the last five years, quarters High Yield Closed End distributions to greater than the peer Fund due to the 3 stockholders over time group yield of 8.03% Investment Grade over the same period component of its index 1. As of June 30, 2019. 2. The Fund’s performance is based on the price of the Fund’s securities, which are listed for trading on the NYSE. 3. The Fund’s Lipper peer group refers to the peer group of high-yield, levered closed-end funds as selected by Lipper, an independent nationally recognized provider of investment company information. 4. The benchmark is based on a blend, in equal parts, of the Bloomberg Barclays U.S. Corporate High Yield — 2% Issuer Cap Index, the Bloomberg Barclays U.S. Aggregate Index, and the JPMorgan Emerging Markets Bond Index Global (EMBI Global). Please note that an investor cannot invest directly in an index. Additional information about the indexes can be found in the Fund’s annual shareholder report. Additional information about the Fund’s performance and about the history of the Board and 6 the Fund’s management generating strong investor returns is included in the Fund’s Proxy Statement and in the Fund’s annual shareholder report. 5. As of August 31, 2019.
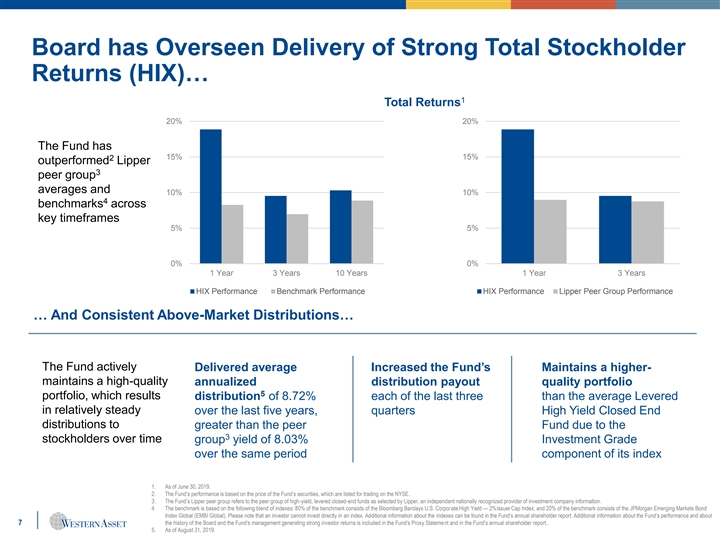
Board has Overseen Delivery of Strong Total Stockholder Returns (HIX)… 1 Total Returns 20% 20% The Fund has 15% 15% 2 outperformed Lipper 3 peer group averages and 10% 10% 4 benchmarks across key timeframes 5% 5% 0% 0% 1 Year 3 Years 10 Years 1 Year 3 Years HIX Performance Benchmark Performance HIX Performance Lipper Peer Group Performance … And Consistent Above-Market Distributions… The Fund actively Delivered average Increased the Fund’s Maintains a higher- maintains a high-quality annualized distribution payout quality portfolio 5 portfolio, which results distribution of 8.72% each of the last three than the average Levered in relatively steady over the last five years, quarters High Yield Closed End distributions to greater than the peer Fund due to the 3 stockholders over time group yield of 8.03% Investment Grade over the same period component of its index 1. As of June 30, 2019. 2. The Fund’s performance is based on the price of the Fund’s securities, which are listed for trading on the NYSE. 3. The Fund’s Lipper peer group refers to the peer group of high-yield, levered closed-end funds as selected by Lipper, an independent nationally recognized provider of investment company information. 4. The benchmark is based on the following blend of indexes: 80% of the benchmark consists of the Bloomberg Barclays U.S. Corporate High Yield — 2%Issuer Cap Index; and 20% of the benchmark consists of the JPMorgan Emerging Markets Bond Index Global (EMBI Global). Please note that an investor cannot invest directly in an index. Additional information about the indexes can be found in the Fund’s annual shareholder report. Additional information about the Fund’s performance and about 7 the history of the Board and the Fund’s management generating strong investor returns is included in the Fund’s Proxy Statement and in the Fund’s annual shareholder report.. 5. As of August 31, 2019.Board has Overseen Delivery of Strong Total Stockholder Returns (HIX)… 1 Total Returns 20% 20% The Fund has 15% 15% 2 outperformed Lipper 3 peer group averages and 10% 10% 4 benchmarks across key timeframes 5% 5% 0% 0% 1 Year 3 Years 10 Years 1 Year 3 Years HIX Performance Benchmark Performance HIX Performance Lipper Peer Group Performance … And Consistent Above-Market Distributions… The Fund actively Delivered average Increased the Fund’s Maintains a higher- maintains a high-quality annualized distribution payout quality portfolio 5 portfolio, which results distribution of 8.72% each of the last three than the average Levered in relatively steady over the last five years, quarters High Yield Closed End distributions to greater than the peer Fund due to the 3 stockholders over time group yield of 8.03% Investment Grade over the same period component of its index 1. As of June 30, 2019. 2. The Fund’s performance is based on the price of the Fund’s securities, which are listed for trading on the NYSE. 3. The Fund’s Lipper peer group refers to the peer group of high-yield, levered closed-end funds as selected by Lipper, an independent nationally recognized provider of investment company information. 4. The benchmark is based on the following blend of indexes: 80% of the benchmark consists of the Bloomberg Barclays U.S. Corporate High Yield — 2%Issuer Cap Index; and 20% of the benchmark consists of the JPMorgan Emerging Markets Bond Index Global (EMBI Global). Please note that an investor cannot invest directly in an index. Additional information about the indexes can be found in the Fund’s annual shareholder report. Additional information about the Fund’s performance and about 7 the history of the Board and the Fund’s management generating strong investor returns is included in the Fund’s Proxy Statement and in the Fund’s annual shareholder report.. 5. As of August 31, 2019.

…While Taking Additional Actions to Position the Fund for Continued Success (EHI)… Over the past year, the Board has worked with the Fund’s investment advisor to take steps to build on our strong performance momentum and increased income distributions, including improving the overall quality of our portfolio and identifying compelling income opportunities globally: Increased allocation to US Investment Grade Credit Securities from 13.5% to 15.3% Increased allocation to US Treasury Securities from 2.1% to 4.3% Increased allocation to Emerging Market Debt to take advantage of compelling income opportunities at attractive valuations Supported the portfolio’s ability to generate high current income by utilizing leverage tactically Decreased allocation to US Below Investment Grade Credit from 49.3% to 46.0% Decreased allocation to CCC-rated securities 1 Delivered 1-Year Returns of 17.96% Through Portfolio Enhancing Initiatives, Well Above Lipper 2 3 4 Peer Group Average of 8.97% and Key Benchmark Average of 8.94% 1. The Fund’s performance is based on the price of the Fund’s securities, which are listed for trading on the NYSE. 2. The Fund’s Lipper peer group refers to the peer group of high-yield, levered closed-end funds as selected by Lipper, an independent nationally recognized provider of investment company information. 3. The benchmark is based on a blend, in equal parts, of the Bloomberg Barclays U.S. Corporate High Yield — 2% Issuer Cap Index, the Bloomberg Barclays U.S. Aggregate Index, and the JPMorgan Emerging Markets Bond Index Global (EMBI Global). Please note that an investor cannot invest directly in an index. Additional information about the indexes can be found in the Fund’s annual shareholder report. Additional information about the Fund’s performance and about the history of the Board and 8 the Fund’s management generating strong investor returns is included in the Fund’s Proxy Statement and in the Fund’s annual shareholder report. 4. 1-year returns as of June 30, 2019.…While Taking Additional Actions to Position the Fund for Continued Success (EHI)… Over the past year, the Board has worked with the Fund’s investment advisor to take steps to build on our strong performance momentum and increased income distributions, including improving the overall quality of our portfolio and identifying compelling income opportunities globally: Increased allocation to US Investment Grade Credit Securities from 13.5% to 15.3% Increased allocation to US Treasury Securities from 2.1% to 4.3% Increased allocation to Emerging Market Debt to take advantage of compelling income opportunities at attractive valuations Supported the portfolio’s ability to generate high current income by utilizing leverage tactically Decreased allocation to US Below Investment Grade Credit from 49.3% to 46.0% Decreased allocation to CCC-rated securities 1 Delivered 1-Year Returns of 17.96% Through Portfolio Enhancing Initiatives, Well Above Lipper 2 3 4 Peer Group Average of 8.97% and Key Benchmark Average of 8.94% 1. The Fund’s performance is based on the price of the Fund’s securities, which are listed for trading on the NYSE. 2. The Fund’s Lipper peer group refers to the peer group of high-yield, levered closed-end funds as selected by Lipper, an independent nationally recognized provider of investment company information. 3. The benchmark is based on a blend, in equal parts, of the Bloomberg Barclays U.S. Corporate High Yield — 2% Issuer Cap Index, the Bloomberg Barclays U.S. Aggregate Index, and the JPMorgan Emerging Markets Bond Index Global (EMBI Global). Please note that an investor cannot invest directly in an index. Additional information about the indexes can be found in the Fund’s annual shareholder report. Additional information about the Fund’s performance and about the history of the Board and 8 the Fund’s management generating strong investor returns is included in the Fund’s Proxy Statement and in the Fund’s annual shareholder report. 4. 1-year returns as of June 30, 2019.
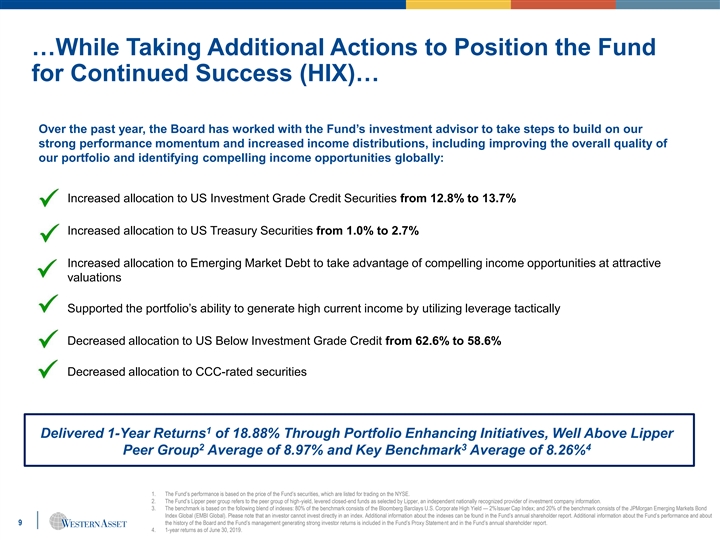
…While Taking Additional Actions to Position the Fund for Continued Success (HIX)… Over the past year, the Board has worked with the Fund’s investment advisor to take steps to build on our strong performance momentum and increased income distributions, including improving the overall quality of our portfolio and identifying compelling income opportunities globally: Increased allocation to US Investment Grade Credit Securities from 12.8% to 13.7% Increased allocation to US Treasury Securities from 1.0% to 2.7% Increased allocation to Emerging Market Debt to take advantage of compelling income opportunities at attractive valuations Supported the portfolio’s ability to generate high current income by utilizing leverage tactically Decreased allocation to US Below Investment Grade Credit from 62.6% to 58.6% Decreased allocation to CCC-rated securities 1 Delivered 1-Year Returns of 18.88% Through Portfolio Enhancing Initiatives, Well Above Lipper 2 3 4 Peer Group Average of 8.97% and Key Benchmark Average of 8.26% 1. The Fund’s performance is based on the price of the Fund’s securities, which are listed for trading on the NYSE. 2. The Fund’s Lipper peer group refers to the peer group of high-yield, levered closed-end funds as selected by Lipper, an independent nationally recognized provider of investment company information. 3. The benchmark is based on the following blend of indexes: 80% of the benchmark consists of the Bloomberg Barclays U.S. Corporate High Yield — 2%Issuer Cap Index; and 20% of the benchmark consists of the JPMorgan Emerging Markets Bond Index Global (EMBI Global). Please note that an investor cannot invest directly in an index. Additional information about the indexes can be found in the Fund’s annual shareholder report. Additional information about the Fund’s performance and about 9 the history of the Board and the Fund’s management generating strong investor returns is included in the Fund’s Proxy Statement and in the Fund’s annual shareholder report. 4. 1-year returns as of June 30, 2019.…While Taking Additional Actions to Position the Fund for Continued Success (HIX)… Over the past year, the Board has worked with the Fund’s investment advisor to take steps to build on our strong performance momentum and increased income distributions, including improving the overall quality of our portfolio and identifying compelling income opportunities globally: Increased allocation to US Investment Grade Credit Securities from 12.8% to 13.7% Increased allocation to US Treasury Securities from 1.0% to 2.7% Increased allocation to Emerging Market Debt to take advantage of compelling income opportunities at attractive valuations Supported the portfolio’s ability to generate high current income by utilizing leverage tactically Decreased allocation to US Below Investment Grade Credit from 62.6% to 58.6% Decreased allocation to CCC-rated securities 1 Delivered 1-Year Returns of 18.88% Through Portfolio Enhancing Initiatives, Well Above Lipper 2 3 4 Peer Group Average of 8.97% and Key Benchmark Average of 8.26% 1. The Fund’s performance is based on the price of the Fund’s securities, which are listed for trading on the NYSE. 2. The Fund’s Lipper peer group refers to the peer group of high-yield, levered closed-end funds as selected by Lipper, an independent nationally recognized provider of investment company information. 3. The benchmark is based on the following blend of indexes: 80% of the benchmark consists of the Bloomberg Barclays U.S. Corporate High Yield — 2%Issuer Cap Index; and 20% of the benchmark consists of the JPMorgan Emerging Markets Bond Index Global (EMBI Global). Please note that an investor cannot invest directly in an index. Additional information about the indexes can be found in the Fund’s annual shareholder report. Additional information about the Fund’s performance and about 9 the history of the Board and the Fund’s management generating strong investor returns is included in the Fund’s Proxy Statement and in the Fund’s annual shareholder report. 4. 1-year returns as of June 30, 2019.

…And Narrowing the Gap Between Market Value and NAV (EHI) Recently, the Board has approved several actions aimed at reducing the discount, including: • Completing the repurchase of $10.1 million in shares in 2018 • The execution of expense reduction initiatives, including the agreement to lower voluntarily the Fund’s investment management fee by 0.025% until November 30, 2019 Following these actions, there has been a significant reduction in the Fund’s discount • The Fund has reduced its discount by almost 50% since the start of the year, from more than 16% in December 2018 to approximately 8% in August 2019 The vast majority of the discount reduction occurred before any engagement from Saba Capital • EHI had reduced its discount to 10.15% as of March, 13, 2019, representing approximately 70% of the Fund’s total 2019 discount 1 reduction . This occurred prior to Saba Capital first disclosing its position in the Fund on March 14, 2019 For context, discounts between market price and NAV are common among closed-end funds across the industry • Discounts allow long-term stockholders to obtain higher yields than they otherwise would if they had to purchase the fund at NAV • Approximately 80% of closed-end funds were trading at a discount as of June 30, 2019 2 • Nearly 90% of funds within the Lipper peer group traded at a discount as of June 30, 2019 Capitalizing on Opportunities to Reduce the Fund’s Discount without Compromising Ability to Achieve Investment Objectives 1. As of July 31, 2019. 10 2. The Fund’s Lipper peer group refers to the peer group of high-yield, levered closed-end funds as selected by Lipper, an independent nationally recognized provider of investment company information. …And Narrowing the Gap Between Market Value and NAV (EHI) Recently, the Board has approved several actions aimed at reducing the discount, including: • Completing the repurchase of $10.1 million in shares in 2018 • The execution of expense reduction initiatives, including the agreement to lower voluntarily the Fund’s investment management fee by 0.025% until November 30, 2019 Following these actions, there has been a significant reduction in the Fund’s discount • The Fund has reduced its discount by almost 50% since the start of the year, from more than 16% in December 2018 to approximately 8% in August 2019 The vast majority of the discount reduction occurred before any engagement from Saba Capital • EHI had reduced its discount to 10.15% as of March, 13, 2019, representing approximately 70% of the Fund’s total 2019 discount 1 reduction . This occurred prior to Saba Capital first disclosing its position in the Fund on March 14, 2019 For context, discounts between market price and NAV are common among closed-end funds across the industry • Discounts allow long-term stockholders to obtain higher yields than they otherwise would if they had to purchase the fund at NAV • Approximately 80% of closed-end funds were trading at a discount as of June 30, 2019 2 • Nearly 90% of funds within the Lipper peer group traded at a discount as of June 30, 2019 Capitalizing on Opportunities to Reduce the Fund’s Discount without Compromising Ability to Achieve Investment Objectives 1. As of July 31, 2019. 10 2. The Fund’s Lipper peer group refers to the peer group of high-yield, levered closed-end funds as selected by Lipper, an independent nationally recognized provider of investment company information.

…And Narrowing the Gap Between Market Value and NAV (HIX) Recently, the Board has approved several actions aimed at reducing the discount, including: • Completing the repurchase of $6 million in shares in 2018 • The execution of expense reduction initiatives, including the agreement to lower voluntarily the Fund’s investment management fee by 0.025% until November 30, 2019 Following these actions, there has been a significant reduction in the Fund’s discount • The Fund has reduced its discount by almost 50% since the start of the year, from more than 14% in December 2018 to approximately 8.7% in August 2019 The vast majority of the discount reduction occurred before any engagement from Saba Capital • HIX had reduced its discount to 10.65% as of March, 13, 2019, representing approximately 85% of the Fund’s total 2019 discount 1 reduction . This occurred prior to Saba Capital first disclosing its position in the Fund on March 14, 2019 For context, discounts between market price and NAV are common among closed-end funds across the industry • Discounts allow long-term stockholders to obtain higher yields than they otherwise would if they had to purchase the fund at NAV • Approximately 80% of closed-end funds were trading at a discount as of June 30, 2019 1 • Nearly 90% of funds within the Lipper peer group traded at a discount as of June 30, 2019 Capitalizing on Opportunities to Reduce the Fund’s Discount without Compromising Ability to Achieve Investment Objectives 1. As of July 31, 2019. 11 2. The Fund’s Lipper peer group refers to the peer group of high-yield, levered closed-end funds as selected by Lipper, an independent nationally recognized provider of investment company information. . …And Narrowing the Gap Between Market Value and NAV (HIX) Recently, the Board has approved several actions aimed at reducing the discount, including: • Completing the repurchase of $6 million in shares in 2018 • The execution of expense reduction initiatives, including the agreement to lower voluntarily the Fund’s investment management fee by 0.025% until November 30, 2019 Following these actions, there has been a significant reduction in the Fund’s discount • The Fund has reduced its discount by almost 50% since the start of the year, from more than 14% in December 2018 to approximately 8.7% in August 2019 The vast majority of the discount reduction occurred before any engagement from Saba Capital • HIX had reduced its discount to 10.65% as of March, 13, 2019, representing approximately 85% of the Fund’s total 2019 discount 1 reduction . This occurred prior to Saba Capital first disclosing its position in the Fund on March 14, 2019 For context, discounts between market price and NAV are common among closed-end funds across the industry • Discounts allow long-term stockholders to obtain higher yields than they otherwise would if they had to purchase the fund at NAV • Approximately 80% of closed-end funds were trading at a discount as of June 30, 2019 1 • Nearly 90% of funds within the Lipper peer group traded at a discount as of June 30, 2019 Capitalizing on Opportunities to Reduce the Fund’s Discount without Compromising Ability to Achieve Investment Objectives 1. As of July 31, 2019. 11 2. The Fund’s Lipper peer group refers to the peer group of high-yield, levered closed-end funds as selected by Lipper, an independent nationally recognized provider of investment company information. .
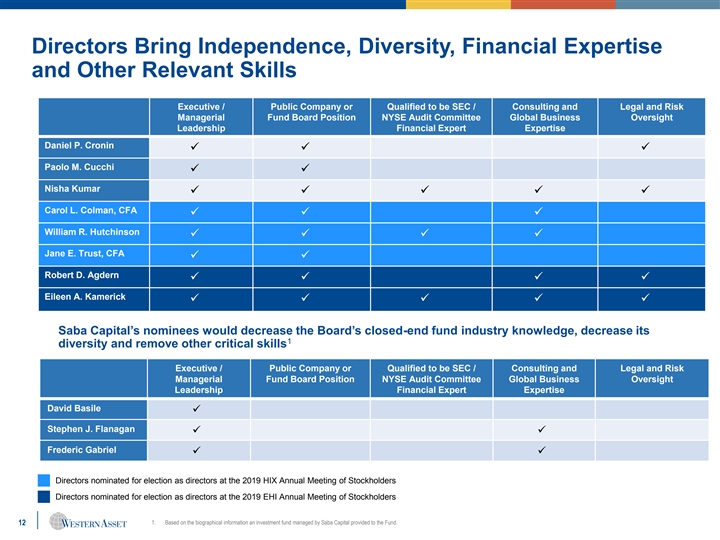
Directors Bring Independence, Diversity, Financial Expertise and Other Relevant Skills Executive / Public Company or Qualified to be SEC / Consulting and Legal and Risk Managerial Fund Board Position NYSE Audit Committee Global Business Oversight Leadership Financial Expert Expertise Daniel P. Cronin üüü Paolo M. Cucchi üü Nisha Kumar üüüüü Carol L. Colman, CFA üüü William R. Hutchinson üüüü Jane E. Trust, CFA üü Robert D. Agdern üüüü Eileen A. Kamerick üüüüü Saba Capital’s nominees would decrease the Board’s closed-end fund industry knowledge, decrease its 1 diversity and remove other critical skills Executive / Public Company or Qualified to be SEC / Consulting and Legal and Risk Managerial Fund Board Position NYSE Audit Committee Global Business Oversight Leadership Financial Expert Expertise David Basile ü Stephen J. Flanagan üü Frederic Gabriel üü Directors nominated for election as directors at the 2019 HIX Annual Meeting of Stockholders Directors nominated for election as directors at the 2019 EHI Annual Meeting of Stockholders 12 1. Based on the biographical information an investment fund managed by Saba Capital provided to the Fund.Directors Bring Independence, Diversity, Financial Expertise and Other Relevant Skills Executive / Public Company or Qualified to be SEC / Consulting and Legal and Risk Managerial Fund Board Position NYSE Audit Committee Global Business Oversight Leadership Financial Expert Expertise Daniel P. Cronin üüü Paolo M. Cucchi üü Nisha Kumar üüüüü Carol L. Colman, CFA üüü William R. Hutchinson üüüü Jane E. Trust, CFA üü Robert D. Agdern üüüü Eileen A. Kamerick üüüüü Saba Capital’s nominees would decrease the Board’s closed-end fund industry knowledge, decrease its 1 diversity and remove other critical skills Executive / Public Company or Qualified to be SEC / Consulting and Legal and Risk Managerial Fund Board Position NYSE Audit Committee Global Business Oversight Leadership Financial Expert Expertise David Basile ü Stephen J. Flanagan üü Frederic Gabriel üü Directors nominated for election as directors at the 2019 HIX Annual Meeting of Stockholders Directors nominated for election as directors at the 2019 EHI Annual Meeting of Stockholders 12 1. Based on the biographical information an investment fund managed by Saba Capital provided to the Fund.
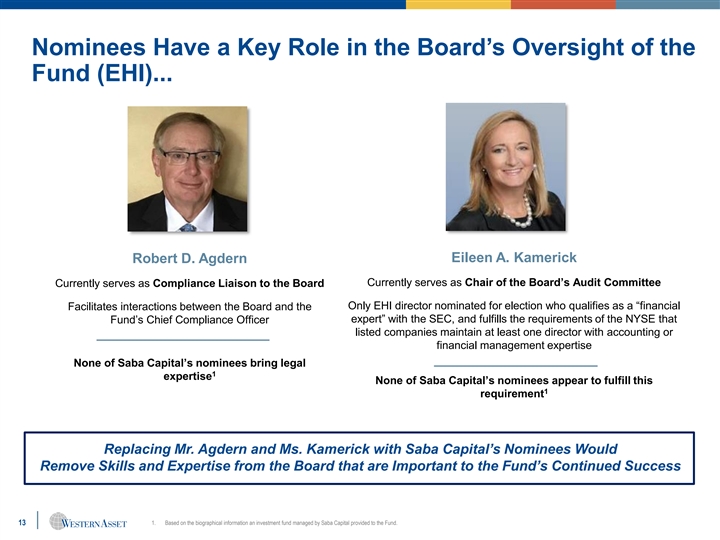
Nominees Have a Key Role in the Board’s Oversight of the Fund (EHI)... Eileen A. Kamerick Robert D. Agdern Currently serves as Chair of the Board’s Audit Committee Currently serves as Compliance Liaison to the Board Only EHI director nominated for election who qualifies as a “financial Facilitates interactions between the Board and the expert” with the SEC, and fulfills the requirements of the NYSE that Fund’s Chief Compliance Officer listed companies maintain at least one director with accounting or financial management expertise None of Saba Capital’s nominees bring legal 1 expertise None of Saba Capital’s nominees appear to fulfill this 1 requirement Replacing Mr. Agdern and Ms. Kamerick with Saba Capital’s Nominees Would Remove Skills and Expertise from the Board that are Important to the Fund’s Continued Success 13 1. Based on the biographical information an investment fund managed by Saba Capital provided to the Fund.Nominees Have a Key Role in the Board’s Oversight of the Fund (EHI)... Eileen A. Kamerick Robert D. Agdern Currently serves as Chair of the Board’s Audit Committee Currently serves as Compliance Liaison to the Board Only EHI director nominated for election who qualifies as a “financial Facilitates interactions between the Board and the expert” with the SEC, and fulfills the requirements of the NYSE that Fund’s Chief Compliance Officer listed companies maintain at least one director with accounting or financial management expertise None of Saba Capital’s nominees bring legal 1 expertise None of Saba Capital’s nominees appear to fulfill this 1 requirement Replacing Mr. Agdern and Ms. Kamerick with Saba Capital’s Nominees Would Remove Skills and Expertise from the Board that are Important to the Fund’s Continued Success 13 1. Based on the biographical information an investment fund managed by Saba Capital provided to the Fund.
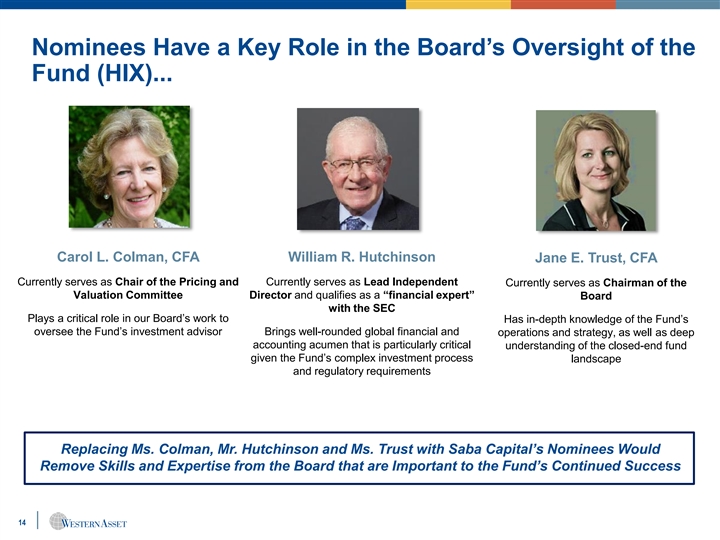
Nominees Have a Key Role in the Board’s Oversight of the Fund (HIX)... Carol L. Colman, CFA William R. Hutchinson Jane E. Trust, CFA Currently serves as Chair of the Pricing and Currently serves as Lead Independent Currently serves as Chairman of the Valuation Committee Director and qualifies as a “financial expert” Board with the SEC Plays a critical role in our Board’s work to Has in-depth knowledge of the Fund’s oversee the Fund’s investment advisor Brings well-rounded global financial and operations and strategy, as well as deep accounting acumen that is particularly critical understanding of the closed-end fund given the Fund’s complex investment process landscape and regulatory requirements Replacing Ms. Colman, Mr. Hutchinson and Ms. Trust with Saba Capital’s Nominees Would Remove Skills and Expertise from the Board that are Important to the Fund’s Continued Success 14Nominees Have a Key Role in the Board’s Oversight of the Fund (HIX)... Carol L. Colman, CFA William R. Hutchinson Jane E. Trust, CFA Currently serves as Chair of the Pricing and Currently serves as Lead Independent Currently serves as Chairman of the Valuation Committee Director and qualifies as a “financial expert” Board with the SEC Plays a critical role in our Board’s work to Has in-depth knowledge of the Fund’s oversee the Fund’s investment advisor Brings well-rounded global financial and operations and strategy, as well as deep accounting acumen that is particularly critical understanding of the closed-end fund given the Fund’s complex investment process landscape and regulatory requirements Replacing Ms. Colman, Mr. Hutchinson and Ms. Trust with Saba Capital’s Nominees Would Remove Skills and Expertise from the Board that are Important to the Fund’s Continued Success 14

Saba Capital is Following its Standard Activist “Playbook” Saba Capital has a long history of attacking closed-end funds to generate a quick profit to the detriment of long-term stockholders • Nominates directors in order to pressure boards to meet its demands intended to generate a short-term “pop” in share price – generally through large share repurchases or liquidity events • Exits funds quickly after pressuring the boards to implement short-term “fixes” – potentially leaving long-term stockholders with shares in funds that do not have the resources to continue to meet their objectives of high current income and strong total returns • Is currently running similar proxy contests with the same nominees at several other closed-end funds Funds that fend off Saba Capital’s self-serving campaigns significantly outperform their peers compared to those that comply with the hedge fund’s requests 1 2 Funds that implemented or surrendered to Saba Capital demands Funds that defended against Saba Capital demands 25% 40% Fund Peer Group Fund Peer Group 20% 30% 15% 10% 20% 5% 10% 0% -5% 0% 3 DSU CCA FSD FTF AVK ERC GLV GLQ GLO FHY DEX AOD MNE BQH BTZ Regulators question the impact activist campaigns in closed-end funds have on retail investors One of the things that is most troubling about this is that closed-end funds ordinarily are held by retail investors – ordinary, buy-and-hold retail 4 investors – who bought the fund with the understanding that it wouldn't be attacked in just this way.” - SEC Commissioner Jackson 1. Based on SEC filings. Performance for periods following the fund's reaching a standstill agreement or initiating a tender offer. 2. Based on SEC filings. Performance for periods following Saba's last 13D filing prior to annual meeting. 3. Advent/Claymore Convertible Securities & Income Fund II (AGC) and Advent/Claymore Enhanced Growth & Income Fund (LCM) merged into the Advent Claymore Convertible Securities and Income Fund (AVK) in the third quarter of 2018. All three funds entered into a standstill agreement with Saba Capital in April 2017. 15 4. Comments made during a Congressional hearing on September 25, 2019 entitled “Oversight of the Securities and Exchange Commission: Wall Street’s Cop on the Beat”, which aired on C-SPAN. Permission to use quotations neither sought nor obtained.Saba Capital is Following its Standard Activist “Playbook” Saba Capital has a long history of attacking closed-end funds to generate a quick profit to the detriment of long-term stockholders • Nominates directors in order to pressure boards to meet its demands intended to generate a short-term “pop” in share price – generally through large share repurchases or liquidity events • Exits funds quickly after pressuring the boards to implement short-term “fixes” – potentially leaving long-term stockholders with shares in funds that do not have the resources to continue to meet their objectives of high current income and strong total returns • Is currently running similar proxy contests with the same nominees at several other closed-end funds Funds that fend off Saba Capital’s self-serving campaigns significantly outperform their peers compared to those that comply with the hedge fund’s requests 1 2 Funds that implemented or surrendered to Saba Capital demands Funds that defended against Saba Capital demands 25% 40% Fund Peer Group Fund Peer Group 20% 30% 15% 10% 20% 5% 10% 0% -5% 0% 3 DSU CCA FSD FTF AVK ERC GLV GLQ GLO FHY DEX AOD MNE BQH BTZ Regulators question the impact activist campaigns in closed-end funds have on retail investors One of the things that is most troubling about this is that closed-end funds ordinarily are held by retail investors – ordinary, buy-and-hold retail 4 investors – who bought the fund with the understanding that it wouldn't be attacked in just this way.” - SEC Commissioner Jackson 1. Based on SEC filings. Performance for periods following the fund's reaching a standstill agreement or initiating a tender offer. 2. Based on SEC filings. Performance for periods following Saba's last 13D filing prior to annual meeting. 3. Advent/Claymore Convertible Securities & Income Fund II (AGC) and Advent/Claymore Enhanced Growth & Income Fund (LCM) merged into the Advent Claymore Convertible Securities and Income Fund (AVK) in the third quarter of 2018. All three funds entered into a standstill agreement with Saba Capital in April 2017. 15 4. Comments made during a Congressional hearing on September 25, 2019 entitled “Oversight of the Securities and Exchange Commission: Wall Street’s Cop on the Beat”, which aired on C-SPAN. Permission to use quotations neither sought nor obtained.

Saba Capital is Recycling Board Candidates • Saba Capital’s director nominees are pulled from its roster of candidates that it has ran against multiple other closed-end funds • Mr. Basile, Mr. Flanagan and Mr. Gabriel have no closed-end fund experience beyond the activist campaigns they have 1 participated in with Saba Capital – and the funds are not aware of any of these nominees having been elected by the stockholders of these respective funds • These nominees are not tailored to the funds – they are part of Saba Capital’s cookie cutter approach to running proxy contests against closed-end funds • These nominees seem to have been selected based on their relationship to Saba Capital rather than their qualifications Saba Capital’s Nominees Are Part of Its Standard Roster David Basile Stephen J. Flanagan Frederic Gabriel • Nuveen Ohio Quality Municipal • BlackRock Muni New York • Neuberger Berman High Yield Income Fund (ongoing) Intermediate Duration Fund Strategies Fund (ongoing) • Invesco High Income Trust II (2019) • Invesco (2019) (2019) • BlackRock Municipal Bond Trust • BlackRock Muni New York • Invesco Senior Income Trust (2019) Intermediate Duration Fund (2019) • BlackRock Credit Allocation (2019) • Invesco Dynamic Credit Income Trust (2019) • BlackRock Municipal Bond Trust Opportunities Fund (2019) • Delaware Enhanced Global (2019) • BlackRock Muni New York Dividend and Income Fund • BlackRock Credit Allocation Intermediate Duration Fund (2018) Income Trust (2019) (2019) • Delaware Enhanced Global Dividend and Income Fund (2018) 16 1. Based on the biographical information an investment fund managed by Saba Capital provided to the Fund.Saba Capital is Recycling Board Candidates • Saba Capital’s director nominees are pulled from its roster of candidates that it has ran against multiple other closed-end funds • Mr. Basile, Mr. Flanagan and Mr. Gabriel have no closed-end fund experience beyond the activist campaigns they have 1 participated in with Saba Capital – and the funds are not aware of any of these nominees having been elected by the stockholders of these respective funds • These nominees are not tailored to the funds – they are part of Saba Capital’s cookie cutter approach to running proxy contests against closed-end funds • These nominees seem to have been selected based on their relationship to Saba Capital rather than their qualifications Saba Capital’s Nominees Are Part of Its Standard Roster David Basile Stephen J. Flanagan Frederic Gabriel • Nuveen Ohio Quality Municipal • BlackRock Muni New York • Neuberger Berman High Yield Income Fund (ongoing) Intermediate Duration Fund Strategies Fund (ongoing) • Invesco High Income Trust II (2019) • Invesco (2019) (2019) • BlackRock Municipal Bond Trust • BlackRock Muni New York • Invesco Senior Income Trust (2019) Intermediate Duration Fund (2019) • BlackRock Credit Allocation (2019) • Invesco Dynamic Credit Income Trust (2019) • BlackRock Municipal Bond Trust Opportunities Fund (2019) • Delaware Enhanced Global (2019) • BlackRock Muni New York Dividend and Income Fund • BlackRock Credit Allocation Intermediate Duration Fund (2018) Income Trust (2019) (2019) • Delaware Enhanced Global Dividend and Income Fund (2018) 16 1. Based on the biographical information an investment fund managed by Saba Capital provided to the Fund.

Forward-Looking Statement Past performance is no guarantee of future results. The information provided is not intended to be a forecast of future events, a guarantee of future results or investment advice. All investments are subject to risk including the possible loss of principal. All benchmark performance reflects no deduction for fees, expenses or taxes. Please note that an investor cannot invest directly in a benchmark. 17Forward-Looking Statement Past performance is no guarantee of future results. The information provided is not intended to be a forecast of future events, a guarantee of future results or investment advice. All investments are subject to risk including the possible loss of principal. All benchmark performance reflects no deduction for fees, expenses or taxes. Please note that an investor cannot invest directly in a benchmark. 17
Appendix 18Appendix 18
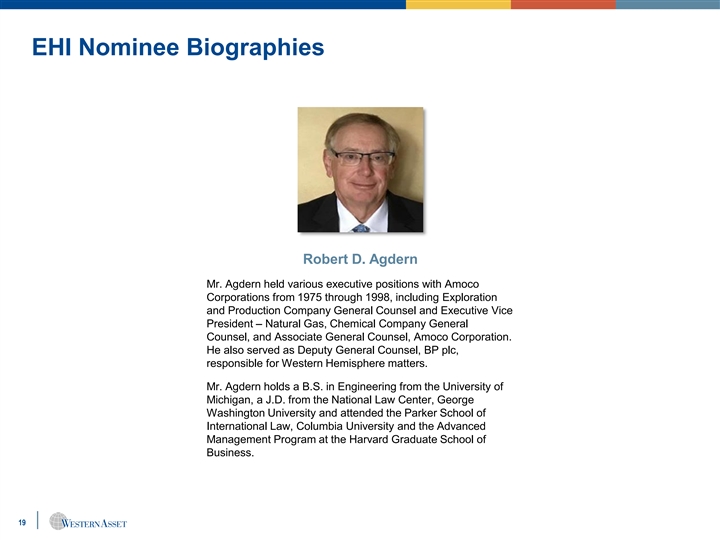
EHI Nominee Biographies Robert D. Agdern Mr. Agdern held various executive positions with Amoco Corporations from 1975 through 1998, including Exploration and Production Company General Counsel and Executive Vice President – Natural Gas, Chemical Company General Counsel, and Associate General Counsel, Amoco Corporation. He also served as Deputy General Counsel, BP plc, responsible for Western Hemisphere matters. Mr. Agdern holds a B.S. in Engineering from the University of Michigan, a J.D. from the National Law Center, George Washington University and attended the Parker School of International Law, Columbia University and the Advanced Management Program at the Harvard Graduate School of Business. 19EHI Nominee Biographies Robert D. Agdern Mr. Agdern held various executive positions with Amoco Corporations from 1975 through 1998, including Exploration and Production Company General Counsel and Executive Vice President – Natural Gas, Chemical Company General Counsel, and Associate General Counsel, Amoco Corporation. He also served as Deputy General Counsel, BP plc, responsible for Western Hemisphere matters. Mr. Agdern holds a B.S. in Engineering from the University of Michigan, a J.D. from the National Law Center, George Washington University and attended the Parker School of International Law, Columbia University and the Advanced Management Program at the Harvard Graduate School of Business. 19
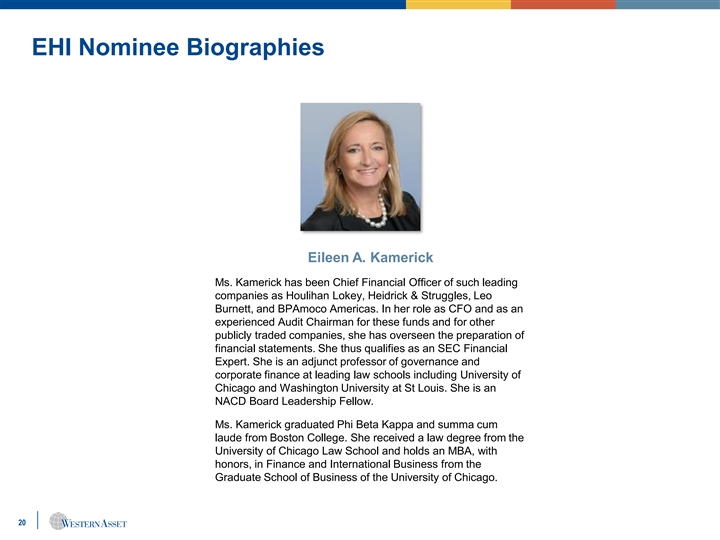
EHI Nominee Biographies Eileen A. Kamerick Ms. Kamerick has been Chief Financial Officer of such leading companies as Houlihan Lokey, Heidrick & Struggles, Leo Burnett, and BPAmoco Americas. In her role as CFO and as an experienced Audit Chairman for these funds and for other publicly traded companies, she has overseen the preparation of financial statements. She thus qualifies as an SEC Financial Expert. She is an adjunct professor of governance and corporate finance at leading law schools including University of Chicago and Washington University at St Louis. She is an NACD Board Leadership Fellow. Ms. Kamerick graduated Phi Beta Kappa and summa cum laude from Boston College. She received a law degree from the University of Chicago Law School and holds an MBA, with honors, in Finance and International Business from the Graduate School of Business of the University of Chicago. 20EHI Nominee Biographies Eileen A. Kamerick Ms. Kamerick has been Chief Financial Officer of such leading companies as Houlihan Lokey, Heidrick & Struggles, Leo Burnett, and BPAmoco Americas. In her role as CFO and as an experienced Audit Chairman for these funds and for other publicly traded companies, she has overseen the preparation of financial statements. She thus qualifies as an SEC Financial Expert. She is an adjunct professor of governance and corporate finance at leading law schools including University of Chicago and Washington University at St Louis. She is an NACD Board Leadership Fellow. Ms. Kamerick graduated Phi Beta Kappa and summa cum laude from Boston College. She received a law degree from the University of Chicago Law School and holds an MBA, with honors, in Finance and International Business from the Graduate School of Business of the University of Chicago. 20
HIX Nominee Biographies Carol L. Colman, CFA Ms. Colman began her career with the U.S. Trust Company in New York in 1968. She was a Group Manager, member of the Investment Strategy Committee and earned her CFA. After ten years of research experience, she became a portfolio manager for both domestic and international clients and was the lead manager for overseas clients. In 1980 she joined J.P. Morgan as a portfolio manager for individual and eleemosynary clients, followed by positions at Madison Fund and William G. Campbell, boutique investment firms. From 1983-1990 Ms. Colman was a Managing Director of Inferential Focus, a research and consulting organization. The firm works with investment managers and corporations on developing long range strategy. Ms. Colman is a graduate of St. Lawrence University and is a member of several non-profit boards. 21HIX Nominee Biographies Carol L. Colman, CFA Ms. Colman began her career with the U.S. Trust Company in New York in 1968. She was a Group Manager, member of the Investment Strategy Committee and earned her CFA. After ten years of research experience, she became a portfolio manager for both domestic and international clients and was the lead manager for overseas clients. In 1980 she joined J.P. Morgan as a portfolio manager for individual and eleemosynary clients, followed by positions at Madison Fund and William G. Campbell, boutique investment firms. From 1983-1990 Ms. Colman was a Managing Director of Inferential Focus, a research and consulting organization. The firm works with investment managers and corporations on developing long range strategy. Ms. Colman is a graduate of St. Lawrence University and is a member of several non-profit boards. 21
HIX Nominee Biographies William R. Hutchinson Prior to opening his energy consulting business in 2001, Mr. Hutchinson was associated with BP Amoco, PLC, from 1968 until his retirement in 2001. During that time he held various positions at Amoco and BP Amoco, including Treasurer; Vice President and Controller, Vice President of Mergers, Acquisitions and Negotiations, Vice President of Financial Operations, and Group Vice President Worldwide Mergers and Acquisitions. Mr. Hutchinson holds a B.A. from Trinity College, Dublin, Ireland, an M.Sc. from Cranfield College, Bedford, England, an M.B.A. from Harvard University, and earned the CPA designation in 1979. 22HIX Nominee Biographies William R. Hutchinson Prior to opening his energy consulting business in 2001, Mr. Hutchinson was associated with BP Amoco, PLC, from 1968 until his retirement in 2001. During that time he held various positions at Amoco and BP Amoco, including Treasurer; Vice President and Controller, Vice President of Mergers, Acquisitions and Negotiations, Vice President of Financial Operations, and Group Vice President Worldwide Mergers and Acquisitions. Mr. Hutchinson holds a B.A. from Trinity College, Dublin, Ireland, an M.Sc. from Cranfield College, Bedford, England, an M.B.A. from Harvard University, and earned the CPA designation in 1979. 22
HIX Nominee Biographies Jane E. Trust, CFA From 2007 to 2014, Ms. Trust held various roles with Legg Mason Capital Management. She became Executive Director and Head of Client Service for Legg Mason Capital Management, where she was responsible for the firm’s domestic and institutional client base including sovereign wealth funds, pension plans, public funds and mutual funds. During her tenure with Legg Mason Capital Management, Ms. Trust served as Chairman of the Fee Committee and as a member of the Investment Risk Analysis Committee. Before joining Legg Mason Capital Management, she was Head of Investments for Legg Mason Investment Counsel, supervising a team of equity and fixed income portfolio managers. Previously, Ms. Trust was a fixed income portfolio manager, which included managing Legg Mason’s tax-free bond mutual funds and money market fund. Ms. Trust first joined Legg Mason in 1987 after beginning her career as a management consultant for a privately held consulting firm. Ms. Trust holds a B.A. in Engineering Sciences from Dartmouth College and an M.A.S. in Finance from The Johns Hopkins University. She received the Chartered Financial Analysts designation in 1991 and is a member of the CFA Institute and the Baltimore CFA Society. 23HIX Nominee Biographies Jane E. Trust, CFA From 2007 to 2014, Ms. Trust held various roles with Legg Mason Capital Management. She became Executive Director and Head of Client Service for Legg Mason Capital Management, where she was responsible for the firm’s domestic and institutional client base including sovereign wealth funds, pension plans, public funds and mutual funds. During her tenure with Legg Mason Capital Management, Ms. Trust served as Chairman of the Fee Committee and as a member of the Investment Risk Analysis Committee. Before joining Legg Mason Capital Management, she was Head of Investments for Legg Mason Investment Counsel, supervising a team of equity and fixed income portfolio managers. Previously, Ms. Trust was a fixed income portfolio manager, which included managing Legg Mason’s tax-free bond mutual funds and money market fund. Ms. Trust first joined Legg Mason in 1987 after beginning her career as a management consultant for a privately held consulting firm. Ms. Trust holds a B.A. in Engineering Sciences from Dartmouth College and an M.A.S. in Finance from The Johns Hopkins University. She received the Chartered Financial Analysts designation in 1991 and is a member of the CFA Institute and the Baltimore CFA Society. 23