UNITED STATES
SECURITIES AND EXCHANGE COMMISSION
Washington, D.C. 20549
FORM N-CSR
CERTIFIED SHAREHOLDER REPORT OF REGISTERED MANAGEMENT INVESTMENT COMPANIES
Investment Company Act file number 811-21359
Managed Duration Investment Grade Municipal Fund
(Exact name of registrant as specified in charter)
2455 Corporate West Drive, Lisle, IL 60532
(Address of principal executive offices) (Zip code)
J. Thomas Futrell
2455 Corporate West Drive, Lisle, IL 60532
(Name and address of agent for service)
Registrant's telephone number, including area code: (630) 505-3700
Date of fiscal year end: July 31
Date of reporting period: August 1, 2009 to July 31, 2010
Form N-CSR is to be used by management investment companies to file reports with the Commission not later than 10 days after the transmission to stockholders of any report that is required to be transmitted to stockholders under Rule 30e-1 under the Investment Company Act of 1940 (17 CFR 270.30e-1). The Commission may use the information provided on Form N-CSR in its regulatory, disclosure review, inspection, and policymaking roles.
A registrant is required to disclose the information specified by Form N-CSR, and the Commission will make this information public. A registrant is not required to respond to the collection of information contained in Form N-CSR unless the Form displays a currently valid Office of Management and Budget ("OMB") control number. Please direct comments concerning the accuracy of the information collection burden estimate and any suggestions for reducing the burden to Secretary, Securities and Exchange Commission, 450 Fifth Street, NW, Washington, DC 20549-0609. The OMB has reviewed this collection of information under the clearance requirements of 44 U.S.C. Section 3507.
Item 1. Reports to Stockholders.
The registrant's annual report transmitted to shareholders pursuant to Rule 30e-1 under the Investment Company Act of 1940, as amended (the “Investment Company Act”), is as follows:
www.claymore.com/mzf
... your stream to the LATEST,
most up-to-date INFORMATION about the
Managed Duration Investment Grade Municipal Fund
The shareholder report you are reading right now is just the beginning of the story. Online at www.claymore.com/mzf, you will find:
| · | Daily, weekly and monthly data on share prices, distributions and more |
| · | Portfolio overviews and performance analyses |
| · | Announcements, press releases and special notices and tax characteristics |
Cutwater Asset Management and Claymore are continually updating and expanding shareholder information services on the Fund’s website, in an ongoing effort to provide you with the most current information about how your Fund’s assets are managed, and the results of our efforts. It is just one more way we are working to keep you better informed about your investment in the Fund.
2 l Annual Report l July 31, 2010
MZF l Managed Duration Investment Grade Municipal Fund
Dear Shareholder l
We thank you for your investment in the Managed Duration Investment Grade Municipal Fund (the “Fund”). Prior to a name change effective June 3, 2010, the Fund was named the MBIA Capital/Claymore Managed Duration Investment Grade Municipal Fund.This report covers performance for the fiscal year ended July 31, 2010.
The Fund’s investment objective is to provide high current income exempt from regular Federal income tax while seeking to protect the value of the Fund’s assets during periods of interest rate volatility. Under normal market conditions, the Fund seeks to achieve this objective by investing at least 80% of its total assets in municipal bonds of investment-grade quality and normally investing substantially all of its total assets in securities of investment-grade quality.
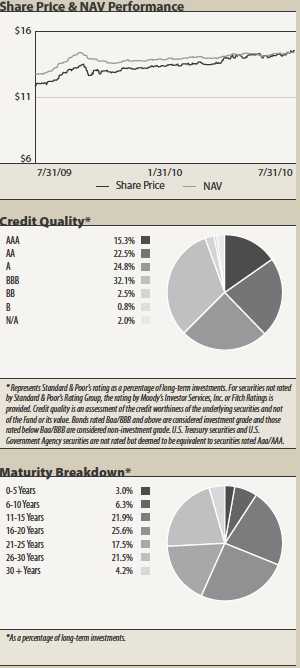
All Fund returns cited—whether based on net asset value (“NAV”) or market price—assume the reinvestment of all distributions. For the 12-month period ended July 31, 2010, the Fund provided a total return based on market price of 31.45% and a total return of 21.21% based on NAV.As of July 31, 2010, the Fund’s market price of $14.53 represented a premium of 0.90% to NAV of $14.40.A year earlier, on July 31, 2009, the Fund’s market price of $11.87 represented a discount of 6.76% to NAV of $12.73. Past performance is not a guarantee of future results. The market value of the Fund’s shares fluctuates from time to time, and it may be higher or lower than the Fund’s NAV.
The Fund performed well during the fiscal year ended July 31, 2010, with an NAV return of 21.21%, more than 12 percentage points higher than the 9.15% return of the Barclays Capital Municipal Bond Index, a widely used measure of the municipal bond market as a whole.The Fund’s portfolio performance benefited mainly from favorable decisions with regard to credit quality and market sectors.The Fund’s market price return was even better, as the Fund’s strong portfolio performance and attractive distribution rate attracted investors.This increased demand for the Fund’s shares caused the market price discount to NAV as of July 31, 2009 to narrow. As of July 31, 2010, the shares were trading at a premium to NAV.
On August 3, 2009, the Fund announced a 22.95% increase in its monthly dividend to $0.0750 per share. On November 2, 2009, the Fund announced an additional 10.00% increase in the monthly dividend to $0.0825 per share. Dividends of $0.0825 were paid in each month from November 2009 through July 2010.The current monthly dividend represents an annualized distribution rate of 6.81% based on the market price of $14.53 on July 31, 2010.This equates to a taxable equivalent distribution rate of 10.48% for shareholders in the 35% federal income tax bracket.
Cutwater Asset Management Corp. (“Cutwater”) is the Fund’s Investment Adviser. Prior to February 8, 2010, Cutwater was known as MBIA Capital Management Corp.With $42 billion of fixed income assets under management as of July 31, 2010, Cutwater is one of the top 50 fixed income specialists in the world. Cutwater’s parent company, MBIA, Inc., is listed on the NewYork Stock Exchange and is a component stock of the S&P 500 Index. Cutwater will operate under the MBIA corporate umbrella as a separate operating company focused on fixed-income asset management.
Claymore Securities, Inc. (“Claymore”) serves as the Fund’s servicing agent. Claymore entities provide supervision, management or servicing on more than $15.3 billion in assets as of June 30, 2010. Claymore currently offers closed-end funds, unit investment trusts and exchange-traded funds. On October 15, 2009, Guggenheim Partners, LLC, a global diversified financial services firm, and Claymore Group Inc. (“Claymore Group”), the parent company of the Fund’s servicing agent, announced the completion of a previously announced merger.As a result of the transaction, Claymore Group and its associated entities, including Claymore Securities, Inc., Claymore Advisors, LLC and Claymore Investments, Inc. (in Canada), are now wholly-owned subsidiaries of Guggenheim Partners, a global diversified financial services firm with more than $100 billion in assets under supervision. Subsequent to the fiscal year ended July 31, 2010,
Annual Report l July 31, 2010 l 3
MZF l Managed Duration Investment Grade Municipal Fund l DearShareholder continued
Claymore Securities, Inc. changed its name to Guggenheim Funds Distributors, Inc.Also, Claymore Advisors, LLC changed its name to Guggenheim Funds Investment Advisors, LLC.
We encourage shareholders to consider the opportunity to reinvest their distributions from the Fund through the Dividend Reinvestment Plan (“DRIP”), which is described in detail on page 26 of the Fund’s annual report.When shares trade at a discount to NAV, the DRIP takes advantage of the discount by reinvesting the monthly dividend distribution in common shares of the Fund purchased in the market at a price less than NAV. Conversely, when the market price of the Fund’s common shares is at a premium above NAV, the DRIP reinvests participants’ dividends in newly-issued common shares at NAV, subject to an IRS limitation that the purchase price cannot be more than 5% below the market price per share.The DRIP provides a cost-effective means to accumulate additional shares and enjoy the benefits of compounding returns ove r time. Since the Fund endeavors to maintain a steady monthly distribution rate, the DRIP plan effectively provides an income averaging technique, which causes shareholders to accumulate a larger number of Fund shares when the market price is depressed than when the price is higher.
On November 27, 2009, the Fund announced that it would commence a tender offer for up to 15% of its outstanding common shares at a price equal to at least 98% of the Fund’s NAV per share on the date the tender offer expired.The Fund commenced the initial tender offer on February 11, 2010.The offer expired on Friday, March 12, 2010, and 2,031,325 Common Shares, or about 25.60% of the Fund’s Common Shares, were tendered through the stated expiration date. Because more than 1,190,339 Common Shares were tendered, the tender offer was oversubscribed.Therefore, in accordance with the terms of the tender offer, the Fund repurchased Common Shares on a pro-rata basis, disregarding fractions, from all tendering shareholders, subject to certain conditions. Nearly 58.60% of the Common Shares tendered were accepted for payment.A total of 1,190,339 p roperly tendered shares, representing approximately 15% of the Fund’s Common Shares outstanding, were accepted and redeemed at a price per Common Share of approximately $13.7298.The total value of assets of the Fund distributed in payment for such shares was just over $16.3 million.
In the initial announcement of the tender offer, the Fund’s Board of Trustees announced plans to conduct up to three additional tender offers during 2010, upon the occurrence of certain terms and conditions related mainly to the Fund’s market price discount to NAV. During the three calendar months ended May 31, 2010, the Fund’s Common Shares traded on the New York Stock Exchange at an average discount of 2.37%.As the Fund’s average daily discount during this conditional tender offer test period was less than 5%, the Fund’s conditional tender offer program expired and the conditional tender offers will not occur.
To learn more about the Fund’s performance, we encourage you to read the Questions & Answers section of the report, which begins on page 5.You will find information about how the Fund is managed, what impacted the performance of the Fund during the 12 months ended July 31, 2010, and Cutwater’s views on the market environment.
We appreciate your investment, and we look forward to serving your investment needs in the future. For the most up-to-date information on your investment, please visit the Fund’s website at www.claymore.com/mzf.
Sincerely,
Clifford D. Corso
President
Managed Duration Investment Grade Municipal Fund
4 l Annual Report l July 31, 2010
MZF l Managed Duration Investment Grade Municipal Fund
Questions & Answers l
Clifford D. Corso
Portfolio Manager
Clifford D. Corso is Chief Executive Officer and Chief Investment Officer of Cutwater Asset Management Corp. (“Cutwater”), Chief Investment Officer of MBIA Insurance Corp. and Executive Vice President & Chief Investment Officer of MBIA Inc. His responsibilities include oversight and direction of the investments of MBIA Inc. and its subsidiaries. He manages Cutwater’s fixed income asset management platform, directs the investment of all fixed income assets under management, and oversees the portfolios of MBIA Insurance Corp. and its affiliates. In addition, Mr. Corso’s responsibilities include the direction of investments for outside clients such as pension funds, sovereign governments, state and local governments, and institutional investors. Mr. Corso is also an active member of the Board of Direc tors for the MBIA Foundation, Inc. Before joining MBIA in 1994, he was the co-head of fixed income at a subsidiary of Alliance Capital Management.Throughout his 25-year career, Mr. Corso has managed a wide array of fixed income products, including corporate, asset-backed, government, mortgage and derivative products. Mr. Corso has a bachelor’s degree fromYale University and a master’s degree from Columbia University. He holds his Series 7, 24, and 63 licenses from the Financial Industry Regulatory Authority (FINRA).
Jeffrey S. MacDonald,
CFA Portfolio Manager
Mr. MacDonald, who joined MBIA in 2007, is a Director of Cutwater and has extensive experience in the fixed income markets across a variety of sectors with particular emphasis on core and core plus strategies. He was previously a vice president and portfolio manager at Hartford Investment Management Company (HIMCO), where he managed core, core plus, intermediate core, and other broad-based fixed income styles. He was also instrumental in designing some of HIMCO’s fixed-income-based products, including a number of “alternative” strategies. Prior to joining HIMCO, Mr. MacDonald was a fixed income portfolio analyst specializing in taxable/insurance portfolios at Wellington Management Company. He began his career with Fidelity Investments as a fixed-income trader and lead systems analyst. Mr. MacDonald earned hi s bachelor's degree from Trinity College in Connecticut and his master’s degree from Boston University. He holds the designation of Chartered Financial Analyst (CFA) through the CFA Institute and is a member of the Hartford Security Analysts Society.
James B. DiChiaro
Portfolio Manager
Mr. DiChiaro joined MBIA in 1999 and is a Vice President of Cutwater. He currently manages the company’s municipal bond portfolios (taxable and tax-exempt) and has extensive experience managing money market portfolios. Mr. DiChiaro began his career at MBIA working with the conduit group structuring medium-term notes for Meridian Funding Company and performing the treasury role for an MBIA-sponsored asset-backed commercial paper conduit,Triple-A One Funding Corporation. Prior to joining MBIA, he worked for Merrill Lynch supporting their asset-backed securities trading desk. Mr. DiChiaro has a bachelor’s degree from Fordham University and a master’s degree from Pace University.
In the following interview Portfolio Managers Clifford D. Corso, Jeffrey S. MacDonald and James B. DiChiaro discuss the market environment and the performance of the Managed Duration Investment Grade Municipal Fund (the “Fund”, previously known as MBIA Capital/Claymore Managed Duration Investment Grade Municipal Fund) for the fiscal year ended July 31, 2010.
Please provide an overview of the municipal market during the 12-month period ended July 31, 2010.
The U.S. economy showed signs of improvement during the second half of 2009, with gross domestic product (“GDP,” or growth in the overall U.S. economy) posting positive growth in third and fourth quarters of the calendar year.The economy continued to expand at a modest pace in the first and second quarters of 2010.According to the Bureau of Economic Analysis, the main sources of growth in recent months were upturns in investment in residential and commercial real estate and increased government spending at the federal, state and local levels. However, forward-looking data indicate that residential real estate investment is not likely to contribute to GDP growth in the near future, as second quarter new home starts and building permits were down significantly from the prior period.
The effects of Europe’s sovereign debt crisis may have been a factor softening the recovery of the U.S. economy.Also, unemployment in the U.S. remains high and is likely to hover around 10% for some time, as workers re-enter the labor market.With most business and consumer indicators flat to negative in recent months, continued economic growth at a rather sluggish pace seems to be the most likely scenario. Recognizing that the economic recovery is fragile, the Federal Reserve has demonstrated reluctance to increase short-term interest rates. Since inflation data has been fairly benign, there is no immediate need for a rate increase, which could put the economic recovery at risk.
Strong technical factors within the municipal bond market produced robust tax-exempt bond returns during the 12 months covered by this report. For the 12-month period ended July 31, 2010, the Barclays Capital Municipal Bond Index, a widely used measure of the municipal bond market as a whole, returned 9.15%.This return compares with a return of 8.91% from the Barclays Capital U.S.Aggregate Bond Index and 6.95% from the Barclays Capital U.S.Treasury Composite Index for the same period. Municipal bonds provided higher returns than taxable investment grade bonds and U.S.Treasury securities on a pre-tax and post-tax basis.
Annual Report l July 31, 2010 l 5
MZF l Managed Duration Investment Grade Municipal Fund l Questions & Answers continued
The “Build America Bond” program, currently scheduled to expire in December 2010, shifted a large amount of new issue supply from the tax-exempt to the taxable market. Build America Bonds, created in April 2009 by the U.S. government as part of the effort to stimulate economic growth, are designed to appeal to a broader set of investors than traditional tax-exempt bonds. Under the Build America Bond program, the U.S.Treasury Department makes a direct payment to the issuer of the bonds in an amount equal to 35% of each interest payment. Potential investors in these bonds include pension funds and other institutional investors that do not generally invest in tax-exempt bonds. The reduction of tax-exempt issuance associated with the Build America Bond program has particularly reduced the supply of long maturity bonds, where issuers tend to realize substantial savings by issuing to the taxable markets. Build America Bonds accounted for approximately 28% of municipal bond issuance in the first half of 2010, lowering tax-exempt supply and anchoring yields at historically low levels.
With bond yields near recent lows, many municipal bond investors attempted to sit on the sidelines, waiting for higher yields, but they eventually were forced into the market by near zero yields on short-term investments such as money market funds. Retail investors are further motivated to invest in tax-exempt securities by the expectation of higher tax rates in the near future.The decrease in supply of long-term tax-exempt bonds and increase in demand has led to a flattening of the tax-exempt yield curve.1
How did the Fund perform in this market environment?
All Fund returns cited—whether based on net asset value (“NAV”) or market price—assume the reinvestment of all distributions. For the 12-month period ended July 31, 2010, the Fund provided a total return based on market price of 31.45% and a total return of 21.21% based on NAV. Past performance is not a guarantee of future results.
As of July 31, 2010, the Fund’s market price of $14.53 represented a premium of 0.90% to NAV of $14.40.As of July 31, 2009, the Fund’s market price of $11.87 represented a discount of 6.76% to NAV of $12.73.The Fund’s successful investment strategies resulted in an NAV return that was significantly higher than the Barclays Capital Municipal Bond Index (the “Index”), a widely used measure of the municipal bond market as a whole, which returned 9.15% for the 12 months ended July 31, 2010. The Fund’s market price return was even better, as the Fund’s strong portfolio performance and attractive distribution rate attracted investors.This increased demand for the shares caused the market price discount to NAV as of July 31, 2009 to narrow. As of July 31, 2010, the shares were trading at a premium to NAV.The market value and NAV of the Fund’s shares fluctuate from time to time, and the Fund’s market value may be higher or lower than its NAV.
On August 3, 2009, the Fund announced a 22.95% increase in the monthly dividend to $0.0750 per share. On November 2, 2009, the Fund announced an additional 10.00% increase in the monthly dividend to $0.0825 per share. Dividends of $0.0825 were paid in each month from November 2009 through July 2010.The current dividend represents an annualized distribution rate of 6.81% based on the market price of $14.53 on July 31, 2010. For comparison, investors were generally receiving yields of between 4% and 5% on individual tax-exempt bonds as of July 31, 2010.
How is the portfolio structured, and what has that structure meant for performance?
The Fund has a high quality portfolio that is diversified across issuers, sectors and states. In selecting securities for the portfolio, the portfolio management team, who together have more than 50 years of experience, are supported by Cutwater’s team of credit analysts, who evaluate the credit quality of sectors and individual issuers, going far beyond the bond ratings provided by rating agencies. Cutwater’s proprietary quantitative models help to evaluate the risk of individual securities as well as the overall portfolio, supplementing the judgment of the experienced team. Thorough quantitative and qualitative analysis helps ensure that the desired level of credit quality is maintained in the Fund’s portfolio while yield is added, as appropriate, by buying higher yielding bonds at what are considered to be attractive prices.
During the market turmoil of the prior fiscal year, the Fund had a large allocation to pre-refunded securities, which have little credit risk.2 These securities performed well early in the fiscal year as investors sought the safety of securities of the highest possible credit quality.As the market returned to more normal conditions, the decision was made to reduce the Fund’s position in pre-refunded securities.Also, as described in the Letter to Shareholders on page 3 of this report, in February and March 2010, the Fund conducted a tender offer under which there was a cash distribution of approximately $16.3 million, or approximately 15% of the Fund’s net assets available to common shareholders, to shareholders who tendered their shares.A major source of t he cash required for the tender offer program was the sale of shorter duration pre-refunded bonds, a sector of the market we viewed as overvalued.The reduction of the Fund’s position in pre-refunded bonds contributed to the Fund’s performance relative to its benchmark.
| 1 | The yield curve is a line that traces yields on a type of security over a spectrum of maturities, generally ranging from three months to 30 years. Ordinarily, the yield curve slopes upward, which means that investors willing to invest in longer maturity securities are generally rewarded with higher yields. |
| | |
| 2 | A bond is pre-refunded when the issuer has purchased U.S. Treasury or agency securities that provide a stream of cash flow to pay off the bonds on their first call date. |
6 l Annual Report l July 31, 2010
MZF l Managed Duration Investment Grade Municipal Fund l Questions & Answers continued
Early in the fiscal year, the duration of the portfolio was lengthened somewhat to take advantage of the higher yields provided by longer-duration bonds.As the yield curve flattened, the duration position was shortened so that it was approximately neutral relative to the Barclays Capital Municipal Bond Index.With bond yields approaching the recent lows, Cutwater believes that interest rates are more likely to rise than to decline at this point.Also, yields on long-term municipal bonds are nearing 4%, which is a technical resistance point for many retail investors.As of July 31, 2010, the average duration of the Fund’s portfolio is approximately eight years, essentially the same as it was a year ago.3
The Fund’s strong performance relative to the Index resulted mainly from its credit positioning.An emphasis was placed on bonds with longer maturities and higher yields, including some bonds with lower investment-grade credit ratings. Diversification was increased across sectors with the addition of general obligation bonds, higher education bonds, and essential service bonds.The Fund has a material overweight position to BBB (the lowest investment-grade rating), as compared with the Index. Cutwater believes that lower-rated investment grade credits have the potential to perform well, as they have in recent months.The Fund’s performance also benefited from a significant overweight position in health care bonds, which performed much better than the Index over the past year.Also positive for the Fund’s performance was a material ove rweight relative to the Index in industrial development bonds, which are corporate backed municipal bonds.
At a time when the financial difficulties of many states and municipalities are prominent in the news, some investors might question the wisdom of investing in municipal bonds with lower credit ratings. It is important to remember that the default rate on investment grade municipal bonds has historically been extremely low. Also, each of the Fund’s bond holdings is subjected to rigorous credit analysis, and the portfolio is well diversified across states and sectors.While it is true that tax receipts have fallen and given rise to budget deficits, creating stresses on the market, the Fund’s portfolio management team believes that investors are well protected from defaults in municipal bonds. In most states, debt service payments represent no more than 5% of general fund revenues, and states are highly motivated to make debt service pa yments on time, even when they are unable to meet other obligations such as payrolls or payments to vendors.This is because states and municipalities have an ongoing need to issue debt, and any entity that failed to meet a debt service payment could be shut out of the market.The majority of the Fund’s holdings are in revenue bonds, each of which are backed by a very specific revenue stream.The Fund has a large position in essential service bonds, which are backed by revenue generated by services such as water and sewer systems that are more resilient to economic downturns.
The Fund’s position in tobacco bonds, 3.4% of total investments (including enhanced tobacco) as of July 31, 2010, detracted from performance, as these bonds underperformed.There are several possible reasons for underperformance of tobacco bonds, including reduced demand for tobacco products in a poor economic environment, higher state taxes on tobacco, and potential anti-tobacco legislation.
Please explain the Fund’s leverage strategy and its effect on Fund returns.
The Fund utilizes leverage (borrowing) as part of its investment strategy, to finance the purchase of additional securities that provide increased income and potentially greater appreciation potential to common shareholders than could be achieved from a portfolio that is not leveraged. Of course, leverage results in greater NAV volatility and entails more downside risk than an unlever-aged portfolio. Leverage adds to performance only when the cost of leverage is less than the total return generated by investments.As of July 31, 2010, the Fund had $69.45 million of leverage outstanding in the form of Auction Market Preferred Shares (“AMPS”). During the 12-month period ended July 31, 2010, the cost of leverage was less than the return of the Fund’s investments; accordingly, leverage contributed to the Fund’s total return.
The broad auction-rate preferred securities market remains essentially frozen, as it has been since February 2008.The auctions for nearly all auction-rate preferred shares, including those issued by the Fund, continue to fail. Investors need to be aware that a failed auction is not a default, nor does it require the redemption of a fund’s auction rate preferred shares. Provisions in the offering documents of the Fund’s AMPS provide a mechanism to set a maximum rate in the event of a failed auction, and, thus, investors will continue to be entitled to receive interest payments for holding these AMPS.This maximum rate is determined based upon a multiple of or a spread to LIBOR and taxable equivalent short-term municipal securities, whichever is greater.The Fund will continue to evaluate the benefits and effects of leverage on the Fund, as well as explore other types of leverage.
There is no guarantee that the Fund’s leverage strategy will be successful, and the Fund’s use of leverage may cause the Fund’s NAV and market price of common shares to be more volatile. Leverage adds value only when the total return on securities purchased exceeds the cost of leverage.
| 3 | Duration is a measure of the interest rate sensitivity of a bond or fixed-income portfolio which incorporates time to maturity and coupon size. The longer the duration, the greater the interest rate risk. |
Annual Report l July 31, 2010 l 7
MZF l Managed Duration Investment Grade Municipal Fund l Questions & Answers continued
What is the outlook for the municipal market in the coming months?
Several conflicting trends are affecting the municipal market, creating significant volatility. Many states experienced a significant drop in tax revenue in 2009.There are some signs that tax receipts will grow in 2010 as the economy improves, but it will likely be some time before they return to the levels of 2007 and 2008. News about several states’ financial difficulties, may contribute to continued volatility in the municipal market.
With rising individual income tax rates in the near future a strong possibility, investors’ desire for income that is exempt from federal income taxes may support the municipal market.An important question is whether the Build America Bond program will be extended beyond December 31, 2010. If it is, these bonds will likely continue to absorb between 25%-30% of the municipal bond supply, providing further support for traditional tax exempt municipal bonds.
Although credit spreads on single-A and BBB bonds have tightened from record highs, they remain wide relative to historical averages.This could generate positive total return for the Fund as its position in BBB credits, and a few securities with slightly lower ratings, experience a tightening in their credit spreads and revert to their longer term averages, while providing attractive levels of income.
Index Definitions
All indices are unmanaged and are not investable.
Barclays Capital Municipal Bond Index is a rules-based, market-value weighted index engineered for the long-term tax-exempt bond market. To be included in the index, bonds must be rated investment-grade (Baa3/BBB- or higher) by at least two of the following ratings agencies: Moody’s, S&P, Fitch.
Barclays Capital U.S. Aggregate Bond Index represents securities that are U.S. domestic, taxable, and dollar denominated.The index covers the U.S. investment grade fixed rate bond market, with index components for government and corporate securities, mortgage pass-through securities, and asset-backed securities.
The Barclays Capital U.S. Treasury Composite Index measures the performance of the U.S. Treasury bond market, using market capitalization weighting and a standard rule based inclusion methodology.
MZF Risks And Other Considerations
The views expressed in this report reflect those of the portfolio managers only through the report period as stated on the cover. These views are subject to change at any time, based on market and other conditions and should not be construed as a recommendation of any kind.The material may also include forward looking statements that involve risk and uncertainty, and there is no guarantee that any predictions will come to pass.
There can be no assurance that the Fund will achieve its investment objective. The value of the Fund will fluctuate with the value of the underlying securities. Historically, closed-end funds often trade at a discount to their net asset value. An investment in this Fund may not be suitable for investors who are, or as a result of this investment would become, subject to the federal alternative minimum tax because the securities in the Fund may pay interest that is subject to taxation under the federal alternative minimum tax. Special rules apply to corporate holders. Additionally, any capital gains dividends will be subject to capital gains taxes.
There can be no guarantee that hedging strategies will be employed or will be successful. The premium paid for entering into such hedging strategies will result in a reduction in the net asset value of the Fund and a subsequent reduction of income to the Fund. Any income generated from hedging transactions will not be exempt from income taxes.
Certain risks are associated with the leveraging of common shares of the Fund. Both the net asset value and the market value of the Fund’s shares may be subject to higher volatility and a decline in value.
There are also specific risks associated with investing in municipal bonds, including but not limited to interest rate and credit risk. Interest rate risk is the risk that prices of Municipal Bonds generally increase when interest rates decline and decrease when interest rates increase. Prices of longer term securities generally change more in response to interest rate changes than prices of shorter term securities. Credit risk is the risk that the issuer will be unable to pay the interest or principal when due. The degree of credit risk depends on both the financial condition of the issuer and the terms of the obligation. The secondary market for municipal bonds is less liquid than many other securities markets, which may adversely affect the Fund’s ability to sell its bonds at prices approximating those at which the Fund currently values th em. The ability of municipal issuers to make timely payments of interest and principal may be diminished during general economic downturns. In addition, laws enacted in the future by Congress or state legislatures or referenda could extend the time for payment of principal and/or interest. In the event of bankruptcy of an issuer, the Fund could experience delays in collecting principal and interest.
Leverage creates certain risks for common shareholders, including higher volatility of both the net asset value and the market value of the common shares, because common shareholders bear the effects of changes in the value of the Fund’s investments. Leverage also creates the risk that the investment return on the Fund’s common shares will be reduced to the extent the dividends paid on preferred shares and other expenses of the preferred shares exceed the income earned by the Fund on its investments. If the Fund is liquidated, preferred shareholders will be entitled to receive liquidating distributions before any distribution is made to common shareholders. When the Fund uses leverage, the fees paid to Cutwater and Claymore will be higher than if leverage was not used.
There are also risks associated with investing in Auction Market Preferred Shares or AMPS. The AMPS are redeemable, in whole or in part, at the option of the Fund on any dividend payment date for the AMPS, and will be subject to mandatory redemption in certain circumstances. The AMPS will not be listed on an exchange.You may only buy or sell AMPS through an order placed at an auction with or through a broker-dealer that has entered into an agreement with the auction agent and the Fund or in a secondary market maintained by certain broker-dealers. These broker-dealers are not required to maintain this market, and it may not provide you with liquidity.The AMPS market continues to remain illiquid as auctions for nearly all AMPS continue to fail. A failed auction is not a default, nor does it require the redemption of a fund’s auction-rate pre ferred shares. Provisions in the Fund’s offering documents provide a mechanism to set a maximum rate in the event of a failed auction, and, thus, investors will continue to be entitled to receive payment for holding these AMPS.
In addition to the risks described above, the Fund is also subject to: Market Risk and Selection Risk, Call and Redemption Risk, Private Activity Bonds, Risks of Tobacco-Related Municipal Bonds, Leverage, Inflation Risk, Derivatives Risk, Affiliated Insurers, and Anti-takeover Provisions, Market Disruption. Please see Fund’s website for a more detailed discussion about Fund risks and considerations.
8 l Annual Report l July 31, 2010
| |
MZF l Managed Duration Investment Grade Municipal Fund |
Fund Summary l As of July 31, 2010 (unaudited) |
| | | | |
| Fund Information | | | |
| Symbol on New York Stock Exchange: | | MZF | |
| Initial Offering Date: | | August 27, 2003 | |
| Closing Market Price as of 07/31/10: | | $ | 14.53 | |
| Net Asset Value as of 07/31/10: | | $ | 14.40 | |
| Yield on Closing Market Price as of 07/31/10: | | | 6.81 | % |
Taxable Equivalent Yield on Closing Market Price as of 07/31/101: | | | 10.48 | % |
Monthly Distribution Per Common Share2: | | $ | 0.0825 | |
Leverage as of 07/31/103: | | | 42 | % |
| Percentage of total investments subject to alternative minimum tax | |
| as of 07/31/10: | | | 22.5 | % |
| 1 | | Taxable equivalent yield is calculated assuming a 35% federal income tax bracket. | |
| 2 | | Monthly distribution is subject to change. | | | | |
| 3 | | As a percentage of total investments. | | | | |
| Total Returns | | | | | | |
| (Inception 8/27/03) | | Market | | | NAV | |
| One Year | | | 31.45 | % | | | 21.21 | % |
| Three Year - average annual | | | 11.75 | % | | | 6.51 | % |
| Five Year - average annual | | | 8.23 | % | | | 4.96 | % |
| Since Inception - average annual | | | 5.36 | % | | | 5.40 | % |

Past performance does not guarantee future results. All portfolio data is subject to change daily. For more current information, please visit www.claymore.com/mzf. The above summaries are provided for informational purposes only and should not be viewed as recommendations.
Annual Report l July 31, 2010 l 9
MZF l Managed Duration Investment Grade Municipal Fund
Portfolio of Investments l July 31, 2010
| | | | | | | | | | |
| Rating | | | Principal | | | Optional | | | |
| (S&P)* | | | Amount (000) | | Description | Call Provisions** | | Value | |
| | | | | | Municipal Bonds & Notes – 168.9% | | | | |
| | | | | | Alabama – 2.8% | | | | |
| BBB | | | $ | 845 | | Courtland, AL Ind Dev Brd | | | | |
| | | | | | | Environ Imp Rev, AMT, Ser B, | | | | |
| | | | | | | 6.25%, 08/01/25 | 08/01/13 @ 100 | | $ | 853,458 | |
| Baa3 | | | | 1,890 | | Courtland, AL Ind Dev Brd | | | | | |
| | | | | | | Solid Waste Disp Rev, AMT, | | | | | |
| | | | | | | 6.00%, 08/01/29 | 08/01/10 @ 101 | | | 1,890,170 | |
| | | | | | | | | | | 2,743,628 | |
| | | | | | | Alaska – 0.8% | | | | | |
| A+ | | | 750 | | Alaska Muni Bond Bank Auth, | | | | | |
| | | | | | | | Ser 1, 5.75%, 09/01/33 | 09/01/18 @ 100 | | | 798,750 | |
| | | | | | | | California – 17.2% | | | | | |
| BBB+ | | | | 5,000 | | California Public Works Brd | | | | | |
| | | | | | | | Dept Mental Health Lease Rev, Ser A, | | | | | |
| | | | | | | | 5.00%, 06/01/24 | 06/01/14 @ 100 | | | 5,041,200 | |
| A- | | | 6,000 | | California Various Purpose Gen Oblig, | | | | | |
| | | | | | | | 5.125%, 11/01/24 | 11/01/13 @ 100 | | | 6,275,400 | |
| Baa1 | | | | 1,250 | | California Municipal Finance Auth Rev, | | | | | |
| | | | | | | | Eisenhower Medical Center, Ser A, | | | | | |
| | | | | | | | 5.50%, 07/01/30 | 07/01/20 @ 100 | | | 1,227,688 | |
| A | | | 2,500 | | Chula Vista, CA Ind Dev Rev, Ser B | | | | | |
| | | | | | | | AMT, 5.50% 12/01/21 | 06/02/14 @ 102 | | | 2,624,125 | |
| BBB | | | | 2,065 | | Golden State Tobacco Securitization | | | | | |
| | | | | | | | Rev, Ser A-1, 5.00%, 06/01/33 | 06/01/17 @ 100 | | | 1,574,459 | |
| | | | | | | | | | | | 16,742,872 | |
| | | | | | | | Colorado – 1.9% | | | | | |
| BBB | | | | 2,000 | | Colorado Health Facs Auth Rev, | | | | | |
| | | | | | | | 5.25%, 05/15/42 | 05/15/17 @ 100 | | | 1,848,860 | |
| | | | | | | | Delaware – 1.6% | | | | | |
| BBB+ | | | | 1,500 | | Delaware St Econ Dev Auth Rev, | | | | | |
| | | | | | | | 5.40%, 02/01/31 | 08/01/20 @ 100 | | | 1,547,925 | |
| | | | | | | | District of Columbia – 2.0% | | | | | |
| Aaa | | | | 2,000 | | District of Columbia FHA Multi Family | | | | | |
| | | | | | | | Henson Ridge-Rmkt, AMT, | | | | | |
| | | | | | | | 5.10%, 06/01/37 (FHA) | 06/01/15 @ 102 | | | 1,971,100 | |
| | | | | | | | Florida – 9.2% | | | | | |
| AA- | | | | 1,000 | | Clearwater, FL Wtr & Swr Rev, Ser A, | | | | | |
| | | | | | | | 5.25%, 12/01/39 | 12/01/19 @ 100 | | | 1,056,540 | |
| NR | | | | 3,000 | | Highlands Co., FL Health Facs | | | | | |
| | | | | | | | Auth Rev, Ser D, 5.875%, 11/15/29 | | | | | |
| | | | | | | | (Prerefunded @ 11/15/13)† | 11/15/13 @ 100 | | | 3,440,370 | |
| A- | | | 2,200 | | Miami-Dade Co., FL Aviation Rev, AMT, | | | | | |
| | | | | | | | 5.00%, 10/01/38 (CIFG) | 10/01/15 @ 100 | | | 2,027,410 | |
| AAA | | | | 1,500 | | Miami-Dade Co., FL Sch Brd, Ser A, | | | | | |
| | | | | | | | 5.375%, 02/01/34 (Assured Gty) | 02/01/19 @ 100 | | | 1,560,630 | |
| BBB | | | | 1,000 | | Seminole Indian Tribe FL Rev, Ser A, | | | | | |
| | | | | | | | 144A, 5.25%, 10/01/27 | 10/01/17 @ 100 | | | 882,140 | |
| | | | | | | | | | | | 8,967,090 | |
| | | | | | | | | | |
| Rating | | | Principal | | | Optional | | | |
| (S&P)* | | | Amount (000) | | Description | Call Provisions** | | Value | |
| | | | | | Hawaii – 1.0% | | | | |
| BBB+ | | | $ | 1,000 | | Hawaii Pacific Health Rev, Ser. B, | | | | |
| | | | | | | 5.625%, 07/01/2030 | 07/01/20 @ 100 | | $ | 1,005,600 | |
| | | | | | | Illinois – 6.3% | | | | | |
| AAA | | | | 1,115 | | Chicago O’Hare Intl Arpt Rev 3rd Lien, | | | | | |
| | | | | | | Ser A-2, AMT, 5.50%, 01/01/16 (AGM) | 01/01/14 @ 100 | | | 1,209,162 | |
| Baa2 | | | | 2,000 | | Illinois Fin Auth, Roosevelt Univ Rev, | | | | | |
| | | | | | | 5.50%, 04/01/37 | 04/01/17 @ 100 | | | 1,950,700 | |
| A- | | | 1,000 | | Illinois Fin Auth, Rush Univ Med Ctr Rev, | | | | | |
| | | | | | | | Ser C, 6.375%, 11/01/29 | 05/01/19 @ 100 | | | 1,079,410 | |
| AA | | | | 1,855 | | Illinois Hsg Dev Auth Homeowner Mtg, | | | | | |
| | | | | | | | AMT, Ser A-2, 5.00%, 08/01/36 | 02/01/16 @ 100 | | | 1,823,205 | |
| | | | | | | | | | | | 6,062,477 | |
| | | | | | | | Indiana – 3.2% | | | | | |
| BB | | | | 1,000 | | Indiana State Finance Auth, | | | | | |
| | | | | | | | Ref-Impt-US Steel Corp., | | | | | |
| | | | | | | | 6.00%, 12/01/26 | 06/01/20 @ 100 | | | 1,029,820 | |
| AA- | | | | 2,000 | | Indianapolis, IN Pub Impt Bond Bank Wtrwks, | | | | |
| | | | | | | | Ser A, 5.50%, 01/01/29 | 01/01/19 @ 100 | | | 2,124,260 | |
| | | | | | | | | | | | 3,154,080 | |
| | | | | | | | Iowa – 3.3% | | | | | |
| BBB | | | | 1,500 | | Iowa Higher Education Loan Auth Rev, | | | | | |
| | | | | | | Ref-Private College Fac, Upper Iowa Univ Project, | | | | | |
| | | | | | | | 5.50%, 09/01/25 | 09/01/20 @ 100 | | | 1,506,840 | |
| BBB | | | | 2,000 | | Iowa Tobacco Settlement Auth, | | | | | |
| | | | | | | | Cap Apprec Asset Bkd, Ser B, | | | | | |
| | | | | | | | 5.60%, 06/01/34 | 06/01/17 @ 100 | | | 1,687,580 | |
| | | | | | | | | | | | 3,194,420 | |
| | | | | | | | Kentucky – 2.2% | | | | | |
| Aa3 | | | | 1,000 | | Kentucky Econ Dev Fin Auth Hosp Fac Rev, | | | | | |
| | | | | | | | Baptist Hlthcr Sys, Ser A, | | | | | |
| | | | | | | | 5.625%, 08/15/27 | 08/15/18 @ 100 | | | 1,094,360 | |
| BBB+ | | | | 1,000 | | Owen Cnty, KY, Wtrwrks Sys Rev, | | | | | |
| | | | | | | | American Wtr Co, Ser B, 5.625%, 09/01/39 | 09/01/19 @ 100 | | | 1,034,050 | |
| | | | | | | | | | | | 2,128,410 | |
| | | | | | | | Louisiana – 8.3% | | | | | |
| BBB | | | | 1,000 | | De Soto Parish, LA Environ Imp | | | | | |
| | | | | | | | Rev, AMT, Ser A, 5.85%, 11/01/27 | 11/01/13 @ 100 | | | 987,080 | |
| AA- | | | | 1,000 | | East Baton Rouge Parish, LA Swr Commission | | | | | |
| | | | | | | | Rev, Ser A, 5.25%, 02/01/34 | 02/01/19 @ 100 | | | 1,069,190 | |
| BB+ | | | | 3,000 | | Louisiana Govt, Environ Facs & Comnty | | | | | |
| | | | | | | | Dev Auth Rev, 6.75%, 11/01/32 | 11/01/17 @ 100 | | | 3,112,410 | |
| BBB+ | | | | 3,000 | | St. John Baptist Parish, LA | | | | | |
| | | | | | | Marathon Oil Corp., Ser A, 5.125%, 06/01/37 | 06/01/17 @ 100 | | | 2,891,790 | |
| | | | | | | | | | | | 8,060,470 | |
| | | | | | | | Maryland – 1.0% | | | | | |
| BBB- | | | | 1,000 | | Maryland Health & Hgr Ed Facs Auth Rev, | | | | | |
| | | | | | | | 5.75%, 01/01/38 | 01/01/18 @ 100 | | | 1,010,140 | |
See notes to financial statements.
10 l Annual Report l July 31, 2010
MZF l Managed Duration Investment Grade Municipal Fund l Portfolio of Investments continued
| | | | | | | | | | | | |
| Rating | | | Principal | | | | Optional | | | | |
| (S&P)* | | | Amount (000) | | Description | | Call Provisions** | | | Value | |
| | | | | | Massachusetts – 3.1% | | | | | | |
| AA- | | | $ | 1,000 | | Massachusetts Housing Fin Agency, | | | | | | |
| | | | | | | AMT, 5.10%, 12/01/27 | | 06/01/17 @ 100 | | | $ | 1,009,100 | |
| AA | | | | 950 | | Massachusetts Housing Fin Agency, | | | | | | | |
| | | | | | | AMT, Ser 134, 5.60%, 12/01/38 | | 06/01/18 @ 100 | | | | 966,768 | |
| BBB | | | | 1,000 | | Massachusetts St Health & Ed Facs Auth Rev | | | | | | | |
| | | | | | | Ser A, 6.25%, 07/01/30 | | 07/01/19 @ 100 | | | | 1,077,000 | |
| | | | | | | | | | | | | 3,052,868 | |
| | | | | | | Michigan – 5.6% | | | | | | | |
| AAA | | | | 1,000 | | Detroit, MI Sewer Disp Rev, | | | | | | | |
| | | | | | | Sr Lien, Ser B, 7.50%, 07/01/33 (AGM) | | 07/01/19 @ 100 | | | | 1,192,180 | |
| AAA | | | | 1,000 | | Detroit, MI Wtr Supply Sys Rev, | | | | | | | |
| | | | | | | 2nd Lien, Ser B, 7.00%, 07/01/36 (AGM) | | 07/01/19 @ 100 | | | | 1,146,950 | |
| BBB- | | | | 1,000 | | Michigan Strategic Fund Ltd Oblig Rev Adj Ref, | | | | | |
| | | | | | | Dow Chemical, Ser B-1, 6.25%, 06/01/14 | | | N/A | | | | 1,117,340 | |
| A- | | | 2,000 | | Michigan Strategic Fund Ltd Oblig | | | | | | | | |
| | | | | | | | Rev Ref, Ser C, 5.45%, 09/01/29 | | 09/01/11 @ 100 | | | | 2,014,220 | |
| | | | | | | | | | | | | | | 5,470,690 | |
| | | | | | | | Mississippi – 1.1% | | | | | | | | |
| BBB | | | | 1,000 | | Warren County, MS Gulf Opp Zone, | | | | | | | | |
| | | | | | | | Intl Paper Co., Ser A, 6.50%, 09/01/32 | | 09/01/18 @ 100 | | | | 1,069,820 | |
| | | | | | | | Nebraska – 3.1% | | | | | | | | |
| A- | | | 3,000 | | Public Power Generation Agency, | | | | | | | | |
| | | | | | | | Whelan Energy Ctr Unit 2, | | | | | | | | |
| | | | | | | | 5.00%, 01/01/41 (AMBAC) | | 01/01/17 @ 100 | | | | 3,021,120 | |
| | | | | | | | Nevada – 5.8% | | | | | | | | |
| A | | | 5,410 | | Henderson, NV Health Care Fac Rev, | | | | | | | | |
| | | | | | | | Ser A, 5.625%, 07/01/24 | | 07/01/14 @ 100 | | | | 5,596,266 | |
| | | | | | | | New Jersey – 1.6% | | | | | | | | |
| BBB+ | | | | 1,500 | | New Jersey, Health Care Fac Fin Auth Rev, | | | | | | | | |
| | | | | | | | Chilton Mem Hosp, 5.75%, 07/01/39 | | 07/01/19 @ 100 | | | | 1,515,210 | |
| | | | | | | | New York – 21.1% | | | | | | | | |
| A- | | | 2,750 | | Long Island, NY Power Auth Rev, Ser A, | | | | | | | | |
| | | | | | | | 5.10%, 09/01/29 | | 09/01/14 @ 100 | | | | 2,827,192 | |
| AA- | | | | 4,000 | | Metropolitan Trans Auth Rev, Ser A, | | | | | | | | |
| | | | | | | | 5.125%, 01/01/24 | | 07/01/12 @ 100 | | | | 4,193,640 | |
| B- | | | | 750 | | New York City Indl Dev Rev, JFK | | | | | | | | |
| | | | | | | | Intl Arpt, Ser A, AMT, 8.00%, 08/01/12 | | | N/A | | | | 768,030 | |
| B- | | | 500 | | New York City Indl Dev Rev, American Airlines | | | | | |
| | | | | | | | JFK Intl Arpt, AMT, 7.50%, 08/01/16 | | | N/A | | | | 510,350 | |
| BBB | | | | 1,000 | | New York Dorm Auth Rev, NYU Hosp Ctr, | | | | | | | | |
| | | | | | | | Ser B, 5.25%, 07/01/24 | | 07/01/17 @ 100 | | | | 1,037,450 | |
| AA | | | | 2,250 | | New York, NY Gen Oblig, Ser J, | | | | | | | | |
| | | | | | | | 5.00%, 05/15/23 | | 05/15/14 @ 100 | | | | 2,410,425 | |
| A+ | | | 1,750 | | New York Muni Bond Bank Agy Special | | | | | | | | |
| | | | | | | | School Purpose Rev, Ser C, | | | | | | | | |
| | | | | | | | 5.25%, 12/01/22 | | 06/01/13 @ 100 | | | | 1,861,195 | |
| AA- | | | | 3,000 | | New York Tobacco Settlement Funding | | | | | | | | |
| | | | | | | | Corp, Ser A1, 5.50%, 06/01/19 | | 06/01/13 @ 100 | | | | 3,290,400 | |
| | | | | | | | | | | | |
| Rating | | | Principal | | | | Optional | | | | |
| (S&P)* | | | Amount (000) | | Description | | Call Provisions** | | | Value | |
| | | | | | New York (continued) | | | | | | |
| A- | | | $ | 2,500 | | Suffolk Co, NY Ind Dev Agy Rev, AMT, | | | | | | |
| | | | | | | | 5.25%, 06/01/27 | | 06/01/13 @ 100 | | | $ | 2,534,500 | |
| A | | | | 1,000 | | Troy, NY Cap Resource Corp Rev, | | | | | | | |
| | | | | | | | Ser A, 5.00%, 09/01/30 | | 09/01/20 @ 100 | | | | 1,030,380 | |
| | | | | | | | | | | | | | 20,463,562 | |
| | | | | | | | North Carolina – 3.7% | | | | | | | |
| A- | | | | 1,000 | | North Carolina Eastern Muni Power Agy | | | | | | | |
| | | | | | | | Sys Rev Ref, Ser D, 5.125%, 01/01/23 | | 01/01/13 @ 100 | | | | 1,036,480 | |
| A- | | | | 1,000 | | North Carolina Eastern Muni Power Agy | | | | | | | |
| | | | | | | | Sys Rev Ref, Ser D, 5.125%, 01/01/26 | | 01/01/13 @ 100 | | | | 1,019,560 | |
| AA | | | | 1,535 | | North Carolina Housing Fin Agy Rev, AMT, | | | | | | | |
| | | | | | | | Ser 14A, 5.35%, 01/01/22 (AMBAC) | | 07/01/11 @ 100 | | | | 1,545,331 | |
| | | | | | | | | | | | | | 3,601,371 | |
| | | | | | | | Ohio – 12.1% | | | | | | | |
| BBB | | | | 1,150 | | Buckeye OH, Tobacco Settlement Turbo Rev, | | | | | | | |
| | | | | | | | Ser A-2, 5.875%, 06/01/30 | | 06/01/17 @ 100 | | | | 906,982 | |
| BBB | | | | 2,000 | | Buckeye OH, Tobacco Settlement Turbo Rev, | | | | | | | |
| | | | | | | | Ser A-2, 5.75%, 06/01/34 | | 06/01/17 @ 100 | | | | 1,498,580 | |
| AA- | | | | 3,000 | | Cuyahoga Co., OH Rev Ref, Ser A, | | | | | | | |
| | | | | | | | 6.00%, 01/01/20 | | 07/01/13 @ 100 | | | | 3,337,350 | |
| AA- | | | | 3,750 | | Lorain Co., OH Hosp Rev Ref, Ser A, | | | | | | | |
| | | | | | | | 5.25%, 10/01/33 | | 10/01/11 @ 101 | | | | 3,782,250 | |
| BBB- | | | | 1,000 | | Ohio Air Quality Dev Auth Rev Ref, | | | | | | | |
| | | | | | | | 5.70%, 02/01/14 | | | N/A | | | | 1,106,710 | |
| BBB- | | | | 1,000 | | Ohio Air Quality Dev Auth Rev Ref, | | | | | | | | |
| | | | | | | | 5.625%, 06/01/18 | | | N/A | | | | 1,095,530 | |
| | | | | | | | | | | | | | | 11,727,402 | |
| | | | | | | | Oklahoma – 2.1% | | | | | | | | |
| A | | | | 2,085 | | Oklahoma Dev Fin Auth Rev, | | | | | | | | |
| | | | | | | | 5.00%, 02/15/42 | | 02/15/17 @ 100 | | | | 2,026,954 | |
| | | | | | | | Pennsylvania – 5.8% | | | | | | | | |
| BBB | | | | 2,340 | | Pennsylvania Higher Education Facs Auth | | | | | | | | |
| | | | | | | | Rev, 5.25%, 05/01/23 | | 05/01/13 @ 100 | | | | 2,376,785 | |
| BBB | | | | 1,000 | | Pennsylvania State Higher Education, | | | | | | | | |
| | | | | | | | 5.00%, 05/01/37 | | 11/01/17 @ 100 | | | | 950,440 | |
| AA- | | | | 1,000 | | Pennsylvania State Higher Education, | | | | | | | | |
| | | | | | | | U of PA Health Sys, Ser B, 6.00%, 08/15/26 | | 08/15/18 @ 100 | | | | 1,113,680 | |
| AAA | | | | 1,110 | | Philadelphia, PA Gen Oblig Ref, Ser A, | | | | | | | | |
| | | | | | | | 5.375%, 08/01/30 (Assured Gty) | | 08/01/19 @ 100 | | | | 1,172,759 | |
| | | | | | | | | | | | | | | 5,613,664 | |
| | | | | | | | Rhode Island – 1.5% | | | | | | | | |
| AAA | | | | 1,300 | | Rhode Island Convention Ctr Auth Rev Ref, | | | | | | | | |
| | | | | | | | Ser A, 5.50%, 05/15/27 (Assured Gty) | | 05/15/19 @ 100 | | | | 1,427,959 | |
See notes to financial statements.
Annual Report l July 31, 2010 l 11
MZF l Managed Duration Investment Grade Municipal Fund l Portfolio of Investments continued
| | | | | | | | | | | | |
| Rating | | | Principal | | | | Optional | | | | |
| (S&P)* | | | Amount (000) | | Description | | Call Provisions** | | | Value | |
| | | | | | South Carolina – 3.6% | | | | | | |
| AAA | | | $ | 2,500 | | Florence Co., SC Hosp Rev, Ser A, | | | | | | |
| | | | | | | 5.25%, 11/01/27 (AGM) | | 11/01/14 @ 100 | | | $ | 2,587,100 | |
| BBB | | | | 1,000 | | Georgetown Co., SC Environ Imp Rev, | | | | | | | |
| | | | | | | AMT, Ser A, 5.30%, 03/01/28 | | 03/01/14 @ 100 | | | | 924,740 | |
| | | | | | | | | | | | | 3,511,840 | |
| | | | | | | South Dakota – 6.3% | | | | | | | |
| AAA | | | | 4,990 | | South Dakota Hsg Dev Auth, Ser K, AMT, | | | | | | | |
| | | | | | | 5.05%, 05/01/36^ | | 11/01/15 @ 100 | | | | 4,904,920 | |
| AA- | | | | 1,200 | | South Dakota St Hlth & Edl Fac, Ser A | | | | | | | |
| | | | | | | 5.25%, 11/01/34 | | 11/01/14 @ 100 | | | | 1,211,244 | |
| | | | | | | | | | | | | 6,116,164 | |
| | | | | | | Tennessee – 2.6% | | | | | | | |
| BBB+ | | | | 2,500 | | Knox Co., TN Health Edl & Hsg Facs Brd Rev, | | | | | | | |
| | | | | | | 5.25%, 04/01/27 | | 04/01/17 @ 100 | | | | 2,501,200 | |
| | | | | | | Texas – 15.4% | | | | | | | |
| Aa2 | | | | 2,000 | | Bexar Co., TX Hsg Fin, AMT, | | | | | | | |
| | | | | | | 5.20%, 10/20/34 (GNMA/FHA) | | 10/20/14 @ 100 | | | | 2,002,840 | |
| AAA | | | | 2,500 | | Houston, TX Utility System, | | | | | | | |
| | | | | | | First Lien Rev Ref, Ser A, 5.00%, | | | | | | | |
| | | | | | | 11/15/33 (AGM) | | 11/15/17 @ 100 | | | | 2,614,600 | |
| A | | | 2,000 | | Lower Colorado River Auth Refund Rev, Ser A, | | | | | |
| | | | | | | | 6.25%, 05/15/28 | | 05/15/18 @ 100 | | | | 2,251,200 | |
| BBB+ | | | | 1,885 | | Matagorda Co., TX Nav Dist No.1 Rev, AMT, | | | | | | | |
| | | | | | | | 5.125%, 11/01/28 (AMBAC) (1) | | | N/A | | | | 1,846,565 | |
| A- | | | 2,000 | | North TX, Tollway Auth Rev, Ser A, | | | | | | | | |
| | | | | | | | 5.625%, 01/01/33 | | 01/01/18 @ 100 | | | | 2,094,140 | |
| A- | | | 1,000 | | North TX, Tollway Auth Rev, Ser L-2, | | | | | | | | |
| | | | | | | | 6.00%, 01/01/38 (1) | | 01/01/13 @ 100 | | | | 1,099,530 | |
| BBB+ | | | | 2,100 | | San Leanna Ed Facs Corp Higher Ed Rev, | | | | | | | | |
| | | | | | | | 5.125%, 06/01/36 | | 06/01/17 @ 100 | | | | 1,940,274 | |
| AAA | | | | 1,000 | | Tarrant Cnty, TX Cult Ed Facs Rev, | | | | | | | | |
| | | | | | | | Ser A, 5.75%, 07/01/18 (Assured Gty) | | | N/A | | | | 1,102,370 | |
| | | | | | | | | | | | | | | 14,951,519 | |
| | | | | | | | Virginia – 1.5% | | | | | | | | |
| BBB+ | | | | 1,250 | | Washington Co., VA Indl Dev Auth Hosp Fac Rev, | | | | | |
| | | | | | | | Ser C, 7.50%, 07/01/29 | | 01/01/19 @ 100 | | | | 1,430,900 | |
| | | | | | | | Washington – 1.1% | | | | | | | | |
| AA+ | | | | 1,000 | | Tes Properties, WA Rev, | | | | | | | | |
| | | | | | | | 5.625%, 12/01/38 | | 06/01/19 @ 100 | | | | 1,047,710 | |
| | | | | | | | West Virginia – 2.5% | | | | | | | | |
| AAA | | | | 2,415 | | West Virginia Housing Dev Fund Rev, | | | | | | | | |
| | | | | | | | Ser D, 5.20%, 11/01/21 | | 05/01/11 @ 100 | | | | 2,440,068 | |
| | | | | | | | Wisconsin – 1.3% | | | | | | | | |
| AA | | | | 1,250 | | Wisconsin State Health & Ed Facs Rev, | | | | | | | | |
| | | | | | | | Ser A, 5.00%, 11/15/36 | | 11/15/16 @ 100 | | | | 1,280,350 | |
| | | | | | | | | |
| Rating | | Principal | | | Optional | | | |
| (S&P)* | | Amount | | Description | Call Provisions** | | Value | |
| | | | | Wyoming – 7.2% | | | | |
| BBB+ | | $ | 4,000 | | Sweetwater Co., WY Solid Waste Disp Rev, | | | | |
| | | | | | AMT, 5.60%, 12/01/35 | 12/01/15 @ 100 | | $ | 3,962,240 | |
| AA+ | | | 3,100 | | Wyoming Cmnty Dev Auth Hsg Rev, | | | | | |
| | | | | | Ser 7, AMT, 5.10%, 12/01/38 | 12/01/16 @ 100 | | | 3,079,540 | |
| | | | | | | | | | 7,041,780 | |
| | | | | | Total Municipal Bonds & Notes – 168.9% | | | | |
| | | | | | (Cost $157,605,382) | | | | 164,144,239 | |
| | | Redemption | | | | | | | |
| | | Value (000) | | Description | | | Value | |
| | | | | | Preferred Shares – 2.1% | | | | | |
| Aaa | | | 2,000 | | Centerline Equity Issuer Trust, AMT, Ser A-4-1, | | | | |
| | | | | | 5.75%, 05/15/15 (remarketing), 144A | | | | | |
| | | | | | (Cost $2,000,000) | | | | 2,076,760 | |
| | | | | | Total Investments – 171.0% | | | | | |
| | | | | | (Cost $159,605,382) | | | | 166,220,999 | |
| | | | | | Other assets in excess of liabilities – 0.4% | | | | 419,314 | |
| | | | | | Preferred Shares, at redemption value – | | | | | |
| | | | | | (-71.4% of Net Assets Applicable to Common | | | | |
| | | | | | Shareholders or -41.8% of Total Investments) | | | (69,450,000 | ) |
| | | | | | Net Assets Applicable to | | | | | |
| | | | | | Common Shareholders – 100.0% (2) | | | $ | 97,190,313 | |
| | |
| * | For securities not rated by Standard & Poor’s Rating Group, the rating by Moody’s Investor Services, Inc. or Fitch |
| | Ratings is provided. (unaudited) |
| ** | Date and price of the earliest optional call or put provision. There may be other call provisions at varying prices at |
| | later dates. |
| † | This bond is prerefunded. U.S. government or U.S. government agency securities, held in escrow, are used to pay |
| | interest on this security, as well as to retire the bond in full at the date and price indicated under the Optional Call |
| | Provisions. |
| ^ | A portion of this security was segregated as collateral for borrowings outstanding. At July 31, 2010, the total |
| | amount segregated was $137,613. |
| (1) | Step-up security. Security is a step-up bond where the coupon increases or steps up at a predetermined date. Rate |
| | shown reflects the rate in effect on July 31, 2010. |
| (2) | Portfolio percentages are calculated based on net assets applicable to common shareholders. |
| |
| Glossary: |
| AGM – Insured by Assured Guaranty Municipal Corp. |
| AMBAC – Insured by Ambac Assurance Corporation |
| AMT – Income from this security is a preference item under the Alternative Minimum Tax |
| Assured Gty – Insured by Assured Guaranty Corp. |
| CIFG – Insured by CIFG Assurance NA |
| FHA – Guaranteed by Federal Housing Administration |
| GNMA – Guaranteed by Ginnie Mae |
| 144A – Security exempt from registration pursuant to Rule 144A under the Securities Act of 1933. The securities |
| may be resold in transactions exempt from registration, normally to qualified institutional buyers. At July |
| 31, 2010 these securities amounted to $2,958,900 which represents 3.0% of net assets applicable to |
| common shareholders. |
See notes to financial statements.
12 l Annual Report l July 31, 2010
MZF l Managed Duration Investment Grade Municipal Fund
Statement of Assets and Liabilities l July 31, 2010
| | | | |
| Assets | | | |
| Investments, at value (cost $159,605,382) | | $ | 166,220,999 | |
| Interest receivable | | | 1,969,765 | |
| Receivable for shares issued through dividend reinvestment | | | 57,703 | |
| Other assets | | | 13,193 | |
| Total assets | | | 168,261,660 | |
| Liabilities | | | | |
| Payable for securities purchased | | | 1,227,688 | |
| Borrowings | | | 45,000 | |
| Investment advisory fee payable | | | 42,307 | |
| Dividends payable - preferred shareholders | | | 30,481 | |
| Servicing agent fee payable | | | 28,205 | |
| Custodian bank | | | 6,723 | |
| Administration fee payable | | | 3,490 | |
| Accrued expenses and other liabilities | | | 237,453 | |
| Total liabilities | | | 1,621,347 | |
| Preferred Shares, at redemption value | | | | |
| $.001 par value per share; 2,778 Auction Market Preferred Shares authorized, | | | | |
| issued and outstanding at $25,000 per share liquidation preference | | | 69,450,000 | |
| Net Assets Applicable to Common Shareholders | | $ | 97,190,313 | |
| Composition of Net Assets Applicable to Common Shareholders | | | | |
| Common stock, $.001 par value per share; unlimited number of shares authorized, | | | | |
| 6,749,259 shares issued and outstanding | | $ | 6,749 | |
| Additional paid-in capital | | | 96,187,052 | |
| Net unrealized appreciation on investments | | | 6,615,617 | |
| Accumulated undistributed net investment income | | | 936,257 | |
| Accumulated net realized loss on investments | | | (6,555,362 | ) |
| Net Assets Applicable to Common Shareholders | | $ | 97,190,313 | |
Net Asset Value Applicable to Common Shareholders (based on 6,749,259 common shares outstanding) | | $ | 14.40 | |
See notes to financial statements.
Annual Report l July 31, 2010 l 13
MZF l Managed Duration Investment Grade Municipal Fund
Statement of Operations l For the year ended July 31, 2010
| | | | | | | |
| Investment Income | | | | | | |
| Interest | | | | | $ | 9,385,971 | |
| Expenses | | | | | | | |
| Investment advisory fee | | $ | 675,903 | | | | | |
| Servicing agent fee | | | 450,602 | | | | | |
| Professional fees | | | 148,932 | | | | | |
| Auction agent fees - preferred shares | | | 131,862 | | | | | |
| Printing expenses | | | 69,382 | | | | | |
| Fund accounting | | | 65,135 | | | | | |
| Fund administration fee | | | 47,660 | | | | | |
| Trustees’ fees and expenses | | | 47,581 | | | | | |
| Custodian fee | | | 21,809 | | | | | |
| NYSE listing fee | | | 21,170 | | | | | |
| Transfer agent fee | | | 20,386 | | | | | |
| Insurance | | | 18,056 | | | | | |
| Line of credit fee | | | 753 | | | | | |
| Other | | | 36,994 | | | | | |
| Total expenses | | | | | | | 1,756,225 | |
| Investment advisory fees waived | | | | | | | (210,586 | ) |
| Servicing agent fees waived | | | | | | | (140,391 | ) |
| Net expenses | | | | | | | 1,405,248 | |
| Net investment income | | | | | | | 7,980,723 | |
| Realized and Unrealized Gain (Loss) on Investments | | | | | | | | |
| Net realized gain (loss) on: | | | | | | | | |
Investments | | | | | | | 585,739 | |
| Net change in unrealized appreciation (depreciation) on: | | | | | | | | |
Investments | | | | | | | 12,207,098 | |
| Net realized and unrealized gain on investments | | | | | | | 12,792,837 | |
| Distributions to Auction Market Preferred Shareholders from | | | | | | | | |
| Net investment income | | | | | | | (1,028,788 | ) |
| Net Increase in Net Assets Applicable to Common Shareholders Resulting from Operations | | | | | | $ | 19,744,772 | |
See notes to financial statements.
14 l Annual Report l July 31, 2010
MZF l Managed Duration Investment Grade Municipal Fund
Statement of Changes in Net Assets l
| | | | | | | |
| | | For the | | | For the | |
| | | Year Ended | | | Year Ended | |
| | | July 31, 2010 | | | July 31, 2009 | |
| Increase/(decrease) in Net Assets Applicable to Common Shareholders Resulting from Operations: | | | | | | |
| Net investment income | | $ | 7,980,723 | | | $ | 8,078,285 | |
| Net realized gain (loss) on investments | | | 585,739 | | | | (663,855 | ) |
| Net change in unrealized appreciation (depreciation) on investments | | | 12,207,098 | | | | (3,211,719 | ) |
| Distributions to auction market preferred shareholders from net investment income | | | (1,028,788 | ) | | | (1,920,054 | ) |
| Net increase in net assets applicable to common shareholders resulting from operations | | | 19,744,772 | | | | 2,282,657 | |
| Distributions to common shareholders from | | | | | | | | |
| Net investment income | | | (7,284,872 | ) | | | (5,792,982 | ) |
| Capital share transactions | | | | | | | | |
| Cost of common shares repurchased | | | (16,343,117 | ) | | | – | |
| Reinvestment of dividends | | | 57,703 | | | | – | |
| Net decrease from capital share transactions | | | (16,285,414 | ) | | | – | |
| Total change in net assets applicable to common shareholders | | | (3,825,514 | ) | | | (3,510,325 | ) |
| Net assets applicable to common shareholders: | | | | | | | | |
| Beginning of period | | | 101,015,827 | | | | 104,526,152 | |
| End of period (including undistributed net investment income of $936,257 and $1,269,194, respectively.) | | $ | 97,190,313 | | | $ | 101,015,827 | |
See notes to financial statements.
Annual Report l July 31, 2010 l 15
MZF l Managed Duration Investment Grade Municipal Fund
Financial Highlights l
| | | | | | | | | | | | | | | | |
| | | For the | | | For the | | | For the | | | For the | | | For the | |
| Per share operating performance for one common share | | Year Ended | | | Year Ended | | | Year Ended | | | Year Ended | | | Year Ended | |
| outstanding throughout each period | | July 31, 2010 | | | July 31, 2009 | | | July 31, 2008 | | | July 31, 2007 | | | July 31, 2006 | |
| Net asset value, beginning of period | | $ | 12.73 | | | $ | 13.17 | | | $ | 14.21 | | | $ | 14.25 | | | $ | 14.68 | |
| Investment operations | | | | | | | | | | | | | | | | | | | | |
Net investment income(a) | | | 1.06 | | | | 1.02 | | | | 0.99 | | | | 0.95 | | | | 0.90 | |
| Net realized and unrealized gain/(loss) on investments | | | | | | | | | | | | | | | | | | | | |
| and swaptions transactions | | | 1.72 | | | | (0.49 | ) | | | (1.06 | ) | | | (0.10 | ) | | | (0.41 | ) |
| Distributions to preferred shareholders from net investment income | | | | | | | | | | | | | | | | | | | | |
| (common share equivalent basis) | | | (0.14 | ) | | | (0.24 | ) | | | (0.35 | ) | | | (0.31 | ) | | | (0.27 | ) |
| Total from investment operations | | | 2.64 | | | | 0.29 | | | | (0.42 | ) | | | 0.54 | | | | 0.22 | |
| Distributions to common shareholders from net investment income | | | (0.97 | ) | | | (0.73 | ) | | | (0.62 | ) | | | (0.58 | ) | | | (0.65 | ) |
| Net asset value, end of period | | $ | 14.40 | | | $ | 12.73 | | | $ | 13.17 | | | $ | 14.21 | | | $ | 14.25 | |
| Market value, end of period | | $ | 14.53 | | | $ | 11.87 | | | $ | 11.73 | | | $ | 12.63 | | | $ | 12.29 | |
Total investment return (b) | | | | | | | | | | | | | | | | | | | | |
| Net asset value | | | 21.21 | % | | | 2.83 | % | | | -3.07 | % | | | 3.80 | % | | | 1.57 | % |
| Market value | | | 31.45 | % | | | 8.65 | % | | | -2.29 | % | | | 7.93 | % | | | -1.60 | % |
| Ratios and supplemental data | | | | | | | | | | | | | | | | | | | | |
| Net assets end of period (thousands) | | $ | 97,190 | | | $ | 101,016 | | | $ | 104,526 | | | $ | 112,777 | | | $ | 113,044 | |
| Ratio of expenses to average net assets (excluding interest expense | | | | | | | | | | | | | | | | | | | | |
and net of fee waivers) (c) | | | 1.35 | % | | | 1.54 | % | | | 1.27 | % | | | 1.28 | % | | | 1.63 | % |
| Ratio of expenses to average net assets (excluding interest expense | | | | | | | | | | | | | | | | | | | | |
and excluding fee waivers) (c) | | | 1.69 | % | | | 1.91 | % | | | 1.61 | % | | | 1.62 | % | | | 1.89 | % |
| Ratio of expenses to average net assets (including interest expense | | | | | | | | | | | | | | | | | | | | |
and net of fee waivers) (c) | | | 1.35 | % | | | 1.54 | % | | | 1.32 | % | | | 1.44 | % | | | 1.63 | % |
| Ratio of expenses to average net assets (including interest expense | | | | | | | | | | | | | | | | | | | | |
and excluding fee waivers) (c) | | | 1.69 | % | | | 1.91 | % | | | 1.66 | % | | | 1.78 | % | | | 1.89 | % |
Ratio of net investment income to average net assets (c) | | | 7.68 | % | | | 8.65 | % | | | 7.15 | % | | | 6.56 | % | | | 6.21 | % |
| Portfolio turnover | | | 6 | % | | | 21 | % | | | 29 | % | | | 4 | % | | | 21 | % |
| Preferred shares, at redemption value ($25,000 per share | | | | | | | | | | | | | | | | | | | | |
| liquidation preference) (thousands) | | $ | 69,450 | | | $ | 69,450 | | | $ | 69,450 | | | $ | 69,450 | | | $ | 69,450 | |
| Preferred shares asset coverage per share | | $ | 59,986 | | | $ | 61,363 | | | $ | 62,626 | | | $ | 65,597 | | | $ | 65,693 | |
Asset coverage per $1,000 of indebtedness (d) | | | N/A | | | | N/A | | | | N/A | | | $ | 37,445 | | | | N/A | |
| N/A | Not applicable. |
| (a) | Based on average shares outstanding during the period. |
| (b) | Total investment return is calculated assuming a purchase of a common share at the beginning of the period and a sale on the last day of the period reported either at net asset value (NAV) or market price per share. Dividends and distributions are assumed to be reinvested at NAV for returns at NAV or in accordance with the Fund's dividend reinvestment plan for returns at market value. Total investment return does not reflect brokerage commissions. A return calculated for a period of less than one year is not annualized. |
| (c) | Calculated on the basis of income and expenses applicable to both common and preferred shares relative to average net assets of common shareholders. |
| (d) | Calculated by subtracting the Fund's total liabilities (not including the floating rate note obligations) from the Fund's total assets and dividing by the total number of indebtedness units, where one unit equals $1,000 of indebtedness. |
See notes to financial statements.
16 l Annual Report l July 31, 2010
MZF l Managed Duration Investment Grade Municipal Fund
Notes to Financial Statements l July 31,2010
Note 1 – Organization:
The Managed Duration Investment Grade Municipal Fund (the“Fund”, formerly known as MBIA Capital/Claymore Managed Duration Investment Grade Municipal Fund) was organized as a Delaware statutory trust on May 20, 2003. The Fund is registered as a diversified, closed-end management investment company under the Investment Company Act of 1940, as amended. The Fund’s investment objective is to provide its common shareholders with high current income exempt from regular federal income tax while seeking to protect the value of the Fund’s assets during periods of interest rate volatility. Prior to commencing operations on August 27, 2003, the Fund had no operations other than matters relating to its organization and registration and the sale and issuance of 6,981 common shares of beneficial interest to Cutwater Asset Management Corp. (“Cutwater”or the“Adviser”, formerly known as MBIA Capital Management Corp.)
Note 2 – Accounting Policies:
The preparation of financial statements in accordance with U.S. generally accepted accounting principles (“GAAP”) requires management to make estimates and assumptions that affect the reported amounts and disclosures in the financial statements. Actual results could differ from those estimates.
In June 2009, the Financial Accounting Standards Board (“FASB”) established the FASB Accounting Standards CodificationTM (“ASC”) as the single source of authoritative accounting principles reorganized by the FASB in preparation of financial statements in conformity with GAAP. The ASC superseded existing non-grandfathered, non-U.S. Securities and Exchange Commission (“SEC”) accounting and reporting standards. The ASC did not change GAAP but rather organized it into a hierarchy where all guidance with the ASC carried an equal level of authority. The ASC became effective for financial statements issued for interim and annual periods ending after September 15, 2009. The implementation of ASC did not have a material effect of the Fund’ ;s financial statements.
The following is a summary of significant accounting policies followed by the Fund.
(a) Valuation of Investments: The municipal bonds and preferred shares in which the Fund invests are traded primarily in the over-the-counter markets. In determining net asset value, the Fund uses the valuations of portfolio securities furnished by a pricing service approved by the Board of Trustees. The pricing service typically values portfolio securities at the bid price or the yield equivalent when quotations are readily available. Securities for which quotations are not readily available are valued at fair market value on a consistent basis as determined by the pricing service using a matrix system to determine valuations. The procedures of the pricing service and its valuations are reviewed by the officers of the Fund under the general supervision of the Board of Trustees. Positions in futures contracts, interest rate swaps and options on interest rate swaps (“swaptions”) are valued at closing prices for such contracts established by the exchange or dealer market on which they are traded, or if market quotations are not readily available, are valued at fair value on a consistent basis using methods approved in good faith by the Board of Trustees.
For those securities where quotations or prices are not available, the valuations are determined in accordance with procedures established in good faith by the Board of Trustees. Valuations in accordance with these procedures are intended to reflect each security’s (or asset’s)“fair value”. Such“fair value”is the amount that the Fund might reasonably expect to receive for the security (or asset) upon its current sale. Each such determination should be based on a consideration of all relevant factors, which are likely to vary from one pricing context to another. Examples of such factors may include, but are not limited to: (i) the type of security, (ii) the initial cost of the security, (iii) the existence of any contractual restrictions on the security’s disposition, (iv) the price and extent of public trad ing in similar securities of the issuer or of comparable companies, (v) quotations or evaluated prices from broker-dealers and/or pricing services, (vi) information obtained from the issuer, analysts, and/or the appropriate stock exchange (for exchange traded securities), (vii) an analysis of the issuer’s financial statements, and (viii) an evaluation of the forces that influence the issuer and the market(s) in which the security is purchased and sold (e.g. the existence of pending merger activity, public offerings or tender offers that might affect the value of the security).
In accordance with ASC 820, Fair Value Measurements and Disclosures (“ASC 820”) (formerly known as the Statement of Financial Accounting Standard (“FAS”) No. 157), fair value is defined as the price that the Fund would receive to sell an investment or pay to transfer a liability in an orderly transaction with an independent buyer in the principal market, or in the absence of a principal market the most advantageous market for the investment or liability. ASC 820 establishes three different categories for valuations. Level 1 valuations are those based upon quoted prices in active markets. Level 2 valuations are those based upon quoted prices in inactive markets or based upon significant observable inputs (e.g. yield curves; benchmark interest rates; indices). Level 3 valuations are those based upon unobservable inputs (e.g. d iscounted cash flow analysis; non-market based methods used to determine fair valuation). The following table represents the Fund’s investments carried on the Statement of Assets and Liabilities by caption and by level within the fair value hierarchy as of July 31, 2010:
| Valuations (in $000s) | | Level 1 | | | Level 2 | | | Level 3 | | | Total | |
| Description | | | | | | | | | | | | |
| Assets: | | | | | | | | | | | | |
| Preferred Stock | | $ | – | | | $ | 2,077 | | | $ | – | | | $ | 2,077 | |
| Municipal Bonds | | | – | | | | 164,144 | | | | – | | | | 164,144 | |
| Total | | $ | – | | | $ | 166,221 | | | $ | – | | | $ | 166,221 | |
The Fund has adopted the Accounting Standard Update, Fair Value Measurements and Disclosures (Topic 820): Improving Disclosures about Fair Value Measurements which provides guidance on how investment assets and liabilities are to be valued and disclosed. Specifically, the amendment requires reporting entities to disclose i) the input and valuation techniques used to measure fair value for both recurring and nonrecurring fair value measurements, for Level 2 or Level 3 positions ii) transfers between all levels (including Level 1 and Level 2) on a gross basis (i.e. transfers out must be disclosed separately from transfers in) as well as the reasons(s) for the transfer and iii) purchases, sales, issuances and settlements on a gross basis in the Level 3 rollforward rather than as one net number. The effective date of the amendment is for interim and an nual periods beginning after December 15, 2009 however, the requirement to provide the Level 3 activity for purchases, sales, issuances and settlements on a gross basis will be effective for interim and annual periods beginning after December 15, 2010. The fund values its current Level 2 securities through independent pricing providers who employ matrix pricing models utilizing market prices, broker quotes and prices of securities with comparable maturities and qualities.There were no transfers between Level 1 and Level 2 during the year ended July 31, 2010.
(b) Investment Transactions and Investment Income: Investment transactions are accounted for on the trade date. Realized gains and losses on investments are determined on the identified cost basis. Interest income and expenses are accrued daily. All discounts/premiums are accreted/amortized for financial reporting purposes over the life of each security.
(c) Dividends and Distributions: The Fund declares and pays on a monthly basis dividends from net investment income to common shareholders. Distributions of net realized capital gains, if any, will be paid at least annually. Dividends and distributions to shareholders are
Annual Report l July 31, 2010 l 17
MZF l Managed Duration Investment Grade Municipal Fund l Notes to Financial Statements continued
recorded on the ex-dividend date. Dividends and distributions to preferred shareholders are accrued and determined as described in Note 8.
(d) Inverse Floating Rate Investments and Floating Rate Note Obligations: Inverse floating rate instruments are notes whose coupon rate fluctuates inversely to a predetermined interest rate index. These instruments typically involve greater risks than a fixed rate municipal bond. In particular, the holder of these inverse floating rate instruments retain all credit and interest rate risk associated with the full underlying bond and not just the par value of the inverse floating rate instrument. As such, these instruments should be viewed as having inherent leverage and therefore involve many of the risks associated with leverage. Leverage is a speculative technique that may expose the Fund to greater risk and increased costs. Leverage may cause the Fund& #8217;s net asset value to be more volatile than if it had not been leveraged because leverage tends to magnify the effect of any increases or decreases in the value of the Fund’s portfolio securities. The use of leverage may also cause the Fund to liquidate portfolio positions when it may not be advantageous to do so in order to satisfy its obligations with respect to inverse floating rate instruments.
The Fund may invest in inverse floating rate securities through either a direct purchase or through the transfer of bonds to a dealer trust in exchange for cash and/or residual interests in the dealer trust. For those inverse floating rate securities purchased directly, the instrument is included in the Portfolio of Investments with income recognized on an accrual basis. The Fund did not invest in inverse floaters during the year ended July 31, 2010.
Note 3 – Agreements:
Pursuant to an Investment Advisory Agreement (the“Advisory Agreement”) between Cutwater and the Fund, the Adviser is responsible for the daily management of the Fund’s portfolio, which includes buying and selling securities for the Fund, as well as investment research, subject to the direction of the Fund’s Board of Trustees. The Adviser is a subsidiary of MBIA Asset Management, LLC which, in turn, is a wholly-owned subsidiary of MBIA, Inc. The Advisory Agreement provides that the Fund shall pay to the Adviser a monthly fee for its services at the annual rate of 0.39% of the sum of the Fund’s average daily managed assets. (“Managed Assets”represent the Fund’s total assets including the assets attributable to the proceeds from any financial leverage but excluding the assets attributable to floating rate note obligations, minus liabilities, other than debt representing financial leverage.) The Adviser contractually agreed to waive a portion of the management fees it is entitled to receive from the Fund at the annual rate of 0.09% of the Fund’s average daily Managed Assets from the commencement of the Fund’s operations through September 1, 2008 and at the annual rate of 0.042% thereafter through September 1, 2009. Effective June 16, 2006, the Adviser voluntarily agreed to waive an additional 0.0375% of advisory fees and has since agreed to forego the scheduled step downs in the contractual waiver scheduled for September 1, 2008 and September 1, 2009. Effective June 1, 2010, the Adviser discontinued the 0.0375% voluntary fee waiver.
Pursuant to a Servicing Agreement, Claymore Securities, Inc. (the“Servicing Agent”) acts as servicing agent to the Fund. The Servicing Agent receives an annual fee from the Fund, payable monthly in arrears, in an amount equal to 0.26% of the average daily value of the Fund’s Managed Assets. The Servicing Agent contractually agreed to waive a portion of the servicing fee it is entitled to receive from the Fund at the annual rate of 0.06% of the average daily value of the Fund’s Managed Assets from the commencement of the Fund’s operations through September 1, 2008 and at the annual rate of 0.028% thereafter through September 1, 2009. Effective June 16, 2006, the Servicing Agent voluntarily agreed to waive an additional 0.025% of servicing fees and has since agreed to forego the scheduled step downs in the contractual wa iver scheduled for September 1, 2008 and September 1, 2009. Effective June 1, 2010, the Servicing Agent discontinued the 0.025% voluntary fee waiver.
On October 15, 2009, Guggenheim Partners LLC, (“Guggenheim”), a global diversified financial services firm, and Claymore Group Inc., parent of the Servicing Agent, announced the completion of a previously announced merger. The closing of this transaction took place on October 14, 2009. This transaction resulted in a change-of-control whereby Claymore Group Inc. and its subsidiaries became indirect, wholly-owned subsidiaries of Guggenheim. The transaction has not affected the daily operations of the Fund or the services provided by the Servicing Agent.
The servicing agreement for the Fund automatically terminated as a result of the Guggenheim transaction. The Fund’s Board of Trustees considered and approved a new servicing agreement for the Fund; however, shareholder approval of the new agreement was not required.
Under a separate Fund Administration agreement, Claymore Advisors, LLC, an affiliate of the Servicing Agent, provides fund administration services to the Fund. Claymore Advisors, LLC receives a fund administration fee payable monthly at the annual rate set forth below as a percentage of the average daily managed assets of the Fund:
| Managed Assets | | Rate | |
| First $200,000,000 | | | 0.0275 | % |
| Next $300,000,000 | | | 0.0200 | % |
| Next $500,000,000 | | | 0.0150 | % |
| Over $1,000,000,000 | | | 0.0100 | % |
For the year ended July 31, 2010, the Fund incurred $47,660 in fund administration fees.
The Bank of New York Mellon (“BNY”) acts as the Fund’s custodian, accounting agent, auction agent and transfer agent. As custodian, BNY is responsible for the custody of the Fund’s assets. As accounting agent, BNY is responsible for maintaining the books and records of the Fund. As auction agent, BNY is responsible for conducting the auction of the preferred shares. As transfer agent, BNY is responsible for performing transfer agency services for the Fund.
Certain officers and/or trustees of the Fund are officers and/or directors of the Adviser and the Servicing Agent.
The Fund does not compensate its officers who are officers of the aforementioned firms.
Note 4 – Federal Income Taxes:
The Fund intends to comply with the requirements of Subchapter M of the Internal Revenue Code of 1986, as amended, applicable to regulated investment companies. Accordingly, no provision for U.S. federal income taxes is required. In addition, by distributing substantially all of its ordinary income and long-term capital gains, if any, during each calendar year, the Fund intends not to be subject to U.S. federal excise tax.
Information on the tax components of investments as of July 31, 2010 is as follows:
| Cost of | | | |
| Investments | Gross Tax | Gross Tax | Net Tax Unrealized |
| for Tax | Unrealized | Unrealized | Appreciation on |
| Purposes | Appreciation | Depreciation | Investments |
| $159,638,592 | $8,398,452 | $(1,816,045) | $6,582,407 |
The difference between book and tax basis cost of investments is due to book/tax differences on the recognition of partnership/trust income.
18 l Annual Report l July 31, 2010
MZF l Managed Duration Investment Grade Municipal Fund l Notes to Financial Statements continued
As of July 31, 2010, the components of accumulated earnings/(losses) (excluding paid-in capital) on a tax basis were as follows:
| | | Undistributed | | | Undistributed | | | Accumulated | | | Unrealized | |
| | | Tax-Exempt | | | Ordinary | | | Capital and | | | Appreciation/ | |
| | | Income | | | Income | | | Other Losses | | | (Depreciation) | |
| 2010 | | $ | 984,609 | | | $ | – | | | $ | (6,570,504 | ) | | $ | 6,582,407 | |
The cumulative timing differences under tax basis accumulated capital and other losses as of July 31, 2010 are due to investments in partnerships/trusts.
As of July 31, 2010, for federal income tax purposes, the Fund had a capital loss carryforward of $6,570,504 available to offset possible future capital gains. The capital loss carryforward is set to expire as follows: $1,172,775 on July 31, 2013, $625,460 on July 31, 2014 and $4,772,269 on July 31, 2017.
Distributions paid to shareholders during the tax years ended July 31, 2010 and 2009 were characterized as follows for tax purposes:
| | | Tax exempt | | | Ordinary | | | Long-term | | | Total | |
| | | income | | | income | | | capital gain | | | distributions | |
| 2010 | | $ | 8,245,149 | | | $ | 68,511 | | | $ | – | | | $ | 8,313,660 | |
| 2009 | | $ | 7,577,820 | | | $ | 135,216 | | | $ | – | | | $ | 7,713,036 | |
For all open tax years and all major jurisdictions, management of the Fund has concluded that there are no significant uncertain tax positions that would require recognition in the financial statements. Open tax years are those years that are open for examination by taxing authorities (i.e. generally the last four tax year ends and the interim tax period since then). Furthermore, management of the Fund is also not aware of any tax positions for which it is reasonably possible that the total amounts of unrecognized tax benefits will significantly change in the next twelve months.
Note 5 – Investment Transactions:
Purchases and sales of investment securities, excluding short-term investments, for the year ended July 31, 2010, aggregated $10,701,778 and $26,787,490, respectively.
Note 6 – Derivatives:
The Fund adopted ASC 815, Derivatives and Hedging (“ASC 815”) (formerly known as FAS No. 161). ASC 815 is intended to improve financial reporting about derivative instruments by requiring enhanced disclosures to enable investors to better understand: a) how and why a fund uses derivative instruments, b) how derivatives instruments and related hedge fund items are accounted for, and c) how derivative instruments and related hedge items affect a fund’s financial position, results of operations and cash flows.
The adoption of ASC 815 had no impact to the financial statements as the Fund did not hold derivative instruments during the year ended July 31, 2010.
Note 7 – Tender Offer:
On February 11, 2010, the Fund commenced a Tender Offer where the Fund agreed to purchase up to approximately 15% of the Fund’s outstanding common shares at a price equal to 98% of the Fund’s net asset value per share. Following the expiration of the Tender Offer on March 12, 2010, the Fund accepted 1,190,339 properly tendered shares representing approximately 15% of the Fund’s Common Shares outstanding at a price per Common Share of approximately $13.7298 (the“Repurchase Price”). The total value of assets of the Fund that was distributed in payment for such tendered Common Shares accepted in the Tender Offer based on the Repurchase Price was $16,343,117.
Note 8 – Capital:
There are an unlimited number of $.001 par value common shares of beneficial interest authorized and 6,749,259 common shares outstanding at July 31, 2010, of which the Adviser owned 10,348 shares.
| Transactions in common shares were as follows: |
| | | Year Ended | | | Year Ended | |
| | | July 31, 2010 | | | July 31, 2009 | |
| Beginning shares | | | 7,935,591 | | | | 7,935,591 | |
| Shares issued through dividend reinvestment | | | 4,007 | | | | – | |
| Common shares redeemed through tender offer | | | (1,190,339 | ) | | | – | |
| Ending shares | | | 6,749,259 | | | | 7,935,591 | |
On October 27, 2003, the Fund issued 1,389 shares of Auction Market Preferred Shares (“AMPS”), Series M7 and 1,389 shares of Auction Market Preferred Shares, Series W28. The preferred shares have a liquidation value of $25,000 per share plus any accumulated unpaid dividends. As of July 31, 2010, the Fund had 1,389 shares each of Auction Market Preferred Shares, Series M7 and W28, outstanding. Dividends on the preferred shares are cumulative at a rate that is set by auction procedures. Distributions of net realized capital gains, if any, are made annually.
The broad auction-rate preferred securities market, including the Fund’s AMPS, has experienced considerable disruption since mid-February, 2008. The result has been failed auctions on nearly all auction-rate preferred shares, including the Fund’s AMPS. A failed auction is not a default, nor does it require the redemption of the Fund’s AMPS.
Provisions in the AMPS offering documents establish a maximum rate in the event of a failed auction. The AMPS reference rate is the higher of LIBOR or 90% of the taxable equivalent of the short-term municipal bond rate. The maximum rate, for auctions for which the Fund has not given notice that the auction will consist of net capital gains or other taxable income, is the higher of the reference rate times 110% or the reference rate plus 1.10%.
Management will continue to monitor events in the marketplace and continue to evaluate the Fund’s leverage as well as any alternative that may be available.
The range of dividend rates on the Fund’s AMPS for the year ended July 31, 2010, were as follows:
| Series | Low | High | At 7/31/10 | Next Auction Date |
| M7 | 1.322% | 1.626% | 1.502% | 8/02/10 |
| W28 | 1.391% | 1.585% | 1.460% | 8/11/10 |
The Fund is subject to certain limitations and restrictions while the AMPS are outstanding. Failure to comply with these limitations and restrictions could preclude the Fund from declaring any dividends or distributions to common shareholders or repurchasing common shares and/or could trigger the mandatory redemption of AMPS at their liquidation value plus any accrued dividends.
The AMPS, which are entitled to one vote per share, generally vote with the common shares but vote separately as a class to elect two Trustees and on any matters affecting the rights of the AMPS.
Note 9 – Borrowings:
The Fund has an uncommitted $2,000,000 line of credit with BNY. Interest on the amount borrowed is based on the Federal Funds Rate plus a spread on outstanding balances. At July 31, 2010 there was a $45,000 balance in connection with the Fund’s uncommitted line of credit. The average daily amount of borrowings during the year ended July 31, 2010 was
Annual Report l July 31, 2010 l 19
MZF l Managed Duration Investment Grade Municipal Fund l Notes to Financial Statements continued
$84,633 with a related weighted average interest rate of 0.89%. The maximum amount outstanding during the year ended July 31, 2010, was $1,074,000.
Note 10 – Indemnifications:
In the normal course of business, the Fund enters into contracts that contain a variety of representations, which provide general indemnifications. The Fund’s maximum exposure under these arrangements is unknown, as this would require future claims that may be made against the Fund that have not yet occurred. However, the Fund expects the risk of loss to be remote.
Note 11 – Subsequent Events:
Dividend Declarations – Common Shareholders
The Fund has declared the following dividends to common shareholders:
| Rate Per | | Declaration | Ex-Dividend | Record | Payable |
| Share | | Date | Date | Date | Date |
| $ | 0.0825 | | 8/02/10 | 8/11/10 | 8/13/10 | 8/31/10 |
| $ | 0.0825 | | 8/02/10 | 9/13/10 | 9/15/10 | 9/30/10 |
| $ | 0.0825 | | 8/02/10 | 10/13/10 | 10/15/10 | 10/29/10 |
Subsequent to the fiscal year ended July 31, 2010, Claymore Securities, Inc. changed its name to Guggenheim Funds Distributors, Inc. Also, Claymore Advisors, LLC changed its name to Guggenheim Funds Investment Advisors, LLC.
20 l Annual Report l July 31, 2010
MZF l Managed Duration Investment Grade Municipal Fund
Report of Independent Registered Public Accounting Firm |
The Board of Trustees and Shareholders of
Managed Duration Investment Grade Municipal Fund
We have audited the accompanying statement of assets and liabilities of Managed Duration Investment Grade Municipal Fund (formerly, MBIA Capital/Claymore Managed Duration Investment Grade Municipal Fund, the Fund), including the portfolio of investments, as of July 31, 2010, and the related statements of operations for the year then ended, the statements of changes in net assets for each of the two years in the period then ended, and the financial highlights for each of the five years in the period then ended. These financial statements and financial highlights are the responsibility of the Fund's management. Our responsibility is to express an opinion on these financial statements and financial highlights based on our audits.
We conducted our audits in accordance with the standards of the Public Company Accounting Oversight Board (United States). Those standards require that we plan and perform the audit to obtain reasonable assurance about whether the financial statements and financial highlights are free of material misstatement. We were not engaged to perform an audit of the Fund’s internal control over financial reporting. Our audits included consideration of internal control over financial reporting as a basis for designing audit procedures that are appropriate in the circumstances, but not for the purpose of expressing an opinion on the effectiveness of the Fund’s internal control over financial reporting. Accordingly, we express no such opinion. An audit also includes examining, on a test basis, evidence supporting the amounts and disclosures in the f inancial statements and financial highlights, assessing the accounting principles used and significant estimates made by management, and evaluating the overall financial statement presentation. Our procedures included confirmation of securities owned as of July 31, 2010, by correspondence with the custodian and brokers or by other appropriate auditing procedures where replies from brokers were not received. We believe that our audits provide a reasonable basis for our opinion.
In our opinion, the financial statements and financial highlights referred to above present fairly, in all material respects, financial position of Managed Duration Investment Grade Municipal Fund at July 31, 2010, the results of its operations for the year then ended, the changes in its net assets for each of the two years in the period then ended, and the financial highlights for each of the five years in the period then ended, in conformity with U.S. generally accepted accounting principles.
Chicago, Illinois
September 27, 2010
Annual Report l July 31, 2010 l 21
MZF l Managed Duration Investment Grade Municipal Fund
Supplemental Information l (unaudited)
Federal Income Tax Information
Subchapter M of the Internal Revenue Code of 1986, as amended, requires the Fund to advise shareholders within 60 days of the Fund’s tax year end (July 31, 2010) as to the federal tax status of dividends and distributions received by shareholders during such tax period. Accordingly, please note that the majority of dividends paid from net investment income from the Fund during the tax period ended July 31, 2010 was federally exempt interest dividends. The Fund has invested in municipal bonds containing market discount, whose accretion is taxable and accordingly, 0.98% of the dividends paid from net investment income during the tax period are attributable to this taxable income. Therefore the Fund designated $8,245,149 as tax-exempt income.
Since the Fund’s fiscal year is not the calendar year, another notification will be sent with respect to calendar year 2010. In January 2011, you will be advised on IRS Form 1099 DIV or substitute 1099 DIV as to the federal tax status of the dividends and distributions received during calendar year 2010. The amount that will be reported will be the amount to use on your 2010 federal income tax return and may differ from the amount which must be reported in connection with the Fund’s tax year ended July 31, 2010. Shareholders are advised to consult with their tax advisers as to the federal, state and local tax status of the income received from the Funds. In January 2011, an allocation of interest by state will be provided which may be of value in reducing a shareholder’s state or local tax liability, if any.
Trustees
The Trustees of the Managed Duration Investment Grade Municipal Fund and their principal occupations during the past five years:
| Name, Address*, | | | Number of | |
| Year of | | | | |
Birth and | | | in the | Other |
| Term of Office** | Principal Occupation during | | Directorships |
| Held with | and Length of | the Past Five Years and | Overseen | Held by |
| Registrant | Time Served | Other Affiliations | by Trustee | Trustee |
| Independent Trustees: | | | | |
| Randall C. Barnes | Since 2006 | Private Investor (2001-present). Formerly, Senior Vice President & Treasurer, PepsiCo., Inc. | 52 | None |
| Year of Birth: 1951 | | (1993-1997), President, Pizza Hut International (1991-1993) and Senior Vice President, | | |
| Trustee | | Strategic Planning and New Business Development (1987-1990) of PepsiCo, Inc. (1987-1997). | | |
| Ronald A. Nyberg | Since 2003 | Partner of Nyberg & Cassioppi, LLC, a law firm specializing in corporate law, estate planning | 54 | None |
| Year of Birth: 1953 | | and business transactions (2000-present). Formerly, Executive Vice President, General | | |
| Trustee | | Counsel and Corporate Secretary of Van Kampen Investments (1982-1999). | | |
| Ronald E. Toupin, Jr. | Since 2003 | Retired. Formerly, Vice President, Manager and Portfolio Manager of Nuveen Asset | 51 | None |
| Year of Birth: 1958 | | Management (1998-1999), Vice President of Nuveen Investment Advisory Corp. (1992-1999), | | |
| Trustee | | Vice President and Manager of Nuveen Unit Investment Trusts (1991-1999), and Assistant | | |
| | | Vice President and Portfolio Manager of Nuveen Unit Investment Trusts (1988-1999), each of | | |
| | | John Nuveen & Co., Inc. (1982-1999). | | |
| Interested Trustees: | | | | |
| Clifford D. Corso† | Since 2003 | President of Cutwater Asset Management; Chief Investment Officer, MBIA Insurance Corp. | 1 | None |
| 113 King Street | | | | |
| Armonk, NY 10504 | | | | |
| Year of Birth: 1961 | | | | |
| Trustee and President | | | | |
| Kevin M. Robinson†† | Trustee since | Senior Managing Director and General Counsel of Claymore Advisors, LLC, Claymore | 2 | None |
| Year of Birth: 1959 | 2009 | Securities, Inc. and Claymore Group Inc. (2007-present). Formerly, Associate General Counsel | | |
| Trustee and | Chief Legal Officer | and Assistant Corporate Secretary of NYSE Euronext, Inc. (2000-2007). | | |
| Chief Legal Officer | since 2008 | | | |
| * | The business address of each Trustee unless otherwise noted is c/o Managed Duration Investment Grade Municipal Fund, 2455 Corporate West Drive, Lisle, IL 60532. |
| ** | The Trustees of each class shall be elected at an annual meeting of shareholders or special meeting in lieu thereof called for that purpose, and each Trustee elected shall hold office until his or her successor shall have been duly elected and qualified. The term of office of a Trustee shall terminate and a vacancy shall occur in the event of the death, resignation, removal, bankruptcy, adjudicated incompetence or other incapacity to perform the duties of the office of Trustee. |
| *** | The Claymore Fund Complex consists of U.S. registered investment companies advised or serviced by Claymore Advisors, LLC or Claymore Securities, Inc. The Claymore Fund Complex is overseen by multiple Boards of Trustees. |
| † | Mr. Corso is an“interested person”(as defined in Section 2(a)(19) of the Investment Company Act of 1940, as amended) of the Fund because of his position as an officer of Cutwater Asset Management the Fund’s Investment Adviser. |
| †† | Mr. Robinson is an “interested person”(as defined in Section 2(a)(19) of the Investment Company Act of 1940, as amended) of the Fund because of his position as an officer of Claymore Securities, Inc., the Fund’s Servicing Agent and certain of its affiliates. |
22 l Annual Report l July 31, 2010
MZF l Managed Duration Investment Grade Municipal Fund l Supplemental Information (unaudited) continued
Principal Executive Officers
The Officers of the Managed Duration Investment Grade Municipal Fund and their principal occupations during the past five years:
| Name, Address*, | Term of | |
| Year of | Office** | |
| Birth and | and | |
| Position(s) | Length of | Principal Occupation During |
| Held with | Time | the Past Five Years and |
| Registrant | Served | Other Affiliations |
| Officers: | | |
| J. Thomas Futrell | Since 2008 | Senior Managing Director and Chief Investment Officer of Claymore Advisors, LLC and Claymore Securities, Inc. (2008-present). Formerly, |
| Year of birth: 1955 | | Managing Director of Research, Nuveen Asset Management (2000-2007). |
| Chief Executive Officer | | |
| Steven M. Hill | Since 2006 | Senior Managing Director of Claymore Advisors, LLC and Claymore Securities, Inc. (2005-present). Chief Financial Officer of Claymore |
| Year of Birth: 1964 | | Group Inc. (2005-2006). Managing Director of Claymore Advisors, LLC and Claymore Securities, Inc. (2003-2005). Formerly, Treasurer |
| Chief Financial Officer, | | of Henderson Global Funds and Operations Manager for Henderson Global Investors (NA) Inc., (2002-2003); Managing Director, |
| Chief Accounting | | FrontPoint Partners LLC (2001-2002). |
| Officer and | | |
| Treasurer | | |
| Melissa J. Nguyen | Since 2006 | Vice President and Assistant General Counsel of Claymore Group Inc. (2005-present). Secretary of certain funds in the Fund Complex. |
| Year of Birth: 1978 | | Formerly, Associate, Vedder Price P.C. (2003-2005). |
| Secretary | | |
| Bruce Saxon | Since 2006 | Vice President, Fund Compliance Officer of Claymore Group (2006 – present). Formerly, Chief Compliance Officer/Assistant Secretary |
| Year of Birth: 1957 | | of Harris Investment Management, Inc. (2003-2006). Director – Compliance of Harrisdirect LLC (1999-2003). |
| Chief Compliance | | |
| Officer | | |
| Jeffrey S. MacDonald | Since 2007 | Director of Advisory Services Portfolio Management, MBIA Asset Management (2007-present). Formerly, Vice President and Portfolio |
| 113 King Street | | Manager, Hartford Investment Management Company (2005-2007); Fixed Income Portfolio Analyst, Wellington Management Company |
| Armonk, NY 10504 | | (2000-2004). |
| Year of Birth: 1970 | | |
| Vice President | | |
| James B. DiChiaro | Since 2009 | Vice President, Cutwater Asset Management Corp. (1999-present) |
| 113 King Street | | |
| Armonk, NY 10504 | | |
| Year of Birth: 1976 | | |
| Vice President | | |
| * | The business address of each officer, unless otherwise noted, is c/o Managed Duration Investment Grade Municipal Fund, 2455 Corporate West Drive, Lisle, IL 60532. |
| ** | Officers serve at the pleasure of the Board of Trustees and until his or her successor is appointed and qualified or until his or her earlier resignation or removal. |
Annual Report l July 31, 2010 l 23
MZF l Managed Duration Investment Grade Municipal Fund
Board Considerations Regarding Investment Advisory Agreement Contract Re-approval l
On April 21, 2010, the Board of Trustees, including the Independent Trustees (those trustees who are not“interested persons”as defined under the Investment Company Act of 1940, as amended), of Managed Duration Investment Grade Municipal Fund (the“Fund”) met to consider the renewal of the investment advisory agreement (the“Advisory Agreement”) between the Fund and Cutwater Asset Management Corp. (f/k/a MBIA Capital Management Corp.) (the“Adviser”). As part of their review process, the Independent Trustees were represented by independent legal counsel. The Board of Trustees reviewed materials received from the Adviser, Claymore Securities, Inc. (“Claymore Securities”), the servicing agent of the Fund, Claymore Advisors, LLC (“Claymore Advisors”and, together with Claymore Securiti es, “Claymore”), the administrator of the Fund, the Fund and independent legal counsel with respect to contract renewal.
In preparation for their review, the Independent Trustees communicated with independent legal counsel regarding the nature of information to be provided, and independent legal counsel, on behalf of the Independent Trustees, sent a formal request for information to the Adviser and Claymore. The Adviser and Claymore provided extensive information in response to the request. In executive sessions on April 8, 2010 and April 21, 2010, the Independent Trustees met to discuss the information provided by the Adviser and Claymore. On the basis of the April 8 meeting and in consultation with independent legal counsel, the Independent Trustees sent a formal request for additional information to the Adviser and Claymore. The Adviser and Claymore supplemented their initial responses with additional information to the satisfaction of the Independent Trustees.
Among other information, the Adviser provided general information to assist the Independent Trustees in assessing the nature and quality of services provided by the Adviser; information comparing the investment performance of the Fund to a peer group of closed-end funds selected by the Adviser and Claymore with similar characteristics to the Fund including, but not limited to, investment objectives and strategies, effective duration targets, assets under management, the use of leverage and the lack of a termination date (the “Adviser Performance Peer Group”); information comparing the advisory fees and expense ratios of a group of funds selected by the Adviser and Claymore with assets under management, the use of leverage and the lack of a termination date similar to the Fund (the“Adviser Expense Peer Group”); information co mparing the investment performance and advisory fees of the Fund to other institutional clients of the Adviser with similar investment objectives to the Fund; and information about the Adviser’s profitability and the effectiveness of the compliance program adopted by the Adviser.
Based upon its review, the Board of Trustees unanimously concluded that it was in the best interest of the Fund and its shareholders to renew the Advisory Agreement. In deciding to recommend the renewal of the Advisory Agreement, the Board of Trustees did not identify any single factor or particular information that, in isolation, was controlling. This summary describes the most important, but not all, of the factors considered by the Board of Trustees.
With respect to the nature, extent and quality of the services provided by the Adviser, the Board of Trustees considered the Adviser’s response to various inquiries, including regulatory and legal issues, the Adviser’s Form ADV, financial information regarding the Adviser and the financial support provided to the Fund in the form of a fee waiver. The Board noted that, since February 2010, the Adviser had been restructured as an independent operating subsidiary of MBIA, Inc., with oversight of its own capital base, compensation structure and management team. The Board of Trustees also considered the key personnel available to manage the portfolio. The Board of Trustees considered the Adviser’s ability to achieve the Fund’s investment objective of providing common shareholders with high current income exempt from regular federal income tax while seeking to protect the value of the Fund’s assets during periods of interest rate volatility, and noted the Fund’s current monthly distribution of $0.0825 per share represented an annualized distribution rate of 7.42% based on the Fund’s market price as of January 31, 2010 (or an 11.42% taxable equivalent yield for taxpayers in the 35% tax bracket). The Board of Trustees also noted that the Fund’s monthly distribution rate had been increased four times since July 2008, from $0.0525 to $0.0825, a total increase of 57%.
In considering investment performance, the Board of Trustees reviewed the Fund’s performance relative to the Barclays General Municipal Index and the Barclays 15 Year Municipal Index (“Barclays Indices”) and the Adviser Performance Peer Group. The Board of Trustees reviewed the Fund’s total return on a net asset value basis for the six months ended January 31, 2010 and the one-year, three-year, five-year and since inception periods ended July 31, 2009. It was noted that the Fund outperformed the Barclays 15 Year Municipal Index for the six-months ended January 31, 2010 but underperformed the Barclays Indices for all periods ended July 31, 2009. The Fund also outperformed the Adviser Performance Peer Group for the six-months ended January 31, 2010 and for the one-year and three-year periods ended July 31, 2009. Specifically, the Trustees noted that the Fund ranked three out of eight based on net asset value performance for the one-year period ended July 31, 2009 and four out of eight for the six-months ended January 31, 2010. The Board of Trustees considered that the Fund’s performance had improved since Mr. Jeffrey MacDonald became a portfolio manager of the Fund. The Board noted that the Adviser does not manage any other institutional accounts with a mandate similar to that of the Fund.
The Board of Trustees also noted that the Fund had conducted a tender offer for up to 15% of its outstanding common shares during the first quarter of 2010, and that the offer was oversubscribed. The Board of Trustees then discussed the fact that there may be three potential conditional tender offers upon the occurrence of certain events and certain other terms and conditions. The Trustees noted that the Fund was currently trading at only a slight discount and that management believed that it was possible that the potential conditional tender offer in June would not occur, and thus the conditional tender offer program would also expire.
The Board of Trustees then considered the Fund’s fees and expenses. In reviewing the Fund’s advisory fees, the Trustees factored in the administration fee paid to Claymore Advisors and the servicing fee paid to Claymore Securities since those functions are typically included in the management fees of the Adviser Expense Peer Group. The Board of Trustees also compared the Fund’s administration fees and servicing fees paid to the Claymore Advisors and Claymore Securities, respectively, to similar fees received by Claymore from certain of their other institutional clients. In addition, the Board of Trustees compared the administration fee paid to Claymore Advisors to the fees that would be charged for similar services provided by an alternate service provider. The Trustees noted that the Adviser and Claymore Securities had offered to continue to waive a portion of their contractual fees until June 30, 2013, but requested the expiration of the additional voluntary fee waivers after June 30, 2010. In considering the expiration of the voluntary fee waivers, the Trustees noted the Fund’s recent improved performance and determined that, should the Fund’s conditional tender offer program expire on June 1, 2010 with no conditional tender offers conducted, the voluntary fee waivers would expire as of June 1, 2010. At the request of the Trustees, the Adviser and Claymore Securities agreed to continue the contractual fee waivers for an additional three years. While the contractual fees were higher than the Adviser Expense Peer Group, after giving effect to these waivers, the Trustees noted that the combined advisory, administration and servicing fees were within a reasonable range of the average advisory fee (net of waivers) of the Adviser Expense Peer Group.
24 l Annual Report l July 31, 2010
MZF l Managed Duration Investment Grade Municipal Fund l Board Considerations continued
With respect to the profits realized by the Adviser from its relationship with the Fund, the Board of Trustees reviewed information regarding the revenues the Adviser received under the Advisory Agreement as well as the direct and estimated indirect costs the Adviser incurred in providing the services to the Fund. The Trustees noted that the Adviser was earning a reasonable profit from its relationship with the Fund.
With respect to potential economies of scale, the Trustees noted that, as a closed-end fund, the Fund was not expected to materially increase in size and in fact, had diminished in size as a result of the tender offer which expired on March 12, 2010. Therefore the Board of Trustees did not consider economies of scale as a principal factor in assessing the fee rates payable under the Agreement.
Overall Conclusions
Based upon all of the information considered and the conclusions reached, the Board of Trustees determined that the terms of the Advisory Agreement continue to be fair and reasonable and that the continuation of the Advisory Agreement was in the best interests of the Fund and its shareholders.
Annual Report l July 31, 2010 l 25
MZF l Managed Duration Investment Grade Municipal Fund
Dividend Reinvestment Plan l (unaudited)
Pursuant to the Fund’s Automatic Dividend Reinvestment Plan (the“Plan”), unless a shareholder is ineligible or elects otherwise, all dividend and capital gains distributions are automatically reinvested by The Bank of New York Mellon (“Administrator”), as agent for shareholders in administering the Plan (the“Plan Agent”), in additional common shares of the Fund. Shareholders whose shares are held in the name of a broker or nominee should contact such broker or nominee to confirm that they are eligible to participate in the Plan. Shareholders who are ineligible or who elect not to participate in the Plan will receive all dividends and distributions in cash paid by check mailed directly to the shareholder of record (or, if the shares are held in street or other nominee name, then to such nominee) by Administr ator, as dividend paying agent. Such shareholders may elect not to participate in the Plan and to receive all distributions of dividends and capital gains in cash by sending written instructions to Administrator, as dividend paying agent, at the address set forth below. Participation in the Plan is completely voluntary and may be terminated or resumed at any time without penalty by written notice if received by the Plan Agent not less than ten days prior to any dividend record date; otherwise, such termination will be effective with respect to any subsequently declared dividend or capital gains distribution.
Whenever the Fund declares an ordinary income dividend or a capital gain dividend (collectively referred to as“dividends”) payable in cash, nonparticipants in the Plan will receive cash, and participants in the Plan will receive the equivalent in common shares. The shares are acquired by the Plan Agent for the participant’s account, depending upon the circumstances described below, either (i) through receipt of additional unissued but authorized common shares from the Fund (“newly issued shares”) or (ii) by purchase of outstanding common shares on the open market (“open-market purchases”) on the New York Stock Exchange or elsewhere. If, on the dividend payment date, the market price per common share plus estimated brokerage commissions is greater than the net asset value per common share (such condition bei ng referred to herein as“market premium”), the Plan Agent will invest the dividend amount in newly issued shares on behalf of the participant. The number of newly issued common shares to be credited to the participant’s account will be determined by dividing the dollar amount of the dividend by the net asset value per share on the payment date, provided that, if the net asset value per share is less than or equal to 95% of the market price per share on the payment date, the dollar amount of the dividend will be divided by 95% of the market price per share on the payment date. If on the dividend payment date the net asset value per share is greater than the market value plus estimated brokerage commissions (such condition being referred to herein as“market discount”), the Plan Agent will invest the dividend amount in shares acquired on behalf of the participant in open-market purchases.
If, before the Plan Agent has completed its open-market purchases, the market price of the common shares exceeds the net asset value per share, the average per share purchase price paid by the Plan Agent may exceed the net asset value of the Fund’s shares, resulting in the acquisition of fewer shares than if the dividend had been paid in newly issued shares on the dividend payment date. Because of the foregoing difficulty with respect to open-market purchases, the Plan provides that if the Plan Agent is unable to invest the full dividend amount in open-market purchases during the purchase period or if the market discount shifts to a market premium during the purchase period, the Plan Agent may cease making open-market purchases and may invest the uninvested portion of the dividend amount in newly issued shares at the net asset value per share at the close of business on the last purchase date; provided that, if the net asset value per share is less than 95% of the market price per share on the payment date, the dollar amount of the dividend will be divided by 95% of the market price per share on the payment date.
The Plan Agent maintains all shareholders’accounts in the Plan and furnishes written confirmation of all transactions in the account, including information needed by shareholders for tax records. Shares in the account of each Plan participant will be held by the Plan Agent in the name of the participant, and each shareholder’s proxy will include those shares purchased or received pursuant to the Plan. The Plan Agent will forward all proxy solicitation materials to participants and vote proxies for shares held pursuant to the Plan in accordance with the instructions of the participants.
There will be no brokerage charges with respect to shares issued directly by the Fund as a result of dividends or capital gains distributions payable either in shares or in cash. However, each participant will pay a pro rata share of brokerage commissions incurred with respect to the Plan Agent’s open-market purchases in connection with the reinvestment of dividends. The automatic reinvestment of dividends and distributions will not relieve participants of any Federal, state or local income tax that may be payable (or required to be withheld) on such dividends.
The Fund reserves the right to amend or terminate the Plan. There is no direct service charge to participants in the Plan; however, the Fund reserves the right to amend the Plan to include a service charge payable by the participants. All questions and correspondence concerning the Plan should be directed to the Plan Administrator, BNY Mellon Shareowner Services, P.O. Box 358015, Pittsburgh, PA 15252-8015, Phone Number: 866-488-3559.
26 l Annual Report l July 31, 2010
MZF l Managed Duration Investment Grade Municipal Fund
Fund Information l
| | | | |
| Board of Trustees | Officers | Investment Adviser | Legal Counsel |
| Randall C. Barnes | Clifford D. Corso | Cutwater Asset | Simpson Thacher & |
| | President | Management Corp. | Bartlett LLP |
| Clifford D. Corso* | | Armonk, New York | New York, New York |
| | J. Thomas Futrell | | |
| Ronald A. Nyberg | Chief Executive Officer | Servicing Agent | Independent Registered |
| | | Claymore Securities, Inc. | Public Accounting Firm |
| Kevin M. Robinson** | Kevin M. Robinson | Lisle, Illinois | |
| | Chief Legal Officer | | Chicago, Illinois |
| Ronald E.Toupin, Jr. | | Administrator | |
| | Steven M. Hill | Claymore Advisors, LLC | |
| | Chief Financial Officer, | Lisle, Illinois | |
| * Trustee is an “interested person” of the | | | |
| Fund as defined in the Investment | and Treasurer | | |
| Company Act of 1940, as amended, as a | | Custodian, Transfer | |
| result of his position as an officer of the | Jeffrey S. MacDonald | Agent and Auction Agent | |
| Fund’s Investment Adviser. | | The Bank of | |
| | | New York Mellon | |
| | James B. DiChiaro | | |
| ** Trustee is an “interested person” of the | Vice President | | |
| Fund as defined in the Investment | | | |
| Company Act of 1940, as amended, | Bruce Saxon | | |
| as a result of his position as an officer | Chief Compliance Officer | | |
| of Claymore Securities, Inc., the | | | |
| Fund’s Servicing Agent and certain | Melissa J. Nguyen | | |
| of its affiliates. | | | |
Privacy Principles of Managed Duration Investment Grade Municipal Fund for Shareholders
The privacy of your personal financial information is extremely important to us. When you open an account with us, we collect a significant amount of information from you in order to properly invest and administer your account. We take very seriously the obligation to keep that information private and confidential, and we want you to know how we protect that important information.
We collect nonpublic personal information about you from applications or other forms you complete and from your transactions with us and our affiliates. We do not disclose information about you, or our former clients, to our affiliates or to service providers or third parties, except as permitted by law. We share only the minimum information required to properly administer your accounts, which enables us to send transaction confirmations, monthly or quarterly statements, financial and tax forms. Even within MBIA and its affiliated entities, only a limited number of people who actually service accounts will ever have access to your personal financial information. Further, we do not share information about our current or former clients with any outside marketing groups or sales entities.
To ensure the highest degree of security and confidentiality, MBIA and its affiliates maintain various physical, electronic and procedural safeguards to protect your personal information. We also apply special measures for authentication of information you request or submit to us on our website- www.MBIA.com.
Questions concerning your shares of Managed Duration Investment Grade Municipal Fund:
| • If your shares are held in a Brokerage Account, contact your Broker. |
| • If you have physical possession of your shares in certificate form, contact the Fund’s Accounting Agent, Custodian, Transfer Agent and Auction Agent: |
| The Bank of New York Mellon, 101 Barclay 11E, New York, New York 10286 (866) 488-3559 |
This report is sent to shareholders of Managed Duration Investment Grade Municipal Fund for their information. It is not a Prospectus, circular or representation intended for use in the purchase or sale of shares of the Fund or of any securities mentioned in this report.
The Fund has adopted the Adviser’s proxy voting policies and procedures to govern the voting of proxies relating to the voting securities of the Fund. A description of the Adviser’s proxy voting policies and procedures related to portfolio securities is available without charge, upon request, by calling the Fund at (866) 819-5301.
Information regarding how the Fund voted proxies for portfolio securities, if applicable, during the most recent 12-month period ended June 30, is also available, without charge and upon request by calling (866) 819-5301 or by accessing the Fund’s Form N-PX on the U.S. Securities and Exchange Commission’s (“SEC”) website at www.sec.gov or www.claymore/mzf.com.
The Fund files its complete schedule of portfolio holdings with the SEC for the first and third quarters of each fiscal year on Form N-Q. The Fund’s Form N-Q is available on the SEC website at www.sec.gov or www.claymore.com/mzf. The Fund’s Form N-Q may also be viewed and copied at the SEC’s Public Reference Room in Washington, DC. Information on the operation of the Public Reference Room may be obtained by calling (800) SEC-0330 or at www.sec.gov .
Notice to Shareholders
Notice is hereby given in accordance with Section 23(c) of the Investment Company Act of 1940, as amended, that the Fund from time to time may purchase shares of its common and preferred stock in the open market or in private transactions.
Effective 7/19/2010, the By-Laws of the Fund were changed as follows:
If the Shareholders of any class or series of Shares are entitled to elect one or more Trustees, only such persons who are holders of record of such class or series of shares at the time notice is provided with regards to the Annual Meetings of Shareholders shall be entitled to nominate persons for election as a Trustee by such class or series of Shares voting separately
Annual Report l July 31, 2010 l 27
MZF l Managed Duration Investment Grade Municipal Fund
About the Fund Manager l
Cutwater Asset Management
Cutwater Asset Management (“Cutwater”), the Fund’s Investment Adviser, is based in Armonk, NewYork and was created in 1991 to provide fixed-income investment products and services to institutional and retail clients.The firm specializes in the management of fixed-income securities and provides expertise in investment-grade municipal bond investing. Cutwater is a wholly-owned subsidiary of MBIA, Inc., which is listed on the NewYork Stock Exchange and is a component stock of the S&P 500 Index.Additional information can be found at cutwater.com.
Investment Philosophy
Cutwater Asset Management’s philosophy is anchored in the conviction that a high quality municipal portfolio diversified among maturities will provide favorable risk-adjusted performance over time and through a variety of market cycles. Cutwater Asset Management believes that security selection is enhanced by its large and dedicated staff of credit analysts. Each analyst has a thorough understanding of the broad market, but focuses research on a particular segment of the larger market.
Investment Process
Investment strategy, including credit quality, yield curve positioning and duration targets, is set for portfolios at regular strategy meetings with the firm’s chief investment officer, portfolio managers and sector specialists. Credit quality decisions are based on credit bands established for each of the portfolios and the current relative value of securities within each of the credit bands. Duration target decisions are based on duration bands which direct the overall risk profile of portfolios relative to their benchmarks and the consensus outlook on the term structure of interest rates. Duration management is extended to each of the individual market sectors. Using the guidelines established in the strategy meetings, the municipal portfolio managers work closely with research analysts. Cutwater’s rigorous bottom-up process is ro oted in fundamental credit analysis and Cutwater’s proprietary research.
| Cutwater Asset Management | Claymore Securities, Inc. |
| 113 King Street | 2455 Corporate West Drive |
| Armonk, NY 10504 | Lisle, IL 60532 |
| (09/10) | Member FINRA/SIPC |
| | (09/10) |
NOT FDIC-INSURED l NOT BANK- GUARANTEED l MAY LOSE VALUE