Washington, D.C. 20549
Scott L. Barbee
Item 1. Reports to Stockholders.

Shareholders’ Letter
February 12, 2014
To the Shareholders of the Aegis High Yield Fund:
We are pleased to present the Aegis High Yield Fund Annual Report for the fiscal year ended December 31, 2013.
If at any time you would like further information about the Fund, please go to our website at www.aegisfunds.com for a more detailed look at our high yield bond market commentary and the Fund’s performance record. We will briefly review the objectives and strategy of the Aegis High Yield Fund.
The Aegis High Yield Fund seeks maximum total return with an emphasis on high current income. The Fund attempts to earn consistent total returns that exceed its benchmark index over periods of three to five years, while striving for below-average risk compared to its peers. We use in-depth fundamental analysis of issuers to identify bonds and build a portfolio with the potential for capital appreciation due to improved company performance, ratings upgrades, or better industry conditions. We seek situations where Wall Street’s appraisal of a security’s value is more negative than we have determined based upon an independent study of the fundamentals. The bonds purchased for the portfolio are not necessarily the highest-yielding issues in the market. Our goal is to maximize risk-adjusted long-term total return.
| | | | | | | | | | | | |
| | | | | | | | | Since I Share | | Since A Share | |
| | | One Year | | Three Year | | Five Year | | Inception | | Inception | |
| Class I shares - at NAV (Inception-1/2/04) | | 9.54% | | 4.91% | | 16.66% | | 7.55% | | N/A | |
| Class A shares - at NAV (Inception-8/24/12) | | | | N/A | | N/A | | N/A | | 8.50% | |
| Class A shares - With 3.75% Load | | 5.11% | | N/A | | N/A | | N/A | | 5.51% | |
| Barclays Capital High Yield Index | | 7.44% | | 9.32% | | 18.93% | | 8.62% | | 9.30% | |
Performance data quoted represents past performance. Past performance does not guarantee future results. Investment return and principal value of an investment will fluctuate so that an investor’s shares, when redeemed, may be worth more or less than their original cost. Current performance may be lower or higher than the performance data quoted. Please call 800-528-3780 to obtain performance data current to the most recent month-end. The Aegis High Yield Fund imposes a 2% redemption fee on shares held for less than 180 days. Performance data does not reflect the redemption fee, which would have reduced the total return. Performance data for the AHYAX shares reflect the Class A maximum sales charge of 3.75%. Performance data shown for the Class A-at NAV does not reflect the deduction of the sales load or fee. If reflected, the load or fee
would reduce the performance quoted. The Fund Class I and Class A have an annualized gross expense ratio of 1.52% and 2.19%, respectively per the Fund’s most recent Prospectus. The Fund Class I and Class A’s net annualized expense ratio, after fee waivers, is 1.20%, and 1.45%, respectively. The Advisor has contractually agreed to waive fees through 4/30/2014.
Aegis High Yield Fund | | |
| Net Assets | $59.0 Million | $10.0 Million |
| NAV / Share. | $8.85 | $8.82 |
| Net Expense Ratio (inclusive of | | |
| Management & 12b-1 Fee)* | 1.20% | 1.45% |
| Gross Expense Ratio* | 1.52% | 2.19% |
| Management Fee | 0.90% | 0.90% |
| Distribution Fee (12b-1) | None | 0.25% |
| Redemption Fee (<180 Days) | 2.00% | 2.00% |
| 30-Day SEC Yield- Subsidized** | 8.42% | 7.85% |
| 30-Day SEC Yield- Unsubsidized** | 8.36% | 7.80% |
| Income & capital gain distributions | $0.7650 | $0.7443 |
* As reported in the Funds Prospectus dated April 30, 2013
** As of December 31, 2013
| | Aegis High | Barclays Capital |
| | Yield Fund | High Yield Index |
| | | |
| Weighted Average Maturity (years) | 3.6 | 6.6 |
| Adjusted Duration (including cash) | 2.0 | 4.2 |
The adjusted duration of the Fund portfolio (excluding Fund holdings of equity securities) was estimated at 2.0 years, compared to a reported 4.2 years for the Barclays Capital High Yield Index. Duration is a measure of the sensitivity of a portfolio’s value to changes in interest rates. Generally, a shorter duration makes portfolio returns less sensitive to the risk of rising interest rates.
All historic performance returns shown in this shareholders’ letter for the Aegis High Yield Fund are pre-tax returns. Investment performance reflects fee waivers and in the absence of these waivers returns would be lower.
For the fiscal year ended December 31, 2013, the Fund posted a total return of 9.54 percent and 9.06 percent return for the Class I and A shares, respectively, versus a total return of 7.44 percent for its benchmark, the Barclays Capital High Yield Index (“the Index”). Top contributors to Fund performance include the Staunton Hotel Bonds, Magnum Hunter Preferred Stocks, Woodbine Holdings Warrants and Dispensing Dynamics International Bonds. Poor performance in holdings of Jaguar Mining Bonds and Zaza Energy Convertible Notes muted Fund returns in what was otherwise a good year. From inception at January 2, 2004 through period end, the Fund’s annualized total return was 7.55 percent, versus 8.62 percent for the Barclays Capital High Yield Index.
After a strong 15.81 percent return in 2012, the Barclays Capital High Yield Index returned a respectable 7.44 percent in 2013. Fears of asset purchase tapering began to take hold in May, eroding Index returns, which fell 3.18 percent over May and June, leaving the Index with a mid-year 2013 gain of just 1.42 percent. However, as investors returned to a more positive state after reassessing the impact of the Federal Reserve’s measured withdrawal from the market, the high yield market recovered from its mid- year swoon to post a rare coupon clipping-like return for the year. The high yield spread over 10-year Treasuries (as measured by the Yield-to-Worst of the Barclays Capital High Yield Index over 10-year Treasuries) contracted by a sizable 175 basis points in
2013 to close 2013 at 2.60 percent, 255 basis points below its historical average spread since 1994. 10-year Treasury yields increased 126 basis points during 2013 to 3.04 percent from the near historic low of 1.78 percent at year-end 2012.
A more in-depth review of the Fund’s performance, outlook and general market commentary can be found in the Fourth Quarter 2013 Manager’s Letter. For those of you who do not automatically receive our quarterly manager’s letters in the mail from your broker, they are available on our website at www.aegisfunds.com or by calling us at 800-528-3780. However, please be aware that these manager’s letters are not a part of the SEC-mandated Annual Report contained in this booklet. We thank you for your continued interest.
Aegis Financial Corporation
Scott L. Barbee, CFA
Managing Director, Portfolio Manager
Must be preceded or accompanied by Prospectus.
Opinions expressed are subject to change at any time, are not guaranteed and should not be considered investment advice.
Any recommendation made in this report may not be suitable for all investors. This presentation does not constitute a solicitation or offer to purchase or sell any securities. Its use in connection with any offering of Fund shares is authorized only in the case of a concurrent or prior delivery of a prospectus.
Mutual fund investing involves risk. Principal loss is possible. This risk is usually greater for longer-term debt securities. Investments in lower-rated and non-rated securities present a greater risk of loss to principal and interest than higher-rated securities. Investments in foreign securities involve greater volatility and political, economic and currency risks and differences in accounting methods. Investments in debt securities typically decrease in value when interest rates rise.
Basis Point: One 100th of one percent.
Barclays Capital High Yield Index: An index that measures the market of USD- denominated, non-investment grade, fixed-rate, taxable corporate bonds
Yield-to-Worst: The lowest potential yield that can be received on a bond without the issuer actually defaulting. The yield to worst is calculated by making worst-case scenario assumptions on the issue by calculating the returns that would be received if provisions, including prepayment, call or sinking fund, are used by the issuer. This metric is used to evaluate the worst-case scenario for yield to help investors manage risks and ensure that specific income requirements will still be met even in the worst scenarios.
An investment cannot be made directly in an index.
Fund holdings, sector allocations, and geographic allocations are subject to change and are not a recommendation to buy or sell any security. Please see the schedule of portfolio investments provided in this report for the complete listing of fund holdings.
Fund Distributor: Quasar Distributors, LLC. Quasar Distributors, LLC is affiliated with U.S. Bancorp Fund Services, LLC.
About Your Fund’s Expenses
December 31, 2013
(Unaudited)
Important Note
As a shareholder of the Fund, you incur two types of costs: (1) transaction costs, including sales charges (loads) on purchase payments and redemption fees, and (2) ongoing costs, including advisory fees, distribution (12b-1) fees (Class A only) and other Fund expenses. If you purchase Class A shares of the Funds you will pay an initial sales charge of 3.75% when you invest. Class I shares of the Funds charge no sales load.
This example is intended to help you understand your ongoing costs (in dollars) of investing in the Fund and to compare these costs with the ongoing costs of investing in other mutual funds. The example is based on an investment of $1,000 invested at the beginning of the period and held for the entire period, July 1, 2013 - December 31, 2013 for the Aegis High Yield Fund Class I and Class A.
Actual expenses
The table below provides information about actual account values and actual expenses.
Hypothetical example for comparison purposes
The below table also provides information about hypothetical account values and hypothetical expenses based on the Fund’s actual expense ratio and an assumed rate of return of 5% per year before expenses, which is not the Fund’s actual return. The hypothetical account values and expenses may not be used to estimate the actual ending account balance or expenses you paid for the period. You may use this information to compare the ongoing costs of investing in the Fund and other funds. To do so, compare this 5% hypothetical example with the 5% hypothetical examples that appear in the shareholder reports of the other funds.
Please note that the expenses shown in the table are meant to highlight your ongoing costs only, and do not reflect any transactional cost, such as sales charges (loads), or redemption fees (if applicable). Therefore, the hypothetical section of the tables is useful in comparing ongoing cost only, and will not help you determine the relative total cost of owning different funds. In addition, if these transactional costs were included, your cost would have been higher.
| | | | | | | | | Hypothetical | |
| | | | | | | | | (5% annual return | |
| | | | | Actual | | before expenses) | |
| | | Beginning | | Ending | | | | Ending | | | |
| | | Account | | Account | | Expenses | | Account | | Expenses | |
| | | Value | | Value(1) | | Paid During | | Value(1) | | Paid During | |
| | | 7/1/13 | | 12/31/13 | | Period | | 12/31/13 | | Period | |
| Aegis High Yield Fund – Class A | | $1,000.00 | | $1,053.80 | | $7.52(2) | | $1,025.21 | | $7.37(2) | |
| Aegis High Yield Fund – Class I | | $1,000.00 | | $1,057.30 | | $6.22(3) | | $1,025.21 | | $6.12(3) | |
| (1) | The actual ending account value is based on the actual total return of the Fund for the period July 1, 2013 to December 31, 2013 after actual expenses and will differ from the hypothetical ending account value which is based on the Fund’s actual expense ratio and a hypothetical annual return of 5% before expenses. |
| (2) | Expenses are equal to the Fund’s annualized expense ratio (1.45%) multiplied by the average account value over the period, multiplied by 184/365 (to reflect the period between 7/1/2013 – 12/31/2013). |
| (3) | Expenses are equal to the Fund’s annualized expense ratio (1.20%) multiplied by the average account value over the period, multiplied by 184/365 (to reflect the period between 7/1/2013 – 12/31/2013). |
Please see performance data disclosure on page 1
You may use the information in this table, together with the amount you invested, to estimate the expenses that you paid over the period. Simply divide your account value by $1,000 (for example, an $8,600 account value divided by $1,000 = 8.6), then multiply the result by the number in the table under the heading entitled “Expenses Paid During Period” to estimate the expenses you paid on your account during this period.
Key Statistics (Unaudited)
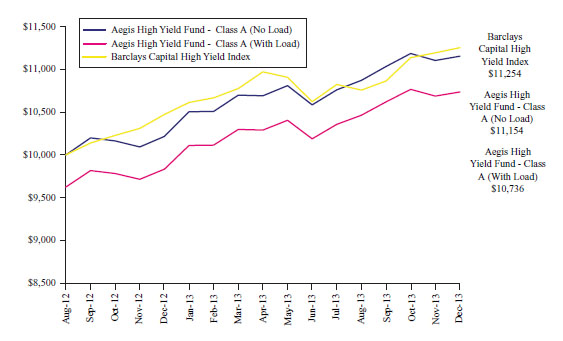
Result of a $10,000 Investment Aegis High Yield Fund – Class A (assumes investment made on August 24, 2012)
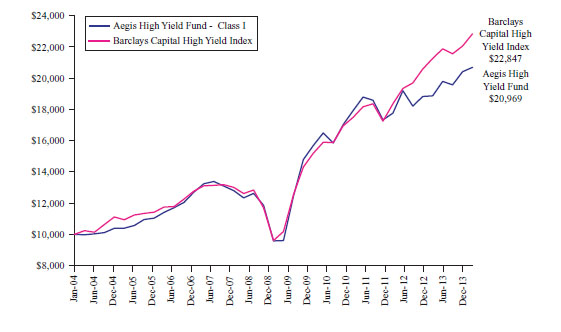
Result of a $10,000 Investment Aegis High Yield Fund – Class I (assumes investment made on January 2, 2004)
Average Annual Total Returns (Unaudited) As of December 31, 2013
| | | | | | | | |
| | | Aegis | | Aegis | | | |
| | | High Yield | | High Yield | | Barclays | |
| | | Fund - Class A | | Fund - Class A | | Capital | |
| | | (No Slaes | | (With Sales | | High | |
| | | Charge) | | Charge)* | | Yield Index | |
| Three months | | 1.09% | | (2.73)% | | 3.58% | |
| Six months | | | | | | | |
| Nine months | | 4.26% | | 0.36 % | | 4.42% | |
| | | | 5.11% | | | |
Average annual since inception (August 24, 2012 | | 8.50% | | 5.51 % | | 9.30% | |
* With sales charge returns reflect the deduction of the current maximum initial sales charge of 3.75% for Class A. Returns without sales charges do not reflect the current maximum sales charges.
Average Annual Total Returns (Unaudited) As of December 31, 2013
| | | | | | |
| | | Aegis | | Barclays | |
| | | High Yield | | Capital | |
| | | Fund - Class I | | High Yield Index | |
| Trailing 1 Year | | 9.54% | | 7.44% | |
| Trailing 3 Year | | 4.91% | | 9.32% | |
| Trailing 5 Year | | 16.66% | | 18.93% | |
Average annual since inception (January 2, 2004) | | 7.55% | | 8.62% |
Returns on both Classes of the Aegis High Yield Fund and the Barclays Capital High Yield Index assume reinvestment of all dividends and distributions. Fund returns are after all expenses. Past performance is not predictive of future results. The returns shown do not reflect the deduction of taxes a shareholder would pay on the redemption of Fund shares or Fund distributions. As of April 30, 2013, the effective date of the most recent prospectus, the gross expense ratio for Class A was 2.19% and for Class I was 1.52%.
Portfolio Characteristics
December 31, 2013
(Unaudited)
Industry Breakdown
| | % of the Fund’s Net Assets |
| Bank Loans | | 5.7% |
| Apparel & Textile Products | 4.3% | |
| Auto Parts & Equipment | 1.4% | |
| Common Stock | | 4.0% |
| Media | 1.1% | |
| Mining | 0.6% | |
| Real Estate Investment Trusts | 1.4% | |
| Transportation | 0.9% | |
| Convertible Bond | | 13.1% |
| Diversified Financial Services | 4.3% | |
| Mining | 2.0% | |
| Oil & Gas Services | 3.8% | |
| Oil Companies - Exploration & Production | 3.0% | |
| Corporate Bond | | 60.0% |
| Agriculture | 4.1% | |
| Auto Parts & Equipment | 3.5% | |
| Consumer Services | 2.9% | |
| Diversified Financial Services | 4.7% | |
| Engineering & Construction | 0.1% | |
| Information Technogy | 2.9% | |
| Machinery - Diversified | 2.8% | |
| Manufactured Goods | 3.9% | |
| Media | 0.4% | |
| Mining | 3.7% | |
| Oil & Gas Drilling | 5.0% | |
| Oil & Gas Services | 4.2% | |
| Oil Companies - Exploration & Production | 12.0% | |
| Paper Products | 1.7% | |
| Retail | 3.6% | |
| Transportation | 4.5% | |
| Preferred Stock | | 3.8% |
| Oil Companies - Exploration & Production | 3.8% | |
| Warrants | | 0.4% |
| Oil Companies - Exploration & Production | 0.4% | |
| Other Assets & Liabilities | | 13.0% |
| Net Assets | | 100.00% |
Portfolio Characteristics – (continued)
December 31, 2013
(Unaudited)
Credit Quality – % of Corporate Bonds
| B | 31.6% |
| CCC | 12.0% |
| Below CCC or Unrated | 56.4% |
| | 100.00% |
Maturity (Or Most Likely Call) – % of Corporate Bonds
| Less than 1 year | 7.4% |
| 1 – 3 years | 40.6% |
| 4 – 6 years | 46.7% |
| 7 – 10 years | 5.2% |
| More than 10 years | 0.1% |
| | 100.00% |
Aegis High Yield Fund
Schedule of Portfolio Investments
December 31, 2013
| | | | Principal Amount | | | Value | |
| Bank Loans - 5.7% | | | | | | | |
| Apparel & Textile Products - 4.3% | | | | | | | |
Archroma Term Loan B(2) | | | $ | 2,992,500 | | | $ | 2,983,148 | |
| | | | | | | | | | |
| Auto Parts & Equipment - 1.4% | | | | | | | | | |
Exide Technologies, Term Loan(2) | | | | 930,748 | | | | 954,017 | |
| Total Bank Loans (Cost $3,869,415) | | | | | | | | 3,937,165 | |
| | | | | | | | | | |
| | | | | | | | | | |
| | | | Shares | | | | |
| Common Stocks - 4.0% | | | | | | | | | |
| Media - 1.1% | | | | | | | | | |
RDA Holding Co. (1)(6) | | | | 18,810 | | | $ | 752,400 | |
| | | | | | | | | | |
| Mining - 0.6% | | | | | | | | | |
Amerigo Resources Ltd. (1)(4) | CAD | | | 1,199,300 | | | | 443,741 | |
| | | | | | | | | | |
| Real Estate Investment Trusts - 1.4% | | | | | | | | | |
| PMC Commercial Trust | | | | 108,720 | | | | 934,992 | |
| | | | | | | | | | |
| Transportation - 0.9% | | | | | | | | | |
Baltic Trading Ltd. (4) | | | | 48,500 | | | | 312,340 | |
Globus Maritime Ltd. (1) | | | | 80,930 | | | | 321,292 | |
| | | | | | | | | 633,632 | |
| Total Common Stocks (Cost $3,593,758) | | | | | | | | 2,764,765 | |
| | | | | | | | | | |
| | | | | | | | | | |
| | | | Principal Amount | | | | |
| Convertible Bonds - 13.1% | | | | | | | | | |
| Diversified Financial Services - 4.3% | | | | | | | | | |
| Penson Worldwide, Inc., Sr. Unsec., | | | | | | | | | |
8.000%, 06/01/2014 (2)(5)(6) | | | $ | 1,000,000 | | | $ | 128,125 | |
| Pinetree Capital Ltd., Subord., | | | | | | | | | |
10.000%, 05/31/2016 (3)(4) | CAD | | | 442,000 | | | | 299,507 | |
| | | | | | | | | | |
| Tower Group, International, Ltd., | | | | | | | | | |
| 5.000%, 09/15/2014 | | | | 3,000,000 | | | | 2,555,625 | |
| | | | | | | | | 2,983,257 | |
| Mining - 2.0% | | | | | | | | | |
| Jaguar Mining, Inc., Sr. Unsec., | | | | | | | | | |
4.500%, 11/01/2014 (2)(5) | | | | 3,000,000 | | | | 375,000 | |
The accompanying notes are an integral part of these financial statements.
Aegis High Yield Fund
Schedule of Portfolio Investments
December 31, 2013
| | | | Principal Amount | | | Value | |
| Convertible Bonds – (continued) | | | | | | | |
| Mining – (continued) | | | | | | | |
| Lake Shore Gold Corp., | | | | | | | |
6.250%, 09/30/2017(4) | CAD | | | 1,362,000 | | $ | | 988,692 | |
| | | | | | | | | 1,363,692 | |
| Oil & Gas Services - 3.8% | | | | | | | | | |
| Cal Dive International Inc., Sr. Unsec., | | | | | | | | | |
5.000%, 07/15/2017(2) | | | $ | 2,500,000 | | | | 2,654,688 | |
| | | | | | | | | | |
| Oil Companies - Exploration & Production - 3.0% | | | | | | | | | |
| Zaza Energy Corp., Sr. Unsec., | | | | | | | | | |
9.000%, 08/01/2017(2) | | | | 2,500,000 | | | | 2,062,500 | |
| Total Convertible Bonds (Cost $12,332,643) | | | | | | | | 9,064,137 | |
| | | | | | | | | | |
| | | | | | | | | | |
| Corporate Bonds - 60.0% | | | | | | | | | |
| Agriculture - 4.1% | | | | | | | | | |
| Alliance One International, Inc., 2nd Lien, | | | | | | | | | |
| 9.875%, 07/15/2021 | | | | 3,000,000 | | | | 2,827,500 | |
| | | | | | | | | | |
| Auto Parts & Equipment - 3.5% | | | | | | | | | |
| Exide Technologies, 1st Lien, | | | | | | | | | |
8.625%, 02/01/2018(2) | | | | 3,300,000 | | | | 2,376,000 | |
| | | | | | | | | | |
| Consumer Services - 2.9% | | | | | | | | | |
| Cenveo Corp., 2nd Lien, | | | | | | | | | |
| 8.875%, 02/01/2018 | | | | 2,000,000 | | | | 2,010,000 | |
| | | | | | | | | | |
| Diversified Financial Services - 4.7% | | | | | | | | | |
| Creditcorp, Sec., 12.000%, | | | | | | | | | |
07/15/2018(2) | | | | 2,000,000 | | | | 1,990,000 | |
| GFI Group, Inc. Sr. Unsec., | | | | | | | | | |
| 10.375%, 07/19/2018 | | | | 1,000,000 | | | | 1,042,500 | |
| Penson Worldwide, Inc., Sec., 12.500%, | | | | | | | | | |
05/15/2017(2)(5)(6) | | | | 915,000 | | | | 205,875 | |
| | | | | | | | | 3,238,375 | |
| Engineering & Construction - 0.1% | | | | | | | | | |
| Pfleiderer Finance BV, Company Guarantee, | | | | | | | | | |
7.125%, 02/14/2049(4)(5) | EURO | | | 650,000 | | | | 26,030 | |
| | | | | | | | | | |
The accompanying notes are an integral part of these financial statements.
Aegis High Yield Fund
Schedule of Portfolio Investments
December 31, 2013
| | | | Principal Amount | | | Value | |
| Convertible Bonds – (continued) | | | | | | | |
| Information Technogy - 2.9% | | | | | | | |
| Sitel LLC / Sitel Finance Corp., Sr. Unsec., | | | | | | | |
| 11.500%, 04/01/2018 | | | $ | 1,000,000 | | | $ | 885,000 | |
| Sitel LLC / Sitel Financial Corp., 1st Lien, | | | | | | | | | |
11.000%, 08/01/2017 (Acquired 06/07/2012, Cost $980,321) (2) | | | | 1,000,000 | | | | 1,072,500 | |
| | | | | | | | | 1,957,500 | |
| Machinery - Diversified - 2.8% | | | | | | | | | |
| Tempel Steel Co., Sr. Sec., 12.000%, | | | | | | | | | |
08/15/2016(2) | | | | 2,000,000 | | | | 1,940,000 | |
| | | | | | | | | | |
| Manufactured Goods - 3.9% | | | | | | | | | |
| Dispensing Dynamics International, Sec., | | | | | | | | | |
12.500%, 01/01/2018(2) | | | | 2,500,000 | | | | 2,693,750 | |
| | | | | | | | | | |
| Media - 0.4% | | | | | | | | | |
| Hearst-Argyle Television, Inc., Sr. Unsec., | | | | | | | | | |
| 7.000%, 01/15/2018 | | | | 265,000 | | | | 255,725 | |
| | | | | | | | | | |
| Mining - 3.7% | | | | | | | | | |
| Thompson Creek Metals Co., Inc., Company | | | | | | | | | |
| Guarantee, 7.375%, 06/01/2018 | | | | 3,000,000 | | | | 2,572,500 | |
| | | | | | | | | | |
| Oil & Gas Drilling - 5.0% | | | | | | | | | |
| Deep Drilling 7 Pte. Ltd. and Deep Drilling | | | | | | | | | |
| 8 Pte. Ltd., Sec., 14.250%, 03/05/2015 | | | | 1,350,000 | | | | 1,471,500 | |
| PSOS Finance Ltd., Sec., | | | | | | | | | |
| 12.000%, 10/06/2015 | | | | 1,903,846 | | | | 1,975,241 | |
| | | | | | | | | 3,446,741 | |
| Oil & Gas Services - 4.2% | | | | | | | | | |
| Global Rig Co. ASA, Company Guarantee, | | | | | | | | | |
| 13.000%, 06/15/2015 | | | | 880,001 | | | | 936,101 | |
| IronGate Energy Services LLC, Sec., | | | | | | | | | |
11.000%, 07/01/2018(2) | | | | 2,000,000 | | | | 1,950,000 | |
| | | | | | | | | 2,886,101 | |
The accompanying notes are an integral part of these financial statements.
Aegis High Yield Fund
Schedule of Portfolio Investments
December 31, 2013
| | | | Principal Amount | | | Value | |
| Corporate Bonds – (continued) | | | | | | | |
| Oil Companies - Exploration & Production - 12.0% | | | | | | | |
| ATP Oil & Gas Corp., Sr. Sec., | | | | | | | |
11.875%, 05/01/2015 (5)(6) | | | $ | 1,250,000 | | | $ | 7,031 | |
| Black Elk Energy Offshore Operations LLC | | | | | | | | | |
| and Black Elk Finance Corp., Sr. Sec., | | | | | | | | | |
| 13.000%, 12/01/2015 | | | | 2,500,000 | | | | 2,112,500 | |
| Callon Petroleum Company, 2nd Lien, | | | | | | | | | |
| 13.000%, 09/15/2016 | | | | 55,250 | | | | 57,322 | |
| Endeavour International Corp., 1st Lien, | | | | | | | | | |
| 12.000%, 03/01/2018 | | | | 2,000,000 | | | | 2,065,000 | |
| Panoro Energy ASA, Sr. Sec., | | | | | | | | | |
12.000%, 11/15/2018 (2) | | | | 880,000 | | | | 932,800 | |
| RAAM Global Energy Co., Sec., | | | | | | | | | |
| 12.500%, 10/01/2015 | | | | 2,000,000 | | | | 2,085,000 | |
| Woodbine Holdings LLC, 2nd Lien, | | | | | | | | | |
| 12.000%, 05/15/2016 | | | | 1,000,000 | | | | 1,065,000 | |
| | | | | | | | | 8,324,653 | |
| Paper Products - 1.7% | | | | | | | | | |
| Fortress Paper Ltd., | | | | | | | | | |
6.500%, 12/31/2016 (4) | CAD | | | 1,000,000 | | | | 658,978 | |
| Fortress Paper Ltd., | | | | | | | | | |
7.000%, 12/31/2019 (4) | CAD | | | 1,000,000 | | | | 522,476 | |
| | | | | | | | | 1,181,454 | |
| Retail - 3.6% | | | | | | | | | |
| HOA Restaurant Group LLC and HOA | | | | | | | | | |
| Finance Corp., Sr. Sec., 11.250%, | | | | | | | | | |
04/01/2017 (2) | | | | 2,350,000 | | | | 2,491,000 | |
| | | | | | | | | | |
| Transportation - 4.5% | | | | | | | | | |
| OSA Goliath Petroleum Ltd., Sec., | | | | | | | | | |
| 12.000%, 10/09/2018 | | | | 3,000,000 | | | | 3,135,000 | |
| Total Corporate Bonds (Cost $42,845,238) | | | | | | | | 41,362,329 | |
| | | | | | | | | | |
The accompanying notes are an integral part of these financial statements.
Aegis High Yield Fund
Schedule of Portfolio Investments
December 31, 2013
| | | Shares | | | Value | |
| Preferred Stocks - 3.8% | | | | | | |
| Oil Companies - Exploration & Production - 3.8% | | | | | | |
| Magnum Hunter Resources Corp. 8.000% | | | 27,228 | | | $ | 749,451 | |
| Magnum Hunter Resources Corp. 10.250% | | | 74,397 | | | | 1,886,708 | |
| Total Preferred Stocks (Cost $2,236,150) | | | | | | | 2,636,159 | |
| | | | | | | | | |
| | | | | | | | | |
| Warrants - 0.4% | | | | | | | | |
| Oil Companies - Exploration & Production - 0.4% | | | | | | | | |
| Woodbine Holdings LLC, Expiration: | | | | | | | | |
May 2016, Exercise Price: $1.00 (1)(6) | | | 1,000 | | | | 250,000 | |
| Total Warrants (Cost $0) | | | | | | | 250,000 | |
| Total Investments - 87.0% (Cost $64,764,584) | | | | | | | 60,014,555 | |
| Other Assets in Excess of Liabiliies - 13.0% | | | | | | | 8,945,403 | |
| Net Assets - 100.0% | | | | | | $ | 68,959,958 | |
| | | | | | | | | |
| (1) | Non-income producing securities. |
| (2) | 144A - Represents a security sold under Rule 144A which is exempt from registration and may be resold to qualified institutional buyers under provisions of Rule 144A under the Securities Act of 1933, as amended. |
| (3) | Variable rate demand deposit; the rate shown is the 7-day effective yield as of 12/31/2013. (4)Foreign security denominated in U.S. Dollars. |
| (5) | Issue is in default or bankruptcy. (6)Fair Valued |
CAD = Canadian Dollar
EURO = The European Currency
The Global Industry Classification Standard (GICS®) was developed by and/or is the exclusive property of MSCI, Inc. and Standard & Poor Financial Services LLC (“S&P”). GICS is a service mark of MSCI and S&P and has been licensed for use by U.S. Bancorp Fund Services, LLC.
The accompanying notes are an integral part of these financial statements.
Aegis High Yield Fund
Statement of Assets and Liabilities
December 31, 2013
| Assets | | | |
| Investments in securities, at value (cost $64,764,584) | | $ | 60,014,555 | |
| Cash denominated in foreign currency (cost $63,440) | | | 63,545 | |
| Cash | | | 6,366,466 | |
| Interest and dividends receivable | | | 2,006,410 | |
| Principle paydown receivable | | | 7,500 | |
| Receivable for Fund shares sold | | | 723,097 | |
| Prepaid assets | | | 23,552 | |
| Total Assets | | | 69,205,125 | |
| | | | | |
| Liabilities | | | | |
| Accrued Trustee and chief compliance officer fees | | | 17,554 | |
| Payable for Fund shares redeemed | | | 58,774 | |
| Payable to Investment Advisor | | | 102,087 | |
| Payable for distribution fees | | | 5,810 | |
| Accrued transfer agent fees | | | 9,120 | |
| Accrued audit fees | | | 16,583 | |
| Accrued printing and mailing fees | | | 9,356 | |
| Other payables | | | 25,883 | |
| Total Liabilities | | | 245,167 | |
| Net Assets | | $ | 68,959,958 | |
| | | | | |
| Net assets consist of: | | | | |
| Paid-in capital | | $ | 74,604,1696 | |
| Accumulated net investment loss | | | (147,835 | ) |
| Accumulated net realized loss on investments and foreign currency transactions | | | (746,452 | ) |
| Net unrealized depreciation on investments and foreign currency transactions | | | (4,749,924 | ) |
| Net Assets | | $ | 68,959,958 | |
| | | | | |
| Class A Shares | | | | |
| Net Assets | | $ | 9,987,788 | |
| | | | | |
| Authorized shares, unlimited, no per value | | | | |
| Outstanding Shares | | | 1,131,967 | |
| Net asset value, offering and redemption price** per share | | $ | 8.82 | * |
| Maximum offering price per share, after sales load (96.25/100) | | $ | 9.16 | *** |
| | | | | |
| Class I Shares | | | | |
| Net Assets | | $ | 58,972,170 | |
| | | | | |
| Authorized shares, unlimited, no per value | | | | |
| Outstanding Shares | | | 6,665,254 | |
| Net asset value, offering and redemption price** per share | | $ | 8.85 | * |
* Shares redeemed within 180 days of purchase are charged a 2.00% redemption fee.
** Value may be less than NAV due to redemption fee.
*** Reflects a maximum sales charge of 3.75%. A contingent deferred sales charge (CDSC) of 1.00% may be charged on shares redeemed two years of purchase.
The accompanying notes are an integral part of these financial statements.
Aegis High Yield Fund
Statement of Operations
For The Year Ended December 31, 2013
| Investment Income | | | |
| Dividends income # | | $ | 608,030 | |
| Interest income | | | 5,794,742 | |
| Total investment income | | | 6,402,772 | |
| | | | | |
| Expenses | | | | |
| Investment advisory fees (Note 3) | | | 551,054 | |
| Transfer agent & custody fees | | | 61,601 | |
| Fund servicing fees | | | 44,274 | |
| Trustees & chief compliance officer fees | | | 35,381 | |
| Registration fees | | | 33,955 | |
| Legal fees | | | 30,145 | |
| Printing and postage fees | | | 25,873 | |
| Audit fees | | | 21,083 | |
| Distribution fees - Class A (Note 4) | | | 18,593 | |
| Insurance fees | | | 7,288 | |
| Miscellaneous fees | | | 2,679 | |
| Gross expenses | | | 831,926 | |
| Waiver of fees (Note 3) | | | (78,543 | ) |
| Net expenses | | | 753,383 | |
| Net Investment Income | | | 5,649,389 | |
| | | | | |
| Realized and unrealized gain (loss) on investments and foreign currency transactions: | | | | |
| Net realized gain (loss) from: | | | | |
| Investments | | | 132,921 | |
| Foreign currency transactions | | | (215,441 | ) |
| Net realized loss on investments and foreign currency transactions | | | (78,520 | ) |
| | | | | |
| Change in net unrealized appreciation/depreciation on: | | | | |
| Investments | | | (253,120 | ) |
| Foreign currency translations | | | 105 | |
| Net change in unrealized appreciation/depreciation on investments and foreign currency translations | | | (253,015 | ) |
| | | | | |
| Net realized and unrealized loss on investments and foreign currency transactions | | | (331,535 | ) |
| | | | | |
| Net increase in net assets resulting from operations | | $ | 5,317,854 | |
| | | | | |
# Net of foreign tax withholding of $698.
The accompanying notes are an integral part of these financial statements.
Aegis High Yield Fund
Statements of Changes in Net Assets
For The Years Ended December 31, 2013
| | | 2013 | | | 2012 | |
| Operations: | | | | | | |
| Net investment income | | $ | 5,649,389 | | | $ | 4,288,643 | |
| Net realized loss on investments and foreign currency transactions | | | (78,520 | ) | | | (1,092,799 | ) |
| Change in unrealized appreciation/depreciation on investments and foreign currency translations | | | (253,015 | ) | | | 438,935 | |
| Net increase in net assets resulting from operations | | | 5,317,854 | | | | 2,756,909 | |
| | | | | | | | | |
| Distributions | | | | | | | | |
| Net investment income - Class A | | | (636,231 | ) | | | (99,211 | ) |
| Net investment income - Class I | | | (4,618,669 | ) | | | (4,077,916 | ) |
| Net decrease in net assets resulting from distributions paid | | | (5,254,900 | ) | | | (4,177,127 | ) |
| | | | | | | | | |
| Capital share transactions* | | | | | | | | |
| Subscriptions - Class A | | | 5,254,223 | | | | 5,045,621 | |
| Subscriptions - Class I | | | 24,588,826 | | | | 28,613,163 | |
| Distributions reinvested - Class A | | | 85,796 | | | | 10,978 | |
| Distributions reinvested - Class I | | | 4,012,283 | | | | 3,319,119 | |
| Redemptions - Class A | | | (297,813 | ) | | | (2,000 | ) |
| Redemptions - Class I | | | (18,493,671 | ) | | | (22,225,424 | ) |
| Redemptions fees - Class A | | | 1,156 | | | | 34 | |
| Redemptions fees - Class I | | | 84,523 | | | | 68,064 | |
| Net increase in net assets resulting from capital share transactions | | | 15,235,323 | | | | 14,829,555 | |
| | | | | | | | | |
| Total Increase in Net Assets | | | 15,298,277 | | | | 13,409,337 | |
| | | | | | | | | |
| NET ASSETS | | | | | | | | |
| Beginning of year | | | 53,661,681 | | | | 40,252,344 | |
| End of year | | $ | 68,959,958 | | | $ | 53,661,681 | |
| | | | | | | | | |
| Accumulated net investment income (loss) at end of year | | $ | (147,835 | ) | | $ | 12,783 | |
The accompanying notes are an integral part of these financial statements.
Aegis High Yield Fund
Statements of Changes in Net Assets
For The Years Ended December 31, 2013
| | | 2013 | | | 2012 | |
| *Share information - Class A | | | | | | |
| Subscriptions | | | 588,637 | | | | 566,017 | |
| Distributions reinvested | | | 9,646 | | | | 1,248 | |
| Redemptions | | | (33,354 | ) | | | (227 | ) |
| Net increase in shares | | | 564,929 | | | | 567,038 | |
| Beginning shares | | | 567,038 | | | | - | |
| Ending shares | | | 1,131,967 | | | | 567,038 | |
| | | | | | | | | |
| *Share information - Class I | | | | | | | | |
| Subscriptions | | | 2,752,280 | | | | 3,121,340 | |
| Distributions reinvested | | | 450,181 | | | | 367,375 | |
| Redemptions | | | (2,067,684 | ) | | | (2,404,279 | ) |
| Net increase in shares | | | 1,134,777 | | | | 1,084,436 | |
| Beginning shares | | | 5,530,477 | | | | 4,446,041 | |
| Ending shares | | | 6,665,254 | | | | 5,530,477 | |
The accompanying notes are an integral part of these financial statements.
Aegis High Yield Fund - Class A
Financial Highlights
The table below sets forth financial data for a share outstanding in the Fund throughout each period presented:
| | | For the Year Ended | | | For the Period from August 24, 2012 (Commencement of Operations) to | |
| | | December 31, 2013 | | | December 31, 2012 | |
| Per Share Data | | | | | | |
| Net asset value, beginning of period | | $ | 8.79 | | | $ | 8.83 | |
| | | | | | | | | |
| Income from investment operations: | | | | | | | | |
| Net investment income | | | 1.33 | | | | 0.23 | |
| Net realized and unrealized loss on investments and foreign currency transactions | | | (0.56 | ) | | | (0.02 | ) |
| Total from investment operations | | | 0.77 | | | | 0.21 | |
| | | | | | | | | |
| Less distributions to shareholders from: | | | | | | | | |
| Net investment income | | | (0.74 | ) | | | (0.25 | ) |
| Total Distributions | | | (0.74 | ) | | | (0.25 | ) |
Redemption fees (1) | | | 0.00 | | | | 0.00 | |
| Net asset value, end of period | | $ | 8.82 | | | $ | 8.79 | |
Total investment return (2) | | | 9.06 | % | | | 2.40 | %(4) |
| | | | | | | | | |
| Ratios (to average net assets)/Supplemental data: | | | | | | | | |
| Expenses after fee waiver | | | 1.45 | % | | | 1.45 | %(5) |
| Expenses before fee waiver | | | 1.57 | % | | | 2.19 | %(5) |
| Net investment income after fee waiver | | | 9.01 | % | | | 7.70 | %(5) |
| Net investment income before fee waiver | | | 8.89 | % | | | 8.44 | %(5) |
Portfolio turnover (3) | | | 58 | % | | | 23 | % |
| Net assets at end of period (000's) | | $ | 9,988 | | | $ | 4,985 | |
(1) Less than one cent per share.
(2) Based on net asset value, which does not reflect the sales charge. With sales charge included, the return is 5.11% and (1.44)%, respectively.
(3) Portfolio turnover is calculated on the basis of the Fund as a whole without distinguishing between the classes of shares issued.
(4) Not Annualized
(5) Annualized
The accompanying notes are an integral part of these financial statements.
Aegis High Yield Fund - Class I
Financial Highlights
The table below sets forth financial data for a share outstanding in the Fund throughout each period presented:
| | | Years Ended December 31, | |
| | | 2013 | | | 2012 | | | 2011 | | | 2010 | | | 2009 | |
| Per Share Data | | | | | | | | | | | | | | | |
| | | | | | | | | | | | | | | | |
| Net asset value, beginning of year | | $ | 8.80 | | | $ | 9.05 | | | $ | 9.99 | | | $ | 10.19 | | | $ | 6.78 | |
| | | | | | | | | | | | | | | | | | | | | |
| Income from investment operations: | | | | | | | | | | | | | | | | | | | | |
| Net investment income | | | 1.52 | | | | 0.83 | | | | 0.75 | | | | 0.79 | | | | 0.73 | |
| Net realized and unrealized gain (loss) on investments and foreign currency transactions | | | (0.71 | ) | | | (0.28 | ) | | | (0.85 | ) | | | 0.59 | | | | 3.40 | |
| Total from investment operations | | | 0.81 | | | | 0.55 | | | | (0.10 | ) | | | 1.38 | | | | 4.13 | |
| | | | | | | | | | | | | | | | | | | | | |
| Less distributions to shareholders from: | | | | | | | | | | | | | | | | | | | | |
| Net investment income | | | (0.77 | ) | | | (0.81 | ) | | | (0.75 | ) | | | (0.80 | ) | | | (0.72 | ) |
| Net realized capital gains | | | - | | | | - | | | | (0.12 | ) | | | (0.79 | ) | | | - | |
| Total Distributions | | | (0.77 | ) | | | (0.81 | ) | | | (0.87 | ) | | | (1.59 | ) | | | (0.72 | ) |
| | | | | | | | | | | | | | | | | | | | | |
| Redemption fees | | | 0.01 | | | | 0.01 | | | | 0.03 | | | | 0.01 | | | | - | (2) |
| | | | | | | | | | | | | | | | | | | | | |
| Net asset value, end of year | | $ | 8.85 | | | $ | 8.80 | | | $ | 9.05 | | | $ | 9.99 | | | $ | 10.19 | |
| | | | | | | | | | | | | | | | | | | | | |
| Total investment return | | | 9.54 | % | | | 6.35 | % | | | (0.89 | )% | | | 14.22 | % | | | 63.85 | % |
| | | | | | | | | | | | | | | | | | | | | |
| Ratios (to average net assets)/Supplemental data: | | | | | | | | | | | | | | | | | | | | |
| Expenses after fee waiver | | | 1.20 | % | | | 1.20 | % | | | 1.20 | % | | | 1.20 | % | | | 1.20 | % |
| Expenses before fee waiver | | | 1.32 | % | | | 1.52 | % | | | 1.45 | % | | | 1.90 | % | | | 2.35 | % |
| Net investment income after fee waiver | | | 9.26 | % | | | 8.84 | % | | | 7.70 | % | | | 7.64 | % | | | 8.92 | % |
| Net investment income before fee waiver | | | 9.14 | % | | | 9.16 | % | | | 7.95 | % | | | 8.34 | % | | | 10.07 | % |
| Portfolio turnover | | | 58 | %(1) | | | 23 | %(1) | | | 46 | % | | | 123 | % | | | 65 | % |
| Net assets at end of period (000's) | | $ | 58,972 | | | $ | 48,677 | | | $ | 40,252 | | | $ | 23,072 | | | $ | 18,064 | |
| | | | | | | | | | | | | | | | | | | | | |
(1) Portfolio turnover is calculated on the basis of the Fund as a whole without distinguishing between the classes of shares issued.
(2) Less than one cent per share.
The accompanying notes are an integral part of these financial statements.
Notes to Financial Statements
December 31, 2013
1. The Organization
Aegis High Yield Fund (the “Fund”) is registered under the Investment Company Act of 1940 (the “1940 Act”) as a diversified open-end management investment company. The Fund is a series of The Aegis Funds, a Delaware statutory trust established July 11,
2003.
The Fund’s principal investment goal is to seek maximum total return with an emphasis on high current income by investing primarily in a portfolio of high-yield fixed-income securities, which include debt securities and preferred stocks.
The Fund currently offers Class A and Class I shares. The Fund’s Class A shares commenced operations August 24, 2012. The Fund’s Class I commenced operations January 1, 2004. Each share class represents an equal pro rata interest in the Fund and provides the shareholder equal voting rights regarding any matters relating solely to that particular class. Class A and Class I shares sold or exchanged within 180 days of purchase are subject to a redemption fee of 2.00% of the value of shares sold or exchanged. Class A shares are subject to a 3.75% front end sales load and 1.00% contingent deferred sales charge for redemptions made within 2 years of purchase date.
2. Summary of Significant Accounting Policies
Security valuation. Investments in securities are valued based on market quotations or on data furnished by an independent pricing service. Short-term notes are stated at amortized cost, which is equivalent to value. Restricted securities and other securities for which market quotations are not readily available are valued at fair value as determined by the Board of Trustees. In determining fair value, the Board procedures consider all relevant qualitative and quantitative factors available. These factors are subject to change over time and are reviewed periodically. The values assigned to fair value investments are based on available information and do not necessarily represent amounts that might ultimately be realized, since such amounts depend on future developments inherent in long-term investments. Further, because of the inherent uncertainty of valuation, those estimated values may differ significantly from the values that would have been used had a ready market for the investments existed, and the differences could be material. Where a security is traded in more than one market, which may include foreign markets, the securities are generally valued on the market considered by the Fund’s advisor to be the primary market. The Fund will value its foreign securities in U.S. dollars on the basis of the then-prevailing currency exchange rates.
In accordance with accounting principles generally accepted in the United States of America (“GAAP”), fair value is defined as the price that the Fund would receive to sell an investment or pay to transfer a liability in an orderly transaction with an independent buyer in the principal market, or in the absence of a principal market, the most
Notes to Financial Statements
December 31, 2013
2. Summary of Significant Accounting Policies – (continued)
advantageous market for the investment or liability. GAAP establishes a three-tier hierarchy to distinguish between (1) inputs that reflect the assumptions market participants would use in pricing an asset or liability developed based on market data obtained from sources independent of the reporting entity (observable inputs) and (2) inputs that reflect the reporting entity’s own assumptions about the assumptions market participants would use in pricing an asset or liability developed based on the best information available in the circumstances (unobservable inputs) and to establish classification of fair value measurements for disclosure purposes. Various inputs are used in determining the value of the Fund’s investments. The inputs are summarized in the three broad levels listed below:
| | • | Level 1 – quoted prices in active markets for identical securities. An active market for the security is a market in which transactions occur with sufficient frequency and volume to provide pricing information on an ongoing basis. A quoted price in an active market provides the most reliable evidence of fair value. |
| | • | Level 2 – other significant observable inputs (including quoted prices for similar securities or identical securities in inactive markets, interest rates, prepayment speeds, credit risk, etc.) An adjustment to any observable input that is significant to the fair value may render the measurement a Level 3 measurement. |
| | • | Level 3 – significant unobservable inputs, including the Fund’s own assumptions in determining the fair value of investments. |
Common stocks, preferred stocks and warrants. Securities traded or dealt in one or more domestic securities exchanges, excluding the National Association of Securities Dealers’ Automated Quotation System (“NASDAQ”), and not subject to restrictions against resale shall be valued on the business day as of which such value is being determined at the close of the exchange representing the principal market for such securities at the last quoted sales price or in the absence of a sale, at the mean of the last bid and asked prices. Securities traded or dealt in the NASDAQ and not subject to restrictions against resale shall be valued in accordance with the NASDAQ Official Closing Price. Securities traded on the NASDAQ Stock Market for which there were no transactions on a particular day are valued at the mean of the last bid and asked prices. To the extent these securities are actively traded and valuation adjustments are not applied, they are categorized in Level 1 of the fair value hierarchy. Stocks traded on inactive markets or valued by reference to similar instruments are categorized in Level 2.
Notes to Financial Statements
December 31, 2013
2. Summary of Significant Accounting Policies – (continued)
Corporate bonds and convertible bonds. Debt securities may be valued at mean prices supplied by the Fund’s pricing agents based on broker or dealer supplied valuation or matrix pricing, a method of valuing securities by reference to the value of other securities with similar characteristics, such as rating and interest rate. If an independent pricing agent cannot price a particular debt security, Aegis Financial Corp. (the “Advisor”) may obtain and use a price provided by an independent dealer who was the underwriter for the issuance or who makes a market in that security maturity. Although most corporate bonds are categorized in Level 2 of the fair value hierarchy, in instances where lower relative weight is placed on transaction prices, quotations, or similar observable inputs, they are categorized in Level 3.
Senior Loans. The Fund may invest in senior secured floating rate loans (“Senior Loans”). Senior Loans generally are made to corporations, partnerships and other business entities (“Borrowers”) which operate in various industries and geographical regions. Senior Loans, which typically hold the most senior position in a Borrower's capital structure, pay interest at rates that are re-determined periodically on the basis of a floating base lending rate, such as the London Inter-bank Offered Rate (LIBOR), plus a premium. This floating rate feature should help to minimize changes in the principal value of the Senior Loans resulting from interest rate changes. The Borrowers generally will use proceeds from Senior Loans to finance leveraged buyouts, recapitalizations, mergers, acquisitions and stock repurchases and, to a lesser extent, to finance internal growth and for other corporate purposes. The Fund invests primarily in Senior Loans that are below investment grade quality and are speculative investments that are subject to credit risk. The Fund will attempt to manage these risks through ongoing analysis and monitoring of Borrowers. Senior Loans in which the Fund invests may not be rated by a rating agency, will not be registered with the SEC or any state securities commission and generally will not be listed on any national securities exchange. Therefore, the amount of public information available about Senior Loans will be limited, and the performance of the Fund's investments in Senior Loans will be more dependent on the analytical abilities of the Advisor than would be the case for investments in more widely rated, registered or exchange-listed securities. In evaluating the creditworthiness of Borrowers, the Advisor will consider, and may rely in part, on analyses performed by others. Moreover, certain Senior Loans will be subject to significant contractual restrictions on resale and, therefore, will be illiquid.
Short-term investments. Short-term investments are valued using amortized cost which approximates fair value. To the extent the inputs are observable and timely, the values would be categorized in Level 2 of the fair value hierarchy.
Notes to Financial Statements
December 31, 2013
2. Summary of Significant Accounting Policies – (continued)
The inputs or methodology used for valuing securities are not necessarily an indication of the risk associated with investing in those securities. The following is a summary of the inputs used to value the Fund’s investments as of December 31, 2013:
| | | | | | | | | | | | | | | | | |
| Bank Loans* | | $ | — | | | $ | 3,937,165 | | | $ | — | | | $ | 3,937,165 | |
| Common Stock* | | | 2,012,365 | | | | — | | | | 752,400 | | | | 2,764,765 | |
Convertible Bond* Corporate Bonds | | | — | | | | 8,936,012 | | | | 128,125 | | | | 9,064,137 | |
| Agriculture | | | — | | | | 2,827,500 | | | | — | | | | 2,827,500 | |
| Auto Parts & Equipment | | | — | | | | 2,376,000 | | | | — | | | | 2,376,000 | |
| Consumer Services | | | — | | | | 2,010,000 | | | | — | | | | 2,010,000 | |
| Diversified Financial Services | | | — | | | | 3,032,500 | | | | 205,875 | | | | 3,238,375 | |
| Engineering & Construction | | | — | | | | 26,030 | | | | — | | | | 26,030 | |
| Information Technology | | | — | | | | 1,957,500 | | | | — | | | | 1,957,500 | |
| Machinery - Diversified | | | — | | | | 1,940,000 | | | | — | | | | 1,940,000 | |
| Manufactured Goods | | | — | | | | 2,693,750 | | | | — | | | | 2,693,750 | |
| Media | | | — | | | | 255,725 | | | | — | | | | 255,725 | |
| Mining | | | — | | | | 2,572,500 | | | | — | | | | 2,572,500 | |
| Oil & Gas Drilling | | | — | | | | 3,446,741 | | | | — | | | | 3,446,741 | |
| Oil & Gas Services | | | — | | | | 2,886,101 | | | | — | | | | 2,886,101 | |
| Oil Companies - | | | | | | | | | | | | | | | | |
| Exploration & Production | | | — | | | | 8,317,622 | | | | 7,031 | | | | 8,324,653 | |
| Paper Products | | | — | | | | 1,181,454 | | | | — | | | | 1,181,454 | |
| Retail | | | — | | | | 2,491,000 | | | | — | | | | 2,491,000 | |
Transportation Preferred Stocks | | | — | | | | 3,135,000 | | | | — | | | | 3,135,000 | |
| Oil Companies - | | | | | | | | | | | | | | | | |
| Exploration & Production | | | 1,886,708 | | | | 749,451 | | | | — | | | | 2,636,159 | |
| Warrants | | | — | | | | — | | | | 250,000 | | | | 250,000 | |
| Total | | $ | 3,899,073 | | | $ | 54,772,051 | | | $ | 1,343,431 | | | $ | 60,014,555 | |
* Please refer to the Schedule of Portfolio Investments to view securities segregated by industry type.
Notes to Financial Statements
December 31, 2013
2. Summary of Significant Accounting Policies – (continued)
The following is a summary of quantitative information about significant unobservable valuation inputs for the Aegis High Yield Fund approved by the Valuation Committee for Level 3 Fair Value Measurements for investments held as of December 31, 2013:
| Investments | | Fair Value asof 12/31/2013 | | | | Unobservable Inputs | | Price ($) | |
| | | | | | | | | | |
ATP Oil & Gas Corp., Sr. Sec | | $ | 7,031 | | Market | | Broker Quotes, | | $ | 0.5625 | |
| 11.875%, 05/01/2015 | | | | | Comparables | | Comparables | | | | |
| | | | | | | | Pricing | | | | |
| | | | | | | | | | | | |
| Penson Worldwide, Inc. | | $ | 128,125 | | Market | | Broker Quotes, | | $ | 12.8125 | |
| Sr. Unsec., 8.000%, 06/01/2014 | | | | | Comparables | | Comparables | | | | |
| | | | | | | | Pricing | | | | |
| | | | | | | | | | | | |
| Penson Worldwide, Inc., Sec. | | $ | 205,875 | | Market | | Broker Quotes, | | $ | 22.5000 | |
| 12.500%, 05/15/2017 | | | | | Comparables | | Comparables | | | | |
| | | | | | | | Pricing | | | | |
| | | | | | | | | | | | |
| RDA Holding Co. | | $ | 752,400 | | Market | | Broker Quotes, | | $ | 40.0000 | |
| | | | | | Comparables | | Comparables | | | | |
| | | | | | | | Pricing | | | | |
| | | | | | | | | | | | |
| Woodbine Holdings LLC, | | $ | 250,000 | | Market | | Broker Quotes, | | $ | 250.0000 | |
| Expiration: May 2016, Exercise | | | | | Comparables | | Comparables | | | | |
| Price: $1.00 | | | | | | | Pricing | | | | |
| | | | | | | | | | | | |
Fair Value Measurement Using Significant Unobservable Inputs | | Investments in | |
| Fair Value as of 12/31/12 | | $ | — | |
| Transfer into Level 3 during the year | | | 1,343,431 | |
| Fair Value as of 12/31/13 | | $ | 1,343,431 | |
| Net change in unrealized appreciation/(depreciation) from | | | | |
| investments still held as of 12/31/13 | | $ | — | |
During the year ended December 31, 2013, there were the following transfers between
Level 1, Level 2 and Level 3 for the Aegis High Yield Fund.
| Transfers | | Market Value | |
| | $ | 1,343,431 | |
Notes to Financial Statements
December 31, 2013
2. Summary of Significant Accounting Policies – (continued)
The transfers from Level 2 to Level 3 were due to a change to a fair valued price based on a broker quote, in accordance with the policies and procedures approved by the Board of Trustees from an evaluated price obtained from the pricing vendor.
The Fund recognizes transfers between levels of the hierarchy as of the end of the period in which the transfers occur.
Foreign risk and currency translation. The Fund may invest directly in foreign securities. Financial market fluctuations in any country where the Fund has investments will likely affect the value of the securities that the Fund owns in that country. These movements will affect the Fund’s share price and investment performance. The political, economic, and social structures of some countries may be less stable and more volatile than those in the United States. The risks of foreign markets include currency fluctuations, possible nationalization or expropriation of assets, extraordinary taxation or exchange controls, political or social instability, unfavorable diplomatic developments, and certain custody and settlement risks. In addition to these risks, many foreign markets have less trading volume and less liquidity than the U.S. markets, and therefore prices in foreign markets can be highly volatile.
Foreign markets may also have less protection for investors than the U.S. markets. Foreign issuers may be subject to less government supervision. It may also be difficult to enforce legal and shareholder/bondholder rights in foreign countries. There is no assurance that the Fund will be able to anticipate these risks or counter their effects.
The accounting records of the Funds are maintained in U.S. dollars. Foreign currency amounts are translated into U.S. dollars at the current rate of exchange to determine the value of investments, assets and liabilities. Purchases and sales of securities, and income and expenses are translated at the prevailing rate of exchange on the respective date of these transactions. The Fund does not isolate that portion of the results of operations resulting from changes in foreign exchange rates on investments from fluctuations arising from changes in market prices of securities held. These fluctuations are included with the net realized and unrealized gains or losses from investments.
Reported net realized foreign exchange gains or losses arise from sales and maturities of short-term securities, sales of foreign currencies, currency gains or losses realized between the trade and settlement dates on securities transactions and the difference between the amounts of dividends, interest and foreign withholding taxes recorded on the Fund’s books and the U.S. dollar equivalent of the amounts actually received or paid. Net unrealized foreign currency gains and losses arise from changes in the fair
Notes to Financial Statements
December 31, 2013
2. Summary of Significant Accounting Policies – (continued)
values of assets and liabilities, other than investments in securities at each reporting period, resulting from changes in the exchange rate. These fluctuations are included with the net realized and unrealized gains or losses from investments.
Federal income and excise taxes. The Fund’s policy is to comply with the requirements of Subchapter M of the Internal Revenue Code that are applicable to regulated investment companies and to distribute substantially all investment company taxable income and net capital gain to shareholders in a manner that results in no tax cost to the Fund. Therefore, no federal income tax provision is required.
Distributions to shareholders. Distributions to Fund shareholders, which are determined in accordance with income tax regulations, are recorded on the ex-dividend date. Distributions of net investment income, if any, are made monthly. Net realized gains from investment transactions, if any, will be distributed to shareholders annually.
The character of distributions made during the year from net investment income or net realized gain may differ from the characterization for federal income tax purposes due to differences in the recognition of income, expense and gain/(loss) items for financial statement and tax purposes. Where appropriate, reclassifications between net asset accounts are made for such differences that are permanent in nature.
Use of estimates. The preparation of financial statements in conformity with accounting principles generally accepted in the United States of America (“GAAP”) requires management to make estimates and assumptions that affect the reported amounts of assets and liabilities and disclosure of contingent assets and liabilities at the date of the financial statements and the reported amounts of revenues and expenses during the reporting period. Actual results could differ from those estimates.
Redemption Fee. To discourage frequent short-term trading in Fund shares, the Fund imposes a redemption fee on redemptions, including exchanges for shares of other Aegis Funds. If you purchase shares of the Fund you will be charged a 2.00% fee for any redemption of those shares made within 180 days of the purchase. The 180-day period begins on the purchase date and ends 180 days from that date.
The fee will be assessed and retained by the Fund for the benefit of remaining shareholders. The redemption fee is accounted for as an addition to paid-in-capital and is reported on the Statements of Changes in Net Assets and Financial Highlights (on a per share basis).
Security Transactions, Income and Expenses. The Fund records security transactions based on the trade date. Interest income is recognized on the accrual basis and includes accretion of discounts and amortization of premiums. The specific identification method
Notes to Financial Statements
December 31, 2013
2. Summary of Significant Accounting Policies – (continued)
is used to determine book and tax cost basis when calculating realized gains and losses. Dividend income is recognized on the ex-dividend date, and interest income is recognized on the accrual basis and includes accretion of discounts and amortization of premiums. Withholding taxes on foreign dividends have been provided for in accordance with the Fund’s understanding of the applicable country’s tax rules and rates.
The Fund’s class-specific expenses are charged to the operations of that class of shares. Income and Expenses (other than expenses attributable to a specific class) and realized and unrealized gains and losses on investments are allocated to each class of shares based on the class respective net assets to the total net assets of the Fund.
Indemnifications. In the normal course of business, the Fund enters into contracts that contain a variety of representations, which provide general indemnifications. The Fund’s maximum exposure under these arrangements is unknown as this would involve future claims that may be made against the Fund that have not yet occurred. However, based on experience, the Fund expects the risk of loss to be remote.
3. Advisory Fees and Other Transactions with Affiliates
The Fund entered into an investment management and advisory services agreement (the “Agreement”) with Aegis Financial Corporation (the “Advisor”) that provides for fees to be computed at an annual rate of 0.90% of the Fund’s average daily net assets. The Agreement shall remain in force through December 31, 2014 and may be renewed for additional one-year periods thereafter if approved annually by a majority of the independent members of the Board. The Agreement may be terminated at any time, without penalty, by the Fund on sixty (60) days’ written notice or by the Advisor on ninety (90) days’ written notice. The Fund and the Advisor have also entered into an expense limitation agreement which shall remain in force through April 30, 2015, that provides for an expense reimbursement from the Advisor if the Fund’s expenses, exclusive of taxes, interest, fees incurred in acquiring or disposing of portfolio securities, and extraordinary expenses, exceed 1.45% for Class A and 1.20% for Class I, of the Fund’s average daily net assets. During the year ended December 31, 2013, the Advisor waived fees in the amount of $78,543.
The Fund has agreed to repay the Advisor for amounts waived or reimbursed by the Advisor pursuant to the expense limitation agreement provided that such repayment does not cause the Fund’s expenses, exclusive of taxes, interest, fees incurred in acquiring or disposing of portfolio securities and extraordinary expenses, to exceed 1.45% for Class A and 1.20% for Class I and the repayment is made within three years after the year in which the Advisor incurred the expense. As of December 31, 2013,
Notes to Financial Statements
December 31, 2013
3. Advisory Fees and Other Transactions with Affiliates – (continued)
there was $319,802 of fees available to be recovered no later than December 31, 2016, of which, $92,399, $148,860 and $78,543 are recoverable through December 31, 2014,
2015 and 2016, respectively.
Certain officers and Trustees of the Fund are also officers and Trustees of the Advisor. The Fund pays each Trustee not affiliated with the Advisor fees in cash or Fund shares of $1,000 for each attended board meeting and $500 for each attended committee meeting. In addition, the Fund pays the chief compliance officer a yearly amount of
$20,000 paid on a quarterly basis.
4. Distribution and Service Plan
The Fund has adopted a distribution and service plan (the “Plan”) pursuant to Rule 12b-1 under the 1940 Act for Class A Shares. Rule 12b-1 provides that an investment company that bears any direct or indirect expense of distributing its shares must do so only in accordance with the Plan permitted by Rule 12b-1. Pursuant to the Plan, the Fund makes payments to Quasar Distributors, LLC, the Fund’s distributor (the “Distributor”), the Advisor, financial intermediaries or others to reimburse such parties for distribution and/or shareholder servicing activity in an amount not to exceed 0.25% of the average daily net assets on an annual basis. The distribution fees are “asset based” sales charges and, therefore, long-term shareholders may pay more in total sales charges than the economic equivalent of the maximum front-end sales charge permitted by the Financial Industry Regulatory Authority (FINRA). The Fund incurred $18,593 in expenses pursuant to the 12b-1 Plan for the year ended December 31, 2013.
5. Investment Transactions
Purchases and sales of long-term investment securities (excluding short-term investments) were $44,133,119 and $32,422,053, respectively, for the year ended December 31, 2013. There were no purchases or sales of U.S. Government securities during the year.
6. Distributions to Shareholders and Tax Components of Net Assets
At December 31, 2013, gross unrealized appreciation and depreciation of investments owned by the Fund, based on cost for federal income tax purposes were as follows:
| Cost of investments | | $ | 64,297,189 | |
| Gross unrealized appreciation | | $ | 3,130,397 | |
| Gross unrealized depreciation | | | (7,413,031 | ) |
| Net unrealized depreciation | | $ | (4,282,634 | ) |
Notes to Financial Statements
December 31, 2013
6. Distributions to Shareholders and Tax Components of Net Assets – (continued)
As of December 31, 2013, the components of accumulated earnings on a tax basis were as follows:
Undistributed ordinary income | | $ | _ | |
Accumulated capital and other losses | | $ | (1,361,682 | ) |
Unrealized depreciation on investments and foreign | | | | |
| | | (4,282,529 | ) |
| Total accumulated earnings | | $ | (5,644,211 | ) |
As of December 31, 2013, the Fund had the following capital loss carryover and expirations. To the extent that the Fund realizes future net capital gains, those gains will be offset by any unused capital loss carryforwards in the character noted below.
| Long Term Amount | | | Short Term Amount | | Expiration | |
| $ | 926,690 | | | $ | 282,006 | | Indefinite | |
At December 31, 2013, the Aegis High Yield Fund deferred, on a tax basis, ordinary late year losses and post-October capital losses, as follows:
| Late Year Loss | Post October Capital Loss |
| $ 70,808 | $ 82,178 |
Primarily as a result of differing book/tax treatment of foreign currency transactions and REIT’s, on December 31, 2013 undistributed net investment income was decreased by $555,107, accumulated net realized loss on investments was decreased by $643,899 and paid in capital was decreased by $88,792. These reclassifications have no effect on the net assets of the Fund.
The tax components of dividends paid during the years ended December 31, 2013 and 2012 were as follows:
| | | 2013 | | | 2012 | |
| Distribution paid from: | | | | | | | | |
| Ordinary income | | $ | 5,254,900 | | | $ | 4,177,127 | |
| Total distributions | | $ | 5,254,900 | | | $ | 4,177,127 | |
GAAP requires an evaluation of tax positions taken (or expected to be taken) in the course of preparing the Fund’s tax returns to determine whether these positions meet a “more-likely-than-not” standard that, based on technical merits, have a more than fifty percent likelihood of being sustained by a taxing authority upon examination. A tax position that meets the “more-likely-than-not” recognition threshold is measured to determine the amount of benefit to recognize in the financial statements. The Fund
Notes to Financial Statements
December 31, 2013
6. Distributions to Shareholders and Tax Components of Net Assets – (continued)
recognizes interest and penalties, if any, related to unrecognized tax benefits as interest expense in the Statement of Operations.
GAAP requires management of the Fund to analyze all open tax years, as defined by IRS statute of limitations for all major jurisdictions, including federal tax authorities and certain state tax authorities. As of and during the year ended December 31, 2013, the Fund did not have a liability for any unrecognized tax benefits. The Fund files a U.S. Federal Income and excise tax return, as required. The Fund’s Federal income tax returns are subject to examination by the IRS for a period of three fiscal years after they are filed. The Fund has no examination in progress and is not aware of any tax positions for which it is reasonably possible that the total amounts of unrecognized tax benefits will significantly change in the next twelve months.
7. Subsequent Events
In connection with the preparation of the financial statements of the Fund as of and for the year ended December 31, 2013, events and transactions subsequent to December 31, 2013 have been evaluated by management for possible adjustment and/or disclosure. Management has determined that there were no material events that would require disclosure in the Fund’s financial statements.
REPORT OF INDEPENDENT REGISTERED PUBLIC ACCOUNTING FIRM
To the Shareholders and Board of Trustees of
Aegis High Yield Fund
We have audited the accompanying statement of assets and liabilities of Aegis High Yield Fund, a series of shares in The Aegis Funds (the “Fund”), including the schedule of portfolio investments, as of December 31, 2013, and the related statement of operations for the year then ended, the statements of changes in net assets for each of the two years in the period then ended, and the financial highlights for each of the five years in the period then ended. These financial statements and financial highlights are the responsibility of the Fund’s management. Our responsibility is to express an opinion on these financial statements and financial highlights based on our audits.
We conducted our audits in accordance with the standards of the Public Company Accounting Oversight Board (United States). Those standards require that we plan and perform the audits to obtain reasonable assurance about whether the financial statements and financial highlights are free of material misstatement. An audit includes examining, on a test basis, evidence supporting the amounts and disclosures in the financial statements. Our procedures included confirmation of securities owned as of December
31, 2013 by correspondence with the custodian and by other appropriate auditing procedures. An audit also includes assessing the accounting principles used and significant estimates made by management, as well as evaluating the overall financial statement presentation. We believe that our audits provide a reasonable basis for our opinion.
In our opinion, the financial statements and financial highlights referred to above present fairly, in all material respects, the financial position of Aegis High Yield Fund as of December 31, 2013, the results of its operations for the year then ended, the changes in its net assets for each of the two years in the period then ended, and its financial highlights for each of the five years in the period then ended, in conformity with accounting principles generally accepted in the United States of America.
Philadelphia, Pennsylvania
February 28, 2014
Trustees and Officers
(Unaudited)
Name, Year of Birth, and Address | Position(s) | Principal Occupation During Past Five Years | Number of Portfolios in Fund Complex Overseen by Trustee | Other Directorships Held by Trustee |
| Interested Trustee* | | | | |
| Scott L. Barbee | President, | President of Aegis Financial | 2 | None |
Born: 1971 6862 Elm Street, Suite 830 McLean, VA 22101 | Trustee | Corporation since 2009; President of Aegis Funds and Aegis Value Fund since 2009; Director of the Aegis Value Fund since 1997; Trustee of the Aegis Funds since 2004; Treasurer, Secretary and Managing Director of Aegis Financial Corporation 1997- 2008; Treasurer of the Aegis Funds and Aegis Value Fund 2003-2008; Secretary of Aegis Funds and Aegis Value Fund 2006 - 2008. | | |
| Independent Trustees | | | | |
50 Beale Street San Francisco, CA 94105 | Trustee | President North America of Dragonmarts Co. Ltd. since 2012;Vice President of ebusiness, Blue Shield of California 2008-2012; Senior Vice President of Internet Services Group, Wells Fargo & Co., 2002-2008; Director of the Aegis Value Fund since 1997; Trustee of the Aegis Funds since 2006. | 2 | None |
David A. Giannini Born: 1953 30 Rockefeller Plaza Suite 4250 New York, NY 10112 | Trustee | Institutional equity sales and research with Scarsdale Equities since 2006; Director of the Aegis Value Fund since 2006; Trustee of the Aegis Funds since 2006. | 2 | None |
V. Scott Soler Born: 1969 7500 San Felipe, Suite 340 Houston, TX 77063 | Trustee | Co-owner at Limestone Value Partners since 2011; Managing Director and Senior Advisor of Quantum Energy Partners, Since 2006; Director of the Aegis Value Fund since 2007; Trustee of the Aegis Funds since 2007. | 2 | Ceritas II & Merchant Energy, Hldings |
Trustees and Officers
(Unaudited)
Name, Year of Birth, and Address | Position(s) | Principal Occupation During Past Five Years | Number of Portfolios in Fund Complex Overseen by Trustee | Other Directorships Held by Trustee |
| Officer of the Fund | | | | |
| Sarah Q. Zhang | Chief | Financial Corporation, Aegis Funds | N/A | N/A |
Born: 1970 6862 Elm Street, Suite 830 McLean, VA 22101 | | and Aegis Value Fund since 2008; Treasurer and Secretary of Aegis Financial Corporation, Aegis Funds and Aegis Value Fund since 2009; Chief Financial Operations Officer, Larkspur Services, Inc. 2005-2007. | |
*Indicates persons who are affiliated with Aegis Financial Corporation, the Fund’s investment advisor, and are therefore considered to be “interested persons” under the Investment Company Act of 1940, Section (2)(a).
The Fund’s Statement of Additional Information includes additional information about Fund Trustee and is available, without charge, by calling the Fund’s toll-fee phone number, (800) 528-3780.
Other Information
(Unaudited)
Proxy Voting
A description of the policies and procedures that the Fund uses to determine how to vote proxies relating to portfolio securities is available by request, without charge, by calling the Fund’s toll-free telephone number, 800-528-3780. Information regarding how the Fund voted proxies, if any, relating to portfolio securities during the most recent 12-month period ended June 30 is available upon request, without charge, by calling 800-528-3780. The Fund’s proxy voting policies and procedures and voting record are also available on the U.S. Securities and Exchange Commission (“SEC”) website at http://www.sec.gov.
Code of Ethics
The Fund has adopted a code of ethics applicable to its principal executive officer and principal financial officer. A copy of this code is available, without charge, by calling the Fund toll-free phone number, 800-528-3780.
Fund Holdings
The complete schedules of Fund holdings for the second and fourth quarters of each fiscal year are contained in the Fund’s semi-annual and annual shareholder reports, respectively. The Fund files complete schedules of Fund holdings with the SEC for the first and third quarters of each fiscal year on Form N-Q within 60 days after the end of the period. Copies of the Fund’s Form N-Q are available without charge, upon request, by contacting the Fund at 800-528-3780 and on the SEC’s website at http://www.sec.gov. You may also review and copy Form N-Q at the SEC’s Public Reference Room in Washington, DC. For more information about the operation of the Public Reference Room, please call the SEC at 1-800-SEC-0330.
Tax Designation
Certain dividends paid by the Funds may be subject to a maximum tax rate of 15%, as provided for by the Jobs and Growth Tax Relief Reconciliation Act of 2003. For the year ended December 31, 2013, 3.77% of dividends paid from net investment income including short term capital gains, qualifies for the dividends received deduction available to corporate shareholders of the Fund. For the year ended December 31, 2013, 3.86% of dividends paid from net investment income, including short term capital gains from the Fund are designated as qualified dividend income.
Basis for the Board’s Approval of Advisory Agreement
At a meeting held on October 21, 2013, the Board considered and approved the advisory agreement (the “Agreement”) between the Fund and Aegis Financial Corporation (“AFC”). The Board based its approval of the Agreement on its review of information provided by AFC. Such information included information provided by
AFC in response to a request for information made pursuant to Section 15(c) of the 1940 Act (the “Section 15(c) Information”).
In its deliberations on the Agreement, the Board considered the Section 15(c) Information provided to it by AFC and contained in the Board materials. The Board did not identify any particular aspect of the Section 15(c) Information that was all important or controlling, and evaluated all information available to it. The Board concluded that the terms of the Agreement are appropriate, that the fees to be paid by the Fund are reasonable in light of the services to be provided to the Fund and that the Agreement should be renewed. In approving the renewal of the Agreement, the Board, including the Independent Trustees, considered and reached the following conclusions with respect to the following factors.
A. Nature, Extent and Quality of Services Provided by AFC
The Board reviewed and considered the scope of services provided (or to be provided) by AFC to the Fund as well as the nature and quality of the services provided (or to be provided) by AFC to the Fund. The Board evaluated information concerning AFC’s discretionary investment advisory services and AFC’s compliance policies and procedures, including its trade allocation and brokerage allocation procedures. The Board considered information regarding AFC’s resources and compensation arrangements, including its in-house research capabilities and recent changes to personnel, and AFC’s future plans for the Fund. On the basis of these and other factors, the Trustees determined that the scope and nature and quality of the services provided (or to be provided) by AFC were consistent with its duties under the Agreement and appropriate and consistent with the investment program of the Fund, and concluded that the nature and quality of services provided (or to be provided) by AFC to the Fund were appropriate.
B. The Investment Performance of the Funds and AFC
In connection with its review, the Trustees reviewed information prepared by AFC and USBFS comparing the Fund’s performance with the performance of its benchmark and the performance of comparable funds. The Trustees considered that some of the information provided to them was derived from information made available by Morningstar (an independent research service) and some of the information was derived from information provided by the Fund’s administrator (i.e., information regarding the performance of the Fund for the recent 9-month period ended September 30, 2013 and the 1-year, 3-year, 5-year and 10-year and since inception periods ended September 30,
2013).
The Trustees noted that during the most recent 9-month period ended September 30, 2013, the Aegis High Yield Fund - Class A (without load) had a quarterly return of 8.01%, the Aegis High Yield Fund - Class A (with load) had a quarterly return of 3.98% and the Aegis High Yield Fund - Class I had a quarterly return of 8.18%, in contrast to the Fund’s benchmark, the Barclays Capital High Yield Index, which had a 3.73% return during the calendar quarter ended September 30, 2013. They noted that the Fund’s Class
I and Class A (without load) performance beat the bench mark by approximately 400 basis points. They also compared the annualized 1-year, 3-year and 5-year performance for Aegis High Yield Fund - Class I against the annualized performance of the Barclays Capital High Yield Index performance for the same periods ended September 30, 2013, noting that the Class I shares returned 8.42%, 6.25%, and 11.48% for those periods while the Barclays Capital High Yield Index returned 7.14%, 9.19%, and 13.53% during the same periods. They considered information about the Fund’s performance for the 1-year and since inception periods for the Aegis High Yield Fund - Class A shares, Class A (without load), which had returns of 8.06% and 9.46%, and Class A (with load) had returns of 4.00% and 5.77%, respectively, against the Barclays Capital High Yield Index of 7.14% and 8.46% for the same periods. The Board also considered information comparing the performance of the Aegis High Yield Fund with the performance of more than 500 U.S. high-yield bond funds.
Based on the Fund’s comparative performance information presented at the Meeting, the Board concluded that the Fund’s performance was satisfactory.
C. AFC Profitability
The Trustees reviewed AFC’s profitability estimates. The Trustees considered information provided by AFC with respect to (i) the profitability of managing the Fund to AFC, (ii) as applicable, expenses reimbursed by AFC under the Fund’s Expense Limitation Agreement, and (iii) other benefits accruing to AFC as a result of its relationship with the Fund, including the fact that the Fund’s public performance record may at times attract inquiries regarding AFC’s advisory services and may result in the acquisition of new advisory clients. The Trustees determined that these factors would not prevent the Board from approving the Agreements.
D. Economies of Scale
The Trustees reviewed information regarding economies of scale or other efficiencies resulting from increases, if any, in the Funds’ asset levels. The Trustees considered economies of scale and whether existing fees might require adjustment. The Trustees noted that, from September 2012 to September 2013, the assets of the Aegis High Yield Fund increased from $50.8 million to $59.3 million.
The Trustees determined that the Fund will have to show substantial growth in assets before any significant economies of scale can be achieved. They did consider, however, that the reorganization of the Aegis Value Fund Inc. into the Aegis Funds series is expected to generate potential economies of scale from fee savings with regard to state blue sky fees, printing/mailing fees resulting from a combined prospectus and annual/semi-annual reports, and EDGARizing costs for combined documents and other “Trust” level filings. They concluded that these potential savings did not warrant a change to the advisory fee arrangements at this time.
E. Comparisons of the Services to be Rendered and Fee Amounts
The Trustees reviewed the fees paid to (or to be paid to) AFC and the Fund’s overall expense ratio and considered whether the fees were reasonable in light of the services provided and the fees charged by other advisers to peer group funds. In evaluating the Fund’s advisory fees, the Trustees took into account the demands, complexity and quality of the investment management of the Fund and the Adviser’s commitments to continue the existing expense limitation agreements through at least the annual update periods ending on April 30, 2015 for Aegis High Yield Fund.
The Trustees also noted that the Aegis High Yield Fund paid an advisory fee of 0.90% of net assets during 2013 and that other expenses for Class I shares were capped at 0.30%, for a total net expense ratio of 1.20%. They considered information reflecting that the Class I actual gross expenses for six months ending June 30, 2013 were approximately 1.39%, and for 2012 were 1.38% of net assets. They considered information reflecting that other expenses for Class A shares were capped at 0.55%, for a total net expense ratio of 1.45%. They considered information showing that the Class A actual gross expenses for six months ending June 30, 2013 were approximately 1.64%. They noted that the expenses above the caps are being paid by AFC under the expense limitation agreement between the Fund and AFC. They considered information showing that the peer group median gross expense ratio of the 597 high yield bond funds currently tracked by Morningstar is 1.12% and that the peer group median net expense ratio of the
597 high yield bond funds is 1.03%. They reviewed information showing that the median management fee percentage of the 597 high yield bond funds currently tracked by Morningstar is 0.55%, with the average median size of the funds being $434.8 million.
The Trustees considered expense ratio and management fee information for the comparable funds to which they had compared the Fund’s performance. They also considered information concerning the fees charged by the Adviser to its managed accounts and the strategies employed for those accounts. They also considered the differences between the services provided to those accounts by the Adviser and the services provided to the Fund by the Adviser.
The Trustees concluded that the Fund’s advisory fee was reasonable in light of the quality and nature of the services provided by AFC and that the Fund’s overall expense ratio was reasonable.
AEGIS MUTUAL FUNDS PRIVACY NOTICE
(This information is not part of the Report)
The Aegis Mutual Funds consider protecting the confidentiality of nonpublic personal information of our shareholders to be of the utmost importance. This privacy notice describes the information that we may collect, when we may disclose that information, and how we maintain the security and confidentiality of your nonpublic personal information.
Information We Collect
The Aegis Mutual Funds collect and retain information about you only when we reasonably believe that the information will assist us in managing your accounts. We collect certain information to protect your account, to ensure accuracy in reporting and recordkeeping, and to identify you when we conduct transactions for you. The information is also used to comply with certain laws and regulations that may apply to us and to help us understand your financial needs as we design or improve our products and services. We will also use your information to administer your account and transactions. We collect nonpublic personal information about you from the following sources:
| | • | Your application or other forms, correspondence or conversations (examples include name, date of birth, address and Social Security Number); and |
| | • | Your transactions with us (examples include account activity and balances). |
Information We Disclose
We understand that you expect the personal information you have entrusted to us to be handled with great care. We may share information about you under agreements with our service providers in order for our service providers to provide shareholder services and administer the funds, to process transactions, or to manage accounts for you. We share only information about our recordkeeping or transactions involving you or your account, such as your name, address, Social Security Number, account activity and account balances. We do not sell your nonpublic personal information. The Aegis Mutual Funds do not disclose nonpublic personal information about our shareholders to nonaffiliated third parties, except as permitted by applicable law. In all cases, your information is strictly protected. Each agreement requires that service providers keep the personal nonpublic information strictly confidential and use it only for the purpose for which it was intended.
Former Shareholders
The personal nonpublic information of former shareholders is treated in the same manner as the information of current shareholders.
Confidentiality and Security
The Aegis Mutual Funds restrict access to your nonpublic personal information to those individuals who need to know the information in order to provide product and services to you. We maintain physical, electronic and procedural safeguards that comply with federal standards to guard your nonpublic personal information. We recommend that you carefully protect your personal information and not provide your account name or number to anyone for any reason. If you choose to provide this information to a third party, you do so at your own risk.
Item 2. Code of Ethics.
The registrant has adopted a code of ethics that applies to the registrant’s principal executive officer and principal financial officer. The registrant has not made any amendments to its code of ethics during the period covered by this report. The registrant has not granted any waivers from any provisions of the code of ethics during the period covered by this report. A copy of the Registrant’s Code of Ethics is incorporated by reference to the Registrant’s Form N-CSR filed on November 6, 2008
Item 3. Audit Committee Financial Expert.
The registrant’s board of trustees has determined that it does not have an audit committee financial expert serving on its audit committee. At this time, the registrant believes that the experience provided by each member of the audit committee together offers the registrant adequate oversight for the registrant’s level of financial complexity.
Item 4. Principal Accountant Fees and Services.
The registrant has engaged its principal accountant to perform audit services, audit-related services, tax services and other services during the past two fiscal years. “Audit services” refer to performing an audit of the registrant's annual financial statements or services that are normally provided by the accountant in connection with statutory and regulatory filings or engagements for those fiscal years. “Audit-related services” refer to the assurance and related services by the principal accountant that are reasonably related to the performance of the audit. “Tax services” refer to professional services rendered by the principal accountant for tax compliance, tax advice, and tax planning. There were no “Other services” provided by the principal accountant. The following table details the aggregate fees billed or expected to be billed for each of the last two fiscal years for audit fees, audit-related fees, tax fees and other fees by the principal accountant.
The audit committee has adopted pre-approval policies and procedures that require the audit committee to pre-approve all audit and non-audit services of the registrant, including services provided to any entity affiliated with the registrant.
The percentage of fees billed by BBD, LLP applicable to non-audit services pursuant to waiver of pre-approval requirement were as follows:
All of the principal accountant’s hours spent on auditing the registrant’s financial statements were attributed to work performed by full-time permanent employees of the principal accountant.
Item 5. Audit Committee of Listed Registrants.
Not applicable to registrants who are not listed issuers (as defined in Rule 10A-3 under the Securities Exchange Act of 1934).
Item 6. Investments.
Schedule of Investments is included as part of the report to shareholders filed under Item 1 of this Form.
Item 7. Disclosure of Proxy Voting Policies and Procedures for Closed-End Management Investment Companies.
Not applicable to open-end investment companies.
Item 8. Portfolio Managers of Closed-End Management Investment Companies.
Not applicable to open-end investment companies.
Item 9. Purchases of Equity Securities by Closed-End Management Investment Company and Affiliated Purchasers.
Not applicable to open-end investment companies.
Item 10. Submission of Matters to a Vote of Security Holders.
Not Applicable.
Item 11. Controls and Procedures.
Item 12. Exhibits.
(2) Certification for the President/Chief Executive Officer and Treasurer/Chief Financial Officer pursuant to Section 302 of the Sarbanes-Oxley Act of 2002. Filed herewith.
(3) Any written solicitation to purchase securities under Rule 23c-1 under the Act sent or given during the period covered by the report by or on behalf of the registrant to 10 or more persons.
Not applicable to open-end investment companies.
Pursuant to the requirements of the Securities Exchange Act of 1934 and the Investment Company Act of 1940, the registrant has duly caused this report to be signed on its behalf by the undersigned, thereunto duly authorized.
Scott L. Barbee, President
Pursuant to the requirements of the Securities Exchange Act of 1934 and the Investment Company Act of 1940, this report has been signed below by the following persons on behalf of the registrant and in the capacities and on the dates indicated.
Sarah Q. Zhang, Treasurer