Shareholders’ Letter
(unaudited)
February 1, 2017
To the Shareholders of the Aegis Funds:
We are pleased to present the Aegis Value Fund’s Annual Report for the year ended December 31, 2016.
If at any time you would like further information about the Fund, please go to our website at www.aegisfunds.com for a more detailed look at our market commentary and the Fund’s performance record. We will briefly review the objective and strategy of the Fund.
The Aegis Value Fund seeks to achieve long-term, capital appreciation. Our strategy is to invest in a well-researched portfolio of small-cap equities trading at a fraction of their intrinsic worth. We believe the equity markets are often inefficient, and we employ a contrarian, company-focused approach, selecting each stock individually on its own merit. We purchase shares in companies when we judge share prices to be significantly undervalued relative to our assessment of fundamental value, focusing on stocks trading at low price-to-book or price-to- future cash flow ratios, segments of the market where academic research shows historical returns have significantly outpaced the overall market. We often invest in companies when they are misunderstood, out of favor, or neglected, and generally hold these companies until share prices reach our estimate of intrinsic value.
Performance
| | | | Annualized |
| | | | | | | | Since | Since |
| | Three | Year- | One | Three | Five | Ten | I Share | A Share |
| | Month | to-Date | Year | Year | Year | Year | Inception | Inception |
| Class I shares | | | | | | | | |
| (AVALX) – at NAV | | | | | | | | |
| (Inception 5/15/98) | 6.73% | 70.71% | 70.71% | -1.29% | 10.23% | 5.63% | 9.96% | N/A |
| Class A shares | | | | | | | | |
| (AVFAX) – at NAV | | | | | | | | |
| (Inception 2/26/14) | 6.66% | 70.41% | 70.41% | N/A | N/A | N/A | N/A | -1.59% |
| Class A shares | | | | | | | | |
| (AVFAX) – | | | | | | | | |
| With Load | 2.64% | 63.97% | 63.97% | N/A | N/A | N/A | N/A | -2.90% |
| Russell 2000 | | | | | | | | |
| Value Index | 14.07% | 31.74% | 31.74% | 8.31% | 15.07% | 6.26% | 8.42% | 8.85% |
| Russell 2000 Index | 8.83% | 21.31% | 21.31% | 6.74% | 14.46% | 7.07% | 7.24% | 6.49% |
| S&P 500 Index | 3.82% | 11.96% | 11.96% | 8.87% | 14.66% | 6.95% | 5.82% | 9.32% |
Performance data quoted represents past performance. Past performance does not guarantee future results. Investment return and principal value of an investment will fluctuate so that an investor’s shares, when redeemed, may be worth more or less than their original cost. Current performance may be lower or higher than the performance data quoted. Please call 800-528-3780 to obtain performance data current to the most recent month-end. The Aegis Value Fund Class I and Class A have an annualized gross expense ratio of 1.53% and 1.78%, respectively per the Fund’s most recent Prospectus. The Aegis Value Fund Class I and Class A’s net annualized expense ratio, after fee waivers, is 1.50%, and 1.75%, respectively. Please refer to the Fund’s most recent financial highlights table in this Annual Report, which contains a more recent net expense ratio. Under the waiver, the Advisor has contractually agreed to limit certain fees and/or reimburse certain of the Fund's expenses through April 30, 2017. Performance data for the AVFAX shares reflect the Class A maximum sales charge of 3.75%. Performance data shown for the Class A-at NAV does not reflect the maximum sales charge. If reflected, total return would be reduced. Short-term performance is not a good indication of the Fund’s future performance and an investments should not be made based solely on historic returns.
Aegis Value Fund | | Class I | | | Class A | |
| Net Assets | | $138.8 Million | | | $4.6 Million | |
| NAV / Share | | $ | 16.76 | | | $ | 16.67 | |
| Net Expense Ratio* | | | 1.50 | % | | | 1.75 | % |
| Management Fee | | | 1.20 | % | | | 1.20 | % |
| Distribution Fee (12b-1) | | None | | | | 0.25 | % |
| Redemption Fee | | None | | | None | |
| Income & capital gain distributions** | | $ | 0.2431 | | | $ | 0.2260 | |
__________
| * | As reported in the Fund’s Prospectus dated April 30, 2016. |
| ** | All income distributions |
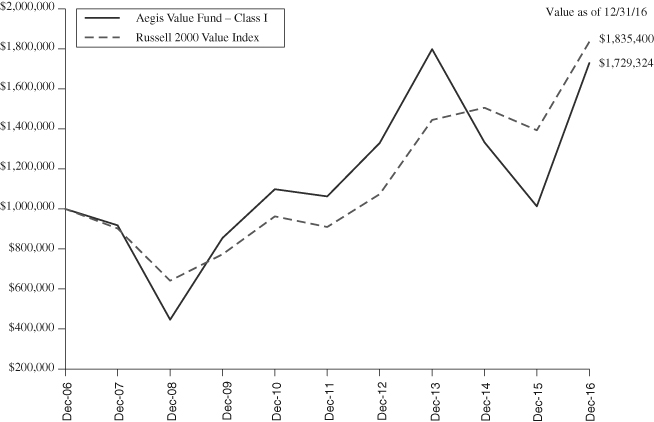
From inception of the Aegis Value Fund’s Class I shares on May 15, 1998 through December 31, 2016, the Fund Class I shares have posted a cumulative gain of 486.89%, compared to a cumulative gain of 351.19% in our primary small-cap benchmark, the Russell 2000 Value Index. During the same period, the Russell 2000 Index of small-cap stocks posted a cumulative gain of 268.03%, and the S&P 500 Index of large cap stocks posted a cumulative gain of 186.69%.
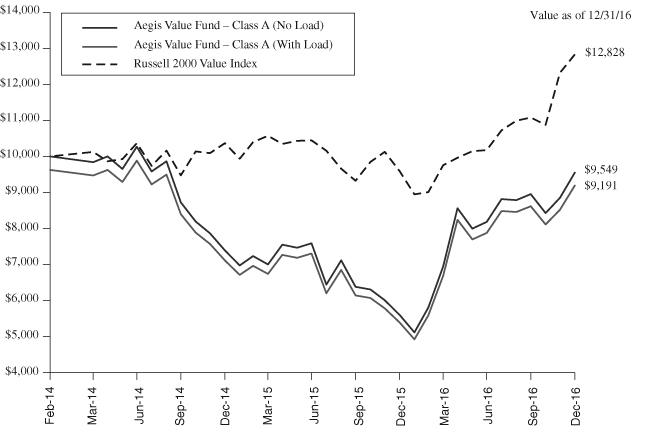
From inception of the Aegis Value Fund’s Class A shares on February 26, 2014 through December 31, 2016, the Fund Class A shares have posted a cumulative loss of 4.45% at net asset value, compared to a cumulative gain of 27.29% in our primary small-cap benchmark, the Russell 2000 Value Index. During the same period, the Russell 2000 Index of small-cap stocks posted a cumulative gain of 19.62%, and the S&P 500 Index of large cap stocks posted a cumulative gain of 28.83%.
For the twelve month period ending December 31, 2016, the Fund Class I shares gained 70.71%, outperforming the Russell 2000 Value Index, which increased 31.74%. Fund performance was most positively impacted by investments in the precious metals mining sector led by Coeur Mining, Guyana Goldfields, Alamos Gold and Geodrill. Energy exposure, led by WPX Energy and McDermott Intl, also significantly contributed to performance. Most of the Fund’s largest non-precious metals and non-energy positions also added to performance with Alliance One International and Delta Apparel providing notable gains. Resolute Forest Products was the lone investment that negatively impacted Fund performance by more than one percent in 2016. The Russell 2000 Index gained 21.31% while the S&P 500 gained 11.96% over the same period.
A more in-depth review of the Fund’s performance, outlook and general market commentary can be found in the fourth Quarter 2016 Manager’s Letter. For those of you who do not automatically receive our quarterly manager’s letters in the mail from your broker, they are available on our website at www.aegisfunds.com or by calling us at 800-528-3780. However, please be aware that these manager’s letters are not a part of the SEC-mandated Annual Report contained in this booklet. We thank you for your continued interest.
Aegis Financial Corporation
Scott L. Barbee, CFA
Portfolio Manager
Must be preceded or accompanied by Prospectus.
Opinions expressed are subject to change at any time, are not guaranteed and should not be considered investment advice.
Any recommendation made in this report may not be suitable for all investors. This presentation does not constitute a solicitation or offer to purchase or sell any securities. Its use in connection with any offering of Fund shares is authorized only in the case of a concurrent or prior delivery of a prospectus.
Mutual fund investing involves risk. Principal loss is possible. Investments in foreign securities involve greater volatility and political, economic and currency risks and differences in accounting methods. Investments in small and mid-cap companies involve additional risks such as limited liquidity and greater volatility. Value stocks may fall out of favor with investors and underperform growth stocks during given periods.
Russell 2000 Value Index: A market-capitalization weighted equity index maintained by the Russell Investment Group and based on the Russell 2000 Index, which measures how U.S. stocks in the equity value segment perform.
Russell 2000 Index: An index of approximately 2000 of the smallest securities based on a combination of their market cap and current index membership, which measures the performance of the small-cap segment of the U.S. equity universe.
S&P 500 Index: An index of 500 stocks chosen for market size, liquidity and industry grouping, among other factors. The S&P 500 is designed to be a leading indicator of U.S. equities and is meant to reflect the risk/return characteristics of the large cap universe. One cannot invest directly in an index.
Price-to-Book: A ratio used to compare a stock’s market value to its book value. It is calculated by dividing the current closing price of the stock by the latest quarter’s book value per share.
Price-to-Future Cash Flow: A measure of the market’s expectations of a firm’s future financial health. Because this measure deals with cash flow, the effects of depreciation and other non-cash factors are removed.
An investment cannot be made directly in an index.
Fund holdings, sector allocations, and geographic allocations are subject to change and are not a recommendation to buy or sell any security. Please see the schedule of portfolio investments provided in this report for the complete listing of Fund holdings.
Fund Distributor: Quasar Distributors, LLC. Quasar Distributors, LLC is affiliated with U.S. Bancorp Fund Services, LLC.
About Your Fund’s Expenses
December 31, 2016
(Unaudited)
Important Note
As a shareholder of the Fund, you incur two types of costs: (1) transaction costs, including sales charges (loads) on purchase payments and CDSC redemption fees, and (2) ongoing costs, including advisory fees, distribution (12b-1) fees (Class A only) and other Fund expenses. If you purchase Class A shares of the Fund you will pay an initial sales charge of 3.75% when you invest. Class I shares of the Fund charge no sales load.
This example is intended to help you understand your ongoing costs (in dollars) of investing in the Fund and to compare these costs with the ongoing costs of investing in other mutual funds. The example is based on an investment of $1,000 invested at the beginning of the period and held for the entire period, July 1, 2016 – December 31, 2016, for the Aegis Value Fund Class I and Class A.
Actual expenses
The table below provides information about actual account values and actual expenses.
Hypothetical example for comparison purposes
The below table also provides information about hypothetical account values and hypothetical expenses based on the Fund’s actual expense ratio and an assumed rate of return of 5% per year before expenses, which is not the Fund’s actual return. The hypothetical account values and expenses may not be used to estimate the actual ending account balance or expenses you paid for the period. You may use this information to compare the ongoing costs of investing in the Fund and other funds. To do so, compare this 5% hypothetical example with the 5% hypothetical examples that appear in the shareholder reports of the other funds.
Please note that the expenses shown in the table are meant to highlight your ongoing costs only, and do not reflect any transactional cost, such as sales charges (loads), or redemption fees (if applicable). Therefore, the hypothetical section of the tables is useful in comparing ongoing cost only, and will not help you determine the relative total cost of owning different funds. In addition, if these transactional costs were included, your cost would have been higher.
| | | | | | | | | Hypothetical |
| | | | | | | | | (5% annual return |
| | | | | Actual | | before expenses) |
| | | Beginning | | Ending | | | | Ending | | |
| | | Account | | Account | | Expenses | | Account | | Expenses |
| | | Value | | Value(1) | | Paid During | | Value | | Paid During |
| | | 7/1/16 | | 12/31/16 | | Period | | 12/31/16 | | Period |
| Aegis Value Fund – | | | | | | | | | | |
| Class A | | $1,000.00 | | $1,166.70 | | $9.53(2) | | $1,016.38 | | $8.89(2) |
| Aegis Value Fund – | | | | | | | | | | |
| Class I | | $1,000.00 | | $1,167.80 | | $8.17(3) | | $1,017.60 | | $7.61(3) |
__________
(1) | The actual ending account value is based on the actual total return of the Fund for the period July 1, 2016 to December 31, 2016 after actual expenses and will differ from the hypothetical ending account value which is based on the Fund’s actual expense ratio and a hypothetical annual return of 5% before expenses. |
(2) | Expenses are equal to the Fund’s annualized expense ratio (1.75%) multiplied by the average account value over the period, multiplied by 184/366 (to reflect the period between 7/1/2016 – 12/31/2016). |
(3) | Expenses are equal to the Fund’s annualized expense ratio (1.50%) multiplied by the average account value over the period, multiplied by 184/366 (to reflect the period between 7/1/2016 – 12/31/2016). |
Please see performance data disclosure on page 3.
Statistics (Unaudited)
Result of a $10,000 Investment in Aegis Value Fund – Class A
(assumes investment made on February 26, 2014)
Result of a $1,000,000 Investment in Aegis Value Fund – Class I
(assumes investment made on December 31, 2006)
Aegis Value Fund
Portfolio Characteristics
December 31, 2016
(Unaudited)
| Industry Breakdown | | | | | | | | | |
| | | % of the Fund’s Net Assets | |
| Common Stock | | | | | | | | | 94.0 | % |
| Consumer Discretionary | | | | | | 9.1 | % | | | | |
| Auto Components | | | 0.6 | % | | | | | | | | |
| Hotels, Restaurants & Leisure | | | 1.6 | % | | | | | | | | |
| Household Durables | | | 1.3 | % | | | | | | | | |
| Specialty Retail | | | 0.9 | % | | | | | | | | |
| Textiles, Apparel & Luxury Goods | | | 4.7 | % | | | | | | | | |
| Consumer Staples | | | | | | | 10.6 | % | | | | |
| Tobacco | | | 10.6 | % | | | | | | | | |
| Energy | | | | | | | 14.2 | % | | | | |
| Energy Equipment & Services | | | 9.1 | % | | | | | | | | |
| Oil, Gas & Consumable Fuels | | | 5.1 | % | | | | | | | | |
| Financials | | | | | | | 4.1 | % | | | | |
| Banks | | | 0.0 | % | | | | | | | | |
| Capital Markets | | | 0.2 | % | | | | | | | | |
| Insurance | | | 3.7 | % | | | | | | | | |
| Real Estate Management & Development | | | 0.0 | % | | | | | | | | |
| Thrifts & Mortgage Finance | | | 0.2 | % | | | | | | | | |
| Industrials | | | | | | | 5.9 | % | | | | |
| Machinery | | | 1.8 | % | | | | | | | | |
| Trading Companies & Distributors | | | 4.1 | % | | | | | | | | |
| Information Technology | | | | | | | 3.3 | % | | | | |
| Electronic Equipment, Instruments & Components | | | 1.2 | % | | | | | | | | |
| Semiconductor & Semiconductor Equipment | | | 2.1 | % | | | | | | | | |
| Materials | | | | | | | 42.5 | % | | | | |
| Construction Materials | | | 2.0 | % | | | | | | | | |
| Copper | | | 2.4 | % | | | | | | | | |
| Diversified Metals & Mining | | | 1.7 | % | | | | | | | | |
| Gold, Silver & Precious Metals & Minerals | | | 17.4 | % | | | | | | | | |
| Mining Services | | | 3.7 | % | | | | | | | | |
| Paper & Forest Products | | | 12.4 | % | | | | | | | | |
| Steel | | | 2.9 | % | | | | | | | | |
| Telecommunication Services | | | | | | | 4.3 | % | | | | |
| Diversified Telecommunication Services | | | 4.3 | % | | | | | | | | |
| Warrants | | | | | | | | | | | 0.2 | % |
| Materials | | | | | | | 0.2 | % | | | | |
| Gold, Silver & Precious Metals & Minerals | | | 0.2 | % | | | | | | | | |
| Other Assets in Excess of Liabilities | | | | | | | | | | | 5.8 | % |
| Total Net Assets | | | | | | | | | | | 100.0 | % |
Aegis Value Fund
Schedule of Portfolio Investments
December 31, 2016
| | | Shares | | | Value | |
| | | | | | | |
| Common Stocks – 94.0% | | | | | | |
| | | | | | | |
| Consumer Discretionary – 9.1% | | | | | | |
| | | | | | | |
| Auto Components – 0.6% | | | | | | |
Sypris Solutions, Inc.(1) | | | 931,799 | | | $ | 819,890 | |
| | | | | | | | | |
| Hotels, Restaurants & Leisure – 1.6% | | | | | | | | |
| Bowl Amer, Inc. – Class A | | | 9,481 | | | | 163,547 | |
Luby’s, Inc.(1) | | | 130,603 | | | | 558,981 | |
Ruby Tuesday, Inc.(1) | | | 503,626 | | | | 1,626,712 | |
| | | | | | | | 2,349,240 | |
| | | | | | | | | |
| Household Durables – 1.3% | | | | | | | | |
Natuzzi S.p.A. – SP ADR(1)(2) | | | 373,265 | | | | 843,579 | |
Retail Holdings N.V.(2) | | | 57,305 | | | | 991,376 | |
| | | | | | | | 1,834,955 | |
| | | | | | | | | |
| Specialty Retail – 0.9% | | | | | | | | |
| Citi Trends Inc. | | | 51,521 | | | | 970,656 | |
Reitmans Canada Ltd – Class A(2)(5) | | | 73,134 | | | | 317,036 | |
| | | | | | | | 1,287,692 | |
| | | | | | | | | |
| Textiles, Apparel & Luxury Goods – 4.7% | | | | | | | | |
Delta Apparel, Inc.(1) | | | 326,831 | | | | 6,775,207 | |
| Total Consumer Discretionary | | | | | | | 13,066,984 | |
| | | | | | | | | |
| Consumer Staples – 10.6% | | | | | | | | |
| | | | | | | | | |
| Tobacco – 10.6% | | | | | | | | |
Alliance One International, Inc.(1)(3) | | | 791,951 | | | | 15,205,459 | |
| | | | | | | | | |
| Energy – 14.2% | | | | | | | | |
| | | | | | | | | |
| Energy Equipment & Services – 9.1% | | | | | | | | |
Deep Down, Inc.(1) | | | 587,774 | | | | 822,884 | |
Gulfmark Offshore, Inc. Class A(1) | | | 120,109 | | | | 210,191 | |
McDermott International, Inc.(1)(2) | | | 752,032 | | | | 5,557,516 | |
Mitcham Industries, Inc.(1)(3) | | | 846,979 | | | | 3,514,963 | |
Parker Drilling Co.(1) | | | 1,122,213 | | | | 2,917,754 | |
| | | | | | | | 13,023,308 | |
The accompanying notes are an integral part of these financial statements.
Aegis Value Fund
Schedule of Portfolio Investments
December 31, 2016
| | | | Shares | | | Value | |
| | | | | | | | |
| Oil, Gas & Consumable Fuels – 5.1% | | | | | | | |
Ardmore Shipping Corp(2) | | | | 152,785 | | | $ | 1,130,609 | |
WPX Energy, Inc.(1) | | | | 428,302 | | | | 6,240,360 | |
| | | | | | | | | 7,370,969 | |
| Total Energy | | | | | | | | 20,394,277 | |
| | | | | | | | | | |
| Financials – 4.1% | | | | | | | | | |
| | | | | | | | | | |
| Banks – 0.0% | | | | | | | | | |
| Citizens Bancshares Corp. | | | | 3,024 | | | | 27,216 | |
| | | | | | | | | | |
| Capital Markets – 0.2% | | | | | | | | | |
| US Global Investors, Inc. – Class A | | | | 246,350 | | | | 335,036 | |
| | | | | | | | | | |
| Insurance – 3.7% | | | | | | | | | |
Conifer Holdings, Inc.(1)(3) | | | | 434,298 | | | | 3,539,529 | |
Echelon Financial Holdings, Inc.(1) | CAD | | | 205,112 | | | | 1,695,708 | |
| | | | | | | | | 5,235,237 | |
| | | | | | | | | | |
| Real Estate Management | | | | | | | | | |
| & Development – 0.0% | | | | | | | | | |
| Public Service Properties | | | | | | | | | |
Investments Ltd.(1)(2)(5) | GBP | | | 5,582 | | | | 30,957 | |
| | | | | | | | | | |
| Thrifts & Mortgage Finance – 0.2% | | | | | | | | | |
| First Federal of Northern | | | | | | | | | |
| Michigan Bancorp, Inc. | | | | 35,640 | | | | 272,646 | |
| Total Financials | | | | | | | | 5,901,092 | |
| | | | | | | | | | |
| Industrials – 5.9% | | | | | | | | | |
| | | | | | | | | | |
| Machinery – 1.8% | | | | | | | | | |
| Hardinge, Inc. | | | | 232,383 | | | | 2,574,804 | |
| | | | | | | | | | |
| Trading Companies & Distributors – 4.1% | | | | | | | | | |
Fly Leasing Ltd. – ADR(1)(2) | | | | 443,757 | | | | 5,901,968 | |
| Total Industrials | | | | | | | | 8,476,772 | |
| | | | | | | | | | |
| Information Technology – 3.3% | | | | | | | | | |
| Electronic Equipment, | | | | | | | | | |
| Instruments & Components – 1.2% | | | | | | | | | |
| Vishay Intertechnology, Inc. | | | | 105,989 | | | | 1,717,022 | |
The accompanying notes are an integral part of these financial statements.
Aegis Value Fund
Schedule of Portfolio Investments
December 31, 2016
| | | | Shares | | | Value | |
| | | | | | | | |
| Semiconductors & | | | | | | | |
| Semiconductor Equipment – 2.1% | | | | | | | |
Photronics, Inc.(1) | | | | 235,234 | | | $ | 2,658,144 | |
Rubicon Technology, Inc.(1) | | | | 541,423 | | | | 335,141 | |
| | | | | | | | | 2,993,285 | |
| Total Information Technology | | | | | | | | 4,710,307 | |
| | | | | | | | | | |
| Materials – 42.5% | | | | | | | | | |
| | | | | | | | | | |
| Construction Materials – 2.0% | | | | | | | | | |
Select Sands Corp(1)(2) | CAD | | | 3,400,000 | | | | 2,912,151 | |
| | | | | | | | | | |
| Copper – 2.4% | | | | | | | | | |
Minera Alamos Inc.(1)(2)(5) | CAD | | | 3,396,809 | | | | 341,540 | |
Nevsun Resources Ltd.(2) | | | | 1,024,962 | | | | 3,167,133 | |
| | | | | | | | | 3,508,673 | |
| | | | | | | | | | |
| Diversified Metals & Mining – 1.7% | | | | | | | | | |
Amerigo Resources Ltd.(1)(2)(3) | | | | 9,615,825 | | | | 2,414,534 | |
| | | | | | | | | | |
| Gold, Silver & Precious | | | | | | | | | |
| Metals & Minerals – 17.4% | | | | | | | | | |
Alacer Gold Corp.(1)(2) | CAD | | | 488,679 | | | | 820,981 | |
AuRico Metals, Inc.(1)(2) | CAD | | | 1,693,232 | | | | 1,256,886 | |
Continental Gold, Inc.(1)(2) | CAD | | | 1,130,455 | | | | 3,704,615 | |
Dalradian Resources, Inc.(1)(2) | CAD | | | 4,539,122 | | | | 3,955,441 | |
Dundee Precious Metals Inc.(1)(2) | CAD | | | 2,490,196 | | | | 4,111,065 | |
Endeavour Mining Corporation(1)(2) | CAD | | | 241,757 | | | | 3,611,995 | |
GoldQuest Mining Corp.(1) | CAD | | | 2,849,300 | | | | 572,979 | |
IAMGOLD Corp.(1)(2) | | | | 344,812 | | | | 1,327,526 | |
Lion One Metals Ltd.(1)(2) | CAD | | | 2,200,000 | | | | 1,573,009 | |
Lydian International, Ltd.(1)(2) | CAD | | | 8,725,077 | | | | 2,144,472 | |
Perseus Mining Limited(1)(2) | CAD | | | 1,174,077 | | | | 271,079 | |
Pershing Gold Corp.(1) | | | | 115,169 | | | | 376,603 | |
Sulliden Mining Capital, Inc.(1) | CAD | | | 407,693 | | | | 89,576 | |
TMAC Resources Inc.(1)(2) | CAD | | | 91,445 | | | | 1,044,093 | |
| | | | | | | | | 24,860,320 | |
| | | | | | | | | | |
| Mining Services – 3.7% | | | | | | | | | |
Geodrill Ltd.(1)(2)(3) | CAD | | | 2,898,257 | | | | 5,245,421 | |
The accompanying notes are an integral part of these financial statements.
Aegis Value Fund
Schedule of Portfolio Investments
December 31, 2016
| | | Shares | | | Value | |
| | | | | | | |
| Paper & Forest Products – 12.4% | | | | | | |
Interfor Corp.(1)(2) | | | 141,960 | | | $ | 1,589,140 | |
| Mercer International, Inc. | | | 378,237 | | | | 4,028,224 | |
Resolute Forest Products, Inc.(1) | | | 1,435,452 | | | | 7,679,668 | |
Verso Corp. – Class A(1) | | | 620,843 | | | | 4,407,986 | |
| | | | | | | | 17,705,018 | |
| | | | | | | | | |
| Steel – 2.9% | | | | | | | | |
| Universal Stainless & | | | | | | | | |
Alloy Products, Inc.(1) | | | 312,187 | | | | 4,217,646 | |
| Total Materials | | | | | | | 60,863,763 | |
| | | | | | | | | |
| Telecommunication Services – 4.3% | | | | | | | | |
| Diversified Telecommunication Services – 4.3% | | | | | | | | |
| Alaska Communications | | | | | | | | |
Systems Group, Inc.(1)(3) | | | 3,797,461 | | | | 6,227,836 | |
| Total Common Stocks (Cost $138,348,764) | | | | | | | 134,846,490 | |
| | | | | | | | | |
| Warrants – 0.2% | | | | | | | | |
| | | | | | | | | |
| Materials – 0.2% | | | | | | | | |
| | | | | | | | | |
| Gold, Silver & Precious Metals & Minerals – 0.2% | | | | | | | | |
| Avino Silver & Gold Mines Ltd., | | | | | | | | |
| Exercise Price: $2.87, | | | | | | | | |
02/25/2017(1)(4)(6) | | | 311,922 | | | | — | |
| Lion One Metals Ltd., | | | | | | | | |
| Exercise Price: $1.35, | | | | | | | | |
03/12/2018(2)(4)(6) | | | 2,200,000 | | | | 262,168 | |
| | | | | | | | 262,168 | |
| Total Warrants (Cost $464,020) | | | | | | | 262,168 | |
| Total Investments – 94.2% | | | | | | | | |
| (Cost $138,812,784) | | | | | | | 135,108,658 | |
| Other Assets in Excess of Liabilities – 5.8% | | | | | | | 8,321,500 | |
| Net Assets – 100.0% | | | | | | $ | 143,430,158 | |
The accompanying notes are an integral part of these financial statements.
Aegis Value Fund
Schedule of Portfolio Investments
December 31, 2016
__________
Percentages are stated as a percent of net assets.
| (1) | Non-income producing securities. |
| (2) | Foreign security denominated in U.S. Dollars. |
| (3) | Affiliated Company − The fund is owner of more than 5% of the outstanding voting securities. See Notes to the Financial Statements for additional information on Investments in Affiliated Companies. |
| (4) | Security was fair valued in accordance with the policies and procedures approved by the Board of Trustees. |
| (5) | Level 2 securities. |
| (6) | Level 3 securities. |
ADR — American Depositary Receipt
S.p.A. — Limited share company
N.V. — Public traded company
CAD — Canadian Dollar
GBP — British Pound
The securities in the portfolio have been organized by their respective GICS code.
The Global Industry Classification Standard (GICS®) was developed by and/or is exclusive property of MSCI, Inc. and Standard & Poor Financial Services LLC (“S&P”). GICS is a service mark of MSCI and S&P and has been licensed for use by U.S. Bancorp Fund services, LLC.
The accompanying notes are an integral part of these financial statements.
Aegis Value Fund
Statement of Assets and Liabilities
December 31, 2016
| Assets | | | |
| Investments in unaffiliated securities, at value (cost $95,978,289) | | $ | 98,960,916 | |
| Investments in affiliated securities*, at value (cost $42,834,495) | | | 36,147,742 | |
| Total investments in securities, at value (cost $138,812,784) | | $ | 135,108,658 | |
| Cash | | | 8,115,915 | |
| Receivable for Fund shares sold | | | 534,950 | |
| Dividends receivable | | | 78,346 | |
| Prepaid assets | | | 38,533 | |
| Total Assets | | | 143,876,402 | |
| | | | | |
| Liabilities | | | | |
| Accrued trustee and chief compliance officer fees | | | 10,470 | |
| Payable for investment securities purchased | | | 188,482 | |
| Payable for distribution fees | | | 5,297 | |
| Payable for fund shares redeemed | | | 50,067 | |
| Payable to investment advisor | | | 145,840 | |
| Payable for legal | | | 10,698 | |
| Payable for audit | | | 23,525 | |
| Payable for printing and postage | | | 8,936 | |
| Other payables | | | 2,929 | |
| Total Liabilities | | | 446,244 | |
| Net Assets | | $ | 143,430,158 | |
| | | | | |
| Net assets consist of: | | | | |
| Paid-in capital | | | 162,309,342 | |
| Accumulated net investment loss | | | (3,309,683 | ) |
| Accumulated net realized loss on investments | | | (11,865,375 | ) |
| Net unrealized depreciation on investments | | | | |
| and foreign currency transactions | | | (3,704,126 | ) |
| Net Assets | | $ | 143,430,158 | |
The accompanying notes are an integral part of these financial statements.
Aegis Value Fund
Statement of Assets and Liabilities
December 31, 2016
| Class A Shares | | | |
| Net Assets | | $ | 4,590,421 | |
| | | | | |
| Authorized (Par value $0.001 per share) | | | 100,000,000 | |
| Outstanding Shares | | | 275,291 | |
| Net asset value, redemption price per share | | $ | 16.67 | |
| Maximum offering price per share, after sales load (96.25/100) | | $ | 17.32 | ** |
| | | | | |
| Class I Shares | | | | |
| Net Assets | | $ | 138,839,737 | |
| | | | | |
| Authorized (Par value $0.001 per share) | | | 100,000,000 | |
| Outstanding Shares | | | 8,285,528 | |
| Net asset value, redemption price and offering price per share | | $ | 16.76 | |
__________
| * | Please refer to Note 7 for additional details. |
| ** | Reflects a maximum sales charge of 3.75%. A contingent deferred sales charge (CDSC) of 1.00% may be charged on shares redeemed within two years of purchase. |
The accompanying notes are an integral part of these financial statements.
Aegis Value Fund
Statement of Operations
For The Year Ended December 31, 2016
| Investment Income | | | |
Dividends from unaffiliated companies# | | $ | 496,787 | |
| Total Investment Income | | | 496,787 | |
| | | | | |
| Expenses | | | | |
| Investment advisory fees (Note 3) | | | 1,500,216 | |
| Transfer agent & custody fees | | | 106,683 | |
| Fund servicing fees | | | 94,905 | |
| Registration fees | | | 42,244 | |
| Directors & chief compliance officer fees | | | 36,976 | |
| Legal fees | | | 29,254 | |
| Insurance fees | | | 25,994 | |
| Audit fees | | | 23,531 | |
| Printing and postage fees | | | 21,468 | |
| Distribution fees – Class A (Note 4) | | | 4,948 | |
| Gross expenses | | | 1,886,219 | |
| Waiver of fees (Note 3) | | | (6,001 | ) |
| Net Expenses | | | 1,880,218 | |
| Net Investment Loss | | | (1,383,431 | ) |
| | | | | |
| Realized and unrealized gain on investments: | | | | |
| Net realized gain from: | | | | |
| Investments in unaffiliated companies | | | 1,821,049 | |
| Investments in affiliated companies (Note 7) | | | 3,678,837 | |
| Net realized gain on investments | | | 5,499,886 | |
| Change in net unrealized appreciation/depreciation on: | | | | |
| Investments in unaffiliated companies | | | 53,562,368 | |
| Investments in affiliated companies (Note 7) | | | 4,196,485 | |
| Net change in unrealized appreciation/depreciation | | | | |
| on investments | | | 57,758,853 | |
| Net realized and unrealized gain on investments | | | 63,258,739 | |
| Net increase in net assets resulting from operations | | $ | 61,875,308 | |
__________
| # | Net of foreign tax withholding of $34,899. |
The accompanying notes are an integral part of these financial statements.
Aegis Value Fund
(This Page Intentionally Left Blank.)
Aegis Value Fund
Statements of Changes in Net Assets
| | | Year Ended | | | Year Ended | |
| | | December 31, | | | December 31, | |
| | | 2016 | | | 2015 | |
| Operations | | | | | | |
| Net investment loss | | $ | (1,383,431 | ) | | $ | (599,967 | ) |
| Net realized gain (loss) on investments | | | | | | | | |
| and foreign currency transactions | | | 5,499,886 | | | | (9,362,556 | ) |
| Net change in unrealized appreciation/ | | | | | | | | |
| depreciation on investments and | | | | | | | | |
| foreign currency transactions | | | 57,758,853 | | | | (24,376,056 | ) |
| Net increase (decrease) in net assets | | | | | | | | |
| resulting from operations | | | 61,875,308 | | | | (34,338,579 | ) |
| Distributions | | | | | | | | |
| Net investment income – Class A | | | (61,007 | ) | | | — | |
| Net investment income – Class I | | | (1,983,857 | ) | | | (43,610 | ) |
| Net decrease in net assets resulting | | | | | | | | |
| from distributions paid | | | (2,044,864 | ) | | | (43,610 | ) |
| Capital share transactions | | | | | | | | |
| Subscriptions – Class A | | | 4,124,602 | | | | 28,351 | |
| Subscriptions – Class I | | | 22,361,478 | | | | 25,881,764 | |
| Distributions Reinvested – Class A | | | 61,007 | | | | — | |
| Distributions Reinvested – Class I | | | 1,788,378 | | | | 41,591 | |
| Redemptions – Class A | | | (535,075 | ) | | | (92,579 | ) |
| Redemptions – Class I | | | (47,869,414 | ) | | | (48,573,256 | ) |
| Net decrease in net assets resulting | | | | | | | | |
| from capital share transactions | | | (20,069,024 | ) | | | (22,714,129 | ) |
| Total Increase (Decrease) in Net Assets | | | 39,761,420 | | | | (57,096,318 | ) |
| Net Assets | | | | | | | | |
| Beginning of year | | | 103,668,738 | | | | 160,765,056 | |
| End of year | | $ | 143,430,158 | | | $ | 103,668,738 | |
| Accumulated net investment | | | | | | | | |
| loss at end of year | | $ | (3,309,683 | ) | | $ | (371,343 | ) |
The accompanying notes are an integral part of these financial statements.
Aegis Value Fund
Statements of Changes in Net Assets
| | | Year Ended | | | Year Ended | |
| | | December 31, | | | December 31, | |
| | | 2016 | | | 2015 | |
| Share information – Class A | | | | | | |
| Subscriptions | | | 293,555 | | | | 2,182 | |
| Distributions reinvested | | | 3,806 | | | | — | |
| Redemptions | | | (36,186 | ) | | | (7,741 | ) |
| Net increase (decrease) in shares | | | 261,175 | | | | (5,559 | ) |
| Beginning shares | | | 14,116 | | | | 19,675 | |
| Ending shares | | | 275,291 | | | | 14,116 | |
| Share information – Class I | | | | | | | | |
| Subscriptions | | | 1,578,127 | | | | 2,092,439 | |
| Distributions reinvested | | | 111,010 | | | | 3,961 | |
| Redemptions | | | (3,795,222 | ) | | | (3,939,287 | ) |
| Net decrease in shares | | | (2,106,085 | ) | | | (1,842,887 | ) |
| Beginning shares | | | 10,391,613 | | | | 12,234,500 | |
| Ending shares | | | 8,285,528 | | | | 10,391,613 | |
The accompanying notes are an integral part of these financial statements.
Aegis Value Fund – Class A
Financial Highlights
The table below sets forth financial data for a share outstanding in Class A throughout each year/period:
| | | | | | | | | For the | |
| | | | | | | | | Period from | |
| | | | | | | | | February 26, 2014 | |
| | | | | | | | | (Commencement of | |
| | | | | | | | | Operations) to | |
| | | Years Ended December 31, | | | December 31, | |
| | | 2016 | | | 2015 | | | 2014 | |
| Per Share Data | | | | | | | | | |
| Net asset value, beginning of period | | $ | 9.92 | | | $ | 13.09 | | | $ | 21.29 | |
| Income from investment operations: | | | | | | | | | | | | |
Net investment loss(5) | | | (0.20 | ) | | | (0.10 | ) | | | (0.16 | ) |
| Net realized and unrealized | | | | | | | | | | | | |
| gain (loss) on investments | | | 7.18 | | | | (3.07 | ) | | | (5.26 | ) |
| Total from investment operations | | | 6.98 | | | | (3.17 | ) | | | (5.42 | ) |
| Less distributions to | | | | | | | | | | | | |
| shareholders from: | | | | | | | | | | | | |
| Net investment income | | | (0.23 | ) | | | — | | | | — | |
| Net realized capital gains | | | — | | | | — | | | | (2.78 | ) |
| Total distributions | | | (0.23 | ) | | | — | | | | (2.78 | ) |
| Net asset value, end of period | | $ | 16.67 | | | $ | 9.92 | | | $ | 13.09 | |
Total investment return(1) | | | 70.41 | % | | | -24.22 | % | | | -26.01 | %(3) |
| Ratios (to average net assets)/ | | | | | | | | | | | | |
| Supplemental data: | | | | | | | | | | | | |
| Expenses after reimbursement/ | | | | | | | | | | | | |
recapture and fees paid(6) | | | 1.75 | % | | | 1.75 | % | | | 1.75 | %(4) |
| Expenses before reimbursement/ | | | | | | | | | | | | |
| recapture and fees paid | | | 1.76 | % | | | 1.78 | % | | | 1.79 | %(4) |
| Net investment loss | | | (1.35 | )% | | | (0.67 | )% | | | (1.04 | )%(4) |
Portfolio turnover(2) | | | 37 | % | | | 30 | % | | | 32 | %(3) |
| Net assets at end of period (000’s) | | $ | 4,590 | | | $ | 140 | | | $ | 258 | |
__________
| (1) | Based on net asset value, which does not reflect the sales charge. With sales charge included, the return is 63.97%, -27.06% and -28.79%, respectively. |
| (2) | Portfolio turnover is calculated on the basis of the Fund as a whole without distinguishing between the classes of shares issued. |
| (3) | Not Annualized |
| (4) | Annualized |
| (5) | Per share net investment income (loss) was calculated prior to tax adjustment, using average shares method. |
| (6) | Net expense ratio is less than gross ratio due to an expense limitation agreement being in place. |
The accompanying notes are an integral part of these financial statements.
Aegis Value Fund – Class I
Financial Highlights
The table below sets forth financial data for a share outstanding in Class I throughout each year/period:
| | | | | | | | | | | | For the Four | | | | | | | |
| | | Years Ended | | | Months Ended | | | Years Ended | |
| | | December 31, | | | December 31, | | | August 31, | |
| | | 2016 | | | 2015 | | | 2014 | | | 2013(4) | | | 2013 | | | 2012 | |
| Per Share Data | | | | | | | | | | | | | | | | | | |
| Net asset value, | | | | | | | | | | | | | | | | | | |
| beginning of period | | $ | 9.96 | | | $ | 13.12 | | | $ | 21.28 | | | $ | 20.55 | | | $ | 14.56 | | | $ | 13.16 | |
| Income from investment | | | | | | | | | | | | | | | | | | | | | | | | |
| operations: | | | | | | | | | | | | | | | | | | | | | | | | |
Net investment loss(1) | | | (0.15 | ) | | | (0.05 | ) | | | (0.15 | ) | | | (0.06 | ) | | | (0.02 | ) | | | — | |
| Net realized and unrealized | | | | | | | | | | | | | | | | | | | | | | | | |
| gain (loss) on investments | | | 7.19 | | | | (3.11 | ) | | | (5.23 | ) | | | 1.50 | | | | 6.02 | | | | 1.40 | |
| Total from investment | | | | | | | | | | | | | | | | | | | | | | | | |
| operations | | | 7.04 | | | | (3.16 | ) | | | (5.38 | ) | | | 1.44 | | | | 6.00 | | | | 1.40 | |
| Less distributions to | | | | | | | | | | | | | | | | | | | | | | | | |
| shareholders from: | | | | | | | | | | | | | | | | | | | | | | | | |
| Net investment income | | | (0.24 | ) | | | — | (6) | | | — | | | | (0.03 | ) | | | (0.01 | ) | | | — | |
| Net realized capital gains | | | — | | | | — | | | | (2.78 | ) | | | (0.68 | ) | | | — | | | | — | |
| Total distributions | | | (0.24 | ) | | | — | | | | (2.78 | ) | | | (0.71 | ) | | | (0.01 | ) | | | — | |
| Net asset value, | | | | | | | | | | | | | | | | | | | | | | | | |
| end of period | | $ | 16.76 | | | $ | 9.96 | | | $ | 13.12 | | | $ | 21.28 | | | $ | 20.55 | | | $ | 14.56 | |
| Total investment return | | | 70.81 | %(5) | | | -24.00 | % | | | -25.82 | %(5) | | | 7.07 | %(2) | | | 41.23 | % | | | 10.64 | % |
| Ratios (to average net | | | | | | | | | | | | | | | | | | | | | | | | |
| assets)/Supplemental data: | | | | | | | | | | | | | | | | | | | | | | | | |
| Expenses after | | | | | | | | | | | | | | | | | | | | | | | | |
| reimbursement/ | | | | | | | | | | | | | | | | | | | | | | | | |
| recapture and fees paid | | | 1.50 | % | | | 1.50 | % | | | 1.46 | % | | | 1.38 | %(3) | | | 1.43 | % | | | 1.47 | % |
| Expenses before | | | | | | | | | | | | | | | | | | | | | | | | |
| reimbursement/ | | | | | | | | | | | | | | | | | | | | | | | | |
| recapture and fees paid | | | 1.50 | % | | | 1.53 | % | | | 1.47 | % | | | 1.38 | %(3) | | | 1.43 | % | | | 1.47 | % |
| Net investment | | | | | | | | | | | | | | | | | | | | | | | | |
| income (loss) | | | (1.10 | )% | | | (0.42 | )% | | | (0.76 | )% | | | (0.79 | )%(3) | | | (0.09 | )% | | | 0.02 | % |
| Portfolio turnover | | | 37 | %(7) | | | 30 | %(7) | | | 32 | %(7) | | | 13 | %(2)(7) | | | 35 | % | | | 20 | % |
| Net assets at end of | | | | | | | | | | | | | | | | | | | | | | | | |
| period (000’s) | | $ | 138,840 | | | $ | 103,529 | | | $ | 160,507 | | | $ | 295,513 | | | $ | 295,513 | | | $ | 146,281 | |
__________
| (1) | Per share net investment income (loss) was calculated prior to tax adjustments, using average shares method. |
| (2) | Not Annualized |
| (3) | Annualized |
| (4) | On October 21, 2013, the Board of Directors approved the change in the fiscal year end to December 31st. |
| (5) | Includes adjustments made to the NAV in accordance with accounting principles generally accepted in the United States and, consequently, the net asset value for financial reporting purposes and the returns based upon those net asset values may differ from the net asset values and returns for shareholder transactions. |
| (6) | Less than 0.01 per share |
| (7) | Portfolio turnover is calculated on the basis of the Fund as a whole without distinguishing between the classes of shares issued. |
The accompanying notes are an integral part of these financial statements.
Notes to Financial Statements
December 31, 2016
1. The Organization
The Aegis Funds (comprised of the Aegis Value Fund) (the “Fund”) is registered under the Investment Company Act of 1940 (the “1940 Act”) as a diversified open-end management investment company. The shares of the Aegis Funds are issued in multiple series, with each series, in effect, representing a separate fund.
The Aegis Value Fund’s principal investment goal is to seek long-term capital appreciation by investing primarily in common stocks that are believed to be significantly undervalued relative to the market based on a company’s book value, revenues, or cash flow.
The Fund currently offers Class A and Class I shares. The Fund’s Class A shares commenced operations February 26, 2014. The Fund’s Class I commenced operations May 15, 1998. Each share class represents an equal pro rata interest in the Fund and provides the shareholder equal voting rights regarding any matters relating solely to that particular class. The Fund’s Class A shares are subject to a 3.75% front end sales load and 1.00% contingent deferred sales charge for redemptions made within 2 years of purchase date.
2. Summary of Significant Accounting Policies
As an investment company, as defined in Financial Accounting Standards Board (“FASB”) Accounting Standards Update 2013-08, the Fund follows accounting and reporting guidance under FASB Accounting Standards Codification Topic 946, “Financial Services – Investment Companies”.
Security valuation. Investments in securities are valued based on market quotations or on data furnished by an independent pricing service. Investments in securities traded on a national securities exchange (or reported on the NASDAQ National Market) are stated at the last reported sales price or a market’s official close price on the day of valuation; other securities traded in the over-the-counter market and listed securities for which no sale was reported on that date are stated at the last close price, or the average of bid and ask price for NASDAQ National Market securities. Short-term (less than 60 days maturity) notes are stated at amortized cost, which is equivalent to value. Restricted securities, securities for which market quotations are not readily available, and securities with market quotations that Aegis Financial Corporation (the “Advisor”) does not believe are reflective of market value are valued at fair value as determined by the Advisor under the supervision of the Board of Trustees (the “Board”). In determining fair value, the Board procedures consider all relevant qualitative and quantitative factors available. These factors are subject to change over time and are reviewed periodically. The values assigned to fair value investments are based on available information and do not necessarily represent amounts that might ultimately be realized, since such amounts depend on future developments inherent in long-term investments. Further, because of the inherent
Notes to Financial Statements
December 31, 2016
2. Summary of Significant Accounting Policies – (continued)
uncertainty of valuation, those estimated values may differ significantly from the values that would have been used had a ready market for the investments existed, and the differences could be material. Where a security is traded in more than one market, which may include foreign markets, the securities are generally valued on the market considered by the Advisor to be the primary market. The Fund will value its foreign securities in U.S. dollars on the basis of the then-prevailing currency exchange rates.
In accordance with accounting principles generally accepted in the United States of America (“GAAP”), fair value is defined as the price that the Fund would receive to sell an investment or pay to transfer a liability in an orderly transaction with an independent buyer in the principal market, or in the absence of a principal market, the most advantageous market for the investment or liability. GAAP establishes a three-tier hierarchy to distinguish between (1) inputs that reflect the assumptions market participants would use in pricing an asset or liability developed based on market data obtained from sources independent of the reporting entity (observable inputs) and (2) inputs that reflect the reporting entity’s own assumptions about the assumptions market participants would use in pricing an asset or liability developed based on the best information available in the circumstances (unobservable inputs) and to establish classification of fair value measurements for disclosure purposes. Various inputs are used in determining the value of the Fund’s investments. The inputs are summarized in the three broad levels listed below:
| • | Level 1 – quoted prices in active markets for identical securities. An active market for the security is a market in which transactions occur with sufficient frequency and volume to provide pricing information on an ongoing basis. A quoted price in an active market provides the most reliable evidence of fair value. |
| | | |
| • | Level 2 – other significant observable inputs (including quoted prices for similar securities, interest rates, prepayment speeds, credit risk, etc.), quoted prices for identical or similar assets in markets that are not active, and inputs that are derived principally from or corroborated by observable market data. An adjustment to any observable input that is significant to the fair value may render the measurement a Level 3 measurement. |
| | | |
| • | Level 3 – significant unobservable inputs, including the Fund’s own assumptions in determining the fair value of investments. |
Common stocks, preferred stocks and warrants. Securities traded or dealt in one or more domestic securities exchanges, excluding the National Association of Securities Dealers’ Automated Quotation System (“NASDAQ”), and not subject to restrictions against resale shall be valued on the business day as of which such value is being determined at the close of the exchange representing the principal market for such
Notes to Financial Statements
December 31, 2016
2. Summary of Significant Accounting Policies – (continued)
securities at the last quoted sales price or in the absence of a sale, at the mean of the last bid and asked prices. Securities traded or dealt in the NASDAQ and not subject to restrictions against resale shall be valued in accordance with the NASDAQ Official Closing Price. Securities traded on the NASDAQ Stock Market for which there were no transactions on a particular day are valued at the mean of the last bid and asked prices. To the extent these securities are actively traded and valuation adjustments are not applied, they are categorized in Level 1 of the fair value hierarchy. Stocks traded on inactive markets or valued by reference to similar instruments are categorized in Level 2.
The inputs or methodology used for valuing securities are not necessarily an indication of the risk associated with investing in those securities. The following is a summary of the inputs used to value the Fund’s investments as of December 31, 2016:
| | | Level 1 | | | Level 2 | | | Level 3 | | | Total | |
| Common Stocks | | | | | | | | | | | | |
| Consumer Discretionary | | $ | 12,749,948 | | | $ | 317,036 | | | $ | — | | | $ | 13,066,984 | |
| Consumer Staples | | | 15,205,459 | | | | — | | | | — | | | | 15,205,459 | |
| Energy | | | 20,394,277 | | | | — | | | | — | | | | 20,394,277 | |
| Financials | | | 5,870,135 | | | | 30,957 | | | | — | | | | 5,901,092 | |
| Industrials | | | 8,476,772 | | | | — | | | | — | | | | 8,476,772 | |
| Information Technology | | | 4,710,307 | | | | — | | | | — | | | | 4,710,307 | |
| Materials | | | 60,522,223 | | | | 341,540 | | | | — | | | | 60,863,763 | |
| Telecommunication Services | | | 6,227,836 | | | | — | | | | — | | | | 6,227,836 | |
| Warrants | | | | | | | | | | | | | | | | |
| Materials | | | — | | | | — | | | | 262,168 | | | | 262,168 | |
| Total | | $ | 134,156,957 | | | $ | 689,533 | | | $ | 262,168 | | | $ | 135,108,658 | |
When market quotations are not readily available, any security or other asset is valued at its fair value as determined in good faith under procedures approved by the Board. If events occur that will affect the value of a Fund’s portfolio securities before the net asset value (“NAV”) has been calculated (a “significant event”), the security will generally be priced using a fair value procedure. The Board has adopted specific procedures for valuing portfolio securities and delegated the responsibility of fair value determinations to the Valuation Committee. Some of the factors that may be considered by the Valuation Committee in determining fair value are fundamental analytical data relating to the investment; the nature and duration of any restriction on disposition; trading in similar securities of the same issuer or comparable companies; information from broker-dealers; and an evaluation of the forces that influence the market in which the securities are purchased or sold.
Notes to Financial Statements
December 31, 2016
2. Summary of Significant Accounting Policies – (continued)
The following is a summary of quantitative information about significant unobservable valuation inputs for the Aegis Value Fund approved by the Valuation Committee for Level 3 Fair Value Measurements for investments held as of December 31, 2016:
| | | Fair Value | | | | | | | |
| | | as of | | Valuation | | Unobservable | | | |
| Investments | | 12/31/2016 | | Technique | | Inputs | | Range | |
| Avino Silver & Gold Mines, Ltd., | | | | | | | | | |
| Exercise Price: | | | | Fair Valuation | | | | | |
| $2.87, 02/25/2017 | | $ | 0 | | – Pricing Model | | Pricing Model | | $ | 0.00 | |
| | | | | | | | | | | | |
| Lion One Metals Ltd., | | | | | | | | | | | |
| Exercise Price: | | | | | Fair Valuation | | | | | | |
| $1.35, 03/12/2018 | | $ | 262,168 | | – Pricing Model | | Pricing Model | | $ | 0.1192 | |
The following is a reconciliation of the Fund Level 3 assets for which significant unobservable inputs were used to determine fair value for the year ended
December 31, 2016:
| | | Investments in | |
| | | Securities | |
| Fair Value Measurement Using Significant | | Period Ended | |
| Unobservable Inputs (Level 3) | | 12/31/2016 | |
| Beginning Balance as of 12/31/15 | | $ | 6,239 | |
| Unrealized gain included in earnings | | | 53,924 | |
| Purchase | | | 202,005 | |
| Ending Balance as of 12/31/2016 | | $ | 262,168 | |
| | | | | |
| The amount of total gains or losses for the period included in net | | | | |
| increase (decrease) in net assets applicable to outstanding shares | | | | |
| attributed to the change in unrealized gains or losses relating | | | | |
| to assets still held at the reporting date | | $ | 53,924 | |
During the period ended December 31, 2016, there were the following transfers between Level 1, Level 2 and Level 3 for the Aegis Value Fund.
| | Transfers | | Market Value | |
| | Level 1 into Level 2 | | $ | 347,993 | |
| | Level 2 into Level 1 | | $ | 6,480,277 | |
The transfers from Level 1 to Level 2 were due to certain securities switching from a direct quote in an active market to an evaluated price obtained from the pricing vendor. The transfers from Level 2 to Level 1 were due to certain securities switching to a direct quote in an active market from an evaluated price obtained from the pricing vendor.
The Fund recognizes transfers between levels of the hierarchy as of the end of the period in which the transfers occur.
Notes to Financial Statements
December 31, 2016
2. Summary of Significant Accounting Policies – (continued)
Foreign risk and currency translation. The Fund may invest directly in foreign securities. Financial market fluctuations in any country where the Fund has investments will likely affect the value of the securities that the Fund owns in that country. These movements will affect the Fund’s share price and investment performance. The political, economic, and social structures of some countries may be less stable and more volatile than those in the United States. The risks of foreign markets include currency fluctuations, possible nationalization or expropriation of assets, extraordinary taxation or exchange controls, political or social instability, unfavorable diplomatic developments, and certain custody and settlement risks. In addition to these risks, many foreign markets have less trading volume and less liquidity than the U.S. markets, and therefore prices in foreign markets can be highly volatile.
Foreign markets may also have less protection for investors than the U.S. markets. Foreign issuers may be subject to less government supervision. It may also be difficult to enforce legal and shareholder/bondholder rights in foreign countries. There is no assurance that the Fund will be able to anticipate these risks or counter their effects.
The accounting records of the Fund are maintained in U.S. dollars. Foreign currency amounts are translated into U.S. dollars at the current rate of exchange to determine the value of investments, assets and liabilities. Purchases and sales of securities, and income and expenses are translated at the prevailing rate of exchange on the respective date of these transactions. The Fund does not isolate that portion of the results of operations resulting from changes in foreign exchange rates on investments from fluctuations arising from changes in market prices of securities held. These fluctuations are included with the net realized and unrealized gains or losses from investments.
Reported net realized foreign exchange gains or losses arise from sales and maturities of short-term securities, sales of foreign currencies, currency gains or losses realized between the trade and settlement dates on securities transactions and the difference between the amounts of dividends, interest and foreign withholding taxes recorded on the Fund’s books and the U.S. dollar equivalent of the amounts actually received or paid. Net unrealized foreign currency gains and losses arise from changes in the fair values of assets and liabilities, other than investments in securities at each reporting period, resulting from changes in the exchange rate. These fluctuations are included with the net realized and unrealized gains or losses from investments.
Federal income and excise taxes. The Fund’s policy is to comply with the requirements of Subchapter M of the Internal Revenue Code that are applicable to regulated investment companies and to distribute substantially all investment company taxable income and net capital gain to shareholders in a manner that results in no tax cost to the Fund. Therefore, no federal income tax provision is required.
Notes to Financial Statements
December 31, 2016
2. Summary of Significant Accounting Policies – (continued)
Distributions to shareholders. Distributions to the Fund’s shareholders, which are determined in accordance with income tax regulations, are recorded on the ex-dividend date. Distributions of net investment income, if any, are made at least annually for the Fund. Net realized gains from investment transactions, if any, will be distributed to shareholders annually.
The character of distributions made during the year from net investment income or net realized gain may differ from the characterization for federal income tax purposes due to differences in the recognition of income, expense and gain/(loss) items for financial statement and tax purposes. Where appropriate, reclassifications between net asset accounts are made for such differences that are permanent in nature.
Use of estimates. The preparation of financial statements in conformity with GAAP requires management to make estimates and assumptions that affect the reported amounts of assets and liabilities and disclosure of contingent assets and liabilities at the date of the financial statements and the reported amounts of revenues and expenses during the reporting period. Actual results could differ from those estimates.
Security Transactions, Income and Expenses. The Fund records security transactions based on the trade date. Interest income is recognized on the accrual basis and includes accretion of discounts and amortization of premiums. The specific identification method is used to determine book and tax cost basis when calculating realized gains and losses. Dividend income is recognized on the ex-dividend date, and interest income is recognized on the accrual basis and includes accretion of discounts and amortization of premiums. Withholding taxes on foreign dividends have been provided for in accordance with the Fund’s understanding of the applicable country’s tax rules and rates.
The Fund’s class-specific expense is charged to the operations of that class of shares. Income and expenses (other than expenses attributable to a specific class) and realized and unrealized gains and losses on investments are allocated to each class of shares based on the class respective net assets to the total net assets of the Fund.
Indemnifications. In the normal course of business, the Fund enters into contracts that contain a variety of representations, which provide general indemnifications. The Fund’s maximum exposure under these arrangements is unknown as this would involve future claims that may be made against the Fund that have not yet occurred. However, based on experience, the Fund expects the risk of loss to be remote.
Significant Concentrations. The Fund maintains a demand deposit in excess of Federal Deposit Insurance Company (”FDIC”) Insurance limits. As a result, the Fund is exposed to credit risk in the event of insolvency or other failure of the institution to meet its obligations. The Fund manages this risk by dealing with a major financial institution and monitoring its credit worthiness.
Notes to Financial Statements
December 31, 2016
3. Advisory Fees and Other Transactions with Affiliates
The Fund entered into an investment management and advisory services agreement (the “Agreement”) with the Advisor that provides for fees to be computed at an annual rate of 1.20% of the Fund’s average daily net assets. The Agreement shall remain in force through December 31, 2017 and may be renewed for additional one-year periods thereafter if approved annually by a majority of the independent members of the Board. The Agreement may be terminated at any time, without penalty, by the Fund on sixty (60) days’ written notice or by the Advisor on ninety (90) days’ written notice. The Fund and the Advisor have also entered into an expense limitation agreement which shall remain in force through April 30, 2017, that provides for an advisory fee waiver and expense reimbursement from the Advisor if the Fund’s expenses, exclusive of taxes, interest, fees incurred in acquiring or disposing of portfolio securities, and extraordinary expenses, exceed 1.75% for Class A and 1.50% for Class I, of the Fund’s average daily net assets. During the year ended December 31, 2016, the Advisor waived fees in the amount of $6,001 for the Fund.
The Fund has agreed to repay the Advisor for amounts waived or reimbursed by the Advisor pursuant to the expense limitation agreement provided that such repayment does not cause the Fund’s expenses, exclusive of taxes, interest, fees incurred in acquiring or disposing of portfolio securities and extraordinary expenses, to exceed 1.75% for Class A and 1.50% for Class I and the repayment is made within three years from the month in which the Advisor incurred the expense. As of December 31, 2016, there was $81,381 of fees available to be recovered no later than December 31, 2019, of which, $67,363 and $14,018 are recoverable no later than December 31, 2018 and 2019, respectively for the Fund.
Certain officers and Trustees of the Fund are also officers of the Advisor. The Fund pays each Trustee not an officer of the Advisor fees in cash or Fund shares of $1,000 for each attended board meeting for the Fund, $500 for each attended audit committee meeting for the Fund and $250 for each attended nominating committee meeting for the Fund. In addition, the Fund reimburses the Advisor for chief compliance officer services, a yearly amount of $20,000 paid on a quarterly basis.
4. Distribution and Service Plan
The Fund has adopted a distribution and service plan (the “Plan”) pursuant to Rule 12b-1 under the 1940 Act for its Class A Shares. Rule 12b-1 provides that an investment company that bears any direct or indirect expense of distributing its shares must do so only in accordance with the Plan permitted by Rule 12b-1. Pursuant to the Plan, the Fund makes payments to Quasar Distributors, LLC, the Fund’s distributor (the “Distributor”), the Advisor, financial intermediaries or others to reimburse such parties for distribution and/or shareholder servicing activity in an
Notes to Financial Statements
December 31, 2016
4. Distribution and Service Plan – (continued)
amount not to exceed 0.25% of its Class A shares average daily net assets on an annual basis. The distribution fees are “asset based” sales charges and, therefore, long-term shareholders may pay more in total sales charges than the economic equivalent of the maximum front-end sales charge permitted by the Financial Industry Regulatory Authority (FINRA). The Class A shares incurred $4,948 in expenses pursuant to the 12b-1 Plan for the year ended December 31, 2016.
5. Investment Transactions
Purchases and sales of long-term investment securities (excluding short-term investments) for the Fund are presented below for the year ended December 31, 2016. There were no purchases or sales of U.S. Government securities during the period.
| | Purchases | Sales |
| Aegis Value Fund | $43,619,952 | $70,778,562 |
6. Distributions to Shareholders and Tax Components of Net Assets
As of December 31, 2016, the components of accumulated earnings (losses) for income tax purposes were as follows:
| | | Aegis | |
| | | Value Fund | |
| Tax cost of Investments | | $ | 143,646,075 | |
| Unrealized appreciation | | | 29,132,635 | |
| Unrealized depreciation | | | (37,670,052 | ) |
| Net unrealized depreciation | | | (8,537,417 | ) |
| Undistributed ordinary income | | | — | |
| Undistributed long term gain | | | — | |
| Distributable earnings | | | — | |
| Other accumulated loss | | | (10,341,767 | ) |
| Total accumulated loss | | $ | (18,879,184 | ) |
The difference between cost amounts for financial statement and federal income tax purposes is due primarily to timing differences in recognizing certain gains and losses in security transactions.
The differences between book-basis and tax-basis unrealized appreciations are attributable primarily to the tax deferral of losses on wash sales and PFIC mark to market adjustments.
Other accumulated gain/(loss) is generally comprised of capital loss carryforwards, qualified late-year loss deferrals and/or unrealized gain/(loss) on derivative positions.
Notes to Financial Statements
December 31, 2016
6. Distributions to Shareholders and Tax Components of Net Assets – (continued)
As of December 31, 2016, the Aegis Value Fund had the following capital loss carryover and expirations. To the extent that each Fund realizes future net capital gains, those gains will be offset by any unused capital loss carryforwards in the character noted below.
| | Long Term Amount | Short Term Amount | Expiration |
| Aegis Value Fund | 2,972,391 | 7,004,317 | Indefinite |
At December 31, 2016, the Aegis Value Fund deferred, on a tax basis, qualified late year losses, consisting of ordinary late year losses and post-October capital losses, as follows:
| | Late Year | Post October | |
| | Loss | Capital Loss | |
| Aegis Value Fund | 365,059 | — | |
On the statement of assets and liabilities, as a result of permanent book to tax differences, certain amounts have been reclassified for the year ended December 31, 2016. The reclassifications were primarily a result of the differing book/tax treatment of distributions from real estate investment trusts and income from passive foreign investment companies and had no impact on the net assets of the Fund.
| | | Aegis Value | |
| | | Fund | |
| Accumulated Net Investment Loss | | $ | 489,955 | |
| Accumulated Net Realized Loss | | $ | (490,003 | ) |
| Paid In Capital | | $ | 48 | |
The tax components of dividends paid during the year ended December 31, 2016 and the year ended December 31, 2015 were as follows:
| | | Year Ended | | | Year Ended | | |
| | | December 31, 2016 | | | December 31, 2015 | | |
| | | Ordinary | | | Capital | | | Ordinary | | | Capital | | |
| | | Income | | | Gains | | | Income | | | Gains | | |
| Aegis Value Fund | | $ | 2,044,864 | | | $ | — | | | $ | 43,610 | | | $ | — | | |
GAAP requires an evaluation of tax positions taken (or expected to be taken) in the course of preparing the Fund’s tax returns to determine whether these positions meet a “more-likely-than-not” standard that, based on technical merits, have a more than fifty percent likelihood of being sustained by a taxing authority upon examination. A tax position that meets the “more-likely-than-not” recognition threshold is measured to determine the amount of benefit to recognize in the financial statements. The Fund recognizes interest and penalties, if any, related to unrecognized tax benefits as an interest expense in the Statement of Operations.
Notes to Financial Statements
December 31, 2016
6. Distributions to Shareholders and Tax Components of Net Assets – (continued)
GAAP requires management of the Fund to analyze all open tax years, as defined by IRS statute of limitations for all major jurisdictions, including federal tax authorities and certain state tax authorities. Open tax years include the tax years ended December 31, 2013 through December 31, 2016. As of and during the year ended December 31, 2016, the Fund did not have a liability for any unrecognized tax benefits. The Fund files U.S. Federal income and excise tax returns, as required. The Fund’s Federal income tax returns are subject to examination by the IRS for a period of three fiscal years after they are filed. The Fund has no examination in progress and are not aware of any tax positions for which it is reasonably possible that the total amounts of unrecognized tax benefits will significantly change in the next twelve months.
7. Investments in Affiliated Companies*
Investments representing 5% or more of the outstanding voting securities of a portfolio company result in that company being considered an affiliated company, as defined in the 1940 Act. The aggregate value of all securities of affiliated companies held in the Aegis Value Fund as of December 31, 2016 amounted to $36,147,742, representing 25.20% of net assets. A summary of affiliated transactions for the period ended December 31, 2016 is as follows:
Aegis Value Fund
| | | Alaska | | | | | | | | | | | | | |
| | | Communi- | | | Alliance One | | | Amerigo | | | Conifer | | | Delta | |
| | | cations Systems | | | International | | | Resources | | | Holdings, | | | Apparel | |
| | | Group, Inc.** | | | Inc. | | | Ltd. | | | Inc.** | | | Inc*** | |
| December 31, 2015 | | | | | | | | | | | | | | | |
| Balance | | | | | | | | | | | | | | | |
Shares | | | 2,220,703 | | | | 803,250 | | | | 8,906,800 | | | | — | | | | 496,073 | |
| Cost | | $ | 4,685,455 | | | $ | 19,429,090 | | | $ | 6,309,422 | | | $ | — | | | $ | 3,753,783 | |
| Market Value | | $ | 3,886,230 | | | $ | 9,213,282 | | | $ | 1,196,183 | | | $ | — | | | $ | 6,964,865 | |
| Gross Additions | | | | | | | | | | | | | | | | | | | | |
| Shares | | | 1,576,758 | | | | 1 | | | | 709,025 | | | | 434,298 | | | | 97,305 | |
| Cost | | $ | 2,680,145 | | | $ | — | | | $ | 175,598 | | | $ | 2,781,174 | | | $ | 1,539,599 | |
| Gross Deductions | | | | | | | | | | | | | | | | | | | | |
| Shares | | | — | | | | 11,300 | | | | — | | | | — | | | | 266,547 | |
| Cost | | $ | — | | | $ | 388,818 | | | $ | — | | | $ | — | | | $ | 1,401,955 | |
| Proceeds | | $ | — | | | $ | 120,182 | | | $ | — | | | $ | — | | | $ | 5,154,700 | |
| December 31, 2016 | | | | | | | | | | | | | | | | | | | | |
| Balance | | | | | | | | | | | | | | | | | | | | |
| Shares | | | 3,797,461 | | | | 791,951 | | | | 9,615,825 | | | | 434,298 | | | | | |
| Cost | | $ | 7,365,600 | | | $ | 19,040,272 | | | $ | 6,485,020 | | | $ | 2,781,174 | | | $ | — | |
| Market Value | | $ | 6,227,836 | | | $ | 15,205,459 | | | $ | 2,414,534 | | | $ | 3,539,529 | | | $ | — | |
| Realized gain (loss) | | $ | — | | | $ | (268,636 | ) | | $ | — | | | $ | — | | | $ | 3,752,745 | |
| Investment income | | $ | — | | | $ | — | | | $ | — | | | $ | — | | | $ | — | |
Notes to Financial Statements
December 31, 2016
7. Investments in Affiliated Companies* – (continued)
| | | | | | | | | Public Service | | | | |
| | | | | | Mitcham | | | Properties | | | | |
| | | | | | Industries | | | Investments | | | | |
| | | Geodrill Ltd. | | | Inc. | | | Ltd.*** | | | Total | |
| December 31, 2015 | | | | | | | | | | | | |
| Balance | | | | | | | | | | | | |
| Shares | | | 2,715,251 | | | | 837,067 | | | | 1,527,056 | | | | — | |
| Cost | | $ | 1,346,961 | | | $ | 5,605,663 | | | $ | 736,136 | | | $ | 41,866,510 | |
| Market Value | | $ | 1,206,822 | | | $ | 2,519,572 | | | $ | 1,091,832 | | | $ | 26,078,786 | |
| Gross Additions | | | | | | | | | | | | | | | | |
| Shares | | | 183,006 | | | | 9,912 | | | | — | | | | — | |
| Cost | | $ | 180,371 | | | $ | 29,434 | | | $ | — | | | $ | 7,386,321 | |
| Gross Deductions | | | | | | | | | | | | | | | | |
| Shares | | | — | | | | — | | | | 968,860 | | | | — | |
| Cost | | $ | — | | | $ | — | | | $ | 467,051 | | | $ | 2,257,824 | |
| Proceeds | | $ | — | | | $ | — | | | $ | 661,779 | | | $ | 5,936,661 | |
| December 31, 2016 | | | | | | | | | | | | | | | | |
| Balance | | | | | | | | | | | | | | | | |
| Shares | | | 2,898,257 | | | | 846,979 | | | | — | | | | — | |
| Cost | | $ | 1,527,332 | | | $ | 5,635,097 | | | $ | — | | | $ | 42,834,495 | |
| Market Value | | $ | 5,245,421 | | | $ | 3,514,963 | | | $ | — | | | $ | 36,147,742 | |
| Realized gain (loss) | | $ | — | | | $ | — | | | $ | 194,728 | | | $ | 3,678,837 | |
| Investment income | | $ | — | | | $ | — | | | $ | — | | | $ | — | |
__________
| * | As a result of the Aegis Value Fund’s beneficial ownership of common stock of these companies, regulators require that the Fund state that it may be deemed an affiliate of the respective issuer. The Fund disclaims that the “affiliated persons” are affiliates of the Distributors, Advisor, Funds or any other client of the Advisor. |
| ** | These securities were not affiliated as of 12/31/2015. |
| *** | These securities were no longer affiliated as of 12/31/2016. |
| Note: | Schedule may not roll forward, as the schedule only reflects activity during the time the Fund was deemed an affiliate (held more than 5% of an issuer’s outstanding securities). |
8. New Accounting Pronouncement
In October 2016, the U.S. Securities and Exchange Commission adopted new rules and amended existing rules (together, “final rules”) intended to modernize the reporting and disclosure of information by registered investment companies. In part, the final rules amend Regulation S-X and require standardized, enhanced disclosure about derivatives in investment company financial statements, as well as other amendments. The compliance date for the amendments to Regulation S-X is August 1, 2017. Management is currently evaluating the impact that the adoption of the amendments to Regulation S-X will have on the financial statements and related disclosures.
9. Subsequent Events
In connection with the preparation of the financial statements of the Fund as of and for the year ended December 31, 2016, events and transactions subsequent to December 31, 2016 have been evaluated by management for possible adjustment and/or disclosure. Management has determined that there were no material events that would require disclosure in the Fund’s financial statements.
REPORT OF INDEPENDENT REGISTERED PUBLIC ACCOUNTING FIRM
To the Board of Trustees of The Aegis Funds
and the Shareholders of Aegis Value Fund
We have audited the accompanying statement of assets and liabilities of Aegis Value Fund, a series of shares of beneficial interest in The Aegis Funds (the “Fund”), including the schedule of portfolio investments, as of December 31, 2016, and the related statement of operations for the year then ended, the statements of changes in net assets for each of the years in the two-year period then ended and the financial highlights for each of the years or periods in the five-year period then ended. These financial statements and financial highlights are the responsibility of the Fund’s management. Our responsibility is to express an opinion on these financial statements and financial highlights based on our audits.
We conducted our audits in accordance with the standards of the Public Company Accounting Oversight Board (United States). Those standards require that we plan and perform the audits to obtain reasonable assurance about whether the financial statements and financial highlights are free of material misstatement. An audit includes examining, on a test basis, evidence supporting the amounts and disclosures in the financial statements. Our procedures included confirmation of securities owned as of December 31, 2016 by correspondence with the custodian and brokers, or by other appropriate auditing procedures where replies from brokers were not received. An audit also includes assessing the accounting principles used and significant estimates made by management, as well as evaluating the overall financial statement presentation. We believe that our audits provide a reasonable basis for our opinion.
In our opinion, the financial statements and financial highlights referred to above present fairly, in all material respects, the financial position of Aegis Value Fund as of December 31, 2016, and the results of its operations for the year then ended, the changes in its net assets for each of the years in the two-year period then ended and its financial highlights for each of the years or periods in the five-year period then ended, in conformity with accounting principles generally accepted in the United States of America.
| |  |
| | |
| | BBD, LLP |
Philadelphia, Pennsylvania
February 22, 2017
Trustees and Officers
(Unaudited)
| | | Term of | | Number of | Other |
| | | Office | | Portfolios | Directorships |
| | | and | Principal | in Fund | Held by |
| | Position(s) | Length | Occupation | Complex | Trustee |
| Name, Year of | Held with | of Time | During Past | Overseen by | During the |
Birth, and Address | the Fund | Served | 5 Years | Trustee | Past 5 Years |
| | | | | | |
| Independent Trustees* |
| | | | | | |
| Eskander Matta | Trustee | Since | Chief Executive | 1 | Director of |
| Born: 1970 | | 2003 | Officer of Tasharina | | Aegis Value |
| c/o Aegis Financial | | | Corporation since | | Fund, Inc. |
| Corporation | | | 2012; since 2012; | | (1997 – 2014). |
| 6862 Elm Street, | | | Vice President of | | |
| Suite 830 | | | ebusiness, Blue Shield | | |
| McLean, VA 22101 | | | of California | | |
| | | | (2008 – 2012). | | |
| | | | | | |
| V. Scott Soler | Trustee | Since | Co-owner at | 1 | Merchant |
| Born: 1969 | | 2007 | Limestone Value | | Energy c/o |
| Aegis Financial | | | Partners, LLC | | Holdings |
| Corporation | | | (SEC-registered | | (2007 – 2012); |
| 6862 Elm Street, | | | investment adviser) | | Director of |
| Suite 830 | | | since 2011. | | Aegis Value |
| McLean, VA 22101 | | | | | Fund, Inc. |
| | | | | | (2007 – 2014). |
| | | | | | |
| Andrew R. Bacas** | Trustee | Since | President, Jefferson | 1 | Director of |
| Born: 1958 | | August | Management | | The Bacas |
| c/o Aegis Financial | | 2016 | Consultants, Inc. | | Family |
| Corporation | | | (a commercial real | | Foundation |
| 6862 Elm Street, | | | estate investment | | (2003 – 2015). |
| Suite 830 | | | and advisory firm) | | |
| McLean, VA 22101 | | | since 2006. | | |
Trustees and Officers
(Unaudited)
| | | Term of | | Number of | Other |
| | | Office | | Portfolios | Directorships |
| | | and | Principal | in Fund | Held by |
| | Position(s) | Length | Occupation | Complex | Trustee |
| Name, Year of | Held with | of Time | During Past | Overseen by | During the |
Birth, and Address | the Fund | Served | 5 Years | Trustee | Past 5 Years |
| | | | | | |
| Interested Trustee*** |
| | | | | | |
| Scott L. Barbee | President | Since | President of Aegis | 1 | Director of |
| Born: 1971 | | 2009 | Financial Corporation | | Aegis Value |
| c/o Aegis Financial | Trustee | Since | since 2009; President | | Fund, Inc. |
| Corporation | | 2003 | of Aegis Value Fund, | | (1997 – 2014); |
| 6862 Elm Street, | Treasurer | 2003 – | Inc. since 2009. | | Director of |
| Suite 830 | | 2008 | | | Donald Smith |
| McLean, VA 22101 | Secretary | 2006 – | | | & Co. (SEC- |
| | | 2008 | | | registered |
| | | | | | investment |
| | | | | | adviser) since |
| | | | | | 2014; Director |
| | | | | | of The Barbee |
| | | | | | Family |
| | | | | | Foundation |
| | | | | | since 2012; |
| | | | | | Director of |
| | | | | | The Donald & |
| | | | | | Paula Smith |
| | | | | | Family |
| | | | | | Foundation |
| | | | | | since 2014. |
| | | | | | |
| David A. Giannini | Trustee | Since | Institutional equity | 1 | Director of |
| Born: 1953 | | 2006 | sales and research | | Aegis Value |
| c/o Aegis Financial | | | with Scarsdale | | Fund, Inc. |
| Corporation | | | Equities since 2006. | | (2006 – 2014); |
| 6862 Elm Street, | | | | | Director of |
| Suite 830 | | | | | Select Sands |
| McLean, VA 22101 | | | | | Corp. since |
| | | | | | November |
| | | | | | 2016. |
| | | | | | |
Trustees and Officers
(Unaudited)
| | | Term of | | Number of | Other |
| | | Office | | Portfolios | Directorships |
| | | and | Principal | in Fund | Held by |
| | Position(s) | Length | Occupation | Complex | Trustee |
| Name, Year of | Held with | of Time | During Past | Overseen by | During the |
Birth, and Address | the Fund | Served | 5 Years | Trustee | Past 5 Years |
| |
| Officer of the Fund who is not also a Trustee |
| | | | | | |
| Sarah Q. Zhang | Chief | Since | Chief Compliance | N/A | N/A |
| Born: 1970 | Compli- | 2008 | Officer of Aegis | | |
| c/o Aegis Financial | ance | | Financial Corporation | | |
| Corporation | Officer | | and Aegis Value Fund, | | |
| 6862 Elm Street, | Treasurer | Since | Inc. since 2008; | | |
| Suite 830 | and | 2009 | Treasurer and Secretary | | |
| McLean, VA 22101 | Secretary | | of Aegis Financial | | |
| | | | Corporation and Aegis | | |
| | | | Value Fund, Inc. | | |
| | | | since 2009. | | |
__________
| * | The “Independent Trustees” are those Trustees that are not considered “interested persons” of the Trust, as that term is defined in the 1940 Act. |
| ** | Mr. Bacas’ son was a summer intern with the Advisor from May 17, 2016 to August 12, 2016. |
| *** | Mr. Barbee is considered to be an “Interested Trustee” because of his affiliation with the Advisor. Mr. Giannini is considered to be an “Interested Trustee” due to his employer’s business relationship with the Advisor. |
The Fund’s Statement of Additional Information includes additional information about Fund Trustees and is available, without charge, by calling the Fund’s toll-fee phone number, (800) 528-3780.
Other Information
(Unaudited)
Proxy Voting
A description of the policies and procedures that the Fund uses to determine how to vote proxies relating to portfolio securities is available by request, without charge, by calling the Fund’s toll-free telephone number, 800-528-3780. Information regarding how the Fund voted proxies, if any, relating to portfolio securities during the most recent 12-month period ended June 30 is available upon request, without charge, by calling 800-528-3780. The Fund’s proxy voting policies and procedures and voting record are also available on the U.S. Securities and Exchange Commission (“SEC”) website at http://www.sec.gov.
Code of Ethics
The Fund have adopted a code of ethics applicable to its principal executive officer and principal financial officer. A copy of this code is available, without charge, by calling the Fund’s toll-free phone number, 800-528-3780.
Fund Holdings
The complete schedules of the Fund’s holdings for the second and fourth quarters of each fiscal year are contained in the Fund’s semi-annual and annual shareholder reports, respectively. The Fund files complete schedules of the Fund’s holdings with the SEC for the first and third quarters of each fiscal year on Form N-Q within 60 days after the end of the period. Copies of the Fund’s Form N-Q are available without charge, upon request, by contacting the Fund at 800-528-3780 and on the SEC’s website at http://www.sec.gov. You may also review and copy Form N-Q at the SEC’s Public Reference Room in Washington, DC. For more information about the operation of the Public Reference Room, please call the SEC at 1-800-SEC-0330.
Tax Designation
For the fiscal year ended December 31, 2016, certain dividends paid by the Fund may be subject to a maximum tax rate of 15%, as provided for by the Jobs and Growth Tax Relief Reconciliation Act of 2003. The percentage of dividends declared from ordinary income designated as qualified dividend income was as follows:
For corporate shareholders, the percent of ordinary income distributions qualifying for the corporate dividends received deduction for the fiscal year ended December 31, 2016 was as follows:
Other Information
(Unaudited)
Foreign Shareholders
The percentage of ordinary income distributions that are designated as interest-related dividends under Internal Revenue Code Section 871(k)(1)(C) for the year ended December 31, 2016 was as follows:
The percentage of taxable ordinary income distributions that are designated as short-term capital gain distributions under Internal Revenue Section 871(k)(2)(C) for the year ended December 31, 2016 was as follows:
The Aegis Funds Privacy Notice
(This information is not part of the Report)
| FACTS | WHAT DOES AEGIS FUNDS DO WITH YOUR PERSONAL INFORMATION? |
| | |
| WHY? | Financial companies choose how they share your personal information. Federal law gives consumers the right to limit some but not all sharing. Federal law also requires us to tell you how we collect, share, and protect your personal information. Please read this notice carefully to understand what we do. |
| | |
| WHAT? | The types of personal information we collect and share depend on the product or service you have with us. This information can include: |
| | • Social Security number and other information including address and date of birth |
| | • Asset and income |
| | • Account balances and account transactions |
| | When you are no longer our customer, we continue to share your information as described in this notice. |
| | |
| HOW? | All financial companies need to share customers’ personal information to run their everyday business. In the section below, we list the reasons financial companies can share their customers’ personal information; the reasons The Aegis Funds chooses to share; and whether you can limit this sharing. |
| Reasons we can share your personal information. | Does The Aegis | Can you limit |
| | Funds share? | this sharing? |
| For our everyday business purposes— | | |
| such as to process your transactions, maintain | | |
| your account(s), respond to court orders and | Yes | No |
| legal investigations, or report to credit bureaus | | |
| For our marketing purposes— | | |
| to offer our products and services to you | Yes | No |
| For joint marketing with other financial | | |
| companies | No | We don’t share |
| For our affiliates’ everyday business purposes— | | |
| information about your transactions and experiences | Yes | No |
| For our affiliates’ everyday business purposes— | | |
| information about your creditworthiness | No | We don’t share |
| For nonaffiliates to market to you | No | We don’t share |
| Questions? | Call 800-528-3780 or go to www.aegisfunds.com |
The Aegis Funds Privacy Notice
(This information is not part of the Report)
| Who we are |
| Who is providing | The Aegis Funds |
| this Notice? | |
| What we do |
| How does | To protect your personal information from unauthorized access and |
| The Aegis | use, we use security measures that comply with federal law. These |
| Funds protect | measures include computer safeguards and secured files and buildings. |
| my personal | |
| information? | |
| How does The | We collect your personal information, for example, when you |
| Aegis Funds | • open an account or perform transactions |
| collect your | • make a transfer or tell us where to send money |
| personal | • tell us about your personal financial information |
| information? | |
| Why can’t I | Federal law gives you the right to limit only |
| limit all sharing? | • sharing for affiliates’ everyday business purposes—information about your creditworthiness |
| | • affiliates from using your information to market to you |
| | • sharing for nonaffiliates to market to you |
| | State laws and individual companies may give you additional rights to limit sharing. |
| | |
| Definitions |
| Affiliates | Companies related by common ownership or control. They can be financial and nonfinancial companies. |
| | |
| | • Our affiliates include Aegis Financial Corporation. |
| | |
| Nonaffiliates | Companies not related by common ownership or control. They can be financial and nonfinancial companies. |
| | |
| | • The Aegis Funds does not share with nonaffiliates so they can market to you. |
| | |
| Joint marketing | A formal agreement between nonaffiliated financial companies that together market financial products or services to you. |
| | |
| | • See Other important information. |
| Other important information |
| Non-affiliates with whom we may share information (except to permit them to market to you) can include financial companies, such as custodians, transfer agents, registered representatives and financial advisors, and nonfinancial companies, such as fulfillment, proxy voting and class action service providers. |
(This Page Intentionally Left Blank.)
| |
| |
| |
| |
| |
| |
| |
| | |
| | |
| The Aegis Funds | Custodian |
| c/o U.S. Bancorp Fund Services, LLC | U.S. Bank, N.A. |
| 615 East Michigan Street | Custody Operations |
| Milwaukee, Wisconsin 53202 | 1555 North RiverCenter Drive, Suite 302 |
| Phone: (800) 528-3780 | Milwaukee, Wisconsin 53212 |
| www.aegisfunds.com | |
| | |
| | Administrator, Transfer Agent and Fund |
| Board of Trustees | Accountant |
| Scott L. Barbee | U.S. Bancorp Fund Services, LLC |
| David A. Giannini | 615 East Michigan Street |
| Eskander Matta | Milwaukee, Wisconsin 53202 |
| V. Scott Soler | |
| | |
| | Independent Registered Public Accounting |
| Officers | Firm |
| Scott L. Barbee, President | BBD, LLP |
| Sarah Q. Zhang, Treasurer/Secretary/ | 1835 Market Street, 26th Floor |
| Chief Compliance Officer | Philadelphia, Pennsylvania 19103 |
| | |
| | |
| Investment Advisor | Counsel |
| Aegis Financial Corporation | Seward & Kissel, LLP |
| 6862 Elm Street, Suite 830, | 901 K Street N.W. |
| McLean, Virgina 22101 | Washington, DC 20001 |
| | |
| | |
| | |
| | |
| | |
| | |
| | |
Item 2. Code of Ethics.
The registrant has adopted a code of ethics that applies to the registrant’s principal executive officer and principal financial officer. The registrant has made amendments to its code of ethics during the period covered by this report. The registrant has not granted any waivers from any provisions of the code of ethics during the period covered by this report. A copy of the Registrant’s Code of Ethics is filed March 4, 2016.
Item 3. Audit Committee Financial Expert.
The registrant’s board of trustees has determined that it does not have an audit committee financial expert serving on its audit committee. At this time, the registrant believes that the experience provided by each member of the audit committee together offers the registrant adequate oversight for the registrant’s level of financial complexity.
Item 4. Principal Accountant Fees and Services.
The registrant has engaged its principal accountant to perform audit services, audit-related services, tax services and other services during the past two fiscal years. “Audit services” refer to performing an audit of the registrant's annual financial statements or services that are normally provided by the accountant in connection with statutory and regulatory filings or engagements for those fiscal years. “Audit-related services” refer to the assurance and related services by the principal accountant that are reasonably related to the performance of the audit. “Tax services” refer to professional services rendered by the principal accountant for tax compliance, tax advice, and tax planning. There were no “Other services” provided by the principal accountant. The following table details the aggregate fees billed or expected to be billed for each of the last two fiscal years for audit fees, audit-related fees, tax fees and other fees by the principal accountant.
| | FYE 12/31/2016 | FYE 12/31/2015 |
| Audit Fees | $20,000 | $20,000 |
| Audit-Related Fees | $0 | $0 |
| Tax Fees | $3,500 | $3,500 |
| All Other Fees | $0 | $0 |
The audit committee has adopted pre-approval policies and procedures that require the audit committee to pre‑approve all audit and non‑audit services of the registrant, including services provided to any entity affiliated with the registrant.
The percentage of fees billed by BBD, LLP applicable to non-audit services pursuant to waiver of pre-approval requirement were as follows:
| | FYE 12/31/2016 | FYE 12/31/2015 |
| Audit-Related Fees | 0% | 0% |
| Tax Fees | 0% | 0% |
| All Other Fees | 0% | 0% |
All of the principal accountant’s hours spent on auditing the registrant’s financial statements were attributed to work performed by full‑time permanent employees of the principal accountant.
The following table indicates the non-audit fees billed or expected to be billed by the registrant’s accountant for services to the registrant and to the registrant’s investment adviser (and any other controlling entity, etc.—not sub-adviser) for the last two years. The audit committee of the board of trustees has considered whether the provision of non-audit services that were rendered to the registrant's investment adviser is compatible with maintaining the principal accountant's independence and has concluded that the provision of such non-audit services by the accountant has not compromised the accountant’s independence.
| Non-Audit Related Fees | FYE 12/31/2016 | FYE 12/31/2015 |
| Registrant | $3,500 | $3,500 |
| Registrant’s Investment Adviser | $0 | $0 |
Item 5. Audit Committee of Listed Registrants.
Not applicable to registrants who are not listed issuers (as defined in Rule 10A-3 under the Securities Exchange Act of 1934).
Item 6. Investments.
Schedule of Investments is included as part of the report to shareholders filed under Item 1 of this Form.
Item 7. Disclosure of Proxy Voting Policies and Procedures for Closed-End Management Investment Companies.
Not applicable to open-end investment companies.
Item 8. Portfolio Managers of Closed-End Management Investment Companies.
Not applicable to open-end investment companies.
Item 9. Purchases of Equity Securities by Closed‑End Management Investment Company and Affiliated Purchasers.
Not applicable to open-end investment companies.
Item 10. Submission of Matters to a Vote of Security Holders.
Not Applicable.
Item 11. Controls and Procedures.
| (a) | The Registrant’s President/Chief Executive Officer and Treasurer/Chief Financial Officer have reviewed the Registrant's disclosure controls and procedures (as defined in Rule 30a-3(c) under the Investment Company Act of 1940 (the “Act”)) as of a date within 90 days of the filing of this report, as required by Rule 30a-3(b) under the Act and Rules 13a-15(b) or 15d‑15(b) under the Securities Exchange Act of 1934. Based on their review, such officers have concluded that the disclosure controls and procedures are effective in ensuring that information required to be disclosed in this report is appropriately recorded, processed, summarized and reported and made known to them by others within the Registrant and by the Registrant’s service provider. |
| (b) | There were no changes in the Registrant's internal control over financial reporting (as defined in Rule 30a-3(d) under the Act) that occurred during the second fiscal quarter of the period covered by this report that has materially affected, or is reasonably likely to materially affect, the Registrant's internal control over financial reporting. |
Item 12. Exhibits.
| (a) | (1) Code of ethics or amendment thereto, Incorporated by reference to the Registrant’s Form N-CSR filed March 4, 2016. |
(2) Certification the President/Chief Executive Officer and Treasurer/Chief Financial Officer pursuant to Section 302 of the Sarbanes-Oxley Act of 2002. Filed herewith.
(3) Any written solicitation to purchase securities under Rule 23c‑1 under the Act sent or given during the period covered by the report by or on behalf of the registrant to 10 or more persons.
Not applicable to open-end investment companies.
| (b) | Certifications pursuant to Section 906 of the Sarbanes‑Oxley Act of 2002. Furnished herewith. |
SIGNATURES
Pursuant to the requirements of the Securities Exchange Act of 1934 and the Investment Company Act of 1940, the registrant has duly caused this report to be signed on its behalf by the undersigned, thereunto duly authorized.
By /s/ Scott L. Barbee
Scott L. Barbee, President
Date March 6, 2017
Pursuant to the requirements of the Securities Exchange Act of 1934 and the Investment Company Act of 1940, this report has been signed below by the following persons on behalf of the registrant and in the capacities and on the dates indicated.
By /s/ Scott L. Barbee
Scott L. Barbee, President
Date March 6, 2017
By /s/ Sarah Q. Zhang
Sarah Q. Zhang, Treasurer
Date March 6, 2017