UNITED STATES
SECURITIES AND EXCHANGE COMMISSION
Washington, D.C. 20549
Form N-CSR
CERTIFIED SHAREHOLDER REPORT OF REGISTERED
MANAGEMENT INVESTMENT COMPANIES
Investment Company Act File Number: 811-21400
Eaton Vance Tax-Advantaged Dividend Income Fund
(Exact Name of Registrant as Specified in Charter)
Two International Place, Boston, Massachusetts 02110
(Address of Principal Executive Offices)
Maureen A. Gemma
Two International Place, Boston, Massachusetts 02110
(Name and Address of Agent for Services)
(617) 482-8260
(Registrant’s Telephone Number)
August 31
Date of Fiscal Year End
February 29, 2016
Date of Reporting Period
Item 1. Reports to Stockholders

Eaton Vance
Tax-Advantaged Dividend Income Fund (EVT)
Semiannual Report
February 29, 2016

Commodity Futures Trading Commission Registration. Effective December 31, 2012, the Commodity Futures Trading Commission (“CFTC”) adopted certain regulatory changes that subject registered investment companies and advisers to regulation by the CFTC if a fund invests more than a prescribed level of its assets in certain CFTC-regulated instruments (including futures, certain options and swap agreements) or markets itself as providing investment exposure to such instruments. The Fund has claimed an exclusion from the definition of the term “commodity pool operator” under the Commodity Exchange Act. Accordingly, neither the Fund nor the adviser with respect to the operation of the Fund is subject to CFTC regulation. Because of its management of other strategies, the Fund’s adviser is registered with the CFTC as a commodity pool operator and a commodity trading advisor.
Managed Distribution Plan. Pursuant to an exemptive order issued by the Securities and Exchange Commission (Order), the Fund is authorized to distribute long-term capital gains to shareholders more frequently than once per year. Pursuant to the Order, the Fund’s Board of Trustees approved a Managed Distribution Plan (MDP) pursuant to which the Fund makes monthly cash distributions to common shareholders, stated in terms of a fixed amount per common share.
The Fund currently distributes monthly cash distributions equal to $0.1450 per share in accordance with the MDP. You should not draw any conclusions about the Fund’s investment performance from the amount of these distributions or from the terms of the MDP. The MDP will be subject to regular periodic review by the Fund’s Board of Trustees and the Board may amend or terminate the MDP at any time without prior notice to Fund shareholders. However, at this time there are no reasonably foreseeable circumstances that might cause the termination of the MDP.
The Fund may distribute more than its net investment income and net realized capital gains and, therefore, a distribution may include a return of capital. A return of capital distribution does not necessarily reflect the Fund’s investment performance and should not be confused with “yield” or “income.” With each distribution, the Fund will issue a notice to shareholders and a press release containing information about the amount and sources of the distribution and other related information. The amounts and sources of distributions contained in the notice and press release are only estimates and are not provided for tax purposes. The amounts and sources of the Fund’s distributions for tax purposes will be reported to shareholders on Form 1099-DIV for each calendar year.
Fund shares are not insured by the FDIC and are not deposits or other obligations of, or guaranteed by, any depository institution. Shares are subject to investment risks, including possible loss of principal invested.
Semiannual Report February 29, 2016
Eaton Vance
Tax-Advantaged Dividend Income Fund
Table of Contents
| | | | |
Performance | | | 2 | |
| |
Fund Profile | | | 3 | |
| |
Endnotes and Additional Disclosures | | | 4 | |
| |
Financial Statements | | | 5 | |
| |
Officers and Trustees | | | 19 | |
| |
Important Notices | | | 20 | |
Eaton Vance
Tax-Advantaged Dividend Income Fund
February 29, 2016
Performance1,2
Portfolio Managers Edward J. Perkin, CFA, John D. Crowley, Michael A. Allison, CFA and John H. Croft, CFA
| | | | | | | | | | | | | | | | | | | | |
| % Average Annual Total Returns | | Inception Date | | | Six Months | | | One Year | | | Five Years | | | Ten Years | |
Fund at NAV | | | 09/30/2003 | | | | –2.09 | % | | | –6.31 | % | | | 8.85 | % | | | 5.43 | % |
Fund at Market Price | | | — | | | | –2.34 | | | | –6.65 | | | | 8.05 | | | | 5.44 | |
Russell 1000® Value Index | | | — | | | | –2.87 | % | | | –9.41 | % | | | 8.80 | % | | | 5.12 | % |
BofA Merrill Lynch Fixed Rate Preferred Securities Index | | | — | | | | 3.28 | | | | 4.51 | | | | 6.71 | | | | 3.08 | |
Blend of 70% Russell 1000® Value Index and | | | — | | | | –0.99 | | | | –5.32 | | | | 8.31 | | | | 4.83 | |
30% BofA Merrill Lynch Fixed Rate Preferred Securities Index | | | | | | | | | | | | | |
| | | | | |
| | | | | | | | | | | | | | | | | | | | |
| % Premium/Discount to NAV3 | | | | | | | | | | | | | | | |
| | | | | | | | | | | | | | | | | | | –9.32 | % |
| | | | | |
| | | | | | | | | | | | | | | | | | | | |
| Distributions4 | | | | | | | | | | | | | | | |
Total Distributions per share for the period | | | | | | | | | | | | | | | | | | | $0.870 | |
Distribution Rate at NAV | | | | | | | | | | | | | | | | | | | 8.77 | % |
Distribution Rate at Market Price | | | | | | | | | | | | | | | | | | | 9.67 | % |
| | | | | |
| | | | | | | | | | | | | | | | | | | | |
| % Total Leverage5 | | | | | | | | | | | | | | | |
Borrowings | | | | | | | | | | | | | | | | | | | 23.62 | % |
See Endnotes and Additional Disclosures in this report.
Past performance is no guarantee of future results. Returns are historical and are calculated by determining the percentage change in net asset value (NAV) or market price (as applicable) with all distributions reinvested and includes management fees and other expenses. Fund performance at market price will differ from its results at NAV due to factors such as changing perceptions about the Fund, market conditions, fluctuations in supply and demand for Fund shares, or changes in Fund distributions. Investment return and principal value will fluctuate so that shares, when sold, may be worth more or less than their original cost. Performance less than one year is cumulative. Performance is for the stated time period only; due to market volatility, current Fund performance may be lower or higher than the quoted return. For performance as of the most recent month-end, please refer to eatonvance.com.
Eaton Vance
Tax-Advantaged Dividend Income Fund
February 29, 2016
Fund Profile
| | |
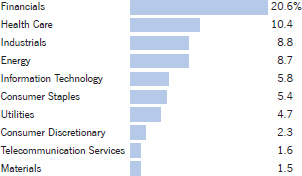
| Common Stock Sector Allocation (% of total investments) | | |
| | |
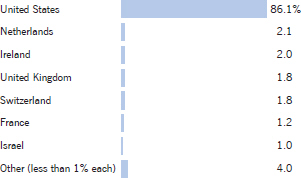
Country Allocation (% of total investments)6 | | |
| | |
| | |
Top 10 Common Stock Holdings (% of total investments) |
| | | | |
| |
General Electric Co. | | | 3.4 | % |
| |
Johnson & Johnson | | | 3.3 | |
| |
Wells Fargo & Co. | | | 2.3 | |
| |
Chevron Corp. | | | 2.2 | |
| |
JPMorgan Chase & Co. | | | 2.1 | |
| |
Occidental Petroleum Corp. | | | 2.1 | |
| |
United Technologies Corp. | | | 2.1 | |
| |
Medtronic PLC | | | 1.9 | |
| |
Sempra Energy | | | 1.8 | |
| |
Goldman Sachs Group, Inc. (The) | | | 1.7 | |
| |
Total | | | 22.9 | % |
See Endnotes and Additional Disclosures in this report.
Eaton Vance
Tax-Advantaged Dividend Income Fund
February 29, 2016
Endnotes and Additional Disclosures
| 1 | Russell 1000® Value Index is an unmanaged index of U.S. large- cap value stocks. BofA Merrill Lynch Fixed Rate Preferred Securities Index is an unmanaged index of fixed-rate, preferred securities issued in the U.S. BofA Merrill Lynch® indices not for redistribution or other uses; provided “as is”, without warranties, and with no liability. Eaton Vance has prepared this report, BofAML does not endorse it, or guarantee, review, or endorse Eaton Vance’s products. Unless otherwise stated, index returns do not reflect the effect of any applicable sales charges, commissions, expenses, taxes or leverage, as applicable. It is not possible to invest directly in an index. |
| 2 | Performance results reflect the effects of leverage. Performance since inception for an index, if presented, is the performance since the Fund’s or oldest share class’ inception, as applicable. |
| 3 | The shares of the Fund often trade at a discount or premium from their net asset value. The discount or premium of the Fund may vary over time and may be higher or lower than what is quoted in this report. For up-to-date premium/discount information, please refer to http://eatonvance.com/closedend. |
| 4 | The Distribution Rate is based on the Fund’s last regular distribution per share in the period (annualized) divided by the Fund’s NAV or market price at the end of the period. The Fund’s distributions may be comprised of amounts characterized for federal income tax purposes as qualified and non-qualified ordinary dividends, capital gains and nondividend distributions, also known as return of capital. For additional information about nondividend distributions, please refer to Eaton Vance Closed-End Fund Distribution Notices (19a) posted on our website, eatonvance.com. The Fund will determine the federal income tax character of distributions paid to a shareholder after the end of the calendar year. This is reported on the IRS form 1099-DIV and provided to the shareholder shortly after each year-end. For information about the tax character of distributions made in prior calendar years, please refer to Performance-Tax Character of Distributions on the Fund’s webpage available at eatonvance.com. The Fund’s distributions are determined by the investment adviser based on its current assessment of the Fund’s long-term return potential. As portfolio and market conditions change, the rate of distributions paid by the Fund could change. |
| 5 | Total leverage is shown as a percentage of the Fund’s aggregate net assets plus borrowings outstanding. The Fund employs leverage through borrowings. Use of leverage creates an opportunity for income, but creates risks including greater price volatility. The cost of borrowings rises and falls with changes in short-term interest rates. The Fund may be required to maintain prescribed asset coverage for its leverage and may be required to reduce its leverage at an inopportune time. |
| 6 | The Fund may obtain exposure to certain market segments through investments in exchange-traded funds (ETFs). For purposes of the chart, the Fund’s investments in ETFs are included based on the portfolio composition of each ETF. |
| | Fund profile subject to change due to active management. |
Eaton Vance
Tax-Advantaged Dividend Income Fund
February 29, 2016
Portfolio of Investments (Unaudited)
| | | | | | | | |
| Common Stocks — 91.0% | |
| | |
| | | | | | | | |
| Security | | Shares | | | Value | |
| | | | | | | | |
|
Aerospace & Defense — 2.7% | |
United Technologies Corp.(1) | | | 408,301 | | | $ | 39,450,043 | |
| | | | | | | | | |
| | | $ | 39,450,043 | |
| | | | | | | | | |
|
Air Freight & Logistics — 1.6% | |
C.H. Robinson Worldwide, Inc.(1) | | | 322,604 | | | $ | 22,527,437 | |
| | | | | | | | | |
| | | $ | 22,527,437 | |
| | | | | | | | | |
|
Auto Components — 0.5% | |
Goodyear Tire & Rubber Co. (The) | | | 222,180 | | | $ | 6,692,062 | |
| | | | | | | | | |
| | | $ | 6,692,062 | |
| | | | | | | | | |
|
Banks — 9.5% | |
JPMorgan Chase & Co.(1) | | | 715,628 | | | $ | 40,289,856 | |
KeyCorp(1) | | | 786,642 | | | | 8,299,073 | |
PNC Financial Services Group, Inc. (The)(1) | | | 213,941 | | | | 17,395,543 | |
U.S. Bancorp(1) | | | 743,992 | | | | 28,658,572 | |
Wells Fargo & Co.(1) | | | 922,643 | | | | 43,290,410 | |
| | | | | | | | | |
| | | $ | 137,933,454 | |
| | | | | | | | | |
|
Beverages — 0.8% | |
Molson Coors Brewing Co., Class B | | | 140,917 | | | $ | 12,015,993 | |
| | | | | | | | | |
| | | $ | 12,015,993 | |
| | | | | | | | | |
|
Building Products — 0.7% | |
Masco Corp. | | | 376,207 | | | $ | 10,609,037 | |
| | | | | | | | | |
| | | $ | 10,609,037 | |
| | | | | | | | | |
|
Capital Markets — 6.2% | |
Charles Schwab Corp. (The) | | | 526,846 | | | $ | 13,197,492 | |
Credit Suisse Group AG(1) | | | 815,898 | | | | 10,920,137 | |
Credit Suisse Group AG(1)(2) | | | 564,255 | | | | 7,552,098 | |
Goldman Sachs Group, Inc. (The) | | | 219,040 | | | | 32,753,051 | |
Invesco, Ltd.(1) | | | 951,332 | | | | 25,438,618 | |
| | | | | | | | | |
| | | $ | 89,861,396 | |
| | | | | | | | | |
|
Chemicals — 1.9% | |
PPG Industries, Inc.(1) | | | 287,616 | | | $ | 27,763,572 | |
| | | | | | | | | |
| | | $ | 27,763,572 | |
| | | | | | | | | |
|
Consumer Finance — 0.8% | |
Synchrony Financial(3) | | | 426,568 | | | $ | 11,496,008 | |
| | | | | | | | | |
| | | $ | 11,496,008 | |
| | | | | | | | | |
| | | | | | | | |
| Security | | Shares | | | Value | |
| | | | | | | | |
|
Diversified Telecommunication Services — 2.1% | |
Verizon Communications, Inc.(1) | | | 606,284 | | | $ | 30,756,787 | |
| | | | | | | | | |
| | | $ | 30,756,787 | |
| | | | | | | | | |
|
Electric Utilities — 2.3% | |
NextEra Energy, Inc.(1) | | | 288,392 | | | $ | 32,536,385 | |
| | | | | | | | | |
| | | $ | 32,536,385 | |
| | | | | | | | | |
|
Electrical Equipment — 2.0% | |
Hubbell, Inc., Class B | | | 138,325 | | | $ | 13,743,972 | |
Rockwell Automation, Inc. | | | 142,156 | | | | 14,797,018 | |
| | | | | | | | | |
| | | $ | 28,540,990 | |
| | | | | | | | | |
|
Energy Equipment & Services — 1.8% | |
Schlumberger, Ltd.(1) | | | 353,411 | | | $ | 25,346,637 | |
| | | | | | | | | |
| | | $ | 25,346,637 | |
| | | | | | | | | |
|
Food & Staples Retailing — 2.1% | |
Kroger Co. (The)(1) | | | 759,705 | | | $ | 30,319,826 | |
| | | | | | | | | |
| | | $ | 30,319,826 | |
| | | | | | | | | |
|
Food Products — 1.6% | |
General Mills, Inc.(1) | | | 400,517 | | | $ | 23,570,425 | |
| | | | | | | | | |
| | | $ | 23,570,425 | |
| | | | | | | | | |
|
Health Care Equipment & Supplies — 3.3% | |
Medtronic PLC(1) | | | 459,580 | | | $ | 35,566,896 | |
Zimmer Biomet Holdings, Inc. | | | 119,943 | | | | 11,611,682 | |
| | | | | | | | | |
| | | $ | 47,178,578 | |
| | | | | | | | | |
|
Health Care Providers & Services — 1.5% | |
McKesson Corp.(1) | | | 135,121 | | | $ | 21,027,530 | |
| | | | | | | | | |
| | | $ | 21,027,530 | |
| | | | | | | | | |
|
Industrial Conglomerates — 4.5% | |
General Electric Co.(1) | | | 2,220,247 | | | $ | 64,697,998 | |
| | | | | | | | | |
| | | $ | 64,697,998 | |
| | | | | | | | | |
|
Insurance — 7.0% | |
Aflac, Inc.(1) | | | 282,680 | | | $ | 16,825,113 | |
Alleghany Corp.(3) | | | 21,655 | | | | 10,047,487 | |
American Financial Group, Inc.(1) | | | 157,124 | | | | 10,539,878 | |
| | | | |
| | 5 | | See Notes to Financial Statements. |
Eaton Vance
Tax-Advantaged Dividend Income Fund
February 29, 2016
Portfolio of Investments (Unaudited) — continued
| | | | | | | | |
| Security | | Shares | | | Value | |
| | | | | | | | |
|
Insurance (continued) | |
Chubb, Ltd.(1) | | | 225,998 | | | $ | 26,109,549 | |
MetLife, Inc. | | | 310,871 | | | | 12,298,057 | |
XL Group PLC(1) | | | 735,413 | | | | 25,283,499 | |
| | | | | | | | | |
| | | $ | 101,103,583 | |
| | | | | | | | | |
|
Internet Software & Services — 0.9% | |
Alphabet, Inc., Class C(1)(3) | | | 17,819 | | | $ | 12,433,564 | |
| | | | | | | | | |
| | | $ | 12,433,564 | |
| | | | | | | | | |
|
IT Services — 0.4% | |
Visa, Inc., Class A | | | 89,745 | | | $ | 6,496,640 | |
| | | | | | | | | |
| | | $ | 6,496,640 | |
| | | | | | | | | |
|
Life Sciences Tools & Services — 1.2% | |
Thermo Fisher Scientific, Inc.(1) | | | 139,024 | | | $ | 17,960,511 | |
| | | | | | | | | |
| | | $ | 17,960,511 | |
| | | | | | | | | |
|
Multi-Utilities — 3.8% | |
PG&E Corp.(1) | | | 376,122 | | | $ | 21,337,401 | |
Sempra Energy(1) | | | 349,137 | | | | 33,695,212 | |
| | | | | | | | | |
| | | $ | 55,032,613 | |
| | | | | | | | | |
|
Multiline Retail — 1.2% | |
Target Corp. | | | 212,173 | | | $ | 16,644,972 | |
| | | | | | | | | |
| | | $ | 16,644,972 | |
| | | | | | | | | |
|
Oil, Gas & Consumable Fuels — 9.5% | |
California Resources Corp. | | | 34,847 | | | $ | 19,588 | |
Chevron Corp.(1) | | | 507,751 | | | | 42,366,743 | |
Devon Energy Corp. | | | 283,083 | | | | 5,571,073 | |
EOG Resources, Inc.(1) | | | 237,365 | | | | 15,367,010 | |
Exxon Mobil Corp.(1) | | | 215,668 | | | | 17,285,790 | |
Occidental Petroleum Corp.(1) | | | 580,385 | | | | 39,942,096 | |
Royal Dutch Shell PLC, Class B ADR(1) | | | 379,322 | | | | 17,338,809 | |
| | | | | | | | | |
| | | $ | 137,891,109 | |
| | | | | | | | | |
|
Pharmaceuticals — 7.6% | |
Allergan PLC(1)(3) | | | 68,678 | | | $ | 19,924,174 | |
Eli Lilly & Co.(1) | | | 122,179 | | | | 8,796,888 | |
Johnson & Johnson(1) | | | 591,780 | | | | 62,261,174 | |
Teva Pharmaceutical Industries, Ltd. ADR(1) | | | 340,918 | | | | 18,955,041 | |
| | | | | | | | | |
| | | $ | 109,937,277 | |
| | | | | | | | | |
| | | | | | | | |
| Security | | Shares | | | Value | |
| | | | | | | | |
|
Real Estate Investment Trusts (REITs) — 3.3% | |
Equity Residential(1) | | | 247,063 | | | $ | 18,403,723 | |
Federal Realty Investment Trust | | | 99,446 | | | | 14,723,975 | |
Host Hotels & Resorts, Inc. | | | 496,568 | | | | 7,602,456 | |
Post Properties, Inc. | | | 135,773 | | | | 7,566,629 | |
| | | | | | | | | |
| | | $ | 48,296,783 | |
| | | | | | | | | |
|
Semiconductors & Semiconductor Equipment — 2.0% | |
Intel Corp.(1) | | | 632,380 | | | $ | 18,712,124 | |
NXP Semiconductors NV(3) | | | 132,940 | | | | 9,470,646 | |
| | | | | | | | | |
| | | $ | 28,182,770 | |
| | | | | | | | | |
|
Software — 4.3% | |
Microsoft Corp.(1) | | | 618,001 | | | $ | 31,443,891 | |
Oracle Corp.(1) | | | 845,200 | | | | 31,086,456 | |
| | | | | | | | | |
| | | $ | 62,530,347 | |
| | | | | | | | | |
|
Specialty Retail — 0.8% | |
Home Depot, Inc. (The)(1) | | | 94,965 | | | $ | 11,787,056 | |
| | | | | | | | | |
| | | | | | $ | 11,787,056 | |
| | | | | | | | | |
|
Textiles, Apparel & Luxury Goods — 0.6% | |
Michael Kors Holdings, Ltd.(3) | | | 146,974 | | | $ | 8,326,077 | |
| | | | | | | | | |
| | | | | | $ | 8,326,077 | |
| | | | | | | | | |
|
Tobacco — 2.5% | |
Altria Group, Inc.(1) | | | 110,350 | | | $ | 6,794,249 | |
Reynolds American, Inc.(1) | | | 580,346 | | | | 29,266,849 | |
| | | | | | | | | |
| | | | | | $ | 36,061,098 | |
| | | | | | | | | |
| |
Total Common Stocks
(identified cost $1,225,749,640) | | | $ | 1,315,008,558 | |
| | | | | | | | | |
|
| Preferred Stocks �� 24.0% | |
| | |
| | | | | | | | |
| Security | | Shares | | | Value | |
| | |
Banks — 10.4% | | | | | | | | |
AgriBank FCB, 6.875% to 1/1/24(4) | | | 92,513 | | | $ | 9,786,145 | |
Barclays Bank PLC, 8.25% to 12/15/18(4) | | | 18,250 | | | | 17,721,234 | |
Citigroup, Inc., Series K, 6.875% to 11/15/23(4) | | | 412,807 | | | | 10,990,986 | |
CoBank ACB, Series F, 6.25% to 10/1/22(4)(5) | | | 94,700 | | | | 9,765,938 | |
Farm Credit Bank of Texas,
6.75% to 9/15/23(4)(5) | | | 13,800 | | | | 1,452,019 | |
Farm Credit Bank of Texas,
Series 1, 10.00%(5) | | | 4,678 | | | | 5,844,576 | |
First Tennessee Bank, 3.75%(5)(6) | | | 4,660 | | | | 3,105,745 | |
JPMorgan Chase & Co., Series X,
6.10% to 10/1/24(4) | | | 5,113 | | | | 5,104,819 | |
| | | | |
| | 6 | | See Notes to Financial Statements. |
Eaton Vance
Tax-Advantaged Dividend Income Fund
February 29, 2016
Portfolio of Investments (Unaudited) — continued
| | | | | | | | |
| Security | | Shares | | | Value | |
| | | | | | | | |
| | |
Banks (continued) | | | | | | | | |
JPMorgan Chase & Co., Series Y, 6.125% | | | 317,275 | | | $ | 8,131,758 | |
KeyCorp, Series A, 7.75% (Convertible) | | | 81,279 | | | | 10,565,457 | |
Regions Financial Corp., Series A, 6.375% | | | 466,043 | | | | 11,814,190 | |
Royal Bank of Scotland Group PLC, Series L, 5.75% | | | 336,483 | | | | 8,068,862 | |
Standard Chartered PLC, 7.014% to 7/30/37(4)(5) | | | 40.97 | | | | 3,916,895 | |
SunTrust Banks, Inc., Series E, 5.875% | | | 330,358 | | | | 8,496,411 | |
Texas Capital Bancshares, Inc., 6.50% | | | 274,290 | | | | 6,643,304 | |
Texas Capital Bancshares, Inc., Series A, 6.50% | | | 39,158 | | | | 939,400 | |
Webster Financial Corp., Series E, 6.40% | | | 317,662 | | | | 8,259,212 | |
Wells Fargo & Co., Series L, 7.50% (Convertible) | | | 12,588 | | | | 14,750,493 | |
Zions Bancorporation, Series I,
5.80% to 9/15/23(4) | | | 1,243 | | | | 1,203,701 | |
Zions Bancorporation, Series J,
7.20% to 9/15/23(4) | | | 4,120 | | | | 4,372,831 | |
| | | | | | | | | |
| | | | | | $ | 150,933,976 | |
| | | | | | | | | |
|
Capital Markets — 2.3% | |
Affiliated Managers Group, Inc., 6.375% | | | 162,973 | | | $ | 4,232,213 | |
Goldman Sachs Group, Inc. (The), Series I, 5.95% | | | 75,922 | | | | 1,906,402 | |
Goldman Sachs Group, Inc. (The), Series J, 5.50% to 5/10/23(4) | | | 349,225 | | | | 8,608,396 | |
Morgan Stanley, Series G, 6.625% | | | 507,393 | | | | 13,466,210 | |
State Street Corp., Series D, 5.90% to 3/15/24(4) | | | 195,338 | | | | 5,152,040 | |
| | | | | | | | | |
| | | | | | $ | 33,365,261 | |
| | | | | | | | | |
|
Consumer Finance — 1.7% | |
Capital One Financial Corp., Series B, 6.00% | | | 593,826 | | | $ | 15,112,872 | |
Discover Financial Services, Series B, 6.50% | | | 357,557 | | | | 9,374,715 | |
| | | | | | | | | |
| | | | | | $ | 24,487,587 | |
| | | | | | | | | |
|
Diversified Financial Services — 0.8% | |
KKR Financial Holdings, LLC, Series A, 7.375% | | | 435,261 | | | $ | 11,412,021 | |
| | | | | | | | | |
| | | | | | $ | 11,412,021 | |
| | | | | | | | | |
|
Electric Utilities — 2.4% | |
AES Gener SA, 8.375% to 6/18/19(4)(5) | | | 11,310 | | | $ | 11,329,792 | |
Entergy Arkansas, Inc., 6.45% | | | 308,409 | | | | 7,835,532 | |
NextEra Energy Capital Holdings, Inc., Series G, 5.70% | | | 88,403 | | | | 2,248,751 | |
NextEra Energy Capital Holdings, Inc., Series I, 5.125% | | | 168,192 | | | | 4,189,663 | |
Southern Co. (The), 6.25% | | | 316,040 | | | | 8,384,541 | |
| | | | | | | | | |
| | | | | | $ | 33,988,279 | |
| | | | | | | | | |
|
Food Products — 1.7% | |
Dairy Farmers of America, 7.875%(5) | | | 94,450 | | | $ | 9,952,669 | |
Land O’Lakes, Inc., 8.00%(5) | | | 9,795 | | | | 10,286,655 | |
Ocean Spray Cranberries, Inc., 6.25%(5) | | | 57,835 | | | | 4,953,932 | |
| | | | | | | | | |
| | | | | | $ | 25,193,256 | |
| | | | | | | | | |
| | | | | | | | |
| Security | | Shares | | | Value | |
| | | | | | | | |
|
Insurance — 0.7% | |
American Overseas Group, Ltd.,
Series A, 7.50% to 12/15/16(4)(7) | | | 13,000 | | | $ | 5,200,813 | |
Aspen Insurance Holdings, Ltd.,
5.95% to 7/1/23(4) | | | 70,552 | | | | 1,822,358 | |
Endurance Specialty Holdings, Ltd., Series B, 7.50% | | | 92,875 | | | | 2,355,310 | |
| | | | | | | | | |
| | | | | | $ | 9,378,481 | |
| | | | | | | | | |
|
Machinery — 1.1% | |
Stanley Black & Decker, Inc., 5.75% | | | 644,724 | | | $ | 16,561,348 | |
| | | | | | | | | |
| | | | | | $ | 16,561,348 | |
| | | | | | | | | |
|
Multi-Utilities — 0.1% | |
DTE Energy Co., Series C, 5.25% | | | 59,547 | | | $ | 1,495,225 | |
| | | | | | | | | |
| | | | | | $ | 1,495,225 | |
| | | | | | | | | |
|
Pipelines — 0.4% | |
NuStar Logistics LP, 7.625% to 1/15/18(4) | | | 283,020 | | | $ | 6,279,506 | |
| | | | | | | | | |
| | | | | | $ | 6,279,506 | |
| | | | | | | | | |
|
Real Estate Investment Trusts (REITs) — 1.3% | |
Cedar Realty Trust, Inc., Series B, 7.25% | | | 188,900 | | | $ | 4,769,725 | |
DDR Corp., Series J, 6.50% | | | 250,000 | | | | 6,520,000 | |
DDR Corp., Series K, 6.25% | | | 129,500 | | | | 3,338,678 | |
Vornado Realty Trust, Series K, 5.70% | | | 146,527 | | | | 3,715,925 | |
| | | | | | | | | |
| | | | | | $ | 18,344,328 | |
| | | | | | | | | |
|
Thrifts & Mortgage Finance — 1.1% | |
Elmira Savings Bank,
8.998% to 12/31/17(4) | | | 4,750 | | | $ | 4,417,500 | |
EverBank Financial Corp., Series A, 6.75% | | | 426,011 | | | | 10,714,177 | |
| | | | | | | | | |
| | | | | | $ | 15,131,677 | |
| | | | | | | | | |
| |
Total Preferred Stocks
(identified cost $342,718,346) | | | $ | 346,570,945 | |
| | | | | | | | | |
|
| Corporate Bonds & Notes — 12.1% | |
| | |
| | | | | | | | |
| Security | | Principal
Amount
(000’s omitted) | | | Value | |
| | |
Banks — 5.0% | | | �� | | | | | |
Banco do Brasil SA, 9.00% to 6/18/24, 6/29/49(4)(5) | | $ | 5,517 | | | $ | 3,199,860 | |
Bank of America Corp., Series AA, 6.10% to 3/17/25, 12/29/49(4) | | | 9,335 | | | | 9,066,619 | |
Caixa Economica Federal, 7.25% to 7/23/19, 7/23/24(4)(5) | | | 6,118 | | | | 4,328,485 | |
Credit Agricole SA, 7.875% to 1/23/24, 1/29/49(4)(5) | | | 12,885 | | | | 11,409,655 | |
| | | | |
| | 7 | | See Notes to Financial Statements. |
Eaton Vance
Tax-Advantaged Dividend Income Fund
February 29, 2016
Portfolio of Investments (Unaudited) — continued
| | | | | | | | |
| Security | | Principal
Amount
(000’s omitted) | | | Value | |
| | | | | | | | |
| | |
Banks (continued) | | | | | | | | |
Credit Suisse Group AG, 6.25% to 12/18/24, 12/29/49(4)(5) | | $ | 16,311 | | | $ | 14,626,791 | |
Deutsche Bank AG, 7.50% to 4/30/25, 12/29/49(4) | | | 6,180 | | | | 4,998,075 | |
JPMorgan Chase & Co., Series Z,
5.30% to 5/1/20, 12/29/49(4) | | | 9,812 | | | | 9,581,909 | |
Lloyds Banking Group PLC, 7.50% to 6/27/24, 4/30/49(4) | | | 4,571 | | | | 4,285,312 | |
Societe Generale SA, 8.25% to 11/29/18, 9/29/49(4)(8) | | | 11,828 | | | | 11,687,542 | |
| | | | | | | | | |
| | | | | | $ | 73,184,248 | |
| | | | | | | | | |
|
Diversified Financial Services — 0.6% | |
Leucadia National Corp., 6.625%, 10/23/43 | | $ | 7,238 | | | $ | 5,687,266 | |
Textron Financial Corp., 6.00% to 2/15/17, 2/15/67(4)(5) | | | 3,791 | | | | 2,738,997 | |
| | | | | | | | | |
| | | | | | $ | 8,426,263 | |
| | | | | | | | | |
|
Diversified Telecommunication Services — 0.8% | |
Koninklijke KPN NV, 7.00% to 3/28/23, 3/28/73(4)(5) | | $ | 11,855 | | | $ | 11,899,456 | |
| | | | | | | | | |
| | | | | | $ | 11,899,456 | |
| | | | | | | | | |
|
Electric Utilities — 2.1% | |
AES Panama SA, 6.00%, 6/25/22(5) | | $ | 2,439 | | | $ | 2,417,659 | |
Enel SpA, 8.75% to 9/24/23, 9/24/73(4)(5) | | | 12,557 | | | | 13,687,130 | |
PPL Capital Funding, Inc., Series A,
6.70% to 3/30/17, 3/30/67(4) | | | 18,510 | | | | 13,894,846 | |
| | | | | | | | | |
| | | | | | $ | 29,999,635 | |
| | | | | | | | | |
|
Energy Equipment & Services — 0.1% | |
Abengoa Finance S.A.U.,
7.75%, 2/1/20(5)(9) | | $ | 7,369 | | | $ | 829,013 | |
| | | | | | | | | |
| | | | | | $ | 829,013 | |
| | | | | | | | | |
|
Insurance — 1.2% | |
Genworth Financial, Inc., 7.625%, 9/24/21 | | $ | 2,163 | | | $ | 1,432,988 | |
Genworth Holdings, Inc., 6.515%, 5/22/18 | | | 358 | | | | 316,830 | |
QBE Capital Funding III, Ltd.,
7.25% to 5/24/21, 5/24/41(4)(5) | | | 1,680 | | | | 1,835,400 | |
XLIT, Ltd., Series E, 6.50% to 4/15/17, 10/29/49(4) | | | 18,845 | | | | 13,238,612 | |
| | | | | | | | | |
| | | | | | $ | 16,823,830 | |
| | | | | | | | | |
|
Metals & Mining — 1.1% | |
BHP Billiton Finance USA, Ltd.,
6.75% to 10/19/25, 10/19/75(4)(5) | | $ | 13,480 | | | $ | 13,126,150 | |
Freeport-McMoRan, Inc., 3.55%, 3/1/22 | | | 3,497 | | | | 2,342,990 | |
| | | | | | | | | |
| | | | | | $ | 15,469,140 | |
| | | | | | | | | |
| | | | | | | | |
| Security | | Principal
Amount
(000’s omitted) | | | Value | |
| | | | | | | | |
|
Oil, Gas & Consumable Fuels — 0.1% | |
Odebrecht Oil & Gas Finance, Ltd.,
7.00% to 6/17/24, 12/29/49(4)(5) | | $ | 11,599 | | | $ | 2,029,825 | |
| | | | | | | | | |
| | | | | | $ | 2,029,825 | |
| | | | | | | | | |
|
Telecommunications — 1.1% | |
Colombia Telecomunicaciones SA ESP,
8.50% to 3/30/20, 12/29/49(4)(5) | | $ | 20,770 | | | $ | 16,200,600 | |
| | | | | | | | | |
| | | | | | $ | 16,200,600 | |
| | | | | | | | | |
| | |
Total Corporate Bonds & Notes
(identified cost $212,283,295) | | | | | | $ | 174,862,010 | |
| | | | | | | | | |
|
| Exchange-Traded Funds — 2.6% | |
| | |
| | | | | | | | |
| Security | | Shares | | | Value | |
|
Equity Funds — 2.6% | |
iShares U.S. Preferred Stock ETF | | | 1,002,350 | | | $ | 38,410,052 | |
| | | | | | | | | |
| | |
Total Exchange-Traded Funds
(identified cost $39,428,522) | | | | | | $ | 38,410,052 | |
| | | | | | | | | |
|
| Short-Term Investments — 0.6% | |
| | |
| | | | | | | | |
| Description | | Interest
(000’s omitted) | | | Value | |
Eaton Vance Cash Reserves Fund, LLC, 0.45%(10) | | $ | 9,458 | | | $ | 9,458,399 | |
| | | | | | | | | |
| | |
Total Short-Term Investments
(identified cost $9,458,399) | | | | | | $ | 9,458,399 | |
| | | | | | | | | |
| | |
Total Investments — 130.3%
(identified cost $1,829,638,202) | | | | | | $ | 1,884,309,964 | |
| | | | | | | | | |
| | |
Other Assets, Less Liabilities — (30.3)% | | | | | | $ | (438,602,787 | ) |
| | | | | | | | | |
| | |
Net Assets — 100.0% | | | | | | $ | 1,445,707,177 | |
| | | | | | | | | |
The percentage shown for each investment category in the Portfolio of Investments is based on net assets.
| | (1) | Security has been segregated as collateral with the custodian for borrowings under the Committed Facility Agreement. |
| | (2) | Security was acquired in a private offering and may be resold on a designated offshore securities market pursuant to Regulation S under the Securities Act of 1933. |
| | (3) | Non-income producing security. |
| | (4) | Security converts to floating rate after the indicated fixed-rate coupon period. |
| | | | |
| | 8 | | See Notes to Financial Statements. |
Eaton Vance
Tax-Advantaged Dividend Income Fund
February 29, 2016
Portfolio of Investments (Unaudited) — continued
| | (5) | Security exempt from registration pursuant to Rule 144A under the Securities Act of 1933, as amended. These securities may be sold in certain transactions in reliance on an exemption from registration (normally to qualified institutional buyers). At February 29, 2016, the aggregate value of these securities is $158,937,242 or 11.0% of the Fund’s net assets. |
| | (6) | Variable rate security. The stated interest rate represents the rate in effect at February 29, 2016. |
| | (7) | For fair value measurement disclosure purposes, security is categorized as Level 3 (see Note 8). |
| | (8) | Security exempt from registration under Regulation S of the Securities Act of 1933, which exempts from registration securities offered and sold outside the United States. Security may not be offered or sold in the United States except pursuant to an exemption from, or in a transaction not subject to, the registration requirements of the Securities Act of 1933. At February 29, 2016, the aggregate value of these securities is $11,687,542 or 0.8% of the Fund’s net assets. |
| (10) | Affiliated investment company, available to Eaton Vance portfolios and funds, which invests in high quality, U.S. dollar denominated money market instruments. The rate shown is the annualized seven-day yield as of February 29, 2016. |
| | | | | | | | |
| Country Concentration of Portfolio | |
| | |
| | | | | | | | |
| Country | | Percentage of
Total Investments | | | Value | |
United States | | | 84.1 | % | | $ | 1,583,720,976 | |
Netherlands | | | 2.1 | | | | 38,708,911 | |
Ireland | | | 2.0 | | | | 38,522,111 | |
United Kingdom | | | 1.8 | | | | 33,992,303 | |
Switzerland | | | 1.8 | | | | 33,099,026 | |
France | | | 1.2 | | | | 23,097,197 | |
Israel | | | 1.0 | | | | 18,955,041 | |
Colombia | | | 0.9 | | | | 16,200,600 | |
Australia | | | 0.8 | | | | 14,961,550 | |
Italy | | | 0.7 | | | | 13,687,130 | |
Chile | | | 0.6 | | | | 11,329,792 | |
Brazil | | | 0.5 | | | | 9,558,170 | |
Germany | | | 0.3 | | | | 4,998,075 | |
Panama | | | 0.1 | | | | 2,417,659 | |
Bermuda | | | 0.1 | | | | 1,822,358 | |
Spain | | | 0.0 | (1) | | | 829,013 | |
Exchange-Traded Funds | | | 2.0 | | | | 38,410,052 | |
| | |
Total Investments | | | 100.0 | % | | $ | 1,884,309,964 | |
| | |
| (1) | Amount is less than 0.05%. |
Abbreviations:
| | | | |
| ADR | | – | | American Depositary Receipt |
| | | | |
| | 9 | | See Notes to Financial Statements. |
Eaton Vance
Tax-Advantaged Dividend Income Fund
February 29, 2016
Statement of Assets and Liabilities (Unaudited)
| | | | |
| Assets | | February 29, 2016 | |
Unaffiliated investments, at value (identified cost, $1,820,179,803) | | $ | 1,874,851,565 | |
Affiliated investment, at value (identified cost, $9,458,399) | | | 9,458,399 | |
Foreign currency, at value (identified cost, $127) | | | 108 | |
Dividends and interest receivable | | | 11,774,870 | |
Interest receivable from affiliated investment | | | 10,287 | |
Receivable for investments sold | | | 7,305 | |
Tax reclaims receivable | | | 5,068,140 | |
Total assets | | $ | 1,901,170,674 | |
|
| Liabilities | |
Notes payable | | $ | 447,000,000 | |
Payable for investments purchased | | | 6,556,065 | |
Payable to affiliate: | | | | |
Investment adviser fee | | | 1,263,841 | |
Accrued expenses | | | 643,591 | |
Total liabilities | | $ | 455,463,497 | |
Net Assets | | $ | 1,445,707,177 | |
|
| Sources of Net Assets | |
Common shares, $0.01 par value, unlimited number of shares authorized, 72,835,900 shares issued and outstanding | | $ | 728,359 | |
Additional paid-in capital | | | 1,382,213,413 | |
Accumulated net realized gain | | | 43,805,189 | |
Accumulated distributions in excess of net investment income | | | (35,719,569 | ) |
Net unrealized appreciation | | | 54,679,785 | |
Net Assets | | $ | 1,445,707,177 | |
|
| Net Asset Value | |
($1,445,707,177 ÷ 72,835,900 common shares issued and outstanding) | | $ | 19.85 | |
| | | | |
| | 10 | | See Notes to Financial Statements. |
Eaton Vance
Tax-Advantaged Dividend Income Fund
February 29, 2016
Statement of Operations (Unaudited)
| | | | |
| Investment Income | | Six Months Ended February 29, 2016 | |
Dividends (net of foreign taxes, $31,170) | | $ | 30,382,321 | |
Interest | | | 7,826,191 | |
Interest income allocated from affiliated investment | | | 42,312 | |
Expenses allocated from affiliated investment | | | (2,075 | ) |
Total investment income | | $ | 38,248,749 | |
|
| Expenses | |
Investment adviser fee | | $ | 8,302,862 | |
Trustees’ fees and expenses | | | 34,000 | |
Custodian fee | | | 237,243 | |
Transfer and dividend disbursing agent fees | | | 9,678 | |
Legal and accounting services | | | 63,242 | |
Printing and postage | | | 165,159 | |
Interest expense and fees | | | 2,051,256 | |
Miscellaneous | | | 60,750 | |
Total expenses | | $ | 10,924,190 | |
Deduct — | | | | |
Reduction of custodian fee | | $ | 35 | |
Total expense reductions | | $ | 35 | |
| |
Net expenses | | $ | 10,924,155 | |
| |
Net investment income | | $ | 27,324,594 | |
|
| Realized and Unrealized Gain (Loss) | |
Net realized gain (loss) — | | | | |
Investment transactions | | $ | 23,574,340 | |
Investment transactions allocated from affiliated investment | | | 72 | |
Foreign currency transactions | | | 331,763 | |
Net realized gain | | $ | 23,906,175 | |
Change in unrealized appreciation (depreciation) — | | | | |
Investments | | $ | (87,329,643 | ) |
Foreign currency | | | (133,123 | ) |
Net change in unrealized appreciation (depreciation) | | $ | (87,462,766 | ) |
| |
Net realized and unrealized loss | | $ | (63,556,591 | ) |
| |
Net decrease in net assets from operations | | $ | (36,231,997 | ) |
| | | | |
| | 11 | | See Notes to Financial Statements. |
Eaton Vance
Tax-Advantaged Dividend Income Fund
February 29, 2016
Statements of Changes in Net Assets
| | | | | | | | |
| Increase (Decrease) in Net Assets | | Six Months Ended February 29, 2016
(Unaudited) | | | Year Ended August 31, 2015 | |
From operations — | | | | | | | | |
Net investment income | | $ | 27,324,594 | | | $ | 58,837,781 | |
Net realized gain from investment, foreign currency and forward foreign currency exchange contract transactions and proceeds from securities litigation settlements | | | 23,906,175 | | | | 117,816,819 | |
Net change in unrealized appreciation (depreciation) from investments and foreign currency | | | (87,462,766 | ) | | | (197,055,171 | ) |
Net decrease in net assets from operations | | $ | (36,231,997 | ) | | $ | (20,400,571 | ) |
Distributions to shareholders — | | | | | | | | |
From net investment income | | $ | (63,367,233 | ) | | $ | (79,040,912 | ) |
From net realized gain | | | — | | | | (26,425,470 | ) |
Total distributions | | $ | (63,367,233 | ) | | $ | (105,466,382 | ) |
| | |
Net decrease in net assets | | $ | (99,599,230 | ) | | $ | (125,866,953 | ) |
|
| Net Assets | |
At beginning of period | | $ | 1,545,306,407 | | | $ | 1,671,173,360 | |
At end of period | | $ | 1,445,707,177 | | | $ | 1,545,306,407 | |
|
Accumulated undistributed (distributions in excess of) net investment income
included in net assets | |
At end of period | | $ | (35,719,569 | ) | | $ | 323,070 | |
| | | | |
| | 12 | | See Notes to Financial Statements. |
Eaton Vance
Tax-Advantaged Dividend Income Fund
February 29, 2016
Statement of Cash Flows (Unaudited)
| | | | |
| Cash Flows From Operating Activities | | Six Months Ended February 29, 2016 | |
Net decrease in net assets from operations | | $ | (36,231,997 | ) |
Adjustments to reconcile net decrease in net assets from operations to net cash provided by operating activities: | | | | |
Investments purchased | | | (994,425,465 | ) |
Investments sold | | | 1,031,972,090 | |
Increase in short-term investments, net | | | (255,977 | ) |
Net amortization/accretion of premium (discount) | | | (81,503 | ) |
Increase in dividends and interest receivable | | | (2,501,110 | ) |
Increase in interest receivable from affiliated investment | | | (6,166 | ) |
Decrease in tax reclaims receivable | | | 293,924 | |
Decrease in payable to affiliate for investment adviser fee | | | (213,973 | ) |
Increase in accrued expenses | | | 366,469 | |
Net change in unrealized (appreciation) depreciation from investments | | | 87,329,643 | |
Net realized gain from investments | | | (23,574,340 | ) |
Net cash provided by operating activities | | $ | 62,671,595 | |
|
| Cash Flows From Financing Activities | |
Distributions paid, net of reinvestments | | $ | (63,367,233 | ) |
Net cash used in financing activities | | $ | (63,367,233 | ) |
| |
Net decrease in cash* | | $ | (695,638 | ) |
| |
Cash at beginning of period(1) | | $ | 695,746 | |
| |
Cash at end of period(1) | | $ | 108 | |
|
| Supplemental disclosure of cash flow information: | |
Cash paid for interest and fees on borrowings | | $ | 1,668,449 | |
| * | Includes net change in unrealized appreciation (depreciation) on foreign currency of $27,948. |
| (1) | Balance includes foreign currency, at value. |
| | | | |
| | 13 | | See Notes to Financial Statements. |
Eaton Vance
Tax-Advantaged Dividend Income Fund
February 29, 2016
Financial Highlights
| | | | | | | | | | | | | | | | | | | | | | | | |
| | | Six Months Ended
February 29, 2016
(Unaudited) | | | Year Ended August 31, | |
| | | | 2015 | | | 2014 | | | 2013 | | | 2012 | | | 2011 | |
Net asset value — Beginning of period | | $ | 21.220 | | | $ | 22.940 | | | $ | 19.500 | | | $ | 18.300 | | | $ | 16.780 | | | $ | 15.950 | |
| | | | | | |
| Income (Loss) From Operations | | | | | | | | | | | | | | | | | | | | | | | | |
Net investment income(1) | | $ | 0.375 | | | $ | 0.808 | | | $ | 1.429 | (2) | | $ | 1.389 | | | $ | 1.202 | | | $ | 1.354 | (3) |
Net realized and unrealized gain (loss) | | | (0.875 | ) | | | (1.080 | ) | | | 3.334 | | | | 1.101 | | | | 1.608 | | | | 0.766 | |
| | | | | | |
Total income (loss) from operations | | $ | (0.500 | ) | | $ | (0.272 | ) | | $ | 4.763 | | | $ | 2.490 | | | $ | 2.810 | | | $ | 2.120 | |
| | | | | | |
| Less Distributions | | | | | | | | | | | | | | | | | | | | | | | | |
From net investment income | | $ | (0.870 | ) | | $ | (1.085 | ) | | $ | (1.323 | ) | | $ | (1.290 | ) | | $ | (1.290 | ) | | $ | (1.290 | ) |
From net realized gain | | | — | | | | (0.363 | ) | | | — | | | | — | | | | — | | | | — | |
| | | | | | |
Total distributions | | $ | (0.870 | ) | | $ | (1.448 | ) | | $ | (1.323 | ) | | $ | (1.290 | ) | | $ | (1.290 | ) | | $ | (1.290 | ) |
| | | | | | |
Net asset value — End of period | | $ | 19.850 | | | $ | 21.220 | | | $ | 22.940 | | | $ | 19.500 | | | $ | 18.300 | | | $ | 16.780 | |
| | | | | | |
Market value — End of period | | $ | 18.000 | | | $ | 19.290 | | | $ | 20.560 | | | $ | 17.630 | | | $ | 16.600 | | | $ | 15.160 | |
| | | | | | |
Total Investment Return on Net Asset Value(4) | | | (2.09 | )%(5) | | | (0.67 | )% | | | 25.90 | % | | | 14.45 | % | | | 18.42 | % | | | 13.58 | % |
| | | | | | |
Total Investment Return on Market Value(4) | | | (2.34 | )%(5) | | | 0.76 | % | | | 24.80 | % | | | 14.09 | % | | | 18.87 | % | | | 10.96 | % |
| | | | | | |
| Ratios/Supplemental Data | | | | | | | | | | | | | | | | | | | | | | | | |
Net assets, end of period (000’s omitted) | | $ | 1,445,707 | | | $ | 1,545,306 | | | $ | 1,671,173 | | | $ | 1,420,015 | | | $ | 1,332,627 | | | $ | 1,222,187 | |
Ratios (as a percentage of average daily net assets): | | | | | | | | | | | | | | | | | | | | | | | | |
Expenses excluding interest and fees(6) | | | 1.17 | %(7) | | | 1.14 | % | | | 1.15 | % | | | 1.19 | % | | | 1.23 | % | | | 1.13 | % |
Interest and fee expense | | | 0.27 | %(7) | | | 0.21 | % | | | 0.22 | % | | | 0.30 | % | | | 0.45 | % | | | 0.36 | % |
Total expenses(6) | | | 1.44 | %(7) | | | 1.35 | % | | | 1.37 | % | | | 1.49 | % | | | 1.68 | % | | | 1.49 | % |
Net investment income | | | 3.61 | %(7) | | | 3.57 | % | | | 6.63 | %(2) | | | 7.14 | % | | | 6.93 | % | | | 7.47 | %(3) |
Portfolio Turnover | | | 49 | %(5) | | | 99 | % | | | 68 | % | | | 84 | % | | | 94 | % | | | 86 | % |
Senior Securities: | | | | | | | | | | | | | | | | | | | | | | | | |
Total notes payable outstanding (in 000’s) | | $ | 447,000 | | | $ | 447,000 | | | $ | 447,000 | | | $ | 447,000 | | | $ | 447,000 | | | $ | 447,000 | |
Asset coverage per $1,000 of notes payable(8) | | $ | 4,234 | | | $ | 4,457 | | | $ | 4,739 | | | $ | 4,177 | | | $ | 3,981 | | | $ | 3,734 | |
| (1) | Computed using average common shares outstanding. |
| (2) | Net investment income per share includes special dividends which amounted to $0.501 per share. Excluding special dividends, the ratio of net investment income to average daily net assets would have been 4.30%. |
| (3) | Net investment income per share includes special dividends which amounted to $0.191 per share. Excluding special dividends, the ratio of net investment income to average daily net assets would have been 6.41%. |
| (4) | Returns are historical and are calculated by determining the percentage change in net asset value or market value with all distributions reinvested. Distributions are assumed to be reinvested at prices obtained under the Fund’s dividend reinvestment plan. |
| (6) | Excludes the effect of custody fee credits, if any, of less than 0.005%. |
| (8) | Calculated by subtracting the Fund’s total liabilities (not including the notes payable) from the Fund’s total assets, and dividing the result by the notes payable balance in thousands. |
| | | | |
| | 14 | | See Notes to Financial Statements. |
Eaton Vance
Tax-Advantaged Dividend Income Fund
February 29, 2016
Notes to Financial Statements (Unaudited)
1 Significant Accounting Policies
Eaton Vance Tax-Advantaged Dividend Income Fund (the Fund) is a Massachusetts business trust registered under the Investment Company Act of 1940, as amended (the 1940 Act), as a diversified, closed-end management investment company. The Fund’s investment objective is to provide a high level of after-tax total return consisting primarily of tax-advantaged dividend income and capital appreciation. The Fund pursues its objective by investing primarily in dividend-paying common and preferred stocks.
The following is a summary of significant accounting policies of the Fund. The policies are in conformity with accounting principles generally accepted in the United States of America (U.S. GAAP). The Fund is an investment company and follows accounting and reporting guidance in the Financial Accounting Standards Board (“FASB”) Accounting Standards Codification Topic 946.
A Investment Valuation — The following methodologies are used to determine the market value or fair value of investments.
Equity Securities. Equity securities listed on a U.S. securities exchange generally are valued at the last sale or closing price on the day of valuation or, if no sales took place on such date, at the mean between the closing bid and asked prices therefore on the exchange where such securities are principally traded. Equity securities listed on the NASDAQ Global or Global Select Market generally are valued at the NASDAQ official closing price. Unlisted or listed securities for which closing sales prices or closing quotations are not available are valued at the mean between the latest available bid and asked prices or, in the case of preferred equity securities that are not listed or traded in the over-the-counter market, by a third party pricing service that uses various techniques that consider factors including, but not limited to, prices or yields of securities with similar characteristics, benchmark yields, broker/dealer quotes, quotes of underlying common stock, issuer spreads, as well as industry and economic events. The value of preferred equity securities that are valued by a pricing service on a bond basis is adjusted by an income factor, as determined by the investment adviser, to reflect the next anticipated regular dividend.
Debt Obligations. Debt obligations (including short-term obligations with a remaining maturity of more than sixty days) are generally valued on the basis of valuations provided by third party pricing services, as derived from such services’ pricing models. Inputs to the models may include, but are not limited to, reported trades, executable bid and asked prices, broker/dealer quotations, prices or yields of securities with similar characteristics, interest rates, anticipated prepayments, benchmark curves or information pertaining to the issuer, as well as industry and economic events. The pricing services may use a matrix approach, which considers information regarding securities with similar characteristics to determine the valuation for a security. Short-term obligations purchased with a remaining maturity of sixty days or less are generally valued at amortized cost, which approximates market value.
Foreign Securities and Currencies. Foreign securities and currencies are valued in U.S. dollars, based on foreign currency exchange rate quotations supplied by a third party pricing service. The pricing service uses a proprietary model to determine the exchange rate. Inputs to the model include reported trades and implied bid/ask spreads. The daily valuation of exchange-traded foreign securities generally is determined as of the close of trading on the principal exchange on which such securities trade. Events occurring after the close of trading on foreign exchanges may result in adjustments to the valuation of foreign securities to more accurately reflect their fair value as of the close of regular trading on the New York Stock Exchange. When valuing foreign equity securities that meet certain criteria, the Fund’s Trustees have approved the use of a fair value service that values such securities to reflect market trading that occurs after the close of the applicable foreign markets of comparable securities or other instruments that have a strong correlation to the fair-valued securities.
Affiliated Fund. The Fund may invest in Eaton Vance Cash Reserves Fund, LLC (Cash Reserves Fund), an affiliated investment company managed by Eaton Vance Management (EVM). The value of the Fund’s investment in Cash Reserves Fund reflects the Fund’s proportionate interest in its net assets. Cash Reserves Fund generally values its investment securities utilizing the amortized cost valuation technique in accordance with Rule 2a-7 under the 1940 Act. This technique involves initially valuing a portfolio security at its cost and thereafter assuming a constant amortization to maturity of any discount or premium. If amortized cost is determined not to approximate fair value, Cash Reserves Fund may value its investment securities in the same manner as debt obligations described above.
Fair Valuation. Investments for which valuations or market quotations are not readily available or are deemed unreliable are valued at fair value using methods determined in good faith by or at the direction of the Trustees of the Fund in a manner that fairly reflects the security’s value, or the amount that the Fund might reasonably expect to receive for the security upon its current sale in the ordinary course. Each such determination is based on a consideration of relevant factors, which are likely to vary from one pricing context to another. These factors may include, but are not limited to, the type of security, the existence of any contractual restrictions on the security’s disposition, the price and extent of public trading in similar securities of the issuer or of comparable companies or entities, quotations or relevant information obtained from broker/dealers or other market participants, information obtained from the issuer, analysts, and/or the appropriate stock exchange (for exchange-traded securities), an analysis of the company’s or entity’s financial condition, and an evaluation of the forces that influence the issuer and the market(s) in which the security is purchased and sold.
B Investment Transactions — Investment transactions for financial statement purposes are accounted for on a trade date basis. Realized gains and losses on investments sold are determined on the basis of identified cost.
C Income — Dividend income is recorded on the ex-dividend date for dividends received in cash and/or securities. However, if the ex-dividend date has passed, certain dividends from foreign securities are recorded as the Fund is informed of the ex-dividend date. Withholding taxes on foreign dividends, interest and capital gains have been provided for in accordance with the Fund’s understanding of the applicable countries’ tax rules and rates. In consideration of recent decisions rendered by European courts, the Fund has filed additional tax reclaims for previously withheld taxes on dividends earned in certain European Union countries. These filings are subject to various administrative and judicial proceedings within these countries. During the six months ended February 29, 2016, the Fund recorded no income for reclaims of previously withheld dividend taxes and approximately $177,000 of
Eaton Vance
Tax-Advantaged Dividend Income Fund
February 29, 2016
Notes to Financial Statements (Unaudited) — continued
previously recorded income for dividend tax reclaims is unpaid and included in Tax reclaims receivable in the Statement of Assets and Liabilities. No other amounts for additional tax reclaims are reflected in the financial statements due to the uncertainty as to the ultimate resolution of proceedings, the likelihood of receipt of these reclaims, and the potential timing of payment. Interest income is recorded on the basis of interest accrued, adjusted for amortization of premium or accretion of discount. Distributions from investment companies are recorded as dividend income, capital gains or return of capital based on the nature of the distribution.
D Federal Taxes — The Fund’s policy is to comply with the provisions of the Internal Revenue Code applicable to regulated investment companies and to distribute to shareholders each year substantially all of its net investment income, and all or substantially all of its net realized capital gains. Accordingly, no provision for federal income or excise tax is necessary.
As of February 29, 2016, the Fund had no uncertain tax positions that would require financial statement recognition, de-recognition, or disclosure. The Fund files a U.S. federal income tax return annually after its fiscal year-end, which is subject to examination by the Internal Revenue Service for a period of three years from the date of filing.
E Expense Reduction — State Street Bank and Trust Company (SSBT) serves as custodian of the Fund. Pursuant to the custodian agreement, SSBT receives a fee reduced by credits, which are determined based on the average daily cash balance the Fund maintains with SSBT. All credit balances, if any, used to reduce the Fund’s custodian fees are reported as a reduction of expenses in the Statement of Operations.
F Foreign Currency Translation — Investment valuations, other assets, and liabilities initially expressed in foreign currencies are translated each business day into U.S. dollars based upon current exchange rates. Purchases and sales of foreign investment securities and income and expenses denominated in foreign currencies are translated into U.S. dollars based upon currency exchange rates in effect on the respective dates of such transactions. Recognized gains or losses on investment transactions attributable to changes in foreign currency exchange rates are recorded for financial statement purposes as net realized gains and losses on investments. That portion of unrealized gains and losses on investments that results from fluctuations in foreign currency exchange rates is not separately disclosed.
G Use of Estimates — The preparation of the financial statements in conformity with U.S. GAAP requires management to make estimates and assumptions that affect the reported amounts of assets and liabilities at the date of the financial statements and the reported amounts of income and expense during the reporting period. Actual results could differ from those estimates.
H Indemnifications — Under the Fund’s organizational documents, its officers and Trustees may be indemnified against certain liabilities and expenses arising out of the performance of their duties to the Fund. Under Massachusetts law, if certain conditions prevail, shareholders of a Massachusetts business trust (such as the Fund) could be deemed to have personal liability for the obligations of the Fund. However, the Fund’s Declaration of Trust contains an express disclaimer of liability on the part of Fund shareholders and the By-laws provide that the Fund shall assume the defense on behalf of any Fund shareholders. Moreover, the By-laws also provide for indemnification out of Fund property of any shareholder held personally liable solely by reason of being or having been a shareholder for all loss or expense arising from such liability. Additionally, in the normal course of business, the Fund enters into agreements with service providers that may contain indemnification clauses. The Fund’s maximum exposure under these arrangements is unknown as this would involve future claims that may be made against the Fund that have not yet occurred.
I Forward Foreign Currency Exchange Contracts — The Fund may enter into forward foreign currency exchange contracts for the purchase or sale of a specific foreign currency at a fixed price on a future date. The forward foreign currency exchange contracts are adjusted by the daily exchange rate of the underlying currency and any gains or losses are recorded as unrealized until such time as the contracts have been closed. Risks may arise upon entering these contracts from the potential inability of counterparties to meet the terms of their contracts and from movements in the value of a foreign currency relative to the U.S. dollar.
J Statement of Cash Flows — The cash amount shown in the Statement of Cash Flows of the Fund is the amount included in the Fund’s Statement of Assets and Liabilities and represents the unrestricted cash on hand at its custodian and does not include any short-term investments.
K Interim Financial Statements — The interim financial statements relating to February 29, 2016 and for the six months then ended have not been audited by an independent registered public accounting firm, but in the opinion of the Fund’s management, reflect all adjustments, consisting only of normal recurring adjustments, necessary for the fair presentation of the financial statements.
2 Distributions to Shareholders and Income Tax Information
Subject to its Managed Distribution Plan, the Fund intends to make monthly distributions from its net investment income, net capital gain (which is the excess of net long-term capital gain over net short-term capital loss) and other sources. The Fund intends to distribute all or substantially all of its net realized capital gains. Distributions are recorded on the ex-dividend date. Distributions to shareholders are determined in accordance with income tax regulations, which may differ from U.S. GAAP. As required by U.S. GAAP, only distributions in excess of tax basis earnings and profits are reported in the financial statements as a return of capital. Permanent differences between book and tax accounting relating to distributions are reclassified to paid-in capital. For tax purposes, distributions from short-term capital gains are considered to be from ordinary income. Distributions in any year may include a return of capital component.
Eaton Vance
Tax-Advantaged Dividend Income Fund
February 29, 2016
Notes to Financial Statements (Unaudited) — continued
The cost and unrealized appreciation (depreciation) of investments of the Fund at February 29, 2016, as determined on a federal income tax basis, were as follows:
| | | | |
| |
Aggregate cost | | $ | 1,836,612,984 | |
| |
Gross unrealized appreciation | | $ | 141,734,436 | |
Gross unrealized depreciation | | | (94,037,456 | ) |
| |
Net unrealized appreciation | | $ | 47,696,980 | |
3 Investment Adviser Fee and Other Transactions with Affiliates
The investment adviser fee is earned by EVM as compensation for management and investment advisory services rendered to the Fund. Pursuant to the investment advisory agreement and subsequent fee reduction agreement, the fee is computed at an annual rate of 0.85% of the Fund’s average daily gross assets up to and including $1.5 billion, 0.83% over $1.5 billion up to and including $3 billion, and at reduced rates as daily gross assets exceed $3 billion, and is payable monthly. Gross assets as referred to herein represent net assets plus obligations attributable to investment leverage. The fee reduction cannot be terminated without the consent of a majority of Trustees and a majority of shareholders. For the six months ended February 29, 2016, the Fund’s investment adviser fee amounted to $8,302,862 or 0.85% (annualized) of the Fund’s average daily gross assets. The Fund invests its cash in Cash Reserves Fund. EVM does not currently receive a fee for advisory services provided to Cash Reserves Fund. EVM also serves as administrator of the Fund, but receives no compensation.
Trustees and officers of the Fund who are members of EVM’s organization receive remuneration for their services to the Fund out of the investment adviser fee. Trustees of the Fund who are not affiliated with EVM may elect to defer receipt of all or a percentage of their annual fees in accordance with the terms of the Trustees Deferred Compensation Plan. For the six months ended February 29, 2016, no significant amounts have been deferred. Certain officers and Trustees of the Fund are officers of EVM.
4 Purchases and Sales of Investments
Purchases and sales of investments, other than short-term obligations, aggregated $961,001,225 and $992,234,943, respectively, for the six months ended February 29, 2016.
5 Common Shares of Beneficial Interest
The Fund may issue common shares pursuant to its dividend reinvestment plan. There were no common shares issued by the Fund for the six months ended February 29, 2016 and the year ended August 31, 2015.
On November 11, 2013, the Board of Trustees of the Fund authorized the repurchase by the Fund of up to 10% of its then currently outstanding common shares in open-market transactions at a discount to net asset value. The repurchase program does not obligate the Fund to purchase a specific amount of shares. There were no repurchases of common shares by the Fund for the six months ended February 29, 2016 and the year ended August 31, 2015.
6 Committed Facility Agreement
The Fund has entered into a Committed Facility Agreement, as amended (the Agreement) with major financial institutions that allows it to borrow up to $447 million ($558 million prior to December 22, 2015) over a rolling 360 calendar day period. Interest is charged at a rate above 1-month LIBOR and is payable monthly. The Fund is charged a commitment fee of 0.35% per annum on the unused portion of the commitment if outstanding borrowings are less than 80% of the borrowing limit. Under the terms of the Agreement, the Fund is required to satisfy certain collateral requirements and maintain a certain level of net assets. At February 29, 2016, the Fund had borrowings outstanding under the Agreement of $447 million at an interest rate of 1.04%. The carrying amount of the borrowings at February 29, 2016 approximated its fair value. If measured at fair value, borrowings under the Agreement would have been considered as Level 2 in the fair value hierarchy (see Note 8) at February 29, 2016. For the six months ended February 29, 2016, the average borrowings under the Agreement and the average annual interest rate (excluding fees) were $447 million and 0.92%, respectively.
7 Risks Associated with Foreign Investments
Investing in securities issued by companies whose principal business activities are outside the United States may involve significant risks not present in domestic investments. For example, there is generally less publicly available information about foreign companies, particularly those not subject to the disclosure and reporting requirements of the U.S. securities laws. Certain foreign issuers are generally not bound by uniform accounting, auditing, and financial reporting requirements and standards of practice comparable to those applicable to domestic issuers. Investments in foreign securities also involve
Eaton Vance
Tax-Advantaged Dividend Income Fund
February 29, 2016
Notes to Financial Statements (Unaudited) — continued
the risk of possible adverse changes in investment or exchange control regulations, expropriation or confiscatory taxation, limitation on the removal of funds or other assets of the Fund, political or financial instability or diplomatic and other developments which could affect such investments. Foreign securities markets, while growing in volume and sophistication, are generally not as developed as those in the United States, and securities of some foreign issuers (particularly those located in developing countries) may be less liquid and more volatile than securities of comparable U.S. companies. In general, there is less overall governmental supervision and regulation of foreign securities markets, broker/dealers and issuers than in the United States.
8 Fair Value Measurements
Under generally accepted accounting principles for fair value measurements, a three-tier hierarchy to prioritize the assumptions, referred to as inputs, is used in valuation techniques to measure fair value. The three-tier hierarchy of inputs is summarized in the three broad levels listed below.
| • | | Level 1 – quoted prices in active markets for identical investments |
| • | | Level 2 – other significant observable inputs (including quoted prices for similar investments, interest rates, prepayment speeds, credit risk, etc.) |
| • | | Level 3 – significant unobservable inputs (including a fund’s own assumptions in determining the fair value of investments) |
In cases where the inputs used to measure fair value fall in different levels of the fair value hierarchy, the level disclosed is determined based on the lowest level input that is significant to the fair value measurement in its entirety. The inputs or methodology used for valuing securities are not necessarily an indication of the risk associated with investing in those securities.
At February 29, 2016, the hierarchy of inputs used in valuing the Fund’s investments, which are carried at value, were as follows:
| | | | | | | | | | | | | | | | |
| Asset Description | | Level 1 | | | Level 2 | | | Level 3* | | | Total | |
| | | | |
Common Stocks | | | | | | | | | | | | | | | | |
Consumer Discretionary | | $ | 43,450,167 | | | $ | — | | | $ | — | | | $ | 43,450,167 | |
Consumer Staples | | | 101,967,342 | | | | — | | | | — | | | | 101,967,342 | |
Energy | | | 163,237,746 | | | | — | | | | — | | | | 163,237,746 | |
Financials | | | 370,218,989 | | | | 18,472,235 | | | | — | | | | 388,691,224 | |
Health Care | | | 196,103,896 | | | | — | | | | — | | | | 196,103,896 | |
Industrials | | | 165,825,505 | | | | — | | | | — | | | | 165,825,505 | |
Information Technology | | | 109,643,321 | | | | — | | | | — | | | | 109,643,321 | |
Materials | | | 27,763,572 | | | | — | | | | — | | | | 27,763,572 | |
Telecommunication Services | | | 30,756,787 | | | | — | | | | — | | | | 30,756,787 | |
Utilities | | | 87,568,998 | | | | — | | | | — | | | | 87,568,998 | |
| | | | |
Total Common Stocks | | $ | 1,296,536,323 | | | $ | 18,472,235 | ** | | $ | — | | | $ | 1,315,008,558 | |
| | | | |
Preferred Stocks | | | | | | | | | | | | | | | | |
Consumer Staples | | $ | — | | | $ | 25,193,256 | | | $ | — | | | $ | 25,193,256 | |
Energy | | | — | | | | 6,279,506 | | | | — | | | | 6,279,506 | |
Financials | | | 129,904,839 | | | | 127,947,679 | | | | 5,200,813 | | | | 263,053,331 | |
Industrials | | | — | | | | 16,561,348 | | | | — | | | | 16,561,348 | |
Utilities | | | 14,069,429 | | | | 21,414,075 | | | | — | | | | 35,483,504 | |
| | | | |
Total Preferred Stocks | | $ | 143,974,268 | | | $ | 197,395,864 | | | $ | 5,200,813 | | | $ | 346,570,945 | |
| | | | |
Corporate Bonds & Notes | | $ | — | | | $ | 174,862,010 | | | $ | — | | | $ | 174,862,010 | |
Exchange-Traded Funds | | | 38,410,052 | | | | — | | | | — | | | | 38,410,052 | |
Short-Term Investments | | | — | | | | 9,458,399 | | | | — | | | | 9,458,399 | |
| | | | |
Total Investments | | $ | 1,478,920,643 | | | $ | 400,188,508 | | | $ | 5,200,813 | | | $ | 1,884,309,964 | |
| * | None of the unobservable inputs for Level 3 assets, individually or collectively, had a material impact on the Fund. |
| ** | Includes foreign equity securities whose values were adjusted to reflect market trading of comparable securities or other correlated instruments that occurred after the close of trading in their applicable foreign markets. |
Level 3 investments at the beginning and/or end of the period in relation to net assets were not significant and accordingly, a reconciliation of Level 3 assets for the six months ended February 29, 2016 is not presented. At February 29, 2016, the value of investments transferred between Level 1 and Level 2 during the six months then ended was not significant.
Eaton Vance
Tax-Advantaged Dividend Income Fund
February 29, 2016
Officers and Trustees
Officers of Eaton Vance Tax-Advantaged Dividend Income Fund
Michael A. Allison
President
Maureen A. Gemma
Vice President, Secretary and
Chief Legal Officer
James F. Kirchner
Treasurer
Paul M. O’Neil
Chief Compliance Officer
Trustees of Eaton Vance Tax-Advantaged Dividend Income Fund
Ralph F. Verni
Chairperson
William H. Park
Vice-Chairperson
Scott E. Eston
Thomas E. Faust Jr.*
Cynthia E. Frost
George J. Gorman
Valerie A. Mosley
Helen Frame Peters
Susan J. Sutherland**
Harriett Tee Taggart
| ** | Ms. Sutherland began serving as a Trustee effective May 1, 2015. |
Number of Employees
The Fund is organized as a Massachusetts business trust and is registered under the Investment Company Act of 1940, as amended, as a closed-end management investment company and has no employees.
Number of Shareholders
As of February 29, 2016, the Fund records indicate that there are 66 registered shareholders and approximately 55,470 shareholders owning the Fund shares in street name, such as through brokers, banks, and financial intermediaries.
If you are a street name shareholder and wish to receive Fund reports directly, which contain important information about the Fund, please write or call:
Eaton Vance Distributors, Inc.
Two International Place
Boston, MA 02110
1-800-262-1122
New York Stock Exchange symbol
The New York Stock Exchange symbol is EVT.
Eaton Vance Funds
IMPORTANT NOTICES
Privacy. The Eaton Vance organization is committed to ensuring your financial privacy. Each of the financial institutions identified below has in effect the following policy (“Privacy Policy”) with respect to nonpublic personal information about its customers:
| • | | Only such information received from you, through application forms or otherwise, and information about your Eaton Vance fund transactions will be collected. This may include information such as name, address, social security number, tax status, account balances and transactions. |
| • | | None of such information about you (or former customers) will be disclosed to anyone, except as permitted by law (which includes disclosure to employees necessary to service your account). In the normal course of servicing a customer’s account, Eaton Vance may share information with unaffiliated third parties that perform various required services such as transfer agents, custodians and broker-dealers. |
| • | | Policies and procedures (including physical, electronic and procedural safeguards) are in place that are designed to protect the confidentiality of such information. |
| • | | We reserve the right to change our Privacy Policy at any time upon proper notification to you. Customers may want to review our Privacy Policy periodically for changes by accessing the link on our homepage: www.eatonvance.com. |
Our pledge of privacy applies to the following entities within the Eaton Vance organization: the Eaton Vance Family of Funds, Eaton Vance Management, Eaton Vance Investment Counsel, Eaton Vance Distributors, Inc., Eaton Vance Trust Company, Eaton Vance Management (International) Limited, Eaton Vance Management’s Real Estate Investment Group and Boston Management and Research. In addition, our Privacy Policy applies only to those Eaton Vance customers who are individuals and who have a direct relationship with us. If a customer’s account (i.e., fund shares) is held in the name of a third-party financial advisor/broker-dealer, it is likely that only such advisor’s privacy policies apply to the customer. This notice supersedes all previously issued privacy disclosures. For more information about Eaton Vance’s Privacy Policy, please call 1-800-262-1122.
Delivery of Shareholder Documents. The Securities and Exchange Commission (SEC) permits funds to deliver only one copy of shareholder documents, including prospectuses, proxy statements and shareholder reports, to fund investors with multiple accounts at the same residential or post office box address. This practice is often called “householding” and it helps eliminate duplicate mailings to shareholders. Eaton Vance, or your financial advisor, may household the mailing of your documents indefinitely unless you instruct Eaton Vance, or your financial advisor, otherwise. If you would prefer that your Eaton Vance documents not be householded, please contact Eaton Vance at 1-800-262-1122, or contact your financial advisor. Your instructions that householding not apply to delivery of your Eaton Vance documents will be effective within 30 days of receipt by Eaton Vance or your financial advisor.
Portfolio Holdings. Each Eaton Vance Fund and its underlying Portfolio(s) (if applicable) will file a schedule of portfolio holdings on Form N-Q with the SEC for the first and third quarters of each fiscal year. The Form N-Q will be available on the Eaton Vance website at www.eatonvance.com, by calling Eaton Vance at 1-800-262-1122 or in the EDGAR database on the SEC’s website at www.sec.gov. Form N-Q may also be reviewed and copied at the SEC’s public reference room in Washington, D.C. (call 1-800-732-0330 for information on the operation of the public reference room).
Proxy Voting. From time to time, funds are required to vote proxies related to the securities held by the funds. The Eaton Vance Funds or their underlying Portfolios (if applicable) vote proxies according to a set of policies and procedures approved by the Funds’ and Portfolios’ Boards. You may obtain a description of these policies and procedures and information on how the Funds or Portfolios voted proxies relating to portfolio securities during the most recent 12-month period ended June 30, without charge, upon request, by calling 1-800-262-1122 and by accessing the SEC’s website at www.sec.gov.
Share Repurchase Program. The Fund’s Board of Trustees has approved a share repurchase program authorizing the Fund to repurchase up to 10% of its outstanding common shares as of the approved date in open-market transactions at a discount to net asset value. The repurchase program does not obligate the Fund to purchase a specific amount of shares. The Fund’s repurchase activity, including the number of shares purchased, average price and average discount to net asset value, is disclosed in the Fund’s annual and semi-annual reports to shareholders.
Additional Notice to Shareholders. If applicable, a Fund may also redeem or purchase its outstanding preferred shares in order to maintain compliance with regulatory requirements, borrowing or rating agency requirements or for other purposes as it deems appropriate or necessary.
Closed-End Fund Information. Eaton Vance closed-end funds make fund performance data and certain information about portfolio characteristics available on the Eaton Vance website shortly after the end of each month. Other information about the funds is available on the website. The funds’ net asset value per share is readily accessible on the Eaton Vance website. Portfolio holdings for the most recent month-end are also posted to the website approximately 30 days following the end of the month. This information is available at www.eatonvance.com on the fund information pages under “Individual Investors — Closed-End Funds”.
Investment Adviser and Administrator
Eaton Vance Management
Two International Place
Boston, MA 02110
Custodian
State Street Bank and Trust Company
State Street Financial Center, One Lincoln Street
Boston, MA 02111
Transfer Agent
American Stock Transfer & Trust Company, LLC
6201 15th Avenue
Brooklyn, NY 11219
Fund Offices
Two International Place
Boston, MA 02110
Item 2. Code of Ethics
Not required in this filing.
Item 3. Audit Committee Financial Expert
Not required in this filing.
Item 4. Principal Accountant Fees and Services
Not required in this filing.
Item 5. Audit Committee of Listed Registrants
Not required in this filing.
Item 6. Schedule of Investments
Please see schedule of investments contained in the Report to Stockholders included under Item 1 of this Form N-CSR.
Item 7. Disclosure of Proxy Voting Policies and Procedures for Closed-End Management Investment Companies
Not required in this filing.
Item 8. Portfolio Managers of Closed-End Management Investment Companies
Not required in this filing.
Item 9. Purchases of Equity Securities by Closed-End Management Investment Company and Affiliated Purchasers
No such purchases this period.
Item 10. Submission of Matters to a Vote of Security Holders
No material changes.
Item 11. Controls and Procedures
(a) It is the conclusion of the registrant’s principal executive officer and principal financial officer that the effectiveness of the registrant’s current disclosure controls and procedures (such disclosure controls and procedures having been evaluated within 90 days of the date of this filing) provide reasonable assurance that the information required to be disclosed by the registrant has been recorded, processed, summarized and reported within the time period specified in the Commission’s rules and forms and that the information required to be disclosed by the registrant has been accumulated and communicated to the registrant’s principal executive officer and principal financial officer in order to allow timely decisions regarding required disclosure.
(b) There have been no changes in the registrant’s internal controls over financial reporting during the second fiscal quarter of the period covered by this report that has materially affected, or is reasonably likely to materially affect, the registrant’s internal control over financial reporting.
Item 12. Exhibits
| (a)(1) | Registrant’s Code of Ethics – Not applicable (please see Item 2). |
| (a)(2)(i) | Treasurer’s Section 302 certification. |
| (a)(2)(ii) | President’s Section 302 certification. |
| (b) | Combined Section 906 certification. |
| (c) | Registrant’s notices to shareholders pursuant to Registrant’s exemptive order granting an exemption from Section 19(b) of the 1940 Act and Rule 19b-1 thereunder regarding distributions paid pursuant to the Registrant’s Managed Distribution Plan. |
Signatures
Pursuant to the requirements of the Securities Exchange Act of 1934 and the Investment Company Act of 1940, the registrant has duly caused this report to be signed on its behalf by the undersigned, thereunto duly authorized.
Eaton Vance Tax-Advantaged Dividend Income Fund
| | |
| By: | | /s/ Michael A. Allison |
| | Michael A. Allison |
| | President |
| |
| Date: | | April 14, 2016 |
Pursuant to the requirements of the Securities Exchange Act of 1934 and the Investment Company Act of 1940, this report has been signed below by the following persons on behalf of the registrant and in the capacities and on the dates indicated.
| | |
| By: | | /s/ James F. Kirchner |
| | James F. Kirchner |
| | Treasurer |
| |
| Date: | | April 14, 2016 |
| |
| By: | | /s/ Michael A. Allison |
| | Michael A. Allison |
| | President |
| |
| Date: | | April 14, 2016 |