UNITED STATES
SECURITIES AND EXCHANGE COMMISSION
Washington, D.C. 20549
FormN-CSR
CERTIFIED SHAREHOLDER REPORT OF REGISTERED
MANAGEMENT INVESTMENT COMPANIES
Investment Company Act File Number:811-21400
Eaton VanceTax-Advantaged Dividend Income Fund
(Exact Name of Registrant as Specified in Charter)
Two International Place, Boston, Massachusetts 02110
(Address of Principal Executive Offices)
Maureen A. Gemma
Two International Place, Boston, Massachusetts 02110
(Name and Address of Agent for Services)
(617)482-8260
(Registrant’s Telephone Number)
October 31
Date of Fiscal Year End
April 30, 2019
Date of Reporting Period
Item 1. Reports to Stockholders

Eaton Vance
Tax-Advantaged Dividend Income Fund (EVT)
Semiannual Report
April 30, 2019
Important Note. Beginning on January 1, 2021, as permitted by regulations adopted by the Securities and Exchange Commission, paper copies of the Fund’s annual and semi-annual shareholder reports will no longer be sent by mail unless you specifically request paper copies of the reports. Instead, the reports will be made available on the Fund’s website (funds.eatonvance.com/closed-end-fund-and-term-trust-documents.php), and you will be notified by mail each time a report is posted and provided with a website address to access the report.
If you already elected to receive shareholder reports electronically, you will not be affected by this change and you need not take any action. If you hold shares at the Fund’s transfer agent, American Stock Transfer & Trust Company, LLC (“AST”), you may elect to receive shareholder reports and other communications from the Fund electronically by contacting AST. If you own your shares through a financial intermediary (such as a broker-dealer or bank), you must contact your financial intermediary to sign up.
You may elect to receive all future Fund shareholder reports in paper free of charge. If you hold shares at AST, you can inform AST that you wish to continue receiving paper copies of your shareholder reports by calling 1-866-439-6787. If you own these shares through a financial intermediary, you must contact your financial intermediary or follow instructions included with this disclosure, if applicable, to elect to continue to receive paper copies of your shareholder reports. Your election to receive reports in paper will apply to all funds held with AST or to all funds held through your financial intermediary, as applicable.

Commodity Futures Trading Commission Registration. Effective December 31, 2012, the Commodity Futures Trading Commission (“CFTC”) adopted certain regulatory changes that subject registered investment companies and advisers to regulation by the CFTC if a fund invests more than a prescribed level of its assets in certain CFTC-regulated instruments (including futures, certain options and swap agreements) or markets itself as providing investment exposure to such instruments. The Fund has claimed an exclusion from the definition of the term “commodity pool operator” under the Commodity Exchange Act. Accordingly, neither the Fund nor the adviser with respect to the operation of the Fund is subject to CFTC regulation. Because of its management of other strategies, the Fund’s adviser is registered with the CFTC as a commodity pool operator and a commodity trading advisor.
Managed Distribution Plan. Pursuant to an exemptive order issued by the Securities and Exchange Commission (Order), the Fund is authorized to distribute long-term capital gains to shareholders more frequently than once per year. Pursuant to the Order, the Fund’s Board of Trustees approved a Managed Distribution Plan (MDP) pursuant to which the Fund makes monthly cash distributions to common shareholders, stated in terms of a fixed amount per common share.
The Fund currently distributes monthly cash distributions equal to $0.1450 per share in accordance with the MDP. You should not draw any conclusions about the Fund’s investment performance from the amount of these distributions or from the terms of the MDP. The MDP will be subject to regular periodic review by the Fund’s Board of Trustees and the Board may amend or terminate the MDP at any time without prior notice to Fund shareholders. However, at this time there are no reasonably foreseeable circumstances that might cause the termination of the MDP.
The Fund may distribute more than its net investment income and net realized capital gains and, therefore, a distribution may include a return of capital. A return of capital distribution does not necessarily reflect the Fund’s investment performance and should not be confused with “yield” or “income.” With each distribution, the Fund will issue a notice to shareholders and a press release containing information about the amount and sources of the distribution and other related information. The amounts and sources of distributions contained in the notice and press release are only estimates and are not provided for tax purposes. The amounts and sources of the Fund’s distributions for tax purposes will be reported to shareholders on Form 1099-DIV for each calendar year.
Fund shares are not insured by the FDIC and are not deposits or other obligations of, or guaranteed by, any depository institution. Shares are subject to investment risks, including possible loss of principal invested.
Semiannual ReportApril 30, 2019
Eaton Vance
Tax-Advantaged Dividend Income Fund
Table of Contents
| | | | |
Performance | | | 2 | |
| |
Fund Profile | | | 3 | |
| |
Endnotes and Additional Disclosures | | | 4 | |
| |
Financial Statements | | | 5 | |
| |
Board of Trustees’ Contract Approval | | | 19 | |
| |
Officers and Trustees | | | 22 | |
| |
Important Notices | | | 23 | |
Eaton Vance
Tax-Advantaged Dividend Income Fund
April 30, 2019
Performance1,2
Portfolio ManagersEdward J. Perkin, CFA, Michael A. Allison, CFA, John H. Croft, CFA and Aaron S. Dunn, CFA
| | | | | | | | | | | | | | | | | | | | |
| % Average Annual Total Returns | | Inception Date | | | Six Months | | | One Year | | | Five Years | | | Ten Years | |
Fund at NAV | | | 09/30/2003 | | | | 10.52 | % | | | 12.93 | % | | | 9.93 | % | | | 15.60 | % |
Fund at Market Price | | | — | | | | 11.36 | | | | 14.62 | | | | 12.00 | | | | 17.77 | |
Russell 1000®Value Index | | | — | | | | 7.90 | % | | | 9.06 | % | | | 8.26 | % | | | 13.75 | % |
ICE BofAML Fixed Rate Preferred Securities Index | | | — | | | | 6.62 | | | | 6.87 | | | | 6.12 | | | | 10.21 | |
Blended Index | | | — | | | | 7.66 | | | | 8.57 | | | | 7.75 | | | | 12.85 | |
| | | | | |
| | | | | | | | | | | | | | | | | | | | |
| % Premium/Discount to NAV3 | | | | | | | | | | | | | | | |
| | | | | | | | | | | | | | | | | | | –1.33 | % |
| | | | | |
| | | | | | | | | | | | | | | | | | | | |
| Distributions4 | | | | | | | | | | | | | | | |
Total Distributions per share for the period | | | | | | | | | | | | | | | | | | $ | 0.870 | |
Distribution Rate at NAV | | | | | | | | | | | | | | | | | | | 7.23 | % |
Distribution Rate at Market Price | | | | | | | | | | | | | | | | | | | 7.33 | % |
| | | | | |
| | | | | | | | | | | | | | | | | | | | |
| % Total Leverage5 | | | | | | | | | | | | | | | |
Borrowings | | | | | | | | | | | | | | | | | | | 20.30 | % |
See Endnotes and Additional Disclosures in this report.
Past performance is no guarantee of future results. Returns are historical and are calculated by determining the percentage change in net asset value (NAV) or market price (as applicable) with all distributions reinvested and include management fees and other expenses. Fund performance at market price will differ from its results at NAV due to factors such as changing perceptions about the Fund, market conditions, fluctuations in supply and demand for Fund shares, or changes in Fund distributions. Investment return and principal value will fluctuate so that shares, when sold, may be worth more or less than their original cost. Performance less than or equal to one year is cumulative. Performance is for the stated time period only; due to market volatility, current Fund performance may be lower or higher than the quoted return. For performance as of the most recent month-end, please refer to eatonvance.com.
Eaton Vance
Tax-Advantaged Dividend Income Fund
April 30, 2019
Fund Profile
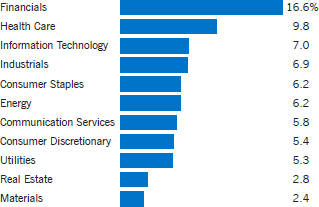
Common Stock Sector Allocation (% of total investments)
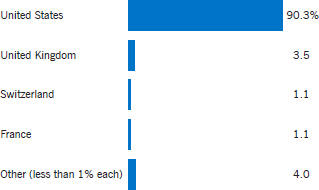
Country Allocation (% of total investments)7
Top 10 Holdings (% of total investments)6
| | | | |
| |
JPMorgan Chase & Co. | | | 3.5 | % |
| |
First Trust Preferred Securities and Income ETF | | | 2.8 | |
| |
Verizon Communications, Inc. | | | 2.6 | |
| |
Johnson & Johnson | | | 2.5 | |
| |
Procter & Gamble Co. (The) | | | 2.4 | |
| |
Bank of America Corp. | | | 2.2 | |
| |
Exxon Mobil Corp. | | | 2.2 | |
| |
Merck & Co., Inc. | | | 2.1 | |
| |
Walt Disney Co. (The) | | | 2.1 | |
| |
QUALCOMM, Inc. | | | 2.1 | |
| |
Total | | | 24.5 | % |
See Endnotes and Additional Disclosures in this report.
Eaton Vance
Tax-Advantaged Dividend Income Fund
April 30, 2019
Endnotes and Additional Disclosures
| 1 | Russell 1000®Value Index is an unmanaged index of U.S. large- cap value stocks. ICE BofAML Fixed Rate Preferred Securities Index is an unmanaged index of fixed-rate, preferred securities issued in the U.S. ICE®BofAML®indices are not for redistribution or other uses; provided “as is”, without warranties, and with no liability. Eaton Vance has prepared this report and ICE Data Indices, LLC does not endorse it, or guarantee, review, or endorse Eaton Vance’s products. BofAML®is a licensed registered trademark of Bank of America Corporation in the United States and other countries. The Blended Index consists of 70% Russell 1000®Value Index and 30% ICE BofAML Fixed Rate Preferred Securities Index. Unless otherwise stated, index returns do not reflect the effect of any applicable sales charges, commissions, expenses, taxes or leverage, as applicable. It is not possible to invest directly in an index. |
| 2 | Performance results reflect the effects of leverage. Performance since inception for an index, if presented, is the performance since the Fund’s or oldest share class’ inception, as applicable. |
| 3 | The shares of the Fund often trade at a discount or premium from their net asset value. The discount or premium of the Fund may vary over time and may be higher or lower than what is quoted in this report. Forup-to-date premium/discount information, please refer to http://eatonvance.com/closedend. |
| 4 | The Distribution Rate is based on the Fund’s last regular distribution per share in the period (annualized) divided by the Fund’s NAV or market price at the end of the period. The Fund’s distributions may be comprised of amounts characterized for federal income tax purposes as qualified andnon-qualified ordinary dividends, capital gains and nondividend distributions, also known as return of capital. For additional information about nondividend distributions, please refer to Eaton Vance Closed- End Fund Distribution Notices (19a) posted on our website, eatonvance.com. The Fund will determine the federal income tax character of distributions paid to a shareholder after the end of the calendar year. This is reported on the IRS form 1099- DIV and provided to the shareholder shortly after each year- end. For information about the tax character of distributions made in prior calendar years, please refer toPerformance-Tax Character of Distributions on the Fund’s webpage available at eatonvance.com. The Fund’s distributions are determined by the investment adviser based on its current assessment of the Fund’s long-term return potential. Fund distributions may be affected by numerous factors including changes in Fund performance, the cost of financing for leverage, portfolio holdings, realized and projected returns, and other factors. As portfolio and market conditions change, the rate of distributions paid by the Fund could change. |
| 5 | Total leverage is shown as a percentage of the Fund’s aggregate net assets plus borrowings outstanding. The Fund employs leverage through borrowings. Use of leverage creates an opportunity for income, but creates risks including greater price volatility. The cost of borrowings rises and falls with changes in short-term interest rates. The Fund may be required to maintain prescribed asset coverage for its leverage and may be required to reduce its leverage at an inopportune time. |
| 6 | Excludes cash and cash equivalents |
| 7 | The Fund may obtain exposure to certain market segments through investments in exchange-traded funds (ETFs). For purposes of the chart, the Fund’s investments in ETFs are included based on the portfolio composition of each ETF. |
| | Fund profile subject to change due to active management. |
Eaton Vance
Tax-Advantaged Dividend Income Fund
April 30, 2019
Portfolio of Investments (Unaudited)
| | | | | | | | |
| Common Stocks — 93.3%(1) | |
| Security | | Shares | | | Value | |
| | | | | | | | |
| | |
| Aerospace & Defense — 1.7% | | | | | | |
| | |
Hexcel Corp. | | | 174,134 | | | $ | 12,313,015 | |
| | |
Textron, Inc. | | | 322,514 | | | | 17,093,242 | |
| |
| | | | $ | 29,406,257 | |
| | |
| Banks — 13.8% | | | | | | |
| | |
Bank of America Corp. | | | 1,587,861 | | | $ | 48,556,789 | |
| | |
JPMorgan Chase & Co. | | | 654,322 | | | | 75,934,068 | |
| | |
KeyCorp | | | 921,361 | | | | 16,169,886 | |
| | |
PNC Financial Services Group, Inc. (The) | | | 275,028 | | | | 37,659,584 | |
| | |
Sterling Bancorp | | | 338,122 | | | | 7,242,573 | |
| | |
U.S. Bancorp | | | 549,267 | | | | 29,286,917 | |
| | |
Wells Fargo & Co. | | | 552,342 | | | | 26,738,876 | |
| |
| | | | $ | 241,588,693 | |
| | |
| Beverages — 1.9% | | | | | | |
| | |
Constellation Brands, Inc., Class A | | | 62,638 | | | $ | 13,258,585 | |
| | |
PepsiCo, Inc. | | | 155,879 | | | | 19,960,306 | |
| |
| | | | $ | 33,218,891 | |
| | |
| Biotechnology — 0.7% | | | | | | |
| | |
Gilead Sciences, Inc. | | | 199,299 | | | $ | 12,962,407 | |
| |
| | | | $ | 12,962,407 | |
| | |
| Building Products — 1.2% | | | | | | |
| | |
A.O. Smith Corp. | | | 399,974 | | | $ | 21,026,633 | |
| |
| | | | $ | 21,026,633 | |
| | |
| Capital Markets — 3.5% | | | | | | |
| | |
Charles Schwab Corp. (The) | | | 206,260 | | | $ | 9,442,583 | |
| | |
Northern Trust Corp. | | | 200,231 | | | | 19,732,765 | |
| | |
Raymond James Financial, Inc. | | | 183,850 | | | | 16,835,145 | |
| | |
S&P Global, Inc. | | | 67,384 | | | | 14,868,953 | |
| |
| | | | $ | 60,879,446 | |
| | |
| Chemicals — 1.6% | | | | | | |
| | |
Dow, Inc. | | | 158,455 | | | $ | 8,989,133 | |
| | |
DowDuPont, Inc. | | | 475,364 | | | | 18,277,746 | |
| |
| | | | $ | 27,266,879 | |
| | |
| Construction & Engineering — 0.8% | | | | | | |
| | |
Abengoa SA, Class A(2) | | | 571,132 | | | $ | 17,541 | |
| | |
Abengoa SA, Class B(2) | | | 5,905,644 | | | | 89,163 | |
| | |
Fluor Corp. | | | 346,798 | | | | 13,778,284 | |
| |
| | | | $ | 13,884,988 | |
| | | | | | | | |
| Security | | Shares | | | Value | |
| | | | | | | | |
|
| Consumer Finance — 1.8% | |
| | |
American Express Co. | | | 140,775 | | | $ | 16,503,053 | |
| | |
Discover Financial Services | | | 191,150 | | | | 15,576,814 | |
| |
| | | | $ | 32,079,867 | |
| | |
| Containers & Packaging — 1.5% | | | | | | |
| | |
Ball Corp. | | | 178,956 | | | $ | 10,726,622 | |
| | |
Packaging Corp. of America | | | 156,787 | | | | 15,546,999 | |
| |
| | | | $ | 26,273,621 | |
| | |
| Diversified Telecommunication Services — 3.2% | | | | | | |
| | |
Verizon Communications, Inc. | | | 984,348 | | | $ | 56,294,862 | |
| |
| | | | $ | 56,294,862 | |
| | |
| Electric Utilities — 3.8% | | | | | | |
| | |
Edison International | | | 382,863 | | | $ | 24,415,173 | |
| | |
NextEra Energy, Inc. | | | 220,083 | | | | 42,792,939 | |
| |
| | | | $ | 67,208,112 | |
|
| Electronic Equipment, Instruments & Components — 1.3% | |
| | |
FLIR Systems, Inc. | | | 433,250 | | | $ | 22,936,255 | |
| |
| | | | $ | 22,936,255 | |
| | |
| Entertainment — 2.6% | | | | | | |
| | |
Walt Disney Co. (The) | | | 331,002 | | | $ | 45,337,344 | |
| |
| | | | $ | 45,337,344 | |
|
| Equity Real Estate Investment Trusts (REITs) — 3.5% | |
| | |
AvalonBay Communities, Inc. | | | 143,012 | | | $ | 28,735,401 | |
| | |
Boston Properties, Inc. | | | 128,247 | | | | 17,649,352 | |
| | |
Mid-America Apartment Communities, Inc. | | | 142,284 | | | | 15,567,293 | |
| |
| | | | $ | 61,952,046 | |
| | |
| Food Products — 1.8% | | | | | | |
| | |
Mondelez International, Inc., Class A | | | 619,001 | | | $ | 31,476,201 | |
| |
| | | | $ | 31,476,201 | |
| | |
| Health Care Equipment & Supplies — 2.0% | | | | | | |
| | |
Abbott Laboratories | | | 191,593 | | | $ | 15,243,139 | |
| | |
Baxter International, Inc. | | | 259,092 | | | | 19,768,720 | |
| |
| | | | $ | 35,011,859 | |
| | |
| Health Care Providers & Services — 0.9% | | | | | | |
| | |
Anthem, Inc. | | | 57,857 | | | $ | 15,218,127 | |
| |
| | | | $ | 15,218,127 | |
| | | | |
| | 5 | | See Notes to Financial Statements. |
Eaton Vance
Tax-Advantaged Dividend Income Fund
April 30, 2019
Portfolio of Investments (Unaudited) — continued
| | | | | | | | |
| Security | | Shares | | | Value | |
| | | | | | | | |
|
| Hotels, Restaurants & Leisure — 1.0% | |
| | |
Marriott International, Inc., Class A | | | 98,626 | | | $ | 13,454,559 | |
| | |
Starbucks Corp. | | | 63,476 | | | | 4,930,816 | |
| |
| | | | $ | 18,385,375 | |
| | |
| Household Durables — 0.8% | | | | | | |
| | |
D.R. Horton, Inc. | | | 328,929 | | | $ | 14,574,844 | |
| |
| | | | $ | 14,574,844 | |
| | |
| Household Products — 3.0% | | | | | | |
| | |
Procter & Gamble Co. (The) | | | 489,556 | | | $ | 52,127,923 | |
| |
| | | | $ | 52,127,923 | |
| | |
| Insurance — 1.8% | | | | | | |
| | |
Allstate Corp. (The) | | | 165,388 | | | $ | 16,383,335 | |
| | |
Progressive Corp. (The) | | | 186,815 | | | | 14,599,592 | |
| |
| | | | $ | 30,982,927 | |
| | |
| Interactive Media & Services — 1.0% | | | | | | |
| | |
Alphabet, Inc., Class C(2) | | | 14,422 | | | $ | 17,140,259 | |
| |
| | | | $ | 17,140,259 | |
| | |
| IT Services — 2.3% | | | | | | |
| | |
Fidelity National Information Services, Inc. | | | 187,294 | | | $ | 21,712,994 | |
| | |
Leidos Holdings, Inc. | | | 256,240 | | | | 18,828,515 | |
| |
| | | | $ | 40,541,509 | |
| | |
| Machinery — 3.7% | | | | | | |
| | |
Gardner Denver Holdings, Inc.(2) | | | 716,218 | | | $ | 24,172,358 | |
| | |
Parker-Hannifin Corp. | | | 128,837 | | | | 23,329,804 | |
| | |
Stanley Black & Decker, Inc. | | | 119,374 | | | | 17,500,228 | |
| |
| | | | $ | 65,002,390 | |
| | |
| Media — 0.5% | | | | | | |
| | |
Fox Corp., Class A(2) | | | 214,267 | | | $ | 8,354,270 | |
| |
| | | | $ | 8,354,270 | |
| | |
| Multi-Utilities — 2.8% | | | | | | |
| | |
CMS Energy Corp. | | | 473,945 | | | $ | 26,327,645 | |
| | |
Sempra Energy | | | 176,700 | | | | 22,608,765 | |
| |
| | | | $ | 48,936,410 | |
| | |
| Oil, Gas & Consumable Fuels — 7.8% | | | | | | |
| | |
ConocoPhillips | | | 473,127 | | | $ | 29,863,776 | |
| | |
EOG Resources, Inc. | | | 235,593 | | | | 22,628,708 | |
| | | | | | | | |
| Security | | Shares | | | Value | |
| | | | | | | | |
| | |
| Oil, Gas & Consumable Fuels (continued) | | | | | | |
| | |
Exxon Mobil Corp. | | | 601,611 | | | $ | 48,297,331 | |
| | |
Phillips 66 | | | 272,657 | | | | 25,703,375 | |
| | |
Pioneer Natural Resources Co. | | | 59,710 | | | | 9,939,327 | |
| |
| | | | $ | 136,432,517 | |
| | |
| Personal Products — 1.2% | | | | | | |
| | |
Estee Lauder Cos., Inc. (The), Class A | | | 118,857 | | | $ | 20,420,821 | |
| |
| | | | $ | 20,420,821 | |
| | |
| Pharmaceuticals — 8.6% | | | | | | |
| | |
Bristol-Myers Squibb Co. | | | 176,256 | | | $ | 8,183,566 | |
| | |
GlaxoSmithKline PLC ADR | | | 602,913 | | | | 24,797,812 | |
| | |
Johnson & Johnson | | | 382,570 | | | | 54,018,884 | |
| | |
Merck & Co., Inc. | | | 585,182 | | | | 46,059,675 | |
| | |
Zoetis, Inc. | | | 181,489 | | | | 18,482,840 | |
| |
| | | | $ | 151,542,777 | |
| | |
| Road & Rail — 1.2% | | | | | | |
| | |
CSX Corp. | | | 272,102 | | | $ | 21,667,482 | |
| |
| | | | $ | 21,667,482 | |
|
| Semiconductors & Semiconductor Equipment — 4.2% | |
| | |
Intel Corp. | | | 262,267 | | | $ | 13,386,108 | |
| | |
NXP Semiconductors NV | | | 137,295 | | | | 14,501,098 | |
| | |
QUALCOMM, Inc. | | | 524,181 | | | | 45,147,709 | |
| |
| | | | $ | 73,034,915 | |
| | |
| Specialty Retail — 3.8% | | | | | | |
| | |
Best Buy Co., Inc. | | | 53,180 | | | $ | 3,957,124 | |
| | |
Home Depot, Inc. (The) | | | 45,380 | | | | 9,243,906 | |
| | |
Tiffany & Co. | | | 201,814 | | | | 21,759,585 | |
| | |
TJX Cos., Inc. (The) | | | 299,440 | | | | 16,433,267 | |
| | |
Tractor Supply Co. | | | 150,166 | | | | 15,542,181 | |
| |
| | | | $ | 66,936,063 | |
|
| Technology Hardware, Storage & Peripherals — 1.0% | |
| | |
Apple, Inc. | | | 89,355 | | | $ | 17,930,868 | |
| |
| | | | $ | 17,930,868 | |
| | | | |
| | 6 | | See Notes to Financial Statements. |
Eaton Vance
Tax-Advantaged Dividend Income Fund
April 30, 2019
Portfolio of Investments (Unaudited) — continued
| | | | | | | | |
| Security | | Shares | | | Value | |
| | | | | | | | |
| | |
| Textiles, Apparel & Luxury Goods — 1.0% | | | | | | |
| | |
Lululemon Athletica, Inc.(2) | | | 48,824 | | | $ | 8,610,112 | |
| | |
Tapestry, Inc. | | | 294,717 | | | | 9,510,518 | |
| |
| | | | $ | 18,120,630 | |
| |
Total Common Stocks
(identified cost $1,280,797,666) | | | $ | 1,636,154,468 | |
|
| Preferred Stocks — 6.7% | |
| Security | | Shares | | | Value | |
| | |
| Banks — 2.1% | | | | | | |
| | |
AgriBank FCB, 6.875% to 1/1/24(1)(3) | | | 92,513 | | | $ | 9,898,891 | |
| | |
CoBank ACB, Series F, 6.25% to 10/1/22(1)(3) | | | 78,033 | | | | 8,105,678 | |
| | |
Farm Credit Bank of Texas, 6.75% to 9/15/23(1)(3)(4) | | | 13,800 | | | | 1,462,800 | |
| | |
First Tennessee Bank NA, 3.75%, (3 mo. USD LIBOR + 0.85%, Floor 3.75%)(1)(4)(5) | | | 4,660 | | | | 3,401,800 | |
| | |
IBERIABANK Corp., Series C, 6.60% to 5/1/26(1)(3) | | | 168,770 | | | | 4,484,219 | |
| | |
Texas Capital Bancshares, Inc., 6.50%(1) | | | 128,965 | | | | 3,447,234 | |
| | |
Wells Fargo & Co., Series Y, 5.625%(1) | | | 269,075 | | | | 6,893,702 | |
| |
| | | | $ | 37,694,324 | |
| | |
| Electric Utilities — 0.7% | | | | | | |
| | |
Duke Energy Corp., Series A, 5.75% | | | 331,300 | | | $ | 8,620,426 | |
| | |
NextEra Energy Capital Holdings, Inc., Series I, 5.125%(1) | | | 168,192 | | | | 4,139,205 | |
| |
| | | | $ | 12,759,631 | |
|
| Equity Real Estate Investment Trusts (REITs) — 0.9% | |
| | |
CBL & Associates Properties, Inc., Series D, 7.375%(1) | | | 491,900 | | | $ | 3,831,901 | |
| | |
SITE Centers Corp., Series A, 6.375%(1) | | | 250,625 | | | | 6,383,419 | |
| | |
SITE Centers Corp., Series K, 6.25%(1) | | | 41,325 | | | | 1,057,920 | |
| | |
Vornado Realty Trust, Series K, 5.70%(1) | | | 146,527 | | | | 3,701,272 | |
| |
| | | | $ | 14,974,512 | |
| | |
| Food Products — 0.8% | | | | | | |
| | |
Dairy Farmers of America, Inc., 7.875%(1)(4) | | | 94,450 | | | $ | 9,465,023 | |
| | |
Ocean Spray Cranberries, Inc., 6.25%(1)(4) | | | 57,835 | | | | 5,118,398 | |
| |
| | | | $ | 14,583,421 | |
|
| Independent Power and Renewable Electricity Producers — 0.6% | |
| | |
Algonquin Power & Utilities Corp., 6.875% to 10/17/23(3) | | | 418,123 | | | $ | 11,197,334 | |
| |
| | | | $ | 11,197,334 | |
| | | | | | | | |
| Security | | Shares | | | Value | |
| | | | | | | | |
| | |
| Multi-Utilities — 0.1% | | | | | | |
| | |
DTE Energy Co., Series C, 5.25%(1) | | | 59,547 | | | $ | 1,505,348 | |
| |
| | | | $ | 1,505,348 | |
| | |
| Oil, Gas & Consumable Fuels — 0.9% | | | | | | |
| | |
NuStar Energy, L.P., Series B, 7.625% to 6/15/22(1)(3) | | | 733,275 | | | $ | 15,134,796 | |
| |
| | | | $ | 15,134,796 | |
| | |
| Pipelines — 0.3% | | | | | | |
| | |
Enbridge, Inc., Series B, 6.375% to 4/15/23(3) | | | 69,550 | | | $ | 1,838,206 | |
| | |
Energy Transfer Operating, L.P., Series E,
7.60% to 5/15/24(3) | | | 108,840 | | | | 2,706,851 | |
| |
| | | | $ | 4,545,057 | |
| | |
| Real Estate Management & Development — 0.3% | | | | | | |
| | |
Brookfield Property Partners, L.P., Series A, 6.50% | | | 185,075 | | | $ | 4,645,382 | |
| |
| | | | $ | 4,645,382 | |
| |
Total Preferred Stocks
(identified cost $122,940,257) | | | $ | 117,039,805 | |
|
| Corporate Bonds & Notes — 21.4% | |
| Security | | Principal Amount (000’s omitted) | | | Value | |
| | |
| Automobiles — 0.7% | | | | | | |
| | |
General Motors Financial Co., Inc., Series A,
5.75% to 9/30/27(1)(3)(6) | | $ | 13,662 | | | $ | 12,797,400 | |
| |
| | | | $ | 12,797,400 | |
| | |
| Banks — 10.6% | | | | | | |
| | |
Banco Bilbao Vizcaya Argentaria SA,
6.125% to 11/16/27(1)(3)(6) | | $ | 6,100 | | | $ | 5,564,054 | |
| | |
Bank of America Corp., Series DD, 6.30% to 3/10/26(3)(6) | | | 2,610 | | | | 2,853,709 | |
| | |
Bank of America Corp., Series FF, 5.
875% to 3/15/28(1)(3)(6) | | | 12,410 | | | | 12,834,608 | |
| | |
Barclays PLC, 7.75% to 9/15/23(3)(6) | | | 13,725 | | | | 14,197,003 | |
| | |
Citigroup, Inc., 5.95% to
1/30/23(3)(6) | | | 3,850 | | | | 3,998,764 | |
| | |
Citigroup, Inc., Series M, 6.30% to
5/15/24(1)(3)(6) | | | 3,755 | | | | 3,907,603 | |
| | |
Citigroup, Inc., Series T, 6.25% to 8/15/26(1)(3)(6) | | | 4,686 | | | | 5,023,978 | |
| | |
Credit Agricole SA, 6.875% to 9/23/24(3)(4)(6) | | | 11,175 | | | | 11,656,754 | |
| | |
Credit Suisse Group AG, 7.50% to
7/17/23(3)(4)(6) | | | 10,607 | | | | 11,130,880 | |
| | |
Danske Bank A/S, 7.00% to 6/26/25(3)(6)(7) | | | 8,305 | | | | 8,031,616 | |
| | |
Farm Credit Bank of Texas, Series 3,
6.20% to 6/15/28(3)(4)(6) | | | 5,827 | | | | 5,907,070 | |
| | | | |
| | 7 | | See Notes to Financial Statements. |
Eaton Vance
Tax-Advantaged Dividend Income Fund
April 30, 2019
Portfolio of Investments (Unaudited) — continued
| | | | | | | | |
| Security | | Principal Amount (000’s omitted) | | | Value | |
| | | | | | | | |
| | |
| Banks (continued) | | | | | | |
| | |
HSBC Holdings PLC, 6.375% to 9/17/24(3)(6) | | $ | 10,805 | | | $ | 11,095,546 | |
| | |
ING Groep NV, 6.50% to 4/16/25(3)(6) | | | 4,900 | | | | 4,959,780 | |
| | |
JPMorgan Chase & Co., Series X, 6.10% to 10/1/24(1)(3)(6) | | | 25,858 | | | | 27,490,286 | |
| | |
Lloyds Banking Group PLC, 7.50% to 6/27/24(1)(3)(6) | | | 11,145 | | | | 11,730,112 | |
| | |
Royal Bank of Scotland Group PLC, 8.00% to 8/10/25(1)(3)(6) | | | 8,348 | | | | 9,109,755 | |
| | |
Societe Generale SA, 6.75% to 4/6/28(1)(3)(4)(6) | | | 7,980 | | | | 7,747,702 | |
| | |
Societe Generale SA, 7.375% to 10/4/23(3)(4)(6) | | | 5,320 | | | | 5,416,505 | |
| | |
SunTrust Banks, Inc., Series G, 5.05% to 6/15/22(3)(6) | | | 5,520 | | | | 5,467,367 | |
| | |
SunTrust Banks, Inc., Series H, 5.125% to 12/15/27(1)(3)(6) | | | 3,890 | | | | 3,767,037 | |
| | |
UniCredit SpA, 8.00% to 6/3/24(1)(3)(6)(7) | | | 12,790 | | | | 12,358,849 | |
| | |
Zions Bancorporation, Series I, 5.80% to 6/15/23(1)(3)(6) | | | 1,243 | | | | 1,212,721 | |
| |
| | | | $ | 185,461,699 | |
| | |
| Capital Markets — 1.8% | | | | | | |
| | |
Charles Schwab Corp. (The), Series F, 5.00% to 12/1/27(1)(3)(6) | | $ | 18,690 | | | $ | 18,161,353 | |
| | |
UBS Group AG, 6.875% to 8/7/25(1)(3)(6)(7) | | | 13,656 | | | | 14,142,741 | |
| |
| | | | $ | 32,304,094 | |
| | |
| Construction & Engineering — 0.0%(8) | | | | | | |
| | |
Abengoa Abenewco 2 SAU, 1.50%, (0.00% Cash and 1.50% PIK), 4/26/24(1)(4) | | $ | 2,472 | | | $ | 29,145 | |
| |
| | | | $ | 29,145 | |
| | |
| Diversified Financial Services — 1.6% | | | | | | |
| | |
Cadence Financial Corp., 4.875%, 6/28/19(1)(4) | | $ | 7,086 | | | $ | 7,085,756 | |
| | |
Credito Real SAB de CV, 9.50%, 2/7/26(4) | | | 8,135 | | | | 8,800,036 | |
| | |
Textron Financial Corp., 4.419%, (3 mo. USD LIBOR + 1.735%), 2/15/67(1)(4)(5) | | | 3,129 | | | | 2,540,795 | |
| | |
Unifin Financiera SAB de CV, 7.375%, 2/12/26(4) | | | 5,490 | | | | 5,222,363 | |
| | |
Unifin Financiera SAB de CV, 8.875% to 1/29/25(1)(3)(4)(6) | | | 4,072 | | | | 3,695,340 | |
| |
| | | | $ | 27,344,290 | |
| | |
| Electric Utilities — 1.3% | | | | | | |
| | |
AES Gener SA, 7.125% to 4/6/24, 3/26/79(3)(4) | | $ | 6,130 | | | $ | 6,427,305 | |
| | |
Pacific Gas & Electric Co., 4.25%, 3/15/46(9) | | | 10,885 | | | | 9,823,713 | |
| | |
Southern Co. (The), Series B,
5.50% to 3/15/22, 3/15/57(1)(3) | | | 5,910 | | | | 6,030,905 | |
| |
| | | | $ | 22,281,923 | |
| | |
| Food Products — 0.7% | | | | | | |
| | |
Land O’ Lakes, Inc., 8.00%(1)(4)(6) | | $ | 12,295 | | | $ | 12,694,588 | |
| |
| | | | $ | 12,694,588 | |
| | | | | | | | |
| Security | | Principal Amount (000’s omitted) | | | Value | |
| | | | | | | | |
| | |
| Gas Utilities — 0.3% | | | | | | |
| | |
NiSource, Inc., 5.65% to 6/15/23(3)(6) | | $ | 5,750 | | | $ | 5,775,070 | |
| |
| | | | $ | 5,775,070 | |
| | |
| Insurance — 0.7% | | | | | | |
| | |
Principal Financial Group, Inc.,
4.70% to 5/15/20, 5/15/55(3) | | $ | 5,785 | | | $ | 5,713,757 | |
| | |
Voya Financial, Inc., 5.65% to 5/15/23, 5/15/53(3) | | | 4,320 | | | | 4,338,209 | |
| | |
Voya Financial, Inc., Series A, 6.125% to 9/15/23(3)(6) | | | 1,556 | | | | 1,619,236 | |
| |
| | | | $ | 11,671,202 | |
| | |
| Multi-Utilities — 0.9% | | | | | | |
| | |
Centerpoint Energy, Inc., Series A, 6.125% to 9/1/23(3)(6) | | $ | 11,713 | | | $ | 11,968,812 | |
| | |
Dominion Resources, Inc.,
5.75% to 10/1/24, 10/1/54(1)(3) | | | 4,430 | | | | 4,602,393 | |
| |
| | | | $ | 16,571,205 | |
| | |
| Oil, Gas & Consumable Fuels — 1.6% | | | | | | |
| | |
EnLink Midstream Partners, L.P., Series C, 6.00% to 12/15/22(1)(3)(6) | | $ | 8,752 | | | $ | 7,581,420 | |
| | |
Enterprise Products Operating, LLC, Series E,
5.25% to 8/16/27, 8/16/77(3) | | | 10,985 | | | | 10,519,621 | |
| | |
Plains All American Pipeline, L.P., Series B, 6.125% to 11/15/22(1)(3)(6) | | | 10,360 | | | | 9,937,467 | |
| |
| | | | $ | 28,038,508 | |
| | |
| Pipelines — 0.7% | | | | | | |
| | |
Energy Transfer Operating, L.P., Series A, 6.25% to 2/15/23(1)(3)(6) | | $ | 13,384 | | | $ | 12,758,766 | |
| |
| | | | $ | 12,758,766 | |
| | |
| Transportation — 0.2% | | | | | | |
| | |
JSL Europe SA, 7.75%, 7/26/24(1)(4) | | $ | 2,755 | | | $ | 2,762,604 | |
| |
| | | | $ | 2,762,604 | |
| | |
| Wireless Telecommunication Services — 0.3% | | | | | | |
| | |
Vodafone Group PLC, 7.00% to 1/4/29, 4/4/79(3) | | $ | 5,165 | | | $ | 5,435,670 | |
| |
| | | | $ | 5,435,670 | |
| | |
Total Corporate Bonds & Notes
(identified cost $373,530,888) | | | | | | $ | 375,926,164 | |
| | | | |
| | 8 | | See Notes to Financial Statements. |
Eaton Vance
Tax-Advantaged Dividend Income Fund
April 30, 2019
Portfolio of Investments (Unaudited) — continued
| | | | | | | | |
| Exchange-Traded Funds — 3.5% | | | | | | | | |
| Security | | Shares | | | Value | |
| | | | | | | | |
| | |
| Equity Funds — 3.5% | | | | | | |
| | |
First Trust Preferred Securities and Income ETF(1) | | | 3,217,015 | | | $ | 61,959,709 | |
| |
Total Exchange-Traded Funds
(identified cost $63,722,769) | | | $ | 61,959,709 | |
| | |
| Short-Term Investments — 0.5% | | | | | | | | |
| Description | | Units | | | Value | |
| | |
Eaton Vance Cash Reserves Fund, LLC,
2.54%(10) | | | 8,118,464 | | | $ | 8,118,464 | |
| |
Total Short-Term Investments
(identified cost $8,118,220) | | | $ | 8,118,464 | |
| |
Total Investments — 125.4%
(identified cost $1,849,109,800) | | | $ | 2,199,198,610 | |
| |
Other Assets, Less Liabilities — (25.4)% | | | $ | (444,767,496 | ) |
| |
Net Assets — 100.0% | | | $ | 1,754,431,114 | |
The percentage shown for each investment category in the Portfolio of Investments is based on net assets.
| | (1) | Security (or a portion thereof) has been segregated as collateral with the custodian for borrowings under the Credit Agreement. |
| | (2) | Non-income producing security. |
| | (3) | Security converts to floating rate after the indicated fixed-rate coupon period. |
| | (4) | Security exempt from registration pursuant to Rule 144A under the Securities Act of 1933, as amended. These securities may be sold in certain transactions in reliance on an exemption from registration (normally to qualified institutional buyers). At April 30, 2019, the aggregate value of these securities is $110,564,864 or 6.3% of the Fund’s net assets. |
| | (5) | Variable rate security. The stated dividend/interest rate represents the rate in effect at April 30, 2019. |
| | (6) | Perpetual security with no stated maturity date but may be subject to calls by the issuer. |
| | (7) | Security exempt from registration under Regulation S of the Securities Act of 1933, which exempts from registration securities offered and sold outside the United States. Security may not be offered or sold in the United States except pursuant to an exemption from, or in a transaction not subject to, the registration requirements of the Securities Act of 1933. At April 30, 2019, the aggregate value of these securities is $34,533,206 or 2.0% of the Fund’s net assets. |
| | (8) | Amount is less than 0.05%. |
| | (9) | Issuer is in default with respect to interest and/or principal payments. |
| (10) | Affiliated investment company, available to Eaton Vance portfolios and funds, which invests in high quality, U.S. dollar denominated money market instruments. The rate shown is the annualized seven-day yield as of April 30, 2019. |
| | | | | | | | |
| Country Concentration of Portfolio | |
| Country | | Percentage of
Total Investments | | | Value | |
| | |
United States | | | 87.5 | % | | $ | 1,925,283,987 | |
| | |
United Kingdom | | | 3.5 | | | | 76,365,898 | |
| | |
Switzerland | | | 1.1 | | | | 25,273,621 | |
| | |
France | | | 1.1 | | | | 24,820,961 | |
| | |
Netherlands | | | 0.9 | | | | 19,460,878 | |
| | |
Mexico | | | 0.8 | | | | 17,717,739 | |
| | |
Canada | | | 0.6 | | | | 13,035,540 | |
| | |
Italy | | | 0.6 | | | | 12,358,849 | |
| | |
Denmark | | | 0.4 | | | | 8,031,616 | |
| | |
Chile | | | 0.3 | | | | 6,427,305 | |
| | |
Spain | | | 0.3 | | | | 5,699,903 | |
| | |
Brazil | | | 0.1 | | | | 2,762,604 | |
| | |
Exchange-Traded Funds | | | 2.8 | | | | 61,959,709 | |
| | |
Total Investments | | | 100.0 | % | | $ | 2,199,198,610 | |
Abbreviations:
| | | | |
| | |
| ADR | | – | | American Depositary Receipt |
| | |
| LIBOR | | – | | London Interbank Offered Rate |
| | |
| PIK | | – | | Payment In Kind |
| | |
| USD | | – | | United States Dollar |
| | | | |
| | 9 | | See Notes to Financial Statements. |
Eaton Vance
Tax-Advantaged Dividend Income Fund
April 30, 2019
Statement of Assets and Liabilities (Unaudited)
| | | | |
| Assets | | April 30, 2019 | |
| |
Unaffiliated investments, at value (identified cost, $1,840,991,580) | | $ | 2,191,080,146 | |
| |
Affiliated investment, at value (identified cost, $8,118,220) | | | 8,118,464 | |
| |
Cash | | | 65,795 | |
| |
Dividends and interest receivable | | | 7,099,193 | |
| |
Dividends receivable from affiliated investment | | | 31,945 | |
| |
Receivable for investments sold | | | 4,290,384 | |
| |
Receivable from the transfer agent | | | 388,021 | |
| |
Tax reclaims receivable | | | 499,006 | |
| |
Total assets | | $ | 2,211,572,954 | |
| |
| Liabilities | | | | |
| |
Notes payable | | $ | 447,000,000 | |
| |
Payable for investments purchased | | | 8,189,365 | |
| |
Payable to affiliate: | | | | |
| |
Investment adviser fee | | | 1,500,830 | |
| |
Trustees’ fees | | | 9,042 | |
| |
Accrued expenses | | | 442,603 | |
| |
Total liabilities | | $ | 457,141,840 | |
| |
Net Assets | | $ | 1,754,431,114 | |
| |
| Sources of Net Assets | | | | |
| |
Common shares, $0.01 par value, unlimited number of shares authorized, 72,941,403 shares issued and outstanding | | $ | 729,414 | |
| |
Additional paid-in capital | | | 1,384,698,427 | |
| |
Distributable earnings | | | 369,003,273 | |
| |
Net Assets | | $ | 1,754,431,114 | |
| |
| Net Asset Value | | | | |
| |
($1,754,431,114 ÷ 72,941,403 common shares issued and outstanding) | | $ | 24.05 | |
| | | | |
| | 10 | | See Notes to Financial Statements. |
Eaton Vance
Tax-Advantaged Dividend Income Fund
April 30, 2019
Statement of Operations (Unaudited)
| | | | |
| Investment Income | | Six Months Ended April 30, 2019 | |
| |
Dividends (net of foreign taxes, $22,778) | | $ | 24,484,977 | |
| |
Interest (net of foreign taxes, $2,030) | | | 12,394,322 | |
| |
Dividends from affiliated investment | | | 177,303 | |
| |
Total investment income | | $ | 37,056,602 | |
| |
| Expenses | | | | |
| |
Investment adviser fee | | $ | 8,689,208 | |
| |
Trustees’ fees and expenses | | | 63,292 | |
| |
Custodian fee | | | 293,088 | |
| |
Transfer and dividend disbursing agent fees | | | 9,509 | |
| |
Legal and accounting services | | | 87,841 | |
| |
Printing and postage | | | 201,576 | |
| |
Interest expense and fees | | | 6,952,093 | |
| |
Miscellaneous | | | 43,793 | |
| |
Total expenses | | $ | 16,340,400 | |
| |
Net investment income | | $ | 20,716,202 | |
| |
| Realized and Unrealized Gain (Loss) | | | | |
| |
Net realized gain (loss) — | | | | |
| |
Investment transactions | | $ | 52,290,228 | |
| |
Investment transactions — affiliated investment | | | 2,893 | |
| |
Proceeds from securities litigation settlements | | | 610,409 | |
| |
Foreign currency transactions | | | (61,953 | ) |
| |
Net realized gain | | $ | 52,841,577 | |
| |
Change in unrealized appreciation (depreciation) — | | | | |
| |
Investments | | $ | 92,928,537 | |
| |
Investments — affiliated investment | | | 244 | |
| |
Foreign currency | | | 49,513 | |
| |
Net change in unrealized appreciation (depreciation) | | $ | 92,978,294 | |
| |
Net realized and unrealized gain | | $ | 145,819,871 | |
| |
Net increase in net assets from operations | | $ | 166,536,073 | |
| | | | |
| | 11 | | See Notes to Financial Statements. |
Eaton Vance
Tax-Advantaged Dividend Income Fund
April 30, 2019
Statements of Changes in Net Assets
| | | | | | | | | | | | |
| Increase (Decrease) in Net Assets | | Six Months Ended April 30, 2019
(Unaudited) | | | Period Ended October 31, 2018(1) | | | Year Ended August 31, 2018 | |
| | | |
From operations — | | | | | | | | | | | | |
| | | |
Net investment income | | $ | 20,716,202 | | | $ | 5,431,856 | | | $ | 40,954,528 | |
| | | |
Net realized gain | | | 52,841,577 | | | | 5,444,346 | | | | 105,548,903 | |
| | | |
Net change in unrealized appreciation (depreciation) | | | 92,978,294 | | | | (106,939,412 | ) | | | 128,683,487 | |
| | | |
Net increase (decrease) in net assets from operations | | $ | 166,536,073 | | | $ | (96,063,210 | ) | | $ | 275,186,918 | |
| | | |
Distributions to shareholders(2) | | $ | (63,441,738 | ) | | $ | (21,138,955 | ) | | $ | (126,741,357 | ) |
| | | |
Capital share transactions — | | | | | | | | | | | | |
| | | |
Reinvestment of distributions to shareholders | | $ | 882,629 | | | $ | 505,983 | | | $ | 1,099,555 | |
| | | |
Net increase in net assets from capital share transactions | | $ | 882,629 | | | $ | 505,983 | | | $ | 1,099,555 | |
| | | |
Net increase (decrease) in net assets | | $ | 103,976,964 | | | $ | (116,696,182 | ) | | $ | 149,545,116 | |
|
| Net Assets | |
| | | |
At beginning of period | | $ | 1,650,454,150 | | | $ | 1,767,150,332 | | | $ | 1,617,605,216 | |
| | | |
At end of period | | $ | 1,754,431,114 | | | $ | 1,650,454,150 | | | $ | 1,767,150,332 | (3) |
| (1) | For the two months ended October 31, 2018. |
| (2) | For the year ended August 31, 2018, the source of distributions was as follows: |
Net investment income — $(34,189,693)
Net realized gain — $(92,551,664)
The presentation of distributions for the six months ended April 30, 2019 and two months ended October 31, 2018 conforms with the Disclosure Update and Simplification Rule issued by the Securities and Exchange Commission, effective November 5, 2018.
| (3) | Includes accumulated undistributed net investment income of $19,846,767 at August 31, 2018. The requirement to disclose the corresponding amounts as of April 30, 2019 and October 31, 2018 was eliminated. |
| | | | |
| | 12 | | See Notes to Financial Statements. |
Eaton Vance
Tax-Advantaged Dividend Income Fund
April 30, 2019
Statement of Cash Flows (Unaudited)
| | | | |
| Cash Flows From Operating Activities | | Six Months Ended April 30, 2019 | |
| |
Net increase in net assets from operations | | $ | 166,536,073 | |
| |
Adjustments to reconcile net increase in net assets from operations to net cash provided by operating activities: | | | | |
| |
Investments purchased | | | (648,545,834 | ) |
| |
Investments sold | | | 699,437,392 | |
| |
Decrease (increase) in short-term investments, net | | | (8,115,327 | ) |
| |
Net amortization/accretion of premium (discount) | | | 93,696 | |
| |
Increase in dividends and interest receivable | | | (722,011 | ) |
| |
Increase in dividends receivable from affiliated investment | | | (31,945 | ) |
| |
Increase in receivable from the transfer agent | | | (388,021 | ) |
| |
Decrease in tax reclaims receivable | | | 485,073 | |
| |
Decrease in payable to affiliate for investment adviser fee | | | (35,179 | ) |
| |
Increase in payable to affiliate for Trustees’ fees | | | 9,042 | |
| |
Decrease in accrued expenses | | | (8,408 | ) |
| |
Net change in unrealized (appreciation) depreciation from investments | | | (92,928,781 | ) |
| |
Net realized gain from investments | | | (52,293,121 | ) |
| |
Net cash provided by operating activities | | $ | 63,492,649 | |
|
| Cash Flows From Financing Activities | |
| |
Cash distributions paid | | $ | (62,559,109 | ) |
| |
Decrease in due to custodian | | | (1,060,919 | ) |
| |
Net cash used in financing activities | | $ | (63,620,028 | ) |
| |
Net increase (decrease) in cash* | | $ | (127,379 | ) |
| |
Cash at beginning of period(1) | | $ | 193,174 | |
| |
Cash at end of period | | $ | 65,795 | |
|
| Supplemental disclosure of cash flow information: | |
| |
Noncash financing activities not included herein consist of: | | | | |
| |
Reinvestment of dividends and distributions | | $ | 882,629 | |
| |
Cash paid for interest and fees on borrowings | | $ | 6,910,695 | |
| (1) | Balance includes foreign currency, at value. |
| * | Includes net change in unrealized appreciation (depreciation) on foreign currency of $315. |
| | | | |
| | 13 | | See Notes to Financial Statements. |
Eaton Vance
Tax-Advantaged Dividend Income Fund
April 30, 2019
Financial Highlights
| | | | | | | | | | | | | | | | | | | | | | | | | | | | |
| | | |
| | | Six Months Ended
April 30, 2019
(Unaudited) | | | Period Ended
October 31, 2018(1) | | | Year Ended August 31, | |
| | | 2018 | | | 2017 | | | 2016 | | | 2015 | | | 2014 | |
| | | | | | | | |
Net asset value — Beginning of period | | $ | 22.640 | | | $ | 24.250 | | | $ | 22.210 | | | $ | 21.610 | | | $ | 21.220 | | | $ | 22.940 | | | $ | 19.500 | |
| | | | | | | |
| Income (Loss) From Operations | | | | | | | | | | | | | | | | | | | | | | | | | | | | |
| | | | | | | |
Net investment income(2) | | $ | 0.284 | | | $ | 0.075 | | | $ | 0.562 | | | $ | 0.824 | | | $ | 0.743 | | | $ | 0.808 | | | $ | 1.429 | (3) |
| | | | | | | |
Net realized and unrealized gain (loss) | | | 1.996 | | | | (1.395 | ) | | | 3.218 | | | | 1.516 | | | | 1.387 | | | | (1.080 | ) | | | 3.334 | |
| | | | | | | |
Total income (loss) from operations | | $ | 2.280 | | | $ | (1.320 | ) | | $ | 3.780 | | | $ | 2.340 | | | $ | 2.130 | | | $ | (0.272 | ) | | $ | 4.763 | |
| | | | | | | |
| Less Distributions | | | | | | | | | | | | | | | | | | | | | | | | | | | | |
| | | | | | | |
From net investment income | | $ | (0.870 | )* | | $ | (0.214 | ) | | $ | (0.469 | ) | | $ | (0.863 | ) | | $ | (0.733 | ) | | $ | (1.085 | ) | | $ | (1.323 | ) |
| | | | | | | |
From net realized gain | | | — | | | | (0.076 | ) | | | (1.271 | ) | | | (0.877 | ) | | | (1.007 | ) | | | (0.363 | ) | | | — | |
| | | | | | | |
Total distributions | | $ | (0.870 | ) | | $ | (0.290 | ) | | $ | (1.740 | ) | | $ | (1.740 | ) | | $ | (1.740 | ) | | $ | (1.448 | ) | | $ | (1.323 | ) |
| | | | | | | |
Net asset value — End of period | | $ | 24.050 | | | $ | 22.640 | | | $ | 24.250 | | | $ | 22.210 | | | $ | 21.610 | | | $ | 21.220 | | | $ | 22.940 | |
| | | | | | | |
Market value — End of period | | $ | 23.730 | | | $ | 22.170 | | | $ | 24.370 | | | $ | 21.730 | | | $ | 20.880 | | | $ | 19.290 | | | $ | 20.560 | |
| | | | | | | |
Total Investment Return on Net Asset Value(4) | | | 10.52 | %(5) | | | (5.48 | )%(5) | | | 17.79 | % | | | 11.57 | % | | | 11.25 | % | | | (0.67 | )% | | | 25.90 | % |
| | | | | | | |
Total Investment Return on Market Value(4) | | | 11.36 | %(5) | | | (7.90 | )%(5) | | | 20.98 | % | | | 12.97 | % | | | 18.24 | % | | | 0.76 | % | | | 24.80 | % |
| | | | | |
| Ratios/Supplemental Data | | | | | | | | | | | | | | | | | | | | | |
| | | | | | | |
Net assets, end of period (000’s omitted) | | $ | 1,754,431 | | | $ | 1,650,454 | | | $ | 1,767,150 | | | $ | 1,617,605 | | | $ | 1,573,697 | | | $ | 1,545,306 | | | $ | 1,671,173 | |
| | | | | | | |
Ratios (as a percentage of average daily net assets): | | | | | | | | | | | | | | | | | | | | | | | | | | | | |
| | | | | | | |
Expenses excluding interest and fees(6) | | | 1.16 | %(7) | | | 1.14 | %(7) | | | 1.14 | % | | | 1.16 | % | | | 1.18 | % | | | 1.14 | % | | | 1.15 | % |
| | | | | | | |
Interest and fee expense | | | 0.86 | %(7) | | | 0.74 | %(7) | | | 0.61 | % | | | 0.46 | % | | | 0.29 | % | | | 0.21 | % | | | 0.22 | % |
| | | | | | | |
Total expenses(6) | | | 2.02 | %(7) | | | 1.88 | %(7) | | | 1.75 | % | | | 1.62 | % | | | 1.47 | % | | | 1.35 | % | | | 1.37 | % |
| | | | | | | |
Net investment income | | | 2.56 | %(7) | | | 1.88 | %(7) | | | 2.41 | % | | | 3.75 | % | | | 3.53 | % | | | 3.57 | % | | | 6.63 | %(3) |
| | | | | | | |
Portfolio Turnover | | | 32 | %(5) | | | 4 | %(5) | | | 58 | % | | | 85 | % | | | 91 | % | | | 99 | % | | | 68 | % |
| | | | | | | |
Senior Securities: | | | | | | | | | | | | | | | | | | | | | | | | | | | | |
| | | | | | | |
Total notes payable outstanding (in 000’s) | | $ | 447,000 | | | $ | 447,000 | | | $ | 447,000 | | | $ | 447,000 | | | $ | 447,000 | | | $ | 447,000 | | | $ | 447,000 | |
| | | | | | | |
Asset coverage per $1,000 of notes payable(8) | | $ | 4,925 | | | $ | 4,692 | | | $ | 4,953 | | | $ | 4,619 | | | $ | 4,521 | | | $ | 4,457 | | | $ | 4,739 | |
| (1) | For the two months ended October 31, 2018. Effective September 1, 2018, the fiscal year-end of the Fund changed from August 31 to October 31. |
| (2) | Computed using average shares outstanding. |
| (3) | Net investment income per share includes special dividends which amounted to $0.501 per share. Excluding special dividends, the ratio of net investment income to average daily net assets would have been 4.30%. |
| (4) | Returns are historical and are calculated by determining the percentage change in net asset value or market value with all distributions reinvested. Distributions are assumed to be reinvested at prices obtained under the Fund’s dividend reinvestment plan. |
| (6) | Excludes the effect of custody fee credits, if any, of less than 0.005%. Effective September 1, 2015, custody fee credits, which were earned on cash deposit balances, were discontinued by the custodian. |
| (8) | Calculated by subtracting the Fund’s total liabilities (not including the notes payable) from the Fund’s total assets, and dividing the result by the notes payable balance in thousands. |
| * | A portion of the distributions may be deemed from net realized gain or a tax return of capital at year-end. |
| | | | |
| | 14 | | See Notes to Financial Statements. |
Eaton Vance
Tax-Advantaged Dividend Income Fund
April 30, 2019
Notes to Financial Statements (Unaudited)
1 Significant Accounting Policies
Eaton Vance Tax-Advantaged Dividend Income Fund (the Fund) is a Massachusetts business trust registered under the Investment Company Act of 1940, as amended (the 1940 Act), as a diversified, closed-end management investment company. The Fund’s investment objective is to provide a high level of after-tax total return consisting primarily of tax-advantaged dividend income and capital appreciation. The Fund pursues its objective by investing primarily in dividend-paying common and preferred stocks.
The following is a summary of significant accounting policies of the Fund. The policies are in conformity with accounting principles generally accepted in the United States of America (U.S. GAAP). The Fund is an investment company and follows accounting and reporting guidance in the Financial Accounting Standards Board (FASB) Accounting Standards Codification Topic 946.
A Investment Valuation — The following methodologies are used to determine the market value or fair value of investments.
Equity Securities.Equity securities listed on a U.S. securities exchange generally are valued at the last sale or closing price on the day of valuation or, if no sales took place on such date, at the mean between the closing bid and ask prices on the exchange where such securities are principally traded. Equity securities listed on the NASDAQ Global or Global Select Market generally are valued at the NASDAQ official closing price. Unlisted or listed securities for which closing sales prices or closing quotations are not available are valued at the mean between the latest available bid and ask prices or, in the case of preferred equity securities that are not listed or traded in the over-the-counter market, by a third party pricing service that uses various techniques that consider factors including, but not limited to, prices or yields of securities with similar characteristics, benchmark yields, broker/dealer quotes, quotes of underlying common stock, issuer spreads, as well as industry and economic events.
Debt Obligations. Debt obligations are generally valued on the basis of valuations provided by third party pricing services, as derived from such services’ pricing models. Inputs to the models may include, but are not limited to, reported trades, executable bid and ask prices, broker/dealer quotations, prices or yields of securities with similar characteristics, interest rates, anticipated prepayments, benchmark curves or information pertaining to the issuer, as well as industry and economic events. The pricing services may use a matrix approach, which considers information regarding securities with similar characteristics to determine the valuation for a security. Short-term debt obligations purchased with a remaining maturity of sixty days or less for which a valuation from a third party pricing service is not readily available may be valued at amortized cost, which approximates fair value.
Foreign Securities and Currencies.Foreign securities and currencies are valued in U.S. dollars, based on foreign currency exchange rate quotations supplied by a third party pricing service. The pricing service uses a proprietary model to determine the exchange rate. Inputs to the model include reported trades and implied bid/ask spreads. The daily valuation of exchange-traded foreign securities generally is determined as of the close of trading on the principal exchange on which such securities trade. Events occurring after the close of trading on foreign exchanges may result in adjustments to the valuation of foreign securities to more accurately reflect their fair value as of the close of regular trading on the New York Stock Exchange. When valuing foreign equity securities that meet certain criteria, the Fund’s Trustees have approved the use of a fair value service that values such securities to reflect market trading that occurs after the close of the applicable foreign markets of comparable securities or other instruments that have a strong correlation to the fair-valued securities.
Affiliated Fund.The Fund may invest in Eaton Vance Cash Reserves Fund, LLC (Cash Reserves Fund), an affiliated investment company managed by Eaton Vance Management (EVM). While Cash Reserves Fund is not a registered money market mutual fund, it conducts all of its investment activities in accordance with the requirements of Rule 2a-7 under the 1940 Act. Investments in Cash Reserves Fund are valued at the closing net asset value per unit on the valuation day. Cash Reserves Fund generally values its investment securities based on available market quotations provided by a third party pricing service.
Fair Valuation.Investments for which valuations or market quotations are not readily available or are deemed unreliable are valued at fair value using methods determined in good faith by or at the direction of the Trustees of the Fund in a manner that most fairly reflects the security’s “fair value”, which is the amount that the Fund might reasonably expect to receive for the security upon its current sale in the ordinary course. Each such determination is based on a consideration of relevant factors, which are likely to vary from one pricing context to another. These factors may include, but are not limited to, the type of security, the existence of any contractual restrictions on the security’s disposition, the price and extent of public trading in similar securities of the issuer or of comparable companies or entities, quotations or relevant information obtained from broker/dealers or other market participants, information obtained from the issuer, analysts, and/or the appropriate stock exchange (for exchange-traded securities), an analysis of the company’s or entity’s financial statements, and an evaluation of the forces that influence the issuer and the market(s) in which the security is purchased and sold.
B Investment Transactions — Investment transactions for financial statement purposes are accounted for on a trade date basis. Realized gains and losses on investments sold are determined on the basis of identified cost.
C Income — Dividend income is recorded on the ex-dividend date for dividends received in cash and/or securities. However, if the ex-dividend date has passed, certain dividends from foreign securities are recorded as the Fund is informed of the ex-dividend date. Withholding taxes on foreign dividends, interest and capital gains have been provided for in accordance with the Fund’s understanding of the applicable countries’ tax rules and rates. In consideration of recent decisions rendered by European courts, the Fund has filed additional tax reclaims for previously withheld taxes on dividends earned in certain European Union countries. These filings are subject to various administrative and judicial proceedings within these countries. Due to the uncertainty as to the ultimate resolution of these proceedings, the likelihood of receipt of these reclaims, and the potential timing of payment, no income
Eaton Vance
Tax-Advantaged Dividend Income Fund
April 30, 2019
Notes to Financial Statements (Unaudited) — continued
was recorded in the financial statements for such outstanding reclaims during the six months ended April 30, 2019. Interest income is recorded on the basis of interest accrued, adjusted for amortization of premium or accretion of discount. Distributions from investment companies are recorded as dividend income, capital gains or return of capital based on the nature of the distribution.
D Federal Taxes — The Fund’s policy is to comply with the provisions of the Internal Revenue Code applicable to regulated investment companies and to distribute to shareholders each year substantially all of its net investment income, and all or substantially all of its net realized capital gains. Accordingly, no provision for federal income or excise tax is necessary.
As of April 30, 2019, the Fund had no uncertain tax positions that would require financial statement recognition, de-recognition, or disclosure. The Fund files a U.S. federal income tax return annually after its fiscal year-end, which is subject to examination by the Internal Revenue Service for a period of three years from the date of filing.
E Foreign Currency Translation — Investment valuations, other assets, and liabilities initially expressed in foreign currencies are translated each business day into U.S. dollars based upon current exchange rates. Purchases and sales of foreign investment securities and income and expenses denominated in foreign currencies are translated into U.S. dollars based upon currency exchange rates in effect on the respective dates of such transactions. Recognized gains or losses on investment transactions attributable to changes in foreign currency exchange rates are recorded for financial statement purposes as net realized gains and losses on investments. That portion of unrealized gains and losses on investments that results from fluctuations in foreign currency exchange rates is not separately disclosed.
F Use of Estimates — The preparation of the financial statements in conformity with U.S. GAAP requires management to make estimates and assumptions that affect the reported amounts of assets and liabilities at the date of the financial statements and the reported amounts of income and expense during the reporting period. Actual results could differ from those estimates.
G Indemnifications — Under the Fund’s organizational documents, its officers and Trustees may be indemnified against certain liabilities and expenses arising out of the performance of their duties to the Fund. Under Massachusetts law, if certain conditions prevail, shareholders of a Massachusetts business trust (such as the Fund) could be deemed to have personal liability for the obligations of the Fund. However, the Fund’s Declaration of Trust contains an express disclaimer of liability on the part of Fund shareholders and the By-laws provide that the Fund shall assume the defense on behalf of any Fund shareholders. Moreover, the By-laws also provide for indemnification out of Fund property of any shareholder held personally liable solely by reason of being or having been a shareholder for all loss or expense arising from such liability. Additionally, in the normal course of business, the Fund enters into agreements with service providers that may contain indemnification clauses. The Fund’s maximum exposure under these arrangements is unknown as this would involve future claims that may be made against the Fund that have not yet occurred.
H Interim Financial Statements — The interim financial statements relating to April 30, 2019 and for the six months then ended have not been audited by an independent registered public accounting firm, but in the opinion of the Fund’s management, reflect all adjustments, consisting only of normal recurring adjustments, necessary for the fair presentation of the financial statements.
2 Distributions to Shareholders and Income Tax Information
Subject to its Managed Distribution Plan, the Fund intends to make monthly distributions from its net investment income, net capital gain (which is the excess of net long-term capital gain over net short-term capital loss) and other sources. The Fund intends to distribute all or substantially all of its net realized capital gains. Distributions are recorded on the ex-dividend date. Distributions to shareholders are determined in accordance with income tax regulations, which may differ from U.S. GAAP. As required by U.S. GAAP, only distributions in excess of tax basis earnings and profits are reported in the financial statements as a return of capital. Permanent differences between book and tax accounting relating to distributions are reclassified to paid-in capital. For tax purposes, distributions from short-term capital gains are considered to be from ordinary income. Distributions in any year may include a return of capital component.
The cost and unrealized appreciation (depreciation) of investments of the Fund at April 30, 2019, as determined on a federal income tax basis, were as follows:
| | | | |
| |
Aggregate cost | | $ | 1,848,093,478 | |
| |
Gross unrealized appreciation | | $ | 381,901,031 | |
| |
Gross unrealized depreciation | | | (30,795,899 | ) |
| |
Net unrealized appreciation | | $ | 351,105,132 | |
Eaton Vance
Tax-Advantaged Dividend Income Fund
April 30, 2019
Notes to Financial Statements (Unaudited) — continued
3 Investment Adviser Fee and Other Transactions with Affiliates
The investment adviser fee is earned by EVM as compensation for management and investment advisory services rendered to the Fund. Pursuant to the investment advisory agreement and subsequent fee reduction agreement, the fee is computed at an annual rate of 0.85% of the Fund’s average daily gross assets up to and including $1.5 billion, 0.83% over $1.5 billion up to and including $3 billion, and at reduced rates as daily gross assets exceed $3 billion, and is payable monthly. Gross assets as referred to herein represent net assets plus obligations attributable to investment leverage. The fee reduction cannot be terminated without the consent of a majority of Trustees and a majority of shareholders. For the six months ended April 30, 2019, the Fund’s investment adviser fee amounted to $8,689,208 or 0.84% (annualized) of the Fund’s average daily gross assets. The Fund invests its cash in Cash Reserves Fund. EVM does not currently receive a fee for advisory services provided to Cash Reserves Fund. EVM also serves as administrator of the Fund, but receives no compensation.
Trustees and officers of the Fund who are members of EVM’s organization receive remuneration for their services to the Fund out of the investment adviser fee. Trustees of the Fund who are not affiliated with EVM may elect to defer receipt of all or a percentage of their annual fees in accordance with the terms of the Trustees Deferred Compensation Plan. For the six months ended April 30, 2019, no significant amounts have been deferred. Certain officers and Trustees of the Fund are officers of EVM.
4 Purchases and Sales of Investments
Purchases and sales of investments, other than short-term obligations, aggregated $656,735,199 and $703,727,776, respectively, for the six months ended April 30, 2019.
5 Common Shares of Beneficial Interest
Common shares issued by the Fund pursuant to its dividend reinvestment plan for the six months ended April 30, 2019, the period ended October 31, 2018 and the year ended August 31, 2018 were 37,983, 20,943 and 46,577, respectively.
In November 2013, the Board of Trustees initially approved a share repurchase program for the Fund. Pursuant to the reauthorization of the share repurchase program by the Board of Trustees in March 2019, the Fund is authorized to repurchase up to 10% of its common shares outstanding as of the last day of the prior calendar year at market prices when shares are trading at a discount to net asset value. The share repurchase program does not obligate the Fund to purchase a specific amount of shares. There were no repurchases of common shares by the Fund for the six months ended April 30, 2019, the two months ended October 31, 2018 and the year ended August 31, 2018.
6 Credit Agreement
The Fund has entered into a Credit Agreement (the Agreement) with a major financial institution that allows it to borrow up to $524 million over a rolling 179 calendar day period through August 30, 2019. Interest is charged at a rate above 1-month LIBOR and is payable monthly. The Fund is charged a commitment fee of 0.30% per annum on the unused portion of the commitment if outstanding borrowings are less than 80% of the borrowing limit. Under the terms of the Agreement, the Fund is required to satisfy certain collateral requirements and maintain a certain level of net assets. At April 30, 2019, the Fund had borrowings outstanding under the Agreement of $447 million at an interest rate of 3.15%. The carrying amount of the borrowings at April 30, 2019 approximated its fair value. If measured at fair value, borrowings under the Agreement would have been considered as Level 2 in the fair value hierarchy (see Note 8) at April 30, 2019. For the six months ended April 30, 2019, the average borrowings under the Agreement were $447 million and the average annual interest rate (excluding fees) was 3.14%.
7 Risks Associated with Foreign Investments
Investing in securities issued by companies whose principal business activities are outside the United States may involve significant risks not present in domestic investments. For example, there is generally less publicly available information about foreign companies, particularly those not subject to the disclosure and reporting requirements of the U.S. securities laws. Certain foreign issuers are generally not bound by uniform accounting, auditing, and financial reporting requirements and standards of practice comparable to those applicable to domestic issuers. Investments in foreign securities also involve the risk of possible adverse changes in investment or exchange control regulations, expropriation or confiscatory taxation, limitation on the removal of funds or other assets of the Fund, political or financial instability or diplomatic and other developments which could affect such investments. Foreign securities markets, while growing in volume and sophistication, are generally not as developed as those in the United States, and securities of some foreign issuers (particularly those located in developing countries) may be less liquid and more volatile than securities of comparable U.S. companies. In general, there is less overall governmental supervision and regulation of foreign securities markets, broker/dealers and issuers than in the United States.
Eaton Vance
Tax-Advantaged Dividend Income Fund
April 30, 2019
Notes to Financial Statements (Unaudited) — continued
8 Fair Value Measurements
Under generally accepted accounting principles for fair value measurements, a three-tier hierarchy to prioritize the assumptions, referred to as inputs, is used in valuation techniques to measure fair value. The three-tier hierarchy of inputs is summarized in the three broad levels listed below.
| • | | Level 1 – quoted prices in active markets for identical investments |
| • | | Level 2 – other significant observable inputs (including quoted prices for similar investments, interest rates, prepayment speeds, credit risk, etc.) |
| • | | Level 3 – significant unobservable inputs (including a fund’s own assumptions in determining the fair value of investments) |
In cases where the inputs used to measure fair value fall in different levels of the fair value hierarchy, the level disclosed is determined based on the lowest level input that is significant to the fair value measurement in its entirety. The inputs or methodology used for valuing securities are not necessarily an indication of the risk associated with investing in those securities.
At April 30, 2019, the hierarchy of inputs used in valuing the Fund’s investments, which are carried at value, were as follows:
| | | | | | | | | | | | | | | | |
| Asset Description | | Level 1 | | | Level 2 | | | Level 3 | | | Total | |
| | | | |
Common Stocks | | | | | | | | | | | | | | | | |
| | | | |
Communication Services | | $ | 127,126,735 | | | $ | — | | | $ | — | | | $ | 127,126,735 | |
| | | | |
Consumer Discretionary | | | 118,016,912 | | | | — | | | | — | | | | 118,016,912 | |
| | | | |
Consumer Staples | | | 137,243,836 | | | | — | | | | — | | | | 137,243,836 | |
| | | | |
Energy | | | 136,432,517 | | | | — | | | | — | | | | 136,432,517 | |
| | | | |
Financials | | | 365,530,933 | | | | — | | | | — | | | | 365,530,933 | |
| | | | |
Health Care | | | 214,735,170 | | | | — | | | | — | | | | 214,735,170 | |
| | | | |
Industrials | | | 150,881,046 | | | | 106,704 | | | | — | | | | 150,987,750 | |
| | | | |
Information Technology | | | 154,443,547 | | | | — | | | | — | | | | 154,443,547 | |
| | | | |
Materials | | | 53,540,500 | | | | — | | | | — | | | | 53,540,500 | |
| | | | |
Real Estate | | | 61,952,046 | | | | — | | | | — | | | | 61,952,046 | |
| | | | |
Utilities | | | 116,144,522 | | | | — | | | | — | | | | 116,144,522 | |
| | | | |
Total Common Stocks | | $ | 1,636,047,764 | | | $ | 106,704 | * | | $ | — | | | $ | 1,636,154,468 | |
| | | | |
Preferred Stocks | | | | | | | | | | | | | | | | |
| | | | |
Consumer Staples | | $ | — | | | $ | 14,583,421 | | | $ | — | | | $ | 14,583,421 | |
| | | | |
Energy | | | 19,679,853 | | | | — | | | | — | | | | 19,679,853 | |
| | | | |
Financials | | | 14,825,155 | | | | 22,869,169 | | | | — | | | | 37,694,324 | |
| | | | |
Real Estate | | | 19,619,894 | | | | — | | | | — | | | | 19,619,894 | |
| | | | |
Utilities | | | 25,462,313 | | | | — | | | | — | | | | 25,462,313 | |
| | | | |
Total Preferred Stocks | | $ | 79,587,215 | | | $ | 37,452,590 | | | $ | — | | | $ | 117,039,805 | |
| | | | |
Corporate Bonds & Notes | | $ | — | | | $ | 375,926,164 | | | $ | — | | | $ | 375,926,164 | |
| | | | |
Exchange-Traded Funds | | | 61,959,709 | | | | — | | | | — | | | | 61,959,709 | |
| | | | |
Short-Term Investments | | | — | | | | 8,118,464 | | | | — | | | | 8,118,464 | |
| | | | |
Total Investments | | $ | 1,777,594,688 | | | $ | 421,603,922 | | | $ | — | | | $ | 2,199,198,610 | |
| * | Includes foreign equity securities whose values were adjusted to reflect market trading of comparable securities or other correlated instruments that occurred after the close of trading in their applicable foreign markets. |
Eaton Vance
Tax-Advantaged Dividend Income Fund
April 30, 2019
Board of Trustees’ Contract Approval
Overview of the Contract Review Process
The Investment Company Act of 1940, as amended (the “1940 Act”), provides, in substance, that the investment advisory agreement between a fund and its investment adviser will continue in effect fromyear-to-year only if its continuation is approved on an annual basis by a vote of the fund’s board of trustees, including a majority of the trustees who are not “interested persons” of the fund (“independent trustees”), cast in person at a meeting called for the purpose of considering such approval.
At a meeting held on April 24, 2019, the Boards of Trustees/Directors (collectively, the “Board”) of the registered investment companies advised by Eaton Vance Management or its affiliate, Boston Management and Research (the “Eaton Vance Funds”), including a majority of the independent trustees (the “Independent Trustees”), voted to approve the continuation of existing investment advisory andsub-advisory agreements for each of the Eaton Vance Funds for an additionalone-year period. In voting its approval, the Board relied upon the affirmative recommendation of its Contract Review Committee, which is a committee exclusively comprised of Independent Trustees. Prior to making its recommendation, the Contract Review Committee reviewed information furnished by the adviser andsub-adviser (where applicable) to each of the Eaton Vance Funds (including information specifically requested by the Board) for a series of meetings held between February and April 2019. Members of the Contract Review Committee also considered information received at prior meetings of the Board and its committees, to the extent such information was relevant to the Contract Review Committee’s annual evaluation of the investment advisory andsub-advisory agreements.
Among other things, the information the Board considered included the following (for funds that invest through one or more underlying portfolios, references to “each fund” in this section may include information that was considered at the portfolio-level):
Information about Fees, Performance and Expenses
| • | | A report from an independent data provider comparing advisory and related fees paid by each fund to such fees paid by comparable funds, as identified by the independent data provider (“comparable funds”); |
| • | | A report from an independent data provider comparing each fund’s total expense ratio (and its components) to those of comparable funds; |
| • | | A report from an independent data provider comparing the investment performance of each fund (including, where relevant, yield data, Sharpe ratios and information ratios) to the investment performance of comparable funds over various time periods; |
| • | | Data regarding investment performance relative to benchmark indices and, in certain instances, to customized groups of peer funds and blended indices identified by the adviser in consultation with the Portfolio Management Committee of the Board; |
| • | | Comparative information concerning the fees charged and services provided by the adviser andsub-adviser (where applicable) to each fund in managing other accounts (including mutual funds, other collective investment funds and institutional accounts) using investment strategies and techniques similar to those used in managing such fund(s), if any; |
| • | | Profitability analyses with respect to the adviser andsub-adviser (where applicable) to each of the funds; |
Information about Portfolio Management and Trading
| • | | Descriptions of the investment management services provided to each fund, as well as each of the funds’ investment strategies and policies; |
| • | | The procedures and processes used to determine the fair value of fund assets, when necessary, and actions taken to monitor and test the effectiveness of such procedures and processes; |
| • | | Information about the policies and practices of each fund’s adviser andsub-adviser (where applicable and in the context of asub-adviser with trading responsibilities) with respect to trading, including their processes for seeking best execution of portfolio transactions; |
| • | | Information about the allocation of brokerage transactions and the benefits, if any, received by the adviser andsub-adviser (where applicable and in the context of asub-adviser with trading responsibilities) to each fund as a result of brokerage allocation, including information concerning the acquisition of research through client commission arrangements and policies with respect to “soft dollars”; |
| • | | Data relating to the portfolio turnover rate of each fund; |
Information about each Adviser andSub-adviser
| • | | Reports detailing the financial results and condition of the adviser andsub-adviser (where applicable) to each fund; |
| • | | Information regarding the individual investment professionals whose responsibilities include portfolio management and investment research for the funds, and, for portfolio managers and certain other investment professionals, information relating to their responsibilities with respect to managing other mutual funds and investment accounts, if applicable; |
| • | | The Code of Ethics of the adviser and its affiliates and thesub-adviser (where applicable) of each fund, together with information relating to compliance with, and the administration of, such codes; |
| • | | Policies and procedures relating to proxy voting and the handling of corporate actions and class actions; |
| • | | Information concerning the resources devoted to compliance efforts undertaken by the adviser and its affiliates and thesub-adviser (where applicable) of each fund, if any, including descriptions of their various compliance programs and their record of compliance; |
| • | | Information concerning the business continuity and disaster recovery plans of the adviser and its affiliates and thesub-adviser (where applicable) of each fund, if any; |
Eaton Vance
Tax-Advantaged Dividend Income Fund
April 30, 2019
Board of Trustees’ Contract Approval — continued
| • | | A description of Eaton Vance Management’s and Boston Management and Research’s oversight ofsub-advisers, including with respect to regulatory and compliance issues, investment management and other matters; |
Other Relevant Information
| • | | Information concerning the nature, cost and character of the administrative and othernon-investment advisory services provided by Eaton Vance Management and its affiliates; |
| • | | Information concerning management of the relationship with the custodian, subcustodians and fund accountants by the adviser or administrator to each of the funds; and |
| • | | The terms of each investment advisory agreement. |
During the various meetings of the Board and its committees throughout the twelve months ended April 2019, the Trustees received information from portfolio managers and other investment professionals of the advisers andsub-advisers (where applicable) of the funds regarding investment and performance matters, and considered various investment and trading strategies used in pursuing the funds’ investment objectives. The Trustees also received information regarding risk management techniques employed in connection with the management of the funds. The Board and its Committees evaluated issues pertaining to industry and regulatory developments, compliance procedures, fund governance and other issues with respect to the funds, and received and participated in reports and presentations provided by Eaton Vance Management, Boston Management and Research and fundsub-advisers (as applicable), with respect to such matters. In addition to the formal meetings of the Board and its committees, the Independent Trustees held regular teleconferences to discuss, among other topics, matters relating to the continuation of investment advisory andsub-advisory agreements.
The Contract Review Committee was advised throughout the contract review process by Goodwin Procter LLP, independent legal counsel for the Independent Trustees. The members of the Contract Review Committee, with the advice of such counsel, exercised their own business judgment in determining the material factors to be considered in evaluating each investment advisory andsub-advisory agreement and the weight to be given to each such factor. The conclusions reached with respect to each investment advisory andsub-advisory agreement were based on a comprehensive evaluation of all the information provided and not any single factor. Moreover, each member of the Contract Review Committee may have placed varying emphasis on particular factors in reaching conclusions with respect to each investment advisory andsub-advisory agreement. In evaluating each investment advisory andsub-advisory agreement, including the fee structures and other terms contained in such agreements, the members of the Contract Review Committee were also informed by multiple years of analysis and discussion with the adviser andsub-adviser (where applicable) to each of the Eaton Vance Funds.
Results of the Process
Based on its consideration of the foregoing, and such other information as it deemed relevant, including the factors and conclusions described below, the Contract Review Committee concluded that the continuation of the investment advisory agreement between Eaton VanceTax-Advantaged Dividend Income Fund (the “Fund”) and Eaton Vance Management (the “Adviser”), including its fee structure, is in the interests of shareholders and, therefore, recommended to the Board approval of the agreement. Based on the recommendation of the Contract Review Committee, the Board, including a majority of the Independent Trustees, voted to approve continuation of the investment advisory agreement for the Fund.
Nature, Extent and Quality of Services
In considering whether to approve the investment advisory agreement for the Fund, the Board evaluated the nature, extent and quality of services provided to the Fund by the Adviser.
The Board considered the Adviser’s management capabilities and investment processes in light of the types of investments held by the Fund, including the education, experience and number of investment professionals and other personnel who provide portfolio management, investment research, and similar services to the Fund. In particular, the Board considered the abilities and experience of the Adviser’s investment professionals in analyzing special considerations relevant to investing in dividend-paying common and preferred stocks. The Board considered the Adviser’sin-house equity research capabilities and experience in managing funds that seek to maximizeafter-tax returns. The Board also took into account the resources dedicated to portfolio management and other services, the compensation methods of the Adviser and other factors, including the reputation and resources of the Adviser to recruit and retain highly qualified research, advisory and supervisory investment professionals. In addition, the Board considered the time and attention devoted to the Eaton Vance Funds, including the Fund, by senior management, as well as the infrastructure, operational capabilities and support staff in place to assist in the portfolio management and operations of the Fund, including the provision of administrative services. The Board also considered the business-related and other risks to which the Adviser or its affiliates may be subject in managing the Fund.
The Board considered the compliance programs of the Adviser and relevant affiliates thereof. The Board considered compliance and reporting matters regarding, among other things, personal trading by investment professionals, selective disclosure of portfolio holdings, late trading, frequent trading, portfolio valuation, business continuity and the allocation of investment opportunities. The Board also considered the responses of the Adviser and its affiliates to requests in recent years from regulatory authorities, such as the Securities and Exchange Commission and the Financial Industry Regulatory Authority.
Eaton Vance
Tax-Advantaged Dividend Income Fund
April 30, 2019
Board of Trustees’ Contract Approval — continued
The Board considered shareholder and other administrative services provided or managed by Eaton Vance Management and its affiliates, including transfer agency and accounting services. The Board evaluated the benefits to shareholders of investing in a fund that is a part of a large fund complex offering exposure to a variety of asset classes and investment disciplines.
After consideration of the foregoing factors, among others, the Board concluded that the nature, extent and quality of services provided by the Adviser, taken as a whole, are appropriate and consistent with the terms of the investment advisory agreement.
Fund Performance
The Board compared the Fund’s investment performance to that of comparable funds and appropriate benchmark indices. The Board’s review included comparative performance data with respect to the Fund for theone-, three-, five- andten-year periods ended September 30, 2018. In this regard, the Board noted that the performance of the Fund was higher than the median performance of the Fund’s peer group for the three-year period. The Board also noted that the performance of the Fund was higher than its primary, secondary and blended benchmark indexes for the three-year period. The Board concluded that the performance of the Fund was satisfactory.
Management Fees and Expenses
The Board considered contractual fee rates payable by the Fund for advisory and administrative services (referred to collectively as “management fees”). As part of its review, the Board considered the Fund’s management fees and total expense ratio for theone-year period ended September 30, 2018, as compared to those of comparable funds, before and after giving effect to any undertaking to waive fees or reimburse expenses. The Board also received and considered information about the services offered and the fee rates charged by the Adviser to other types of accounts with investment objectives and strategies that are substantially similar to and/or managed in a similar investment style as the Fund. In this regard, the Board received information about the differences in the nature and scope of services the Adviser provides to the Fund as compared to other types of accounts and the material differences in compliance, reporting and other legal burdens and risks to the Adviser as between the Fund and other types of accounts. The Board also considered factors that had an impact on the Fund’s total expense ratio relative to comparable funds.
After considering the foregoing information, and in light of the nature, extent and quality of the services provided by the Adviser, the Board concluded that the management fees charged for advisoryand related services are reasonable.
Profitability and“Fall-Out” Benefits
The Board considered the level of profits realized by the Adviser and relevant affiliates thereof in providing investment advisory and administrative services to the Fund and to all Eaton Vance Funds as a group. The Board considered the level of profits realized without regard to marketing support or other payments by the Adviser and its affiliates to third parties in respect of distribution services.
The Board concluded that, in light of the foregoing factors and the nature, extent and quality of the services rendered, the profits realized by the Adviser and its affiliates are deemed not to be excessive.
The Board also considered direct or indirectfall-out benefits received by the Adviser and its affiliates in connection with their respective relationships with the Fund, including the benefits of research services that may be available to the Adviser as a result of securities transactions effected for the Fund and other investment advisory clients.
Economies of Scale
In reviewing management fees and profitability, the Board also considered the extent to which the Adviser and its affiliates, on the one hand, and the Fund, on the other hand, can expect to realize benefits from economies of scale as the assets of the Fund increase. The Board acknowledged the difficulty in accurately measuring the benefits resulting from economies of scale, if any, with respect to the management of any specific fund or group of funds. The Board reviewed data summarizing the increases and decreases in the assets of the Fund and of all Eaton Vance Funds as a group over various time periods, and evaluated the extent to which the total expense ratio of the Fund and the profitability of the Adviser and its affiliates may have been affected by such increases or decreases. Based upon the foregoing, the Board concluded that the Fund currently shares in the benefits from economies of scale, if any, when they are realized by the Adviser. The Board also concluded that the structure of the advisory fee, which includes breakpoints at several asset levels, will allow the Fund to continue to benefit from any economies of scale in the future.
Eaton Vance
Tax-Advantaged Dividend Income Fund
April 30, 2019
Officers and Trustees
Officers of Eaton Vance Tax-Advantaged Dividend Income Fund
Edward J. Perkin
President
Maureen A. Gemma
Vice President, Secretary and
Chief Legal Officer
James F. Kirchner
Treasurer
Richard F. Froio
Chief Compliance Officer
Trustees of Eaton Vance Tax-Advantaged Dividend Income Fund
William H. Park
Chairperson
Thomas E. Faust Jr.*
Mark R. Fetting
Cynthia E. Frost
George J. Gorman
Valerie A. Mosley
Helen Frame Peters
Keith Quinton(1)
Marcus L. Smith(1)
Susan J. Sutherland
Scott E. Wennerholm
| (1) | Messrs. Quinton and Smith began serving as Trustees effective October 1, 2018. |
Eaton Vance Funds
IMPORTANT NOTICES
Privacy. The Eaton Vance organization is committed to ensuring your financial privacy. Each of the financial institutions identified below has in effect the following policy (“Privacy Policy”) with respect to nonpublic personal information about its customers:
| • | | Only such information received from you, through application forms or otherwise, and information about your Eaton Vance fund transactions will be collected. This may include information such as name, address, social security number, tax status, account balances and transactions. |
| • | | None of such information about you (or former customers) will be disclosed to anyone, except as permitted by law (which includes disclosure to employees necessary to service your account). In the normal course of servicing a customer’s account, Eaton Vance may share information with unaffiliated third parties that perform various required services such as transfer agents, custodians and broker-dealers. |
| • | | Policies and procedures (including physical, electronic and procedural safeguards) are in place that are designed to protect the confidentiality of such information. |
| • | | We reserve the right to change our Privacy Policy at any time upon proper notification to you. Customers may want to review our Privacy Policy periodically for changes by accessing the link on our homepage: www.eatonvance.com. |
Our pledge of privacy applies to the following entities within the Eaton Vance organization: the Eaton Vance Family of Funds, Eaton Vance Management, Eaton Vance Investment Counsel, Eaton Vance Distributors, Inc., Eaton Vance Trust Company, Eaton Vance Management (International) Limited, Eaton Vance Advisers International Ltd., Eaton Vance Management’s Real Estate Investment Group and Boston Management and Research. In addition, our Privacy Policy applies only to those Eaton Vance customers who are individuals and who have a direct relationship with us. If a customer’s account (i.e., fund shares) is held in the name of a third-party financial advisor/broker-dealer, it is likely that only such advisor’s privacy policies apply to the customer. This notice supersedes all previously issued privacy disclosures. For more information about Eaton Vance’s Privacy Policy, please call 1-800-262-1122.
Delivery of Shareholder Documents. The Securities and Exchange Commission (SEC) permits funds to deliver only one copy of shareholder documents, including prospectuses, proxy statements and shareholder reports, to fund investors with multiple accounts at the same residential or post office box address. This practice is often called “householding” and it helps eliminate duplicate mailings to shareholders. American Stock Transfer & Trust Company, LLC (“AST”), the closed-end funds transfer agent, or your financial advisor, may household the mailing of your documents indefinitely unless you instruct AST, or your financial advisor, otherwise. If you would prefer that your Eaton Vance documents not be householded, please contact AST or your financial advisor. Your instructions that householding not apply to delivery of your Eaton Vance documents will typically be effective within 30 days of receipt by AST or your financial advisor.
Portfolio Holdings. Each Eaton Vance Fund and its underlying Portfolio(s) (if applicable) files a schedule of portfolio holdings on Part F to Form N-PORT with the SEC for the first and third quarters of each fiscal year. The Form N-PORT will be available on the Eaton Vance website at www.eatonvance.com, by calling Eaton Vance at 1-800-262-1122 or in the EDGAR database on the SEC’s website at www.sec.gov.
Proxy Voting. From time to time, funds are required to vote proxies related to the securities held by the funds. The Eaton Vance Funds or their underlying Portfolios (if applicable) vote proxies according to a set of policies and procedures approved by the Funds’ and Portfolios’ Boards. You may obtain a description of these policies and procedures and information on how the Funds or Portfolios voted proxies relating to portfolio securities during the most recent 12-month period ended June 30, without charge, upon request, by calling 1-800-262-1122 and by accessing the SEC’s website at www.sec.gov.
Share Repurchase Program. The Fund’s Board of Trustees has approved a share repurchase program authorizing the Fund to repurchase up to 10% of its common shares outstanding as of the last day of the prior calendar year in open-market transactions at a discount to net asset value. The repurchase program does not obligate the Fund to purchase a specific amount of shares. The Fund’s repurchase activity, including the number of shares purchased, average price and average discount to net asset value, is disclosed in the Fund’s annual and semi-annual reports to shareholders.
Additional Notice to Shareholders. If applicable, a Fund may also redeem or purchase its outstanding preferred shares in order to maintain compliance with regulatory requirements, borrowing or rating agency requirements or for other purposes as it deems appropriate or necessary.
Closed-End Fund Information. Eaton Vance closed-end funds make fund performance data and certain information about portfolio characteristics available on the Eaton Vance website shortly after the end of each month. Other information about the funds is available on the website. The funds’ net asset value per share is readily accessible on the Eaton Vance website. Portfolio holdings for the most recent month-end are also posted to the website approximately 30 days following the end of the month. This information is available at www.eatonvance.com on the fund information pages under “Individual Investors — Closed-End Funds”.
This Page Intentionally Left Blank
Investment Adviser and Administrator
Eaton Vance Management
Two International Place
Boston, MA 02110
Custodian
State Street Bank and Trust Company
State Street Financial Center, One Lincoln Street
Boston, MA 02111
Transfer Agent
American Stock Transfer & Trust Company, LLC
6201 15th Avenue
Brooklyn, NY 11219
Fund Offices
Two International Place
Boston, MA 02110

7734 4.30.19
Item 2. Code of Ethics
Not required in this filing.
Item 3. Audit Committee Financial Expert
Not required in this filing.
Item 4. Principal Accountant Fees and Services
Not required in this filing.
Item 5. Audit Committee of Listed Registrants
Not required in this filing.
Item 6. Schedule of Investments
Please see schedule of investments contained in the Report to Stockholders included under Item 1 of this FormN-CSR.
Item 7. Disclosure of Proxy Voting Policies and Procedures forClosed-End Management Investment Companies
Not required in this filing.
Item 8. Portfolio Managers ofClosed-End Management Investment Companies
Not required in this filing.
Item 9. Purchases of Equity Securities byClosed-End Management Investment Company and Affiliated Purchasers
No such purchases this period.
Item 10. Submission of Matters to a Vote of Security Holders
No material changes.
Item 11. Controls and Procedures
(a) It is the conclusion of the registrant’s principal executive officer and principal financial officer that the effectiveness of the registrant’s current disclosure controls and procedures (such disclosure controls and procedures having been evaluated within 90 days of the date of this filing) provide reasonable assurance that the information required to be disclosed by the registrant has been recorded, processed, summarized and reported within the time period specified in the Commission’s rules and forms and that the information required to be disclosed by the registrant has been accumulated and communicated to the registrant’s principal executive officer and principal financial officer in order to allow timely decisions regarding required disclosure.
(b) There have been no changes in the registrant’s internal controls over financial reporting during the second fiscal quarter of the period covered by this report that has materially affected, or is reasonably likely to materially affect, the registrant’s internal control over financial reporting.
Item 12. Disclosure of Securities Lending Activities forClosed-End Management Investment Companies
No activity to report for the Registrant’s most recent fiscal year end.
Item 13. Exhibits
| | |
| (a)(1) | | Registrant’s Code of Ethics – Not applicable (please see Item 2). |
| |
| (a)(2)(i) | | Treasurer’s Section 302 certification. |
| |
| (a)(2)(ii) | | President’s Section 302 certification. |
| |
| (b) | | Combined Section 906 certification. |
| |
| (c) | | Registrant’s notices to shareholders pursuant to Registrant’s exemptive order granting an exemption from Section 19(b) of the 1940 Act and Rule19b-1 thereunder regarding distributions paid pursuant to the Registrant’s Managed Distribution Plan. |
Signatures
Pursuant to the requirements of the Securities Exchange Act of 1934 and the Investment Company Act of 1940, the registrant has duly caused this report to be signed on its behalf by the undersigned, thereunto duly authorized.
Eaton VanceTax-Advantaged Dividend Income Fund
| | |
| By: | | /s/ Edward J. Perkin |
| | Edward J. Perkin |
| | President |
| |
| Date: | | June 24, 2019 |
Pursuant to the requirements of the Securities Exchange Act of 1934 and the Investment Company Act of 1940, this report has been signed below by the following persons on behalf of the registrant and in the capacities and on the dates indicated.
| | |
| By: | | /s/ James F. Kirchner |
| | James F. Kirchner |
| | Treasurer |
| |
| Date: | | June 24, 2019 |
| | |
| By: | | /s/ Edward J. Perkin |
| | Edward J. Perkin |
| | President |
| |
| Date: | | June 24, 2019 |