UNITED STATES
SECURITIES AND EXCHANGE COMMISSION
Washington, D.C. 20549
FORM N-CSR
CERTIFIED SHAREHOLDER REPORT OF REGISTERED
MANAGEMENT INVESTMENT COMPANIES
Investment Company Act file number | 811-21407 |
|
Nuveen Diversified Dividend & Income Fund |
(Exact name of registrant as specified in charter) |
|
Nuveen Investments 333 West Wacker Drive Chicago, IL 60606 |
(Address of principal executive offices) |
|
Kevin J. McCarthy Nuveen Investments 333 West Wacker Drive Chicago, IL 60606 |
(Name and address of agent for service) |
|
Registrant’s telephone number, including area code: | (312) 917-7700 | |
|
Date of fiscal year end: | December 31 | |
|
Date of reporting period: | June 30, 2011 | |
| | | | | | |
Form N-CSR is to be used by management investment companies to file reports with the Commission not later than 10 days after the transmission to stockholders of any report that is required to be transmitted to stockholders under Rule 30e-1 under the Investment Company Act of 1940 (17 CFR 270.30e-1). The Commission may use the information provided on Form N-CSR in its regulatory, disclosure review, inspection, and policymaking roles.
A registrant is required to disclose the information specified by Form N-CSR, and the Commission will make this information public. A registrant is not required to respond to the collection of information contained in Form N-CSR unless the Form displays a currently valid Office of Management and Budget ("OMB") control number. Please direct comments concerning the accuracy of the information collection burden estimate and any suggestions for reducing the burden to Secretary, Securities and Exchange Commission, 450 Fifth Street, NW, Washington, DC 20549-0609. The OMB has reviewed this collection of information under the clearance requirements of 44 U.S.C. ss. 3507.
ITEM 1. REPORTS TO STOCKHOLDERS.

Closed-End Funds
Nuveen Investments
Closed-End Funds
Seeks High Current Income and Total Return from a Portfolio of Dividend-Paying
Common Stocks, REIT Stocks, Emerging Markets Debt, and Senior Loans
Semi-Annual Report
June 30, 2011

Nuveen Diversified
Dividend and
Income Fund
JDD

LIFE IS COMPLEX.
Nuveen makes things e-simple.
It only takes a minute to sign up for e-Reports. Once enrolled, you'll receive an e-mail as soon as your Nuveen Fund information is ready. No more waiting for delivery by regular mail. Just click on the link within the e-mail to see the report and save it on your computer if you wish.
Free e-Reports right to your e-mail!
www.investordelivery.com
If you receive your Nuveen Fund dividends and statements from your financial advisor or brokerage account.
OR
www.nuveen.com/accountaccess
If you receive your Nuveen Fund dividends and statements directly from Nuveen.

Table of Contents
| Chairman's Letter to Shareholders | | | 4 | | |
|
| Portfolio Managers' Comments | | | 5 | | |
|
| Common Share Distribution and Share Price Information | | | 13 | | |
|
| Performance Overview | | | 16 | | |
|
| Shareholder Meeting Report | | | 17 | | |
|
| Portfolio of Investments | | | 18 | | |
|
| Statement of Assets & Liabilities | | | 31 | | |
|
| Statement of Operations | | | 32 | | |
|
| Statement of Changes in Net Assets | | | 33 | | |
|
| Statement of Cash Flows | | | 34 | | |
|
| Financial Highlights | | | 36 | | |
|
| Notes to Financial Statements | | | 38 | | |
|
| Annual Investment Management Agreement Approval Process | | | 50 | | |
|
| Reinvest Automatically Easily and Conveniently | | | 58 | | |
|
| Glossary of Terms Used in this Report | | | 60 | | |
|
| Other Useful Information | | | 62 | | |
|
Chairman's
Letter to Shareholders

Dear Shareholders,
The global economy continues to be weighed down by an unusual combination of pressures facing the larger developed economies. Japanese leaders continue to work through the economic aftereffects of the March 2011 earthquake and tsunami. Political leaders in Europe and the U.S. have resolved some of the near term fiscal problems, but the financial markets are not convinced that these leaders are able to address more complex longer term fiscal issues. Despite improved earnings and capital increases, the largest banks in these countries continue to be vulnerable to deteriorating mortgage portfolios and sovereign credit exposure, adding another source of uncertainty to the global financial system.
In the U.S., recent economic statistics indicate that the economic recovery may be losing momentum. Consumption, which represents about 70% of the gross domestic product, faces an array of challenges from seemingly intractable declines in housing values, increased energy costs and limited growth in the job market. The failure of Congress and the administration to agree on the debt ceiling increase on a timely basis and the deep divisions between the political parties over fashioning a balanced program to address growing fiscal imbalances that led to the recent S&P ratings downgrade add considerable uncertainty to the domestic economic picture.
On a more positive note, corporate earnings continue to hold up well and the municipal bond market is recovering from recent weakness as states and municipalities implement various programs to reduce their budgetary deficits. In addition, the Federal Reserve System has made it clear that it stands ready to take additional steps should the economic recovery falter. However, there are concerns that the Fed is approaching the limits of its resources to intervene in the economy.
These perplexing times highlight the importance of professional investment management. Your Nuveen investment team is working hard to develop an appropriate response to increased risk, and they continue to seek opportunities created by stressful markets using proven investment disciplines designed to help your Fund achieve its investment objectives. On your behalf, we monitor their activities to assure that they maintain their investment disciplines.
As always, I encourage you to contact your financial consultant if you have any questions about your investment in a Nuveen Fund. On behalf of the other members of your Fund Board, we look forward to continuing to earn your trust in the months and years ahead.
Sincerely,

Robert P. Bremner
Chairman of the Board
August 23, 2011
Nuveen Investments
4
Portfolio Managers' Comments
Certain statements in this report are forward-looking statements. Discussions of specific investments are for illustration only and are not intended as recommendations of individual investments. The forward-looking statements and other views expressed herein are those of the portfolio managers as of the date of this report. Actual future results or occurrences may differ significantly from those anticipated in any forward-looking statements and the views expressed herein are subject to change at any time, due to numerous market and other factors. The Fund disclaims any obligation to update publicly or revise any forward-looking statements or views expressed herein.
Ratings shown are the highest rating given by one of the following national rating agencies: S&P, Moody's or Fitch. Credit ratings are subject to change. AAA, AA, A, and BBB are investment grade ratings; BB, B, CCC/CC/C and D are below-investment grade ratings. Bonds backed by U.S. Government or agency securities are given an implied rating equal to the rating of such securities. Holdings designated NR are not rated by a national rating agency.
Nuveen Diversified Dividend and Income Fund (JDD)
JDD features portfolio management by teams at four separate sub-advisers.
NWQ Investment Management Company, LLC, an affiliate of Nuveen Investments, invests its portion of the Fund's assets primarily in dividend-paying common stocks and manages the Fund's call option strategy. Jon Bosse, Chief Investment Officer of NWQ, leads the Fund's management team. He has 29 years of corporate finance and investment management experience.
The real estate portion of the Fund's investment portfolio is managed by a team at Security Capital Research & Management Incorporated, a wholly-owned subsidiary of JPMorgan Chase & Co. Anthony R. Manno Jr., Kenneth D. Statz and Kevin Bedell, who each have more than 20 years of experience in managing real estate investments, lead the team.
Wellington Management Company, LLP, invests its portion of the Fund's assets in emerging markets sovereign debt, quasi-sovereign and corporate securities and manages the Fund's foreign currency forward strategy. James W. Valone, who has more than 18 years of investment management experience, heads the team.
Symphony Asset Management, LLC, an affiliate of Nuveen Investments, invests its portion of the Fund's assets primarily in senior loans. The Symphony team is led by Gunther Stein, Symphony's Chief Investment Officer. Gunther has more than 20 years of investment management experience.
Here representatives from NWQ, Security Capital, Symphony and Wellington Management talk about their management strategies and the performance of the Fund for the six-month period ending June 30, 2011.
What were the key strategies were used to manage the Fund over this reporting period?
The Fund's investment objectives are high current income and total return. In its efforts to achieve these objectives, the Fund invests primarily in 1) U.S. and foreign dividend-paying common stocks, 2) dividend-paying common stocks issued by real estate companies, 3) emerging markets sovereign debt, and 4) senior secured loans. The Fund expects to invest at least 40%, but no more than 70%, of its assets in equity security holdings and at least 30%, but no more than 60%, of its assets in debt security holdings. Under normal circumstances, the Fund's target weighting is approximately 50% equity and 50% debt.
Nuveen Investments
5
For the dividend-paying equity portion of the Fund's portfolio managed by NWQ, we continued to employ an opportunistic, bottom-up strategy that focused on identifying undervalued companies possessing favorable risk/reward characteristics as well as emerging catalysts that can unlock value or improve profitability. These catalysts included management changes, restructuring efforts, recognition of hidden assets, or a positive change in the underlying fundamentals. We also focused on downside protection, and paid a great deal of attention to a company's balance sheet and cash flow statement, not just the income statement. We believed that cash flow analysis offered a more objective and truer picture of a company's financial position than an evaluation based on earnings alone. We also wrote (sold) covered call options on individual stocks held in its portfolio in an attempt to enhance returns, although this did create the possibility of foregoing some upside potential from stock appreciation.
In managing the real estate portion of the portfolio managed by Security Capital, we sought to maintain significant property type and geographic diversification while taking into account company credit quality, sector, and security-type allocations. Investment decisions are based on a multi-layered analysis of the company, the real estate it owns, its management, and the relative price of the security, with a focus on securities that we believe will be best positioned to generate sustainable income and potential price appreciation over the long-run. Across all real estate sectors, we favored companies with properties located in the strongest urban locations. These "high barrier to entry" markets are defined by constraints that limit new construction, a quality that over the long-term has the potential to provide superior value enhancement and a real inflation hedge.
In the emerging market debt portion of the Fund managed by Wellington Management, we kept the portfolio's beta at a neutral level, balancing our positive outlook and expectations for emerging markets countries with concerns about the broader global environment. We were overweight Latin America, favoring countries such as Argentina, Brazil, and Peru. An underweight to Central Europe reflected our concerns about the region's vulnerability to a worsening of the European sovereign crisis, and instead we focused our exposure on countries like Russia, Kazakhstan, and South Africa. We reduced exposure to most countries in the Middle East following the political turmoil seen in that region, but we continued to hold exposure in Qatar and United Arab Emirates, two high quality countries with attractive valuations. We remained underweight in Asia on the basis of tight valuations, though we increased exposure to Asian currencies where growth was strong, the balance of payments picture was healthy, and inflation pressures were rising. Local interest rate exposure was concentrated in countries with steep yield curves, like Mexico and Colombia, while corporate exposure was taken on a tactical basis where new issue premiums were attractive. On June 23, 2011, the Fund implemented an investment policy change for its emerging markets debt investments. Going forward, the Fund may invest up to 1% of this portion of its portfolio in defaulted securities issued by a single issuer. There also will be an aggregate 3% limit to defaulted securities in this portion of the portfolio. We also entered into forward foreign currency exchange contracts, buying currencies expected to appreciate and selling currencies expected to depreciate.
Nuveen Investments
6
Past performance is not predictive of future results. Current performance may be higher or lower than the data shown. Returns do not reflect the deduction of taxes that shareholders may have to pay on Fund distributions or upon the sale of Fund shares.
For additional information, see the individual Performance Overview for the Fund in this report.
* Six-month returns are cumulative; all other numbers are annualized.
1 Comparative benchmark performance is a blended return consisting of: 1) 18.75% of the return of the Russell 3000 Value Index, which measures the performance of those Russell 3000 Index companies with lower price-to book ratios and lower forecasted growth values, 2) 6.25% of the return of the MSCI EAFE ex-Japan Value Index, a capitalization weighted index that selects the lower 50% of the price-to-book ranked value stocks traded in the developed markets of Europe, Asia and the Far East, excluding Japan, 3) 25% of the return of the Dow Jones Wilshire Real Estate Securities Index, an unmanaged, market capitalization-weighted index comprised of publicly traded Real Estate Investment Trusts (REITs) and real estate companies, 4) 25% of the return of the JPMorgan EMBI Global Diversified Index, which tracks total returns for U.S.-dollar-denominated debt instruments issued by emerging markets sovereign and quasi sovereign entities, and 5) 25% of the return of the CSFB Leveraged Loan Index, which consists of approximately $150 billion of tradable term loans with at least one year to maturity and rated BBB or lower. Index returns do not include the effects of any sales charges or management fees. It is not possible to invest directly in an index.
2 The S&P 500 Stock Index is an unmanaged index generally considered representative of the U.S. Stock Market. Index returns do not include the effects of any sales charges or management fees. It is not possible to invest directly in an index.
In the senior loan and other debt portion of the Fund's portfolio managed by Symphony, we continued to position the portfolio conservatively with senior loans we felt offered above-average fundamental strength, asset coverage, and a solid risk-adjusted yield. During most of the period, the leveraged finance markets traded positively as the Federal Reserve's quantitative easing initiative was underway, optimism about stability (and growth) increased, and sovereign concerns remained on the back burner until mid-May when volatility began to increase as macro concerns about Europe (and later the U.S.) drove markets lower.
Nonetheless, the loan market showed a positive return for the first half of 2011, despite a selloff late in the period. Overall, consensus opinion in the loan market centered on overall optimism regarding a low default environment, with the default rate for the U.S. market decreasing 20 basis points to 1.05% for the twelve-month period ended June 2011. While the average recovery rate has dropped, such a low default rate makes the average recovery rate less meaningful—particularly for higher quality portfolios within the non-investment grade space.
How did the Fund perform over the six-month period?
The performance of JDD, as well as a comparative benchmark and general market index, is presented in the accompanying table.
Average Annual Total Returns on Common Share Net Asset Value*
For periods ended 6/30/11
| | | 6-month | | 1-Year | | 5-Year | |
| JDD | | | 5.73 | % | | | 22.93 | % | | | 2.06 | % | |
| Comparative Benchmark1 | | | 6.88 | % | | | 22.99 | % | | | 5.01 | % | |
| S&P 500 Stock Index2 | | | 6.02 | % | | | 30.69 | % | | | 2.94 | % | |
For the six-month period ended June 30, 2011, the total return on common share net asset value (NAV) for the Fund underperformed both its comparative benchmark and the general market index.
Within the dividend-paying equity portion of the Fund's portfolio managed by NWQ, several positions appreciated sharply during the period given depressed initial valuations, individual catalysts, and a perception of stabilization in the economy. Pfizer Inc. outperformed, as the company has been active in addressing ongoing and future challenges by shaking up its management team, stabilizing its core earnings, and beginning the process of divesting several divisions.
Motorola Solutions is a leading provider of two-way radio and wireless network products, and is positioned to profit from the digital upgrade in public safety equipment. We believe the company will also benefit significantly if the government allocates additional frequency spectrum to public safety for wireless broadband data usage, an issue that is starting to gain momentum in Washington. We expect the company will address capital allocation (dividends and share repurchase) after completing the sale of its network business to Nokia Siemens.
A catalyst for the appreciation in CVS Caremark Corp. was the announcement that its pharmacy benefit manager (PBM) had won a $3 billion contract for the Federal
Nuveen Investments
7
Employee Program (FEP). The win is significant for Caremark as it further validates the company's integrated PBM-retail pharmacy business model (they have now won the two largest contracts out for bid in the past year at competitive, but we believe still attractive, margins). We believe Caremark's earnings and free cash flow are trending in the right direction as new management resumes its cost cutting and restructuring efforts and its PBM business continues to gain more solid footing. The company is also poised to benefit from the upcoming "generic wave" as many branded pharmaceutical products are set to come off patent.
Several of our bank stocks, including Citigroup, JP Morgan Chase, and Wells Fargo negatively impacted performance. This reflects uncertainty surrounding future banking regulations, overall market/trading weakness, and concerns about lower economic growth. Of particular concern was an expected higher capital requirement, which could constrain future growth and profitability. Genworth Financial's U.S. mortgage insurance business struggled, given the lingering housing market problems. Despite stability in its life and international mortgage divisions, weakness in its U.S. mortgage insurance operations continue to loom over the company's efforts to recover from the 2008 financial crisis. General Motors declined on concerns about potential pricing degradation and product mix given high gasoline prices and production cutbacks due to supply shortages from Japan. The potential overhang of the U.S. government's ownership stake has also weighed on the stock. Our investment thesis for the stock remained intact as the company's fundamentals have greatly improved since emerging from bankruptcy last year, and we believe the most pressing issues and concerns are short-term in nature.
NWQ also added several new positions to its portion of the Fund's portfolio. Cisco Systems was purchased as we felt the share price fully discounted lower future operating margins and gave little value to the company's core franchise or management's ability to successfully restructure its businesses. With a cash rich balance sheet and attractive free cash flow yield, we felt that shares of Cisco offered meaningful downside protection and potential upside through stock repurchases, increased dividends, and successful reorganization and product repositioning efforts. We also purchased Teva Pharmaceutical Industries Ltd., a global leader in the development and marketing of generic pharmaceuticals. We believe the firm is well-positioned to benefit from the upcoming wave of major branded drugs reaching the end of their patent protection. Recent execution issues, which have included FDA quality control violations at two plants, have sent Teva shares down to single-digit earnings multiples and near double-digit free cash flow yields. Interpublic Group of Companies, Inc. (IPG) provides advertising and marketing services worldwide. The company had been plagued by accounting irregularities, as well as poor cost controls, following a series of acquisitions made over the years. A new management team has fixed the accounting issues and implemented controls and other important business systems for managing and monitoring costs. We initiated a position as the company continued its fundamental improvement driven by better execution and increased cash flow generation. IPG recently took another positive step in its turnaround when Moody's upgraded its unsecured debt and revolving credit facility two notches to investment grade. This should result in removing the covenants on cash flow and could lead to the company ramping up its share buyback and/or increasing its dividend payout. We also purchased CVS Caremark, the retail pharmacy and pharmacy services
Nuveen Investments
8
provider. We believe that the market is giving the company no credit for the synergies created by its purchase of pharmacy benefit manager (PBM) Caremark Rx two years ago in a deal that created the most vertically integrated pharmacy in the country. Other new investments during the period include JPMorgan, National CineMedia, Nielsen Holdings N.V., and Redwood Trust.
During the period we eliminated Kroger Co. on concerns that the supermarket group will be unable to pass through upcoming food price inflation as consumers simultaneously digest higher gas prices and a sluggish employment outlook. Kimberly-Clark Corp. was sold based on valuation and concerns stemming from the announced restructuring of its pulp and paper operations. We questioned the high cost of the plan, particularly when compared to the limited expected return the restructuring would generate. We exited Valeant Pharmaceutical International following significant appreciation as investors became more comfortable with the company's business model and the sustainability of its growth prospects. ENI SPA, Packaging Corp. of America, and Union Pacific were also sold as we felt each company's share price had reached fair valuation, and the risk/reward for continuing to own the stocks was no longer attractive.
In the real estate portion of the Fund managed by Security Capital, the portfolio's shopping center, office and self-storage investments contributed positively to performance. On the negative side, the Fund's performance was constrained by investments in health care and multi-family companies.
In the emerging markets debt portion of the portfolio managed by Wellington Management, both country rotation and security selection strategies contributed positively to returns for the Fund. Security selection trades in Argentina, Ukraine, Venezuela and Russia were particularly favorable, as was a lack of exposure to Lebanon, Belarus and an underweight to China and Turkey. Conversely, an overweight allocation to Bahrain and less favorable security selection in Chile detracted from relative returns.
Wellington Management continued to be positive on the outlook for emerging markets debt. Credit fundamentals continued to improve on the back of strong economic growth, low and stable debt burdens, and higher reserves. Reform progress, however, has waned in an environment of high commodity prices and ample global liquidity. As a result, the pace of credit improvement from here may ebb. The global backdrop also remained challenging, with slower growth in the U.S. and core Europe, persistent challenges in the Western European periphery, and policy tightening in China aimed at cooling inflation and property sector expansion. The prospect of a hard landing in China—not our base case scenario at this point—likely poses the biggest risk to our market should it lead to a sharp drop in commodity prices.
The senior loan portion of the Fund managed by Symphony benefited toward the end of the period by a positioning in lower volatility names, many of which have lower leverage and less cyclicality to their businesses than the overall market. The Fund also had some good company specific news within some holdings, such as Burlington Coat Factory, which continued to show positive earnings and free cashflow momentum and an ability to translate that into debt paydowns.
Nuveen Investments
9
Generally speaking, this part of the Fund's portfolio was largely constrained by having better quality holdings during the period. Many of these names pay lower coupons, and as such tend to underperform in an environment in which price action is flat. However, the positioning kept pace with the overall Index.
During the period, the Fund also entered into interest rate swaps to partially fix the interest cost of leverage, which the Fund uses through the use of bank borrowings. This portion of the Fund is overseen by Nuveen Fund Advisors, Inc., also an affiliate of Nuveen Investments.
IMPACT OF THE FUND'S LEVERAGE STRATEGY ON PERFORMANCE
One important factor impacting the return of the Fund relative to its benchmarks was the Fund's use of financial leverage through the use of bank borrowings. The Fund uses leverage because its managers believe that, over time, leveraging provides opportunities for additional income and total return for common shareholders. However, use of leverage also can expose common shareholders to additional volatility. For example, as the prices of securities held by a Fund decline, the negative impact of these valuation changes on common share net asset value and common shareholder total return is magnified by the use of leverage. Conversely, leverage may enhance common share returns during periods when the prices of securities held by a Fund generally are rising. Leverage had a very modest negative impact on the performance of the Fund over this reporting period.
RECENT DEVELOPMENTS REGARDING THE FUND'S REDEMPTION OF AUCTION RATE PREFERRED SHARES
Shortly after its inception, the Fund issued auction rate preferred shares (ARPS) to create structural leverage. As noted in past shareholder reports, the weekly auctions for those ARPS shares began in February 2008 to consistently fail, causing the Fund to pay the so called "maximum rate" to ARPS shareholders under the terms of the ARPS in the Fund's charter documents. The Fund redeemed its ARPS at par in 2009 and since then has relied upon bank borrowings to create structural leverage.
During 2010 and 2011, certain Nuveen leveraged closed-end funds (including this Fund) received a demand letter on behalf of purported holders of common shares of each such fund, alleging that Nuveen and the funds' officers and Board of Directors/Trustees breached their fiduciary duties related to the redemption at par of the funds' ARPS. In response, the Board established an ad hoc Demand Committee consisting of certain of its disinterested and independent Board members to investigate the claims. The Demand Committee retained independent counsel to assist it in conducting an extensive investigation. Based upon its investigation, the Demand Committee found that it was not in the best interests of each fund or its shareholders to take the actions suggested in the demand letters, and recommended that the full Board reject the demands made in the demand letters. After reviewing the findings and recommendation of the Demand Committee, the full Board of each fund unanimously adopted the Demand Committee's recommendation.
Nuveen Investments
10
Subsequently, 33 of the funds that received demand letters (including this Fund) were named in a consolidated complaint as nominal defendants in a putative shareholder derivative action captioned Martin Safier, et al. v. Nuveen Asset Management, et al. that was filed in the Circuit Court of Cook County, Illinois, Chancery Division (the "Cook County Chancery Court") on February 18, 2011 (the "Complaint"). The Complaint, filed on behalf of purported holders of each fund's common shares, also name Nuveen Fund Advisors, Inc. as a defendant, together with current and former Officers and interested Directors/Trustees of each of the funds (together with the nominal defendants, collectively, the "Defendants"). The Complaint contains the same basic allegations contained in the demand letters. The suits seek a declaration that the Defendants have breached their fiduciary duties, an order directing the Defendants not to redeem any ARPS at their liquidation value using fund assets, indeterminate monetary damages in favor of the funds and an award of plaintiffs' costs and disbursements in pursuing the action. The funds and other Defendants have filed a motion to dismiss the suit, which is still pending before the court. Nuveen Fund Advisors, Inc. believes that the Complaint is without merit, and is defending vigorously against these charges.
Regulatory Matters
During May 2011, Nuveen Securities, LLC, known as Nuveen Investments, LLC, prior to April 30, 2011, entered into a settlement with the Financial Industry Regulatory Authority (FINRA) with respect to certain allegations regarding Nuveen-sponsored closed-end fund ARPS marketing brochures. As part of this settlement, Nuveen Securities, LLC neither admitted to nor denied FINRA's allegations. Nuveen Securities, LLC is the broker-dealer subsidiary of Nuveen Investments.
The settlement with FINRA concludes an investigation that followed the widespread failure of auctions for ARPS and other auction rate securities, which generally began in mid-February 2008. In the settlement, FINRA alleged that certain marketing materials provided by Nuveen Securities, LLC were false and misleading. Nuveen Securities, LLC agreed to a censure and the payment of a $3 million fine.
RISK CONSIDERATIONS
Fund shares are not guaranteed or endorsed by any bank or other insured depository institution, and are not federally insured by the Federal Deposit Insurance Corporation. Past performance is no guarantee of future results. Fund common shares are subject to a variety of risks, including:
Investment Risk. The possible loss of the entire principal amount that you invest.
Price Risk. Shares of closed-end investment companies like the Fund frequently trade at a discount to their net asset value. Your common shares at any point in time may be worth less than your original investment, even after taking into account the reinvestment of Fund dividends and distributions.
Leverage Risk. The Fund's use of leverage creates the possibility of higher volatility for the Fund's per share NAV, market price, distributions and returns. There is no assurance that a Fund's leveraging strategy will be successful.
Nuveen Investments
11
Tax Risk. The tax treatment of Fund distributions may be affected by new IRS interpretations of the Internal Revenue Code and future changes in tax laws and regulations. This is particularly true for funds employing a managed distribution program.
Common Stock Risk. Common stock returns often have experienced significant volatility.
Issuer Credit Risk. This is the risk that a security in the Fund's portfolio will fail to make dividend or interest payments when due.
Illiquid Securities Risk. This is the risk that the Fund may not be able to sell securities in its portfolio at the time or price desired by the Fund.
Below-Investment Grade Risk. Investments in securities below investment grade quality are predominantly speculative and subject to greater volatility and risk of default.
Non-U.S. Securities Risk. Investments in non-U.S securities involve special risks not typically associated with domestic investments including currency risk and adverse political, social and economic development. These risks often are magnified in emerging markets.
Real Estate Risk. The Fund may invest in various types of securities issued by REITs, linking an investment in the Fund to the performance of the real estate markets.
Unrated Investment Risk. In determining whether an unrated security is an appropriate investment for the Fund, the manager will consider information from industry sources, as well as its own quantitative and qualitative analysis, in making such a determination. However, such a determination by the manager is not the equivalent of a rating by a rating agency.
Dividend Income Risk. There is no guarantee that the issuers of common stocks in which the Fund invests will declare dividends in the future or that, if declared, they will remain at current levels or increase over time.
Risks from Unsecured Adjustable Rate Loans or Insufficient Collateral Securing Adjustable Rate Loans. Some of the adjustable rate loans in which the Fund may invest will be unsecured or insufficiently collateralized, thereby increasing the risk of loss to the Fund in the event of issuer default.
Value Stock Risks. Value stocks are securities that the portfolio manager believes to be undervalued, or mispriced. If the manager's assessment of a company's prospects is wrong, the price of the company's common stock or other equity securities may fall, or may not approach the value that the manager has placed on them.
Nuveen Investments
12
Common Share Distribution
and Share Price Information
The following information regarding your Fund's distributions is current as of June 30, 2011, and likely will vary over time based on the Fund's investment activities and portfolio investment value changes.
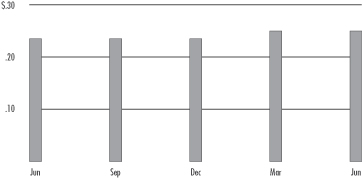
During the six-month reporting period, the Fund's quarterly distribution to common shareholders decreased during March. Some of the important factors affecting the amount and composition of these distributions are summarized below.
The Fund employs financial leverage through the use of bank borrowings. Financial leverage provides the potential for higher earnings (net investment income), total returns and distributions over time, but-as noted earlier-also increases the variability of common shareholders' net asset value per share in response to changing market conditions.
The Fund has a managed distribution program. The goal of this program is to provide common shareholders with relatively consistent and predictable cash flow by systematically converting the Fund's expected long-term return potential into regular distributions. As a result, regular common share distributions throughout the year are likely to include a portion of expected long-term gains (both realized and unrealized), along with net investment income.
Important points to understand about the managed distribution program are:
• The Fund seeks to establish a relatively stable common share distribution rate that roughly corresponds to the projected total return from its investment strategy over an extended period of time. However, you should not draw any conclusions about the Fund's past or future investment performance from its current distribution rate.
• Actual common share returns will differ from projected long-term returns (and therefore the Fund's distribution rate), at least over shorter time periods. Over a specific timeframe, the difference between actual returns and total distributions will be reflected in an increasing (returns exceed distributions) or a decreasing (distributions exceed returns) Fund net asset value.
• Each distribution is expected to be paid from some or all of the following sources:
• net investment income (regular interest and dividends),
• realized capital gains, and
• unrealized gains, or, in certain cases, a return of principal (non-taxable distributions).
• A non-taxable distribution is a payment of a portion of the Fund's capital. When the Fund's returns exceed distributions, it may represent portfolio gains generated, but not realized as a taxable capital gain. In periods when the Fund's returns fall short of
Nuveen Investments
13
3 The Fund elected to retain a portion of its realized long-term capital gains for the tax years ended December 31, 2007 and December 31, 2006, and pay required federal corporate income taxes on these amounts. As reported on Form 2439, Common shareholders on record date must include their pro-rata share of these gains on their applicable federal tax returns, and are entitled to take offsetting tax credits, for their pro-rata share of the taxes paid by the Fund. The total returns "Including retained gain tax credit/refund" include the economic benefit to Common shareholders on record date of these tax credits/refunds. The Fund had no retained capital gains for the tax years ended December 31, 2010 through December 31, 2008 or for the tax years ended prior to December 31, 2006.
distributions, the shortfall will represent a portion of your original principal, unless the shortfall is offset during other time periods over the life of your investment (previous or subsequent) when the Fund's total return exceeds distributions.
• Because distribution source estimates are updated during the year based on the Fund's performance and forecast for its current fiscal year (which is the calendar year for the Fund), estimates on the nature of your distributions provided at the time the distributions are paid may differ from both the tax information reported to you in your Fund's IRS Form 1099 statement provided at year end, as well as the ultimate economic sources of distributions over the life of your investment.
The following table provides estimated information regarding the Fund's common share distributions and total return performance for the six months ended June 30, 2011. This information is provided on a tax basis rather than a generally accepted accounting principles (GAAP) basis. This information is intended to help you better understand whether the Fund's returns for the specified time period were sufficient to meet the Fund's distributions.
| As of 6/30/11 (Common Shares) | | JDD | |
| Inception date | | 9/25/03 | |
| Six months ended June 30, 2011: | |
| Per share distribution: | |
| From net investment income | | $ | 0.20 | | |
| From realized capital gains | | | 0.30 | | |
| Return of capital | | | 0.00 | | |
| Total per share distribution | | $ | 0.50 | | |
| Annualized distribution rate on NAV | | | 8.10 | % | |
| Average annual total returns: | |
| Excluding retained gain tax credit/refund3: | |
| Six-Month (Cumulative) on NAV | | | 5.73 | % | |
| 1-Year on NAV | | | 22.93 | % | |
| 5-Year on NAV | | | 2.06 | % | |
| Since inception on NAV | | | 6.99 | % | |
| Including retained gain tax credit/refund3: | |
| Six-Month (Cumulative) on NAV | | | 5.73 | % | |
| 1-Year on NAV | | | 22.93 | % | |
| 5-Year on NAV | | | 2.66 | % | |
| Since inception on NAV | | | 7.37 | % | |
Common Share Repurchases and Share Price Information
As of June 30, 2011, and since the inception of the Fund's repurchase program, the Fund has cumulatively repurchased and retired its common shares as shown in the accompanying table.
Common Shares
Repurchased and Retired | | % of Outstanding
Common Shares | |
| | 240,001 | | | | 1.2 | % | |
Nuveen Investments
14
During the six-month reporting period, the Fund did not repurchase and retired any of it outstanding common shares.
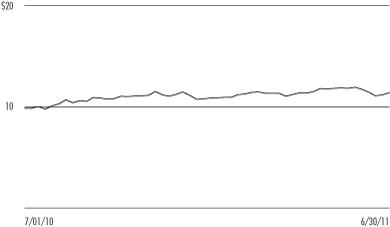
As of June 30, 2011, the Fund's common share price was trading at a -8.27% discount to its common share net asset value (NAV), compared with an average discount of -9.24% for the entire six-month period.
Nuveen Investments
15
Fund Snapshot
| Common Share Price | | $ | 11.42 | | |
| Common Share Net Asset Value (NAV) | | $ | 12.45 | | |
| Premium/(Discount) to NAV | | | -8.27 | % | |
| Current Distribution Rate1 | | | 8.76 | % | |
Net Assets Applicable to
Common Shares ($000) | | $ | 248,439 | | |
Leverage
(as a % of managed assets)6
| Structural Leverage | | | 24.31 | % | |
| Effective Leverage | | | 24.31 | % | |
Portfolio Composition
(as a % of total investments)2,3
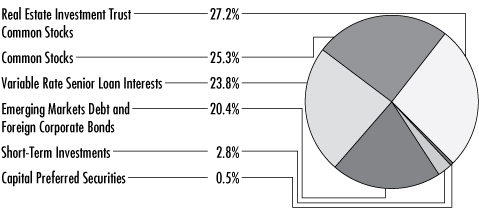
| Real Estate Investment Trust | | | 27.5 | % | |
| Emerging Markets Debt | | | 20.4 | % | |
| Media | | | 5.4 | % | |
| Pharmaceuticals | | | 4.8 | % | |
| Insurance | | | 3.9 | % | |
| Hotels, Restaurants & Leisure | | | 3.6 | % | |
| Health Care Providers & Services | | | 3.4 | % | |
| Communications Equipment | | | 2.5 | % | |
| Metals & Mining | | | 2.2 | % | |
| Software | | | 1.6 | % | |
| Diversified Financial Services | | | 1.6 | % | |
| Oil, Gas & Consumable Fuels | | | 1.6 | % | |
| Short-Term Investments | | | 2.8 | % | |
| Other | | | 18.7 | % | |
Real Estate Investment Trust
Top Five Sub-Industries
(as a % of total investments)2,3
| Specialized | | | 6.8 | % | |
| Office | | | 6.4 | % | |
| Retail | | | 5.5 | % | |
| Residential | | | 4.8 | % | |
| Diversified | | | 2.1 | % | |
Emerging Markets Debt
and Foreign Corporate Bonds
Top Five Countries
(as a % of total investments)2,3
| Mexico | | | 1.8 | % | |
| Indonesia | | | 1.5 | % | |
| Russian Federation | | | 1.4 | % | |
| Brazil | | | 1.4 | % | |
| Turkey | | | 0.9 | % | |
Average Annual Total Return
(Inception 9/25/03)
| | | On Share Price | | On NAV | |
| 6-month (Cumulative) | | | 9.50 | % | | | 5.73 | % | |
| 1-Year | | | 26.16 | % | | | 22.93 | % | |
| 5-Year | | | 2.13 | % | | | 2.06 | % | |
| Since Inception | | | 6.13 | % | | | 6.99 | % | |
Average Annual Total Return4
(Including retained gain tax credit/refund)
| | | On Share Price | | On NAV | |
| 6-Month (Cumulative) | | | 9.50 | % | | | 5.73 | % | |
| 1-Year | | | 26.16 | % | | | 22.93 | % | |
| 5-Year | | | 2.77 | % | | | 2.66 | % | |
| Since Inception | | | 6.52 | % | | | 7.37 | % | |
JDD
Performance
OVERVIEW
Nuveen Diversified Dividend and Income Fund
as of June 30, 2011
Portfolio Allocation (as a % of total investments)2,3,5
2010-2011 Distributions Per Common Share
Common Share Price Performance — Weekly Closing Price
Refer to the Glossary of Terms Used in this Report for further definition of the terms used within this Fund's Performance Overview page.
1 Current Distribution Rate is based on the Fund's current annualized quarterly distribution divided by the Fund's current market price. The Fund's quarterly distributions to its shareholders may be comprised of ordinary income, net realized capital gains and, if at the end of the calendar year the Fund's cumulative net ordinary income and net realized gains are less than the amount of the investments in Fund's distributions, a return of capital for tax purposes.
2 Excluding investments in derivatives.
3 Holdings are subject to change.
4 As previously explained in the Common Share Distribution and Share Price Information section of this report, the Fund elected to retain a portion of its realized long-term capital gains for the tax years ended December 31, 2007 and December 31, 2006, and pay required federal corporate income taxes on these amounts. These standardized total returns include the economic benefit to Common shareholders of record of this tax credit/refund. The Fund had no retained capital gains for the tax years ended December 31, 2010 through December 31, 2008 or for the tax years ended prior to December 31, 2006.
5 74.8% of the Fund's total investments (excluding investments in derivatives) are U.S. Securities.
6 As defined in Footnote 7—Management Fees and Other Transactions with Affiliates.
Nuveen Investments
16
JDD
Shareholder MEETING REPORT
The annual meeting of shareholders was held in the offices of Nuveen Investments on May 6, 2011; at this meeting the shareholders were asked to vote on the election of Board Members.
| | | JDD | |
| | | Common
Shares | |
| Approval of the Board Members was reached as follows: | |
| John P. Amboian | |
| For | | | 17,772,844 | | |
| Withhold | | | 437,145 | | |
| Total | | | 18,209,989 | | |
| David J. Kundert | |
| For | | | 17,750,052 | | |
| Withhold | | | 459,937 | | |
| Total | | | 18,209,989 | | |
| Terence J. Toth | |
| For | | | 17,769,619 | | |
| Withhold | | | 440,370 | | |
| Total | | | 18,209,989 | | |
Nuveen Investments
17
JDD
Nuveen Diversified Dividend and Income Fund
Portfolio of Investments
June 30, 2011 (Unaudited)
| Shares | | Description (1) | | Value | |
| | | Common Stocks – 33.8% (25.3% of Total Investments) | |
| | | Aerospace & Defense – 1.4% | |
| | 17,900 | | | Lockheed Martin Corporation | | $ | 1,449,363 | | |
| | 40,500 | | | Raytheon Company | | | 2,018,925 | | |
| | | Total Aerospace & Defense | | | 3,468,288 | | |
| | | Automobiles – 0.8% | |
| | 63,300 | | | General Motors Company, (2) | | | 1,921,788 | | |
| | | Biotechnology – 0.6% | |
| | 24,500 | | | Amgen Inc., (2) | | | 1,429,575 | | |
| | | Building Products – 0.5% | |
| | 35,400 | | | Masonite Worldwide Holdings, (2), (11) | | | 1,256,700 | | |
| | | Commercial Banks – 0.9% | |
| | 76,800 | | | Wells Fargo & Company | | | 2,155,008 | | |
| | | Commercial Services & Supplies – 0.7% | |
| | 72,000 | | | Pitney Bowes Inc. | | | 1,655,280 | | |
| | | Communications Equipment – 2.2% | |
| | 76,000 | | | Cisco Systems, Inc. | | | 1,186,360 | | |
| | 100,600 | | | Motorola Mobility Holdings Inc., (2) | | | 2,217,224 | | |
| | 47,428 | | | Motorola Solutions Inc., (2) | | | 2,183,585 | | |
| | | Total Communications Equipment | | | 5,587,169 | | |
| | | Computers & Peripherals – 0.5% | |
| | 36,000 | | | Hewlett-Packard Company | | | 1,310,400 | | |
| | | Diversified Financial Services – 1.8% | |
| | 70,450 | | | Citigroup Inc. | | | 2,933,538 | | |
| | 38,400 | | | JPMorgan Chase & Co. | | | 1,572,096 | | |
| | | Total Diversified Financial Services | | | 4,505,634 | | |
| | | Diversified Telecommunication Services – 0.6% | |
| | 181,200 | | | Frontier Communications Corporation | | | 1,462,284 | | |
| | | Food & Staples Retailing – 0.6% | |
| | 40,000 | | | CVS Caremark Corporation | | | 1,503,200 | | |
| | | Hotels, Restaurants & Leisure – 0.6% | |
| | 39,200 | | | Hyatt Hotels Corporation, Class A, (2) | | | 1,600,144 | | |
| | | Industrial Conglomerates – 0.3% | |
| | 44,600 | | | General Electric Company | | | 841,156 | | |
Nuveen Investments
18
| Shares | | Description (1) | | Value | |
| | | Insurance – 5.0% | |
| | 187,500 | | | Genworth Financial Inc., Class A, (2) | | $ | 1,927,500 | | |
| | 107,900 | | | Hartford Financial Services Group, Inc. | | | 2,845,323 | | |
| | 31,200 | | | Loews Corporation | | | 1,313,208 | | |
| | 61,800 | | | MetLife, Inc. | | | 2,711,166 | | |
| | 111,800 | | | Symetra Financial Corporation | | | 1,501,474 | | |
| | 86,500 | | | Unum Group | | | 2,204,020 | | |
| | | Total Insurance | | | 12,502,691 | | |
| | | Machinery – 0.7% | |
| | 37,600 | | | Ingersoll Rand Company Limited, Class A | | | 1,707,416 | | |
| | | Media – 2.3% | |
| | 111,000 | | | Interpublic Group Companies, Inc., (2) | | | 1,387,500 | | |
| | 17,337 | | | Metro-Goldwyn-Mayer, (11) | | | 388,493 | | |
| | 81,100 | | | National CineMedia, Inc. | | | 1,371,401 | | |
| | 70,300 | | | Time Warner Inc. | | | 2,556,811 | | |
| | | Total Media | | | 5,704,205 | | |
| | | Metals & Mining – 2.5% | |
| | 56,200 | | | AngloGold Ashanti Limited, Sponsored ADR | | | 2,365,458 | | |
| | 49,500 | | | Barrick Gold Corporation | | | 2,241,855 | | |
| | 37,400 | | | Nucor Corporation | | | 1,541,628 | | |
| | | Total Metals & Mining | | | 6,148,941 | | |
| | | Oil, Gas & Consumable Fuels – 2.1% | |
| | 14,000 | | | Exxon Mobil Corporation, (3) | | | 1,139,320 | | |
| | 16,100 | | | Occidental Petroleum Corporation | | | 1,675,044 | | |
| | 41,000 | | | Total S.A., Sponsored ADR | | | 2,371,440 | | |
| | | Total Oil, Gas & Consumable Fuels | | | 5,185,804 | | |
| | | Pharmaceuticals – 5.6% | |
| | 43,400 | | | GlaxoSmithKline PLC, Sponsored ADR | | | 1,861,860 | | |
| | 56,000 | | | Merck & Company Inc. | | | 1,976,240 | | |
| | 205,000 | | | Pfizer Inc. | | | 4,223,000 | | |
| | 114,200 | | | Sanofi-Aventis, ADR | | | 4,587,414 | | |
| | 27,900 | | | Teva Pharmaceutical Industries Limited, Sponsored ADR | | | 1,345,338 | | |
| | | Total Pharmaceuticals | | | 13,993,852 | | |
| | | Professional Services – 0.3% | |
| | 25,700 | | | Nielsen Holdings BV, (2) | | | 800,812 | | |
| | | Software – 2.2% | |
| | 156,600 | | | CA Inc. | | | 3,576,744 | | |
| | 68,100 | | | Microsoft Corporation | | | 1,770,600 | | |
| | | Total Software | | | 5,347,344 | | |
| | | Tobacco – 0.7% | |
| | 24,700 | | | Philip Morris International | | | 1,649,219 | | |
| | | Wireless Telecommunication Services – 0.9% | |
| | 85,000 | | | Vodafone Group PLC, Sponsored ADR | | | 2,271,200 | | |
| | | Total Common Stocks (cost $78,279,267) | | | 84,008,110 | | |
Nuveen Investments
19
JDD
Nuveen Diversified Dividend and Income Fund (continued)
Portfolio of Investments June 30, 2011 (Unaudited)
| Shares | | Description (1) | | Value | |
| | | Real Estate Investment Trust Common Stocks – 36.4% (27.2% of Total Investments) | |
| | | Diversified – 2.8% | |
| | 170 | | | Colonial Properties Trust | | $ | 3,468,000 | | |
| | 107 | | | Liberty Property Trust | | | 3,494,205 | | |
| | | Total Diversified | | | 6,962,205 | | |
| | | Industrial – 1.7% | |
| | 120 | | | ProLogis | | | 4,284,600 | | |
| | | Mortgage – 0.3% | |
| | 56 | | | Redwood Trust, Inc. | | | 846,720 | | |
| | | Office – 8.6% | |
| | 170 | | | Biomed Realty Trust, Inc. | | | 3,270,800 | | |
| | 28 | | | Boston Properties, Inc. | | | 2,930,016 | | |
| | 134 | | | Commonwealth REIT | | | 3,457,056 | | |
| | 114 | | | Mack-Cali Realty Corporation | | | 3,755,160 | | |
| | 189 | | | Piedmont Office Realty Trust | | | 3,849,632 | | |
| | 49 | | | SL Green Realty Corporation | | | 4,035,769 | | |
| | | Total Office | | | 21,298,433 | | |
| | | Residential – 6.4% | |
| | 151 | | | Apartment Investment & Management Company, Class A | | | 3,850,588 | | |
| | 29 | | | AvalonBay Communities, Inc. | | | 3,746,070 | | |
| | 69 | | | Equity Residential | | | 4,122,000 | | |
| | 168 | | | Equity Lifestyle Properties Inc. | | | 4,255,440 | | |
| | | Total Residential | | | 15,974,098 | | |
| | | Retail – 7.4% | |
| | 31 | | | Federal Realty Investment Trust | | | 2,632,062 | | |
| | 238 | | | General Growth Properties Inc. | | | 3,978,228 | | |
| | 79 | | | Macerich Company | | | 4,239,394 | | |
| | 82 | | | Regency Centers Corporation | | | 3,583,555 | | |
| | 34 | | | Simon Property Group, Inc. | | | 3,990,757 | | |
| | | Total Retail | | | 18,423,996 | | |
| | | Specialized – 9.2% | |
| | 170 | | | Extra Space Storage Inc. | | | 3,626,100 | | |
| | 106 | | | HCP, Inc. | | | 3,878,133 | | |
| | 69 | | | Health Care REIT, Inc. | | | 3,636,021 | | |
| | 225 | | | Host Hotels & Resorts Inc. | | | 3,821,242 | | |
| | 35 | | | Public Storage, Inc. | | | 3,941,782 | | |
| | 72 | | | Ventas Inc. | | | 3,816,203 | | |
| | | Total Specialized | | | 22,719,481 | | |
| | | Total Real Estate Investment Trust Common Stocks (cost $67,485,258) | | | 90,509,533 | | |
| Shares | | Description (1) | | Coupon | | Ratings (4) | | Value | |
| | | Capital Preferred Securities – 0.7% (0.5% of Total Investments) | | | | | | | |
| | | Food Products – 0.7% | |
| | 15 | | | HJ Heinz Finance Company, 144A | | | 8.000 | % | | BB+ | | $ | 1,624,688 | | |
| | | Total Capital Preferred Securities (cost $1,310,000) | | | | | | | 1,624,688 | | |
Nuveen Investments
20
Principal
Amount (000) | | Description (1) | | Weighted
Average
Coupon | | Maturity (5) | | Ratings (4) | | Value | |
| | | | | | | | | Variable Rate Senior Loan Interests – 31.9% (23.8% of Total Investments) (6) | | | | | | | | | | | | | | | | | |
| | | | | | | | | Aerospace & Defense – 0.2% | | | | | | | | | | | | | | | | | |
| $ | 423 | | | | | | | Transdigm, Inc., Term Loan | | | 4.000 | % | | 6/30/17 | | Ba2 | | $ | 425,422 | | |
| | | | | | | | | Auto Components – 0.8% | | | | | | | | | | | | | | | | | |
| | 1,321 | | | | | | | Federal-Mogul Corporation, Tranche B, Term Loan, DD1 | | | TBD | | | TBD | | Ba3 | | | 1,252,969 | | |
| | 674 | | | | | | | Federal-Mogul Corporation, Tranche C, Term Loan, DD1 | | | TBD | | | TBD | | Ba3 | | | 639,270 | | |
| | 1,995 | | | | | | | Total Auto Components | | | | | | | | | | | | | | | 1,892,239 | | |
| | | | | | | | | Biotechnology – 0.4% | | | | | | | | | | | | | | | | | |
| | 900 | | | | | | | Grifols, Term Loan | | | 6.000 | % | | 6/01/17 | | BB | | | 905,250 | | |
| | | | | | | | | Building Products – 0.4% | | | | | | | | | | | | | | | | | |
| | 993 | | | | | | | Goodman Global Inc., Term Loan | | | 5.750 | % | | 10/28/16 | | B+ | | | 997,391 | | |
| | | | | | | | | Chemicals – 0.4% | | | | | | | | | | | | | | | | | |
| | 995 | | | | | | | Univar, Inc., Term Loan | | | 5.000 | % | | 6/30/17 | | B | | | 994,734 | | |
| | | | | | | | | Commercial Services & Supplies – 0.4% | | | | | | | | | | | | | | | | | |
| | 1,000 | | | | | | | KAR Auction Services, Inc., Term Loan | | | 5.000 | % | | 5/19/17 | | BB- | | | 1,003,906 | | |
| | | | | | | | | Communications Equipment – 1.1% | | | | | | | | | | | | | | | | | |
| | 660 | | | | | | | Avaya Inc., Term Loan | | | 5.250 | % | | 10/24/14 | | B+ | | | 635,860 | | |
| | 1,325 | | | | | | | Avaya Inc., Term Loan | | | 1.000 | % | | 10/26/16 | | B1 | | | 1,280,569 | | |
| | 867 | | | | | | | Intelsat, Term Loan | | | 5.250 | % | | 4/02/18 | | BB- | | | 870,639 | | |
| | 2,852 | | | | | | | Total Communications Equipment | | | | | | | | | | | | | | | 2,787,068 | | |
| | | | | | | | | Consumer Finance – 0.3% | | | | | | | | | | | | | | | | | |
| | 750 | | | | | | | Springleaf Financial Funding Company, Term Loan | | | 5.500 | % | | 5/06/17 | | B+ | | | 736,797 | | |
| | | | | | | | | Diversified Financial Services – 0.3% | | | | | | | | | | | | | | | | | |
| | 730 | | | | | | | Pinafore LLC, Term Loan | | | 4.250 | % | | 9/29/16 | | BB | | | 731,446 | | |
| | | | | | | | | Electric Utilities – 0.8% | | | | | | | | | | | | | | | | | |
| | 2,312 | | | | | | | TXU Corporation, 2014 Term Loan | | | 3.690 | % | | 10/10/14 | | B2 | | | 1,940,074 | | |
| | | | | | | | | Electronic Equipment & Instruments – 0.6% | | | | | | | | | | | | | | | | | |
| | 499 | | | | | | | NDS Group, Ltd., Term Loan | | | 4.000 | % | | 3/12/18 | | Ba2 | | | 499,789 | | |
| | 800 | | | | | | | Sensata Technologies B.V., Term Loan | | | 4.000 | % | | 5/12/18 | | BB+ | | | 800,425 | | |
| | 300 | | | | | | | Sensus Metering Systems, Inc., Term Loan, First Lien | | | 4.750 | % | | 5/09/17 | | Ba3 | | | 301,437 | | |
| | 1,599 | | | | | | | Total Electronic Equipment & Instruments | | | | | | | | | | | | | | | 1,601,651 | | |
| | | | | | | | | Food & Staples Retailing – 0.7% | | | | | | | | | | | | | | | | | |
| | 1,984 | | | | | | | U.S. Foodservice, Inc., Term Loan | | | 2.690 | % | | 7/03/14 | | B3 | | | 1,865,426 | | |
| | | | | | | | | Food Products – 0.9% | | | | | | | | | | | | | | | | | |
| | 1,000 | | | | | | | JBS USA LLC, Term Loan | | | 4.250 | % | | 5/25/18 | | BB | | | 1,000,313 | | |
| | 1,375 | | | | | | | Michael Foods Group, Inc., Term Loan | | | 4.250 | % | | 2/25/18 | | B+ | | | 1,377,395 | | |
| | 2,375 | | | | | | | Total Food Products | | | | | | | | | | | | | | | 2,377,708 | | |
| | | | | | | | | Health Care Providers & Services – 4.5% | | | | | | | | | | | | | | | | | |
| | 65 | | | | | | | Community Health Systems, Inc., Delayed Term Loan | | | 2.504 | % | | 7/25/14 | | BB | | | 63,217 | | |
| | 142 | | | | | | | Community Health Systems, Inc., Extended Term Loan | | | 3.754 | % | | 1/25/17 | | BB | | | 138,339 | | |
| | 1,270 | | | | | | | Community Health Systems, Inc., Term Loan | | | 2.504 | % | | 7/25/14 | | BB | | | 1,229,533 | | |
| | 1,990 | | | | | | | DaVita, Inc., Tranche B, Term Loan | | | 4.500 | % | | 10/20/16 | | BB | | | 1,998,172 | | |
| | 748 | | | | | | | Emergency Medical Services, Term Loan | | | 5.250 | % | | 5/25/18 | | B+ | | | 746,722 | | |
| | 2,000 | | | | | | | Golden Living, Term Loan | | | 5.000 | % | | 5/04/18 | | B+ | | | 1,964,990 | | |
| | 917 | | | | | | | Kindred Healthcare, Term Loan | | | 5.250 | % | | 6/01/18 | | Ba3 | | | 916,897 | | |
| | 962 | | | | | | | MultiPlan, Inc., Term Loan B | | | 4.750 | % | | 8/26/17 | | Ba3 | | | 959,586 | | |
Nuveen Investments
21
JDD
Nuveen Diversified Dividend and Income Fund (continued)
Portfolio of Investments June 30, 2011 (Unaudited)
Principal
Amount (000) | | Description (1) | | Weighted
Average
Coupon | | Maturity (5) | | Ratings (4) | | Value | |
| | | | | | | | | Health Care Providers & Services (continued) | | | | | | | | | | | | | | | | | |
| $ | 228 | | | | | | | United Surgical Partners International, Inc., Delayed Term Loan | | | 2.190 | % | | 4/21/14 | | Ba3 | | $ | 221,229 | | |
| | 1,205 | | | | | | | United Surgical Partners International, Inc., Term Loan | | | 2.234 | % | | 4/21/14 | | Ba3 | | | 1,170,718 | | |
| | 1,836 | | | | | | | Universal Health Services, Inc., Term Loan B | | | 4.000 | % | | 11/15/16 | | BB+ | | | 1,843,282 | | |
| | 11,363 | | | | | | | Total Health Care Providers & Services | | | | | | | | | | | | | | | 11,252,685 | | |
| | | | | | | | | Hotels, Restaurants & Leisure – 4.1% | | | | | | | | | | | | | | | | | |
| | 1,980 | | | | | | | 24 Hour Fitness Worldwide, Inc., New Term Loan | | | 6.750 | % | | 4/22/16 | | Ba3 | | | 1,967,625 | | |
| | 1,427 | | | | | | | Dunkin Brands, Inc., Term Loan B2 | | | 4.250 | % | | 11/23/17 | | B | | | 1,426,989 | | |
| | 83 | | | | | | | OSI Restaurant Partners LLC, Revolver | | | 2.499 | % | | 6/14/13 | | B+ | | | 79,965 | | |
| | 857 | | | | | | | OSI Restaurant Partners LLC, Term Loan | | | 2.500 | % | | 6/14/14 | | B+ | | | 822,401 | | |
| | 1,073 | | | | | | | Reynolds Group Holdings, Inc., US Term Loan | | | 4.250 | % | | 2/09/18 | | BB | | | 1,068,319 | | |
| | 2,057 | | | | | | | Seaworld Parks and Entertainment, Inc., Term Loan B | | | 4.000 | % | | 8/17/17 | | BB+ | | | 2,066,133 | | |
| | 1,050 | | | | | | | Six Flags Theme Parks, Inc., Tranche B, Term Loan | | | 5.250 | % | | 6/30/16 | | BB | | | 1,057,875 | | |
| | 89 | | | | | | | Travelport LLC, Letter of Credit | | | 4.746 | % | | 8/23/15 | | Ba3 | | | 85,541 | | |
| | 313 | | | | | | | Travelport LLC, Term Loan | | | 4.746 | % | | 8/21/15 | | Ba3 | | | 299,733 | | |
| | 299 | | | | | | | Venetian Casino Resort LLC, Delayed Term Loan | | | 2.690 | % | | 11/23/16 | | BB | | | 290,141 | | |
| | 1,097 | | | | | | | Venetian Casino Resort LLC, Tranche B, Term Loan | | | 2.690 | % | | 11/23/16 | | BB | | | 1,065,209 | | |
| | 10,325 | | | | | | | Total Hotels, Restaurants & Leisure | | | | | | | | | | | | | | | 10,229,931 | | |
| | | | | | | | | Household Products – 0.4% | | | | | | | | | | | | | | | | | |
| | 995 | | | | | | | Visant Corporation, Term Loan | | | 5.250 | % | | 12/22/16 | | BB- | | | 994,689 | | |
| | | | | | | | | Industrial Conglomerates – 1.2% | | | | | | | | | | | | | | | | | |
| | 2,993 | | | | | | | U.S. Foodservice, Inc., Term Loan, First Lien, WI/DD | | | TBD | | | TBD | | B- | | | 2,912,701 | | |
| | | | | | | | | Insurance – 0.2% | | | | | | | | | | | | | | | | | |
| | 620 | | | | | | | Fidelity National Information Services, Inc., Term Loan B | | | 5.250 | % | | 7/18/16 | | BBB- | | | 623,190 | | |
| | | | | | | | | IT Services – 2.0% | | | | | | | | | | | | | | | | | |
| | 1,581 | | | | | | | First Data Corporation, Extended Term Loan | | | 4.186 | % | | 3/24/18 | | B+ | | | 1,453,386 | | |
| | 168 | | | | | | | First Data Corporation, Term Loan B1 | | | 2.936 | % | | 9/24/14 | | B+ | | | 156,148 | | |
| | 720 | | | | | | | Frac Tech International LLC, Term Loan | | | 6.250 | % | | 5/03/16 | | B+ | | | 719,838 | | |
| | 750 | | | | | | | Infor Global Solutions Intermediate Holdings, Ltd., Term Loan B2, WI/DD | | | TBD | | | TBD | | B+ | | | 742,501 | | |
| | 1,937 | | | | | | | SunGard Data Systems, Inc., Term Loan B | | | 1.939 | % | | 2/28/14 | | BB | | | 1,892,583 | | |
| | 5,156 | | | | | | | Total IT Services | | | | | | | | | | | | | | | 4,964,456 | | |
| | | | | | | | | Leisure Equipment & Products – 0.6% | | | | | | | | | | | | | | | | | |
| | 1,379 | | | | | | | Cedar Fair LP, Term Loan | | | 4.000 | % | | 12/15/17 | | Ba2 | | | 1,385,224 | | |
| | | | | | | | | Media – 5.0% | | | | | | | | | | | | | | | | | |
| | 622 | | | | | | | Bresnan Broadband Holdings LLC, Term Loan B | | | 4.500 | % | | 12/14/17 | | BB+ | | | 622,935 | | |
| | 1,742 | | | | | | | Emmis Operating Company, Term Loan | | | 4.246 | % | | 11/01/13 | | Caa2 | | | 1,624,220 | | |
| | 670 | | | | | | | SuperMedia, Term Loan | | | 11.000 | % | | 12/31/15 | | B- | | | 407,147 | | |
| | 1,298 | | | | | | | Interactive Data Corporation, Term Loan B | | | 4.750 | % | | 2/11/18 | | Ba3 | | | 1,300,522 | | |
| | 1,548 | | | | | | | Knology, Inc., Term Loan | | | 4.000 | % | | 8/18/17 | | B+ | | | 1,544,459 | | |
| | 2,463 | | | | | | | Mediacom Broadband LLC, Tranche D, Term Loan | | | 5.500 | % | | 3/31/17 | | BB- | | | 2,459,298 | | |
| | 33 | | | | | | | Nielsen Finance LLC, Term Loan A | | | 2.190 | % | | 8/09/13 | | Ba2 | | | 32,818 | | |
| | 546 | | | | | | | Nielsen Finance LLC, Term Loan C | | | 3.440 | % | | 5/02/16 | | Ba2 | | | 544,451 | | |
| | 475 | | | | | | | Tribune Company, Term Loan B, (7), (8) | | | 0.000 | % | | 6/04/14 | | Ca | | | 323,329 | | |
| | 1,956 | | | | | | | Univision Communications, Inc., Term Loan | | | 4.436 | % | | 3/31/17 | | B+ | | | 1,861,942 | | |
| | 1,000 | | | | | | | UPC Broadband Holding BV, Term Loan N | | | 3.686 | % | | 12/31/17 | | Ba3 | | | 999,168 | | |
| | 1,570 | | | | | | | Yell Group PLC, Term Loan | | | 3.936 | % | | 7/31/14 | | N/R | | | 634,251 | | |
| | 13,923 | | | | | | | Total Media | | | | | | | | | | | | | | | 12,354,540 | | |
| | | | | | | | | Metals & Mining – 0.5% | | | | | | | | | | | | | | | | | |
| | 1,167 | | | | | | | Walter Energy, Term Loan | | | 4.000 | % | | 4/02/18 | | BB- | | | 1,169,094 | | |
| | | | | | | | | Multiline Retail – 0.8% | | | | | | | | | | | | | | | | | |
| | 1,000 | | | | | | | Bass Pro Group LLC Term Loan B | | | 5.250 | % | | 6/13/17 | | BB- | | | 995,625 | | |
| | 1,000 | | | | | | | Neiman Marcus Group, Inc., Term Loan | | | 4.750 | % | | 5/16/18 | | BB- | | | 989,034 | | |
| | 2,000 | | | | | | | Total Multiline Retail | | | | | | | | | | | | | | | 1,984,659 | | |
Nuveen Investments
22
Principal
Amount (000) | | Description (1) | | Weighted
Average
Coupon | | Maturity (5) | | Ratings (4) | | Value | |
| | | | | | | | | Personal Products – 0.4% | | | | | | | | | | | | | | | | | |
| $ | 931 | | | | | | | NBTY, Inc., Term Loan B1 | | | 4.250 | % | | 10/01/17 | | BB- | | $ | 931,581 | | |
| | | | | | | | | Pharmaceuticals – 0.8% | | | | | | | | | | | | | | | | | |
| | 886 | | | | | | | Warner Chilcott Corporation, Term Loan B1 | | | 4.250 | % | | 3/17/18 | | BBB- | | | 887,622 | | |
| | 443 | | | | | | | Warner Chilcott Corporation, Term Loan B2 | | | 4.250 | % | | 3/17/18 | | BBB- | | | 443,811 | | |
| | 609 | | | | | | | Warner Chilcott Corporation, Term Loan B3 | | | 4.250 | % | | 3/17/18 | | BBB- | | | 610,241 | | |
| | 1,938 | | | | | | | Total Pharmaceuticals | | | | | | | | | | | | | | | 1,941,674 | | |
| | | | | Real Estate Investment Trust – 0.3% | | | | | | | | | | | | | | | | | |
| | 837 | | | | | | | iStar Financial, Inc., Tranche A1 | | | 5.000 | % | | 6/28/13 | | BB- | | | 825,372 | | |
| | | | | Real Estate Management & Development – 0.6% | | | | | | | | | | | | | | | | | |
| | 987 | | | | | | | Capital Automotive LP, Tranche B | | | 5.000 | % | | 3/11/17 | | Ba3 | | | 989,086 | | |
| | 438 | | | | | | | LNR Property Corporation, Term Loan | | | 4.750 | % | | 4/29/16 | | BB+ | | | 438,868 | | |
| | 1,425 | | | | | | | Total Real Estate Management & Development | | | | | | | | | | | | | | | 1,427,954 | | |
| | | | | Road & Rail – 0.4% | | | | | | | | | | | | | | | | | |
| | 973 | | | | | | | Swift Transportation Company, Inc., Term Loan | | | 6.000 | % | | 12/21/16 | | BB- | | | 980,733 | | |
| | | | | Semiconductors & Equipment – 1.2% | | | | | | | | | | | | | | | | | |
| | 1,987 | | | | | | | Freescale Semiconductor, Inc., Term Loan | | | 4.436 | % | | 12/01/16 | | B1 | | | 1,980,527 | | |
| | 998 | | | | | | | NXP Semiconductor LLC, Term Loan | | | 4.500 | % | | 3/04/17 | | B- | | | 1,003,424 | | |
| | 2,985 | | | | | | | Total Semiconductors & Equipment | | | | | | | | | | | | | | | 2,983,951 | | |
| | | | | Specialty Retail – 1.6% | | | | | | | | | | | | | | | | | |
| | 748 | | | | | | | Burlington Coat Factory Warehouse Corporation, Term Loan B | | | 6.250 | % | | 2/23/17 | | B- | | | 747,658 | | |
| | 1,000 | | | | | | | J Crew Group, Term Loan | | | 4.750 | % | | 3/07/18 | | B1 | | | 963,064 | | |
| | 1,833 | | | | | | | Jo-Ann Stores, Inc., Term Loan | | | 4.750 | % | | 3/16/18 | | B+ | | | 1,810,417 | | |
| | 500 | | | | | | | Pilot Travel Centers LLC, Term Loan | | | 4.250 | % | | 3/30/18 | | BB+ | | | 502,345 | | |
| | 4,081 | | | | | | | Total Specialty Retail | | | | | | | | | | | | | | | 4,023,484 | | |
| $ | 81,999 | | | | | | | Total Variable Rate Senior Loan Interests (cost $81,368,725) | | | | | | | | | | | | | | | 79,245,030 | | |
Principal
Amount (000) (9) | | Description (1) | | Coupon | | Maturity | | Ratings (4) | | Value | |
| | | | | Emerging Markets Debt and Foreign Corporate Bonds – 27.3% (20.4% of Total Investments) | | | | | | | | | |
| | | | | Argentina – 1.0% | | | | | | | | | | | | | | | | | |
| | 250 | | | | | | | City of Buenos Aires, Argentina, 144A | | | 12.500 | % | | 4/06/15 | | B | | $ | 283,125 | | |
| | 429 | | | | | | | Republic of Argentina | | | 8.280 | % | | 12/31/33 | | B- | | | 378,870 | | |
| | 448 | | | | | | | Republic of Argentina | | | 8.280 | % | | 12/31/33 | | B | | | 395,594 | | |
| | 558 | | | EUR | | Republic of Argentina | | | 7.820 | % | | 12/31/33 | | B | | | 584,379 | | |
| | 1,660 | | | | | Republic of Argentina | | | 2.500 | % | | 12/31/38 | | B | | | 722,100 | | |
| | 380 | | | EUR | | Republic of Argentina | | | 2.260 | % | | 12/31/38 | | B | | | 188,737 | | |
| | | | | Total Argentina | | | | | | | | | | | | | | | 2,552,805 | | |
| | | | | Brazil – 1.8% | | | | | | | | | | | | | | | | | |
| | 155 | | | | | Banco Bradesco Cayman, 144A | | | 5.900 | % | | 1/16/21 | | Baa1 | | | 156,550 | | |
| | 525 | | | | | Banco de Brazil, 144A | | | 5.875 | % | | 1/26/22 | | Baa1 | | | 519,225 | | |
| | 695 | | | BRL | | Companhia Energetica de Sao Paula, 144A | | | 9.750 | % | | 1/15/15 | | Ba1 | | | 646,350 | | |
| | 265 | | | | | | | Globo Comunicacao Paricipacoes, S.A., 144A | | | 7.250 | % | | 4/26/22 | | BBB | | | 279,575 | | |
| | 120 | | | | | | | Globo Comunicacao Paricipacoes, S.A., 144A | | | 6.250 | % | | 7/20/50 | | BBB | | | 125,700 | | |
| | 605 | | | | | | | Banco Nacional de Desenvolvimento Economico e Social, Reg S | | | 6.369 | % | | 6/16/18 | | BBB- | | | 677,600 | | |
| | 255 | | | | | | | Banco de Nordeste do Brasil, 144A | | | 3.625 | % | | 11/09/15 | | BBB- | | | 250,538 | | |
| | 225 | | | | | | | Companhia de Bebidas Das | | | 8.750 | % | | 9/15/13 | | A- | | | 258,188 | | |
| | 294 | | | | | | | Telemar Norte Leste, S.A., 144A | | | 5.500 | % | | 10/23/20 | | Baa2 | | | 290,325 | | |
| | 255 | | | | | | | Federative Republic of Brazil | | | 8.750 | % | | 2/04/25 | | Baa2 | | | 361,463 | | |
| | 155 | | | | | | | Federative Republic of Brazil | | | 10.125 | % | | 5/15/27 | | Baa2 | | | 242,575 | | |
| | 125 | | | | | | | Federative Republic of Brazil | | | 8.250 | % | | 1/20/34 | | Baa2 | | | 171,875 | | |
Nuveen Investments
23
JDD
Nuveen Diversified Dividend and Income Fund (continued)
Portfolio of Investments June 30, 2011 (Unaudited)
Principal
Amount (000) (9) | | Description (1) | | Coupon | | Maturity | | Ratings (4) | | Value | |
| | | | | Brazil (continued) | | | | | | | | | | | | | | | | | |
| $ | 95 | | | | | | | Federative Republic of Brazil | | | 7.125 | % | | 1/20/37 | | Baa2 | | $ | 117,325 | | |
| | 360 | | | BRL | | | | National Treasury Note of Brazil | | | 6.000 | % | | 5/15/15 | | Baa2 | | | 466,035 | | |
| | | | | Total Brazil | | | | | | | | | | | | | | | 4,563,324 | | |
| | | | | | | | | Canada – 0.3% | | | | | | | | | | | | | | | | | |
| | 375 | | | | | | | Pacific Rubiales Energy Corporation, 144A | | | 8.750 | % | | 11/10/16 | | BB | | | 422,813 | | |
| | 265 | | | | | | | PTTEP Canada International Limited, 144A | | | 5.692 | % | | 4/05/21 | | BBB+ | | | 264,125 | | |
| | | | | Total Canada | | | | | | | | | | | | | | | 686,938 | | |
| | | | | | | Cayman Islands – 0.8% | | | | | | | | | | | | | | | | | |
| | 191 | | | | | | | Fibria Overseas Finance, 144A | | | 7.500 | % | | 5/04/20 | | BB | | | 207,961 | | |
| | 150 | | | | | | | Fibria Overseas Finance, 144A | | | 6.750 | % | | 3/03/21 | | BB | | | 157,125 | | |
| | 195 | | | | | | | Petrobras International Finance Corporation | | | 7.875 | % | | 3/15/19 | | A3 | | | 236,128 | | |
| | 285 | | | | | | | Petrobras International Finance Corporation | | | 5.875 | % | | 3/01/18 | | A3 | | | 306,651 | | |
| | 145 | | | | | | | Braskem SA, Reg S | | | 7.000 | % | | 5/07/20 | | BBB- | | | 158,050 | | |
| | 386 | | | | | | | IPIC GMTN LTD, 144A | | | 5.000 | % | | 11/15/20 | | AA | | | 382,140 | | |
| | 450 | | | | | | | ITAU Unibanco Holding S.A., 144A | | | 5.750 | % | | 1/22/21 | | Baa1 | | | 448,419 | | |
| | | | | Total Cayman Islands | | | | | | | | | | | | | | | 1,896,474 | | |
| | | | | | | Chile – 0.5% | | | | | | | | | | | | | | | | | |
| | 195 | | | | | | | E CL, S.A., 144A | | | 5.625 | % | | 1/15/21 | | BBB- | | | 200,305 | | |
| | 55 | | | | | | | Empresa Nacional del Petroleo, 144A | | | 4.875 | % | | 3/15/14 | | A3 | | | 58,548 | | |
| | 225 | | | | | | | Empresa Nacional del Petroleo, Reg S, 144A | | | 6.250 | % | | 7/08/19 | | A3 | | | 243,553 | | |
| | 450 | | | | | | | Corporacion Nacional del Cobre de Chile, Reg S | | | 5.625 | % | | 9/21/35 | | A1 | | | 456,287 | | |
| | 420 | | | | | | | Codelco, Inc. | | | 3.750 | % | | 11/4/20 | | A1 | | | 399,031 | | |
| | | | | Total Chile | | | | | | | | | | | | | | | 1,357,724 | | |
| | | | | | | China – 0.1% | | | | | | | | | | | | | | | | | |
| | 205 | | | | | | | ENN Energy Holding Limited, 144A | | | 6.000 | % | | 5/13/21 | | BBB- | | | 201,426 | | |
| | | | | | | Colombia – 1.0% | | | | | | | | | | | | | | | | | |
| | 465 | | | | | | | Republic of Colombia | | | 11.750 | % | | 2/25/20 | | BBB- | | | 719,355 | | |
| | 420,000 | | | COP | | | | Republic of Colombia | | | 7.750 | % | | 4/14/21 | | BBB- | | | 269,593 | | |
| | 175,000 | | | COP | | | | Republic of Colombia | | | 9.850 | % | | 6/28/27 | | BBB- | | | 126,645 | | |
| | 535 | | | | | | | Republic of Colombia | | | 10.375 | % | | 1/28/33 | | BBB- | | | 845,300 | | |
| | 395 | | | | | | | Bancolombia S.A. | | | 6.125 | % | | 7/26/20 | | Baa3 | | | 400,412 | | |
| | 125 | | | | | | | Colbun S.A., 144A | | | 6.000 | % | | 1/21/20 | | BBB- | | | 131,050 | | |
| | | | | Total Colombia | | | | | | | | | | | | | | | 2,492,355 | | |
| | | | | | | Costa Rica – 0.0% | | | | | | | | | | | | | | | | | |
| | 20 | | | | | | | Republic of Costa Rica, Reg S | | | 9.995 | % | | 8/01/20 | | BB+ | | | 27,500 | | |
| | | | | | | | | Cote d'Ivoire (Ivory Coast) – 0.1% | | | | | | | | | | | | | | | | | |
| | 690 | | | | | | | Ivory Coast Republic, Reg S, (10) | | | 2.500 | % | | 12/31/32 | | N/A | | | 363,975 | | |
| | | | | | | | | Croatia – 0.3% | | | | | | | | | | | | | | | | | |
| | 325 | | | | | | | Croatia Republic, 144A | | | 6.750 | % | | 11/05/19 | | BBB- | | | 351,000 | | |
| | 130 | | | | | | | Croatia Republic, 144A | | | 6.625 | % | | 7/14/20 | | BBB- | | | 137,638 | | |
| | 215 | | | | | | | Croatia Republic, 144A | | | 6.375 | % | | 3/24/21 | | BBB- | | | 223,600 | | |
| | | | | Total Croatia | | | | | | | | | 712,238 | | |
| | | | | | | | | Dominican Republic – 0.4% | | | | | | | | | | | | | | | | | |
| | 160 | | | | | | | Dominican Republic, Reg S | | | 7.500 | % | | 5/06/21 | | B+ | | | 166,400 | | |
| | 639 | | | | | | | Dominican Republic, Reg S | | | 9.040 | % | | 1/23/18 | | B+ | | | 719,315 | | |
| | | | | Total Dominican Republic | | | | | | | | | 885,715 | | |
Nuveen Investments
24
Principal
Amount (000) (9) | | Description (1) | | Coupon | | Maturity | | Ratings (4) | | Value | |
| | | | | | | | | El Salvador – 0.6% | | | | | | | | | | | | | | | | | |
| $ | 150 | | | | | | | Republic of El Salvador, 144A | | | 7.625 | % | | 2/01/41 | | Ba2 | | $ | 153,750 | | |
| | 105 | | | | | | | Republic of El Salvador, Reg S | | | 7.375 | % | | 12/01/19 | | BB- | | | 115,500 | | |
| | 361 | | | | | | | Republic of El Salvador, Reg S | | | 7.750 | % | | 1/24/23 | | Baa3 | | | 407,930 | | |
| | 510 | | | | | | | Republic of El Salvador, Reg S | | | 7.625 | % | | 9/21/34 | | Baa3 | | | 554,625 | | |
| | 150 | | | | | | | Republic of El Salvador, Reg S | | | 7.625 | % | | 2/01/41 | | Ba2 | | | 153,750 | | |
| | 30 | | | | | | | Republic of El Salvador, Reg S | | | 8.250 | % | | 4/10/32 | | Baa3 | | | 33,525 | | |
| | | | | Total El Salvador | | | | | | | | | | | | | | | 1,419,080 | | |
| | | | | | | | | Germany – 0.1% | | | | | | | | | | | | | | | | | |
| | 215 | | | | | | | Rearden G Holdings, 144A | | | 7.875 | % | | 3/30/20 | | BB- | | | 234,350 | | |
| | | | | | | | | Hungary – 0.5% | | | | | | | | | | | | | | | | | |
| | 90 | | | EUR | | | | Republic of Hungary, Government Bond | | | 5.750 | % | | 6/11/18 | | BBB- | | | 129,600 | | |
| | 40 | | | EUR | | | | Republic of Hungary, Government Bond | | | 6.000 | % | | 1/11/19 | | BBB- | | | 57,498 | | |
| | 612 | | | | | | | Republic of Hungary, Government Bond | | | 6.375 | % | | 3/29/21 | | BBB- | | | 645,660 | | |
| | 400 | | | | | | | Republic of Hungary, Government Bond | | | 7.625 | % | | 3/29/41 | | BBB- | | | 431,500 | | |
| | | | | Total Hungary | | | | | | | | | | | | | | | 1,264,258 | | |
| | | | | | | | | Indonesia – 2.0% | | | | | | | | | | | | | | | | | |
| | 620 | | | | | | | Republic of Indonesia, Reg S | | | 6.750 | % | | 3/10/14 | | BB+ | | | 690,789 | | |
| | 590 | | | | | | | Republic of Indonesia, Reg S | | | 10.375 | % | | 5/04/14 | | BB+ | | | 721,275 | | |
| | 520 | | | | | | | Republic of Indonesia, Reg S | | | 7.250 | % | | 4/20/15 | | BB+ | | | 601,879 | | |
| | 330 | | | | | | | Republic of Indonesia, Reg S | | | 6.875 | % | | 1/17/18 | | BB+ | | | 386,100 | | |
| | 890 | | | | | | | Republic of Indonesia, Reg S | | | 11.625 | % | | 3/04/19 | | BB+ | | | 1,311,638 | | |
| | 335 | | | | | | | Republic of Indonesia, Reg S | | | 4.875 | % | | 5/05/21 | | BB+ | | | 342,956 | | |
| | 125 | | | | | | | Republic of Indonesia, Reg S | | | 8.500 | % | | 10/12/35 | | BB+ | | | 167,813 | | |
| | 560 | | | | | | | Republic of Indonesia, Reg S | | | 7.750 | % | | 1/17/38 | | BB+ | | | 702,100 | | |
| | | | | Total Indonesia | | | | | | | | | | | | | | | 4,924,550 | | |
| | | | | | | | | Ireland – 0.1% | | | | | | | | | | | | | | | | | |
| | 290 | | | | | | | Vneshecono Bank, 144A | | | 6.800 | % | | 11/20/25 | | BBB | | | 294,611 | | |
| | | | | | | | | Kazakhstan – 0.8% | | | | | | | | | | | | | | | | | |
| | 400 | | | | | | | Kazakhstan Development Bank | | | 6.500 | % | | 6/03/20 | | BBB | | | 402,000 | | |
| | 265 | | | | | | | KazMuniaGaz Finance Subsidiary, 144A | | | 9.125 | % | | 7/02/18 | | BBB- | | | 326,586 | | |
| | 430 | | | | | | | KazMuniaGaz Finance Subsidiary, 144A | | | 11.750 | % | | 1/23/15 | | BBB- | | | 534,404 | | |
| | 325 | | | | | | | KazMuniaGaz Finance Subsidiary, Reg S | | | 9.125 | % | | 7/02/18 | | Baa1 | | | 400,563 | | |
| | 150 | | | | | | | Tengizchevroil LLP, 144A | | | 6.124 | % | | 11/15/14 | | Baa2 | | | 159,520 | | |
| | 225 | | | | | | | Kazatomprom | | | 6.250 | % | | 5/20/15 | | Baa3 | | | 241,874 | | |
| | | | | Total Kazakhston, Reg S | | | | | | | | | | | | | | | 2,064,947 | | |
| | | | | | | | | Latvia – 0.1% | | | | | | | | | | | | | | | | | |
| | 250 | | | | | | | Latvia Republic, 144A | | | 5.250 | % | | 6/16/21 | | Baa3 | | | 246,875 | | |
| | | | | | | | | Lithuania – 0.5% | | | | | | | | | | | | | | | | | |
| | 175 | | | | | | | Republic of Lithuania, 144A | | | 7.375 | % | | 2/11/20 | | Baa1 | | | 202,563 | | |
| | 145 | | | | | | | Republic of Lithuania, 144A | | | 6.125 | % | | 3/09/21 | | Baa1 | | | 154,062 | | |
| | 725 | | | | | | | Republic of Lithuania, Reg S | | | 7.375 | % | | 2/11/20 | | Baa1 | | | 833,750 | | |
| | | | | Total Lithuania | | | | | | | | | | | | | | | 1,190,375 | | |
| | | | | | | | | Luxembourg – 0.7% | | | | | | | | | | | | | | | | | |
| | 290 | | | | | | | Alrosa Finance, S.A., 144A | | | 7.750 | % | | 11/3/20 | | BB- | | | 315,375 | | |
| | 360 | | | | | | | Gaz Capital, S.A., 144A | | | 9.250 | % | | 4/23/19 | | BBB | | | 449,550 | | |
| | 140 | | | | | | | Gaz Capital, S.A., Reg S | | | 8.625 | % | | 4/28/34 | | A3 | | | 174,650 | | |
| | 185 | | | | | | | SberBank Capital, S.A. | | | 5.499 | % | | 7/07/15 | | A3 | | | 195,869 | | |
| | 270 | | | | | | | VTB Bank, Reg S | | | 6.315 | % | | 2/22/18 | | Baa1 | | | 276,750 | | |
| | 415 | | | | | | | VTB Capital, S.A., Reg S | | | 6.551 | % | | 10/13/20 | | BBB | | | 421,225 | | |
| | | | | Total Luxembourg | | | | | | | | | | | | | | | 1,833,419 | | |
Nuveen Investments
25
JDD
Nuveen Diversified Dividend and Income Fund (continued)
Portfolio of Investments June 30, 2011 (Unaudited)
Principal
Amount (000) (9) | | Description (1) | | Coupon | | Maturity | | Ratings (4) | | Value | |
| | | | | | | | | Malaysia – 0.6% | | | | | | | | | | | | | | | | | |
| $ | 450 | | | | | | | Penerbangan Malaysia Berhad, Reg S | | | 5.625 | % | | 3/15/16 | | A- | | $ | 498,378 | | |
| | 115 | | | | | | | Pertoliam Nasional Berhad, Reg S | | | 7.625 | % | | 10/15/26 | | A1 | | | 148,295 | | |
| | 565 | | | | | | | Petronas Capital Limited, 144A | | | 5.250 | % | | 8/12/19 | | A1 | | | 605,834 | | |
| | 285 | | | | | | | Petronas Capital Limited, Reg S | | | 5.250 | % | | 8/12/19 | | A1 | | | 306,970 | | |
| | | | | Total Malaysia | | | | | | | | | | | | | | | 1,559,477 | | |
| | | | | | | | | Mexico – 2.4% | | | | | | | | | | | | | | | | | |
| | 8,660 | | | MXN | | | | Mexico Bonos de DeSarrollo | | | 8.000 | % | | 6/11/20 | | A | | | 791,665 | | |
| | 9,000 | | | MXN | | | | Mexico Bonos de DeSarrollo | | | 6.500 | % | | 6/10/21 | | Baa1 | | | 738,783 | | |
| | 120 | | | | | | | Cemex Finance LLC, 144A | | | 9.000 | % | | 1/11/18 | | B | | | 122,100 | | |
| | 230 | | | | | | | Comision Federal de Electricidad, 144A | | | 4.875 | % | | 5/26/21 | | BBB | | | 229,678 | | |
| | 550 | | | | | | | Pemex Project Funding Master Trust | | | 6.625 | % | | 6/15/35 | | BBB | | | 579,713 | | |
| | 100 | | | | | | | Pemex Project Funding Master Trust | | | 5.750 | % | | 3/01/18 | | BBB | | | 109,651 | | |
| | 250 | | | | | | | Petroleos Mexicanos, 144A | | | 6.500 | % | | 6/02/41 | | BBB | | | 253,662 | | |
| | 350 | | | | | | | United Mexican States | | | 5.875 | % | | 2/17/14 | | Baa1 | | | 387,975 | | |
| | 40 | | | | | | | United Mexican States | | | 5.625 | % | | 1/15/17 | | Baa1 | | | 45,460 | | |
| | 77 | | | EUR | | | | United Mexican States | | | 11.000 | % | | 5/08/17 | | Baa1 | | | 151,099 | | |
| | 560 | | | | | | | United Mexican States | | | 5.950 | % | | 3/19/19 | | Baa1 | | | 642,600 | | |
| | 500 | | | | | | | United Mexican States | | | 5.125 | % | | 1/15/20 | | Baa1 | | | 540,000 | | |
| | 335 | | | | | | | United Mexican States | | | 7.500 | % | | 4/08/33 | | Baa1 | | | 423,775 | | |
| | 245 | | | | | | | United Mexican States | | | 6.750 | % | | 9/27/34 | | Baa1 | | | 284,813 | | |
| | 558 | | | | | | | United Mexican States | | | 6.050 | % | | 1/11/40 | | Baa1 | | | 593,712 | | |
| | | | | Total Mexico | | | | | | | | | | | | | | | 5,894,686 | | |
| | | | | | | | | Netherlands – 0.7% | | | | | | | | | | | | | | | | | |
| | 295 | | | | | | | Waha Aerospace BV, 144A | | | 3.925 | % | | 7/28/20 | | B+ | | | 298,181 | | |
| | 375 | | | | | | | Kazakhstan Temir Zholy JSC, Reg S | | | 7.000 | % | | 5/13/16 | | AA | | | 415,313 | | |
| | 690 | | | | | | | Majapahit Holdings BV, Reg S | | | 8.000 | % | | 8/07/19 | | BB | | | 815,925 | | |
| | 120 | | | | | | | Myriad International Holdings, BV, 144A | | | 6.375 | % | | 7/28/17 | | Baa3 | | | 129,600 | | |
| | | | | Total Netherlands | | | | | | | | | | | | | | | 1,659,019 | | |
| | | | | | | | | Panama – 0.8% | | | | | | | | | | | | | | | | | |
| | 43 | | | | | | | Republic of Panama | | | 7.250 | % | | 3/15/15 | | BBB- | | | 50,654 | | |
| | 285 | | | | | | | Republic of Panama | | | 5.200 | % | | 1/30/20 | | BBB- | | | 312,645 | | |
| | 435 | | | | | | | Republic of Panama | | | 7.125 | % | | 1/29/26 | | BBB- | | | 536,138 | | |
| | 615 | | | | | | | Republic of Panama | | | 8.875 | % | | 9/30/27 | | BBB- | | | 871,763 | | |
| | 180 | | | | | | | AES Panama, Reg S | | | 6.350 | % | | 12/21/16 | | BBB- | | | 193,500 | | |
| | | | | Total Panama | | | | | | | | | | | | | | | 1,964,700 | | |
| | | | | | | | | Peru – 1.2% | | | | | | | | | | | | | | | | | |
| | 280 | | | PEN | | | | Banco Credito del Peru, 144A | | | | | | | | | | | | | | | 311,609 | | |
| | 125 | | | | | | | Republic of Peru | | | 9.875 | % | | 2/06/15 | | BBB- | | | 155,625 | | |
| | 655 | | | | | | | Republic of Peru, Reg S | | | 8.375 | % | | 5/03/16 | | BBB- | | | 807,288 | | |
| | 249 | | | | | | | Republic of Peru | | | 7.840 | % | | 8/12/20 | | BBB+ | | | 99,774 | | |
| | 105 | | | | | | | Republic of Peru | | | 7.350 | % | | 7/21/25 | | BBB- | | | 128,258 | | |
| | 900 | | | | | | | Republic of Peru | | | 8.750 | % | | 11/21/33 | | BBB- | | | 1,227,150 | | |
| | 71 | | | | | | | Republic of Peru | | | 6.550 | % | | 3/14/37 | | BBB- | | | 79,201 | | |
| | 75 | | | | | | | Republic of Peru | | | 5.625 | % | | 11/18/50 | | BBB- | | | 70,688 | | |
| | | | | Total Peru | | | | | | | | | | | | | | | 2,879,593 | | |
| | | | | | | | | Philippines – 0.9% | | | | | | | | | | | | | | | | | |
| | 35 | | | | | | | Republic of the Philippines | | | 9.375 | % | | 1/18/17 | | BB | | | 45,413 | | |
| | 230 | | | | | | | Republic of the Philippines | | | 9.875 | % | | 1/15/19 | | BB | | | 315,388 | | |
| | 375 | | | | | | | Republic of the Philippines | | | 8.375 | % | | 6/17/19 | | BB | | | 482,363 | | |
| | 315 | | | | | | | Republic of the Philippines | | | 7.500 | % | | 9/25/24 | | BB | | | 385,875 | | |
| | 270 | | | | | | | Republic of the Philippines | | | 10.625 | % | | 3/16/25 | | BB | | | 413,775 | | |
| | 200 | | | | | | | Republic of the Philippines | | | 5.500 | % | | 3/30/26 | | BB | | | 205,250 | | |
| | 200 | | | | | | | National Power Corporation | | | 5.500 | % | | 3/30/26 | | BB | | | 511,100 | | |
| | | | | Total Philipines | | | | | | | | | | | | | | | 2,359,164 | | |
Nuveen Investments
26
Principal
Amount (000) (9) | | Description (1) | |
Coupon | | Maturity | | Ratings (4) | | Value | |
| | | | | | | | | Poland – 0.9% | | | | | | | | | | | | | | | | | |
| $ | 1,110 | | | | | | | Republic of Poland | | | 3.875 | % | | 7/16/15 | | A2 | | $ | 1,147,740 | | |
| | 340 | | | | | | | Republic of Poland | | | 6.375 | % | | 7/15/19 | | A2 | | | 388,450 | | |
| | 490 | | | | | | | Republic of Poland | | | 5.125 | % | | 4/21/21 | | A2 | | | 506,538 | | |
| | 120 | | | EUR | | | | Republic of Poland | | | 5.250 | % | | 1/20/25 | | A2 | | | 171,111 | | |
| | | | | Total Poland | | | | | | | | | | | | | | | 2,213,839 | | |
| | | | | | | | | Qatar – 0.5% | | | | | | | | | | | | | | | | | |
| | 340 | | | | | | | State of Qatar, Reg S | | | 5.250 | % | | 1/20/20 | | AA | | | 362,440 | | |
| | 282 | | | | | | | Nakilat, Inc., Reg S | | | 6.067 | % | | 12/31/33 | | AA- | | | 290,460 | | |
| | 290 | | | | | | | State of Qatar, Reg S | | | 4.000 | % | | 1/20/15 | | AA | | | 303,775 | | |
| | 210 | | | | | | | State of Qatar, Reg S | | | 9.750 | % | | 6/15/30 | | AA | | | 313,425 | | |
| | | | | Total Qatar | | | | | | | | | | | | | | | 1,270,100 | | |
| | | | | | | | | Russian Federation – 1.8% | | | | | | | | | | | | | | | | | |
| | 1,300 | | | | | | | Russian Federation, 144A | | | 3.625 | % | | 4/29/15 | | Baa1 | | | 1,335,750 | | |
| | 300 | | | | | | | Russian Federation, 144A | | | 5.000 | % | | 4/29/20 | | Baa1 | | | 310,125 | | |
| | 900 | | | | | | | Russian Federation, Reg S | | | 3.625 | % | | 4/29/15 | | Baa1 | | | 924,750 | | |
| | 180 | | | | | | | Russian Federation, Reg S | | | 11.000 | % | | 7/24/18 | | BBB | | | 256,734 | | |
| | 700 | | | | | | | Russian Federation, Reg S | | | 5.000 | % | | 4/29/20 | | Baa1 | | | 723,625 | | |
| | 329 | | | | | | | Russian Federation, Reg S | | | 7.500 | % | | 3/31/30 | | Baa1 | | | 387,455 | | |
| | 375 | | | | | | | Russian Ministry of Finance, Reg S | | | 12.750 | % | | 6/24/28 | | Baa1 | | | 663,750 | | |
| | | | | Total Russian Federation | | | | | | | | | | | | | | | 4,602,189 | | |
| | | | | | | | | Serbia – 0.0% | | | | | | | | | | | | | | | | | |
| | 59 | | | | | | | Republic of Serbia, Reg S | | | 6.750 | % | | 11/01/24 | | BB | | | 58,793 | | |
| | | | | | | | | South Africa – 0.9% | | | | | | | | | | | | | | | | | |
| | 335 | | | | | | | Transnet Limited, 144A | | | 4.500 | % | | 2/10/16 | | A3 | | | 345,749 | | |
| | 200 | | | | | | | Eskom Holdings Limited, Reg S | | | 5.750 | % | | 1/26/21 | | BBB+ | | | 206,500 | | |
| | 145 | | | | | | | Republic of South Africa | | | 6.250 | % | | 3/08/41 | | A3 | | | 155,513 | | |
| | 190 | | | | | | | Republic of South Africa | | | 7.375 | % | | 4/25/12 | | A3 | | | 199,747 | | |
| | 4,765 | | | | | | | Republic of South Africa | | | 8.000 | % | | 12/21/18 | | A | | | 691,305 | | |
| | 485 | | | | | | | Republic of South Africa | | | 6.875 | % | | 5/27/19 | | A3 | | | 578,363 | | |
| | | | | Total South Africa | | | | | | | | | | | | | | | 2,177,177 | | |
| | | | | | | | | South Korea – 0.2% | | | | | | | | | | | | | | | | | |
| | 140 | | | | | | | Republic of Korea | | | 5.750 | % | | 4/16/14 | | A1 | | | 154,132 | | |
| | 115 | | | | | | | National Agricultureal Cooperative Federation, Reg S | | | 5.000 | % | | 9/30/14 | | A | | | 122,672 | | |
| | 135 | | | | | | | Korea Development Bank | | | 8.000 | % | | 1/23/14 | | A1 | | | 153,658 | | |
| | | | | Total South Korea | | | | | | | | | | | | | | | 430,462 | | |
| | | | | | | | | Sri Lanka – 0.1% | | | | | | | | | | | | | | | | | |
| | 170 | | | | | | | Republic of Sri Lanka, 144A | | | 6.250 | % | | 10/04/20 | | B+ | | | 170,000 | | |
| | | | | | | | | Trinidad – 0.1% | | | | | | | | | | | | | | | | | |
| | 185 | | | | | | | Petroleum Company of Trinidad & Tobago Limited, 144A | | | 9.750 | % | | 8/14/19 | | BB | | | 223,388 | | |
| | | | | | | | | Turkey – 1.2% | | | | | | | | | | | | | | | | | |
| | 145 | | | | | | | Republic of Turkey, Government Bond | | | 9.500 | % | | 1/15/14 | | BB | | | 169,795 | | |
| | 135 | | | | | | | Republic of Turkey, Government Bond | | | 7.250 | % | | 3/15/15 | | BB | | | 154,035 | | |
| | 1,220 | | | | | | | Republic of Turkey, Government Bond | | | 7.000 | % | | 9/26/16 | | BB | | | 1,399,950 | | |
| | 820 | | | | | | | Republic of Turkey, Government Bond | | | 5.625 | % | | 3/30/21 | | Ba2 | | | 856,900 | | |
| | 185 | | | | | | | Republic of Turkey, Government Bond | | | 6.750 | % | | 4/03/18 | | BB | | | 210,197 | | |
| | 200 | | | | | | | Republic of Turkey, Government Bond | | | 6.000 | % | | 1/14/41 | | Ba2 | | | 195,000 | | |
| | | | | Total Turkey | | | | | | | | | | | | | | | 2,985,877 | | |
Nuveen Investments
27
JDD
Nuveen Diversified Dividend and Income Fund (continued)
Portfolio of Investments June 30, 2011 (Unaudited)
Principal
Amount (000) (9) | | Description (1) | | Coupon | | Maturity | | Ratings (4) | | Value | |
| | | | | | | | | Ukraine – 1.1% | | | | | | | | | | | | | | | | | |
| $ | 100 | | | | | | | Republic of Ukraine, 144A | | | 6.875 | % | | 9/23/15 | | B+ | | $ | 103,250 | | |
| | 495 | | | | | | | Republic of Ukraine, 144A | | | 6.250 | % | | 6/17/16 | | B+ | | | 494,406 | | |
| | 250 | | | | | | | Republic of Ukraine, 144A | | | 7.750 | % | | 9/23/20 | | B+ | | | 259,375 | | |
| | 810 | | | | | | | Republic of Ukraine, Reg S | | | 7.650 | % | | 6/11/13 | | B+ | | | 850,500 | | |
| | 330 | | | | | | | Republic of Ukraine, Reg S | | | 6.580 | % | | 11/21/16 | | B+ | | | 332,343 | | |
| | 105 | | | | | | | Naftogaz Ukraine | | | 9.500 | % | | 9/30/14 | | N/A | | | 115,106 | | |
| | 666 | | | | | | | Ukraine Cabinet Ministers, 144A | | | 7.950 | % | | 2/23/21 | | B+ | | | 694,305 | | |
| | | | | Total Ukraine | | | | | | | | | | | | | | | 2,849,285 | | |
| | | | | | | | | United Arab Emirates – 0.1% | | | | | | | | | | | | | | | | | |
| | 242 | | | | | | | Dubai Electricity & Water, 144A | | | 7.375 | % | | 10/21/20 | | Ba2 | | | 248,958 | | |
| | 100 | | | | | | | Emirate of Abu Dhabi, Reg S, 144A | | | 6.750 | % | | 4/08/19 | | AA | | | 118,250 | | |
| | | | | Total United Arab Emirates | | | | | | | | | | | | | | | 367,208 | | |
| | | | | | | | | United Kingdom – 0.1% | | | | | | | | | | | | | | | | | |
| | 245 | | | | | | | Vedanta Resources, PLC | | | 8.250 | % | | 6/07/21 | | BB | | | 246,838 | | |
| | | | | | | | | Uruguay – 0.8% | | | | | | | | | | | | | | | | | |
| | 565 | | | | | | | Republic of Uruguay | | | 9.250 | % | | 5/17/17 | | Ba1 | | | 745,800 | | |
| | 85 | | | | | | | Republic of Uruguay | | | 8.000 | % | | 11/18/22 | | BB+ | | | 109,990 | | |
| | 596 | | | | | | | Republic of Uruguay | | | 7.875 | % | | 1/15/33 | | BB+ | | | 752,763 | | |
| | 237 | | | | | | | Republic of Uruguay | | | 7.625 | % | | 3/21/36 | | BB+ | | | 298,182 | | |
| | | | | Total Uruguay | | | | | | | | | | | | | | | 1,906,735 | | |
| | | | | | | | | Venezuela – 1.2% | | | | | | | | | | | | | | | | | |
| | 485 | | | | | | | Petroleos de Venezuela S.A. | | | 8.500 | % | | 1/02/17 | | B+ | | | 359,627 | | |
| | 475 | | | | | | | Petroleos de Venezuela S.A., Reg S | | | 8.500 | % | | 11/02/17 | | B+ | | | 352,212 | | |
| | 665 | | | | | | | Petroleos de Venezuela | | | 5.250 | % | | 4/12/17 | | B+ | | | 417,098 | | |
| | 402 | | | | | | | Republic of Venezuela, Reg S | | | 9.000 | % | | 5/07/23 | | BB- | | | 290,227 | | |
| | 405 | | | | | | | Republic of Venezuela, Reg S | | | 8.250 | % | | 10/13/24 | | BB- | | | 275,399 | | |
| | 760 | | | | | | | Republic of Venezuela, Reg S | | | 9.250 | % | | 5/07/28 | | BB- | | | 541,499 | | |
| | 540 | | | | | | | Republic of Venezuela, Reg S | | | 12.750 | % | | 8/23/22 | | BB- | | | 483,299 | | |
| | 205 | | | | | | | Republic of Venezuela | | | 9.250 | % | | 9/15/27 | | BB- | | | 154,467 | | |
| | | | | Total Venezuela | | | | | | | | | | | | | | | 2,873,828 | | |
| | | | | Total Emerging Markets Debt and Foreign Corporate Bonds (cost $63,800,010) | | | | | | | | | | | | | | | 67,905,297 | | |
Principal
Amount (000) | | Description (1) | | Coupon | | Maturity | | | | Value | |
| | | | | | | | | Short-Term Investments – 3.7% (2.8% of Total Investments) | | | | | | | | | | | | | | | |
| $ | 4,056 | | | | | | | Repurchase Agreement with Fixed Income Clearing Corporation, dated
6/30/11, repurchase price $4,055,564, collateralized by $4,050,000
U.S. Treasury Notes, 1.500%, due 12/31/13, value $4,141,125 | | | 0.010
| % | | 7/01/11
| | | | | | $ | 4,055,563
| | |
| | 5,125 | | | | | | | Repurchase Agreement with Fixed Income Clearing Corporation, dated
6/30/11, repurchase price $5,125,024, collateralized by $5,160,000
U.S. Treasury Notes, 1.375%, due 3/15/12, value $5,230,950 | | | 0.010
| % | | 7/01/11
| | | | | | | 5,125,023
| | |
| $ | 9,181 | | | | | Total Short-Term Investments (cost $9,180,586) | | | | | | | | | 9,180,586 | | |
| | | | | Total Investments (cost $301,423,846) – 133.8% | | | | | | | | | | | | | | | 332,473,244 | | |
| | | | | Borrowings – (32.1)% (12) | | | | | | | | | | | | | | | (79,800,000 | ) | |
| | | | | Other Assets Less Liabilities – (1.7)% (13) | | | | | | | | | | | | | | | (4,233,759 | ) | |
| | | | | Net Assets Applicable to Common Shares – 100% | | | | | | | | | | | | | | $ | 248,439,485 | | |
Nuveen Investments
28
Investments in Derivatives
Forward Foreign Currency Exchange Contracts outstanding at June 30, 2011:
| Counterparty | | Currency Contracts to Deliver | | Amount
(Local Currency) | | In Exchange For
Currency | | Amount
(Local Currency) | | Settlement
Date | | Unrealized
Appreciation
(Depreciation)
(U.S. Dollars) | |
| BNP Paribas | | Brazilian Real | | | 1,647,000 | | | U.S. Dollar | | | 995,587 | | | 9/02/11 | | $ | (45,911 | ) | |
| Citibank | | Colombian Peso | | | 57,633,000 | | | U.S. Dollar | | | 32,120 | | | 7/29/11 | | | (358 | ) | |
| Citibank | | Euro | | | 84,000 | | | U.S. Dollar | | | 120,837 | | | 7/20/11 | | | (925 | ) | |
| JPMorgan Chase | | Euro | | | 40,000 | | | U.S. Dollar | | | 56,906 | | | 9/21/11 | | | (973 | ) | |
| Credit Suisse | | Euro | | | 761,000 | | | U.S. Dollar | | | 1,100,962 | | | 9/21/11 | | | (178 | ) | |
| HSBC | | Kazakhstan Tenge | | | 2,800,000 | | | U.S. Dollar | | | 19,159 | | | 7/13/11 | | | (34 | ) | |
| HSBC | | Mexican Peso | | | 9,586,000 | | | U.S. Dollar | | | 804,174 | | | 9/21/11 | | | (8,895 | ) | |
| Credit Suisse | | Peruvian Nouveau Sol | | | 168,000 | | | U.S. Dollar | | | 59,712 | | | 9/21/11 | | | (1,024 | ) | |
| UBS | | South African Rand | | | 4,707,000 | | | U.S. Dollar | | | 686,512 | | | 9/21/11 | | | (1,769 | ) | |
| State Street Bank | | U.S. Dollar | | | 21,736 | | | Euro | | | 15,000 | | | 9/21/11 | | | (31 | ) | |
| JPMorgan Chase | | U.S. Dollar | | | 345,913 | | | Indonesian Rupiah | | | 2,988,000,000 | | | 7/29/11 | | | 2,474 | | |
| UBS | | U.S. Dollar | | | 170,389 | | | Isreali Shekel | | | 576,000 | | | 9/21/11 | | | (1,838 | ) | |
| Credit Suisse | | U.S. Dollar | | | 531,812 | | | Isreali Shekel | | | 1,844,000 | | | 9/21/11 | | | 7,786 | | |
| Deutsche Bank | | U.S. Dollar | | | 173,919 | | | Kazakhstan Tenge | | | 25,580,000 | | | 7/07/11 | | | 1,409 | | |
| JPMorgan Chase | | U.S. Dollar | | | 152,821 | | | Kazakhstan Tenge | | | 22,350,000 | | | 7/13/11 | | | 373 | | |
| HSBC | | U.S. Dollar | | | 132,288 | | | Kazakhstan Tenge | | | 19,150,000 | | | 7/13/11 | | | (1,028 | ) | |
| Deutsche Bank | | U.S. Dollar | | | 96,161 | | | Kazakhstan Tenge | | | 13,900,000 | | | 9/06/11 | | | (906 | ) | |
| Deutsche Bank | | U.S. Dollar | | | 651,584 | | | Kazakhstan Tenge | | | 93,991,000 | | | 9/12/11 | | | (7,479 | ) | |
| Deutsche Bank | | U.S. Dollar | | | 173,912 | | | Kazakhstan Tenge | | | 25,579,000 | | | 10/07/11 | | | 1,377 | | |
| JPMorgan Chase | | U.S. Dollar | | | 678,346 | | | Malaysian Ringgit | | | 2,060,000 | | | 9/21/11 | | | 3,441 | | |
| JPMorgan Chase | | U.S. Dollar | | | 514,971 | | | Philippine Peso | | | 22,445,000 | | | 7/29/11 | | | 2,693 | | |
| UBS | | U.S. Dollar | | | 515,030 | | | Philippine Peso | | | 22,445,000 | | | 7/29/11 | | | 2,634 | | |
| HSBC | | U.S. Dollar | | | 360,480 | | | Polish Zloty | | | 980,000 | | | 9/21/11 | | | (5,960 | ) | |
| UBS | | U.S. Dollar | | | 14,632 | | | South Afirican Rand | | | 100,000 | | | 9/21/11 | | | (10 | ) | |
| JPMorgan Chase | | U.S. Dollar | | | 343,990 | | | South Korean Won | | | 374,640,000 | | | 9/21/11 | | | 5,420 | | |
| JPMorgan Chase | | U.S. Dollar | | | 636,364 | | | Yuan Renminbi | | | 4,200,000 | | | 9/27/11 | | | 14,789 | | |
| JPMorgan Chase | | U.S. Dollar | | | 48,574 | | | Yuan Renminbi | | | 315,000 | | | 9/27/11 | | | 263 | | |
| | | | | | | | | | | | | $ | (34,660 | ) | |
Interest Rate Swaps outstanding at June 30, 2011:
| Counterparty | | Notional
Amount | | Fund
Pay/Receive
Floating Rate | | Floating
Rate Index | | Fixed Rate* | | Fixed Rate
Payment
Frequency | | Termination
Date | | Unrealized
Appreciation
(Depreciation) | |
| JPMorgan | | $ | 19,950,000 | | | Receive | | 1-Month USD-LIBOR | | | 0.360 | % | | Monthly | | 3/21/12 | | $ | (10,966 | ) | |
| JPMorgan | | | 19,950,000 | | | Receive | | 1-Month USD-LIBOR | | | 1.193 | % | | Monthly | | 3/21/14 | | | (144,722 | ) | |
| Morgan Stanley | | | 19,950,000 | | | Receive | | 1-Month USD-LIBOR | | | 2.064 | % | | Monthly | | 3/21/16 | | | (211,136 | ) | |
| | | | | | | | | | | | | | | $ | (366,824 | ) | |
* Annualized.
Nuveen Investments
29
JDD
Nuveen Diversified Dividend and Income Fund (continued)
Portfolio of Investments June 30, 2011 (Unaudited)
For Fund portfolio compliance purposes, the Fund's industry classifications refer to any one or more of the industry subclassifications used by one or more widely recognized market indexes or ratings group indexes, and/or as defined by Fund management. This definition may not apply for purposes of this report, which may combine industry subclassifications into sectors for reporting ease.
(1) All percentages shown in the Portfolio of Investments are based on net assets applicable to Common shares unless otherwise noted.
(2) Non-income producing; issuer has not declared a dividend within the past twelve months.
(3) Investment, or portion of investment, has been pledged to collateralize the net payment obligations for investments in derivatives.
(4) Ratings: Using the highest of Standard & Poor's Group ("Standard & Poor's"), Moody's Investor Service, Inc. ("Moody's") or Fitch, Inc. ("Fitch") rating. Ratings below BBB by Standard & Poor's, Baa by Moody's or BBB by Fitch are considered to be below investment grade. Holdings designated N/R are not rated by any of these national rating agencies.
(5) Senior Loans generally are subject to mandatory and/or optional prepayment. Because of these mandatory prepayment conditions and because there may be significant economic incentives for a Borrower to prepay, prepayments of Senior Loans may occur. As a result, the actual remaining maturity of Senior Loans held may be substantially less than the stated maturities shown.
(6) Senior Loans generally pay interest at rates which are periodically adjusted by reference to a base short-term, floating lending rate plus an assigned fixed rate. These floating lending rates are generally (i) the lending rate referenced by the London Inter-Bank Offered Rate ("LIBOR"), or (ii) the prime rate offered by one or more major United States banks.
Senior Loans may be considered restricted in that the Fund ordinarily is contractually obligated to receive approval from the Agent Bank and/or Borrower prior to the disposition of a Senior Loan.
(7) At or subsequent to June 30, 2011, this issue was under the protection of the Federal Bankruptcy Court.
(8) Non-income producing; denotes that the issuer has defaulted on the payment of principal or interest.
(9) Principal Amount (000) denominated in U.S. Dollars, unless otherwise noted.
(10) At or subsequent to the end of the reporting period, this security is non-income producing. Non-income producing security, in the case of a bond, generally denotes that the issuer has (1) defaulted on the payment of principal or interest, (2) is under the protection of the Federal Bankruptcy Court or (3) the Fund's Adviser has concluded that the issue is not likely to meet its future interest payment obligations and has directed the Fund's custodian to cease accruing additional income on the Fund's records.
(11) For fair value measurement disclosure purposes, Common Stock categorized as Level 2. See Notes to Financial Statements, Footnote 1—General Information and Significant Accounting Policies, Investment Valuation for more information.
(12) Borrowings as a percentage of Total Investments is 24.0%.
(13) Other Assets Less Liabilities includes Value and/or Net Unrealized Appreciation (Depreciation) of derivative instruments as noted within Investments in Derivatives.
N/A Not applicable.
N/R Not rated.
DD1 Investment, or portion of investment purchased on a delayed delivery basis.
WI/DD Purchased on a when-issued or delayed delivery basis.
144A Investment is exempt from registration under Rule 144A of the Securities Act of 1933, as amended. These investments may only be resold in transactions exempt from registration, which are normally those transactions with qualified institutional buyers.
ADR American Depositary Receipt.
Reg S Regulation S allows U.S. companies to sell securities to persons or entities located outside of the United States without registering those securities with the Securities and Exchange Commission. Specifically, Regulation S provides a safe harbor from the registration requirements of the Securities Act for the offers and sales of securities by both foreign and domestic issuers that are made outside the United States.
TBD Senior Loan purchased on a when-issued or delayed-delivery basis. Certain details associated with this purchase are not known prior to the settlement date of the transaction. In addition, Senior Loans typically trade without accrued interest and therefore a weighted average coupon rate is not available prior to settlement. At settlement, if still unknown, the Borrower or counterparty will provide the Fund with the final weighted average coupon rate and maturity date.
BRL Brazilian Real
COP Columbian Peso
EUR Euro
MXN Mexican Peso
PEN Peruvian Nuevo Sol
USD-LIBOR United States Dollar—London Inter-Bank Offered Rate
See accompanying notes to financial statements.
Nuveen Investments
30
Statement of
ASSETS & LIABILITIES
June 30, 2011 (Unaudited)
| Assets | |
| Investments, at value (cost $301,423,846) | | $ | 332,473,244 | | |
| Unrealized appreciation on forward foreign currency exchange contracts | | | 42,659 | | |
| Receivables: | |
| Dividends | | | 396,112 | | |
| Interest | | | 1,482,799 | | |
| Investments sold | | | 4,283,717 | | |
| Matured senior loans | | | 229,376 | | |
| Reclaims | | | 25,863 | | |
| Other assets | | | 138,361 | | |
| Total assets | | | 339,072,131 | | |
| Liabilities | |
| Borrowings | | | 79,800,000 | | |
| Unrealized depreciation on forward foreign currency exchange contracts | | | 77,319 | | |
| Payables: | |
| Investments purchased | | | 4,994,485 | | |
| Common share dividends | | | 4,903,456 | | |
| Unrealized depreciation on interest rate swaps | | | 366,824 | | |
| Accrued expenses: | |
| Interest on borrowings | | | 74,963 | | |
| Management fees | | | 214,373 | | |
| Other | | | 201,226 | | |
| Total liabilities | | | 90,632,646 | | |
| Net assets applicable to Common shares | | $ | 248,439,485 | | |
| Common shares outstanding | | | 19,962,818 | | |
| Net asset value per Common share outstanding (net assets applicable to Common shares, divided by Common shares outstanding) | | $ | 12.45 | | |
| Net assets applicable to Common shares consist of: | |
| Common shares, $.01 par value per share | | $ | 199,628 | | |
| Paid-in surplus | | | 274,089,898 | | |
| Undistributed (Over-distribution of) net investment income | | | (5,923,297 | ) | |
| Accumulated net realized gain (loss) | | | (50,575,899 | ) | |
| Net unrealized appreciation (depreciation) | | | 30,649,155 | | |
| Net assets applicable to Common shares | | $ | 248,439,485 | | |
| Authorized shares: | |
| Common | | | Unlimited | | |
| FundPreferred | | | Unlimited | | |
See accompanying notes to financial statements.
Nuveen Investments
31
Statement of
OPERATIONS
Six Months Ended June 30, 2011 (Unaudited)
| Investment Income | |
| Dividends (net of foreign tax withheld of $55,070) | | $ | 2,515,245 | | |
| Interest | | | 4,409,298 | | |
| Total investment income | | | 6,924,543 | | |
| Expenses | |
| Management fees | | | 1,431,274 | | |
| Shareholders' servicing agent fees and expenses | | | 677 | | |
| Interest expense on borrowings | | | 554,221 | | |
| Custodian's fees and expenses | | | 83,303 | | |
| Trustees' fees and expenses | | | 13,057 | | |
| Professional fees | | | 65,603 | | |
| Shareholders' reports — printing and mailing expenses | | | 56,527 | | |
| Stock exchange listing fees | | | 4,422 | | |
| Investor relations expense | | | 29,778 | | |
| Other expenses | | | 10,427 | | |
| Total expenses before custodian fee credit and expense reimbursement | | | 2,249,289 | | |
| Custodian fee credit | | | (147 | ) | |
| Expense reimbursement | | | (136,825 | ) | |
| Net expenses | | | 2,112,317 | | |
| Net investment income (loss) | | | 4,812,226 | | |
| Realized and Unrealized Gain (Loss) | |
| Net realized gain (loss) from: | | | | | |
| Investments and foreign currency | | | 12,355,863 | | |
| Call options written | | | 755,913 | | |
| Forward foreign currency exchange contracts | | | (196,836 | ) | |
| Interest rate swaps | | | (146,584 | ) | |
| Change in net unrealized appreciation (depreciation) of: | | | | | |
| Investments and foreign currency | | | (3,279,762 | ) | |
| Call options written | | | 93,838 | | |
| Forward foreign currency exchange contracts | | | (68,414 | ) | |
| Interest rate swaps | | | (366,824 | ) | |
| Net realized and unrealized gain (loss) | | | 9,147,194 | | |
| Net increase (decrease) in net assets applicable to Common shares from operations | | $ | 13,959,420 | | |
See accompanying notes to financial statements.
Nuveen Investments
32
Statement of
CHANGES in NET ASSETS (Unaudited)
| | | Six Months
Ended
6/30/11 | | Year
Ended
12/31/10 | |
| Operations | |
| Net investment income (loss) | | $ | 4,812,226 | | | $ | 7,119,184 | | |
| Net realized gain (loss) from: | |
| Investments and foreign currency | | | 12,355,863 | | | | 17,955,345 | | |
| Call options written | | | 755,913 | | | | 67,700 | | |
| Forward foreign currency exchange contracts | | | (196,836 | ) | | | 309,630 | | |
| Interest rate swaps | | | (146,584 | ) | | | — | | |
| Change in net unrealized appreciation (depreciation) of: | |
| Investments and foreign currency | | | (3,279,762 | ) | | | 15,818,516 | | |
| Call options written | | | 93,838 | | | | (214,275 | ) | |
| Forward foreign currency exchange contracts | | | (68,414 | ) | | | (95,919 | ) | |
| Interest rate swaps | | | (366,824 | ) | | | — | | |
Net increase (decrease) in net assets applicable to Common shares
from operations | | | 13,959,420 | | | | 40,960,181 | | |
| Distributions to Common Shareholders | |
| From and in excess of net investment income | | | (9,981,409 | ) | | | — | | |
| From net investment income | | | — | | | | (18,768,363 | ) | |
Decrease in net assets applicable to Common shares from distributions
to Common shareholders | | | (9,981,409 | ) | | | (18,768,363 | ) | |
| Capital Share Transactions | |
| Cost of Common shares repurchased and retired | | | — | | | | (295,844 | ) | |
Net increase (decrease) in net assets applicable to Common shares from
capital share transactions | | | — | | | | (295,844 | ) | |
| Net increase (decrease) in net assets applicable to Common shares | | | 3,978,011 | | | | 21,895,974 | | |
| Net assets applicable to Common shares at the beginning of period | | | 244,461,474 | | | | 222,565,500 | | |
| Net assets applicable to Common shares at the end of period | | $ | 248,439,485 | | | $ | 244,461,474 | | |
Undistributed (Over-distribution of) net investment income at
the end of period | | $ | (5,923,297 | ) | | $ | (754,114 | ) | |
See accompanying notes to financial statements.
Nuveen Investments
33
Statement of
CASH FLOWS
Six Months Ended June 30, 2011 (Unaudited)
| Cash Flows from Operating Activities: | |
| Net Increase (Decrease) In Net Assets Applicable to Common Shares from Operations | | $ | 13,959,420 | | |
Adjustments to reconcile the net increase (decrease) in net assets applicable to Common shares
from operations to net cash provided by (used in) operating activities: | |
| Purchases of investments | | | (148,299,521 | ) | |
| Proceeds from sales and maturities of investments | | | 130,374,679 | | |
| Proceeds from (Purchase of) short-term investments, net | | | 2,094,472 | | |
| Proceeds from (Payments for) closed foreign currency spot contracts | | | (25,096 | ) | |
| Proceeds from (Payments for) cash denominated in foreign currencies, net | | | 62 | | |
| Cash paid for terminated call options written | | | (89,429 | ) | |
| Premiums received for call options written | | | 502,275 | | |
| Proceeds from (Payments for) interest rate swap contracts | | | (146,584 | ) | |
| Amortization (Accretion) of premiums and discounts, net | | | (159,638 | ) | |
| (Increase) Decrease in: | |
| Receivable for dividends | | | 19,264 | | |
| Receivable for interest | | | (11,164 | ) | |
| Receivable for investments sold | | | (320,900 | ) | |
| Receivables for matured senior loans | | | 1,451 | | |
| Receivable for reclaims | | | 12,987 | | |
| Other assets | | | (40,837 | ) | |
| Increase (Decrease) in: | |
| Payable for investments purchased | | | 1,772,830 | | |
| Accrued interest on borrowings | | | 5,370 | | |
| Accrued management fees | | | 4,829 | | |
| Accrued other expenses | | | (34,552 | ) | |
| Net realized (gain) loss from: | |
| Investments and foreign currency | | | (12,355,863 | ) | |
| Call options written | | | (755,913 | ) | |
| Interest rate swaps | | | 146,584 | | |
| Paydowns | | | (463,497 | ) | |
| Change in net unrealized (appreciation) depreciation of: | |
| Investments and foreign currency | | | 3,279,762 | | |
| Call options written | | | (93,838 | ) | |
| Forward foreign currency exchange contracts | | | 68,414 | | |
| Interest rate swaps | | | 366,824 | | |
| Capital gain and return of capital distributions from investments | | | 429,525 | | |
| Net cash provided by (used in) operating activities | | | (9,758,084 | ) | |
| Cash Flows from Financing Activities: | |
| Cash distribution paid to Common shareholders | | | (5,077,953 | ) | |
| Increase (Decrease) in borrowings | | | 14,800,000 | | |
| Net cash provided by (used in) financing activities | | | 9,722,047 | | |
| Net Increase (Decrease) in Cash | | | (36,037 | ) | |
| Cash at the beginning of period | | | 36,037 | | |
| Cash at the End of Period | | $ | — | | |
Supplemental Disclosure of Cash Flow Information
Cash paid for interest on borrowings (excluding amortization of borrowing costs), was $452,662.
See accompanying notes to financial statements.
Nuveen Investments
34
Intentionally Left Blank
Nuveen Investments
35
Financial
HIGHLIGHTS (Unaudited)
Selected data for a Common share outstanding throughout each period:
| | | | |
| | | | | Investment Operations | | Less Distributions | |
| | | Beginning
Common
Share
Net Asset
Value | | Net
Investment
Income
(Loss)(a) | | Net
Realized/
Unrealized
Gain (Loss)(b) | | Distributions
from Net
Investment
Income to
Fund-
Preferred
Share-
holders(c) | | Distributions
from Capital
Gains to
Fund-
Preferred
Share-
holders(c) | | Total | | Net
Investment
Income to
Common
Share-
holders | | Capital
Gains to
Common
Share-
holders | | Return of
Capital to
Common
Share-
holders | | Total | |
| Year Ended 12/31: | |
| | 2011 | (g) | | $ | 12.25 | | | $ | 0.24 | | | $ | 0.46 | | | $ | — | | | $ | — | | | $ | .70 | | | $ | (.50 | )*** | | $ | — | | | $ | — | | | $ | (.50 | ) | |
| | 2010 | | | | 11.13 | | | | .36 | | | | 1.70 | | | | — | | | | — | | | | 2.06 | | | | (.94 | ) | | | — | | | | — | | | | (.94 | ) | |
| | 2009 | | | | 8.30 | | | | .46 | | | | 3.24 | | | | — | * | | | — | * | | | 3.70 | | | | (.47 | ) | | | — | | | | (.41 | ) | | | (.88 | ) | |
| | 2008 | | | | 16.09 | | | | .89 | | | | (7.19 | ) | | | (.18 | ) | | | — | | | | (6.48 | ) | | | (.78 | ) | | | (.06 | ) | | | (.47 | ) | | | (1.31 | ) | |
| | 2007 | | | | 19.22 | | | | 1.02 | | | | (2.30 | ) | | | (.12 | ) | | | (.19 | ) | | | (1.59 | ) | | | (.90 | ) | | | (.64 | ) | | | — | | | | (1.54 | ) | |
| | 2006 | | | | 16.88 | | | | .99 | | | | 2.98 | | | | (.13 | ) | | | (.15 | ) | | | 3.69 | | | | (.98 | ) | | | (.37 | ) | | | — | | | | (1.35 | ) | |
| | | FundPreferred Shares at End of Period | | Borrowings at End of Period | |
| | | Aggregate
Amount
Outstanding
(000) | | Liquidation
Value
Per Share | | Asset
Coverage
Per Share | | Aggregate
Amount
Outstanding
(000) | | Asset
Coverage
Per $1,000 | |
| Year Ended 12/31: | |
| | 2011 | (g) | | $ | — | | | $ | — | | | $ | — | | | $ | 79,800 | | | $ | 4,113 | | |
| | 2010 | | | | — | | | | — | | | | — | | | | 65,000 | | | | 4,761 | | |
| | 2009 | | | | — | | | | — | | | | — | | | | 65,000 | | | | 4,424 | | |
| | 2008 | | | | 72,000 | | | | 25,000 | | | | 83,203 | | | | — | | | | — | | |
| | 2007 | | | | 120,000 | | | | 25,000 | | | | 92,729 | | | | 45,000 | | | | 10,891 | | |
| | 2006 | | | | 120,000 | | | | 25,000 | | | | 105,715 | | | | 45,000 | | | | 12,276 | | |
(a) Per share Net Investment Income (Loss) is calculated using the average daily shares method.
(b) Net of federal corporate income taxes on long-term capital gains retained by the Fund per share as follows:
| | | Long-Term
Capital Gains
Retained | |
| Year Ended 12/31: | | | |
| | 2011 | (g) | | | N/A | | |
| | 2010 | | | | N/A | | |
| | 2009 | | | | N/A | | |
| | 2008 | | | | N/A | | |
| | 2007 | | | $ | .25 | | |
| | 2006 | | | | .25 | | |
(c) The amounts shown are based on Common share equivalents
Nuveen Investments
36
| | | | | | | Ratios/Supplemental Data | |
| | | | | | | | | Total Returns | | | | Ratios to Average Net Assets
Applicable to Common Shares
Before Reimbursement(e) | | Ratios to Average Net Assets
Applicable to Common Shares
After Reimbursement(e)(f) | |
| |
| | | Discount
from
Common
Shares
Repurchased
and Retired | | Ending
Common
Share
Net Asset
Value | | Ending
Market
Value | | Based
on
Market
Value(d) | | Based
on
Common
Share
Net
Asset
Value(d) | | Ending Net
Assets
Applicable to
Common
Shares (000) | | Expenses | | Net
Investment
Income | | Expenses | | Net
Investment
Income | | Portfolio
Turnover
Rate | |
| Year Ended 12/31: | |
| | 2011 | (g) | | $ | — | | | $ | 12.45 | | | $ | 11.42 | | | | 9.50 | % | | | 5.73 | % | | $ | 248,439 | | | | 1.81 | %** | | | 3.76 | %** | | | 1.70 | %** | | | 3.87 | %** | | | 40 | % | |
| | 2010 | | | | — | * | | | 12.25 | | | | 10.89 | | | | 22.16 | | | | 19.18 | | | | 244,461 | | | | 1.78 | | | | 2.88 | | | | 1.61 | | | | 3.06 | | | | 67 | | |
| | 2009 | | | | .01 | | | | 11.13 | | | | 9.73 | | | | 72.17 | | | | 47.30 | | | | 222,566 | | | | 1.89 | | | | 4.73 | | | | 1.59 | | | | 5.02 | | | | 77 | | |
| | 2008 | | | | — | | | | 8.30 | | | | 6.32 | | | | (49.58 | ) | | | (42.60 | ) | | | 167,623 | | | | 2.13 | | | | 6.28 | | | | 1.65 | | | | 6.77 | | | | 49 | | |
| | 2007 | | | | — | | | | 16.09 | | | | 14.28 | | | | (25.75 | ) | | | (9.00 | ) | | | 325,097 | | | | 2.20 | | | | 5.06 | | | | 1.74 | | | | 5.53 | | | | 48 | | |
| | 2006 | | | | — | | | | 19.22 | | | | 21.03 | | | | 38.72 | | | | 22.66 | | | | 387,432 | | | | 1.70 | | | | 5.03 | | | | 1.26 | | | | 5.47 | | | | 44 | | |
(d) • Total Return Based on Market Value is the combination of changes in the market price per share and the effect of reinvested dividend income and reinvested capital gains distributions, if any, at the average price paid per share at the time of reinvestment. The last dividend declared in the period, which is typically paid on the first business day of the following month, is assumed to be reinvested at the ending market price. The actual reinvestment for the last dividend declared in the period takes place over several days, and in some instances may not be based on the market price, so the actual reinvestment price may be different from the price used in the calculation. Total returns are not annualized.
Total Return Based on Common Share Net Asset Value is the combination of changes in Common Share net asset value, reinvested dividend income at net asset value and reinvested capital gains distributions at net asset value, if any. The last dividend declared in the period, which is typically paid on the first business day of the following month, is assumed to be reinvested at the ending net asset value. The actual reinvest price for the last dividend declared in the period may often be based on the Fund's market price (and not its net asset value), and therefore may be different from the price used in the calculation. Total returns are not annualized.
• The Fund elected to retain a portion of its realized long-term capital gains for the following tax years ended December 31, (which is the fiscal year end for the Fund) and pay required federal corporate income taxes on these amounts. As reported on Form 2439, Common shareholders on record date must include their pro-rata share of these gains on their applicable federal tax returns, and are entitled to take offsetting tax credits, for their pro-rata share of the taxes paid by the Fund. The standardized total returns shown above do not include the economic benefit to Common shareholders on record date of these tax credits/refunds. The Fund's corresponding Total Returns Based on Market Value and Common Share Net Asset Value when these benefits are included are as follows:
| | | | | Total Returns | |
| | | Common
Shareholders
of Record on | | Based on
Market Value | | Based on
Common Share
Net Asset Value | |
| Year Ended 12/31: | |
| | 2011 | (g) | | | N/A | | | | 9.50 | % | | | 5.73 | % | |
| | 2010 | | | | N/A | | | | 22.16 | | | | 19.18 | | |
| | 2009 | | | | N/A | | | | 72.17 | | | | 47.30 | | |
| | 2008 | | | | N/A | | | | (49.58 | ) | | | (42.60 | ) | |
| | 2007 | | | | December 31 | | | | (24.47 | ) | | | (7.60 | ) | |
| | 2006 | | | | December 29 | | | | 40.37 | | | | 24.26 | | |
(e) • Ratios do not reflect the effect of dividend payments to FundPreferred shareholders, when applicable.
• Net Investment Income ratios reflect income earned and expenses incurred on assets attributable to FundPreferred shares and/or borrowings, where applicable.
• Each ratio includes the effect of the interest expense paid on borrowings as follows:
| | | Ratios of Borrowings Interest Expense to
Average Net Assets Applicable to Common Shares(h) | |
| Year Ended 12/31: | | | |
| | 2011 | (g) | | | .45 | %** | |
| | 2010 | | | | .38 | | |
| | 2009 | | | | .38 | | |
| | 2008 | | | | .38 | | |
| | 2007 | | | | .66 | | |
| | 2006 | | | | .26 | ** | |
(f) After expense reimbursement from the Adviser, where applicable. Ratios do not reflect the effect of custodian fee credits earned on the Fund's net cash on deposit with the custodian bank, where applicable.
(g) For the six months ended June 30, 2011.
(h) Borrowings Interest Expense includes all interest expense and other costs related to borrowings.
* Rounds to less than $.01 per share.
** Annualized.
*** Represents distributions paid "From and in excess of net investment income" for the six months ended June 30, 2011.
N/A Not applicable for the six months ended June 30, 2011. The Fund had no retained capital gains for the tax years ended December 31, 2010, December 31, 2009 and December 31, 2008.
See accompanying notes to financial statements.
Nuveen Investments
37
Notes to
FINANCIAL STATEMENTS (Unaudited)
1. General Information and Significant Accounting Policies
General Information
Nuveen Diversified Dividend and Income Fund (the "Fund") is a closed-end registered investment company registered under the Investment Company Act of 1940, as amended. The Fund's Common shares are listed on the New York Stock Exchange ("NYSE") and trade under the ticker symbol "JDD." The Fund was organized as a Massachusetts business trust on July 18, 2003.
The Fund's investment objectives are high current income and total return. The Fund invests primarily in U.S. and foreign dividend-paying common stocks, dividend-paying common stocks issued by Real Estate Investment Trusts ("REITs"), debt securities and other non-equity instruments that are issued by, or that are related to, government, government-related and supernational issuers located, or conducting their business, in emerging market countries ("emerging markets debt and foreign corporate bonds") and senior loans.
Effective January 1, 2011, the Fund's adviser, Nuveen Asset Management, a wholly-owned subsidiary of Nuveen Investments, Inc. ("Nuveen"), changed its name to Nuveen Fund Advisors, Inc. (the "Adviser").
Significant Accounting Policies
The following is a summary of significant accounting policies followed by the Fund in the preparation of its financial statements in accordance with U.S. generally accepted accounting principles ("U.S. GAAP").
Investment Valuation
Common stocks and other equity-type securities are valued at the last sales price on the securities exchange on which such securities are primarily traded and are generally classified as Level 1 for fair value measurement purposes. Securities primarily traded on the NASDAQ National Market ("NASDAQ") are valued, except as indicated below, at the NASDAQ Official Closing Price and are generally classified as Level 1. However, securities traded on a securities exchange or NASDAQ for which there were no transactions on a given day or securities not listed on a securities exchange or NASDAQ are valued at the quoted bid price. Prices of certain American Depositary Receipts ("ADR") held by the Fund that trade in the United States are valued based on the last traded price, official closing price, or the most recent bid price of the underlying non-U.S.-traded stock, adjusted as appropriate for the underlying-to-ADR conversion ratio and foreign exchange rate, and from time-to-time foreign currencies may also be adjusted further to take into account material events that may take place after the close of the local non-U.S. market but before the close of the NYSE. These securities generally represent a transfer from a Level 1 to a Level 2 security.
Prices of fixed-income securities, forward foreign currency exchange contracts and swap contracts are provided by a pricing service approved by the Fund's Board of Trustees. These securities are generally classified as Level 2. When price quotes are not readily available the pricing service establishes a security's fair value using methods that may include consideration of the following: yields or prices of investments of comparable quality, type of issue, coupon, maturity and rating, market quotes or indications of value from security dealers, evaluations of anticipated cash flows or collateral, general market conditions and other information and analysis, including the obligor's credit characteristics considered relevant. In pricing certain securities, particularly less liquid and lower quality securities, the pricing service may consider information about a security, its issuer, or market activity, provided by the Adviser. These securities are generally classified as Level 2 or Level 3 depending on the priority of significant inputs.
Like most fixed income instruments, the senior and subordinated loans in which the Fund invests are not listed on an organized exchange. The secondary market of such investments may be less liquid relative to markets for other fixed-income securities. Consequently, the value of senior and subordinated loans, determined as described above, may differ significantly from the value that would have been determined had there been an active market for that senior loan. These securities are generally classified as Level 2.
The value of exchange-traded options are based on the mean of the closing bid and ask prices. Exchange-traded options are generally classified as Level 1. Options traded in the over-the-counter market are valued using an evaluated mean price and are generally classified as Level 2.
Nuveen Investments
38
Repurchase agreements are valued at contract amount plus accrued interest, which approximates market value. These securities are generally classified as Level 2.
Certain securities may not be able to be priced by the pre-established pricing methods as described above. Such securities may be valued by the Fund's Board of Trustees or its designee at fair value. These securities generally include, but are not limited to, restricted securities (securities which may not be publicly sold without registration under the Securities Act of 1933, as amended) for which a pricing service is unable to provide a market price; securities whose trading has been formally suspended; debt securities that have gone into default and for which there is no current market quotation; a security whose market price is not available from a pre-established pricing source; a security with respect to which an event has occurred that is likely to materially affect the value of the security after the market has closed but before the calculation of a Fund's net asset value (as may be the case in non-U.S. markets on which the security is primarily traded) or make it difficult or impossible to obtain a reliable market quotation; and a security whose price, as provided by the pricing service, is not deemed to reflect the security's fair value. As a general principle, the fair value of a security would appear to be the amount that the owner might reasonably expect to receive for it in a current sale. A variety of factors may be considered in determining the fair value of such securities, which may include consideration of the following: yields or prices of investments of comparable quality, type of issue, coupon, maturity and rating, market quotes or indications of value from security dealers, evaluations of anticipated cash flows or collateral, general market conditions and other information and analysis, including the obligor's credit characteristics considered relevant. These securities are generally classified as Level 2 or Level 3 depending on the priority of the significant inputs. Regardless of the method employed to value a particular security, all valuations are subject to review by the Fund's Board of Trustees or its designee.
Refer to Footnote 2—Fair Value Measurements for further details on the leveling of securities held by the Fund as of the end of the reporting period.
Investment Transactions
Investment transactions are recorded on a trade date basis. Trade date for senior and subordinated loans purchased in the "primary market" is considered the date on which the loan allocations are determined. Trade date for senior and subordinated loans purchased in the "secondary market" is the date on which the transaction is entered into. Realized gains and losses from investment transactions are determined on the specific identification method, which is the same basis used for federal income tax purposes. Investments purchased on a when-issued/delayed delivery basis may have extended settlement periods. Any investments so purchased are subject to market fluctuation during this period. The Fund has instructed the custodian to segregate assets with a current value at least equal to the amount of the when-issued/delayed delivery purchase commitments. At June 30, 2011, the Fund had outstanding when-issued/delayed delivery purchase commitments of $4,583,987.
Investment Income
Dividend income is recorded on the ex-dividend date or, for foreign securities, when information is available. Interest income, which reflects the amortization of premiums and includes accretion of discounts for financial reporting purposes, is recorded on an accrual basis. Interest income also reflects paydown gains and losses and fee income, if any. Fee income consists primarily of amendment fees. Amendment fees are earned as compensation for evaluating and accepting changes to an original senior loan agreement and are recognized when received. Other income includes the increase of the net realizable value of the receivable of matured senior loans during the current fiscal period, when applicable.
Income Taxes
The Fund intends to distribute substantially all of its investment company taxable income to shareholders and to otherwise comply with the requirements of Subchapter M of the Internal Revenue Code applicable to regulated investment companies. In any year when the Fund realizes net capital gains, the Fund may choose to distribute all or a portion of its net capital gains to shareholders, or alternatively, to retain all or a portion of its net capital gains and pay federal corporate income taxes on such retained gains.
For all open tax years and all major taxing jurisdictions, management of the Fund has concluded that there are no significant uncertain tax positions that would require recognition in the financial statements. Open tax years are those that are open for examination by taxing authorities (i.e., generally the last four tax year ends and the interim tax period since then). Furthermore, management of the Fund is also not aware of any tax positions for which it is reasonably possible that the total amounts of unrecognized tax benefits will significantly change in the next twelve months.
Dividends and Distributions to Common Shareholders
Distributions to Common shareholders are recorded on the ex-dividend date. The amount and timing of distributions are determined in accordance with federal income tax regulations, which may differ from U.S. GAAP.
The Fund makes quarterly cash distributions to Common shareholders of a stated dollar amount per share. Subject to approval and oversight by the Fund's Board of Trustees, the Fund seeks to maintain a stable distribution level designed to deliver the long-term return potential of the Fund's investment strategy through regular quarterly distributions (a "Managed Distribution Program"). Total distributions during a calendar year generally will be made from the Fund's net investment income, net realized capital gains and net unrealized capital gains in the Fund's portfolio, if any. The portion of distributions paid attributed to net unrealized gains, if any, is distributed from the Fund's assets and is treated by shareholders as a non-taxable distribution ("Return of Capital") for tax purposes. In the event that total distributions during a calendar year exceed the Fund's total return on net asset value, the difference will reduce
Nuveen Investments
39
Notes to
FINANCIAL STATEMENTS (Unaudited) (continued)
net asset value per share. If the Fund's total return on net asset value exceeds total distributions during a calendar year, the excess will be reflected as an increase in net asset value per share. The final determination of the source and character of all distributions for the fiscal year are made after the end of the fiscal year and are reflected in the financial statements contained in the annual report as of December 31 each year.
REIT distributions received by the Fund are generally comprised of ordinary income, long-term and short-term capital gains, and a return of REIT capital. The actual character of amounts received during the period are not known until after the fiscal year end. For the fiscal year ended December 31, 2010, the character of distributions to the Fund from the REITs was 65.03% ordinary income, 13.90% long-term and short-term capital gains, and 21.07% return of REIT capital.
For the fiscal year ended December 31, 2010, the Fund applied the actual character of distributions reported by the REITs in which the Fund invests to its receipts from the REITs. If a REIT held in the portfolio of investments did not report the actual character of its distributions during the period, the Fund treated the distributions as ordinary income.
For the six months ended June 30, 2011, the Fund applied the actual percentages for the fiscal year ended December 31, 2010, described above, to its receipts from the REITs and treated as income on the Statement of Operations only the amount of ordinary income so calculated. The Fund adjusts that estimated breakdown of income type (and consequently its net investment income) as necessary early in the following calendar year when the REITs inform their shareholders of the actual breakdown of income type.
The actual character of distributions made by the Fund during the fiscal year ended December 31, 2010, is reflected in the accompanying financial statements.
The distributions made by the Fund during the six months ended June 30, 2011, are provisionally classified as being "From and in excess of net investment income," and those distributions will be classified as being from net investment income, net realized capital gains and/or a return of capital for tax purposes after the fiscal year end. For purposes of calculating "Undistributed (Over-distribution of) net investment income" as of June 30, 2011, the distribution amounts provisionally classified as "From and in excess of net investment income" were treated as being entirely from net investment income. Consequently, the financial statements at June 30, 2011, reflect an over-distribution of net investment income.
FundPreferred Shares
The Fund is authorized to issue auction rate preferred ("FundPreferred") shares. During the fiscal year ended December 31, 2009, the Fund redeemed all $120,000,000 of its outstanding FundPreferred shares, at liquidation value.
During the fiscal year ended December 31, 2010, lawsuits pursuing claims made in a demand letter alleging that the Fund's Board of Trustees breached their fiduciary duties related to the redemption at par of the Fund's FundPreferred shares had been filed on behalf of shareholders of the Fund, against the Adviser, the Nuveen holding company, the majority owner of the holding company, the lone interested trustee, and current and former officers of the Fund. Nuveen and the other defendants have filed a motion to dismiss the lawsuits, which are still pending before the court. Nuveen and the other named defendants believe these lawsuits to be without merit, and all named parties are defending themselves vigorously against these charges.
During the current reporting period, Nuveen Investments, LLC, known as Nuveen Securities, LLC, effective April 30, 2011, ("Nuveen Securities") entered into a settlement with the Financial Industry Regulatory Authority ("FINRA") with respect to certain allegations regarding Nuveen-sponsored closed-end fund Auction Rate Preferred Shares ("ARPS") marketing brochures. As part of this settlement, Nuveen Securities neither admitted to nor denied FINRA's allegations. Nuveen Securities is the broker-dealer subsidiary of Nuveen.
The settlement with FINRA concludes an investigation that followed the widespread failure of auctions for ARPS and other auction rate securities, which generally began in mid-February 2008. In the settlement, FINRA alleged that certain marketing materials provided by Nuveen Securities were false and misleading. Nuveen Securities agreed to a censure and the payment of a $3 million fine.
Foreign Currency Transactions
The Fund is authorized to engage in foreign currency exchange transactions, including foreign currency forwards, futures, options and swap contracts. To the extent that the Fund invests in securities and/or contracts that are denominated in a currency other than U.S. dollars, the Fund will be subject to currency risk, which is the risk that an increase in the U.S. dollar relative to the foreign
Nuveen Investments
40
currency will reduce returns or portfolio value. Generally, when the U.S. dollar rises in value against a foreign currency, the Fund's investments denominated in that currency will lose value because its currency is worth fewer U.S. dollars; the opposite effect occurs if the U.S. dollar falls in relative value. Investments and other assets and liabilities denominated in foreign currencies are converted into U.S. dollars on a spot (i.e. cash) basis at the spot rate prevailing in the foreign currency exchange market at the time of valuation. Purchases and sales of investments and income denominated in foreign currencies are translated into U.S. dollars on the respective dates of such transactions.
The books and records of the Fund are maintained in U.S. dollars. Foreign currencies, investments and other assets and liabilities are translated into U.S. dollars at 4:00 p.m. Eastern time. Investments, income and expenses are translated on the respective dates of such transactions. Net realized foreign currency gains and losses resulting from changes in exchange rates include foreign currency gains and losses between trade date and settlement date of the transactions, foreign currency transactions, and the difference between the amounts of interest and dividends recorded on the books of the Fund and the amounts actually received.
The realized gains and losses resulting from changes in foreign currency exchange rates and changes in foreign exchange rates associated with other assets and liabilities on investments, forward foreign currency exchange contracts, options written and swap contracts are recognized as a component of "Net realized gain (loss) from investments and foreign currency" on the Statement of Operations, when applicable.
The unrealized gains and losses resulting from changes in foreign currency exchange rates and changes in foreign exchange rates associated with other assets and liabilities on investments are recognized as a component of "Change in unrealized appreciation (depreciation) of investments and foreign currency" on the Statement of Operations, when applicable. The unrealized gains and losses resulting from changes in foreign exchange rates associated with forward foreign currency exchange contracts, options written and swap contracts are recognized as a component of "Change in net unrealized appreciation (deprecation) of forward foreign currency exchange contracts, call options written and interest rate swaps, respectively" on the Statement of Operations, when applicable.
Forward Foreign Currency Exchange Contracts
The Fund is subject to foreign currency exchange rate risk in the normal course of pursuing its investment objectives and is authorized to enter into forward foreign currency exchange contracts in an attempt to manage such risk under two circumstances: (i) when the Fund enters into a contract for the purchase or sale of a security denominated in a foreign currency to "lock in" the U.S. exchange rate of the transaction, with such period being a short-dated contract covering the period between transaction date and settlement date; or (ii) when Wellington Management Company LLP ("Wellington"), one of the Fund's sub-advisors, believes that the currency of a particular foreign country may experience a substantial movement against the U.S. dollar or against another foreign currency. Forward foreign currency exchange contracts are valued daily at the forward rate and are recognized as a component of "Unrealized appreciation or depreciation on forward foreign currency exchange contracts" on the Statement of Assets and Liabilities. The change in value of the contracts during the reporting period is recognized as a component of "Change in net unrealized appreciation (depreciation) of forward foreign currency exchange contracts" on the Statement of Operations. When the contract is closed or offset with the same counterparty, the Fund recognizes the difference between the value of the contract at the time it was entered and the value at the time it was closed or offset as a component of "Net realized gain (loss) from forward foreign currency exchange contracts" on the Statement of Operations.
Forward foreign currency exchange contracts will generally not be entered into for terms greater than three months, but may have maturities of up to six months or more. The use of forward foreign currency exchange contracts does not eliminate fluctuations in the underlying prices of the Fund's investment securities; however, it does establish a rate of exchange that can be achieved in the future. The use of forward foreign currency exchange contracts involves the risk that anticipated currency movements will not be accurately predicted. A forward foreign currency exchange contract would limit the risk of loss due to a decline in the value of a particular currency; however, it also would limit any potential gain that might result should the value of the currency increase instead of decrease. These contracts may involve market risk in excess of the unrealized appreciation or depreciation reflected on the Statement of Assets and Liabilities. Forward foreign currency contracts are subject to counterparty risk if the counterparty fails to perform as specified in the contract due to financial impairment or other reason.
During the six months ended June 30, 2011, the Fund entered into forward foreign currency exchange contracts, buying currencies expected to appreciate and selling currencies expected to depreciate.
The average number of forward foreign currency exchange contracts outstanding during the six months ended June 30, 2011, was 29. The average number of outstanding contracts is calculated based on the outstanding contracts at the beginning of the fiscal year and at the end of each fiscal quarter within the current fiscal year. Refer to Footnote 3—Derivative Instruments and Hedging Activities for further details on forward foreign currency exchange contract activity.
Options Transactions
The Fund is subject to equity price risk in the normal course of pursuing its investment objectives and is authorized to purchase and write (sell) call and put options on securities, futures, swaps ("swaptions") or currencies in an attempt to manage such risk. The purchase of options involves the risk of loss of all or a part of the cash paid for the options (the premium). The market risk associated with purchasing options is limited to the premium paid. The counterparty credit risk of purchasing options, however, needs to take
Nuveen Investments
41
Notes to
FINANCIAL STATEMENTS (Unaudited) (continued)
into account the current value of the option, as this is the performance expected from the counterparty. When the Fund purchases an option, an amount equal to the premium paid (the premium plus commission) is recognized as a component of "Options purchased, at value" on the Statement of Assets and Liabilities. When the Fund writes an option, an amount equal to the net premium received (the premium less commission) is recognized as a component of "Call options written, at value" on the Statement of Assets and Liabilities and is subsequently adjusted to reflect the current value of the written option until the option is exercised or expires or the Fund enters into a closing purchase transaction. The changes in the value of options written during the fiscal period are recognized as a component of "Change in net unrealized appreciation (depreciation) of call options written" on the Statement of Operations. When a written call option is exercised or expires or the Fund enters into a closing purchase transaction, the difference between the net premium received and any amount paid at expiration or on executing a closing purchase transaction, including commission, is recognized as a component of "Net realized gain (loss) from call options written" on the Statement of Operations. The Fund, as a writer of an option, has no control over whether the underlying instrument may be sold (called) or purchased (put) and as a result bears the risk of an unfavorable change in the market value of the instrument underlying the written option. There is also the risk a Fund may not be able to enter into a closing transaction because of an illiquid market.
During the six months ended June 30, 2011, the Fund wrote covered call options on individual stocks held in its portfolio to enhance returns while foregoing some upside potential.
The Fund did not purchase put or call options or write put options during the six months ended June 30, 2011. The average notional amount of call options written during the six months ended June 30, 2011, was as follows:
| Average notional amount of call options written* | | $ | (3,600,267 | ) | |
* The average notional amount is calculated based on the outstanding notional at the beginning of the fiscal year and at the end of each fiscal quarter within the current fiscal year.
Refer to Footnote 3—Derivative Instruments and Hedging Activities and Footnote 5—Investment Transactions for further details on options activity.
Interest Rate Swap Contracts
The Fund is subject to interest rate risk in the normal course of pursuing its investment objectives and is authorized to invest in interest rate swap transactions in an attempt to manage such risk. The Fund's use of interest rate swap contracts is intended to mitigate the negative impact that an increase in short-term interest rates could have on Common share net earnings as a result of leverage. Interest rate swap contracts involve the Fund's agreement with the counterparty to pay or receive a fixed rate payment in exchange for the counterparty receiving or paying a variable rate payment that is intended to approximate the Fund's variable rate payment obligation on FundPreferred shares or any variable rate borrowing. The payment obligation is based on the notional amount of the interest rate swap contract. Interest rate swap contracts do not involve the delivery of securities or other underlying assets or principal. Accordingly, the risk of loss with respect to the swap counterparty on such transactions is limited to the net amount of interest payments that the Fund is to receive. Interest rate swap positions are valued daily. The Fund accrues the fixed rate payment expected to be paid or received and the variable rate payment expected to be received or paid on interest rate swap contracts on a daily basis, and recognizes the daily change in the fair value of the Fund's contractual rights and obligations under the contracts. The net amount recorded for these transactions for each counterparty is recognized on the Statement of Assets and Liabilities as a component of "Unrealized appreciation or depreciation on interest rate swaps" with the change during the fiscal period recognized on the Statement of Operations as a component of "Change in net unrealized appreciation (depreciation) of interest rate swaps." Income received or paid by the Fund is recognized as a component of "Net realized gain (loss) from interest rate swaps" on the Statement of Operations, in addition to the net realized gains or losses recognized upon the termination of an interest rate swap contract and are equal to the difference between the Fund's basis in the interest rate swap and the proceeds from (or cost of) the closing transaction. Payments received or made at the beginning of the measurement period are recognized as a component of "Interest rate swap premiums paid and/or received" on the Statement of Assets and Liabilities. For tax purposes, periodic payments are treated as ordinary income or expense.
Nuveen Investments
42
During the six months ended June 30, 2011, the Fund entered into interest rate swap contracts to partially fix the interest cost of leverage, which the Fund uses through the use of bank borrowing.
The average notional amount of interest rate swap contracts outstanding during the six months ended June 30, 2011, was as follows:
| Average notional amount of interest rate swap contracts outstanding* | | $ | 39,900,000 | | |
* The average notional amount is calculated based on the outstanding notional at the beginning of the fiscal year and at the end of each fiscal quarter within the current fiscal year.
Refer to Footnote 3—Derivative Instruments and Hedging Activities for further details on interest rate swap contract activity.
Market and Counterparty Credit Risk
In the normal course of business the Fund may invest in financial instruments and enter into financial transactions where risk of potential loss exists due to changes in the market (market risk) or failure of the other party to the transaction to perform (counterparty credit risk). The potential loss could exceed the value of the financial assets recorded on the financial statements. Financial assets, which potentially expose the Fund to counterparty credit risk, consist principally of cash due from counterparties on forward, option and swap transactions, when applicable. The extent of the Fund's exposure to counterparty credit risk in respect to these financial assets approximates their carrying value as recorded on the Statement of Assets and Liabilities. Futures contracts, when applicable, expose the Fund to minimal counterparty credit risk as they are exchange traded and the exchange's clearinghouse, which is counterparty to all exchange traded futures, guarantees the futures contracts against default.
The Fund helps manage counterparty credit risk by entering into agreements only with counterparties the Adviser believes have the financial resources to honor their obligations and by having the Adviser monitor the financial stability of the counterparties. Additionally, counterparties may be required to pledge collateral daily (based on the daily valuation of the financial asset) on behalf of the Fund with a value approximately equal to the amount of any unrealized gain above a pre-determined threshold. Reciprocally, when the Fund has an unrealized loss, the Fund has instructed the custodian to pledge assets of the Fund as collateral with a value approximately equal to the amount of the unrealized loss above a pre-determined threshold. Collateral pledges are monitored and subsequently adjusted if and when the valuations fluctuate, either up or down, by at least the pre-determined threshold amount.
Repurchase Agreements
In connection with transactions in repurchase agreements, it is the Fund's policy that its custodian take possession of the underlying collateral securities, the fair value of which exceeds the principal amount of the repurchase transaction, including accrued interest, at all times. If the counterparty defaults, and the fair value of the collateral declines, realization of the collateral may be delayed or limited.
Zero Coupon Securities
The Fund is authorized to invest in zero coupon securities. A zero coupon security does not pay a regular interest coupon to its holders during the life of the security. Income to the holder of the security comes from accretion of the difference between the original purchase price of the security at issuance and the par value of the security at maturity and is effectively paid at maturity. The market prices of zero coupon securities generally are more volatile than the market prices of securities that pay interest periodically.
Custodian Fee Credit
The Fund has an arrangement with the custodian bank whereby certain custodian fees and expenses are reduced by net credits earned on the Fund's cash on deposit with the bank. Such deposit arrangements are an alternative to overnight investments. Credits for cash balances may be offset by charges for any days on which the Fund overdraws its account at the custodian bank.
Indemnifications
Under the Fund's organizational documents, its officers and trustees are indemnified against certain liabilities arising out of the performance of their duties to the Fund. In addition, in the normal course of business, the Fund enters into contracts that provide general indemnifications to other parties. The Fund's maximum exposure under these arrangements is unknown as this would involve future claims that may be made against the Fund that have not yet occurred. However, the Fund has not had prior claims or losses pursuant to these contracts and expects the risk of loss to be remote.
Use of Estimates
The preparation of financial statements in conformity with U.S. GAAP requires management to make estimates and assumptions that affect the reported amounts of assets and liabilities at the date of the financial statements and the reported amounts of increases and decreases in net assets applicable to Common shares from operations during the reporting period. Actual results may differ from those estimates.
2. Fair Value Measurements
Fair value is defined as the price that the Fund would receive upon selling an investment or transferring a liability in an orderly transaction to an independent buyer in the principal or most advantageous market for the investment. A three-tier hierarchy is used to maximize the use of observable market data and minimize the use of unobservable inputs and to establish classification of fair value measurements for disclosure purposes. Observable inputs reflect the assumptions market participants would use in pricing the asset or liability. Observable inputs are based on market data obtained from sources independent of the reporting entity.
Nuveen Investments
43
Notes to
FINANCIAL STATEMENTS (Unaudited) (continued)
Unobservable inputs reflect the reporting entity's own assumptions about the assumptions market participants would use in pricing the asset or liability. Unobservable inputs are based on the best information available in the circumstances. The three-tier hierarchy of inputs is summarized in the three broad levels listed below:
Level 1 — Quoted prices in active markets for identical securities.
Level 2 — Other significant observable inputs (including quoted prices for similar securities, interest rates, prepayment speeds, credit risk, etc.).
Level 3 — Significant unobservable inputs (including management's assumptions in determining the fair value of investments).
The inputs or methodologies used for valuing securities are not an indication of the risk associated with investing in those securities. The following is a summary of the Fund's fair value measurements as of June 30, 2011:
| | | Level 1 | | Level 2 | | Level 3 | | Total | |
| Investments: | |
| Common Stocks* | | $ | 82,362,917 | | | $ | 1,645,193 | | | $ | — | | | $ | 84,008,110 | | |
| REIT Common Stocks | | | 90,509,533 | | | | — | | | | — | | | | 90,509,533 | | |
| Capital Preferred Securities | | | — | | | | 1,624,688 | | | | — | | | | 1,624,688 | | |
| Variable Rate Senior Loan Interests | | | — | | | | 79,245,030 | | | | — | | | | 79,245,030 | | |
| Emerging Markets Debt and Foreign Corporate Bonds | | | — | | | | 67,905,297 | | | | — | | | | 67,905,297 | | |
| Short-Term Investments | | | — | | | | 9,180,586 | | | | — | | | | 9,180,586 | | |
| Derivatives: | |
| Forward Foreign Currency Exchange Contracts** | | | — | | | | (34,660 | ) | | | — | | | | (34,660 | ) | |
| Interest Rate Swaps** | | | — | | | | (366,824 | ) | | | — | | | | (366,824 | ) | |
| Total | | $ | 172,872,450 | | | $ | 159,199,310 | | | $ | — | | | $ | 332,071,760 | | |
* Refer to the Fund's Portfolio of Investments for industry breakdown of Common Stocks classified as Level 2.
** Represents net unrealized appreciation (depreciation) as reported in the Fund's Portfolio of Investments.
The following is a reconciliation of the Fund's Level 3 investments held at the beginning and end of the measurement period:
| | | Level 3
Emerging Markets
Debt and Foreign
Corporate Bonds | |
| Balance at the beginning of period | | $ | 42,700 | | |
| Gains (losses): | |
| Net realized gains (losses) | | | — | | |
| Net change in unrealized appreciation (depreciation) | | | (12,200 | ) | |
| Purchases at cost | | | — | | |
| Sales at proceeds | | | (30,500 | ) | |
| Net discounts (premiums) | | | — | | |
| Transfers in to | | | — | | |
| Transfers out of | | | — | | |
| Balance at the end of period | | $ | — | | |
Change in net unrealized appreciation (depreciation) during the period of Level 3 securities held as of
June 30, 2011 | | $ | — | | |
During the six months ended June 30, 2011, the Fund recognized no significant transfers to or from Level 1, Level 2 or Level 3.
Nuveen Investments
44
3. Derivative Instruments and Hedging Activities
The Fund records derivative instruments at fair value, with changes in fair value recognized on the Statement of Operations, when applicable. Even though the Fund's investments in derivatives may represent economic hedges, they are not considered to be hedge transactions for financial reporting purposes. For additional information on the derivative instruments in which the Fund was invested during and at the end of the reporting period, refer to the Portfolio of Investments, Financial Statements and Footnote 1—General Information and Significant Accounting Policies.
The following table presents the fair value of all derivative instruments held by the Fund as of June 30, 2011, the location of these instruments on the Statement of Assets and Liabilities, and the primary underlying risk exposure.
| | | | | Location on the Statement of Assets and Liabilities | |
| Underlying | | Derivative | | Asset Derivatives | | Liability Derivatives | |
| Risk Exposure | | Instrument | | Location | | Value | | Location | | Value | |
Foreign Currency
Exchange Rate | | Forward Foreign Currency
Exchange Contracts | | Unrealized appreciation on forward
foreign currency exchange contracts | | $ | 42,659
| | | Unrealized depreciation on forward
foreign currency exchange contracts | | $ | 77,319
| | |
| Interest Rate | | Swaps | | Unrealized appreciation
on interest rate swaps* | | | —
| | | Unrealized depreciation
on interest rate swaps* | | | 366,824 | | |
| Total | | | | | | $ | 42,659 | | | | | $ | 444,143 | | |
* Value represents cumulative gross appreciation (depreciation) of swap contracts as reported in the Fund's Portfolio of Investments.
The following tables present the amount of net realized gain (loss) and change in net unrealized appreciation (depreciation) recognized for the six months ended June 30, 2011, on derivative instruments, as well as the primary risk exposure associated with each.
| Net Realized Gain (Loss) from Call Options Written | |
| Risk Exposure | |
| Equity Price | | $ | 755,913 | | |
| Net Realized Gain (Loss) from Forward Foreign Currency Exchange Contracts | |
| Risk Exposure | |
| Foreign Currency Exchange Rate | | $ | (196,836 | ) | |
| Net Realized Gain (Loss) from Interest Rate Swaps | |
| Risk Exposure | |
| Interest Rate | | $ | (146,584 | ) | |
| Change in Net Unrealized Appreciation (Depreciation) of Call Options Written | |
| Risk Exposure | |
| Equity Price | | $ | 93,838 | | |
| Change in Net Unrealized Appreciation (Depreciation) of Forward Foreign Currency Exchange Contracts | |
| Risk Exposure | |
| Foreign Currency Exchange Rate | | $ | (68,414 | ) | |
| Change in Net Unrealized Appreciation (Depreciation) of Interest Rate Swaps | |
| Risk Exposure | |
| Interest Rate | | $ | (366,824 | ) | |
4. Fund Shares
Common Shares
Transactions in Common shares were as follows:
| | | Six Months
Ended
6/30/11 | | Year
Ended
12/31/10 | |
| Common shares repurchased and retired | | | — | | | | (30,100 | ) | |
| Weighted average: | |
| Price per Common share repurchased and retired | | | — | | | $ | 9.81 | | |
| Discount per Common share repurchased and retired | | | — | | | | 15.61 | % | |
Nuveen Investments
45
Notes to
FINANCIAL STATEMENTS (Unaudited) (continued)
5. Investment Transactions
Purchases and sales (including maturities but excluding short-term investments and derivative transactions) during the six months ended June 30, 2011, aggregated $148,299,521 and $130,374,679, respectively.
Transactions in call options written during the six months ended June 30, 2011, were as follows:
| | | Number of
Contracts | | Premiums
Received | |
| Options outstanding, beginning of period | | | 4,471 | | | $ | 343,067 | | |
| Options written | | | 2,466 | | | | 502,275 | | |
| Options terminated in closing purchase transactions | | | (3,865 | ) | | | (493,736 | ) | |
| Options exercised | | | (357 | ) | | | (89,684 | ) | |
| Options expired | | | (2,715 | ) | | | (261,922 | ) | |
| Options outstanding, end of period | | | — | | | $ | — | | |
6. Income Tax Information
The following information is presented on an income tax basis. Differences between amounts for financial statement and federal income tax purposes are primarily due to the treatment of paydown gains and losses, recognition of premium amortization and timing differences in recognizing certain gains and losses on investment transactions. To the extent that differences arise that are permanent in nature, such amounts are reclassified within the capital accounts as detailed below. Temporary differences do not require reclassification. Temporary and permanent differences do not impact the net asset value of the Fund.
At June 30, 2011, the cost and unrealized appreciation (depreciation) of investments (excluding investments in derivatives), as determined on a federal income tax basis, were as follows:
| Cost of investments | | $ | 308,528,224 | | |
| Gross unrealized: | |
| Appreciation | | $ | 40,548,635 | | |
| Depreciation | | | (16,603,615 | ) | |
| Net unrealized appreciation (depreciation) of investments | | $ | 23,945,020 | | |
Permanent differences, primarily due to tax basis earnings and profits adjustments, foreign currency reclassifications, paydown adjustments and bond premium amortization adjustments, resulted in reclassifications among the Fund's components of Common share net assets at December 31, 2010, the Fund's last tax year-end, as follows:
| Paid-in surplus | | $ | (10,877,093 | ) | |
| Undistributed (Over-distribution of) net investment income | | | 12,062,975 | | |
| Accumulated net realized gain (loss) | | | (1,185,882 | ) | |
The tax components of undistributed net ordinary income and net long-term capital gains at December 31, 2010, the Fund's last tax year end, were as follows:
| Undistributed net ordinary income | | $ | — | | |
| Undistributed net long-term capital gains | | | — | | |
Nuveen Investments
46
The tax character of distributions paid during the Fund's last tax year ended December 31, 2010, was designated for purposes of the dividends paid deduction as follows:
| Distributions from net ordinary income * | | $ | 18,768,363 | | |
| Distributions from net long-term capital gains | | | — | | |
| Return of capital | | | — | | |
* Net ordinary income consists of net taxable income derived from dividends, interest and net short-term capital gains, if any.
At December 31, 2010, the Fund's last tax year end, the Fund had unused capital loss carryforwards available for federal income tax purposes to be applied against future capital gains, if any. If not applied, the carryforwards will expire as follows:
| Expiration: | |
| December 31, 2016 | | $ | 24,094,780 | | |
| December 31, 2017 | | | 32,452,667 | | |
| Total | | $ | 56,547,447 | | |
During the Fund's last tax year ended December 31, 2010, the Fund utilized $14,944,995 of its capital loss carryforwards.
The Fund has elected to defer net realized losses from investments incurred from November 1, 2010 through December 31, 2010, the Fund's last tax year end, ("post-October losses") in accordance with federal income tax regulations. Post-October currency losses of $105,345 were treated as having arisen on the first day of the current fiscal year.
7. Management Fees and Other Transactions with Affiliates
The Fund's management fee consists of two components—a fund-level fee, based only on the amount of assets within the Fund, and a complex-level fee, based on the aggregate amount of all eligible fund assets managed by the Adviser. This pricing structure enables Fund shareholders to benefit from growth in the assets within the Fund as well as from growth in the amount of complex-wide assets managed by the Adviser.
The annual fund-level fee, payable monthly, is calculated according to the following schedule:
| Average Daily Managed Assets* | | Fund-Level Fee Rate | |
| For the first $500 million | | | .7000 | % | |
| For the next $500 million | | | .6750 | | |
| For the next $500 million | | | .6500 | | |
| For the next $500 million | | | .6250 | | |
| For managed assets over $2 billion | | | .6000 | | |
The annual complex-level fee, payable monthly, is calculated according to the following schedule:
| Complex-Level Managed Asset Breakpoint Level* | | Effective Rate at Breakpoint Level | |
| $55 billion | | | .2000 | % | |
| $56 billion | | | .1996 | | |
| $57 billion | | | .1989 | | |
| $60 billion | | | .1961 | | |
| $63 billion | | | .1931 | | |
| $66 billion | | | .1900 | | |
| $71 billion | | | .1851 | | |
| $76 billion | | | .1806 | | |
| $80 billion | | | .1773 | | |
| $91 billion | | | .1691 | | |
| $125 billion | | | .1599 | | |
| $200 billion | | | .1505 | | |
| $250 billion | | | .1469 | | |
| $300 billion | | | .1445 | | |
* For the fund-level and complex-level fees, managed assets include closed-end fund assets managed by the Adviser that are attributable to financial leverage. For these purposes, financial leverage includes the funds' use of preferred stock and borrowings and certain investments in the residual interest certificates (also called inverse floating rate securities) in tender option bond (TOB) trusts, including the portion of assets held by a TOB trust that has been effectively financed by the trust's issuance of floating rate securities, subject to an agreement by the Adviser as to certain funds to limit the amount of such assets for determining managed assets in certain circumstances. The complex-level fee is calculated based upon the aggregate daily managed assets of all Nuveen Funds that constitute "eligible assets." Eligible assets do not include assets attributable to investments in other Nuveen Funds and assets in excess of $2 billion added to the Nuveen Fund complex in connection with the Adviser's assumption of the management of the former First American Funds effective January 1, 2011. As of June 30, 2011, the complex-level fee rate for the Fund was .1774%.
Nuveen Investments
47
Notes to
FINANCIAL STATEMENTS (Unaudited) (continued)
The management fee compensates the Adviser for overall investment advisory and administrative services and general office facilities. The Adviser has entered into sub-advisory agreements with NWQ Investment Management Company, LLC ("NWQ"), Security Capital Research & Management Incorporated ("Security Capital"), Symphony Asset Management, LLC ("Symphony"), and Wellington. NWQ and Symphony are each a subsidiary of Nuveen. NWQ manages the portion of the Fund's investment portfolio allocated to dividend-paying common stocks including ADR and the Fund's call option strategy. Security Capital manages the portion of the Fund's investment portfolio allocated to securities issued by real estate companies. Symphony manages the portion of the Fund's investment portfolio allocated to senior loans and other debt instruments. Wellington manages the portion of the Fund's investment portfolio allocated to emerging markets debt and foreign corporate bonds, and foreign currency forward strategy. The Adviser is responsible for overseeing the Fund's investments in interest rate swap contracts. NWQ, Security Capital, Symphony and Wellington are compensated for their services to the Fund from the management fee paid to the Adviser.
The Fund pays no compensation directly to those of its trustees who are affiliated with the Adviser or to its officers, all of whom receive remuneration for their services to the Fund from the Adviser or its affiliates. The Board of Trustees has adopted a deferred compensation plan for independent trustees that enables trustees to elect to defer receipt of all or a portion of the annual compensation they are entitled to receive from certain Nuveen-advised funds. Under the plan, deferred amounts are treated as though equal dollar amounts had been invested in shares of select Nuveen-advised funds.
For the first eight years of the Fund's operations, the Adviser has agreed to reimburse the Fund, as a percentage of average daily managed assets, for fees and expenses in the amounts and for the time periods set forth below:
Year Ending
September 30, | | Year Ending
September 30, | |
| | 2003 | * | | | .32 | % | | | 2008 | | | | .32 | % | |
| | 2004 | | | | .32 | | | | 2009 | | | | .24 | | |
| | 2005 | | | | .32 | | | | 2010 | | | | .16 | | |
| | 2006 | | | | .32 | | | | 2011 | | | | .08 | | |
| | 2007 | | | | .32 | | | | | | | | | | |
* From the commencement of operations.
The Adviser has not agreed to reimburse the Fund for any portion of its fees and expenses beyond September 30, 2011.
8. Senior Loan Commitments
Unfunded Commitments
Pursuant to the terms of certain of the variable rate senior loan agreements, the Fund may have unfunded senior loan commitments. The Fund will maintain with its custodian, cash, liquid securities and/or liquid senior loans having an aggregate value at least equal to the amount of unfunded senior loan commitments. At June 30, 2011, the Fund had no unfunded senior loan commitments.
Participation Commitments
With respect to the senior loans held in the Fund's portfolio, the Fund may: 1) invest in assignments; 2) act as a participant in primary lending syndicates; or 3) invest in participations. If the Fund purchases a participation of a senior loan interest, the Fund would typically enter into a contractual agreement with the lender or other third party selling the participation, rather than directly with the borrower. As such, the Fund not only assumes the credit risk of the borrower, but also that of the selling participant or other persons interpositioned between the Fund and the borrower. At June 30, 2011, there were no such outstanding participation commitments.
9. Borrowing Arrangements
The Fund has entered into a $83 million (maximum commitment amount) senior committed secured 364-day revolving line of credit (the "Facility"), renewable annually, with its custodian bank. On February 1, 2011, the Fund amended the Facility with its custodian bank and increased its amount from $65 million to $83 million. As of June 30, 2011, the Fund's outstanding balance on the Facility was $79.8 million. During the six months ended June 30, 2011, the average daily balance outstanding and average annual interest rate was $77.3 and 1.01%, respectively.
Nuveen Investments
48
Interest is charged on the Facility at a rate per annum equal to (a) the higher of (i) the overnight London Inter-bank Offered Rate ("LIBOR") rate plus 1.00% and (ii) the Federal Funds rate plus 1.00% or (b) the 1-week, 30, 60, or 90-day LIBOR plus 1.00%. In addition to interest expense, the Fund pays a per annum commitment fee based on the total amount of the Facility.
Borrowings outstanding are recognized as "Borrowings" on the Statement of Assets and Liabilities. Interest expense and commitment fees are recognized as "Interest expense on borrowings" on the Statement of Operations.
10. New Accounting Pronouncements
Financial Accounting Standards Board ("FASB") Transfers and Servicing (Topic 860): Reconsideration of Effective Control for Repurchase Agreements
On April 15, 2011, the FASB issued Accounting Standards Update ("ASU") No. 2011-03 ("ASU No. 2011-03"). The guidance in ASU No. 2011-03 is intended to improve the accounting for repurchase agreements and other similar agreements. Specifically, ASU No. 2011-03 modifies the criteria for determining when these transactions would be accounted for as financings (secured borrowings/lending agreements) as opposed to sales (purchases) with commitments to repurchase (resell). The effective date of ASU No. 2011-03 is for interim and annual periods beginning on or after December 15, 2011. At this time, management is evaluating the implications of this guidance and the impact it will have to the financial statement amounts or footnote disclosures, if any.
Fair Value Measurements and Disclosures
On May 12, 2011, the FASB issued ASU No. 2011-04 modifying Topic 820, Fair Value Measurements and Disclosures. At the same time, the International Accounting Standards Board ("IASB") issued International Financial Reporting Standard ("IFRS") 13, Fair Value Measurement. The objective of the FASB and IASB is convergence of their guidance on fair value measurements and disclosures. Specifically, ASU No. 2011-04 requires reporting entities to disclose i) the amounts of any transfers between Level 1 and Level 2, and the reasons for the transfers, ii) for Level 3 fair value measurements, a) quantitative information about significant unobservable inputs used, b) a description of the valuation processes used by the reporting entity and c) a narrative description of the sensitivity of the fair value measurement to changes in unobservable inputs if a change in those inputs might result in a significantly higher or lower fair value measurement. The effective date of ASU No. 2011-04 is for interim and annual periods beginning after December 15, 2011. At this time, management is evaluating the implications of this guidance and the impact it will have on the financial statement amounts and footnote disclosures, if any.
Nuveen Investments
49
Annual Investment Management
Agreement Approval Process (Unaudited)
The Board of Trustees (the "Board," and each Trustee, a "Board Member") of the Fund, including the Board Members who are not parties to the Fund's advisory or sub-advisory agreements or "interested persons" of any such parties (the "Independent Board Members"), are responsible for approving the advisory agreement (the "Investment Management Agreement") between the Fund and Nuveen Fund Advisors, Inc. (the "Advisor") and the sub-advisory agreements (each a "Sub-Advisory Agreement") between the Advisor and NWQ Investment Management Company, LLC ("NWQ"), the Advisor and Symphony Asset Management LLC ("Symphony"), the Advisor and Wellington Management Company, LLP ("Wellington"), and the Advisor and Security Capital Research & Management Incorporated ("Security Capital" and, together with NWQ, Symphony and Wellington, the "Sub-Advisors") (the Investment Management Agreement and the Sub-Advisory Agreements are referred to collectively as the "Advisory Agreements") and their periodic continuation. Pursuant to the Investment Company Act of 1940, as amended (the "1940 Act"), the Board is required to consider the continuation of advisory agreements and sub-advisory agreements on an annual basis. Accordingly, at an in-person meeting held on May 23-25, 2011 (the "May Meeting"), the Board, including a majority of the Independent Board Members, considered and approved the continuation of the Advisory Agreements for the Fund for an additional one-year period.
In preparation for their considerations at the May Meeting, the Board requested and received extensive materials prepared in connection with the review of the Advisory Agreements. The materials provided a broad range of information regarding the Fund, the Advisor and each Sub-Advisor (the Advisor and each Sub-Advisor are collectively, the "Fund Advisers" and each, a "Fund Adviser"). As described in more detail below, the information provided included, among other things, a review of Fund performance, including Fund investment performance assessments against peer groups and appropriate benchmarks, a comparison of Fund fees and expenses relative to peers, a description and assessment of shareholder service levels for the Fund, a summary of the performance of certain service providers, a review of product initiatives and shareholder communications and an analysis of the Advisor's profitability with comparisons to comparable peers in the managed fund business. As part of their annual review, the Board also held a separate meeting on April 19-20, 2011, to review the Fund's investment performance and consider an analysis provided by the Advisor of each Sub-Advisor which generally evaluated the Sub-Advisor's investment team, investment mandate, organizational structure and history, investment philosophy and process, performance of the Fund, and significant changes to the foregoing. As a result of their review of the materials and discussions, the Board presented the Advisor with questions and the Advisor responded.
Nuveen Investments
50
The materials and information prepared in connection with the annual review of the Advisory Agreements supplement the information provided to the Board during the year. In this regard, throughout the year, the Board, acting directly or through its committees, regularly reviews the performance and various services provided by the Advisor and each Sub-Advisor. The Board meets at least quarterly as well as at other times as the need arises. At its quarterly meetings, the Board reviews reports by the Advisor which include, among other things, Fund performance, a review of the investment teams and compliance reports. The Board also meets with key investment personnel managing the Fund's portfolio during the year. In addition, the Board continues its program of seeking to visit each sub-advisor to the Nuveen funds at least once over a multiple year rotation, meeting with key investment and business personnel. In this regard, the Independent Board Members met with NWQ and Symphony in 2010 and 2011. The Board also met with Wellington and State Street Bank & Trust Company, the Fund's accountant and custodian, in 2010. The Board considers factors and information that are relevant to its annual consideration of the renewal of the Advisory Agreements at these meetings held throughout the year. Accordingly, the Board considers the information provided and knowledge gained at these meetings when performing its annual review of the Advisory Agreements. The Independent Board Members are assisted throughout the process by independent legal counsel who provided materials describing applicable law and the duties of directors or trustees in reviewing advisory contracts and met with the Independent Board Members in executive sessions without management present.
The Board considered all factors it believed relevant with respect to the Fund, including among other factors: (a) the nature, extent and quality of the services provided by the Fund Advisers, (b) the investment performance of the Fund and Fund Advisers, (c) the advisory fees and costs of the services to be provided to the Fund and the profitability of the Fund Advisers, (d) the extent of any economies of scale, (e) any benefits derived by the Fund Advisers from the relationship with the Fund and (f) other factors. Each Board Member may have accorded different weight to the various factors in reaching his or her conclusions with respect to the Fund's Advisory Agreements. The Independent Board Members did not identify any single factor as all important or controlling. The Independent Board Members' considerations were instead based on a comprehensive consideration of all the information presented. The principal factors considered by the Board and its conclusions are described below.
A. Nature, Extent and Quality of Services
In considering renewal of the Advisory Agreements, the Independent Board Members considered the nature, extent and quality of the Fund Adviser's services, including advisory services and the resulting Fund performance and administrative services. The Independent Board Members reviewed materials outlining, among other things, the Fund Adviser's organization and business; the types of services that the Fund Adviser or its affiliates provide to the Fund; the performance record of the Fund (as described in further detail below); and any initiatives Nuveen had taken for the applicable fund product line.
Nuveen Investments
51
Annual Investment Management Agreement
Approval Process (Unaudited) (continued)
In considering advisory services, the Board recognized that the Advisor provides various oversight, administrative, compliance and other services for the Fund and the Sub-Advisors provide the portfolio investment management services to the Fund. Accordingly, in reviewing the portfolio management services provided to the Fund, the Board reviewed the materials provided by the Nuveen Investment Services Oversight Team analyzing, among other things, each Sub-Advisor's investment team and changes thereto, organization and history, assets under management, Fund objectives and mandate, the investment team's philosophy and strategies in managing the Fund, developments affecting a Sub-Advisor or the Fund and performance of the Fund and each portion of the Fund's portfolio allocated to such Sub-Advisor. The Independent Board Members also reviewed portfolio manager compensation arrangements to evaluate each Fund Adviser's ability to attract and retain high quality investment personnel, preserve stability, and reward performance but not provide an incentive to take undue risks. In addition, the Board considered the Advisor's execution of its oversight responsibilities over the Sub-Advisors. Given the importance of compliance, the Independent Board Members also considered Nuveen's compliance program, including the report of the chief compliance officer regarding the Fund's compliance policies and procedures.
In addition to advisory services, the Board considered the quality and extent of administrative and other non-investment advisory services the Advisor and its affiliates provide to the Fund, including product management, investment services (such as oversight of investment policies and procedures, risk management, and pricing), fund administration, oversight of service providers, shareholder services, administration of Board relations, regulatory and portfolio compliance, legal support, managing leverage and promoting an orderly secondary market for common shares.
In reviewing the services provided, the Board also reviewed materials describing various notable initiatives and projects the Advisor performed in connection with the closed-end fund product line. These initiatives included continued activities to refinance auction rate preferred securities; ongoing services to manage leverage that has become increasingly complex; continued secondary market offerings and share repurchases for certain funds; and continued communications efforts with shareholders, fund analysts and financial advisers. With respect to the latter, the Independent Board Members noted Nuveen's continued commitment to supporting the secondary market for the common shares of its closed-end funds through a comprehensive secondary market communication program designed to raise investor and analyst awareness and understanding of closed-end funds. Nuveen's support services included, among other things: continuing communications in support of refinancing efforts related to auction rate preferred securities; participating in conferences; communicating continually with closed-end fund analysts covering the Nuveen funds; providing marketing for the closed-end funds; share purchases; and maintaining and enhancing a closed-end fund website.
Based on their review, the Independent Board Members found that, overall, the nature, extent and quality of services provided to the Fund under each applicable Advisory Agreement were satisfactory.
Nuveen Investments
52
B. The Investment Performance of the Fund and Fund Advisers
The Board, including the Independent Board Members, reviewed and considered the performance history of the Fund over various time periods. The Board reviewed, among other things, the Fund's historic investment performance as well as information comparing the Fund's performance information with that of other funds (the "Performance Peer Group") based on data provided by an independent provider of mutual fund data and with recognized and/or customized benchmarks.
The Board reviewed reports, including a comprehensive analysis of the Fund's performance and the applicable investment team. In this regard, the Board reviewed the Fund's total return information compared to the returns of its Performance Peer Group and recognized and/or customized benchmarks for the quarter, one-, three- and five-year periods ending December 31, 2010 and for the same periods ending March 31, 2011. The Independent Board Members also reviewed, among other things, the returns of each sleeve of the Fund relative to the benchmark of such sleeve for the quarter, one- and three-year periods ending December 31, 2010 and for the same periods ending March 31, 2011.
The Independent Board Members also reviewed historic premium and discount levels, including a summary of actions taken to address or discuss other developments affecting the secondary market discounts of various funds, including the Fund. This information supplemented the Fund performance information provided to the Board at each of its quarterly meetings.
In reviewing performance comparison information, the Independent Board Members recognized that the usefulness of the comparisons of the performance of certain funds with the performance of their respective Performance Peer Group may be limited because the Performance Peer Group may not adequately represent the objectives and strategies of the applicable funds or may be limited in size or number.
In this regard, the Independent Board Members noted that the Performance Peer Group of the Fund was classified as having significant differences from the Fund based on various considerations such as special fund objectives, potential investable universe and the composition of the peer set (e.g., the number and size of competing funds and number of competing managers). The Independent Board Members also noted that the investment experience of a particular shareholder in the Nuveen funds will vary depending on when such shareholder invests in the applicable fund, the class held (if multiple classes are offered) and the performance of the fund (or respective class) during that shareholder's investment period. With respect to any Nuveen funds that underperformed their peers and/or benchmarks from time to time, the Board monitors such funds closely and considers any steps necessary or appropriate to address such issues.
As noted above, the Fund had significant differences from its Performance Peer Group; therefore, the Independent Board Members considered the performance of the Fund compared to its benchmark. In this regard, the Independent Board Members noted that although the Fund underperformed its benchmark for the three-year period, it outperformed its benchmark for the one-year period.
Nuveen Investments
53
Annual Investment Management Agreement
Approval Process (Unaudited) (continued)
Based on their review, the Independent Board Members determined that the Fund's investment performance had been satisfactory.
C. Fees, Expenses and Profitability
1. Fees and Expenses
The Board evaluated the management fees and expenses of the Fund reviewing, among other things, the Fund's gross management fees, net management fees and net expense ratios in absolute terms as well as compared to the fee and expenses of a comparable universe of funds based on data provided by an independent fund data provider (the "Peer Universe") and in certain cases, to a more focused subset of funds in the Peer Universe (the "Peer Group") and any expense limitations.
The Independent Board Members further reviewed the methodology regarding the construction of the applicable Peer Universe and Peer Group (if any). In reviewing the comparisons of fee and expense information, the Independent Board Members took into account that in certain instances various factors such as: the asset level of a fund relative to peers; the limited size and particular composition of the Peer Universe or Peer Group; the investment objectives of the peers; expense anomalies; changes in the funds comprising the Peer Universe or Peer Group from year to year; levels of reimbursement; the timing of information used; and the differences in the type and use of leverage may impact the comparative data thereby limiting the ability to make a meaningful comparison with peers, including for the Fund.
In reviewing the fee schedule for the Fund, the Independent Board Members also considered the fund-level and complex-wide breakpoint schedules (described in further detail below) and any fee waivers and reimbursements provided by Nuveen (applicable, in particular, for certain closed-end funds launched since 1999). In reviewing fees and expenses, the Board considered the expenses and fees to be higher if they were over 10 basis points higher, slightly higher if they were 6 to 10 basis points higher, in line if they were within 5 basis points higher than the peer average and below if they were below the peer average of the Peer Group (if available) or Peer Universe if there was no separate Peer Group. The Independent Board Members observed that the Fund had net management fees and net expense ratios below its peer averages.
Based on their review of the fee and expense information provided, the Independent Board Members determined that the Fund's management fees were reasonable in light of the nature, extent and quality of services provided to the Fund.
2. Comparisons with the Fees of Other Clients
The Independent Board Members further reviewed information regarding the nature of services and fee rates offered by the Advisor to other clients, including separately managed accounts (both retail and institutional accounts), foreign investment funds offered by Nuveen, and funds that are not offered by Nuveen but are sub-advised by one of Nuveen's investment management teams. In evaluating the comparisons of fees, the Independent Board Members noted that the fee rates charged to the Fund and other clients vary, among other things, because of the different services involved
Nuveen Investments
54
and the additional regulatory and compliance requirements associated with registered investment companies, such as the Fund. Accordingly, the Independent Board Members considered the differences in the product types, including, but not limited to, the services provided, the structure and operations, product distribution and costs thereof, portfolio investment policies, investor profiles, account sizes and regulatory requirements. The Independent Board Members noted, in particular, that the range of services provided to the Fund (as discussed above) is much more extensive than that provided to separately managed accounts. Given the inherent differences in the products, particularly the extensive services provided to the Fund, the Independent Board Members believe such facts justify the different levels of fees.
In considering the fees of a Sub-Advisor, the Independent Board Members also considered the pricing schedule or fees that the Sub-Advisor charges for similar investment management services for other fund sponsors or clients (such as retail and/or institutional managed accounts) as applicable. With respect to Symphony, the Independent Board Members also reviewed the fees it assesses for equity and taxable fixed-income hedge funds it manages, which include a performance fee. The Independent Board Members noted that with respect to Security Capital and Wellington, the Sub-Advisors unaffiliated with Nuveen, such fees were the result of arm's-length negotiations.
3. Profitability of Fund Advisers
In conjunction with its review of fees, the Independent Board Members also considered the profitability of Nuveen for its advisory activities (which incorporated Nuveen's wholly-owned affiliated sub-advisers) and its financial condition. The Independent Board Members reviewed the revenues and expenses of Nuveen's advisory activities for the last two years, the allocation methodology used in preparing the profitability data and an analysis of the key drivers behind the changes in revenues and expenses that impacted profitability in 2010. The Independent Board Members noted this information supplemented the profitability information requested and received during the year to help keep them apprised of developments affecting profitability (such as changes in fee waivers and expense reimbursement commitments). In this regard, the Independent Board Members noted that they have an Independent Board Member serve as a point person to review and keep them apprised of changes to the profitability analysis and/or methodologies during the year. The Independent Board Members also considered Nuveen's revenues for advisory activities, expenses, and profit margin compared to that of various unaffiliated management firms with similar amounts of assets under management and relatively comparable asset composition prepared by Nuveen.
In reviewing profitability, the Independent Board Members recognized the subjective nature of determining profitability which may be affected by numerous factors including the allocation of expenses. Further, the Independent Board Members recognized the difficulties in making comparisons as the profitability of other advisers generally is not publicly available and the profitability information that is available for certain advisers or management firms may not be representative of the industry and may be affected by, among other things, the adviser's particular business mix, capital
Nuveen Investments
55
Annual Investment Management Agreement
Approval Process (Unaudited) (continued)
costs, types of funds managed and expense allocations. Notwithstanding the foregoing, the Independent Board Members reviewed Nuveen's methodology and assumptions for allocating expenses across product lines to determine profitability. In reviewing profitability, the Independent Board Members recognized Nuveen's investment in its fund business. Based on their review, the Independent Board Members concluded that the Advisor's level of profitability for its advisory activities was reasonable in light of the services provided.
With respect to NWQ and Symphony, the Independent Board Members reviewed each such Sub-Advisor's revenues, expenses and pre-tax profitability margins. Similarly, with respect to Security Capital and Wellington, the Sub-Advisors unaffiliated with Nuveen, the Independent Board Members also considered each such Sub-Advisor's revenues, expenses and profitability margins (pre- and post-tax). Based on their review, the Independent Board Members were satisfied that the respective Sub-Advisor's level of profitability was reasonable in light of the services provided.
In evaluating the reasonableness of the compensation, the Independent Board Members also considered other amounts paid to a Fund Adviser by the Fund as well as any indirect benefits (such as soft dollar arrangements, if any) the Fund Adviser and its affiliates receive, or are expected to receive, that are directly attributable to the management of the Fund, if any. See Section E below for additional information on indirect benefits the Fund Adviser may receive as a result of its relationship with the Fund. Based on their review of the overall fee arrangements of the Fund, the Independent Board Members determined that the advisory fees and expenses of the Fund were reasonable.
D. Economies of Scale and Whether Fee Levels Reflect These Economies of Scale
With respect to economies of scale, the Independent Board Members have recognized the potential benefits resulting from the costs of a fund being spread over a larger asset base, although economies of scale are difficult to measure and predict with precision, particularly on a fund-by-fund basis. One method to help ensure the shareholders share in these benefits is to include breakpoints in the advisory fee schedule. Generally, management fees for funds in the Nuveen complex are comprised of a fund-level component and a complex-level component, subject to certain exceptions. Accordingly, the Independent Board Members reviewed and considered the applicable fund-level breakpoints in the advisory fee schedules that reduce advisory fees as asset levels increase. Further, the Independent Board Members noted that although closed-end funds may from time-to-time make additional share offerings, the growth of their assets will occur primarily through the appreciation of such funds' investment portfolio.
In addition to fund-level advisory fee breakpoints, the Board also considered the Fund's complex-wide fee arrangement. Pursuant to the complex-wide fee arrangement, the fees of the funds in the Nuveen complex are generally reduced as the assets in the fund complex reach certain levels. The complex-wide fee arrangement seeks to provide the benefits of economies of scale to fund shareholders when total fund complex assets increase, even if assets of a particular fund are unchanged or have decreased. The
Nuveen Investments
56
approach reflects the notion that some of Nuveen's costs are attributable to services provided to all its funds in the complex and therefore all funds benefit if these costs are spread over a larger asset base.
Based on their review, the Independent Board Members concluded that the breakpoint schedules and complex-wide fee arrangement were acceptable and reflect economies of scale to be shared with shareholders when assets under management increase.
E. Indirect Benefits
In evaluating fees, the Independent Board Members received and considered information regarding potential "fall out" or ancillary benefits the respective Fund Adviser or its affiliates may receive as a result of its relationship with the Fund. In this regard, the Independent Board Members considered any revenues received by affiliates of the Advisor for serving as agent at Nuveen's trading desk and as co-manager in initial public offerings of new closed-end funds.
In addition to the above, the Independent Board Members considered whether the Fund Advisers received any benefits from soft dollar arrangements whereby a portion of the commissions paid by the Fund for brokerage may be used to acquire research that may be useful to the Fund Adviser in managing the assets of the Fund and other clients. With respect to the Advisor, the Independent Board Members recognized that the Advisor has the authority to pay a higher commission in return for brokerage and research services if it determines in good faith that the commission paid is reasonable in relation to the value of the brokerage and research services provided. With respect to NWQ and Security Capital, the Independent Board Members considered that such Sub-Advisors may benefit from their soft dollar arrangements pursuant to which the respective Sub-Advisor receives research from brokers that execute the Fund's portfolio transactions. With respect to Wellington, the Independent Board Members noted that while Wellington does have some soft dollar arrangements with respect to some of its agency trades, the trades in fixed income securities held by the Fund are done on a principal basis and do not generate soft dollar credits. For the Advisor, NWQ, Security Capital and Wellington, the Independent Board Members noted that such Fund Advisers' profitability may be somewhat lower if they did not receive the research services pursuant to the soft dollar arrangements and had to acquire such services directly. With respect to Symphony, the Board also considered that Symphony currently does not enter into soft dollar arrangements; however, it has adopted a soft dollar policy in the event it does so in the future.
Based on their review, the Independent Board Members concluded that any indirect benefits received by a Fund Adviser as a result of its relationship with the Fund were reasonable and within acceptable parameters.
F. Other Considerations
The Independent Board Members did not identify any single factor discussed previously as all-important or controlling. The Board Members, including the Independent Board Members, unanimously concluded that the terms of each Advisory Agreement are fair and reasonable, that the respective Fund Adviser's fees are reasonable in light of the services provided to the Fund and that the Advisory Agreements be renewed.
Nuveen Investments
57
Reinvest Automatically
Easily and Conveniently
Nuveen makes reinvesting easy. A phone call is all it takes to set up your reinvestment account.
Nuveen Closed-End Funds Automatic Reinvestment Plan
Your Nuveen Closed-End Fund allows you to conveniently reinvest distributions in additional Fund shares.
By choosing to reinvest, you'll be able to invest money regularly and automatically, and watch your investment grow through the power of compounding. Just like distributions in cash, there may be times when income or capital gains taxes may be payable on distributions that are reinvested.
It is important to note that an automatic reinvestment plan does not ensure a profit, nor does it protect you against loss in a declining market.
Easy and convenient
To make recordkeeping easy and convenient, each quarter you'll receive a statement showing your total distributions, the date of investment, the shares acquired and the price per share, and the total number of shares you own.
How shares are purchased
The shares you acquire by reinvesting will either be purchased on the open market or newly issued by the Fund. If the shares are trading at or above net asset value at the time of valuation, the Fund will issue new shares at the greater of the net asset value or 95% of the then-current market price. If the shares are trading at less than net asset value, shares for your account will be purchased on the open market. If the Plan Agent begins purchasing Fund shares on the open market while shares are trading below net asset value, but the Fund's shares subsequently trade at or above their net asset value before the Plan Agent is able to complete its purchases, the Plan Agent may cease open-market purchases and may invest the uninvested portion of the distribution in newly-issued Fund shares at a price equal to the greater of the shares' net asset value or 95% of the shares' market value on the last business day immediately prior to the purchase date. Distributions received to purchase shares in the open market will normally be invested shortly after the distribution payment date. No interest will be paid on distributions awaiting reinvestment. Because the market price of the shares may increase before purchases are completed, the average purchase price per share may exceed the market price at the time of valuation, resulting in the acquisition of fewer shares than if the distribution had been paid in shares issued by the Fund. A pro rata portion of any applicable brokerage commissions on open market purchases will be paid
Nuveen Investments
58
by Plan participants. These commissions usually will be lower than those charged on individual transactions.
Flexible
You may change your distribution option or withdraw from the Plan at any time, should your needs or situation change.
You can reinvest whether your shares are registered in your name, or in the name of a brokerage firm, bank, or other nominee. Ask your financial advisor if his or her firm will participate on your behalf. Participants whose shares are registered in the name of one firm may not be able to transfer the shares to another firm and continue to participate in the Plan.
The Fund reserves the right to amend or terminate the Plan at any time. Although the Fund reserves the right to amend the Plan to include a service charge payable by the participants, there is no direct service charge to participants in the Plan at this time.
Call today to start reinvesting distributions
For more information on the Nuveen Automatic Reinvestment Plan or to enroll in or withdraw from the Plan, speak with your financial advisor or call us at (800) 257-8787.
Nuveen Investments
59
Glossary of Terms
Used in this Report
• Average Annual Total Return: This is a commonly used method to express an investment's performance over a particular, usually multi-year time period. It expresses the return that would have been necessary each year to equal the investment's actual cumulative performance (including change in NAV or market price and reinvested dividends and capital gains distributions, if any) over the time period being considered.
• Collateralized Debt Obligations (CDOs): Collateralized debt obligations are a type of asset-backed security constructed from a portfolio of fixed-income assets. CDOs usually are divided into different tranches having different ratings and paying different interest rates. Losses, if any, are applied in reverse order of seniority and so junior tranches generally offer higher coupons to compensate for added default risk.
• Current Distribution Rate: Current distribution rate is based on the Fund's current annualized quarterly distribution divided by the Fund's current market price. The Fund's quarterly distributions to its shareholders may be comprised of ordinary income, net realized capital gains and, if at the end of the calendar year the Fund's cumulative net ordinary income and net realized gains are less than the amount of the Fund's distributions, a tax return of capital.
• Effective Leverage: Effective leverage is a Fund's effective economic leverage, and includes both structural leverage and the leverage effects of certain derivative investments in the Fund's portfolio.
• Leverage: Using borrowed money to invest in securities or other assets.
• Net Asset Value (NAV): A Fund's NAV per common share is calculated by subtracting the liabilities of the Fund (including any debt or preferred shares issued in order to leverage the Fund) from its total assets and then dividing the remainder by the number of common shares outstanding. Fund NAVs are calculated at the end of each business day.
• Structural Leverage: Structural Leverage consists of preferred shares or debt issued by the fund. Both of these are part of a fund's capital structure. Structural leverage is sometimes referred to as "'40 Act Leverage" and is subject to asset coverage limits set in the Investment Company Act of 1940.
Nuveen Investments
60
Notes
Nuveen Investments
61
Other Useful Information
Board of Trustees
John P. Amboian
Robert P. Bremner
Jack B. Evans
William C. Hunter
David J. Kundert
William J. Schneider
Judith M. Stockdale
Carole E. Stone
Virginia L. Stringer
Terence J. Toth
Fund Manager
Nuveen Fund Advisors, Inc.
333 West Wacker Drive
Chicago, IL 60606
Custodian
State Street Bank & Trust Company
Boston, MA
Transfer Agent and
Shareholder Services
State Street Bank & Trust Company
Nuveen Funds
P.O. Box 43071
Providence, RI 02940-3071
(800) 257-8787
Legal Counsel
Chapman and Cutler LLP
Chicago, IL
Independent Registered
Public Accounting Firm
Ernst & Young LLP
Chicago, IL
Quarterly Portfolio of Investments and Proxy Voting Information
You may obtain (i) the Fund's quarterly portfolio of investments, (ii) information regarding how the Fund voted proxies relating to portfolio securities held during the most recent twelve-month period ended June 30, and (iii) a description of the policies and procedures that the Fund used to determine how to vote proxies relating to portfolio securities are available without charge, upon request, by calling Nuveen Investments toll-free at (800) 257-8787 or on Nuveen's website at www.nuveen.com.
You may also obtain this and other Fund information directly from the Securities and Exchange Commission (SEC). The SEC may charge a copying fee for this information. Visit the SEC on-line at http://www.sec.gov or in person at the SEC's Public Reference Room in Washington, D.C. Call the SEC at (202) 942-8090 for room hours and operation. You may also request Fund information by sending an e-mail request to publicinfo@sec.gov or by writing to the SEC's Public Reference Section at 100 F Street NE, Washington, D.C. 20549.
CEO Certification Disclosure
The Fund's Chief Executive Officer has submitted to the New York Stock Exchange (NYSE) the annual CEO certification as required by Section 303A.12(a) of the NYSE Listed Company Manual.
The Fund has filed with the SEC the certification of its Chief Executive Officer and Chief Financial Officer required by Section 302 of the Sarbanes-Oxley Act.
Common Share Information
The Fund intends to repurchase shares of its own common stock in the future at such times and in such amounts as is deemed advisable. During the period covered by this report, the Fund repurchased shares of its common stock as shown in the accompanying table.
| | | Common
Shares
Repurchased | |
| JDD | | | — | | |
Any future repurchases will be reported to shareholders in the next annual or semi-annual report.
Nuveen Investments
62


Nuveen Investments makes it easy, with the ultimate online resource.
At nuveen.com/understand, you have access to comprehensive educational tools, video libraries and daily pricing for Nuveen's more than 130* closed-end funds–so you can stay up to date on the latest income-investing news and information.
All the tools and resources you need on closed-end funds are just a click away. www.nuveen.com/understand
* There are risks inherent in any investment, including market risk, interest rate risk, credit risk, and the possible loss of principal. There can be no assurance that fund objectives will be achieved and income is not guaranteed. Closed-end funds frequently trade at a discount to their net asset value. Diversification does not ensure against loss.
* As of 5/31/11
Nuveen Investments:
Serving Investors for Generations
Distributed by
Nuveen Securities, LLC
333 West Wacker Drive
Chicago, IL 60606
www.nuveen.com/performance
Since 1898, financial advisors and their clients have relied on Nuveen Investments to provide dependable investment solutions through continued adherence to proven, long-term investing principles. Today, we offer a range of high quality equity and fixed-income solutions designed to be integral components of a well-diversified core portfolio.
Focused on meeting investor needs.
Nuveen Investments is a global investment management firm that seeks to help secure the long-term goals of institutions and high net worth investors as well as the consultants and financial advisors who serve them. We market our growing range of specialized investment solutions under the high-quality brands of HydePark, NWQ, Nuveen Asset Management, Santa Barbara, Symphony, Tradewinds and Winslow Capital. In total, Nuveen Investments managed approximately $210 billion of assets as of June 30, 2011.
Find out how we can help you.
To learn more about how the products and services of Nuveen Investments may be able to help you meet your financial goals, talk to your financial advisor, or call us at (800) 257-8787. Please read the information provided carefully before you invest. Investors should consider the investment objective and policies, risk considerations, charges and expenses of any investment carefully. Where applicable, be sure to obtain a prospectus, which contains this and other relevant information. To obtain a prospectus, please contact your securities representative or Nuveen Investments, 333 W. Wacker Dr., Chicago, IL 60606. Please read the prospectus carefully before you invest or send money.
Learn more about Nuveen Funds at: www.nuveen.com/performance
ESA-B-0611D
ITEM 2. CODE OF ETHICS.
Not applicable to this filing.
ITEM 3. AUDIT COMMITTEE FINANCIAL EXPERT.
Not applicable to this filing.
ITEM 4. PRINCIPAL ACCOUNTANT FEES AND SERVICES.
Not applicable to this filing.
ITEM 5. AUDIT COMMITTEE OF LISTED REGISTRANTS.
Not applicable to this filing.
ITEM 6. SCHEDULE OF INVESTMENTS.
(a) See Portfolio of Investments in Item 1.
(b) Not applicable.
ITEM 7. DISCLOSURE OF PROXY VOTING POLICIES AND PROCEDURES FOR CLOSED-END MANAGEMENT INVESTMENT COMPANIES.
Not applicable to this filing.
ITEM 8. PORTFOLIO MANAGERS OF CLOSED-END MANAGEMENT INVESTMENT COMPANIES.
Not applicable to this filing.
ITEM 9. PURCHASES OF EQUITY SECURITIES BY CLOSED-END MANAGEMENT INVESTMENT COMPANY AND AFFILIATED PURCHASERS.
Not applicable.
ITEM 10. SUBMISSION OF MATTERS TO A VOTE OF SECURITY HOLDERS.
There have been no material changes to the procedures by which shareholders may recommend nominees to the registrant’s Board of Directors or Trustees implemented after the registrant last provided disclosure in response to this Item.
ITEM 11. CONTROLS AND PROCEDURES.
(a) The registrant’s principal executive and principal financial officers, or persons performing similar functions, have concluded that the registrant’s disclosure controls and procedures (as defined in Rule 30a-3(c) under the Investment Company Act of 1940, as amended (the “1940 Act”) (17 CFR 270.30a-3(c))) are effective, as of a date within 90 days of the filing date of this report that includes the disclosure required by this paragraph, based on their evaluation of the controls and procedures required by Rule 30a-3(b) under the 1940 Act (17 CFR 270.30a-3(b)) and Rules 13a-15(b) or 15d-15(b) under the Securities Exchange Act of 1934, as amended (the “Exchange Act”)(17 CFR 240.13a-15(b) or 240.15d-15(b)).
(b) There were no changes in the registrant’s internal control over financial reporting (as defined in Rule 30a-3(d) under the 1940 Act (17 CFR 270.30a-3(d)) that occurred during the second fiscal quarter of the period covered by this report that has materially affected, or is reasonably likely to materially affect, the registrant’s internal control over financial reporting.
ITEM 12. EXHIBITS.
File the exhibits listed below as part of this Form.
(a)(1) Any code of ethics, or amendment thereto, that is the subject of the disclosure required by Item 2, to the extent that the registrant intends to satisfy the Item 2 requirements through filing of an exhibit: Not applicable to this filing.
(a)(2) A separate certification for each principal executive officer and principal financial officer of the registrant as required by Rule 30a-2(a) under the 1940 Act (17 CFR 270.30a-2(a)) in the exact form set forth below: See Ex-99.CERT attached hereto.
(a)(3) Any written solicitation to purchase securities under Rule 23c-1 under the 1940 Act (17 CFR 270.23c-1) sent or given during the period covered by the report by or on behalf of the registrant to 10 or more persons: Not applicable.
(b) If the report is filed under Section 13(a) or 15(d) of the Exchange Act, provide the certifications required by Rule 30a-2(b) under the 1940 Act (17 CFR 270.30a-2(b)); Rule 13a-14(b) or Rule 15d-14(b) under the Exchange Act (17 CFR 240.13a-14(b) or 240.15d-14(b)), and Section 1350 of Chapter 63 of Title 18 of the United States Code (18 U.S.C. 1350) as an exhibit. A certification furnished pursuant to this paragraph will not be deemed “filed” for purposes of Section 18 of the Exchange Act (15 U.S.C. 78r), or otherwise subject to the liability of that section. Such certification will not be deemed to be incorporated by reference into any filing under the Securities Act of 1933 or the Exchange Act, except to the extent that the registrant specifically incorporates it by reference: See Ex-99.906 CERT attached hereto.
SIGNATURES
Pursuant to the requirements of the Securities Exchange Act of 1934 and the Investment Company Act of 1940, the registrant has duly caused this report to be signed on its behalf by the undersigned, thereunto duly authorized.
(Registrant) Nuveen Diversified Dividend & Income Fund
By (Signature and Title) | /s/ Kevin J. McCarthy | |
| Kevin J. McCarthy | |
| (Vice President and Secretary) | |
Date: September 7, 2011
Pursuant to the requirements of the Securities Exchange Act of 1934 and the Investment Company Act of 1940, this report has been signed below by the following persons on behalf of the registrant and in the capacities and on the dates indicated.
By (Signature and Title) | /s/ Gifford R. Zimmerman | |
| Gifford R. Zimmerman | |
| Chief Administrative Officer | |
| (principal executive officer) | |
Date: September 7, 2011
By (Signature and Title) | /s/ Stephen D. Foy | |
| Stephen D. Foy | |
| Vice President and Controller | |
| (principal financial officer) | |
Date: September 7, 2011