UNITED STATES
SECURITIES AND EXCHANGE COMMISSION
Washington, D.C. 20549
FORM N-CSR
CERTIFIED SHAREHOLDER REPORT OF REGISTERED
MANAGEMENT INVESTMENT COMPANIES
Investment Company Act file number | 811-21407 |
|
Nuveen Diversified Dividend and Income Fund |
(Exact name of registrant as specified in charter) |
|
Nuveen Investments 333 West Wacker Drive Chicago, IL 60606 |
(Address of principal executive offices) |
|
Kevin J. McCarthy Nuveen Investments 333 West Wacker Drive Chicago, IL 60606 |
(Name and address of agent for service) |
|
Registrant’s telephone number, including area code: | (312) 917-7700 | |
|
Date of fiscal year end: | December 31 | |
|
Date of reporting period: | June 30, 2014 | |
| | | | | | |
Form N-CSR is to be used by management investment companies to file reports with the Commission not later than 10 days after the transmission to stockholders of any report that is required to be transmitted to stockholders under Rule 30e-1 under the Investment Company Act of 1940 (17 CFR 270.30e-1). The Commission may use the information provided on Form N-CSR in its regulatory, disclosure review, inspection, and policymaking roles.
A registrant is required to disclose the information specified by Form N-CSR, and the Commission will make this information public. A registrant is not required to respond to the collection of information contained in Form N-CSR unless the Form displays a currently valid Office of Management and Budget ("OMB") control number. Please direct comments concerning the accuracy of the information collection burden estimate and any suggestions for reducing the burden to Secretary, Securities and Exchange Commission, 450 Fifth Street, NW, Washington, DC 20549-0609. The OMB has reviewed this collection of information under the clearance requirements of 44 U.S.C. ss. 3507.
ITEM 1. REPORTS TO STOCKHOLDERS.

Nuveen Investments
Closed-End Funds
Semi-Annual Report June 30, 2014
JDD
Nuveen Diversified Dividend and Income Fund
Nuveen Investments to be acquired by TIAA-CREF
On April 14, 2014, TIAA-CREF announced that it had entered into an agreement to acquire Nuveen Investments, the parent company of your fund's investment adviser, Nuveen Fund Advisors, LLC ("NFAL") and the Nuveen affiliates that act as sub-advisers to the majority of the Nuveen Funds. TIAA-CREF is a national financial services organization with approximately $569 billion in assets under management (as of March 31, 2014) and is a leading provider of retirement services in the academic, research, medical and cultural fields. Nuveen anticipates that it will operate as a separate subsidiary within TIAA-CREF's asset management business, and that its current leadership and key investment teams will stay in place.
Your fund investment will not change as a result of Nuveen's change of ownership. You will still own the same fund shares and the underlying value of those shares will not change as a result of the transaction. NFAL and your fund's sub-adviser(s) will continue to manage your fund according to the same objectives and policies as before, and we do not anticipate any significant changes to your fund's operations. Under the securities laws, the consummation of the transaction will result in the automatic termination of the investment management agreements between the funds and NFAL and the investment sub-advisory agreements between NFAL and each fund's sub-adviser(s). The new agreements have been approved by shareholders of your fund.
The transaction is currently expected to close early in the fourth quarter of 2014, but remains subject to customary closing conditions.

Chairman's Letter to Shareholders | | | 4 | | |
Portfolio Managers' Comments | | | 5 | | |
Fund Leverage | | | 11 | | |
Common Share Information | | | 12 | | |
Risk Considerations | | | 15 | | |
Performance Overview and Holding Summaries | | | 17 | | |
Portfolio of Investments | | | 19 | | |
Statement of Assets and Liabilities | | | 35 | | |
Statement of Operations | | | 36 | | |
Statement of Changes in Net Assets | | | 37 | | |
Statement of Cash Flows | | | 38 | | |
Financial Highlights | | | 40 | | |
Notes to Financial Statements | | | 42 | | |
Additional Fund Information | | | 55 | | |
Glossary of Terms Used in this Report | | | 57 | | |
Reinvest Automatically, Easily and Conveniently | | | 59 | | |
Nuveen Investments
3
Chairman's Letter
to Shareholders

Dear Shareholders,
After significant growth in 2013, domestic and international equity markets have been less compelling during the first part of 2014. Concerns about deflation, political uncertainty in many places and the potential for more fragile economies to impact other countries have produced uncertainty in the markets.
Europe is beginning to emerge slowly from the recession in mid-2013, with improved GDP and employment trends in some countries. However, Japan's deflationary headwinds have resurfaced; and China shows signs of slowing from credit distress combined with declines in manufacturing and exports. Most recently, tensions between Russia and Ukraine may continue to hold back stocks and support government bonds in the near term.
Despite these headwinds, there are some encouraging signs of forward momentum in the markets. In the U.S., the news is more positive with financial risks slowly receding, positive GDP trends, downward trending unemployment and stronger household finances and corporate spending.
It is in such changeable markets that professional investment management is most important. Investment teams who have experienced challenging markets in the past understand how their asset class can behave in rapidly changing times. Remaining committed to their investment disciplines during these times is a critical component to achieving long-term success. In fact, many strong investment track records are established during challenging periods because experienced investment teams understand that volatile markets place a premium on companies and investment ideas that can weather the short-term volatility. By maintaining appropriate time horizons, diversification and relying on practiced investment teams, we believe that investors can achieve their long-term investment objectives.
As always, I encourage you to communicate with your financial consultant if you have any questions about your investment in a Nuveen Fund. On behalf of the other members of the Nuveen Fund Board, we look forward to continuing to earn your trust in the months and years ahead.

William J. Schneider
Chairman of the Board
August 25, 2014
Nuveen Investments
4
Portfolio Managers'
Comments
Nuveen Diversified Dividend and Income Fund (JDD)
JDD invests approximately equal proportions of its managed assets across four complementary strategies, each managed by a separate, specialized sub-adviser.
NWQ Investment Management Company, LLC (NWQ), an affiliate of Nuveen Investments Inc. (Nuveen) is the sub-adviser for the global equity income strategy portion of the Fund consisting of a portfolio focused on income producing and dividend paying equity securities. Jon D. Bosse, CFA, Chief Investment Officer and James T. Stephenson, CFA, lead the Fund's management team at the firm.
The real estate securities strategy portion of the Fund consisting of a portfolio focused on dividend-paying common REITs is managed by a team at Security Capital Research & Management Incorporated, (Security Capital), a wholly-owned subsidiary of JPMorgan Chase & Co. Anthony R. Manno Jr., Kenneth D. Statz and Kevin W. Bedell lead the management team.
Symphony Asset Management, LLC (Symphony), an affiliate of Nuveen, is the sub-adviser for the adjustable rate senior loan strategy portion of the Fund consisting of a portfolio focused on senior loans. The Symphony team is led by Gunther Stein, Chief Investment Officer.
Wellington Management Company, LLP (Wellington Management) is the sub-adviser for the emerging market debt strategy portion of the Fund consisting of a portfolio focused on emerging market sovereign debt. James W. Valone, CFA, heads the management team.
Fund Investment Policy Changes
During August 2014 (subsequent to the close of this reporting period) the Fund's Board of Trustees approved changes to the Fund's investment policies, which are primarily intended to update and clarify the investment parameters used to manage the global equity income portion of the Fund sub-advised by NWQ. The clarifications and changes to the Fund's investment policies that apply to the Fund as a whole, and that apply only to the global equity income strategy portion of the Fund are detailed below. The policy changes will be effective September 1, 2014.
The following summarizes the clarifications and changes that apply at the overall Fund level:
• Provide greater flexibility to invest (up to 60% of the Fund's managed assets) in non-US issues of any currency;
• Clarify that at least 80% of the Fund's managed assets will be invested in income producing or dividend paying securities;
• Clarify the Fund's use of options for hedging purposes and expand the flexibility for the Fund to write (sell) covered puts and call options for enhancing risk-adjusted returns; and
• Clarify that the Fund's policies regarding credit ratings do not apply to the global equity income and real estate securities strategy portions of the Fund.
Certain statements in this report are forward-looking statements. Discussions of specific investments are for illustration only and are not intended as recommendations of individual investments. The forward-looking statements and other views expressed herein are those of the portfolio managers as of the date of this report. Actual future results or occurrences may differ significantly from those anticipated in any forward-looking statements and the views expressed herein are subject to change at any time, due to numerous market and other factors. The Fund disclaims any obligation to update publicly or revise any forward-looking statements or views expressed herein.
Ratings shown are the highest rating given by one of the following national rating agencies: Standard & Poor's (S&P), Moody's Investors Service, Inc. (Moody's) or Fitch, Inc. (Fitch). Credit ratings are subject to change. AAA, AA, A and BBB are investment grade ratings; BB, B, CCC, CC, C and D are below investment grade ratings. Certain bonds backed by U.S. Government or agency securities are regarded as having an implied rating equal to the rating of such securities. Holdings designated N/R are not rated by these national rating agencies.
Nuveen Investments
5
Portfolio Managers' Comments (continued)
The following summarizes the clarifications and changes that apply only to the global equity income strategy portion of the Fund:
• Provide that at least 65% of the global equity income strategy will be invested in income-producing or dividend-paying securities;
• Provide that a maximum of 20% of the global equity income strategy may be invested in emerging market issuers;
• Provide that a maximum of 20% of the global equity income strategy may be invested in convertible securities;
• Provide that a maximum of 20% of the global equity income strategy may be invested in preferred securities;
• Provide that a maximum of 20% of the global equity income strategy may be invested in debt: and
• Clarify that at least 80% of the global equity income strategy will be invested in equity security holdings that may include common stocks, preferred stocks, convertible securities, common and preferred securities issued by master limited partnerships (MLPs) and REITS of U.S. and non-U.S. issuers.
Here representatives from NWQ, Security Capital, Symphony and Wellington Management discuss their management strategies and the performance of the Fund for the six-month reporting period ended June 30, 2014.
What were the key strategies used to manage the Fund during this six-month reporting period ended June 30, 2014?
The Fund's investment objectives are high current income and total return. In its efforts to achieve these objectives, the Fund invests primarily in 1) U.S. and foreign dividend paying common stocks, 2) dividend paying common stocks issued by real estate companies, 3) emerging markets sovereign debt, and 4) senior secured loans. The Fund expects to invest at least 40%, but no more than 70%, of its assets in equity security holdings and at least 30%, but no more than 60%, of its assets in debt security holdings. Under normal circumstances, the Fund's target weighting is approximately 50% equity and 50% debt.
For the dividend paying equity portion of the Fund's portfolio, NWQ continued to employ an opportunistic, bottom-up strategy that focused on identifying undervalued companies possessing favorable risk/reward characteristics as well as emerging catalysts that can unlock value or improve profitability. These catalysts included management changes, restructuring efforts, recognition of hidden assets or a positive change in the underlying fundamentals. We also focused on trying to manage downside risk exposure, and focused on each company's balance sheet and cash flow statement, not just the income statement. We believe that cash flow analysis offers a more objective and truer picture of a company's financial position than an evaluation based on earnings alone.
In managing the real estate portion of the portfolio, Security Capital seeks to maintain significant property type and geographic diversification while taking into account company credit quality, sector, and security-type allocations. Investment decisions are based on a multi-layered analysis of the company, the real estate it owns, its management, and the relative price of the security, with a focus on securities that we believe will be best positioned to generate sustainable income and potential price appreciation over the long run. Across all real estate sectors, Security Capital favored companies with properties located in the strongest infill markets. These "high barrier to entry" markets are defined by constraints that limit new construction, a quality that over the long-term has the potential to provide superior value enhancement and a real inflation hedge.
In the senior loan and other debt portion of the Fund's portfolio, Symphony continued to manage and monitor senior loan market risks. The overall macroeconomic backdrop during the reporting period remained supportive of the leveraged loan (loan) asset class. The Fund's capital remained invested in issuers with strong credit profiles among non-investment grade debt while offering attractive current income and yield. Fundamentally, Symphony feels that many of
Nuveen Investments
6
these companies have stable businesses, good asset coverage for senior debt holders and could perform well in a stable to slow growth environment.
The emerging market debt portion of the Fund is managed by Wellington Management. During the reporting period, we increased the risk stance in the portfolio and moved to moderately pro-risk, reflecting a more constructive outlook for the asset class. Throughout the reporting period we remained overweight Latin America, but shifted our positioning by adding to our local sovereign debt exposure while trimming our quasi-sovereign and corporate exposures. Moderating growth, tame inflation and more attractive valuations have led us to increase the local market exposure in the portfolio. We favored countries with steep yield curves in Latin America, such as Brazil, Colombia and Mexico. We also increased our currency exposure as valuations improved. We increased exposure to the Mexican peso, Colombian peso and Peruvian sol on improving fundamentals and attractive valuations. We initiated a position in Indian rupee and increased exposure in Brazilian real based on the high carry. Within Eastern Europe, Middle East and Africa (EEMEA), we turned more defensive on Russia and remained underweight in Ukraine. We continued to favor some smaller markets in Eastern Europe where we expected the spreads to compress as credit quality improved such as Lithuania, Latvia and Romania. We remained underweight in Asia given tight valuations, though we favored Indonesia on the back of attractive valuation. During the reporting period, we continued reducing corporate exposure on stretched valuations, heavy supply and weaker domestic growth conditions.
How did the Fund perform during this six-month reporting period ended June 30, 2014?
The table in the Performance Overview and Holding Summaries section of this report provides total return performance for the Fund for the six-month, one-year, five-year and ten-year periods ended June 30, 2014. For the six-month period ended June 30, 2014, the Fund's total return on common share net asset value (NAV) outperformed its comparative benchmark and the S&P 500® Index.
NWQ
For the dividend paying equity portion of the Fund's portfolio, managed by NWQ, the Fund's performance reflects gains in several holdings for the period, although returns did modestly trail the benchmark for the reporting period. The materials and energy sectors had the largest positive contribution on absolute and relative performance. These gains were partially offset by relative underperformance in the producer durables, technology and utility sectors.
AstraZeneca plc (Astra) and Teva Pharmaceutical Industries Ltd. (Teva) were among two of our top investments, while General Motors Company (GM) and CA Technologies, Inc. had losses. Astra appreciated as the company received a takeout offer from Pfizer, Inc., which was rejected based on valuation. Under U.K. takeover laws, Pfizer can submit another bid after six months. In addition to the financial engineering benefits of the deal (corporate tax rate inversion), Astra has a broad drug pipeline and several long term opportunities that Pfizer wants. Astra's rejection of the deal appears to reflect management's confidence in its own framework for growth for the company.
Microsoft Corporation appreciated following strong performance during 2013. In February, Satya Nadella was named CEO of the company and Bill Gates stepped down from his chairman role to become a senior advisor, thereby removing a potential obstacle to drive change at the company. Mr. Nadella previously led Microsoft's Business division for seven years and most recently ran the company's Cloud business. These businesses are growing and are a major part of our investment thesis.
Canadian-based Suncor Energy outperformed after reporting solid financial results that reflected strong operating momentum. The company's free cash flows are being driven by strong realized pricing for oil sands production and record refining results. The U.S. is undergoing a structural transformation with refiners benefitting from excessive supply, primarily in the Gulf Coast. Suncor is returning significant cash to shareholders with dividends forecasted to increase 25% per year over the next three years, plus buybacks.
Nuveen Investments
7
Portfolio Managers' Comments (continued)
Teva has embarked on an aggressive $2 billion cost cutting plan that should help maintain strong profitability in the face of the upcoming patent expiration of its multiple sclerosis drug, Copaxone. Teva received FDA approval in late January for a 3 day/week dosing for Copaxone, and is actively working to shift its patients to the new formulation. We increased our position prior to the stock's explosive rally, making it one of the larger investments in the fund. We did modestly trim the position after its substantial gain.
Copa Holdings, S.A. is a leading Latin American airline with a strong balance sheet and one of the most modern fleets in the industry. The company's primary hub in Panama is ideally positioned between North and South America. The shares sold off on concerns that Venezuela, a strategically important market for Copa, would devalue its currency and place restrictions on the repatriation of cash out of the country. The company has $300 million in cash trapped on its balance sheet. Furthermore, Copa had to reduce service in the country and has placed limits on bolivar-denominated ticket sales. Although we believe that Copa's robust growth and high profitability remain intact despite these headwinds, we eliminated the position due to risk/reward concerns.
Ultra low cost airline Controladora Vuela Companhia de Aviacion (Volaris) also declined due to a weakened economic environment in Mexico and higher competition. AeroMexico dramatically lowered fares in some markets to help regain lost market share. Although we believe this will only be a near term issue as AeroMexico is burning cash at current levels and Volaris remains the lowest cost producer in the market, we elected to eliminate the position from the fund.
General Motors was pressured by issues related to extensive product recalls and an investigation into why previous management delayed recalling vehicles with defective ignition parts that resulted in thirteen deaths. Mary Barra was recently appointed CEO as part of a long expected management transition, replacing Dan Akerson. We believe GM is a fundamentally transformed company with a new culture. While the short term suggests upside, the stock is capped for now and we believe the company remains an excellent value that is supported by a strong balance sheet, excellent product cadence, and continued earnings momentum.
Norwegian Cruise Lines declined as additional capacity has entered the Caribbean cruise market, and the company issued conservative guidance. The Getaway, Norwegian's new ship in that market, is generating double digit premiums. The overhang of an upcoming stock issuance from major holders continues to be a modest headwind, although we believe this will provide an opportunity for better liquidity and investment in an excellent operator with a compelling valuation and earnings ramp. We increased our position on Norwegian Cruise Lines in December in conjunction with a secondary public offering of the shares.
We also wrote (sold) call options on individual stocks, while investing in those same stocks, to enhance returns while foregoing some upside potential. The effect on performance for the reporting period was a small positive one.
Wellington Management
In the emerging markets debt portion of the portfolio managed by Wellington Management, security selection contributed to overall performance outweighing the negative contribution from country rotation strategies. Among country rotation strategies, a lack of exposure to Lebanon, an underweight to Poland and an allocation to Slovenia contributed to overall performance, while an overweight to Russia, Latvia and Lithuania detracted. Within security selection, positioning in Mexico, Indonesia and Colombia contributed to overall performance, while security selection in Turkey, Russia and Peru detracted. We also used currency forward contracts, buying currencies we expected to appreciate and selling currencies we expected to depreciate. Currency forwards were also used to hedge currency exposure of the local currency denominated emerging markets debt holdings. In aggregate, these contracts detracted from overall performance during the reporting period.
Security Capital
In the real estate portion of the Fund managed by Security Capital, returns for the common equity of U.S. real estate investment trusts (REITs) surged in the first half of 2014, in the context of easing long term interest rates, healthy underlying
Nuveen Investments
8
operating fundamentals and highly accommodating debt and equity markets after materially lagging both private real estate and broader equity market benchmarks in 2013. Easing long term interest rate trends were also evident in the strong returns generated by REIT senior fixed income securities during the reporting period, particularly the perpetual preferred securities with their extended duration profile.
Within the Fund's common equity holdings during the reporting period, as always, there were distinctive performance differences by major property type with the underlying themes and influences reflecting company specific factors, earlier period performance differentials as well as shifting investor expectations colored by macro-economic trends. In this context, the performance leaders by major property type were the office, apartment and regional mall companies. Office property operations in general have been challenged by generally weak user demand driven by cost sensitive business tenants and efficiency gains in office space use, particularly for more fungible suburban product. But asset pricing for quality assets in primary markets has remained strong and strength in technology and life science markets has driven leasing and development opportunities for a number of office companies, both areas of overweight in the Fund's holdings. Apartment companies continue to drive healthy revenue growth, but investors have been wary of asset and company valuations in the context of rebounding levels of new supply, rising property taxes and perceived headwinds from a recovering single family housing market. Underperformance coming into 2014 and evidence of a sputtering single family housing recovery have been key drivers of strong stock performance for the group in 2014. Finally, investors have been cautious over trends impacting regional malls including a deceleration in sales growth over the last several quarters, renewed worries over the health of mall anchors Sears and JCPenney and escalating competition from internet based sales. But operations have been resilient and the companies were poised for a bounce back after underperformance in 2013 and the first quarter of this year.
Within the Fund's common equity holdings, the relative underperformers by major property-type during the reporting period were the hotel, industrial and self-storage companies. For hotel companies, returns in the Fund were positive on an absolute basis as economically sensitive operations continued to respond very favorably to a combination of healthy corporate and leisure travel patterns and the generally low level of new supply. On a relative basis, we do not have a conclusive research based explanation for modest underperformance. Within industrial, while rent and occupancy trends have been healthy, investors were wary of escalating levels of new construction in a number of key distribution markets, particularly given the very short lead times for delivering new industrial assets and abundant capital availability. Lastly, self-storage companies continued to exhibit strong and durable property operations driven, in part, by housing market trends, a scarcity of new supply as well as expense saving technology. Self-storage companies delivered strong returns to start the year and for all of 2013 suggesting a reversion of sorts as investors were cautious on valuations.
We have been asked to address the outlook for REITs given the potential for rising interest rates. The issue at hand in our view, is the extent to which increasing rates will be corrosive to real estate valuations and investor returns. Real estate investors and generalist stock investors appear to be seeing the world differently and this tension is leading to some significant quarter-to-quarter price volatility within REIT common equity.
While dedicated real estate investors are keenly focused on interest rates, the continued advance of underlying asset values suggest that private real estate markets as a whole have largely shrugged off interest rate gyrations. Real estate investors appear focused to a greater extent on a host of factors, which have not changed and together characterize a highly favorable fundamental and financial positioning for continued cash flow growth and stable valuations. These include low borrowing spreads, accommodating debt markets, low levels of new construction and stable-to-improving rent/occupancy levels. In this context, U.S. and global institutional demand for U.S. real estate investments is very strong, pricing is stable-to-improving, and there is a suggestion that private capital stands ready to take advantage of public market overreactions where they occur.
The behavior of generalist stock investors large/small cap stock funds, hedge funds, closed end funds suggest a different view. Many of these investors embrace a dividend orientation to investing in REIT common equity and within
Nuveen Investments
9
Portfolio Managers' Comments (continued)
their portfolios REIT's are aligned with a group of income-oriented investments, which become significantly less appealing as rates rise and vice versa.
We expect this tension and the resulting quarter-to-quarter price volatility, to continue as the highly diverse universe of REIT investors respond to shifting signals and interpretations of Fed actions and intent among a myriad of other factors. After significant pricing gains in the first and second quarters, we characterize current REIT common equity valuation's as full-to-fair in contrast to our more favorable stance coming into the year. We would counsel investors to be cautious.
Symphony
The loan market moved steadily higher during the reporting period, returning over 2% as investors wrote off the drop in first quarter GDP as a temporary contraction; focusing instead on encouraging employment data, home sales figures and accommodative Fed policy statements. The senior loan sleeve managed by Symphony positively contributed to the Fund's performance during the reporting period. The senior loan portion of the Fund benefited from credit selection and strong market technicals as loans continue to see demand from institutional and retail investors as well as Collateralized Loan Obligations (CLOs). Year to date visible inflows from CLO issuance and retail loan funds total $63.2 billion and $1.8 billion, respectively.
The Fund's positions in Golden Living and Clear Channel Communications contributed positively to performance during the reporting period. The loans of Clear Channel, a large levered media company contributed to the portfolios' performance. The company reported in-line earnings in March and investors continued to reward these higher beta, higher yielding loans. Also contributing to the portfolios performance were the loans Golden Living, a health care company. During the reporting period, the lenders negotiated more favorable terms through an amendment of the credit agreement and the loans rallied.
The loans of Delta Airlines hurt performance during the reporting period. The loans traded down ahead of the company's April earnings report as investors were broadly concerned that the harsh winter weather conditions would adversely impact the airline industry. Also detracting from performance were the loans of Valeant Pharmaceuticals International, a multinational, specialty pharmaceutical company that develops, manufacturers and markets a range of pharmaceutical products. The loans traded down during the reporting period as the company was the subject of a number of negative sell side research reports.
Nuveen Investments
10
IMPACT OF THE FUND'S LEVERAGE STRATEGY ON PERFORMANCE
One important factor impacting the return of the Fund relative to its benchmarks was the Fund's use of leverage through the use of bank borrowings. The Fund uses leverage because our research has shown that, over time, leveraging provides opportunities for additional income and total return for common shareholders. However, use of leverage also can expose common shareholders to additional volatility. For example, as the prices of securities held by the Fund decline, the negative impact of these valuation changes on common share NAV and common shareholder total return is magnified by the use of leverage. Conversely, leverage may enhance common share returns during periods when the prices of securities held by the Fund generally are rising. The Fund's use of leverage had a positive impact on performance during this reporting period.
The Fund also continued to use swap contracts to partially fix the interest cost of leverage, which as mentioned previously, the Fund uses through bank borrowings. The swap contracts impact on performance was modestly negative during this reporting period, as interest rates moved lower.
As of June 30, 2014, the Fund's percentages of leverage are as shown in the accompanying table.
| | | JDD | |
Effective Leverage* | | | 29.81 | % | |
Regulatory Leverage* | | | 29.81 | % | |
* Effective leverage is the Fund's effective economic leverage, and includes both regulatory leverage and the leverage effects of certain derivative and other investments in the Fund's portfolio that increase the Fund's investment exposure. Regulatory leverage consists of preferred shares issued or borrowings of the Fund. Both of these are part of the Fund's capital structure. Regulatory leverage is subject to asset coverage limits set forth in the Investment Company Act of 1940.
THE FUND'S REGULATORY LEVERAGE
Bank Borrowings
The Fund employs regulatory leverage through the use of bank borrowings. As of June 30, 2014, the Fund had outstanding bank borrowings of $116,000,000.
Refer to Notes to Financial Statements, Note 9 – Borrowing Arrangements for further details.
Nuveen Investments
11
DISTRIBUTION INFORMATION
The following information regarding the Fund's distributions is current as of June 30, 2014. The Fund's distribution levels may vary over time based on the Fund's investment activities and portfolio investment value changes.
The Fund has a managed distribution program. The goal of this program is to provide common shareholders with relatively consistent and predictable cash flow by systematically converting the Fund's expected long-term return potential into regular distributions. As a result, regular common share distributions throughout the year are likely to include a portion of expected long-term gains (both realized and unrealized), along with net investment income.
Important points to understand about the managed distribution program are:
• The Fund seeks to establish a relatively stable common share distribution rate that roughly corresponds to the projected total return from its investment strategy over an extended period of time. However, you should not draw any conclusions about the Fund's past or future investment performance from its current distribution rate.
• Actual common share returns will differ from projected long-term returns (and therefore the Fund's distribution rate), at least over shorter time periods. Over a specific timeframe, the difference between actual returns and total distributions will be reflected in an increasing (returns exceed distributions) or a decreasing (distributions exceed returns) Fund net asset value.
• Each distribution is expected to be paid from some or all of the following sources:
• net investment income (regular interest and dividends),
• realized capital gains, and
• unrealized gains, or, in certain cases, a return of principal (non-taxable distributions).
• A non-taxable distribution is a payment of a portion of the Fund's capital. When the Fund's returns exceed distributions, it may represent portfolio gains generated, but not realized as a taxable capital gain. In periods when the Fund's returns fall short of distributions, the shortfall will represent a portion of your original principal, unless the shortfall is offset during other time periods over the life of your investment (previous or subsequent) when the Fund's total return exceeds distributions.
• Because distribution source estimates are updated during the year based on the Fund's performance and forecast for its current fiscal year (which is the calendar year for the Fund), estimates on the nature of your distributions provided at the time the distributions are paid may differ from both the tax information reported to you in your Fund's IRS Form 1099 statement provided at year end, as well as the ultimate economic sources of distributions over the life of your investment.
Nuveen Investments
12
The following table provides estimated information regarding the Fund's common share distributions and total return performance for the six months ended June 30, 2014. This information is provided on a tax basis rather than a generally accepted accounting principles (GAAP) basis. This information is intended to help you better understand whether the Fund's returns for the specified time period were sufficient to meet its distributions.
As of June 30, 2014 (Common Shares) | | JDD | |
Inception date | | 9/25/03 | |
Six months ended June 30, 2014: | |
Per share distribution: | |
From net investment income | | $ | 0.22 | | |
From realized capital gains | | | 0.29 | | |
Return of capital | | | 0.00 | | |
Total per share distribution | | $ | 0.51 | | |
Annualized distribution rate on NAV | | | 7.45 | % | |
Current distribution rate* | | | 8.48 | % | |
Average annual total returns: | |
Excluding retained gain tax credit/refund**: | |
6-Month (Cumulative) on NAV | | | 10.76 | % | |
| 1-Year on NAV | | | 16.97 | % | |
| 5-Year on NAV | | | 18.26 | % | |
| 10-Year on NAV | | | 7.84 | % | |
Including retained gain tax credit/refund**: | |
6-Month (Cumulative) on NAV | | | 10.76 | % | |
| 1-Year on NAV | | | 16.97 | % | |
| 5-Year on NAV | | | 18.26 | % | |
| 10-Year on NAV | | | 8.05 | % | |
* Current distribution rate is based on the Fund's current annualized quarterly distribution divided by the Fund's current market price. The Fund's quarterly distributions to its shareholders may be comprised of ordinary income, net realized capital gains and, if at the end of the fiscal year the Fund's cumulative net ordinary income and net realized gains are less than the amount of the Fund's distributions, a return of capital for tax purposes.
** The Fund elected to retain a portion of its realized long-term capital gains for the tax years ended December 31, 2007 and December 31, 2006, and pay required federal corporate income taxes on these amounts. As reported on Form 2439, common shareholders on record date must include their pro-rata share of these gains on their applicable federal tax returns, and are entitled to take offsetting tax credits, for their pro-rata share of the taxes paid by the Fund. The total returns "Including retained gain tax credit/refund" include the economic benefit to common shareholders on record date of these tax credits/refunds. The Fund had no retained capital gains for the tax years ended December 31, 2008 through December 31, 2013 or for the tax years ended prior to December 31, 2006.
Nuveen Investments
13
Common Share Information (continued)
COMMON SHARE REPURCHASES
As of June 30, 2014, and since the inception of the Fund's repurchase program, the Fund has cumulatively repurchased and retired common shares as shown in the accompanying table.
| | | JDD | |
Common Shares Cumulatively Repurchased and Retired | | | 268,008 | | |
Common Shares Authorized for Repurchase | | | 1,995,000 | | |
During the current reporting period, the Fund did not repurchase any of its outstanding common shares.
OTHER COMMON SHARE INFORMATION
As of June 30, 2014, and during the current reporting period, the Fund's common share price was trading at a premium/(discount) to its common share NAV as shown in the accompanying table.
| | | JDD | |
Common Share NAV | | $ | 13.70 | | |
Common Share Price | | $ | 12.26 | | |
Premium/(Discount) to NAV | | | (10.51 | )% | |
6-Month Average Premium/(Discount) to NAV | | | (11.53 | )% | |
Nuveen Investments
14
Fund shares are not guaranteed or endorsed by any bank or other insured depository institution, and are not federally insured by the Federal Deposit Insurance Corporation. Shares of closed-end funds are subject to investment risks, including the possible loss of principal invested. Past performance is no guarantee of future results. Fund common shares are subject to a variety of risks, including:
Investment, Market and Price Risk. An investment in common shares is subject to investment risk, including the possible loss of the entire principal amount that you invest. Your investment in common shares represents an indirect investment in the corporate securities owned by the Fund, which generally trade in the over-the-counter markets. Shares of closed-end investment companies like the Fund frequently trade at a discount to their NAV. Your common shares at any point in time may be worth less than your original investment, even after taking into account the reinvestment of Fund dividends and distributions.
Leverage Risk. The Fund's use of leverage creates the possibility of higher volatility for the Fund's per share NAV, market price and distributions. Leverage risk can be introduced through regulatory leverage (issuing preferred shares or debt borrowings at the Fund level) or through certain derivative investments held in the Fund's portfolio. Leverage typically magnifies the total return of the Fund's portfolio, whether that return is positive or negative. The use of leverage creates an opportunity for increased common share net income, but there is no assurance that the Fund's leveraging strategy will be successful.
Tax Risk. The tax treatment of Fund distributions may be affected by new IRS interpretations of the Internal Revenue Code and future changes in tax laws and regulations. This is particularly true for funds employing a managed distribution program.
Common Stock Risk. Common stock returns often have experienced significant volatility.
Counterparty Risk. To the extent that a Fund's derivative investments are purchased or sold in over-the-counter transactions, the Fund will be exposed to the risk that counterparties to these transactions will be unable to meet their obligations.
Issuer Credit Risk. This is the risk that a security in the Fund's portfolio will fail to make dividend or interest payments when due.
Illiquid Securities Risk. This is the risk that the Fund may not be able to sell securities in its portfolio at the time or price desired by the Fund.
Below-Investment Grade Risk. Investments in securities below investment grade quality are predominantly speculative and subject to greater volatility and risk of default.
Non-U.S. Securities Risk. Investments in non-U.S securities involve special risks not typically associated with domestic investments including currency risk and adverse political, social and economic development. These risks often are magnified in emerging markets.
Real Estate Risk. The Fund may invest in various types of securities issued by real estate investment trusts (REITs), linking an investment in the Fund to the performance of the real estate markets, which may fall due to increasing vacancies, declining rents or the failure of borrowers to pay their loans.
Derivatives Strategy Risk. Derivative securities such as calls, puts, warrants, swaps and forwards carry risks different from, and possibly greater than, the risks associated with the underlying investments.
Nuveen Investments
15
Risk Considerations (continued)
Unrated Investment Risk. In determining whether an unrated security is an appropriate investment for the Fund, the portfolio manager will consider information from industry sources, as well as its own quantitative and qualitative analysis, in making such a determination. However, such a determination by the portfolio manager is not the equivalent of a rating by a rating agency.
Dividend Income Risk. There is no guarantee that the issuers of common stocks in which the Fund invests will declare dividends in the future or that, if declared, they will remain at current levels or increase over time.
Risks from Unsecured Adjustable Rate Loans or Insufficient Collateral Securing Adjustable Rate Loans. Some of the adjustable rate loans in which the Fund may invest will be unsecured or insufficiently collateralized, thereby increasing the risk of loss to the Fund in the event of issuer default.
Value Stock Risks. Value stocks are securities that the portfolio manager believes to be undervalued or mispriced. If the manager's assessment of a company's prospects is wrong, the price of the company's common stock or other equity securities may fall, or may not approach the value that the manager has placed on them.
Interest Rate Swaps Risk. The risk that yields will move in the direction opposite to the direction anticipated by a Fund, which would cause a Fund to make payments to its counterparty in the transaction that could adversely affect the Fund's performance.
Forward Currency Contracts Risk. Forward currency contracts are not standardized and are substantially unregulated. Principals are not required to continue to make markets in the securities or currencies they trade and these markets can experience periods of illiquidity, sometimes of significant duration. In addition, trading forward currency contracts can have the effect of financial leverage by creating additional investment exposure.
Reinvestment Risk. If market interest rates decline, income earned from the Fund's portfolio may be reinvested at rates below that of the original bond that generated the income.
Nuveen Investments
16
Nuveen Diversified Dividend and Income Fund
Performance Overview and Holding Summaries as of June 30, 2014
Refer to Glossary of Terms Used in this Report for further definition of terms used in this section.
Average Annual Total Returns as of June 30, 2014
| | | Cumulative | | Average Annual | |
| | 6-Month | | 1-Year | | 5-Year | | 10-Year | |
JDD at Common Share NAV | | | 10.76 | % | | | 16.97 | % | | | 18.26 | % | | | 7.84 | % | |
JDD at Common Share Price | | | 13.46 | % | | | 10.79 | % | | | 21.43 | % | | | 8.94 | % | |
JDD Blended Index (Comparative Benchmark) | | | 9.23 | % | | | 14.36 | % | | | 15.84 | % | | | 9.54 | % | |
S&P 500® Index | | | 7.14 | % | | | 24.61 | % | | | 18.83 | % | | | 7.78 | % | |
Average Annual Total Returns as of June 30, 20141 (including retained gain tax credit/refund)
| | | Cumulative | | Average Annual | |
| | | 6-Month | | 1-Year | | 5-Year | | 10-Year | |
JDD at Common Share NAV | | | 10.76 | % | | | 16.97 | % | | | 18.26 | % | | | 8.05 | % | |
JDD at Common Share Price | | | 13.46 | % | | | 10.79 | % | | | 21.43 | % | | | 9.16 | % | |
Past performance is not predictive of future results. Current performance may be higher or lower than the data shown. Returns do not reflect the deduction of taxes that shareholders may have to pay on Fund distributions or upon the sale of Fund shares. Returns at NAV are net of Fund expenses, and assume reinvestment of distributions. Comparative index return information is provided for the Fund's shares at NAV only. Indexes are not available for direct investment.
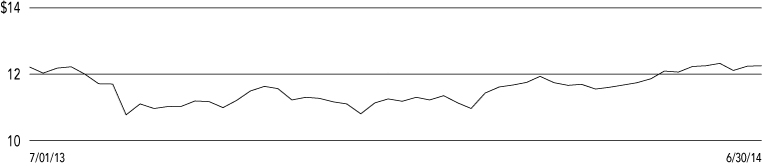
Common Share Price Performance — Weekly Closing Price
Nuveen Investments
17
Performance Overview and Holding Summaries (continued)
This data relates to the securities held in the Fund's portfolio of investments as of the end of the reporting period. It should not be construed as a measure of performance for the Fund itself. Holdings are subject to change.
Portfolio Allocation
(% of net assets)
Common Stocks | | | 35.6 | % | |
Real Estate Investment Trust (REIT)
Common Stocks | | | 38.1 | % | |
Convertible Preferred Securities | | | 0.4 | % | |
$25 Par (or similar) Retail Preferred | | | 0.4 | % | |
$1,000 Par (or similar)
Institutional Preferred | | | 0.4 | % | |
Variable Rate Senior Loan Interests | | | 29.8 | % | |
Corporate Bonds | | | 0.1 | % | |
Emerging Market Debt and
Foreign Corporate Bonds | | | 33.5 | % | |
Short-Term Investments | | | 6.7 | % | |
Borrowings | | | (42.5 | )% | |
Other Assets Less Liabilities | | | (2.5 | )% | |
Portfolio Composition
(% of total investments)2
Real Estate Investment Trust (REIT)
Common Stocks | | | 26.3 | % | |
Emerging Market Debt and
Foreign Corporate Bonds | | | 23.1 | % | |
Pharmaceuticals | | | 5.6 | % | |
Media | | | 5.6 | % | |
Oil, Gas & Consumable Fuels | | | 3.1 | % | |
Banks | | | 2.2 | % | |
Insurance | | | 2.5 | % | |
Food Products | | | 2.1 | % | |
Software | | | 2.1 | % | |
Diversified Telecommunication
Services | | | 1.8 | % | |
Automobiles | | | 1.5 | % | |
Capital Markets | | | 1.3 | % | |
Short-Term Investments | | | 4.7 | % | |
Other Industries | | | 18.1 | % | |
REIT Common Stocks
Top Five Industries
(% of total investments)2
Retail | | | 7.1 | % | |
Residential | | | 4.4 | % | |
Office | | | 3.4 | % | |
HealthCare | | | 3.1 | % | |
Hotels, Restaurants & Leisure | | | 2.1 | % | |
Country Allocation
(% of total investments)2
United States | | | 65.4 | % | |
Netherlands | | | 1.7 | % | |
Brazil | | | 1.7 | % | |
United Kingdom | | | 1.6 | % | |
Indonesia | | | 1.5 | % | |
Colombia | | | 1.4 | % | |
France | | | 1.4 | % | |
Mexico | | | 1.3 | % | |
Russia | | | 1.2 | % | |
Canada | | | 1.2 | % | |
Switzerland | | | 1.2 | % | |
Other Countries | | | 20.4 | % | |
1 As previously explained in the Common Share Information section of this report, the Fund elected to retain a portion of its realized long-term capital gains for the tax years ended December 31, 2007 and December 31, 2006, and pay required federal corporate income taxes on these amounts. These standardized total returns include the economic benefit to common shareholders of record of this tax credit/refund. The Fund had no retained capital gains for the tax years ended December 31, 2008 through December 31, 2013 or for the tax years ended prior to December 31, 2006.
2 Excluding investments in derivatives.
Nuveen Investments
18
Nuveen Diversified Dividend and Income Fund
Portfolio of Investments June 30, 2014 (Unaudited)
| Shares | | Description (1) | | | | | | | | Value | |
| | | LONG-TERM INVESTMENTS – 138.3% (95.3% of Total Investments) | |
| | | COMMON STOCKS – 35.6% (24.6% of Total Investments) | |
| | | Automobiles – 1.5% | |
| | 8,000 | | | Daimler AG, Sponsored ADR, (3) | | | | | | | | | | | | | | $ | 748,880 | | |
| | 88,000 | | | Ford Motor Company | | | | | | | | | | | | | | | 1,517,120 | | |
| | 48,000 | | | General Motors Company | | | | | | | | | | | | | | | 1,742,400 | | |
| | | Total Automobiles | | | 4,008,400 | | |
| | | Banks – 2.8% | |
| | 47,000 | | | Citigroup Inc. | | | | | | | | | | | | | | | 2,213,700 | | |
| | 44,000 | | | JPMorgan Chase & Co. | | | | | | | | | | | | | | | 2,535,280 | | |
| | 57,000 | | | Wells Fargo & Company | | | | | | | | | | | | | | | 2,995,920 | | |
| | Total Banks | | | 7,744,900 | | |
| | | Capital Markets – 1.6% | |
| | 70,000 | | | Ares Capital Corporation | | | | | | | | | | | | | | | 1,250,200 | | |
| | 58,500 | | | Bank New York Mellon | | | | | | | | | | | | | | | 2,192,580 | | |
| | 81,500 | | | Medley Capital Corporation | | | | | | | | | | | | | | | 1,064,390 | | |
| | | Total Capital Markets | | | 4,507,170 | | |
| | | Chemicals – 0.8% | |
| | 22,600 | | | Agrium Inc. | | | | | | | | | | | | | | | 2,070,838 | | |
| | | Communications Equipment – 1.3% | |
| | 61,500 | | | Cisco Systems, Inc. | | | | | | | | | | | | | | | 1,528,275 | | |
| | 167,200 | | | Ericsson LM Telefonaktiebolaget | | | | | | | | | | | | | | | 2,019,776 | | |
| | | Total Communications Equipment | | | 3,548,051 | | |
| | | Consumer Finance – 0.7% | |
| | 24,000 | | | Capital One Financial Corporation | | | | | | | | | | | | | | | 1,982,400 | | |
| | | Containers & Packaging – 0.7% | |
| | 39,500 | | | Avery Dennison Corporation | | | | | | | | | | | | | | | 2,024,375 | | |
| | | Diversified Financial Services – 1.4% | |
| | 295,000 | | | Deutsche Boerse AG, ADR, (3) | | | | | | | | | | | | | | | 2,280,350 | | |
| | 110,400 | | | ING Groep N.V, Sponsored ADR, (2) | | | | | | | | | | | | | | | 1,547,808 | | |
| | | Total Diversified Financial Services | | | 3,828,158 | | |
| | | Diversified Telecommunication Services – 0.7% | |
| | 65,000 | | | Nippon Telegraph and Telephone Corporation, ADR | | | | | | | | | | | | | | | 2,028,650 | | |
| | | Food & Staples Retailing – 1.2% | |
| | 110,000 | | | Carrefour SA, Sponsored ADR, (3) | | | | | | | | | | | | | | | 803,000 | | |
| | 33,000 | | | CVS Caremark Corporation | | | | | | | | | | | | | | | 2,487,210 | | |
| | | Total Food & Staples Retailing | | | 3,290,210 | | |
| | | Food Products – 0.3% | |
| | 85,000 | | | Orkla ASA, Sponsored ADR | | | | | | | | | | | | | | | 764,150 | | |
Nuveen Investments
19
JDD Nuveen Diversified Dividend and Income Fund
Portfolio of Investments (continued) June 30, 2014 (Unaudited)
| Shares | | Description (1) | | | | | | | | Value | |
| | | Hotels, Restaurants & Leisure – 0.6% | |
| | 9,750 | | | Hyatt Hotels Corporation, Class A, (2) | | | | | | | | | | | | | | $ | 594,555 | | |
| | 31,200 | | | Norwegian Cruise Line Holdings Limited, (2) | | | | | | | | | | | | | | | 989,040 | | |
| | | Total Hotels, Restaurants & Leisure | | | 1,583,595 | | |
| | | Independent Power Producers & Energy Traders – 0.1% | |
| | 4,200 | | | Abengoa Yield PLC, (2) | | | | | | | | | | | | | | | 158,844 | | |
| | | Industrial Conglomerates – 0.9% | |
| | 38,000 | | | General Electric Company | | | | | | | | | | | | | | | 998,640 | | |
| | 33,000 | | | Philips Electronics | | | | | | | | | | | | | | | 1,048,080 | | |
| | 4,000 | | | Siemens AG, Sponsored ADR, (3) | | | | | | | | | | | | | | | 528,760 | | |
| | | Total Industrial Conglomerates | | | 2,575,480 | | |
| | | Insurance – 3.6% | |
| | 69,000 | | | American International Group, Inc. | | | | | | | | | | | | | | | 3,766,020 | | |
| | 55,000 | | | Hartford Financial Services Group, Inc. | | | | | | | | | | | | | | | 1,969,550 | | |
| | 29,000 | | | Swiss Re AG, Sponsored ADR, (3) | | | | | | | | | | | | | | | 2,580,176 | | |
| | 45,000 | | | Unum Group | | | | | | | | | | | | | | | 1,564,200 | | |
| | | Total Insurance | | | 9,879,946 | | |
| | | Media – 4.5% | |
| | 151,000 | | | Interpublic Group of Companies, Inc. | | | | | | | | | | | | | | | 2,946,010 | | |
| | 10,722 | | | Metro-Goldwyn-Mayer, (2) | | | | | | | | | | | | | | | 838,997 | | |
| | 83,000 | | | National CineMedia, Inc. | | | | | | | | | | | | | | | 1,453,330 | | |
| | 86,400 | | | ProSiebenSat.1 Media AG, ADR, (3) | | | | | | | | | | | | | | | 962,176 | | |
| | 70,000 | | | RTL Group SA, ADR, (3) | | | | | | | | | | | | | | | 787,500 | | |
| | 43,800 | | | Time Warner Inc. | | | | | | | | | | | | | | | 3,076,950 | | |
| | 3,958 | | | Tribune Company, (2) | | | | | | | | | | | | | | | 336,628 | | |
| | 3,184 | | | Tribune Company, (2), (4) | | | | | | | | | | | | | | | — | | |
| | 23,500 | | | Viacom Inc., Class B | | | | | | | | | | | | | | | 2,038,155 | | |
| | | Total Media | | | 12,439,746 | | |
| | | Metals & Mining – 0.4% | |
| | 28,000 | | | AngloGold Ashanti Limited, Sponsored ADR, (2) | | | | | | | | | | | | | | | 481,880 | | |
| | 120,000 | | | AuRico Gold Inc. | | | | | | | | | | | | | | | 511,200 | | |
| | | Total Metals & Mining | | | 993,080 | | |
| | | Oil, Gas & Consumable Fuels – 2.9% | |
| | 24,700 | | | Phillips 66 | | | | | | | | | | | | | | | 1,986,621 | | |
| | 28,100 | | | Royal Dutch Shell PLC, Class A, ADR | | | | | | | | | | | | | | | 2,314,597 | | |
| | 32,000 | | | Suncor Energy, Inc. | | | | | | | | | | | | | | | 1,364,160 | | |
| | 30,000 | | | Total SA, Sponsored ADR | | | | | | | | | | | | | | | 2,166,000 | | |
| | | Total Oil, Gas & Consumable Fuels | | | 7,831,378 | | |
| | | Pharmaceuticals – 6.0% | |
| | 18,400 | | | AbbVie Inc. | | | | | | | | | | | | | | | 1,038,496 | | |
| | 20,500 | | | AstraZeneca PLC, Sponsored ADR | | | | | | | | | | | | | | | 1,523,355 | | |
| | 48,300 | | | GlaxoSmithKline PLC, Sponsored ADR | | | | | | | | | | | | | | | 2,583,084 | | |
| | 18,000 | | | Merck & Company Inc. | | | | | | | | | | | | | | | 1,041,300 | | |
| | 111,000 | | | Pfizer Inc. (5) | | | | | | | | | | | | | | | 3,294,480 | | |
| | 54,800 | | | Roche Holdings AG, Sponsored ADR, (3) | | | | | | | | | | | | | | | 2,044,040 | | |
| | 37,800 | | | Sanofi-Aventis, ADR | | | | | | | | | | | | | | | 2,009,826 | | |
| | 53,000 | | | Teva Pharmaceutical Industries Limited, Sponsored ADR | | | | | | | | | | | | | | | 2,778,260 | | |
| | | Total Pharmaceuticals | | | 16,312,841 | | |
Nuveen Investments
20
| Shares | | Description (1) | | | | | | | | Value | |
| | | Semiconductors & Equipment – 1.1% | |
| | 27,300 | | | Analog Devices, Inc. | | | | | | | | | | | | | | $ | 1,476,112 | | |
| | 33,700 | | | Microchip Technology Incorporated | | | | | | | | | | | | | | | 1,644,897 | | |
| | | Total Semiconductors & Equipment | | | 3,121,009 | | |
| | | Software – 1.4% | |
| | 246,734 | | | Eagle Topco LP, (2), (3) | | | | | | | | | | | | | | | — | | |
| | 60,300 | | | Microsoft Corporation | | | | | | | | | | | | | | | 2,514,510 | | |
| | 31,000 | | | Oracle Corporation | | | | | | | | | | | | | | | 1,256,430 | | |
| | | Total Software | | | 3,770,940 | | |
| | | Tobacco – 0.5% | |
| | 15,000 | | | Philip Morris International | | | | | | | | | | | | | | | 1,264,650 | | |
| | | Wireless Telecommunication Services – 0.6% | |
| | 47,000 | | | Vodafone Group PLC, Sponsored ADR | | | | | | | | | | | | | | | 1,569,330 | | |
| | | Total Common Stocks (cost $74,152,453) | | | 97,298,141 | | |
| Shares | | Description (1) | | | | | | | | Value | |
| | | REAL ESTATE INVESTMENT TRUST (REIT) COMMON STOCKS – 38.1% (26.3% of Total Investments) | |
| | | Diversified – 2.9% | |
| | 199,800 | | | Duke Realty Corporation | | | | | | | | | | | | | | $ | 3,628,368 | | |
| | 40,950 | | | Vornado Realty Trust | | | | | | | | | | | | | | | 4,370,591 | | |
| | | Total Diversified | | | 7,998,959 | | |
| | | Health Care – 4.5% | |
| | 97,250 | | | HCP, Inc. | | | | | | | | | | | | | | | 4,024,205 | | |
| | 61,650 | | | Health Care REIT, Inc. | | | | | | | | | | | | | | | 3,863,606 | | |
| | 42,900 | | | Senior Housing Properties Trust | | | | | | | | | | | | | | | 1,042,041 | | |
| | 51,350 | | | Ventas Inc. | | | | | | | | | | | | | | | 3,291,535 | | |
| | | Total Health Care | | | 12,221,387 | | |
| | | Hotels, Restaurants & Leisure – 3.0% | |
| | 179,642 | | | Host Hotels & Resorts Inc. | | | | | | | | | | | | | | | 3,953,920 | | |
| | 19,900 | | | LaSalle Hotel Properties | | | | | | | | | | | | | | | 702,271 | | |
| | 63,350 | | | RLJ Lodging Trust | | | | | | | | | | | | | | | 1,830,182 | | |
| | 110,650 | | | Sunstone Hotel Investors Inc. | | | | | | | | | | | | | | | 1,652,005 | | |
| | | Total Hotels, Restaurants & Leisure | | | 8,138,378 | | |
| | | Industrial – 2.4% | |
| | 22,800 | | | EastGroup Properties Inc. | | | | | | | | | | | | | | | 1,464,444 | | |
| | 124,448 | | | Prologis Inc. | | | | | | | | | | | | | | | 5,113,565 | | |
| | | Total Industrial | | | 6,578,009 | | |
| | | Mortgage – 0.8% | |
| | 57,300 | | | PennyMac Mortgage Investment Trust | | | | | | | | | | | | | | | 1,257,162 | | |
| | 50,000 | | | Redwood Trust Inc. | | | | | | | | | | | | | | | 973,500 | | |
| | | Total Mortgage | | | 2,230,662 | | |
| | | Office – 5.0% | |
| | 25,600 | | | Alexandria Real Estate Equities Inc. | | | | | | | | | | | | | | | 1,987,584 | | |
| | 97,650 | | | BioMed Realty Trust Inc. | | | | | | | | | | | | | | | 2,131,700 | | |
| | 30,600 | | | Boston Properties, Inc. | | | | | | | | | | | | | | | 3,616,308 | | |
| | 92,650 | | | Brandywine Realty Trust | | | | | | | | | | | | | | | 1,445,340 | | |
| | 53,150 | | | Douglas Emmett Inc. | | | | | | | | | | | | | | | 1,499,893 | | |
| | 13,950 | | | Kilroy Realty Corporation | | | | | | | | | | | | | | | 868,806 | | |
| | 19,050 | | | SL Green Realty Corporation | | | | | | | | | | | | | | | 2,084,261 | | |
| | | Total Office | | | 13,633,892 | | |
Nuveen Investments
21
JDD Nuveen Diversified Dividend and Income Fund
Portfolio of Investments (continued) June 30, 2014 (Unaudited)
| Shares | | Description (1) | | | | | | | | Value | |
| | | Residential – 6.4% | |
| | 106,676 | | | Apartment Investment & Management Company, Class A | | | | | | | | | | | | | | $ | 3,442,435 | | |
| | 29,175 | | | AvalonBay Communities, Inc. | | | | | | | | | | | | | | | 4,148,393 | | |
| | 21,450 | | | Equity Lifestyles Properties Inc. | | | | | | | | | | | | | | | 947,232 | | |
| | 67,100 | | | Equity Residential | | | | | | | | | | | | | | | 4,227,300 | | |
| | 12,150 | | | Essex Property Trust Inc. | | | | | | | | | | | | | | | 2,246,657 | | |
| | 87,350 | | | UDR Inc. | | | | | | | | | | | | | | | 2,500,831 | | |
| | | Total Residential | | | 17,512,848 | | |
| | | Retail – 10.2% | |
| | 30,750 | | | Brixmor Property Group Inc. | | | | | | | | | | | | | | | 705,714 | | |
| | 27,350 | | | CBL & Associates Properties Inc. | | | | | | | | | | | | | | | 519,651 | | |
| | 122,250 | | | Developers Diversified Realty Corporation | | | | | | | | | | | | | | | 2,155,269 | | |
| | 10,700 | | | Federal Realty Investment Trust | | | | | | | | | | | | | | | 1,293,845 | | |
| | 150,310 | | | General Growth Properties Inc. | | | | | | | | | | | | | | | 3,541,305 | | |
| | 113,200 | | | Kimco Realty Corporation | | | | | | | | | | | | | | | 2,601,337 | | |
| | 61,741 | | | Macerich Company | | | | | | | | | | | | | | | 4,121,213 | | |
| | 24,900 | | | Regency Centers Corporation | | | | | | | | | | | | | | | 1,386,433 | | |
| | 35,400 | | | Retail Opportunity Investments Corporation | | | | | | | | | | | | | | | 556,843 | | |
| | 42,835 | | | Simon Property Group, Inc. | | | | | | | | | | | | | | | 7,122,598 | | |
| | 41,000 | | | Taubman Centers Inc. | | | | | | | | | | | | | | | 3,108,211 | | |
| | 25,850 | | | Weingarten Realty Trust | | | | | | | | | | | | | | | 848,914 | | |
| | | Total Retail | | | 27,961,333 | | |
| | | Specialized – 2.9% | |
| | 89,100 | | | CubeSmart | | | | | | | | | | | | | | | 1,632,312 | | |
| | 29,900 | | | Extra Space Storage Inc. | | | | | | | | | | | | | | | 1,592,175 | | |
| | 26,924 | | | Public Storage, Inc. | | | | | | | | | | | | | | | 4,613,424 | | |
| | | Total Specialized | | | 7,837,911 | | |
| | | Total Real Estate Investment Trust (REIT) Common Stocks (cost $72,100,494) | | | | | | | | | | | | | | | 104,113,379 | | |
| Shares | | Description (1) | | Coupon | | | | Ratings (6) | | Value | |
| | | CONVERTIBLE PREFERRED SECURITIES – 0.4% (0.2% of Total Investments) | |
| | | Diversified Telecommunication Services – 0.4% | |
| | 19,000 | | | IntelSat SA | | | 5.750 | % | | | | | | N/R | | $ | 967,290 | | |
| | | Total Convertible Preferred Securities (cost $1,024,405) | | | 967,290 | | |
| Shares | | Description (1) | | Coupon | | | | Ratings (6) | | Value | |
| | | $25 PAR (OR SIMILAR) RETAIL PREFERRED – 0.4% (0.2% of Total Investments) | |
| | | Banks – 0.4% | |
| | 40,283 | | | Texas Capital Bancshares | | | 6.500 | % | | | | | | BB+ | | $ | 975,251 | | |
| | | Total $25 Par (or similar) Retail Preferred (cost $921,611) | | | 975,251 | | |
Principal
Amount (000) | | Description (1) | | Coupon | | Maturity | | Ratings | | Value | |
| | | $1,000 PAR (OR SIMILAR) INSTITUTIONAL PREFERRED – 0.4% (0.3% of Total Investments) | |
| | | Diversified Financial Services – 0.4% | |
$ | 978,000 | | | JPMorgan Chase & Company | | | 6.000 | % | | | N/A (7) | | | BBB | | $ | 997,560 | | |
$ | 978,000 | | | Total $1,000 Par (or similar) Institutional Preferred (cost $978,000) | | | 997,560 | | |
Nuveen Investments
22
Principal
Amount (000) | | Description (1) | | Coupon | | Maturity (8) | | Ratings (6) | | Value | |
| | | VARIABLE RATE SENIOR LOAN INTERESTS – 29.8% (20.6% of Total Investments) (9) | |
| | | Aerospace & Defense – 0.1% | |
$ | 421 | | | Hamilton Sundstrand, Term Loan, First Lien | | | 4.000 | % | | 12/13/19 | | B+ | | $ | 420,702 | | |
| | | Airlines – 0.4% | |
| | 495 | | | American Airlines, Inc., Term Loan | | | 3.750 | % | | 6/27/19 | | Ba2 | | | 497,033 | | |
| | 493 | | | Delta Air Lines, Inc., Term Loan B1 | | | 3.500 | % | | 10/18/18 | | Ba1 | | | 492,808 | | |
| | 988 | | | Total Airlines | | | 989,841 | | |
| | | Auto Components – 0.5% | |
| | 1,000 | | | Goodyear Tire & Rubber Company, Term Loan, Second Lien | | | 4.750 | % | | 4/30/19 | | Ba1 | | | 1,007,492 | | |
| | 421 | | | Tomkins, LLC / Tomkins, Inc., Term Loan B2 | | | 3.850 | % | | 9/29/16 | | BB | | | 422,108 | | |
| | 1,421 | | | Total Auto Components | | | 1,429,600 | | |
| | | Automobiles – 0.7% | |
| | 995 | | | Chrysler Group LLC, Term Loan B | | | 3.500 | % | | 5/24/17 | | BB+ | | | 1,000,024 | | |
| | 998 | | | Chrysler Group LLC, Tranche B, Term Loan | | | 3.250 | % | | 12/31/18 | | BB+ | | | 996,249 | | |
| | 1,993 | | | Total Automobiles | | | 1,996,273 | | |
| | | Building Products – 0.3% | |
| | 800 | | | Gates Global LLC., First Lien Term Loan, WI/DD | | TBD | | TBD | | B+ | | | 798,437 | | |
| | | Capital Markets – 0.2% | |
| | 496 | | | Guggenheim Partners LLC, Initial Term Loan | | | 4.250 | % | | 7/22/20 | | N/R | | | 498,524 | | |
| | | Chemicals – 0.9% | |
| | 500 | | | Mineral Technologies, Inc., Term Loan B, First Lien | | | 4.000 | % | | 5/07/21 | | BB | | | 503,750 | | |
| | 965 | | | Univar, Inc., Term Loan | | | 5.000 | % | | 6/30/17 | | B+ | | | 969,937 | | |
| | 990 | | | US Coatings Acquisition, Term Loan B | | | 4.000 | % | | 2/01/20 | | B+ | | | 991,788 | | |
| | 2,455 | | | Total Chemicals | | | 2,465,475 | | |
| | | Commercial Services & Supplies – 0.7% | |
| | 985 | | | ADS Waste Holdings, Inc., Initial Term Loan, Tranche B2 | | | 3.750 | % | | 10/09/19 | | B+ | | | 981,746 | | |
| | 1,000 | | | Millennium Laboratories, Inc., Tranche B, Term Loan | | | 5.250 | % | | 4/16/21 | | B+ | | | 1,010,408 | | |
| | 1,985 | | | Total Commercial Services & Supplies | | | 1,992,154 | | |
| | | Computers & Peripherals – 0.4% | |
| | 995 | | | Dell, Inc., Term Loan B | | | 4.500 | % | | 4/29/20 | | BB+ | | | 1,001,050 | | |
| | | Containers & Packaging – 0.6% | |
| | 100 | | | Berry Plastics Holding Corporation, Term Loan E | | | 3.750 | % | | 1/06/21 | | BB– | | | 99,536 | | |
| | 1,575 | | | Reynolds Group Holdings, Inc., Incremental US Term Loan, First Lien | | | 4.000 | % | | 12/01/18 | | B+ | | | 1,578,652 | | |
| | 1,675 | | | Total Containers & Packaging | | | 1,678,188 | | |
| | | Diversified Consumer Services – 0.7% | |
| | 1,461 | | | Hilton Hotels Corporation, Term Loan B2 | | | 3.500 | % | | 10/25/20 | | BB+ | | | 1,459,650 | | |
| | 420 | | | ServiceMaster Company, Term Loan B, WI/DD | | TBD | | TBD | | B+ | | | 419,642 | | |
| | 1,881 | | | Total Diversified Consumer Services | | | 1,879,292 | | |
| | | Diversified Telecommunication Services – 1.5% | |
| | 821 | | | Intelsat Jackson Holdings, S.A., Tranche B2, Term Loan | | | 3.750 | % | | 6/30/19 | | BB– | | | 823,117 | | |
| | 1,000 | | | SBA Communication, Incremental Term Loan, Tranche B1 | | | 3.250 | % | | 3/24/21 | | BB | | | 996,354 | | |
| | 432 | | | WideOpenWest Finance LLC, Term Loan B | | | 4.750 | % | | 4/01/19 | | Ba3 | | | 434,658 | | |
| | 739 | | | Windstream Corporation, Term Loan B4 | | | 3.500 | % | | 1/23/20 | | BB+ | | | 737,937 | | |
| | 370 | | | Ziggo N.V., Term Loan B1, DD1 | | TBD | | TBD | | BB– | | | 365,726 | | |
| | 238 | | | Ziggo N.V., Term Loan B2, DD1 | | | 3.250 | % | | 1/15/22 | | BB– | | | 235,681 | | |
| | 392 | | | Ziggo N.V., Term Loan B3, WI/DD | | | 3.250 | % | | 1/15/22 | | BB– | | | 387,611 | | |
| | 3,992 | | | Total Diversified Telecommunication Services | | | 3,981,084 | | |
Nuveen Investments
23
JDD Nuveen Diversified Dividend and Income Fund
Portfolio of Investments (continued) June 30, 2014 (Unaudited)
Principal
Amount (000) | | Description (1) | | Coupon | | Maturity (8) | | Ratings (6) | | Value | |
| | | Energy Equipment & Services – 0.1% | |
$ | 248 | | | Drill Rigs Holdings, Inc., Tranche B1, Term Loan | | | 6.000 | % | | 3/31/21 | | B+ | | $ | 251,847 | | |
| | | Food & Staples Retailing – 0.2% | |
| | 500 | | | BJ's Wholesale Club, Inc., Replacement Loan, Second Lien | | | 8.500 | % | | 3/26/20 | | CCC | | | 513,854 | | |
| | | Food Products – 2.8% | |
| | 2,772 | | | H.J Heinz Company, Term Loan B2 | | | 3.500 | % | | 6/05/20 | | BB | | | 2,795,728 | | |
| | 4,838 | | | US Foods, Inc., Incremental Term Loan | | | 4.500 | % | | 3/31/19 | | B2 | | | 4,850,017 | | |
| | 7,610 | | | Total Food Products | | | 7,645,745 | | |
| | | Health Care Equipment & Supplies – 1.4% | |
| | 929 | | | ConvaTec, Inc., Dollar Term Loan | | | 4.000 | % | | 12/22/16 | | Ba3 | | | 931,189 | | |
| | 1,463 | | | Kinetic Concepts, Inc., Term Loan D1 | | | 4.000 | % | | 5/04/18 | | BB– | | | 1,466,630 | | |
| | 1,389 | | | United Surgical Partners International, Inc., Term Loan, First Lien | | | 4.250 | % | | 4/19/17 | | B1 | | | 1,390,353 | | |
| | 3,781 | | | Total Health Care Equipment & Supplies | | | 3,788,172 | | |
| | | Health Care Providers & Services – 1.6% | |
| | 749 | | | Community Health Systems, Inc., Term Loan D | | | 4.250 | % | | 1/27/21 | | BB | | | 754,881 | | |
| | 1 | | | Community Health Systems, Inc., Term Loan E | | | 3.478 | % | | 1/25/17 | | BB | | | 1,156 | | |
| | 831 | | | DaVita, Inc., Term Loan B | | | 3.500 | % | | 6/24/21 | | Ba1 | | | 836,282 | | |
| | 1,718 | | | Drumm Investors LLC, Term Loan | | | 6.750 | % | | 5/04/18 | | B | | | 1,727,833 | | |
| | 993 | | | HCA, Inc., Tranche B4, Term Loan | | | 2.984 | % | | 5/01/18 | | BB | | | 994,981 | | |
| | 75 | | | HCA, Inc., Tranche B5, Term Loan | | | 2.900 | % | | 3/31/17 | | BB | | | 75,611 | | |
| | 4,367 | | | Total Health Care Providers & Services | | | 4,390,744 | | |
| | | Hotels, Restaurants & Leisure – 1.0% | |
| | 986 | | | MGM Resorts International, Term Loan B | | | 3.500 | % | | 12/20/19 | | BB | | | 984,632 | | |
| | 1,889 | | | Seaworld Parks and Entertainment, Inc., Term Loan B2 | | | 3.000 | % | | 5/14/20 | | BB+ | | | 1,865,681 | | |
| | 2,875 | | | Total Hotels, Restaurants & Leisure | | | 2,850,313 | | |
| | | Household Durables – 1.0% | |
| | 993 | | | Jarden Corporation, Term Loan B1 | | | 2.900 | % | | 9/30/20 | | BBB– | | | 998,285 | | |
| | 970 | | | Serta Simmons Holdings LLC, Term Loan | | | 4.250 | % | | 10/01/19 | | B+ | | | 973,308 | | |
| | 789 | | | Tempur-Pedic International, Inc., New Term Loan B | | | 3.500 | % | | 3/18/20 | | BB | | | 787,478 | | |
| | 2,752 | | | Total Household Durables | | | 2,759,071 | | |
| | | Household Products – 0.5% | |
| | 1,000 | | | Libbey Glass, Inc., Initial Term Loan | | | 3.750 | % | | 4/09/21 | | BB | | | 1,001,250 | | |
| | 378 | | | Spectrum Brands, Inc., Term Loan A | | | 3.000 | % | | 9/04/17 | | BB | | | 378,476 | | |
| | 1,378 | | | Total Household Products | | | 1,379,726 | | |
| | | Independent Power Producers & Energy Traders – 0.4% | |
| | 995 | | | Calpine Corporation, Delayed Term Loan | | | 4.000 | % | | 10/31/20 | | BB– | | | 999,284 | | |
| | | IT Services – 0.3% | |
| | 875 | | | Vantiv, Inc., Term Loan B | | | 3.750 | % | | 6/13/21 | | BB+ | | | 878,692 | | |
| | | Leisure Equipment & Products – 0.7% | |
| | 2,000 | | | 24 Hour Fitness Worldwide, Inc., Term Loan B | | | 4.750 | % | | 5/28/21 | | Ba3 | | | 2,014,584 | | |
| | | Machinery – 0.4% | |
| | 667 | | | Doosan Infracore International, Inc., Term Loan | | | 4.500 | % | | 5/27/21 | | BB– | | | 670,272 | | |
| | 496 | | | Rexnord LLC, Term Loan B | | | 4.000 | % | | 8/21/20 | | BB– | | | 496,560 | | |
| | 1,163 | | | Total Machinery | | | 1,166,832 | | |
Nuveen Investments
24
Principal
Amount (000) | | Description (1) | | Coupon | | Maturity (8) | | Ratings (6) | | Value | |
| | | Media – 3.5% | |
$ | 990 | | | Charter Communications Operating Holdings LLC, Term Loan E | | | 3.000 | % | | 7/01/20 | | Baa3 | | $ | 976,882 | | |
| | 102 | | | Clear Channel Communications, Inc., Tranche B, Term Loan | | | 3.800 | % | | 1/29/16 | | CCC+ | | | 101,709 | | |
| | 748 | | | Clear Channel Communications, Inc., Tranche D, Term Loan | | | 6.900 | % | | 1/30/19 | | CCC+ | | | 746,049 | | |
| | 92 | | | Clear Channel Communications, Inc.,Term Loan E | | | 7.650 | % | | 7/30/19 | | CCC+ | | | 92,710 | | |
| | 1,969 | | | Cumulus Media, Inc., Term Loan B | | | 4.250 | % | | 12/23/20 | | B+ | | | 1,978,859 | | |
| | 333 | | | Gray Television Inc., First Lien Term Loan | | | 3.750 | % | | 6/13/21 | | BB | | | 335,486 | | |
| | 500 | | | Interactive Data Corporation, Term Loan B | | | 4.750 | % | | 5/02/21 | | B+ | | | 504,922 | | |
| | 464 | | | Media General, Inc., Delayed Draw, Term Loan | | | 4.250 | % | | 7/31/20 | | BB– | | | 466,593 | | |
| | 536 | | | Numericable Group S.A., Term Loan B1 | | | 4.500 | % | | 5/21/20 | | Ba3 | | | 539,965 | | |
| | 464 | | | Numericable Group S.A., Term Loan B2 | | | 4.500 | % | | 5/21/20 | | Ba3 | | | 467,144 | | |
| | 496 | | | Springer Science & Business Media, Inc., Term Loan | | | 5.000 | % | | 8/14/20 | | B | | | 498,188 | | |
| | 991 | | | Tribune Company, Term Loan B | | | 4.000 | % | | 12/27/20 | | BB+ | | | 993,742 | | |
| | 1,544 | | | Univision Communications, Inc., Replacement Term Loan, First Lien | | | 4.000 | % | | 3/01/20 | | B+ | | | 1,544,937 | | |
| | 347 | | | Yell Group PLC, Term Loan A2 | | | 0.000 | % | | 3/01/19 | | CCC+ | | | 318,224 | | |
| | 41 | | | Yell Group PLC, Term Loan A2 | | | 0.000 | % | | 3/03/19 | | CCC+ | | | – | | |
| | 639 | | | Yell Group PLC, Term Loan B2, PIK | | | 0.000 | % | | 3/03/24 | | CCC– | | | – | | |
| | 10,256 | | | Total Media | | | 9,565,410 | | |
| | | Multiline Retail – 0.2% | |
| | 463 | | | Hudson's Bay Company, Term Loan B, First Lien | | | 4.750 | % | | 11/04/20 | | BB | | | 468,537 | | |
| | | Oil, Gas & Consumable Fuels – 1.7% | |
| | 1,500 | | | Energy Transfer Equity L.P.,Term Loan, First Lien | | | 3.250 | % | | 12/02/19 | | BB | | | 1,486,790 | | |
| | 643 | | | Fieldwood Energy LLC, Term Loan, First Lien | | | 3.875 | % | | 9/28/18 | | Ba2 | | | 645,842 | | |
| | 500 | | | Fieldwood Energy LLC, Term Loan, Second Lien | | | 8.375 | % | | 9/30/20 | | B2 | | | 517,052 | | |
| | 120 | | | Frac Tech International LLC, Term Loan B | | | 5.750 | % | | 4/16/21 | | B2 | | | 121,546 | | |
| | 833 | | | Samson Investment Company, Tranche 1, Term Loan, Second Lien | | | 5.000 | % | | 9/25/18 | | B1 | | | 835,045 | | |
| | 995 | | | Seadrill Partners LLC, Initial Term Loan | | | 4.000 | % | | 2/21/21 | | BB– | | | 989,748 | | |
| | 4,591 | | | Total Oil, Gas & Consumable Fuels | | | 4,596,023 | | |
| | | Pharmaceuticals – 2.2% | |
| | 998 | | | Grifols, Inc., Term Loan | | | 3.150 | % | | 2/27/21 | | Ba1 | | | 997,563 | | |
| | 896 | | | Par Pharmaceutical Companies, Inc., Term Loan B2 | | | 4.000 | % | | 9/30/19 | | B1 | | | 897,697 | | |
| | 736 | | | Quintiles Transnational Corp., Term Loan B3 | | | 3.750 | % | | 6/08/18 | | BB | | | 737,413 | | |
| | 1,376 | | | Valeant Pharmaceuticals International, Inc., Term Loan E | | | 3.750 | % | | 8/05/20 | | Ba1 | | | 1,376,414 | | |
| | 1,955 | | | Valeant Pharmaceuticals International, Inc., Tranche B, Term Loan D2 | | | 3.750 | % | | 2/13/19 | | Ba1 | | | 1,956,047 | | |
| | 5,961 | | | Total Pharmaceuticals | | | 5,965,134 | | |
| | | Professional Services – 0.1% | |
| | 374 | | | Nielsen Finance LLC, Dollar Term Loan B2 | | | 3.151 | % | | 4/15/21 | | BBB– | | | 376,425 | | |
| | | Real Estate Investment Trust – 0.3% | |
| | 872 | | | Walter Investment Management Corporation, Tranche B, Term Loan, First Lien | | | 4.750 | % | | 12/18/20 | | B+ | | | 864,022 | | |
| | | Real Estate Management & Development – 0.2% | |
| | 648 | | | Capital Automotive LP, Term Loan, Tranche B1 | | | 4.000 | % | | 4/10/19 | | Ba2 | | | 651,653 | | |
| | | Semiconductors & Equipment – 0.6% | |
| | 1,000 | | | Avago Technologies, Term Loan B | | | 3.750 | % | | 5/06/21 | | BBB– | | | 1,004,639 | | |
| | 734 | | | NXP Semiconductor LLC, Term Loan D | | | 3.250 | % | | 1/11/20 | | BB+ | | | 731,253 | | |
| | 1,734 | | | Total Semiconductors & Equipment | | | 1,735,892 | | |
| | | Software – 1.6% | |
| | 424 | | | Activision Blizzard, Inc., Term Loan B | | | 3.250 | % | | 10/12/20 | | BBB | | | 425,453 | | |
| | 499 | | | BMC Software, Inc., Initial Term Loan | | | 5.000 | % | | 9/10/20 | | B1 | | | 498,591 | | |
| | 833 | | | Datatel Parent Corp, Term Loan B1 | | | 4.000 | % | | 7/19/18 | | B+ | | | 834,918 | | |
| | 967 | | | Emdeon Business Services LLC, Term Loan B2 | | | 3.750 | % | | 11/02/18 | | BB– | | | 968,866 | | |
| | 782 | | | Infor Global Solutions Intermediate Holdings, Ltd., Term Loan B5 | | | 3.750 | % | | 6/03/20 | | Ba3 | | | 778,724 | | |
| | 835 | | | SS&C Technologies, Inc./ Sunshine Acquisition II, Inc. 2013 Replacement Term Loan B1 | | | 3.250 | % | | 6/07/19 | | BBB– | | | 836,830 | | |
| | 86 | | | SS&C Technologies, Inc./ Sunshine Acquisition II, Inc. 2013 Replacement Term Loan B2 | | | 3.250 | % | | 6/07/19 | | BBB– | | | 86,609 | | |
| | 4,426 | | | Total Software | | | 4,429,991 | | |
Nuveen Investments
25
JDD Nuveen Diversified Dividend and Income Fund
Portfolio of Investments (continued) June 30, 2014 (Unaudited)
Principal
Amount (000) | | Description (1) | | Coupon | | Maturity (8) | | Ratings (6) | | Value | |
| | | Specialty Retail – 1.3% | |
$ | 623 | | | Burlington Coat Factory Warehouse Corporation, Term Loan B2 | | | 4.250 | % | | 2/23/17 | | BB– | | $ | 628,069 | | |
| | 268 | | | Gardner Denver, Inc., Term Loan | | | 4.250 | % | | 7/30/20 | | B1 | | | 268,188 | | |
| | 1,741 | | | Jo-Ann Stores, Inc., Term Loan, First Lien | | | 4.000 | % | | 3/16/18 | | B+ | | | 1,734,892 | | |
| | 983 | | | Pilot Travel Centers LLC, First Amendment, Tranche B, Term Loan | | | 4.250 | % | | 8/07/19 | | BB | | | 985,781 | | |
| | 3,615 | | | Total Specialty Retail | | | 3,616,930 | | |
| | | Trading Companies & Distributors – 0.3% | |
| | 748 | | | HD Supply, Inc., Term Loan, WI/DD | | TBD | | TBD | | B+ | | | 749,294 | | |
| | | Wireless Telecommunication Services – 0.4% | |
| | 1,000 | | | UPC Broadband Holding BV, Term Loan AH | | | 3.250 | % | | 6/30/21 | | BB– | | | 994,500 | | |
$ | 82,334 | | | Total Variable Rate Senior Loan Interests (cost $81,897,323) | | | 81,783,295 | | |
Principal
Amount (000) | | Description (1) | | Coupon | | Maturity | | Ratings (6) | | Value | |
| | | CORPORATE BONDS – 0.1% (0.0% of Total Investments) | |
| | | Media – 0.1% | |
$ | 132 | | | Clear Channel Communications, Inc. | | | 9.000 | % | | 12/15/19 | | CCC+ | | $ | 140,745 | | |
$ | 132 | | | Total Corporate Bonds (cost $110,724) | | | 140,745 | | |
Principal
Amount (000) (10) | |
Description (1) | |
Coupon | |
Maturity | |
Ratings (6) | |
Value | |
| | | EMERGING MARKETS DEBT AND FOREIGN CORPORATE BONDS – 33.5% (23.1% of Total Investments) | |
| | | Argentina – 0.9% | |
| | 130 | | | City of Buenos Aires, Argentina, 144A | | | | | | | | | | | | | | $ | 132,275 | | |
| | 145 | | | Republic of Argentina | | | 7.000 | % | | 10/03/15 | | B– | | | 140,215 | | |
| | 560 | | | Republic of Argentina | | | 7.000 | % | | 4/17/17 | | B– | | | 523,040 | | |
| | 897 | | | Republic of Argentina | | | 8.280 | % | | 12/31/33 | | B– | | | 755,979 | | |
| | 234 | EUR | | Republic of Argentina | | | 7.820 | % | | 12/31/33 | | CC | | | 257,866 | | |
| | 833 | | | Republic of Argentina | | | 2.500 | % | | 12/31/38 | | CC | | | 399,424 | | |
| | 236 | | | YPF Sociedad Anonima, 144A | | | 8.750 | % | | 4/04/24 | | B– | | | 246,596 | | |
| | | Total Argentina | | | 2,455,395 | | |
| | | Azerbaijan – 0.3% | |
| | 335 | | | Azerbaijan Government International Bond, 144A | | | 4.750 | % | | 3/18/24 | | Baa3 | | | 345,050 | | |
| | 465 | | | Azerbaijan State Oil Company, Reg S | | | 5.450 | % | | 2/09/17 | | BBB– | | | 492,854 | | |
| | | Total Azerbaijan | | | 837,904 | | |
| | | Brazil – 2.7% | |
| | 255 | | | Banco do Nordeste do Brasil, 144A | | | 3.625 | % | | 11/09/15 | | BBB– | | | 261,375 | | |
| | 875 | | | Brazil Minas SPE via State of Minas Gerais, Pass Through Notes, 144A | | | 5.333 | % | | 2/15/28 | | BBB– | | | 882,875 | | |
| | 1,878 | BRL | | Brazil Nota do Tesouro Nacional | | | 10.000 | % | | 1/01/21 | | BBB+ | | | 776,640 | | |
| | 1,398 | BRL | | Brazil Nota do Tesouro Nacional | | | 10.000 | % | | 1/01/23 | | BBB+ | | | 566,252 | | |
| | 2,295 | BRL | | Brazil Nota do Tesouro Nacional | | | 10.000 | % | | 1/01/25 | | BBB+ | | | 908,922 | | |
| | 35 | | | Brazil Nota do Tesouro Nacional | | | 6.000 | % | | 8/15/50 | | BBB+ | | | 389,381 | | |
| | 300 | | | Centrais Eletricas Brasileiras S.A, 144A | | | 5.750 | % | | 10/27/21 | | BBB– | | | 307,764 | | |
| | 315 | | | Centrais Eletricas Brasileiras S.A, Reg S | | | 5.750 | % | | 10/27/21 | | BBB– | | | 323,152 | | |
| | 695 | | | Companhia Energetica de Sao Paulo, 144A | | | 9.750 | % | | 1/15/15 | | Baa3 | | | 486,500 | | |
| | 600 | | | Federative Republic of Brazil | | | 6.000 | % | | 1/17/17 | | Baa2 | | | 667,200 | | |
| | 409 | | | Federative Republic of Brazil | | | 8.000 | % | | 1/15/18 | | Baa2 | | | 455,911 | | |
| | 296 | | | Federative Republic of Brazil | | | 8.250 | % | | 1/20/34 | | Baa2 | | | 409,960 | | |
| | 848 | | | Federative Republic of Brazil | | | 7.125 | % | | 1/20/37 | | Baa2 | | | 1,072,720 | | |
| | | Total Brazil | | | 7,508,652 | | |
Nuveen Investments
26
Principal
Amount (000) (10) | |
Description (1) | |
Coupon | |
Maturity | |
Ratings (6) | |
Value | |
| | | Canada – 0.1% | |
| | 206 | | | Pacific Rubiales Energy Corporation, 144A | | | 7.250 | % | | 12/12/21 | | BB+ | | $ | 228,660 | | |
| | | Chile – 0.6% | |
| | 195 | | | E-CL S.A, 144A | | | 5.625 | % | | 1/15/21 | | BBB | | | 212,739 | | |
| | 655 | | | Coporacion Nacional del Cobre de Chile, Reg S | | | 3.875 | % | | 11/03/21 | | AA– | | | 678,639 | | |
| | 225 | | | Empresa Nacional del Petroleo, Reg S | | | 6.250 | % | | 7/08/19 | | A | | | 256,464 | | |
| | 395 | | | Empresa Nacional del Petroleo, 144A | | | 4.750 | % | | 12/06/21 | | A | | | 419,125 | | |
| | | Total Chile | | | 1,566,967 | | |
| | | China – 0.6% | |
| | 430 | | | CNOOC Curtis Funding 1, Reg S | | | 4.500 | % | | 10/03/23 | | AA– | | | 451,102 | | |
| | 255 | | | Sinopec Group Overseas Development 2012, 144A | | | 3.900 | % | | 5/17/22 | | Aa3 | | | 258,878 | | |
| | 920 | | | Sinopec Group Overseas Development 2013 Limited, 144A | | | 4.375 | % | | 10/17/23 | | Aa3 | | | 960,591 | | |
| | | Total China | | | 1,670,571 | | |
| | | Colombia – 2.1% | |
| | 708 | COP | | Republic of Colombia | | | 12.000 | % | | 10/22/15 | | BBB | | | 411,338 | | |
| | 587 | | | Republic of Colombia | | | 11.750 | % | | 2/25/20 | | BBB | | | 849,683 | | |
| | 420 | COP | | Republic of Colombia | | | 7.750 | % | | 4/14/21 | | BBB | | | 258,219 | | |
| | 175 | COP | | Republic of Colombia | | | 9.850 | % | | 6/28/27 | | BBB | | | 122,029 | | |
| | 535 | | | Republic of Colombia | | | 10.375 | % | | 1/28/33 | | BBB | | | 845,300 | | |
| | 1,420 | | | Republic of Colombia | | | 7.375 | % | | 9/18/37 | | BBB | | | 1,931,200 | | |
| | 440 | | | Republic of Colombia | | | 6.125 | % | | 1/18/41 | | BBB | | | 526,900 | | |
| | 400 | | | Republic of Colombia | | | 5.625 | % | | 2/26/44 | | BBB | | | 448,000 | | |
| | 272 | COP | | Titulos de Tesoreria B Bonds | | | 3.500 | % | | 3/10/21 | | BBB+ | | | 146,564 | | |
| | 210 | COP | | Titulos de Tesoreria B Bonds | | | 4.750 | % | | 2/23/23 | | BBB+ | | | 122,748 | | |
| | | Total Colombia | | | 5,661,981 | | |
| | | Cote d'Ivoire (Ivory Coast) – 0.4% | |
| | 1,075 | | | Ivory Coast Republic, Reg S | | | 5.750 | % | | 12/31/32 | | D | | | 1,041,406 | | |
| | | Croatia – 0.8% | |
| | 130 | | | Republic of Croatia, 144A | | | 6.625 | % | | 7/14/20 | | Ba1 | | | 145,275 | | |
| | 880 | | | Republic of Croatia, Reg S | | | 6.625 | % | | 7/14/20 | | Ba1 | | | 983,400 | | |
| | 280 | | | Republic of Croatia, 144A | | | 6.250 | % | | 4/27/17 | | Ba1 | | | 303,274 | | |
| | 200 | | | Republic of Croatia, Reg S | | | 6.250 | % | | 4/27/17 | | Ba1 | | | 216,624 | | |
| | 400 | | | Republic of Croatia, Reg S | | | 5.375 | % | | 11/29/19 | | Ba1 | | | 448,500 | | |
| | | Total Croatia | | | 2,097,073 | | |
| | | Dominican Republic – 0.6% | |
| | 335 | | | Dominican Republic, 144A | | | 6.600 | % | | 1/28/24 | | B+ | | | 365,653 | | |
| | 405 | | | Dominican Republic, 144A | | | 5.875 | % | | 4/18/24 | | B+ | | | 422,618 | | |
| | 500 | | | Dominican Republic, 144A | | | 7.450 | % | | 4/30/44 | | B+ | | | 533,500 | | |
| | 162 | | | Dominican Republic, Reg S | | | 9.040 | % | | 1/23/18 | | B+ | | | 178,503 | | |
| | 165 | | | Dominican Republic, Reg S | | | 5.875 | % | | 4/18/24 | | B+ | | | 172,178 | | |
| | | Total Dominican Republic | | | 1,672,452 | | |
| | | El Salvador – 0.3% | |
| | 616 | | | Republic of El Salvador, Reg S | | | 7.750 | % | | 1/24/23 | | BB– | | | 695,156 | | |
| | 75 | | | Republic of El Salvador, Reg S | | | 7.625 | % | | 9/21/34 | | BB– | | | 82,500 | | |
| | 120 | | | Republic of El Salvador, Reg S | | | 7.650 | % | | 6/15/35 | | BB– | | | 129,780 | | |
| | 30 | | | Republic of El Salvador, Reg S | | | 8.250 | % | | 4/10/32 | | BB– | | | 34,125 | | |
| | | Total El Salvador | | | 941,561 | | |
Nuveen Investments
27
JDD Nuveen Diversified Dividend and Income Fund
Portfolio of Investments (continued) June 30, 2014 (Unaudited)
Principal
Amount (000) (10) | |
Description (1) | |
Coupon | |
Maturity | |
Ratings (6) | |
Value | |
| | | Hungary – 0.8% | |
| | 395 | EUR | | Republic of Hungary, Government Bond, Reg S | | | 4.375 | % | | 7/04/17 | | Ba1 | | $ | 579,059 | | |
| | 276 | | | Republic of Hungary, Government Bond | | | 4.125 | % | | 2/19/18 | | Ba1 | | | 287,730 | | |
| | 90 | EUR | | Republic of Hungary, Government Bond, Reg S | | | 5.750 | % | | 6/11/18 | | Ba1 | | | 139,720 | | |
| | 360 | | | Republic of Hungary, Government Bond | | | 4.000 | % | | 3/25/19 | | Ba1 | | | 370,835 | | |
| | 422 | | | Republic of Hungary, Government Bond | | | 5.750 | % | | 11/22/23 | | Ba1 | | | 465,255 | | |
| | 432 | | | Republic of Hungary, Government Bond | | | 5.375 | % | | 3/25/24 | | Ba1 | | | 462,240 | | |
| | | Total Hungary | | | 2,304,839 | | |
| | | Iceland – 0.3% | |
| | 231 | | | Republic of Iceland, 144A | | | 5.875 | % | | 5/11/22 | | BBB | | | 254,911 | | |
| | 485 | | | Republic of Iceland, Reg S | | | 4.875 | % | | 6/16/16 | | BBB | | | 509,328 | | |
| | | Total Iceland | | | 764,239 | | |
| | | India – 0.1% | |
| | 285 | | | Reliance Holdings USA Inc., 144A | | | 5.400 | % | | 2/14/22 | | BBB+ | | | 307,731 | | |
| | | Indonesia – 2.2% | |
| | 760 | | | Majapahit Holdings BV, Reg S | | | 8.000 | % | | 8/07/19 | | Baa3 | | | 896,800 | | |
| | 200 | | | Perusahaan Listrik Negaraa PT, Reg S | | | 5.500 | % | | 11/22/21 | | Baa3 | | | 210,000 | | |
| | 540 | | | Republic of Indonesia, Reg S | | | 11.625 | % | | 3/04/19 | | Baa3 | | | 734,400 | | |
| | 235 | | | Republic of Indonesia, Reg S | | | 4.875 | % | | 5/05/21 | | Baa3 | | | 246,750 | | |
| | 975 | | | Republic of Indonesia, Reg S | | | 8.500 | % | | 10/12/35 | | Baa3 | | | 1,291,875 | | |
| | 1,610 | | | Republic of Indonesia, Reg S | | | 6.625 | % | | 2/17/37 | | Baa3 | | | 1,787,100 | | |
| | 595 | | | Republic of Indonesia, Reg S | | | 7.750 | % | | 1/17/38 | | Baa3 | | | 740,775 | | |
| | | Total Indonesia | | | 5,907,700 | | |
| | | Ireland – 0.2% | |
| | 400 | | | RZD Capital Limited, Russian Railways, Reg S | | | 5.700 | % | | 4/05/22 | | Baa1 | | | 416,138 | | |
| | | Kazakhstan – 1.3% | |
| | 200 | | | Kazakhstan Development Bank, Reg S | | | 5.500 | % | | 12/20/15 | | BBB+ | | | 208,000 | | |
| | 330 | | | Kazakhstan Development Bank, Reg S | | | 6.500 | % | | 6/03/20 | | BBB+ | | | 353,496 | | |
| | 225 | | | Kazatomprom, Reg S | | | 6.250 | % | | 5/20/15 | | Baa3 | | | 232,457 | | |
| | 220 | | | KazAgro National Management Holding JSC, 144A | | | 4.625 | % | | 5/24/23 | | BBB+ | | | 212,828 | | |
| | 435 | | | Kazmunaygas National, Reg S | | | 11.750 | % | | 1/23/15 | | BBB | | | 459,199 | | |
| | 1,035 | | | Kazmunaygas National, Reg S | | | 5.750 | % | | 4/30/43 | | BBB | | | 993,600 | | |
| | 430 | | | KazMuniaGaz Finance Subsidiary, 144A | | | 11.750 | % | | 1/23/15 | | BBB | | | 453,921 | | |
| | 225 | | | Kazakhstan Temir Zholy JSC, Reg S | | | 6.375 | % | | 10/06/20 | | BBB | | | 248,906 | | |
| | 375 | | | Kazakhstan Temir Zholy JSC, Reg S | | | 7.000 | % | | 5/13/16 | | BBB | | | 405,000 | | |
| | | Total Kazakhstan | | | 3,567,407 | | |
| | | Kenya – 0.1% | |
| | 265 | | | Republic of Kenya, 144A | | | 6.875 | % | | 6/24/24 | | B+ | | | 275,600 | | |
| | | Latvia – 1.1% | |
| | 520 | | | Latvia Republic, 144A | | | 5.250 | % | | 2/22/17 | | A– | | | 567,450 | | |
| | 715 | | | Latvia Republic, 144A | | | 3.625 | % | | 1/12/20 | | A– | | | 706,063 | | |
| | 315 | EUR | | Latvia Republic, 144A | | | 2.625 | % | | 1/21/21 | | A– | | | 450,092 | | |
| | 200 | | | Latvia Republic, Reg S | | | 5.250 | % | | 6/16/21 | | A– | | | 224,000 | | |
| | 295 | | | Latvia Republic, Reg S | | | 5.250 | % | | 2/22/17 | | A– | | | 321,919 | | |
| | 715 | | | Latvia Republic, 144A | | | 2.750 | % | | 1/12/20 | | A– | | | 706,063 | | |
| | Total Latvia | | | 2,975,587 | | |
| | | Lithuania – 1.4% | |
| | 175 | | | Republic of Lithuania, 144A | | | 7.375 | % | | 2/11/20 | | A– | | | 214,375 | | |
| | 145 | | | Republic of Lithuania, 144A | | | 6.125 | % | | 3/09/21 | | A– | | | 169,418 | | |
| | 670 | | | Republic of Lithuania, 144A | | | 6.625 | % | | 2/01/22 | | A– | | | 809,863 | | |
| | 120 | | | Republic of Lithuania, Reg S | | | 5.125 | % | | 9/14/17 | | A– | | | 132,076 | | |
| | 730 | | | Republic of Lithuania, Reg S | | | 7.375 | % | | 2/11/20 | | A– | | | 894,250 | | |
| | 1,345 | | | Republic of Lithuania, Reg S | | | 6.125 | % | | 3/09/21 | | A– | | | 1,571,498 | | |
| | | Total Lithuania | | | 3,791,480 | | |
Nuveen Investments
28
Principal
Amount (000) (10) | |
Description (1) | |
Coupon | |
Maturity | |
Ratings (6) | |
Value | |
| | | Luxembourg – 0.0% | |
| | 70 | | | Gaz Capital SA, Reg S | | | 8.625 | % | | 4/28/34 | | Baa1 | | $ | 86,450 | | |
| | | Malaysia – 0.5% | |
| | 765 | | | Penerbangan Malaysia Berhad, Reg S | | | 5.625 | % | | 3/15/16 | | A– | | | 822,175 | | |
| | 360 | | | Petronas Capital Limited, Reg S | | | 5.250 | % | | 8/12/19 | | A1 | | | 408,980 | | |
| | | Total Malaysia | | | 1,231,155 | | |
| | | Mexico – 2.0% | |
| | 200 | | | Alpek SA DE CV, Reg S | | | 4.500 | % | | 11/20/22 | | BBB– | | | 200,900 | | |
| | 1,472 | MXN | | Mexican Udibonds Bonds | | | 4.500 | % | | 12/04/25 | | A | | | 138,112 | | |
| | 962 | MXN | | Mexican Udibonds Bonds | | | 4.500 | % | | 11/22/35 | | A | | | 89,599 | | |
| | 9,111 | MXN | | Mexico Bonos de DeSarrollo | | | 10.000 | % | | 12/05/24 | | A | | | 937,685 | | |
| | 210 | | | Pemex Project Funding Master Trust | | | 6.625 | % | | 6/15/38 | | A3 | | | 245,700 | | |
| | 425 | | | Petroleos Mexicanos | | | 5.500 | % | | 1/21/21 | | A3 | | | 477,063 | | |
| | 210 | | | United Mexican States | | | 6.625 | % | | 3/03/15 | | A3 | | | 217,875 | | |
| | 96 | | | United Mexican States | | | 3.500 | % | | 1/21/21 | | A3 | | | 99,696 | | |
| | 156 | | | United Mexican States | | | 4.000 | % | | 10/02/23 | | A3 | | | 163,956 | | |
| | 61 | | | United Mexican States | | | 6.750 | % | | 9/27/34 | | A3 | | | 78,995 | | |
| | 1,076 | | | United Mexican States | | | 6.050 | % | | 1/11/40 | | A3 | | | 1,304,112 | | |
| | 557 | | | United Mexican States | | | 5.550 | % | | 1/21/45 | | A3 | | | 633,588 | | |
| | 916 | | | United Mexican States | | | 5.750 | % | | 10/12/00 | | A3 | | | 971,876 | | |
| | | Total Mexico | | | 5,559,157 | | |
| | | Morocco – 0.3% | |
| | 215 | | | Kingdom of Morocco, 144A | | | 4.250 | % | | 12/11/22 | | BBB– | | | 215,269 | | |
| | 235 | | | Kingdom of Morocco, 144A | | | 5.500 | % | | 12/11/42 | | BBB– | | | 230,977 | | |
| | 235 | | | Kingdom of Morocco, Reg S | | | 4.500 | % | | 10/05/20 | | BBB– | | | 348,751 | | |
| | | Total Morocco | | | 794,997 | | |
| | | Nigeria – 0.1% | |
| | 240 | | | Nigerian Government International Bond, 144A | | | 5.125 | % | | 7/12/18 | | BB– | | | 248,760 | | |
| | | Pakistan – 0.2% | |
| | 275 | | | Islamic Republic of Pakistan, 144A | | | 7.250 | % | | 4/15/19 | | B– | | | 281,188 | | |
| | 250 | | | Islamic Republic of Pakistan, 144A | | | 8.250 | % | | 4/15/24 | | B– | | | 257,813 | | |
| | | Total Pakistan | | | 539,001 | | |
| | | Panama – 0.4% | |
| | 180 | | | AES Panama, Reg S | | | 6.350 | % | | 12/21/16 | | BB+ | | | 186,300 | | |
| | 5 | | | Republic of Panama | | | 7.250 | % | | 3/15/15 | | BBB | | | 5,225 | | |
| | 645 | | | Republic of Panama | | | 9.375 | % | | 4/01/29 | | BBB | | | 959,760 | | |
| | | Total Panama | | | 1,151,285 | | |
| | | Peru – 0.9% | |
| | 215 | | | BBVA Banco Continental SA, 144A | | | 3.250 | % | | 4/08/18 | | A– | | | 219,569 | | |
| | 165 | | | El Fondo Mivivienda SA, 144A | | | 3.500 | % | | 1/31/23 | | BBB+ | | | 157,163 | | |
| | 249 | PEN | | Republic of Peru Treasury Bond | | | 7.840 | % | | 8/12/20 | | A– | | | 102,190 | | |
| | 745 | | | Republic of Peru | | | 8.375 | % | | 5/03/16 | | A3 | | | 840,360 | | |
| | 1,025 | PEN | | Republic of Peru | | | 6.950 | % | | 8/12/31 | | A3 | | | 393,749 | | |
| | 335 | | | Republic of Peru | | | 6.550 | % | | 3/14/37 | | A3 | | | 420,928 | | |
| | 550 | | | Republic of Peru | | | 5.625 | % | | 11/18/50 | | A3 | | | 615,725 | | |
| | | Total Peru | | | 2,749,684 | | |
Nuveen Investments
29
JDD Nuveen Diversified Dividend and Income Fund
Portfolio of Investments (continued) June 30, 2014 (Unaudited)
Principal
Amount (000) (10) | |
Description (1) | |
Coupon | |
Maturity | |
Ratings (6) | |
Value | |
| | | Philippines – 1.5% | |
| | 185 | | | National Power Corporation | | | 9.625 | % | | 5/15/28 | | BBB | | $ | 275,419 | | |
| | 230 | | | Republic of the Philippines | | | 9.875 | % | | 1/15/19 | | BBB | | | 304,463 | | |
| | 685 | | | Republic of the Philippines | | | 8.375 | % | | 6/17/19 | | BBB | | | 872,519 | | |
| | 805 | | | Republic of the Philippines | | | 4.200 | % | | 1/21/24 | | BBB | | | 850,281 | | |
| | 420 | | | Republic of the Philippines | | | 10.625 | % | | 3/16/25 | | BBB | | | 658,875 | | |
| | 200 | | | Republic of the Philippines | | | 5.500 | % | | 3/30/26 | | BBB | | | 230,500 | | |
| | 575 | | | Republic of the Philippines | | | 7.750 | % | | 1/14/31 | | BBB | | | 794,219 | | |
| | | Total Philippines | | | 3,986,276 | | |
| | | Poland – 0.7% | |
| | 95 | | | Republic of Poland | | | 3.875 | % | | 7/16/15 | | A2 | | | 98,230 | | |
| | 91 | | | Republic of Poland | | | 6.375 | % | | 7/15/19 | | A2 | | | 107,835 | | |
| | 1,400 | | | Republic of Poland | | | 5.000 | % | | 3/23/22 | | A2 | | | 1,556,100 | | |
| | | Total Poland | | | 1,762,165 | | |
| | | Romania – 1.4% | |
| | 390 | | | Republic of Romania, 144A | | | 6.750 | % | | 2/07/22 | | BBB– | | | 465,563 | | |
| | 150 | EUR | | Republic of Romania, 144A | | | 4.875 | % | | 1/22/24 | | BBB– | | | 159,563 | | |
| | 736 | | | Republic of Romania, 144A | | | 6.125 | % | | 1/22/44 | | BBB– | | | 836,354 | | |
| | 536 | | | Republic of Romania, Reg S | | | 6.750 | % | | 2/07/22 | | BBB– | | | 639,850 | | |
| | 266 | | | Republic of Romania, Reg S | | | 4.375 | % | | 8/22/23 | | BBB– | | | 272,597 | | |
| | 296 | | | Republic of Romania, Reg S | | | 6.125 | % | | 1/22/44 | | BBB– | | | 336,360 | | |
| | 315 | | | Republic of Romania | | | 4.875 | % | | 11/07/19 | | BBB– | | | 488,891 | | |
| | 405 | EUR | | Republic of Romania | | | 4.625 | % | | 9/18/20 | | BBB– | | | 623,056 | | |
| | | Total Romania | | | 3,822,234 | | |
| | | Russia – 1.7% | |
| | 230 | | | Gazprom OAO Via Gaz Capital SA, Reg S | | | 5.999 | % | | 1/23/21 | | Baa1 | | | 245,238 | | |
| | 8,755 | RUB | | Russian Federal Bond – OFZ | | | 7.600 | % | | 4/14/21 | | Baa1 | | | 250,990 | | |
| | 13,060 | RUB | | Russian Federal Bond – OFZ | | | 7.000 | % | | 8/16/23 | | Baa1 | | | 354,878 | | |
| | 200 | | | Russian Federation, 144A | | | 4.875 | % | | 9/16/23 | | Baa1 | | | 206,500 | | |
| | 700 | | | Russian Federation, Reg S | | | 3.625 | % | | 4/29/15 | | Baa1 | | | 712,250 | | |
| | 200 | | | Russian Federation, Reg S | | | 4.875 | % | | 9/16/23 | | Baa1 | | | 206,500 | | |
| | 2,000 | | | Russian Federation, Reg S | | | 7.500 | % | | 3/31/30 | | Baa1 | | | 2,316,754 | | |
| | 205 | | | Russian Ministry of Finance, Reg S | | | 12.750 | % | | 6/24/28 | | Baa1 | | | 354,958 | | |
| | | Total Russia | | | 4,648,068 | | |
| | | Senegal – 0.2% | |
| | 400 | | | Republic of Senegal, Reg S | | | 8.750 | % | | 5/13/21 | | B+ | | | 462,032 | | |
| | | Serbia – 0.6% | |
| | 1,200 | | | Republic of Serbia, Reg S | | | | | | | | | | | | | | | 1,251,000 | | |
| | 480 | | | Republic of Serbia, 144A | | | 5.875 | % | | 12/03/18 | | BB– | | | 510,600 | | |
| | | Total Serbia | | | 1,761,600 | | |
| | | Slovakia – 0.1% | |
| | 210 | | | Slovakia Government, Reg S | | | 4.675 | % | | 5/21/22 | | A+ | | | 224,070 | | |
| | | Slovenia – 0.5% | |
| | 475 | | | Republic of Slovenia, 144A | | | 5.850 | % | | 5/10/23 | | A– | | | 533,188 | | |
| | 385 | | | Republic of Slovenia, 144A | | | 5.250 | % | | 2/18/24 | | A– | | | 413,875 | | |
| | 220 | | | Republic of Slovenia, Reg S | | | 4.750 | % | | 5/10/18 | | A– | | | 237,050 | | |
| | 200 | | | Republic of Slovenia, Reg S | | | 5.500 | % | | 10/26/22 | | A– | | | 219,000 | | |
| | | Total Slovenia | | | 1,403,113 | | |
| | | South Africa – 0.6% | |
| | 200 | | | Eskom Holdings Limited, 144A | | | 6.750 | % | | 8/06/23 | | BBB– | | | 212,000 | | |
| | 705 | | | Republic of South Africa | | | 4.665 | % | | 1/17/24 | | Baa1 | | | 718,219 | | |
| | 3,855 | ZAR | | Republic of South Africa | | | 7.000 | % | | 2/28/31 | | Baa1 | | | 305,312 | | |
| | 4,165 | ZAR | | Republic of South Africa | | | 8.750 | % | | 2/28/48 | | BBB+ | | | 377,642 | | |
| | | Total South Africa | | | 1,613,173 | | |
Nuveen Investments
30
Principal
Amount (000) (10) | |
Description (1) | |
Coupon | |
Maturity | |
Ratings (6) | |
Value | |
| | | Sri Lanka – 0.8% | |
| | 720 | | | Republic of Sri Lanka, 144A | | | 6.000 | % | | 1/14/19 | | BB– | | $ | 757,800 | | |
| | 170 | | | Republic of Sri Lanka, 144A | | | 6.250 | % | | 10/04/20 | | BB– | | | 179,775 | | |
| | 200 | | | Republic of Sri Lanka, 144A | | | 6.250 | % | | 7/27/21 | | BB– | | | 211,000 | | |
| | 290 | | | Republic of Sri Lanka, 144A | | | 5.875 | % | | 7/25/22 | | BB– | | | 298,338 | | |
| | 175 | | | Republic of Sri Lanka, Reg S | | | 6.250 | % | | 10/04/20 | | BB– | | | 185,063 | | |
| | 510 | | | Republic of Sri Lanka, Reg S | | | 6.250 | % | | 7/27/21 | | BB– | | | 538,050 | | |
| | | Total Sri Lanka | | | 2,170,026 | | |
| | | Turkey – 1.1% | |
| | 775 | | | Republic of Turkey, Government Bond | | | 7.000 | % | | 9/26/16 | | Baa3 | | | 855,368 | | |
| | 321 | | | Republic of Turkey, Government Bond | | | 7.500 | % | | 7/14/17 | | Baa3 | | | 365,242 | | |
| | 185 | | | Republic of Turkey, Government Bond | | | 6.750 | % | | 4/03/18 | | BBB– | | | 208,865 | | |
| | 370 | | | Republic of Turkey, Government Bond | | | 5.625 | % | | 3/30/21 | | Baa3 | | | 403,300 | | |
| | 310 | | | Republic of Turkey, Government Bond | | | 5.750 | % | | 3/22/24 | | Baa3 | | | 338,675 | | |
| | 755 | | | Republic of Turkey, Government Bond | | | 7.375 | % | | 2/05/25 | | Baa3 | | | 917,325 | | |
| | | Total Turkey | | | 3,088,775 | | |
| | | Ukraine – 0.8% | |
| | 355 | | | Republic of Ukraine, 144A | | | 6.250 | % | | 6/17/16 | | CCC | | | 342,646 | | |
| | 445 | | | Republic of Ukraine, 144A | | | 9.250 | % | | 7/24/17 | | CCC | | | 450,563 | | |
| | 175 | | | Republic of Ukraine, Reg S | | | 6.875 | % | | 9/23/15 | | CCC | | | 170,660 | | |
| | 785 | | | Republic of Ukraine, Reg S | | | 6.580 | % | | 11/21/16 | | CCC | | | 757,525 | | |
| | 515 | | | Republic of Ukraine, Reg S | | | 9.250 | % | | 7/24/17 | | CCC | | | 521,438 | | |
| | | Total Ukraine | | | 2,242,832 | | |
| | | United Arab Emirates – 0.2% | |
| | 242 | | | Dubai Electricity and Water Authority, 144A | | | 7.375 | % | | 10/21/20 | | Baa2 | | | 294,320 | | |
| | 202 | | | Waha Aerospace BV, 144A | | | 3.925 | % | | 7/28/20 | | AA | | | 214,062 | | |
| | Total United Arab Emirates | | | 508,382 | | |
| | | Uruguay – 0.9% | |
| | 1,039 | | | Republic of Uruguay | | | 4.500 | % | | 8/14/24 | | Baa2 | | | 1,102,379 | | |
| | 12 | | | Republic of Uruguay | | | 4.125 | % | | 11/20/45 | | Baa2 | | | 10,241 | | |
| | 1,256 | | | Republic of Uruguay | | | 5.100 | % | | 6/18/50 | | Baa2 | | | 1,240,300 | | |
| | | Total Uruguay | | | 2,352,920 | | |
| | | Venezuela – 1.1% | |
| | 1,765 | | | Petroleos de Venezuela S.A., Reg S | | | 6.000 | % | | 11/15/26 | | B | | | 1,138,420 | | |
| | 390 | | | Petroleos de Venezuela S.A., Reg S | | | 5.250 | % | | 4/12/17 | | B | | | 329,350 | | |
| | 175 | | | Republic of Venezuela, Reg S | | | 7.750 | % | | 10/13/19 | | B | | | 151,370 | | |
| | 610 | | | Republic of Venezuela, Reg S | | | 9.000 | % | | 5/07/23 | | B | | | 521,550 | | |
| | 270 | | | Republic of Venezuela, Reg S | | | 9.250 | % | | 5/07/28 | | B | | | 226,800 | | |
| | 505 | | | Republic of Venezuela, Reg S | | | 11.950 | % | | 8/05/31 | | B | | | 494,900 | | |
| | 150 | | | Republic of Venezuela | | | 9.375 | % | | 1/13/34 | | B | | | 126,371 | | |
| | | Total Venezuela | | | 2,988,761 | | |
| | | Total Emerging Markets Debt and Foreign Corporate Bonds (cost $86,314,120) | | | | | | | | | | | | | | | 91,388,259 | | |
| | | Total Long-Term Investments (cost $317,499,130) | | | | | | | | | | | | | | | 377,663,920 | | |
Nuveen Investments
31
JDD Nuveen Diversified Dividend and Income Fund
Portfolio of Investments (continued) June 30, 2014 (Unaudited)
Principal
Amount (000) | | Description (1) | | Coupon | | Maturity | | | | Value | |
| | | SHORT-TERM INVESTMENTS – 6.7% (4.7% of Total Investments) | |
$ | 8,805 | | | Repurchase Agreement with Fixed Income Clearing Corporation, dated 6/30/14,
repurchase price $8,804,511, collateralized by $8,555,000 U.S. Treasury Notes, 2.625%,
due 5/15/20, value $8,982,750 | | | 0.000
| % | | 7/01/14
| | |
| | | $ | 8,804,511
| | |
| | 9,619 | | | Repurchase Agreement with Fixed Income Clearing Corporation, dated 6/30/14,
repurchase price $9,619,413, collateralized by $9,215,000 U.S. Treasury Notes, 2.750%,
due 2/15/19, value $9,813,975 | | | 0.000
| % | | 7/01/14
| | |
| | | | 9,619,413
| | |
$ | 18,424 | | | Total Short-Term Investments (cost $18,423,924) | | | 18,423,924 | | |
| | | Total Investments (cost $335,923,054) – 145.0% | | | 396,087,844 | | |
| | | Borrowings – (42.5)% (11), (12) | | | (116,000,000 | ) | |
| | | Other Assets Less Liabilities – (2.5)% (13) | | | (7,011,413 | ) | |
| | | Net Assets Applicable to Common Shares – 100% | | $ | 273,076,431 | | |
Investments in Derivatives as of June 30, 2014
Options Written outstanding:
Number of
Contracts | | Description | | Notional
Amount (14) | | Expiration
Date | | Strike
Price | | Value (13) | |
| | (220 | ) | | Interpublic Group of Companies Inc. | | $ | (440,000 | ) | | 7/19/14 | | $ | 20 | | | $ | (11,550 | ) | |
| | (312 | ) | | Norwegian Cruise Line Holdings Limited | | | (1,092,000 | ) | | 9/20/14 | | | 35 | | | | (12,480 | ) | |
| | (163 | ) | | Vodafone Group PLC | | | (619,400 | ) | | 7/19/14 | | | 38 | | | | (571 | ) | |
| | (695 | ) | | Total Options Written (premiums received $62,762) | | $ | (2,151,400 | ) | | | | | | | | | | $ | (24,601 | ) | |
Forward Foreign Currency Exchange Contracts outstanding:
Counterparty | | Currency Contracts to Deliver | | Notional Amount
(Local Currency) | | In Exchange For Currency | | Notional Amount
(Local Currency) | | Settlement
Date | | Unrealized
Appreciation
(Depreciation)
(U.S. Dollars) (13) | |
Bank of America | | U.S. Dollar | | | 441,783 | | | Polish Zloty | | | 1,350,000 | | | 9/17/14 | | $ | 633 | | |
BNP Paribas | | Peruvian Nouveau Sol | | | 32,000 | | | U.S. Dollar | | | 11,360 | | | 9/17/14 | | | 18 | | |
BNP Paribas | | U.S. Dollar | | | 60,088 | | | Peruvian Nouveau Sol | | | 170,000 | | | 9/17/14 | | | 166 | | |
Citibank | | Euro | | | 2,063,000 | | | U.S. Dollar | | | 2,792,704 | | | 9/17/14 | | | (32,978 | ) | |
Citibank | | Peruvian Nouveau Sol | | | 138,000 | | | U.S. Dollar | | | 48,876 | | | 9/17/14 | | | (36 | ) | |
Citibank | | Russian Ruble | | | 1,236,000 | | | U.S. Dollar | | | 35,661 | | | 9/17/14 | | | (117 | ) | |
Citibank | | U.S. Dollar | | | 469,507 | | | Mexican Peso | | | 6,140,000 | | | 9/17/14 | | | 1,300 | | |
Credit Suisse | | Russian Ruble | | | 4,122,000 | | | U.S. Dollar | | | 119,913 | | | 9/17/14 | | | 594 | | |
Credit Suisse | | U.S. Dollar | | | 458,673 | | | Russian Ruble | | | 15,760,000 | | | 9/17/14 | | | (2,472 | ) | |
Deutsche Bank AG | | U.S. Dollar | | | 921,517 | | | Indian Rupee | | | 56,160,000 | | | 9/17/14 | | | 1,981 | | |
Deutsche Bank AG | | U.S. Dollar | | | 470,793 | | | South African Rand | | | 5,080,000 | | | 9/17/14 | | | 830 | | |
Goldman Sachs | | U.S. Dollar | | | 455,673 | | | Malaysian Ringgit | | | 1,470,000 | | | 9/17/14 | | | 764 | | |
Goldman Sachs | | U.S. Dollar | | | 484,985 | | | Polish Zloty | | | 1,485,000 | | | 9/17/14 | | | 1,673 | | |
JPMorgan | | Euro | | | 70,000 | | | U.S. Dollar | | | 95,239 | | | 9/17/14 | | | (640 | ) | |
JPMorgan | | Russian Ruble | | | 9,097,000 | | | U.S. Dollar | | | 264,505 | | | 9/17/14 | | | 1,177 | | |
JPMorgan | | Russian Ruble | | | 4,044,000 | | | U.S. Dollar | | | 117,695 | | | 9/17/14 | | | 635 | | |
JPMorgan | | South African Rand | | | 2,972,000 | | | U.S. Dollar | | | 277,368 | | | 9/17/14 | | | 1,450 | | |
JPMorgan | | South African Rand | | | 1,776,000 | | | U.S. Dollar | | | 164,670 | | | 9/17/14 | | | (213 | ) | |
JPMorgan | | South African Rand | | | 148,000 | | | U.S. Dollar | | | 13,760 | | | 9/17/14 | | | 20 | | |
JPMorgan | | U.S. Dollar | | | 206,264 | | | South African Rand | | | 2,255,000 | | | 9/17/14 | | | 3,089 | | |
Morgan Stanley | | Brazilian Real | | | 3,594,000 | | | U.S. Dollar | | | 1,562,779 | | | 9/03/14 | | | (35,130 | ) | |
Morgan Stanley | | Mexican Peso | | | 2,967,000 | | | U.S. Dollar | | | 226,798 | | | 9/17/14 | | | (707 | ) | |
Morgan Stanley | | Russian Ruble | | | 2,552,000 | | | U.S. Dollar | | | 74,294 | | | 9/17/14 | | | 422 | | |
Morgan Stanley | | U.S. Dollar | | | 202,182 | | | Brazilian Real | | | 455,000 | | | 9/03/14 | | | 113 | | |
Morgan Stanley | | U.S. Dollar | | | 416,848 | | | Mexican Peso | | | 5,470,000 | | | 9/17/14 | | | 2,584 | | |
Nuveen Investments
32
Forward Foreign Currency Exchange Contracts outstanding (continued):
Counterparty | | Currency Contracts to Deliver | | Notional Amount
(Local Currency) | | In Exchange For Currency | | Notional Amount
(Local Currency) | | Settlement
Date | | Unrealized
Appreciation
(Depreciation)
(U.S. Dollars) (13) | |
Royal Bank of Canada | | U.S. Dollar | | | 3,356 | | | Mexican Peso | | | 44,000 | | | 9/17/14 | | $ | 18 | | |
Standard Chartered Bank | | U.S. Dollar | | | 199,632 | | | Colombian Peso | | | 380,000,000 | | | 9/17/14 | | | 1,706 | | |
UBS AG | | Colombian Peso | | | 626,417,000 | | | U.S. Dollar | | | 329,087 | | | 9/17/14 | | | (2,812 | ) | |
| | | | | | | | | | | | | $ | (55,932 | ) | |
Interest Rate Swaps outstanding:
Counterparty | | Notional
Amount | | Fund
Pay/Receive
Floating Rate | | Floating Rate Index | | Fixed Rate
(Annualized) | | Fixed Rate
Payment
Frequency | | Effective
Date (15) | | Termination
Date | | Unrealized
Appreciation
(Depreciation) (13) | |
JPMorgan | | $ | 30,450,000 | | | Receive | | 1-Month USD-LIBOR | | | 1.255 | % | | Monthly | | 12/01/14 | | 12/01/18 | | $ | 362,793 | | |
JPMorgan | | | 30,450,000 | | | Receive | | 1-Month USD-LIBOR | | | 1.673 | | | Monthly | | 12/01/14 | | 12/01/20 | | | 712,740 | | |
Morgan Stanley | | | 19,950,000 | | | Receive | | 1-Month USD-LIBOR | | | 2.064 | | | Monthly | | 3/21/11 | | 3/21/16 | | | (583,687 | ) | |
| | | $ | 80,850,000 | | | | | | | | | | | | | | | $ | 491,846 | | |
Nuveen Investments
33
JDD Nuveen Diversified Dividend and Income Fund
Portfolio of Investments (continued) June 30, 2014 (Unaudited)
For Fund portfolio compliance purposes, the Fund's industry classifications refer to any one or more of the industry sub-classifications used by one or more widely recognized market indexes or ratings group indexes, and/or as defined by Fund management. This definition may not apply for purposes of this report, which may combine industry sub-classifications into sectors for reporting ease.
(1) All percentages shown in the Portfolio of Investments are based on net assets applicable to common shares unless otherwise noted.
(2) Non-income producing; issuer has not declared a dividend within the past twelve months.
(3) For fair value measurement disclosure purposes, Common Stock classified as Level 2. See Notes to Financial Statements, Note 2 – Investment Valuation and Fair Value Measurements for more information.
(4) Investment valued at fair value using methods determined in good faith by, or at the discretion of, Nuveen funds' Board of Directors/Trustees. For fair value disclosure purposes, investment classified as Level 3. See Notes to Financial Statements, Note 2 – Investment Valuation and Fair Value Measurements for more information.
(5) Investment, or portion of investment, has been pledged to collateralize the net payment obligations for investment in derivatives.
(6) Ratings: Using the highest of Standard & Poor's Group ("Standard & Poor's"), Moody's Investors Service, Inc. ("Moody's") or Fitch, Inc. ("Fitch") rating. Ratings below BBB by Standard & Poor's, Baa by Moody's or BBB by Fitch are considered to be below investment grade. Holdings designated N/R are not rated by any of these national rating agencies.
(7) Perpetual security. Maturity date is not applicable
(8) Senior loans generally are subject to mandatory and/or optional prepayment. Because of these mandatory prepayment conditions and because there may be significant economic incentives for a borrower to prepay, prepayments of senior loans may occur. As a result, the actual remaining maturity of senior loans held may be substantially less than the stated maturities shown
(9) Senior loans generally pay interest at rates which are periodically adjusted by reference to a base short-term, floating lending rate plus an assigned fixed rate. These floating lending rates are generally (i) the lending rate referenced by the London Inter-Bank Offered Rate ("LIBOR"), or (ii) the prime rate offered by one or more major United States banks
(10) Principal Amount (000) denominated in U.S. Dollars, unless otherwise noted.
(11) Borrowings as a percentage of Total Investments is 29.3%.
(12) The Fund segregates 100% of its eligible investments (excluding any investments separately pledged as collateral for specific investments in derivatives) in the Portfolio of Investments as collateral for Borrowings.
(13) Other Assets Less Liabilities includes the Value and the Unrealized Appreciation (Depreciation) of derivative instruments as noted within Investments in Derivatives as of the end of the reporting period.
(14) For disclosure purposes, Notional Amount is calculated by multiplying the Number of Contracts by the Strike Price by 100.
(15) Effective date represents the date on which both the Fund and Counterparty commence interest payment accruals on each contract.
DD1 Portion of investment purchased on a delayed delivery basis.
WI/DD Purchased on a when-issued or delayed delivery basis.
N/A Not applicable.
144A Investment is exempt from registration under Rule 144A of the Securities Act of 1933, as amended. These investments may only be resold in transactions exempt from registration, which are normally those transactions with qualified institutional buyers
ADR American Depositary Receipt.
TBD Senior loan purchased on a when-issued or delayed-delivery basis. Certain details associated with this purchase are not known prior to the settlement date of the transaction. In addition, senior loans typically trade without accrued interest and therefore a coupon rate is not available prior to settlement. At settlement, if still unknown, the borrower or counterparty will provide the Fund with the final coupon rate and maturity date.
Reg S Regulation S allows U.S. companies to sell securities to persons or entities located outside of the United States without registering those securities with the Securities and Exchange Commission. Specifically, Regulation S provides a safe harbor from the registration requirements of the Securities Act for the offers and sales of securities by both foreign and domestic issuers that are made outside the United States.
BRL Brazilian Real
COP Colombian Peso
EUR Euro
MXN Mexican Peso
PEN Peruvian Nuevo Sol
RUB Russian Ruble
ZAR South African Rand
USD-LIBOR United States Dollar - London Inter-Bank Offered Rate.
See accompanying notes to financial statements.
Nuveen Investments
34
Statement of
Assets and Liabilities June 30, 2014 (Unaudited)
Assets | |
Long-term investments, at value (cost $317,499,130) | | $ | 377,663,920 | | |
Short-term investments, at value (cost approximates value) | | | 18,423,924 | | |
Cash | | | 22,802 | | |
Cash denominated in foreign currencies (cost $228,017) | | | 228,724 | | |
Unrealized appreciation on: | |
Forward foreign currency exchange contracts, net | | | 13,307 | | |
Interest rate swaps | | | 1,075,533 | | |
Receivable for: | |
Dividends | | | 462,335 | | |
Interest | | | 2,038,915 | | |
Investments sold | | | 4,382,659 | | |
Reclaims | | | 35,069 | | |
Other assets | | | 107,651 | | |
Total assets | | | 404,454,839 | | |
Liabilities | |
Borrowings | | | 116,000,000 | | |
Options written, at value (premiums received $62,762) | | | 24,601 | | |
Unrealized depreciation on: | |
Forward foreign currency exchange contracts, net | | | 69,239 | | |
Interest rate swaps | | | 583,687 | | |
Payable for: | |
Dividends | | | 5,119,014 | | |
Investments purchased | | | 9,041,037 | | |
Accrued expenses: | |
Management fees | | | 277,044 | | |
Interest on borrowings | | | 81,783 | | |
Trustees fees | | | 47,704 | | |
Other | | | 134,299 | | |
Total liabilities | | | 131,378,408 | | |
Net assets applicable to common shares | | $ | 273,076,431 | | |
Common shares outstanding | | | 19,938,925 | | |
Net asset value ("NAV") per common share outstanding | | $ | 13.70 | | |
Net assets applicable to common shares consist of: | |
Common shares, $.01 par value per share | | $ | 199,389 | | |
Paid-in surplus | | | 239,651,124 | | |
Undistributed (Over-distribution of) net investment income | | | (5,979,656 | ) | |
Accumulated net realized gain (loss) | | | (21,435,477 | ) | |
Net unrealized appreciation (depreciation) | | | 60,641,051 | | |
Net assets applicable to common shares | | $ | 273,076,431 | | |
Authorized shares: | |
Common | | | Unlimited | | |
Preferred | | | Unlimited | | |
See accompanying notes to financial statements.
Nuveen Investments
35
Statement of
Operations Six Months Ended June 30, 2014 (Unaudited)
Investment Income | |
Dividends (net of foreign tax withheld of $70,949) | | $ | 3,309,192 | | |
Interest | | | 4,276,519 | | |
Total investment income | | | 7,585,711 | | |
Expenses | |
Management fees | | | 1,636,291 | | |
Interest expense on borrowings | | | 543,458 | | |
Shareholder servicing agent fees and expenses | | | 570 | | |
Custodian fees and expenses | | | 117,584 | | |
Trustees fees and expenses | | | 5,418 | | |
Professional fees | | | 38,399 | | |
Shareholder reporting expenses | | | 43,305 | | |
Stock exchange listing fees | | | 4,377 | | |
Investor relations expense | | | 35,074 | | |
Other expenses | | | 11,877 | | |
Total expenses | | | 2,436,353 | | |
Net investment income (loss) | | | 5,149,358 | | |
Realized and Unrealized Gain (Loss) | |
Net realized gain (loss) from: | |
Investments and foreign currency | | | 8,409,246 | | |
Forward foreign currency exchange contracts | | | (47,416 | ) | |
Options written | | | 201,191 | | |
Swaps | | | (240,610 | ) | |
Change in net unrealized appreciation (depreciation) of: | |
Investments and foreign currency | | | 15,419,795 | | |
Forward foreign currency exchange contracts | | | (68,389 | ) | |
Options written | | | (9,047 | ) | |
Swaps | | | (1,485,306 | ) | |
Net realized and unrealized gain (loss) | | | 22,179,464 | | |
Net increase (decrease) in net assets applicable to common shares from operations | | $ | 27,328,822 | | |
See accompanying notes to financial statements.
Nuveen Investments
36
Statement of
Changes in Net Assets (Unaudited)
| | | Six Months
Ended
6/30/14 | | Year
Ended
12/31/13 | |
Operations | |
Net investment income (loss) | | $ | 5,149,358 | | | $ | 8,639,185 | | |
Net realized gain (loss) from: | |
Investments and foreign currency | | | 8,409,246 | | | | 8,789,273 | | |
Forward foreign currency exchange contracts | | | (47,416 | ) | | | 42,177 | | |
Options written | | | 201,191 | | | | 647,990 | | |
Swaps | | | (240,610 | ) | | | (575,277 | ) | |
Change in net unrealized appreciation (depreciation) of: | |
Investments and foreign currency | | | 15,419,795 | | | | 7,400,101 | | |
Forward foreign currency exchange contracts | | | (68,389 | ) | | | 1,236 | | |
Options written | | | (9,047 | ) | | | 38,029 | | |
Swaps | | | (1,485,306 | ) | | | 3,027,397 | | |
Net increase (decrease) in net assets applicable to common shares from operations | | | 27,328,822 | | | | 28,010,111 | | |
Distributions to Common Shareholders | |
From and in excess of net investment income | | | (10,168,852 | ) | | | — | | |
From net investment income | | | — | | | | (16,909,056 | ) | |
Return of capital | | | — | | | | (3,031,726 | ) | |
Decrease in net assets applicable to common shares from distributions to common shareholders | | | (10,168,852 | ) | | | (19,940,782 | ) | |
Capital Share Transactions | |
Common shares: | |
Repurchased and retired | | | — | | | | (31,515 | ) | |
Net proceeds from shares issued to shareholders due to reinvestment of distributions | | | — | | | | 53,078 | | |
Net increase (decrease) in net assets applicable to common shares from capital share transactions | | | — | | | | 21,563 | | |
Net increase (decrease) in net assets applicable to common shares | | | 17,159,970 | | | | 8,090,892 | | |
Net assets applicable to common shares at the beginning of period | | | 255,916,461 | | | | 247,825,569 | | |
Net assets applicable to common shares at the end of period | | $ | 273,076,431 | | | $ | 255,916,461 | | |
Undistributed (Over-distribution of) net investment income at the end of period | | $ | (5,979,656 | ) | | $ | (960,162 | ) | |
See accompanying notes to financial statements.
Nuveen Investments
37
Statement of
Cash Flows Six Months Ended June 30, 2014 (Unaudited)
Cash Flows from Operating Activities: | |
Net Increase (Decrease) in Net Assets Applicable to Common Shares from Operations | | $ | 27,328,822 | | |
Adjustments to reconcile the net increase (decrease) in net assets applicable to common shares from
operations to net cash provided by (used in) operating activities: | |
Purchases of investments | | | (98,804,588 | ) | |
Proceeds from sales and maturities of investments | | | 104,181,260 | | |
Proceeds from (Purchases of) short-term investments, net | | | (7,861,811 | ) | |
Proceeds from (Payments for) closed foreign currency spot contracts | | | 21,576 | | |
Proceeds from (Payments for) cash denominated in foreign currencies, net | | | (220,057 | ) | |
Premiums received for options written | | | 260,147 | | |
Cash paid for terminated options written | | | (44,402 | ) | |
Proceeds from (Payments for) swap contracts, net | | | (240,610 | ) | |
Amortization (Accretion) of premiums and discounts, net | | | (205,040 | ) | |
(Increase) Decrease in: | |
Receivable for dividends | | | 106,312 | | |
Receivable for interest | | | (155,094 | ) | |
Receivable for investments sold | | | (3,034,917 | ) | |
Receivable for reclaims | | | (6,211 | ) | |
Other assets | | | (30,952 | ) | |
Increase (Decrease) in: | |
Payable for investment purchased | | | 6,269,045 | | |
Accrued management fees | | | 4,491 | | |
Accrued interest on borrowings | | | (8,203 | ) | |
Accrued Trustees fees | | | (4,668 | ) | |
Accrued other expenses | | | 7,179 | | |
Net realized (gain) loss from: | |
Investments and foreign currency | | | (8,409,246 | ) | |
Options written | | | (201,191 | ) | |
Swaps | | | 240,610 | | |
Change in net unrealized (appreciation) depreciation of: | |
Investments and foreign currency | | | (15,419,795 | ) | |
Forward foreign currency exchange contracts | | | 68,389 | | |
Options written | | | 9,047 | | |
Swaps | | | 1,485,306 | | |
Capital gain and return of capital distributions from investments | | | 560,949 | | |
Net cash provided by (used in) operating activities | | | 5,896,348 | | |
Cash Flows from Financing Activities: | |
Increase (Decrease) in cash overdraft | | | (823,708 | ) | |
Cash distributions paid to common shareholders | | | (5,049,838 | ) | |
Net cash provided by (used in) financing activities | | | (5,873,546 | ) | |
Net Increase (Decrease) in Cash | | | 22,802 | | |
Cash at the beginning of period | | | — | | |
Cash at the end of period | | $ | 22,802 | | |
Supplemental Disclosure of Cash Flow Information | |
Cash paid for interest on borrowings (excluding borrowing costs) | | $ | 521,926 | | |
See accompanying notes to financial statements.
Nuveen Investments
38
THIS PAGE INTENTIONALLY LEFT BLANK
Nuveen Investments
39
Financial
Highlights (Unaudited)
Selected data for a common share outstanding throughout each period:
| | | | |
| | | | | Investment Operations | | Less Distributions | | | | | | | |
| | Beginning
Common
Share
NAV | | Net
Investment
Income
(Loss)(a) | | Net
Realized/
Unrealized
Gain (Loss) | | Distributions
from Net
Investment
Income to
FundPreferred
Shareholders(b) | | Distributions
from
Accumulated
Net Realized
Gains to
FundPreferred
Shareholders(b) | | Total | | From Net
Investment
Income to
Common
Share-
holders | | From
Accum-
ulated
Net
Realized
Gains to
Common
Share-
holders | | Return of
Capital to
Common
Share-
holders | | Total | | Discount
from
Common
Shares
Repur-
chased
and
Retired | | Ending
Common
Share
NAV | | Ending
Market
Value | |
Year Ended 12/31: | |
| 2014(g) | | $ | 12.84 | | | $ | .26 | | | $ | 1.11 | | | $ | — | | | $ | — | | | $ | 1.37 | | | $ | (.51 | )*** | | $ | — | | | $ | — | | | $ | (.51 | ) | | $ | — | | | $ | 13.70 | | | $ | 12.26 | | |
2013 | | | 12.43 | | | | .43 | | | | .98 | | | | — | | | | — | | | | 1.41 | | | | (.85 | ) | | | — | | | | (.15 | ) | | | (1.00 | ) | | | — | * | | | 12.84 | | | | 11.27 | | |
2012 | | | 11.37 | | | | .45 | | | | 1.61 | | | | — | | | | — | | | | 2.06 | | | | (.96 | ) | | | — | | | | (.04 | ) | | | (1.00 | ) | | | — | | | | 12.43 | | | | 11.60 | | |
2011 | | | 12.25 | | | | .44 | | | | (.32 | ) | | | — | | | | — | | | | 0.12 | | | | (1.00 | ) | | | — | | | | — | | | | (1.00 | ) | | | — | * | | | 11.37 | | | | 10.26 | | |
2010 | | | 11.13 | | | | .36 | | | | 1.70 | | | | — | | | | — | | | | 2.06 | | | | (.94 | ) | | | — | | | | — | | | | (.94 | ) | | | — | * | | | 12.25 | | | | 10.89 | | |
2009 | | | 8.30 | | | | .46 | | | | 3.24 | | | | — | * | | | — | * | | | 3.70 | | | | (.47 | ) | | | — | | | | (.41 | ) | | | (.88 | ) | | | .01 | | | | 11.13 | | | | 9.73 | | |
| | | Borrowings at the End of Period | |
| | | Aggregate
Amount
Outstanding
(000) | | Asset
Coverage
Per $1,000 | |
Year Ended 12/31: | |
| 2014(g) | | $ | 116,000 | | | $ | 3,354 | | |
2013 | | | 116,000 | | | | 3,206 | | |
2012 | | | 107,800 | | | | 3,299 | | |
2011 | | | 97,800 | | | | 3,318 | | |
2010 | | | 65,000 | | | | 4,761 | | |
2009 | | | 65,000 | | | | 4,424 | | |
Nuveen Investments
40
| | | | | Ratios/Supplemental Data | |
| | | Total Returns | | | | Ratios to Average Net Assets
Applicable to Common Shares
Before Reimbursement(d) | | Ratios to Average Net Assets
Applicable to Common Shares
After Reimbursement(d)(e) | |
| |
| | Based
on
Common
Share
NAV(c) | | Based
on
Market
Value(c) | | Ending
Net
Assets
Applicable
to Common
Shares (000) | | Expenses | | Net
Investment
Income (Loss) | | Expenses | | Net
Investment
Income (Loss) | | Portfolio
Turnover
Rate(f) | |
Year Ended 12/31: | |
| 2014(g) | | | 10.76 | % | | | 13.46 | % | | $ | 273,076 | | | | 1.86 | %** | | | 3.92 | %** | | | N/A | | | | N/A | | | | 27 | % | |
2013 | | | 11.63 | | | | 5.63 | | | | 255,916 | | | | 1.90 | | | | 3.35 | | | | N/A | | | | N/A | | | | 54 | | |
2012 | | | 18.45 | | | | 22.99 | | | | 247,826 | | | | 1.95 | | | | 3.72 | | | | N/A | | | | N/A | | | | 50 | | |
2011 | | | 1.08 | | | | 3.33 | | | | 226,702 | | | | 1.81 | | | | 3.61 | | | | 1.73 | % | | | 3.69 | % | | | 67 | | |
2010 | | | 19.18 | | | | 22.16 | | | | 244,461 | | | | 1.78 | | | | 2.88 | | | | 1.61 | | | | 3.06 | | | | 67 | | |
2009 | | | 47.30 | | | | 72.17 | | | | 222,566 | | | | 1.89 | | | | 4.73 | | | | 1.59 | | | | 5.02 | | | | 77 | | |
(a) Per share Net Investment Income (Loss) is calculated using the average daily shares method.
(b) The amounts shown are based on common share equivalents. During the fiscal year ended December 31, 2009, the Fund redeemed all of its outstanding FundPreferred shares, at liquidation value.
(c) Total Return Based on Market Value is the combination of changes in the market price per share and the effect of reinvested dividend income and reinvested capital gains distributions, if any, at the average price paid per share at the time of reinvestment. The last dividend declared in the period, which is typically paid on the first business day of the following month, is assumed to be reinvested at the ending market price. The actual reinvestment for the last dividend declared in the period takes place over several days, and in some instances may not be based on the market price, so the actual reinvestment price may be different from the price used in the calculation. Total returns are not annualized.
Total Return Based on Common Share NAV is the combination of changes in common share NAV, reinvested dividend income at NAV and reinvested capital gains distributions at NAV, if any. The last dividend declared in the period, which is typically paid on the first business day of the following month, is assumed to be reinvested at the ending NAV. The actual reinvest price for the last dividend declared in the period may often be based on the Fund's market price (and not its NAV), and therefore may be different from the price used in the calculation. Total returns are not annualized.
(d) • Ratios do not reflect the effect of dividend payments to FundPreferred shareholders, where applicable.
• Net Investment Income (Loss) ratios reflect income earned and expenses incurred on assets attributable to FundPreferred shares and/or borrowings, (as described in Note 8 – Borrowing Arrangements), where applicable.
• Each ratio includes the effect of all interest expense paid and other costs related to borrowings as follows:
Ratios of Borrowings Interest Expense
to Average Net Assets Applicable to Common Shares | | | |
Year Ended 12/31: | |
| 2014(g) | | | .41 | %** | |
2013 | | | .47 | | |
2012 | | | .53 | | |
2011 | | | .44 | | |
2010 | | | .38 | | |
2009 | | | .38 | | |
(e) After expense reimbursement from the Adviser, where applicable. As of September 30, 2011, the Adviser is no longer reimbursing the Fund for any fees or expenses.
(f) Portfolio Turnover Rate is calculated based on the lesser of long-term purchases or sales (as disclosed in Note 5 – Investment Transactions) divided by the average long-term market value during the period.
(g) For the six months ended June 30, 2014.
* Rounds to less than $.01 per share.
** Annualized.
*** Represents distributions paid "From and in excess of net investment income" for the six months ended June 30, 2014, as described in Note 1 – General Information and Significant Accounting Policies, Dividends and Distributions to Shareholders.
N/A Fund no longer has a contractual reimbursement agreement with the Adviser.
See accompanying notes to financial statements.
Nuveen Investments
41
Notes to
Financial Statements (Unaudited)
1. General Information and Significant Accounting Policies
General Information
Fund Information
Nuveen Diversified Dividend and Income Fund (the "Fund") is registered under the Investment Company Act of 1940, as amended, as a diversified closed-end registered investment company. The Fund's shares are listed on the New York Stock Exchange ("NYSE") and trade under the ticker symbol "JDD." The Fund was organized as a Massachusetts business trust on July 18, 2003.
Investment Adviser
The Fund's investment adviser is Nuveen Fund Advisors, LLC (the "Adviser"), a wholly-owned subsidiary of Nuveen Investments, Inc. ("Nuveen").The Adviser is responsible for the Fund's overall investment strategy and asset allocation decisions. The Adviser has entered into sub-advisory agreements with NWQ Investment Management Company, LLC ("NWQ"), Security Capital Research & Management Incorporated ("Security Capital"), Symphony Asset Management LLC ("Symphony") and Wellington Management Company, LLP ("Wellington") (each a "Sub-Adviser" and collectively, the "Sub-Advisers"). NWQ and Symphony are each an affiliate of Nuveen. NWQ manages the global equity income strategy portion of the Fund consisting of a portfolio focused on income producing and dividend paying equity securities. Security Capital manages the real estate securities ("REIT") strategy portion of the Fund consisting of a portfolio focused on dividend-paying common stock REITs. Symphony manages the adjustable rate senior loan strategy portion of the Fund consisting of a portfolio focused on senior loans. Wellington manages the emerging market debt strategy portion of the Fund consisting of a portfolio focused on emerging market sovereign debt. Wellington also manages the Fund's forward foreign currency exchange strategy. The Adviser is responsible for managing the Fund's investments in swap contracts.
Agreement and Plan of Merger
On April 14, 2014, TIAA-CREF, a national financial services organization, announced that it had entered into an agreement (the "Purchase Agreement") to acquire Nuveen, the parent company of the Adviser. The transaction is expected to be completed by the end of the year, subject to customary closing conditions, including obtaining necessary Nuveen fund and client consents sufficient to satisfy the terms of the Purchase Agreement and obtaining customary regulatory approvals. There can be no assurance that the transaction described above will be consummated as contemplated or that necessary conditions will be satisfied.
The consummation of the transaction will be deemed to be an "assignment" (as defined in the Investment Company Act of 1940) of the investment management agreements between the Nuveen funds and the Adviser and the investment sub-advisory agreements between the Adviser and each Nuveen fund's sub-adviser or sub-advisers, and will result in automatic termination of each agreement. It is anticipated that the Board of Directors/Trustees of the Nuveen funds will consider a new investment management agreement with the Adviser and new investment sub-advisory agreements with each sub-adviser.
The transaction is not expected to result in any change in the portfolio management of the Fund or in the Fund's investment objectives or policies.
Investment Objectives and Principal Investment Strategies
The Fund's investment objectives are high current income and total return. The Fund invests primarily in U.S. and foreign dividend-paying common stocks, dividend-paying common stocks issued by REITs, debt securities and other non-equity instruments that are issued by, or that are related to, government, government-related and supernational issuers located, or conducting their business, in emerging market countries ("emerging markets debt and foreign corporate bonds") and senior loans.
Significant Accounting Policies
The following is a summary of significant accounting policies followed by the Fund in the preparation of its financial statements in accordance with U.S. generally accepted accounting principles ("U.S. GAAP").
Investment Transactions
Investment transactions are recorded on a trade date basis. Trade date for senior and subordinated loans purchased in the "primary market" is considered the date on which the loan allocations are determined. Trade date for senior and subordinated loans purchased in the "secondary market" is the date on which the transaction is entered into. Realized gains and losses from investment transactions are determined on the specific identification method, which is the same basis used for federal income tax purposes. Investments purchased on a when-issued/delayed delivery basis may have
Nuveen Investments
42
extended settlement periods. Any investments so purchased are subject to market fluctuation during this period. The Fund has instructed the custodian to earmark securities in the Fund's portfolio with a current value at least equal to the amount of the when-issued/delayed delivery purchase commitments. As of June 30, 2014, the Funds' outstanding when-issued/delayed delivery purchase commitments were as follows:
Outstanding when-issued/delayed delivery purchase commitments | | $ | 1,958,190 | | |
Investment Income
Dividend income is recorded on the ex-dividend date or, for foreign securities, when information is available. Interest income, which reflects the amortization of premiums and accretion of discounts for financial reporting purposes, is recorded on an accrual basis. Fee income consists primarily of amendment fees. Amendment fees are earned as compensation for evaluating and accepting changes to an original senior loan agreement and are recognized when received. Fee income and amendment fees are recognized as a component of "Interest" on the Statement of Operations.
Professional Fees
Professional fees presented on the Statement of Operations consist of legal fees incurred in the normal course of operations, audit fees, tax consulting fees and, in some cases, workout expenditures. Workout expenditures are incurred in an attempt to protect or enhance an investment or to pursue other claims or legal actions on behalf of Fund shareholders. If a refund is received for workout expenditures paid in a prior reporting period, such amounts will be recognized as "Legal fee refund" on the Statement of Operations.
Dividends and Distributions to Common Shareholders
Distributions to common shareholders are recorded on the ex-dividend date. The amount and timing of distributions are determined in accordance with federal income tax regulations, which may differ from U.S. GAAP.
The Fund makes quarterly cash distributions to common shareholders of a stated dollar amount per share. Subject to approval and oversight by the Fund's Board of Trustees, the Fund seeks to maintain a stable distribution level designed to deliver the long-term return potential of the Fund's investment strategy through regular quarterly distributions (a "Managed Distribution Program"). Total distributions during a calendar year generally will be made from the Fund's net investment income, net realized capital gains and net unrealized capital gains in the Fund's portfolio, if any. The portion of distributions paid attributed to net unrealized gains, if any, is distributed from the Fund's assets and is treated by shareholders as a non-taxable distribution ("Return of Capital") for tax purposes. In the event that total distributions during a calendar year exceed the Fund's total return on net asset value ("NAV"), the difference will reduce NAV per share. If the Fund's total return on NAV exceeds total distributions during a calendar year, the excess will be reflected as an increase in NAV per share. The final determination of the source and character of all distributions for the fiscal year are made after the end of the fiscal year and are reflected in the financial statements contained in the annual report as of December 31 each year.
REIT distributions received by the Fund are generally comprised of ordinary income, long-term capital gains and a return of REIT capital. The actual character of amounts received during the period are not known until after the fiscal year end. For the fiscal year ended December 31, 2013, the character of distributions to the Fund from the REITs was 67.33% ordinary income, 23.25% long-term capital gains and 9.42% return of REIT capital.
For the fiscal year ended December 31, 2013, the Fund applied the actual character of distributions reported by the REITs in which the Fund invests to its receipts from the REITs. If a REIT held in the portfolio of investments did not report the actual character of its distributions during the period, the Fund treated the distributions as ordinary income.
For the six months ended June 30, 2014, the Fund applied the actual percentages for the fiscal year ended December 31, 2013, described above, to its receipts from the REITs and treated as income on the Statement of Operations only the amount of ordinary income so calculated. The Fund adjusts that estimated breakdown of income type (and consequently its net investment income) as necessary early in the following calendar year when the REITs inform their shareholders of the actual breakdown of income type.
The actual character of distributions made by the Fund during the fiscal year ended December 31, 2013, is reflected in the accompanying financial statements.
The distributions made by the Fund during the six months ended June 30, 2014, are provisionally classified as being "From and in excess of net investment income," and those distributions will be classified as being from net investment income, net realized capital gains and/or a return of capital for tax purposes after the fiscal year end. For purposes of calculating "Undistributed (Over distribution of) net investment income" as of June 30, 2014, the distribution amounts provisionally classified as "From and in excess of net investment income" were treated as being entirely from net investment income. Consequently, the financial statements as of June 30, 2014, reflect an over-distribution of net investment income.
FundPreferred Shares
The Fund is authorized to issue auction rate preferred ("FundPreferred") shares. During prior fiscal periods, the Fund redeemed all of its outstanding FundPreferred shares, at liquidation value.
Indemnifications
Under the Fund's organizational documents, its officers and trustees are indemnified against certain liabilities arising out of the performance of their duties to the Fund. In addition, in the normal course of business, the Fund enters into contracts that provide general indemnifications to other parties.
Nuveen Investments
43
Notes to Financial Statements (Unaudited) (continued)
The Fund's maximum exposure under these arrangements is unknown as this would involve future claims that may be made against the Fund that have not yet occurred. However, the Fund has not had prior claims or losses pursuant to these contracts and expects the risk of loss to be remote.
Netting Agreements
In the ordinary course of business, the Fund may enter into transactions subject to enforceable master repurchase agreements, International Swaps and Derivative Association, Inc. ("ISDA") master agreements or other similar arrangements ("netting agreements"). Generally, the right to offset in netting agreements allows the Fund to offset any exposure to a specific counterparty with any collateral received or delivered to that counterparty based on the terms of the agreements. Generally, the Fund manages its cash collateral and securities collateral on a counterparty basis.
As of June 30, 2014, the Fund was invested in repurchase agreements, forward foreign currency exchange contracts and swap contracts that are subject to netting agreements and further described in Note 3 – Portfolio Securities and Investments in Derivatives.
Use of Estimates
The preparation of financial statements in conformity with U.S. GAAP requires management to make estimates and assumptions that affect the reported amounts of assets and liabilities at the date of the financial statements and the reported amounts of increases and decreases in net assets applicable to common shares from operations during the reporting period. Actual results may differ from those estimates.
2. Investment Valuation and Fair Value Measurements
The fair valuation input levels as described below are for fair value measurement purposes.
Investment Valuation
Common stocks and other equity-type securities are valued at the last sales price on the securities exchange on which such securities are primarily traded and are generally classified as Level 1. Securities primarily traded on the NASDAQ National Market ("NASDAQ") are valued, at the NASDAQ Official Closing Price and are generally classified as Level 1. However, securities traded on a securities exchange or NASDAQ for which there were no transactions on a given day or securities not listed on a securities exchange or NASDAQ are valued at the quoted bid price and are generally classified as Level 2. Prices of certain American Depositary Receipts ("ADRs") held by the Fund that trade in the United States are valued based on the last traded price, official closing price or the most recent bid price of the underlying non-U.S.-traded stock, adjusted as appropriate for the underlying-to-ADR conversion ratio and foreign exchange rate, and from time-to-time may also be adjusted further to take into account material events that may take place after the close of the local non-U.S. market but before the close of the NYSE, which may represent a transfer from a Level 1 to a Level 2 security.
Prices of fixed-income securities are provided by a pricing service approved by the Nuveen funds' Board of Directors/Trustees. The pricing service establishes a security's fair value using methods that may include consideration of the following: yields or prices of investments of comparable quality, type of issue, coupon, maturity and rating, market quotes or indications of value from security dealers, evaluations of anticipated cash flows or collateral, general market conditions and other information and analysis, including the obligor's credit characteristics considered relevant. These securities are generally classified as Level 2. In pricing certain securities, particularly less liquid and lower quality securities, the pricing service may consider information about a security, its issuer or market activity provided by the Adviser. These securities are generally classified as Level 2 or Level 3 depending on the priority of the significant inputs.
Like most fixed-income securities, the senior and subordinated loans in which the Fund invests are not listed on an organized exchange. The secondary market of such investments may be less liquid relative to markets for other fixed-income securities. Consequently, the value of senior and subordinated loans, determined as described above, may differ significantly from the value that would have been determined had there been an active market for that senior loan. These securities are generally classified as Level 2.
Prices of forward foreign currency exchange contracts and swap contracts are also provided by a pricing service approved by the Nuveen funds' Board of Directors/Trustees using the same methods as described above, and are generally classified as Level 2.
The value of exchange-traded options are based on the mean of the closing bid and ask prices. Exchange-traded options are generally classified as Level 1. Options traded in the over-the-counter ("OTC") market are valued using an evaluated mean price and are generally classified as Level 2.
Repurchase agreements are valued at contract amount plus accrued interest, which approximates market value. These securities are generally classified as Level 2.
Investments initially valued in currencies other than the U.S. dollar are converted to the U.S. dollar using exchange rates obtained from pricing services. As a result, the NAV of the Fund's shares may be affected by changes in the value of currencies in relation to the U.S. dollar. The value of securities traded in markets outside the United States or denominated in currencies other than the U.S. dollar may be affected significantly on a day that the NYSE is closed and an investor is not able to purchase, redeem or exchange shares. If significant market events occur between the time of determination of the closing price of a foreign security on an exchange and the time that the Fund's NAV is determined, or if under the Fund's procedures, the closing price of a foreign security is not deemed to be reliable, the security would be valued at fair value as determined in accordance with procedures established in good faith by the Nuveen funds' Board of Directors/Trustees. These securities are generally classified as Level 2 or Level 3 depending on the priority of the significant inputs.
Nuveen Investments
44
Certain securities may not be able to be priced by the pre-established pricing methods as described above. Such securities may be valued by the Nuveen funds' Board of Directors/Trustees or its designee at fair value. These securities generally include, but are not limited to, restricted securities (securities which may not be publicly sold without registration under the Securities Act of 1933, as amended) for which a pricing service is unable to provide a market price; securities whose trading has been formally suspended; debt securities that have gone into default and for which there is no current market quotation; a security whose market price is not available from a pre-established pricing source; a security with respect to which an event has occurred that is likely to materially affect the value of the security after the market has closed but before the calculation of a fund's NAV (as may be the case in non-U.S. markets on which the security is primarily traded) or make it difficult or impossible to obtain a reliable market quotation; and a security whose price, as provided by the pricing service, is not deemed to reflect the security's fair value. As a general principle, the fair value of a security would appear to be the amount that the owner might reasonably expect to receive for it in a current sale. A variety of factors may be considered in determining the fair value of such securities, which may include consideration of the following: yields or prices of investments of comparable quality, type of issue, coupon, maturity and rating, market quotes or indications of value from security dealers, evaluations of anticipated cash flows or collateral, general market conditions and other information and analysis, including the obligor's credit characteristics considered relevant. These securities are generally classified as Level 2 or Level 3 depending on the priority of the significant inputs. Regardless of the method employed to value a particular security, all valuations are subject to review by the Nuveen funds' Board of Directors/Trustees or its designee.
Fair Value Measurements
Fair value is defined as the price that would be received upon selling an investment or transferring a liability in an orderly transaction to an independent buyer in the principal or most advantageous market for the investment. A three-tier hierarchy is used to maximize the use of observable market data and minimize the use of unobservable inputs and to establish classification of fair value measurements for disclosure purposes. Observable inputs reflect the assumptions market participants would use in pricing the asset or liability. Observable inputs are based on market data obtained from sources independent of the reporting entity. Unobservable inputs reflect the reporting entity's own assumptions about the assumptions market participants would use in pricing the asset or liability. Unobservable inputs are based on the best information available in the circumstances. The following is a summary of the three-tiered hierarchy of valuation input levels.
Level 1 – Inputs are unadjusted and prices are determined using quoted prices in active markets for identical securities.
Level 2 – Prices are determined using other significant observable inputs (including quoted prices for similar securities, interest rates, prepayment speeds, credit risk, etc.).
Level 3 – Prices are determined using significant unobservable inputs (including management's assumptions in determining the fair value of investments).
The inputs or methodologies used for valuing securities are not an indication of the risks associated with investing in those securities. The following is a summary of the Fund's fair value measurements as of the end of the reporting period:
| | Level 1 | | Level 2 | | Level 3 | | Total | |
Long-Term Investments*: | |
Common Stocks | | $ | 85,563,258 | | | $ | 10,734,882 | | | $ | — | *** | | $ | 97,298,141 | | |
Real Estate Investment Trust (REIT) Common Stocks | | | 104,113,379 | | | | — | | | | — | | | | 104,113,379 | | |
Convertible Preferred Securities | | | 967,290 | | | | — | | | | — | | | | 967,290 | | |
$25 Par (or similar) Retail Preferred | | | 975,251 | | | | | | — | | | | 975,251 | | |
$1,000 Par (or similar) Institutional Preferred | | | — | | | | 997,560 | | | | — | | | | 997,560 | | |
Variable Rate Senior Loan Interests | | | — | | | | 81,783,295 | | | | — | | | | 81,783,295 | | |
Corporate Bonds | | | — | | | | 140,745 | | | | — | | | | 140,745 | | |
Emerging Markets Debt and Foreign Corporate Bonds | | | — | | | | 91,388,259 | | | | — | | | | 91,388,259 | | |
Short-Term Investments: | |
Repurchase Agreements | | | — | | | | 18,423,924 | | | | — | | | | 18,423,924 | | |
Investments in Derivatives: | |
Options Written | | | (24,601 | ) | | | — | | | | — | | | | (24,601 | ) | |
Forward Foreign Currency Exchange Contracts** | | | — | | | | (55,932 | ) | | | — | | | | (55,932 | ) | |
Interest Rate Swaps** | | | — | | | | 491,846 | | | | — | | | | 491,846 | | |
Total | | $ | 192,594,577 | | | $ | 203,904,579 | | | $ | — | | | $ | 396,499,157 | | |
* Refer to the Fund's Portfolio of Investments for industry and country, where applicable, classifications and breakdown of Common Stocks classified as Level 2 and Level 3.
** Represents net unrealized appreciation (depreciation) as reported in the Fund's Portfolio of Investments.
*** Value equals zero as of the end of the reporting period.
The Nuveen funds' Board of Directors/Trustees is responsible for the valuation process and has delegated the oversight of the daily valuation process to the Adviser's Valuation Committee. The Valuation Committee, pursuant to the valuation policies and procedures adopted by the Nuveen funds' Board of Directors/Trustees, is responsible for making fair value determinations, evaluating the effectiveness of the funds' pricing policies and reporting to the Board of Directors/Trustees. The Valuation Committee is aided in its efforts by the Adviser's dedicated Securities Valuation Team, which is responsible for administering the daily valuation process and applying fair value methodologies as approved by the Valuation Committee. When determining the reliability of independent pricing services for investments owned by the funds, the Valuation Committee, among other things, conducts due diligence reviews of the pricing services and monitors the quality of security prices received through various testing reports conducted by the Securities Valuation Team.
Nuveen Investments
45
Notes to Financial Statements (Unaudited) (continued)
The Valuation Committee will consider pricing methodologies it deems relevant and appropriate when making a fair value determination, based on the facts and circumstances specific to the portfolio instrument. Fair value determinations generally will be derived as follows, using public or private market information:
(i) If available, fair value determinations shall be derived by extrapolating from recent transactions or quoted prices for identical or comparable securities.
(ii) If such information is not available, an analytical valuation methodology may be used based on other available information including, but not limited to: analyst appraisals, research reports, corporate action information, issuer financial statements and shelf registration statements. Such analytical valuation methodologies may include, but are not limited to: multiple of earnings, discount from market value of a similar freely-traded security, discounted cash flow analysis, book value or a multiple thereof, risk premium/yield analysis, yield to maturity and/or fundamental investment analysis.
The purchase price of a portfolio instrument will be used to fair value the instrument only if no other valuation methodology is available or deemed appropriate, and it is determined that the purchase price fairly reflects the instrument's current value.
For each portfolio security that has been fair valued pursuant to the policies adopted by the Board of Directors/Trustees, the fair value price is compared against the last available and next available market quotations. The Valuation Committee reviews the results of such testing and fair valuation occurrences are reported to the Board of Directors/Trustees.
3. Portfolio Securities and Investments in Derivatives
Portfolio Securities
Foreign Currency Transactions
To the extent that the Fund invests in securities and/or contracts that are denominated in a currency other than U.S. dollars, the Fund will be subject to currency risk, which is the risk that an increase in the U.S. dollar relative to the foreign currency will reduce returns or portfolio value. Generally, when the U.S. dollar rises in value against a foreign currency, the Fund's investments denominated in that currency will lose value because its currency is worth fewer U.S. dollars; the opposite effect occurs if the U.S. dollar falls in relative value. Investments and other assets and liabilities denominated in foreign currencies are converted into U.S. dollars on a spot (i.e. cash) basis at the spot rate prevailing in the foreign currency exchange market at the time of valuation. Purchases and sales of investments and income denominated in foreign currencies are translated into U.S. dollars on the respective dates of such transactions.
The Fund may invest in non-U.S. securities (as described in Note 1 – General Information and Significant Accounting Policies, Investment Objective). As of June 30, 2014, the Fund's investments in non-U.S. securities were as follows:
| | Value | | % of Total
Investments | |
Country: | |
Netherlands | | $ | 6,630,756 | | | | 1.7 | % | |
Brazil | | | 6,625,777 | | | | 1.7 | | |
United Kingdom | | | 6,152,837 | | | | 1.6 | | |
Indonesia | | | 5,907,700 | | | | 1.5 | | |
Colombia | | | 5,661,980 | | | | 1.4 | | |
France | | | 5,404,279 | | | | 1.4 | | |
Mexico | | | 5,112,556 | | | | 1.3 | | |
Russia | | | 4,648,067 | | | | 1.2 | | |
Canada | | | 4,643,395 | | | | 1.2 | | |
Switzerland | | | 4,624,216 | | | | 1.2 | | |
Other Countries* | | | 81,527,351 | | | | 20.4 | | |
Total | | $ | 136,938,914 | | | | 34.6 | % | |
The books and records of the Fund are maintained in U.S. dollars. Foreign currencies, assets and liabilities are translated into U.S. dollars at 4:00 p.m. Eastern Time. Investment transactions, income and expenses are translated on the respective dates of such transactions. Net realized foreign currency gains and losses resulting from changes in exchange rates include foreign currency gains and losses between trade date and settlement date of the transactions, foreign currency transactions and the difference between the amounts of interest and dividends recorded on the books of the Fund and the amounts actually received.
The realized gains and losses resulting from changes in foreign currency exchange rates and changes in foreign exchange rates associated with other assets and liabilities on investments, forward foreign currency exchange contracts, options written and swap contracts are recognized as a component of "Net realized gain (loss) from investments and foreign currency" on the Statement of Operations, when applicable.
Nuveen Investments
46
The unrealized gains and losses resulting from changes in foreign currency exchange rates and changes in foreign exchange rates associated with other assets and liabilities on investments are recognized as a component of "Change in unrealized appreciation (depreciation) of investments and foreign currency" on the Statement of Operations, when applicable. The unrealized gains and losses resulting from changes in foreign exchange rates associated with forward foreign currency exchange contracts, options written and swaps are recognized as a component of "Change in net unrealized appreciation (deprecation) of forward foreign currency exchange contracts, options written and swaps", respectively, on the Statement of Operations, when applicable.
Repurchase Agreements
In connection with transactions in repurchase agreements, it is the Fund's policy that its custodian take possession of the underlying collateral securities, the fair value of which exceeds the principal amount of the repurchase transaction, including accrued interest, at all times. If the counterparty defaults, and the fair value of the collateral declines, realization of the collateral may be delayed or limited.
The following table presents the repurchase agreements for the Fund that are subject to netting agreements as of the end of the reporting period, and the collateral delivered related to those repurchase agreements.
Counterparty | | Short-term
Investments, at Value | | Collateral
Pledged (From)
Counterparty* | | Net
Exposure | |
Fixed Income Clearing Corporation | | $ | 18,423,924 | | | $ | (18,423,924 | ) | | $ | — | | |
* As of June 30, 2014, the value of the collateral pledged from the counterparty exceeded the value of the repurchase agreements. Refer to the Fund's Portfolio of Investments for details on the repurchase agreements.
Zero Coupon Securities
A zero coupon security does not pay a regular interest coupon to its holders during the life of the security. Income to the holder of the security comes from accretion of the difference between the original purchase price of the security at issuance and the par value of the security at maturity and is effectively paid at maturity. The market prices of zero coupon securities generally are more volatile than the market prices of securities that pay interest periodically.
Investments in Derivatives
The Fund is authorized to invest in certain derivative instruments, such as futures, options and swap contracts. The Fund limits its investments in futures, options on futures and swap contracts to the extent necessary for the Adviser to claim the exclusion from registration by the Commodity Futures Trading Commission as a commodity pool operator with respect to the Fund. The Fund records derivative instruments at fair value, with changes in fair value recognized on the Statement of Operations, when applicable. Even though the Fund's investments in derivatives may represent economic hedges, they are not considered to be hedge transactions for financial reporting purposes.
Forward Foreign Currency Exchange Contracts
The Fund is authorized to enter into forward foreign currency exchange contracts ("forward contracts") under two circumstances: (i) when the Fund enters into a contract for the purchase or sale of a security denominated in a foreign currency to "lock in" the U.S. exchange rate of the transaction, with such period being a short-dated contract covering the period between transaction date and settlement date or (ii) when the Sub-Adviser believes that the currency of a particular foreign country may experience a substantial movement against the U.S. dollar or against another foreign currency.
A forward contract is an agreement between two parties to purchase or sell a specified quantity of a currency at or before a specified date in the future at a specified price. Forward contracts are typically traded in the OTC markets and all details of the contract are negotiated between the counterparties to the agreement. Accordingly, the forward contracts are valued by reference to the contracts traded in the OTC markets. The contractual obligations of a buyer or seller may generally be satisfied by taking or making physical delivery of the underlying currency, establishing an opposite position in the contract and recognizing the profit or loss on both positions simultaneously on the delivery date or, in some instances, paying a cash settlement before the designated date of delivery.
Forward contracts are valued daily at the forward rate. The net amount recorded on these transactions for each counterparty is recognized as a component of "Unrealized appreciation and/or depreciation on forward foreign currency exchange contracts (, net)" on the Statement of Assets and Liabilities. The change in value of the forward contracts during the reporting period is recognized as a component of "Change in net unrealized appreciation (depreciation) of forward foreign currency exchange contracts" on the Statement of Operations. When the contract is closed or offset with the same counterparty, the Fund recognizes the difference between the value of the contract at the time it was entered and the value at the time it was closed or offset as a component of "Net realized gain (loss) from forward foreign currency exchange contracts" on the Statement of Operations.
Forward contracts will generally not be entered into for terms greater than three months, but may have maturities of up to six months or more. The use of forward contracts does not eliminate fluctuations in the underlying prices of the Fund's investment securities; however, it does establish a rate of exchange that can be achieved in the future. The use of forward contracts involves the risk that anticipated currency movements will not be accurately predicted. A forward contract would limit the risk of loss due to a decline in the value of a particular currency; however, it also would limit any potential
Nuveen Investments
47
Notes to Financial Statements (Unaudited) (continued)
gain that might result should the value of the currency increase instead of decrease. These contracts may involve market risk in excess of the unrealized appreciation or depreciation reflected on the Statement of Assets and Liabilities. Forward contracts are subject to counterparty risk if the counterparty fails to perform as specified in the contract due to financial impairment or other reason.
During the six months ended June 30, 2014, the Fund continued to utilize forward contracts to reduce the currency risk of select local currency denominated emerging market bonds, as well as to actively manage certain currency exposures in an attempt to benefit from potential appreciation.
The average notional amount of forward foreign currency exchange contracts outstanding during the six months ended June 30, 2014, was as follows:
Average notional amount of forward foreign currency exchange contracts outstanding* | | $ | 8,257,941 | | |
* The average notional amount is calculated based on the outstanding notional at the beginning of the fiscal year and at the end of each fiscal quarter within the current fiscal year.
The following table presents the fair value of forward foreign currency exchange contracts held by the Fund as of June 30, 2014, the location of these instruments on the Statement of Assets and Liabilities and the primary underlying risk exposure.
| | | | | Location on the Statement of Assets and Liabilities | |
Underlying | | Derivative | | Asset Derivatives | | (Liability) Derivatives | |
Risk Exposure | | Instrument | | Location | | Value | | Location | | Value | |
Foreign currency
exchange rate | | Forward
contracts | | Unrealized appreciation on forward
foreign currency exchange contracts, net | | $ | 14,160 | | | Unrealized depreciation on forward
foreign currency exchange contracts, net | | $ | 5,013 | | |
Foreign currency
exchange rate | | Forward
contracts | | Unrealized appreciation on forward
foreign currency exchange contracts, net | | | (853 | ) | | Unrealized depreciation on forward
foreign currency exchange contracts, net | | | (74,252 | ) | |
Total | | | | | | $ | 13,307 | | | | | $ | (69,239 | ) | |
The following table presents the forward foreign currency exchange contracts, which are subject to netting agreements, and the collateral delivered to those forward foreign currency exchange contracts as of June 30, 2014.
Counterparty | | Gross
Unrealized
Appreciation on
Forward Foreign
Currency Exchange
Contracts* | | Gross
Unrealized
(Depreciation) on
Forward Foreign
Currency Exchange
Contracts* | | Amounts
Netted on
Statement of
Assets and
Liabilities | | Net Unrealized
Appreciation
(Depreciation) on
Forward Foreign
Currency Exchange
Contracts | | Collateral
Pledged
to (from)
Counterparty | | Net
Exposure | |
Bank of America | | $ | 633 | | | $ | — | | | $ | — | | | $ | 633 | | | $ | — | | | $ | 633 | | |
BNP Paribas | | | 184 | | | | — | | | | — | | | | 184 | | | | — | | | | 184 | | |
Citibank N.A. | | | 1,300 | | | | (33,131 | ) | | | 1,300 | | | | (31,831 | ) | | | — | | | | (31,831 | ) | |
Credit Suisse | | | 594 | | | | (2,472 | ) | | | 594 | | | | (1,878 | ) | | | — | | | | (1,878 | ) | |
Deutsche Bank AG | | | 2,811 | | | | — | | | | — | | | | 2,811 | | | | — | | | | 2,811 | | |
Goldman Sachs | | | 2,437 | | | | — | | | | — | | | | 2,437 | | | | — | | | | 2,437 | | |
JPMorgan | | | 6,371 | | | | (853 | ) | | | (853 | ) | | | 5,518 | | | | — | | | | 5,518 | | |
Morgan Stanley | | | 3,119 | | | | (35,837 | ) | | | 3,119 | | | | (32,718 | ) | | | — | | | | (32,718 | ) | |
Royal Bank of Canada | | | 18 | | | | — | | | | — | | | | 18 | | | | — | | | | 18 | | |
Standard Chartered Bank | | | 1,706 | | | | — | | | | — | | | | 1,706 | | | | — | | | | 1,706 | | |
UBS AG | | | — | | | | (2,812 | ) | | | — | | | | (2,812 | ) | | | — | | | | (2,812 | ) | |
Total | | $ | 19,173 | | | $ | (75,105 | ) | | $ | 4,160 | | | $ | (55,932 | ) | | $ | — | | | $ | (55,932 | ) | |
* Represents gross unrealized appreciation (depreciation) for the counterparty as reported in the Fund's Portfolio of Investments.
The following table presents the amount of net realized gain (loss) and change in net unrealized appreciation (depreciation) recognized on forward foreign currency exchange contracts on the Statement of Operations during the six months ended June 30, 2014, and the primary underlying risk exposure.
Underlying
Risk Exposure | | Derivative
Instrument | | Net Realized Gain (Loss) from
Forward Foreign Currency Exchange Contracts | | Change in Net Unrealized
Appreciation (Depreciation) of
Forward Foreign Currency Exchange Contracts | |
Foreign currency
exchange rate | | Forward contracts | | $ | (47,416 | ) | | $ | (68,389 | ) | |
Swap Contracts
Interest rate swap contracts involve the Fund's agreement with the counterparty to pay or receive a fixed rate payment in exchange for the counterparty receiving or paying a variable rate payment that is intended to approximate the Fund's variable rate payment obligation on any variable rate borrowing. Forward interest rate swap contracts involve the Fund's agreement with a counterparty to pay, in the future, a fixed or variable rate payment in exchange for the counterparty paying the Fund a variable or fixed rate payment, the accruals for which would begin at a specified date in the future (the "effective date"). The payment obligation is based on the notional amount of the swap contract. Swap contracts do not involve the delivery of securities or other underlying assets or principal. Accordingly, the risk of loss with respect to the swap counterparty on such transactions is limited to the net amount of
Nuveen Investments
48
interest payments that the Fund is to receive. Swap contracts are valued daily. Upon entering into an interest rate swap (and beginning on the effective date for a forward interest rate swap), the Fund accrues the fixed rate payment expected to be paid or received and the variable rate payment expected to be received or paid on a daily basis, and recognizes the daily change in the fair value of the Fund's contractual rights and obligations under the contracts. The net amount recorded for these transactions for each counterparty is recognized on the Statement of Assets and Liabilities as a component of "Unrealized appreciation or depreciation on interest rate swaps (, net)" with the change during the fiscal period recognized on the Statement of Operations as a component of "Change in net unrealized appreciation (depreciation) of swaps." Income received or paid by the Fund is recognized as a component of "Net realized gain (loss) from swaps" on the Statement of Operations, in addition to the net realized gains or losses recognized upon the termination of a swap contract and are equal to the difference between the Fund's basis in the swap and the proceeds from (or cost of) the closing transaction. Payments received or made at the beginning of the measurement period are recognized as a component of "Interest rate swap premiums paid and/or received" on the Statement of Assets and Liabilities, when applicable. For tax purposes, periodic payments are treated as ordinary income or expense.
During the six months ended June 30, 2014, the Fund continued to utilize interest rate swap contracts to partially fix its interest cost of leverage, which the Fund employs through the use of bank borrowings.
The average notional amount of interest rate swap contracts outstanding during the six months ended June 30, 2014, was as follows:
Average notional amount of interest rate swap contracts outstanding* | | $ | 87,500,000 | | |
* The average notional amount is calculated based on the outstanding notional at the beginning of the fiscal year and at the end of each fiscal quarter within the current fiscal year.
The following table presents the fair value of all interest rate swap contracts held by the Fund as of June 30, 2014, the location of these instruments on the Statement of Assets and Liabilities and the primary underlying risk exposure.
| | | | | Location on the Statement of Assets and Liabilities | |
Underlying | | Derivative | | Asset Derivatives | | (Liability) Derivatives | |
Risk Exposure | | Instrument | | Location | | Value | | Location | | Value | |
Interest rate | | Swaps | | Unrealized appreciation on
interest rate swaps | | $ | 1,075,533 | | | Unrealized depreciation on
interest rate swaps | | $ | (583,687 | ) | |
The following table presents the swap contacts, that subject to netting agreements, and the collateral delivered related to those swap contracts as of June 30, 2014.
Counterparty | | Gross
Unrealized
Appreciation on
Interest Rate Swaps* | | Gross
Unrealized
(Depreciation) on
Interest Rate Swaps* | | Amounts
Netted on
Statement of
Assets and
Liabilities | | Net Unrealized
Appreciation
(Depreciation) on
Interest Rate Swaps | | Collateral
Pledged
to (from)
Counterparty | | Net
Exposure | |
JPMorgan | | $ | 1,075,533 | | | $ | — | | | $ | — | | | $ | 1,075,533 | | | $ | (1,075,533 | ) | | $ | — | | |
Morgan Stanley | | | — | | | | (583,687 | ) | | | — | | | | (583,687 | ) | | | 583,687 | | | | — | | |
Total | | $ | 1,075,533 | | | $ | (583,687 | ) | | $ | — | | | $ | 491,846 | | | $ | (491,846 | ) | | $ | — | | |
* Represents gross unrealized appreciation (depreciation) for the counterparty as reported in the Fund's Portfolio of Investments.
The following table presents the amount of net realized gain (loss) and change in net unrealized appreciation (depreciation) recognized on swap contracts on the Statement of Operations during the six months ended June 30, 2014, and the primary underlying risk exposure.
Underlying
Risk Exposure | | Derivative
Instrument | | Net Realized Gain (Loss) from
Swaps | | Change in Net Unrealized
Appreciation (Depreciation) of
Swaps | |
Interest rate | | Swaps | | $ | (240,610 | ) | | $ | (1,485,306 | ) | |
Options Transactions
The purchase of options involves the risk of loss of all or a part of the cash paid for the options (the premium). The market risk associated with purchasing options is limited to the premium paid. The counterparty credit risk of purchasing options, however, needs also to take into account the current value of the option, as this is the performance expected from the counterparty. When the Fund purchases an option, an amount equal to the premium paid (the premium plus commission) is recognized as a component of "Options purchased, at value" on the Statement of Assets and Liabilities. When the Fund writes an option, an amount equal to the net premium received (the premium less commission) is recognized as a component of "Options written, at value" on the Statement of Assets and Liabilities and is subsequently adjusted to reflect the current value of the written option until the option is exercised or expires or the Fund enters into a closing purchase transaction. The changes in the value of options purchased during the fiscal period are recognized as a component of "Change in net unrealized appreciation (depreciation) of options purchased" on the Statement of Operations. The
Nuveen Investments
49
Notes to Financial Statements (Unaudited) (continued)
changes in the value of options written during the fiscal period are recognized as a component of "Change in net unrealized appreciation (depreciation) of options written" on the Statement of Operations. When an option is exercised or expires or the Fund enters into a closing purchase transaction, the difference between the net premium received and any amount paid at expiration or on executing a closing purchase transaction, including commission, is recognized as a component of "Net realized gain (loss) from options purchased and/or written" on the Statement of Operations. The Fund, as a writer of an option, has no control over whether the underlying instrument may be sold (called) or purchased (put) and as a result bears the risk of an unfavorable change in the market value of the instrument underlying the written option. There is also the risk the Fund may not be able to enter into a closing transaction because of an illiquid market.
During the six months ended June 30, 2014, the Fund continued to wrote call options on individual stocks, while investing in those same stocks, to enhance returns while foregoing some upside potential.
The average notional amount of outstanding options contracts during the six months ended June 30, 2014, was as follows:
Average notional amount of outstanding options written* | | $ | (1,547,033 | ) | |
* The average notional amount is calculated based on the outstanding notional at the beginning of the fiscal year and at the end of each fiscal quarter within the current fiscal year.
The following table presents the fair value of all options written by the Fund as of June 30, 2014, the location of these instruments on the Statement of Assets and Liabilities and the primary underlying risk exposure.
| | | | | Location on the Statement of Assets and Liabilities | |
Underlying | | Derivative | | Asset Derivatives | | (Liability) Derivatives | |
Risk Exposure | | Instrument | | Location | | Value | | Location | | Value | |
Equity price | | Options | | | — | | | $ | — | | | Options written, at value | | $ | (24,601 | ) | |
The following table presents the amount of net realized gain (loss) and change in net unrealized appreciation (depreciation) recognized on options contracts on the Statement of Operations during the six months ended June 30, 2014, and the primary underlying risk exposure.
Underlying
Risk Exposure | | Derivative
Instrument | | Net Realized Gain (Loss) from
Options Written | | Change in Net Unrealized
Appreciation (Depreciation) of
Options Written | |
Equity price | | Options | | $ | 201,191 | | | $ | (9,047 | ) | |
Market and Counterparty Credit Risk
In the normal course of business the Fund may invest in financial instruments and enter into financial transactions where risk of potential loss exists due to changes in the market (market risk) or failure of the other party to the transaction to perform (counterparty credit risk). The potential loss could exceed the value of the financial assets recorded on the financial statements. Financial assets, which potentially expose the Fund to counterparty credit risk, consist principally of cash due from counterparties on forward, option and swap transactions, when applicable. The extent of the Fund's exposure to counterparty credit risk in respect to these financial assets approximates their carrying value as recorded on the Statement of Assets and Liabilities.
The Fund helps manage counterparty credit risk by entering into agreements only with counterparties the Adviser believes have the financial resources to honor their obligations and by having the Adviser monitor the financial stability of the counterparties. Additionally, counterparties may be required to pledge collateral daily (based on the daily valuation of the financial asset) on behalf of the Fund with a value approximately equal to the amount of any unrealized gain above a pre-determined threshold. Reciprocally, when the Fund has an unrealized loss, the Fund has instructed the custodian to pledge assets of the Fund as collateral with a value approximately equal to the amount of the unrealized loss above a pre-determined threshold. Collateral pledges are monitored and subsequently adjusted if and when the valuations fluctuate, either up or down, by at least the pre-determined threshold amount.
4. Fund Shares
Common Shares
Transactions in common shares were as follows:
| | | Six Months
Ended
6/30/14 | | Year
Ended
12/31/13 | |
Common shares: | |
Issued to shareholders due to reinvestment of distributions | | | — | | | | 4,114 | | |
Repurchased and retired | | | — | | | | (2,886 | ) | |
Weighted average: | |
Price per common share repurchased and retired | | $ | — | | | $ | 10.90 | | |
Discount per common share repurchased and retired | | | — | % | | | 13.77 | % | |
Nuveen Investments
50
5. Investment Transactions
Long-term purchases and sales (including maturities but excluding derivative transactions) during the six months ended June 30, 2014, aggregated $98,804,588 and $104,181,260, respectively.
Transactions in options written during the six months ended June 30, 2014, were as follows:
| | | Number of
Contracts | | Premiums
Received | |
Options outstanding, beginning of period | | | 400 | | | $ | 48,208 | | |
Options written | | | 3,674 | | | | 260,147 | | |
Options terminated in closing purchase transactions | | | (1,237 | ) | | | (96,820 | ) | |
Options exercised | | | (209 | ) | | | (15,359 | ) | |
Options expired | | | (1,933 | ) | | | (133,414 | ) | |
Options outstanding, end of period | | | 695 | | | $ | 62,762 | | |
6. Income Tax Information
The Fund intends to distribute substantially all of its investment company taxable income to shareholders and to otherwise comply with the requirements of Subchapter M of the Internal Revenue Code applicable to regulated investment companies. In any year when the Fund realizes net capital gains, the Fund may choose to distribute all or a portion of its net capital gains to shareholders, or alternatively, to retain all or a portion of its net capital gains and pay federal corporate income taxes on such retained gains.
For all open tax years and all major taxing jurisdictions, management of the Fund has concluded that there are no significant uncertain tax positions that would require recognition in the financial statements. Open tax years are those that are open for examination by taxing authorities (i.e., generally the last four tax year ends and the interim tax period since then). Furthermore, management of the Fund is also not aware of any tax positions for which it is reasonably possible that the total amounts of unrecognized tax benefits will significantly change in the next twelve months.
The following information is presented on an income tax basis. Differences between amounts for financial statement and federal income tax purposes are primarily due to recognition of premium amortization and timing differences in recognizing certain gains and losses on investment transactions. To the extent that differences arise that are permanent in nature, such amounts are reclassified within the capital accounts as detailed below. Temporary differences do not require reclassification. Temporary and permanent differences do not impact the NAV of the Fund.
As of June 30, 2014, the cost and unrealized appreciation (depreciation) of investments (excluding investments in derivatives), as determined on a federal income tax basis, were as follows:
Cost of investments | | $ | 341,853,268 | | |
Gross unrealized: | |
Appreciation | | $ | 62,853,917 | | |
Depreciation | | | (8,619,341 | ) | |
Net unrealized appreciation (depreciation) of investments | | $ | 54,234,576 | | |
Permanent differences, primarily due to bond premium amortization adjustments, treatment of notional principal contracts, foreign currency reclasses, tax basis earnings and profits adjustments and return of capital distributions, resulted in reclassifications among the Fund's components of common share net assets as of December 31, 2013, the Fund's last tax year-end, as follows:
Paid-in surplus | | $ | (11,497,967 | ) | |
Undistributed (Over-distribution of) net investment income | | | 11,451,247 | | |
Accumulated net realized gain (loss) | | | 46,720 | | |
The tax components of undistributed net ordinary income and net long-term capital gains as of December 31, 2013, the Fund's last tax year end, were as follows:
Undistributed net ordinary income | | $ | — | | |
Undistributed net long-term capital gains | | | — | | |
1 Net ordinary income consists of net taxable income derived from dividends, interest and current year earnings and profits attributable to realized gains.
The tax character of distributions paid during the Fund's last tax year ended December 31, 2013, was designated for purposes of the dividends paid deduction as follows:
Distributions from net ordinary income1 | | $ | 16,909,056 | | |
Distributions from net long-term capital gains | | | — | | |
Return of capital | | | 3,031,726 | | |
1 Net ordinary income consists of net taxable income derived from dividends, interest and current year earnings and profits attributable to realized gains.
Nuveen Investments
51
Notes to Financial Statements (Unaudited) (continued)
As of December 31, 2013, the Fund's last tax year end, the Fund had unused capital loss carryforwards available for federal income tax purposes to be applied against future capital gains, if any. If not applied, the carryforwards will expire as shown in the following table. The losses not subject to expiration will be utilized first by the Fund.
Expiration: | |
December 31, 2017 | | $ | 24,657,663 | | |
Not subject to expiration: | | | — | | |
Total | | $ | 24,657,663 | | |
During the Fund's last tax year ended December 31, 2013, the Fund utilized $8,466,983 of its capital loss carryforwards.
The Fund has elected to defer late-year losses in accordance with federal income tax rules. These losses are treated as having arisen on the first day of the current fiscal year. The Fund has elected to defer losses as follows:
Post-October capital losses2 | | $ | 113,534 | | |
Late-year ordinary losses3 | | | — | | |
2 Capital losses incurred from November 1, 2013 through December 31, 2013, the Fund's last tax year end.
3 Specified losses incurred from November 1, 2013 through December 31, 2013.
7. Management Fees and Other Transactions with Affiliates
The Fund's management fee compensates the Adviser for overall investment advisory and administrative services and general office facilities. The Sub-Advisers are compensated for their services to the Fund from the management fees paid to the Adviser.
The Fund's management fee consists of two components – a fund-level fee, based only on the amount of assets within the Fund, and a complex-level fee, based on the aggregate amount of all eligible fund assets managed by the Adviser. This pricing structure enables Fund shareholders to benefit from growth in the assets within the Fund as well as from growth in the amount of complex-wide assets managed by the Adviser.
The annual fund-level fee, payable monthly, is calculated according to the following schedule:
Average Daily Managed Assets* | | Fund-Level Fee Rate | |
For the first $500 million | | | .7000 | % | |
For the next $500 million | | | .6750 | | |
For the next $500 million | | | .6500 | | |
For the next $500 million | | | .6250 | | |
For managed assets over $2 billion | | | .6000 | | |
The annual complex-level fee, payable monthly, is calculated according to the following schedule:
Complex-Level Managed Asset Breakpoint Level* | | Effective Rate at Breakpoint Level | |
| $55 billion | | | .2000 | % | |
| $56 billion | | | .1996 | | |
| $57 billion | | | .1989 | | |
| $60 billion | | | .1961 | | |
| $63 billion | | | .1931 | | |
| $66 billion | | | .1900 | | |
| $71 billion | | | .1851 | | |
| $76 billion | | | .1806 | | |
| $80 billion | | | .1773 | | |
| $91 billion | | | .1691 | | |
| $125 billion | | | .1599 | | |
| $200 billion | | | .1505 | | |
| $250 billion | | | .1469 | | |
| $300 billion | | | .1445 | | |
* For the fund-level and complex-level fees, managed assets include closed-end fund assets managed by the Adviser that are attributable to certain types of leverage. For these purposes, leverage includes the funds' use of preferred stock and borrowings and certain investments in the residual interest certificates (also called inverse floating rate securities) in tender option bond (TOB) trusts, including the portion of assets held by a TOB trust that has been effectively financed by the trust's issuance of floating rate securities, subject to an agreement by the Adviser as to certain funds to limit the amount of such assets for determining managed assets in certain circumstances. The complex-level fee is calculated based upon the aggregate daily managed assets of all Nuveen Funds that constitute "eligible assets." Eligible assets do not include assets attributable to investments in other Nuveen Funds or assets in excess of $2 billion added to the Nuveen Fund complex in connection with the Adviser's assumption of the management of the former First American Funds effective January 1, 2011. As of June 30, 2014, the complex-level fee rate for the Fund was .1653%.
The Fund pays no compensation directly to those of its trustees who are affiliated with the Adviser or to its officers, all of whom receive remuneration for their services to the Fund from the Adviser or its affiliates. The Board of Trustees has adopted a deferred compensation plan for independent trustees that enables trustees to elect to defer receipt of all or a portion of the annual compensation they are entitled to receive from certain Nuveen-advised funds. Under the plan, deferred amounts are treated as though equal dollar amounts had been invested in shares of select Nuveen-advised funds.
Nuveen Investments
52
8. Senior Loan Commitments
Unfunded Commitments
Pursuant to the terms of certain of the variable rate senior loan agreements, the Fund may have unfunded senior loan commitments. The Fund will maintain with its custodian, cash, liquid securities and/or liquid senior loans having an aggregate value at least equal to the amount of unfunded senior loan commitments. As of June 30, 2014, the Fund had no unfunded senior loan commitments.
Participation Commitments
With respect to the senior loans held in the Fund's portfolio, the Fund may: 1) invest in assignments; 2) act as a participant in primary lending syndicates; or 3) invest in participations. If the Fund purchases a participation of a senior loan interest, the Fund would typically enter into a contractual agreement with the lender or other third party selling the participation, rather than directly with the borrower. As such, the Fund not only assumes the credit risk of the borrower, but also that of the selling participant or other persons interpositioned between the Fund and the borrower. As of June 30, 2014, the Fund had no such outstanding participation commitments.
9. Borrowing Arrangements
The Fund has entered into borrowing arrangements ("Borrowings") as a means of leverage.
The Fund has entered into a $125 million (maximum commitment amount) senior committed secured 364-day revolving line of credit, renewable annually, with its custodian bank. As of June 30, 2014, the outstanding balance on these Borrowings was $116 million. During the six months ended June 30, 2014, the average daily balance outstanding and average annual interest rate on these Borrowings were $116 million and .88%, respectively.
Interest is charged on Borrowings outstanding balance at a rate per annum equal to the higher of (a) the overnight LIBOR (London Inter-Bank Offered Rate) rate plus .75% or (b) the Federal Funds rate plus .75%. In addition to interest expense, the Fund accrues a per annum commitment fee and a .05% per annum facility fee based on the total maximum commitment amount of the Borrowings through the renewal date.
On May 23, 2014, the Fund renewed these Borrowings with its custodian bank through May 22, 2015. The Fund accrues a .10% per annum commitment fee and also accrues a one-time .05% upfront fee based on the maximum commitment amount of the Borrowings through the renewal date.
In order to maintain these Borrowings, the Fund must meet certain collateral, asset coverage and other requirements. Borrowings outstanding are fully secured by securities held in the Fund's portfolio of investments.
Borrowings outstanding are recognized as "Borrowings" on the Statement of Assets and Liabilities. Interest and other fees incurred on these Borrowings are recognized as a component of "Interest expense on borrowings" on the Statement of Operations.
10. New Accounting Pronouncement
Financial Accounting Standards Board ("FASB") Financial Services – Investment Companies (Topic 946): Amendments to the Scope, Measurement, and Disclosure Requirements
During 2013, the FASB issued Accounting Standards Update ("ASU") 2013-08, "Financial Services – Investment Companies (Topic 946): Amendments to the Scope, Measurement, and Disclosure Requirements," which amends the criteria that define an investment company and clarifies the measurement guidance and requires new disclosures for investment companies. ASU 2013-08 is effective for fiscal years beginning on or after December 15, 2013. Management has evaluated the implications of ASU 2013-08 and determined that the Fund's current disclosures already followed this guidance and therefore it does not have an impact on the Fund's financial statements or footnote disclosures.
11. Subsequent Event
As previously described in Note 1 – General Information and Significant Accounting Policies, Agreement and Plan of Merger, the new investment management agreements and the new sub-advisory agreements have been approved by shareholders of the Fund.
The transaction is currently expected to close early in the fourth quarter of 2014, but remains subject to customary closing conditions.
Investment Policy Changes
During August 2014, the Fund's Board of Trustees approved changes to the Fund's investment policies, which are primarily intended to update and clarify the investment parameters used to manage the global equity income portion of the Fund sub-advised by NWQ. The clarifications and changes to the Fund's investment policies that apply to the Fund as a whole, and that apply only to the global equity income strategy portion of the Fund are detailed below. The policy changes will be effective September 1, 2014.
Nuveen Investments
53
Notes to Financial Statements (Unaudited) (continued)
The following summarizes the clarifications and changes that apply at the overall Fund level:
• Provide greater flexibility to invest (up to 60% of the Fund's managed assets) in non-US issues of any currency;
• Clarify that at least 80% of the Fund's managed assets will be invested in income producing or dividend paying securities;
• Clarify the Fund's use of options for hedging purposes and expand the flexibility for the Fund to write (sell) covered puts and call options for enhancing risk-adjusted returns; and
• Clarify that the Fund's policies regarding credit ratings do not apply to the global equity income and real estate securities strategy portions of the Fund.
The following summarizes the clarifications and changes that apply only to the global equity income strategy portion of the Fund:
• Provide that at least 65% of the global equity income strategy will be invested in income-producing or dividend-paying securities;
• Provide that a maximum of 20% of the global equity income strategy may be invested in emerging market issuers;
• Provide that a maximum of 20% of the global equity income strategy may be invested in convertible securities;
• Provide that a maximum of 20% of the global equity income strategy may be invested in preferred securities;
• Provide that a maximum of 20% of the global equity income strategy may be invested in debt: and
• Clarify that at least 80% of the global equity income strategy will be invested in equity security holdings that may include common stocks, preferred stocks, convertible securities, common and preferred securities issued by master limited partnerships (MLPs) and REITS of U.S. and non-U.S. issuers.
Nuveen Investments
54
Additional
Fund Information
Board of Trustees
William Adams IV* | | Robert P. Bremner | | Jack B. Evans | | William C. Hunter | | David J. Kundert | | John K. Nelson | |
William J. Schneider | | Thomas S. Schreier, Jr.* | | Judith M. Stockdale | | Carole E. Stone | | Virginia L. Stringer | | Terence J. Toth | |
* Interested Board Member.
Fund Manager
Nuveen Fund Advisors, LLC
333 West Wacker Drive
Chicago, IL 60606 | | Custodian
State Street Bank & Trust Company
Boston, MA 02111 | | Legal Counsel
Chapman and Cutler LLP
Chicago, IL 60603 | | Independent* Registered
Public Accounting Firm
KPMG LLP
Chicago, IL 60601 | | Transfer Agent and
Shareholder Services
State Street Bank & Trust Company
Nuveen Funds
P.O. Box 43071
Providence,
RI 02940-3071
(800) 257-8787 | |
* The Board of Trustees of the Fund, upon recommendation of the Audit Committee, engaged KPMG LLP as the Fund's independent registered public accounting firm as of August 7, 2014. On August 11, 2014, Ernst & Young LLP ("Ernst & Young") resigned as the independent registered public accounting firm of the Fund.
Ernst & Young's report on the Fund's financial statements for the period ended December 31, 2013, contained no adverse opinion or disclaimer of opinion, and was not qualified or modified as to uncertainty, audit scope or accounting principles. For the period ended December 31, 2013, there were no disagreements with Ernst & Young on any matter of accounting principles, financial statement disclosure or auditing scope or procedures, which disagreements, if not resolved to the satisfaction of Ernst & Young, would have caused it to make reference to the subject matter of the disagreements in connection with its report on the Fund's financial statements.
Quarterly Form N-Q Portfolio of Investments Information
The Fund is required to file its complete schedule of portfolio holdings with the Securities and Exchange Commission (SEC) for the first and third quarters of each fiscal year on Form N-Q. You may obtain this information directly from the SEC. Visit the SEC on-line at http://www.sec.gov or in person at the SEC's Public Reference Room in Washington, D.C. Call the SEC toll-free at (800) SEC -0330 for room hours and operation.
Nuveen Funds' Proxy Voting Information
You may obtain (i) information regarding how each fund voted proxies relating to portfolio securities held during the most recent twelve-month period ended June 30, without charge, upon request, by calling Nuveen Investments toll-free at (800) 257-8787 or on Nuveen's website at www.nuveen.com and (ii) a description of the policies and procedures that each fund used to determine how to vote proxies relating to portfolio securities without charge, upon request, by calling Nuveen Investments toll free at (800) 257-8787. You may also obtain this information directly from the SEC. Visit the SEC on-line at http://www.sec.gov.
CEO Certification Disclosure
The Fund's Chief Executive Officer (CEO) has submitted to the New York Stock Exchange (NYSE) the annual CEO certification as required by Section 303A.12(a) of the NYSE Listed Company Manual.
The Fund has filed with the SEC the certification of its CEO and Chief Financial Officer required by Section 302 of the Sarbanes-Oxley Act.
Common Share Information
The Fund intends to repurchase shares of its own common stock at such times and in such amounts as is deemed advisable. During the period covered by this report, the Fund repurchased shares of its common stock as shown in the accompanying table.
| | | JDD | |
Common shares repurchased | | | – | | |
Any future repurchases will be reported to shareholders in the next annual or semi-annual report.
Nuveen Investments
55
Annual Fund Information (continued)
FINRA BrokerCheck
The Financial Industry Regulatory Authority (FINRA) provides information regarding the disciplinary history of FINRA member firms and associated investment professionals. This information as well as an investor brochure describing FINRA BrokerCheck is available to the public by calling the FINRA BrokerCheck Hotline number at (800) 289-9999 or by visiting www.FINRA.org.
Nuveen Investments
56
Glossary of Terms
Used in this Report
n Average Annual Total Return: This is a commonly used method to express an investment's performance over a particular, usually multi-year time period. It expresses the return that would have been necessary each year to equal the investment's actual cumulative performance (including change in NAV or market price and reinvested dividends and capital gains distributions, if any) over the time period being considered.
n Beta: A measure of the variability of the change in the share price for a fund in relation to a change in the value of the fund's market benchmark. Securities with betas higher than 1.0 have been, and are expected to be, more volatile than the benchmark; securities with betas lower than 1.0 have been, and are expected to be, less volatile than the benchmark.
n Blended Index (Comparative Benchmark): The performance is a blended return consisting of: 1) 18.75% of the return of the Russell 3000 Value Index, which measures the performance of those Russell 3000 Index companies with lower price-to book ratios and lower forecasted growth values, 2) 6.25% of the return of the Morgan Stanley Capital International Europe Australasia and Far East (MSCI EAFE) ex-Japan Value Index, a capitalization weighted index that selects the lower 50% of the price-to-book ranked value stocks traded in the developed markets of Europe, Asia and the Far East, excluding Japan, 3) 25% of the return of the Wilshire U.S. Real Estate Securities Index, an unmanaged, market capitalization-weighted index comprised of publicly traded REITs and real estate companies, 4) 25% of the return of the JPMorgan Emerging Markets Bond Index (EMBI) Global Diversified, which tracks total returns for U.S.-dollar-denominated debt instruments issued by emerging markets sovereign and quasi-sovereign entities, and 5) 25% of the return of the Credit Suisse First Boston (CSFB) Leveraged Loan Index, which consists of approximately $150 billion of tradable term loans with at least one year to maturity and rated BBB or lower. Index returns assume reinvestment of dividends, but do not include the effects of any applicable sales charges or management fees.
n Collateralized Loan Obligation (CLO): A security backed by a pool of debt, often low rated corporate loans. Collateralized loan obligations (CLOs) are similar to collateralized mortgage obligations, except for the different type of underlying loan.
n Dow Jones Industrial Average: A price-weighted index of the 30 largest, most widely held stocks traded on the New York Stock Exchange. The index returns assume reinvestment of distributions, but do not reflect any applicable sales charges or management fees.
n Effective Leverage: Effective leverage is a fund's effective economic leverage, and includes both regulatory leverage (see below) and the leverage effects of certain derivative investments in the fund's portfolio.
n Gross Domestic Product (GDP): The total market value of all final goods and services produced in a country/region in a given year, equal to total consumer, investment and government spending, plus the value of exports, minus the value of imports.
n JPMorgan Corporate Emerging Markets Bond Index (CEMBI): A global, liquid corporate emerging markets benchmark that tracks U.S.-denominated corporate bonds issued by emerging markets entities. The index returns assume reinvestment of distributions, but do not reflect any applicable sales charges or management fees.
n JPMorgan Government Bond Index-Emerging Markets (GBI-EM): A comprehensive emerging market debt benchmark that tracks local currency bonds issued by Emerging Market governments. The index returns assume reinvestment of distributions, but do not reflect any applicable sales charges or management fees.
n Leverage: Leverage is created whenever a fund has investment exposure (both reward and/or risk) equivalent to more than 100% of the investment capital.
Nuveen Investments
57
Glossary of Terms Used in this Report (continued)
n Net Asset Value (NAV) Per Share: A fund's Net Assets is equal to its total assets (securities, cash, accrued earnings and receivables) less its total liabilities. NAV per share is equal to the fund's Net Assets divided by its number of shares outstanding.
n Regulatory Leverage: Regulatory leverage consists of preferred shares issued by or borrowings of the fund. Both of these are part of the fund's capital structure. Regulatory leverage is subject to asset coverage limits set in the Investment Company Act of 1940.
n Russell 2000® Index: An index that measures the performance of the small-cap segment of the U.S. equity universe. The Russell 2000 Index is a subset of the Russell 3000® Index representing approximately 10% of the total market capitalization of that index. It includes approximately 2,000 of the smallest securities based on a combination of their market cap and current index membership. The index returns assume reinvestment of distributions, but do not reflect any applicable sales charges or management fees.
n S&P 500® Index: An unmanaged Index generally considered representative of the U.S. stock market. Index returns assume reinvestment of distributions, but do not reflect of any applicable sales charges or management fees.
Nuveen Investments
58
Reinvest Automatically,
Easily and Conveniently
Nuveen makes reinvesting easy. A phone call is all it takes to set up your reinvestment account.
Nuveen Closed-End Funds Automatic Reinvestment Plan
Your Nuveen Closed-End Fund allows you to conveniently reinvest distributions in additional Fund shares.
By choosing to reinvest, you'll be able to invest money regularly and automatically, and watch your investment grow through the power of compounding. Just like distributions in cash, there may be times when income or capital gains taxes may be payable on distributions that are reinvested.
It is important to note that an automatic reinvestment plan does not ensure a profit, nor does it protect you against loss in a declining market.
Easy and convenient
To make recordkeeping easy and convenient, each quarter you'll receive a statement showing your total distributions, the date of investment, the shares acquired and the price per share, and the total number of shares you own.
How shares are purchased
The shares you acquire by reinvesting will either be purchased on the open market or newly issued by the Fund. If the shares are trading at or above net asset value at the time of valuation, the Fund will issue new shares at the greater of the net asset value or 95% of the then-current market price. If the shares are trading at less than net asset value, shares for your account will be purchased on the open market. If the Plan Agent begins purchasing Fund shares on the open market while shares are trading below net asset value, but the Fund's shares subsequently trade at or above their net asset value before the Plan Agent is able to complete its purchases, the Plan Agent may cease open-market purchases and may invest the uninvested portion of the distribution in newly-issued Fund shares at a price equal to the greater of the shares' net asset value or 95% of the shares' market value on the last business day immediately prior to the purchase date. Distributions received to purchase shares in the open market will normally be invested shortly after the distribution payment date. No interest will be paid on distributions awaiting reinvestment. Because the market price of the shares may increase before purchases are completed, the average purchase price per share may exceed the market price at the time of valuation, resulting in the acquisition of fewer shares than if the distribution had been paid in shares issued by the Fund. A pro rata portion of any applicable brokerage commissions on open market purchases will be paid by Plan participants. These commissions usually will be lower than those charged on individual transactions.
Flexible
You may change your distribution option or withdraw from the Plan at any time, should your needs or situation change.
You can reinvest whether your shares are registered in your name, or in the name of a brokerage firm, bank, or other nominee. Ask your investment advisor if his or her firm will participate on your behalf. Participants whose shares are registered in the name of one firm may not be able to transfer the shares to another firm and continue to participate in the Plan.
The Fund reserves the right to amend or terminate the Plan at any time. Although the Fund reserves the right to amend the Plan to include a service charge payable by the participants, there is no direct service charge to participants in the Plan at this time.
Call today to start reinvesting distributions
For more information on the Nuveen Automatic Reinvestment Plan or to enroll in or withdraw from the Plan, speak with your financial advisor or call us at (800) 257-8787.
Nuveen Investments
59
Annual Investment
Management Agreement Approval Process (Unaudited)
I. The Approval Process
The Board of Trustees of the Fund (the "Board" and each Trustee, a "Board Member"), including the Board Members who are not parties to the Fund's advisory or sub-advisory agreements or "interested persons" of any such parties (the "Independent Board Members"), is responsible for overseeing the performance of the investment adviser and the sub-advisers to the Fund and determining whether to approve or continue the Fund's advisory agreement (the "Original Investment Management Agreement") between the Fund and Nuveen Fund Advisors, LLC (the "Adviser") and sub-advisory agreements (each, an "Original Sub-Advisory Agreement" and, together with the Original Investment Management Agreement, the "Original Advisory Agreements") between (a) the Adviser and Wellington Management Company, LLP ("Wellington"), (b) the Adviser and NWQ Investment Management Company, LLC ("NWQ"), (c) the Adviser and Symphony Asset Management LLC ("Symphony") and (d) the Adviser and Security Capital Research & Management Incorporated ("Security Capital" and, together with Wellington, NWQ and Symphony, the "Sub-Advisers"). Pursuant to the Investment Company Act of 1940, as amended (the "1940 Act"), the Board is required to consider the continuation of the respective Original Advisory Agreements on an annual basis. In addition, prior to its annual review, the Board Members were advised of the potential acquisition of Nuveen Investments, Inc. ("Nuveen") by TIAA-CREF (the "Transaction"). For purposes of this section, references to "Nuveen" herein include all affiliates of Nuveen Investments, Inc. providing advisory, sub-advisory, distribution or other services to the Nuveen funds. In accordance with the 1940 Act and the terms of the Original Advisory Agreements, the completion of the Transaction would terminate the Original Investment Management Agreement and each of the Original Sub-Advisory Agreements. Accordingly, at an in-person meeting held on April 30, 2014 (the "April Meeting"), the Board, including all of the Independent Board Members, performed its annual review of the Original Advisory Agreements and approved the continuation of the Original Advisory Agreements for the Fund. Furthermore, in anticipation of the termination of the Original Advisory Agreements that would occur upon the consummation of the Transaction, the Board also approved a new advisory agreement (the "New Investment Management Agreement") between the Fund and the Adviser and new sub-advisory agreements (each, a "New Sub-Advisory Agreement" and, together with the New Investment Management Agreement, the "New Advisory Agreements") between (a) the Adviser and Wellington, (b) the Adviser and NWQ, (c) the Adviser and Symphony and (d) the Adviser and Security Capital, each on behalf of the Fund to be effective following the completion of the Transaction and the receipt of the requisite shareholder approval.
Leading up to the April Meeting, the Independent Board Members had several meetings and deliberations, with and without management from Nuveen present and with the advice of legal counsel, regarding the Original Advisory Agreements, the Transaction and its impact and the New Advisory Agreements. At its meeting held on February 25-27, 2014 (the "February Meeting"), the Board Members met with a senior executive representative of TIAA-CREF to discuss the proposed Transaction. At the February Meeting, the Independent Board Members also established an ad hoc committee comprised solely of the Independent Board Members to monitor and evaluate the Transaction and to keep the Independent Board Members updated with developments regarding the Transaction. On March 20, 2014, the ad hoc committee met telephonically to discuss with management of Nuveen, and separately with independent legal counsel, the terms of the proposed Transaction and its impact on, among other things: the governance structure of Nuveen; the strategic plans for Nuveen; the operations of the Nuveen funds (which include the Fund); the quality or level of services provided to the Nuveen funds; key personnel that service the Nuveen funds and/or the Board and the
Nuveen Investments
60
compensation or incentive arrangements to retain such personnel; Nuveen's capital structure; the regulatory requirements applicable to Nuveen or fund operations; and the Nuveen funds' fees and expenses, including the funds' complex-wide fee arrangement. Following the meeting of the ad hoc committee, the Board met in person (two Independent Board Members participating telephonically) in an executive session on March 26, 2014 to further discuss the proposed Transaction. At the executive session, the Board met privately with independent legal counsel to review its duties with respect to reviewing advisory agreements, particularly in the context of a change of control, and to evaluate further the Transaction and its impact on the Nuveen funds, the Adviser and the Sub-Advisers (collectively, the "Fund Advisers" and each, a "Fund Adviser") and the services provided. Representatives of Nuveen also met with the Board to update the Board Members on developments regarding the Transaction, to respond to questions and to discuss, among other things: the governance of the Adviser and the affiliated sub-advisers following the Transaction; the background, culture (including with respect to regulatory and compliance matters) and resources of TIAA-CREF; the general plans and intentions of TIAA-CREF for Nuveen; the terms and conditions of the Transaction (including financing terms); any benefits or detriments the Transaction may impose on the Nuveen funds, TIAA-CREF or the Fund Advisers; the reaction from the employees of the Adviser and the affiliated sub-advisers knowledgeable of the Transaction; the incentive and retention plans for key personnel of the Adviser and the affiliated sub-advisers; the potential access to additional distribution platforms and economies of scale; and the impact of any additional regulatory schemes that may be applicable to the Nuveen funds given the banking and insurance businesses operated in the TIAA-CREF enterprise. As part of its review, the Board also held a separate meeting on April 15-16, 2014 to review the Nuveen funds' investment performance and consider an analysis provided by the Adviser of each sub-adviser of the Nuveen funds (including the Sub-Advisers) and the Transaction and its implications to the Nuveen funds. During their review of the materials and discussions, the Independent Board Members presented the Adviser with questions and the Adviser responded. Further, the Independent Board Members met in an executive session with independent legal counsel on April 29, 2014 and April 30, 2014.
In connection with their review of the Original Advisory Agreements and the New Advisory Agreements, the Independent Board Members received extensive information regarding the Fund and the Fund Advisers including, among other things: the nature, extent and quality of services provided by each Fund Adviser; the organization and operations of any Fund Adviser; the expertise and background of relevant personnel of each Fund Adviser; a review of the Fund's performance (including performance comparisons against the performance of its peer group and appropriate benchmarks); a comparison of Fund fees and expenses relative to peers; a description and assessment of shareholder service levels for the Fund; a summary of the performance of certain service providers; a review of fund initiatives and shareholder communications; and an analysis of the Adviser's profitability with comparisons to peers in the managed fund business. In light of the proposed Transaction, the Independent Board Members, through their independent legal counsel, also requested in writing and received additional information regarding the proposed Transaction and its impact on the provision of services by the Fund Advisers.
The Independent Board Members received, well in advance of the April Meeting, materials which responded to the request for information regarding the Transaction and its impact on Nuveen and the Nuveen funds including, among other things: the structure and terms of the Transaction; the impact of the Transaction on Nuveen, its operations and the nature, quality and level of services provided to the Nuveen funds, including, in particular, any changes to those services that the Nuveen funds may experience following the Transaction; the strategic plan for Nuveen, including any financing arrangements following the Transaction and any cost-cutting efforts that may impact services; the organizational structure of TIAA-CREF, including the governance structure of Nuveen following the Transaction; any anticipated effect on each Nuveen fund's expense ratios (including changes to advisory and sub-advisory fees) and economies of scale that may be expected; any benefits or conflicts of interest that TIAA-CREF, Nuveen or their affiliates can expect from the Transaction; any benefits or undue burdens or other negative implications that may be imposed on the Nuveen funds as a result of the Transaction; the impact on Nuveen or the Nuveen funds as a result of being subject to additional regulatory
Nuveen Investments
61
Annual Investment Management Agreement Approval Process (Unaudited) (continued)
schemes that TIAA-CREF must comply with in operating its various businesses; and the costs associated with obtaining necessary shareholder approvals and the bearer of such costs. The Independent Board Members also received a memorandum describing the applicable laws, regulations and duties in approving advisory contracts, including in conjunction with a change of control, from their independent legal counsel.
The materials and information prepared in connection with the review of the Original Advisory Agreements and New Advisory Agreements supplemented the information and analysis provided to the Board during the year. In this regard, throughout the year, the Board, acting directly or through its committees, regularly reviewed the performance and various services provided by the Adviser and the Sub-Advisers. The Board met at least quarterly as well as at other times as the need arose. At its quarterly meetings, the Board reviewed reports by the Adviser regarding, among other things, fund performance, fund expenses, premium and discount levels of closed-end funds, the performance of the investment teams and compliance, regulatory and risk management matters. In addition to regular reports, the Adviser provided special reports to the Board or a committee thereof from time to time to enhance the Board's understanding of various topics that impact some or all the Nuveen funds (such as distribution channels, oversight of omnibus accounts and leverage management topics), to update the Board on regulatory developments impacting the investment company industry or to update the Board on the business plans or other matters impacting the Adviser. The Board also met with key investment personnel managing certain Nuveen fund portfolios during the year.
In addition, the Board has created several standing committees (the Executive Committee; the Dividend Committee; the Audit Committee; the Compliance, Risk Management and Regulatory Oversight Committee; the Nominating and Governance Committee; the Open-End Funds Committee; and the Closed-End Funds Committee). The Open-End Funds Committee and Closed-End Funds Committee are intended to assist the full Board in monitoring and gaining a deeper insight into the distinctive business practices of closed-end and open-end funds. These two Committees have met prior to each quarterly Board meeting, and the Adviser provided presentations to these Committees permitting them to delve further into specific matters or initiatives impacting the respective product line.
Further, the Board continued its program of seeking to have the Board Members or a subset thereof visit each sub-adviser to the Nuveen funds and meet key investment and business personnel at least once over a multiple year rotation. In this regard, the Independent Board Members made a site visit to certain teams of NWQ in October 2013.
The Board considered the information provided and knowledge gained at these meetings and visits during the year when performing its annual review of the Original Advisory Agreements and its review of the New Advisory Agreements. The Independent Board Members also were assisted throughout the process by independent legal counsel. During the course of the year and during their deliberations regarding the review of advisory contracts, the Independent Board Members met with independent legal counsel in executive sessions without management present. In addition, it is important to recognize that the management arrangements for the funds are the result of many years of review and discussion between the Independent Board Members and Nuveen fund management and that the Board Members' conclusions may be based, in part, on their consideration of fee arrangements and other factors developed in previous years.
The Board considered all factors it believed relevant with respect to the Fund, including, among other things: (a) the nature, extent and quality of the services provided by the Fund Advisers, (b) the investment performance of the Fund and the Fund Advisers, (c) the advisory fees and costs of the services to be provided to the Fund and the profitability of the Fund Advisers, (d) the extent of any economies of scale, (e) any benefits derived by the Fund Advisers from the relationship with the Fund and (f) other factors. With respect to the New Advisory Agreements, the Board also considered the Transaction and its impact on the foregoing factors. Each Board Member may have accorded different weight to the various factors in reaching his or her conclusions with respect to the Original Advisory Agreements and New Advisory Agreements. The Independent Board Members did not identify any single factor as
Nuveen Investments
62
all-important or controlling. The Independent Board Members' considerations were instead based on a comprehensive consideration of all the information presented. The principal factors considered by the Board and its conclusions are described below.
A. Nature, Extent and Quality of Services
1. The Original Advisory Agreements
In considering renewal of each Original Advisory Agreement, the Independent Board Members considered the nature, extent and quality of the respective Fund Adviser's services, including portfolio management services (and the resulting Fund performance) and administrative services. The Independent Board Members further considered the overall reputation and capabilities of the Adviser and its affiliates, the commitment of the Adviser to provide high quality service to the Fund, their overall confidence in the capability and integrity of the Adviser and its staff and the Adviser's responsiveness to questions and concerns raised by them. The Independent Board Members reviewed materials outlining, among other things: each Fund Adviser's organization and business; the types of services that each Fund Adviser or its affiliates provide to the Fund; the performance record of the Fund (as described in further detail below); and any initiatives Nuveen had taken for the closed-end fund product line.
In considering the services provided by the Fund Advisers, the Board recognized that the Adviser provides a myriad of investment management, administrative, compliance, oversight and other services for the Fund, and the Sub-Advisers generally provide the portfolio advisory services to the Fund under the oversight of the Adviser. The Board considered the wide range of services provided by the Adviser to the Nuveen funds beginning with developing the fund and monitoring and analyzing its performance to providing or overseeing the services necessary to support a fund's daily operations. The Board recognized the Adviser, among other things, provides: (a) product management (such as analyzing ways to better position a fund in the marketplace, maintaining relationships to gain access to distribution platforms and setting dividends); (b) fund administration (such as preparing a fund's tax returns, regulatory filings and shareholder communications; managing fund budgets and expenses; overseeing a fund's various service providers; and supporting and analyzing new and existing funds); (c) Board administration (such as supporting the Board and its committees, in relevant part, by organizing and administering the Board and committee meetings and preparing the necessary reports to assist the Board in its duties); (d) compliance (such as monitoring adherence to a fund's investment policies and procedures and applicable law; reviewing the compliance program periodically and developing new policies or updating existing compliance policies and procedures as considered necessary or appropriate; responding to regulatory requests; and overseeing compliance testing of sub-advisers); (e) legal support (such as preparing or reviewing fund registration statements, proxy statements and other necessary materials; interpreting regulatory requirements and compliance thereof; and maintaining applicable registrations); and (f) investment services (such as overseeing and reviewing sub-advisers and their investment teams; analyzing performance of the funds; overseeing investment and risk management; overseeing the daily valuation process for portfolio securities and developing and recommending valuation policies and methodologies and changes thereto; and participating in fund development, leverage management and the development of investment policies and parameters). With respect to closed-end funds, the Adviser also monitors asset coverage levels on leveraged funds, manages leverage, negotiates the terms of leverage, evaluates alternative forms and types of leverage, promotes an orderly secondary market for common shares and maintains an asset maintenance system for compliance with certain rating agency criteria.
In its review, the Board also considered the new services, initiatives or other changes adopted since the last advisory contract review that were designed to enhance the services and support the Adviser provides to the Nuveen funds. The Board recognized that some initiatives are a multi-year process. In reviewing the activities of 2013, the Board recognized that the year reflected the Adviser's continued focus on fund rationalization for both closed-end and open-end funds, consolidating certain
Nuveen Investments
63
Annual Investment Management Agreement Approval Process (Unaudited) (continued)
funds through mergers that were designed to improve efficiencies and economies of scale for shareholders, repositioning various funds through updates in their investment policies and guidelines with the expectation of bringing greater value to shareholders, and liquidating certain funds. As in the past, the Board recognized the Adviser's significant investment in its technology initiatives, including the continued progress toward a central repository for fund and other Nuveen product data and implementing a data system to support the risk oversight group enabling it to provide more detailed risk analysis for the Nuveen funds. The Board noted the new data system has permitted more in-depth analysis of the investment risks of the Fund and across the complex providing additional feedback and insights to the investment teams and more comprehensive risk reporting to the Board. The Adviser also conducted several workshops for the Board regarding the new data system, including explaining the risk measures being applied and their purpose. The Board also recognized the enhancements in the valuation group within the Adviser, including centralizing the fund pricing process within the valuation group, trending to more automated and expedient reviews and continuing to expand its valuation team. The Board further considered the expansion of personnel in the compliance department enhancing the collective expertise of the group, investments in additional compliance systems and the updates of various compliance policies.
In addition to the foregoing actions, the Board also considered other initiatives related to the closed-end funds, including the continued investment of considerable resources and personnel dedicated to managing and overseeing the various forms of leverage utilized by certain funds. The Board recognized the results of these efforts included the development of less expensive forms of leverage, expansion of leverage providers, the negotiation of more favorable terms for existing leverage, the enhanced ability to respond to market and regulatory developments and the enhancements to technology systems to manage and track the various forms of leverage. The Board also noted Nuveen's continued capital management services, including executing share repurchase programs, its implementation of data systems that permit more targeted solicitation strategies for fund mergers and more targeted marketing and promotional efforts and its continued focus and efforts to address the discounts of various funds. The Board further noted Nuveen's continued commitment to supporting the secondary market for the common shares of its closed-end funds through a comprehensive communication program designed to further educate the investor and analyst about closed-end funds. Nuveen's support services included, among other things, maintaining and enhancing a closed-end fund website, creating marketing campaigns and educational materials, communicating with financial advisers, sponsoring and participating in conferences, providing educational seminars and programs and evaluating the results of these marketing efforts.
As noted, the Adviser also oversees the Sub-Advisers who provide the portfolio advisory services to the Fund. In reviewing the portfolio advisory services provided to the Fund, the Nuveen Investment Services Oversight Team of the Adviser analyzes the performance of the Sub-Advisers and may recommend changes to the investment teams or investment strategies as appropriate. In assisting the Board's review of the Sub-Advisers, the Adviser provides a report analyzing, among other things, each Sub-Adviser's investment team and changes thereto, organization and history, assets under management, the investment team's philosophy and strategies in managing the Fund, developments affecting the Sub-Adviser or the Fund and Fund performance (or the portion of the Fund's portfolio allocated to the respective Sub-Adviser). In their review of the Sub-Advisers, the Independent Board Members considered, among other things, the experience and qualifications of the relevant investment personnel, their investment philosophy and strategies, each Sub-Adviser's organization and stability, its capabilities and any initiatives taken or planned to enhance its current capabilities or support potential growth of business and, as outlined in further detail below, the performance of the Fund. The Independent Board Members also reviewed portfolio manager compensation arrangements to evaluate each Fund Adviser's ability to attract and retain high quality investment personnel, preserve stability, and reward performance while not providing an inappropriate incentive to take undue risks.
Nuveen Investments
64
Given the importance of compliance, the Independent Board Members also considered Nuveen's compliance program, including the report of the chief compliance officer regarding the Nuveen funds' compliance policies and procedures; the resources dedicated to compliance; the record of compliance with the policies and procedures; and Nuveen's supervision of the Fund's service providers. The Board recognized Nuveen's commitment to compliance and strong commitment to a culture of compliance. Given the Adviser's emphasis on monitoring investment risk, the Board has also appointed two Independent Board Members as point persons to review and keep the Board apprised of developments in this area and work with applicable Fund Adviser personnel.
Based on their review, the Independent Board Members found that, overall, the nature, extent and quality of services provided to the Fund under each respective Original Advisory Agreement were satisfactory.
2. The New Advisory Agreements
In evaluating the nature, quality and extent of the services expected to be provided by the Fund Advisers under the New Investment Management Agreement and the New Sub-Advisory Agreements, the Board Members concluded that no diminution in the nature, quality and extent of services provided to the Fund and its shareholders by the respective Fund Advisers is expected as a result of the Transaction. In making their determination, the Independent Board Members considered, among other things: the expected impact, if any, of the Transaction on the operations, facilities, organization and personnel of each Fund Adviser; the ability of each Fund Adviser to perform its duties after the Transaction, including any changes to the level or quality of services provided to the Fund; the potential implications of any additional regulatory requirements imposed on the Fund Advisers or the Nuveen funds following the Transaction; and any anticipated changes to the investment and other practices of the Nuveen funds.
The Board noted that the terms of the New Investment Management Agreement, including the fees payable thereunder, are substantially identical to those of the Original Investment Management Agreement. Similarly, the terms of the New Sub-Advisory Agreements, including fees payable thereunder, are substantially identical to those of the corresponding Original Sub-Advisory Agreements. The Board considered that the services to be provided and the standard of care under the New Investment Management Agreement and the New Sub-Advisory Agreements are the same as the corresponding original agreements. The Board Members noted the Transaction also does not alter the allocation of responsibilities between the Adviser and the Sub-Advisers. Each Sub-Adviser will continue to furnish an investment program in respect of, make investment decisions for and place all orders for the purchase and sale of securities for the portion of the Fund's investment portfolio allocated by the Adviser to the respective Sub-Adviser, all on behalf of the Fund and subject to oversight of the Board and the Adviser. The Board noted that TIAA-CREF did not anticipate any material changes to the advisory, sub-advisory or other services provided to the Nuveen funds as a result of the Transaction. The Independent Board Members recognized that there were not any planned "cost cutting" measures that could be expected to reduce the nature, extent or quality of services. The Independent Board Members further noted that there were currently no plans for material changes to senior personnel at Nuveen or key personnel who provide services to the Nuveen funds and the Board following the Transaction. The key personnel who have responsibility for the Nuveen funds in each area, including portfolio management, investment oversight, fund management, fund operations, product management, legal/compliance and board support functions, are expected to be the same following the Transaction, although such personnel may have additional reporting requirements to TIAA-CREF. The Board also considered the anticipated incentive plans designed to retain such key personnel. Notwithstanding the foregoing, the Board Members recognized that personnel changes may occur in the future as a result of normal business developments or personal career decisions.
The Board Members also considered Nuveen's proposed governance structure following the Transaction and noted that Nuveen was expected to remain a stand-alone business within the TIAA-CREF enterprise and operate relatively autonomously from the other TIAA-CREF businesses, but would receive the general support and oversight from certain TIAA-CREF functional
Nuveen Investments
65
Annual Investment Management Agreement Approval Process (Unaudited) (continued)
groups (such as legal, finance, internal audit, compliance, and risk management groups). The Board recognized, however, that Nuveen may be subject to additional reporting requirements as it keeps TIAA-CREF abreast of developments affecting the Nuveen business, may be required to modify certain of its reports, policies and procedures as necessary to conform to the practices followed in the TIAA-CREF enterprise and may need to collaborate with TIAA-CREF with respect to strategic planning for its business.
In considering the implications of the Transaction, the Board Members also recognized the reputation and size of TIAA-CREF and the benefits that the Transaction may bring to the Nuveen funds and Nuveen. In this regard, the Board recognized, among other things, that the increased resources and support that may be available to Nuveen from TIAA-CREF and the improved capital structure of Nuveen Investments, Inc. (the parent of the Adviser) that would result from the significant reduction in its debt level may reinforce and enhance Nuveen's ability to provide quality services to the Nuveen funds and to invest further into its infrastructure.
Further, with the consummation of the Transaction, the Board recognized the enhanced distribution capabilities for the Nuveen funds as the funds may gain access to TIAA-CREF's distribution network, particularly through TIAA-CREF's retirement platform and institutional client base. The Board also considered that investors in TIAA-CREF's retirement platform may choose to roll their investments as they exit their retirement plans into the Nuveen funds. The Independent Board Members recognized the potential cost savings to the benefit of all shareholders of the Nuveen funds from reduced expenses as assets in the Nuveen fund complex rise pursuant to the complex-wide fee arrangement described in further detail below.
Based on their review, the Independent Board Members found that the expected nature, extent and quality of services to be provided to the Fund under its New Advisory Agreements were satisfactory and supported approval of the New Advisory Agreements.
B. The Investment Performance of the Fund and Fund Advisers
1. The Original Advisory Agreements
The Board, including the Independent Board Members, considered the performance history of the Fund over various time periods. The Board reviewed reports, including an analysis of the Fund's performance and its investment teams. In considering the Fund's performance, the Board recognized that a fund's performance can be reviewed through various measures including the fund's absolute return, the fund's return compared to the performance of other peer funds and the fund's performance compared to its benchmark. Accordingly, the Board reviewed, among other things, the Fund's historic investment performance as well as information comparing the Fund's performance information with that of other funds (the "Performance Peer Group") and with recognized and/or customized benchmarks (i.e., generally benchmarks derived from multiple recognized benchmarks) for the quarter, one-, three- and five-year periods ending December 31, 2013, as well as performance information reflecting the first quarter of 2014. The Independent Board Members also reviewed, among other things, the returns of each sleeve of the Fund relative to the benchmark of such sleeve for the quarter, one-, three- and five-year periods ending December 31, 2013, as well as performance information reflecting the first quarter of 2014. With respect to closed-end funds, the Independent Board Members also reviewed historic premium and discount levels, including a summary of actions taken to address or discuss other developments affecting the secondary market discounts of various funds. This information supplemented the Nuveen fund performance information provided to the Board at each of its quarterly meetings.
In evaluating performance, the Board recognized several factors that may impact the performance data as well as the consideration given to particular performance data.
Nuveen Investments
66
• The performance data reflects a snapshot in time, in this case as of the end of the most recent calendar year or quarter. A different performance period, however, could generate significantly different results.
• Long-term performance can be adversely affected by even one period of significant underperformance so that a single investment decision or theme has the ability to disproportionately affect long-term performance.
• The investment experience of a particular shareholder in a fund will vary depending on when such shareholder invests in such fund, the class held (if multiple classes offered in the fund) and the performance of the fund (or respective class) during that shareholder's investment period.
• The usefulness of comparative performance data as a frame of reference to measure a fund's performance may be limited because the Performance Peer Group, among other things, does not adequately reflect the objectives and strategies of the fund, has a different investable universe, or the composition of the peer set may be limited in size or number as well as other factors. In this regard, the Board noted that the Adviser classified the Performance Peer Groups of the Nuveen funds from highly relevant to less relevant. Funds classified with less relevant Performance Peer Groups include the Fund. For these funds, the Board considered a fund's performance compared to its benchmark to help assess the fund's comparative performance. A fund was generally considered to have performed comparably to its benchmark if the fund's performance was within certain thresholds compared to the performance of its benchmark and was considered to have outperformed or underperformed its benchmark if the fund's performance was beyond these thresholds for the one- and three-year periods, subject to certain exceptions.i While the Board is cognizant of the relative performance of a fund's peer set and/or benchmark(s), the Board evaluated fund performance in light of the respective fund's investment objectives, investment parameters and guidelines and considered that the variations between the objectives and investment parameters or guidelines of the fund with its peers and/or benchmarks result in differences in performance results. Further, for funds that utilize leverage, the Board understands that leverage during different periods can provide both benefits and risks to a portfolio as compared to an unlevered benchmark.
With respect to any Nuveen funds for which the Board has identified performance concerns, the Board monitors such funds closely until performance improves, discusses with the Adviser the reasons for such results, considers those steps necessary or appropriate to address such issues and reviews the results of any efforts undertaken. The Board is aware, however, that shareholders chose to invest or remain invested in a fund knowing that the Adviser manages the fund and knowing the fund's fee structure.
In considering the performance data, the Board noted that the Fund's Performance Peer Group was classified as less relevant as noted above and, as such, the Board considered the Fund's performance compared to its benchmark. In this regard, the Board noted that the Fund outperformed its benchmark over the one-, three- and five-year periods.
Based on their review, the Independent Board Members determined that the Fund's investment performance had been satisfactory.
2. The New Advisory Agreements
With respect to the performance of the Fund, the Board considered that the portfolio investment personnel responsible for the management of the Fund's portfolio were expected to continue to manage the portfolio following the completion of the Transaction and the investment strategies of the Fund were not expected to change as a result of the Transaction (subject to
i The Board recognized that the Adviser considered a fund to have outperformed or underperformed its benchmark if the fund's performance was higher or lower than the performance of the benchmark by the following thresholds: for open-end funds (+/- 100 basis points for equity funds excluding index funds; +/- 30 basis points for tax exempt fixed income funds; +/- 40 basis points for taxable fixed income funds) and for closed-end funds (assuming 30% leverage) (+/- 130 basis points for equity funds excluding index funds; +/- 39 basis points for tax exempt funds and +/- 52 basis points for taxable fixed income funds).
Nuveen Investments
67
Annual Investment Management Agreement Approval Process (Unaudited) (continued)
changes unrelated to the Transaction that are approved by the Board and/or shareholders). Accordingly, the findings regarding performance outlined above for the Original Advisory Agreements are applicable to the review of the New Advisory Agreements.
C. Fees, Expenses and Profitability
1. Fees and Expenses
The Board evaluated the management fees and expenses of the Fund, reviewing, among other things, the Fund's gross management fees, net management fees and net expense ratios in absolute terms as well as compared to the fees and expenses of a comparable universe of funds provided by an independent fund data provider (the "Peer Universe") and any expense limitations.
The Independent Board Members further reviewed the methodology regarding the construction of the applicable Peer Universe. In reviewing the comparisons of fee and expense information, the Independent Board Members took into account that in certain instances various factors such as the limited size and particular composition of the Peer Universe (including the inclusion of other Nuveen funds in the peer set); expense anomalies; changes in the funds comprising the Peer Universe from year to year; levels of reimbursement or fee waivers; the timing of information used; and the differences in the type and use of leverage may impact the comparative data thereby limiting somewhat the ability to make a meaningful comparison with peers.
In reviewing the fee schedule for a fund, the Independent Board Members also considered the fund-level and complex-wide breakpoint schedules (described in further detail below) and any fee waivers and reimbursements provided by Nuveen. In reviewing fees and expenses (excluding leverage costs and leveraged assets for the closed-end funds), the Board considered the expenses and fees to be higher if they were over 10 basis points higher, slightly higher if they were approximately 6 to 10 basis points higher, in line if they were within approximately 5 basis points higher than the peer average and below if they were below the peer average of the Peer Universe. In reviewing the reports, the Board noted that the majority of the Nuveen funds were at, close to or below their peer average based on the net total expense ratio. The Independent Board Members observed that the Fund had a net management fee and net expense ratio (including fee waivers and expense reimbursements) higher than the respective peer averages. The Board noted the factors that contributed to the Fund's higher relative expense ratio, including that such was generally due to the differences between the Fund and its peers limiting some of the usefulness of the comparison.
Based on their review of the fee and expense information provided, the Independent Board Members determined that the Fund's management fees (as applicable) to a Fund Adviser were reasonable in light of the nature, extent and quality of services provided to the Fund.
2. Comparisons with the Fees of Other Clients
The Board recognized that all Nuveen funds have one or more sub-advisers, either affiliated and/or non-affiliated, and therefore the overall fund management fee can be divided into two components, the fee retained by the Adviser and the fee paid to the sub-adviser(s). In general terms, the fee to the Adviser reflects the administrative and other services it provides to support the Nuveen fund (as described above) and, while some administrative services may occur at the sub-adviser level, the fee to the sub-adviser(s) generally reflects the portfolio management services provided by the sub-adviser(s). The Independent Board Members considered the fees a Fund Adviser assesses to the Fund compared to that of other clients. With respect to non-municipal funds, such other clients of the Adviser and/or its affiliated sub-advisers may include: separately managed accounts (both retail and institutional accounts), hedge funds, foreign investment funds offered by Nuveen, collective trust funds and funds that are not offered by Nuveen but are sub-advised by one of Nuveen's investment management teams.
Nuveen Investments
68
The Independent Board Members reviewed the nature of services provided by the Adviser, including through its affiliated sub-advisers and the average fee the affiliated sub-advisers assessed such clients as well as the range of fees assessed to the different types of separately managed accounts (such as retail, institutional or wrap accounts) to the extent applicable to the respective sub-adviser. With respect to Symphony, the Independent Board Members also noted that it also advises equity and taxable fixed-income hedge funds and reviewed the average fee and fee range assessed such funds as well as the performance fee. In their review, the Independent Board Members considered the differences in the product types, including, but not limited to: the services provided, the structure and operations, product distribution and costs thereof, portfolio investment policies, investor profiles, account sizes and regulatory requirements. In evaluating the comparisons of fees, the Independent Board Members noted that the fee rates charged to the Nuveen funds and other clients vary, among other things, because of the different services involved and the additional regulatory and compliance requirements associated with registered investment companies, such as the Fund. The Independent Board Members noted that, as a general matter, higher fee levels reflect higher levels of service, increased investment management complexity, greater product management requirements and higher levels of risk or a combination of the foregoing. The Independent Board Members further noted, in particular, that the range of services provided to the Fund (as discussed above) is generally much more extensive than that provided to separately managed accounts. Many of the additional administrative services provided by the Adviser are not required for institutional clients. The Independent Board Members also recognized that the management fee rates of the foreign funds advised by the Adviser may vary due to, among other things, differences in the client base, governing bodies, operational complexities and services covered by the management fee. Given the inherent differences in the various products, particularly the extensive services provided to the Fund, the Independent Board Members believe such facts justify the different levels of fees.
With respect to Security Capital, the Independent Board Members also considered the pricing schedule or fees that it charges for other clients. The Independent Board Members noted that the fees paid to Security Capital for its sub-advisory services were generally consistent with its average fees. With respect to Wellington, the Independent Board Members considered its profitability margins for its advisory activities with respect to the applicable funds. The Independent Board Members also noted that the fees paid to the Sub-Advisers unaffiliated with Nuveen were the result of arm's-length negotiations.
3. Profitability of Fund Advisers
In conjunction with their review of fees, the Independent Board Members also considered the profitability of Nuveen for its advisory activities and its financial condition. The Independent Board Members reviewed the revenues and expenses of Nuveen's advisory activities for the last two calendar years, the allocation methodology used in preparing the profitability data, an analysis of the key drivers behind the changes in revenues and expenses that impacted profitability in 2013 and Nuveen's consolidated financial statements for 2013. The Independent Board Members noted this information supplemented the profitability information requested and received during the year to help keep them apprised of developments affecting profitability (such as changes in fee waivers and expense reimbursement commitments). In this regard, the Independent Board Members noted that two Independent Board Members served as point persons to review the profitability analysis and methodologies employed, and any changes thereto, and to keep the Board apprised of such changes. The Independent Board Members also considered Nuveen's revenues for advisory activities, expenses and profit margin compared to that of various unaffiliated management firms.
In reviewing profitability, the Independent Board Members noted the Adviser's continued investment in its business with expenditures to, among other things, upgrade its investment technology and compliance systems and provide for additional personnel and other resources. The Independent Board Members recognized the Adviser's continued commitment to its business should enhance the Adviser's capacity and capabilities in providing the services necessary to meet the needs of the Nuveen funds as they grow or change over time. In addition, in evaluating profitability, the Independent Board Members also
Nuveen Investments
69
Annual Investment Management Agreement Approval Process (Unaudited) (continued)
noted the subjective nature of determining profitability which may be affected by numerous factors including the allocation of expenses and that various allocation methodologies may each be reasonable but yield different results. Further, the Independent Board Members recognized the difficulties in making comparisons as the profitability of other advisers generally is not publicly available, and the profitability information that is available for certain advisers or management firms may not be representative of the industry and may be affected by, among other things, an adviser's particular business mix, capital costs, size, types of funds managed and expense allocations. Notwithstanding the foregoing, the Independent Board Members noted the Adviser's adjusted operating margin appears to be reasonable in relation to other investment advisers and sufficient to operate as a viable investment management firm meeting its obligations to the Nuveen funds. Based on their review, the Independent Board Members concluded that the Adviser's level of profitability for its advisory activities was reasonable in light of the services provided.
With respect to sub-advisers affiliated with Nuveen, including NWQ and Symphony, the Independent Board Members reviewed each such sub-adviser's revenues, expenses and profitability margins (pre- and post-tax) for its advisory activities and the methodology used for allocating expenses among the internal sub-advisers. In addition, with respect to sub-advisers unaffiliated with Nuveen, including Wellington and Security Capital, the Independent Board Members also considered such sub-advisers' revenues, expenses and profitability margins for their advisory activities with the applicable funds. Based on their review, the Independent Board Members were satisfied that each Fund Adviser's level of profitability was reasonable in light of the services provided.
In evaluating the reasonableness of the compensation, the Independent Board Members also considered other amounts paid to a Fund Adviser by the funds as well as indirect benefits (such as soft dollar arrangements), if any, the Fund Adviser and its affiliates receive or are expected to receive that are directly attributable to the management of a Nuveen fund. See Section E below for additional information on indirect benefits the Fund Advisers may receive as a result of its relationship with a Nuveen fund. Based on their review of the overall fee arrangements of the Fund, the Independent Board Members determined that the advisory fees and expenses of the Fund were reasonable.
4. The New Advisory Agreements
As noted above, the terms of the New Advisory Agreements are substantially identical to their corresponding Original Advisory Agreements. The fee schedule, including the breakpoint schedule and complex-wide fee schedule, in each New Advisory Agreement is identical to that under the corresponding Original Advisory Agreement. The Board Members also noted that Nuveen has committed for a period of two years from the date of closing the Transaction not to increase contractual management fee rates for any Nuveen fund. This commitment shall not limit or otherwise affect mergers or liquidations of any funds in the ordinary course. Based on the information provided, the Board Members did not believe that the overall expenses would increase as a result of the Transaction. In addition, the Board Members recognized that the Nuveen funds may gain access to the retirement platform and institutional client base of TIAA-CREF, and the investors in the retirement platforms may roll their investments into one or more Nuveen funds as they exit their retirement plans. The enhanced distribution access may result in additional sales of the Nuveen funds resulting in an increase in total assets under management in the complex and a corresponding decrease in overall management fees if additional breakpoints at the fund-level or complex-wide level are met. Based on its review, the Board determined that the management fees and expenses under each New Advisory Agreement were reasonable.
Further, other than from a potential reduction in the debt level of Nuveen Investments, Inc., the Board recognized that it is difficult to predict with any degree of certainty the impact of the Transaction on Nuveen's profitability. Given the fee schedule was not expected to change under the New Advisory Agreements, however, the Independent Board Members concluded that each
Nuveen Investments
70
Fund Adviser's level of profitability for its advisory activities under the respective New Advisory Agreements would continue to be reasonable in light of the services provided.
D. Economies of Scale and Whether Fee Levels Reflect These Economies of Scale
1. The Original Advisory Agreements
With respect to economies of scale, the Independent Board Members have recognized the potential benefits resulting from the costs of a fund being spread over a larger asset base, although economies of scale are difficult to measure and predict with precision, particularly on a fund-by-fund basis. One method to help ensure the shareholders share in these benefits is to include breakpoints in the advisory fee schedule. Generally, management fees for funds in the Nuveen complex are comprised of a fund-level component and a complex-level component, subject to certain exceptions. Accordingly, the Independent Board Members reviewed and considered the applicable fund-level breakpoints in the advisory fee schedules that reduce advisory fees as asset levels increase. Further, the Independent Board Members noted that, although closed-end funds may from time-to-time make additional share offerings, the growth of their assets would occur primarily through the appreciation of such funds' investment portfolios.
In addition to fund-level advisory fee breakpoints, the Board also considered the Nuveen funds' complex-wide fee arrangement. Pursuant to the complex-wide fee arrangement, the fees of the funds in the Nuveen complex are reduced as the assets in the fund complex reach certain levels. The complex-wide fee arrangement seeks to provide the benefits of economies of scale to fund shareholders when total fund complex assets increase, even if assets of a particular fund are unchanged or have decreased. The approach reflects the notion that some of Nuveen's costs are attributable to services provided to all its funds in the complex and therefore all funds benefit if these costs are spread over a larger asset base.
Based on their review, the Independent Board Members concluded that the breakpoint schedules and complex-wide fee arrangement (as applicable) were acceptable and reflect economies of scale to be shared with shareholders when assets under management increase.
2. The New Advisory Agreements
As noted, the Independent Board Members recognized that the fund-level and complex-wide schedules will not change under the New Advisory Agreements. Assets in the funds advised by TIAA-CREF or its current affiliates will not be included in the complex-wide fee calculation. Nevertheless, the Nuveen funds may have access to TIAA-CREF's retirement platform and institutional client base. The access to this distribution network may enhance the distribution of the Nuveen funds which, in turn, may lead to reductions in management and sub-advisory fees if the Nuveen funds reach additional fund-level and complex-wide breakpoint levels. Based on their review, including the considerations in the annual review of the Original Advisory Agreements, the Independent Board Members determined that the fund-level breakpoint schedules and complex-wide fee schedule continue to be appropriate and desirable in ensuring that shareholders participate in the benefits derived from economies of scale under the New Advisory Agreements.
E. Indirect Benefits
1. The Original Advisory Agreements
In evaluating fees, the Independent Board Members received and considered information regarding potential "fall out" or ancillary benefits the respective Fund Adviser or its affiliates may receive as a result of its relationship with the Fund. In this regard, with respect to closed-end funds, the Independent Board Members considered any revenues received by affiliates of the Adviser for serving as co-manager in initial public offerings of new closed-end funds as well as revenues received in connection with secondary offerings.
Nuveen Investments
71
Annual Investment Management Agreement Approval Process (Unaudited) (continued)
In addition to the above, the Independent Board Members considered whether the Fund Advisers received any benefits from soft dollar arrangements whereby a portion of the commissions paid by a fund for brokerage may be used to acquire research that may be useful to a Fund Adviser in managing the assets of the fund and other clients. The Fund's portfolio transactions are allocated by the Sub-Advisers. Accordingly, with respect to NWQ, Security Capital and Symphony, the Independent Board Members considered that each such Sub-Adviser may benefit from its respective soft dollar arrangements pursuant to which it receives research from brokers that execute the Fund's portfolio transactions. With respect to any fixed income securities, however, the Board recognized that such securities generally trade on a principal basis that does not generate soft dollar credits. Similarly, the Board recognized that the research received pursuant to soft dollar arrangements by a Sub-Adviser may also benefit the Fund and its shareholders to the extent the research enhances the ability of the Sub-Adviser to manage the Fund. For the Sub-Advisers with soft dollar arrangements, the Independent Board Members noted that such Sub-Advisers' profitability may be somewhat lower if they did not receive the research services pursuant to the soft dollar arrangements and had to acquire such services directly. With respect to Wellington, the Independent Board Members noted that it only executes principal trades on behalf of the Nuveen funds and therefore has not engaged in soft dollar transactions on behalf of the Fund.
Based on their review, the Independent Board Members concluded that any indirect benefits received by a Fund Adviser as a result of its relationship with the Fund were reasonable and within acceptable parameters.
2. The New Advisory Agreements
The Independent Board Members noted that, as the applicable policies and operations of the Fund Advisers with respect to the Nuveen funds were not anticipated to change significantly after the Transaction, such indirect benefits should remain after the Transaction. The Independent Board Members further noted the benefits the Transaction would provide to TIAA-CREF and Nuveen, including a larger-scale fund complex, certain shared services (noted above) and a broader range of investment capabilities, distribution capabilities and product line. Further, the Independent Board Members noted that Nuveen Investments, Inc. (the parent of the Adviser) would benefit from an improved capital structure through a reduction in its debt level.
F. Other Considerations for the New Advisory Agreements
In addition to the factors above, the Board Members also considered the following with respect to the Nuveen funds:
• Nuveen would rely on the provisions of Section 15(f) of the 1940 Act. In this regard, to help ensure that an unfair burden is not imposed on the Nuveen funds, Nuveen has committed for a period of two years from the date of the closing of the Transaction not to increase contractual management fee rates for any fund. This commitment shall not limit or otherwise affect mergers or liquidations of any funds in the ordinary course.
• The Nuveen funds would not incur any costs in seeking the necessary shareholder approvals for the new investment management agreements or the new sub-advisory agreements (except for any costs attributed to seeking shareholder approvals of fund specific matters unrelated to the Transaction, such as election of Board Members or changes to investment policies, in which case a portion of such costs will be borne by the applicable funds).
• The reputation, financial strength and resources of TIAA-CREF.
• The long-term investment philosophy of TIAA-CREF and anticipated plans to grow Nuveen's business to the benefit of the Nuveen funds.
• The benefits to the Nuveen funds as a result of the Transaction including: (i) increased resources and support available to Nuveen as well as an improved capital structure that may reinforce and enhance the quality and level of services it provides to the funds; (ii) potential additional distribution capabilities for the funds to access new markets and customer segments
Nuveen Investments
72
through TIAA-CREF's distribution network, including, in particular, its retirement platforms and institutional client base; and (iii) access to TIAA-CREF's expertise and investment capabilities in additional asset classes.
G. Other Considerations
The Independent Board Members did not identify any single factor discussed previously as all-important or controlling. The Board Members, including the Independent Board Members, unanimously concluded that the terms of each Original Advisory Agreement and New Advisory Agreement are fair and reasonable, that the respective Fund Adviser's fees are reasonable in light of the services provided to the Fund and that the Original Advisory Agreements be renewed and the New Advisory Agreements be approved.
II. Approval of Interim Advisory Agreements
At the April Meeting, the Board Members, including the Independent Board Members, unanimously approved an interim advisory agreement (the "Interim Investment Management Agreement") between the Fund and the Adviser and interim sub-advisory agreements (each, an "Interim Sub-Advisory Agreement") between (a) the Adviser and Wellington, (b) the Adviser and NWQ, (c) the Adviser and Symphony and (d) the Adviser and Security Capital. If necessary to assure continuity of advisory services, the Interim Investment Management Agreement and the Interim Sub-Advisory Agreements will take effect upon the closing of the Transaction if shareholders have not yet approved the New Investment Management Agreement or the corresponding New Sub-Advisory Agreements, respectively. The terms of the Interim Investment Management Agreement and each of the Interim Sub-Advisory Agreements are substantially identical to those of the Original Investment Management Agreement and New Investment Management Agreement and the corresponding Original Sub-Advisory Agreements and New Sub-Advisory Agreements, respectively, except for certain term and fee escrow provisions. In light of the foregoing, the Board Members, including the Independent Board Members, unanimously determined that the scope and quality of services to be provided to the Fund under the Interim Investment Management Agreement and the Interim Sub-Advisory Agreements are at least equivalent to the scope and quality of services provided under the Original Investment Management Agreement and the corresponding Original Sub-Advisory Agreements, respectively.
Nuveen Investments
73

Nuveen Investments:
Serving Investors for Generations
Since 1898, financial advisors and their clients have relied on Nuveen Investments to provide dependable investment solutions through continued adherence to proven, long-term investing principles. Today, we offer a range of high quality equity and fixed-income solutions designed to be integral components of a well-diversified core portfolio.
Focused on meeting investor needs.
Nuveen Investments provides high-quality investment services designed to help secure the long-term goals of institutional and individual investors as well as the consultants and financial advisors who serve them. Nuveen Investments markets a wide range of specialized investment solutions which provide investors access to capabilities of its high-quality boutique investment affiliates—Nuveen Asset Management, Symphony Asset Management, NWQ Investment Management Company, Santa Barbara Asset Management, Tradewinds Global Investors, Winslow Capital Management and Gresham Investment Management. In total, Nuveen Investments managed approximately $231 billion as of June 30, 2014.
Find out how we can help you.
To learn more about how the products and services of Nuveen Investments may be able to help you meet your financial goals, talk to your financial advisor, or call us at (800) 257-8787. Please read the information provided carefully before you invest. Investors should consider the investment objective and policies, risk considerations, charges and expenses of any investment carefully. Where applicable, be sure to obtain a prospectus, which contains this and other relevant information. To obtain a prospectus, please contact your securities representative or Nuveen Investments, 333 W. Wacker Dr., Chicago, IL 60606. Please read the prospectus carefully before you invest or send money.
Learn more about Nuveen Funds at: www.nuveen.com/cef
Distributed by Nuveen Securities, LLC | 333 West Wacker Drive | Chicago, IL 60606 | www.nuveen.com/cef
ESA-B-0614D 2837-INV-B08/15
ITEM 2. CODE OF ETHICS.
Not applicable to this filing.
ITEM 3. AUDIT COMMITTEE FINANCIAL EXPERT.
Not applicable to this filing.
ITEM 4. PRINCIPAL ACCOUNTANT FEES AND SERVICES.
Not applicable to this filing.
ITEM 5. AUDIT COMMITTEE OF LISTED REGISTRANTS.
Not applicable to this filing.
ITEM 6. SCHEDULE OF INVESTMENTS.
(a) See Portfolio of Investments in Item 1.
(b) Not applicable.
ITEM 7. DISCLOSURE OF PROXY VOTING POLICIES AND PROCEDURES FOR CLOSED-END MANAGEMENT INVESTMENT COMPANIES.
Not applicable to this filing.
ITEM 8. PORTFOLIO MANAGERS OF CLOSED-END MANAGEMENT INVESTMENT COMPANIES.
Not applicable to this filing.
ITEM 9. PURCHASES OF EQUITY SECURITIES BY CLOSED-END MANAGEMENT INVESTMENT COMPANY AND AFFILIATED PURCHASERS.
Not applicable.
ITEM 10. SUBMISSION OF MATTERS TO A VOTE OF SECURITY HOLDERS.
There have been no material changes to the procedures by which shareholders may recommend nominees to the registrant’s Board implemented after the registrant last provided disclosure in response to this Item.
ITEM 11. CONTROLS AND PROCEDURES.
(a) The registrant’s principal executive and principal financial officers, or persons performing similar functions, have concluded that the registrant’s disclosure controls and procedures (as defined in Rule 30a-3(c) under the Investment Company Act of 1940, as amended (the “1940 Act”) (17 CFR 270.30a-3(c))) are effective, as of a date within 90 days of the filing date of this report that includes the disclosure required by this paragraph, based on their evaluation of the controls and procedures required by Rule 30a-3(b) under the 1940 Act (17 CFR 270.30a-3(b)) and Rules 13a-15(b) or 15d-15(b) under the Securities Exchange Act of 1934, as amended (the “Exchange Act”)(17 CFR 240.13a-15(b) or 240.15d-15(b)).
(b) There were no changes in the registrant’s internal control over financial reporting (as defined in Rule 30a-3(d) under the 1940 Act (17 CFR 270.30a-3(d)) that occurred during the second fiscal quarter of the period covered by this report that has materially affected, or is reasonably likely to materially affect, the registrant’s internal control over financial reporting.
ITEM 12. EXHIBITS.
File the exhibits listed below as part of this Form.
(a)(1) Any code of ethics, or amendment thereto, that is the subject of the disclosure required by Item 2, to the extent that the registrant intends to satisfy the Item 2 requirements through filing of an exhibit: Not applicable to this filing.
(a)(2) A separate certification for each principal executive officer and principal financial officer of the registrant as required by Rule 30a-2(a) under the 1940 Act (17 CFR 270.30a-2(a)) in the exact form set forth below: See Ex-99.CERT attached hereto.
(a)(3) Any written solicitation to purchase securities under Rule 23c-1 under the 1940 Act (17 CFR 270.23c-1) sent or given during the period covered by the report by or on behalf of the registrant to 10 or more persons: Not applicable.
(b) If the report is filed under Section 13(a) or 15(d) of the Exchange Act, provide the certifications required by Rule 30a-2(b) under the 1940 Act (17 CFR 270.30a-2(b)); Rule 13a-14(b) or Rule 15d-14(b) under the Exchange Act (17 CFR 240.13a-14(b) or 240.15d-14(b)), and Section 1350 of Chapter 63 of Title 18 of the United States Code (18 U.S.C. 1350) as an exhibit. A certification furnished pursuant to this paragraph will not be deemed “filed” for purposes of Section 18 of the Exchange Act (15 U.S.C. 78r), or otherwise subject to the liability of that section. Such certification will not be deemed to be incorporated by reference into any filing under the Securities Act of 1933 or the Exchange Act, except to the extent that the registrant specifically incorporates it by reference: See Ex-99.906 CERT attached hereto.
SIGNATURES
Pursuant to the requirements of the Securities Exchange Act of 1934 and the Investment Company Act of 1940, the registrant has duly caused this report to be signed on its behalf by the undersigned, thereunto duly authorized.
(Registrant) Nuveen Diversified Dividend and Income Fund
By (Signature and Title) | /s/ Kevin J. McCarthy | |
| Kevin J. McCarthy | |
| (Vice President and Secretary) | |
Date: September 5, 2014
Pursuant to the requirements of the Securities Exchange Act of 1934 and the Investment Company Act of 1940, this report has been signed below by the following persons on behalf of the registrant and in the capacities and on the dates indicated.
By (Signature and Title) | /s/ Gifford R. Zimmerman | |
| Gifford R. Zimmerman | |
| Chief Administrative Officer | |
| (principal executive officer) | |
Date: September 5, 2014
By (Signature and Title) | /s/ Stephen D. Foy | |
| Stephen D. Foy | |
| Vice President and Controller | |
| (principal financial officer) | |
Date: September 5, 2014