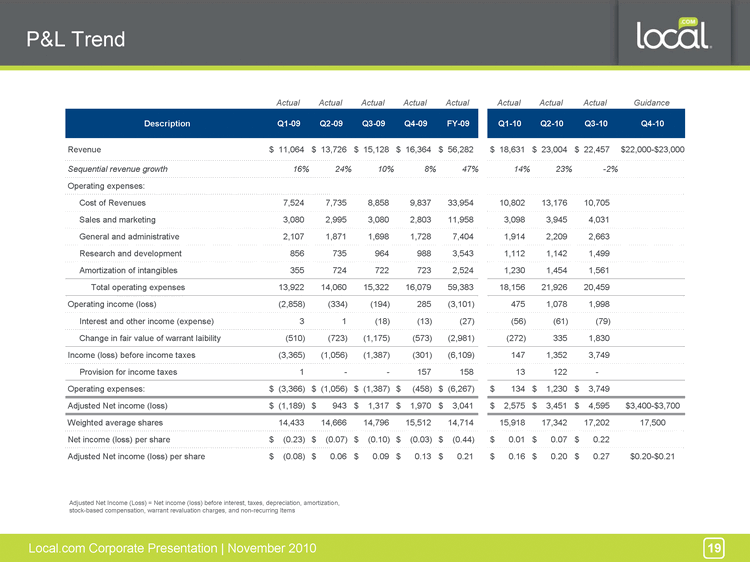
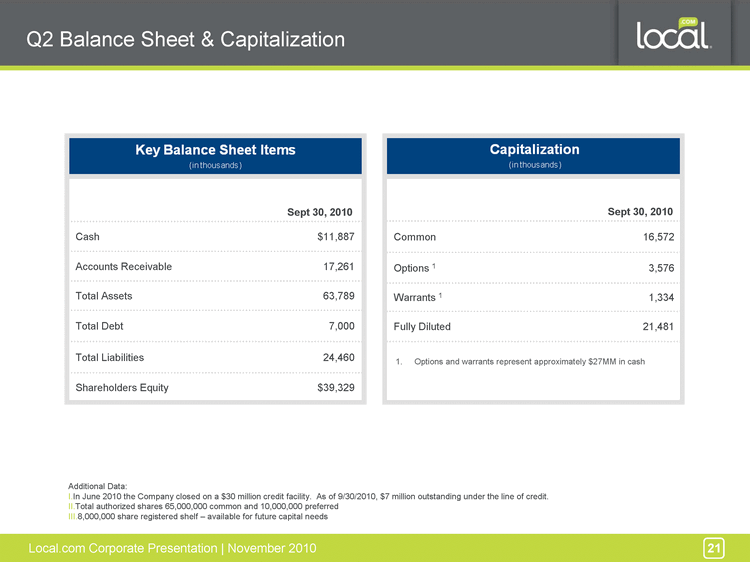
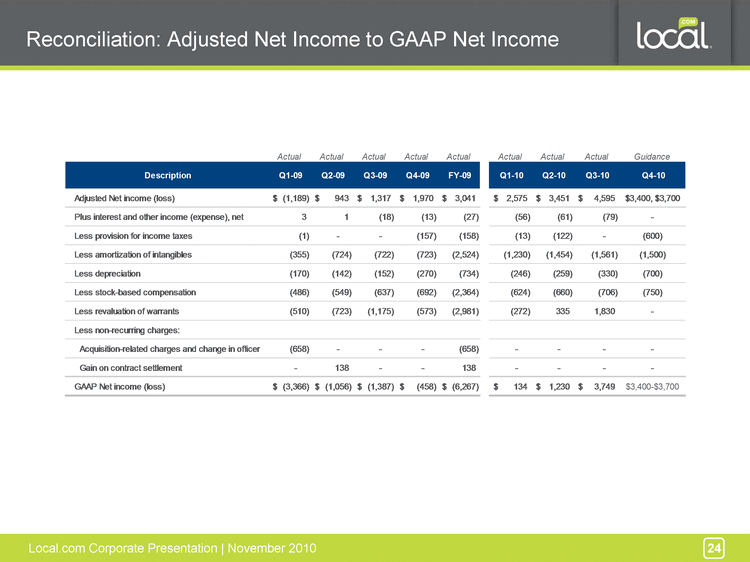
| P&L Trend 19 Actual Actual Actual Actual Actual Actual Actual Actual Guidance Description Q1-09 Q2-09 Q3-09 Q4-09 FY-09 Q1-10 Q2-10 Q3-10 Q4-10 Revenue $ 11,064 $ 13,726 $ 15,128 $ 16,364 $ 56,282 $ 18,631 $ 23,004 $ 22,457 $22,000-$23,000 Sequential revenue growth 16% 24% 10% 8% 47% 14% 23% -2% Operating expenses: Cost of Revenues 7,524 7,735 8,858 9,837 33,954 10,802 13,176 10,705 Sales and marketing 3,080 2,995 3,080 2,803 11,958 3,098 3,945 4,031 General and administrative 2,107 1,871 1,698 1,728 7,404 1,914 2,209 2,663 Research and development 856 735 964 988 3,543 1,112 1,142 1,499 Amortization of intangibles 355 724 722 723 2,524 1,230 1,454 1,561 Total operating expenses 13,922 14,060 15,322 16,079 59,383 18,156 21,926 20,459 Operating income (loss) (2,858) (334) (194) 285 (3,101) 475 1,078 1,998 Interest and other income (expense) 3 1 (18) (13) (27) (56) (61) (79) Change in fair value of warrant laibility (510) (723) (1,175) (573) (2,981) (272) 335 1,830 Income (loss) before income taxes (3,365) (1,056) (1,387) (301) (6,109) 147 1,352 3,749 Provision for income taxes 1 - - 157 158 13 122 - Operating expenses: $ (3,366) $ (1,056) $ (1,387) $ (458) $ (6,267) $ 134 $ 1,230 $ 3,749 Adjusted Net income (loss) $ (1,189) $ 943 $ 1,317 $ 1,970 $ 3,041 $ 2,575 $ 3,451 $ 4,595 $3,400-$3,700 Weighted average shares 14,433 14,666 14,796 15,512 14,714 15,918 17,342 17,202 17,500 Net income (loss) per share $ (0.23) $ (0.07) $ (0.10) $ (0.03) $ (0.44) $ 0.01 $ 0.07 $ 0.22 Adjusted Net income (loss) per share $ (0.08) $ 0.06 $ 0.09 $ 0.13 $ 0.21 $ 0.16 $ 0.20 $ 0.27 $0.20-$0.21 Adjusted Net Income (Loss) = Net income (loss) before interest, taxes, depreciation, amortization, stock-based compensation, warrant revaluation charges, and non-recurring Items |

