Exhibit 99.1

local corporation
Local Corporation Corporate Overview | Q2 2014
Forward looking statements
Certain matters being discussed by Local Corporation’s management today include forward looking statements which are made pursuant to the Safe Harbor provisions of section 21-E of the Securities Exchange Act of 1934. Investors are cautioned that statements which are not strictly historical statements, including statements concerning future expected financial performance, management objectives and plans for future operations, our relationships with strategic or other partners, the release of new products or services or enhancements to existing products or services, our expectations regarding potential acquisitions and the future performance of past acquisitions including our ability to realize expected synergies, trends in the market for our current or planned products or services, and market acceptance of our products or services, constitute forward looking statements.
The forward looking statements include, but are not limited to, any statements containing the words “expect”, “anticipate”, “estimates”, “believes”, “should”, “could”, “may”, “possibly”, and similar expressions and the negatives thereof. These forward looking statements involve a number of risks and uncertainties that could cause actual results to differ materially from the forward looking statements. Those risks and uncertainties are detailed in the company’s filings from time to time with the Securities and Exchange Commission. The information contained in the forward looking statements is provided as of the date of such oral statements and the company disclaims any obligation to update such statements.
Adjusted EBITDA is defined as net income (loss) excluding: provision for income taxes; interest and other income (expense), net; depreciation; amortization; stock-based compensation charges; gain or loss on derivatives’ revaluation; net income (loss) from discontinued operations; LEC receivables reserve; finance-related charges; accrued lease liability/asset; severance charges; and an expense related to a settlement accrual. Adjusted EBITDA, as defined above, is not a measurement under GAAP. Adjusted EBITDA is reconciled to net loss and loss per share, which we believe are the most comparable GAAP measures, at the end of this presentation. Management believes that Adjusted EBITDA provides useful information to investors about the company’s performance because it eliminates the effects of period-to-period changes in income from interest on the company’s cash and marketable securities, expense from the company’s financing transactions and the costs associated with income tax expense, capital investments, stock-based compensation expense, warrant revaluation charges, and non-recurring charges which are not directly attributable to the underlying performance of the company’s business operations. Management uses Adjusted EBITDA in evaluating the overall performance of the company’s business operations.
A limitation of non-GAAP Adjusted EBITDA is that it excludes items that often have a material effect on the company’s net income and earnings per common share calculated in accordance with GAAP. Therefore, management compensates for this limitation by using Adjusted EBITDA in conjunction with GAAP net loss and loss per share measures. The company believes that Adjusted EBITDA provides investors with an additional tool for evaluating the company’s core performance, which management uses in its own evaluation of overall performance, and as a base-line for assessing the future earnings potential of the company. While the GAAP results are more complete, the company prefers to allow investors to have this supplemental metric since, with reconciliation to GAAP (as noted above), it may provide greater insight into the company’s financial results. The non-GAAP measures should be viewed as a supplement to, and not as a substitute for, or superior to, GAAP net income or earnings per share. Corporate Overview – Q2 2014 2
Our mission
To give consumers the most relevant and personalized information at the right time and on the right platform – and continually refine it until it’s perfect.
Corporate Overview – Q2 2014 3
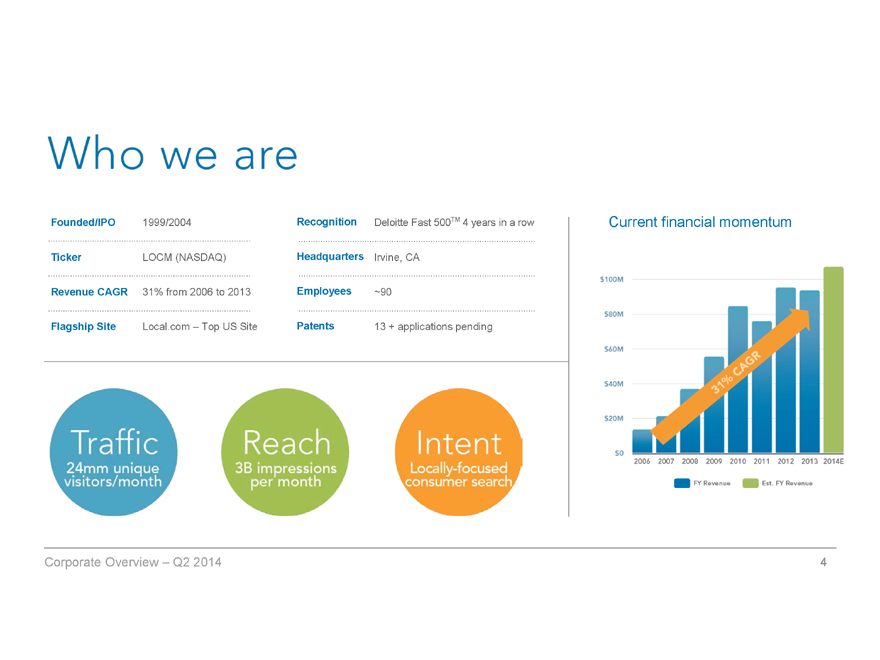
Who we are
Founded/IPO 1999/2004 Recognition Deloìtte Fast 500TM 4 years in a row
Ticker LOCM (NASDAQ) Headquarters Irvine, CA
Revenue CAGR 31% from 2006 to 2013 Employees ~90
Flagship Site Local.com – Top US Site Patents 13 + applications pending
Traffic 24mm unique visitors/month
Reach 3B impressions per month
Intent Locally-focused consumer search
Current financial momentum
$100M $80M $60M $40M $20M $0M
31% CAGR 2006 2007 2008 2009 2010 2011 2012 2013 2014E
FY Revenue Est. FY Revenue
Corporate Overview – Q2 2014 4
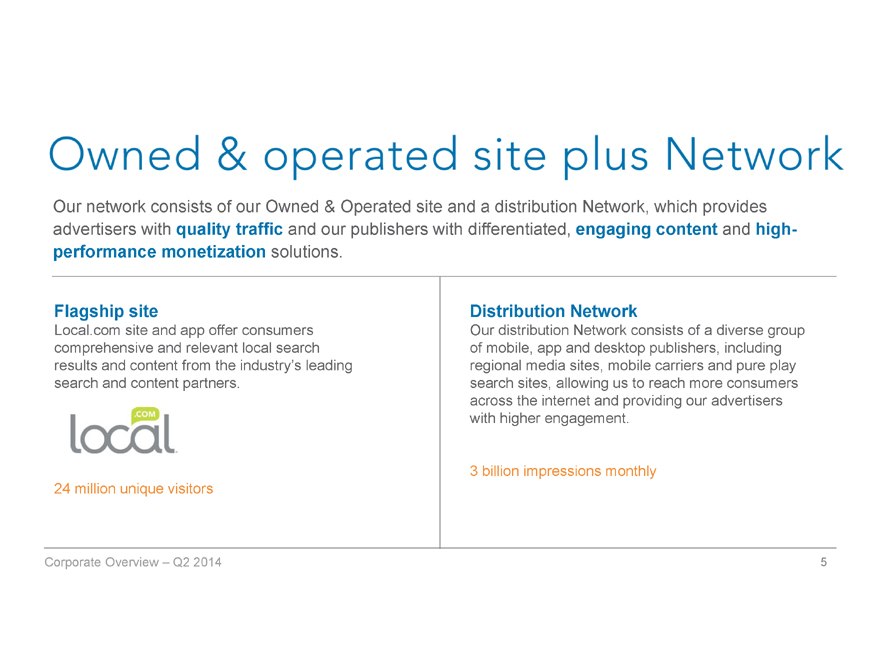
Owned & operated site plus Network
Our network consists of our Owned & Operated site and a distribution Network, which provides advertisers with quality traffic and our publishers with differentiated, engaging content and high- performance monetization solutions.
Flagship site Local.com site and app offer consumers comprehensive and relevant local search results and content from the industry’s leading search and content partners.
.com local 24 million unique visitors
Distribution Network Our distribution Network consists of a diverse group of mobile, app and desktop publishers, including regional media sites, mobile carriers and pure play search sites, allowing us to reach more consumers across the internet and providing our advertisers with higher engagement.
3 billion impressions monthly
Corporate Overview – 2014 5
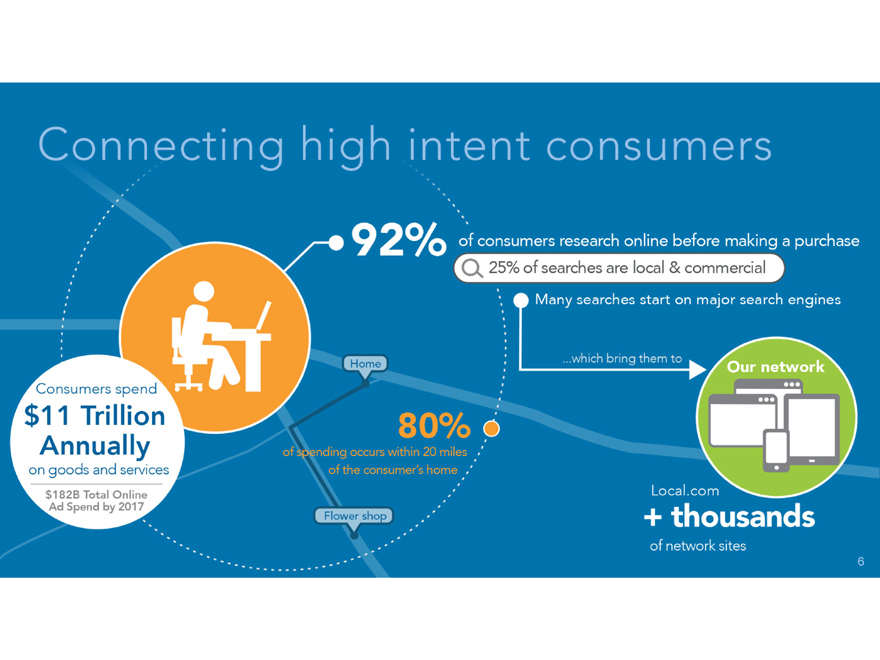
Connecting high intent consumers
92% of consumers research online before making a purchase
25% of searches are local & commercial
Many searches start on major search engines
...which bring them to
Our network
Consumers spend $11 Trillion Annually on goods and services $182B Total Online Ad Spend by 2017
Home
80% of spending occurs within 20 miles of the consumer’s home
Flower shop
Local.com
+ thousands
of network sites
6
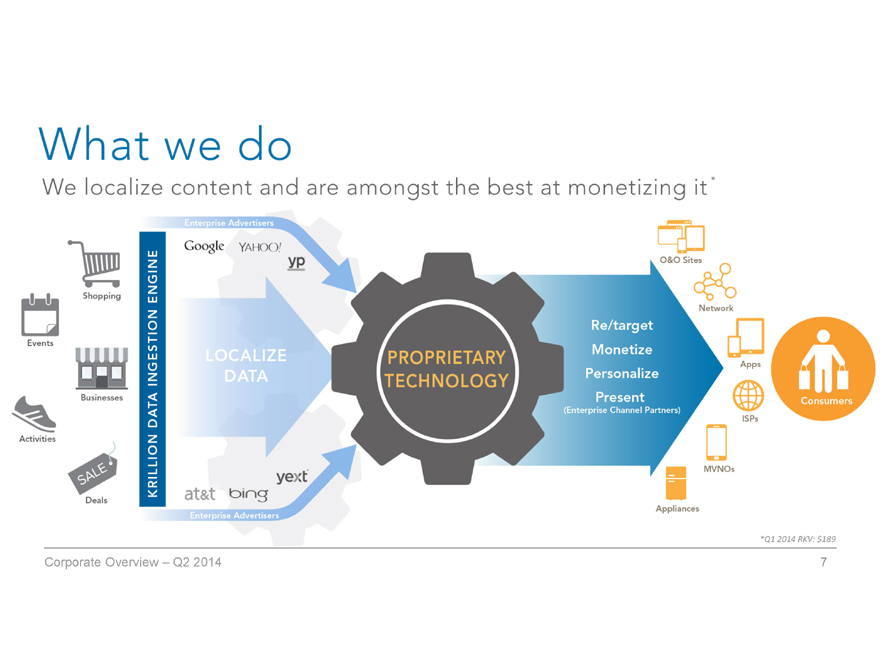
What we do
We localize content and are amongst the best of monetizing it *
Shopping
Events
Businesses
Activities
SALE
Deals
KRILLION DATA INGESTION ENGINE
Enterprise Advertisers
Google YAHOO!
yp
LOCALIZE DATA
at&t bing yext
Enterprise Advertisers
PROPRIETARY TECHNOLOGY
Re/target
Monetize
Personalize
Present
(Enterprise Channel Partners)
O&O Sites
Network
Apps
ISPs
MVNOs Appliances
Consumers
* Q1 2014 RKV: $189
Corporate Overview - Q2 2014
7
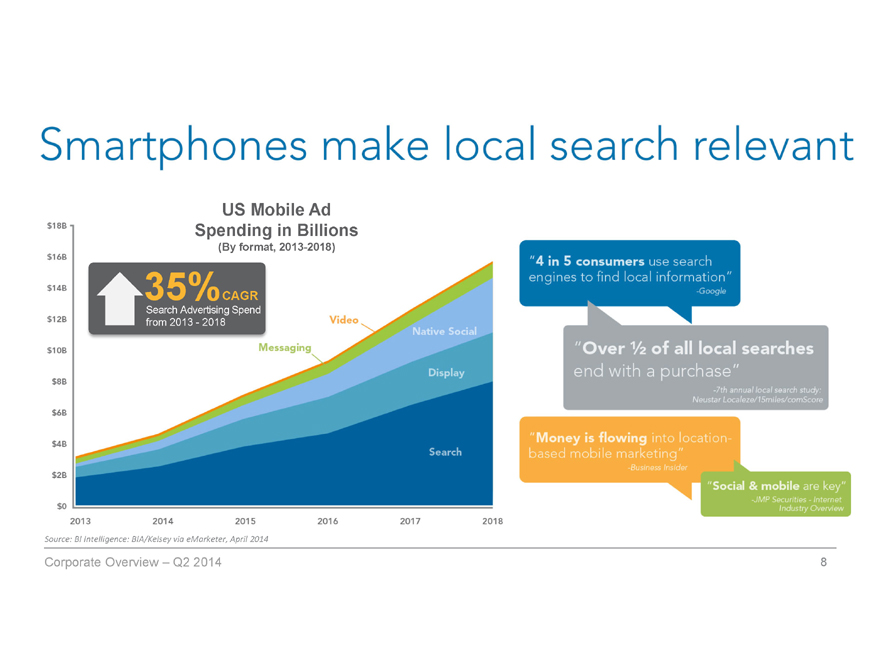
Smartphones make local search relevant
US Mobile Ad
Spending in Billions
(By format, 2013-2018)
35%CAGR
Search Advertising Spend
from 2013 - 2018
$18B $16B $14B $12B $10B $8B $6B $4B $2B $0
Messaging Video Native Social Display Search
2013 2014 2015 2016 2017 2018
“4 in 5 consumers use search engines to find local information”
-Google
“Over ½ of all local searches end with a purchase”
-7th annual local search study: Neustar Localeze/15miles/comScore
“Money is flowing into location-based mobile marketing”
-Business Insider
“Social & mobile are key”
-JMP Securities – Internet Industry Overview
Source: BI Intelligence: BIA/Kelsey via eMarketer, April 2014
Corporate Overview – Q2 2014 8
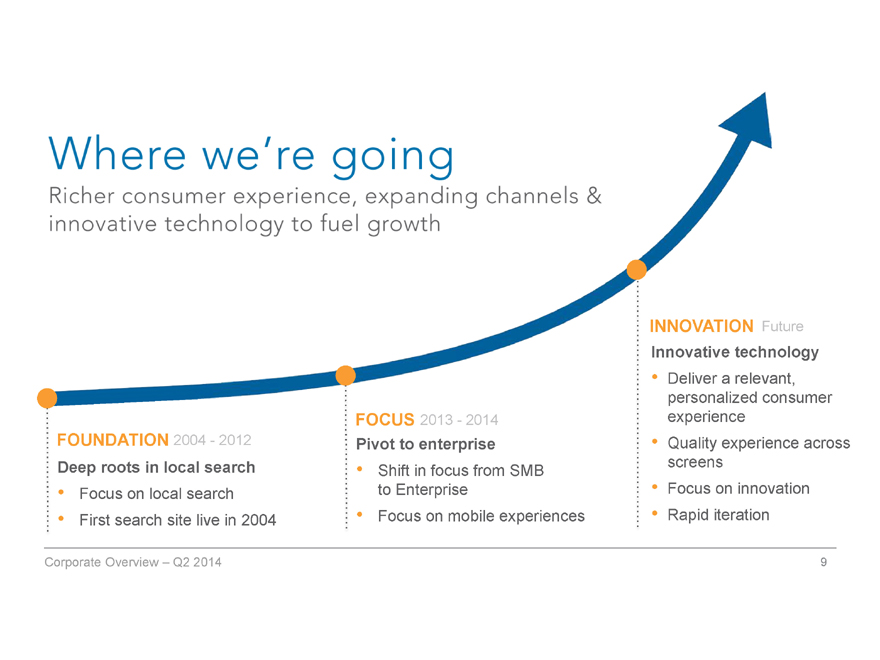
Where we’re going
Richer consumer experience, expanding channels & innovative technology to fuel growth
Foundation 2004 – 2012
Deep roots in local search
Focus on local search
First search site live in 2004
Focus 2013 – 2014
Pivot to enterprise
Shift in Focus from SMB to Enterprise
Focus on mobile experiences
Innovation Future
Innovative technology
Deliver a relevant, personalized consumer experience
Quality experience across screens
Focus on innovation
Rapid iteration
Corporate Overview – Q2 2014
9
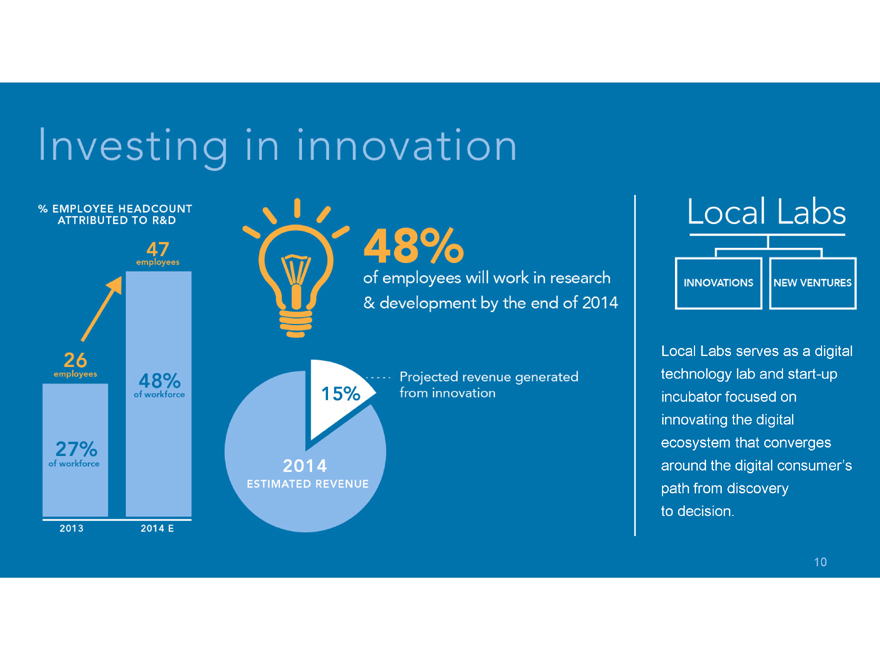
Investing in innovation
% EMPLOYEE HEADCOUNT ATTRIBUTED TO R&D
47 employees 48% of workforce 2014 E 26 employees 27% of workforce 2013
48% of employees will work in research & development by the end of 2014
15% Projected revenue generated from innovation
2014 ESTIMATED REVENUE
Local Labs
INNOVATIONS NEW VENTURES
Local Labs serves as a digital technology lab and start-up incubator focused on innovating the digital ecosystem that converges around the digital consumer’s path from discovery to decision.
10
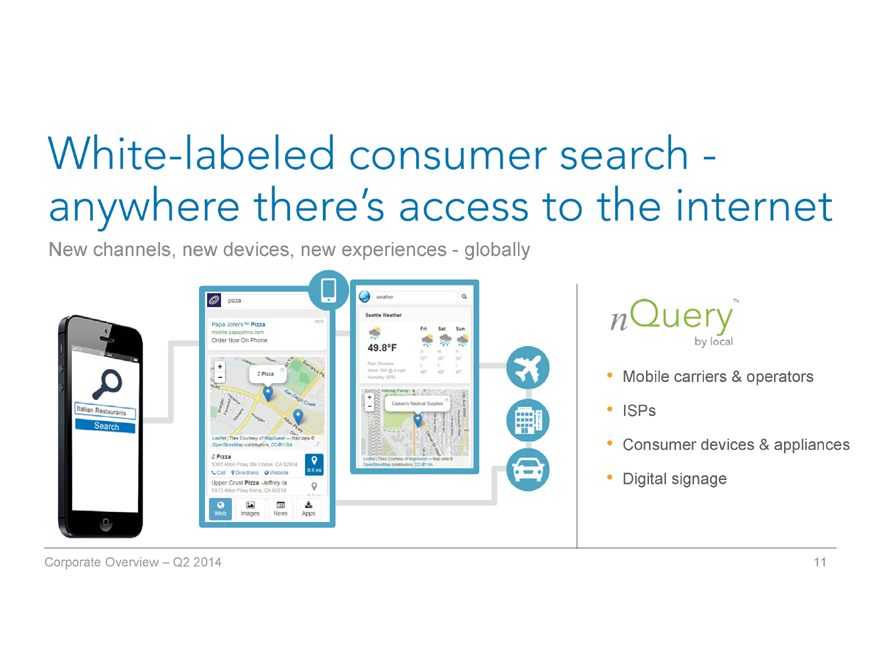
White-labeled consumer search - anywhere there’s access to the internet
New channels, new devices, new experiences - globally
nQueryTM by local
Mobile carriers & operators
ISPs
Consumer devices & appliances
Digital signage
Corporate Overview – Q2 2014 11
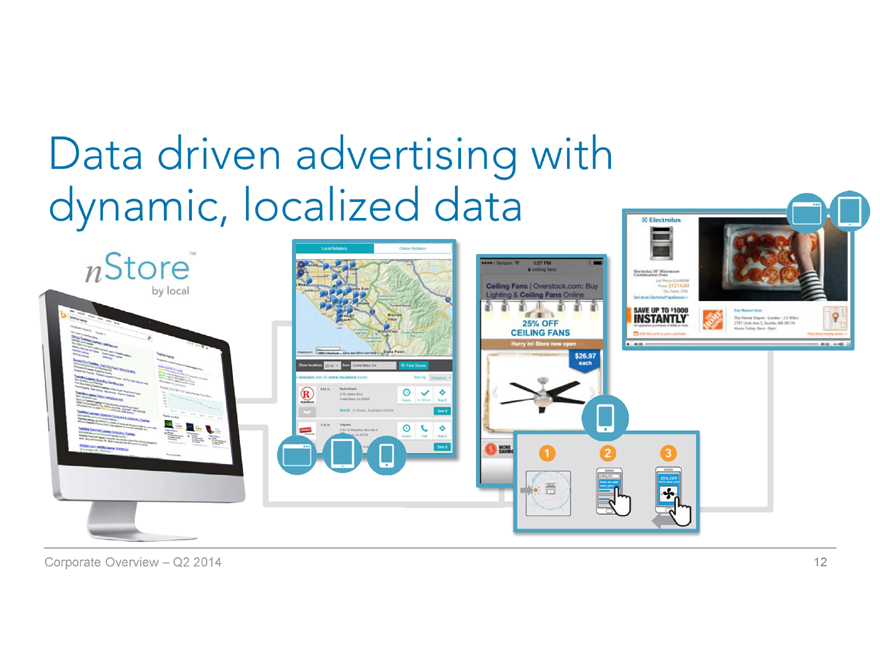
Data driven advertising with dynamic, localized data
nStoreTM by local
Corporate Overview – Q2 2014 12
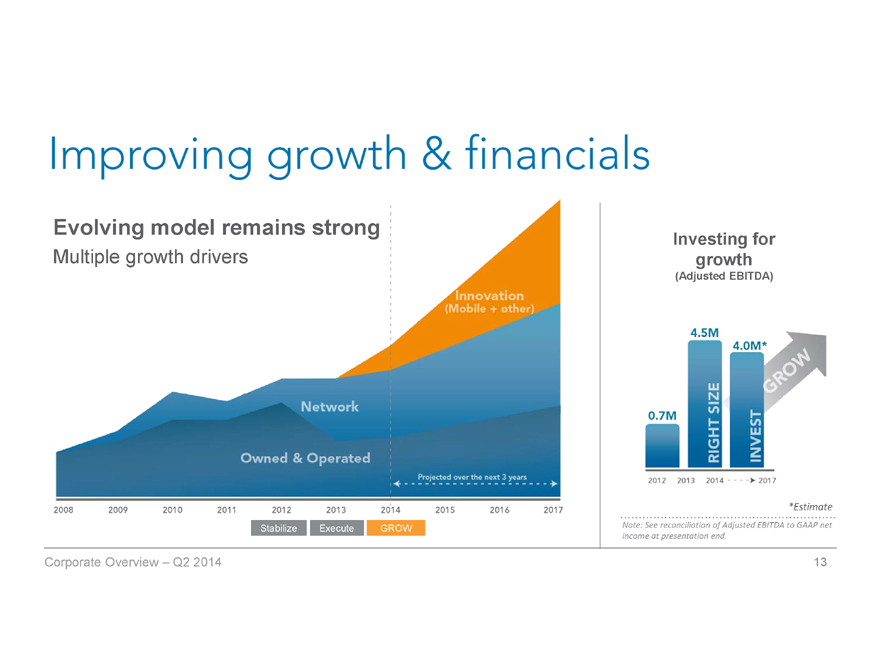
Improving growth & financials
Evolving model remains strong
Multiple growth drivers
Investing for growth (Adjusted EBITDA)
0.7M 4.5M 4.0M*
2012 2013 2014 2017
*Estimate
Stabilize Execute GROW
Note: See reconciliation of Adjusted EBITDA to GAAP net income at presentation end.
Corporate Overview – Q2 2014 13
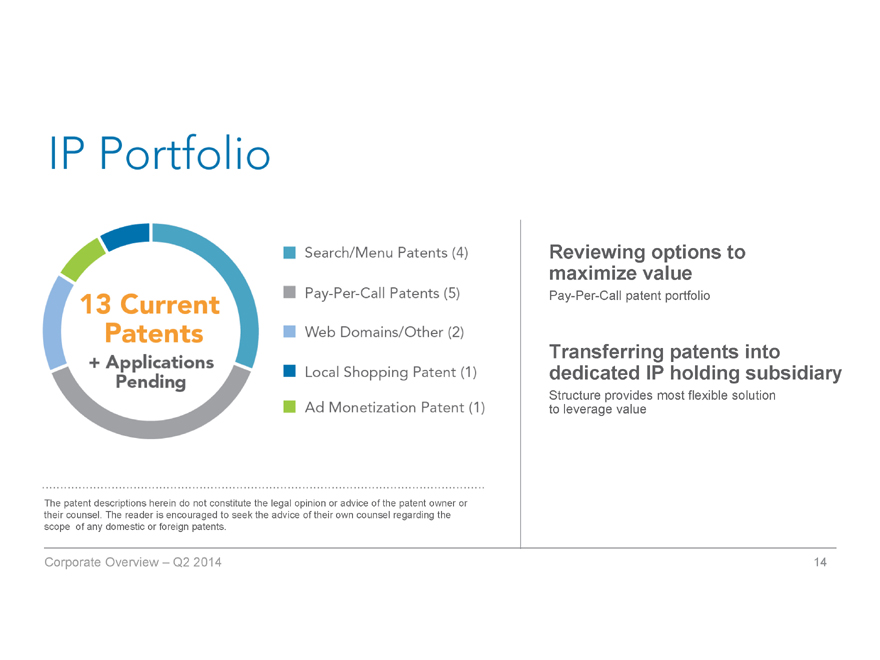
IP Portfolio
13 Current Patents + Applications Pending
Search/Menu Patents (4)
Pay-Per-Call Patents (5)
Web Domains/Other (2)
Local Shopping Patent (1)
Ad Monetization Patent (1)
Reviewing options to maximize value
Pay-Per-Call patent portfolio
Transferring patents into dedicated IP holding subsidiary
Structure provides most flexible solution to leverage value
The patent descriptions herein do not constitute the legal opinion or advice of the patent owner or their counsel. The reader is encouraged to seek the advice of their own counsel regarding the scope of any domestic or foreign patents.
Corporate Overview – Q2 2014 14
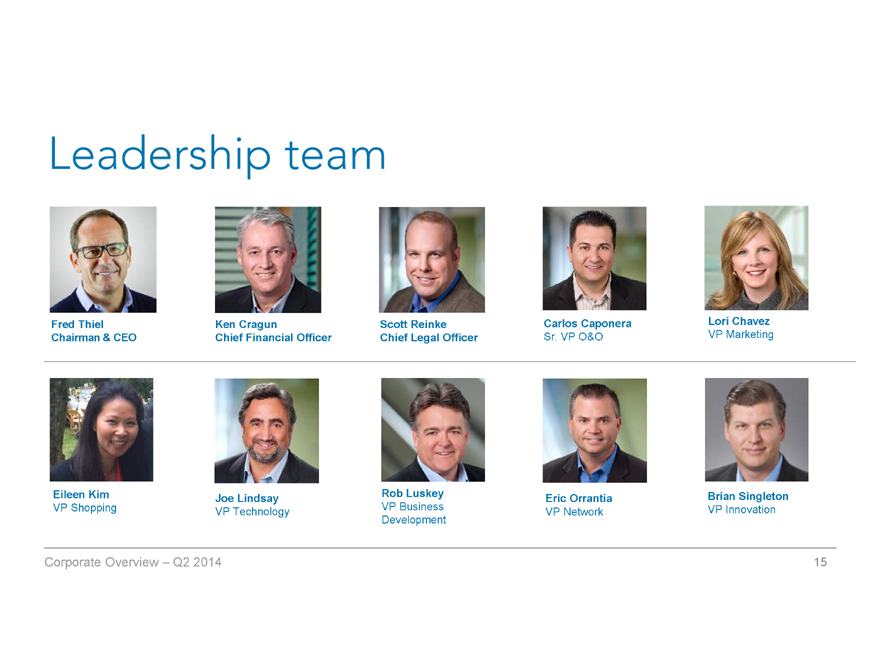
Leadership team
Fred Thiel Chairman & CEO
Ken Cragun
Chief Financial Officer
Scott Reinke
Chief Legal Officer
Carlos Caponera
Sr. VP O&O
Lori Chavez
VP Marketing
Eileen Kim
VP Shopping
Joe Lindsay
VP Technology
Rob Luskey
VP Business Development
Eric Orrantia
VP Network
Brian Singleton
VP Innovation
Corporate Overview – Q2 2014 15

Board of directors
Fred Thiel
Chairman of the Board & Chief Executive Officer
Frederick G. Thiel has more than 25 years of experience leading companies in the technology, data
communications, Internet, Big Data, digital media and software industries. He was named chairman in
January 2014, after joining the board in January 2013. Fred served as managing partner at Triton Pacific
Capital Partners and founder and managing partner of TechStarter Ventures. He also served as CEO of
GameSpy Industries where he led the company from losses to almost double revenues in less than one year
and led the sale of the company. As chairman and CEO for Lantronix (LTRX), Fred led a repositioning,
doubled the company’s revenue growth in four years, led four acquisitions and the initial public and secondary
offerings that raised $120+ million. He also serves as a senior advisor to Graham Partners and as a director
for three privately-held companies. Fred attended classes at the Stockholm School of Economics in Europe.
Norman K. Farra, Jr.
Lead Director
Norman K. Farra Jr. has more than 20 years of strategic leadership experience. Farra has served as a
director since August 2005 and is currently serving as lead director. He is currently a Managing Director,
Investment Banking for Aegis Capital, Inc. Farra also served as Managing Director of Investment Banking for
R.F. Lafferty & Co. Inc. and Director for Investment Banking for Cresta Capital Strategies, LLC. He was an
independent financial consultant and served as Managing Director of Investment Banking for GunnAllen
Financial Inc. Farra also served as an independent contractor acting as Managing Director of Investment
Banking for GunnAllen Financial Inc. Farra received a Bachelor of Science degree in Business Administration
from Widener University.
David M. Hughes
Director
David M. Hughes has more than 15 years of strategic leadership experience. He is currently the CEO of The
Search Agency, a global digital marketing company. Hughes served as senior vice president of corporate
development for United Online, Inc. Hughes also served as a management consultant for the Boston
Consulting Group and was an associate with Mercer Management Consulting. Hughes is a graduate of
Harvard University’s Graduate School of Business Administration, where he received a master’s of business
administration. He also holds a bachelor of arts degree with honors from the University of Western Ontario.
He currently serves as a board member for Spark Networks (NYSE: LOV), YPOLA, and The Huron University
College Foundation USA.
John M. Payne
Director
John M. Payne has more than 30 years of strategic leadership experience. Payne is currently CEO of
SimpleAir, Inc., an inventor-owned technology licensing company with mobile interests and intellectual
property assets. He serves as lead inventor for the SimpleAir patent portfolio, which covers more than
12 patents, and is widely licensed in the mobile industry by companies, including Apple® for its Apple
Push Notification. Payne has been CEO of more than 10 digital technology and enterprise security
companies. He led the successful IPO of Stamps.com (NASDAQ: STMP) and the turnaround of Day
Software(SWX: DAYN), which was acquired by Adobe. He is an experienced fundraiser who has
raised more than $550 million in public and private equity. He currently serves as managing director
for Outset Ventures and as an advisory board member for Digital Offering LLC.
John E. Rehfeld
Director
John E. Rehfeld has more than 30 years of strategic leadership experience and served as a director
since August 2005, as well as lead independent director from December 2005 to October 2011.
Rehfeld has been the adjunct professor of marketing and strategy for the Executive MBA Program at
Pepperdine University, since 1998 and the University of San Diego, since 2010. He currently serves as
Director of Lantronix, Inc. Rehfeld was previously a Director of ADC Telecommunication, Inc. and
Primal Solutions, Inc. Additionally, Rehfeld currently holds directorships with several private
companies. Rehfeld received a Masters of Business Administration degree from Harvard University
and a Bachelor of Science degree in Chemical Engineering from the University of Minnesota.
Corporate Overview – Q2 2014 16
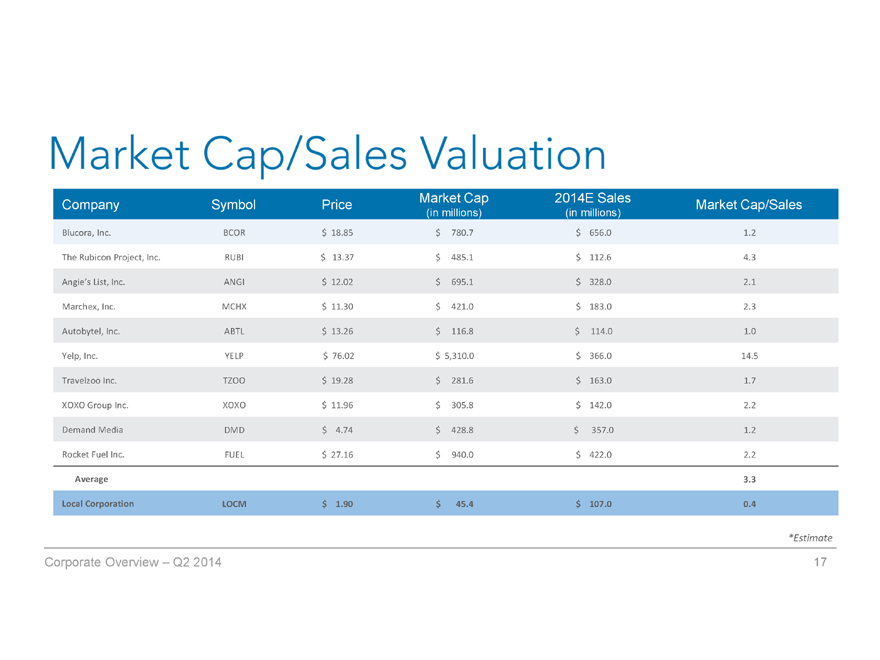
Market Cap/Sales Valuation
Market Cap 2014E Sales
Company Symbol Price Market Cap/Sales
(in millions) (in millions)
Blucora, Inc. BCOR $ 18.85 $ 780.7 $ 656.0 1.2
The Rubicon Project, Inc. RUBI $ 13.37 $ 485.1 $ 112.6 4.3
Angie’s List, Inc. ANGI $ 12.02 $ 695.1 $ 328.0 2.1
Marchex, Inc. MCHX $ 11.30 $ 421.0 $ 183.0 2.3
Autobytel, Inc. ABTL $ 13.26 $ 116.8 $ 114.0 1.0
Yelp, Inc. YELP $ 76.02 $ 5,310.0 $ 366.0 14.5
Travelzoo Inc. TZOO $ 19.28 $ 281.6 $ 163.0 1.7
XOXO Group Inc. XOXO $ 11.96 $ 305.8 $ 142.0 2.2
Demand Media DMD $ 4.74 $ 428.8 $ 357.0 1.2
Rocket Fuel Inc. FUEL $ 27.16 $ 940.0 $ 422.0 2.2
Average 3.3
Local Corporation LOCM $ 1.90 $ 45.4 $ 107.0 0.4
*Estimate
Corporate Overview – Q2 2014 17
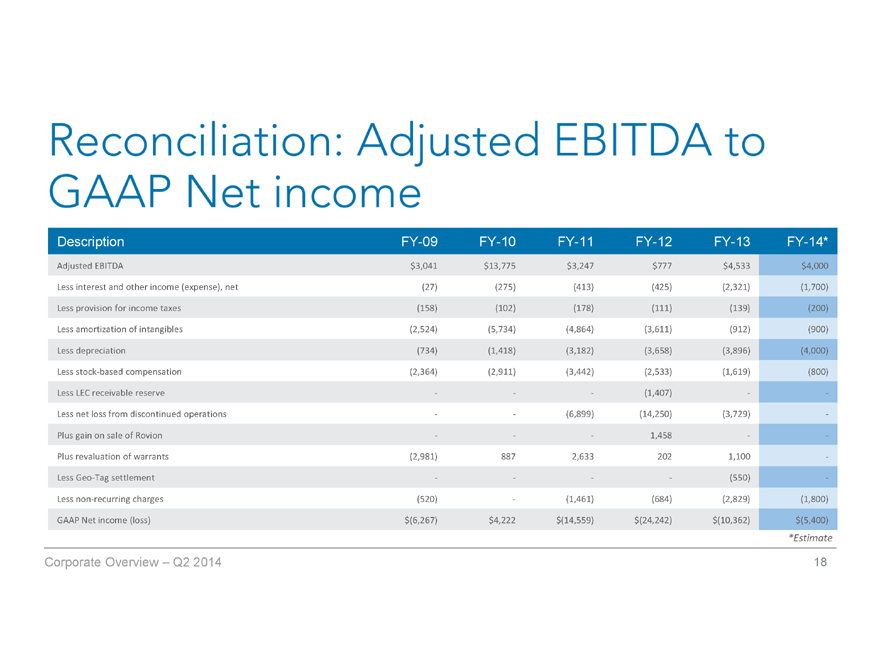
Reconciliation: Adjusted EBITDA to GAAP Net income
Description FY-09 FY-10 FY-11 FY-12 FY-13 FY-14*
Adjusted EBITDA $3,041 $13,775 $3,247 $777 $4,533 $4,000
Less interest and other income (expense), net (27) (275) (413) (425) (2,321) (1,700)
Less provision for income taxes (158) (102) (178) (111) (139) (200)
Less amortization of intangibles (2,524) (5,734) (4,864) (3,611) (912) (900)
Less depreciation (734) (1,418) (3,182) (3,658) (3,896) (4,000)
Less stock-based compensation (2,364) (2,911) (3,442) (2,533) (1,619) (800)
Less LEC receivable reserve - - - (1,407) - -
Less net loss from discontinued operations - - (6,899) (14,250) (3,729) -
Plus gain on sale of Rovion - - - 1,458 - -
Plus revaluation of warrants (2,981) 887 2,633 202 1,100 -
Less Geo-Tag settlement - - - - (550) -
Less non-recurring charges (520) - (1,461) (684) (2,829) (1,800)
GAAP Net income (loss) $(6,267) $4,222 $(14,559) $(24,242) $(10,362) $(5,400)
*Estimate
Corporate Overview – Q2 2014 18

Use of non-GAAP measures
This document includes the non-GAAP financial measure of “Adjusted EBITDA”
which we define as net income (loss) excluding: provision for income taxes; interest
and other income (expense), net; depreciation; amortization; stock based
compensation charges; gain or loss on derivatives’ revaluation, net income (loss)
from discontinued operations; gain on sale of Rovion; impairment charges; LEC
receivables reserve; finance related charges; accrued lease liability/asset; and
severance charges. Adjusted EBITDA, as defined above, is not a measurement
under GAAP. Adjusted EBITDA is reconciled to net income (loss) which we believe
is the most comparable GAAP measure. A reconciliation of net income (loss) to
Adjusted EBITDA is set forth within this presentation.
Management believes that Adjusted EBITDA provides useful information to
investors about the company’s performance because it eliminates the effects of
period-to-period changes in income from interest on the company’s cash and
marketable securities, expense from the company’s financing transactions and the
costs associated with income tax expense, capital investments, stock-based
compensation expense, LEC receivables reserve, warrant revaluation charges;
finance related charges; accrued lease liability; and severance charges which are
not directly attributable to the underlying performance of the company’s business
operations. Management uses Adjusted EBITDA in evaluating the overall
performance of the company’s business operations.
A limitation of non-GAAP Adjusted EBITDA is that it excludes items that often have
a material effect on the company’s net income and earnings per common share
calculated in accordance with GAAP. Therefore, management compensates for this
limitation by using Adjusted EBITDA in conjunction with net income (loss) and net
income (loss) per share measures. The company believes that Adjusted EBITDA
provides investors with an additional tool for evaluating the company’s core
performance, which management uses in its own evaluation of overall performance,
and as a base-line for assessing the future earnings potential of the company.
While the GAAP results are more complete, the company prefers to allow investors
to have this supplemental metric since, with reconciliation to GAAP; it may provide
greater insight into the company’s financial results. The non-GAAP measures
should be viewed as a supplement to, and not as a substitute for, or superior to,
GAAP net income (loss) or earnings (loss) per share.
Corporate Overview – Q2 2014 19
Thank you
Fred Thiel Ken Cragun
Chairman & CEO CFO
fred@local.com kcragun@local.com
Local Corporation | 7555 Irvine Center Drive | Irvine CA 92618 | 949.784.0800 | www.localcorporation.com
Corporate Overview – Q2 2014 20