UNITED STATES
SECURITIES AND EXCHANGE COMMISSION
Washington, D.C. 20549
FORM 10-Q
ý | | QUARTERLY REPORT PURSUANT TO SECTION 13 OR 15(d) OF THE SECURITIES EXCHANGE ACT OF 1934 |
| | |
For the quarterly period ended June 30, 2005 |
| | |
OR |
| | |
o | | TRANSITION REPORT PURSUANT TO SECTION 13 OR 15(d) OF THE SECURITIES EXCHANGE ACT OF 1934 |
| | |
For the transition period from To |
| | |
| | Commission file number 333-109064 |
WORLDSPAN, L.P.
(Exact name of registrant as specified in its charter)
Delaware | | 75-3125716 |
(State or other jurisdiction of
incorporation or organization) | | (I.R.S. Employer Identification No.) |
| | |
300 Galleria Parkway, N.W.
Atlanta, Georgia | | 30339 |
(Address of principal executive offices) | | (Zip Code) |
Registrant’s telephone number, including area code (770) 563-7400
Indicate by check mark whether the registrant (1) has filed all reports required to be filed by Section 13 or 15(d) of the Securities Exchange Act of 1934 during the preceding 12 months (or for such shorter period that the registrant was required to file such reports), and (2) has been subject to such filing requirements for the past 90 days.
ý Yes o No
Indicate by check mark whether the registrant is an accelerated filer (as defined by Rule 12b-2 of the Act).
o Yes ý No
As of August 8, 2005, Registrant’s parent had outstanding 82,967,548 shares of Class A Common Stock and 11,000,000 shares of Class B Common Stock.
WORLDSPAN, L.P.
REPORT ON FORM 10-Q
FOR THE PERIOD ENDED JUNE 30, 2005
INDEX
2
PART I. FINANCIAL INFORMATION
ITEM 1. FINANCIAL STATEMENTS
Worldspan, L.P.
Condensed Consolidated Balance Sheets
(dollars in thousands)
(Unaudited)
| | June 30, 2005 | | December 31, 2004 | |
Assets | | | | | |
Current assets | | | | | |
Cash and cash equivalents | | $ | 44,951 | | $ | 100,474 | |
Trade accounts receivable, net of an allowance for bad debt of $12,933 and $17,111, respectively | | 134,675 | | 102,793 | |
Prepaid expenses and other current assets | | 18,913 | | 21,306 | |
Total current assets | | 198,539 | | 224,573 | |
Property and equipment, net of accumulated depreciation | | 104,477 | | 118,218 | |
Deferred charges | | 28,103 | | 34,351 | |
Debt issuance costs, net of accumulated amortization | | 16,264 | | 10,201 | |
Supplier and agency relationships, net of accumulated amortization | | 254,154 | | 271,020 | |
Developed technology, net | | 194,094 | | 206,802 | |
Trade name | | 72,142 | | 72,142 | |
Goodwill | | 112,035 | | 112,035 | |
Other intangible assets, net | | 30,510 | | 31,914 | |
Other long-term assets | | 27,007 | | 31,030 | |
Total assets | | $ | 1,037,325 | | $ | 1,112,286 | |
| | | | | |
Liabilities and Partners’ Capital | | | | | |
Current liabilities | | | | | |
Accounts payable | | $ | 14,083 | | $ | 14,671 | |
Accrued expenses | | 159,851 | | 156,635 | |
Current portion of capital lease obligations | | 18,712 | | 19,369 | |
Current portion of long-term debt | | 4,000 | | 12,497 | |
Total current liabilities | | 196,646 | | 203,172 | |
Long-term portion of capital lease obligations | | 45,602 | | 54,079 | |
Long-term debt | | 711,500 | | 324,990 | |
Pension and postretirement benefits | | 62,393 | | 64,779 | |
Other long-term liabilities | | 13,659 | | 13,867 | |
Total liabilities | | 1,029,800 | | 660,887 | |
Commitments and contingencies | | | | | |
Partners’ capital | | 7,525 | | 451,399 | |
Total liabilities and partners’ capital | | $ | 1,037,325 | | $ | 1,112,286 | |
The accompanying notes are an integral part of these condensed consolidated financial statements.
3
Worldspan, L.P.
Condensed Consolidated Statements of Operations
(dollars in thousands)
(Unaudited)
| | Three months ended | | Six months ended | |
| | June 30, 2005 | | June 30, 2004 | | June 30, 2005 | | June 30, 2004 | |
| | | | | | | | | |
Revenues | | | | | | | | | |
Electronic travel distribution | | $ | 227,481 | | $ | 232,487 | | $ | 469,439 | | $ | 465,026 | |
Information technology services | | 18,150 | | 16,317 | | 36,774 | | 32,309 | |
Total revenues | | 245,631 | | 248,804 | | 506, 213 | | 497,335 | |
Operating Expenses | | | | | | | | | |
Cost of revenues | | | | | | | | | |
Cost of revenues excluding developed technology amortization | | 168,470 | | 173,416 | | 346,612 | | 343,754 | |
Developed technology amortization | | 6,891 | | 5,508 | | 12,589 | | 11,015 | |
Total cost of revenues | | 175,361 | | 178,924 | | 359,201 | | 354,769 | |
Selling, general and administrative | | 25,535 | | 29,632 | | 58,151 | | 65,792 | |
Amortization of intangible assets | | 9,135 | | 9,135 | | 18,270 | | 18,270 | |
Total operating expenses | | 210,031 | | 217,691 | | 435,622 | | 438,831 | |
Operating income | | 35,600 | | 31,113 | | 70,591 | | 58,504 | |
Other Income (Expense) | | | | | | | | | |
Interest expense, net | | (15,573 | ) | (9,960 | ) | (27,902 | ) | (20,654 | ) |
Loss on extinguishment of debt | | — | | — | | (55,597 | ) | — | |
Other, net | | (11 | ) | 433 | | (220 | ) | 118 | |
Total other expense, net | | (15,584 | ) | (9,527 | ) | (83,719 | ) | (20,536 | ) |
Income (loss) before provision for income taxes | | 20,016 | | 21,586 | | (13,128 | ) | 37,968 | |
Income tax expense | | 1,539 | | 73 | | 2,457 | | 302 | |
Net income (loss) | | $ | 18,477 | | $ | 21,513 | | $ | (15,585 | ) | $ | 37,666 | |
The accompanying notes are an integral part of these condensed consolidated financial statements.
4
Worldspan, L.P.
Condensed Consolidated Statements of Partners’ Capital
(dollars in thousands)
(Unaudited)
| | Partners’
Capital | | Accumulated
Other
Comprehensive
Loss | | Total | |
| | | | | | | |
Balance at December 31, 2004 | | $ | 453,947 | | $ | (2,548 | ) | $ | 451,399 | |
Comprehensive loss: | | | | | | | |
Net loss | | (15,585 | ) | — | | (15,585 | ) |
Change in fair value of derivative accounted for as a hedge | | — | | (2,350 | ) | (2,350 | ) |
Unrealized holding loss on investment | | — | | (109 | ) | (109 | ) |
Comprehensive loss | | | | | | (18,044 | ) |
Distribution to and contributions from WTI, net | | (427,238 | ) | — | | (427,238 | ) |
Stock-based compensation | | 1,408 | | — | | 1,408 | |
Balance at June 30, 2005 | | $ | 12,532 | | $ | (5,007 | ) | $ | 7,525 | |
The accompanying notes are an integral part of these condensed consolidated financial statements.
5
Worldspan, L.P.
Condensed Consolidated Statements of Cash Flows
(dollars in thousands)
(Unaudited)
| | Six months ended | |
| | June 30, 2005 | | June 30, 2004 | |
Cash flows from operating activities: | | | | | |
Net (loss) income | | $ | (15,585 | ) | $ | 37,666 | |
Adjustments to reconcile net (loss) income to net cash provided by operating activities: | | | | | |
Depreciation and amortization | | 51,187 | | 51,084 | |
Amortization of debt issuance costs | | 1,594 | | 1,899 | |
Loss on extinguishment of debt | | 55,597 | | — | |
Stock-based compensation | | 1,408 | | 1,767 | |
Loss on disposal of property and equipment, net | | 322 | | 584 | |
Other | | — | | (57 | ) |
Changes in operating assets and liabilities: | | | | | |
Trade accounts receivable, net | | (31,882 | ) | (25,136 | ) |
Prepaid expenses and other current assets | | 2,419 | | 8,908 | |
Deferred charges | | 6,249 | | (2,919 | ) |
Other long-term assets | | 1,673 | | 159 | |
Accounts payable | | (588 | ) | (8,463 | ) |
Accrued expenses | | 3,217 | | 29,092 | |
Pension and postretirement benefits | | (2,385 | ) | (3,292 | ) |
Other long-term liabilities | | (209 | ) | (880 | ) |
Net cash provided by operating activities | | 73,017 | | 90,412 | |
Cash flows from investing activities: | | | | | |
Purchase of property and equipment | | (6,601 | ) | (7,359 | ) |
Proceeds from sale of property and equipment | | 77 | | 92 | |
Capitalized software for internal use | | (19 | ) | (744 | ) |
Net cash used in investing activities | | (6,543 | ) | (8,011 | ) |
Cash flows from financing activities: | | | | | |
Proceeds from issuance of debt, net of debt issuance costs | | 734,801 | | — | |
Principal payments on capital leases | | (9,517 | ) | (10,969 | ) |
Principal payments on debt | | (92,488 | ) | (38,256 | ) |
Repurchase old notes | | (327,555 | ) | — | |
Distributions to and contributions from WTI, net | | (427,238 | ) | (3,464 | ) |
Net cash used in financing activities | | (121,997 | ) | (52,689 | ) |
Net (decrease) increase in cash and cash equivalents | | (55,523 | ) | 29,712 | |
Cash and cash equivalents at beginning of period | | 100,474 | | 43,746 | |
Cash and cash equivalents at end of period | | $ | 44,951 | | $ | 73,458 | |
The accompanying notes are an integral part of these condensed consolidated financial statements.
6
Worldspan, L.P.
Notes to Condensed Consolidated Financial Statements
(Unaudited) (dollars in thousands)
1. Accounting Policies
Nature of Business. Worldspan, L.P. (the “Partnership”) is a Delaware limited partnership formed in 1990. On June 30, 2003, Worldspan Technologies Inc. (“WTI”), formerly named Travel Transaction Processing Corporation, formed by Citigroup Venture Capital Equity Partners, L.P. (“CVC”) and Ontario Teachers’ Pension Plan Board (“OTPP”), indirectly acquired 100% of the outstanding partnership interests of the Partnership from affiliates of Delta Air Lines, Inc. (“Delta”), Northwest Airlines, Inc. (“Northwest”) and American Airlines, Inc. (“American”) (the “Acquisition”). WTI owns all of the general partnership interests in the Partnership. WS Holdings LLC (“WS Holdings”), which is owned by WTI, is the sole limited partner of the Partnership, owning all of the limited partnership interests.
The Partnership provides information, reservations, transaction processing and related services for airlines, travel agencies and other travel-related entities. The Partnership owns and operates a global distribution system (“GDS”) and provides subscribers with access to and use of this GDS. The Partnership also charges airlines, hotels, car rental companies and others for the use of the GDS.
Basis of Presentation. The accompanying unaudited condensed consolidated financial statements have been prepared in accordance with accounting principles generally accepted in the United States for interim financial information and with the instructions to Form 10-Q and Article 10 of Regulation S-X. Accordingly, they do not include all of the information and footnotes required by accounting principles generally accepted in the United States for complete financial statements. In the opinion of management these financial statements contain all adjustments, consisting of normal recurring accruals, necessary to present fairly the financial position, results of operations and cash flows for the periods indicated. The preparation of financial statements in accordance with accounting principles generally accepted in the United States requires management to make estimates and assumptions that affect the amounts reported in the financial statements and the accompanying notes. Operating results for the three and six months ended June 30, 2005 and June 30, 2004 are not necessarily indicative of results that may be expected for any other interim period or for the year ending December 31, 2005. The Partnership’s quarterly financial data should be read in conjunction with its consolidated financial statements for the year ended December 31, 2004 (including the notes thereto), set forth in its annual report on Form 10-K filed with the Securities and Exchange Commission on March 28, 2005.
Derivative Instruments. All derivatives are measured at fair value and recognized as either assets or liabilities in our condensed consolidated balance sheets. Changes in the fair values of derivative instruments that do not qualify as hedges and/or any ineffective portion of hedges are recognized as a gain or loss in our condensed consolidated statement of operations in the current period. Changes in the fair values of derivative instruments used effectively as fair value hedges are recognized in earnings, along with the change in the value of the hedged item. Changes in the fair value of the effective portions of cash flow hedges are reported in other comprehensive income (loss) and recognized in earnings when the hedged item is recognized in earnings.
Risks and Uncertainties. The Partnership derives substantially all of its revenues from the travel industry. Accordingly, events, circumstances and changes affecting the travel industry, particularly changes in airline travel and the financial well-being of the participating airlines, can significantly affect the Partnership’s business, financial condition and results of operations. The Partnership’s customers are primarily located in the United States and Europe.
Travel agencies are the primary channel of distribution for the services offered by travel vendors. If the Partnership were to lose all or part of the transactions generated by any significant travel agencies and not replace such transactions, its business, financial condition and results of operations could be adversely affected. One online agency subscriber, Expedia, generated transactions in the Partnership’s electronic travel distribution segment which resulted in revenues of approximately $66,185 and $62,559 for the three months ended June 30, 2005 and 2004, respectively, and $139,547 and $125,944 for the six months ended June 30, 2005 and 2004, respectively. These amounts represented 27% and 25% of total revenues for the three months ended June 30, 2005 and 2004, respectively, and 28% and 25% of total revenues for the six months ended June 30, 2005 and 2004, respectively.
A development within the GDS industry over the past several years involves the competitive need for GDSs to maintain full content for airlines, including web fare content, for distribution to traditional and online agency subscribers. We have entered into fare content agreements (which include web fare content) with a number of major airlines. Subject to termination rights, these obligations continue until late 2005 (in the case of US Airways) or 2006 and 2007 (with respect to certain other of the contracted airlines). Should we fail to maintain competitive content, our traditional and online agency subscribers could move transactions from us to competitors with access to this content, thus negatively affecting the Partnership’s business, financial condition and results of operation.
Furthermore, the Partnership charges airline carriers, rental car companies, hotels and other providers of travel products and services (collectively referred to as “suppliers”) for electronic travel distribution services and information technology services.
7
Revenues generated by two suppliers were $64,135 and $67,962 for the three months ended June 30, 2005 and 2004, respectively, and $139,984 and $137,121 for the six months ended June 30, 2005 and 2004, respectively. These amounts, included in the electronic travel distribution segment and the information technology services segment, represented approximately 26% and 27% of total revenues for the three months ended June 30, 2005 and 2004, respectively, and 28% of total revenues for the six months ended June 30, 2005 and 2004. At June 30, 2005 and December 31, 2004, accounts receivable from these same two suppliers was approximately $35,986 and $34,057, or 26.7% and 33.1%, respectively, of the Partnership’s total net accounts receivable.
Recently Issued Accounting Pronouncements. In December 2004, the Financial Accounting Standards Board (“FASB”) issued SFAS No. 123R, Share-Based Payment. The Statement requires an entity to measure cost of employee services received in exchange for an award of equity instruments based on the grant-date fair value of the award. That cost will be recognized over the period during which an employee is required to provide service in exchange for the award-the requisite service period. The Partnership does not believe SFAS 123R will have significant impact on the Partnership’s consolidated financial position or results of operation. SFAS No. 123(R) will become applicable to the Partnership beginning January 1, 2006.
In May 2005, the FASB issued SFAS No. 154, “Accounting Changes and Error Corrections” (“SFAS No. 154”) which supersedes APB Opinion No. 20, “Accounting Changes” and SFAS No. 3 “Reporting Accounting Changes in Interim Financial Statements”. SFAS No. 154 changes the requirements for accounting for and reporting of changes in accounting principle. The statement requires the retroactive application to prior periods’ financial statements of changes in accounting principles, unless it is impracticable to determine either the period specific effects or the cumulative effect of the change. SFAS No. 154 does not change the guidance for reporting the correction of an error in previously issued financial statements or the change in accounting estimate. SFAS No. 154 is effective for accounting changes and corrections of errors made in fiscal years beginning after December 15, 2005. The Partnership does not believe SFAS No. 154 will have a significant impact on the Partnership’s consolidated financial position or results of operations.
2. Debt
On February 11, 2005, the Partnership, WS Financing Corp. (“WS Financing”), the wholly-owned domestic subsidiaries of the Partnership parties thereto as guarantors (the “Guarantor Subsidiaries”) and The Bank of New York Trust Company, N.A., as trustee, entered into an Indenture (the “Indenture”) as part of the Partnership’s and WS Financing’s refinancing transactions (the “Refinancing Transactions”). Pursuant to the Indenture, the Partnership and WS Financing issued $300,000 of Senior Second Lien Secured Floating Rate Notes due 2011 (the “New Notes”), secured on a second priority basis by substantially all of the assets of the Partnership, WS Financing and the Guarantor Subsidiaries. In connection with the closing under the Indenture, the New Notes were sold in a private placement and resold by the initial purchasers to qualified institutional buyers pursuant to Rule 144A of the Securities Act of 1933 (the “Securities Act”) and to non-U.S. persons pursuant to Regulation S of the Securities Act. On April 29, 2005, the Partnership filed a Form S-4 with the Securities and Exchange Commission (“SEC”) to offer to exchange the New Notes for substantially identical notes that will have been registered with the SEC.
In addition, in connection with the Refinancing Transactions, on February 11, 2005, the Partnership, as borrower, WTI, and WS Holdings entered into a new credit agreement (the “Credit Agreement”) with J.P. Morgan Securities Inc. and UBS Securities LLC, as joint advisors, J.P. Morgan Securities Inc., UBS Securities LLC and Lehman Brothers Inc., as joint book-runners, J.P. Morgan Securities Inc., UBS Securities LLC, Lehman Brothers Inc., Deutsche Bank Securities Inc. and Goldman Sachs Credit Partners L.P., as joint lead arrangers, UBS Securities LLC, as syndication agent, Lehman Commercial Paper Inc., Deutsche Bank Securities Inc. and Goldman Sachs Credit Partners L.P., as documentation agents, JPMorgan Chase Bank, N.A., as administrative agent, and the several banks and other financial institutions or entities from time to time party thereto (the “Lenders”). In connection with the closing under the Credit Agreement, the Lenders made available to the Partnership a new senior credit facility (the “New Senior Credit Facility”) consisting of a revolving credit facility in the amount of $40,000 and a new term loan facility (the “New Term Loan”) in the amount of $450,000.
The net proceeds to the Partnership from the sale of the New Notes and the closing of the New Senior Credit Facility, along with available cash of the Partnership, were used to (i)(a) repay approximately $57,488 of the outstanding balance of the then-existing senior term loan including any accrued and unpaid interest then outstanding under the Partnership’s then-existing senior credit facility (the “Old Credit Facility”) and (b) terminate all commitments then outstanding under the Old Credit Facility, (ii) accept for purchase pursuant to the cash tender offer for any and all of the Partnership’s outstanding 9 5/8% Senior Notes due 2011 (the “Old Notes”) approximately $279,350 of Old Notes validly tendered prior to the consent date (more than 99 1¤2% of the total aggregate principal amount of $280,000 of Old Notes previously outstanding), and pay those holders the total purchase price of $1,171.64, including a consent payment related to the solicitation of the holders’ consent to the elimination of substantially all of the covenants contained in the indenture related to the Old Notes, for each $1,000.00 principal amount of Old Notes tendered in accordance with the Partnership’s and WS Financing’s Offer to Purchase and Consent Solicitation Statement and Letter of Transmittal and Consent (the “Offer to Purchase and Consent Solicitation Statement”), plus accrued and unpaid interest on the Old Notes, for an aggregate total purchase price of $331,405, and accept for purchase and pay for an additional $150 of Old Notes tendered after February 4, 2005 but prior to February 22, 2005, the expiration time of the tender offer, and pay those holders the purchase price of $1,141.64 for each
8
$1,000.00 principal amount of old notes tendered in accordance with the Offer to Purchase and Consent Solicitation Statement for an aggregate purchase price of $174, (iii) redeem outstanding WTI Preferred Stock at a redemption price equal to the face amount of the WTI Preferred Stock plus accrued and unpaid dividends thereon (including Additional Dividends (as defined in WTI’s Amended and Restated Certificate of Incorporation)) to the redemption date for a total redemption price of approximately $375,729, (iv) pay the Consent Fee (as defined below) to the Funds (as defined below) and (v) pay fees and expenses related to the Refinancing Transactions.
In addition, in connection with the Refinancing Transactions, on February 16, 2005, WTI, CVC Capital Funding, LLC (“CVC Capital”) and Citicorp Mezzanine III, L.P. (“CMIII,” and together with CVC Capital, the “Funds”) entered into an Exchange Agreement (the “Exchange Agreement”). In connection with the closing under the Exchange Agreement, WTI issued $43,630 aggregate principal amount of its new Subordinated Notes due 2013 (the “Holdco Notes”) to the Funds and paid $365 in accrued and unpaid interest in exchange for the surrender and cancellation by the Funds of all of the obligations owing by WTI to the Funds under each Fund’s interest in that certain Subordinated Note (the “Seller Note”), dated as of June 30, 2003, made by WTI in favor of American Airlines (which was subsequently transferred in part to each of the Funds). WTI also paid the Funds a total of $8,638 as a consent fee (the “Consent Fee”) in return for the approval by the Funds of the Refinancing Transactions and the replacement of the Seller Note with the Holdco Notes.
To finance the redemption of the WTI Preferred Stock and the payment of the Consent Fee, the Partnership distributed $375,729 and $8,638, respectively, to WTI.
As a result of the Refinancing Transactions described above, the Partnership recorded a loss on extinguishment of debt of $55,597 during the six months ended June 30, 2005.
At the Partnership’s option, the interest rate applied to borrowings under the New Term Loan during 2005 was based on the LIBOR rate plus the initial applicable margin of 2.75%. The interest rate applicable to borrowings under the New Notes is based on the three-month LIBOR rate plus 6.25%.
On March 4, 2005, the Partnership entered into an interest rate swap with a notional amount that will start at $508,370 on November 15, 2005 and amortize on a quarterly basis to $102,250 at November 15, 2008. The reset dates on the swap are February 15, May 15, August 15 and November 15 of each year until maturity on November 15, 2008. This agreement, which has been designated as a cash flow hedge, will be used to convert the variable component of the interest rates on certain indebtedness to a fixed rate of 4.3%, effective November 15, 2005. Because the critical terms of the swap match those of the debt it is hedging, the swap is considered a perfect hedge against changes in the fair value of the debt and the hedge will result in no ineffectiveness being recognized in operations. Changes in the fair value of the swap are recognized as a component of accumulated other comprehensive income in each reporting period. As of June 30, 2005, the fair value of this swap was a liability of $2,350, which is included in other long-term liabilities in the condensed consolidated balance sheet.
Debt covenants contained in the Credit Agreement and the Indenture require the Partnership to maintain certain financial ratios, including a minimum interest coverage ratio and a maximum total leverage ratio. Also, the Indenture requires the Partnership to maintain a minimum fixed charge coverage ratio. In addition, certain non-financial covenants restrict the activities of the Partnership. As of June 30, 2005, the Partnership is in compliance with all of its debt covenants.
Long-term debt consisted of the following:
| | June 30, 2005 | |
| | | |
New Term loan under New Senior Credit Facility | | $ | 415,000 | |
New Notes | | 300,000 | |
Old Notes | | 500 | |
| | 715,500 | |
Less current portion of long-term debt | | 4,000 | |
Long-term debt, excluding current portion | | $ | 711,500 | |
During the six months ended June 30, 2005, the Partnership paid $35,000 in principal on the New Term Loan, of which $2,000 were scheduled principal payments. On August 1, 2005, the Partnership made a $12,000 discretionary principal payment on the New Term Loan.
9
3. Employee Benefit Plans
The components of net pension and postretirement costs were as follows:
| | Pension benefits | | Pension benefits | |
| | Three months
ended | | Three months
ended | | Six months
ended | | Six months
ended | |
| | June 30,
2005 | | June 30,
2004 | | June 30,
2005 | | June 30,
2004 | |
Service cost | | $ | — | | $ | — | | $ | — | | $ | — | |
Interest cost | | 2,892 | | 2,762 | | 5,785 | | 5,524 | |
Expected return on plan assets | | (3,656 | ) | (3,389 | ) | (7,312 | ) | (6,778 | ) |
Amortization of transition obligation | | — | | — | | — | | — | |
Amortization of prior service cost | | — | | — | | — | | — | |
Recognized net actuarial loss | | 27 | | — | | 54 | | — | |
Net periodic pension benefit (income) expense | | $ | (737 | ) | $ | (627 | ) | $ | (1,473 | ) | $ | (1,254 | ) |
| | Postretirement benefits | | Postretirement benefits | |
| | Three months
ended
June 30,
2005 | | Three months
ended
June 30,
2004 | | Six months
ended
June 30,
2005 | | Six months
ended
June 30,
2004 | |
Service cost | | $ | 66 | | $ | 82 | | $ | 132 | | $ | 164 | |
Interest cost | | 407 | | 418 | | 813 | | 836 | |
Expected return on plan assets | | — | | — | | — | | — | |
Amortization of transition obligation | | — | | — | | — | | — | |
Amortization of prior service cost | | — | | — | | — | | — | |
Recognized net actuarial loss | | — | | — | | — | | — | |
Net periodic pension benefit (income) expense | | $ | 473 | | $ | 500 | | $ | 945 | | $ | 1,000 | |
4. Related Party Transactions
In February 2005, the Partnership entered into a series of Refinancing Transactions. Certain of the parties to these transactions were related parties, including WTI, CVC and OTPP. See Note 2 for a full description of these matters.
In connection with the Refinancing Transactions, on February 16, 2005, the Partnership entered into an amendment to its Advisory Agreement with WTI to terminate all advisory and other fees payable under that agreement as of January 1, 2005 in return for a prepayment of $7,700 payable on or before December 15, 2005. The Partnership expects to make this prepayment in the third quarter of 2005.
On January 10, 2005, WTI entered into a Note Redemption Agreement (the “Note Redemption Agreement”) with Delta. Pursuant to the Note Redemption Agreement, WTI redeemed the 10% Subordinated Note due 2012 in an original principal amount of $45,000 issued by WTI to Delta on June 30, 2003, the additional notes issued in lieu of cash interest and all accrued and unpaid interest up to January 10, 2005 for $36,137. The Partnership distributed $36,137 to WTI to finance this transaction.
During the six months ended June 30, 2005, the Partnership distributed $4,700 to WTI to enable WTI to pay income taxes that it owed on the income generated by the Partnership in the United States and $1,587 to enable WTI to pay interest payments on the Holdco Notes.
5. Commitments and Contingencies
In September 2003, the Partnership received multiple assessments totaling €39,503 from the tax authorities of Greece relating to tax years 1993-2002. The Partnership filed appeals of these assessments. Pursuant to a formal tax amnesty program with the Greek authorities, the Partnership recently reached a settlement of the outstanding assessments in an amount of approximately €7,775. The Partnership Interest Purchase Agreement, dated March 3, 2003, provides that each of the founding airlines shall severally indemnify WTI and hold WTI harmless on a net after-tax basis from and against any and all taxes of the Partnership and its subsidiaries related to periods prior to the sale of the Partnership on June 30, 2003. The Partnership informed the founding airlines of the receipt of these assessments and the indemnity obligation of the founding airlines under the Partnership Interest Purchase Agreement. Because of the indemnity provision, the Partnership believes that amounts paid to settle this assessment will be reimbursed by the founding airlines and will not have an effect on the Partnership’s financial position or results of operations. As of June 30, 2005, the balance of the amounts due from the founding airlines was €3,459. American has paid its share in full while Delta and Northwest are also current in their respective reimbursement payments to us. The remaining balance is scheduled to be repaid in monthly installments through June 2006.
6. Other Significant Events
On May 5, 2004, the Partnership announced that it had been informed by Expedia that it intends to move a portion of its transactions to another GDS provider in order to diversify its GDS relationships beyond using a single provider to process substantially all of its GDS transactions. Expedia has not specified the volumes or percentages of volumes it intends to process through this other GDS. To date, the announced movement of Expedia’s transactions has not yet occurred.
10
7. Business Segment Information
The Partnership’s operations are classified into two reportable business segments: electronic travel distribution and information technology services. The Partnership’s two reportable business segments are managed separately based on fundamental differences in their operations. In addition, each business segment offers different products and services. The electronic travel distribution segment distributes travel services of its suppliers to subscribers of the Worldspan GDS. By having access to the Worldspan GDS, subscribers are able to book reservations with the suppliers. The information technology services segment provides technology services to Delta and Northwest and other companies in the travel industry.
The Partnership evaluates performance and allocates resources based on operating income. The accounting policies of the reportable segments are the same as those described in the summary of significant accounting policies. There are no intersegment sales.
| | Three months ended | | Six months ended | |
| | June 30,
2005 | | June 30,
2004 | | June 30,
2005 | | June 30,
2004 | |
| | | | | | | | | |
Revenues | | | | | | | | | |
Electronic travel distribution | | $ | 227,481 | | $ | 232,487 | | $ | 469,439 | | $ | 465,026 | |
Information technology services | | 18,150 | | 16,317 | | 36,774 | | 32,309 | |
Total revenues | | $ | 245,631 | | $ | 248,804 | | $ | 506,213 | | $ | 497,335 | |
Operating income | | | | | | | | | |
Electronic travel distribution | | $ | 44,261 | | $ | 38,158 | | $ | 86,043 | | $ | 74,691 | |
Information technology services | | (8,661 | ) | (7,045 | ) | (15,452 | ) | (16,187 | ) |
Total operating income | | $ | 35,600 | | $ | 31,113 | | $ | 70,591 | | $ | 58,504 | |
Depreciation and amortization | | | | | | | | | |
Electronic travel distribution | | $ | 19,399 | | $ | 22,743 | | $ | 39,074 | | $ | 43,226 | |
Information technology services | | 6,889 | | 3,278 | | 12,113 | | 7,858 | |
Total depreciation and amortization | | $ | 26,288 | | $ | 26,021 | | $ | 51,187 | | $ | 51,084 | |
Our principal administrative, marketing, product development and technical operations are located in the United States. Areas of operation outside of North America include EMEA and Latin America which are primarily composed of selling and marketing functions.
The following table includes selected interim financial information for the three and six months ended June 30, 2005 and 2004 related to our geographic areas.
| | Three months ended | | Six months ended | |
| | June 30,
2005 | | June 30,
2004 | | June 30,
2005 | | June 30,
2004 | |
| | | | | | | | | |
Geographic areas | | | | | | | | | |
Total revenues | | | | | | | | | |
United States | | $ | 207,708 | | $ | 210,949 | | $ | 430,874 | | $ | 424,156 | |
Foreign | | 37,923 | | 37,855 | | 75,339 | | 73,179 | |
Total | | $ | 245,631 | | $ | 248,804 | | $ | 506,213 | | $ | 497,335 | |
Long-lived assets | | | | | | | | | |
United States | | $ | 809,235 | | $ | 902,970 | | $ | 809,235 | | $ | 902,970 | |
Foreign | | 29,551 | | 31,904 | | 29,551 | | 31,904 | |
Total | | $ | 838,786 | | $ | 934,874 | | $ | 838,786 | | $ | 934,874 | |
8. Supplemental Guarantor/Non-Guarantor Financial Information
Concurrent with the closing of the Acquisition discussed in Note 1, the Old Notes became fully and unconditionally guaranteed on a senior unsecured basis by the domestic operations and assets of the Partnership (referred to as “Worldspan, L.P.—Guarantor” in the accompanying financial information). Included in Worldspan, L.P.—Guarantor are Worldspan, L.P. and all of its wholly-owned domestic subsidiaries including WS Financing. These domestic subsidiaries also fully and unconditionally guarantee on a senior secured basis the New Notes. These domestic subsidiaries collectively represent less than one percent of the Partnership’s total assets, Partners’ capital, total revenues, net income (loss), and cash flows from operating activities. The guarantees of each of the legal entities comprised by Worldspan, L.P.—Guarantor are joint and several. The foreign subsidiaries (referred to as “Non-Guarantor
11
Subsidiaries” in the accompanying financial information) represent the foreign operations of the Partnership. WS Financing, the co-issuer of the Old Notes and the New Notes, was incorporated on June 6, 2003. WS Financing does not have any substantial operations, assets or revenues. The following financial information presents condensed consolidating balance sheets, statements of operations and statements of cash flows for Worldspan, L.P.—Guarantor and Non-Guarantor Subsidiaries. The information has been presented as if Worldspan, L.P.—Guarantor accounted for its ownership of the Non-Guarantor Subsidiaries using the equity method of accounting.
Condensed Consolidating Balance Sheets
as of June 30, 2005
(dollars in thousands)
| | Worldspan, L.P.—
Guarantor | | Non-Guarantor
Subsidiaries | | Eliminating
Entries | | Worldspan
Consolidated | |
| | | | | | | | | |
Assets | | | | | | | | | |
Current assets | | | | | | | | | |
Cash and cash equivalents | | $ | 38,643 | | $ | 6,308 | | $ | — | | $ | 44,951 | |
Trade accounts receivable, net | | 132,844 | | 1,831 | | — | | 134,675 | |
Prepaid expenses and other current assets | | 15,973 | | 2,940 | | — | | 18,913 | |
Total current assets | | 187,460 | | 11,079 | | — | | 198,539 | |
Property and equipment, net | | 98,634 | | 5,843 | | — | | 104,477 | |
Deferred charges | | 14,436 | | 13,667 | | — | | 28,103 | |
Debt issuance costs | | 16,264 | | — | | — | | 16,264 | |
Supplier and agency relationships, net | | 254,154 | | — | | — | | 254,154 | |
Developed technology, net | | 194,094 | | — | | — | | 194,094 | |
Trade name | | 72,142 | | — | | — | | 72,142 | |
Goodwill | | 112,035 | | — | | — | | 112,035 | |
Other intangible assets, net | | 30,510 | | — | | — | | 30,510 | |
Investments in subsidiaries | | 25,291 | | — | | (25,291 | ) | — | |
Other long-term assets | | 16,965 | | 10,042 | | — | | 27,007 | |
Total assets | | $ | 1,021,985 | | $ | 40,631 | | $ | (25,291 | ) | $ | 1,037,325 | |
| | | | | | | | | |
Liabilities and Partners’ Capital | | | | | | | | | |
Current liabilities | | | | | | | | | |
Accounts payable | | $ | 9,913 | | $ | 4,170 | | $ | — | | $ | 14,083 | |
Intercompany accounts payable (receivable) | | 26,792 | | (26,792 | ) | — | | — | |
Accrued expenses | | 121,789 | | 38,062 | | — | | 159,851 | |
Current portion of capital lease obligations | | 18,712 | | — | | — | | 18,712 | |
Current portion of senior debt | | 4,000 | | — | | — | | 4,000 | |
Total current liabilities | | 181,206 | | 15,440 | | — | | 196,646 | |
Long-term portion of capital lease obligations | | 45,602 | | — | | — | | 45,602 | |
Long-term debt | | 711,500 | | — | | — | | 711,500 | |
Pension and postretirement benefits | | 62,435 | | (42 | ) | — | | 62,393 | |
Other long-term liabilities | | 13,717 | | (58 | ) | — | | 13,659 | |
Total liabilities | | 1,014,460 | | 15,340 | | — | | 1,029,800 | |
Commitments and contingencies | | | | | | | | | |
Partners’ capital | | 7,525 | | 25,291 | | (25,291 | ) | 7,525 | |
Total liabilities and partners’ capital | | $ | 1,021,985 | | $ | 40,631 | | $ | (25,291 | ) | $ | 1,037,325 | |
12
Condensed Consolidating Balance Sheets
as of December 31, 2004
(dollars in thousands)
| | Worldspan, L.P.—
Guarantor | | Non-Guarantor
Subsidiaries | | Eliminating
Entries | | Worldspan
Consolidated | |
| | | | | | | | | |
Assets | | | | | | | | | |
Current assets | | | | | | | | | |
Cash and cash equivalents | | $ | 96,504 | | $ | 3,970 | | $ | — | | $ | 100,474 | |
Trade accounts receivable, net | | 99,646 | | 3,147 | | — | | 102,793 | |
Prepaid expenses and other current assets | | 18,729 | | 2,577 | | — | | 21,306 | |
Total current assets | | 214,879 | | 9,694 | | — | | 224,573 | |
Property and equipment, net | | 111,972 | | 6,246 | | — | | 118,218 | |
Deferred charges | | 15,956 | | 18,395 | | — | | 34,351 | |
Debt issuance costs, net | | 10,201 | | — | | — | | 10,201 | |
Supplier and agency relationships, net | | 271,020 | | — | | — | | 271,020 | |
Developed technology, net | | 206,664 | | 138 | | — | | 206,802 | |
Trade name | | 72,142 | | — | | — | | 72,142 | |
Goodwill | | 112,035 | | — | | — | | 112,035 | |
Other intangible assets, net | | 31,914 | | — | | — | | 31,914 | |
Investments in subsidiaries | | 14,165 | | — | | (14,165 | ) | — | |
Other long-term assets | | 20,187 | | 10,843 | | — | | 31,030 | |
Total assets | | $ | 1,081,135 | | $ | 45,316 | | $ | (14,165 | ) | $ | 1,112,286 | |
| | | | | | | | | |
Liabilities and Partners’ Capital | | | | | | | | | |
Current liabilities | | | | | | | | | |
Accounts payable | | $ | 11,926 | | $ | 2,745 | | $ | — | | $ | 14,671 | |
Intercompany accounts payable (receivable) | | 15,305 | | (15,305 | ) | — | | — | |
Accrued expenses | | 115,682 | | 40,953 | | — | | 156,635 | |
Current portion of capital lease obligations | | 19,369 | | — | | — | | 19,369 | |
Current portion of long-term debt | | 12,497 | | — | | — | | 12,497 | |
Total current liabilities | | 174,779 | | 28,393 | | — | | 203,172 | |
Long-term portion of capital lease obligations | | 54,079 | | — | | — | | 54,079 | |
Long-term debt | | 324,990 | | — | | — | | 324,990 | |
Pension and postretirement benefits | | 64,821 | | (42 | ) | — | | 64,779 | |
Other long-term liabilities | | 11,067 | | 2,800 | | — | | 13,867 | |
Total liabilities | | 629,736 | | 31,151 | | — | | 660,887 | |
Commitments and contingencies | | | | | | | | | |
Partners’ capital | | 451,399 | | 14,165 | | (14,165 | ) | 451,399 | |
Total liabilities and partners’ capital | | $ | 1,081,135 | | $ | 45,316 | | $ | (14,165 | ) | $ | 1,112,286 | |
13
Condensed Consolidating Statements of Operations
for the Three Months Ended June 30, 2005
(dollars in thousands)
| | Worldspan, L.P.—
Guarantor | | Non-Guarantor
Subsidiaries | | Eliminating
Entries | | Worldspan
Consolidated | |
| | | | | | | | | |
Revenues | | $ | 207,708 | | $ | 37,923 | | $ | — | | $ | 245,631 | |
Operating expenses | | 178,510 | | 31,521 | | — | | 210, 031 | |
Operating income | | 29,198 | | 6,402 | | — | | 35,600 | |
Other income (expense) | | | | | | | | | |
Interest (expense) income, net | | (15,584 | ) | 11 | | — | | (15,573 | ) |
Income from subsidiaries | | 5,070 | | — | | (5,070 | ) | — | |
Other, net | | (207 | ) | 196 | | — | | (11 | ) |
Total other (expense) income, net | | (10,721 | ) | 207 | | (5,070 | ) | (15,584 | ) |
Income before income taxes | | 18,477 | | 6,609 | | (5,070 | ) | 20,016 | |
Income tax expense | | — | | 1,539 | | — | | 1,539 | |
Net income | | $ | 18,477 | | $ | 5,070 | | $ | (5,070 | ) | $ | 18,477 | |
Condensed Consolidating Statements of Operations
for the Three Months Ended June 30, 2004
(dollars in thousands)
| | Worldspan, L.P.—
Guarantor | | Non-Guarantor
Subsidiaries | | Eliminating
Entries | | Worldspan
Consolidated | |
| | | | | | | | | |
Revenues | | $ | 210,949 | | $ | 37,855 | �� | $ | — | | $ | 248,804 | |
Operating expenses | | 185,031 | | 32,660 | | — | | 217,691 | |
Operating income | | 25,918 | | 5,195 | | — | | 31,113 | |
Other income (expense) | | | | | | | | | |
Interest (expense) income, net | | (9,963 | ) | 3 | | — | | (9,960 | ) |
Income from subsidiaries | | 5,471 | | — | | (5,471 | ) | — | |
Other, net | | 87 | | 346 | | — | | 433 | |
Total other (expense) income, net | | (4,405 | ) | 349 | | (5,471 | ) | (9,527 | ) |
Income before income taxes | | 21,513 | | 5,544 | | (5,471 | ) | 21,586 | |
Income tax expense | | — | | 73 | | — | | 73 | |
Net income | | $ | 21,513 | | $ | 5,471 | | $ | (5,471 | ) | $ | 21,513 | |
14
Condensed Consolidating Statements of Operations
for the Six Months Ended June 30, 2005
(dollars in thousands)
| | Worldspan, L.P.—
Guarantor | | Non-Guarantor
Subsidiaries | | Eliminating
Entries | | Worldspan
Consolidated | |
| | | | | | | | | |
Revenues | | $ | 430,874 | | $ | 75,339 | | $ | — | | $ | 506,213 | |
Operating expenses | | 368,611 | | 67,011 | | — | | 435,622 | |
Operating income | | 62,263 | | 8,328 | | — | | 70,591 | |
Other income (expense) | | | | | | | | | |
Interest (expense) income, net | | (27,973 | ) | 71 | | — | | (27,902 | ) |
Loss on extinguishment of debt | | (55,597 | ) | — | | — | | (55,597 | ) |
Income from subsidiaries | | 5,603 | | — | | (5,603 | ) | — | |
Other, net | | 119 | | (339 | ) | — | | (220 | ) |
Total other expense, net | | (77,848 | ) | (268 | ) | (5,603 | ) | (83,719 | ) |
(Loss) income before income taxes | | (15,585 | ) | 8,060 | | (5,603 | ) | (13,128 | ) |
Income tax expense | | — | | 2,457 | | — | | 2,457 | |
Net (loss) income | | $ | (15,585 | ) | $ | 5,603 | | $ | (5,603 | ) | $ | (15,585 | ) |
Condensed Consolidating Statements of Operations
for the Six Months Ended June 30, 2004
(dollars in thousands)
| | Worldspan, L.P.—
Guarantor | | Non-Guarantor
Subsidiaries | | Eliminating
Entries | | Worldspan
Consolidated | |
| | | | | | | | | |
Revenues | | $ | 424,156 | | $ | 73,179 | | $ | — | | $ | 497,335 | |
Operating expenses | | 372,861 | | 65,970 | | — | | 438,831 | |
Operating income | | 51,295 | | 7,209 | | — | | 58,504 | |
Other income (expense) | | | | | | | | | |
Interest (expense) income | | (20,712 | ) | 58 | | — | | (20,654 | ) |
Income from subsidiaries | | 7,050 | | — | | (7,050 | ) | — | |
Other, net | | 30 | | 88 | | — | | 118 | |
Total other (expense) income, net | | (13,632 | ) | 146 | | (7,050 | ) | (20,536 | ) |
Income before income taxes | | 37,663 | | 7,355 | | (7,050 | ) | 37,968 | |
Income tax (benefit) expense | | (3 | ) | 305 | | — | | 302 | |
Net income | | $ | 37,666 | | $ | 7,050 | | $ | (7,050 | ) | $ | 37,666 | |
15
Condensed Consolidating Statements of Cash Flows
for the Six Months Ended June 30, 2005
(dollars in thousands)
| | Worldspan, L.P.—
Guarantor | | Non-Guarantor
Subsidiaries | | Eliminating
Entries | | Worldspan
Consolidated | |
| | | | | | | | | |
Net cash provided by (used in) operating activities | | $ | 80,446 | | $ | (7,429 | ) | $ | — | | $ | 73,017 | |
Cash flows from investing activities: | | | | | | | | | |
Purchase of property and equipment | | (5,240 | ) | (1,361 | ) | — | | (6,601 | ) |
Proceeds from sale of property and equipment | | 77 | | — | | — | | 77 | |
Capitalized software development costs | | (19 | ) | — | | — | | (19 | ) |
Investment in subsidiaries | | (11,126 | ) | | | 11,126 | | | |
Net cash provided used in investing activities | | (16,308 | ) | (1,361 | ) | 11,126 | | (6,543 | ) |
Cash flows from financing activities: | | | | | | | | | |
Proceeds from issuance of debt, net of debt issuance costs | | 734,801 | | — | | — | | 734,801 | |
Principal payments on capital leases | | (9,517 | ) | — | | — | | (9,517 | ) |
Principal payments on debt | | (92,488 | ) | — | | — | | (92,488 | ) |
Repurchase old notes | | (327,555 | ) | — | | — | | (327,555 | ) |
Distribution to and contributions from WTI, net | | (427,238 | ) | — | | — | | (427,238 | ) |
Contributions to subsidiaries | | — | | 11,126 | | (11,126 | ) | — | |
Net cash (used in) provided by financing activities | | (121,997 | ) | 11,126 | | (11,126 | ) | (121,997 | ) |
Net decrease in cash and cash equivalents | | (57,859 | ) | 2,336 | | — | | (55,523 | ) |
Cash and cash equivalents at beginning of period | | 96,504 | | 3,970 | | — | | 100,474 | |
Cash and cash equivalents at end of period | | $ | 38,645 | | $ | 6,306 | | $ | — | | $ | 44,951 | |
Condensed Consolidating Statements of Cash Flows
for the Six Months Ended June 30, 2004
| | Worldspan, L.P.—
Guarantor | | Non-Guarantor
Subsidiaries | | Eliminating
Entries | | Worldspan
Consolidated | |
| | | | | | | | | |
Net cash provided by (used in) operating activities | | $ | 96,753 | | $ | (6,341 | ) | $ | — | | $ | 90,412 | |
Cash flows from investing activities: | | | | | | | | | |
Purchase of property and equipment | | (5,614 | ) | (1,745 | ) | — | | (7,359 | ) |
Proceeds from sale of property and equipment | | 82 | | 10 | | — | | 92 | |
Capitalized software for internal use | | (744 | ) | — | | — | | (744 | ) |
Investments in subsidiaries | | (7,793 | ) | — | | 7,793 | | — | |
Net cash used in investing activities | | (14,069 | ) | (1,735 | ) | 7,793 | | (8,011 | ) |
Cash flows from financing activities: | | | | | | | | | |
Distribution to WTI | | (3,464 | ) | — | | — | | (3,464 | ) |
Principal payments on capital leases | | (10,969 | ) | — | | — | | (10,969 | ) |
Principal payments on debt | | (38,256 | ) | — | | — | | (38,256 | ) |
Contributions to subsidiaries | | — | | 7,793 | | (7,793 | ) | — | |
Net cash (used in) provided by financing activities | | (52,689 | ) | 7,793 | | (7,793 | ) | (52,689 | ) |
Net increase (decrease) in cash and cash equivalents | | 29,995 | | (283 | ) | — | | 29,712 | |
Cash and cash equivalents at beginning of year | | 41,615 | | 2,131 | | — | | 43,746 | |
Cash and cash equivalents at end of year | | $ | 71,610 | | $ | 1,848 | | $ | — | | $ | 73,458 | |
16
9. Goodwill and Other Intangible Assets
Goodwill and other intangible assets consisted of the following:
| | | | Successor Basis | |
| | | | December 31, 2004 | | June 30, 2005 | |
| | Estimated
Useful Life | | Cost | | Accumulated
Amortization | | Cost | | Accumulated
Amortization | |
Supplier and agency relationships | | 8-11 years | | $ | 321,618 | | $ | 50,598 | | $ | 321,618 | | $ | 67,464 | |
Information technology services contracts | | 5-15 years | | 36,126 | | 4,212 | | 36,126 | | 5,616 | |
Developed technology | | 5-11 years | | 239,947 | | 33,145 | | 239,828 | | 45,734 | |
Goodwill | | Indefinite | | 112,035 | | — | | 112,035 | | — | |
Trade name | | Indefinite | | 72,142 | | — | | 72,142 | | — | |
| | | | $ | 781,868 | | $ | 87,955 | | $ | 781,749 | | $ | 118,814 | |
During the three months ended June 30, 2005, the Partnership recorded a $1,500 writedown of certain purchased software to be enhanced and ultimately used in multi-hosting services for smaller carriers. The carrying value of the software was written down to zero as a result of management’s decision to pursue other third party solutions as a means to provide these services to smaller carriers as well as management’s current evaluation of the current and potential revenue stream, among other factors. The writedown is included in “Developed technology amortization” in the accompanying consolidated statement of operations.
The Partnership recorded amortization expense for its amortized intangible assets of $16,026 and $14,642 for the three months ended June 30, 2005 and 2004, respectively and $30,859 and $29,285 for the six months ended June 30, 2005 and 2004, respectively. Estimated amortization expense for the Partnership’s intangible assets, excluding the $30,859 amortization recorded for the six months ended June 30, 2005, is as follows:
Year Ended December 31, | | | |
2005 | | $ | 29,110 | |
2006 | | 58,220 | |
2007 | | 58,124 | |
2008 | | 57,765 | |
2009 | | 57,491 | |
Thereafter | | 218,048 | |
| | $ | 478,758 | |
10. Subsequent Events
On July 20, 2005, the Partnership announced a reduction in force of approximately 70 employees. The reduction was the result of improved organizational efficiency and the outsourcing of programming for certain applications. The Partnership will record a charge for severance and benefits in the third quarter of 2005 of approximately $1,200. We anticipate these obligations to be paid in the third and fourth quarters of 2005 through internally generated funds.
17
ITEM 2. MANAGEMENT’S DISCUSSION AND ANALYSIS OF FINANCIAL CONDITION AND RESULTS OF OPERATIONS
References to “WTI” refer to Worldspan Technologies Inc. References to the “company” refer to Worldspan, L.P. The terms “we”, “us”, “our” and other similar terms refer to the consolidated businesses of the company and all of its subsidiaries. References to the “Acquisition” refer to the acquisition by WTI, of our general partnership interests and, through its wholly-owned subsidiaries, limited partnership interests. The following discussion and analysis of the financial condition and results of operations should be read in conjunction with the consolidated financial statements and related notes included in our annual report on Form 10-K filed with the Securities and Exchange Commission on March 28, 2005.
Overview
We are a provider of mission-critical transaction processing and information technology services to the global travel industry. We provide subscribers (including traditional travel agencies, online travel agencies and corporate travel departments) with real-time access to schedule, price, availability and other travel information and the ability to process reservations and issue tickets for the products and services of approximately 800 travel suppliers (such as airlines, hotels, car rental companies, tour companies and cruise lines) throughout the world. Globally, we are the largest transaction processor for online travel agencies, having processed approximately 63% of all global distribution system, or GDS, online air transactions during the twelve months ended June 30, 2005. In the United States (the world’s largest travel market), we are the second largest transaction processor for travel agencies, accounting for 32% of GDS air transactions and approximately 66% of online GDS air transactions processed during the twelve months ended June 30, 2005. During the twelve months ended June 30, 2005, we processed approximately 205 million transactions. We also provide information technology services to the travel industry, primarily airline internal reservation systems, flight operations technology and software development.
Our relationships with four of the largest online travel agencies in the world have positioned us well to take advantage of the continuing shift to the online travel agency channel, where we have a higher market share. We believe our strong position in the online travel agency channel has allowed us to increase our airline transaction volume, despite the difficult times in the travel industry since 2001. Total transactions for the twelve months ended June 30, 2005, including airline and hospitality and destination services, were up 1.8% compared to the same period in 2004.
As a result of the market conditions and industry pressures described above, we took steps to reduce our operating expenses. We have reduced personnel cost through targeted reductions in the number of personnel and personnel related costs such as benefit plans and pension plans and increased the use of offshore resources to reduce the cost of application development and travel agency support functions. We have renegotiated our network, technology and communication contracts with our primary providers in the first quarter of 2004. In addition, we have pursued a strategy to move customers from Worldspan sponsored networks to third party sponsored networks. These actions have led to decreases in our network and communication expenses in both 2004 and 2005. Each of these actions has generated cost savings which are expected to continue in future years; however, the actual amount of our ongoing expenses may ultimately be impacted by other environmental factors such as changes in healthcare and technology costs and usage, which we are unable to predict.
We depend upon a relatively small number of airlines and online travel agencies for a significant portion of our revenues. Our five largest airline relationships represented an aggregate of approximately 50% and 51% of our total revenues for the twelve months ended June 30, 2005 and December 31, 2004, respectively, while our top ten largest airline relationships represented an aggregate of approximately 63% and 64% of our total revenues for the twelve months ended June 30, 2005 and December 31, 2004, respectively. Our relationships with four online travel agencies, Expedia, Hotwire, Orbitz and Priceline, represented 50% of our total transactions during the twelve months ended June 30, 2005. We expect to continue to depend upon a relatively small number of airlines and online travel agencies for a significant portion of our revenues.
Supplier Content, Transaction Fees and Transaction Volume
A development within the GDS industry over the past several years involves the competitive need for GDSs to maintain full content, including web fare content, for distribution to traditional and online agency subscribers. Historically, we have increased the transaction fees we collect from our airline suppliers, which pay a substantial portion of our transaction fees. We anticipate that this historic trend of annual transaction fee increases could be reduced in the future due to our current fare content agreements with major airlines. For instance, we have entered into fare content agreements with American Airlines, British Airways, Continental Airlines, Delta, Northwest, United Air Lines and US Airways. Generally, in these agreements, the airlines commit (subject to the exceptions contained in the agreements) to provide the traditional and online travel agencies covered by the agreements in the territories covered by the agreements with substantially the same fare content it provides to the travel agency subscribers of other GDSs (including web fares) in exchange for payments from us and/or discounts in transaction fees to each airline and subject to us keeping steady the average transaction fees paid by each airline for travel agency transactions in the territories covered by the agreements. In addition,
18
pursuant to these agreements, each airline has agreed, among other things, to commit to the highest level of participation in our GDS. Subject to termination rights, these obligations continue until late 2005 (in the case of US Airways), 2006 (with respect to the other contracted airlines) or 2007 (in the case of British Airways). We expect that these fare content agreements will provide our travel agencies in the territories covered by the agreements with access to improved content concerning the flights and fares of the participating airlines and other forms of non-discriminatory treatment.
We believe that obtaining similar fare content from our other major airline travel suppliers is important to our ability to compete, since other GDSs have also entered into fare content agreements with various airlines. Consequently, we are pursuing agreements similar to these fare content agreements with other major airlines in order to obtain access to such content. We expect that the fare content agreements will require us to make, in the aggregate, significant payments or other concessions to the participating airlines, which we expect will reduce our revenues. Further, should we fail to maintain competitive content, our traditional and online agency subscribers could move transactions from us to competitors with access to this content, thus negatively affecting the Partnership’s business, financial condition and results of operation.
Financial Conditions in the Airline Industry
The downturn in the commercial airline market, together with, and resulting from, the ongoing threat of terrorist acts after September 11, 2001, war in Iraq and rising fuel costs for commercial airlines, among other issues, have adversely affected the financial condition of many commercial airlines. Several major airlines are experiencing liquidity problems, some have sought bankruptcy protection and still others are considering, or may consider, bankruptcy relief. We derive a substantial portion of our revenues from transaction fees received directly from airlines and from the sale of products and services directly to airlines. In circumstances where an airline declares bankruptcy, we may be unable to collect our outstanding accounts receivable from the airline. In addition, the bankruptcy of the airline might result in reduced transaction fees and other revenues from the airline, a rejection by the airline of some or all of our agreements with it, or loss of the revenue by other means such as an airline liquidation, all of which could have a material adverse effect on our business, financial condition and results of operation.
Channel Shift
An increasing number of travel transactions are being made online. During the twelve months ended June 30, 2005, airline transactions generated through online travel agencies accounted for approximately 33% of all airline transactions in the United States processed by a GDS, up from approximately 31% in 2004, approximately 28% in 2003 and approximately 23% in 2002. Between 2002 and 2004, the number of airline transactions in the United States generated through online travel agencies and processed by us increased at a compound annual growth rate of 15.6%. We believe that this shift to online travel agency bookings will continue, but the extent and pace of the shift is difficult to anticipate. Other industry developments, such as Expedia’s announcement that it intends to move a portion of its transactions to another GDS provider, compound our difficulty in forecasting the growth of our transactions from online travel agencies. We typically pay a higher inducement per transaction to our large online travel agency customers than our traditional agencies. Accordingly, as we continue to experience significant channel shift, we expect our inducements cost to continue to grow and direct costs related to supporting traditional travel agencies to continue to decline.
Since 2001, the combination of channel shift, declines in the global economy, terrorist actions and threats, wars in Afghanistan and Iraq, and health concerns over SARS has resulted in annual declines in transactions generated by traditional travel agencies. As a result of these declines, we have completed restructuring activities in each of the last five years, which have largely been focused on reducing the operating costs associated with servicing traditional travel agencies in areas such as labor, network, agency hardware, and advertising.
Uncertainty in Transaction Volumes from Online Travel Agencies
Although we have historically processed most of the airline transactions for our online travel agencies, these agencies may move a portion of their business to other technologies and technology providers, subject to some contractual limitations. For example, Expedia announced in May 2004 that it intends to diversify its GDS relationships beyond using a single provider to process substantially all of its GDS transactions and that it intends to move a portion of its transactions to another GDS provider. Expedia has not specified the volumes or percentages of volumes it intends to process through this other GDS. To date, the announced movement of Expedia’s transactions has not occurred and, at this time, we cannot forecast the timing or magnitude of any such movement on our financial position or results of operations. In connection with the Acquisition, we recorded an intangible asset related to online customer contracts of $131.9 million, of which we estimate $35.2 million was related to the Expedia contract. Based on that estimate, the portion of this intangible asset that was unamortized as of June 30, 2005 was $26.4 million. Upon determination of the specific volumes, percentage of volumes or timing relating to Expedia’s announced agreement with the other GDS provider, we will further assess the impact, if any, on our overall financial condition as prescribed by Statement of Financial Accounting Standards (“SFAS”) No. 144, Accounting for the Impairment or Disposal of Long-Lived Assets, and SFAS No. 142, Goodwill and Other Intangible Assets. In addition, Orbitz has developed direct connections with travel suppliers which bypass our GDS. Further, Cendant Corporation recently acquired Orbitz. Cendant’s Travel Distribution Services Division includes Galileo, which is a competitor of ours. Orbitz is
19
one of our largest online travel agency customers. Our contract with Orbitz extends into 2011 subject to standard termination rights held by Orbitz including for-cause termination rights.
Although we currently continue to operate under these agreements, it is uncertain as to whether or not these and our other major online travel agencies will not attempt to terminate their respective agreements with us or otherwise move business to another GDS in the future. With this uncertainty, we cannot reliably forecast the volume of such transactions and may experience transaction volume decreases that result in a material adverse effect on our financial condition and operating results.
Neutrality
We do not own an online travel agency. Unlike our competitors, we have intentionally not pursued a strategy of vertical integration and instead have forged strategic partnerships with leading online travel agencies. Given the highly competitive nature of the travel agency business, we believe our customers value our neutrality. As the shift towards the online travel agency channel continues, we believe the traditional travel agencies will increasingly view the GDS-owned online travel agencies as competitive to their core business. As a result, our neutrality gives us an opportunity to capture additional business from both online and traditional travel agencies not owned by a GDS. However, to the extent that such agencies are acquired by or become affiliated with one of our competitors, the likelihood of our capturing additional business from those agencies may be reduced and our existing business with those agencies may be at risk.
FASA Credits
Pursuant to the terms of our founder airline services agreements, or FASAs, we provide FASA credits to Delta and Northwest to be applied against FASA service fee payments due from these airlines to us. The FASA credits are structured and will be applied through June 2012 in scheduled monthly installments up to an aggregate total of approximately $91.7 million to each of Delta and Northwest as of June 30, 2005, and are reflected as reductions of FASA revenue in the corresponding periods. In the event that the monthly FASA credits deliverable by us to Delta or Northwest are more than the FASA service fee payments due from the applicable airline, then we will be obligated to pay such excess to such airline in cash. Pursuant to a recent amendment of our FASA with Delta, Worldspan has the right, at its option, to terminate the FASA credits on or before December 31, 2005, in exchange for a one-time payment from us to Delta in an amount that varies depending upon when Worldspan elects to make the one-time payment. The one-time payment would be capitalized and amortized as a reduction of FASA revenue in the corresponding periods. See the section captioned “Liquidity and Capital Resources” below for further information on the FASA credits.
Business Segment Summary
Our revenues are primarily derived from transaction fees paid by our travel suppliers for electronic travel distribution services, and to a lesser extent, other transaction and subscription fees from our information technology services operations:
• Electronic travel distribution revenues are generated by charging a fee per transaction, which is generally paid by the travel supplier, based upon the number of transactions involved in the booking. We record and charge one transaction for each segment of an air travel itinerary (e.g., four transactions for a round-trip airline ticket with one connection each way). We record and charge one transaction for each car rental, hotel, cruise or tour company booking, regardless of the length of time associated with the booking. Fees paid by travel suppliers vary according to the levels of functionality at which they can participate in our GDS. These levels of functionality generally depend upon the type of communications and real-time access allowed with respect to the particular travel supplier’s internal systems. Revenues are based on the volume of transactions and are not dependent on the revenue earned by the supplier for that booking. We recognize revenue for airline travel transactions in the month the transactions are processed, net of cancellations processed in that month. Revenues for other types of travel transactions are recognized at the time the booking is used by the traveler. Although the substantial majority of our electronic travel distribution revenues are derived from transaction fees paid by travel suppliers, we have an agreement with Hotwire which does not follow this traditional business model. Under our agreement with Hotwire, we generally derive revenues from a service fee payable by Hotwire (rather than the travel supplier) based upon the number of travel transactions booked.
Set forth below is a chart illustrating the flow of payments in a typical consumer travel booking processed by us.
1 roundtrip airline ticket (one connection each way) | | 4 | transactions | |
1 car rental (3 days) | | 1 | transaction | |
1 hotel reservation (3 days) | | 1 | transaction | |
| | 6 | transactions | |
20
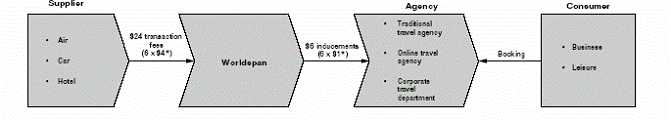
* Transaction and inducement fees are for illustrative purposes only.
• Information technology services revenues are generated by charging a fee for hosting travel supplier inventory, reservations, flight operations and other computer applications within our data center and by providing software development and maintenance services on those applications. Fees paid by travel suppliers are generally based upon the volume of messages processed on behalf of the travel supplier or software development hours performed on the travel supplier’s applications. In some cases, we charge fees for access to and usage of certain of our proprietary applications on a per transaction basis. Revenues for information technology services are recognized in the month that the services are provided and are recorded net of the value of the FASA credits earned in the case of Delta and Northwest in the corresponding month.
Our costs and expenses consist of the cost of electronic travel distribution and information technology services revenues, selling, general and administrative expenses and depreciation and amortization:
• Cost of electronic travel distribution revenues consists primarily of inducements paid to travel agencies, technology development and operations personnel, software costs, network costs, hardware leases, maintenance of computer and network hardware, the data center building, help desk and other travel agency support headcount. As our transactions from online travel agencies increase as a percent of our total transactions, we incur additional inducement and technology costs due to the average inducement paid to our large online customers typically exceeding the average inducement that we pay to traditional travel agencies and due to a higher volume of messages processed per transaction in the online channel compared to traditional travel agency transactions. Cost of information technology services revenues consists primarily of technology development and operations personnel, software costs, network costs, hardware leases, depreciation of computer hardware and the data center building, amortization of capitalized software and maintenance of computer and network hardware.
• Selling, general and administrative expenses consist primarily of sales and marketing, labor and associated costs, advertising services, professional fees, a portion of the expenses associated with our facilities, depreciation of computer equipment, furniture and fixtures and leasehold improvements, internal management costs and expenses for finance, legal, human resources and other administrative functions.
Critical Accounting Policies
The discussion and analysis of our financial condition and results of operations is based on our consolidated financial statements, which have been prepared in accordance with accounting principles generally accepted in the United States. The preparation of these financial statements requires us to make estimates and judgments that affect our reported assets and liabilities, revenues and expenses, and other financial information. Actual results may differ significantly from these estimates, and our reported financial condition and results of operations could vary under different assumptions and conditions. In addition, our reported financial condition and results of operations could vary due to a change in the application of a particular accounting standard.
We regard an accounting estimate underlying our financial statements as a “critical accounting estimate” if the accounting estimate requires us to make assumptions about matters that are highly uncertain at the time of estimation and if different estimates that reasonably could have been used in the current period, or changes in the estimate that are reasonably likely to occur from period to period, would have had a material effect on the presentation of financial condition, changes in financial condition, or results of operations.
There have been no changes to our critical accounting policies or significant changes in assumptions or estimates that would affect such policies in the six months ended June 30, 2005. Our critical accounting policies are described in Item 7, “ Management’s Discussion and Analysis of Financial Condition and Results of Operations “ in our Annual Report on Form 10-K for the year ended December 31, 2004.
21
Results of Operations
The following table shows information derived from our condensed consolidated statements of operations for the three and six months ended June 30, 2005 and 2004 expressed as a percentage of revenues for the periods presented.
| | Three months
ended
June 30, 2005 | | Three months
ended
June 30, 2004 | | Six months
ended
June 30, 2005 | | Six months
ended
June 30, 2004 | |
| | | | | | | | | |
Revenues: | | | | | | | | | |
Electronic travel distribution | | 92.6 | % | 93.4 | % | 92.7 | % | 93.5 | % |
Information technology services | | 7.4 | | 6.6 | | 7.3 | | 6.5 | |
Total revenues | | 100.0 | | 100.0 | | 100.0 | | 100.0 | |
Operating expenses: | | | | | | | | | |
Cost of revenues excluding developed technology amortization | | 68.6 | | 69.7 | | 68.5 | | 69.1 | |
Developed technology amortization | | 2.8 | | 2.2 | | 2.5 | | 2.2 | |
Total cost of revenues | | 71.4 | | 71.9 | | 71.0 | | 71.3 | |
Selling, general and administrative expenses | | 10.4 | | 11.9 | | 11.5 | | 13.2 | |
Amortization of intangible assets | | 3.7 | | 3.7 | | 3.6 | | 3.7 | |
Total operating expenses | | 85.5 | | 87.5 | | 86.1 | | 88.2 | |
Operating income | | 14.5 | | 12.5 | | 13.9 | | 11.8 | |
Total other expense, net | | (6.3 | ) | (3.8 | ) | (16.5 | ) | (4.1 | ) |
Income (loss) before provision for income taxes | | 8.1 | | 8.7 | | (2.6) | | 7.7 | |
Income tax expense | | 0.6 | | — | | 0.5 | | 0.1 | |
Net (loss) income | | 7.5 | % | 8.7 | % | (3.1 | )% | 7.6 | % |
The following table shows total transactions using the Worldspan GDS for the three and six months ended June 30, 2005 and 2004. The historical transaction data set forth below reflects the designations which were in effect for each period presented. We evaluate the classification of our travel agencies on a monthly basis and reclassify them as appropriate.
Worldspan Transaction Summary
(in millions)
| | Three months
ended
June 30, 2005 | | Three months
ended
June 30, 2004 | | Change | | Six months
ended
June 30, 2005 | | Six months
ended
June 30, 2004 | | Change | |
Traditional | | 25.1 | | 26.4 | | (4.9 | )% | 52.7 | | 55.6 | | (5.2 | )% |
Online | | 27.6 | | 25.6 | | 7.8 | % | 57.1 | | 51.8 | | 10.2 | % |
Total transactions | | 52.7 | | 52.0 | | 1.3 | % | 109.8 | | 107.4 | | 2.2 | % |
Comparison of Three Months Ended June 30, 2005 and June 30, 2004
Revenues
Total revenues decreased $3.2 million or 1.3% to $245.6 million from $248.8 million for the three months ended June 30, 2005 and 2004, respectively. This decrease was primarily attributable to lower average fees per transaction and a decrease in the volume of transactions processed in the traditional channel during the second quarter of 2005 when compared to the same period in the prior year. This decrease was partially offset by an increase in the volume of transactions processed in the online channel and higher subscription-based information technology services.
Electronic travel distribution revenues decreased $5.0 million or 2.2% to $227.5 million from $232.5 million for the three months ended June 30, 2005 and 2004, respectively. The decrease in revenues was attributable to a 2.7% decline in the average fee per transaction processed coupled with a 1.3 million or 4.9% decrease in transactions generated from the traditional channel during the period. The decline in the average fee per transaction when compared to the same period in the prior year is primarily driven by new webfare content agreements executed in late June and throughout the second half of 2004. The decrease in revenues was partially offset by a 2.0 million, or 7.8%, increase in transactions generated from the online channel during the period.
Information technology services revenues increased $1.9 million or 11.7% to $18.2 million from $16.3 million for the three months ended June 30, 2005 and 2004, respectively. The increase was primarily attributable to a $2.3 million increase in revenue associated with products and services we sell to airlines, which include Worldspan Rapid Reprice, Fares and Pricing and Electronic Ticketing.
22
Cost of Revenues Excluding Developed Technology Amortization
Cost of revenues excluding developed technology amortization decreased $4.9 million or 2.8% to $168.5 million from $173.4 million for the three months ended June 30, 2005 and 2004, respectively. This $4.9 million decrease was primarily attributable to lower network and communications costs and employee costs, partially offset by cost of higher inducements. Cost of revenues excluding developed technology amortization as a percentage of total revenues decreased to 68.6% for the three months ended June 30, 2005 compared to 69.7% for the three months ended June 30, 2004.
Cost of electronic travel distribution revenues excluding developed technology amortization decreased $4.9 million or 3.2% to $147.0 million from $151.9 million for the three months ended June 30, 2005 and 2004, respectively. Cost of electronic distribution revenues excluding developed technology amortization decreased as a percentage of total electronic travel distribution revenue to 64.6% from 65.3% for the three months ended June 30, 2005 and 2004, respectively. The decrease was primarily attributable to a $5.3 million decrease in network and communication costs and a $2.2 million decrease in employee and employee-related costs that was partially offset by a $4.6 million increase in inducement costs paid to travel agencies. Network and communication costs decreased due to the continued migration of traditional travel agencies to third-party owned equipment and networks as well as the migration of supplier connections to less expensive IP-based solutions. Employee related costs declined from prior years due to lower headcount as a result of improved organizational effectiveness and efficiency, partially offset by an increase in outsourcing costs as programming for certain applications and certain travel agency support functions are now performed by third-party vendors. Inducements increased from the prior year due to increased transactions from online travel agencies, which tend to have higher inducement costs and increased inducement costs per transaction for traditional agencies, partially offset by a decline in transactions from traditional travel agencies.
Cost of information technology services revenues excluding developed technology amortization was $21.5 million for the three months ended June 30, 2005 and 2004. Cost of information technology services revenues excluding developed technology amortization was 118.1% of information technology services revenue for the three months ended June 30, 2005 as compared to 131.9% for the three months ended June 30, 2004. The decreased percentage is due primarily to higher revenue on unchanged costs from the prior year.
Developed Technology Amortization
Developed technology amortization (“DTA”) increased $1.4 million or 25.5% to $6.9 million from $5.5 million for the three months ended June 30, 2005 and 2004, respectively. DTA was 2.8% of total revenues for the three months ended June 30, 2005 as compared to 2.2% for the three months ended June 30, 2004. The $1.4 million increase was primarily the result of the writedown of certain purchased software to be enhanced and ultimately used in multi-hosting services for smaller carriers. The carrying value of the software was written down as a result of management’s decision to pursue other third party solutions as a means to provide these services to smaller carriers as well as management’s current evaluation of the current and potential revenue stream, among other factors.
Selling, General and Administrative Expenses
Selling, general and administrative expenses decreased $4.1 million or 13.9% to $25.5 million from $29.6 million for the three months ended June 30, 2005 and 2004, respectively. The decrease was primarily attributable to a $2.6 million decrease in bad debt expense as a result of a settlement and partial recovery of an outstanding customer balance as well as a decrease in employee costs related to lower headcount from the prior year as a result of our restructuring efforts. The settlement agreement with the customer provides for monthly cash payments for the next 12 months or full payment in the event the customer’s bankruptcy plan is approved. As a percentage of total revenue, selling, general and administrative expenses declined to 10.4% in the three months ended June 30, 2005 from 11.9% in the prior year. Excluding the reduction in bad debt expense, selling, general and administrative expenses were 11.4% of total revenue for the three months ended June 30, 2005.
Amortization of Intangible Assets
Amortization of intangible assets was $9.1 million or 3.7% of total revenues for the three months ended June 30, 2005, unchanged from the three months ended June 30, 2004. The intangible assets acquired as a result of the Acquisition are amortized on a straight-line basis over their estimated useful lives and the related amortization is expected to remain constant.
Operating Income
Operating income increased $4.5 million or 14.5% to $35.6 million from $31.1 million for the three months ended June 30, 2005 and 2004, respectively. As a percentage of total revenue, operating income increased to 14.5% from 12.5% for the three months ended June 30, 2005 and 2004, respectively. The increase is due primarily to decrease in operating expenses of $7.7 million or 3.5%, offset by a $3.2 million or 1.3% decline in total revenue.
23
Net Interest Expense
Net interest expense increased $5.6 million or 56% to $15.6 million from $10.0 million for the three months ended June 30, 2005 and 2004, respectively. The increase in net interest expense was primarily related to the increase in debt outstanding that was issued in connection with the Refinancing Transactions (as defined below under the heading “—Liquidity and Capital Resources–Senior Notes”) in February 2005.
Income Tax Expense
Income tax expense attributable to foreign jurisdictions increased $1.4 million to $1.5 million from $0.1 million for the three months ended June 30, 2005 and 2004, respectively. The increase relates to the implementation of various tax planning strategies in our foreign subsidiaries during the first quarter of 2005. The tax planning strategies are causing a transfer in tax liabilities from WTI to the Partnership as well as reducing the overall taxes paid by the Partnership and WTI.
Net Other Expense
Net other expense increased $6.1 million or 63.6% to $15.6 million from $9.5 million for the three months ended June 30, 2005 and 2004, respectively. The increase was primarily due to a $5.6 million increase in net interest expense related to the debt issued in connection with the Refinancing Transactions in February 2005.
Net Income
Net income decreased $3.0 million or 14.0% to $18.5 million from $21.5 million for the three months ended June 30, 2005 and 2004, respectively. The decrease was primarily due to a $5.6 million increase in interest expense associated with the debt issued in connection with the Refinancing Transactions, a $1.4 million increase in income tax expense attributable to tax planning strategies implemented in the first quarter of 2005, partially offset by improved operating income.
Comparison of Six Months Ended June 30, 2005 and June 30, 2004
Revenues
Total revenues increased $8.9 million or 1.8% to $506.2 million from $497.3 million for the six months ended June 30, 2005 and 2004, respectively. The increase was attributable to an increase in the volume of transactions processed in the online channel and an increase in subscription-based technology services during the six months of 2005 when compared to the same period in the prior year. This increase was partially offset by lower average fees per transaction and a decrease in the volume of transactions processed in the traditional channel during the period.
Electronic travel distribution revenues increased $4.4 million or 1.0% to $469.4 million from $465.0 million for the six months ended June 30, 2005 and 2004, respectively. The increase in revenues was attributable to a 5.3 million, or 10.2%, increase in transactions processed in the online channel during the period. This increase in revenues was partially offset by a 1.6% decline in the average fee per transaction processed and a 2.9 million or 5.2% decrease in transactions generated from the traditional channel during the period. The decline in the average fee per transaction when compared to the same period in the prior year is primarily driven by new webfare content agreements executed throughout 2004.
Information technology services revenues increased $4.5 million or 13.9% to $36.8 million from $32.3 million for the six months ended June 30, 2005 and 2004, respectively. The increase was primarily attributable to a $4.0 million increase in revenue associated with products and services we sell to airlines, which include Worldspan Rapid Reprice, Fares and Pricing and Electronic Ticketing.
Cost of Revenues Excluding Developed Technology Amortization
Cost of revenues excluding developed technology amortization increased $2.8 million or 0.8% to $346.6 million from $343.8 million for the six months ended June 30, 2005 and 2004, respectively. Cost of revenues excluding developed technology amortization as a percentage of total revenues decreased to 68.5% for the six months ended June 30, 2005 compared to 69.1% for the six months ended June 30, 2004. The $2.8 million increase was primarily driven by higher inducements paid to travel agencies, which was partially offset by lower employee costs and network and communication costs.
Cost of electronic travel distribution revenues excluding developed technology amortization increased $2.7 million or 0.9% to $303.5 million from $300.8 million for the six months ended June 30, 2005 and 2004, respectively. Cost of electronic distribution revenues excluding developed technology amortization as a percentage of total electronic travel distribution revenue was 64.7% for the six months ended June 30, 2005 and 2004. The increase was primarily attributable to a $23.1 million increase in inducement costs paid to travel agencies, partially offset by $11.0 million decrease in network and communication costs and a $6.2 million decrease in employee and employee-related costs. Inducements increased from the prior year due to increased transactions from online travel agencies, which tend to have higher inducement costs, and increased inducement costs, per transaction for traditional agencies, partially offset by a decline in transactions from traditional travel agencies. Network and communication costs decreased due to the continued migration of traditional travel agencies to third-party owned equipment and networks, the migration of supplier connections to less expensive IP-based connections and the renegotiation of our network and
24
communication contracts with our primary vendors in the first quarter of 2004. Employee related costs declined from prior years due to lower headcount as a result of improved organizational effectiveness and efficiency, partially offset by an increase in outsourcing costs as programming for certain applications and certain travel agency support functions are now performed by third-party vendors.
Cost of information technology services revenues excluding developed technology amortization increased $0.1 million or 0.2% to $43.1 million from $43.0 million for the six months ended June 30, 2005 and 2004, respectively.
Developed Technology Amortization
Developed technology amortization (“DTA”) increased $1.6 million or 14.5% to $12.6 million from $11.0 million for the six months ended June 30, 2005 and 2004, respectively. DTA was 2.5% of total revenues for the six months ended June 30, 2005 as compared to 2.2% for the six months ended June 30, 2004. The $1.6 million increase was primarily the result of the writedown in the second quarter of certain purchased software to be enhanced and ultimately used in multi-hosting services for smaller carriers. The carrying value of the software was written down as a result of management’s decision to pursue other third party solutions as a means to provide these services to smaller carriers as well as management’s current evaluation of the current and potential revenue stream, among other factors.
Selling, General and Administrative Expenses
Selling, general and administrative expenses decreased $7.6 million or 11.6% to $58.2 million from $65.8 million for the six months ended June 30, 2005 and 2004, respectively. The decrease was primarily attributable to a $2.6 million decrease in bad debt expense as a result of a settlement and partial recovery of an outstanding customer balance as well as a decrease in employee costs related to lower headcount from the prior year as a result our restructuring activities. The settlement agreement with the customer provides for monthly cash payments for the next 12 months or full payment in the event the customer’s bankruptcy plan is approved. As a percentage of total revenue, selling, general and administrative expenses declined to 11.5% from 13.2% in the prior year. Excluding the reduction in bad debt expense, selling, general and administrative expenses were 12.0% of total revenue.
Amortization of Intangible Assets
Amortization of intangible assets was $18.3 million or 3.6% of total revenues for the six months ended June 30, 2005, unchanged from the six months ended June 30, 2004. The intangible assets acquired as a result of the Acquisition are amortized on a straight-line basis over their estimated useful lives and the related amortization is expected to remain constant.
Operating Income
Operating income increased $12.1 million or 20.7% to $70.6 million from $58.5 million for the six months ended June 30, 2005 and 2004, respectively. As a percentage of total revenue, operating income increased to 13.9% from 11.8% for the six months ended June 30, 2005 and 2004, respectively. The increase is due primarily to an $8.9 million or 1.8% increase in total revenue and a decrease in operating expenses of $3.2 million or 0.7%.
Net Interest Expense
Net interest expense increased $7.2 million or 34.8% to $27.9 million from $20.7 million for the six months ended June 30, 2005 and 2004, respectively. The increase in net interest expense was primarily related to the increase in debt outstanding that was issued in connection with the Refinancing Transactions (as defined below under the heading “—Liquidity and Capital Resources–Senior Notes”) in February 2005.
Net Other Expense
Net other expense increased $63.2 million to $83.7 million from $20.5 million for the six months ended June 30, 2005 and 2004, respectively. The increase was due to a $55.6 million loss on extinguishment of debt and a $7.2 million increase in net interest expense, both related to the debt issued in connection with the Refinancing Transactions in February 2005.
Income Tax Expense
Income tax expense increased $2.2 million to $2.5 million from $0.3 million for the six months ended June 30, 2005 and 2004, respectively. The increase is attributable to the implementation of tax planning strategies in our foreign subsidiaries during the first quarter of 2005. The tax planning strategies are causing a transfer in income tax liabilities from WTI to the Partnership as well as reducing the overall taxes ultimately to be paid by the Partnership and WTI.
Net (Loss)/Income
Net income decreased $53.3 million or 141.4% to a loss of $15.6 million from income of $37.7 million for the six months ended June 30, 2005 and 2004, respectively. The decrease was primarily due to a $55.6 million loss on the extinguishment of debt associated with the Refinancing Transactions, a $ 7.2 million increase in interest expense associated with the increased debt outstanding that was issued in connection with the Refinancing Transactions, a $2.2 million increase in income tax expense attributable to tax planning strategies implemented in the first quarter of 2005, partially offset by improved operating income.
25
Liquidity and Capital Resources
Our principal source of liquidity will be cash flow generated from operations, borrowings under capital lease obligations and borrowings under our new senior credit facility (as defined below). Our principal uses of cash will be to fund our planned operating expenditures which include operating expenses, capital expenditures, investments in our current as well as future products and offerings, interest payments on our debt and any mandatory principal payments of our debt. Based on our current level of operations, we believe that our cash flow from operations, available cash of $45.0 million and available borrowings under our new senior credit facility will be adequate to meet our future liquidity needs for at least the next 12 months, although no assurance can be given. Our future operating performance and ability to extend or refinance our indebtedness will be dependent on future economic conditions and financial, business and other factors that are beyond our control. Risk factors that could possibly affect the ability of our internally generated funds include, among other things:
• reduced sales due to declines in transaction volumes or movement of transactions to another GDS,
• acts of global terrorism,
• bankruptcy filings of any of the airlines that comprise a significant portion of our revenues.
For a more complete discussion of risk factors that might affect the availability of our internally generated funds, see “Risk Factors” in Item 1 of our annual report on Form 10-K for the year ended December 31, 2004.
At June 30, 2005, we had cash and cash equivalents of $45.0 million and working capital of $1.9 million as compared to $73.5 million in cash and cash equivalents and working capital of $0.3 million at June 30, 2004. The $28.5 million decrease in cash and cash equivalents was primarily the result of $34.0 million in principal payments made on the new senior credit facility during the second quarter of 2005. We may also continue to use cash flows from operations to retire debt as appropriate, based on market conditions and our desired liquidity and capital structure. On August 1, 2005, we made a $12,000 discretionary principal payment on the New Term Loan (as defined below). The $1.6 million increase in working capital was primarily the result of an increase in operating income and a decrease to the current portion of long-term debt and accrued expenses primarily for inducement related accruals.
Historically, we have funded our operations through internally generated cash. We generated cash from operating activities of $73.0 million and $90.4 million for the six months ended June 30, 2005 and 2004, respectively. The $17.4 million decrease in cash provided by operating activities during the first six months of 2005 as compared to the first six months of 2004 primarily resulted from a $53.3 million decrease in net income and a $19.0 million decrease for changes in operating assets and liabilities, partially offset by an increase in non-cash and cash charges of $54.8 million, primarily related to the Refinancing Transactions.
We used cash for investing activities of approximately $6.5 million and $8.0 million in the six months ended June 30, 2005 and 2004, respectively. The $1.5 million decrease in cash used for investing activities during the first six months of 2005 as compared to the first six months of 2004 primarily resulted from a decrease in capital expenditures. The decline in capital expenditures during 2005 as compared to 2004 primarily resulted from decreased purchases of agency equipment.
We used cash for financing activities of approximately $122.0 million and $52.7 million in the six months ended June 30, 2005 and 2004, respectively. The $69.3 million increase in cash used for financing activities during the first six months of 2005 as compared to the first six months of 2004 primarily resulted from the Refinancing Transactions in February 2005. To finance the redemption of the WTI Preferred Stock and the payment of the Consent Fee (as defined below under the heading “— Use of Proceeds”), we distributed $375.7 million and $8.6 million, respectively, to WTI. In addition, WTI redeemed the Delta subordinated note in January 2005 and we distributed $36.1 million to WTI to finance this transaction.
Senior Credit Facility
In June 2003, we entered into a senior credit facility, referred to herein as our “old senior credit facility,” with a syndicate of financial institutions as lenders. In February 2005 we entered into a new credit agreement that made available a new senior credit facility, referred to herein as our “new senior credit facility,” with a syndicate of financial institutions as lenders, consisting of a revolving credit facility of $40.0 million and a term loan facility (the “New Term Loan”) of $450.0 million, and extinguished and terminated all obligations then existing under the old senior credit facility. The old senior credit facility provided for aggregate borrowings by us of up to $175.0 million, consisting of:
• a four-year revolving credit facility of up to $50.0 million in revolving credit loans and letters of credit which is available until June 30, 2007, and
• a four-year term loan facility of $125.0 million which matures on June 30, 2007.
We borrowed $125.0 million under the old credit facility’s term loan facility in connection with the Acquisition. The revolving credit facility was available for working capital and general corporate needs.
26
The new senior credit facility consists of:
• a five-year revolving credit facility of up to $40.0 million in revolving credit loans with a $15.0 million sublimit for letters of credit and a $5.0 million sublimit for swing line loans, and
• the New Term Loan
Obligations under the old senior credit facility and the guarantees were secured by, and obligations under our new senior credit facility and the guarantees are secured by:
• a perfected first priority security interest in all of our tangible and intangible assets and all of the tangible and intangible assets of WTI and each of the other guarantors of the new senior credit facility, subject to customary exceptions, and
• a pledge of (i) all of the membership interests of WS Holdings LLC owned by WTI, (ii) all of our partnership interests owned by WTI and WS Holdings LLC, (iii) all of the capital stock of our domestic subsidiaries and some of our foreign subsidiaries and (iv) 65% of the capital stock of other of our first-tier foreign subsidiaries.
Borrowings under the old senior credit facility bore interest at a rate equal to, at our option:
• a base rate generally defined as the sum of (i) the higher of (x) the prime rate (as quoted on the British Banking Association Telerate Page 5) and (y) the federal funds effective rate, plus one half percent (0.50%) per annum) and (ii) an applicable margin, or
• a LIBOR rate generally defined as the sum of (i) the rate at which euro deposits for one, two, three or six months (as selected by us) are offered in the interbank euro market as set forth on page 3750 of the Dow Jones Telerate Screen and (ii) an applicable margin.
The initial applicable margin for the base rate revolving loans under the old senior credit facility was 2.75% and the applicable margin for the euro revolving loans was 3.75%. The applicable margin for the loans was subject to reduction based upon the ratio of our consolidated total bank debt to consolidated EBITDA. We also were required to pay a commitment fee of 0.50% per annum on the difference between committed amounts and amounts actually utilized under the revolving credit facility. Fees for letters of credit under the old senior credit facility were based on the face amount of each letter of credit outstanding multiplied by to the applicable margin for LIBOR borrowings under the revolving credit facility and were payable quarterly in arrears. In addition, we were required to pay each letter of credit bank a fronting fee to be determined based upon the face amount of all outstanding letters of credit issued by it.
Our borrowings under the new senior credit facility will be subject to quarterly interest payments with respect to loans bearing interest at the base rate described below or at the end of each one, two, three or six month interest period for loans bearing interest at the LIBOR rate described below and bear interest at a rate which, at our option can be either:
• a base rate generally defined as the sum of (i) the highest of (x) the administrative agent’s prime rate, (y) the federal funds effective rate, plus one half percent (0.50%) per annum and (z) the certificate of deposit rate, plus one half percent (0.50%) per annum and (ii) an applicable margin, or
• a LIBOR rate generally defined as the sum of (i) the rate at which euro deposits for one, two, three or six months (as selected by us) are offered in the interbank euro market as set forth on page 3750 of the Dow Jones Telerate Screen and (ii) an applicable margin.
The initial applicable margin for base rate loans under the new senior credit facility is 1.75% and the applicable margin for LIBOR rate loans is 2.75%.
For the remaining six months of 2005, assuming mandatory scheduled payments only and using a LIBOR rate of 2.79%, we expect the cash principal and interest payments related to the $450.0 million borrowed under the New Term Loan to be $2.0 million and approximately $11.5 million, respectively. The actual amounts to be paid for cash principal and interest during 2005 may differ significantly from these amounts depending on the LIBOR rate in effect at the time and any discretionary payments that we may elect to make during the year.
The old senior credit facility required us to meet financial tests, including without limitation, a minimum fixed charge coverage ratio, a minimum interest coverage ratio, a maximum senior secured leverage ratio and a maximum total leverage ratio. Our new senior credit facility also requires us to meet financial tests, including without limitation, a minimum interest coverage ratio and a
27
maximum total leverage ratio. In addition, the old senior credit facility contained, and our new senior credit facility contains customary covenants which, among other things, limit the incurrence of additional indebtedness, investments, dividends, transactions with affiliates, asset sales, acquisitions, capital expenditures, mergers and consolidations, prepayments of other indebtedness, liens and encumbrances and other matters customarily restricted in a senior credit facility. As of June 30, 2005, we were in compliance with the applicable covenants.
Senior Notes
On June 30, 2003, we issued $280.0 million aggregate principal amount of 9 5/8% Senior Notes Due 2011, referred to herein as the “old senior notes.” Interest on the old senior notes accrues at 9 5/8% per annum. As part of our issuance of $300.0 million in aggregate principal amount of Senior Second Lien Secured Floating Rate Notes due 2011, referred to herein as the “new senior secured notes,” and the refinancing of our old senior credit facility with our $490.0 million new senior credit facility (collectively, the “Refinancing Transactions”), in February 2005 we consummated a tender offer for and consent solicitation relating to our old senior notes. As a result of this tender offer and consent solicitation, we repurchased more than 99 1/2% of the total aggregate principal amount of $280.0 million of old senior notes previously outstanding, received the requisite consents from the holders of the old senior notes with respect to the consent solicitation and executed a supplemental indenture that eliminated substantially all of the restrictive covenants and certain default provisions in the indenture governing the remaining outstanding old senior notes. The supplemental indenture became effective on February 11, 2005 upon our acceptance for payment of a majority in principal amount of the outstanding old senior notes tendered.
On February 11, 2005, we issued $300.0 million in aggregate principal amount of new senior secured notes, secured on a second priority basis by substantially all of our assets, the assets of WS Financing Corp. (“WS Financing”) and those of our guarantor subsidiaries. Interest on the new senior secured notes accrues at a rate equal to three-month LIBOR, which will be reset quarterly, plus 6.25%.
On March 4, 2005, we entered into an interest rate swap with a notional amount that will start at $508.4 million on November 15, 2005 and amortize on a quarterly basis to $102.2 million at November 15, 2008. The reset dates on the swap are February 15, May 15, August 15 and November 15 each year until maturity on November 15, 2008. This agreement, which has been designated as a cash flow hedge, will be used to convert the variable component of interest rates on certain indebtedness to a fixed rate of 4.3%. As of June 30, 2005, the fair value of the interest rate swap was recorded as a liability in the amount of $2.4 million.
We cannot redeem the remaining old senior notes before June 15, 2007. There is currently $0.5 million aggregate principal amount of old senior notes outstanding.
The old senior notes are unsecured senior obligations, are equal in right of payment to all of our existing and future unsecured senior debt, and are senior in right of payment to all of our future subordinated debt. The new senior secured notes are secured on a second priority basis by substantially all of our assets, the assets of WS Financing and those of our guarantor subsidiaries. Each of the old senior notes and the new senior secured notes are guaranteed by each subsidiary guarantor (as defined in the indenture governing the old senior notes or the new senior secured notes, as applicable).
If we experience a change of control (as defined in the indenture governing the old senior notes or the new senior secured notes, as applicable), each holder of old senior notes and new senior secured notes may require us to repurchase all or any portion of the holder’s notes at a purchase price equal to 101% of the principal amount plus accrued and unpaid interest to the date of purchase.
The indenture governing the old senior notes contained, and the indenture governing the new senior secured notes contains, certain covenants that, among other things, limit (i) the incurrence of additional debt by us and certain of our subsidiaries, (ii) the payment of dividends and the purchase, redemption or retirement of capital stock or subordinated indebtedness, (iii) investments, (iv) certain transactions with affiliates, (v) sales of assets, including capital stock of subsidiaries and (vi) certain consolidations, mergers and transfers of assets. As of June 30, 2005, we were in compliance with the applicable covenants. The indenture governing the old senior notes prohibited, and the indenture governing the new senior secured notes prohibits, certain restrictions on distributions from certain subsidiaries.
Use of Proceeds
The net proceeds to us from the sale of the new senior secured notes and the closing of the new senior credit facility, along with available cash, were used to (i)(a) repay approximately $58.0 million due under the old senior credit facility, and (b) terminate all commitments then outstanding under the old senior credit facility, (ii) accept for purchase pursuant to the cash tender offer for any and all of our’s and WS Financing’s outstanding old senior notes of which $279.5 million of old senior notes were validly tendered prior to the consent date (more than 99 1¤2% of the total aggregate principal amount of $280.0 million of old senior notes previously outstanding), and pay those holders the total purchase price of $1,171.64, including a consent payment related to the solicitation of the holders’ consent to the elimination of substantially all of the covenants contained in the indenture related to the old senior notes, for each $1,000.00 principal amount of old senior notes tendered in accordance with the cash tender offer plus, accrued and unpaid
28
interest on the old senior notes, for an aggregate total purchase price of $331.4 million and accept for purchase and pay for additional old senior notes tendered after February 4, 2005 but prior to February 22, 2005, the expiration time of the tender offer, and pay those holders the purchase price of $1,141.64 for each $1,000.00 principal amount of old notes tendered in accordance with the cash tender offer for an aggregate purchase price of $0.2 million, (iii) redeem 100% of the outstanding WTI Preferred Stock, at a redemption price equal to the face amount of the WTI Preferred Stock plus accrued and unpaid dividends thereon (including Additional Dividends (as defined in WTI’s Amended and Restated Certificate of Incorporation)) to the redemption date for a total redemption price of approximately $375.7 million, (iv) pay the Consent Fee (as defined below) to the Funds (as defined below) and (v) pay fees and expenses related to the Refinancing Transactions.
In addition, in connection with the Refinancing Transactions, on February 16, 2005, WTI, CVC Capital Funding, LLC (“CVC Capital”) and Citicorp Mezzanine III, L.P. (“CMIII,” and together with CVC Capital, the “Funds”) entered into an Exchange Agreement (the “Exchange Agreement”). In connection with the closing under the Exchange Agreement, WTI issued $43.6 million aggregate principal amount of its new Subordinated Notes due 2013 (the “Holdco Notes”) to the Funds and paid $0.4 million in accrued and unpaid interest in exchange for the surrender and cancellation by the Funds of all of the obligations owing by WTI to the Funds under each Fund’s interest in that certain Subordinated Note (the “Seller Note”), dated as of June 30, 2003, made by WTI in favor of American Airlines, Inc. (which was subsequently transferred in part to each of the Funds). WTI also paid the Funds a total of $8.6 million as a consent fee (the “Consent Fee”) in return for the approval by the Funds of the Refinancing Transactions and the replacement of the Seller Note with the Holdco Notes.
Also in connection with the Refinancing Transactions, on February 16, 2005, we entered into an amendment to our Advisory Agreement with WTI to terminate all advisory and other fees payable under that agreement as of January 1, 2005 in return for a prepayment of $7.7 million payable on or before December 15, 2005.
Capital Lease Obligations
We lease equipment and software under capital lease obligations. As of June 30, 2005, our obligations under capital leases totaled $64.3 million. The interest rate used in computing the present value of the minimum lease payments ranges from approximately 4.0% to 12.0% depending on the asset being leased.
Subordinated Notes
As part of the Acquisition, WTI issued to American Airlines and Delta subordinated seller notes, referred to herein as the “subordinated seller notes”, in the original principal amounts of $39.0 million and $45.0 million, respectively, which were scheduled to mature on July 31, 2012. In March 2004, affiliates of CVC acquired from American Airlines the $39.0 million subordinated seller note originally issued to American Airlines, together with the right to receive all accrued and unpaid interest thereon. Thereafter, pursuant to the terms of the subordinated seller note, WTI paid cash interest to these affiliates of CVC in the aggregate amount of approximately $2.0 million and was obligated to issue additional notes to such affiliates in lieu of cash interest in the aggregate principal amount of $2.9 million, in each case, for the year ended 2004. In January 2005, WTI redeemed the Delta subordinated note, along with all additional notes issued or issuable in lieu of cash interest payments, for an aggregate payment of $36.1 million. As a result of this redemption, the Delta subordinated seller note was cancelled. In February 2005, in connection with the Refinancing Transactions, WTI issued $43.6 million aggregate principal amount of its new Subordinated Notes due 2013, referred to here in as the “holding company notes”, to two affiliates of CVC, CVC Capital Funding, LLC and Citicorp Mezzanine III, L.P. (“CMIII” and together with CVC Capital, the “Funds”) and paid $0.4 million in accrued and unpaid interest in exchange for the surrender and cancellation by the Funds of all of the obligations owing by WTI to the Funds under each Fund’s interest in the remaining American subordinated seller note.
The holding company notes and subordinated seller notes are not direct debt obligations of the Partnership. As long as we are not in default under the new senior credit facility, we expect to be permitted to disburse funds to WTI sufficient to pay cash interest of up to 12% for the holding company notes. Under the old senior credit facility, we were permitted to disburse funds to WTI sufficient to pay the 5% cash interest component of the seller subordinated notes. During the six months ended June 30, 2005 and 2004, we distributed $1.6 million and $2.2million, respectively, to WTI for this purpose. The holding company notes are, and the subordinated seller notes were, unsecured obligations of WTI contractually and structurally subordinated to our new senior secured notes and our new senior credit facility, or our old senior notes and our old senior credit facility, as applicable, and structurally subordinated to all of our other debt. The subordinated seller note originally issued to American Airlines bore interest at an annual rate equal to 12.0% and the subordinated seller note originally issued to Delta bore interest at an annual rate equal to 10.0%.
FASAs
Pursuant to the terms of the FASAs, we provide FASA credits to Delta and Northwest to be applied against FASA service fee
29
payments due from these airlines to us. The FASA credits are structured and will be applied through June 2012 in an amount up to an aggregate total of $91.7 million to each of Delta and Northwest as of June 30, 2005, and are reflected as reductions to our FASA revenues in the corresponding periods. The FASA credits are provided to Delta and Northwest in monthly installments, with an annual amount of $16.7 million scheduled to be provided to each of these founding airlines during the first six years of the respective FASA term, an annual amount of $9.2 million scheduled to be provided to each of these founding airlines during the seventh and eighth years of the respective FASA term and an annual amount of $6.7 million scheduled to be provided to each of these founding airlines during the ninth year of the respective FASA term. In the event that the monthly FASA credits deliverable by us to Delta or Northwest are more than the FASA service fee payments due from the applicable airline, then we will be obligated to pay such excess to such airline in cash. Pursuant to a recent amendment of our FASA with Delta, Worldspan has the right, at its option, to terminate the FASA credits to Delta on or before December 31, 2005, in exchange for a one-time payment from us to Delta in an amount that varies depending upon when Worldspan elects to make the one-time payment. The one-time payment would be capitalized and amortized as a reduction of FASA revenue in the corresponding periods.
Delta or Northwest may terminate its FASA due to a failure by us to satisfy the mainframe processing time, system availability or critical production data performance standards under that agreement (which represent performance standards which we have historically met under our predecessor services agreements with Delta and Northwest). Furthermore, such a termination by Delta or Northwest of its FASA constitutes an event of default under our new senior credit facility. In the event that the event of default is waived by the applicable lenders under our senior credit facilities (as defined in the subordination agreement executed by the founding airlines) or our senior credit facilities are no longer outstanding, then any remaining FASA credits deliverable by us to the terminating airline will not be provided according to the initial nine year schedule specified above and will instead be payable in cash to such airline as and when, and only to the extent that, we are permitted to make such payments as “Restricted Payments” under the restricted payment covenant test contained in the indenture governing our old senior notes and the new senior secured notes. If a FASA is otherwise terminated in accordance with its terms prior to the expiration of its term, such as a termination by either Delta or Northwest without cause, or is rejected by Delta or Northwest in bankruptcy, then the obligation to provide the remaining FASA credits or to make the remaining FASA credit payments then deliverable or payable to the airline under the applicable FASA will terminate. Our obligations to provide FASA credits or to make the FASA credit payments will not terminate if either or both of Delta and Northwest reduce or cease operations in a way that reduces or eliminates the amount of airline services either founding airline obtains under the FASAs, although an airline’s failure to comply with its software development minimum and exclusivity obligations would constitute a breach of its agreement. If we terminate a FASA other than as expressly permitted by the agreement, then we will be obligated to provide the scheduled FASA credits to the applicable airline by way of a monthly cash payment rather than applying the FASA credits against FASA service fee payments due from the airline. In the event that the monthly FASA credits deliverable by us to Delta or Northwest are more than the FASA service fee payments due from the applicable airline, then we will be obligated to pay such excess to such airline in cash. In the event of our bankruptcy or insolvency, holders of our senior debt (as defined in the subordination agreement executed by the founding airlines), including the old senior notes and the new senior secured notes, will be entitled to receive payments in full in cash before we may make any FASA credit payments in cash. In that event, Delta and Northwest will, however, retain their rights to apply the scheduled FASA credit payments against their obligations to pay us fees for our services under the FASAs. In the event that we wrongfully terminate a FASA, we will remain obligated to deliver the FASA credits to the applicable airline by paying the credit amounts to the applicable airline in cash on a monthly basis according to the nine-year schedule described above. However, if we reject a FASA in a bankruptcy of the company, our FASA credit payment obligations to the applicable airline will match the obligations described above in a termination of a FASA by such airline due to our failure to satisfy performance standards. Any FASA credit payment obligations by us to an airline in such a bankruptcy will be subordinated to our senior debt (as defined in the subordination agreement executed by the founding airlines), including the old senior notes and the new senior secured notes.
Taxes
Because we are a limited partnership, our partners will owe taxes on all of the income that we generate in the United States. We expect that WTI will cause us to make distributions to it from time to time sufficient to cover all income taxes owed by WTI. Under the terms of our senior credit facility and the indentures governing our old senior notes and the new senior secured notes, we are specifically permitted to make these tax distributions.
We implemented various tax planning strategies in our foreign subsidiaries during the first quarter of 2005. The tax planning strategies will cause a transfer in tax liabilities from WTI to us as well as reduce the overall taxes paid by us and WTI. We believe these strategies will reduce the overall tax obligations of the Partnership and WTI and thus will lower distributions to WTI for income taxes. During 2005, we do not expect to make any tax distributions to WTI.
Capital Expenditures
Capital expenditures for property and equipment, including both purchased assets and assets acquired under capital leases, as well as capitalized software, totaled $6.6 million for the six months ended June 30, 2005, a decrease of $0.8 million from capital expenditures of $7.4 million for the six months ended June 30, 2004. We have estimated approximately $26.8 million for capital expenditures in 2005, which relates to normal growth in capacity requirements and routine replacement of older equipment.
30
Off-Balance Sheet Arrangements
At June 30, 2005 and December 31, 2004, we did not have any relationships with unconsolidated entities or financial partnerships, such as entities often referred to as structured finance or special purpose entities, which would have been established for the purpose of facilitating off-balance sheet arrangements or other contractually narrow or limited purposes. We are, therefore, not materially exposed to any financing, liquidity, market or credit risk that could arise if we had engaged in such relationships.
Effect of Inflation
Inflation generally affects us by increasing our costs of labor, equipment and new materials. We do not believe that inflation has had any material effect on our results of operations during the three and six months ended June 30, 2005.
Subsequent Events
On July 20, 2005, the Partnership announced a reduction in force of approximately 70 employees. The reduction was the result of improved organizational efficiency and the outsourcing of programming for certain applications. The Partnership will record a charge for severance and benefits in the third quarter of 2005 of approximately $1.2 million. We anticipate these obligations to be paid in the third and fourth quarters of 2005 through internally generated funds.
Worldspan Cautionary Statement
Statements in this report and the exhibits hereto which are not purely historical facts, including statements about forecasted financial projections or other statements about anticipations, beliefs, expectations, hopes, intentions or strategies for the future, may be forward-looking statements within the meaning of Section 27A of the Securities Act, and Section 21E of the Exchange Act, as amended. Readers are cautioned not to place undue reliance on forward-looking statements. All forward-looking statements are based upon information available to the company on the date this report was submitted. We undertake no obligation to publicly update or revise any forward-looking statements, whether as a result of new information, future events or otherwise. Any forward-looking statements involve risks and uncertainties that could cause actual events or results to differ materially from the events or results described in the forward-looking statements, including, but not limited to, risks or uncertainties related to: our revenues being highly dependent on the travel and transportation industries; airlines limiting their participation in travel marketing and distribution services; or other changes within, or affecting, the travel industry. We may not succeed in addressing these and other risks.
31
ITEM 3. QUANTITATIVE AND QUALITATIVE DISCLOSURES ABOUT MARKET RISK
Market risk represents the risk of changes in value of a financial instrument, derivative or non-derivative, caused by fluctuations in interest rates, foreign exchange rates and equity prices. Changes in these factors could cause fluctuations in the results of our operations and cash flows. In the ordinary course of business, we are exposed to foreign currency and interest rate risks. These risks primarily relate to the sale of products and services to foreign customers and changes in interest rates on our long-term debt.
Foreign Exchange Rate Market Risk
We consider the U.S. dollar to be the functional currency for all of our entities. Substantially all of our net sales and the majority of our expenses during the six months ended June 30, 2005 and 2004 were denominated in U.S. dollars. Therefore, foreign currency fluctuations did not materially impact our financial results in those periods. We have foreign currency exposure arising from the translation of our foreign subsidiaries’ financial statements into U.S. dollars. The primary currencies to which we are exposed to fluctuations include the euro and the British pound sterling. The fair value of our net foreign investments would not be materially affected by a 10% adverse change in foreign currency exchange rates from June 30, 2005 levels.
Interest Rate Market Risk
Our old senior credit facility was, and our new senior credit facility is variable rate debt. Interest rate changes therefore generally do not affect the market value of such debt but do impact the amount of our interest payments and, therefore, our future earnings and cash flows, assuming other factors are held constant. As of June 30, 2005, we had variable rate debt of approximately $715.0 million. Holding other variables constant, including levels of indebtedness, a one hundred basis point increase in interest rates on our variable debt would have an estimated impact on pre-tax earnings and cash flows for the next year of approximately $7.2 million. Under the terms of our old senior credit facility, we were required to have at least 50% of our total indebtedness subject to either a fixed interest rate or interest rate protection for a period of not less than three years.
On March 4, 2005, we entered into an interest rate swap with a notional amount that will start at $508.4 million on November 15, 2005 and amortize on a quarterly basis to $102.2 million at November 15, 2008. The reset dates on the swap are February 15, May 15, August 15 and November 15 each year until maturity on November 15, 2008. This agreement, which has been designated as a cash flow hedge, will be used to convert the variable component of interest rates on certain indebtedness to a fixed rate of 4.3%. As of June 30, 2005, the fair value of the interest rate swap was recorded as a liability in the amount of $2.4 million.
ITEM 4. CONTROLS AND PROCEDURES
As of the end of the period covered by this report, we conducted an evaluation, under the supervision and with the participation of our principal executive officer and principal financial officer, of the effectiveness of the design and operation of our disclosure controls and procedures (as defined in Rules 13a-15(e) and 15d-15(e) under the Exchange Act). Based on this evaluation, our principal executive officer and principal financial officer concluded that our disclosure controls and procedures are effective to provide reasonable assurance that material information required to be included in our periodic SEC reports is recorded, processed, summarized and reported within the time periods specified in SEC rules and forms. In addition, we reviewed our internal controls and based upon that review determined that certain changes were necessary to improve our internal controls over financial reporting. As previously reported in our Form 10-K filed March 28, 2005, Form 10-Q filed May 16, 2005 and our Form 10-Q/A filed May 25, 2005, certain deficiencies identified in the fourth quarter of 2004 involved the absence of a control to insure completeness of the transfer of information between our processing and billing systems. We improved our internal controls by implementing a monthly review and analysis of the nature of rejected items to insure that the system classification of these items as non-billable was appropriate. The management review procedure described above specifically addressing this transfer issue is now in place. Specifically, we have reviewed over 99% of the transactions previously excluded from the transfer from the processing system to the billing system for the period April 20, 2005 through June 30, 2005 and found no transactions that were incorrectly rejected.
We previously reported, in our Form 10-K filed March 28, 2005, Form 10-Q filed May 16, 2005 and our Form 10-Q/A filed May 25, 2005, on insufficient resources in our finance department. Corrective controls have been implemented, including the active recruitment and placement of additional experienced financial personnel. The hiring plan instituted by our Chief Financial Officer has been substantially completed with the addition of nine new hires in the finance department.
32
PART II. OTHER INFORMATION
ITEM 1. LEGAL PROCEEDINGS
As described in our Annual Report on Form 10-K for the year ended December 31, 2004, in September 2003, we received multiple assessments totaling €39.5 million from the tax authorities of Greece relating to tax years 1993-2002. Pursuant to a formal tax amnesty program with the Greek authorities, we reached a settlement of the outstanding assessments in an amount of approximately of €7.8 million. The purchase agreement between our founding airlines and us provides that each of our founding airlines will severally indemnify us on a net after-tax basis from and against any of our taxes related to periods prior to the Acquisition. Because of this indemnity, we believe that the settlement payments made by us to the Greek authorities will be reimbursed by our founding airlines and will not have a material impact upon our business, financial condition or results of operations. In fact, American has prepaid to us known Greek tax payments attributable to it and Delta and Northwest are current in their respective reimbursement payments to us.
We are involved in various other litigation proceedings as both plaintiff and defendant. In the opinion of our management, none of these other litigation matters, individually or in the aggregate, if determined adversely to us, would have a material adverse effect on our business, financial condition or results of operations.
ITEM 6. EXHIBITS
Exhibits:
31.1 Certification of the Principal Executive Officer pursuant to Section 302 of the Sarbanes-Oxley Act of 2002.
31.2 Certification of the Principal Financial Officer pursuant to Section 302 of the Sarbanes-Oxley Act of 2002.
32.1 Certifications pursuant to 18 U.S.C. Section 1350, as adopted pursuant to Section 906 of the Sarbanes-Oxley Act of 2002.
33
SIGNATURES
Pursuant to the requirements of the Securities Exchange Act of 1934, the registrant has duly caused this report to be signed on its behalf by the undersigned thereunto duly authorized.
| WORLDSPAN, L.P. | |
| | | |
| | | |
August 10, 2005 | | | /s/ Rakesh Gangwal |
DATE | | By: | Rakesh Gangwal |
| | | Chairman, President and Chief Executive Officer |
| | | and Director |
| | | (principal executive officer) |
| | | |
| | | |
August 10, 2005 | | | /s/ Kevin W. Mooney |
DATE | | By: | Kevin W. Mooney |
| | | Chief Financial Officer |
| | | (principal financial and accounting officer) |
| | | | |
34