UNITED STATES
SECURITIES AND EXCHANGE COMMISSION
Washington, D.C. 20549
FORM 10-Q
x | | QUARTERLY REPORT PURSUANT TO SECTION 13 OR 15(d) OF THE SECURITIES EXCHANGE ACT OF 1934 |
| | |
For the quarterly period ended September 30, 2006 |
| | |
OR |
| | |
o | | TRANSITION REPORT PURSUANT TO SECTION 13 OR 15(d) OF THE SECURITIES EXCHANGE ACT OF 1934 |
For the transition period from To
Commission file number 333-109064
WORLDSPAN, L.P.
(Exact name of registrant as specified in its charter)
Delaware | | 75-3125716 |
(State or other jurisdiction of | | (I.R.S. Employer Identification No.) |
incorporation or organization) | | |
| | |
300 Galleria Parkway, N.W. | | |
Atlanta, Georgia | | 30339 |
(Address of principal executive offices) | | (Zip Code) |
Registrant’s telephone number, including area code (770) 563-7400
Indicate by check mark whether the registrant (1) has filed all reports required to be filed by Section 13 or 15(d) of the Securities Exchange Act of 1934 during the preceding 12 months (or for such shorter period that the registrant was required to file such reports), and (2) has been subject to such filing requirements for the past 90 days.
Indicate by check mark whether the Registrant is a large accelerated filer, an accelerated filer, or a non-accelerated filer (as defined in Rule 12b-2 of the Exchange Act).
Large accelerated filer o | Accelerated Filer o | Non-accelerated filer x |
Indicate by check mark whether the Registrant is a shell company (as defined in Rule 12b-2 of the Exchange Act). Yes o No x
As of November 3, 2006, Registrant’s parent had outstanding 85,265,948 shares of Class A Common Stock and 11,000,000 shares of Class B Common Stock.
WORLDSPAN, L.P.
REPORT ON FORM 10-Q
FOR THE PERIOD ENDED SEPTEMBER 30, 2006
INDEX
2
PART I. FINANCIAL INFORMATION
ITEM 1. FINANCIAL STATEMENTS
Worldspan, L.P.
Condensed Consolidated Balance Sheets
(dollars in thousands)
(Unaudited)
| | September 30, 2006 | | December 31, 2005 | |
Assets | | | | | |
Current assets | | | | | |
Cash and cash equivalents | | $ | 76,488 | | $ | 58,093 | |
Trade accounts receivable, net | | 90,591 | | 97,984 | |
Prepaid expenses and other current assets | | 19,993 | | 16,992 | |
Total current assets | | 187,072 | | 173,069 | |
Property and equipment, net | | 107,064 | | 91,283 | |
Deferred charges | | 22,537 | | 24,392 | |
Debt issuance costs, net | | 11,558 | | 14,626 | |
Supplier and agency relationships, net | | 210,110 | | 236,981 | |
Developed technology, net | | 166,930 | | 183,254 | |
Trade name | | 72,142 | | 72,142 | |
Goodwill | | 111,803 | | 111,803 | |
Other intangible assets, net | | 27,000 | | 29,106 | |
Other long-term assets | | 46,865 | | 52,194 | |
Total assets | | $ | 963,081 | | $ | 988,850 | |
| | | | | |
Liabilities and Partners’ Capital | | | | | |
Current liabilities | | | | | |
Accounts payable | | $ | 6,212 | | $ | 16,847 | |
Accrued expenses | | 139,249 | | 144,738 | |
Current portion of capital lease obligations | | 15,309 | | 17,863 | |
Current portion of long-term debt | | 4,000 | | 4,000 | |
Total current liabilities | | 164,770 | | 183,448 | |
Long-term portion of capital lease obligations | | 64,327 | | 36,555 | |
Long-term debt | | 562,500 | | 667,500 | |
Pension and postretirement benefits | | 56,254 | | 60,328 | |
Other long-term liabilities | | 9,902 | | 9,510 | |
Total liabilities | | 857,753 | | 957,341 | |
Commitments and contingencies | | | | | |
Partners’ capital | | 105,328 | | 31,509 | |
Total liabilities and Partners’ capital | | $ | 963,081 | | $ | 988,850 | |
The accompanying notes are an integral part of these condensed consolidated financial statements.
3
Worldspan, L.P.
Condensed Consolidated Statements of Operations
(dollars in thousands)
(Unaudited)
| | Three months ended | | Nine months ended | |
| | September 30,
2006 | | September 30,
2005 | | September 30,
2006 | | September 30,
2005 | |
| | | | | | | | | |
Revenues | | | | | | | | | |
Electronic travel distribution | | $ | 194,989 | | $ | 222,487 | | $ | 670,917 | | $ | 691,926 | |
Information technology services | | 17,517 | | 17,218 | | 55,371 | | 53,992 | |
Total revenues | | 212,506 | | 239,705 | | 726,288 | | 745,918 | |
Operating Expenses | | | | | | | | | |
Cost of revenues | | | | | | | | | |
Cost of revenues excluding developed technology amortization | | 138,931 | | 164,566 | | 464,606 | | 511,177 | |
Developed technology amortization | | 5,388 | | 5,420 | | 16,196 | | 18,009 | |
Total cost of revenues | | 144,319 | | 169,986 | | 480,802 | | 529,186 | |
Selling, general and administrative | | 26,996 | | 25,402 | | 84,688 | | 83,554 | |
Amortization of intangible assets | | 9,037 | | 9,288 | | 28,978 | | 27,558 | |
Total operating expenses | | 180,352 | | 204,676 | | 594,468 | | 640,298 | |
Operating income | | 32,154 | | 35,029 | | 131,820 | | 105,620 | |
Other Income (Expense) | | | | | | | | | |
Interest (expense) income, net | | (14,885 | ) | (15,793 | ) | (46,099 | ) | (43,695 | ) |
Loss on extinguishment of debt | | — | | — | | — | | (55,597 | ) |
Other, net | | (1,111 | ) | (275 | ) | (2,213 | ) | (495 | ) |
Total other expense, net | | (15,996 | ) | (16,068 | ) | (48,312 | ) | (99,787 | ) |
Income before provision for income taxes | | 16,158 | | 18,961 | | 83,508 | | 5,833 | |
Income tax expense | | 663 | | 860 | | 2,047 | | 3,317 | |
Net income | | $ | 15,495 | | $ | 18,101 | | $ | 81,461 | | $ | 2,516 | |
The accompanying notes are an integral part of these condensed consolidated financial statements.
4
Worldspan, L.P.
Condensed Consolidated Statements of Changes in Partners’ Capital
(dollars in thousands)
(Unaudited)
| | Partners’
Capital | | Accumulated
Other
Comprehensive
Income | | Total | |
| | | | | | | |
Balance at December 31, 2005 | | $ | 30,892 | | $ | 617 | | $ | 31,509 | |
Comprehensive income: | | | | | | | |
Net income | | 81,461 | | — | | 81,461 | |
Change in fair value of derivative accounted for as a hedge | | — | | 122 | | 122 | |
Comprehensive income | | | | | | 81,583 | |
Distribution to WTI | | (10,400 | ) | — | | (10,400 | ) |
Stock-based compensation | | 2,636 | | — | | 2,636 | |
Balance at September 30, 2006 | | $ | 104,589 | | $ | 739 | | $ | 105,328 | |
The accompanying notes are an integral part of these condensed consolidated financial statements.
5
Worldspan, L.P.
Condensed Consolidated Statements of Cash Flows
(dollars in thousands)
(Unaudited)
| | Nine months ended | |
| | September 30, 2006 | | September 30, 2005 | |
Cash flows from operating activities: | | | | | |
Net income | | $ | 81,461 | | $ | 2,516 | |
Adjustments to reconcile net income to net cash provided by operating activities: | | | | | |
Depreciation and amortization | | 70,825 | | 76,000 | |
Amortization of debt issuance costs | | 3,070 | | 2,479 | |
Loss on extinguishment of debt | | — | | 55,597 | |
Stock-based compensation | | 2,636 | | 2,176 | |
Loss on disposal of property and equipment, net | | 103 | | 359 | |
Other | | (14 | ) | — | |
Changes in operating assets and liabilities: | | | | | |
Trade accounts receivable, net | | 7,393 | | (31,933 | ) |
Prepaid expenses and other current assets | | 2,883 | | 2,502 | |
Deferred charges | | 1,855 | | 6,642 | |
Other long-term assets | | 472 | | 1,851 | |
Accounts payable | | (10,635 | ) | 2,194 | |
Accrued expenses | | (5,361 | ) | 5,982 | |
Pension and postretirement benefits | | (4,075 | ) | (3,641 | ) |
Other long-term liabilities | | 393 | | (4,370 | ) |
Net cash provided by operating activities | | 151,006 | | 118,354 | |
Cash flows from investing activities: | | | | | |
Purchase of property and equipment | | (4,392 | ) | (9,305 | ) |
Proceeds from sale of property and equipment | | 215 | | 102 | |
Capitalized software for internal use | | — | | (19 | ) |
Net cash used in investing activities | | (4,177 | ) | (9,222 | ) |
Cash flows from financing activities: | | | | | |
Proceeds from issuance of debt, net of debt issuance costs | | — | | 734,727 | |
Principal payments on capital leases | | (13,034 | ) | (14,516 | ) |
Principal payments on debt | | (105,000 | ) | (125,488 | ) |
Repurchase old notes | | — | | (327,555 | ) |
Distributions to and contributions from WTI, net | | (10,400 | ) | (427,238 | ) |
Net cash used in financing activities | | (128,434 | ) | (160,070 | ) |
Net increase (decrease) in cash and cash equivalents | | 18,395 | | (50,938 | ) |
Cash and cash equivalents at beginning of period | | 58,093 | | 100,474 | |
Cash and cash equivalents at end of period | | $ | 76,488 | | $ | 49,536 | |
The accompanying notes are an integral part of these condensed consolidated financial statements.
6
Worldspan, L.P.
Notes to Condensed Consolidated Financial Statements
(dollars in thousands)
(Unaudited)
1. Accounting Policies
Nature of Business. Worldspan, L.P. (“Worldspan” or the “Partnership”) is a Delaware limited partnership formed in 1990. On June 30, 2003, Worldspan Technologies Inc. (“WTI”), formerly named Travel Transaction Processing Corporation, formed by Citigroup Venture Capital Equity Partners, L.P. (“CVC”) and Ontario Teachers’ Pension Plan Board (“OTPP”), indirectly acquired 100% of the outstanding partnership interests of the Partnership from affiliates of Delta Air Lines, Inc. (“Delta”), Northwest Airlines, Inc. (“Northwest”) and American Airlines, Inc. (“American”) (the “Acquisition”). WTI owns all of the general partnership interests in the Partnership. WS Holdings LLC (“WS Holdings”), which is owned by WTI, is the sole limited partner of the Partnership, owning all of the limited partnership interests.
The Partnership provides information, reservations, transaction processing and related services for airlines, travel agencies and other travel-related entities. The Partnership owns and operates a global distribution system (“GDS”) and provides subscribers with access to and use of this GDS. The Partnership also charges airlines, hotels, car rental companies and others for the use of the GDS.
Basis of Presentation. The accompanying unaudited condensed consolidated financial statements have been prepared in accordance with accounting principles generally accepted in the United States for interim financial information and with the instructions to Form 10-Q and Article 10 of Regulation S-X. Accordingly, they do not include all of the information and footnotes required by accounting principles generally accepted in the United States for complete financial statements. In the opinion of management these financial statements contain all adjustments, consisting of normal recurring accruals, necessary to present fairly the financial position, results of operations and cash flows for the periods indicated. The preparation of financial statements in accordance with accounting principles generally accepted in the United States requires management to make estimates and assumptions that affect the amounts reported in the financial statements and the accompanying notes. Operating results for the three and nine months ended September 30, 2006 and September 30, 2005 are not necessarily indicative of results that may be expected for any other interim period or for the year ending December 31, 2006. The Partnership’s quarterly financial data should be read in conjunction with its consolidated financial statements for the year ended December 31, 2005 (including the notes thereto), set forth in its annual report on Form 10-K filed with the Securities and Exchange Commission on March 3, 2006.
Derivative Instruments. All derivatives are measured at fair value and recognized as either assets or liabilities on our consolidated balance sheets. Changes in the fair values of derivative instruments that do not qualify as hedges and/or any ineffective portion of hedges are recognized as a gain or loss in our condensed consolidated statement of operations in the current period. Changes in the fair values of derivative instruments used effectively as fair value hedges are recognized in earnings, along with the change in the value of the hedged item. Changes in the fair value of the effective portions of cash flow hedges are reported in other comprehensive income and recognized in earnings when the hedged item is recognized in earnings.
Risks and Uncertainties. The Partnership derives substantially all of its revenues from the travel industry. Accordingly, events, circumstances and changes affecting the travel industry, particularly changes in airline travel and the financial well-being of the participating airlines, can significantly affect the Partnership’s business, financial condition and results of operations. The Partnership’s customers are primarily located in the United States and Europe.
Travel agencies are the primary channel of distribution for the services offered by travel vendors. If the Partnership were to lose all or part of the transactions generated by any significant travel agency and not replace such transactions, its business, financial condition and results of operations could be adversely affected. One online agency subscriber, Expedia, generated transactions in the Partnership’s electronic travel distribution segment which resulted in revenues of approximately $53,533 and $66,353 for the three months ended September 30, 2006 and 2005, respectively, and $195,673 and $205,966 for the nine months ended September 30, 2006 and 2005, respectively. These amounts represented 25% and 28% of total revenues for the three months ended September 30, 2006 and 2005, respectively, and 27% and 28% of total revenues for the nine months ended September 30, 2006 and 2005, respectively.
On May 5, 2004, the Partnership announced that it had been informed by Expedia of its intention to move a portion of its transactions in North America to another GDS provider in order to diversify its GDS relationships beyond using a single provider to process substantially all of its GDS transactions. In October 2005, Expedia notified the Partnership of its intention to move some portion but not all of its European transactions to another GDS provider in 2006. Expedia announced in May 2006 that it had commenced booking at select points of sale certain European segments through another GDS. In July 2006, Expedia announced the commencement of processing transactions in North America with another GDS. The Partnership has confirmed that some of Expedia’s North American transactions are now being processed on another GDS. Expedia’s total transaction volume with the Partnership decreased significantly from its transaction volume with the Partnership during the third quarter of 2005, primarily due to a large number of transactions Expedia processed on another GDS during September 2006. The Partnership expects Expedia to substantially increase the number of its transactions processed on another
7
GDS in the fourth quarter of 2006 from the volume it processed on another GDS in the third quarter. Expedia has further indicated to the Partnership that it could process almost all of its volume on another GDS in the near future. However, the Partnership believes that it will continue to process a sizeable portion of Expedia’s transactions going forward, even if less than a majority of Expedia’s total bookings. The movement of Expedia’s transaction volume to another GDS has had, and in the future is expected to have, a significant adverse impact on the Partnership’s financial position and results from operations.
Also, on July 26, 2006, Hotwire, a division of Expedia, notified the Partnership of its intent to terminate its technology services agreement with us effective October 26, 2006. Hotwire ceased processing transactions on the Worldspan GDS in October. For the three and nine month periods ended September 30, 2006, Hotwire generated revenue of approximately $1,723 and $7,412, respectively.
Additionally, on June 13, 2006, Priceline, one of the Partnership’s largest online travel agency customers, notified the Partnership that it intended to begin processing segments on another GDS as soon as July 28, 2006. In October 2006, the Partnership has confirmed that some of Priceline’s North American transactions are now being processed on another GDS. The Partnership has not received any notification from Priceline as to the volume of transactions that it intends to move. Currently, the Partnership cannot forecast the annual magnitude of any such movement of transactions and therefore is unable to estimate the impact on its financial position, results of operations and cash flows.
Furthermore as more fully discussed in Note 5, if the Partnership is unable to satisfactorily resolve the claims asserted against it by Orbitz, Worldspan’s second largest online travel agency, and its lawsuit against the Partnership is successful, there would be few or no restrictions to prevent Orbitz from moving a significant portion of its business from Worldspan’s GDS. If Expedia, Priceline or Orbitz were to move a material portion of their respective transactions to other GDS providers, the Partnership’s business would be negatively and materially impacted.
A development within the GDS industry over the past several years involves the competitive need for GDSs to maintain full content, including web fare content, for distribution to traditional and online agency subscribers. In 2006, Worldspan has entered into long-term content agreements with certain major domestic airlines such as American, Continental Airlines, Inc. (“Continental”), Northwest, United Air Lines, Inc. (“United”), US Airways, Inc. (“US Airways”), and Delta. Subject to termination rights, these new agreements continue until 2011 with the exception of Delta which expires in 2013. See Note 11 for a discussion of Worldspan’s content agreements.
Effective September 14, 2005, Delta and Northwest, both significant suppliers of the Partnership, entered bankruptcy protection. Revenues generated by Delta and Northwest were $43,707 and $63,460 for the three months ended September 30, 2006 and 2005, respectively, and $160,004 and $203,444 for the nine months ended September 30, 2006 and 2005, respectively. These amounts represented approximately 21% and 26% of total revenues for the three months ended September 30, 2006 and 2005, respectively, and 22% and 27% for the nine months ended September 30, 2006 and 2005, respectively. Individually, Delta and Northwest accounted for 12% and 9%, respectively, of total revenue for the three months ended September 30, 2006, and 13% and 9%, respectively, of total revenue for the nine months ended September 30, 2006.
Pre-bankruptcy petition accounts receivable at September 30, 2006 under the Partnership’s two primary agreements with Northwest was $14,997. Pre-bankruptcy petition accounts receivable under the Partnership’s two primary agreements with Delta has been collected as of September 30, 2006. Post-bankruptcy petition accounts receivable at September 30, 2006 under the Partnership’s two primary agreements with Delta and Northwest collectively totaled $21,427. The Partnership believes that its pre-bankruptcy petition Northwest accounts receivable will likely be realized over an extended period of time. The Partnership believes it will continue to provide the services to the airlines and, absent further significant deterioration in the financial condition of the airlines, post-bankruptcy petition accounts receivable are expected to be collected in accordance with the terms of the Partnership’s current commercial agreements.
While under bankruptcy protection, Delta and Northwest could petition the court to reject certain or all of the existing agreements with the Partnership, except for the Participating Carrier Agreement with Northwest, which was assumed by Northwest and received Bankruptcy Court approval in June 2006. The Partnership is not aware of an action by either Delta or Northwest to reject any agreements with it and, accordingly continues to operate with the two airlines under its existing commercial agreements. See Note 11 for a discussion of the new five-year content agreement, which is an addendum to the Participating Carrier Agreement assumed by Northwest. Additional facts could become known or actions taken by either airline in bankruptcy that could impact the Partnership’s assessment of the collectibility and thus result in a charge to earnings in future periods. Furthermore, the Partnership is not yet in a position to ultimately determine whether payments previously made to it will be challenged or unwound in the bankruptcy proceedings.
The Partnership maintained an allowance for doubtful accounts of approximately $9,498 and $8,110 at September 30, 2006 and December 31, 2005, respectively.
8
Accounting Pronouncements. In December 2004, the Financial Accounting Standards Board (“FASB”) issued Statement of Financial Accounting Standards (“SFAS”) No. 123R, Share-Based Payment . The statement requires an entity to measure the cost of employee services received in exchange for an award of equity instruments based on the grant-date fair value of the award. That cost will be recognized over the period during which an employee is required to provide service in exchange for the award, known as the requisite service period. SFAS No. 123(R) became applicable to the Partnership beginning January 1, 2006. See Note 10 for a discussion of the impact of adopting SFAS No. 123(R).
In May 2005, the FASB issued SFAS No. 154, Accounting Changes and Error Corrections, which supersedes APB Opinion No. 20, Accounting Changes, and SFAS No. 3, Reporting Accounting Changes in Interim Financial Statements. SFAS No. 154 changes the requirements for accounting for and reporting of changes in accounting principles. The statement requires the retroactive application to prior periods’ financial statements of changes in accounting principles, unless it is impracticable to determine either the period specific effects or the cumulative effect of the change. SFAS No. 154 does not change the guidance for reporting the correction of an error in previously issued financial statements or the change in an accounting estimate. SFAS No. 154 became effective for accounting changes and corrections of errors made in fiscal years beginning after December 15, 2005. As of and for the nine months ended September 30, 2006, SFAS No. 154 did not impact the Partnership’s consolidated financial position or results of operations.
In February 2006, the FASB issued SFAS No. 155, Accounting for Certain Hybrid Financial Instruments. Under current generally accepted accounting principles an entity that holds a financial instrument with an embedded derivative must separate the financial instrument, resulting in the host financial instrument and the embedded derivative being accounted for separately. SFAS No. 155 permits, but does not require, entities to account for financial instruments with an embedded derivative at fair value thus negating the need to separate the instrument between its host and the embedded derivative. SFAS No. 155 is effective as of the beginning of the first annual reporting period that begins after September 15, 2006. The Partnership believes that SFAS No. 155 will not have a material effect on its consolidated financial condition or results of operations.
In March 2006, the FASB issued SFAS No. 156, Accounting for Servicing of Financial Assets. SFAS No. 156 amends SFAS No. 140, Accounting for Transfers and Servicing of Financial Assets and Extinguishments of Liabilities, to require that all separately recognized servicing assets and servicing liabilities be initially measured at fair value, if practicable. SFAS No. 156 permits, but does not require, the subsequent measurement of separately recognized servicing assets and servicing liabilities at fair value. An entity that uses derivative instruments to mitigate the risks inherent in servicing assets and servicing liabilities is required to account for those derivative instruments at fair value. SFAS No. 156 is effective as of the beginning of the first annual reporting period that begins after September 15, 2006. The Partnership believes that SFAS No. 156 will not have a material effect on its consolidated financial condition or results of operations.
In July 2006, the FASB issued FASB Interpretation No. 48, Accounting for Uncertainty in Income Taxes—an Interpretation of FASB Statement 109 (“FIN 48”), which clarifies the accounting for uncertainty in tax positions. FIN 48 prescribes a comprehensive model for recognizing, measuring, presenting and disclosing in the financial statements, tax positions taken or expected to be taken on a tax return, including a decision whether to file or not to file in a particular jurisdiction. FIN 48 provides that the tax effects from an uncertain tax position can be recognized in an entity’s financial statements, only if the position is more likely than not of being sustained on audit, based on the technical merits of the position. The provisions of FIN 48 are effective for fiscal years beginning after December 15, 2006, with the cumulative effect of the change in accounting principle recorded as an adjustment to opening retained earnings. The Partnership is currently assessing the impact of FIN 48 on its consolidated financial position and results of operations.
In September 2006, the SEC issued Staff Accounting Bulletin No. 108 (“SAB No. 108”), which provides interpretive guidance on how the effects of carryover or reversal of prior year misstatements should be considered in quantifying a current year misstatement. The SEC staff believes that errors should be quantified using both a balance sheet approach and an income statement approach and evaluated as to whether either approach results in quantifying a misstatement that, when all relevant quantitative and qualitative factors are considered, is material. SAB No. 108 is effective for the Partnership for the year ended December 31, 2006 and allows a one-time transitional cumulative effect adjustment to retained earnings as of January 1, 2006 for errors that were not previously deemed material, but are material under the guidance in SAB No. 108. The Partnership does not expect that the adoption of SAB No. 108 will have a material effect on its consolidated financial position or results of operations.
In September 2006, the FASB issued SFAS No. 157, Fair Value Measurements, which defines fair value, establishes a framework for measuring fair value and expands disclosure of fair value measurements. SFAS No. 157 applies under other accounting pronouncements that require or permit fair value measurements and accordingly, does not require any new fair value measurements. SFAS No. 157 is effective for financial statements issued for fiscal years beginning after November 15, 2007. The Partnership is currently assessing the impact, if any, that the adoption of this pronouncement will have on our financial statements.
9
In September 2006, the FASB issued SFAS No. 158, Employers’ Accounting for Defined Benefit Pension and Other Postretirement Plans — an amendment of FASB Statements No. 87, 88, 106, and 132(R). This pronouncement is effective for the Partnership as of December 31, 2007 and is required to be adopted prospectively. SFAS No. 158 requires that the Partnership recognize the funded status of its defined benefit and other postretirement benefit plans in its December 31, 2007 balance sheet, with changes in the funded status recognized through comprehensive income, net of tax, in the year in which they occur. The funded status of a plan is measured as the difference between plan assets at fair value and the benefit obligation, which is represented by the projected benefit obligation for pension plans and the accumulated postretirement benefit obligation for other postretirement plans. Based on the Partnership’s funded status of plan obligations disclosed in Note 6 to the Partnership’s Consolidated Financial Statements in its Annual Report on Form 10-K for the year ended December 31, 2005, the estimated impact of adopting SFAS No. 158 would have been an increase of approximately $9,400 in accumulated other comprehensive income at December 31, 2005, with no impact to the Partnership’s Consolidated Statements of Income or Cash Flows. The actual impact of adopting SFAS No. 158 could materially differ from this estimate as a result of changes in assumptions used in the valuation of projected plan obligations and the fair value of plan assets measured as of December 31, 2007. The Partnership’s plans are currently in compliance with the SFAS No. 158 requirement to be measured as of the date of the year-end statement of financial position. The Partnership does not anticipate that the adoption of SFAS No. 158 will have any impact on compliance with its financial covenants associated with its 2005 Senior Credit Facility and Indenture.
2. Debt
On February 11, 2005, the Partnership, WS Financing Corp. (“WS Financing”), the wholly-owned domestic subsidiaries of the Partnership, as guarantors (the “Guarantor Subsidiaries”) and The Bank of New York Trust Company, N.A., as trustee, entered into an Indenture (the “Indenture”). Pursuant to the Indenture, the Partnership, WS Financing and the Guarantor Subsidiaries issued $300,000 of Senior Second Lien Secured Floating Rate Notes due 2011 (the “Floating Rate Notes”), secured on a second priority basis by substantially all of the assets of the Partnership, WS Financing and the Guarantor Subsidiaries. In addition, the Partnership, as borrower, WTI, and WS Holdings entered into a new credit agreement (the “Credit Agreement”) with a syndicate of financial institutions as lenders. In connection with the closing under the Credit Agreement, a new senior credit facility (the “2005 Senior Credit Facility”), consisting of a five-year revolving credit facility in the amount of $40,000 and a new term loan facility due 2010 (the “Term Loan under 2005 Senior Credit Facility”) in the amount of $450,000, was made available to the Partnership. Obligations under the 2005 Senior Credit Facility and the guarantees are secured by a perfected first priority security interest in all of the Partnership’s tangible and intangible assets and all of the tangible and intangible assets of WTI and each of the Guarantor Subsidiaries, subject to customary exceptions, and a pledge of (i) all of the membership interests of WS Holdings LLC owned by WTI, (ii) all of the partnership interests owned by WTI and WS Holdings LLC, and (iii) all of the capital stock of the Partnership’s Guarantor Subsidiaries and significant portions of the Partnership’s holdings in foreign subsidiaries.
At the Partnership’s option, the interest rate applied to borrowings under the 2005 Senior Credit Facility is based on the LIBOR rate (as defined in the Credit Agreement) plus the initial applicable margin of 2.75%. The alternative rate is a base rate (generally defined as the sum of (i) the higher of (x) the prime rate and (y) the federal funds effective rate, plus one half percent (0.50%) per annum and (ii) an initial applicable margin of 1.75%). Borrowings under the 2005 Senior Credit Facility are subject to quarterly interest payments with respect to loans bearing interest at the base rate described above or at the end of each one, two, three or six month interest period for loans bearing interest at the LIBOR rate described above.
The interest rate applicable to borrowings under the Floating Rate Notes is based on the three-month LIBOR rate plus 6.25%. At September 30, 2006, the three-month LIBOR rate was 5.4%.
The net proceeds from the sale of the Floating Rate Notes and the closing of the Term Loan under 2005 Senior Credit Facility, along with available cash of the Partnership, were used to (collectively referred to as the “Refinancing Transactions”):
· repay approximately $57,488 of the outstanding balance of the then-existing senior term loan due 2007 including any accrued and unpaid interest then outstanding under the then existing senior credit facility,
· purchase pursuant to a cash tender offer of $279,500 of the Partnership’s outstanding 9 5/8% Senior Notes due 2011,
· distribute funds to WTI to redeem WTI’s outstanding Preferred Stock at a redemption price equal to the face amount of WTI’s Preferred Stock plus accrued and unpaid dividends to the redemption date for a total redemption price of approximately $375,729,
· distribute funds to WTI to pay a consent fee of $8,638 (the “Consent Fee”) to certain related parties of CVC in connection with the Holdco Notes described below, and
· pay fees and expenses related to the Refinancing Transactions.
10
In connection with the Refinancing Transactions, on February 16, 2005, WTI issued $43,630 in new 11% Subordinated Notes due 2013 (the “Holdco Notes”) to certain related parties of CVC and paid $365 in accrued and unpaid interest in exchange for the surrender and cancellation of all of the obligations owing by WTI related to the then outstanding subordinated notes due 2012.
As a result of the Refinancing Transactions described above, the Partnership recorded a loss on extinguishment of debt of $55,597 during the three months ended March 31, 2005.
On March 4, 2005, the Partnership entered into an interest rate swap with a notional amount that began at $508,370 on November 15, 2005 and is amortized on a quarterly basis to $102,250 at November 15, 2008. The reset dates on the swap are February 15, May 15, August 15 and November 15 of each year until maturity on November 15, 2008. The notional amount as of September 30, 2006 was $434,880. This agreement, which has been designated as a cash flow hedge, is being used to convert the variable component of the interest rates on certain indebtedness to a fixed rate of 4.3%, effective November 15, 2005. Because the critical terms of the swap match those of the debt it is hedging, the swap is considered a perfect hedge against changes in the fair value of the debt and the hedge has resulted in no ineffectiveness being recognized in operations. Changes in the fair value of the swap are recognized as a component of accumulated other comprehensive income in each reporting period. As of September 30, 2006, the total value of this swap was an asset of $4,118, including accrued interest of $614. The accrued interest is included in other current assets in the condensed consolidated balance sheet with the remainder of the total value included in other long-term assets.
On June 21, 2006, WTI, WS Holdings LLC, the Partnership, the lenders party thereto and JP Morgan Chase Bank, N.A., as administrative agent (the “Administrative Agent”) entered into the Second Amendment (the “Credit Amendment”) to the Credit Agreement. The Credit Amendment amends the Credit Agreement to provide that the Partnership or WTI, as applicable, may, provided that no revolving credit loans are outstanding, repurchase up to a total combined $50,000 aggregate principal amount of the Partnership’s and WS Financing’s outstanding Floating Rate Notes and/or WTI’s Holdco Notes, including any such Floating Rate Notes or Holdco Notes held by affiliates of the Partnership and WTI provided that no default or event of default has occurred and is continuing. As of November 3, 2006 the Partnership has not repurchased any Floating Rate Notes or Holdco Notes.
The 2005 Senior Credit Facility requires the Partnership to meet certain financial tests, including without limitation, a minimum interest coverage ratio and a maximum total leverage ratio. Also, the Indenture requires the Guarantor Subsidiaries to maintain a minimum fixed charge coverage ratio. In addition, certain non-financial covenants restrict the activities of the Guarantor Subsidiaries.
Long-term debt consisted of the following:
| | September 30,
2006 | | December 31,
2005 | |
| | | | | |
Term loan under 2005 Senior Credit Facility (1) | | $ | 266,000 | | $ | 371,000 | |
Floating Rate Notes (2) | | 300,000 | | 300,000 | |
9 5/8% Senior Notes (1) | | 500 | | 500 | |
| | 566,500 | | 671,500 | |
Less current portion of long-term debt | | 4,000 | | 4,000 | |
Long-term debt, excluding current portion | | $ | 562,500 | | $ | 667,500 | |
(1) Based on borrowing rates currently available to the Partnership, the carrying value of the debt obligation approximates fair value.
(2) $290,000 of the Floating Rate Notes are publicly traded and at November 3, 2006 had a market value of approximately $289,275 based on the quoted market price for such notes. The remaining $10,000 of Floating Rate Notes that are outstanding have not yet been registered with the Securities and Exchange Commission.
During the nine months ended September 30, 2006, the Partnership paid $105,000 in principal on the term loan, of which $3,000 were scheduled principal payments.
11
3. Employee Benefit Plans
The components of net pension and postretirement costs were as follows:
| | Pension benefits | | Pension benefits | |
| | Three months
ended
September 30,
2006 | | Three months
ended
September 30,
2005 | | Nine months
ended
September 30,
2006 | | Nine months
ended
September 30,
2005 | |
Service cost | | $ | — | | $ | — | | $ | — | | $ | — | |
Interest cost | | 2,923 | | 2,892 | | 8,769 | | 8,677 | |
Expected return on plan assets | | (3,948 | ) | (3,656 | ) | (11,844 | ) | (10,968 | ) |
Amortization of transition obligation | | — | | — | | — | | — | |
Amortization of prior service cost | | — | | — | | — | | — | |
Recognized net actuarial loss | | 32 | | 27 | | 96 | | 81 | |
Net periodic pension benefit income | | $ | (993 | ) | $ | (737 | ) | $ | (2,979 | ) | $ | (2,210 | ) |
| | Postretirement benefits | | Postretirement benefits | |
| | Three months
ended
September 30,
2006 | | Three months
ended
September 30,
2005 | | Nine months
ended
September 30,
2006 | | Nine months
ended
September 30,
2005 | |
Service cost | | $ | 59 | | $ | 66 | | $ | 177 | | $ | 197 | |
Interest cost | | 380 | | 407 | | 1,140 | | 1,220 | |
Expected return on plan assets | | — | | — | | — | | — | |
Amortization of transition obligation | | — | | — | | — | | — | |
Amortization of prior service cost | | — | | — | | — | | — | |
Recognized net actuarial loss | | — | | — | | — | | — | |
Net periodic pension benefit expense | | $ | 439 | | $ | 473 | | $ | 1,317 | | $ | 1,417 | |
Effective January 1, 2002, the defined benefit pension plan was amended to exclude employees hired on or after January 1, 2002. Effective December 31, 2003, the Partnership froze all further benefit accruals under the defined benefit pension plan.
4. Related Party Transactions
In February 2005, the Partnership entered into the Refinancing Transactions. Certain of the parties to these transactions were related parties, including WTI, CVC and OTPP. See Note 2 for a full description of these matters.
In connection with the Refinancing Transactions, on February 16, 2005, the Partnership entered into an amendment to its Advisory Agreement with WTI to terminate all advisory and other fees payable under that agreement as of January 1, 2005 in return for a prepayment of $7,700 payable on or before December 15, 2005. The prepaid advisory fees are included in “Prepaid expenses and other current assets” and “Other long-term assets” in the accompanying consolidated balance sheets. The prepaid advisory fees are being amortized on a straight line basis over the remaining term during which the services are provided. The agreement expires in June 2013. During the three and nine month periods ended September 30, 2006, the Partnership recognized $226 and $679, respectively, of expense in connection with this agreement. During the three and nine month periods ended September 30, 2005, the Partnership recognized a total of $226 and $1,054, respectively, of expense related to advisory fees.
On January 10, 2005, WTI entered into a Note Redemption Agreement (the “Note Redemption Agreement”) with Delta. Pursuant to the Note Redemption Agreement, WTI redeemed the 10% Subordinated Note due 2012 in an original principal amount of $45,000 issued by WTI to Delta on June 30, 2003, the additional notes issued in lieu of cash interest and all accrued and unpaid interest up to January 10, 2005 for $36,137. The Partnership distributed $36,137 to WTI to finance this transaction.
The Partnership distributed $8,000 and $4,700 to WTI during the nine months ended September 30, 2006 and 2005, respectively, to enable WTI to cover income taxes that it owed on the income generated by the Partnership in the United States. During the nine months ended September 30, 2006 and 2005, the Partnership distributed $2,400 and $1,587, respectively, to enable WTI to pay interest payments on the Holdco Notes. Under the WTI stock incentive plan, WTI offers restricted shares of its Common Stock and grants options to purchase shares of its Common Stock to certain employees of the Partnership. As the options and restricted shares are being granted to employees of
12
the Partnership, the Partnership recognizes this value as an expense over the period in which the options and restricted shares are expected to vest. See Note 10 for further discussion.
In 2005 the Partnership entered into a master services agreement for technology services with Calleo Distribution Technologies Pvt. Ltd (“Calleo”). Additionally in 2005, the Partnership’s United Kingdom domiciled subsidiary, Worldspan Services Limited, entered into a distributor agreement with Calleo for the distribution of Worldspan’s services in the India sub-continent and other countries. In 2006, the master services agreement for technology services with Calleo was terminated and the Partnership entered into a similar master services agreement for technology services with InterGlobe Technologies, Pvt. Ltd. (“IGT”). Mr. Rakesh Gangwal, Chairman, President and Chief Executive Officer of the Partnership, has a greater than 10% equity ownership interest in both Calleo and IGT. The master services agreement has an initial term of ten years, subject to termination rights. The distributor agreement also has an initial ten year term, subject to termination rights. Payments under the agreements are contingent upon bookings generated by Calleo. The Partnership has paid $974 and $718 to Calleo and IGT, respectively, during the three months ended September 30, 2006, and has paid $1,915 and $1,686 to Calleo and IGT, respectively, during the nine months ended September 30, 2006. The Partnership has a total of approximately $1,320 of accrued expenses owed to Calleo and IGT as of September 30, 2006. The Partnership has also recorded a prepaid asset in the amount of $221 as of September 30, 2006 that relates to deferred costs and that will be amortized over the 120 month term of the agreement.
During the nine months ended September 30, 2006 the Partnership entered into an internet service agreement with Time Warner Telecom, Inc. (“TWTC”). Mr. Kevin Mooney, Chief Financial Officer of the Partnership, is a director of TWTC. During the three and nine months ended September 30, 2006, the Partnership paid $4 to TWTC and, as of September 30, 2006, there were no accrued expenses owed to TWTC.
5. Commitments and Contingencies
Litigation
On September 19, 2005, the Partnership filed a lawsuit against Orbitz in the United States District Court, Northern District of Illinois, Eastern Division (“Federal Suit”). Orbitz is one of the Partnership’s largest online travel agency customers and represented approximately 10% of its transaction volume for the three and nine month periods ended September 30, 2006. The Federal Suit alleged that Orbitz accessed and used the Partnership’s seat map data in violation of the Federal Computer Fraud and Abuse Act (“FCFAA”) and in breach of the agreement with Orbitz. The Federal Suit contained several additional state-law claims. On April 19, 2006, the court considering the Federal Suit dismissed the claim under the FCFAA and relinquished jurisdiction over the Partnership’s state-law claims against Orbitz without prejudice to the Partnership refiling its state-law claims in state court. The Partnership filed an appeal with the United States Court of Appeals for the Seventh Circuit on May 18, 2006.
The Partnership refiled its state-law claims in the Circuit Court of Cook County, Illinois, County Department, Law Division. The complaint alleges that Orbitz’s improper accessing and use of the Partnership’s seat map data violates the Georgia Computer Systems Protection Act and the Partnership’s agreements with Orbitz, and that Orbitz’s use of Galileo and ITA, competing computer reservation systems, constitutes breaches of the Partnership’s agreement with Orbitz. The Partnership is seeking injunctive relief to prevent the unauthorized accessing and use of its seat map data as well as to prevent Orbitz’s use of the services or data of Galileo and ITA. The Partnership also seeks monetary damages from Orbitz in excess of $109,000 and reimbursement for its attorneys’ fees and costs.
After filing the Federal Suit, the Partnership learned that Orbitz filed suit against it on September 16, 2005, in the Circuit Court of Cook County, Illinois, County Department, Law Division, purporting to assert two causes of action against it for violation of the Illinois Consumer Fraud Act and equitable estoppel. Orbitz claimed that certain exclusivity, minimum segment fee and 100% booking requirement provisions in the agreement were illegal and in violation of public policy. In its suit, Orbitz seeks a court order precluding the Partnership from pursuing its breach of contract claims against Orbitz, an order terminating and rescinding the first and second amendments of the Partnership’s contract with Orbitz (which include, among other things, provisions containing commitments from Orbitz with respect to its usage of the Worldspan GDS through 2011), monetary damages in excess of $50, punitive damages and reimbursement for attorneys’ fees and costs. Orbitz filed an amended complaint against the Partnership on July 5, 2006. The amended complaint adds six counts, including claims of breach of contract, fraud and rescission, in addition to a declaratory judgment request. The complaint seeks equitable and monetary relief, attorney’s fees and costs, monetary damages in excess of $50 and prejudgment interest. The Orbitz case has been consolidated with the Partnership’s state court cases. The Partnership believes that the allegations in the Orbitz complaint are without merit and it intends to defend against this action vigorously. If the Partnership is unable to satisfactorily resolve the claims asserted by Orbitz and its lawsuit against the Partnership is successful, there would be few or no restrictions to prevent Orbitz from moving a significant portion of its business from the Worldspan GDS, which would have a material adverse effect on the Partnership’s business, financial condition and results of operations.
In September 2003, the Partnership received multiple assessments totaling €39,503 from the tax authorities of Greece relating to tax years 1993-2002. The Partnership filed appeals of these assessments. Pursuant to a formal tax amnesty program with the Greek authorities, the Partnership reached a settlement of the outstanding assessments in an amount of approximately €7,775. The Partnership Interest Purchase Agreement, dated March 3, 2003, provides that each of Delta, Northwest and American (collectively, Worldspan’s “founding airlines”) shall
13
severally indemnify WTI and hold WTI harmless on a net after-tax basis from and against any and all taxes of the Partnership and its subsidiaries related to periods prior to the Acquisition. The Partnership informed the founding airlines of the receipt of these assessments and the indemnity obligation of the founding airlines under the Partnership Interest Purchase Agreement. Delta and American have reimbursed the Partnership in full pursuant to their indemnity obligations. As of September 30, 2006, the balance of the amounts due from Northwest was $1,625. Because of the indemnity provision and other remedies available under the applicable agreements, the Partnership believes that this remaining balance will be recovered from Northwest and will not have a material effect on the Partnership’s financial position or results of operations.
Additionally, in connection with the Acquisition of the Partnership in 2003, Delta, Northwest and American agreed to retain the rights and obligations of all tax matters relating to tax periods prior to June 30, 2003. However, the exercise of these rights could be successfully challenged in bankruptcy court.
On July 26, 2006, Expedia and its affiliate, IAC Global LLC, (collectively, “Expedia”) filed a lawsuit against the Partnership in the Superior Court, King County, Washington. Among other actions and requests for relief, the complaint requests a declaratory judgment from the court regarding Expedia’s use of data and information provided by the Partnership as set forth in the contract between the parties. The Partnership believes that the allegations in the Expedia complaint are without merit and it intends to defend against this action.
In addition, the Partnership is currently involved in various claims related to matters arising from the ordinary course of business. Management believes the ultimate disposition of these actions will not materially affect the financial position or results of operations of the Partnership.
Operating and Capital Leases
On June 30, 2006, Worldspan signed amendments to the existing Asset Management Offering agreement (“AMO”), Enterprise Software Option agreement (“ESO”) and the Websphere Software Special Option agreement (“WSSO”), collectively referred to as the “IBM OIO Agreements”. The terms of the IBM OIO Agreements were extended from June 30, 2008 to June 30, 2011 with the option for two one-year renewal periods from June 30, 2011.
Consistent with prior treatment, the Partnership has accounted for the amended IBM OIO Agreements collectively as a multiple element arrangement of hardware, software, and services. Under the terms of these agreements, the Partnership has a remaining aggregate minimum commitment of $213,750 at September 30, 2006, plus additional contingent payments dependent upon the rate of growth of electronic travel distribution transaction volumes. Of the aggregate minimum commitment, approximately $163,296 represents future minimum lease payments for leases classified as operating at September 30, 2006 and approximately $50,454 represents future minimum lease payments for leases classified as capital at September 30, 2006.
Effective September 29, 2006, the Partnership entered a leasing arrangement with IBM to lease new mainframe and storage devices. This leasing arrangement increased capital lease obligations and property and equipment by $11,184.
14
The future minimum amounts payable under the IBM OIO Agreements are as follows at September 30, 2006:
| | Total IBM OIO
Agreements | | IBM OIO
Agreements
Operating Leases at
September 30, 2006 | | IBM OIO
Agreements
Capital Leases at
September 30, 2006 | |
2006 | | $ | 11,250 | | $ | 8,595 | | $ | 2,655 | |
2007 | | 45,000 | | 34,378 | | 10,622 | |
2008 | | 45,000 | | 34,378 | | 10,622 | |
2009 | | 45,000 | | 34,378 | | 10,622 | |
2010 | | 45,000 | | 34,378 | | 10,622 | |
Thereafter | | 22,500 | | 17,189 | | 5,311 | |
Total | | $ | 213,750 | | $ | 163,296 | | $ | 50,454 | |
Less imputed interest (1) | | | | | | (7,579 | ) |
Present value of net minimum lease payments related to IBM OIO Agreements | | | | | | $ | 42,875 | |
Present value of net minimum lease payments related to other capital leases (2) | | | | | | 36,761 | |
Total | | | | | | $ | 79,636 | |
Less current maturities | | | | | | (15,309 | ) |
Long-term maturities | | | | | | $ | 64,327 | |
(1) The interest rate used in computing the present value of the minimum lease payments ranges from approximately 5.30% to 7.25% depending on the asset being leased as required by SFAS No. 13.
(2) The interest rate used in computing the present value of the minimum lease payments ranges from approximately 4.2% to 12.0% depending on the asset being leased.
6. Other Events
In the first quarter of 2006, the Partnership collected outstanding previously disputed amounts regarding minimum booking fees owed by certain former online travel agency subscribers. The settlement resulted in the receipt of approximately $11,290. The receipts were classified in the accompanying statement of operations as a reduction in cost of revenues (because payments to the agencies exceeded payments received from the agencies) in accordance with Emerging Issues Task Force Issue No. 01-9, Accounting for Consideration Given by a Vendor to a Customer (Including a Reseller of the Vendor’s Products). In the second quarter of 2006, the Partnership collected an outstanding previously disputed amount regarding excess messaging fees owed by one of these former online travel agency subscribers. This final settlement resulted in the receipt of approximately $10,450 in fees which were classified in the accompanying statement of operations as revenue (because payments received from the agency exceeded payments to the agency). The contracts with these agencies have been terminated.
7. Business Segment Information
The Partnership’s operations are classified into two reportable business segments: electronic travel distribution and information technology services. The Partnership’s two reportable business segments are managed separately based on fundamental differences in their operations. In addition, each business segment offers different products and services. The electronic travel distribution segment distributes travel services of its suppliers to subscribers of the Worldspan GDS. By having access to the Worldspan GDS, subscribers are able to book reservations with the suppliers. The information technology services segment provides technology services to Delta and Northwest and other companies in the travel industry.
The Partnership evaluates segment performance and allocates resources based on operating income plus depreciation and amortization. The accounting policies of the reportable segments are the same as those described in the summary of significant accounting policies. There are no intersegment sales.
15
| | Three months ended | | Nine months ended | |
| | September 30,
2006 | | September 30,
2005 | | September 30,
2006 | | September 30,
2005 | |
Revenues | | | | | | | | | |
Electronic travel distribution | | $ | 194,989 | | $ | 222,487 | | $ | 670,917 | | $ | 691,926 | |
Information technology services | | 17,517 | | 17,218 | | 55,371 | | 53,992 | |
Total revenues | | $ | 212,506 | | $ | 239,705 | | $ | 726,288 | | $ | 745,918 | |
| | | | | | | �� | | |
Operating income (loss) | | | | | | | | | |
Electronic travel distribution | | $ | 37,718 | | $ | 42,511 | | $ | 148,899 | | $ | 128,554 | |
Information technology services | | (5,564 | ) | (7,482 | ) | (17,079 | ) | (22,934 | ) |
Total operating income | | $ | 32,154 | | $ | 35,029 | | $ | 131,820 | | $ | 105,620 | |
| | | | | | | | | |
Depreciation and amortization | | | | | | | | | |
Electronic travel distribution | | $ | 15,980 | | $ | 19,481 | | $ | 55,040 | | $ | 58,555 | |
Information technology services | | 5,182 | | 5,332 | | 15,785 | | 17,445 | |
Total depreciation and amortization | | $ | 21,162 | | $ | 24,813 | | $ | 70,825 | | $ | 76,000 | |
The Partnership’s principal administrative, marketing, product development and technical operations are located in the United States. Areas of operation outside of North America include EMEA, Asia and Latin America which are primarily composed of selling and marketing functions.
The following table includes selected interim financial information related to our geographic areas:
| | Three months ended | | Nine months ended | |
| | September 30,
2006 | | September 30,
2005 | | September 30,
2006 | | September 30,
2005 | |
Geographic areas | | | | | | | | | |
Total revenues | | | | | | | | | |
United States | | $ | 180,206 | | $ | 205,553 | | $ | 640,779 | | $ | 636,427 | |
Foreign | | 32,300 | | 34,152 | | 85,509 | | 109,491 | |
Total | | $ | 212,506 | | $ | 239,705 | | $ | 726,288 | | $ | 745,918 | |
| | September 30,
2006 | | December 31,
2005 | | | | | |
Long-lived assets | | | | | | | | | |
United States | | $ | 750,942 | | $ | 787,651 | | | | | |
Foreign | | 25,067 | | 28,130 | | | | | |
Total | | $ | 776,009 | | $ | 815,781 | | | | | |
8. Supplemental Guarantor/Non-Guarantor Financial Information
In conjunction with the closing of the Refinancing Transactions discussed in Note 2, the Term Loan under 2005 Senior Credit Facility became fully and unconditionally guaranteed on a senior secured basis by the domestic operations and assets of the Partnership (referred to as “Worldspan, L.P.—Guarantor” in the accompanying financial information). Included in Worldspan, L.P.—Guarantor are Worldspan, L.P. and all of its wholly-owned domestic subsidiaries including WS Financing. These domestic subsidiaries also fully and unconditionally guarantee on a second priority basis the Floating Rate Notes. These domestic subsidiaries collectively represent less than one percent of the Partnership’s total assets, Partners’ capital, total revenues, net income, and cash flows from operating activities. The guarantees of each of the legal entities comprised by Worldspan, L.P.—Guarantor are joint and several. The foreign subsidiaries (referred to as “Non-Guarantor Subsidiaries” in the accompanying financial information) represent the foreign operations of the Partnership. WS Financing does not have any substantial operations, assets or revenues. The following financial information presents condensed consolidating balance sheets, statements of operations and statements of cash flows for Worldspan, L.P.—Guarantor and Non-Guarantor Subsidiaries. The information has been presented as if Worldspan, L.P.—Guarantor accounted for its ownership of the Non-Guarantor Subsidiaries using the equity method of accounting.
16
Condensed Consolidating Balance Sheets
as of September 30, 2006
(dollars in thousands)
(Unaudited)
| | Worldspan, L.P.—
Guarantor | | Non-Guarantor
Subsidiaries | | Eliminating
Entries | | Worldspan
Consolidated | |
| | | | | | | | | |
Assets | | | | | | | | | |
Current assets | | | | | | | | | |
Cash and cash equivalents | | $ | 74,495 | | $ | 1,993 | | $ | — | | $ | 76,488 | |
Trade accounts receivable, net | | 88,806 | | 1,785 | | — | | 90,591 | |
Prepaid expenses and other current assets | | 18,766 | | 1,227 | | — | | 19,993 | |
Total current assets | | 182,067 | | 5,005 | | — | | 187,072 | |
Property and equipment, net | | 102,970 | | 4,094 | | — | | 107,064 | |
Deferred charges | | 14,005 | | 8,532 | | — | | 22,537 | |
Debt issuance costs, net | | 11,558 | | — | | — | | 11,558 | |
Goodwill | | 111,803 | | — | | — | | 111,803 | |
Other intangible assets, net | | 476,182 | | — | | — | | 476,182 | |
Investments in subsidiaries | | 32,464 | | — | | (32,464 | ) | — | |
Other long-term assets | | 34,424 | | 12,441 | | — | | 46,865 | |
Total assets | | $ | 965,473 | | $ | 30,072 | | $ | (32,464 | ) | $ | 963,081 | |
| | | | | | | | | |
Liabilities and Partners’ Capital | | | | | | | | | |
Current liabilities | | | | | | | | | |
Accounts payable | | $ | 6,236 | | $ | (24 | ) | $ | — | | $ | 6,212 | |
Intercompany accounts payable (receivable) | | 30,805 | | (30,805 | ) | — | | — | |
Accrued expenses | | 110,802 | | 28,447 | | — | | 139,249 | |
Current portion of capital lease obligations | | 15,309 | | — | | — | | 15,309 | |
Current portion of senior debt | | 4,000 | | — | | — | | 4,000 | |
Total current liabilities | | 167,152 | | (2,382 | ) | — | | 164,770 | |
Long-term portion of capital lease obligations | | 64,327 | | — | | — | | 64,327 | |
Long-term debt | | 562,500 | | — | | — | | 562,500 | |
Pension and postretirement benefits | | 56,254 | | — | | — | | 56,254 | |
Other long-term liabilities | | 9,912 | | (10 | ) | — | | 9,902 | |
Total liabilities | | 860,145 | | (2,392 | ) | — | | 857,753 | |
Commitments and contingencies | | | | | | — | | | |
Partners’ capital | | 105,328 | | 32,464 | | (32,464 | ) | 105,328 | |
Total liabilities and Partners’ capital | | $ | 965,473 | | $ | 30,072 | | $ | (32,464 | ) | $ | 963,081 | |
17
Condensed Consolidating Balance Sheets
as of December 31, 2005
(dollars in thousands)
(Unaudited)
| | Worldspan, L.P.—
Guarantor | | Non-Guarantor
Subsidiaries | | Eliminating
Entries | | Worldspan
Consolidated | |
| | | | | | | | | |
Assets | | | | | | | | | |
Current assets | | | | | | | | | |
Cash and cash equivalents | | $ | 55,238 | | $ | 2,855 | | $ | — | | $ | 58,093 | |
Trade accounts receivable, net | | 95,475 | | 2,509 | | — | | 97,984 | |
Prepaid expenses and other current assets | | 16,196 | | 796 | | — | | 16,992 | |
Total current assets | | 166,909 | | 6,160 | | — | | 173,069 | |
Property and equipment, net | | 85,311 | | 5,972 | | — | | 91,283 | |
Deferred charges | | 12,984 | | 11,408 | | — | | 24,392 | |
Debt issuance costs, net | | 14,626 | | — | | — | | 14,626 | |
Goodwill | | 111,803 | | — | | — | | 111,803 | |
Other intangible assets, net | | 521,483 | | — | | — | | 521,483 | |
Investments in subsidiaries | | 27,811 | | — | | (27,811 | ) | — | |
Other long-term assets | | 41,444 | | 10,750 | | — | | 52,194 | |
Total assets | | $ | 982,371 | | $ | 34,290 | | $ | (27,811 | ) | $ | 988,850 | |
| | | | | | | | | |
Liabilities and Partners’ Capital | | | | | | | | | |
Current liabilities | | | | | | | | | |
Accounts payable | | $ | 12,477 | | $ | 4,370 | | $ | — | | $ | 16,847 | |
Intercompany accounts payable (receivable) | | 31,461 | | (31,461 | ) | — | | — | |
Accrued expenses | | 111,089 | | 33,649 | | — | | 144,738 | |
Current portion of capital lease obligations | | 17,863 | | — | | — | | 17,863 | |
Current portion of long-term debt | | 4,000 | | — | | — | | 4,000 | |
Total current liabilities | | 176,890 | | 6,558 | | — | | 183,448 | |
Long-term portion of capital lease obligations | | 36,555 | | — | | — | | 36,555 | |
Long-term debt | | 667,500 | | — | | — | | 667,500 | |
Pension and postretirement benefits | | 60,370 | | (42 | ) | — | | 60,328 | |
Other long-term liabilities | | 9,547 | | (37 | ) | — | | 9,510 | |
Total liabilities | | 950,862 | | 6,479 | | — | | 957,341 | |
Commitments and contingencies | | | | | | | | | |
Partners’ capital | | 31,509 | | 27,811 | | (27,811 | ) | 31,509 | |
Total liabilities and Partners’ capital | | $ | 982,371 | | $ | 34,290 | | $ | (27,811 | ) | $ | 988,850 | |
18
Condensed Consolidating Statements of Operations
for the Three Months Ended September 30, 2006
(dollars in thousands)
(Unaudited)
| | Worldspan, L.P—
Guarantor | | Non-Guarantor
Subsidiaries | | Eliminating
Entries | | Worldspan
Consolidated | |
| | | | | | | | | |
Revenues | | $ | 180,206 | | $ | 32,300 | | $ | — | | $ | 212,506 | |
Operating expenses | | 151,277 | | 29, 075 | | — | | 180,352 | |
Operating income | | 28,929 | | 3,225 | | — | | 32,154 | |
Other income (expense) | | | | | | | | | |
Interest (expense) income, net | | (14,893 | ) | 8 | | — | | (14,885 | ) |
Income from subsidiaries | | 1,451 | | — | | (1,451 | ) | — | |
Other, net | | 8 | | (1,119 | ) | — | | (1,111 | ) |
Total other expense, net | | (13,434 | ) | (1,111 | ) | (1,451 | ) | (15,996 | ) |
Income before income taxes | | 15,495 | | 2,114 | | (1,451 | ) | 16,158 | |
Income tax expense | | — | | 663 | | — | | 663 | |
Net income | | $ | 15,495 | | $ | 1,451 | | $ | (1,451 | ) | $ | 15,495 | |
Condensed Consolidating Statements of Operations
for the Three Months Ended September 30, 2005
(dollars in thousands)
(Unaudited)
| | Worldspan, L.P.—
Guarantor | | Non-Guarantor
Subsidiaries | | Eliminating
Entries | | Worldspan
Consolidated | |
| | | | | | | | | |
Revenues | | $ | 205,553 | | $ | 34,152 | | $ | — | | $ | 239,705 | |
Operating expenses | | 173,226 | | 31,450 | | — | | 204,676 | |
Operating income | | 32,327 | | 2,702 | | — | | 35,029 | |
Other expense | | | | | | | | | |
Interest (expense) income, net | | (15,810 | ) | 17 | | | | (15,793 | ) |
Income from subsidiaries | | 1,139 | | — | | (1,139 | ) | — | |
Other, net | | 445 | | (720 | ) | — | | (275 | ) |
Total other expense, net | | (14,226 | ) | (703 | ) | (1,139 | ) | (16,068 | ) |
Income before income taxes | | 18,101 | | 1,999 | | (1,139 | ) | 18,961 | |
Income tax expense | | — | | 860 | | — | | 860 | |
Net income | | $ | 18,101 | | $ | 1,139 | | $ | (1,139 | ) | $ | 18,101 | |
19
Condensed Consolidating Statements of Operations
for the Nine Months Ended September 30, 2006
(dollars in thousands)
(Unaudited)
| | Worldspan, L.P.—
Guarantor | | Non-Guarantor
Subsidiaries | | Eliminating
Entries | | Worldspan
Consolidated | |
| | | | | | | | | |
Revenues | | $ | 640,779 | | $ | 85,509 | | $ | — | | $ | 726,288 | |
Operating expenses | | 518,038 | | 76,430 | | — | | 594,468 | |
Operating income | | 122,741 | | 9,079 | | — | | 131,820 | |
Other income (expense) | | | | | | | | | |
Interest (expense) income, net | | (46,170 | ) | 71 | | — | | (46,099 | ) |
Income from subsidiaries | | 4,653 | | — | | (4,653 | ) | — | |
Other, net | | 237 | | (2,450 | ) | — | | (2,213 | ) |
Total other expense, net | | (41,280 | ) | (2,379 | ) | (4,653 | ) | (48,312 | ) |
Income before income taxes | | 81,461 | | 6,700 | | (4,653 | ) | 83,508 | |
Provision for income taxes | | — | | 2,047 | | — | | 2,047 | |
Net income | | $ | 81,461 | | $ | 4,653 | | $ | (4,653 | ) | $ | 81,461 | |
Condensed Consolidating Statements of Operations
for the Nine Months Ended September 30, 2005
(dollars in thousands)
(Unaudited)
| | Worldspan, L.P—
Guarantor | | Non-Guarantor
Subsidiaries | | Eliminating
Entries | | Worldspan
Consolidated | |
| | | | | | | | | |
Revenues | | $ | 636,427 | | $ | 109,491 | | $ | — | | $ | 745,918 | |
Operating expenses | | 541,838 | | 98,460 | | — | | 640,298 | |
Operating income | | 94,589 | | 11,031 | | — | | 105,620 | |
Other income (expense) | | | | | | | | | |
Interest (expense) income, net | | (43,783 | ) | 88 | | — | | (43,695 | ) |
Loss on extinguishment of debt | | (55,597 | ) | — | | — | | (55,597 | ) |
Income from subsidiaries | | 6,742 | | — | | (6,742 | ) | — | |
Other, net | | 565 | | (1,060 | ) | — | | (495 | ) |
Total other expense, net | | (92,073 | ) | (972 | ) | (6,742 | ) | (99,787 | ) |
Income before income taxes | | 2,516 | | 10,059 | | (6,742 | ) | 5,833 | |
Income tax expense | | — | | 3,317 | | — | | 3,317 | |
Net income | | $ | 2,516 | | $ | 6,742 | | $ | (6,742 | ) | $ | 2,516 | |
20
Condensed Consolidating Statements of Cash Flows
for the Nine Months Ended September 30, 2006
(dollars in thousands)
(Unaudited)
| | Worldspan, L.P.—
Guarantor | | Non-Guarantor
Subsidiaries | | Eliminating
Entries | | Worldspan
Consolidated | |
| | | | | | | | | |
Net cash provided by (used in) operating activities | | $ | 156,252 | | $ | (5,246 | ) | $ | — | | $ | 151,006 | |
Cash flows from investing activities: | | | | | | | | | |
Purchase of property and equipment | | (4,008 | ) | (384 | ) | — | | (4,392 | ) |
Proceeds from sale of property and equipment | | 100 | | 115 | | — | | 215 | |
Investment in subsidiaries | | (4,653 | ) | — | | 4,653 | | — | |
Net cash used in investing activities | | (8,561 | ) | (269 | ) | 4,653 | | (4,177 | ) |
Cash flows from financing activities: | | | | | | | | | |
Principal payments on capital leases | | (13,034 | ) | — | | — | | (13,034 | ) |
Principal payments on debt | | (105,000 | ) | — | | — | | (105,000 | ) |
Distribution to WTI, net | | (10,400 | ) | — | | — | | (10,400 | ) |
Contributions to subsidiaries | | — | | 4,653 | | (4,653 | ) | — | |
Net cash (used in) provided by financing activities | | (128,434 | ) | 4,653 | | (4,653 | ) | (128,434 | ) |
Net increase (decrease) in cash and cash equivalents | | 19,257 | | (862 | ) | — | | 18,395 | |
Cash and cash equivalents at beginning of period | | 55,238 | | 2,855 | | — | | 58,093 | |
Cash and cash equivalents at end of period | | $ | 74,495 | | $ | 1,993 | | $ | — | | $ | 76,488 | |
21
Condensed Consolidating Statements of Cash Flows
for the Nine Months Ended September 30, 2005
(dollars in thousands)
(Unaudited)
| | Worldspan, L.P.—
Guarantor | | Non-Guarantor
Subsidiaries | | Eliminating
Entries | | Worldspan
Consolidated | |
Net cash provided by (used in) operating activities | | $ | 129,192 | | $ | (10,838 | ) | $ | — | | $ | 118,354 | |
Cash flows from investing activities: | | | | | | — | | | |
Purchase of property and equipment | | (6,926 | ) | (2,379 | ) | — | | (9,305 | ) |
Proceeds from sale of property and equipment | | 102 | | — | | — | | 102 | |
Capitalized software development costs | | (19 | ) | — | | — | | (19 | ) |
Investment in subsidiaries | | (12,265 | ) | — | | 12,265 | | — | |
Net cash used in investing activities | | (19,108 | ) | (2,379 | ) | 12,265 | | (9,222 | ) |
Cash flows from financing activities: | | | | | | | | | |
Proceeds from issuance of debt, net of debt issuance costs | | 734,727 | | — | | — | | 734,727 | |
Principal payments on capital leases | | (14,516 | ) | — | | — | | (14,516 | ) |
Principal payments on debt | | (125,488 | ) | — | | — | | (125,488 | ) |
Repurchase old notes | | (327,555 | ) | — | | — | | (327,555 | ) |
Distribution to and contributions from WTI, net | | (427,238 | ) | — | | — | | (427,238 | ) |
Contributions to subsidiaries | | — | | 12,265 | | (12,265 | ) | — | |
Net cash (used in) provided by financing activities | | (160,070 | ) | 12,265 | | (12,265 | ) | (160,070 | ) |
Net decrease in cash and cash equivalents | | (49,986 | ) | (952 | ) | | | (50,938 | ) |
Cash and cash equivalents at beginning of period | | 96,504 | | 3,970 | | — | | 100,474 | |
Cash and cash equivalents at end of period | | $ | 46,518 | | $ | 3,018 | | $ | — | | $ | 49,536 | |
22
9. Goodwill and Other Intangible Assets
Goodwill and other intangible assets consisted of the following:
| | | | September 30, 2006 | | December 31, 2005 | |
| | Estimated
Useful Life | | Cost | | Accumulated
Amortization | | Cost | | Accumulated
Amortization | |
Supplier and agency relationships | | 8-11 years | | $ | 318,467 | | $ | 108,357 | | $ | 321,618 | | $ | 84,637 | |
Information technology services contracts | | 5-15 years | | 36,126 | | 9,126 | | 36,126 | | 7,020 | |
Developed technology | | 5-11 years | | 238,850 | | 71,920 | | 238,979 | | 55,725 | |
Goodwill | | Indefinite | | 111,803 | | | | 111,803 | | — | |
Trade name | | Indefinite | | 72,142 | | — | | 72,142 | | — | |
| | | | $ | 777,388 | | $ | 189,403 | | $ | 780,668 | | $ | 147,382 | |
During the three months ended March 31, 2006, the Partnership recorded $1,615 in acceleration of amortization of agency relationship intangibles related to two online agencies. The contracts with the Partnership were terminated by the agencies. The write-off was recorded as additional amortization in the statement of operations. During the three months ended June 30, 2005, the Partnership recorded a $1,500 write-down of certain purchased software to be enhanced and ultimately used in multi-hosting services for smaller carriers. The carrying value of the software was written down to zero as a result of management’s decision to pursue other third party solutions as a means to provide these services to smaller carriers as well as management’s current evaluation of the current and potential revenue stream, among other factors. The write-down is included in “Developed technology amortization” in the accompanying consolidated statement of operations.
As discussed in Note 1, Delta and Northwest, both significant suppliers of the Partnership, entered bankruptcy protection in September 2005. In connection with the Acquisition, the Partnership recorded an intangible asset in the amount of $33,152 related to its founding airline services agreements (“FASAs”) with Delta and Northwest. As of September 30, 2006, the unamortized portion of the intangible asset related to the Delta and Northwest FASAs was $25,976. This amount is included in “Other intangible assets, net” in the accompanying consolidated balance sheets. The services provided to Delta and Northwest under the terms of their respective FASAs include internal reservation services, development services and other support services. The Partnership continues to provide services to the airlines in accordance with the terms of the respective FASA. The Partnership believes that these services are essential to the continued operation of the airlines. In addition, the Partnership believes that the cost of the services provided to Delta and Northwest are competitive to current market rates for these services given the cost formula and the monthly credit the airlines receive as a part of the FASA. The Partnership does not believe that the long term value of the FASA has changed based solely on the bankruptcy filings and any additional facts currently available to it. Additional facts could become known or actions taken by the airlines in bankruptcy that could impact the long term value of the FASA and possibly result in an impairment of the intangible asset in the future.
In connection with the Acquisition, the Partnership also recorded additional intangible assets of approximately $318,467 related to the value of its existing relationships with online travel agencies, traditional travel agencies and travel suppliers. The Partnership believes to date that the Delta and Northwest bankruptcy filings are not expected to have a materially adverse impact on cash flows because the travel customer would be able to select another supplier if Delta and Northwest were to selectively reduce their flight capacity. Alternatively, in connection with their bankruptcy related restructuring, Delta and Northwest could pursue a GDS alternative allowing them to bypass the Worldspan GDS. If either Delta or Northwest were successful in bypassing the Worldspan GDS or significantly reducing their flight capacity, the Partnership’s cash flow and financial condition could be materially, adversely affected and possibly result in an impairment of the intangible asset in the future.
Of the $318,467 recorded for the Partnership’s existing relationships with travel agencies and travel suppliers, the Partnership estimates that $35,234, $76,174 and $14,223 were related to the Expedia, Orbitz and Priceline contracts, respectively. Based on these estimates, the portions of these intangible assets that were unamortized as of September 30, 2006 were $20,920, $45,228 and $8,445. The Partnership will continue to monitor the outcome of the Orbitz claims against it and any movement in Expedia and/or Priceline to another GDS provider in order to assess the impact, if any, on the overall financial condition as prescribed by Statement of Financial Accounting Standards (“SFAS”) No. 144, Accounting for the Impairment or Disposal of Long-Lived Assets, and SFAS No. 142, Goodwill and Other Intangible Assets. See Note 1 for a discussion of the potential movement of Expedia, Priceline and Orbitz transactions to another GDS.
23
The Partnership recorded amortization expense for its intangible assets of $14,425 and $14,708 for the three months ended September 30, 2006 and 2005, respectively, and $45,173 and $45,567 for the nine months ended September 30, 2006 and 2005, respectively. Estimated amortization expense for the Partnership’s intangible assets, excluding the $45,173 amortization recorded for the nine months ended September 30, 2006, is as follows:
Year Ended December 31, | | | | | |
Remaining in 2006 | | $ | 14,478 | |
2007 | | 57,771 | |
2008 | | 56,871 | |
2009 | | 57,171 | |
2010 | | 57,171 | |
Thereafter | | 160,578 | |
| | $ | 404,040 | |
10. Stock-Based Compensation
Under the WTI stock incentive plan, WTI offers restricted shares of its Class A Common Stock and grants options to purchase shares of its Class A Common Stock to selected management employees of the Partnership. On June 15, 2006, the Human Resources Committee of the Board of Directors of WTI approved the Second Amendment to the WTI Stock incentive plan thereby authorizing a reserve of 13,250,000 shares of its Class A Common Stock for issuance under the stock incentive plan. The securities underlying the options are not traded on an established exchange. The exercise price of any options granted or the purchase price for restricted stock offered under the stock incentive plan is determined by the Board of Directors. Restricted stock awards and options generally vest quarterly over a five-year period which is deemed to be the service period over which the stock-based compensation expense is recognized. Options expire ten years from date of grant. Option grants consist of “Series 1” and “Series 2” options.
In the event of an employee termination, WTI has the right to repurchase all or any of the shares of Common Stock acquired by an employee under the WTI stock incentive plan for a cash payment equal to the fair market value (as determined by the Board of Directors) of the shares of Common Stock on the day of repurchase. If, however, the employee is terminated for cause, then the cash payment will be the lower of the fair market value and the employee’s original purchase price.
Prior to January 1, 2006, WTI accounted for employee stock options and restricted stock awards in accordance with SFAS No. 123, Accounting for Stock- Based Compensation (“SFAS No. 123”). Under SFAS No. 123, WTI valued the stock options based upon a binomial option-pricing model. As the options to purchase Class A Common Stock were being granted to employees of the Partnership, the Partnership recognized the grant-date fair value as an expense ratably over the period in which the options vest, with a corresponding increase in Partners’ capital.
In December 2004, the FASB issued SFAS No. 123(R), Share-Based Payment (“SFAS No. 123(R)”), which is a revision of SFAS No. 123. The Partnership adopted the provisions of SFAS No. 123(R) effective at the beginning of 2006. The Partnership elected to use the modified-prospective transition method which had no significant impact on income before income taxes, net income, cash flow from operations or cash flow from financing activities.
24
Stock option activity under the WTI stock incentive plan for the nine-month period ended September 30, 2006 is summarized as follows:
| | Series 1 | | Series 2 | |
| | Number of
Shares | | Weighted-Average
Exercise Price | | Number of
Shares | | Weighted-
Average
Exercise Price | |
Outstanding at December 31, 2005 | | 2,102,500 | | $ | 1.48 | | 2,102,500 | | $ | 6.49 | |
Granted (1) | | 72,500 | | 3.90 | | 72,500 | | 7.90 | |
Exercised (2) | | (304,750 | ) | 1.20 | | — | | 0.00 | |
Forfeited | | (39,000 | ) | 1.39 | | (39,000 | ) | 6.18 | |
Expired | | (11,500 | ) | 1.29 | | (16,250 | ) | 6.31 | |
| | | | | | | | | |
Outstanding at September 30, 2006 (3) | | 1,819,750 | | $ | 1.26 | | 2,119,750 | | $ | 6.22 | |
| | | | | | | | | |
Exercisable at September 30, 2006 (4) | | 826,250 | | $ | 1.05 | | 1,126,250 | | $ | 6.20 | |
(1) As allowed under SFAS No. 123(R), WTI has continued to apply the binomial option-pricing model in valuing the options granted in the third quarter of 2006 with the resulting fair value being amortized straight-line over the service period. The weighted-average exercise price and weighted-average grant-date fair value of the Series 1 options reflected above as being granted during the nine months ended September 2006, were $3.90 and $1.83, respectively, per share. These options were granted with an exercise price equal to or lower than the market value of the underlying Class A Common Stock. The weighted-average exercise price and weighted-average grant-date fair value of the Series 2 options reflected above as being granted during the nine months ended September 2006, were $7.90 and $0, respectively, per share. These options were granted with an exercise price higher than the market value of the underlying Class A Common Stock. During the nine months ended September 30, 2005, there were 285,000 Series 1 options granted with a weighted-average exercise price of $1.87 and a weighted-average grant-date fair value of $0.33; additionally, there were 285,000 Series 2 options granted with a weighted-average exercise price of $5.93 and a weighted-average grant-date fair value of $0.
(2) WTI received $365 in cash upon exercise of these options. The intrinsic value of the 304,750 Series 1 options exercised during the nine months ended September 30, 2006 was approximately $932.9, which represents the amount by which the market value of the underlying stock exceeds the exercise price of the option. The weighted average market value of the underlying stock was approximately $4.26 on the dates of exercise. There were no options exercised during the nine months ended September 30, 2005.
(3) The aggregate intrinsic value of the Series 1 and Series 2 options expected to vest at September 30, 2006 was approximately $2,793 and $0, respectively. See item (2) above regarding the definition of “intrinsic value.” The weighted-average exercise prices of the Series 1 and Series 2 options expected to vest were $1.44 and $6.25, respectively. The weighted-average remaining contractual term of the Series 1 and Series 2 options expected to vest at September 30, 2006 was 7.7 years for both Series. The total compensation cost to be recognized under SFAS 123(R) related to Series 1 and Series 2 options at September 30, 2006 expected to vest is approximately $587 and $107, respectively, which will be expensed over the remaining weighted-average vesting period of 3.0 years for both Series.
(4) The total fair value of Series 1 and Series 2 options vested at September 30, 2006 was approximately $406 and approximately $119, respectively. At September 30, 2005, there were 633,500 Series 1 options vested with a total fair value of approximately $201 and 633,500 Series 2 options vested with a total fair value of approximately $62. The aggregate intrinsic value of the Series 1 and Series 2 options vested at September 30, 2006 was approximately $2,405 and $0, respectively. See item (2) above regarding the definition of “intrinsic value.” The weighted-average remaining contractual term of the Series 1 and Series 2 options exercisable at September 30, 2006 was 7.0 years for both series.
25
For grants of options awarded during the nine months ended September 30, 2006 and 2005, the weighted-average assumptions used in the binomial option-pricing model were as follows:
| | Risk-Free
Interest Rate
(1) | | Expected
Life (2) | | Expected
Volatility (3) | | Expected
Dividend Yield | |
2006 | | 4.96 | % | 6.5 years | | 35.4 | % | 0 | % |
2005 | | 3.54 | % | 5.0 years | | 0.30 | % | 0 | % |
(1) Represents the rate of a U.S. Treasury security maturing from the grant date over a period of time approximating the expected life of the option.
(2) Prior to January 1, 2006, the Partnership estimated the expected life to approximate the vesting period. However, due to a lack of substantial history regarding the timing of exercises (the Partnership was formed only recently — June 30, 2003), the Partnership has elected to use the simplified method allowed by Staff Accounting Bulletin (SAB) No. 107 , Share-Based Payment , for estimating the expected term equal to the midpoint between the vesting period and the contractual term. This change of estimate was effective January 1, 2006.
(3) Prior to January 1, 2006, the Partnership estimated expected volatility to approach zero as the underlying stock is not publicly traded. Effective January 1, 2006, as required under SFAS No. 123 (R), the Partnership has estimated the volatility of the underlying stock. The Partnership has determined that the historical volatility experienced by one of its major competitor’s publicly-traded stock reflects a more accurate forecast of volatility.
During the first nine months of 2006, the Partnership granted 72,500 Series 1 options, with weighted average exercise prices and weighted average grant date fair values as follows:
| | Weighted Average
Exercise Price | | Weighted-
Average
Grant-Date Fair
Value (1) | |
Options whose exercise price was less than the market value of the underlying Class A Common Stock on the date of grant | | $ | 3.79 | | $ | 1.89 | |
Options whose exercise price was equal to the market value of the underlying Class A Common Stock on the date of grant | | $ | 3.96 | | $ | 1.78 | |
Options whose exercise price was greater than the market value of the underlying Class A Common Stock on the date of grant | | N/A | | N/A | |
(1) Grant-date fair value was calculated using the binomial option-pricing model.
26
Non-vested restricted share activity under the WTI stock incentive plan for the nine-month period ended September 30, 2006 is summarized as follows:
| | Number of
Shares | | Weighted-
Average
Grant-Date Fair
Value (1) | |
Non-vested restricted shares of Class A Common Stock at December 31, 2005 | | 3,139,046 | | $ | 2.54 | |
Granted | | 2,000,000 | | 3.96 | |
Vested (2) | | (580,500 | ) | .36 | |
Forfeited | | — | | — | |
| | | | | |
Non-vested restricted shares of Class A Common Stock at September 30, 2006 (3) | | 4,558,546 | | $ | 3.44 | |
(1) Under both SFAS No. 123(R) and SFAS No. 123, the fair value of restricted stock awards is measured as being the intrinsic value of the shares on the day of grant — i.e. the amount by which the market value of the shares on the day of grant exceeds the exercise/purchase price of the shares.
(2) The fair value of restricted stock awards vested during the nine months ended September 30, 2006 was approximately $208. No restricted stock awards vested during the nine months ended September 30, 2005.
(3) Of the non-vested shares at September 30, 2006, 4,558,546, are expected to vest. The total compensation cost to be recognized under SFAS 123(R) related to the shares at September 30, 2006 expected to vest is approximately $13,693, which will be expensed over the remaining weighted-average service period of 2.2 years.
During the three months ended September 30, 2006 and 2005, the Partnership recorded $1,279 and $768, respectively, in total stock-based employee compensation expense, of which $176 and $232, respectively, was attributable to stock options. During the nine months ended September 30, 2006 and 2005, the Partnership recorded $2,636 and $2,176, respectively, in total stock-based employee compensation expense, of which $535 and $465, respectively, was attributable to stock options. The Partnership recognized stock-based compensation expense (benefit) of $703 and ($42) during the three month periods ended September 30, 2006 and 2005 attributable to restricted stock grants. The Partnership recognized stock-based compensation expense of $789 and $93 during the nine month periods ended September 30, 2006 and 2005 attributable to restricted stock grants. The Partnership recognized stock-based compensation expense of $400 and $578 during the three month periods ended September 30, 2006 and 2005, respectively, attributable to restricted stock subscription agreements. The Partnership recognized stock-based compensation expense of $1,312 and $1,618 during the nine month periods ended September 30, 2006 and 2005, respectively, attributable to restricted stock subscription agreements.
On June 15, 2006, WTI entered into a Restricted Stock Subscription Agreement with the Partnership’s Chairman, President, and Chief Executive Officer, Rakesh Gangwal. Pursuant to the agreement, Mr. Gangwal received 2,000,000 shares of WTI Class A Common Stock. These shares are deemed to be Restricted Stock and will vest on June 30, 2009. Accelerated vesting will occur prior to the June 30, 2009 vesting date if there is a change in control of WTI, if Mr. Gangwal’s employment is terminated by Worldspan “without cause” or if Mr. Gangwal terminates his employment with Worldspan for “good reason,” as those terms are defined in the employment agreement between Mr. Gangwal and Worldspan. The Restricted Stock is subject to forfeiture if Mr. Gangwal’s employment is terminated for cause or if he resigns for any reason other than good reason prior to June 30, 2009.
27
11. Airline Content Agreements
During the first quarter of 2006, the Partnership signed a five-year content agreement with American. During the second quarter of 2006, the Partnership signed five-year content agreements with Continental, United and Northwest. And, during the third quarter of 2006, the Partnership signed a five-year content agreement with US Airways and a seven-year content agreement with Delta. The Northwest agreement received Bankruptcy Court approval on June 15, 2006. In conjunction with the agreements, Worldspan has developed two new optional products which were introduced into the marketplace in September 2006. Through these new agreements, travel agencies have the opportunity to access the airlines’ comprehensive published fares and inventory. The new content agreements have resulted in reduced transaction fees from participating airlines and reduced inducement fees paid to travel agencies within the territory as defined in the agreements. Since the effective date of the new content agreements, traditional travel agencies who adopted the optional products comprised almost all of total U.S. traditional travel agency transactions. For the third quarter, these new agreements had, and are expected to continue to have, a significant negative impact on the Partnership’s U.S. traditional agency business and also on the Partnership’s overall financial position and results from operations. However, as to the Partnership’s online travel agency business, the Partnership cannot predict at this time the ultimate impact of these agreements on its operating income, as the overall impact will be determined upon both the adoption of the Partnership’s two new optional product offerings by online travel agencies within the territory and the accompanying inducement payments required to be made to the online travel agencies by the Partnership, if any. The Partnership is evaluating various measures to mitigate the adverse financial impact of these agreements while offering the new products to its agency base and performing its obligations under the new airline content agreements. However, there is no guarantee that these measures, if implemented by the Partnership, will be successful.
28
ITEM 2. MANAGEMENT’S DISCUSSION AND ANALYSIS OF FINANCIAL CONDITION AND RESULTS OF OPERATIONS
References to “WTI” refer to Worldspan Technologies Inc. References to the “Company” or “Partnership” refer to Worldspan, L.P. The terms “we”, “us”, “our” and other similar terms refer to the consolidated businesses of the Company and all of its subsidiaries. References to the “Acquisition” refer to the acquisition by WTI, of our general partnership interests and, through its wholly- owned subsidiaries, limited partnership interests. The following discussion and analysis of the financial condition and results of operations should be read in conjunction with the consolidated financial statements and related notes included in our annual report on Form 10-K filed with the Securities and Exchange Commission (the “SEC”) on March 3, 2006.
Overview
We are a provider of mission-critical transaction processing and information technology services to the global travel industry. We provide subscribers (including traditional travel agencies, online travel agencies and corporate travel departments) with real-time access to schedule, price, availability and other travel information and the ability to process bookings and issue tickets for the products and services of travel suppliers (such as airlines, hotels, car rental companies, tour companies and cruise lines) throughout the world. Globally, we are the largest transaction processor for online travel agencies, having processed approximately 56% of all global distribution system, or GDS, online air transactions during the twelve months ended September 30, 2006. In the United States (the world’s largest travel market), we are the second largest transaction processor for travel agencies, accounting for approximately 31% of GDS air transactions and approximately 59% of online GDS air transactions processed during the twelve months ended September 30, 2006. During the twelve months ended September 30, 2006, we processed approximately 194 million transactions. We also provide information technology services to the travel industry, primarily airline internal reservation systems, flight operations technology and software development.
We depend upon a relatively small number of airlines and online travel agencies for a significant portion of our revenues. Our five largest airline relationships represented an aggregate of approximately 49% and 52% of our total revenues for the twelve months ended September 30, 2006 and December 31, 2005, respectively, while our top ten largest airline relationships represented an aggregate of approximately 61% and 64% of our total revenues for the twelve months ended September 30, 2006 and December 31, 2005, respectively. Our relationships with four online travel agencies, Expedia, Orbitz, Hotwire and Priceline, represented 52% of our total transactions during the twelve months ended September 30, 2006. We expect to continue to depend upon a relatively small number of airlines and online travel agencies for a significant portion of our revenues.
In September 2005, we and Orbitz LLC (“Orbitz”) each filed separate complaints against the other with respect to certain disputes arising under our online agreement with Orbitz. See “Item 1. Legal Proceedings” in Part II. In addition, on May 5, 2004, we announced that we had been informed by Expedia of its intention to move a portion of its transactions in North America to another GDS provider in order to diversify its GDS relationships beyond using a single provider to process substantially all of its GDS transactions. In October 2005, Expedia notified us of its intention to move some portion but not all of its European transactions to another GDS provider in 2006. Expedia announced in May 2006 that it had commenced booking at select points of sale certain European segments through another GDS. In July 2006, Expedia announced the commencement of processing transactions in North America with another GDS. We have confirmed that some of Expedia’s North American transactions are now being processed on another GDS. Expedia’s total transaction volume with us decreased significantly from its transaction volume with us during the third quarter of 2005, primarily due to a large number of transactions Expedia processed on another GDS during September 2006. We expect Expedia to substantially increase the number of its transactions processed on another GDS in the fourth quarter of 2006 from the volume it processed on another GDS in the third quarter. Expedia has further indicated to us that it could process almost all of its volume on another GDS in the near future. However, we believe that we will continue to process a sizeable portion of Expedia’s transactions going forward, even if less than a majority of Expedia’s total bookings. The movement of Expedia’s transaction volume to another GDS has had, and in the future is expected to have, a significant adverse impact on our financial position and results from operations.
Also, on July 26, 2006, Hotwire, a division of Expedia, notified us of its intent to terminate its technology services agreement with us effective October 26, 2006. Hotwire ceased processing transactions on the Worldspan GDS in October. For the three and nine month periods ended September 30, 2006, Hotwire transactions generated approximately $1.7 million and $7.4 million, respectively, in revenue.
Additionally, on June 13, 2006, Priceline, one of our largest online travel agency customers, notified us that it intended to begin processing segments on another GDS as soon as July 28, 2006. In October 2006, we have confirmed that some of Priceline’s North American transactions are now being processed on another GDS. We have not received any notification from Priceline as to the volume of transactions that it intends to move. Currently, we cannot forecast the annual magnitude of any such movement of transactions and therefore we are unable to estimate the impact on our financial position, results of operations and cash flows.
Effective September 14, 2005, Delta Air Lines, Inc. and Northwest Airlines, Inc., both significant suppliers of ours, entered bankruptcy protection. For a more complete discussion of the bankruptcies, see the section captioned “Liquidity and Capital Resources.”
29
Supplier Content and Transaction Fees
A development within the GDS industry over the past several years involves the competitive need for GDSs to maintain full content for distribution to traditional and online agency subscribers. Historically, we have increased the transaction fees we collect from our airline suppliers. As our business evolves and we continue to explore new ways to offer effective distribution options to our travel suppliers and travel agencies, we are entering into new content arrangements that depart from our traditional business model. As a result, we do not anticipate that the historic trend of annual transaction fee increases will continue in the future and in fact could decrease substantially.
During the first quarter of 2006, we signed a five-year content agreement with American. During the second quarter of 2006, we signed five-year content agreements with Continental, United and Northwest. And, during the third quarter of 2006, we signed a five-year content agreement with US Airways and a seven-year content agreement with Delta. The Northwest agreement received Bankruptcy Court approval on June 15, 2006. In conjunction with the agreements, Worldspan has developed two new optional products which were introduced into the marketplace in September 2006. Through these new agreements, travel agencies have the opportunity to access the airlines’ comprehensive published fares and inventory. The new content agreements have resulted in reduced transaction fees from participating airlines and reduced inducement fees paid to travel agencies within the territory as defined in the agreements. Since the effective date of the new content agreements, traditional travel agencies who adopted the optional products comprised almost all of total U.S. traditional travel agency transactions. For the third quarter, these new agreements had, and are expected to continue to have, a significant negative impact on our U.S. traditional agency business and also on our overall financial position and results from operations. However, as to our online travel agency business, we cannot predict at this time the ultimate impact of these agreements on our operating income, as the overall impact will be determined upon both the adoption of our two new optional product offerings by online travel agencies within the territory and the accompanying inducement payments required to be made to the online travel agencies by us, if any. We are evaluating various measures to mitigate the adverse financial impact of these agreements while offering the new products to our agency base and performing our obligations under the new airline content agreements. However, there is no guarantee that these measures, if implemented by us, will be successful.
We believe that obtaining similar content from our other major airline travel suppliers is important to our ability to compete, since other GDSs have also entered into content agreements with various airlines. We expect that future content agreements will require us to make, in the aggregate, significant payments or other concessions to the participating airlines, which we expect will reduce our revenues. Further, should we fail to maintain competitive content, our traditional and online agency subscribers could move transactions from us to competitors with access to this content, thus negatively affecting our business, financial condition and results of operation.
Financial Conditions in the Airline Industry
The downturn in the commercial airline market, together with, and resulting from, the ongoing threat of terrorist acts, the global economic downturn, the continuing conflict in Iraq and rising fuel costs for commercial airlines, among other issues, have adversely affected the financial condition of many commercial airlines. Several major airlines are experiencing liquidity problems, some have sought bankruptcy protection and still others are considering, or may consider, bankruptcy relief. We derive a substantial portion of our revenues from transaction fees received directly from airlines and from the sale of products and services directly to airlines. In circumstances where an airline declares bankruptcy, we may be unable to collect our outstanding accounts receivable from the airline. In addition, the bankruptcy of the airline might result in reduced transaction fees and other revenues from the airline, a rejection by the airline of some or all of our agreements with it, or loss of the revenue by other means such as an airline liquidation, all of which could have a material adverse effect on our business, financial condition and results of operation. In September 2005, Delta and Northwest entered bankruptcy protection. For further discussion of the potential impact of these bankruptcy filings, see “Management’s Discussion and Analysis of Financial Condition and Results of Operations—Liquidity and Capital Resources.”
Channel Shift
An increasing number of travel transactions are being made online. During the twelve months ended September 30, 2006, airline transactions generated through online travel agencies accounted for approximately 35% of all airline transactions in the United States processed by a GDS, up from approximately 34% in fiscal year 2005, approximately 31% in 2004, approximately 28% in 2003, and approximately 23% in 2002. Between 2002 and 2005, the number of airline transactions in the United States generated through online travel agencies and processed by us increased at a compound annual growth rate of 11.6%. We believe that this shift to online travel agency bookings will continue, but the extent and pace of the shift is difficult to anticipate. Other industry developments, such as the announcements by Expedia and Priceline, that they intend to move a portion of their transactions to other GDSs, compound our difficulty in forecasting the volume of our transactions from online travel agencies.
Uncertainty in Transaction Volumes from Online Travel Agencies
Although we have historically processed most of the airline transactions for our online travel agencies, these agencies may move a portion of their business to other technologies and technology providers, subject to some contractual limitations. For example, on May 5, 2004, we announced that we had been informed by Expedia of its intention to move a portion of its transactions in North America to another GDS provider in order to diversify its GDS relationships beyond using a single provider to process substantially all of its GDS transactions. In October 2005, Expedia notified us of its intention to move some portion but not all of its European transactions to another GDS provider in
30
2006. Expedia announced in May 2006 that it had commenced booking at select points of sale certain European segments through another GDS. In July 2006, Expedia announced the commencement of processing transactions in North America with another GDS. We have confirmed that some of Expedia’s North American transactions are now being processed on another GDS. Expedia’s total transaction volume with us decreased significantly from its transaction volume with us during the third quarter of 2005, primarily due to a large number of transactions Expedia processed on another GDS during September 2006. We expect Expedia to substantially increase the number of its transactions processed on another GDS in the fourth quarter of 2006 from the volume it processed on another GDS in the third quarter. Expedia has further indicated to us that it could process almost all of its volume on another GDS in the near future. However, we believe that we will continue to process a sizeable portion of Expedia’s transactions going forward, even if less than a majority of Expedia’s total bookings. The movement of Expedia’s transaction volume to another GDS has had, and in the future is expected to have, a significant adverse impact on our financial position and results from operations.
Also, on July 26, 2006, Hotwire, a division of Expedia, notified us of its intent to terminate its technology services agreement with us effective October 26, 2006. Hotwire ceased processing transactions on the Worldspan GDS in October. For the three and nine month periods ended September 30, 2006, Hotwire generated approximately $1.7 million and $7.4 million, respectively, in revenue.
In addition, on February 10, 2006, Priceline announced that it had signed an agreement with another GDS and, in June 2006, announced that it intended to begin moving transactions to this other GDS as soon as July 28, 2006. In October 2006, we have confirmed that some of Priceline’s North American transactions are now being processed on another GDS. We have not received any notification from Priceline as to the volume of transactions that it intended to move. Currently, we cannot forecast the magnitude of any such movement of transactions and therefore are unable to estimate the annual impact on our financial position, results of operations and cash flows.
In addition, Orbitz has developed direct connections with travel suppliers which bypass our GDS. Further, Orbitz is owned by Travelport, who also owns Galileo (a competitor of ours). Orbitz is one of our largest online travel agency customers. Our contract with Orbitz extends into 2011 subject to standard termination rights held by Orbitz including for-cause termination rights. Also, in September 2005, we and Orbitz each filed separate complaints against the other with respect to certain disputes arising under our online agreement with Orbitz. See “Item 1. Legal Proceedings” in Part II.
Furthermore, in connection with the Acquisition we recorded an intangible asset related to online customer contracts of $131.9 million, of which we estimate $35.2 million, $76.2 million and $14.2 million were related to the Expedia, Orbitz and Priceline contracts, respectively. Based on these estimates, the portions of these intangible assets that were unamortized as of September 30, 2006 were $20.9 million, $45.2 million and $8.4 million. We will continue to monitor the outcome of the Orbitz claims against us and any movement in Expedia and/or Priceline to another GDS provider in order to assess the impact, if any, on the overall financial condition as prescribed by Statement of Financial Accounting Standards (“SFAS”) No. 144, Accounting for the Impairment or Disposal of Long-Lived Assets, and SFAS No. 142, Goodwill and Other Intangible Assets.
Although we currently continue to operate under these agreements, it is uncertain as to whether or not these and our other major online travel agencies will not attempt to terminate their respective agreements with us or otherwise move business to another GDS in the future. With this uncertainty, we cannot reliably forecast the volume of such transactions and may experience transaction volume decreases that result in a material adverse effect on our financial condition and operating results.
FASA Credits
Pursuant to the terms of our founder airline services agreements, or FASAs, we provide FASA credits to Delta and Northwest to be applied against FASA service fee payments due from these airlines to us. The FASA credits are structured and will be applied through June 2012 in scheduled monthly installments up to an aggregate total of approximately $70.8 million to each of Delta and Northwest as of September 30, 2006, and are reflected as reductions of FASA revenue in the corresponding periods. In the event that the monthly FASA credits deliverable by us to Delta or Northwest are more than the FASA service fee payments due from the applicable airline, then we will be obligated to pay such excess to such airline in cash. See the section captioned “Liquidity and Capital Resources” below for further information on the FASA credits. At this time we cannot predict how the Delta and Northwest bankruptcies may affect the FASAs. The rejection of those agreements in bankruptcy by one or both airlines could have a material adverse effect on our business, financial condition and results of operations.
31
Business Segment Summary
Our revenues are primarily derived from transaction fees paid by our travel suppliers for electronic travel distribution services, and to a lesser extent, other transaction and subscription fees from our information technology services operations:
· Electronic travel distribution revenues are generated by charging a fee per transaction, which is generally paid by the travel supplier, based upon the number of transactions involved in the booking. We record and charge one transaction for each segment of an air travel itinerary (e.g., four transactions for a round-trip airline ticket with one connection each way). We record and charge one transaction for each car rental, hotel, cruise or tour company booking, regardless of the length of time associated with the booking. Fees paid by travel suppliers vary according to the levels of functionality at which they can participate in our GDS. These levels of functionality generally depend upon the type of communications and real-time access allowed with respect to the particular travel supplier’s internal systems.
· Revenues are based on the volume of transactions and are not dependent on the revenue earned by the supplier for that booking. We recognize revenue for airline travel transactions in the month the transactions are processed, net of current actual and estimated future cancellations for transactions processed in that month. Revenues for other types of travel transactions are recognized at the time the booking is used by the traveler.
Set forth below is a chart illustrating the flow of payments in a typical consumer travel booking processed by us pursuant to our traditional business model.
1 roundtrip airline ticket (one connection each way) | | 4 transactions |
1 car rental (3 days) | | 1 transaction |
1 hotel reservation (3 days) | | 1 transaction |
| | 6 transactions |
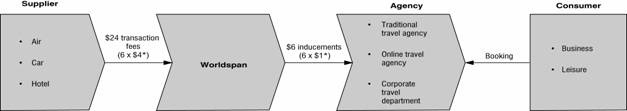
* Transaction and inducement fees are for illustrative purposes only.
· Information technology services revenues are generated by charging a fee for hosting travel supplier inventory, reservations, flight operations and other computer applications within our data center and by providing software development and maintenance services on those applications. Fees paid by hosted travel suppliers are generally based upon the volume of messages processed on behalf of the travel supplier or software development hours performed on the travel supplier’s applications. In some cases, we charge fees for access to and usage of certain of our proprietary applications on a per transaction basis. Revenues for information technology services are recognized in the month that the services are provided and are recorded net of the value of the FASA credits earned by Delta and Northwest in the corresponding month.
Our costs and expenses consist of the cost of electronic travel distribution and information technology services revenues, selling, general and administrative expenses and depreciation and amortization:
· Cost of electronic travel distribution revenues consists primarily of inducements paid to travel agencies, technology development and operations personnel, software costs, network costs, hardware leases, maintenance of computer and network hardware, the data center building, help desk and other travel agency support headcount. Cost of information technology services revenues consists primarily of technology development and operations personnel, software costs, network costs, hardware leases, depreciation of computer hardware and the data center building, amortization of capitalized software and maintenance of computer and network hardware.
32
· Selling, general and administrative expenses consist primarily of sales and marketing, labor and associated costs, advertising services, professional fees, a portion of the expenses associated with our facilities, depreciation of computer equipment, furniture and fixtures and leasehold improvements, internal management costs and expenses for finance, legal, human resources and other administrative functions.
Critical Accounting Policies
The discussion and analysis of our financial condition and results of operations is based on our consolidated financial statements, which have been prepared in accordance with accounting principles generally accepted in the United States. The preparation of these financial statements requires us to make estimates and judgments that affect our reported assets and liabilities, revenues and expenses, and other financial information. Actual results may differ significantly from these estimates, and our reported financial condition and results of operations could vary under different assumptions and conditions. In addition, our reported financial condition and results of operations could vary due to a change in the application of a particular accounting standard.
We regard an accounting estimate underlying our financial statements as a “critical accounting estimate” if the accounting estimate requires us to make assumptions about matters that are highly uncertain at the time of estimation and if different estimates that reasonably could have been used in the current period, or changes in the estimate that are reasonably likely to occur from period to period, would have had a material effect on the presentation of financial condition, changes in financial condition, or results of operations.
Prior to January 1, 2006, the Partnership accounted for employee stock options and restricted stock awards in accordance with SFAS No. 123, Accounting for Stock- Based Compensation (“SFAS No. 123”). In December 2004, the FASB issued SFAS No. 123(R), Share-Based Payment (“SFAS No. 123(R)”), which is a revision of SFAS No. 123. The Partnership adopted the provisions of SFAS No. 123(R) effective January 1, 2006. Like SFAS No. 123, SFAS No. 123(R) requires the use of various assumptions in determining the amount of compensation expense to recognize. Upon adoption of SFAS No. 123(R), the Partnership changed certain of its assumptions, including the following:
· Forfeiture rates — The Partnership changed from using actual forfeitures as allowed by SFAS No. 123 to using estimated forfeitures as required by SFAS No. 123(R).
· Expected life—Due to a lack of substantial history regarding the timing of exercises (the Partnership was formed only recently—June 30, 2003), the Partnership changed from using an estimate approximating the vesting period to using the simplified method allowed by Staff Accounting Bulletin (SAB) No. 107 , Share-Based Payment , for estimating the expected term equal to the midpoint between the vesting period and the contractual term.
· Expected volatility—Prior to January 1, 2006, the Partnership estimated expected volatility to approach zero as the underlying stock is not publicly traded. As required by SFAS No. 123(R), the Partnership has estimated the volatility of the underlying stock using the historical volatility experienced by one of its major competitor’s publicly-traded stock, an estimate which the Partnership has determined reflects a more accurate forecast of volatility.
The Partnership elected to use the modified-prospective transition method in adopting SFAS No. 123(R). The adoption of SFAS No. 123(R), including the changes in the above assumptions, had no significant impact on income before income taxes, net income, cash flow from operations or cash flow from financing activities.
Other than as discussed above regarding the adoption of SFAS No. 123(R), there have been no changes to our critical accounting policies or significant changes in assumptions or estimates that would affect such policies in the nine months ended September 30, 2006. Our critical accounting policies are described in Item 7, “Management’s Discussion and Analysis of Financial Condition and Results of Operations” in our Annual Report on Form 10-K for the year ended December 31, 2005.
33
Results of Operations
The following table shows information derived from our consolidated statements of operations expressed as a percentage of revenues for the periods presented.
| | Three months ended | | Nine months ended | |
| | September 30, 2006 | | September 30, 2005 | | September 30, 2006 | | September 30, 2005 | |
Revenues: | | | | | | | | | |
Electronic travel distribution | | 91.8 | % | 92.8 | % | 92.4 | % | 92.8 | % |
Information technology services | | 8.2 | | 7.2 | | 7.6 | | 7.2 | |
Total revenues | | 100.0 | | 100.0 | | 100.0 | | 100.0 | |
Operating expenses: | | | | | | | | | |
Cost of revenues excluding developed technology amortization | | 65.4 | | 68.6 | | 64.0 | | 68.5 | |
Developed technology amortization | | 2.5 | | 2.3 | | 2.2 | | 2.4 | |
Total cost of revenues | | 67.9 | | 70.9 | | 66.2 | | 70.9 | |
Selling, general and administrative expenses | | 12.7 | | 10.6 | | 11.7 | | 11.2 | |
Amortization of intangible assets | | 4.3 | | 3.9 | | 4.0 | | 3.7 | |
Total operating expenses | | 84.9 | | 85.4 | | 81.9 | | 85.8 | |
Operating income | | 15.1 | | 14.6 | | 18.1 | | 14.2 | |
Total other expense, net | | 7.5 | | 6.7 | | 6.7 | | 13.4 | |
Income before provision for income taxes | | 7.6 | | 7.9 | | 11.5 | | 0.8 | |
Income tax expense | | 0.3 | | 0.4 | | 0.3 | | 0.4 | |
Net income | | 7.3 | % | 7.5 | % | 11.2 | % | 0.4 | % |
The following table shows total transactions using the Worldspan GDS for the periods presented. The historical transaction data set forth below reflects the designations which were in effect for each period presented. We evaluate the classification of our travel agencies periodically and reclassify as appropriate.
Worldspan Transaction Summary
(in millions)
| | Three months ended | | | | Nine months ended | | | |
| | September 30, 2006 | | September 30, 2005 | | %
Change | | September 30, 2006 | | September 30, 2005 | | %
Change | |
Traditional | | 22.5 | | 23.4 | | (3.8 | )% | 73.5 | | 76.1 | | (3.4 | )% |
Online | | 22.4 | | 27.0 | | (17.0 | ) | 77.8 | | 84.1 | | (7.5 | ) |
Total transactions | | 44.9 | | 50.4 | | (10.9 | )% | 151.3 | | 160.2 | | (5.6 | )% |
Worldspan Revenue Summary
(in millions)
| | Three months ended | | | | Nine months ended | | | |
| | September 30, 2006 | | September 30, 2005 | | %
Change | | September 30, 2006 | | September 30, 2005 | | %
Change | |
| | | | | | | | | | | | | |
Electronic travel distribution | | $ | 195.0 | | $ | 222.5 | | (12.4 | )% | $ | 670.9 | | $ | 691.9 | | (3.0 | )% |
Information technology services | | 17.5 | | 17.2 | | 1.7 | | 55.4 | | 54.0 | | 2.6 | |
Total revenue | | $ | 212.5 | | $ | 239.7 | | (11.3 | )% | $ | 726.3 | | $ | 745.9 | | (2.6 | )% |
34
Worldspan Revenue per Transaction Summary
| | Three months ended | | | | Nine months ended | | | |
| | September 30, 2006 | | September 30, 2005 | | %
Change | | September 30, 2006 | | September 30, 2005 | | %
Change | |
Revenue per transaction | | $ | 4.34 | | $ | 4.41 | | (1.6 | )% | $ | 4.43 | | $ | 4.32 | | 2.5 | % |
| | | | | | | | | | | | | |
| | | | | | | | | | | | | | | | | |
(1) Revenue per transaction calculated as Electronic travel distribution revenue divided by total transactions.
Comparison of the Three Months Ended September 30, 2006 and September 30, 2005
Revenues
Total revenues decreased $27.2 million or 11.3% to $212.5 million from $239.7 million for the three months ended September 30, 2006 and 2005, respectively. Electronic travel distribution revenues decreased $27.5 million or 12.4% to $195.0 million from $222.5 million for the three months ended September 30, 2006 and 2005, respectively. This decrease was due to a 10.9% decline in total transactions, driven primarily by Expedia, and a 1.6% decrease in the average fee per transaction, driven primarily by the new content agreement pricing which became effective in September 2006. Information technology services revenues increased $0.3 million or 1.7% to $17.5 million from $17.2 million for the three months ended September 30, 2006 and 2005, respectively. The increase was primarily attributable to increased revenue associated with the use of Worldspan Rapid RepriceSM Electronic Ticketing and Fares and Pricing, partially offset by lower FASA revenue.
Cost of Revenues Excluding Developed Technology Amortization
Cost of revenues excluding developed technology amortization decreased $25.6 million or 15.6% to $138.9 million from $164.6 million for the three months ended September 30, 2006 and 2005, respectively. Cost of revenues excluding developed technology amortization as a percentage of total revenues decreased to 65.4% from 68.6% for the three months ended September 30, 2006 and 2005, respectively. The $25.6 million decrease was primarily driven by lower travel agency inducement expenses and technology costs.
Cost of electronic travel distribution revenues excluding developed technology amortization decreased $23.5 million or 16.4% to $120.0 million from $143.5 million for the three months ended September 30, 2006 and 2005, respectively. Cost of electronic travel distribution revenues excluding developed technology amortization as a percentage of total electronic travel distribution revenue decreased to 61.6% from 64.5% for the three months ended September 30, 2006 and 2005, respectively. The $23.5 million decrease was primarily attributable to a decrease in inducements paid to travel agencies and a decrease in technology costs. Inducements decreased due to fewer overall transactions due primarily to the Expedia transaction movement to another GDS and lower overall inducement rates paid to agencies primarily in connection with the implementation of the new content agreements in September 2006. Technology costs decreased due to the renegotiated IBM OIO Agreements (see “Operating and Capital Lease Obligations” under the heading “Liquidity and Capital Resources”) and the continued migration of traditional travel agencies to third-party owned equipment and networks and the migration of supplier connections to less expensive IP-based connections.
Cost of information technology services revenues excluding developed technology amortization decreased $2.2 million or 10.2% to $18.9 million from $21.1 million for the three months ended September 30, 2006 and 2005, respectively. Cost of information technology services revenues excluding developed technology amortization was 107.8% of information technology services revenue for the three months ended September 30, 2006 as compared to 122.7% for the three months ended September 30, 2005. This decrease was primarily caused by the reduced costs attributable to the hosting operations and development resources for Delta and Northwest.
Selling, General and Administrative Expenses
Selling, general and administrative expenses increased $1.6 million or 6.3% to $27.0 million from $25.4 million for the three months ended September 30, 2006 and 2005, respectively. The increase was primarily attributable to a $3.7 million increase in bad debt expense, partially offset by decreased outside services of $1.2 million and employee costs of $0.7 million. During the three months ended September 30, 2005, bad debt expense benefited from the full recovery on an outstanding customer balance. As a percentage of total revenue, selling, general and administrative expenses increased to 12.7% in the three months ended September 30, 2006 from 10.6% in the prior year.
35
Excluding the increase in bad debt expense, selling, general and administrative expenses decreased $2.1 million or 7.2% and were 12.1% of total revenue for the three months ended September 30, 2005 due primarily to lower revenues as a result of the factors discussed above.
Operating Income
Operating income decreased $2.9 million or 8.2% to $32.2 million from $35.0 million for the three months ended September 30, 2006 and 2005, respectively. As a percentage of total revenue, operating income increased to 15.1% from 14.6% for the three months ended September 30, 2006 and 2005, respectively. The dollar decrease is due primarily to the above mentioned decrease in revenue, partially offset by the decrease in cost of revenue excluding developed technology amortization.
Net Interest Expense
Net interest expense decreased $0.9 million or 5.7% to $14.9 million from $15.8 million for the three months ended September 30, 2006 and 2005, respectively. The decrease in net interest expense was primarily related to an increase in investment income.
Income Tax Expense
Income tax expense attributable to foreign jurisdictions decreased $0.2 million to $0.7 million from $0.9 million for the three months ended September 30, 2006 and 2005, respectively. The decrease in income tax expense primarily relates to a decrease in taxable income of our foreign subsidiaries during the three months ended September 30, 2006.
Net Income
Net income decreased $2.6 million or 14.4% to $15.5 million from $18.1 million for the three months ended September 30, 2006 and 2005, respectively. The decrease was primarily due to a $2.9 million decline in operating income.
Comparison of Nine Months Ended September 30, 2006 and September 30, 2005
Revenues
Total revenues decreased $19.6 million or 2.6% to $726.3 million from $745.9 million for the nine months ended September 30, 2006 and 2005, respectively. The decrease included the $10.5 million received during the second quarter of 2006 related to a contractual payment that was received from a certain former online travel agency in final settlement of a dispute. Excluding this receipt, revenue for the nine months ended September 30, 2006 would have been $715.8 million or a $30.1 million decline. This decrease was primarily due to a decline in transactions, partially offset by an increase in subscription-based technology services revenues.
Electronic travel distribution revenues decreased $21.0 million or 3.0% to $670.9 million from $691.9 million for the nine months ended September 30, 2006 and 2005, respectively. Absent the $10.5 million contractual payment mentioned above, electronic travel distribution revenues of $660.4 million were $31.5 million or 4.6% lower than the same period in 2005. This decrease was due to a 5.6% decline in total transactions, partially offset by a 2.5% increase in the average fee per transaction. The 2.5% increase in average fee per transaction includes the impact of the non-transaction based $10.5 million contractual payment discussed above. Without this contractual payment, the average fee per transaction was essentially unchanged from the prior year.
Information technology services revenues increased $1.4 million or 2.6% to $55.4 million from $54.0 million for the nine months ended September 30, 2006 and 2005, respectively. The increase was primarily attributable to increased revenue associated with the use of Worldspan Rapid Reprice SM, Electronic Ticketing and Fares and Pricing partially offset by lower FASA revenue.
Cost of Revenues Excluding Developed Technology Amortization
Cost of revenues excluding developed technology amortization decreased $46.6 million or 9.1% to $464.6 million from $511.2 million for the nine months ended September 30, 2006 and 2005, respectively. Cost of revenues excluding developed technology amortization as a percentage of total revenues decreased to 64.0% for the nine months ended September 30, 2006 compared to 68.5% for the nine months ended September 30, 2005. The $46.6 million decrease was primarily driven by lower inducements paid to travel agencies due to
36
fewer transactions and due to $11.3 million of minimum booking fees that were received from certain former online travel agencies related to the settlement of previously disputed amounts as well as lower technology costs and employee related costs.
Cost of electronic travel distribution revenues excluding developed technology amortization decreased $42.5 million or 9.5% to $404.5 million from $447.0 million for the nine months ended September 30, 2006 and 2005, respectively. Cost of electronic distribution revenues excluding developed technology amortization as a percentage of total electronic travel distribution revenue was 60.3% for the nine months ended September 30, 2006 compared to 64.6% for the nine months ended September 30, 2005. The decrease was primarily attributable to decrease in inducement costs paid to travel agencies as well as decreases in technology costs, employee related costs, and depreciation expense, partially offset by an increase in outside service costs. Inducements decreased due to the $11.3 million of minimum booking fees discussed above that were received in the first quarter of 2006. This agency revenue has been reclassified to inducement expense in accordance with Emerging Issues Task Force Issue No. 01-9, Accounting for Consideration Given by a Vendor to a Customer (Including a reseller of the Vendor’s Products). Excluding this agency revenue, inducement expense would have decreased $16.3 million primarily due to fewer overall transactions, partially offset by higher overall inducement rates. Technology costs decreased due to the continued migration of traditional travel agencies to third-party owned equipment and networks and the migration of supplier connections to less expensive IP-based connections as well as the renegotiated IBM OIO Agreements. Employee related costs declined from prior year due to lower headcount as a result of improved organizational effectiveness and efficiency and workforce reductions. Depreciation expense declined due to a decrease in agency equipment owned by us and various assets becoming fully depreciated in July 2006 that existed at Acquisition. Outside service costs increased primarily due to a higher volume of transactions in distributor markets globally.
Cost of information technology services revenues excluding developed technology amortization decreased $4.1 million or 6.3% to $60.1 million from $64.2 million for the nine months ended September 30, 2006 and 2005, respectively. Cost of information technology services revenues excluding developed technology amortization was 108.6% of information technology services revenue for the nine months ended September 30, 2006 as compared to 118.9% for the nine months ended September 30, 2005. This decrease was primarily caused by the reduced costs attributable to the hosting operations and development resources for Delta and Northwest.
Developed Technology Amortization
Developed technology amortization decreased $1.8 million or 10.1% to $16.2 million from $18.0 million for the nine months ended September 30, 2006 and 2005, respectively. Developed technology amortization was 2.2% of total revenues for the nine months ended September 30, 2006 as compared to 2.4% for the nine months ended September 30, 2005. The $1.8 million decrease was primarily the result of the write-down in the second quarter of 2005 of certain purchased software to be enhanced and ultimately used in multi-hosting services for smaller carriers. The carrying value of the software was written down as a result of management’s decision to pursue other third party solutions as a means to provide these services to smaller carriers as well as management’s current evaluation of the current and potential revenue stream of the software, among other factors.
Selling, General and Administrative Expenses
Selling, general and administrative expenses increased $1.1 million or 1.4% to $84.7 million from $83.6 million for the nine months ended September 30, 2006 and 2005, respectively. This $1.1 million increase included a $5.3 million increase in bad debt expense due to a prior year settlement received on an outstanding customer balance. Absent the increase in bad debt expense, expenses for the current year decreased $4.2 million or 4.7% from selling, general and administrative expenses for the prior year period. The decrease is primarily due to a 5.1% decline in employee costs and a 20.5% decline in rent and utilities. Employee costs declined due to a lower headcount from the prior year. Rent and utilities declined due to a reduction in the amount of office space leased. As a percentage of total revenue, selling, general and administrative expenses increased to 11.7% from 11.2% in the prior year. Excluding the reduction in bad debt expense in the prior year, selling, general and administrative expenses were 11.9% of total revenue for the nine months ended September 30, 2005.
Amortization of Intangible Assets
Amortization of intangible assets increased $1.4 million or 5.2% to $29.0 million from $27.6 million for the nine months ended September 30, 2006 and 2005, respectively. As a percentage of total revenue, amortization of intangible assets increased to 4.0% from 3.7% for the nine months ended September 30, 2006 and 2005, respectively. The $1.4 million increase is due to the acceleration of amortization in March 2006 of intangible assets related to two online agencies with whom we no longer have an agreement.
37
Operating Income
Operating income increased $26.2 million or 24.8% to $131.8 million from $105.6 million for the nine months ended September 30, 2006 and 2005, respectively. As a percentage of total revenue, operating income increased to 18.1% from 14.2% for the nine months ended September 30, 2006 and 2005, respectively. The increase is due primarily to a decrease in operating expenses of $45.8 million or 7.2%, partially offset by a decrease of $19.6 million or 2.6% in total revenue.
Net Interest Expense
Net interest expense increased $2.3 million or 5.5% to $46.0 million from $43.7 million for the nine months ended September 30, 2006 and 2005, respectively. The increase in net interest expense was primarily related to the increase in the interest rate on the Floating Rate Notes (as defined below under the heading “—Liquidity and Capital Resources—Floating Rate Notes and Senior Credit Facility”) and an increase in debt issuance costs partially offset by an increase in investment income.
Total Other Expense, Net
Total other expense, net decreased $51.5 million to $48.3 million from $99.8 million for the nine months ended September 30, 2006 and 2005, respectively. The decrease was primarily due to a $55.6 million loss on extinguishment of debt in connection with the Refinancing Transactions (as defined below under the heading “—Liquidity and Capital Resources—Use of Proceeds”) in February 2005.
Income Tax Expense
Income tax expense decreased $1.3 million to $2.0 million from $3.3 million for the nine months ended September 30, 2006 and 2005, respectively. The decrease in income tax expense primarily relates to a decrease in taxable income of our foreign subsidiaries during the nine months ended September 30, 2006.
Net Income
Net income increased $78.9 million to $81.5 million from $2.5 million for the nine months ended September 30, 2006 and 2005, respectively. The increase was primarily due to a $55.6 million loss on the extinguishment of debt associated with the Refinancing Transactions and to the receipt of $11.3 million and $10.5 million, respectively, during the quarters ended March 31, 2006 and June 30, 2006 in contractual payments from certain former online travel agencies in settlement of previous disputes.
Liquidity and Capital Resources
Our principal source of liquidity will be cash flow generated from operations, borrowings under capital lease obligations and borrowings under our 2005 Senior Credit Facility (as defined below). Our principal uses of cash will be to fund our planned operating expenditures which include operating expenses, capital expenditures, investments in our current as well as future products and offerings, interest payments on our debt and any mandatory or discretionary principal payments of our debt. Based on our current level of operations, we believe that our cash flow from operations, available cash of $76.5 million and available borrowings under our revolving credit facility will be adequate to meet our future liquidity needs for the next 12 months, although no assurance can be given. As of November 3, 2006, we have $40.0 million in available borrowings under our revolving credit facility which is a part of our 2005 Senior Credit Facility. Our future operating performance and ability to extend or refinance our indebtedness will be dependent on future economic conditions and financial, business and other factors that are beyond our control. Risk factors that could possibly affect the ability of our internally generated funds include, among other things:
· reduced sales due to declines in transaction volumes, movement of transactions to another GDS or reductions in price,
· acts of global terrorism, and
· bankruptcy filings of any of the airlines that comprise a significant portion of our revenues.
Effective September 14, 2005, Delta and Northwest, two of our significant suppliers, entered bankruptcy protection. Revenues generated by Delta and Northwest were $43.7 million and $63.5 million for the three months ended September 30, 2006 and 2005,
38
respectively, and $160.0 million and $203.4 million for the nine months ended September 30, 2006 and 2005, respectively. These amounts represented approximately 21% and 26% of total revenues for the three months ended September 30, 2006 and 2005, respectively, and 22% and 27% for the nine months ended September 30, 2006 and 2005, respectively. Individually, Delta and Northwest accounted for 12% and 9%, respectively, of total revenue for the three months ended September 30, 2006, and 13% and 9%, respectively, for the nine months ended September 30, 2006.
Pre-bankruptcy petition accounts receivable at September 30, 2006 under our two primary agreements with Northwest was $15.0 million, collectively. Pre-bankruptcy petition accounts receivable under the Partnership’s two primary agreements with Delta has been collected as of September 30, 2006. Post-bankruptcy petition accounts receivable at September 30, 2006 under our two primary agreements with Delta and Northwest are $21.4 million. We believe that our pre-bankruptcy petition accounts receivable from Northwest will likely be realized over an extended period of time. We believe we will continue to provide the services to the airlines and, absent further significant deterioration in the financial condition of the airlines, post-bankruptcy petition accounts receivable are expected to be collected in accordance with the terms of our current commercial agreements.
While under bankruptcy protection, Delta and Northwest could petition the court to reject certain or all of the existing agreements with us except for the Participating Carrier Agreement with Northwest, which was assumed by Northwest and received Bankruptcy court approval in June 2006. We are not aware of an action by either Delta or Northwest to reject any agreements with us and, accordingly, continue to operate with the two airlines under our existing commercial agreements. See the heading “Airline Content Agreements” for a discussion of the new five-year content agreement, which is an addendum to the Participating Carrier Agreement assumed by Northwest. Additional facts could become known or actions taken by either airline in bankruptcy that could impact our assessment of the collectibility and thus result in a charge to earnings in future periods. Furthermore, we are not yet in a position to ultimately determine whether payments previously made to us will be challenged or unwound in the bankruptcy proceedings.
Additionally, it is not possible for us to determine the long term impacts of the Delta and Northwest bankruptcies at this time. Actions taken in the future by the airlines in the bankruptcy proceedings could have a material, adverse impact on our financial condition and cash flows. If Delta was to reject our Participating Carrier Agreement (“PCA”), which represent $18.1 million or 74% of total revenue generated by Delta for the three months ended September 30, 2006, and $72.3 million or 77% of total revenue generated by Delta for the nine months ended September 30, 2006, it would have a material, adverse impact on our financial condition and cash flows.
Should these airlines fail to successfully emerge from bankruptcy, there can be no assurance that our cash flow from operations and borrowings available under our senior credit facility would be adequate to meet our future liquidity needs without additional capital. Such capital may or may not be available to us. For a more complete discussion of risk factors that might affect the availability of our internally generated funds, see “Item 1A. Risk Factors” in this report and in our annual report on Form 10-K for the year ended December 31, 2005.
At September 30, 2006, we had cash and cash equivalents of $76.5 million and working capital of $22.3 million as compared to $49.5 million in cash and cash equivalents and working capital of $1.4 million at September 30, 2005. The $27.0 million increase in cash was primarily the result of increased operating income, decreased costs associated with the Refinancing Transactions that occurred in February 2005 and the timing of the receipt of payments for international airline receivables from a clearing house before September 30, 2006. During 2005 these payments were not received until the middle of the subsequent month. The $20.9 million increase in working capital is primarily the result of higher cash and lower accrued expenses and accounts payable, partially offset by lower accounts receivable.
Historically, we have funded our operations through internally generated cash. We generated cash from operating activities of $151.0 million for the nine months ended September 30, 2006 as compared to $118.4 million for the nine months ended September 30, 2005. The $32.6 million increase in cash flows from operating activities during the first nine months of 2006 as compared to the first nine months of 2005 is primarily a result of receipts of minimum booking fees and contractual payments from certain former online travel agencies totaling $21.8 million during the first and second quarters of 2006 and the timing of the receipt of payments for international airline receivables as discussed above.
We used cash for investing activities of approximately $4.2 million for the nine months ended September 30, 2006 as compared to $9.2 million for the nine months ended September 30, 2005. The $5.0 million decrease in cash used for investing activities during the first nine months of 2006 as compared to the first nine months of 2005 primarily resulted from decreased capital expenditures.
We used cash for financing activities of approximately $128.4 million for the nine months ended September 30, 2006 as compared to $160.1 million for the nine months ended September 30, 2005. The $31.7 million decrease in cash used for financing activities during the first nine months of 2006 as compared to the first nine months of 2005 primarily resulted from the Refinancing Transactions that occurred in February 2005. To finance the redemption of the WTI Preferred Stock and the payment of the Consent Fee (as defined below under the heading “—Use of Proceeds”), we distributed $375.7 million and $8.6 million, respectively, to WTI. In addition, WTI redeemed the Delta subordinated note in January 2005 and we distributed $36.1 million to WTI to finance this transaction.
39
Floating Rate Notes and Senior Credit Facility
On February 11, 2005, we, WS Financing Corp. (“WS Financing”), our wholly-owned domestic subsidiaries, as guarantors (the “Guarantor Subsidiaries”) and The Bank of New York Trust Company, N.A., as trustee, entered into an Indenture (the “Indenture”). Pursuant to the Indenture, the Guarantor Subsidiaries issued $300.0 million of Senior Second Lien Secured Floating Rate Notes due 2011 (the “Floating Rate Notes”), secured on a second priority basis by substantially all of our assets and those of WS Financing and the Guarantor Subsidiaries. In addition, we, as borrower, WTI, and WS Holdings entered into a new credit agreement (the “Credit Agreement”) with a syndicate of financial institutions as lenders. In connection with the closing under the Credit Agreement, a new senior credit facility (the “2005 Senior Credit Facility”), consisting of a five-year revolving credit facility in the amount of $40.0 million and a new term loan facility due 2010 (the “Term Loan under 2005 Senior Credit Facility”) in the amount of $450.0 million, was made available to us. Obligations under the 2005 Senior Credit Facility and the guarantees are secured by a perfected first priority security interest in all of our tangible and intangible assets and all of the tangible and intangible assets of WTI and each of the Guarantor Subsidiaries, subject to customary exceptions, and a pledge of (i) all of the membership interests of WS Holdings LLC owned by WTI, (ii) all of the partnership interests owned by WTI and WS Holdings LLC, and (iii) all of the capital stock of our Guarantor Subsidiaries and significant portions of our holdings in foreign subsidiaries.
At our option, the interest rate applied to borrowings under the 2005 Senior Credit Facility is based on the LIBOR rate (as defined in the Credit Agreement) plus the initial applicable margin of 2.75%. The alternative rate is a base rate (generally defined as the sum of (i) the higher of (x) the prime rate and (y) the federal funds effective rate, plus one half percent (0.50%) per annum and (ii) an initial applicable margin of 1.75%). Our borrowings under the 2005 Senior Credit Facility are subject to quarterly interest payments with respect to loans bearing interest at the base rate described above or at the end of each one, two, three or six month interest period for loans bearing interest at the LIBOR rate described above.
The interest rate applicable to borrowings under the Floating Rate Notes is based on the three-month LIBOR rate plus 6.25%. At September 30, 2006, the three-month LIBOR rate was 5.4%.
On March 4, 2005, we entered into an interest rate swap with a notional amount that started at $508.4 million on November 15, 2005 and is amortized on a quarterly basis to $102.3 million at November 15, 2008. The reset dates on the swap are February 15, May 15, August 15 and November 15 of each year until maturity on November 15, 2008. The notional amount as of September 30, 2006 is $434.9 million. This agreement, which has been designated as a cash flow hedge, is being used to convert the variable component of the interest rates on certain indebtedness to a fixed rate of 4.3%, effective November 15, 2005. Because the critical terms of the swap match those of the debt it is hedging, the swap is considered a perfect hedge against changes in the fair value of the debt and the hedge has resulted in no ineffectiveness being recognized in operations. Changes in the fair value of the swap are recognized as a component of accumulated other comprehensive income in each reporting period. As of September 30, 2006, the total value of this swap was an asset of $4.1 million, including accrued interest of $0.6 million. The accrued interest is included in other current assets in the condensed consolidated balance sheet with the remainder of the total value included in other long-term assets.
On June 21, 2006, WTI, WS Holdings LLC, the Partnership, the lenders party thereto and JP Morgan Chase Bank, N.A., as administrative agent (the “Administrative Agent”) entered into the Second Amendment (the “Credit Amendment”) to the Credit Agreement. The Credit Amendment amends the Credit Agreement to provide that the Partnership or WTI, as applicable, may, provided that no revolving credit loans are outstanding, repurchase up to a total combined $50.0 million aggregate principal amount of the Partnership’s and WS Financing’s outstanding Floating Rate Notes and/or WTI’s Holdco Notes (as defined below), including any such Floating Rate Notes or Holdco Notes held by affiliates of the Partnership and WTI provided that no default or event of default has occurred and is continuing. As of November 3, 2006 the Partnership has not repurchased any Floating Rate Notes or Holdco Notes.
The 2005 Senior Credit Facility requires us to meet financial tests, including without limitation, a minimum interest coverage ratio and a maximum total leverage ratio. Also, the Indenture requires the Guarantor Subsidiaries to maintain a minimum fixed charge coverage ratio. In addition, the 2005 Senior Credit Facility contains customary covenants which, among other things, limit the incurrence of additional indebtedness, prepayments of other indebtedness, liens and encumbrances and other matters customarily restricted in a senior credit facility. The Indenture also includes certain restrictions on distributions from certain of our subsidiaries. As of September 30, 2006, we believe we were in compliance with the applicable covenants under both the 2005 Senior Credit Facility and the Indenture.
40
Use of Proceeds
The net proceeds from the sale of the Floating Rate Notes and the closing of the Term Loan under 2005 Senior Credit Facility, along with available cash, were used to (collectively referred to as the “Refinancing Transactions”):
· repay approximately $57.5 million of the outstanding balance of the then-existing senior term loan due 2007 including any accrued and unpaid interest then outstanding under the then existing senior credit facility,
· purchase pursuant to a cash tender offer of $279.5 million of our outstanding 9 5/8% Senior Notes due 2011,
· distribute funds to WTI to redeem WTI’s outstanding Preferred Stock at a redemption price equal to the face amount of WTI’s Preferred Stock plus accrued and unpaid dividends to the redemption date for a total redemption price of approximately $375.7 million,
· distribute funds to WTI to pay a consent fee of $8.6 million (the “Consent Fee”) to certain related parties of CVC in connection with the Holdco Notes described below, and
· pay fees and expenses related to the Refinancing Transactions.
As a result of the Refinancing Transactions described above, we recorded a loss on extinguishment of debt of $55.6 million during the three months ended March 31, 2005.
Also in connection with the Refinancing Transactions, on February 16, 2005, we entered into an amendment to our Advisory Agreement with WTI to terminate all advisory and other fees payable under that agreement as of January 1, 2005 in return for a prepayment of $7.7 million payable on or before December 15, 2005. We paid a total of $7.7 million in the third and fourth quarters of 2005.
Holdco Notes
In connection with the Refinancing Transactions, on February 16, 2005, WTI issued $43.6 million in new 11% Subordinated Notes due 2013 (the “Holdco Notes”) to certain related parties of CVC and paid $0.4 million in accrued and unpaid interest in exchange for the surrender and cancellation of all of the obligations owing by WTI related to the then outstanding subordinated notes due 2012. We periodically distribute funds to WTI to pay the interest on the Holdco notes. During the nine months ended September 30, 2006 and 2005 we distributed $2.4 million and $2.1 million, respectively, to WTI for this purpose. For 2006 we expect to distribute $4.8 million to WTI for this purpose.
Operating and Capital Lease Obligations
The Partnership has operating lease agreements which are principally for software, equipment and office facilities. We also lease equipment and software under capital lease obligations. As of September 30, 2006, our obligations under capital leases totaled $79.6 million.
On June 30, 2006, we signed amendments to the existing Asset Management Offering agreement (“AMO”), Enterprise Software Option agreement (“ESO”) and the Websphere Software Special Option agreement (“WSSO”), collectively referred to as the “IBM OIO Agreements”. The IBM OIO Agreements were extended from June 30, 2008 to June 30, 2011 with the option for two one-year renewal periods from June 30, 2011. We expect the amendments to reduce its operating expenses and cash out flows for the remainder of the term of the amended agreements.
Consistent with prior treatment, we have accounted for the amended IBM OIO Agreements collectively as a multiple element arrangement of hardware, software, and services. Under the terms of these agreements, we have a remaining aggregate minimum commitment of $213.8 million at September 30, 2006, plus additional contingent payments dependent upon the rate of growth of electronic travel distribution transaction volumes. Of the aggregate minimum commitment, approximately $163.3 million represents future minimum lease payments for leases classified as operating at September 30, 2006 and approximately $50.5 million represents future minimum lease payments for leases classified as capital at September 30, 2006.
Effective September 29, 2006, we entered a leasing arrangement with IBM to lease new mainframe and storage devices. This leasing arrangement increased capital lease obligations and property and equipment by $11,184.
41
The future minimum amounts payable under the IBM OIO Agreements are as follows at September 30, 2006:
(dollars in thousands)
| | Total IBM OIO
Agreements | | IBM OIO Agreements
Operating Leases at
September 30, 2006 | | IBM OIO Agreements
Capital Leases at
September 30, 2006 | |
2006 | | $ | 11,250 | | $ | 8,595 | | $ | 2,655 | |
2007 | | 45,000 | | 34,378 | | 10,622 | |
2008 | | 45,000 | | 34,378 | | 10,622 | |
2009 | | 45,000 | | 34,378 | | 10,622 | |
2010 | | 45,000 | | 34,378 | | 10,622 | |
Thereafter | | 22,500 | | 17,189 | | 5,311 | |
Total | | $ | 213,750 | | $ | 163,296 | | $ | 50,454 | |
Less imputed interest (1) | | | | | | (7,579 | ) |
Present value of net minimum lease payments related to IBM OIO Agreements | | | | | | $ | 42,875 | |
Present value of net minimum lease payments related to other capital leases (2) | | | | | | 36,761 | |
Total | | | | | | $ | 79,636 | |
Less current maturities | | | | | | (15,309 | ) |
Long-term maturities | | | | | | $ | 64,327 | |
(1) The interest rate used in computing the present value of the minimum lease payments ranges from approximately 5.30% to 7.25% depending on the asset being leased as required by SFAS No. 13.
(2) The interest rate used in computing the present value of the minimum lease payments ranges from approximately 4.2% to 12.0% depending on the asset being leased.
FASAs
Pursuant to the terms of the FASAs, we provide FASA credits to Delta and Northwest to be applied against FASA service fee payments due from these airlines to us. The FASA credits are structured and will be applied through June 2012 in an amount up to an aggregate total of $70.8 million to each of Delta and Northwest as of September 30, 2006, and are reflected as reductions to our FASA revenues in the corresponding periods. The FASA credits are provided to Delta and Northwest in monthly installments, with an annual amount of $16.7 million scheduled to be provided to each of these founding airlines during the first six years of the respective FASA term, an annual amount of $9.2 million scheduled to be provided to each of these founding airlines during the seventh and eighth years of the respective FASA term and an annual amount of $6.7 million scheduled to be provided to each of these founding airlines during the ninth year of the respective FASA term. In the event that the monthly FASA credits deliverable by us to Delta or Northwest are more than the FASA service fee payments due from the applicable airline, then we will be obligated to pay such excess to such airline in cash.
Delta or Northwest may terminate its FASA due to a failure by us to satisfy the mainframe processing time, system availability or critical production data performance standards under that agreement (which represent performance standards which we have historically met under our predecessor services agreements with Delta and Northwest). Furthermore, such a termination by Delta or Northwest of its FASA constitutes an event of default under our 2005 Senior Credit Facility. In the event that the event of default is waived by the applicable lenders under our senior credit facilities (as defined in the subordination agreement executed by the founding airlines) or our senior credit facilities are no longer outstanding, then any remaining FASA credits deliverable by us to the terminating airline will not be provided according to the initial nine year schedule specified above and will instead be payable in cash to such airline as and when, and only to the extent that, we are permitted to make such payments as “Restricted Payments” under the restricted payment covenant test contained in the indenture governing our 9 5/8% Senior Notes and the Floating Rate Notes. If a FASA is otherwise terminated in accordance with its terms prior to the expiration of its term, such as a termination by either Delta or Northwest without cause, or is rejected by Delta or Northwest in bankruptcy, then the obligation to provide the remaining FASA credits or to make the remaining FASA credit payments then deliverable or payable to the airline under the applicable FASA will terminate. See discussion of the Delta and Northwest bankruptcies under “Item 2. Management’s Discussion and Analysis of Financial Condition and Results of Operations—Overview.” Our obligations to provide FASA credits or to make the FASA
42
credit payments will not terminate if either or both of Delta and Northwest reduce or cease operations in a way that reduces or eliminates the amount of airline services either founding airline obtains under the FASAs, although an airline’s failure to comply with its software development minimum and exclusivity obligations would constitute a breach of its agreement. If we terminate a FASA other than as expressly permitted by the agreement, then we will be obligated to provide the scheduled FASA credits to the applicable airline by way of a monthly cash payment rather than applying the FASA credits against FASA service fee payments due from the airline. In the event that the monthly FASA credits deliverable by us to Delta or Northwest are more than the FASA service fee payments due from the applicable airline, then we will be obligated to pay such excess to such airline in cash. In the event of our bankruptcy or insolvency, holders of our senior debt (as defined in the subordination agreement executed by the founding airlines), including the 9 5/8% Senior Notes and the Floating Rate Notes, will be entitled to receive payments in full in cash before we may make any FASA credit payments in cash. In that event, Delta and Northwest will, however, retain their rights to apply the scheduled FASA credit payments against their obligations to pay us fees for our services under the FASAs. In the event that we wrongfully terminate a FASA, we will remain obligated to deliver the FASA credits to the applicable airline by paying the credit amounts to the applicable airline in cash on a monthly basis according to the nine-year schedule described above. However, if we reject a FASA in a bankruptcy of the company, our FASA credit payment obligations to the applicable airline will match the obligations described above in a termination of a FASA by such airline due to our failure to satisfy performance standards. Any FASA credit payment obligations by us to an airline in such a bankruptcy will be subordinated to our senior debt (as defined in the subordination agreement executed by the founding airlines), including the 9 5/8% Senior Notes and the Floating Rate Notes.
Taxes
Because we are a limited partnership, our partners will owe taxes on all of the income that we generate in the United States. We expect that WTI will cause us to make distributions to it from time to time sufficient to cover all income taxes owed by WTI. Under the terms of our 2005 Senior Credit Facility and the indentures governing our 9 5/8% Senior Notes and the Floating Rate Notes, we are specifically permitted to make these tax distributions. During the nine months ended September 30, 2006 we distributed $8.0 million to WTI for U.S. income taxes. We expect to distribute an additional $8.0 million to WTI for 2006 taxes, although actual results of operations could cause this amount to differ materially.
Capital Expenditures
Capital expenditures for property and equipment, including purchased assets, assets acquired under capital leases and capitalized software, totaled $41.7 million (of which $4.4 million were cash capital expenditures) for the nine months ended September 30, 2006. This is an increase of $31.7 million from capital expenditures of $10.0 million for the nine months ended September 30, 2005. The increase is primarily due to the renegotiation of the IBM OIO Agreements and the new IBM leasing arrangement as discussed above. We have estimated approximately $43.7 million for capital expenditures in 2006, which relates to the renegotiation of the IBM OIO Agreements as well as normal growth in capacity requirements and routine replacement and upgrades of equipment.
Off-Balance Sheet Arrangements
At September 30, 2006 and 2005, we did not have any relationships with unconsolidated entities or financial partnerships, such as entities often referred to as structured finance or special purpose entities, which would have been established for the purpose of facilitating off-balance sheet arrangements or other contractually narrow or limited purposes. We are, therefore, not materially exposed to any financing, liquidity, market or credit risk that could arise if we had engaged in such relationships.
Effect of Inflation
Inflation generally affects us by increasing our costs of labor, equipment and new materials. We do not believe that inflation has had any material effect on our results of operations during the three months ended September 30, 2006.
Airline Content Agreements
During the first quarter of 2006, we signed a five-year content agreement with American. During the second quarter of 2006, we signed five-year content agreements with Continental, United and Northwest. And, during the third quarter of 2006, we signed a five-year content agreement with US Airways and a seven-year content agreement with Delta. The Northwest agreement received Bankruptcy Court approval on June 15, 2006. In conjunction with the agreements, Worldspan has developed two new optional products which were introduced into the marketplace in September 2006. Through these new agreements, travel agencies have the opportunity to access the airlines’ comprehensive published fares and inventory. The new content agreements have resulted in reduced transaction fees from participating airlines and reduced inducement fees paid to travel agencies within the territory as defined in the agreements. Since the effective date of the new content agreements, traditional travel agencies who adopted the optional products comprised almost all of total U.S. traditional travel agency transactions. For the third quarter, these new agreements had, and are expected to continue to have, a significant negative impact on our U.S. traditional agency business and also on our overall financial position and results from operations. However, as to our online travel agency business, we cannot predict at this time the ultimate impact of these agreements on our operating income, as the overall impact will be determined upon both the adoption of our two new optional product offerings by online travel agencies within the territory and the accompanying inducement payments required to be made to the online travel agencies by us, if any. We are evaluating various measures to mitigate the adverse financial impact of these agreements while offering the new products to our agency base and performing our obligations under the new airline content agreements. However, there is no guarantee that these measures, if implemented by us, will be successful.
43
Worldspan Cautionary Statement
Statements in this report and the exhibits hereto which are not purely historical facts, including statements about forecasted financial projections or other statements about anticipations, beliefs, expectations, hopes, intentions or strategies for the future, may be forward-looking statements within the meaning of Section 27A of the Securities Act of 1933, as amended (the “Securities Act”) and Section 21E of the Securities Exchange Act of 1934, as amended (the “Exchange Act”). Readers are cautioned not to place undue reliance on forward-looking statements. All forward-looking statements are based upon information available to the Company on the date this report was submitted. We undertake no obligation to publicly update or revise any forward-looking statements, whether as a result of new information, future events or otherwise. Any forward-looking statements involve risks and uncertainties that could cause actual events or results to differ materially from the events or results described in the forward-looking statements, including, but not limited to, risks or uncertainties related to: our revenues being highly dependent on the travel and transportation industries; airlines limiting their participation in travel marketing and distribution services; airlines altering their content or changing the pricing of such content; or other changes within, or affecting, the travel industry. We may not succeed in addressing these and other risks.
44
ITEM 3. QUANTITATIVE AND QUALITATIVE DISCLOSURES ABOUT MARKET RISK
Market risk represents the risk of changes in value of a financial instrument, derivative or non-derivative, caused by fluctuations in interest rates, foreign exchange rates and equity prices. Changes in these factors could cause fluctuations in the results of our operations and cash flows. In the ordinary course of business, we are exposed to foreign currency and interest rate risks. These risks primarily relate to the sale of products and services to foreign customers and changes in interest rates on our long-term debt.
Foreign Exchange Rate Market Risk
We consider the U.S. dollar to be the functional currency for all of our entities. Substantially all of our net sales and the majority of our expenses during the three months ended September 30, 2006 and 2005 were denominated in U.S. dollars. Therefore, foreign currency fluctuations did not materially impact our financial results in those periods. We have foreign currency exposure arising from the remeasurement of our foreign subsidiaries’ financial statements into U.S. dollars. The primary currencies to which we are exposed to fluctuations include the euro and the British pound sterling. The fair value of our net foreign investments would not be materially affected by a 10% adverse change in foreign currency exchange rates from September 30, 2006 levels.
Interest Rate Market Risk
Our 2005 Senior Credit Facility is variable rate debt. Interest rate changes therefore generally do not affect the market value of such debt but do impact the amount of our interest payments and, therefore, our future earnings and cash flows, assuming other factors are held constant. As of September 30, 2006, we had variable rate debt of approximately $566.0 million, of which $434.9 million was hedged through an interest rate swap. Holding other variables constant, including levels of indebtedness, a one hundred basis point increase in interest rates on our variable debt would have an estimated impact on 2006 pre-tax earnings and cash flows of approximately $1.3 million.
On March 4, 2005, we entered into an interest rate swap with a notional amount that will start at $508.4 million on November 15, 2005 and amortize on a quarterly basis to $102.2 million at November 15, 2008. The reset dates on the swap are February 15, May 15, August 15 and November 15 each year until maturity on November 15, 2008. The notional amount as of September 30, 2006 is $434.9 million. This agreement, which has been designated as a cash flow hedge, is being used to convert the variable component of interest rates on certain indebtedness to a fixed rate of 4.3%. As of September 30, 2006, the fair value of the interest rate swap was $4.1 million including accrued interest of $0.6 million.
ITEM 4. CONTROLS AND PROCEDURES
As of the end of the period covered by this report, we conducted an evaluation, under the supervision and with the participation of our principal executive officer and principal financial officer, of the effectiveness of the design and operation of our disclosure controls and procedures (as defined in Rules 13a-15(e) and 15d-15(e) under the Exchange Act). Based on this evaluation, our principal executive officer and principal financial officer concluded that our disclosure controls and procedures are effective. There were no changes in our internal control over financial reporting that occurred during the quarter ended September 30, 2006 which have materially affected, or are reasonably likely to materially affect, our internal control over financial reporting.
45
PART II. OTHER INFORMATION
ITEM 1. LEGAL PROCEEDINGS
On September 19, 2005, we filed a lawsuit against Orbitz in the United States District Court, Northern District of Illinois, Eastern Division (“Federal Suit”). Orbitz is one of our largest online travel agency customers and represented approximately 10% of our transaction volume for the three and six month periods ended June 30, 2006. Our Federal Suit alleged that Orbitz accessed and used our seat map data in violation of the Federal Computer Fraud and Abuse Act (“FCFAA”) and in breach of our agreement with Orbitz. Our Federal Suit contained several additional state-law claims. On April 19, 2006, the court considering our Federal Suit dismissed our claim under the FCFAA and relinquished jurisdiction over our state-law claims against Orbitz without prejudice to us refiling our state-law claims in state court. We filed an appeal with the United States Court of Appeals for the Seventh Circuit on May 18, 2006.
We refiled our state-law claims in the Circuit Court of Cook County, Illinois, County Department, Law Division. Our complaint alleges that Orbitz’s improper accessing and use of our seat map data violates the Georgia Computer Systems Protection Act and our agreements with Orbitz, and that Orbitz’s use of Galileo and ITA, competing computer reservation systems, constitutes breaches of our agreement with Orbitz. We are seeking injunctive relief to prevent the unauthorized accessing and use of our seat map data as well as to prevent Orbitz’s use of the services or data of Galileo and ITA. We also seek monetary damages from Orbitz in excess of $109.0 million and reimbursement for our attorneys’ fees and costs.
After filing our Federal Suit, we learned that Orbitz filed suit against us on September 16, 2005, in the Circuit Court of Cook County, Illinois, County Department, Law Division, purporting to assert two causes of action against us for violation of the Illinois Consumer Fraud Act and equitable estoppel. Orbitz claimed that certain exclusivity, minimum segment fee and 100% booking requirement provisions in our agreement were illegal and in violation of public policy. In its suit, Orbitz seeks a court order precluding us from pursuing our breach of contract claims against Orbitz, an order terminating and rescinding the first and second amendments of our contract with Orbitz (which include, among other things, provisions containing commitments from Orbitz with respect to its usage of our GDS through 2011), monetary damages in excess of $0.05 million, punitive damages and reimbursement for attorneys’ fees and costs. Orbitz filed an amended complaint against us on July 5, 2006. The amended complaint adds six counts, including claims of breach of contract, fraud and rescission, in addition to a declaratory judgment request. The complaint seeks equitable and monetary relief, attorney’s fees and costs, monetary damages in excess of $0.05 million and prejudgment interest. The Orbitz case has been consolidated with our state court case. We believe that the allegations in the Orbitz complaint are without merit and we intend to defend against this action vigorously. If we are unable to satisfactorily resolve the claims asserted by Orbitz and its lawsuit against us is successful, there would be few or no restrictions to prevent Orbitz from moving a significant portion of its business from our GDS, which would have a material adverse effect on our business, financial condition and results of operations.
On July 26, 2006, Expedia and its affiliate, IAC Global LLC, (collectively, “Expedia”) filed a lawsuit against us in the Superior Court, King County, Washington. Among other actions and requests for relief, the complaint requests a declaratory judgment from the court regarding Expedia’s use of data and information provided by us as set forth in the contract between the parties. We believe that the allegations in the Expedia complaint are without merit and we intend to defend against this action.
We are involved in various other litigation proceedings as both plaintiff and defendant. In the opinion of our management, none of these other litigation matters, individually or in the aggregate, if determined adversely to us, would have a material adverse effect on our business, financial condition, or results of operations.
ITEM 1A. RISK FACTORS
As further described herein, our performance and financial results are subject to risks and uncertainties including, but not limited to, the following specific risks. There are no material changes to the risk factors included in our annual report on Form 10-K filed with the Securities and Exchange Commission on March 3, 2006 as updated in our quarterly report on Form 10-Q filed with the SEC on May 15, 2006 other than the risk factors below entitled “Travel Supplier Cost Savings—Travel supplier cost savings efforts may shift business away from us or cause us to reduce the fees we charge to suppliers or increase the inducements we offer to travel agencies, thereby adversely affecting our electronic travel distribution revenues and inducement expense,” “Content Agreements—Our efforts to obtain more comprehensive content through airline content agreements may cause downward pressure on pricing and adversely affect our electronic travel distribution revenue” and “Dependence on a Small Number of Online Travel Agencies—We are highly dependent on a small number of large online travel agencies, and the success of our business depends on continuing these relationships and the continued growth of online travel commerce.”
46
Risks Relating to Our Business
Travel Supplier Cost Savings—Travel supplier cost savings efforts may shift business away from us or cause us to reduce the fees we charge to suppliers or increase the inducements we offer to travel agencies, thereby adversely affecting our electronic travel distribution revenues and inducement expense.
Travel suppliers, particularly airlines, are aggressively seeking ways to reduce distribution costs and, through the use of the Internet and otherwise, are seeking to decrease their reliance on global distribution systems including us. There is ongoing pressure by airlines to significantly reduce their distribution costs. During the first quarter of 2006, we signed a five-year content agreement with American. During the second quarter of 2006, we signed five-year content agreements with Continental, United and Northwest. And, during the third quarter of 2006, we signed a five-year content agreement with US Airways and a seven-year content agreement with Delta. The Northwest agreement received Bankruptcy Court approval on June 15, 2006. In conjunction with the agreements, Worldspan has developed two new optional products which were introduced into the marketplace in September 2006. Through these new agreements, travel agencies have the opportunity to access the airlines’ comprehensive published fares and inventory. The new content agreements have resulted in reduced transaction fees from participating airlines and reduced inducement fees paid to travel agencies within the territory as defined in the agreements. Since the effective date of the new content agreements, traditional travel agencies who adopted the optional products comprised almost all of total U.S. traditional travel agency transactions. For the third quarter, these new agreements had, and are expected to continue to have, a significant negative impact on our U.S. traditional agency business and also on our overall financial position and results from operations. However, as to our online travel agency business, we cannot predict at this time the ultimate impact of these agreements on our operating income, as the overall impact will be determined upon both the adoption of our two new optional product offerings by online travel agencies within the territory and the accompanying inducement payments required to be made to the online travel agencies by us, if any. We are evaluating various measures to mitigate the adverse financial impact of these agreements while offering the new products to our agency base and performing our obligations under the new airline content agreements. However, there is no guarantee that these measures, if implemented by us, will be successful.
If a reduction in airline payments to us was coupled with an increase in inducements or maintenance of present levels of payments paid by us, our business, financial condition and results of operations could be materially and adversely impacted. Further, travel suppliers have increasingly been providing direct access to their inventory through their own websites through travel agencies and through travel supplier joint ventures, which potentially bypass GDSs. See the section captioned “Risk Factors—Competition—We operate in highly competitive markets, and we may not be able to compete effectively” under our Form 10-K Item 1 for further information. Some of these travel suppliers offer lower prices when their products and services are purchased directly from these supplier-related distribution channels. These lower prices are not always available to us. Some of these travel suppliers are also not providing their lowest fares or other content to GDSs unless the GDSs agree to provide them with significantly lower transaction fees or sometimes none at all. These practices may have the effect of diverting customers away from us to other distribution channels, including websites, forcing us to significantly reduce our transaction fees or not have content available in our system, all of which could have a material adverse effect on our electronic travel distribution revenues, inducement expense and financial condition. Moreover, consolidation among travel suppliers, including airline mergers and alliances, may increase competition from these supplier-related distribution channels. In addition, some travel suppliers have reduced or eliminated commissions paid to both traditional and online travel agencies. The reduction or loss of commissions may cause travel agencies to become more dependent on other sources of revenues, such as traveler-paid service fees and GDS-paid inducements. We may have to increase inducement payments or incur other expenses in order to compete for travel agency business.
Content Agreements—Our efforts to obtain more comprehensive content through airline content agreements will cause downward pressure on pricing and may materially and adversely affect our electronic travel distribution revenues.
Some airlines have differentiated the content that they provide to us and to our GDS competitors. Some content has been provided to GDSs at no additional charge under standard participation agreements, and other content, such as web fares, has been withheld unless the GDS agrees to provide discounts, payments or other benefits to the airline. We have existing content agreements with most major carriers in the United States. Generally, in these agreements, the airlines commit (subject to the exceptions contained in the agreements) to provide traditional and online travel agencies covered by the agreements in the territories covered by the agreements with substantially the same content (including web fares) it provides to the travel agencies of other GDSs in exchange for payments from us and/or discounts to transaction fees to each airline and subject to us keeping steady the average transaction fees paid by each airline for travel agency transactions in the territories covered by the agreements. Further, we have executed a three-year content agreement with British Airways to provide access to virtually all of their published fares (including web fares) to some of our U.K. travel agencies. We believe that obtaining similar content from other major airline travel suppliers and renewing existing content agreements is important to our ability to compete, since other GDSs have also entered into content agreements with various airlines. Most of the content agreements we originally entered into were for an initial three year period, and expire in 2006 and early 2007. We are actively in discussions with our airline suppliers to renew or extend these agreements. In fact, during the first quarter of 2006, we signed a five-year content agreement with American. During the second quarter of 2006, we signed five-year content agreements with Continental, United and Northwest. And, during the third quarter of 2006, we signed a five-year content agreement with US Airways and a seven-year content agreement with Delta. The Northwest agreement received Bankruptcy Court approval on June 15, 2006. The terms of these agreements became effective in the third quarter of 2006. In conjunction with the agreements, Worldspan has developed two new optional products which were introduced into the marketplace in September 2006. Through these new agreements, travel agencies have the opportunity to access the airlines’ comprehensive published fares and inventory. The new content agreements have resulted in reduced
47
transaction fees from participating airlines and reduced inducement fees paid to travel agencies within the territory as defined in the agreements. Since the effective date of the new content agreements, traditional travel agencies who adopted the optional products comprised almost all of total U.S. traditional travel agency transactions. For the third quarter, these new agreements had, and are expected to continue to have, a significant negative impact on our U.S. traditional agency business and also on our overall financial position and results from operations However, as to our online travel agency business, we cannot predict at this time the ultimate impact of these agreements on our operating income, as the overall impact will be determined upon both the adoption of our two new optional product offerings by online travel agencies within the territory and the accompanying inducement payments required to be made to the online travel agencies by us, if any. We are evaluating various measures to mitigate the adverse financial impact of these agreements while offering the new products to our agency base and performing our obligations under the new airline content agreements. However, there is no guarantee that these measures, if implemented by us, will be successful.
In addition, our content agreements, both existing and new, are subject to several conditions, exceptions, term limitations and termination rights. As existing content agreements come up for renewal, there is no guarantee that the participating airlines will continue to provide their content to us to the same extent as they do at the current time. The loss or substantial reduction in the amount of content received from the participating airlines could negatively affect our electronic travel distribution revenues and financial condition. Further, should we fail to maintain competitive content and/or make acceptable inducement payments, our traditional and online agency subscribers could move transactions from us to competitors, thus negatively affecting our business, financial condition and results of operations. See “Supplier Content and Transaction Fees” under “Item 2. Management’s Discussion and Analysis of Financial Condition and Results of Operations” for further detail.
Dependence on a Small Number of Online Travel Agencies—We are highly dependent on a small number of large online travel agencies, and the success of our business depends on continuing these relationships and the continued growth of online travel commerce.
In 2005, Expedia, Orbitz, and Priceline represented approximately 48% of our total transactions, with Expedia representing approximately 32% of our total transactions and Orbitz representing approximately 9% of our total transactions. If we were to lose all or a significant portion of, and not replace, the transactions generated by any of our material online travel agencies, our electronic travel distribution revenues and financial condition would be materially adversely impacted. In addition, if other online travel agencies become more successful or new online travel agencies emerge and we lose online transaction volumes as a result, our electronic travel distribution revenues and financial condition (including the carrying value of certain intangibles) could be materially adversely impacted. See the section captioned “Uncertainty in Transaction Volumes from Online Travel Agencies” under “Item 7. Management’s Discussion and Analysis of Financial Condition and Results of Operations” for further information.
While we have long-term contracts with Expedia, Orbitz, and Priceline, these agencies have a variety of termination rights and other rights to reduce their business with us. Expedia has the right to renegotiate the inducements payable to it by us every three years, and it can terminate its contract with us if we cannot reach an agreement on inducements. Expedia announced in May 2004 that it intends to diversify its GDS relationships beyond using a single provider to process substantially all of its GDS transactions and that it intends to move a portion of its transactions to another GDS provider. In October 2005, Expedia notified us of its intention to move some portion but not all of its European transactions to another GDS provider in 2006 Expedia announced in May 2006 that it had commenced booking at select points of sale certain European segments through another GDS. In July 2006, Expedia announced the commencement of processing transactions in North America with another GDS. We have confirmed that some of Expedia’s North American transactions are now being processed on another GDS. Expedia’s total transaction volume with us decreased significantly from its transaction volume with us during the third quarter of 2005, primarily due to a large number of transactions Expedia processed on another GDS during September 2006. We expect Expedia to substantially increase the number of its transactions processed on another GDS in the fourth quarter of 2006 from the volume it processed on another GDS in the third quarter. Expedia has further indicated to us that it could process almost all of its volume on another GDS in the near future. However, we believe that we will continue to process a sizeable portion of Expedia’s transactions going forward, even if less than a majority of Expedia’s total bookings. The movement of Expedia’s transaction volume to another GDS has had, and in the future is expected to have, a significant adverse impact on our financial position and results from operations.
Also, on July 26, 2006, Hotwire, a division of Expedia, notified the Partnership of its intent to terminate its technology services agreement with us effective October 26, 2006. Hotwire ceased processing transactions on the Worldspan GDS in October. For the three and nine month periods ended September 30, 2006, Hotwire generated revenue of approximately $1,723 and $7,412, respectively.
Priceline announced on February 10, 2006 that it signed an agreement with another GDS. Additionally, on June 13, 2006, Priceline notified us that it intended to begin processing segments on another GDS as soon as July 28, 2006. In October 2006, we confirmed that some of Priceline’s North American transactions are now being processed on another GDS. We have not received any notification from Priceline as to the volume of transactions that it intends to move. Currently, we cannot forecast the annual magnitude of any such movement of transactions and therefore are unable to estimate the impact on its financial position, results of operations and cash flows.
48
Further, Orbitz is owned by Travelport, who also owns Galileo (a competitor of ours). Orbitz is one of our largest online travel agency customers. Our contract with Orbitz extends into 2011 subject to standard termination rights held by Orbitz including for-cause termination rights. Although we currently continue to operate under these agreements, we cannot assure you that any travel agency will not attempt to terminate its agreement with us or otherwise move business to another GDS in the future. Any such termination or a significant reduction in transaction volumes would have a material adverse effect on our electronic travel distribution revenues and financial condition (including the carrying value of certain intangibles).
In September 2005, we and Orbitz each filed separate complaints against the other with respect to certain disputes arising under our online agreement with Orbitz. If we are unable to satisfactorily resolve the claims asserted against us by Orbitz, and its lawsuit against us is successful, there would be few or no restrictions to prevent Orbitz from moving a significant portion of its business from our GDS. See “Item 3. Legal Proceedings.”
If Expedia, Priceline or Orbitz were to move a material portion of their respective transactions to other GDS providers, the Partnership’s business would be negatively and materially impacted.
In addition, our growth strategy relies on the continuing growth in the travel industry of the Internet as a distribution channel. If consumers’ use of the Internet as a medium of commerce for travel transactions does not continue to grow or grows more slowly than expected, our revenues and profit may be adversely affected. Consumers have historically relied on traditional travel agencies and travel suppliers and are accustomed to a high degree of human interaction in purchasing travel products and services. The growth of our business is dependent on the number of consumers who use the Internet to process travel transactions increasing significantly.
ITEM 2. UNREGISTERED SALES OF EQUITY SECURITIES AND USE OF PROCEEDS
We are wholly-owned by Worldspan Technologies Inc., or WTI, a privately owned corporation. There is no public trading market for our equity securities or for those of WTI. As of November 3, 2006, there were 46 holders of WTI Class A Common Stock and 1 holder of WTI Class B Common Stock.
On September 22, 2006, WTI entered into a stock subscription agreement in connection with the exercise by an employee of his option to purchase 3,500 shares of WTI Class A Common Stock for an aggregate purchase price of $0.04. On September 27, 2006, WTI entered into a stock subscription agreement in connection with the exercise by an employee of her option to purchase 1,250 shares of WTI Class A Common Stock for an aggregate purchase price of $0.01. These sales were exempt from registration under the Securities Act in reliance on Rule 506 promulgated thereunder.
49
ITEM 6. EXHIBITS
10.101 | | Content Agreement, dated as of July 10, 2006, by and between Worldspan, L.P. and US Airways, Inc. and America West Airlines, Inc.*** |
| | |
10.102 | | Content Agreement, dated as of September 29, 2006, by and between Worldspan, L.P. and Delta Air Lines, Inc.*** |
| | |
31.1 | | Certification of the Principal Executive Officer pursuant to Section 302 of the Sarbanes-Oxley Act of 2002. |
| | |
31.2 | | Certification of the Principal Financial Officer pursuant to Section 302 of the Sarbanes-Oxley Act of 2002. |
| | |
32.1 | | Certifications pursuant to 18 U.S.C. Section 1350, as adopted pursuant to Section 906 of the Sarbanes-Oxley Act of 2002. |
*** �� Certain portions of this document have been omitted pursuant to a confidential treatment request.
50
SIGNATURES
Pursuant to the requirements of the Securities Exchange Act of 1934, the registrant has duly caused this report to be signed on its behalf by the undersigned thereunto duly authorized.
| | WORLDSPAN, L.P. | |
| | | | |
| | | | |
November 10, 2006 | | By: | /s/ Rakesh Gangwal | |
DATE | | | Rakesh Gangwal | |
| | | Chairman, President and Chief Executive Officer (principal executive officer) | |
| | | | |
| | | | |
November 10, 2006 | | By: | /s/ Kevin W. Mooney | |
DATE | | | Kevin W. Mooney | |
| | | Chief Financial Officer | |
| | | (principal financial and accounting officer) | |
51