 First Quarter 2015 Update May 18, 2015 Exhibit 99.2 CNL Lifestyle Properties, Inc. Owning America’s Lifestyle ® |
 2 Forward Looking Statements Certain statements in this document may constitute forward-looking statements within the meaning of Section 27A of the Securities Act of 1933, as amended (the “Securities Act”) and of Section 21E of the Securities Exchange Act of 1934, as amended (the “Exchange Act”). CNL Lifestyle Properties, Inc. (herein also referred to as the “Company”) intends that all such forward-looking statements be covered by the safe-harbor provisions for forward-looking statements of Section 27A of the Securities Act and Section 21E of the Exchange Act, as applicable. All statements, other than statements that relate solely to historical facts, including, among others, statements regarding the Company’s future financial position, business strategy, projected levels of growth, projected costs and projected financing needs, are forward-looking statements. Those statements include statements regarding the intent, belief or current expectations of the management team, as well as the assumptions on which such statements are based, and generally are identified by the use of words such as “may,” “will,” “seeks,” “anticipates,” “believes,” “estimates,” “expects,” “plans,” “intends,” “should,” “continues,” “pro forma” or similar expressions. Forward-looking statements are not guarantees of future performance and actual results may differ materially from those contemplated by such forward-looking statements due to a variety of risks, uncertainties and other factors, including but not limited to, the factors detailed in our Annual Report on Form 10-K for the year ended December 31, 2014, and other documents filed from time to time with the Securities and Exchange Commission. Many of these factors are beyond the Company’s ability to control or predict. Such factors include, but are not limited to: changes in general economic conditions in the U.S. or globally (including financial market fluctuations); risks associated with our investment strategy; risks associated with the real estate markets in which the Company invests; risks of doing business internationally and global expansion, including unfamiliarity with new markets and currency risks; risks associated with the use of debt to finance the Company’s business activities, including refinancing and interest rate risk and the Company’s failure to comply with its debt covenants; the Company’s failure to obtain, renew or extend necessary financing or to access the debt or equity markets; competition for properties and/or tenants in the markets in which the Company engages in business; the impact of current and future environmental, zoning and other governmental regulations affecting the Company’s properties; the Company’s ability to make necessary improvements to properties on a timely or cost-efficient basis; risks related to development projects or acquired property value-add conversions, if applicable (including construction delays, cost overruns, the Company’s inability to obtain necessary permits and/or public opposition to these activities); defaults on or non-renewal of leases by tenants; failure to lease properties at all or on favorable terms; unknown liabilities in connection with acquired properties or liabilities caused by property managers or operators; the Company’s failure to successfully manage growth or integrate acquired properties and operations; material adverse actions or omissions by any joint venture partners; increases in operating costs and other expense items and costs, uninsured losses or losses in excess of the Company’s insurance coverage; the impact of outstanding or potential litigation; risks associated with the Company’s tax structuring; the Company’s failure to qualify and maintain its status as a real estate investment trust and the Company’s ability to protect its intellectual property and the value of its brand. Management believes these forward-looking statements are reasonable; however, such statements are necessarily dependent on assumptions, data or methods that may be incorrect or imprecise and the Company may not be able to realize them. Investors are cautioned not to place undue reliance on any forward-looking statements which are based on current expectations. All written and oral forward-looking statements attributable to the Company or persons acting on its behalf are qualified in their entirety by these cautionary statements. Further, forward-looking statements speak only as of the date they are made and the Company undertakes no obligation to update or revise forward-looking statements to reflect changed assumptions, the occurrence of unanticipated events or changes to future operating results over time unless otherwise required by law. |
 Recent Highlights Ongoing evaluation of strategic alternatives with the REIT’s Board of Directors and advisors for the balance of the portfolio Invested over $7.2 million of owner capital into various portfolio assets in Q1 2015 Sold the REIT’s 81.98 percent interest in the Dallas Market Center partnership for $140 million in April 2015 Entered into a purchase and sale agreement in April 2015 for the sale of the REIT’s unimproved land in Granby, CO for $5.5 million Entered into a purchase and sale agreement in May 2015 for the sale of the marinas portfolio for approximately the carrying value of the assets 3 |
 Recent Highlights Sold 37 of the 38 senior housing properties in May 2015 to SNH for an aggregate sales price of $763 million The remaining senior housing asset is expected to close before the end of 2015 Net sales proceeds were used to fully pay down related senior housing debt, the corporate line of credit, and the secured debt on Elitch Gardens and Mountain High, altogether totaling approximately $445 million The remaining proceeds may be used to repay other outstanding secured debt, fund a special distribution, and/or make necessary capital expenditures at existing assets In May 2015, initiated the process to call all of the senior unsecured notes with the outstanding amount of $318 million at a premium of 103.625% The repurchase of these notes is expected to be complete in June 2015 4 |
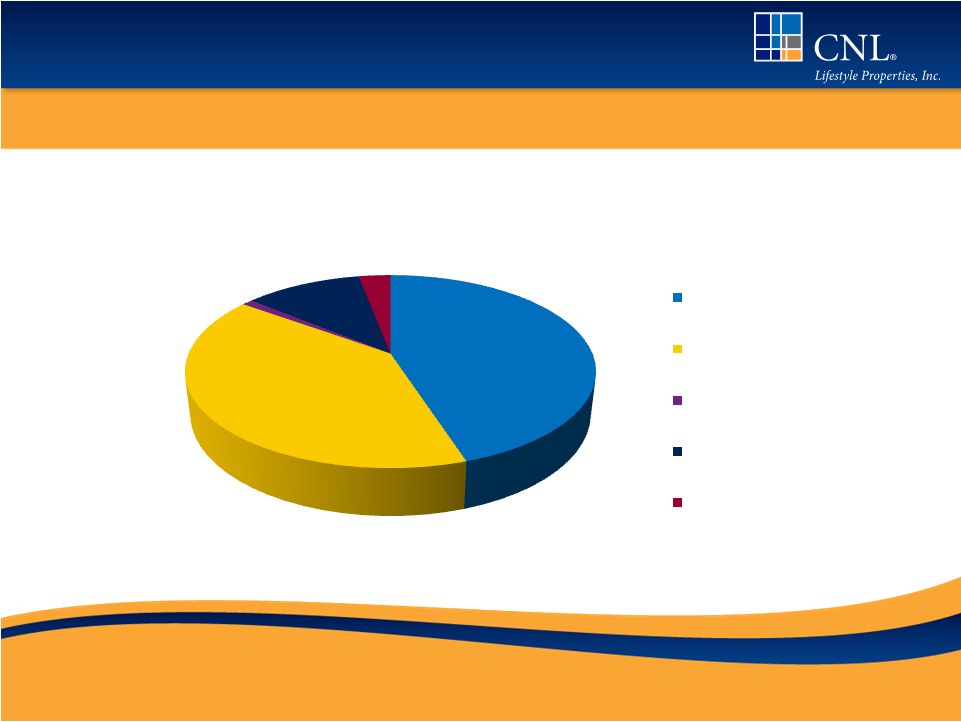 The current portfolio remains diversified yet reflects the Company’s liquidity strategy efforts Sector Diversification As of May 13, 2015 By Initial Purchase Price 5 45% 40% 1% 11% 3% Ski & Mountain Lifestyle (24) Attractions (24) Senior Housing (1) Marinas (17) Additional Lifestyle Properties (1) |
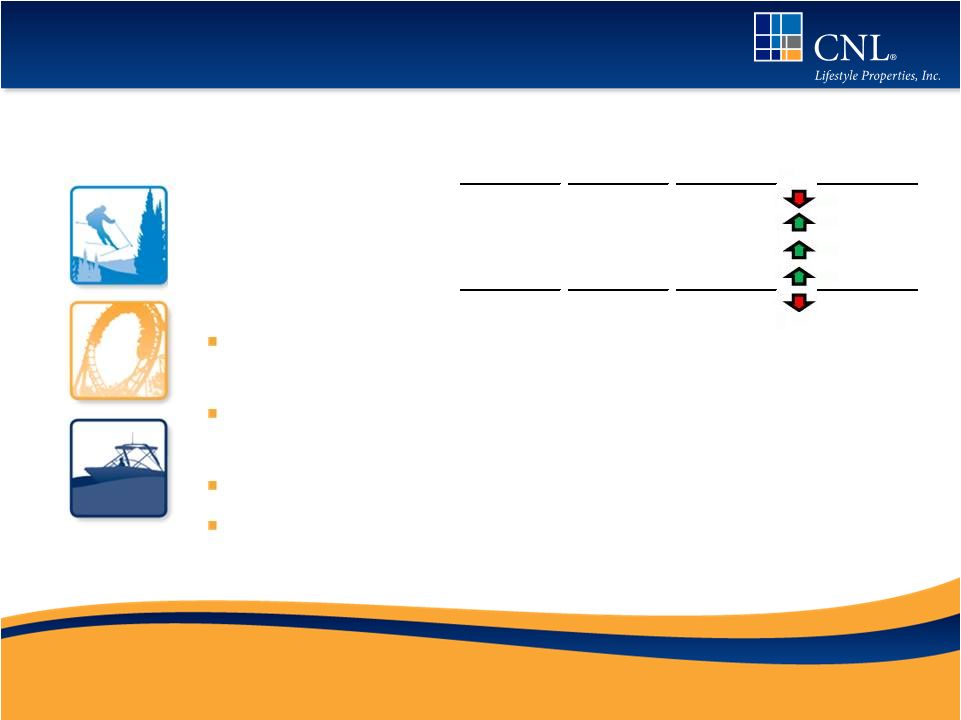
 Sector Performance 6 Ski & Mountain 24 properties Attractions 24 properties Senior Housing and Additional Lifestyle 2 properties Marinas 17 properties 67 properties as of May 13, 2015 Source: CNL Lifestyle Properties, Inc. March 31, 2015, Form 10-Q Past performance is not indicative of future returns. Revenue and EBITDA down due to warm temperatures and drought conditions in the Pacific West resulting in historically low snowfall levels, partially offset by strong performance in the Northeast due to numerous winter storms. Higher revenue and EBITDA for senior housing portfolio due to higher occupancy and higher revenue per occupied unit and expense containment in Q1 2015. Steady performance continued at Dallas Market Center, up to its sale. Higher revenue and EBITDA due to season pass sales, improved market penetration and favorable weather at select locations that have year round operations. Revenue and EBITDA were both up compared to Q1 2014. The portfolio experienced lower sales and higher expenses associated with the transition of property managers during 2014 as a result of the former tenants defaulting under their leases. |
 Same-Store Property Performance 7 Note: Includes results for comparable consolidated leased and managed properties Source: CNL Lifestyle Properties, Inc. March 31, 2015, Form 10-Q Ski and Mountain Lifestyle - Record-breaking drought conditions continued for the third straight season and unusually low snowfall and warm temperatures at our properties in the Pacific West (specifically in California). Results were partially offset by ample snowfall and cold temperatures in the Northeast from numerous winter storms driving strong visitation through March 2015. Attractions - While most of our major attraction properties were closed in Q1, performance at our six amusement parks and one waterpark that operate year round met or exceeded expectations. Revenue increases were the result of season pass sales, market penetration and favorable weather, all which have generated early season momentum for the full portfolio. Senior Housing - Revenue and EBITDA increased due to higher occupancy and revenue per occupied unit. Income also was higher due to a reduction of certain expenses that occurred in Q1 2014 which did not reoccur in Q1 2015. Marinas - Revenue and EBITDA are both up due to the fact that revenues and EBITDA during 2014 reflected lower sales and higher expenses related to transitioning these properties under property managers during 2014 as a result of the former tenants defaulting under their leases. # of Properties Revenue EBITDA TTM Rent Coverage Ski and Mountain Lifestyle 17 -9.3% -14.8% 1.12 Attractions 24 13.2% 12.6% 2.31 Senior Housing 29 5.0% 7.2% 1.06 Marinas 17 11.7% 17.6% n/a Total 87 -5.8% -12.8% 1.23 Three Months Ended March 31, 2015, Compared to Same Period 2014 |
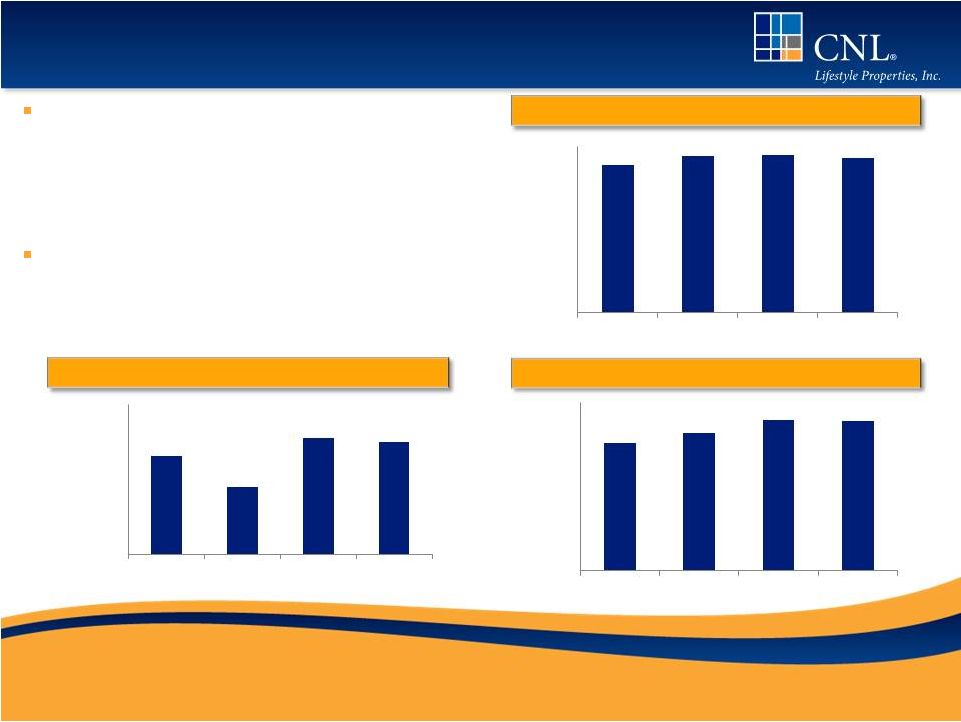 Full Year Financial Summary (in Millions) FFO Adjusted EBITDA* 8 MFFO Source: CNL Lifestyle Properties, Inc. December 31, 2014, Form 10-K and March 31, 2015, Form 10-Q The Company believes that its presentation of historical non-GAAP financial measures provides useful supplementary information to and facilitates additional analysis by investors. These historical non-GAAP financial measures are in addition to, not a substitute for, or superior to, measures of financial performance prepared in accordance with U.S. Generally Accepted Accounting Principles. See reconciliation to GAAP net income (loss) contained in the Appendix. Past performance is not indicative of future returns. * Adjusted EBITDA excludes results from discontinued operations $97.7 $67.2 $116.5 $112.4 $- $25.0 $50.0 $75.0 $100.0 $125.0 $150.0 2012 2013 2014 TTM Mar 2015 $114.3 $122.9 $134.6 $133.8 $- $25.0 $50.0 $75.0 $100.0 $125.0 $150.0 2012 2013 2014 TTM Mar 2015 $133.6 $141.0 $142.2 $142.1 $- $20.0 $40.0 $60.0 $80.0 $100.0 $120.0 $140.0 2012 2013 2014 TTM Mar 2015 Trailing 12 month FFO lower due to a loan loss provision recorded on one of our mortgage notes receivables. Trailing 12 month FFO and MFFO were lower due to bad debt expense recorded related to two ski properties, a decrease in rental income due to the sale of our golf portfolio and our multi-family residential property and a decrease in interest income on mortgage notes receivable that were repaid. The decreases were partially offset by a decrease in interest expense, an increase in rental income from leased properties acquired after the first quarter of 2014, an increase in “same-store” net operating income from managed properties, and a decrease in advisor asset management fees. Trailing 12 month Adjusted EBITDA from Continuing Operations is lower due to an increase in bad debt expense and a decrease in interest income on mortgage notes receivable due to collection. The decrease was partially offset by an increase in rental income from leased properties acquired after Q1 2014 as well as in “same-store” net income growth from managed properties and a reduction of advisor asset management fees. |
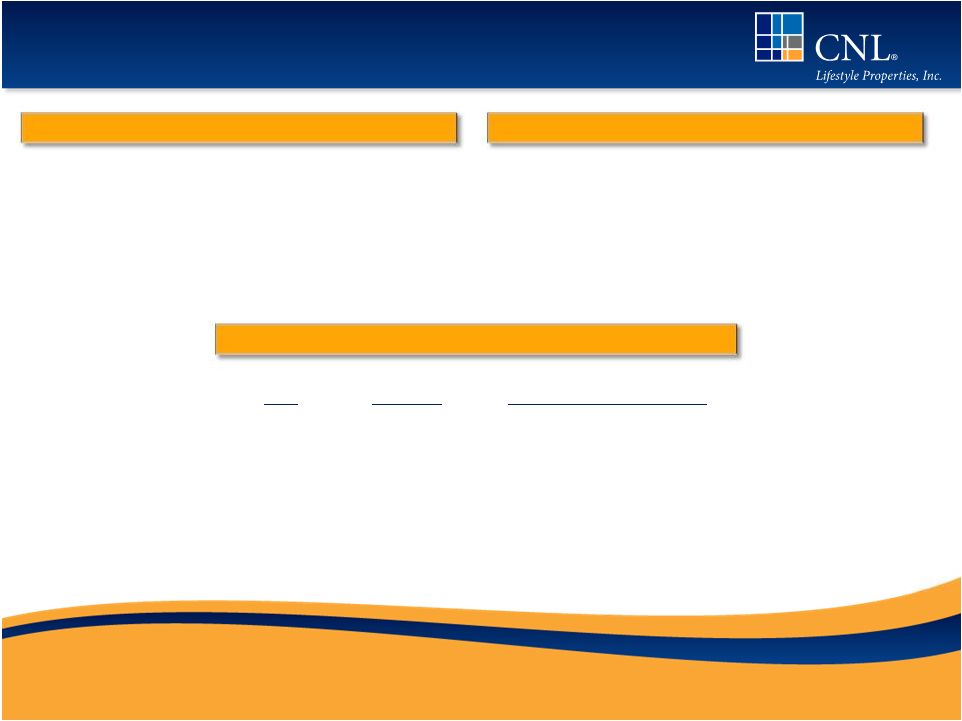 Credit Metrics Interest Coverage (1) (1) Calculated as adjusted EBITDA divided by interest expense from continued operations (2) Net debt is total debt including line of credit, less cash and adjusted EBITDA is only presented for continuing operations (3) Debt includes line of credit Net Debt / Adjusted EBITDA (2) 9 Debt / GAAP Total Assets (3) Source: CNL Lifestyle Properties, Inc. December 31, 2014, Form 10-K and March 31, 2015, Form 10-Q The Company believes that its presentation of historical non-GAAP financial measures provides useful supplementary information to and facilitates additional analysis by investors. These historical non-GAAP financial measures are in addition to, not a substitute for, or superior to, measures of financial performance prepared in accordance with U.S. Generally Accepted Accounting Principles. See reconciliation to GAAP net income (loss) contained in the Appendix. Past performance is not indicative of future returns. Consolidated Leverage Including Share Year Coverage of Unconsolidated Entities 2012 38.7% 45.3% 2013 44.6% 48.1% 2014 44.6% 48.7% Mar 2015 43.8% 47.3% 2012 2.4x 2013 2.5x 2014 2.5x TTM Mar 2015 2.6x 2012 8.0x 2013 8.0x 2014 6.2x Mar 2015 6.3x |
 Key Credit Information 10 Weighted average interest rate is 5.10% (5.45% without JV debt) 60% fixed rate debt, 2% hedged and 38% variable rate debt Note: As of March 31, 2015 2015 2016 2017 2018 2019 2020 CLP Debt Maturity Schedule (in thousands) Bonds $450,000 $400,000 $350,000 $300,000 $250,000 $200,000 $150,000 $100,000 $50,000 $0 Variable JV LOC Fixed/Swap |
 Contact Information 11 For more information about CNL Lifestyle Properties, please contact CNL Client Services at 866-650-0650. |
 Appendix 12 Appendix |
 Reconciliation of FFO and MFFO to Net Income (Loss) 13 Source: CNL Lifestyle Properties, Inc. March 31, 2015, Form 10-Q The Company believes that its presentation of historical non-GAAP financial measures provides useful supplementary information to and facilitates additional analysis by investors. These historical non-GAAP financial measures are in addition to, not a substitute for, or superior to, measures of financial performance prepared in accordance with U.S. Generally Accepted Accounting Principles. Past performance is not indicative of future returns. Three Months Ended March 31, 2015 2014 Net loss $ (7,555) $ (20,353) Adjustments: Gain on sale of property Discontinued operations (139) — Depreciation and amortization Continuing operations 23,112 24,202 Discontinued operations — 12,657 Impairment of real estate assets (1) Discontinued operations — 3,314 Net effect of FFO adjustment from unconsolidated entities (2) 2,082 1,731 Total funds from operations 17,500 21,551 Acquisition fees and expenses (3) Continuing operations — 613 Discontinued operations — 111 Straight-line adjustments for leases and notes receivable (4) Continuing operations (3,024) (2,545) Discontinued operations — (881) Amortization of above/below market intangible assets and liabilities Continuing operations (16) 18 Discontinued operations — 358 Loan loss provision Continuing operations 3,940 — Accretion of discounts/amortization of premiums Continuing operations 1 3 MFFO adjustments from unconsolidated entities: (2) Straight-line adjustments for leases and notes receivable (4) Continuing operations 94 14 Amortization of above/below market intangible assets and liabilities Continuing operations (1) 12 Modified funds from operations $ 18,494 $ 19,254 Weighted average number of shares of common stock Outstanding (basic and diluted) 325,184 322,639 FFO per share (basic and diluted) $ 0.05 $ 0.07 MFFO per share (basic and diluted) $ 0.06 $ 0.06 (1) While impairment charges are excluded from the calculation of FFO, investors are cautioned that due to the fact that impairments are based on estimated future undiscounted cash flows and the relatively limited term of our operations, it could be difficult to recover any impairment charges. (2) This amount represents our share of the FFO or MFFO adjustments allowable under the NAREIT or IPA definitions, respectively, multiplied by the percentage of income or loss recognized under the HLBV method. (3) In evaluating investments in real estate, management differentiates the costs to acquire the investment from the operations derived from the investment. By adding back acquisition fees and expense relating to business combinations, management believes MFFO provides useful supplemental information of its operating performance and will also allow comparability between real estate entities regardless of their level of acquisition activities. Acquisition fees and expenses include payments to our advisor or third parties. Acquisition fees and expenses relating to business combinations under GAAP are considered operating expenses and as expenses included in the determination of net income (loss) and income (loss) from continuing operations, both of which are performance measures under GAAP. All paid and accrued acquisition fees and expenses will have negative effects on returns to investors, the potential for future distributions, and cash flows generated by us, unless earnings from operations or net sales proceeds from the disposition of properties are generated to cover the purchase price of the property. (4) Under GAAP, rental receipts are allocated to periods using various methodologies. This may result in income recognition that is significantly different than underlying contract terms. By adjusting for these items (to reflect such payments from a GAAP accrual basis to a cash basis of disclosing the rent and lease payments), MFFO provides useful supplemental information on the realized economic impact of lease terms and debt investments, providing insight on the contractual cash flows of such lease terms and debt investments, and aligns results with management’s analysis of operating performance. |
 Reconciliation of Adjusted EBITDA to Net Income (Loss) 14 Source: CNL Lifestyle Properties, Inc. March 31, 2015, Form 10-Q The Company believes that its presentation of historical non-GAAP financial measures provides useful supplementary information to and facilitates additional analysis by investors. These historical non-GAAP financial measures are in addition to, not a substitute for, or superior to, measures of financial performance prepared in accordance with U.S. Generally Accepted Accounting Principles. Past performance is not indicative of future returns. Three Months Ended March 31, 2015 2014 Net loss $ (7,555) $ (20,353) (Gain) loss from discontinued operations (7, 052) 8,471 Interest and other (income) expense (948 ) (167 ) Interest expense and loan cost amortization 12,009 14,164 Equity in earnings of unconsolidated entities (1) (3,561) (4,299) Depreciation and amortization 23,112 24,202 Loan loss provision 3,940 — Straight-line adjustments for leases and notes receivables (2) (3,024) (2,545) Cash distributions from unconsolidated entities (1) 5,570 3,120 Adjusted EBITDA from Continuing Operations $ 22,491 $ 22,593 (1) Investments in our unconsolidated joint ventures are accounted for under the HLBV method of accounting. Under this method, we recognize income or loss based on the change in liquidating proceeds we would receive from a hypothetical liquidation of our investments based on depreciated book value. We adjust EBITDA for equity in earnings (loss) of our unconsolidated entities because we believe this is not reflective of the joint ventures’ operating performance or cash flows available for distributions to us. We believe cash distributions from our unconsolidated entities, exclusive of any financing transactions, are reflective of their operating performance and its impact to us and have been added back to adjusted EBITDA above. (2) We believe that adjusting for straight-line adjustments for leased properties and mortgages and other notes receivable is appropriate because they are non-cash adjustments and reflect the actual cash receipts received by us from our tenants and borrowers. . |