
REGAN TOTAL RETURN INCOME FUND
INSTITUTIONAL CLASS (RCIRX)
INVESTOR CLASS (RCTRX)
SEMI ANNUAL REPORT TO SHAREHOLDERS
MARCH 31, 2023
TABLE OF CONTENTS
| Regan Total Return Income Fund |
| Performance Summary |
| March 31, 2023 (Unaudited) |
| |
Investment Returns
For the period ended March 31, 2023
| | | | | | | Annualized |
| | | 6-Months | | 1-Year | | Since Inception* |
| Regan Total Return Income Fund | | | | | | |
| Institutional Class | | 2.76% | | 0.25% | | 6.20% |
| Investor Class | | 2.62% | | -0.06% | | 5.93% |
| Bloomberg Barclays U.S. Aggregate Bond Index(1) | | 4.89% | | -4.78% | | -4.65% |
| * | Inception date on October 1, 2020. |
| (1) | The Bloomberg Barclays U.S. Aggregate Bond Index is a broad-based fixed-income index that includes government Treasury securities, corporate bonds, mortgage-backed securities, asset-backed securities and munis to simulate the universe of bonds in the market. |
The performance data quoted represents past performance and is no guarantee of future results. Investment return and principal value of an investment will fluctuate so that an investor’s shares, when redeemed, may be worth more or less than their original cost. Current performance may be lower or higher than the performance data quoted. For the most recent month-end performance, please call 1.800.44.REGAN or visit the Fund’s website at www.reganfunds.com.
The gross expense ratios as stated in the prospectus dated January 31, 2023 are 1.68% and 1.41% for the Investor Class and Institutional Class, respectively. The net expense ratios are 1.55% and 1.31% for the Investor Class and Institutional Class, respectively, with contractual fee waivers through January 31, 2024.
| Regan Total Return Income Fund |
| Expense Example |
| March 31, 2023 (Unaudited) |
| |
As a shareholder of the Funds, you incur two types of costs: (1) transaction costs, including redemption fees; and (2) ongoing costs, including management fees and other Fund expenses. This Example is intended to help you understand your ongoing costs (in dollars) of investing in the Funds and to compare these costs with the ongoing costs of investing in other mutual funds.
The Example is based on an investment of $1,000 invested at the beginning of the period and held for the entire period from October 1, 2022 to March 31, 2023 (the “period”).
Actual Expenses
The “Actual Fund Return” lines in the table below provide information about actual account values and actual expenses. You may use the information in these lines, together with the amount you invested, to estimate the expenses you paid over the period. Simply divide your account value by $1,000 (for example, an $8,600 account value divided by $1,000 equals 8.6), then multiply the result by the number in the corresponding line under the heading entitled “Expenses Paid During the Period” to estimate the expenses you paid on your account during the period.
Hypothetical Example for Comparison Purposes
The information in the table with the lines titled “Hypothetical 5% Return” provides information about hypothetical account values and hypothetical expenses based on the Funds’ actual expense ratio and an assumed rate of return of 5% per year before expenses, which is not the Funds’ actual return. The hypothetical account values and expenses may not be used to estimate the actual ending account balance or expenses you paid for the period. You may use this information to compare the ongoing costs of investing in the Funds and other funds. To do so, compare this 5% hypothetical example with the 5% hypothetical examples that appear in the shareholder reports of the other funds.
Please note that the expenses shown in the table are meant to highlight your ongoing costs only and do not reflect any transaction costs, such as redemption fees. Therefore, the information in the lines titled “Hypothetical 5% Return” is useful in comparing ongoing costs only, and will not help you determine the relative total costs of owning different funds. In addition, if transactional costs were included, your costs would have been higher.
Expenses Paid During the Period
| | Beginning Account Value | Ending Account Value | Annualized Expense Ratio | Expenses Paid During the Period |
| Regan Total Return Income Fund | | | | |
| Institutional Class | | | | |
| Actual Fund Return(1) | $1,000.00 | $1,027.60 | 1.30% | $6.57 |
| Hypothetical 5% Return(2) | $1,000.00 | $1,018.50 | 1.29% | $6.49 |
| Investor Class | | | | |
| Actual Fund Return(1) | $1,000.00 | $1,026.20 | 1.55% | $7.83 |
| Hypothetical 5% Return(2) | $1,000.00 | $1,017.30 | 1.53% | $7.70 |
| (1) | Expenses are equal to each of the Funds’ annualized expense ratio as indicated, multiplied by the average account value over the period, multiplied by 182/365. The expense ratios reflect an expense waiver. The returns assume all dividends and distributions were reinvested. |
| (2) | Expenses are equal to each of the Funds’ annualized expense ratio as indicated, multiplied by the average account value over the period, multiplied by 182/365. The expense ratios reflect an expense waiver. The returns assume all dividends and distributions were reinvested. |
| Regan Total Return Income Fund |
| Allocation of Portfolio Holdings |
| (Calculated as a percentage of Total Investments) |
| March 31, 2023 (Unaudited) |
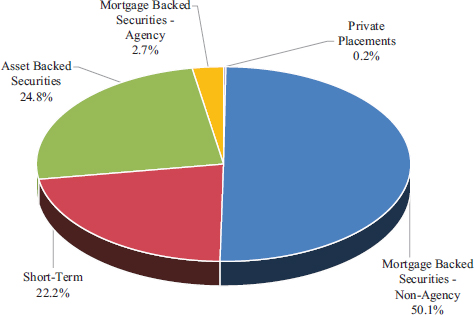
| * | Short-Term Investments consist of amounts held in money market funds and US Treasury Bills. |
Regan Total Return Income Fund
Schedule of Investments
March 31, 2023 (Unaudited)
| | | Principal
Amount | | | Value | |
| | | | | | | | | |
| ASSET BACKED SECURITIES — 24.7% | | | | | | | | |
| Ace Securities Corp. | | | | | | | | |
| Series 2004-RM2, Class M3, 5.715% (1 Month LIBOR USD + 0.870%), 01-25-2035 (2)(a) | | $ | 54,193 | | | $ | 52,757 | |
| Series 2006-ASAP5, Class A2D, 5.365% (1 Month LIBOR USD + 0.520%), 10-25-2036 (2) | | | 1,980,456 | | | | 674,076 | |
| Series 2006-ASAP6, Class A2D, 5.285% (1 Month LIBOR USD + 0.440%), 12-26-2036 (2) | | | 2,712,532 | | | | 941,100 | |
| Series 2006-ASL1, Class A, 5.125% (1 Month USD LIBOR + 0.280%), 02-25-2036 (2) | | | 285,902 | | | | 38,603 | |
| Series 2006-HE4, Class A2B, 5.065% (1 Month LIBOR USD + 0.220%), 10-25-2036 (2) | | | 2,274,636 | | | | 852,349 | |
| Series 2007-D1, Class A4, 6.930%, 02-25-2038 (3)(4) | | | 735,929 | | | | 570,694 | |
| Aegis Asset Backed Securities Trust | | | | | | | | |
| Series 2004-2, Class M3, 7.245% (1 Month LIBOR USD + 2.400%), 06-26-2034 (2) | | | 154,448 | | | | 136,740 | |
| American Home Mortgage Investment Trust | | | | | | | | |
| Series 2007-A, Class 4A, 5.745% (1 Month USD LIBOR + 0.900%), 07-25-2046 (2)(3) | | | 112,837 | | | | 29,254 | |
| Angel Oak Mortgage Trust | | | | | | | | |
| Series 2020-5, Class A3, 2.041%, 05-25-2065 (1)(3) | | | 20,536 | | | | 18,649 | |
| Series 2020-5, Class A1, 1.373%, 05-25-2065 (1)(3) | | | 18,688 | | | | 16,875 | |
| Series 2021-3, Class A1, 1.068%, 05-25-2066 (1)(3) | | | 5,308,723 | | | | 4,363,551 | |
| Series 2021-4, Class A1, 1.035%, 01-20-2065 (1)(3) | | | 1,785,375 | | | | 1,430,822 | |
| Series 2021-5, Class A1, 0.951%, 07-25-2066 (1)(3) | | | 946,753 | | | | 777,935 | |
| Argent Securities Inc. | | | | | | | | |
| Series 2006-W4, Class A2D, 5.385% (1 Month USD LIBOR + 0.540%), 05-25-2036 (2) | | | 285,679 | | | | 68,991 | |
| Series 2006-W5, Class A2B, 5.045% (1 Month LIBOR USD + 0.200%), 06-25-2036 (2) | | | 315,178 | | | | 84,583 | |
| Banc of America Funding Corporation | | | | | | | | |
| Series 2016-R2, Class 1A2, 8.495%, 05-02-2033 (1)(3) | | | 1,588,110 | | | | 1,553,437 | |
| BankAmerica Manufactured Housing Contract Trust | | | | | | | | |
| Series 1997-1, Class B1, 6.940%, 09-25-2023 | | | 600,000 | | | | 157,374 | |
| Series 1998-2, Class B1, 7.331%, 12-10-2025 (1) | | | 2,077,312 | | | | 421,814 | |
| Bayview Commercial Asset Trust | | | | | | | | |
| Series 2005-3, Class B2, 6.475% (1 Month LIBOR USD + 2.445%), 11-25-2035 (2)(3) | | | 285,598 | | | | 258,802 | |
| Bayview Financial AcqusitionTrust | | | | | | | | |
| Series 2006-C, Class 2A3, 5.266% (1 Month LIBOR USD + 0.435%), 11-28-2036 (2) | | | 1,152,227 | | | | 966,937 | |
| Bear Stearns Asset Backed Securities Trust | | | | | | | | |
| Series 2007-SD1, Class 22A1, 3.846%, 10-25-2036 (1) | | | 909,419 | | | | 534,107 | |
| BRAVO Residential Funding Trust | | | | | | | | |
| Series 2021-HE1, Class A1, 5.310% (SOFR30A + 0.750%), 01-27-2070 (2)(3) | | | 608,071 | | | | 600,371 | |
| CDC Mortgage Capital Trust | | | | | | | | |
| Series 2002-HE1, Class A, 5.465% (1 Month LIBOR USD + 0.620%), 01-25-2033 (2) | | | 8,423 | | | | 8,256 | |
| Chase Funding Mortgage Loan Asset-Backed CTFS | | | | | | | | |
| Series 2003-5, Class 1M2, 5.641%, 09-25-2032 (1) | | | 84,946 | | | | 69,798 | |
| Chec Loan trust | | | | | | | | |
| Series 2004-2, Class M3, 6.720% (1 Month USD LIBOR + 1.875%), 04-25-2034 (2) | | | 457,071 | | | | 455,746 | |
| Citigroup Mortgage Loan Trust Inc | | | | | | | | |
| Series 2014-12, Class 2A5, 3.111%, 02-25-2037 (1)(3) | | | 2,489,396 | | | | 1,771,005 | |
| COLT 2021-1 Mortgage Loan Trust | | | | | | | | |
| Series 2021-1, Class A1, 0.910%, 06-25-2066 (1)(3) | | | 363,455 | | | | 292,411 | |
| Conseco Finance Corp. | | | | | | | | |
| Series 1995-5, Class B2, 7.650%, 09-15-2026 (1) | | | 3,859,471 | | | | 377,520 | |
| Conseco Finance Securitizations Corp. | | | | | | | | |
| Series 1999-6, Class A1, 7.360%, 06-01-2030 (1)(3) | | | 8,717,676 | | | | 3,198,602 | |
| Series 2002-1, Class M2, 9.546%, 12-01-2032 (1) | | | 1,951,594 | | | | 1,783,997 | |
| Series 2002-2, Class M2, 9.163%, 03-01-2033 (1) | | | 1,684,600 | | | | 1,541,168 | |
| Conseco Financial Corp | | | | | | | | |
| Series 1996-6, Class B1, 8.000%, 09-15-2027 (1) | | | 1,307,021 | | | | 1,225,622 | |
| Series 1996-8, Class B1, 7.950%, 11-15-2026 (1) | | | 1,680,958 | | | | 1,588,263 | |
| Series 1997-4, Class M1, 7.220%, 02-15-2029 (1) | | | 137,750 | | | | 137,586 | |
| Series 1997-5, Class B1, 6.970%, 05-15-2029 (1) | | | 846,379 | | | | 789,729 | |
| Series 1998-3, Class M1, 6.860%, 03-01-2030 (1) | | | 2,476,818 | | | | 2,300,721 | |
| Series 1998-8, Class M1, 6.980%, 09-01-2029 (1) | | | 3,335,746 | | | | 3,014,188 | |
| Series 1999-4, Class A7, 7.410%, 01-01-2030 | | | 2,381,616 | | | | 1,020,121 | |
| Series 1999-5, Class A6, 7.500%, 03-01-2030 (1) | | | 5,099,430 | | | | 2,015,006 | |
The accompanying notes are an integral part of these financial statements.
Regan Total Return Income Fund
Schedule of Investments
March 31, 2023 (Unaudited)
| | | Principal
Amount | | | Value | |
| | | | | | | | | |
| Countrywide Asset-Backed Certificates | | | | | | | | |
| Series 2004-6, Class 1A1, 5.385% (1 Month LIBOR USD + 0.540%), 12-25-2034 (2) | | $ | 810,565 | | | $ | 759,631 | |
| Series 2006-1, Class AF6, 5.526%, 05-25-2036 (1) | | | 36,502 | | | | 34,238 | |
| Series 2006-15, Class A6, 5.826%, 08-25-2046 (1) | | | 146,720 | | | | 146,192 | |
| Series 2006-9, Class 1AF6, 5.989%, 08-25-2046 (1) | | | 175,417 | | | | 170,124 | |
| Series 2007-6, Class 2A3, 5.065% (1 Month USD LIBOR + 0.220%), 07-25-2034 (2) | | | 167,259 | | | | 171,612 | |
| Series 2007-SEA2, Class 2A1, 6.345% (1 Month LIBOR USD + 1.500%), 07-25-2037 (2)(3) | | | 3,686,406 | | | | 2,512,549 | |
| Countrywide Home Equity Loan Trust | | | | | | | | |
| Series 2004-B, Class 2A, 4.904% (1 Month USD LIBOR + 0.220%), 02-15-2029 (2) | | | 542,018 | | | | 480,039 | |
| Credit Suisse Mortgage Trust | | | | | | | | |
| Series 2007-1, Class 5A4, 6.000%, 02-25-2037 | | | 510,999 | | | | 307,042 | |
| Series 2007-1, Class 5A13, 6.000%, 02-25-2037 | | | 1,715,955 | | | | 1,020,802 | |
| Series 2007-1, Class 1A6A, 5.863%, 02-25-2037 (1) | | | 1,340,104 | | | | 314,526 | |
| Series 2007-1, Class 5A14, 6.000%, 02-25-2037 | | | 918,986 | | | | 547,073 | |
| Series 2015-1R, Class 6A1, 4.795% (1 Month USD LIBOR + 0.280%), 05-28-2037 (2)(3)(a) | | | 191,183 | | | | 184,071 | |
| Series 2019-RPL1, Class A1A, 3.650%, 07-25-2058 (1)(3) | | | 811,886 | | | | 767,502 | |
| Series 2021-NQM4, Class A1, 1.101%, 05-25-2066 (1)(3) | | | 833,313 | | | | 678,291 | |
| Series 2021-NQM6, Class A1, 1.174%, 07-25-2066 (1)(3) | | | 507,941 | | | | 407,455 | |
| Series 2021-NQM7, Class A3, 2.064%, 10-25-2066 (1)(3) | | | 235,761 | | | | 191,668 | |
| Credit-Based Asset Servicing and Securitization | | | | | | | | |
| Series 2004-CB7, Class AF5, 3.773%, 10-25-2034 (4)(a) | | | 29,904 | | | | 26,091 | |
| Series 2006-CB8, Class A1, 5.125% (1 Month USD LIBOR + 0.280%), 10-25-2036 (2) | | | 83,035 | | | | 70,039 | |
| Series 2007-RP1, Class A, 4.927% (1 Month USD LIBOR + 0.310%), 04-25-2037 (2)(3) | | | 123,027 | | | | 100,000 | |
| Ellington Financial Mortgage Trust | | | | | | | | |
| Series 2021-1, 1 Class A3, .106%, 02-25-2066 (1)(3) | | | 482,505 | | | | 395,845 | |
| EquiFirst Mortgage Loan Trust | | | | | | | | |
| Series 2004-1, Class 2A3, 5.645% (1 Month LIBOR USD + 0.800%), 01-25-2034 (2) | | | 512,869 | | | | 482,203 | |
| First Franklin Mtg Loan Asset Backed Certificates | | | | | | | | |
| Series 2006-FF11, Class 2A3, 5.145% (1 Month LIBOR USD + 0.300%), 08-25-2036 (2) | | | 367,682 | | | | 336,336 | |
| Series 2006-FF18, Class A2C, 5.005% (1 Month LIBOR USD + 0.160%), 12-26-2037 (2) | | | 596,847 | | | | 519,539 | |
| First Horizon Alternative Mortgage Securities | | | | | | | | |
| Series 2006-AA8, Class 2A1, 4.410%, 01-25-2037 (1) | | | 238,673 | | | | 135,958 | |
| Fremont Home Loan Trust | | | | | | | | |
| Series 2004-C, Class M2, 5.895% (1 Month USD LIBOR + 1.050%), 08-25-2034 (2) | | | 197,013 | | | | 189,096 | |
| Series 2006-B, Class 2A2, 5.045% (1 Month USD LIBOR + 0.200%), 08-25-2036 (2) | | | 79,564 | | | | 25,985 | |
| Series 2006-3, Class 1A1, 5.125% (1 Month USD LIBOR + 0.280%), 02-25-2037 (2) | | | 63,162 | | | | 48,299 | |
| GCAT | | | | | | | | |
| Series 2021-NQM2, Class A2, 1.242%, 05-25-2066 (1)(3) | | | 399,784 | | | | 325,508 | |
| Series 2021-NQM6, Class A1, 1.855%, 08-25-2066 (1)(3) | | | 841,503 | | | | 710,190 | |
| Series 2021-NQM7, Class A1, 1.915%, 08-25-2066 (1)(3) | | | 1,676,499 | | | | 1,476,319 | |
| GMAC Mortgage Corporation Loan Trust | | | | | | | | |
| Series 2007-HE3, Class 2A1, 7.000%, 09-25-2037 (1) | | | 172,211 | | | | 151,919 | |
| Greenpoint Manufactured Housing | | | | | | | | |
| Series 1999-5, Class M1B, 8.290%, 12-15-2029 (1) | | | 20,526 | | | | 20,367 | |
| Series 1999-5, Class M2, 9.230%, 12-15-2029 (1) | | | 55,984 | | | | 48,749 | |
| Series 2000-3, Class IA, 8.450%, 06-20-2031 (1) | | | 2,284,530 | | | | 1,153,203 | |
| GS Mortgage Securities Corp. | | | | | | | | |
| Series 2015-7R, Class A, 4.812% (1 Month USD LIBOR + 0.150%), 09-28-2037 (2)(3) | | | 22,338 | | | | 22,172 | |
| GSAMP Trust | | | | | | | | |
| Series 2003-SEA, Class A1, 5.645% (1 Month LIBOR USD + 0.800%), 02-25-2033 (2) | | | 58,482 | | | | 56,318 | |
| Series 2006-S1, Class A1, 5.125% (1 Month USD LIBOR + 0.280%), 11-25-2035 (2) | | | 6,564,089 | | | | 684,703 | |
| Series 2006-S5, Class A1, 1.804% (1 Month LIBOR USD + 0.180%), 09-25-2036 (2) | | | 18,570,655 | | | | 223,988 | |
| Series 2006-S5, Class A2, 6.158%, 09-25-2036 (4) | | | 6,187,543 | | | | 82,592 | |
| GSRPM Mortgage Loan Trust | | | | | | | | |
| Series 2004-1, Class B1, 8.595% (1 Month LIBOR USD + 3.750%), 09-25-2042 (2)(3) | | | 55,220 | | | | 54,925 | |
| Home Equity Asset Trust | | | | | | | | |
| Series 2002-2, Class A3, 5.425% (1 Month USD LIBOR + 0.580%), 12-27-2032 (2) | | | 94,405 | | | | 84,191 | |
The accompanying notes are an integral part of these financial statements.
Regan Total Return Income Fund
Schedule of Investments
March 31, 2023 (Unaudited)
| | | Principal
Amount | | | Value | |
| | | | | | | | | |
| HSI Asset Securitization Corporation Trust | | | | | | | | |
| Series 2007-HE2, Class 2A1, 4.955% (1 Month USD LIBOR + 0.110%), 04-27-2037 (2) | | $ | 180,935 | | | $ | 91,492 | |
| Imperial Fund Mortgage Trust | | | | | | | | |
| Series 2021-NQM2, Class A3, 1.516%, 09-25-2056 (1)(3) | | | 294,934 | | | | 229,766 | |
| Series 2022-NQM6, Class A1, 6.819%, 10-25-2067 (3)(4) | | | 38,453 | | | | 38,632 | |
| IndyMac Residential Asset Backed Trust | | | | | | | | |
| Series 2005-A, Class M5, 5.970% (1 Month LIBOR USD + 1.125%), 03-25-2035 (2) | | | 229,448 | | | | 228,294 | |
| Series 2006-C, Class 2A, 5.105% (1 Month USD LIBOR + 0.260%), 08-25-2036 (2) | | | 72,934 | | | | 67,629 | |
| Series 2007-A, Class 2A2, 5.035% (1 Month USD LIBOR + 0.190%), 04-25-2037 (2)(a) | | | 33,007 | | | | 19,969 | |
| Series 2007-A, Class 1A, 5.065% (1 Month LIBOR USD + 0.220%), 04-25-2037 (2) | | | 302,553 | | | | 223,271 | |
| Series 2007-A, Class 2A4B, 5.295% (1 Month LIBOR USD + 0.450%), 04-25-2037 (2) | | | 3,710,580 | | | | 1,387,651 | |
| Lehman ABS Manufactured Housing Contract Trust | | | | | | | | |
| Series 2001-B, Class M2, 7.170%, 04-15-2040 (1) | | | 2,843,688 | | | | 2,017,585 | |
| Long Beach Mortgage Loan Trust | | | | | | | | |
| Series 2004-2, Class A1, 5.285% (1 Month LIBOR USD + 0.440%), 06-25-2034 (2) | | | 374,035 | | | | 347,775 | |
| Series 2006-A, Class A1, 5.025% (1 Month USD LIBOR + 0.180%), 05-25-2036 (2) | | | 979,624 | | | | 22,272 | |
| MASTR Asset Backed Securities Trust | | | | | | | | |
| Series 2002-NC1, Class M4, 8.445% (1 Month LIBOR USD + 3.600%), 10-25-2032 (2) | | | 1,407,262 | | | | 1,160,953 | |
| Series 2006-FRE2, Class A5, 5.325% (1 Month USD LIBOR + 0.480%), 03-25-2036 (2) | | | 255,167 | | | | 175,573 | |
| Series 2006-AM2, Class A3, 5.185% (1 Month LIBOR USD + 0.340%), 06-25-2036 (2) | | | 602,342 | | | | 521,678 | |
| Series 2006-NC2 A3, Class A3, 5.065% (1 Month LIBOR USD + 0.220%), 08-25-2036 (2) | | | 1,002,642 | | | | 383,614 | |
| Series 2006-NC2 A5, Class A5, 5.325% (1 Month LIBOR USD + 0.480%), 08-25-2036 (2) | | | 457,658 | | | | 175,123 | |
| MASTR Specialized Loan Trust | | | | | | | | |
| Series 2007-01, Class A, 5.215% (1 Month LIBOR USD + 0.370%), 01-25-2037 (2)(3) | | | 650,190 | | | | 256,269 | |
| Merrill Lynch Mortgage Investors Trust | | | | | | | | |
| Series 2006-RM3, Class A1B, 5.225% (1 Month USD LIBOR + 0.380%), 06-25-2037 (2) | | | 5,939,596 | | | | 179,878 | |
| Metlife Securitization Trust | | | | | | | | |
| Series 2020-INV1, Class A2A, 2.500%, 05-25-2050 (1)(3) | | | 34,800 | | | | 28,765 | |
| MFRA Trust | | | | | | | | |
| Series 2020-NQM2, Class A3, 1.947%, 04-25-2065 (1)(3) | | | 99,378 | | | | 90,234 | |
| Series 2021-INV1, 1 Class A2, .057%, 01-25-2056 (1)(3) | | | 314,402 | | | | 277,262 | |
| Morgan Stanley Capital Inc | | | | | | | | |
| Series 2003-NC8, Class B1, 10.245% (1 Month USD LIBOR + 5.400%), 09-25-2033 (2) | | | 119,173 | | | | 117,537 | |
| Series 2004-WMC3, Class M3, 5.715% (1 Month USD LIBOR + 0.870%), 01-25-2035 (2) | | | 148,263 | | | | 158,847 | |
| Series 2005-HE1, Class M2, 5.550% (1 Month LIBOR USD + 0.705%), 12-25-2034 (2) | | | 282,834 | | | | 249,110 | |
| Series 2006-HE6, Class A2FP, 4.965% (1 Month LIBOR USD + 0.120%), 09-25-2036 (2)(a) | | | 163,956 | | | | 52,466 | |
| Series 2007-HE1, Class A2C, 4.995% (1 Month LIBOR USD + 0.150%), 11-25-2036 (2) | | | 554,934 | | | | 309,680 | |
| Morgan Stanley Mortgage Loan Trust | | | | | | | | |
| Series 2007-1XS, Class 2A4A, 6.584%, 09-25-2046 (4) | | | 5,897,590 | | | | 1,673,687 | |
| New Century Home Equity Loan Trust | | | | | | | | |
| Series 2004-4, Class M2, 5.640% (1 Month LIBOR USD + 0.795%), 02-25-2035 (2)(a) | | | 110,627 | | | | 96,854 | |
| New Residential Mortgage Loan Trust | | | | | | | | |
| Series 2021-NQM3, Class A3, 1.516%, 11-25-2056 (1)(3) | | | 372,460 | | | | 303,505 | |
| Series 2022-NQM1, Class A1, 2.277%, 04-25-2061 (1)(3) | | | 521,969 | | | | 444,250 | |
| Nomura Home Equity Loan Inc | | | | | | | | |
| Series 2006-AF1, Class A1, 6.032%, 10-25-2036 (4) | | | 1,480,836 | | | | 356,288 | |
| Nomura Resecuritization Trust | | | | | | | | |
| Series 2015-10R, Class 1A2, 5.306%, 12-25-2036 (1)(3) | | | 1,242,626 | | | | 1,010,160 | |
| Novastar Home Equity Loan | | | | | | | | |
| Series 2006-3, Class A2C, 5.165% (1 Month LIBOR USD + 0.320%), 10-25-2036 (2) | | | 1,829,150 | | | | 988,892 | |
| Series 2006-5, Class A2B, 5.085% (1 Month USD LIBOR + 0.240%), 11-25-2036 (2) | | | 999,517 | | | | 332,933 | |
| Oakwood Mortgage Investors Inc. | | | | | | | | |
| Series 1997-A, Class B1, 7.450%, 05-15-2027 (1) | | | 86,023 | | | | 84,019 | |
| Series 2002-C M1, Class M1, 6.890%, 11-15-2032 (1) | | | 1,363,615 | | | | 1,325,332 | |
| Oakwood Mortgage Investors, Inc. | | | | | | | | |
| Series 2001-D A2, 5.260%, 12-15-2024 (1) | | | 1,165,090 | | | | 528,798 | |
| Series 2001-D, Class A4, 6.930%, 09-15-2031 (1) | | | 2,187,241 | | | | 1,191,675 | |
The accompanying notes are an integral part of these financial statements.
Regan Total Return Income Fund
Schedule of Investments
March 31, 2023 (Unaudited)
| | | Principal
Amount | | | Value | |
| | | | | | | | | |
| Option One Mortgage Loan Trust | | | | | | | | |
| Series 2005-QS11, Class 1A1, 5.820%, 03-25-2037 (4) | | $ | 371,743 | | | $ | 325,447 | |
| Series 2007-1, Class 1A1, 4.985% (1 Month LIBOR USD + 0.140%), 01-25-2037 (2) | | | 590,347 | | | | 385,510 | |
| Series 2007-FXD1, Class 3A4, 5.860%, 01-25-2037 (4) | | | 1,762,336 | | | | 1,668,427 | |
| OWNIT Mortgage Loan Asset-Backed Certificates | | | | | | | | |
| Series 2006-6, Class A2C, 5.165% (1 Month USD LIBOR + 0.320%), 09-25-2037 (2) | | | 1,532,950 | | | | 732,404 | |
| RAAC Series | | | | | | | | |
| Series 2007-RP4, Class A, 5.195% (1 Month LIBOR USD + 0.350%), 06-25-2037 (2)(3) | | | 670,873 | | | | 596,997 | |
| RBSSP Resecuritization Trust | | | | | | | | |
| Series 2010-9, Class 7A6, 6.000%, 05-27-2037 (1)(3) | | | 1,025,900 | | | | 511,073 | |
| Renaissance Home Equity Loan Trust | | | | | | | | |
| Series 2002-3, Class A, 5.605% (1 Month LIBOR USD + 0.760%), 12-25-2032 (2) | | | 368,923 | | | | 334,438 | |
| Series 2003-4, Class M2F, 6.244%, 03-25-2034 (4) | | | 216,324 | | | | 194,714 | |
| Series 2004-1, Class M4, 7.545% (1 Month USD LIBOR + 2.700%), 05-25-2034 (2) | | | 239,243 | | | | 172,372 | |
| Series 2004-2, Class M1, 6.414%, 07-25-2034 (4) | | | 406,398 | | | | 350,964 | |
| Residential Funding Mortgage Securities II | | | | | | | | |
| Series 2006-HI5, Class A4, 6.200%, 12-25-2036 (4) | | | 8,137,043 | | | | 1,712,624 | |
| ResMAE Mortgage Loan Trust | | | | | | | | |
| Series 2006-1, Class A2B, 5.145% (1 Month LIBOR USD + 0.300%), 02-25-2036 (2)(3) | | | 2,969,366 | | | | 1,001,040 | |
| Series 2006-1, Class A2C, 5.245% (1 Month LIBOR USD + 0.400%), 02-25-2036 (2)(3) | | | 5,843,178 | | | | 1,970,691 | |
| Securitized Asset Backed Receivables LLC Trust | | | | | | | | |
| Series 2006-FR4, Class A2A, 5.005% (1 Month LIBOR USD + 0.160%), 08-25-2036 (2) | | | 367,746 | | | | 115,512 | |
| Series 2006-WM2, Class A2B, 4.965% (1 Month LIBOR USD + 0.120%), 09-25-2036 (2) | | | 628,086 | | | | 423,596 | |
| Security National Mortgage Loan Trust | | | | | | | | |
| Series 2006-3A, Class A3, 6.330%, 01-25-2037 (1)(3) | | | 337,455 | | | | 150,877 | |
| Specialty Underwriting & Residential Finance | | | | | | | | |
| Series 2006-BC3, Class A2C, 5.145% (1 Month LIBOR USD + 0.300%), 06-25-2037 (2) | | | 85,679 | | | | 48,809 | |
| Structured Asset Securities Corporation | | | | | | | | |
| Series 2006-S3, Class A1, 5.105% (1 Month USD LIBOR + 0.260%), 09-25-2036 (2) | | | 1,034,275 | | | | 344,394 | |
| Series 2006-BC6, Class A1, 5.005% (1 Month LIBOR USD + 0.160%), 01-25-2037 (2) | | | 356,751 | | | | 330,867 | |
| UCFC Manufactured Housing Contract | | | | | | | | |
| Series 1996-1, Class M, 7.900%, 01-15-2028 (1) | | | 28,385 | | | | 25,104 | |
| Verus Securitization Trust | | | | | | | | |
| Series 2021-2, Class A2, 1.288%, 02-25-2066 (1)(3) | | | 367,574 | | | | 310,740 | |
| Series 2021-3, Class A2, 1.283%, 06-25-2066 (1)(3) | | | 668,684 | | | | 553,882 | |
| Series 2021-6, Class A1, 1.630%, 10-25-2066 (1)(3) | | | 2,691,528 | | | | 2,216,131 | |
| Series 2023-1, Class A1, 5.850%, 12-25-2067 (3)(4) | | | 34,634 | | | | 34,331 | |
| WAMU Asset-Backed Certificates | | | | | | | | |
| Series 2007-HE4, Class 2A2, 4.975% (1 Month USD LIBOR + 0.130%), 07-25-2047 (2) | | | 319,594 | | | | 190,090 | |
| Washington Mutual Asset-Backed Certificates | | | | | | | | |
| Series 2007-HE1, Class 2A1, 4.905% (1 Month USD LIBOR + 0.060%), 11-25-2036 (2) | | | 1,544,330 | | | | 550,287 | |
| Conseco Finance Securitizations Corp. | | | | | | | | |
| Series 2000-4, Class A6, 8.310%, 05-01-2032 (1) | | | 660,851 | | | | 133,751 | |
| Option One Mortgage Loan Trust | | | | | | | | |
| Series 2006-3, Class 1A1, 4.985% (1 Month LIBOR USD + 0.140%), 02-25-2037 (2) | | | 996,721 | | | | 660,839 | |
| Residential Asset Securities Corporation | | | | | | | | |
| Series 2005-KS10, Class M2, 5.505% (1 Month LIBOR USD + 0.660%), 11-25-2035 (2) | | | 32,155 | | | | 31,974 | |
| TOTAL ASSET BACKED SECURITIES | | | | | | | | |
| (Cost $89,574,510) | | | | | | $ | 85,482,513 | |
| | | | | | | | | |
| MORTGAGE BACKED SECURITIES — NON AGENCY — 50.0% | | | | | | | | |
| Adjustable Rate Mortgage Trust | | | | | | | | |
| Series 2004-4, Class 3A1, 3.993%, 03-25-2035 (1)(a) | | | 37,313 | | | | 34,981 | |
| Series 2005-5, Class 2A1, 3.359%, 09-25-2035 (1)(a) | | | 50,374 | | | | 39,695 | |
| Series 2005-6A, Class 2A1, 5.465% (1 Month LIBOR USD + 0.620%), 11-25-2035 (2) | | | 91,848 | | | | 35,362 | |
| Series 2005-10, Class 1A1, 4.178%, 01-25-2036 (1) | | | 116,889 | | | | 101,760 | |
| Series 2006-1, Class 1A1, 3.825%, 03-25-2036 (1) | | | 87,255 | | | | 70,755 | |
The accompanying notes are an integral part of these financial statements.
Regan Total Return Income Fund
Schedule of Investments
March 31, 2023 (Unaudited)
| | | Principal
Amount | | | Value | |
| | | | | | | |
| Agate Bay Mortgage Trust | | | | | | | | |
| Series 2015-4, Class A5, 3.000%, 06-25-2045 (1)(3)(a) | | $ | 362,186 | | | $ | 337,739 | |
| Series 2015-6, Class A3, 3.500%, 09-25-2045 (1)(3) | | | 405,800 | | | | 364,730 | |
| American Home Mortgage Assets | | | | | | | | |
| Series 2006-2, Class 1A1, 4.098% (12 Month US Treasury Average + 0.960%), 09-25-2046 (2) | | | 530,740 | | | | 443,126 | |
| Series 2007-3, Class 11A1, 5.265% (1 Month USD LIBOR + 0.420%), 06-25-2037 (2) | | | 175,396 | | | | 159,113 | |
| American Home Mortgage Investment Trust | | | | | | | | |
| Series 2004-3, Class MH1, 4.115% (1 Month LIBOR USD + 0.900%), 10-25-2034 (2) | | | 80,264 | | | | 68,216 | |
| Series 2007-1, Class GIOP, 2.078%, 05-25-2047 | | | 5,848,349 | | | | 784,577 | |
| Series 2007-2, Class 11A1, 5.305% (1 Month USD LIBOR + 0.460%), 03-25-2047 (2) | | | 949,521 | | | | 366,901 | |
| Series 2007-2, Class 12A1, 5.385% (1 Month LIBOR USD + 0.540%), 03-25-2047 (2) | | | 1,064,459 | | | | 401,728 | |
| Angel Oak Mortgage Trust | | | | | | | | |
| Series 2020-4, Class A1, 1.469%, 05-25-2065 (1)(3) | | | 264,292 | | | | 237,431 | |
| ASG Resecuritization Trust | | | | | | | | |
| Series 2011-2, Class M52, 5.750%, 02-28-2036 (3) | | | 811,375 | | | | 743,307 | |
| Banc of America Alternative Loan Trust | | | | | | | | |
| Series 2005-11, Class 1CB5, 5.500%, 12-25-2035 | | | 171,462 | | | | 152,656 | |
| Series 2005-J 2A1, Class 1CB1, 5.245% (1 Month LIBOR USD + 0.400%), 11-25-2035 (2) | | | 603,466 | | | | 498,608 | |
| Series 2006-5, Class CB7, 6.000%, 06-25-2046 | | | 250,427 | | | | 219,709 | |
| Series 2006-7, Class A4, 6.498%, 10-25-2036 (4) | | | 854,565 | | | | 246,599 | |
| Series 2007-1, Class 1A1, 3.929%, 04-25-2023 (1)(a) | | | 324,299 | | | | 253,763 | |
| Series 2007-2, Class 1A1, 5.500%, 06-25-2037 | | | 741,463 | | | | 627,311 | |
| Banc of America Funding Corporation | | | | | | | | |
| Series 2004-2, Class 1CB1, 5.750%, 09-20-2034 | | | 306,062 | | | | 303,800 | |
| Series 2005-3, Class 1A10, 5.250%, 06-25-2035 | | | 340,084 | | | | 299,537 | |
| Series 2005-6, Class 1A3, 5.750%, 10-25-2035 | | | 1,276,872 | | | | 1,002,881 | |
| Series 2005-6, Class 1A8, 6.000%, 10-25-2035 | | | 365,344 | | | | 291,702 | |
| Series 2005-8, Class 1A1, 5.500%, 01-25-2036 | | | 257,644 | | | | 209,177 | |
| Series 2005-B, Class 2A1, 3.409%, 04-20-2035 (1) | | | 51,514 | | | | 44,689 | |
| Series 2005-E, Class 8A1, 4.568% (12 Month US Treasury Average + 1.430%), 06-20-2035 (2) | | | 1,034,618 | | | | 721,891 | |
| Series 2006-4, Class A11, 6.000%, 07-25-2036 | | | 232,139 | | | | 166,493 | |
| Series 2006-G, Class 3A3, 7.441% (12 Month LIBOR USD + 1.750%), 07-20-2036 (2) | | | 21,538 | | | | 20,841 | |
| Series 2007-4, Class 3A1, 5.215% (1 Month USD LIBOR + 0.370%), 06-25-2037 (2) | | | 168,911 | | | | 130,808 | |
| Series 2007-8, Class 4A1, 6.000%, 08-25-2037 (a) | | | 87,410 | | | | 62,498 | |
| Series 2007-C, Class 7A4, 5.201% (1 Month LIBOR USD + 0.440%), 05-20-2047 (2)(a) | | | 295,830 | | | | 242,580 | |
| Series 2008-R4, Class 1A4, 5.067% (1 Month LIBOR USD + 0.450%), 07-25-2037 (2)(3)(a) | | | 311,957 | | | | 188,734 | |
| Banc of America Mortgage Securities | | | | | | | | |
| Series 2003-H, Class 2A2, 4.038%, 09-25-2033 (1) | | | 870,361 | | | | 790,176 | |
| Series 2004-D, Class 2A2, 3.042%, 05-25-2034 (1) | | | 65,586 | | | | 60,146 | |
| Series 2005-3, Class 2A3, 5.500%, 03-25-2035 | | | 649,747 | | | | 565,233 | |
| Series 2005-8, Class A12, 5.500%, 09-25-2035 | | | 1,163,439 | | | | 1,004,735 | |
| Series 2005-E, Class 3A1, 3.648%, 06-25-2035 (1) | | | 228,147 | | | | 192,938 | |
| Series 2005-F, Class 2A2, 3.933%, 07-25-2035 (1) | | | 250,321 | | | | 223,124 | |
| Series 2005-J, Class 2A1, 3.841%, 11-25-2035 (1) | | | 51,364 | | | | 44,014 | |
| Series 2006-2, Class A2, 6.000% (1 Month LIBOR USD + 6.000%), 07-25-2046 (2) | | | 282,318 | | | | 244,431 | |
| Series 2006-2, Class A3, 5.445% (1 Month LIBOR USD + 0.600%), 07-25-2046 (2) | | | 869,984 | | | | 674,090 | |
| Series 2007-2, Class A7, 5.500%, 05-25-2037 | | | 79,535 | | | | 60,351 | |
| Series 2007-3, Class 1A1, 6.000%, 09-25-2037 | | | 471,717 | | | | 409,688 | |
| Bayview Commercial Asset Trust | | | | | | | | |
| Series 2006-1A, Class B1, 6.420% (1 Month USD LIBOR + 1.575%), 04-25-2036 (2)(3) | | | 191,527 | | | | 172,030 | |
| BCAP LLC Trust | | | | | | | | |
| Series 2008-IND2, Class A2, 3.457%, 04-25-2038 (1) | | | 975,330 | | | | 724,349 | |
| Bear Stearns Adjustable Rate Mortgage Trust | | | | | | | | |
| Series 2003-4, Class 3A1, 3.566%, 07-25-2033 (1)(a) | | | 65,068 | | | | 57,585 | |
| Series 2003-6, Class 1B1, 3.834%, 08-25-2033 (1) | | | 259,636 | | | | 198,190 | |
| Series 2006-4, Class 2A1, 3.857%, 10-25-2036 (1)(a) | | | 162,590 | | | | 121,536 | |
| Series 2007-2, Class 4A1, 6.180% (1 Year CMT Rate + 2.200%), 12-25-2046 (2) | | | 924,219 | | | | 754,806 | |
| Bear Stearns Alt-A Trust | | | | | | | | |
| Series 2004-5, Class M, 4.121%, 06-25-2034 (1) | | | 528,794 | | | | 431,124 | |
The accompanying notes are an integral part of these financial statements.
Regan Total Return Income Fund
Schedule of Investments
March 31, 2023 (Unaudited)
| | | Principal
Amount | | | Value | |
| | | | | | | |
| Series 2005-7, Class 23A1, 3.588%, 09-25-2035 (1) | | $ | 253,664 | | | $ | 106,371 | |
| Series 2005-9, Class 26A1, 3.613%, 11-25-2035 (1) | | | 503,704 | | | | 327,928 | |
| Series 2006-5, Class 2A2, 3.841%, 08-25-2036 (1) | | | 1,263,563 | | | | 635,586 | |
| Bear Stearns Asset Backed Securities Trust | | | | | | | | |
| Series 2007-AC4, Class A2, 10.341% (1 Month USD LIBOR + 27.300%), 05-25-2037 (2) | | | 645,295 | | | | 605,803 | |
| Series 2007-AC5 A-2, 6.000%, 07-25-2037 | | | 5,637,758 | | | | 1,775,150 | |
| Charlie Mac | | | | | | | | |
| Series 2004-1, Class A8, 5.395% (1 Month USD LIBOR + 0.550%), 08-25-2034 (2) | | | 31,799 | | | | 28,453 | |
| Chase Mortgage Finance Corporation | | | | | | | | |
| Series 2004-S2, Class 2A4, 5.500%, 02-25-2034 | | | 241,331 | | | | 231,235 | |
| Series 2005-A1, Class 3A1, 3.939%, 12-25-2035 (1) | | | 119,057 | | | | 98,522 | |
| Series 2007-S1, Class A1, 5.445% (1 Month USD LIBOR + 0.600%), 02-25-2037 (2) | | | 6,455,759 | | | | 1,961,387 | |
| Series 2007-A1, Class 11M1, 3.713%, 03-25-2037 (1) | | | 116,866 | | | | 104,871 | |
| Series 2007-S3, Class 1A1, 5.445% (1 Month LIBOR USD + 0.600%), 05-25-2037 (2) | | | 3,473,994 | | | | 1,146,212 | |
| Series 2007-A3, Class 1A7, 4.180%, 12-25-2037 (1) | | | 143,923 | | | | 114,742 | |
| ChaseFlex Trust | | | | | | | | |
| Series 2007-1, Class 2A6, 6.000%, 02-25-2037 | | | 1,894,459 | | | | 740,211 | |
| Series 2007-3, Class 1A2, 5.305% (1 Month USD LIBOR + 0.460%), 07-25-2037 (2) | | | 885,795 | | | | 264,685 | |
| Series 2007-M1, Class 1A1, 5.145% (1 Month USD LIBOR + 0.300%), 08-25-2037 (2) | | | 339,936 | | | | 297,237 | |
| Chevy Chase Mortgage Funding Corp. | | | | | | | | |
| Series 2003-4, Class A1, 5.525% (1 Month LIBOR USD + 0.680%), 10-25-2034 (2)(3) | | | 170,372 | | | | 156,589 | |
| Series 2004-3, Class A1, 5.095% (1 Month LIBOR USD + 0.250%), 08-27-2035 (2)(3) | | | 320,886 | | | | 284,204 | |
| Series 2005-1A, Class A2, 5.045% (1 Month USD LIBOR + 0.200%), 01-25-2036 (2)(3) | | | 368,809 | | | | 320,714 | |
| Series 2005-2A, Class A2, 5.075% (1 Month USD LIBOR + 0.230%), 05-25-2036 (2)(3) | | | 146,487 | | | | 122,524 | |
| Series 2006-1, Class A1, 4.995% (1 Month LIBOR USD + 0.150%), 12-25-2046 (2)(3)(a) | | | 472,785 | | | | 366,881 | |
| Series 2006-2, Class A2, 5.025% (1 Month LIBOR USD + 0.180%), 04-25-2047 (2)(3)(a) | | | 529,384 | | | | 413,979 | |
| Series 2006-4A, Class A2, 5.025% (1 Month USD LIBOR + 0.180%), 11-25-2047 (2)(3) | | | 67,642 | | | | 50,163 | |
| CHNGE Mortgage Trust 2022-1 | | | | | | | | |
| Series 2022-1, Class A1, 3.007%, 01-25-2067 (1)(3) | | | 158,904 | | | | 141,939 | |
| CIM Trust | | | | | | | | |
| Series 2019-INV1, Class A2, 5.617% (1 Month LIBOR USD + 1.000%), 02-25-2049 (2)(3) | | | 235,413 | | | | 224,894 | |
| Citicorp Mortgage Securities Inc. | | | | | | | | |
| Series 2006-3 1A4, Class 1A4, 6.000%, 06-25-2036 | | | 1,457,447 | | | | 1,273,234 | |
| Series 2006-4 1A4, Class 1A4, 6.000%, 08-25-2036 | | | 1,113,029 | | | | 1,001,116 | |
| Series 2007-5, Class 1A9, 6.000%, 06-25-2037 | | | 61,328 | | | | 52,563 | |
| Citigroup Mortgage Loan Trust Inc | | | | | | | | |
| Series 2004-2, Class 1A1, 6.500%, 09-25-2033 (3) | | | 311,546 | | | | 293,522 | |
| Series 2005-7, Class 2A3A, 3.621%, 11-25-2035 (1) | | | 136,396 | | | | 88,930 | |
| Series 2005-9, Class 1A1, 5.105% (1 Month LIBOR USD + 0.260%), 10-25-2035 (2) | | | 1,045,778 | | | | 836,476 | |
| Series 2005-9, Class 21A2, 5.500%, 10-25-2035 | | | 181,829 | | | | 173,510 | |
| Series 2006-AR1, Class 2A1, 6.380% (1 Month USD LIBOR + 2.400%), 03-25-2036 (2) | | | 59,780 | | | | 53,268 | |
| Series 2006-WF1, Class A2C, 4.605%, 03-25-2036 (4) | | | 434,485 | | | | 208,820 | |
| Series 2007-10, Class 2A4A, 3.734%, 09-25-2037 (1) | | | 182,272 | | | | 159,031 | |
| Series 2007-10, Class 22AA, 3.890%, 09-25-2037 (1) | | | 32,066 | | | | 27,289 | |
| Series 2007-9, Class 3A1, 6.500%, 06-25-2037 (3) | | | 624,108 | | | | 520,400 | |
| Series 2007-AR1, Class A4, 5.265% (1 Month USD LIBOR + 0.420%), 01-25-2037 (2) | | | 5,929,947 | | | | 1,060,844 | |
| Series 2007-OPX1, Class A2, 5.045% (1 Month USD LIBOR + 0.200%), 01-25-2037 (2) | | | 1,274,933 | | | | 587,888 | |
| Series 2021-INV2, Class A3A, 2.500%, 05-25-2051 (1)(3) | | | 342,742 | | | | 277,354 | |
| CitiMortgage Alternative Loan Trust | | | | | | | | |
| Series 2006-A1, Class 1A5, 5.500%, 04-25-2036 | | | 234,129 | | | | 209,992 | |
| Series 2006-A7, Class 1A9, 5.495% (1 Month LIBOR USD + 0.650%), 12-25-2036 (2) | | | 318,987 | | | | 253,747 | |
| Series 2006-A7, Class 1A1, 6.000%, 12-25-2036 (2) | | | 417,096 | | | | 350,757 | |
| Series 2006-A7, Class 1A12, 6.000%, 12-25-2036 | | | 363,674 | | | | 310,549 | |
| Series 2007-A5, Class 1A3, 5.345% (1 Month LIBOR USD + 0.500%), 05-25-2037 (2) | | | 319,170 | | | | 252,946 | |
| Series 2007-A6, Class 1A3, 6.000%, 06-25-2037 | | | 821,051 | | | | 708,674 | |
| Countrywide Alternative Loan Trust | | | | | | | | |
| Series 2003-J2, Class M, 6.000%, 10-25-2033 | | | 178,397 | | | | 165,139 | |
| Series 2004-28CB, Class 2A5, 5.245% (1 Month USD LIBOR + 0.400%), 01-25-2035 (2) | | | 183,796 | | | | 173,276 | |
The accompanying notes are an integral part of these financial statements.
Regan Total Return Income Fund
Schedule of Investments
March 31, 2023 (Unaudited)
| | | Principal
Amount | | | Value | |
| | | | | | | |
| Series 2004-34T1, Class A2, 5.500%, 02-25-2035 (a) | | $ | 384,563 | | | $ | 311,496 | |
| Series 2005-17, Class 2A1, 5.325% (1 Month LIBOR USD + 0.480%), 07-25-2035 (2) | | | 785,418 | | | | 610,256 | |
| Series 2005-19CB, Class A2, 6.280% (1 Month USD LIBOR + 16.940%), 06-25-2035 (2) | | | 69,709 | | | | 58,507 | |
| Series 2005-2, Class 2A1, 4.516%, 03-25-2035 (1) | | | 88,596 | | | | 74,405 | |
| Series 2005-24, Class 4A2, 5.378% (1 Month LIBOR USD + 0.600%), 07-20-2035 (2)(a) | | | 498,883 | | | | 291,847 | |
| Series 2005-27, Class 1A6, 6.075% (1 Month LIBOR USD + 1.230%), 08-25-2035 (2) | | | 475,940 | | | | 368,168 | |
| Series 2005-38, Class A3, 5.545% (1 Month LIBOR USD + 0.700%), 09-25-2035 (2)(a) | | | 213,453 | | | | 172,897 | |
| Series 2005-42CB, Class A2, 5.495% (1 Month LIBOR USD + 0.650%), 10-25-2035 (2) | | | 954,302 | | | | 601,129 | |
| Series 2005-42CB, Class A4, 5.500% (1 Month LIBOR USD + 0.680%), 10-25-2035 (2) | | | 1,260,315 | | | | 796,360 | |
| Series 2005-42CB, Class A1, 5.500% (1 Month LIBOR USD + 0.680%), 10-25-2035 (2) | | | 3,390,451 | | | | 2,142,337 | |
| Series 2005-49CB, Class A7, 5.500%, 11-25-2035 | | | 678,933 | | | | 462,463 | |
| Series 2005-51, Class 3A2A, 4.428% (12 Month US Treasury Average + 1.290%), 11-20-2035 (2) | | | 832,327 | | | | 669,553 | |
| Series 2005-57CB, Class 3A3, 5.500%, 12-25-2035 | | | 189,477 | | | | 101,172 | |
| Series 2005-70CB, Class A4, 5.500%, 12-25-2035 | | | 263,336 | | | | 181,854 | |
| Series 2005-76, Class 2A1, 4.138% (12 Month US Treasury Average + 1.000%), 02-25-2036 (2)(a) | | | 23,844 | | | | 17,979 | |
| Series 2005-J1, Class 2A1, 5.500%, 02-25-2025 | | | 11,655 | | | | 11,297 | |
| Series 2005-J10, Class 1A4, 5.475% (1 Month LIBOR USD + 0.630%), 10-25-2035 (2) | | | 1,248,793 | | | | 785,276 | |
| Series 2005-J10, Class 1A13, 5.500% (1 Month LIBOR USD + 0.700%), 10-25-2035 (2) | | | 353,028 | | | | 222,069 | |
| Series 2005-J10, Class 1A9, 5.500% (1 Month LIBOR USD + 0.700%), 10-25-2035 (2) | | | 1,200,763 | | | | 755,330 | |
| Series 2005-J8, Class 1A5, 5.500%, 07-25-2035 | | | 155,955 | | | | 118,742 | |
| Series 2006-17T1, Class A1, 6.250%, 06-25-2036 | | | 863,866 | | | | 366,085 | |
| Series 2006-24CB, Class A19, 5.345% (1 Month LIBOR USD + 0.500%), 08-25-2036 (2) | | | 1,851,415 | | | | 841,243 | |
| Series 2006-24CB, Class A13, 5.195% (1 Month USD LIBOR + 0.350%), 08-25-2036 (2) | | | 493,750 | | | | 219,696 | |
| Series 2006-24CB, Class A22, 6.000%, 08-25-2036 | | | 451,230 | | | | 260,978 | |
| Series 2006-24CB, Class A9, 6.000%, 08-25-2036 | | | 591,028 | | | | 341,833 | |
| Series 2006-26CB, Class A20, 5.195% (1 Month LIBOR USD + 0.350%), 09-25-2036 (2) | | | 1,576,864 | | | | 647,643 | |
| Series 2006-32CB, Class A3, 6.000%, 11-25-2036 | | | 368,805 | | | | 231,580 | |
| Series 2006-34, Class A5, 6.250%, 11-25-2046 | | | 809,107 | | | | 409,020 | |
| Series 2006-39CB, Class 2A1, 5.295% (1 Month LIBOR USD + 0.450%), 01-25-2037 (2) | | | 4,006,489 | | | | 502,615 | |
| Series 2006-40T1, Class 2A4, 6.000%, 12-25-2036 | | | 2,163,048 | | | | 643,717 | |
| Series 2006-41CB, Class 1A7, 6.000%, 01-25-2037 | | | 312,931 | | | | 178,758 | |
| Series 2006-46, Class A2, 5.365% (1 Month LIBOR USD + 0.520%), 02-25-2047 (2) | | | 453,833 | | | | 170,883 | |
| Series 2006-8T1, Class 1A4, 6.000%, 04-25-2036 (a) | | | 73,903 | | | | 32,702 | |
| Series 2006-HY13, Class 4A1, 3.973%, 02-25-2037 (1) | | | 506,292 | | | | 417,993 | |
| Series 2006-J1, Class 2A1, 7.000%, 02-25-2036 | | | 957,459 | | | | 116,376 | |
| Series 2006-J2, Class A2, 0.655% (1 Month LIBOR USD + 5.500%), 04-25-2036 (2) | | | 2,221,955 | | | | 265,124 | |
| Series 2006-J5, Class 1A5, 6.500%, 09-25-2036 | | | 242,007 | | | | 138,663 | |
| Series 2007-11T1, Class A35, 5.175% (1 Month LIBOR USD + 0.330%), 05-25-2037 (2) | | | 3,278,109 | | | | 1,142,003 | |
| Series 2007-16CB, Class 2A2, 14.206% (1 Month LIBOR USD + 54.583%), 08-25-2037 (2) | | | 733,607 | | | | 1,142,902 | |
| Series 2007-16CB, Class 1A5, 5.245% (1 Month LIBOR USD + 0.400%), 08-25-2037 (2) | | | 1,595,758 | | | | 1,037,947 | |
| Series 2007-16CB, Class 1A2, 5.245% (1 Month USD LIBOR + 0.400%), 08-25-2037 (2) | | | 1,074,286 | | | | 698,572 | |
| Series 2007-17CB, Class 1A10, 7.612% (1 Month LIBOR USD + 29.900%), 08-25-2037 (2) | | | 730,488 | | | | 739,462 | |
| Series 2007-22, Class 2A16, 6.500%, 09-25-2037 | | | 1,087,224 | | | | 457,135 | |
| Series 2007-24, Class A6, 5.845% (1 Month USD LIBOR + 1.000%), 10-25-2037 (2) | | | 226,230 | | | | 56,032 | |
| Series 2007-24, Class A7, 1.155% (1 Month USD LIBOR + 6.000%), 10-25-2037 (2) | | | 226,230 | | | | 32,879 | |
| Series 2007-25, Class 1A2, 6.500%, 11-25-2037 | | | 1,266,384 | | | | 637,239 | |
| Series 2007-2CB, Class 2A1, 5.445% (1 Month LIBOR USD + 0.600%), 03-25-2037 (2) | | | 315,486 | | | | 137,129 | |
| Series 2007-3T1, Class 1A2, 5.345% (1 Month USD LIBOR + 0.500%), 04-25-2037 (2) | | | 1,730,231 | | | | 581,092 | |
| Series 2007-9T1, Class 1A4, 5.345% (1 Month USD LIBOR + 0.500%), 05-25-2037 (2) | | | 1,194,967 | | | | 454,269 | |
| Series 2007-9T1, Class 1A5, 0.655% (1 Month USD LIBOR + 5.500%), 05-25-2037 (2) | | | 1,194,967 | | | | 122,552 | |
| Series 2007-J1, Class 2A6, 5.445% (1 Month USD LIBOR + 0.600%), 03-25-2037 (2) | | | 1,886,915 | | | | 569,179 | |
| Series 2007-OA2, Class 1A1, 3.978% (1 Month USD LIBOR + 0.840%), 03-25-2047 (2) | | | 340,193 | | | | 274,622 | |
| Series 2007-OH1, Class A1D, 5.055% (1 Month LIBOR USD + 0.210%), 04-25-2047 (2) | | | 80,595 | | | | 60,551 | |
| Countrywide Alternative Loan Trust Resecuritization | | | | | | | | |
| Series 2008-2R, Class 4A1, 6.250%, 08-25-2037 (1) | | | 1,203,114 | | | | 645,697 | |
| Countrywide Home Loans | | | | | | | | |
| Series 2003-48, Class 2A3, 4.202%, 10-25-2033 (1) | | | 401,221 | | | | 192,997 | |
| Series 2004-25, Class 2A1, 5.525% (1 Month LIBOR USD + 0.680%), 02-25-2035 (2) | | | 565,920 | | | | 466,633 | |
The accompanying notes are an integral part of these financial statements.
Regan Total Return Income Fund
Schedule of Investments
March 31, 2023 (Unaudited)
| | | Principal
Amount | | | Value | |
| | | | | | | |
| Series 2004-J3, Class A7, 5.500%, 05-25-2034 | | $ | 243,540 | | | $ | 235,100 | |
| Series 2005-15, Class A5, 5.500%, 08-25-2035 | | | 480,682 | | | | 280,618 | |
| Series 2005-16, Class A28, 5.500%, 09-25-2035 | | | 1,942,829 | | | | 1,262,744 | |
| Series 2005-17, Class 1A8, 5.500%, 09-25-2035 | | | 701,896 | | | | 639,008 | |
| Series 2005-19, Class 2A1, 5.195% (1 Month USD LIBOR + 0.350%), 08-25-2035 (2) | | | 337,819 | | | | 72,519 | |
| Series 2005-2, Class 2A1, 5.485% (1 Month LIBOR USD + 0.640%), 03-25-2035 (2) | | | 124,465 | | | | 109,192 | |
| Series 2005-21, Class A2, 5.500%, 10-25-2035 | | | 193,857 | | | | 118,285 | |
| Series 2005-25, Class A17, 5.500%, 11-25-2035 | | | 402,165 | | | | 209,395 | |
| Series 2005-31, Class 2A1, 3.209%, 01-25-2036 (1) | | | 219,809 | | | | 173,145 | |
| Series 2005-HYB10, Class 5A1, 3.914%, 02-20-2036 (1) | | | 1,225,996 | | | | 928,805 | |
| Series 2005-HYB8, Class 4A1, 3.867%, 12-20-2035 (1) | | | 148,452 | | | | 122,349 | |
| Series 2005-J3, Class 1A3, 6.000% (1 Month LIBOR USD + 1.350%), 09-25-2035 (2) | | | 1,390,827 | | | | 975,969 | |
| Series 2006-10, Class 1A11, 5.850%, 05-25-2036 | | | 174,562 | | | | 84,336 | |
| Series 2007-1, Class A2, 6.000%, 03-25-2037 | | | 1,423,108 | | | | 718,585 | |
| Series 2007-10, Class A6, 6.000%, 07-25-2037 | | | 399,962 | | | | 89,757 | |
| Series 2007-17, Class 1A1, 6.000%, 10-25-2037 | | | 313,889 | | | | 239,971 | |
| Series 2007-20, Class A1, 6.500%, 01-25-2038 (a) | | | 122,750 | | | | 56,219 | |
| Series 2007-3, Class A16, 6.000%, 04-25-2037 | | | 517,614 | | | | 272,267 | |
| Series 2007-HY1, Class 1A1, 3.752%, 04-25-2037 (1) | | | 492,471 | | | | 431,109 | |
| Credit Suisse First Boston Mortgage Securities | | | | | | | | |
| Series 2001-28, Class 1A1, 5.495% (1 Month LIBOR USD + 0.650%), 11-25-2031 (2) | | | 108,078 | | | | 62,894 | |
| Series 2002-18, Class 2A1, 7.500%, 06-25-2032 | | | 100,982 | | | | 92,129 | |
| Series 2002-9, Class 1A1, 7.000%, 03-25-2032 | | | 910,853 | | | | 838,891 | |
| Series 2004-6, Class 4A12, 5.245% (1 Month USD LIBOR + 0.400%), 10-25-2034 (2) | | | 129,382 | | | | 119,373 | |
| Series 2005-10, Class 10A3, 6.000%, 11-25-2035 | | | 197,147 | | | | 56,860 | |
| Series 2005-10, Class 6A7, 5.500%, 11-25-2035 | | | 253,869 | | | | 113,000 | |
| Series 2005-11, Class 8A5, 6.000%, 12-25-2035 (a) | | | 125,295 | | | | 92,091 | |
| Series 2005-11, Class 1A1, 6.500%, 12-25-2035 | | | 1,144,050 | | | | 597,709 | |
| Series 2005-11, Class 3A5, 5.500%, 12-25-2035 | | | 196,868 | | | | 86,153 | |
| Series 2005-4, Class 2A4, 5.500%, 06-25-2035 | | | 559,227 | | | | 421,380 | |
| Series 2005-7, Class 2A2, 5.145% (1 Month USD LIBOR + 0.300%), 08-25-2035 (2) | | | 1,070,360 | | | | 438,990 | |
| Series 2005-8, Class 5A1, 6.200% (1 Month LIBOR USD + 19.525%), 09-25-2035 (2) | | | 950,129 | | | | 507,100 | |
| Series 2005-9, Class 3A1, 6.000%, 10-25-2035 | | | 3,073,584 | | | | 1,016,828 | |
| Series 2005-9, Class 4A1, 6.200% (1 Month LIBOR USD + 19.525%), 10-25-2035 (2) | | | 472,878 | | | | 472,702 | |
| Series 2005-9, Class 1A3, 5.250%, 10-25-2035 | | | 177,266 | | | | 159,669 | |
| Credit Suisse Mortgage Trust | | | | | | | | |
| Series 2006-2, Class 2A3, 6.000%, 03-25-2036 (a) | | | 72,895 | | | | 28,137 | |
| Series 2006-2, Class 6A8, 5.750%, 03-25-2036 | | | 214,224 | | | | 115,107 | |
| Series 2006-3, Class 1A4B, 6.664%, 04-25-2036 (4) | | | 2,008,353 | | | | 138,867 | |
| Series 2006-3, Class 1A3, 6.810%, 04-25-2036 (4) | | | 9,650,000 | | | | 674,881 | |
| Series 2006-6, Class 1A12, 6.000%, 07-25-2036 | | | 1,879,758 | | | | 992,792 | |
| Series 2006-6, Class 1A8, 6.000%, 07-25-2036 | | | 1,258,753 | | | | 666,058 | |
| Series 2006-6, Class 2A4, 6.500%, 07-25-2036 | | | 4,500,307 | | | | 1,306,354 | |
| Series 2007-3, Class 1A2, 5.587%, 04-25-2037 (1) | | | 3,343,751 | | | | 779,767 | |
| Series 2007-4, Class 2A2, 6.000%, 06-25-2037 | | | 102,673 | | | | 60,073 | |
| Series 2007-4R, Class 1A1, 5.494%, 10-26-2036 (1)(3) | | | 74,405 | | | | 63,145 | |
| Series 2007-5, Class 3A19, 6.000%, 08-25-2037 | | | 230,390 | | | | 176,105 | |
| Series 2013-6, Class 2A1, 3.500%, 08-25-2043 (1)(3) | | | 623,948 | | | | 543,458 | |
| Series 2013-6, Class 1A1, 2.500%, 07-25-2028 (1)(3) | | | 46,736 | | | | 43,581 | |
| CSAB Mortgage Backed Trust | | | | | | | | |
| Series 2006-1, Class A3, 5.325% (1 Month USD LIBOR + 0.480%), 06-25-2036 (2) | | | 5,011,249 | | | | 850,046 | |
| Series 2007-1, Class 4A1, 5.195% (1 Month LIBOR USD + 0.350%), 05-25-2037 (2) | | | 8,179,712 | | | | 964,316 | |
| CSAB Mortgage-Backed Trust | | | | | | | | |
| Series 2007-1, Class 1A1A, 5.898%, 05-25-2037 (1) | | | 2,166,357 | | | | 553,059 | |
| Deephaven Residential Mortgage Trust | | | | | | | | |
| Series 2021-2, Class A1, 0.899%, 04-25-2066 (1)(3) | | | 371,796 | | | | 317,706 | |
| Series 2021-2, Class A2, 1.209%, 04-25-2066 (1)(3) | | | 325,509 | | | | 278,895 | |
The accompanying notes are an integral part of these financial statements.
Regan Total Return Income Fund
Schedule of Investments
March 31, 2023 (Unaudited)
| | | Principal
Amount | | | Value | |
| | | | | | | |
| Deutsche Alt-A Securities INC Mortgage Loan Trust | | | | | | | | |
| Series 2003-1 A1, Class A1, 5.500%, 09-25-2033 | | $ | 426,082 | | | $ | 426,368 | |
| Series 2005-4 A5, Class A5, 5.500%, 09-25-2035 (1) | | | 73,385 | | | | 64,942 | |
| Series 2006-AR5, Class 1A1, 5.105% (1 Month LIBOR USD + 0.260%), 10-25-2036 (2) | | | 946,574 | | | | 297,919 | |
| Series 2007-AR2, Class A4, 5.115% (1 Month LIBOR USD + 0.270%), 03-25-2037 (2) | | | 28,014 | | | | 29,476 | |
| Series 2007-BAR1, Class A4, 5.325% (1 Month LIBOR USD + 0.480%), 03-25-2037 (2) | | | 7,517,050 | | | | 484,574 | |
| Series 2007-OA5, Class A1A, 5.045% (1 Month LIBOR USD + 0.200%), 08-25-2047 (2)(a) | | | 194,509 | | | | 158,136 | |
| Deutsche Alt-B Securities INC Mortgage Loan Trust | | | | | | | | |
| Series 2006-AB2, Class A3, 6.270%, 06-25-2036 (1) | | | 1,178,000 | | | | 991,535 | |
| Deutsche Mortgage Securities, Inc. | | | | | | | | |
| Series 2004-1, Class 3A5, 6.160%, 09-25-2033 (4) | | | 35,450 | | | | 33,577 | |
| Series 2004-5, Class A4B, 6.125%, 07-25-2034 (4) | | | 40,161 | | | | 38,468 | |
| Series 2006-PR1, Class 5AF1, 5.234% (1 Month USD LIBOR + 0.550%), 04-15-2036 (2)(3) | | | 489,808 | | | | 385,442 | |
| Ellington Financial Mortgage Trust | | | | | | | | |
| Series 2020-1, Class A1, 2.006%, 05-25-2065 (1)(3) | | | 22,510 | | | | 21,466 | |
| First Horizon Alternative Mortgage Securities | | | | | | | | |
| Series 2005-FA6, Class A7, 5.500%, 09-25-2035 | | | 816,402 | | | | 455,761 | |
| Series 2005-AA10, Class 2A1, 4.135%, 12-25-2035 (1) | | | 155,311 | | | | 120,861 | |
| Series 2005-AA11, Class 2A1, 4.147%, 01-25-2036 (1) | | | 412,210 | | | | 218,241 | |
| Series 2006-FA2, Class 1A6, 6.000%, 05-25-2036 | | | 349,981 | | | | 155,565 | |
| First Horizon Mortgage Pass-Through Trust | | | | | | | | |
| Series 2005-AR3, Class 2A1, 3.875%, 08-25-2035 (1) | | | 184,533 | | | | 124,466 | |
| FirstKey Mortgage Trust | | | | | | | | |
| Series 2015-1, Class A3, 3.500%, 03-25-2045 (1)(3) | | | 54,151 | | | | 49,122 | |
| Flagstar Mortgage Trust | | | | | | | | |
| Series 2018-6RR, Class 2A4, 4.000%, 10-25-2048 (1)(3) | | | 131,822 | | | | 127,186 | |
| FWD Securitization Trust | | | | | | | | |
| Series 2020-INV1, Class A3, 2.440%, 01-25-2050 (1)(3) | | | 271,849 | | | | 245,876 | |
| Galton Funding Mortgage Trust | | | | | | | | |
| Series 2019-2, Class A21, 4.000%, 06-25-2059 (1)(3) | | | 73,728 | | | | 70,391 | |
| GCAT | | | | | | | | |
| Series 2021-NQM3, Class A1, 1.091%, 05-25-2066 (1)(3) | | | 748,261 | | | | 610,263 | |
| Series 2021-CM2, Class A1, 2.352%, 08-25-2066 (1)(3) | | | 359,242 | | | | 324,937 | |
| GMAC Mortgage Corporation Loan Trust | | | | | | | | |
| Series 2005-AR4, Class 2A2, 4.111%, 07-19-2035 (1) | | | 124,719 | | | | 87,948 | |
| GSAA Home Equity Trust | | | | | | | | |
| Series 2005-14, Class A1, 5.545% (1 Month LIBOR USD + 0.700%), 12-25-2035 (2) | | | 770,008 | | | | 317,999 | |
| Series 2005-14, Class 2A3, 5.545% (1 Month LIBOR USD + 0.700%), 12-25-2035 (2)(a) | | | 360,013 | | | | 292,330 | |
| Series 2006-10, Class AF3, 5.985%, 06-25-2036 (1) | | | 988,124 | | | | 260,786 | |
| Series 2006-11, Class 2A1, 5.025% (1 Month LIBOR USD + 0.180%), 07-25-2036 (2) | | | 483,419 | | | | 105,215 | |
| Series 2007-5, Class 2A1A, 5.085% (1 Month LIBOR USD + 0.240%), 05-25-2037 (2)(a) | | | 288,190 | | | | 244,097 | |
| GSMPS Mortgage Loan Trust | | | | | | | | |
| Series 2005-RP1, Class 1AF, 5.195% (1 Month LIBOR USD + 0.350%), 01-25-2035 (2)(3)(a) | | | 34,594 | | | | 28,661 | |
| Series 2005-RP3, Class 1AF, 5.195% (1 Month USD LIBOR + 0.350%), 09-25-2035 (2)(3) | | | 497,294 | | | | 420,763 | |
| Series 2006-RP1, Class 1AF2, 5.195% (1 Month LIBOR USD + 0.350%), 01-25-2036 (2)(3) | | | 646,115 | | | | 521,727 | |
| GSR Mortgage Loan Trust | | | | | | | | |
| Series 2004-2F, Class 1A4, 5.500%, 01-25-2034 | | | 29,432 | | | | 28,844 | |
| Series 2005-1F, Class 4A1, 5.145% (1 Month USD LIBOR + 0.300%), 01-25-2035 (2) | | | 355,347 | | | | 322,755 | |
| Series 2005-6F, Class 3A11, 5.145% (1 Month LIBOR USD + 0.300%), 07-25-2035 (2) | | | 636,123 | | | | 486,540 | |
| Series 2005-9F, Class 1A6, 5.500%, 12-25-2035 | | | 383,356 | | | | 317,570 | |
| Series 2005-AR5, Class 2A3, 3.765%, 10-25-2035 (1) | | | 24,247 | | | | 13,638 | |
| Series 2005-AR6, Class B1, 4.184%, 09-25-2035 (1) | | | 93,482 | | | | 79,465 | |
| Series 2006-10F, Class 4A1, 5.195% (1 Month LIBOR USD + 0.350%), 01-25-2037 (2) | | | 1,692,630 | | | | 235,738 | |
| Series 2006-3F, Class 2A3, 5.750%, 03-25-2036 | | | 423,045 | | | | 389,211 | |
| Series 2006-4F, Class 4A2, 2.305% (1 Month LIBOR USD + 7.150%), 05-25-2036 (2) | | | 9,550,098 | | | | 1,144,551 | |
| Series 2006-7F, Class 4A2, 6.500%, 08-25-2036 | | | 1,731,836 | | | | 634,244 | |
| Series 2006-AR1, Class 3A1, 3.664%, 01-25-2036 (1) | | | 60,758 | | | | 65,128 | |
| Series 2006-AR2, Class 3A1, 4.253%, 04-25-2036 (1) | | | 541,307 | | | | 357,126 | |
The accompanying notes are an integral part of these financial statements.
Regan Total Return Income Fund
Schedule of Investments
March 31, 2023 (Unaudited)
| | | Principal
Amount | | | Value | |
| | | | | | | |
| Series 2006-OA1, Class 2A2, 5.365% (1 Month LIBOR USD + 0.520%), 08-25-2046 (2) | | $ | 3,306,688 | | | $ | 871,354 | |
| Series 2007-AR2, Class 1A1, 3.163%, 05-25-2037 (1) | | | 879,929 | | | | 485,573 | |
| Series 2007-OA1, Class 2A3A, 5.155% (1 Month USD LIBOR + 0.310%), 05-25-2037 (2) | | | 452,453 | | | | 315,321 | |
| HarborView Mortgage Loan Trust | | | | | | | | |
| Series 2004-8, Class 2A3, 5.581% (1 Month LIBOR USD + 0.820%), 11-19-2034 (2) | | | 267,616 | | | | 222,976 | |
| Series 2004-8, Class 2A4A, 5.561% (1 Month USD LIBOR + 0.800%), 11-19-2034 (2) | | | 283,721 | | | | 257,941 | |
| Series 2005-14, Class 3A1A, 4.373%, 12-19-2035 (1) | | | 53,971 | | | | 50,346 | |
| Series 2005-14, Class 4A1A, 3.796%, 12-19-2035 (1) | | | 1,443,134 | | | | 764,583 | |
| Series 2005-16, Class 1A1A, 5.261% (1 Month USD LIBOR + 0.500%), 01-19-2036 (2) | | | 6,272,503 | | | | 1,855,750 | |
| Series 2005-16, Class 3A1A, 5.261% (1 Month LIBOR USD + 0.500%), 01-19-2036 (2) | | | 2,180,261 | | | | 1,323,021 | |
| Series 2006-4, Class 1A2A, 5.141% (1 Month LIBOR USD + 0.380%), 05-19-2046 (2) | | | 735,508 | | | | 368,096 | |
| Series 2006-5, Class 2A1A, 5.121% (1 Month USD LIBOR + 0.360%), 07-19-2046 (2) | | | 1,569,342 | | | | 805,955 | |
| Series 2006-8, Class 1A1, 4.978% (1 Month LIBOR USD + 0.400%), 07-21-2036 (2) | | | 786,508 | | | | 400,120 | |
| Series 2007-4, Class 2A1, 4.981% (1 Month LIBOR USD + 0.440%), 07-19-2047 (2) | | | 364,816 | | | | 325,145 | |
| HSI Asset Loan Obligation | | | | | | | | |
| Series 2007-WF1, Class A1, 4.965% (1 Month USD LIBOR + 0.120%), 12-25-2036 (2) | | | 812,319 | | | | 261,944 | |
| Impac CMB Trust | | | | | | | | |
| Series 2004-6, Class 2A, 6.060%, 10-25-2034 (4) | | | 199,597 | | | | 196,869 | |
| Series 2004-11, Class 2A1, 5.505% (1 Month USD LIBOR + 0.660%), 03-25-2035 (2) | | | 33,839 | | | | 30,835 | |
| Series 2005-5, Class A1, 5.485% (1 Month LIBOR USD + 0.320%), 08-25-2035 (2) | | | 498,881 | | | | 441,641 | |
| Impac Secured Assets Corp. | | | | | | | | |
| Series 2005-2, Class A2D, 5.705% (1 Month USD LIBOR + 0.860%), 03-25-2036 (2) | | | 52,025 | | | | 39,948 | |
| Series 2007-3, Class A1A, 5.065% (1 Month USD LIBOR + 0.220%), 09-25-2037 (2) | | | 172,293 | | | | 144,470 | |
| IndyMac IMJA Mortgage Loan Trust | | | | | | | | |
| Series 2007-A1, Class A3, 6.000%, 08-25-2037 | | | 2,734,808 | | | | 1,149,516 | |
| IndyMac IMSC Mortgage Loan Trust | | | | | | | | |
| Series 2007-F3, Class 2A1, 6.500%, 09-25-2037 | | | 26,640 | | | | 16,159 | |
| IndyMac INDA Mortgage Loan Trust | | | | | | | | |
| Series 2006-AR2, Class 1A1, 3.576%, 09-25-2036 (1)(a) | | | 262,321 | | | | 150,048 | |
| Series 2007-AR1, Class 1A1, 3.551%, 03-25-2037 (1) | | | 190,045 | | | | 151,996 | |
| IndyMac INDX Mortgage Loan Trust | | | | | | | | |
| Series 2005-AR11, Class A4, 3.465%, 08-25-2035 (1) | | | 712,399 | | | | 549,330 | |
| Series 2005-AR5, Class 1A1, 3.239%, 05-25-2035 (1) | | | 774,716 | | | | 607,177 | |
| Series 2005-AR5, Class 4A1, 3.232%, 05-25-2035 (1) | | | 277,690 | | | | 195,584 | |
| Series 2006-AR19, Class 4A1, 3.321%, 08-25-2036 (1) | | | 1,251,948 | | | | 1,040,077 | |
| Series 2006-AR37, Class 1A1, 3.885%, 02-25-2037 (1) | | | 80,502 | | | | 63,330 | |
| Series 2006-AR5, Class 2A1, 3.149%, 05-25-2036 (1) | | | 1,549,361 | | | | 1,289,311 | |
| Series 2007-AR21IP, Class 1A2, 3.873%, 11-25-2036 (1) | | | 206,728 | | | | 178,951 | |
| Series 2007-AR9, Class 2A1, 3.255%, 06-25-2037 (1) | | | 21,896 | | | | 12,569 | |
| J.P. Morgan Alternative Loan Trust | | | | | | | | |
| Series 2006-A2, Class 3A1, 3.231%, 05-25-2036 (1) | | | 781,351 | | | | 439,974 | |
| Series 2006-A6, Class 2A6, 3.399%, 11-25-2036 (1) | | | 938,185 | | | | 712,537 | |
| Series 2006-S1, Class 3A5, 5.730%, 03-25-2036 (1) | | | 58,915 | | | | 57,206 | |
| Series 2006-S3, Class A5, 6.920%, 08-25-2036 (4) | | | 1,103,529 | | | | 854,333 | |
| Series 2007-A2, Class 2A1, 4.200%, 05-25-2037 (1) | | | 178,441 | | | | 144,418 | |
| JP Morgan Alternative Loan Trust | | | | | | | | |
| Series 2006-A4, Class A8, 3.532%, 09-25-2036 (1) | | | 10,705 | | | | 11,247 | |
| JP Morgan Mortgage Trust | | | | | | | | |
| Series 2004-A1, Class 5A1, 4.240%, 02-25-2034 (1) | | | 70,652 | | | | 67,890 | |
| Series 2004-A3, Class 1A1, 3.319%, 07-25-2034 (1) | | | 28,815 | | | | 25,316 | |
| Series 2005-A1, Class 3A4, 3.859%, 02-25-2035 (1) | | | 37,136 | | | | 34,232 | |
| Series 2005-A2, Class 2A1, 3.580%, 04-25-2035 (1) | | | 86,826 | | | | 68,618 | |
| Series 2005-A8, Class 1A1, 3.902%, 11-25-2035 (1) | | | 1,160,750 | | | | 932,175 | |
| Series 2006-A4, Class 5A1, 3.633%, 06-25-2036 (1) | | | 142,840 | | | | 103,166 | |
| Series 2007-A1, Class 5A6, 3.999%, 07-25-2035 (1) | | | 156,127 | | | | 143,910 | |
| Series 2007-S1, Class 2A22, 5.750%, 03-25-2037 | | | 310,855 | | | | 134,909 | |
| Series 2007-S3, Class 1A18, 5.345% (1 Month USD LIBOR + 0.500%), 08-25-2037 (2) | | | 870,790 | | | | 305,264 | |
| Series 2014-IVR6, Class 2A4, 5.682%, 08-25-2044 (1)(3) | | | 25,145 | | | | 25,045 | |
The accompanying notes are an integral part of these financial statements.
Regan Total Return Income Fund
Schedule of Investments
March 31, 2023 (Unaudited)
| | | Principal
Amount | | | Value | |
| | | | | | | |
| Series 2016-2, Class A1, 6.005%, 06-25-2046 (1)(3) | | $ | 19,575 | | | $ | 18,099 | |
| Series 2017-4, Class A3, 3.500%, 11-25-2048 (1)(3) | | | 6,641 | | | | 6,088 | |
| Series 2019-INV1, Class A11, 5.567% (1 Month LIBOR USD + 0.950%), 09-25-2049 (2)(3) | | | 17,496 | | | | 16,751 | |
| Series 2020-LTV1, Class A11, 5.617% (1 Month LIBOR USD + 1.000%), 06-25-2050 (2)(3) | | | 54,546 | | | | 53,417 | |
| Lehman Mortgage Trust | | | | | | | | |
| Series 2006-2, Class 1A1, 5.898%, 04-25-2036 (1) | | | 108,903 | | | | 71,957 | |
| Series 2006-3, Class 1A10, 6.000%, 07-25-2036 | | | 1,281,087 | | | | 642,199 | |
| Series 2006-7, Class 2A5, 1.705% (1 Month LIBOR USD + 6.550%), 11-25-2036 (2) | | | 7,991,628 | | | | 950,351 | |
| Series 2006-9, Class 1A2, 5.445% (1 Month LIBOR USD + 0.600%), 01-25-2037 (2) | | | 1,193,093 | | | | 633,508 | |
| Series 2007-1, Class 2A3, 1.785% (1 Month USD LIBOR + 6.630%), 02-25-2037 (2) | | | 8,546,573 | | | | 935,801 | |
| Series 2007-10, Class 2A1, 6.500%, 01-25-2038 | | | 1,166,483 | | | | 351,879 | |
| Series 2007-3, Class 1A2, 1.855% (1 Month LIBOR USD + 6.700%), 04-25-2037 (2)(a) | | | 1,421,443 | | | | 194,453 | |
| Series 2007-3, Class 1A3, 5.145% (1 Month USD LIBOR + 0.300%), 04-25-2037 (2) | | | 1,471,701 | | | | 352,776 | |
| Series 2007-5, Class 1A3, 5.750%, 06-25-2037 | | | 441,125 | | | | 398,064 | |
| Series 2007-6, Class 1A7, 6.000%, 07-25-2037 | | | 539,523 | | | | 484,922 | |
| Series 2007-7, Class 1A1, 5.345% (1 Month USD LIBOR + 0.500%), 08-25-2037 (2) | | | 737,529 | | | | 380,718 | |
| Series 2008-2, Class 1A1, 6.000%, 03-25-2038 (a) | | | 174,172 | | | | 54,429 | |
| Series 2008-4, Class A1, 5.225% (1 Month LIBOR USD + 0.380%), 01-25-2037 (2) | | | 3,659,088 | | | | 1,084,681 | |
| Lehman XS Trust | | | | | | | | |
| Series 2006-10N, Class 2A1, 5.085% (1 Month LIBOR USD + 0.240%), 05-25-2036 (2)(a) | | | 220,149 | | | | 196,637 | |
| Series 2007-6, Class 1A1, 6.521% (1 Month USD LIBOR + 1.250%), 05-25-2037 (2) | | | 561,819 | | | | 430,477 | |
| MASTR Adjustable Rate Mortgages Trust | | | | | | | | |
| Series 2004-4, Class 2A3, 3.664%, 05-25-2034 (1) | | | 209,451 | | | | 189,819 | |
| Series 2005-6, Class 7A1, 3.721%, 06-25-2035 (1) | | | 315,299 | | | | 272,898 | |
| Series 2005-6, Class 5A1, 2.871%, 07-25-2035 (1) | | | 168,331 | | | | 141,158 | |
| Series 2005-7, Class 3A1, 3.483%, 09-25-2035 (1) | | | 356,938 | | | | 217,496 | |
| Series 2006-2, Class 2A1, 4.162%, 04-25-2036 (1) | | | 59,675 | | | | 32,877 | |
| Series 2006-OA1, Class 1A1, 5.055% (1 Month LIBOR USD + 0.210%), 04-25-2046 (2) | | | 172,881 | | | | 146,168 | |
| Series 2007-2, Class A1, 5.145% (1 Month LIBOR USD + 0.300%), 03-25-2047 (2) | | | 1,018,373 | | | | 863,312 | |
| MASTR Alternative Loan Trust | | | | | | | | |
| Series 2003-4, Class 3A1, 6.000%, 06-25-2033 | | | 18,813 | | | | 18,692 | |
| Series 2004-8, Class 1A1, 6.500%, 09-25-2034 | | | 29,016 | | | | 29,153 | |
| Series 2004-13, Class 10A3, 5.750%, 01-25-2035 | | | 496,947 | | | | 406,291 | |
| Series 2005-4, Class 5A1, 6.000%, 05-25-2035 | | | 646,287 | | | | 560,139 | |
| Series 2006-3, Class 2A2, 6.750%, 07-25-2036 | | | 1,065,181 | | | | 394,300 | |
| Series 2007-1, Class 2A7, 6.000%, 10-25-2036 | | | 983,524 | | | | 305,244 | |
| MASTR Alternative Loans Trust | | | | | | | | |
| Series 2003-6, Class 3A3, 6.000%, 09-25-2033 | | | 44,659 | | | | 42,471 | |
| Series 2004-12, Class 2A1, 6.500%, 12-25-2034 | | | 59,850 | | | | 57,921 | |
| MASTR Asset Securitization Trust | | | | | | | | |
| Series 2004-4, Class 1A7, 5.250%, 12-26-2033 | | | 237,103 | | | | 207,290 | |
| MASTR Resecuritization Trust | | | | | | | | |
| Series 2008-1, Class A1, 6.000%, 09-27-2037 (1)(3)(a) | | | 470,221 | | | | 312,109 | |
| Mello Mortgage Capital Acceptance Trust | | | | | | | | |
| Series 2021-INV2, Class A4, 2.500%, 08-25-2051 (1)(3) | | | 45,748 | | | | 39,313 | |
| Merrill Lynch Mortgage Backed Securities Trust | | | | | | | | |
| Series 2007-2, Class 1A1, 7.430% (1 Month USD LIBOR + 2.400%), 08-25-2036 (2) | | | 434,426 | | | | 374,249 | |
| MFRA Trust | | | | | | | | |
| Series 2020-NQM3, Class A1, 1.014%, 01-26-2065 (1)(3) | | | 19,389 | | | | 16,820 | |
| Series 2021-INV2, Class A1, 1.906%, 11-25-2056 (1)(3) | | | 165,932 | | | | 141,114 | |
| MLCC Mortgage Investors Inc | | | | | | | | |
| Series 2006-3, Class 2A1, 3.739%, 10-25-2036 (1) | | | 742,370 | | | | 626,848 | |
| Morgan Stanley Capital Inc | | | | | | | | |
| Series 2006-16AX, Class 1A, 5.185% (1 Month LIBOR USD + 0.340%), 11-25-2036 (2) | | | 2,961,283 | | | | 536,966 | |
| Morgan Stanley Mortgage Loan Trust | | | | | | | | |
| Series 2004-11AR, Class 1A2A, 5.155% (1 Month LIBOR USD + 0.310%), 01-25-2035 (2) | | | 90,735 | | | | 78,766 | |
| Series 2004-5AR, Class 2A, 3.543%, 07-25-2034 (1) | | | 32,258 | | | | 28,638 | |
The accompanying notes are an integral part of these financial statements.
Regan Total Return Income Fund
Schedule of Investments
March 31, 2023 (Unaudited)
| | | Principal
Amount | | | Value | |
| | | | | | | |
| Series 2005-10, Class 1A1, 5.545% (1 Month LIBOR USD + 0.700%), 12-25-2035 (2) | | $ | 310,582 | | | $ | 194,765 | |
| Series 2005-10, Class 1A5, 5.750%, 12-25-2035 | | | 30,509 | | | | 21,975 | |
| Series 2005-4, Class 4A, 4.637%, 08-25-2035 (1) | | | 36,346 | | | | 18,153 | |
| Series 2005-7, Class 7A6, 5.500%, 11-25-2035 | | | 141,441 | | | | 129,872 | |
| Series 2005-9AR, Class 2A, 4.134%, 12-25-2035 (1) | | | 347,492 | | | | 311,397 | |
| Series 2006-12XS, Class A4, 6.512%, 10-25-2036 (4) | | | 4,111,561 | | | | 976,677 | |
| Series 2006-17XS, Class A6, 6.077%, 10-25-2046 (4) | | | 1,989,580 | | | | 490,870 | |
| Series 2006-3AR, Class 2A3, 3.886%, 03-25-2036 (1) | | | 731,296 | | | | 473,455 | |
| Series 2006-7, Class 3A, 5.154%, 06-25-2036 (1) | | | 104,255 | | | | 69,279 | |
| Series 2007-10XS, Class A19, 6.000%, 02-25-2047 (1) | | | 549,283 | | | | 227,866 | |
| Series 2007-11AR, Class 2A3, 2.724%, 06-25-2037 (1)(a) | | | 449,147 | | | | 235,802 | |
| Series 2007-14AR, Class 3A3, 3.815%, 10-25-2037 (1) | | | 320,547 | | | | 287,598 | |
| Series 2007-7AX, Class 1A, 5.285% (1 Month LIBOR USD + 0.440%), 04-25-2037 (2) | | | 2,088,280 | | | | 513,542 | |
| Morgan Stanley ReRemic Trust | | | | | | | | |
| Series 2013-R3, Class 6B2, 3.489%, 12-29-2036 (1)(3) | | | 352,528 | | | | 293,241 | |
| MortgageIT Trust | | | | | | | | |
| Series 2005-1, Class 2A, 5.912% (1 Month LIBOR USD + 1.250%), 02-25-2035 (2) | | | 65,351 | | | | 61,214 | |
| New Residential Mortgage Loan Trust | | | | | | | | |
| Series 2019-NQM4, Class A2, 2.644%, 09-25-2059 (1)(3) | | | 210,846 | | | | 192,796 | |
| NMLT Trust | | | | | | | | |
| Series 2021-INV1, Class A1, 1.185%, 05-25-2056 (1)(3) | | | 1,878,769 | | | | 1,559,593 | |
| Nomura Asset Acceptance Corporation | | | | | | | | |
| Series 2005-WF1, Class 1A1, 5.653%, 03-25-2035 (1) | | | 24,972 | | | | 24,623 | |
| Series 2007-1, Class 1A1A, 5.995%, 03-25-2047 (4) | | | 835,245 | | | | 787,394 | |
| Series 2007-2, Class A1B, 6.017%, 04-25-2047 (1) | | | 1,236,292 | | | | 1,045,063 | |
| Series A-5, Class A5, 6.757%, 06-25-2036 (4) | | | 941,500 | | | | 261,817 | |
| Oceanview Mortgage Loan Trust | | | | | | | | |
| Series 2020-1, Class A1A, 1.733%, 05-31-2050 (1)(3) | | | 461,691 | | | | 415,161 | |
| Onslow Bay Financial LLC | | | | | | | | |
| Series 2021-INV2, Class A3, 2.500%, 10-25-2051 (1)(3) | | | 530,418 | | | | 429,224 | |
| Series 2021-NQM2, Class A1, 1.101%, 05-25-2061 (1)(3) | | | 3,964,312 | | | | 3,127,297 | |
| PHH Alternative Mortgage Trust | | | | | | | | |
| Series 2007-2, Class 3A1, 6.000%, 05-25-2037 | | | 264,356 | | | | 230,767 | |
| PHHMC Mortgage Pass Through Certificates | | | | | | | | |
| Series 2007-3, Class A3, 4.281%, 06-18-2037 (1) | | | 7,828 | | | | 7,376 | |
| Prime Mortgage Trust | | | | | | | | |
| Series 2005-4, Class 2A9, 5.500%, 10-25-2035 | | | 80,087 | | | | 73,011 | |
| Series 2006-1, Class 3A1, 5.195% (1 Month LIBOR USD + 0.350%), 06-25-2036 (2) | | | 1,615,193 | | | | 1,110,640 | |
| Series 2006-DR1, Class 2A2, 6.000%, 05-25-2035 (3) | | | 483,841 | | | | 396,355 | |
| PRKCM Trust | | | | | | | | |
| Series 2021-AFC2, Class A1, 2.071%, 11-25-2056 (1)(3) | | | 427,698 | | | | 354,633 | |
| RAAC Series | | | | | | | | |
| Series 2004-SP3, Class AI4, 5.739%, 09-25-2034 (4) | | | 361,286 | | | | 354,701 | |
| Series 2005-SP1, Class 1A1, 5.000%, 09-25-2034 | | | 135,858 | | | | 124,664 | |
| RBSGC Mortgage Pass Through Certificates | | | | | | | | |
| Series 2008-A, Class A1, 5.500%, 11-25-2035 (1)(3) | | | 258,733 | | | | 218,432 | |
| RBSSP Resecuritization Trust | | | | | | | | |
| Series 2009-12, Class 17A2, 3.990%, 10-26-2035 (1)(3) | | | 598,076 | | | | 563,671 | |
| Series 2009-12, Class 9A2, 3.852%, 03-26-2036 (1)(3) | | | 380,656 | | | | 335,573 | |
| Residential Accredit Loans, Inc. | | | | | | | | |
| Series 2005-QA9, Class CB11, 3.902%, 08-25-2035 (1) | | | 122,841 | | | | 103,181 | |
| Series 2005-QS10, Class 3A3, 5.500%, 08-25-2035 | | | 780,656 | | | | 576,878 | |
| Series 2005-QS11, Class A3, 0.155% (1 Month LIBOR USD + 5.000%), 07-25-2035 (2) | | | 398,207 | | | | 18,910 | |
| Series 2005-QS13, Class 2A3, 5.750%, 09-25-2035 | | | 2,170,503 | | | | 1,858,251 | |
| Series 2005-QS14, Class 3A3, 6.000%, 09-25-2035 | | | 393,110 | | | | 342,899 | |
| Series 2005-QS5, Class A1, 5.245% (1 Month LIBOR USD + 0.400%), 04-25-2035 (2) | | | 1,771,593 | | | | 1,365,514 | |
| Series 2005-QS7, Class A1, 5.500%, 06-25-2035 | | | 395,941 | | | | 328,353 | |
The accompanying notes are an integral part of these financial statements.
Regan Total Return Income Fund
Schedule of Investments
March 31, 2023 (Unaudited)
| | | Principal
Amount | | | Value | |
| | | | | | | |
| Series 2006-QS1, Class A5, 5.755% (1 Month LIBOR USD + 0.910%), 01-25-2036 (2) | | $ | 456,735 | | | $ | 322,102 | |
| Series 2006-QS12, Class 2A7, 5.495% (1 Month LIBOR USD + 0.650%), 09-25-2036 (2) | | | 358,539 | | | | 243,130 | |
| Series 2006-QS13, Class 1A10, 6.000%, 09-25-2036 | | | 550,294 | | | | 414,957 | |
| Series 2006-QS2, Class 1A2, 5.345% (1 Month LIBOR USD + 0.500%), 02-25-2036 (2) | | | 420,660 | | | | 302,992 | |
| Series 2006-QS2, Class 1A17, 5.325% (1 Month LIBOR USD + 0.480%), 02-25-2036 (2) | | | 552,768 | | | | 397,766 | |
| Series 2006-QS2, Class 1A7, 6.000%, 02-25-2036 (a) | | | 271,920 | | | | 41,876 | |
| Series 2006-QS4, Class A8, 8.000% (1 Month USD LIBOR + 5,143.000%), 04-25-2036 (2) | | | 70,026 | | | | 60,457 | |
| Series 2007-QS1, Class 1A5, 5.395% (1 Month LIBOR USD + 0.550%), 01-25-2037 (2) | | | 3,189,099 | | | | 2,204,873 | |
| Series 2007-QS1, Class 2A2, 5.205% (1 Month LIBOR USD + 0.360%), 01-25-2037 (2) | | | 659,494 | | | | 433,924 | |
| Series 2007-QS5, Class A1, 5.500%, 03-25-2037 | | | 623,575 | | | | 475,673 | |
| Series 2007-QS8, Class A3, 5.445% (1 Month USD LIBOR + 0.600%), 06-25-2037 (2) | | | 292,000 | | | | 198,675 | |
| Residential Asset Securitization Trust | | | | | | | | |
| Series 2005-A15, Class 2A12, 6.000%, 02-25-2036 | | | 738,948 | | | | 336,568 | |
| Series 2005-A15, Class 4A1, 6.000%, 02-25-2036 | | | 2,286,563 | | | | 766,434 | |
| Series 2006-A10, Class A4, 6.500%, 09-25-2036 | | | 525,327 | | | | 190,931 | |
| Series 2006-A10, Class A5, 6.500%, 09-25-2036 | | | 983,295 | | | | 357,379 | |
| Series 2006-A2, Class A11, 6.000%, 01-25-2046 | | | 1,713,205 | | | | 741,351 | |
| Series 2006-A2, Class A7, 6.000%, 05-25-2036 | | | 858,239 | | | | 369,641 | |
| Series 2006-A7CB, Class 2A5, 5.095% (1 Month USD LIBOR + 0.250%), 07-25-2036 (2) | | | 427,194 | | | | 75,351 | |
| Series 2006-A8, Class 2A2, 6.750%, 08-25-2036 | | | 2,000,659 | | | | 623,994 | |
| Series 2006-A8, Class 3A8, 5.595% (1 Month LIBOR USD + 0.750%), 08-25-2036 (2) | | | 507,492 | | | | 205,794 | |
| Series 2007-A3, Class 1A1, 5.295% (1 Month USD LIBOR + 0.450%), 04-25-2037 (2) | | | 2,012,457 | | | | 770,662 | |
| Residential Asset Securitization Trust 2005-A12 | | | | | | | | |
| Series 2005-A12, Class A3, 5.500%, 11-25-2035 | | | 1,931,783 | | | | 1,050,400 | |
| Residential Asset Securitization Trust 2005-A9 | | | | | | | | |
| Series 2005-A9, Class A3, 5.500%, 07-25-2035 | | | 2,439,131 | | | | 1,516,330 | |
| Residential Asset Securitization Trust 2006-A8 | | | | | | | | |
| Series 2006-A8, Class 2A3, 6.000%, 08-25-2036 | | | 911,918 | | | | 252,820 | |
| Series 2006-A8, Class 2A4, 6.500%, 08-25-2036 | | | 633,926 | | | | 190,395 | |
| Residential Asset Securitization Trust 2007-A2 | | | | | | | | |
| Series 2007-A2, Class 1A6, 6.000%, 04-25-2037 | | | 1,595,125 | | | | 934,007 | |
| Residential Funding Mtg Sec I | | | | | | | | |
| Series 2006-S12, Class 3A7, 5.750%, 12-25-2036 | | | 136,728 | | | | 115,817 | |
| Series 2007-S6, Class 2A4, 6.000%, 06-25-2037 | | | 1,421,721 | | | | 1,071,728 | |
| Series 2007-SA3, Class 2A1, 4.524%, 07-25-2037 (1) | | | 518,977 | | | | 401,525 | |
| Series 2007-SA4, Class 3A1, 4.849%, 10-25-2037 (1) | | | 117,029 | | | | 82,932 | |
| Salomon Brothers Mortgage Securities VII | | | | | | | | |
| Series 1997-HUD1, Class A4, 3.071%, 12-25-2030 (1)(a) | | | 225,370 | | | | 135,357 | |
| Sequoia Mortgage Trust | | | | | | | | |
| Series 2007-3, Class 2BA1, 3.314%, 07-20-2037 (1) | | | 885,174 | | | | 661,710 | |
| Series 2013-5, Class A1, 2.500%, 05-25-2043 (1)(3) | | | 234,489 | | | | 200,256 | |
| Series 2013-9, Class AP, , 07-25-2043 (3) | | | 250,828 | | | | 178,370 | |
| Series 2014-1, Class 2A5, 4.000%, 04-25-2044 (1)(3) | | | 99,887 | | | | 95,144 | |
| Series 2015-3, Class A1, 3.500%, 07-25-2045 (1)(3) | | | 524,272 | | | | 474,806 | |
| Series 2018-CH3, Class A2, 4.000%, 08-25-2048 (1)(3) | | | 260,224 | | | | 252,396 | |
| Series 2018-CH3, Class A19, 4.500%, 08-25-2048 (1)(3)(a) | | | 29,301 | | | | 26,371 | |
| Small Business Administration Pools | | | | | | | | |
| Series 510847, 7.575% (PRIME + 0.075%), 09-25-2037 (2)(a) | | | 72,948 | | | | 76,459 | |
| Starwood Mortgage Residential Trust | | | | | | | | |
| Series 2020-3, Class A1, 1.486%, 04-25-2065 (1)(3) | | | 236,891 | | | | 221,629 | |
| Structured Adjustable Rate Mortgage Loan Trust | | | | | | | | |
| Series 2005-17, Class 5A1, 4.697%, 08-25-2035 (1) | | | 512,318 | | | | 298,445 | |
| Series 2005-18, Class 1A1, 3.635%, 09-25-2035 (1) | | | 698,590 | | | | 496,188 | |
| Series 2005-20, Class 1A1, 4.928%, 10-25-2035 (1) | | | 543,151 | | | | 487,135 | |
| Series 2005-23, Class 3A1, 4.115%, 01-25-2036 (1) | | | 94,637 | | | | 56,991 | |
| Series 2007-3, Class 2A1, 3.587%, 04-25-2037 (1) | | | 330,064 | | | | 295,773 | |
| Series 2007-7, Class 1A1, 5.445% (1 Month LIBOR USD + 0.600%), 08-25-2037 (2) | | | 37,817 | | | | 30,840 | |
The accompanying notes are an integral part of these financial statements.
Regan Total Return Income Fund
Schedule of Investments
March 31, 2023 (Unaudited)
| | | Principal
Amount | | | Value | |
| | | | | | | |
| Structured Asset Mortgage Investments Inc | | | | | | | | |
| Series 2006-AR3, Class 3A1, 5.305% (1 Month LIBOR USD + 0.460%), 02-25-2036 (2) | | $ | 666,848 | | | $ | 514,806 | |
| Series 2006-AR3, Class 22A1, 3.448%, 05-25-2036 (1) | | | 435,332 | | | | 231,817 | |
| Series 2006-AR3, Class 21A1, 5.245% (1 Month LIBOR USD + 0.400%), 05-25-2036 (2) | | | 868,794 | | | | 661,142 | |
| Series 2006-AR5, Class 3A1, 5.265% (1 Month LIBOR USD + 0.420%), 05-25-2036 (2) | | | 2,000,424 | | | | 854,990 | |
| Structured Asset Securities Corporation | | | | | | | | |
| Series 2003-37A, Class 2A, 3.933%, 12-25-2033 (1) | | | 49,283 | | | | 44,855 | |
| Suntrust Adjustable Rate Mortgage Loan Trust | | | | | | | | |
| Series 2007-2, Class 2A1, 4.102%, 04-25-2037 (1) | | | 170,401 | | | | 99,756 | |
| Series 2007-4, Class 2A1, 3.653%, 10-25-2037 (1) | | | 141,905 | | | | 108,003 | |
| TBW Mortgage Backed Pass Through Certificates | | | | | | | | |
| Series 2006-3, Class 2A1, 6.500%, 07-25-2036 | | | 878,625 | | | | 330,614 | |
| Terwin Mortgage Trust | | | | | | | | |
| Series 2004-19HE, Class A1, 5.585% (1 Month LIBOR USD + 0.740%), 10-25-2034 (2)(3) | | | 453,347 | | | | 421,266 | |
| Thornburg Mortgage Securities Trust | | | | | | | | |
| Series 2005-1, Class A2, 3.673%, 04-25-2045 (1) | | | 198,686 | | | | 185,947 | |
| TIAA Bank Mortgage Loan Trust | | | | | | | | |
| Series 2018-3, Class A13, 4.000%, 11-25-2048 (1)(3) | | | 167,289 | | | | 156,038 | |
| Verus Securitization Trust | | | | | | | | |
| Series 2021-1, Class A2, 1.052%, 01-25-2066 (1)(3)(a) | | | 125,499 | | | | 96,006 | |
| Washington Mutual Mortgage Pass-Through Certificates | | | | | | | | |
| Series 2004-A11, Class A, 4.181%, 10-25-2034 (1) | | | 141,032 | | | | 125,185 | |
| Series 2004-AR9, Class B1, 3.896%, 08-25-2034 (1) | | | 176,945 | | | | 154,908 | |
| Series 2004-S1, Class 1A11, 5.500%, 03-25-2034 | | | 30,300 | | | | 29,469 | |
| Series 2005-1, Class 1A1, 5.500%, 03-25-2035 | | | 1,069,969 | | | | 981,367 | |
| Series 2005-7, Class 2CB4, 5.500%, 08-25-2035 | | | 542,944 | | | | 520,498 | |
| Series 2005-AR12, Class 1A4, 3.806%, 10-25-2035 (1) | | | 32,169 | | | | 28,876 | |
| Series 2005-AR2, Class 2A3, 5.545% (1 Month LIBOR USD + 0.700%), 01-25-2045 (2) | | | 64,023 | | | | 60,628 | |
| Series 2005-AR5, Class A6, 3.312%, 05-25-2035 (1) | | | 129,710 | | | | 124,901 | |
| Series 2006-4, Class 3A3, 6.467%, 05-25-2036 (4) | | | 213,467 | | | | 189,612 | |
| Series 2006-5, Class 4A1, 6.000%, 06-25-2023 (a) | | | 1,636,700 | | | | 166,943 | |
| Series 2006-AR10, Class A2B, 5.265% (1 Month USD LIBOR + 0.420%), 12-25-2036 (2) | | | 663,169 | | | | 112,176 | |
| Series 2006-AR14, Class 1A4, 3.342%, 11-25-2036 (1) | | | 141,567 | | | | 117,172 | |
| Series 2006-AR14, Class 2A3, 3.350%, 11-25-2036 (1) | | | 795,566 | | | | 694,952 | |
| Series 2006-AR2, Class 2A1, 3.651%, 03-25-2036 (1) | | | 92,814 | | | | 79,161 | |
| Series 2006-AR7, Class 3A, 4.186% (12 Month US Treasury Average + 1.048%), 07-25-2046 (2)(a) | | | 132,066 | | | | 91,785 | |
| Series 2007-HY1, Class 1A1, 3.652%, 02-25-2037 (1) | | | 182,103 | | | | 152,050 | |
| Wells Fargo Alternative Loan Trust | | | | | | | | |
| Series 2007-PA3, Class 1A4, 5.750%, 07-25-2037 | | | 294,814 | | | | 239,368 | |
| Series 2007-PA6, Class A1, 4.294%, 12-28-2037 (1)(a) | | | 111,513 | | | | 95,177 | |
| Wells Fargo Mortgage Backed Securities Trust | | | | | | | | |
| Series 2006-AR12, Class 2A1, 4.449%, 09-25-2036 (1) | | | 107,249 | | | | 100,093 | |
| Series 2006-AR14, Class 2A3, 4.512%, 10-25-2036 (1) | | | 70,937 | | | | 60,188 | |
| Series 2007-AR3, Class A4, 4.539%, 04-25-2037 (1) | | | 457,291 | | | | 382,881 | |
| Series 2007-7, Class A38, 6.000%, 06-25-2037 (a) | | | 49,907 | | | | 39,078 | |
| Series 2018-1, Class A1, 3.500%, 07-25-2047 (1)(3) | | | 30,647 | | | | 27,567 | |
| Winwater Mortgage Loan Trust | | | | | | | | |
| Series 2015-A, Class A3, 3.500%, 06-20-2045 (1)(3) | | | 253,824 | | | | 230,803 | |
| Yale Mortgage Loan Trust | | | | | | | | |
| Series 2007-1, Class A, 5.245% (1 Month USD LIBOR + 0.400%), 06-25-2037 (2)(3) | | | 84,297 | | | | 27,425 | |
| TOTAL MORTGAGE BACKED SECURITIES — NON AGENCY | | | | | | | | |
| (Cost $184,017,841) | | | | | | $ | 172,696,959 | |
| | | | | | | | | |
| MORTGAGE BACKED SECURITIES — U.S. GOVERNMENT AGENCY — 2.7% | | | | | | | | |
| Fannie Mae Interest Strip | | | | | | | | |
| Series 328 1, Class 1, 0.00%, 12-25-2032 | | | 949,634 | | | | 806,972 | |
| Fannie Mae REMICS | | | | | | | | |
| Series 2002-26B, Class A3, 4.686%, 06-25-2041 (2) | | | 807,768 | | | | 750,633 | |
The accompanying notes are an integral part of these financial statements.
Regan Total Return Income Fund
Schedule of Investments
March 31, 2023 (Unaudited)
| | | Principal
Amount | | | Value | |
| | | | | | | |
| Series 2003-25, Class KP, 5.000%, 04-25-2033 | | $ | 8,607 | | | $ | 8,607 | |
| Series 2010-41, Class OP, 0.000% , 05-25-2040 | | | 1,570,778 | | | | 1,311,209 | |
| Series 2010-41, Class DC, 4.500%, 05-25-2025 | | | 9,202 | | | | 9,078 | |
| Series 2012-111, Class UC, 1.350%, 10-25-2027 | | | 31,136 | | | | 29,258 | |
| Series 2012-146, Class QA, 1.000%, 01-25-2043 | | | 17,431 | | | | 13,161 | |
| Series 2015-87, Class BF, 5.145% (1 Month LIBOR USD + 0.300%), 12-25-2045 (2) | | | 12,545 | | | | 11,736 | |
| Series 2018-94, Class KD, 3.500%, 12-25-2048 | | | 16,866 | | | | 14,209 | |
| Series 2019-24, Class NJ, 2.500%, 05-25-2049 | | | 968,888 | | | | 818,105 | |
| FannieMae Grantor Trust | | | | | | | | |
| Series 2002-T16, Class A4, 4.693%, 05-25-2042 (1) | | | 22,095 | | | | 21,320 | |
| Series 2002-T4, Class A3, 7.500%, 12-25-2041 | | | 154,536 | | | | 164,766 | |
| Series 2004-T5, Class A13, 5.217%, 05-28-2035 (1) | | | 961,775 | | | | 887,057 | |
| Series 2004-T5, Class AB7, 4.747%, 05-28-2035 (1) | | | 374,936 | | | | 342,114 | |
| FannieMae Whole Loan | | | | | | | | |
| Series 2002-W8, Class A2, 7.000%, 06-25-2042 | | | 160,112 | | | | 169,594 | |
| Series 2003-W6, Class F, 4.967% (1 Month LIBOR USD + 0.350%), 09-25-2042 (2) | | | 57,913 | | | | 53,949 | |
| FHLMC Structured Pass Through Securities | | | | | | | | |
| Series T-076 2A, Class 2A, 2.012%, 10-25-2037 (1) | | | 251,603 | | | | 231,223 | |
| Series T-41, Class 2A, 4.760%, 07-25-2032 (1) | | | 13,694 | | | | 12,359 | |
| Series T-42 A5, Class A5, 7.500%, 02-25-2042 | | | 147,759 | | | | 152,164 | |
| Series T-57 1A2, Class 1A2, 7.000%, 07-25-2043 | | | 290,293 | | | | 309,370 | |
| Freddie Mac | | | | | | | | |
| Series 2629, Class DB, 5.000%, 06-15-2023 | | | 3,862 | | | | 3,850 | |
| Series 3202, Class HF, 5.034% (1 Month LIBOR USD + 0.350%), 08-15-2036 (2) | | | 13,528 | | | | 12,715 | |
| Series 3378, Class FA, 5.264% (1 Month LIBOR USD + 0.580%), 06-15-2037 (2) | | | 10,526 | | | | 9,921 | |
| Series 4076, Class QB, 1.750%, 11-15-2041 | | | 128,406 | | | | 121,901 | |
| Series 4171, Class NG, 2.000%, 06-15-2042 | | | 21,089 | | | | 18,777 | |
| Series 4182, Class UC, 1.500%, 09-15-2027 | | | 8,908 | | | | 8,543 | |
| Series 4265, Class FD, 5.084% (1 Month LIBOR USD + 0.400%), 01-15-2035 (2) | | | 33,122 | | | | 32,645 | |
| Series 4582, Class GA, 3.750%, 03-15-2052 (4) | | | 11,533 | | | | 11,495 | |
| Series 4921, Class NB, 1.750%, 08-25-2049 | | | 266,525 | | | | 223,354 | |
| Series 4943, Class JP, 2.500%, 09-25-2049 | | | 402,409 | | | | 359,068 | |
| Series 5020, Class HA, 1.000%, 08-25-2050 | | | 951,764 | | | | 738,457 | |
| Series 5068, Class AB, 1.000%, 11-25-2050 | | | 473,165 | | | | 357,731 | |
| Freddie Mac STRIP | | | | | | | | |
| Series 237, Class PO, 0.000%, 05-15-2036 | | | 1,013,931 | | | | 822,804 | |
| Freddie Mac Whole Loan Securities Trust | | | | | | | | |
| Series 2017-SC02, Class 2A, 3.500%, 05-25-2047 | | | 28,244 | | | | 25,424 | |
| Government National Mortgage Association | | | | | | | | |
| Series 2010-147, Class PG, 3.500%, 05-20-2040 | | | 59,630 | | | | 57,728 | |
| Series 2014-21, Class DA, 2.000%, 04-16-2026 | | | 10,066 | | | | 9,778 | |
| Series 2019-043, Class SQ, 1.289% (1 Month LIBOR USD + 6.050%), 04-20-2049 (2) | | | 3,165,937 | | | | 175,783 | |
| Series 2022-179, Class IO, 2.500%, 09-20-2051 | | | 1,513,258 | | | | 201,549 | |
| | | | | | | | 9,308,407 | |
| TOTAL MORTGAGE BACKED SECURITIES — U.S. GOVERNMENT AGENCY | | | | | | | | |
| (Cost $9,446,420) | | | | | | $ | 9,308,407 | |
| MORTGAGE SECURED NOTE — 0.2% | | | | | | | | |
| KORTH DIRECT MORTGAGE | | | | | | | | |
| Series 2021 B, 12.500%, 01-25-2027 (3) | | | 800,000 | | | | 792,000 | |
| TOTAL MORTGAGE SECURED NOTE | | | | | | | | |
| (Cost $800,000) | | | | | | $ | 792,000 | |
| MONEY MARKET FUNDS — 5.8% | | | | | | | | |
| First American Government Obligations Fund — 4.653% (b) | | | 20,154,604 | | | | 20,154,604 | |
| TOTAL MONEY MARKET FUNDS | | | | | | | | |
| (Cost $20,154,604) | | | | | | $ | 20,154,604 | |
The accompanying notes are an integral part of these financial statements.
Regan Total Return Income Fund
Schedule of Investments
March 31, 2023 (Unaudited)
| | | Principal
Amount | | | Value | |
| | | | | | | |
| U.S. TREASURY BILL — 16.3% | | | | | | | | |
| 0.00%, 4/20/2023 | | $ | 5,000,000 | | | $ | 4,988,956 | |
| 0.00%, 4/13/2023 | | | 8,000,000 | | | | 7,990,028 | |
| 0.00%, 8/17/2023 | | | 4,000,000 | | | | 3,929,076 | |
| 0.00%, 8/31/2023 | | | 9,000,000 | | | | 8,824,400 | |
| 0.00%, 5/11/2023 | | | 3,000,000 | | | | 2,985,433 | |
| 0.00%, 7/6/2023 | | | 13,000,000 | | | | 12,841,134 | |
| 0.00%, 5/9/2023 | | | 5,000,000 | | | | 4,977,213 | |
| 0.00%, 7/5/2023 | | | 5,000,000 | | | | 4,939,340 | |
| 0.00%, 7/25/2023 | | | 5,000,000 | | | | 4,926,338 | |
| TOTAL U.S. TREASURY BILLS | | | | | | | | |
| (Cost $56,375,179) | | | | | | $ | 56,401,918 | |
| TOTAL SHORT TERM INVESTMENTS | | | | | | | | |
| (Cost $76,529,783) | | | | | | $ | 76,556,522 | |
| TOTAL INVESTMENTS — 99.7% | | | | | | | | |
| (Cost $360,368,554) | | | | | | | 344,836,401 | |
| Other Assets in Excess of Liabilities — 0.3% | | | | | | | 1,159,927 | |
| TOTAL NET ASSETS — 100.0% | | | | | | $ | 345,996,328 | |
| (1) | Variable Rate Security. The Coupon is based on an underlying pool of loans and represents the rate in effect as of March 31, 2023. |
| (2) | Floating Rate Security based on a reference index and spread. The rate reported is the rate in effect as of March 31, 2023. |
| (3) | Restricted security deemed liquid. The total market value of these securities was $53,718,070 (15.50% of total net assets) as of March 31, 2023. |
| (4) | Step-up bond. The interest rate will step up if the issuer does not redeem the bond by an expected redemption date. The interest rate shown is the rate in effect as of March 31, 2023. |
| (a) | Value determined using unobservable inputs. |
| (b) | The rate quoted is the annualized seven-day effective yield as of March 31, 2023. |
The accompanying notes are an integral part of these financial statements.
Regan Total Return Income Fund
Statement of Assets and Liabilities
March 31, 2023 (Unaudited)
| Assets | | | |
| Investments, at value (cost $360,368,554) | | $ | 344,836,401 | |
| Cash | | | 147,080 | |
| Interest Receivable | | | 1,549,118 | |
| Receivable for capital shares sold | | | 1,025,708 | |
| Receivable for investments sold | | | 4,432 | |
| Other assets | | | 85,284 | |
| Total Assets | | | 347,648,023 | |
| | | | | |
| Liabilities | | | | |
| Payable for capital shares redeemed | | | 1,198,329 | |
| Distribution fees - Investor Class | | | 3,431 | |
| Payable to Advisor | | | 273,611 | |
| Payable for professional fees | | | 9,739 | |
| Payable for administration and accounting | | | 80,991 | |
| Payable for directors fees | | | 659 | |
| Payable to custodian | | | 6,604 | |
| Payable for transfer agent fees | | | 33,667 | |
| Accrued Shareholder Servicing Fees | | | 34,782 | |
| Accrued expenses and other liabilities | | | 9,882 | |
| Total Liabilities | | | 1,651,695 | |
| | | | | |
| Net Assets | | $ | 345,996,328 | |
| | | | | |
| Components of Net Assets | | | | |
| Paid-in capital | | $ | 343,249,498 | |
| Total distributable earnings | | | 2,746,830 | |
| Net Assets | | $ | 345,996,328 | |
| | | | | |
| Institutional Class: | | | | |
| Net assets | | $ | 333,049,813 | |
| Shares outstanding (unlimited number of shares authorized, no par value) | | | 35,944,278 | |
| Net asset value, offering and redemption price per share | | $ | 9.27 | |
| | | | | |
| Investor Class: | | | | |
| Net assets | | $ | 12,946,515 | |
| Shares outstanding (unlimited number of shares authorized, no par value) | | | 1,386,522 | |
| Net asset value, offering and redemption price per share | | $ | 9.34 | |
The accompanying notes are an integral part of these financial statements.
| Regan Total Return Income Fund | | | |
| STATEMENT OF OPERATIONS (Unaudited) | | | |
| For the Period Ended March 31, 2023 | | | |
| | | | |
| | | | |
| Investment Income | | | |
| Interest income | | $ | 10,773,398 | |
| | | | | |
| Expenses | | | | |
| Advisory fees | | | 1,156,647 | |
| Administration fees (Note 3) | | | 144,408 | |
| Shareholder servicing fees (Note 6) | | | 129,960 | |
| Fees recaptured by Adviser (Note 3) | | | 92,612 | |
| Transfer agent fees and expenses (Note 3) | | | 51,587 | |
| Registration fees | | | 45,979 | |
| Custody fees (Note 3) | | | 19,947 | |
| Distribution fees - Investor Class (Note 7) | | | 13,056 | |
| Legal fees | | | 12,395 | |
| Audit fees | | | 9,766 | |
| Trustees' fees | | | 6,798 | |
| Shareholder reporting fees | | | 6,304 | |
| Compliance fees (Note 3) | | | 5,627 | |
| Insurance expense | | | 3,966 | |
| Miscellaneous expenses | | | 3,489 | |
Total Expenses | | | 1,702,541 | |
| | | | | |
| Net Investment Income | | | 9,070,857 | |
| | | | | |
| Realized and Unrealized Gain (Loss) on Investments | | | | |
Net realized loss on Investments | | | 348,009 | |
Change in unrealized appreciation/depreciation on investments | | | (1,696,765 | ) |
| Net Realized and Unrealized Loss on Investments | | | (1,348,756 | ) |
| | | | | |
| Net decrease in Net Assets from Operations | | $ | 7,722,101 | |
| | | | | |
| The accompanying notes are an integral part of these financial statements. | |
Regan Total Return Income Fund
Statements of Changes in Net Assets
| | | For the Six Months Ended March 31, 2023 (Unaudited) | | | Year Ended September 30, 2022 | |
| Operations | | | | | | | | |
| Net investment income | | $ | 9,070,857 | | | $ | 9,533,421 | |
| Net realized gain (loss) on investments | | | 348,009 | | | | (397,007 | ) |
| Change in unrealized appreciation/depreciation on investments | | | (1,696,795 | ) | | | (13,120,688 | ) |
| Net Increase (decrease) in Net Assets from Operations | | | 7,722,101 | | | | (3,984,274 | ) |
| | | | | | | | | |
| Distributions to Shareholders | | | | | | | | |
| From distributable earnings | | | | | | | | |
| Institutional Class | | | (8,075,838 | ) | | | (6,759,171 | ) |
| Investor Class | | | (311,344 | ) | | | (141,976 | ) |
| Return of Capital | | | | | | | | |
| Institutional Class | | | — | | | | (3,094,686 | ) |
| Investor Class | | | — | | | | (65,004 | ) |
| Total Distributions to Shareholders | | | (8,387,182 | ) | | | (10,060,837 | ) |
| | | | | | | | | |
| Capital Share Transactions | | | | | | | | |
| Proceeds from shares sold | | | | | | | | |
| Institutional Class | | | 190,354,718 | | | | 222,169,607 | |
| Investor Class | | | 10,180,087 | | | | 7,584,807 | |
| Proceeds from shares reinvested | | | | | | | | |
| Institutional Class | | | 6,678,512 | | | | 8,084,876 | |
| Investor Class | | | 306,388 | | | | 196,460 | |
| Cost of shares redeemed | | | | | | | | |
| Institutional Class | | | (43,923,299 | ) | | | (88,176,330 | ) |
| Investor Class | | | (2,565,620 | ) | | | (3,282,123 | ) |
| Net Increase in Net Assets from Capital Share Transactions | | | 161,030,786 | | | | 146,577,297 | |
| Total Increase in Net Assets | | | 160,365,705 | | | | 132,532,186 | |
| | | | | | | | | |
| Net Assets | | | | | | | | |
| Beginning of period | | | 185,630,623 | | | | 53,098,437 | |
| End of period | | $ | 345,996,328 | | | $ | 185,630,623 | |
| | | | | | | | | |
| Capital Shares Transactions | | | | | | | | |
| Institutional Class | | | | | | | | |
| Shares Sold | | | 20,494,752 | | | | 5,944,500 | |
| Shares reinvested | | | 725,041 | | | | 182,918 | |
| Shares redeemed | | | (4,724,189 | ) | | | (1,035,919 | ) |
| Net increase in shares outstanding | | | 16,495,604 | | | | 5,091,499 | |
| Investor Class | | | | | | | | |
| Shares Sold | | | 1,089,315 | | | | 76,600 | |
| Shares reinvested | | | 33,004 | | | | 3,671 | |
| Shares redeemed | | | (273,401 | ) | | | (1,552 | ) |
| Net increase in shares outstanding | | | 848,918 | | | | 78,719 | |
The accompanying notes are an integral part of these financial statements.
| Regan Total Return Income Fund | | | | | | | | | | | |
Financial Highlights | | | | | | | | | | | |
Institutional Class | | | | | | | | | | | |
| | | | | | | | | | | | |
| | | | | | | | | | | | |
| For a Capital Share Outstanding Throughout Each Year Presented: | | | | | | | | | | | |
| | | For the Six Months
Ended
March 31, 2023 (Unaudited) | | | For the Year Ended
September 30, 2022 | | | For the Year Ended
September 30, 2021 | | (1 | ) |
| Net Asset Value, Beginning of Period | | $ | 9.29 | | | $ | 10.27 | | | $ | 10.00 | | | |
| | | | | | | | | | | | | | | |
| Gain from Investment Operations: | | | | | | | | | | | | | | |
Net investment income (2) | | | 0.32 | | | | 0.74 | | | | 0.95 | | | |
| Net realized and unrealized loss on investments | | | (0.07 | ) | | | (0.89 | ) | | | 0.49 | | | |
| Total Gain (Loss) from Investment Operations | | | 0.25 | | | | (0.15 | ) | | | 1.44 | | | |
| | | | | | | | | | | | | | | |
| Less Distributions: | | | | | | | | | | | | | | |
| From net investment income | | | (0.27 | ) | | | (0.45 | ) | | | (0.82 | ) | (3 | ) |
| From net realized gain on investments | | | - | | | | (0.02 | ) | | | (0.06 | ) | | |
| | | -
| | | | (0.36
| )
| | | (0.29
| )
| (3
| ) |
| | | (0.27
| )
| | | (0.83
| )
| | | (1.17
| ) | | |
| Net Asset Value, End of Period | | $ | 9.27 | | | $ | 9.29 | | | $ | 10.27 | | | |
| | | | | | | | | | | | | | | |
Total Return (4) | | | 2.76 | % | | | (1.65 | )% | | | 14.96 | % | | |
| | | | | | | | | | | | | | | |
| Supplemental Data and Ratios: | | | | | | | | | | | | | | |
Net assets, end of year (in thousands) | | $ | 333,050 | | | $ | 180,600 | | | $ | 52,283 | | | |
Ratio of expenses to average net assets | | | | | | | | | | | | | | |
Before fees waived and reimbursed by the Adviser (5) | | | 1.30 | % | | | 1.40 | % | | | 2.56 | % | | |
After fees waived and reimbursed by the Adviser (5) | | | 1.30 | % | | | 1.30 | % | | | 1.28 | % | | |
Ratio of net investment income to average net assets | | | | | | | | | | | | | | |
After fees waived and reimbursed by the Adviser (5) | | | 6.98 | % | | | 7.61 | % | | | 9.15 | % | | |
Portfolio turnover rate (4)(6) | | | 14.40 | % | | | 62.88 | % | | | 88.09 | % | | |
(1) | Inception date of the Fund was October 1, 2020. | | | | | | | |
(2) | Per share amounts have been calculated using the average shares method. | | | | | |
(3) | Amount does not accord to the Fund's annual report dated September 30, 2021 due to revisions to the tax | |
| | characterization of distributions that were made after the issuance of the annual report. The revisions were | |
| | the result of the Fund’s election to defer accretion on market discount until disposition. | | | |
(4) | Not annualized. | | | | | | | | |
(5) | Annualized | | | | | | | | |
(6) | Portfolio turnover rate is calculated for the Fund without distinguishing between classes. | | | |
| The accompanying notes are an integral part of these financial statements. |
| Regan Total Return Income Fund | | | | | | | | | | | |
Financial Highlights | | | | | | | | | | | |
Investor Class | | | | | | | | | | | |
| | | | | | | | | | | | |
| | | | | | | | | | | | |
| For a Capital Share Outstanding Throughout Each Year Presented: | | | | | | | | | | | |
| | | For the Six Months
Ended
March 31, 2023 (Unaudited) | | | For the Year Ended
September 30, 2022 | | | For the Year Ended
September 30, 2021 | | (1 | ) |
| Net Asset Value, Beginning of Period | | $ | 9.36 | | | $ | 10.36 | | | $ | 10.00 | | | |
| | | | | | | | | | | | | | | |
| Gain from Investment Operations: | | | | | | | | | | | | | | |
Net investment income (2) | | | 0.32 | | | | 0.72 | | | | 1.03 | | | |
| Net realized and unrealized loss on investments | | | (0.08 | ) | | | (0.90 | ) | | | 0.41 | | | |
| Total Gain (Loss) from Investment Operations | | | 0.24 | | | | (0.18 | ) | | | 1.44 | | | |
| | | | | | | | | | | | | | | |
| Less Distributions: | | | | | | | | | | | | | | |
| From net investment income | | | (0.26 | ) | | | (0.44 | ) | | | (0.75 | ) | (3 | ) |
| From net realized gain on investments | | | - | | | | (0.02 | ) | | | (0.06 | ) | | |
| From return of capital | | | - | | | | (0.36 | ) | | | (0.27 | ) | (3 | ) |
| Total distributions | | | (0.26 | ) | | | (0.82 | ) | | | (1.08 | ) | | |
| Net Asset Value, End of Period | | $ | 9.34 | | | $ | 9.36 | | | $ | 10.36 | | | |
| | | | | | | | | | | | | | | |
Total Return (4) | | | 2.62 | % | | | (1.91 | )% | | | 14.72 | % | | |
| | | | | | | | | | | | | | | |
| Supplemental Data and Ratios: | | | | | | | | | | | | | | |
Net assets, end of year (in thousands) | | $ | 12,947 | | | $ | 5,031 | | | $ | 816 | | | |
Ratio of expenses to average net assets | | | | | | | | | | | | | | |
Before fees waived and reimbursed by the Adviser (5) | | | 1.55 | % | | | 1.67 | % | | | 5.23 | % | | |
After fees waived and reimbursed by the Adviser (5) | | | 1.55 | % | | | 1.54 | % | | | 1.53 | % | | |
Ratio of net investment income to average net assets | | | | | | | | | | | | | | |
After fees waived and reimbursed by the Adviser (5) | | | 6.91 | % | | | 7.36 | % | | | 9.89 | % | | |
Portfolio turnover rate (4)(6) | | | 14.40 | % | | | 62.88 | % | | | 88.09 | % | | |
(1) | Inception date of the Fund was October 1, 2020. | | | | | | | | |
(2) | Per share amounts have been calculated using the average shares method. | | | | | |
(3) | Amount does not accord to the Fund's annual report dated September 30, 2021 due to revisions to the tax | |
| | characterization of distributions that were made after the issuance of the annual report. The revisions were | |
| | the result of the Fund’s election to defer accretion on market discount until disposition. | | | |
(4) | Not annualized. | | | | | | | | | | |
(5) | Annualized | | | | | | | | | | |
(6) | Portfolio turnover rate is calculated for the Fund without distinguishing between classes. | | | |
| | | | | | | | | | | | |
| | | | | | | | | | | | |
| | | | | | | | | | | | |
| The accompanying notes are an integral part of these financial statements. |
Regan Total Return Income Fund
Notes to Financial Statements
March 31, 2023 (Unaudited)
NOTE 1 – ORGANIZATION
Regan Total Return Income Fund (the “Fund”) is a diversified series of Trust for Advised Portfolios (the “Trust”). The Trust, a Delaware Statutory Trust, is registered under the Investment Company Act of 1940, as amended (the “1940 Act”) as an open-end investment management company. Regan Capital LLC (the “Adviser”) serves as the investment manager to the Fund. The inception date of the Fund was October 1, 2020. The investment objective of the Fund is to provide a high level of risk-adjusted current income and capital appreciation.
NOTE 2 – SIGNIFICANT ACCOUNTING POLICIES
The following is a summary of significant accounting policies consistently followed by the Fund in preparation of their financial statements. These policies are in conformity with accounting principles generally accepted in the United States of America (“U.S. GAAP”) for investment companies. Each Fund is considered an investment company under U.S. GAAP and follows the accounting and reporting guidance applicable to investment companies in the Financial Accounting Standards Board Accounting Standards Codification Topic 946. The presentation of financial statements in conformity with U.S. GAAP requires management to make estimates and assumptions that affect the reported amounts of assets and liabilities and disclosure of contingent assets and liabilities at the date of the financial statements and the reported amounts of income and expenses during the period. Actual results may differ from those estimates.
A. Securities Valuation
Portfolio securities are valued using current market values or official closing prices, if available. When reliable market quotations are not readily available or a pricing service does not provide a valuation (or provides a valuation that in the judgment of the Adviser does not represent the security’s fair value) or when, in the judgment of the Adviser, events have rendered the market value unreliable, a security is fair valued in good faith by the Adviser under procedures approved by the Board. Valuing securities at fair value is intended to ensure that the Fund is accurately priced and involves reliance on judgment. There can be no assurance that the Fund will obtain the fair value assigned to a security if it were to sell the security at approximately the time at which the Fund determines its NAV per share.
The Fund follows a fair value hierarchy that distinguishes between market data obtained from independent sources (observable inputs) and the Fund’s own market assumptions (unobservable inputs). The inputs or methodology used in determining the value of each Fund’s investments are not necessarily an indication of the risk associated with investing in those securities.
Various inputs are used in determining the value of the Fund’s investments. These inputs are summarized into three broad categories as defined below:
| Level 1 - | Quoted prices in active markets for identical securities. An active market for a security is a market in which transactions occur with sufficient frequency and volume to provide pricing information on an ongoing basis. A quoted price in an active market provides the most reliable evidence of fair value. |
| | | |
| Level 2 - | Observable inputs other than quoted prices included in Level 1 that are observable for the asset or liability either directly or indirectly. These inputs may include quoted prices for the identical instrument on an inactive market, prices for similar instruments, interest rates, prepayment speeds, credit risk, yield curves, default rates, and similar data. |
| | | |
| Level 3 - | Significant unobservable inputs, including the Fund’s own assumptions in determining fair value of investments. |
Equity securities that are traded on a national securities exchange are stated at the last reported sales price on the day of valuation. To the extent these securities are actively traded, and valuation adjustments are not applied, they are categorized as Level 1 of the fair value hierarchy.
Regan Total Return Income Fund
Notes to Financial Statements
March 31, 2023 (Unaudited)
NOTE 2 – SIGNIFICANT ACCOUNTING POLICIES (Continued)
Short-term investments classified as money market instruments are valued at NAV. These investments are categorized as Level 1 of the fair value hierarchy.
Debt securities, including corporate, convertible, U.S. government agencies, U.S. treasury obligations, and sovereign issues, are normally valued by pricing service providers that use broker dealer quotations or valuation estimates from their internal pricing models. The service providers’ internal models use inputs that are observable such as issuer details, interest rates, yield curves, prepayment speeds, credit risk/spreads and default rates. Securities that use similar valuation techniques and inputs as described above are categorized as Level 2 of the fair value hierarchy.
Mortgage- and asset-backed securities are securities issued as separate tranches, or classes, of securities within each deal. These securities are normally valued by independent pricing service providers that use broker-dealer quotations or valuation estimates from their internal pricing models. The pricing models for these securities usually consider tranche-level attributes, estimated cash flows and market-based yield spreads for each tranche, current market data and incorporate deal collateral performance, as available.
Depending on the relative significance of the valuation inputs, fair valued securities may be classified in either level 2 or level 3 of the fair value hierarchy.
The inputs or methodology used for valuing securities are not necessarily an indication of the risk associated with investing in those securities. The following is a summary of the fair values of the Fund’s investments in each category investment type as of March 31, 2023:
| Description | | Level 1 | | | Level 2 | | | Level 3 | | | Total | |
| Assets | | | | | | | | | | | | | | | | |
| Asset Backed Securities | | $ | — | | | $ | 85,050,105 | | | $ | 432,408 | | | $ | 85,482,513 | |
| Mortgage Backed Securities – Non-Agency | | | — | | | | 166,937,864 | | | | 5,759,095 | | | | 172,696,959 | |
| Mortgage Backed Securities – U.S. Government Agency | | | — | | | | 8,963,342 | | | | 345,065 | | | | 9,308,407 | |
| Mortgage Secured Note | | | — | | | | 792,000 | | | | — | | | | 792,000 | |
| Short Term Investments | | | 20,154,604 | | | | 56,401,918 | | | | — | | | | 76,556,522 | |
| Total | | $ | 20,154,604 | | | $ | 318,145,229 | | | $ | 6,536,568 | | | $ | 344,836,401 | |
Please refer to the Schedule of Investments for further classification.
U.S. Government agency securities are comprised of two main categories consisting of agency issued debt and mortgage pass-throughs. Agency issued debt securities are generally valued in a manner similar to U.S. Government securities. Mortgage pass-throughs include to-be announced (“TBAs”) securities and mortgage pass-through certificates. TBA securities and mortgage pass-throughs are generally valued using dealer quotations.
The independent pricing service does not distinguish between smaller-sized bond positions, known as “odd lots”, and larger institutional-sized bond positions, known as “round lots”. The Adviser reviews pricing from the independent pricing service relative to odd lot acquisitions. If the vendor price is more than 3% greater than the acquisition price of the odd lot, cost is initially used to value the position. The Adviser monitors market levels and the vendor pricing daily, and will employ the vendor’s price when the Adviser believes it represents fair value, or if additional purchases of a security result in a round lot position. The Adviser also monitors current market levels for odd lot positions and updates fair valuations if material differences are observed.
Regan Total Return Income Fund
Notes to Financial Statements
March 31, 2023 (Unaudited)
NOTE 2 – SIGNIFICANT ACCOUNTING POLICIES (Continued)
Odd lot securities valued at cost are classified as level 2 when acquired within 30 days of the reporting date; odd lot positions acquired more than 30 days prior to the reporting date and valued at cost are classified as level 3.
Following is a reconciliation of investments in which significant unobservable inputs (Level 3) were used in determining fair value.
| | | Asset Backed Securities | | | Mortgage Backed Securities – U.S. Government Agency | | | Mortgage Backed Securities – Non-Agency | | | Mortgage Secured Note | |
| Balance at September 30, 2022 | | $ | 316,083 | | | $ | 71,661 | | | $ | 2,642,389 | | | $ | 800,000 | |
| Purchased | | | 229,392 | | | | 139,176 | | | | 5,429,619 | | | | — | |
| Accrued discounts/premiums | | | — | | | | — | | | | 1,340,096 | | | | — | |
| Sale/Paydown Proceeds | | | (91,862 | ) | | | (100,509 | ) | | | (932,535 | ) | | | — | |
| Realized Gain (Loss) | | | 4,789 | | | | 3,045 | | | | 89,960 | | | | — | |
| Change in unrealized Appreciation (depreciation) | | | (5,248 | ) | | | (602 | ) | | | (1,443,149 | ) | | | (8,000 | ) |
| Transfers into Level 3(1) | | | 19,969 | | | | 232,293 | | | | — | | | | — | |
| Transfers from Level 3(1) | | | (40,715 | ) | | | — | | | | (1,367,284 | ) | | | (792,000 | )
|
| Balance at March 31, 2023 | | $ | 432,408 | | | $ | 345,064 | | | $ | 5,759,096 | | | $ | — | |
| (1) | Transfers into Level 3 from Level 2 relate to securities that were valued by a third party pricing service, but became valued by the Adviser during the period. Transfers from Level 3 to Level 2 relate to securities that began the period valued at cost, but became valued by a third party pricing service during the period. The Adviser believes that the value from the pricing service represents the fair value of each security for which the transfer occurred. |
The change in unrealized appreciation/(depreciation) for Level 3 securities still held at March 31, 2023 was $(1,212,019)
The following is a summary of quantitative information about Level 3 valued measurements:
Regan Total Return Income Fund
| | | Value at March 31, 2023 | | | Valuation Technique(s) |
| Asset Backed Securities | | $ | 432,407 | | | Acquisition Cost |
| Mortgage Backed Securities – Agency | | $ | 5,759,095 | | | Acquisition Cost |
| Mortgage Backed Securities – Non-Agency | | $ | 345,065 | | | Acquisition Cost |
The Fund invests in distressed debt securities, which are securities that are priced below $50. In accordance with GAAP, the ultimate realizable value and potential for early retirement of securities is considered when determining the yield. If current values of debt securities decline significantly from the issue price, computed yields may be higher than rates expected to be ultimately realized. To avoid unsound yield information being presented in the Fund’s financial statements, consideration is given to capping yields of individual securities at a reasonable level. The Fund’s Adviser performs a periodic assessment of the yields for these distressed securities and adjustments are made to the income and cost of these securities on the Fund’s financial statements.
Regan Total Return Income Fund
Notes to Financial Statements
March 31, 2023 (Unaudited)
NOTE 2 – SIGNIFICANT ACCOUNTING POLICIES (Continued)
B. Security Transactions, Investment Income and Distributions
The Fund record security transactions based on trade date. Realized gains and losses on sales of securities are calculated by comparing the original cost of the specifically identified security lot sold with the net sales proceeds. Dividend income is recognized on the ex-dividend date, and interest income is recognized on an accrual basis. Withholding taxes on foreign dividends have been provided for in accordance with the Trust’s understanding of the applicable country’s tax rules and rates.
C. Distributions to Shareholders
Distributions from net investment income, if any, are declared at least quarterly. Distributions of net realized gains, if any, are declared at least annually. Distributions to shareholders of the Fund are recorded on the ex-dividend date and are determined in accordance with income tax regulations. The Fund may periodically make reclassifications among certain income and capital gains distributions determined in accordance with federal tax regulations, which may differ from U.S. GAAP. These reclassifications are due to differences in the recognition of income, expense and gain (loss) items for financial statement and tax purposes.
D. Federal Income Taxes
The Fund has elected to be taxed as Regulated Investment Companies (“RIC”) under the U.S. Internal Revenue Code of 1986, as amended, and intend to maintain this qualification and to distribute substantially all of their net taxable income to their shareholders. Therefore, no provision is made for federal income taxes. Due to the timing of dividend distributions (if any) and the differences in accounting for income and realized gains and losses for financial statement and federal income tax purposes, the fiscal year in which amounts are distributed may differ from the year in which the income and realized gains and losses are recorded by the Fund.
Management of the Fund is required to analyze all open tax years, as defined by IRS statute of limitations for all major jurisdictions, including federal tax authorities and certain state tax authorities. As of and during the period ended March 31, 2023, the Fund did not have a liability for any unrecognized tax benefits. The Fund recognizes interest and penalties, if any, related to unrecognized tax benefits as interest expense and other expense for penalties in the statement of operations. During the period, the Fund did not incur any interest or tax penalties. The Fund has not currently filed any tax returns; generally, tax authorities can examine tax returns filed for the preceding three years.
NOTE 3 – INVESTMENT MANAGEMENT AGREEMENT AND OTHER RELATED PARTY TRANSACTIONS
The Trust entered into an agreement for the Adviser to furnish investment advisory services to the Fund. Under the terms of this agreement, the Fund will pay the Adviser a monthly fee based on the Fund’s average daily net assets at the annual rate of 0.89%.
The Adviser has contractually agreed to waive its management fee and/or reimburse the Fund’s operating expenses (other than shareholder servicing fees, front-end or contingent deferred loads, taxes, interest expense, brokerage commissions, acquired fund fees and expenses, portfolio transaction expenses, dividends paid on short sales, extraordinary expenses, Rule 12b-1 fees, or intermediary servicing fees) for each class so that annual operating expenses will not exceed 1.20% (the “Expense Cap”). The Expense Cap will remain in effect through at least January 31, 2024 and may be terminated only by the Trust for Advised Portfolios Board of Trustees. The Adviser may request recoupment from the Fund of previously waived fees and paid expenses for three years from the date such fees and expenses were waived or paid, provided that such recoupment does not cause the Fund’s expense ratio (after the recoupment is taken into account) to exceed the lower of (1) the Expense Cap in place at the time such amounts were waived or paid and (2) the Fund’s Expense Cap at the time of recoupment.
Regan Total Return Income Fund
Notes to Financial Statements
March 31, 2023 (Unaudited)
NOTE 3 – INVESTMENT MANAGEMENT AGREEMENT AND OTHER RELATED PARTY TRANSACTIONS (Continued)
U.S. Bancorp Fund Services, LLC, doing business as U.S. Bank Global Fund Services (“Fund Services”), serves as the Fund’s administrator and fund accountant and transfer agent. The officers of the Trust are employees of Fund Services. U.S. Bank serves as the Fund’s custodian and provides compliance services to the Funds. Quasar Distributors, LLC (“Quasar” or the “Distributor”) acts as the Fund’s distributor and principal underwriter. For the period ended March 31, 2023, the Fund incurred the following expenses for administration and fund accounting, compliance, custody and transfer agency fees:
| Administration and Fund Accounting | $144,408 |
| Compliance Service | 5,627 |
| Custody | 19,947 |
| Transfer Agency | 51,587 |
At March 31, 2023, the expenses reimbursed, and contractual fees waived by the Adviser and subject to potential recapture by period were as follows:
Regan Total Return Income Fund
| | Fiscal Year | Waived/reimbursed | Expiration |
| | September 30, 2021 | $160,828 | September 30, 2024 |
| | September 30, 2022 | 128,004 | September 30, 2025 |
At March 31, 2023, the Fund had payables due to Fund Services for administration and fund accounting, compliance, custody and transfer agency fees to U.S. Bank in the following amounts:
| Administration and Fund Accounting | $80,991 |
| Compliance Services | 3,630 |
| Custody | 6,604 |
| Transfer Agency | 33,667 |
The above payable amounts are included in Accrued other expenses and other liabilities in the Statement of Assets and Liabilities.
The Independent Trustees were paid $6,798 for their services and reimbursement of travel expenses during the period ended March 31, 2023. The Fund pays no compensation to the Interested Trustee or officers of the Trust.
NOTE 4 – INVESTMENT TRANSACTIONS
Purchases and sales of investment securities (excluding short-term investments) for the six months ended March 31, 2023, were as follows:
| | | | Non-Government | | Government | |
| Purchases | | | $ | 145,278,032 | | | $— | |
| Sales | | | $ | 37,113,845 | | | $— | |
Regan Total Return Income Fund
Notes to Financial Statements
March 31, 2023 (Unaudited)
NOTE 5 – FEDERAL INCOME TAX INFORMATION
At September 30, 2022, the components of distributable earnings for income tax purposes were as follows:
Regan Total Return Income Fund
| Cost of investments | | $ | 195,569,817 | |
| Gross unrealized appreciation | | | 154,816 | |
| Gross unrealized depreciation | | | (14,332,141 | ) |
| Net unrealized depreciation on investments | | | (14,177,325 | ) |
| Undistributed ordinary income | | | 593,804 | |
| Undistributed long-term capital gains | | | — | |
| Distributable earnings | | | 593,804 | |
| Other book/tax temporary differences | | | 16,738,227 | |
| Total distributable earnings | | $ | 3,154,706 | |
The difference between book basis and tax basis unrealized appreciation/(depreciation) is attributable in part to the recognition of accretable yield on deep discounted mortgage back securities and to the deferral of losses on wash sales.
Additionally, U.S. GAAP requires that certain components of net assets relating to permanent differences be reclassified between financial and tax reporting. These reclassifications have no effect on net assets or net asset value per share. For the six months ended September 30, 2022, the following table shows the reclassifications made:
| | Total | |
| | Accumulated | Paid-In |
| | Losses | Capital |
| Regan Total Return Income Fund | $17,667,283 | $(17,667,283) |
The following table summarizes the characteristics of distributions paid during the periods ended March 31, 2023 and September 30, 2022:
Regan Total Return Income Fund
| | | Long Term | Return of | Total |
| | Income | Capital Gains | Capital | Distributions |
| March 31, 2023 | $8,387,182 | $— | $— | $8,387,182 |
| September 30, 2022 | 6,901,219 | — | 3,159,689 | 10,060,908 |
The Fund also designates as distributions of long term gains, to the extent necessary to fully distribute such capital gains, earnings and profits distributed to shareholders on the redemption of shares.
The Fund is required, in order to meet certain excise tax requirements, to measure and distribute annually, net capital gains realized during the twelve month period ending October 31. In connection with this requirement, the Fund is permitted, for tax purposes, to defer into its next fiscal year any net capital losses incurred from November 1 through the end of the fiscal year. Late year losses incurred after December 31 within the fiscal year are deemed to arise on the first business day of the following fiscal year for tax purposes. As of September 30, 2022, the Fund had no late-year or post-October losses.
Regan Total Return Income Fund
Notes to Financial Statements
March 31, 2023 (Unaudited)
NOTE 5 – FEDERAL INCOME TAX INFORMATION (Continued)
At September 30, 2022, the Fund had capital loss carryforwards, which reduce the Fund’s taxable income arising from future net realized gains on investments, if any, to the extent permitted by the Internal Revenue Code, and thus will reduce the amount of distributions to shareholders which would otherwise be necessary to relieve the Fund of any liability for federal tax. Pursuant to the Internal Revenue Code, the character of such capital loss carryforwards is as follows:
| | Not Subject to Expiration | |
| Short Term | Long Term | Total |
| $130,915 | $36,877 | $167,792 |
The Fund did not utilize any capital loss carryforwards at September 30, 2022.
NOTE 6 – SHAREHOLDER SERVICING PLAN
The Trust, on behalf of the Fund, has adopted a Shareholder Servicing Plan to pay a fee at an annual rate on average daily net assets up to a maximum rate as follows:
| Institutional Class | 0.10% | Investor Class | 0.15% |
The Shareholder Servicing Plan authorizes payment of a shareholder servicing fee to the financial intermediaries and other service providers who provide administrative and support services to Fund shareholders.
For the six months ended March 31, 2023, class specific Shareholder Servicing fees were as follows:
| Institutional Class | $124,738 | Investor Class | $5,222 |
NOTE 7 – DISTRIBUTION PLAN
The Trust, on behalf of the Fund, has adopted a Distribution Plan (the “Plan”) pursuant to Rule 12b-1 under the 1940 Act that allows the Fund to pay distribution fees for the sale and distribution of its Investor Class shares. The Plan provides for the payment of distribution fees at the annual rate of up to 0.25% of average daily net assets of the Investor Class shares. For the period ended March 31, 2023, distribution fees incurred are disclosed on the Statement of Operations.
For the six months ended March 31, 2023, class specific Distribution fees were as follows:
NOTE 8 – COMMITMENTS AND CONTINGENCIES
In the normal course of business, the Fund enters into contracts that provide general indemnifications by the Fund to the counterparty to the contract. The Fund’s maximum exposure under these arrangements is dependent on future claims that may be made against each Fund and, therefore, cannot be estimated; however, based on experience, the risk of loss from such claims is considered remote.
Regan Total Return Income Fund
Notes to Financial Statements
March 31, 2023 (Unaudited)
NOTE 9 – LINE OF CREDIT
The Fund has access to a $15 million secured line of credit through an agreement with U.S. Bank. The Fund may temporarily draw on the line of credit to satisfy redemption requests or to settle investment transactions. Interest is charged to the Fund based on its borrowings at a rate per annum equal to the Prime Rate, to be paid monthly. Loan activity for the six months ended March 31, 2023 was as follows:
| Maximum Available Credit | | $ | 15,000,000 | |
| Largest Amount Outstanding on an Individual Day | | $ | 2,256,000 | |
| Average Daily Loan Outstanding | | $ | 1,137,500 | |
| Interest Expense – 4 days | | $ | 3,188 | |
| Loan Outstanding as of March 31, 2023 | | $ | — | |
| Average Interest Rate | | | 7.25 | % |
NOTE 10 – SUBSEQUENT EVENTS
In preparing these financial statements, the Fund has evaluated events and transactions for potential recognition or disclosure through the date the financial statements were available to be issued. The Fund has determined that there were no subsequent events that would need to be disclosed in the Fund’s financial statements.
NOTE 11 – NEW ACCOUNTING PRONOUNCEMENTS
In March 2020, FASB issued Accounting Standards Update 2020-04, Reference Rate Reform: Facilitation of the Effects of Reference Rate Reform on Financial Reporting (“ASU 2020-04”). The main objective of ASU 2020-04 is to provide relief to companies that will be impacted by the expected change in benchmark interest rates at the end of 2021, when participating banks will no longer be required to submit London Inter-bank Offered Rate (“LIBOR”) quotes by the UK Financial Conduct Authority. ASU 2020-04 allows companies to, provided the only change to existing contracts are a change to an approved benchmark interest rate, account for modifications as a continuance of the existing contract without additional analysis. In addition, derivative contracts that qualified for hedge accounting prior to modification, will be allowed to continue to receive such treatment, even if critical terms change due to a change in the benchmark interest rate. For new and existing contracts, the Fund may elect to apply the amendments as of March 12, 2020 through December 31, 2022. Management is currently assessing the impact of the adoption of ASU 2020-04 to the Fund’s financial statements and various filings.
NOTE 12 – PRINCIPAL RISKS
Below is a summary of some, but not all, of the principal risks of investing in the Fund, each of which may adversely affect the Fund’s net asset value and total return. The Fund’s most recent prospectus provides further descriptions of the Fund’s investment objective, principal investment strategies and principal risks.
Mortgage-Backed Securities Risk. When interest rates increase, the market values of mortgage-backed securities decline. At the same time, however, mortgage refinancings and prepayments slow, which lengthens the effective duration of these securities. As a result, the negative effect of the interest rate increase on the market value of mortgage-backed securities is usually more pronounced than it is for other types of fixed income securities, potentially increasing the volatility of the Fund. Conversely, when market interest rates decline, while the value of mortgage-backed securities may increase, the rate of prepayment of the underlying mortgages also tends to increase, which shortens the effective duration of these securities. Mortgage-backed securities are also subject to the risk that underlying borrowers will be unable to meet their obligations and the value of property that secures the mortgage may decline in value and be insufficient, upon foreclosure, to repay the associated loan. Additionally, the liquidity of non-investment grade securities and sub-prime mortgage securities can change dramatically over time.
Regan Total Return Income Fund
Notes to Financial Statements
March 31, 2023 (Unaudited)
NOTE 12 – PRINCIPAL RISKS (Continued)
Asset-Backed Securities Risk (“ABS”). ABS represent participations in, or are secured by and payable from, assets such as installment sales or loan contracts, leases, credit card receivables and other categories of receivables. Certain debt instruments may only pay principal at maturity or may only represent the right to receive payments of principal or payments of interest on underlying pools of mortgages, assets or government securities, but not both. The value of these types of instruments may change more drastically than debt securities that pay both principal and interest. The Fund may obtain a below market yield or incur a loss on such instruments during periods of declining interest rates. Principal only and interest only instruments are subject to extension risk. Certain ABS may provide, upon the occurrence of certain triggering events or defaults, for the investors to become the holders of the underlying assets. In that case, the Fund may become the holder of securities that it could not otherwise purchase, based on its investment strategies or its investment restrictions and limitations, at a time when such securities may be difficult to dispose of because of adverse market conditions.
Credit Risk. There is a risk that the issuer of a mortgage-backed security may experience unanticipated financial problems causing their securities to decline in value. Changes in the market’s perception of the issuer’s financial strength or in a security’s credit rating, which reflects a third party’s assessment of the credit risk presented by a particular issuer, may affect debt securities’ value. In addition, the Fund is subject to the risk that the issuer of a fixed income security will fail to make timely payments of interest or principal, or may stop making such payments altogether.
Interest Rate Risk. When interest rates increase this may result in a decrease in the value of debt securities held by the Fund. Conversely, as interest rates decrease, mortgage-backed securities’ prices typically do not rise as much as the prices of comparable bonds. Changes in government intervention may have adverse effects on investments, volatility, and illiquidity in debt markets.
Prepayment Risk. When interest rates fall, certain obligations may be paid off by the obligor earlier than expected by refinancing their mortgages, resulting in prepayment of the mortgage-backed securities held by the Fund. The Fund would then lose any price appreciation above the mortgage’s principal and would have to reinvest the proceeds at lower yields, resulting in a decline in the Fund’s income. Prepayment reduces the yield to maturity and the average life of the security.
NOTE 13 – CHANGE IN INDEPENDENT REGISTERED PUBLIC ACCOUNTING FIRM
BBD LLP (“BBD”) served as the independent registered public accounting firm for the Fund to audit the financial statements for the fiscal year ended September 30, 2022. On March 13, 2023, BBD sent a letter of cessation to the SEC indicating that BBD would no longer be serving as auditor. This letter was sent as a result of the the Investment Management Group of BBD being acquired by Cohen & Company, LTD (“Cohen”).
The Trust engaged Cohen on February 28, 2023, as the independent registered public accounting firm to audit the Fund’s financial statements for the fiscal year ending September 30, 2023.
The report of BBD on the financial statement of the Fund for the fiscal year ended September 30, 2022, contained no adverse opinion or disclaimer of opinion, and was not qualified or modified as to uncertainty, audit scope, or accounting principle.
In connection with the Fund’s audit for the fiscal period ended September 30, 2022, there have been no disagreements, if not resolved to the satisfaction of BBD, that would have caused them to make reference thereto in their report on the financial statements for such period.
Regan Total Return Income Fund
Additional Information
March 31, 2023 (Unaudited)
Quarterly Portfolio Schedule
The Fund files its complete schedule of portfolio holdings for the first and third quarters of each fiscal year with the Securities and Exchange Commission (SEC) on Part F of Form N-PORT. The Fund’s Form N-PORT is available without charge by visiting the SEC’s Web site at www.sec.gov and may be reviewed and copied at the SEC’s Public Reference Room in Washington D.C. You may obtain information on the operation of the Public Reference Room by calling 1-800-SEC-0330.
Proxy Voting
You may obtain a description of the Fund’s proxy voting policy and voting records, without charge, upon request by contacting the Fund directly at 1-888-44-REGAN or on the EDGAR Database on the SEC’s website at ww.sec.gov. The Fund files its proxy voting records annually as of June 30, with the SEC on Form N-PX. The Fund’s Form N-PX is available without charge by visiting the SEC’s website at www.sec.gov and may be reviewed and copied at the SEC’s Public Reference Room in Washington D.C. You may obtain information on the operation of the Public Reference Room by calling 1-800-SEC-0330.
PRIVACY NOTICE
The Fund collects non-public information about you from the following sources:
| ● | Information we receive about you on applications or other forms; |
| ● | Information you give us orally; and/or |
| ● | Information about your transactions with us or others. |
We do not disclose any non-public personal information about our customers or former customers without the customer’s authorization, except as permitted by law or in response to inquiries from governmental authorities. We may share information with affiliated and unaffiliated third parties with whom we have contracts for servicing the Fund. We will provide unaffiliated third parties with only the information necessary to carry out their assigned responsibilities. We maintain physical, electronic and procedural safeguards to guard your non-public personal information and require third parties to treat your personal information with the same high degree of confidentiality.
In the event that you hold shares of the Fund through a financial intermediary, including, but not limited to, a broker-dealer, bank, or trust company, the privacy policy of your financial intermediary would govern how your non-public personal information would be shared by those entities with unaffiliated third parties.
Investment Adviser
Regan Capital, LLC
300 Crescent Court, Suite 1760
Dallas, Texas 75201
Distributor
Quasar Distributors, LLC
111 East Kilbourn Ave., Suite 2200
Milwaukee, Wisconsin 53202
Custodian
U.S. Bank National Association
Custody Operations
1555 North River Center Drive, Suite 302
Milwaukee, Wisconsin 53212
Transfer Agent, Fund Accountant and Fund Administrator
U.S. Bancorp Fund Services, LLC
615 East Michigan Street
Milwaukee, Wisconsin 53202
Independent Registered Public Accounting Firm
Cohen & Company, Ltd.
1835 Market Street, Suite 310
Philadelphia, Pennsylvania 19103
Legal Counsel
Morgan, Lewis & Bockius LLP
1111 Pennsylvania Avenue, NW
Washington, DC 20004
This report has been prepared for shareholders and may be distributed to others only if preceded or accompanied by a current prospectus.