Exhibit 99.1
Fourth Quarter 2004
Earnings Release and
Supplemental Operating and Financial Data

Affordable Residential Communities
600 Grant Street, Suite 900
Denver, CO 80203
Phone: (866) 847-8931
Fax: (303) 294-0121
www.aboutarc.com

| | Table of Contents |
Note: This earnings release and supplemental operating and financial data report contains certain non-GAAP financial measures that we believe are helpful in understanding our business as further described in Exhibit I. These financial measures that principally include Funds From Operations, Funds Available for Distribution, Earnings Before Interest, Taxes, Depreciation and Amortization, and Net Segment Income should not be considered an alternative to Loss Available to Common Stockholders or any other GAAP measurement of performance or as an alternative to cash flows from operating, investing or financing activities. Furthermore, these non-GAAP financial measures are not intended to be a measure of cash flow or liquidity.
1
AFFORDABLE RESIDENTIAL COMMUNITIES ANNOUNCES FOURTH QUARTER RESULTS
DENVER, CO — (BUSINESS WIRE) — March 16, 2005—Affordable Residential Communities Inc. (NYSE:ARC) today announced results for the year and quarter ended December 31, 2004.
Revenue for the fourth quarter 2004 was $64.5 million, compared to $60.1 million in the third quarter 2004 and $37.5 million in the comparable quarter last year. Net loss to common shareholders for the fourth quarter 2004 was $35.4 million, or $0.87 per share, versus a net loss of $17.2 million, or $0.42 per share, in the third quarter 2004 and a net loss of $10.7 million, or $0.63 per share, in the comparable quarter last year. The company has recast all previously issued results to reflect the 30 non-core communities sold during 2004 or held for sale as of December 31, 2004 as discontinued operations.
Funds from operations (FFO1) available to common shareholders for the fourth quarter 2004 was $(13.2) million, or $(0.32) per share, versus FFO of $2.6 million, or $0.06 per share, in the third quarter 2004 and $(1.5) million, or $(0.09) per share, in the comparable quarter last year.
The net loss to common shareholders and FFO in the fourth quarter 2004 included several non-cash and severance charges, including:
• $3.6 million of retail losses, or $0.09 per share, related to older vacant homes sold during the fourth quarter at discounts to their original costs in order to drive occupancy, help establish and drive our Hispanic marketing initiative and reduce future repairs and maintenance costs in the company’s rental home portfolio,
• $3.0 million of impairment charges, or $0.07 per share, related to older vacant rental homes the company expects to sell in 2005 at prices less than their carrying value in order to continue to drive occupancy in specific markets and reduce maintenance and repair costs in the company’s rental home portfolio,
• $0.9 million of goodwill impairment, or $0.02 per share, related to the company’s insurance business,
• $0.7 million of previously announced severance costs, or $0.02 per share, related to the resignation of the company’s chief operating officer during the fourth quarter,
• $0.5 million of impairment charges, or $0.01 per share, related to three communities.
In addition, the company incurred significant community property operation expenses related to the cleanup and repair of acquired communities, increased community and home sales staffing requirements, and increased levels of administrative support to improve occupancy in those acquired communities.
Fourth quarter 2004 net loss to common shareholders and FFO included income from discontinued operations totaling $565,000. Net loss to common stockholders also included a $6.3 million loss on the sale of 15 communities during December 2004. This loss on sale is not a component of FFO.
2
Scott Jackson, chairman and chief executive officer, commented, “While 2004 was a disappointing year, we believe that we have made the necessary changes to move forward. It is our intention to continue to run our company as we had in a manner that was successful for the first nine years of operation. In 2004, we worked to put the company in a position to increase occupancy via an intensified focus on acquired community cleanup, as well as invest in people, processes and training, particularly in our acquired communities.”
“We have established an in-community sales force that is consistently selling homes and leasing inventory. We have positioned our inventory to facilitate conversion of renters to long-term owner residents and fully staffed all of the acquired communities with new or additional management. We invested in our acquired communities to improve their curb appeal and implemented our marketing program focused on the Hispanic customer.”
Mr. Jackson continued, “We have restructured our management in the field and at the corporate level to form the ‘office of the chief operating officer’ to provide for greater focus on individual communities. We are now driving the business with specific business plans for every community, market, district and region. To position ourselves to grow occupancy, we have further strengthened our executive management team by adding chief operating officers for three divisions. This includes; A. sales, inventory and marketing, management, B. community operations and C. consumer finance. We also have added depth at the finance and accounting level with experienced senior level executives. Additionally, we have made substantial progress in completing the capital structure we need to support our business plan and have funding and commitments for $100 million.”
Total portfolio occupancy was 81.5% at December 31, 2004 and “same communities”2 occupancy was 83.0%. Additionally in the fourth quarter, the company had positive occupancy absorption in the Dallas and Atlanta markets. The sequential decrease from the third quarter 2004 was due primarily to the company’s decision to hold homes coming off lease for sale. As of December 31, 2004, the company was holding 920 older vacant homes for sale.
Mr. Jackson concluded, “We believe this management reorganization as well as our approach to selling older, rental homes as they become vacant will maximize long-term occupancy and create more stable cash flows.”
During the fourth quarter 2004, 946 homes were sold, while 348 homes were leased through the lease with an option to purchase program. This compares to 277 homes sold and 36 homes sold through the lease-to-own program in the third quarter 2004. The company made substantially all its sales and leasing activity in 2004 from mid September 2004 through December 31, 2004.
Based on preliminary results for the first quarter 2005, the company has produced positive occupancy increases through February 28, 2005. Occupancy increased to 82.0% compared to 81.5% at December 31, 2004. The increase occurred over a broad range of the company’s markets.
For the twelve months ended December 31, 2004, net loss available to common stockholders was $94.7 million, or a loss of $2.49 per share, as compared to a net loss of $34.4 million, or $2.03 per share for the year-ago period ended December 31, 2003. FFO for the full year 2004 was a deficit of $(23.2) million, or $(0.61) per share.
3
Capital Structure:
On December 31, 2004, the company had $1,001.6 million of debt, including approximately $28.0 million drawn under its $50.0 million floorplan facility and $51.0 million outstanding on its $85.0 million revolving credit mortgage facility. The weighted average interest rate on the company’s debt was 6.1% (including the impact of the company’s interest rate swaps) and 87% of the company’s debt is not due until 2008 or later (assuming its senior variable rate debt due 2006 is extended in accordance with the terms of the current debt agreement). Fixed rate debt, including variable rate debt hedged by interest rate swaps, amounted to 87% of total debt.
In March 2005, the company secured an additional $100 million in financing commitments, consisting of an unsecured $25 million trust preferred security, and a $75 million lease receivables facility secured by substantially all of the company’s rental homes and the related leases. The $25 million trust preferred security was borrowed in full on March 15, 2005, matures in 30 years and bears interest at 3-month LIBOR plus 3.25%. The lease receivables facility is subject to customary closing conditions and documentation, however there can be no assurance that we will close the facility and fund.
Dividend:
For the fourth quarter 2004, the board of directors declared a $0.3125 common dividend per share. The dividend was paid on January 14, 2005 to shareholders of record on December 31, 2004.
The board of directors also declared a dividend of $0.5156 on each share of its Series A Cumulative Redeemable Preferred Stock and a dividend of $0.39 per unit on its Series B and Series C Preferred Operating Partnership Units. These dividends were paid on January 31, 2005 to shareholders of record on January 15, 2005.
Community Sales:
We sold or held for sale 15 communities in the fourth quarter 2004. In addition, we have identified 14 communities which we intend to offer for sale in 2005, and we may also offer for sale additional communities in 2005. There can be no assurances that any of these contemplated community sales will in fact occur.
Fourth Quarter Conference Call
The company will host a conference call, today, Wednesday, March 16, 2005, at 5:00 PM Eastern. The call will be webcast live over the Internet from the company’s website at www.aboutarc.com under the section titled “Webcast”. Participants should follow the instructions provided on the website for the download and installation of audio applications necessary to join the webcast. The call can also be accessed live over the phone by dialing (800) 289-0494 or for international callers by dialing (913) 981-5520.
A replay will be available one hour after the call and can be accessed by dialing (888) 203-1112 or (719) 457-0820 for international callers; the password is 8710794. The replay will be available from March 16, 2005, through March 23, 2005 and will also be archived on the company’s website.
(1) As defined by the National Association of Real Estate Investment Trusts (“NAREIT”), FFO represents net income (loss) (computed in accordance with GAAP), excluding gains (or losses) from sales of property, plus income
4
generating real estate related depreciation and amortization (excluding amortization of loan origination costs) and after adjustments for unconsolidated partnerships and joint ventures. We present FFO because we consider it an important supplemental measure of our operating performance and believe it is frequently used by securities analysts, investors and other interested parties in the evaluation of REITs, many of which present FFO when reporting their results. FFO is intended to exclude GAAP historical cost depreciation and amortization of real estate and related assets, which assumes that the value of real estate assets diminishes ratably over time. Historically, however, real estate values have risen or fallen with market conditions. Because FFO excludes depreciation and amortization unique to real estate and gains and losses from property dispositions, it provides a performance measure that, when compared year over year, reflects the impact to operations from trends in occupancy rates, rental rates, operating costs, development activities and interest costs, providing perspective not immediately apparent from net income. We compute FFO in accordance with standards established by the Board of Governors of NAREIT in its March 1995 White Paper (as amended in November 1999 and April 2002), which may differ from the methodology for calculating FFO utilized by other equity REITs and, accordingly, may not be comparable to such other REITs. Further, FFO does not represent amounts available for management’s discretionary use because of needed capital replacement or expansion, debt service obligations, or other commitments and uncertainties. FFO should not be considered as an alternative to net income (loss) (computed in accordance with GAAP) as an indicator of our financial performance or to cash flow from operating activities (computed in accordance with GAAP) as an indicator of our liquidity, nor is it indicative of funds available to fund our cash needs, including our ability to pay dividends or make distributions.
(2) “Same Communities” reflects information for all communities owned by us at both January 1, 2003 and December 31, 2004. “Same Communities”, therefore, does not include our Hometown acquisition, the D.A.M. portfolio acquisition or the other communities that we acquired subsequent to January 1, 2003. “Same Communities” also does not include any communities sold or held for sale during 2004 or 2003.
The Private Securities Litigation Reform Act of 1995 provides a “safe harbor” for certain forward-looking statements. The forward-looking statements contained in this news release are subject to certain risks and uncertainties including, but not limited to, general risks affecting the real estate industry; the company’s ability to maintain or increase rental rates and occupancy with respect to properties currently owned; the company’s assumptions on rental home and home sales and financing activity; completion of pending acquisitions and sales, if any, and timing with respect thereto; the company’s growth and expansion into new markets or successful integration of acquisitions; and the effect of interest rates as well as other risks indicated from time to time in the company’s filings with the Securities and Exchange Commission. The company expressly disclaims any intention or obligation to provide public updates, revisions or amendments to any forward-looking statements that become untrue because of subsequent events.
About Affordable Residential Communities Inc.
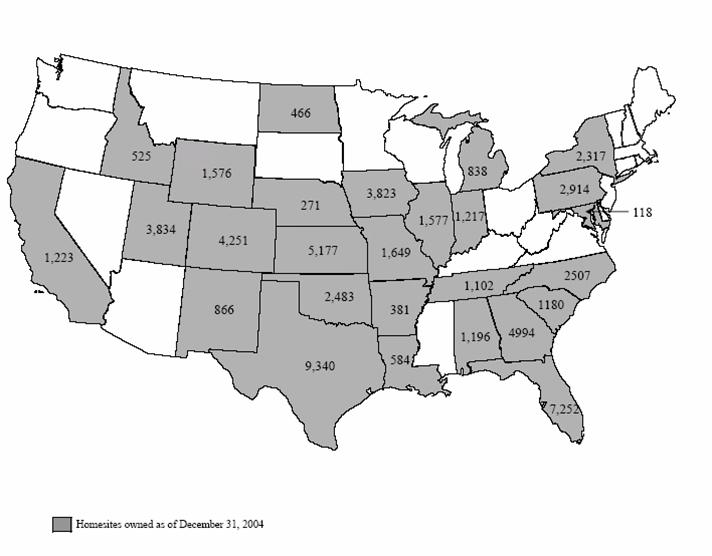
Affordable Residential Communities Inc. (“ARC”) currently owns and operates approximately 64,000 homesites located in approximately 315 communities in 27 states. ARC is a fully integrated, self-administered, self-managed equity real estate investment trust (REIT) focused on the acquisition, renovation, repositioning and operation of primarily all-age manufactured home communities with headquarters in Denver, CO.
CONTACT:
Affordable Residential Communities Inc.
Lawrence Kreider, Chief Financial Officer
866-847-8931
investor.relations@aboutarc.com
Or
Integrated Corporate Relations, Inc.
Brad Cohen, 203-682-8211
5
| | Three Months Ended | |
($ in thousands, except per share data) | | 12/31/04 | | 09/30/04 | | 06/30/04 | | 03/31/04 | |
Operating Data | | | | | | | | | |
Total revenue | | $ | 64,482 | | $ | 60,088 | | $ | 55,165 | | $ | 42,922 | |
Same community real estate net segment income (a) | | $ | 18,216 | | $ | 19,032 | | $ | 21,020 | | $ | 21,590 | |
Avg. monthly real estate revenue per occupied homesite | | 377 | | 377 | | 374 | | 367 | |
Avg. monthly homeowner rental income per homeowner occupied homesite | | 286 | | 286 | | 284 | | 283 | |
Average occupied homesites | | 30,777 | | 31,046 | | 31,384 | | 31,721 | |
| | | | | | | | | |
EBITDA (a) | | $ | 12,298 | | $ | 21,737 | | $ | 24,248 | | $ | 5,232 | |
Adjusted EBITDA (a) | | $ | 12,298 | | $ | 21,737 | | $ | 24,248 | | $ | 19,719 | |
| | | | | | | | | |
Funds from operations available to common stockholders (a) | | $ | (13,155 | ) | $ | 2,632 | | $ | 9,304 | | $ | (21,708 | ) |
FFO per share – basic | | $ | (0.32 | ) | $ | 0.06 | | $ | 0.23 | | $ | (0.74 | ) |
FFO per share – diluted | | $ | (0.32 | ) | $ | 0.06 | | $ | 0.22 | | $ | (0.74 | ) |
Adjusted FFO (a) | | $ | (13,155 | ) | $ | 5,708 | | $ | 9,304 | | $ | 4,023 | |
| | | | | | | | | |
Funds available for distribution (“FAD”) (a) | | $ | (16,713 | ) | $ | 2,146 | | $ | 7,069 | | $ | (10,455 | ) |
FAD per share – basic | | $ | (0.41 | ) | $ | 0.05 | | $ | 0.17 | | $ | (0.36 | ) |
FAD per share – diluted | | $ | (0.41 | ) | $ | 0.05 | | $ | 0.16 | | $ | (0.36 | ) |
Adjusted FAD (a) | | $ | (16,713 | ) | $ | 2,146 | | $ | 7,069 | | $ | 2,899 | |
| | | | | | | | | |
Net income (loss) to common stockholders | | $ | (35,353 | ) | $ | (17,211 | ) | $ | (7,126 | ) | $ | (34,969 | ) |
Earnings (loss) per share – basic | | (0.87 | ) | (0.42 | ) | (0.17 | ) | (1.20 | ) |
Earnings (loss) per share – diluted | | (0.87 | ) | (0.42 | ) | (0.17 | ) | (1.20 | ) |
| | | | | | | | | |
Distributions per common share | | $ | 0.3125 | | $ | 0.3125 | | $ | 0.3125 | | $ | 0.1493 | |
Distributions per preferred share | | $ | 0.5156 | | $ | 0.5156 | | $ | 0.5156 | | $ | 0.4182 | |
| | | | | | | | | |
Interest expensed | | $ | 15,920 | | $ | 13,720 | | $ | 12,782 | | $ | 14,471 | |
Interest capitalized | | 146 | | 1,145 | | 1,235 | | 544 | |
Total interest incurred | | $ | 16,066 | | $ | 14,865 | | $ | 14,017 | | $ | 15,015 | |
| | | | | | | | | |
EBITDA / interest | | 0.77 | x | 1.46 | x | 1.73 | x | 0.35 | x |
EBITDA / interest + preferred stock dividend | | 0.66 | x | 1.25 | x | 1.46 | x | 0.32 | x |
| | | | | | | | | |
Share Detail | | | | | | | | | |
Average number of common shares outstanding | | 40,858 | | 40,857 | | 40,857 | | 29,233 | |
Average number of OP units outstanding | | 4,184 | | 4,186 | | 2,412 | | 2,560 | |
Diluted shares outstanding | | 45,042 | | 45,043 | | 43,269 | | 31,793 | |
| | | | | | | | | |
Balance Sheet Data | | | | | | | | | |
Total assets | | $ | 1,813,002 | | $ | 1,836,165 | | $ | 1,834,169 | | $ | 1,770,503 | |
Total debt | | 1,001,622 | | 977,473 | | 937,887 | | 901,682 | |
Market common equity value, end of period | | 586,543 | | 597,285 | | 679,105 | | 757,620 | |
Market preferred equity value, end of period | | 130,000 | | 127,550 | | 128,750 | | 131,250 | |
Debt / total assets | | 55.2 | % | 53.2 | % | 51.1 | % | 50.9 | % |
Debt / total market capitalization | | 58.3 | % | 57.4 | % | 53.7 | % | 50.4 | % |
| | | | | | | | | |
Other Data | | | | | | | | | |
Total properties (at period end) | | 315 | | 315 | | 313 | | 272 | |
Total homesites (at period end) | | 63,661 | | 63,661 | | 63,400 | | 59,586 | |
Occupied homesites (at period end) | | 51,913 | | 52,604 | | 52,613 | | 49,947 | |
Occupancy percentage – total portfolio | | 81.5 | % | 82.6 | % | 83.0 | % | 83.8 | % |
(a) See Exhibit I for definition and reconciliation to nearest GAAP measure.
6
| | Period Ending | |
($ in thousands) | | 12/31/04 | | 09/30/04 | | 06/30/04 | | 03/31/04 | | 12/31/03 | |
Assets | | | | | | | | | | | |
Rental property | | | | | | | | | | | |
Land | | $ | 211,383 | | $ | 210,270 | | $ | 210,295 | | $ | 197,735 | | $ | 119,779 | |
Land improvements and buildings | | 1,268,002 | | 1,245,925 | | 1,229,079 | | 1,151,224 | | 705,573 | |
Manufactured homes and improvements | | 197,668 | | 197,511 | | 181,349 | | 154,655 | | 129,194 | |
Furniture, equipment and vehicles | | 12,434 | | 9,549 | | 9,104 | | 8,940 | | 8,655 | |
Rental property, gross | | 1,689,487 | | 1,663,255 | | 1,629,826 | | 1,512,554 | | 963,201 | |
Accumulated depreciation | | (156,707 | ) | (142,071 | ) | (126,645 | ) | (112,243 | ) | (99,686 | ) |
Rental property, net | | 1,532,780 | | 1,521,184 | | 1,503,181 | | 1,400,311 | | 863,515 | |
| | | | | | | | | | | |
Assets held for sale | | 54,123 | | 101,499 | | 103,830 | | 142,500 | | 44,362 | |
Cash and cash equivalents | | 39,802 | | 35,482 | | 47,575 | | 43,511 | | 26,626 | |
Restricted cash | | 0 | | 0 | | 935 | | 1,435 | | 13,669 | |
Tenant, notes and other receivables, net | | 18,799 | | 16,267 | | 16,080 | | 16,135 | | 8,233 | |
Inventory | | 11,230 | | 2,343 | | 2,521 | | 3,085 | | 3,878 | |
Loan origination costs, net | | 14,403 | | 12,326 | | 14,965 | | 15,108 | | 11,921 | |
Loan reserves | | 31,019 | | 31,977 | | 28,564 | | 29,643 | | 32,414 | |
Goodwill | | 85,264 | | 86,126 | | 86,126 | | 86,126 | | 86,127 | |
Lease intangibles and customer relationships, net | | 19,106 | | 20,821 | | 21,476 | | 23,089 | | 10,987 | |
Prepaid expenses and other assets | | 6,476 | | 8,140 | | 8,916 | | 9,560 | | 24,101 | |
Total assets | | $ | 1,813,002 | | $ | 1,836,165 | | $ | 1,834,169 | | $ | 1,770,503 | | $ | 1,125,833 | |
Liabilities and Stockholders’ Equity | | | | | | | | | | | |
Notes payable and preferred interest | | $ | 1,001,622 | | $ | 977,473 | | $ | 937,887 | | $ | 901,682 | | $ | 773,394 | |
Liabilities related to assets held for sale | | 29,516 | | 34,610 | | 36,275 | | 33,423 | | 16,938 | |
Accounts payable and accrued expenses | | 53,382 | | 45,367 | | 41,902 | | 31,970 | | 19,862 | |
Tenant deposits and other liabilities | | 12,773 | | 12,380 | | 19,377 | | 11,383 | | 7,655 | |
Total liabilities | | 1,097,293 | | 1,069,830 | | 1,035,441 | | 978,458 | | 817,849 | |
| | | | | | | | | | | |
Minority interest | | 56,662 | | 59,485 | | 61,896 | | 37,175 | | 42,639 | |
| | | | | | | | | | | |
Stockholders’ equity | | | | | | | | | | | |
Preferred stock | | 119,108 | | 119,108 | | 119,108 | | 119,108 | | — | |
Common stock | | 409 | | 410 | | 410 | | 410 | | 170 | |
Paid-in capital | | 790,528 | | 792,462 | | 791,916 | | 791,916 | | 378,018 | |
Unearned compensation | | (235 | ) | (873 | ) | (923 | ) | (1,760 | ) | — | |
Accumulated other comprehensive income (expense) | | 1,208 | | 766 | | 1,284 | | (518 | ) | — | |
Retained deficit | | (251,971 | ) | (205,023 | ) | (174,963 | ) | (154,286 | ) | (112,843 | ) |
Total stockholders’ equity | | 659,047 | | 706,850 | | 736,832 | | 754,870 | | 265,345 | |
Total liabilities and stockholders’ equity | | 1,813,002 | | 1,836,165 | | $ | 1,834,169 | | $ | 1,770,503 | | $ | 1,125,833 | |
7
| | Debt Analysis |
| | As of December 31, 2004 |
($ in thousands) | | Debt
Amount | | % of Total
Debt | | Interest
Rate | | Maturity
Date | |
Fixed Rate Debt | | | | | | | | | |
Senior fixed rate mortgage due 2012 | | $ | 303,903 | | 30.4 | % | 7.35 | % | 2012 | |
Senior fixed rate mortgage due 2014 | | 213,333 | | 21.3 | % | 5.53 | % | 2014 | |
Senior fixed rate mortgage due 2009 | | 99,651 | | 9.9 | % | 5.05 | % | 2009 | |
Various individual fixed rate mortgages | | 153,818 | | 15.4 | % | 6.38 | % | 2005-2031 | |
Existing other loans | | 1,047 | | 0.1 | % | 8.67 | % | 2005 | |
Total fixed rate debt | | 771,752 | | 77.1 | % | 6.34 | % | | |
| | | | | | | | | |
Variable Rate Debt (a) | | | | | | | | | |
Senior variable rate mortgage due 2006 | | 150,871 | | 15.1 | % | 5.40 | % | 2006 | |
Floorplan lines of credit | | 27,999 | | 2.7 | % | 7.79 | % | 2005 | |
Revolving credit mortgage facility | | 51,000 | | 5.1 | % | 5.35 | % | 2005 | |
Total variable rate debt | | 229,870 | | 22.9 | % | 5.66 | % | | |
| | | | | | | | | |
Total debt | | $ | 1,001,622 | | 100.0 | % | 6.17 | % | | |
| | | | | | | | | |
% Fixed / Variable | | | | | | | | | |
Fixed | | $ | 771,752 | | 77.1 | % | 6.34 | % | | |
Variable | | 229,870 | | 22.9 | % | 5.66 | % | | |
Total debt | | $ | 1,001,622 | | 100.0 | % | 6.17 | % | | |
| | 2005 | | 2006 | | 2007 | | 2008 | | 2009 | | Thereafter | |
Maturity Schedule | | | | | | | | | | | | | |
Senior fixed rate mortgages | | $ | 7,435 | | $ | 7,917 | | $ | 8,431 | | $ | 8,916 | | $ | 101,138 | | $ | 483,050 | |
Various individual fixed rate mortgages (b) | | 3,476 | | 14,570 | | 2,359 | | 52,769 | | 12,317 | | 61,731 | |
Senior variable rate mortgage (c) | | 0 | | 150,871 | | 0 | | 0 | | 0 | | 0 | |
Floorplan lines of credit | | 27,999 | | 0 | | 0 | | 0 | | 0 | | 0 | |
Revolving credit mortgage facility | | 51,000 | | 0 | | 0 | | 0 | | 0 | | 0 | |
Other debt | | 1,047 | | 0 | | 0 | | 0 | | 0 | | 0 | |
Total debt maturities | | $ | 90,957 | | $ | 173,358 | | $ | 10,790 | | $ | 61,685 | | $ | 113,455 | | $ | 544,781 | |
(a) In February 2004, we entered into a two-year $100 million swap and purchased interest rate caps covering our senior variable rate mortgage.
(b) Does not include debt premium of $6,596 as of December 31, 2004.
(c) At our option, and subject to certain conditions, we may extend the senior variable rate mortgagte due 2006 for three additional twelve-month periods.
8
($ in thousands; except per share data) | | Three Months
Ended
12/31/04 | | Three Months
Ended
09/30/04 | | Three Months
Ended
06/30/04 | | Three Months
Ended
03/31/04 | |
| | | | | | | | | |
Revenue | | | | | | | | | |
Communities | | $ | 55,609 | | $ | 55,991 | | $ | 52,997 | | $ | 42,093 | |
Retail Sales | | 8,642 | | 3,880 | | 2,082 | | 644 | |
Consumer finance and insurance | | 231 | | 217 | | 85 | | 185 | |
Corporate and other | | 0 | | 0 | | 0 | | 0 | |
Total revenue | | 64,482 | | 60,088 | | 55,165 | | 42,922 | |
| | | | | | | | | |
Operating Expenses | | | | | | | | | |
Communities | | $ | 23,857 | | $ | 21,032 | | 17,626 | | 12,609 | |
Retail Sales | | 14,790 | | 6,265 | | 3,101 | | 843 | |
Consumer finance and insurance | | 556 | | 508 | | 162 | | 170 | |
Corporate and other | | (40 | ) | 22 | | 44 | | 83 | |
Real Estate taxes | | 5,114 | | 4,105 | | 4,080 | | 3,310 | |
Property management | | 2,082 | | 1,978 | | 1,600 | | 1,467 | |
General and administrative (a) | | 5,825 | | 4,441 | | 4,304 | | 14,791 | |
IPO related costs (a) | | 0 | | 0 | | 0 | | 4,417 | |
Total expenses | | 52,184 | | 38,351 | | 30,917 | | 37,691 | |
EBITDA (b) | | 12,298 | | 21,737 | | 24,248 | | 5,232 | |
| | | | | | | | | |
Early termination of debt (a) | | 0 | | 3,258 | | 0 | | 13,427 | |
Depreciation & amortization | | 21,196 | | 18,666 | | 17,242 | | 14,910 | |
Real estate and retail home asset impairment | | 3,591 | | 0 | | 0 | | 0 | |
Goodwill impairment | | 863 | | 0 | | 0 | | 0 | |
Net interest expense | | 15,477 | | 13,338 | | 12,332 | | 14,129 | |
Income (loss) before minority interest | | (28,829 | ) | (13,525 | ) | (5,326 | ) | (37,234 | ) |
Minority interest | | 1,429 | | 524 | | 452 | | 3,066 | |
Income (loss) from continuing operations | | (27,400 | ) | (13,001 | ) | (4,874 | ) | (34,168 | ) |
Discontinued operations, net | | (5,375 | ) | (1,633 | ) | 326 | | 431 | |
Income (loss) before preferred stock dividend | | (32,775 | ) | (14,634 | ) | (4,548 | ) | (33,737 | ) |
Preferred stock dividend | | (2,578 | ) | (2,577 | ) | (2,578 | ) | (1,232 | ) |
Income (loss) available to common stockholders | | $ | (35,353 | ) | $ | (17,211 | ) | $ | (7,126 | ) | $ | (34,969 | ) |
FFO Calculation (b) | | | | | | | | | |
Income (loss) from continuing operations (a) | | $ | (27,400 | ) | $ | (13,001 | ) | $ | (4,874 | ) | $ | (34,168 | ) |
Plus: | Depreciation and amortization | | 21,196 | | 18,666 | | 17,242 | | 14,910 | |
| Income from discontinued operations | | 565 | | 561 | | 374 | | 431 | |
| Depreciation from discontinued operations | | 171 | | 1,145 | | 1,047 | | 750 | |
Less: | Amortization of loan origination fees | | (3,505 | ) | (725 | ) | (855 | ) | (868 | ) |
| Depreciation on F, F & E | | (614 | ) | (363 | ) | (81 | ) | (369 | ) |
| Minority interest portion of FFO reconciling items | | (990 | ) | (1,074 | ) | (971 | ) | (1,162 | ) |
| Preferred stock dividends | | (2,578 | ) | (2,577 | ) | (2,578 | ) | (1,232 | ) |
FFO available to common stockholders (b) | | $ | (13,155 | ) | $ | 2,632 | | $ | 9,304 | | $ | (21,708 | ) |
| | | | | | | | | |
Plus: | Amortization of loan origination fees | | 3,505 | | 725 | | 855 | | 868 | |
| Early termination of debt (a) | | 0 | | 3,258 | | 0 | | 13,427 | |
| Depreciation on F, F & E | | 614 | | 363 | | 81 | | 369 | |
Less: | Recurring capital expenditures | | $ | (5,554 | ) | $ | (2,679 | ) | $ | (1,100 | ) | $ | (520 | ) |
| Scheduled principal amortization of indebtedness | | (2,332 | ) | (2,182 | ) | (2,200 | ) | (1,936 | ) |
Plus: | Minority interest portion of FAD reconciling items | | 209 | | 29 | | 130 | | (955 | ) |
Funds available for distribution (“FAD”) (b) | | $ | (16,713 | ) | $ | 2,146 | | $ | 7,069 | | $ | (10,455 | ) |
| | | | | | | | | |
EPS per share / unit | | | | | | | | | |
Basic | | $ | (0.87 | ) | $ | (0.42 | ) | $ | (0.17 | ) | $ | (1.20 | ) |
Diluted | | $ | (0.87 | ) | $ | (0.42 | ) | $ | (0.17 | ) | $ | (1.20 | ) |
FFO per share / unit | | | | | | | | | |
Basic | | $ | (0.32 | ) | $ | 0.06 | | $ | 0.23 | | $ | (0.74 | ) |
Diluted | | $ | (0.32 | ) | $ | 0.06 | | $ | 0.22 | | $ | (0.74 | ) |
FAD per share / unit | | | | | | | | | |
Basic | | $ | (0.41 | ) | $ | 0.05 | | $ | 0.17 | | $ | (0.36 | ) |
Diluted | | $ | (0.41 | ) | $ | 0.05 | | $ | 0.16 | | $ | (0.36 | ) |
| | | | | | | | | |
Distribution per common share / OP unit | | $ | 0.3125 | | $ | 0.3125 | | $ | 0.3125 | | $ | 0.1493 | |
Distribution per preferred share / OP unit | | $ | 0.5156 | | $ | 0.5156 | | $ | 0.5156 | | $ | 0.4182 | |
Basic weighted average common shares | | 40,858 | | 40,857 | | 40,857 | | 29,233 | |
Diluted weighted average common shares | | 45,042 | | 45,043 | | 43,269 | | 31,793 | |
(a) Includes certain one-time costs related to the IPO and the repayment of certain indebtedness.
(b) See Exhibit I for definition and reconciliation to nearest GAAP measure.
9
| | Three Months Ended | |
($ in thousands) | | 12/31/2004 | | 9/30/2004 | | 6/30/2004 | | 03/31/04 (a) | |
Revenue | | | | | | | | | |
Total real estate revenue | | $ | 55,609 | | $ | 55,991 | | $ | 52,997 | | $ | 42,093 | |
Retail homes sales revenue | | 8,642 | | 3,880 | | 2,082 | | 644 | |
Finance and insurance revenue | | 231 | | 217 | | 85 | | 185 | |
Corporate and other | | 0 | | 0 | | 0 | | 0 | |
Segment revenue | | 64,482 | | 60,088 | | 55,165 | | 42,922 | |
| | | | | | | | | |
Expenses | | | | | | | | | |
Property operations expense | | 23,857 | | 21,032 | | 17,626 | | 12,609 | |
Real estate taxes | | 5,114 | | 4,105 | | 4,080 | | 3,310 | |
Retail homes sales expense | | 14,790 | | 6,265 | | 3,101 | | 843 | |
Insurance and finance expense | | 556 | | 508 | | 162 | | 170 | |
Corporate and other | | (40 | ) | 22 | | 44 | | 83 | |
Segment expenses | | 44,277 | | 31,932 | | 25,013 | | 17,016 | |
| | | | | | | | | |
Net Segment Income | | | | | | | | | |
Real estate income | | 26,638 | | 30,854 | | 31,291 | | 26,173 | |
Retail homes sales income | | (6,148 | ) | (2,385 | ) | (1,019 | ) | (199 | ) |
Insurance and finance income | | (325 | ) | (291 | ) | (77 | ) | 15 | |
Corporate and other | | 40 | | (22 | ) | (44 | ) | (83 | ) |
Net segment income | | $ | 20,205 | | $ | 28,156 | | $ | 30,151 | | $ | 25,906 | |
| | | | | | | | | |
Other Data | | | | | | | | | |
EBITDA (b) | | $ | 12,298 | | $ | 21,737 | | $ | 24,248 | | $ | 5,232 | |
| | | | | | | | | |
FFO available to common stockholders (b) | | $ | (13,155 | ) | $ | 2,632 | | $ | 9,304 | | $ | (21,708 | ) |
| | | | | | | | | |
Net income (loss) | | $ | (35,353 | ) | $ | (17,211 | ) | $ | (7,126 | ) | $ | (34,969 | ) |
| | | | | | | | | |
IPO Related Charges | | $ | 0 | | $ | 0 | | $ | 0 | | $ | 27,914 | |
(a) Includes certain one-time costs related to the IPO and the repayment of certain indebtedness.
(b) See Exhibit I for definition and reconciliation to nearest GAAP measure.
10
| | 2004 | | 2003 | |
($ in thousands) | | 4th Qtr | | 3rd Qtr | | 2nd Qtr | | 1st Qtr | | 4th Qtr | | 3rd Qtr | | 2nd Qtr | | 1st Qtr | |
For the full quarter noted: | | | | | | | | | | | | | | | | | |
Average total homesites | | 36,925 | | 36,925 | | 36,925 | | 36,925 | | 36,923 | | 36,923 | | 36,908 | | 36,842 | |
Average total rental homes | | 6,569 | | 6,687 | | 6,319 | | 5,768 | | 5,468 | | 5,086 | | 4,689 | | 4,496 | |
Average occupied homesites – homeowners | | 25,817 | | 26,149 | | 26,734 | | 27,319 | | 27,839 | | 28,513 | | 29,148 | | 29,678 | |
Average occupied homesites – home renters | | 4,960 | | 4,897 | | 4,650 | | 4,402 | | 4,255 | | 4,099 | | 3,809 | | 3,390 | |
Average occupied homesites – total | | 30,777 | | 31,046 | | 31,384 | | 31,721 | | 32,093 | | 32,612 | | 32,957 | | 33,068 | |
Average occupancy – rental homes | | 75.5 | % | 73.2 | % | 73.6 | % | 76.3 | % | 77.9 | % | 80.6 | % | 81.2 | % | 75.4 | % |
Average occupancy – total | | 83.4 | % | 84.1 | % | 85.0 | % | 85.9 | % | 86.9 | % | 88.3 | % | 89.3 | % | 89.8 | % |
| | | | | | | | | | | | | | | | | |
For the full quarter noted: | | | | | | | | | | | | | | | | | |
Real estate revenue | | | | | | | | | | | | | | | | | |
Homeowner rental income | | $ | 22,178 | | $ | 22,413 | | $ | 22,778 | | $ | 23,202 | | $ | 23,277 | | $ | 23,060 | | $ | 23,648 | | $ | 23,887 | |
Home renter rental income | | 9,319 | | 9,073 | | 8,935 | | 8,440 | | 7,987 | | 8,333 | | 7,707 | | 6,868 | |
Other | | 122 | | 125 | | 128 | | 107 | | 106 | | 27 | | 6 | | 32 | |
Rental income | | 31,619 | | 31,611 | | 31,841 | | 31,749 | | 31,370 | | 31,420 | | 31,360 | | 30,786 | |
Utility and other income | | 3,212 | | 3,498 | | 3,410 | | 3,214 | | 3,343 | | 3,485 | | 3,223 | | 3,336 | |
Total real estate revenue | | 34,831 | | 35,109 | | 35,251 | | 34,963 | | 34,713 | | 34,905 | | 34,583 | | 34,122 | |
Real estate expenses | | | | | | | | | | | | | | | | | |
Property operations expenses | | 13,450 | | 13,232 | | 11,355 | | 10,493 | | 12,302 | | 11,361 | | 10,574 | | 10,545 | |
Real estate taxes | | 3,165 | | 2,845 | | 2,876 | | 2,880 | | 2,695 | | 2,426 | | 2,399 | | 2,521 | |
Total real estate expenses | | 16,615 | | 16,077 | | 14,231 | | 13,373 | | 14,997 | | 13,788 | | 12,972 | | 13,066 | |
| | | | | | | | | | | | | | | | | |
Real estate net segment income (a) | | $ | 18,216 | | $ | 19,032 | | $ | 21,020 | | $ | 21,590 | | $ | 19,716 | | $ | 21,117 | | $ | 21,611 | | $ | 21,056 | |
| | | | | | | | | | | | | | | | | |
Average monthly real estate revenue per total occupied homesite (b) | | $ | 377 | | $ | 377 | | $ | 374 | | $ | 367 | | $ | 361 | | $ | 357 | | $ | 350 | | $ | 344 | |
Average monthly homeowner rental income per homeowner occupied homesite (c) | | $ | 286 | | $ | 286 | | $ | 284 | | $ | 283 | | $ | 279 | | $ | 270 | | $ | 270 | | $ | 268 | |
Average monthly real estate revenue per total homesite (d) | | $ | 314 | | $ | 317 | | $ | 318 | | $ | 316 | | $ | 313 | | $ | 315 | | $ | 312 | | $ | 309 | |
Average monthly home renter income per occupied rental home (e) | | $ | 626 | | $ | 618 | | $ | 641 | | $ | 639 | | $ | 626 | | $ | 678 | | $ | 674 | | $ | 675 | |
At end of quarter: | | | | | | | | | | | | | | | | | |
Total communities owned | | 196 | | 196 | | 196 | | 196 | | 196 | | 196 | | 196 | | 196 | |
Total homesites | | 36,925 | | 36,925 | | 36,925 | | 36,925 | | 36,923 | | 36,923 | | 36,923 | | 36,861 | |
Occupied homesites | | 30,631 | | 30,966 | | 31,105 | | 31,640 | | 31,729 | | 32,334 | | 32,805 | | 33,030 | |
Total rental homes owned | | 6,424 | | 6,803 | | 6,579 | | 6,092 | | 5,492 | | 5,423 | | 4,824 | | 4,547 | |
Occupied rental homes | | 4,924 | | 5,263 | | 4,964 | | 4,873 | | 4,459 | | 4,390 | | 4,192 | | 3,786 | |
| | | | | | | | | | | | | | | | | |
Homeowner activity (f): | | | | | | | | | | | | | | | | | |
Homeowner move ins | | 40 | | 104 | | 103 | | 122 | | 156 | | 196 | | 278 | | 175 | |
Homeowner move outs | | (436 | ) | (379 | ) | (373 | ) | (285 | ) | (367 | ) | (365 | ) | (333 | ) | (262 | ) |
Home sales | | 741 | | 156 | | 53 | | 14 | | — | | — | | — | | — | |
Repossession move outs | | (341 | ) | (319 | ) | (409 | ) | (354 | ) | (463 | ) | (500 | ) | (576 | ) | (311 | ) |
Net homeowner activity | | 4 | | (438 | ) | (626 | | (503 | ) | (674 | ) | (669 | ) | (631 | ) | (398 | ) |
Home renter activity (f): | | | | | | | | | | | | | | | | | |
Home renter move ins | | 581 | | 1,442 | | 1,191 | | 1,277 | | 1,063 | | 1,230 | | 1,232 | | 1,047 | |
Home renter lease to own move ins | | 235 | | 27 | | — | | — | | — | | — | | — | | — | |
Home renter move outs | | (1,155 | ) | (1,170 | ) | (1,100 | ) | (863 | ) | (994 | ) | (1,032 | ) | (826 | ) | (739 | ) |
Net home renter activity | | (339 | ) | 299 | | 91 | | 414 | | 69 | | 198 | | 406 | | 308 | |
Net activity | | (335 | ) | (139 | ) | (535 | ) | (89 | ) | (605 | ) | (471 | ) | (225 | ) | (90 | ) |
Net homeowner activity | | 4 | | (438 | ) | (626 | ) | (503 | ) | (674 | ) | (669 | ) | (631 | ) | (398 | ) |
Occupied homeowner sites, beginning of period | | 25,703 | | 26,141 | | 26,767 | | 27,270 | | 27,944 | | 28,613 | | 29,244 | | 29,642 | |
Occupied homeowner sites, end of period | | 25,707 | | 25,703 | | 26,141 | | 26,767 | | 27,270 | | 27,944 | | 28,613 | | 29,244 | |
Net home renter activity | | (339 | ) | 299 | | 91 | | 414 | | 69 | | 198 | | 406 | | 308 | |
Occupied home renter sites, beginning of period | | 5,263 | | 4,964 | | 4,873 | | 4,459 | | 4,390 | | 4,192 | | 3,786 | | 3,478 | |
Occupied home renter sites, end of period | | 4,924 | | 5,263 | | 4,964 | | 4,873 | | 4,459 | | 4,390 | | 4,192 | | 3,786 | |
Total occupied homesites, end of period | | 30,631 | | 30,966 | | 31,105 | | 31,640 | | 31,729 | | 32,334 | | 32,805 | | 33,030 | |
Occupancy percentage | | 83.0 | % | 83.9 | % | 84.2 | % | 85.7 | % | 85.9 | % | 87.6 | % | 88.8 | % | 89.6 | % |
(a) See Exhibit I for definition and reconciliation to nearest GAAP measure.
(b) Average monthly real estate revenue per occupied homesite is defined as total real estate revenue (including homeowner, home renter, utility and other revenue) divided by average total occupied homesites divided by the number of months in the period.
(c) Average monthly homeowner rental income per homeowner occupied homesite is defined as homeowner rental income divided by average homeowner occupied homesites divided by the number of months in the period.
(d) Average monthly real estate revenue per total homesite is defined as total real estate revenue divided by average total homesites divided by the number of months in the period.
(e) Average monthly home renter income per occupied rental home is defined as total home renter rental income divided by average occupied rental homes divided by the number of months in the period.
(f) Occupancy totals for the quarter ended December 31, 2003 reflect an adjustment from previous reported amounts to conform with current year homeowner and home renter clasifications.
11
| | 2004 | | 2003 | |
($ in thousands) | | 4th Qtr | | 3rd Qtr | | 2nd Qtr | | 1st Qtr | | 4th Qtr | | 3rd Qtr | | 2nd Qtr | | 1st Qtr | |
For the full quarter noted: | | | | | | | | | | | | | | | | | |
Average total homesites | | 63,661 | | 63,521 | | 60,539 | | 48,575 | | 37,691 | | 37,417 | | 37,233 | | 36,934 | |
Average total rental homes | | 8,312 | | 8,294 | | 7,609 | | 6,296 | | 5,534 | | 5,856 | | 5,443 | | 4,479 | |
Average occupied homesites – homeowners | | 46,267 | | 46,899 | | 45,159 | | 36,466 | | 28,326 | | 28,984 | | 29,493 | | 29,889 | |
Average occupied homesites – home renters | | 5,955 | | 5,694 | | 5,227 | | 4,594 | | 4,154 | | 4,001 | | 3,727 | | 3,253 | |
Average occupied homesites – total | | 52,222 | | 52,592 | | 50,386 | | 41,060 | | 32,480 | | 32,985 | | 33,220 | | 33,142 | |
Average occupancy – rental homes | | 71.6 | % | 68.6 | % | 68.7 | % | 73.0 | % | 75.1 | % | 68.3 | % | 68.5 | % | 72.6 | % |
Average occupancy – total | | 82.0 | % | 82.8 | % | 83.2 | % | 84.5 | % | 86.2 | % | 88.2 | % | 89.2 | % | 89.7 | % |
| | | | | | | | | | | | | | | | | |
For the full quarter noted: | | | | | | | | | | | | | | | | | |
Real estate revenue | | | | | | | | | | | | | | | | | |
Homeowner rental income | | $ | 38,334 | | $ | 39,804 | | $ | 37,575 | | $ | 29,424 | | $ | 25,084 | | $ | 27,026 | | $ | 27,262 | | $ | 26,987 | |
Home renter rental income | | 11,090 | | 10,468 | | 9,987 | | 8,740 | | 6,518 | | 4,642 | | 4,354 | | 3,888 | |
Other | | 290 | | 313 | | 322 | | 148 | | 90 | | 34 | | (7 | ) | 36 | |
Rental income | | 49,714 | | 50,585 | | 47,884 | | 38,312 | | 31,691 | | 31,702 | | 31,609 | | 30,911 | |
Utility and other income | | 5,895 | | 5,406 | | 5,113 | | 3,758 | | 3,959 | | 3,927 | | 3,647 | | 4,067 | |
Total real estate revenue | | 55,609 | | 55,991 | | 52,997 | | 42,071 | | 35,650 | | 35,629 | | 35,256 | | 34,978 | |
| | | | | | | | | | | | | | | | | |
Real estate expenses | | | | | | | | | | | | | | | | | |
Property operations expenses | | 23,857 | | 21,032 | | 17,626 | | 12,609 | | 12,070 | | 11,379 | | 10,585 | | 10,333 | |
Real estate taxes | | 5,114 | | 4,105 | | 4,080 | | 3,310 | | 2,705 | | 2,472 | | 2,369 | | 2,503 | |
Total real estate expenses | | 28,971 | | 25,137 | | 21,706 | | 15,920 | | 14,775 | | 13,850 | | 12,954 | | 12,836 | |
| | | | | | | | | | | | | | | | | |
Real estate net segment income (a) | | $ | 26,638 | | $ | 30,854 | | $ | 31,291 | | $ | 26,151 | | $ | 20,875 | | $ | 21,779 | | $ | 22,302 | | $ | 22,142 | |
| | | | | | | | | | | | | | | | | |
Average monthly real estate revenue per total occupied homesite (b) | | $ | 355 | | $ | 355 | | $ | 351 | | $ | 342 | | $ | 366 | | $ | 360 | | $ | 354 | | $ | 352 | |
Average monthly homeowner rental income per homeowner occupied homesite (c) | | $ | 276 | | $ | 283 | | $ | 277 | | $ | 269 | | $ | 295 | | $ | 311 | | $ | 308 | | $ | 301 | |
Average monthly real estate revenue per total homesite (d) | | $ | 291 | | $ | 294 | | $ | 292 | | $ | 289 | | $ | 315 | | $ | 317 | | $ | 316 | | $ | 316 | |
Average monthly home renter income per occupied rental home (e) | | $ | 621 | | $ | 613 | | $ | 637 | | $ | 634 | | $ | 523 | | $ | 387 | | $ | 389 | | $ | 398 | |
At end of quarter: | | | | | | | | | | | | | | | | | |
Total communities owned | | 315 | | 315 | | 313 | | 272 | | 199 | | 199 | | 199 | | 198 | |
Total homesites | | 63,661 | | 63,661 | | 63,400 | | 59,586 | | 37,552 | | 37,552 | | 37,372 | | 37,063 | |
Occupied homesites | | 51,913 | | 52,604 | | 52,613 | | 49,947 | | 32,104 | | 32,739 | | 33,193 | | 33,116 | |
Total rental homes owned | | 8,286 | | 8,540 | | 8,023 | | 7,192 | | 5,558 | | 5,488 | | 4,828 | | 4,551 | |
Occupied rental homes | | 6,005 | | 6,243 | | 5,713 | | 5,516 | | 4,233 | | 4,164 | | 4,023 | | 3,626 | |
| | | | | | | | | | | | | | | | | |
Homeowner activity (f): | | | | | | | | | | | | | | | | | |
Homeowner move ins | | 99 | | 124 | | 149 | | 171 | | 160 | | 210 | | 287 | | 175 | |
Homeowner move outs | | (952 | ) | (749 | ) | (649 | ) | (493 | ) | (397 | ) | (374 | ) | (239 | ) | (320 | ) |
Home sales | | 946 | | 280 | | 100 | | 15 | | — | | — | | — | | — | |
Repossession move outs | | (546 | ) | (476 | ) | (561 | ) | (484 | ) | (467 | ) | (507 | ) | (581 | ) | (313 | ) |
Net homeowner activity | | (453 | ) | (821 | ) | (961 | ) | (791 | ) | (704 | ) | (671 | ) | (533 | ) | (458 | ) |
Home renter activity (f): | | | | | | | | | | | | | | | | | |
Home renter move ins | | 792 | | 1,877 | | 1,530 | | 1,450 | | 1,065 | | 1,236 | | 1,235 | | 1,157 | |
Home renter lease to own move ins | | 348 | | 38 | | — | | — | | — | | — | | — | | — | |
Home renter move outs | | (1,378 | ) | (1,385 | ) | (1,356 | ) | (1,052 | ) | (996 | ) | (1,095 | ) | (838 | ) | (685 | ) |
Net home renter activity | | (238 | ) | 530 | | 174 | | 398 | | 69 | | 141 | | 397 | | 472 | |
Net activity | | (691 | ) | (291 | ) | (787 | ) | (393 | ) | (635 | ) | (530 | ) | (136 | ) | 14 | |
Acquisitions and other- homeowners | | — | | 282 | | 3,430 | | 17,351 | | — | | 76 | | 213 | | 181 | |
Acquisitions and other- home renters | | — | | — | | 23 | | 885 | | — | | — | | — | | — | |
Net activity, including acquisitions and other | | (691 | ) | (9 | ) | 2,666 | | 17,843 | | (635 | ) | (454 | ) | 77 | | 195 | |
Net homeowner activity | | (453 | ) | (539 | ) | 2,469 | | 16,560 | | (704 | ) | (595 | ) | (320 | ) | (277 | ) |
Occupied homeowner sites, beginning of period | | 46,361 | | 46,900 | | 44,431 | | 27,871 | | 28,575 | | 29,170 | | 29,490 | | 29,767 | |
Occupied homeowner sites, end of period | | 45,908 | | 46,361 | | 46,900 | | 44,431 | | 27,871 | | 28,575 | | 29,170 | | 29,490 | |
Net home renter activity | | (238 | ) | 530 | | 197 | | 1,283 | | 69 | | 141 | | 397 | | 472 | |
Occupied home renter sites, beginning of period | | 6,243 | | 5,713 | | 5,516 | | 4,233 | | 4,164 | | 4,023 | | 3,626 | | 3,154 | |
Occupied home renter sites, end of period | | 6,005 | | 6,243 | | 5,713 | | 5,516 | | 4,233 | | 4,164 | | 4,023 | | 3,626 | |
Total occupied homesites, end of period | | 51,913 | | 52,604 | | 52,613 | | 49,947 | | 32,104 | | 32,739 | | 33,193 | | 33,116 | |
Occupancy percentage | | 81.5 | % | 82.6 | % | 83.0 | % | 83.8 | % | 85.5 | % | 87.2 | % | 88.8 | % | 89.4 | % |
(a) See Exhibit I for definition and reconciliation to nearest GAAP measure.
(b) Average monthly real estate revenue per occupied homesite is defined as total real estate revenue (including homeowner, home renter, utility and other revenue) divided by average total occupied homesites divided by the number of months in the period.
(c) Average monthly homeowner rental income per homeowner occupied homesite is defined as homeowner rental income divided by average homeowner occupied homesites divided by the number of months in the period.
(d) Average monthly real estate revenue per total homesite is defined as total real estate revenue divided by average total homesites divided by the number of months in the period.
(e) Average monthly home renter income per occupied rental home is defined as total home renter rental income divided by average occupied rental homes divided by the number of months in the period.
(f) Occupancy totals for the quarter ended December 31, 2003 reflect an adjustment from previous reported amounts to conform with current year homeowner and home renter clasifications.
12
| | Three Months Ended | |
($ in thousands) | | 12/31/04 | | 09/30/04 | | 06/30/04 | | 03/31/04 | |
| | | | | | | | | |
Recurring capital expenditures (a) | | $ | 5,554 | | $ | 2,679 | | $ | 1,100 | | $ | 520 | |
| | | | | | | | | |
Recurring capital expenditures per average site per annum | | 349 | | 169 | | 73 | | 39 | |
| | | | | | | | | |
Homesite upgrades (b) | | 4,056 | | 2,336 | | 1,482 | | 1,042 | |
| | | | | | | | | |
Expansion, development, renovation and improvements (c) | | 11,610 | | 5,337 | | 4,730 | | 1,955 | |
| | | | | | | | | | | | | |
Total capital improvements | | $ | 21,220 | | $ | 10,352 | | $ | 7,312 | | $ | 3,517 | |
(a) Includes capital expenditures necessary to maintain asset quality, including purchasing and replacing assets used to operate the community. These capital expenditures include repairs of roads, driveways, pools, renovation of clubhouses and replacement or installation of street lights, playground equipment, signage, maintenance facilities, manager housing and property vehicles. These capital expenditures do not include water meters, sheds, homes or community acquisitions. Our minimum capitalizable amount of a project is $500.
(b) Includes capital expenditures that improve homesites for placement of a new home typically when an existing older home moves out and the site is prepared for a new home. Many of these activities are governed by manufacturers’ installation requirements and state building codes and include grading, electrical, concrete, landscaping, drainage and water/sewer lines. We estimate that the new home will be in the community for an average of at least 20 years although we depreciate these costs over 10 years.
(c) These are the costs to develop, expand, renovate and improve communities following acquisition. They include costs for engineering, driveways, paving, utilities, and amenities.
13
| | Three Months Ended | |
($ in thousands) | | 12/31/04 | | 09/30/04 | | 06/30/04 | | 03/31/04 | |
| | | | | | | | | |
Home purchase data | | | | | | | | | |
Number of manufactured homes purchased (a) | | 692 | | 815 | | 952 | | 1,565 | |
| | | | | | | | | |
Home sales data | | | | | | | | | |
New homes sold | | 6 | | 21 | | 11 | | 13 | |
Used homes sold | | 940 | | 277 | | 110 | | 9 | |
Total homes sales | | 946 | | 298 | | 121 | | 22 | |
| | | | | | | | | |
Average homes sale price | | $ | 9,135 | | $ | 13,020 | | $ | 17,207 | | $ | 29,273 | |
| | | | | | | | | |
Home Inventory Data | | | | | | | | | |
Home inventory | | 8,286 | | 8,540 | | 8,023 | | 7,192 | |
| | | | | | | | | |
Gross asset value including setup costs ($000’s) | | $ | 197,668 | | $ | 197,511 | | $ | 181,349 | | $ | 154,655 | |
Gross asset value per home | | 23,856 | | 23,128 | | 22,604 | | 21,504 | |
| | | | | | | | | |
Current asset value including setup costs ($000’s) | | $ | 169,689 | | $ | 171,685 | | $ | 159,212 | | $ | 136,075 | |
Current asset value per home | | 20,479 | | 20,104 | | 19,844 | | 18,920 | |
| | | | | | | | | |
(a) Includes manufactured homes purchased in our Hometown and other acquisitions.
14
| | Number of
Total | | Percentage of
Total | | Occupancy | | Rental Income Per Occupied
Homesite Per Month (b) (c) | |
Market (a) | | Homesites | | Homesites | | 12/31/04 | | 09/30/04 | | 06/30/04 | | 03/31/04 | | 12/31/04 | | 09/30/04 | | 06/30/04 | | 03/31/04 (d) | |
| | | | | | | | | | | | | | | | | | | | | |
Dallas – Ft. Worth, TX | | 7,250 | | 11.4 | % | 77.4 | % | 76.1 | % | 76.0 | % | 78.0 | % | $ | 357 | | $ | 349 | | $ | 351 | | $ | 347 | |
Atlanta, GA | | 4,994 | | 7.8 | % | 84.8 | % | 84.0 | % | 83.1 | % | 83.5 | % | 340 | | 328 | | 325 | | 323 | |
Salt Lake City, UT | | 3,834 | | 6.0 | % | 90.1 | % | 91.1 | % | 91.0 | % | 93.1 | % | 342 | | 341 | | 347 | | 349 | |
Front Range of CO | | 3,289 | | 5.2 | % | 86.7 | % | 88.1 | % | 89.2 | % | 91.6 | % | 431 | | 425 | | 423 | | 419 | |
Kansas City – Lawrence – Topeka, MO – KS | | 2,430 | | 3.8 | % | 87.0 | % | 88.4 | % | 88.9 | % | 89.3 | % | 284 | | 283 | | 277 | | 274 | |
Jacksonville, FL | | 2,256 | | 3.5 | % | 86.4 | % | 86.0 | % | 86.3 | % | 86.8 | % | 337 | | 331 | | 333 | | 330 | |
Wichita, KS | | 2,215 | | 3.5 | % | 62.3 | % | 64.8 | % | 65.5 | % | 69.7 | % | 290 | | 282 | | 283 | | 282 | |
Orlando, FL | | 1,989 | | 3.1 | % | 87.5 | % | 86.3 | % | 87.1 | % | 87.7 | % | 337 | | 329 | | 328 | | 326 | |
St. Louis, MO – IL | | 1,950 | | 3.1 | % | 78.5 | % | 80.4 | % | 82.1 | % | 81.4 | % | 290 | | 288 | | 286 | | 276 | |
Oklahoma City, OK | | 1,895 | | 3.0 | % | 77.2 | % | 79.0 | % | 78.5 | % | 81.3 | % | 309 | | 304 | | 301 | | 288 | |
Greensboro – Winston Salem, NC | | 1,412 | | 2.2 | % | 68.9 | % | 68.1 | % | 69.2 | % | 72.0 | % | 256 | | 253 | | 259 | | 257 | |
Davenport – Moline – Rock Island, IA – IL | | 1,406 | | 2.2 | % | 84.4 | % | 85.7 | % | 84.7 | % | 84.5 | % | 267 | | 264 | | 262 | | 258 | |
Inland Empire, CA | | 1,223 | | 1.9 | % | 92.0 | % | 91.7 | % | 89.4 | % | 90.6 | % | 414 | | 410 | | 406 | | 412 | |
Elkhart – Goshen, IN | | 1,217 | | 1.9 | % | 79.9 | % | 79.5 | % | 79.4 | % | 79.7 | % | 317 | | 314 | | 313 | | 305 | |
Charleston – North Charleston, SC | | 1,180 | | 1.9 | % | 77.8 | % | 76.2 | % | 76.5 | % | 78.4 | % | 233 | | 233 | | 232 | | 239 | |
Southeast Florida | | 1,124 | | 1.8 | % | 95.5 | % | 95.9 | % | 95.7 | % | 94.4 | % | 481 | | 476 | | 476 | | 473 | |
Nashville, TN | | 1,102 | | 1.7 | % | 68.7 | % | 71.5 | % | 71.1 | % | 70.8 | % | 279 | | 273 | | 267 | | 262 | |
Raleigh – Durham – Chapel Hill, NC | | 1,095 | | 1.7 | % | 82.9 | % | 82.0 | % | 81.4 | % | 85.1 | % | 329 | | 326 | | 324 | | 321 | |
Syracuse, NY | | 1,091 | | 1.7 | % | 55.4 | % | 56.9 | % | 62.0 | % | 61.9 | % | 337 | | 338 | | 347 | | 354 | |
Tampa – Lakeland – Winter Haven, FL | | 999 | | 1.6 | % | 77.8 | % | 79.5 | % | 77.0 | % | 75.5 | % | 277 | | 269 | | 265 | | 262 | |
Subtotal – Top 20 Markets | | 43,951 | | 69.0 | % | 81.2 | % | 81.3 | % | 81.3 | % | 82.6 | % | 337 | | 331 | | 330 | | 325 | |
All Other Markets | | 19,710 | | 31.0 | % | 82.7 | % | 80.4 | % | 81.1 | % | 80.1 | % | 294 | | 303 | | 300 | | 293 | |
Total / Weighted Average | | 63,661 | | 100.0 | % | 81.5 | % | 82.6 | % | 83.0 | % | 83.8 | % | $ | 317 | | $ | 321 | | $ | 317 | | $ | 311 | |
(a) Markets are defined by our management.
(b) Rental Income is defined as homeowner rental income, home renter rental income and other rental income reduced by move-in bonuses and rent concessions.
(c) For communities acquired during the quarter, weighted average all-in rent (homesite rent and home rent) was used as a proxy for “Rental Income Per Occupied Homesite Per Month”.
(d) For communities acquired during the quarter, weighted average all-in rent (homesite rent and home rent) was used as a proxy for “Rental Income Per Occupied Homesite Per Month”.
15
QUARTERLY 2004
| | | | | | Q4 2004 | | Q3 2004 (c) | | Q2 2004 (b) | | Q1 2004 (a) | |
Occupancy
12/31/04 | | Comm. | | Home-
sites | | Revenue | | NSI ** | | Margin % | | Revenue | | NSI ** | | Margin % | | Revenue | | NSI ** | | Margin % | | Revenue | | NSI ** | | Margin % | |
| | | | | | | | | | | | | | | | | | | | | | | | | | | | | |
Same Communities | | | | | | | | | | | | | | | | | | | | | | | | | | | | | |
90 - 100% | | 67 | | 13,695 | | $ | 15,655 | | $ | 8,776 | | 56.1 | % | $ | 15,699 | | $ | 10,032 | | 63.9 | % | $ | 15,650 | | $ | 10,505 | | 67.1 | % | $ | 15,406 | | $ | 10,296 | | 66.8 | % |
80 - 89.9% | | 53 | | 9,325 | | 8,788 | | 5,071 | | 57.7 | % | 8,869 | | 4,988 | | 56.2 | % | 8,907 | | 5,385 | | 60.5 | % | 8,872 | | 5,694 | | 64.2 | % |
70 - 79.9% | | 41 | | 7,318 | | 5,824 | | 2,613 | | 44.9 | % | 5,909 | | 2,515 | | 42.6 | % | 5,942 | | 2,954 | | 49.7 | % | 5,906 | | 3,188 | | 54.0 | % |
< 70% | | 35 | | 6,587 | | 4,564 | | 1,756 | | 38.5 | % | 4,632 | | 1,498 | | 32.3 | % | 4,752 | | 2,175 | | 45.8 | % | 4,780 | | 2,391 | | 50.0 | % |
Total | | 196 | | 36,925 | | $ | 34,831 | | $ | 18,216 | | 52.3 | % | $ | 35,109 | | $ | 19,033 | | 54.2 | % | $ | 35,251 | | $ | 21,019 | | 59.6 | % | $ | 34,963 | | $ | 21,569 | | 61.7 | % |
| | | | | | | | | | | | | | | | | | | | | | | | | | | | | |
Acquired Communities | | | | | | | | | | | | | | | | | | | | | | | | | | | | | |
90 - 100% | | 41 | | 5,762 | | $ | 5,338 | | $ | 2,129 | | 39.9 | % | $ | 5,346 | | $ | 3,420 | | 64.0 | % | $ | 3,687 | | $ | 2,231 | | 60.5 | % | $ | 1,426 | | $ | 1,074 | | 75.3 | % |
80 - 89.9% | | 38 | | 9,297 | | 7,959 | | 3,582 | | 45.0 | % | 7,852 | | 4,443 | | 56.6 | % | 7,034 | | 4,314 | | 61.3 | % | 2,735 | | 1,694 | | 61.9 | % |
70 - 79.9% | | 21 | | 5,848 | | 4,053 | | 1,641 | | 40.5 | % | 4,149 | | 2,343 | | 56.5 | % | 3,688 | | 2,010 | | 54.5 | % | 1,472 | | 986 | | 67.0 | % |
< 70% | | 19 | | 5,829 | | 3,429 | | 1,071 | | 31.2 | % | 3,535 | | 1,616 | | 45.7 | % | 3,338 | | 1,716 | | 51.4 | % | 1,496 | | 828 | | 55.4 | % |
Total | | 119 | | 26,736 | | $ | 20,778 | | $ | 8,422 | | 40.5 | % | $ | 20,882 | | $ | 11,822 | | 56.6 | % | $ | 17,746 | | $ | 10,271 | | 57.9 | % | $ | 7,129 | | $ | 4,582 | | 64.3 | % |
| | | | | | | | | | | | | | | | | | | | | | | | | | | | | |
Total Real Estate Segment | | | | | | | | | | | | | | | | | | | | | | | | | | | | | |
90 - 100% | | 108 | | 19,457 | | $ | 20,993 | | $ | 10,905 | | 51.9 | % | $ | 21,045 | | $ | 13,452 | | 63.9 | % | $ | 19,337 | | $ | 12,736 | | 65.9 | % | $ | 16,832 | | $ | 11,371 | | 67.6 | % |
80 - 89.9% | | 91 | | 18,622 | | 16,747 | | 8,653 | | 51.7 | % | 16,721 | | 9,430 | | 56.4 | % | 15,941 | | 9,699 | | 60.8 | % | 11,606 | | 7,388 | | 63.7 | % |
70 - 79.9% | | 62 | | 13,166 | | 9,877 | | 4,254 | | 43.1 | % | 10,058 | | 4,858 | | 48.3 | % | 9,630 | | 4,964 | | 51.5 | % | 7,377 | | 4,174 | | 56.6 | % |
< 70% | | 54 | | 12,416 | | 7,992 | | 2,827 | | 35.4 | % | 8,166 | | 3,113 | | 38.1 | % | 8,090 | | 3,892 | | 48.1 | % | 6,276 | | 3,219 | | 51.3 | % |
Total | | 315 | | 63,661 | | $ | 55,609 | | $ | 26,638 | | 47.9 | % | $ | 55,991 | | $ | 30,854 | | 55.1 | % | $ | 52,997 | | $ | 31,291 | | 59.0 | % | $ | 42,092 | | $ | 26,151 | | 62.1 | % |
FULL YEAR 2004
| | | | | | Full Year 2004 | |
| | Comm. | | Home-
sites | | Revenue | | NSI ** | | Margin
% | |
| | | | | | | | | | | |
Same Communities | | | | | | | | | | | |
90 - 100% | | 67 | | 13,695 | | $ | 62,409 | | $ | 39,609 | | 63.5 | % |
80 - 89.9% | | 53 | | 9,325 | | 35,436 | | 21,138 | | 59.7 | % |
70 - 79.9% | | 41 | | 7,318 | | 23,581 | | 11,270 | | 47.8 | % |
< 70% | | 35 | | 6,587 | | 18,728 | | 7,820 | | 41.8 | % |
Total | | 196 | | 36,925 | | $ | 140,154 | | $ | 79,837 | | 57.0 | % |
| | | | | | | | | | | |
Acquired Communities | | | | | | | | | | | |
90 - 100% | | 41 | | 5,762 | | $ | 15,797 | | $ | 8,855 | | 56.1 | % |
80 - 89.9% | | 38 | | 9,297 | | 25,579 | | 14,032 | | 54.9 | % |
70 - 79.9% | | 21 | | 5,848 | | 13,362 | | 6,980 | | 52.2 | % |
< 70% | | 19 | | 5,829 | | 11,797 | | 5,230 | | 44.3 | % |
Total | | 119 | | 26,736 | | $ | 66,535 | | $ | 35,097 | | 52.7 | % |
| | | | | | | | | | | |
Total Real Estate Segment | | | | | | | | | | | |
90 - 100% | | 108 | | 19,457 | | $ | 78,206 | | $ | 48,464 | | 62.0 | % |
80 - 89.9% | | 91 | | 18,622 | | 61,015 | | 35,170 | | 57.6 | % |
70 - 79.9% | | 62 | | 13,166 | | 36,943 | | 18,250 | | 49.4 | % |
< 70% | | 54 | | 12,416 | | 30,525 | | 13,050 | | 42.8 | % |
Total | | 315 | | 63,661 | | $ | 206,689 | | $ | 114,934 | | 55.6 | % |
** NSI is real estate net segment income
(a) Quarter in which we acquired communities from Hometown America in connection with the IPO in February 2004.
(b) First full quarter of ownership of Hometown communities. We acquired 37 communities acquired from D.A.M. Management on June 30, 2004.
(c) First full quarter of ownership of D.A.M. Management communities.
16
($ in thousands)
Acquisitions
Acquisition
Date | | Market | | Number of
Communities | | Number of
Homesites | | Allocated
Purchase Price | | Debt
Assumed | | Cash | | Fair Market
Value of
OP Units/shares | |
02/18/04 | | Various | | 90 | | 26,406 | | $ | 615,270 | | $ | 92,434 | | $ | 522,836 | | $ | 0 | |
02/26/04 | | Nashville, TN | | 2 | | 401 | | 7,400 | | 0 | | 7,400 | | 0 | |
06/18/04 | | Salt Lake City | | 2 | | 243 | | 5,456 | | 0 | | 5,456 | | 0 | |
06/30/04 | | Various | | 36 | | 3,573 | | 61,500 | | 28,358 | | 0 | | 33,142 | |
07/20/04 | | Salt Lake City | | 1 | | 145 | | 4,126 | | 3,759 | | 367 | | 0 | |
09/28/04 | | Salt Lake City | | 1 | | 137 | | 3,290 | | 0 | | 3,290 | | 0 | |
| | | | | | | | | | | | | | | | | | | |
Dispositions
Month
Held for Sale | | Market | | Number of
Communities | | Number of
Homesites | | Net Assets
Held for Sale | | Gain (Loss)
Held for Sale | |
September. 2004 | | Various | | 15 | | 4,006 | | $ | 28,012 | | $ | (2,292 | ) |
December 2004 | | Various | | 15 | | 3,149 | | $ | 24,607 | | $ | (6,257 | ) |
17
| | 12/31/04 | | 09/30/04 | | 06/30/04 | | 03/31/04 | |
| | | | | | | | | |
# of Communities (a) | | 73 | | 73 | | 73 | | 71 | |
# of Homesites (a) | | 21630 | | 21,630 | | 21,630 | | 21,063 | |
| | | | | | | | | |
Total occupied homesites | | 17,185 | | 17,354 | | 17,363 | | 17,014 | |
Occupancy % | | 79.4 | % | 80.2 | % | 80.3 | % | 80.8 | % |
| | | | | | | | | |
Homeowner occupied homesites | | 16,247 | | 16,579 | | 16,871 | | 16,680 | |
Renter occupied homes | | 938 | | 775 | | 492 | | 334 | |
Total occupied homesites | | 17,185 | | 17,354 | | 17,363 | | 17,014 | |
Vacant homesites | | 4,445 | | 4,276 | | 4,267 | | 4,049 | |
Total homesites | | 21,630 | | 21,630 | | 21,630 | | 21,063 | |
| | | | | | | | | |
% of Total Homesites | | | | | | | | | |
Homeowner occupied homesites | | 75.1 | % | 76.6 | % | 78.0 | % | 79.2 | % |
Renter occupied homes | | 4.3 | % | 3.6 | % | 2.3 | % | 1.6 | % |
Vacant homesites | | 20.6 | % | 19.8 | % | 19.7 | % | 19.2 | % |
Total homesites | | 100.0 | % | 100.0 | % | 100.0 | % | 100.0 | % |
| | | | | | | | | |
% of Occupied Homesites | | | | | | | | | |
Homeowner occupied homesites | | 94.5 | % | 95.5 | % | 97.2 | % | 98.0 | % |
Renter occupied homes | | 5.5 | % | 4.5 | % | 2.8 | % | 2.0 | % |
Occupied homesites | | 100.0 | % | 100.0 | % | 100.0 | % | 100.0 | % |
| | | | | | | | | |
Number of owned homes | | 1,527 | | 1,509 | | 1,301 | | 1,011 | |
Renter occupied homes | | 938 | | 775 | | 492 | | 334 | |
Non-revenue producing homes | | 589 | | 734 | | 809 | | 677 | |
| | | | | | | | | |
Number of repossessed homes | | 335 | | 370 | | 371 | | 412 | |
as a % of total homesites | | 1.5 | % | 1.7 | % | 1.7 | % | 2.0 | % |
as a % of homeowner occupied homesites | | 2.1 | % | 2.2 | % | 2.2 | % | 2.5 | % |
| | | | | | | | | |
Financial Data | | | | | | | | | |
Bad debt as a % of total real estate revenue | | 3.0 | % | 2.7 | % | 1.0 | % | 1.6 | % |
Bad debt expense | | 515 | | 466 | | 172 | | 293 | |
Revenue contribution | | $ | 17,402 | | $ | 17,517 | | $ | 17,284 | | $ | 17,917 | |
Expense contribution | | 9,424 | | 7,656 | | 7,120 | | 7,804 | |
Net real estate segment income contribution | | $ | 7,978 | | $ | 9,861 | | $ | 10,164 | | $ | 10,112 | |
| | | | | | | | | | | | | | | |
(a) First quarter does not reflect two communities acquired upon the completion of the loan assumption process on April 9, 2004.
18
Common stock symbol: | | ARC |
Preferred stock symbol: | | ARC Pr A |
| | |
Exchange Traded: | | NYSE |
| | Q4
2004 | | Q3
2004 | | Q2
2004 | | Q1
2004 (a) | |
Common Stock Dividend Information | | | | | | | | | |
Declaration date | | 12/15/2004 | | 9/14/2004 | | 06/14/04 | | 03/10/04 | |
Record date | | 12/31/2004 | | 9/30/2004 | | 06/30/04 | | 03/31/04 | |
Payment date | | 1/14/2005 | | 10/15/2004 | | 07/15/04 | | 04/15/04 | |
Distributions per share | | $ | 0.3125 | | $ | 0.3125 | | $ | 0.3125 | | $ | 0.1493 | |
| | | | | | | | | |
Preferred Stock Dividend Information | | | | | | | | | |
Declaration date | | 12/15/2004 | | 9/14/2004 | | 06/14/04 | | 03/10/04 | |
Record date | | 1/15/2005 | | 10/15/2004 | | 07/15/04 | | 04/15/04 | |
Payment date | | 1/31/2005 | | 10/29/2004 | | 07/30/04 | | 04/30/04 | |
Distributions per share | | $ | 0.5156 | | $ | 0.5156 | | $ | 0.5156 | | $ | 0.4182 | |
(a) Distributions reflect partial period.
Inquiries:
Affordable Residential Communities welcomes any questions or comments from our investors, prospective investors, analysts, investment managers or media professionals. Please direct all inquiries to one of the following contact points:
At our website: | | www.aboutarc.com |
By phone: | | (866 847-8931) |
By fax: | | (303 294-0121) |
By e-mail: | | investor.relations@aboutarc.com |
By mail: | | Affordable Residential Communities Inc. |
| | Investor Relations Department |
| | 600 Grant Street |
| | Suite 900 |
| | Denver, CO 80203 |
19
Investors in and analysts following the real estate industry use funds from operations (“FFO”), net segment income, earnings before interest, taxes, depreciation and amortization (“EBITDA”) and funds available for distribution (“FAD”) as supplemental performance measures. While we believe that net income (as defined by GAAP) is the most appropriate measure, we also believe that FFO, net segment income, EBITDA and FAD are widely used by and relevant to investors, analysts and lenders and are appropriate supplemental measures. FFO reflects the assumption that real estate values rise or fall with market conditions and principally adjusts for the effects of GAAP depreciation and amortization of real estate assets. Net segment income provides a measure of rental operations and excludes deductions for depreciation and amortization and non-property specific expenses such as general and administrative expenses. EBITDA provides a measure to evaluate our ability to incur and service debt and to fund dividends and other cash needs. FAD provides a measure to evaluate our ability to fund dividends. In addition, FFO, net segment income, EBITDA and FAD are commonly used in various ratios, pricing multiples/yields and returns and valuation calculations used to measure financial position, performance and value.
FFO is defined by the National Association of Real Estate Investment Trusts (“NAREIT”) as “net income, computed in accordance with generally accepted accounting principles (“GAAP”), excluding gains (or losses) from sales of property, plus rental property depreciation and amortization, and after adjustments for unconsolidated partnerships and joint ventures.” Industry analysts consider FFO to be an appropriate supplemental measure of the operating performance of an equity REIT primarily because the computation of FFO excludes historical cost depreciation as an expense and thereby facilitates the comparison of REITs which have different cost bases in their assets. Historical cost accounting for real estate assets implicitly assumes that the value of real estate assets diminishes predictably over time, whereas real estate values have instead historically risen or fallen based upon market conditions. FFO does not represent cash flow from operations as defined by GAAP and is a supplemental measure of performance that does not replace net income as a measure of performance or net cash provided by operating activities as a measure of liquidity. In addition, FFO is not intended as a measure of a REIT’s ability to meet debt principal repayments and other cash requirements, nor as a measure of working capital. Please see the Reconciliation of Net Income to Funds from Operations set forth above.
Net segment income is defined as income from real estate operations and other segments of the Company, less expenses for property operations, real estate taxes, cost of manufactured homes sold, and retail home sales, finance, insurance and other operations.
EBITDA is defined as net loss available to common stockholders adjusted to exclude preferred stock dividend expense, income from discontinued operations net of minority interest, minority interest, interest income, interest expense, depreciation and amortization and early termination of debt expenses. It is a measure of net segment income less property management, general and administrative expenses and IPO related costs.
FAD is defined as FFO less non-revenue producing, recurring capital expenditures and scheduled principal amortization of indebtedness.
FFO, net segment income, EBITDA and FAD do not represent cash generated from operating activities in accordance with GAAP and are not necessarily indicative of cash available to fund cash needs, including the repayment of principal on indebtedness and payment of dividends and distributions. FFO, net segment income, EBITDA and FAD should not be considered as substitutes for net income (calculated in accordance with GAAP), as a measure of results of operations or cash flows (calculated in accordance with GAAP) as a measure of liquidity. FFO, net segment income, EBITDA and FAD as calculated by the Company may not be comparable to similarly titled, but differently calculated, measures of other REITs or to the definition of FFO published by NAREIT.
I-1
| | Three Months Ended | |
($ in thousands, except per share data) | | 12/31/04 | | 09/30/04 | | 06/30/04 | | 03/31/04 | |
| | | | | | | | | |
Funds from operations (“FFO”) and adjusted funds from operations | | | | | | | | | |
Net income loss before preferred stock dividend and discontinued operations | | $ | (27,400 | ) | $ | (13,001 | ) | $ | (4,874 | ) | $ | (34,168 | ) |
Plus: | Depreciation and amortization | | 21,196 | | 18,666 | | 17,242 | | 14,910 | |
| Income (loss) from discontinued operations | | 565 | | 561 | | 374 | | 431 | |
| Depreciation from discontinued operations | | 171 | | 1,145 | | 1,047 | | 750 | |
Less: | Amortization of loan origination fees | | (3,505 | ) | (725 | ) | (855 | ) | (868 | ) |
| Depreciation expense on furniture, equipment and vehicles | | (614 | ) | (363 | ) | (81 | ) | (369 | ) |
| Minority interest portion of FFO reconciling items | | (990 | ) | (1,074 | ) | (971 | ) | (1,162 | ) |
| Preferred stock dividend | | (2,578 | ) | (2,577 | ) | (2,578 | ) | (1,232 | ) |
FFO available to common stockholders | | (13,155 | ) | 2,632 | | 9,304 | | (21,708 | ) |
Plus: | Restricted stock grants | | — | | — | | — | | 10,070 | |
| IPO related costs | | — | | — | | — | | 4,417 | |
| Early termination of debt | | — | | 3,258 | | — | | 13,427 | |
| Minority interest portion of Adjusted FFO reconciling items | | — | | | (181 | ) | | — | | | (2,183 | ) |
Adjusted FFO | | $ | (13,155 | ) | $ | 5,708 | | $ | 9,304 | | $ | 4,023 | |
| | | | | | | | | |
Funds available for distribution (“FAD”) and adjusted FAD | | | | | | | | | |
FFO available to common stockholders | | $ | (13,155 | ) | $ | 2,632 | | $ | 9,304 | | ($21,708 | ) |
Plus: | Amortization of loan origination fees | | 3,505 | | 725 | | 855 | | 868 | |
| Depreciation expense on furniture, equipment and vehicles | | 614 | | 363 | | 81 | | 369 | |
| Early termination of debt | | — | | 3,258 | | — | | 13,427 | |
Less: | Recurring capital expenditures | | (5,554 | ) | (2,679 | ) | (1,100 | ) | (520 | ) |
| Scheduled principal amortization of indebtedness | | (2,332 | ) | (2,182 | ) | (2,200 | ) | (1,936 | ) |
| Minority interest portion of FAD reconciling items | | 209 | | 29 | | 130 | | (955 | ) |
FAD | | (16,713 | ) | 2,146 | | 7,069 | | (10,455 | ) |
Plus: | Restricted stock grants | | — | | — | | — | | 10,070 | |
| IPO related costs | | — | | — | | — | | 4,417 | |
| Minority interest portion of Adjusted FAD reconciling items | | — | | | — | | | — | | | (1,113 | ) |
Adjusted FAD | | $ | (16,713 | ) | $ | 2,146 | | $ | 7,069 | | $ | 2,899 | |
| | | | | | | | | |
EBITDA and adjusted EBITDA | | | | | | | | | |
Net loss available to common stockholders | | $ | (35,353 | ) | $ | (17,211 | ) | $ | (7,126 | ) | $ | (34,969 | ) |
Plus: | Preferred stock dividend | | 2,578 | | 2,577 | | 2,578 | | 1,232 | |
| Loss (income) from discontinued operations, net | | 5,375 | | 1,633 | | (326 | ) | (431 | ) |
| Minority interest | | (1,429 | ) | (524 | ) | (452 | ) | (3,066 | ) |
| Interest income | | (443 | ) | (382 | ) | (450 | ) | (342 | ) |
| Interest expense | | 15,920 | | 13,720 | | 12,782 | | 14,471 | |
| Depreciation and amortization | | 21,196 | | 18,666 | | 17,242 | | 14,910 | |
| Real estate and retail home asset impairment | | 3,591 | | 0 | | 0 | | 0 | |
| Goodwill impairment | | 863 | | 0 | | 0 | | 0 | |
| Early termination of debt | | — | | 3,258 | | — | | 13,427 | |
EBITDA | | 12,298 | | 21,737 | | 24,248 | | 5,232 | |
Plus: | Restricted stock grants | | — | | — | | — | | 10,070 | |
| IPO related costs | | — | | — | | — | | 4,417 | |
Adjusted EBITDA | | $ | 12,298 | | $ | 21,737 | | $ | 24,248 | | $ | 19,719 | |
I-2
| | 2004 | | 2003 | |
($ in thousands) | | 4th Qtr | | 3rd Qtr | | 2nd Qtr | | 1st Qtr | | 4th Qtr | | 3rd Qtr | | 2nd Qtr | | 1st Qtr | |
| | | | | | | | | | | | | | | | | |
Net segment income: | | | | | | | | | | | | | | | | | |
Real estate | | $ | 26,638 | | $ | 30,854 | | $ | 31,291 | | $ | 26,173 | | $ | 19,854 | | $ | 21,779 | | $ | 22,302 | | $ | 22,142 | |
Retail sales | | (6,148 | ) | (2,385 | ) | (1,019 | ) | (199 | ) | (403 | ) | (777 | ) | (410 | ) | (469 | ) |
Insurance and Finance | | (325 | ) | (291 | ) | (77 | ) | 15 | | 38 | | (360 | ) | (333 | ) | (304 | ) |
Corporate and other | | 40 | | (22 | ) | (44 | ) | (83 | ) | 178 | | (47 | ) | (4 | ) | (359 | ) |
| | $ | 20,205 | | $ | 28,156 | | 30,151 | | 25,906 | | 19,667 | | 20,595 | | 21,555 | | 21,011 | |
Other expenses: | | | | | | | | | | | | | | | | | |
Property management | | 2,082 | | 1,978 | | 1,600 | | 1,467 | | 1,673 | | 1,286 | | 1,382 | | 1,186 | |
General and administrative | | 5,825 | | 4,441 | | 4,304 | | 14,791 | | 5,101 | | 3,672 | | 3,681 | | 4,365 | |
Initial public offering (“IPO”) related costs | | — | | — | | — | | 4,417 | | — | | — | | — | | — | |
Early terminiation of debt | | — | | 3,258 | | — | | 13,427 | | — | | — | | — | | — | |
Depreciation and amortization | | 21,196 | | 18,666 | | 17,242 | | 14,910 | | 10,767 | | 11,521 | | 12,123 | | 12,066 | |
Retail home sales asset impairment and other exp. | | 3,591 | | — | | — | | — | | — | | 1,385 | | — | | — | |
Goodwill impairment | | 863 | | — | | — | | — | | — | | — | | — | | — | |
Interest expense | | 15,920 | | 13,720 | | 12,782 | | 14,471 | | 14,875 | | 14,311 | | 14,467 | | 13,717 | |
Total other expenses | | 49,477 | | 42,063 | | 35,928 | | 63,483 | | 32,416 | | 32,175 | | 31,653 | | 31,335 | |
Interest income | | 443 | | 382 | | 450 | | 342 | | 344 | | 344 | | 404 | | 347 | |
Loss before allocation to mirority interest | | (28,829 | ) | (13,525 | ) | (5,327 | ) | (37,235 | ) | (12,405 | ) | (11,236 | ) | (9,695 | ) | (9,976 | ) |
Minority interest | | 1,429 | | 524 | | 452 | | 3,066 | | 1,719 | | 1,556 | | 1,381 | | 1,370 | |
Net loss from continuing operations | | (27,400 | ) | (13,001 | ) | (4,875 | ) | (34,169 | ) | (10,686 | ) | (9,680 | ) | (8,314 | ) | (8,607 | ) |
Income from discontinued operations | | 565 | | 560 | | 375 | | 454 | | (7 | ) | 19 | | (208 | ) | 227 | |
Gain (loss) on sale of discontinued operations | | (6,257 | ) | (2,292 | ) | — | | — | | — | | 3,333 | | — | | — | |
Minority interest in discontinued operations | | 317 | | 99 | | (48 | ) | (22 | ) | — | | (465 | ) | (5 | ) | (22 | ) |
Net loss | | (32,775 | ) | (14,634 | ) | (4,548 | ) | (33,737 | ) | (10,693 | ) | (6,793 | ) | (8,527 | ) | (8,401 | ) |
| | | | | | | | | | | | | | | | | |
Preferred stock dividend | | (2,578 | ) | (2,577 | ) | (2,578 | ) | (1,232 | ) | — | | — | | — | | — | |
Net loss available to common stockholders | | $ | (35,353 | ) | $ | (17,211 | ) | $ | (7,126 | ) | $ | (34,969 | ) | $ | (10,693 | ) | $ | (6,793 | ) | $ | (8,527 | ) | $ | (8,401 | ) |
I-3
| | 2004 | | 2003 | |
($ in thousands) | | 4th Qtr | | 3rd Qtr | | 2nd Qtr | | 1st Qtr | | 4th Qtr | | 3rd Qtr | | 2nd Qtr | | 1st Qtr | |
| | | | | | | | | | | | | | | | | |
Net segment income: | | | | | | | | | | | | | | | | | |
Real estate (a) | | $ | 18,216 | | $ | 19,032 | | $ | 21,020 | | $ | 21,590 | | $ | 19,716 | | $ | 21,117 | | $ | 21,611 | | $ | 21,056 | |
Retail home sales and finance (b) | | — | | — | | — | | — | | — | | — | | — | | — | |
Insurance | | (325 | ) | (291 | ) | (77 | ) | 15 | | 38 | | (360 | ) | (333 | ) | (304 | ) |
Corporate and other | | 40 | | (22 | ) | (44 | ) | (83 | ) | 178 | | (47 | ) | (4 | ) | (359 | ) |
| | 17,931 | | 18,719 | | 20,899 | | 21,522 | | 19,932 | | 20,710 | | 21,274 | | 20,393 | |
Other expenses: | | | | | | | | | | | | | | | | | |
Property management (d) | | 1,301 | | 1,236 | | 1,000 | | 1,367 | | 1,673 | | 1,286 | | 1,382 | | 1,186 | |
General and administrative (c) | | 5,813 | | 4,390 | | 4,275 | | 4,676 | | 5,101 | | 3,672 | | 3,681 | | 4,365 | |
Depreciation and amortization | | 11,415 | | 12,136 | | 11,776 | | 11,895 | | 10,538 | | 11,468 | | 11,493 | | 11,896 | |
Retail home sales asset impairment and other expense | | 3,591 | | — | | — | | — | | — | | — | | — | | — | |
Interest expense | | 9,926 | | 9,714 | | 9,655 | | 13,526 | | 14,702 | | 14,086 | | 14,207 | | 13,526 | |
Total other expenses | | 32,046 | | 27,476 | | 26,706 | | 31,464 | | 32,014 | | 30,513 | | 30,763 | | 30,973 | |
Interest income | | 443 | | 382 | | 403 | | 295 | | 344 | | 344 | | 404 | | 347 | |
Loss before allocation to minority interest | | (13,672 | ) | (8,375 | ) | (5,404 | ) | (9,647 | ) | (11,738 | ) | (9,458 | ) | (9,086 | ) | (10,232 | ) |
Minority interest | | 678 | | 324 | | 459 | | 794 | | 1,627 | | 1,310 | | 1,294 | | 1,405 | |
Net loss from continuing operations | | (12,993 | ) | (8,050 | ) | (4,945 | ) | (8,853 | ) | (10,111 | ) | (8,148 | ) | (7,792 | ) | (8,827 | ) |
Discontinued operations | | — | | — | | — | | — | | — | | — | | — | | — | |
Net loss | | (12,993 | ) | (8,050 | ) | (4,945 | ) | (8,853 | ) | (10,111 | ) | (8,148 | ) | (7,792 | ) | (8,827 | ) |
| | | | | | | | | | | | | | | | | |
Preferred stock dividend | | — | | — | | — | | — | | — | | — | | — | | — | |
Net loss available to common stockholders | | $ | (12,993 | ) | $ | (8,050 | ) | $ | (4,945 | ) | $ | (8,853 | ) | $ | (10,111 | ) | $ | (8,148 | ) | $ | (7,792 | ) | $ | (8,827 | ) |
(a) Same communities information excludes results of communities acquired in the ometown, D.A.M and other acquisitions after January 1, 2003 and the communities old or discontinued before December 31, 2004.
(b) Excludes impact of the restructuring in September 2003 in which we closed all stand-alone retail stores existing on January 1, 2003 at which time we had no significant n-community sales operations.
(c) Excludes impact of restricted stock issued in connection with the IPO.
(d) Excludes property management expenses incurred in connection with the Hometown acquisition.
I-4