Exhibit 99.1
| Hilltop Holdings Inc. Earnings Presentation Q4 2019 January 2020 |

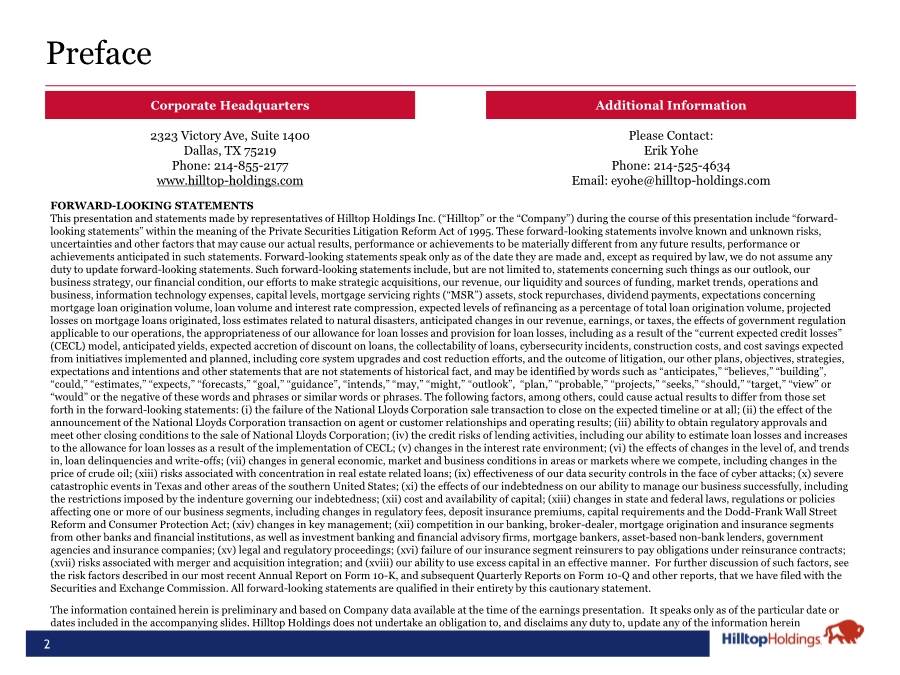
| Preface 2 Additional Information Corporate Headquarters 2323 Victory Ave, Suite 1400 Dallas, TX 75219 Phone: 214-855-2177 www.hilltop-holdings.com Please Contact: Erik Yohe Phone: 214-525-4634 Email: eyohe@hilltop-holdings.com FORWARD-LOOKING STATEMENTS This presentation and statements made by representatives of Hilltop Holdings Inc. (“Hilltop” or the “Company”) during the course of this presentation include “forward- looking statements” within the meaning of the Private Securities Litigation Reform Act of 1995. These forward-looking statements involve known and unknown risks, uncertainties and other factors that may cause our actual results, performance or achievements to be materially different from any future results, performance or achievements anticipated in such statements. Forward-looking statements speak only as of the date they are made and, except as required by law, we do not assume any duty to update forward-looking statements. Such forward-looking statements include, but are not limited to, statements concerning such things as our outlook, our business strategy, our financial condition, our efforts to make strategic acquisitions, our revenue, our liquidity and sources of funding, market trends, operations and business, information technology expenses, capital levels, mortgage servicing rights (“MSR”) assets, stock repurchases, dividend payments, expectations concerning mortgage loan origination volume, loan volume and interest rate compression, expected levels of refinancing as a percentage of total loan origination volume, projected losses on mortgage loans originated, loss estimates related to natural disasters, anticipated changes in our revenue, earnings, or taxes, the effects of government regulation applicable to our operations, the appropriateness of our allowance for loan losses and provision for loan losses, including as a result of the “current expected credit losses” (CECL) model, anticipated yields, expected accretion of discount on loans, the collectability of loans, cybersecurity incidents, construction costs, and cost savings expected from initiatives implemented and planned, including core system upgrades and cost reduction efforts, and the outcome of litigation, our other plans, objectives, strategies, expectations and intentions and other statements that are not statements of historical fact, and may be identified by words such as “anticipates,” “believes,” “building”, “could,” “estimates,” “expects,” “forecasts,” “goal,” “guidance”, “intends,” “may,” “might,” “outlook”, “plan,” “probable,” “projects,” “seeks,” “should,” “target,” “view” or “would” or the negative of these words and phrases or similar words or phrases. The following factors, among others, could cause actual results to differ from those set forth in the forward-looking statements: (i) the failure of the National Lloyds Corporation sale transaction to close on the expected timeline or at all; (ii) the effect of the announcement of the National Lloyds Corporation transaction on agent or customer relationships and operating results; (iii) ability to obtain regulatory approvals and meet other closing conditions to the sale of National Lloyds Corporation; (iv) the credit risks of lending activities, including our ability to estimate loan losses and increases to the allowance for loan losses as a result of the implementation of CECL; (v) changes in the interest rate environment; (vi) the effects of changes in the level of, and trends in, loan delinquencies and write-offs; (vii) changes in general economic, market and business conditions in areas or markets where we compete, including changes in the price of crude oil; (xiii) risks associated with concentration in real estate related loans; (ix) effectiveness of our data security controls in the face of cyber attacks; (x) severe catastrophic events in Texas and other areas of the southern United States; (xi) the effects of our indebtedness on our ability to manage our business successfully, including the restrictions imposed by the indenture governing our indebtedness; (xii) cost and availability of capital; (xiii) changes in state and federal laws, regulations or policies affecting one or more of our business segments, including changes in regulatory fees, deposit insurance premiums, capital requirements and the Dodd-Frank Wall Street Reform and Consumer Protection Act; (xiv) changes in key management; (xii) competition in our banking, broker-dealer, mortgage origination and insurance segments from other banks and financial institutions, as well as investment banking and financial advisory firms, mortgage bankers, asset-based non-bank lenders, government agencies and insurance companies; (xv) legal and regulatory proceedings; (xvi) failure of our insurance segment reinsurers to pay obligations under reinsurance contracts; (xvii) risks associated with merger and acquisition integration; and (xviii) our ability to use excess capital in an effective manner. For further discussion of such factors, see the risk factors described in our most recent Annual Report on Form 10-K, and subsequent Quarterly Reports on Form 10-Q and other reports, that we have filed with the Securities and Exchange Commission. All forward-looking statements are qualified in their entirety by this cautionary statement. The information contained herein is preliminary and based on Company data available at the time of the earnings presentation. It speaks only as of the particular date or dates included in the accompanying slides. Hilltop Holdings does not undertake an obligation to, and disclaims any duty to, update any of the information herein |
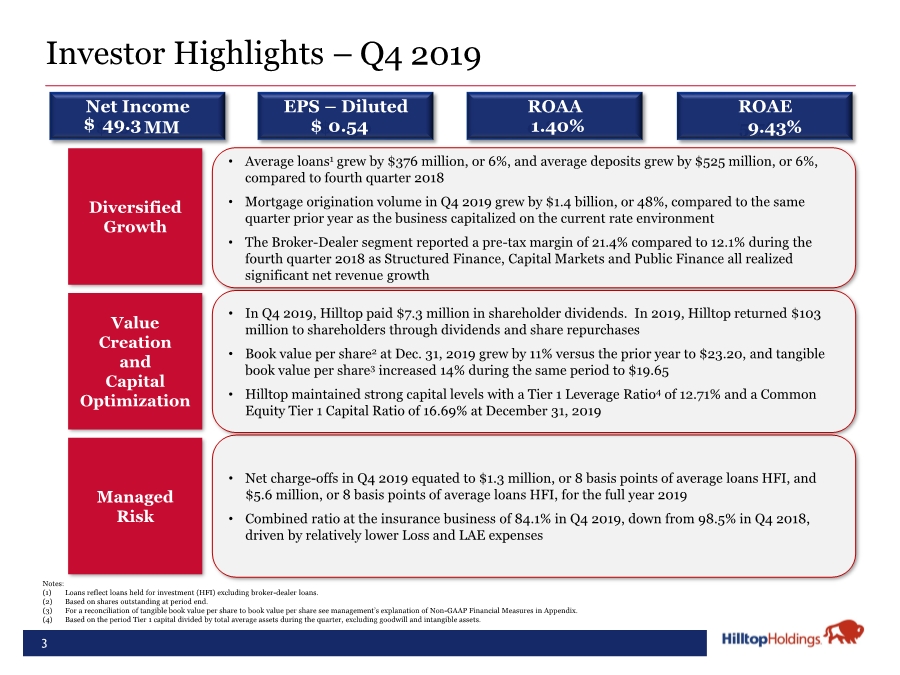
| • Net charge-offs in Q4 2019 equated to $1.3 million, or 8 basis points of average loans HFI, and $5.6 million, or 8 basis points of average loans HFI, for the full year 2019 • Combined ratio at the insurance business of 84.1% in Q4 2019, down from 98.5% in Q4 2018, driven by relatively lower Loss and LAE expenses • Average loans1 grew by $376 million, or 6%, and average deposits grew by $525 million, or 6%, compared to fourth quarter 2018 • Mortgage origination volume in Q4 2019 grew by $1.4 billion, or 48%, compared to the same quarter prior year as the business capitalized on the current rate environment • The Broker-Dealer segment reported a pre-tax margin of 21.4% compared to 12.1% during the fourth quarter 2018 as Structured Finance, Capital Markets and Public Finance all realized significant net revenue growth • In Q4 2019, Hilltop paid $7.3 million in shareholder dividends. In 2019, Hilltop returned $103 million to shareholders through dividends and share repurchases • Book value per share2 at Dec. 31, 2019 grew by 11% versus the prior year to $23.20, and tangible book value per share3 increased 14% during the same period to $19.65 • Hilltop maintained strong capital levels with a Tier 1 Leverage Ratio4 of 12.71% and a Common Equity Tier 1 Capital Ratio of 16.69% at December 31, 2019 3 Investor Highlights – Value Creation and Capital Optimization Diversified Growth Managed Risk Net Income $28.1MM ROAA 0.86% EPS – Diluted $0.30 ROAE 5.76% Notes: (1) Loans reflect loans held for investment (HFI) excluding broker-dealer loans. (2) Based on shares outstanding at period end. (3) For a reconciliation of tangible book value per share to book value per share see management’s explanation of Non-GAAP Financial Measures in Appendix. (4) Based on the period Tier 1 capital divided by total average assets during the quarter, excluding goodwill and intangible assets. 49.3 $ 0.54 $ 9.43% Q 4 20 1 9 1.40% |
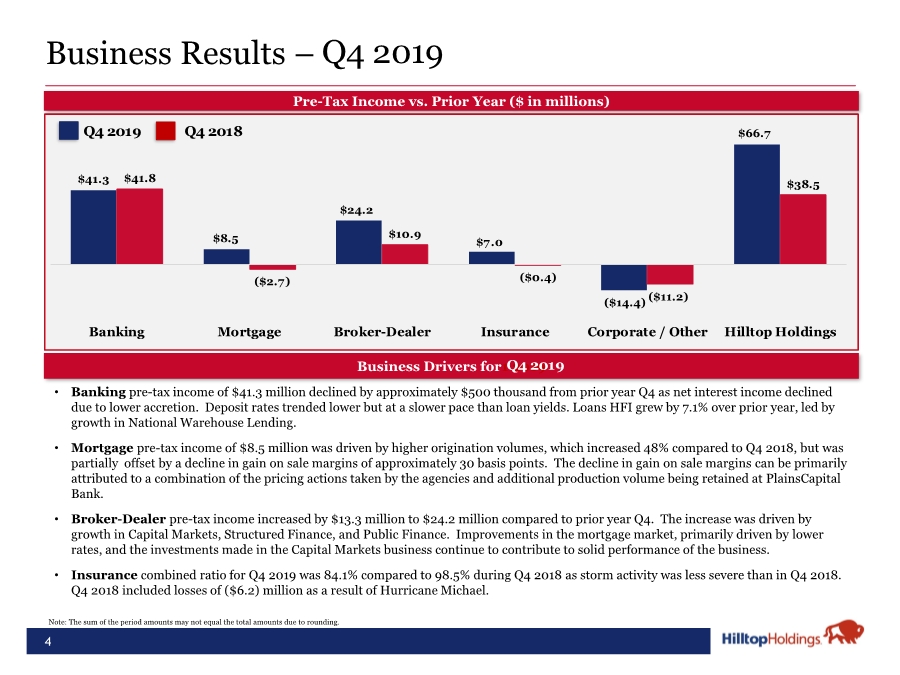
| $41.3 $8.5 $24.2 $7.0 ($14.4) $66.7 $41.8 ($2.7) $10.9 ($0.4) ($11.2) $38.5 Banking Mortgage Broker-Dealer Insurance Corporate / Other Hilltop Holdings 4 Business Results – Pre-Tax Income vs. Prior Year ($ in millions) • Banking pre-tax income of $41.3 million declined by approximately $500 thousand from prior year Q4 as net interest income declined due to lower accretion. Deposit rates trended lower but at a slower pace than loan yields. Loans HFI grew by 7.1% over prior year, led by growth in National Warehouse Lending. • Mortgage pre-tax income of $8.5 million was driven by higher origination volumes, which increased 48% compared to Q4 2018, but was partially offset by a decline in gain on sale margins of approximately 30 basis points. The decline in gain on sale margins can be primarily attributed to a combination of the pricing actions taken by the agencies and additional production volume being retained at PlainsCapital Bank. • Broker-Dealer pre-tax income increased by $13.3 million to $24.2 million compared to prior year Q4. The increase was driven by growth in Capital Markets, Structured Finance, and Public Finance. Improvements in the mortgage market, primarily driven by lower rates, and the investments made in the Capital Markets business continue to contribute to solid performance of the business. • Insurance combined ratio for Q4 2019 was 84.1% compared to 98.5% during Q4 2018 as storm activity was less severe than in Q4 2018. Q4 2018 included losses of ($6.2) million as a result of Hurricane Michael. Business Drivers for1 2019 Note: The sum of the period amounts may not equal the total amounts due to rounding. Q4 2019 Q4 2018 Q 4 20 1 9 Q4 2019 |
| 5 Platform for Growth and Efficiency – Year 1 Update In January 2019, HTH announced a program designed to deliver $84 million in run-rate PPNR improvements by the year end 2021 Through solid execution and the commitment across all of our businesses, actions taken through year end 2019 have resulted in approximately $45 million of incremental PPNR benefit Enhanced Business Operations Strategic Sourcing Shared Services • Streamlined mortgage operations • Capital Markets / Securitized products platform enhancements • Targeted leadership changes and succession planning • Technology and software contract consolidation • Purchasing program for Real Estate services, IT hardware and office supplies • Delivery of single enterprise Travel and Entertainment platform and program • Corporate function and specialty operating department consolidation across HTH • IT Data Center consolidation Actions Taken Through Year End 2019 |

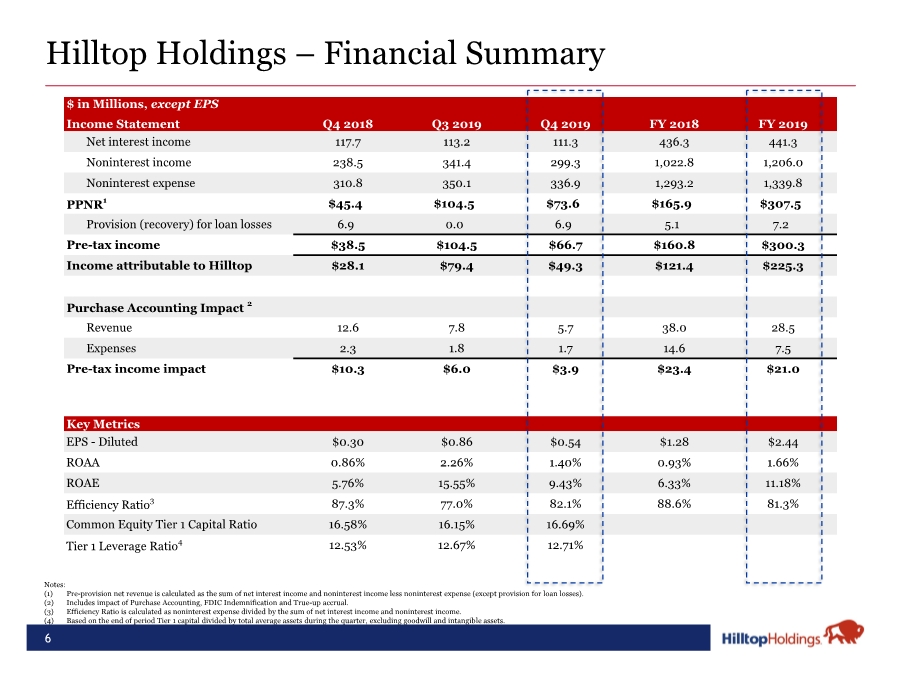
| $ in Millions, except EPS Income Statement Q4 2018 Q3 2019 Q4 2019 FY 2018 FY 2019 Net interest income 117.7 113.2 111.3 436.3 441.3 Noninterest income 238.5 341.4 299.3 1,022.8 1,206.0 Noninterest expense 310.8 350.1 336.9 1,293.2 1,339.8 PPNR1 $45.4 $104.5 $73.6 $165.9 $307.5 Provision (recovery) for loan losses 6.9 0.0 6.9 5.1 7.2 Pre-tax income $38.5 $104.5 $66.7 $160.8 $300.3 Income attributable to Hilltop $28.1 $79.4 $49.3 $121.4 $225.3 Purchase Accounting Impact 2 Revenue 12.6 7.8 5.7 38.0 28.5 Expenses 2.3 1.8 1.7 14.6 7.5 Pre-tax income impact $10.3 $6.0 $3.9 $23.4 $21.0 Key Metrics EPS - Diluted $0.30 $0.86 $0.54 $1.28 $2.44 ROAA 0.86% 2.26% 1.40% 0.93% 1.66% ROAE 5.76% 15.55% 9.43% 6.33% 11.18% Efficiency Ratio3 87.3% 77.0% 82.1% 88.6% 81.3% Common Equity Tier 1 Capital Ratio 16.58% 16.15% 16.69% Tier 1 Leverage Ratio4 12.53% 12.67% 12.71% 6 Notes: (1) Pre-provision net revenue is calculated as the sum of net interest income and noninterest income less noninterest expense (except provision for loan losses). (2) Includes impact of Purchase Accounting, FDIC Indemnification and True-up accrual. (3) Efficiency Ratio is calculated as noninterest expense divided by the sum of net interest income and noninterest income. (4) Based on the end of period Tier 1 capital divided by total average assets during the quarter, excluding goodwill and intangible assets. Hilltop Holdings – Financial Summary |
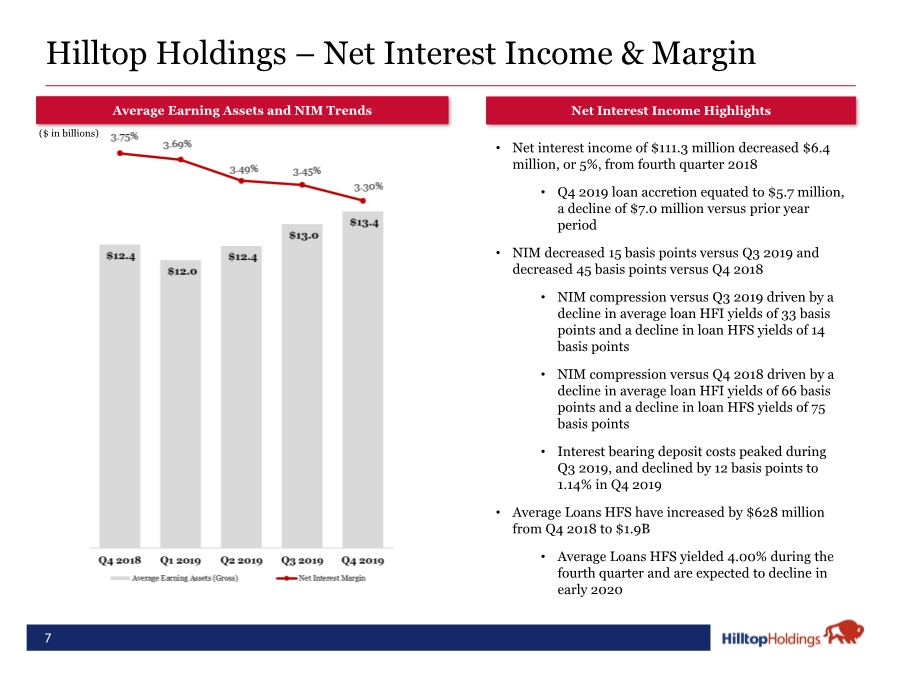
| 7 Hilltop Holdings – Net Interest Income & Margin • Net interest income of $111.3 million decreased $6.4 million, or 5%, from fourth quarter 2018 • Q4 2019 loan accretion equated to $5.7 million, a decline of $7.0 million versus prior year period • NIM decreased 15 basis points versus Q3 2019 and decreased 45 basis points versus Q4 2018 • NIM compression versus Q3 2019 driven by a decline in average loan HFI yields of 33 basis points and a decline in loan HFS yields of 14 basis points • NIM compression versus Q4 2018 driven by a decline in average loan HFI yields of 66 basis points and a decline in loan HFS yields of 75 basis points • Interest bearing deposit costs peaked during Q3 2019, and declined by 12 basis points to 1.14% in Q4 2019 • Average Loans HFS have increased by $628 million from Q4 2018 to $1.9B • Average Loans HFS yielded 4.00% during the fourth quarter and are expected to decline in early 2020 Average Earning Assets and NIM Trends 2 Net Interest Income Highlights ($ in billions) |
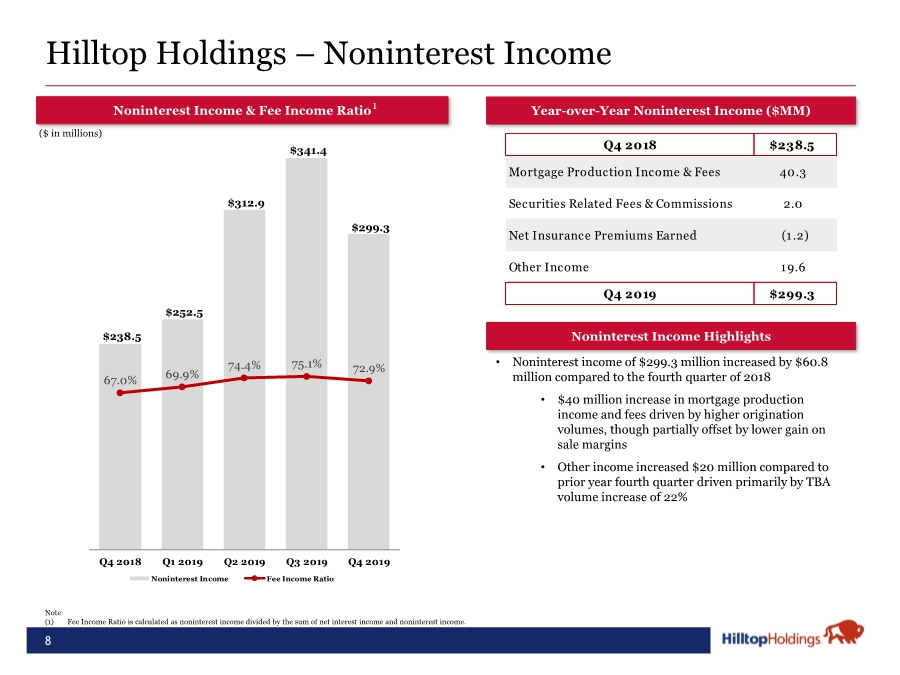
| 8 Hilltop Holdings – Noninterest Income • Noninterest income of $299.3 million increased by $60.8 million compared to the fourth quarter of 2018 • $40 million increase in mortgage production income and fees driven by higher origination volumes, though partially offset by lower gain on sale margins • Other income increased $20 million compared to prior year fourth quarter driven primarily by TBA volume increase of 22% Year-over-Year Noninterest Income ($MM) Noninterest Income & Fee Income Ratio Noninterest Income Highlights 1 Note: (1) Fee Income Ratio is calculated as noninterest income divided by the sum of net interest income and noninterest income. ($ in millions) Q4 2018 $238.5 Mortgage Production Income & Fees 40.3 Securities Related Fees & Commissions 2.0 Net Insurance Premiums Earned (1.2) Other Income 19.6 Q4 2019 $299.3 $238.5 $252.5 $312.9 $341.4 $299.3 67.0% 69.9% 74.4% 75.1% 72.9% Q4 2018 Q1 2019 Q2 2019 Q3 2019 Q4 2019 Noninterest Income Fee Income Ratio |
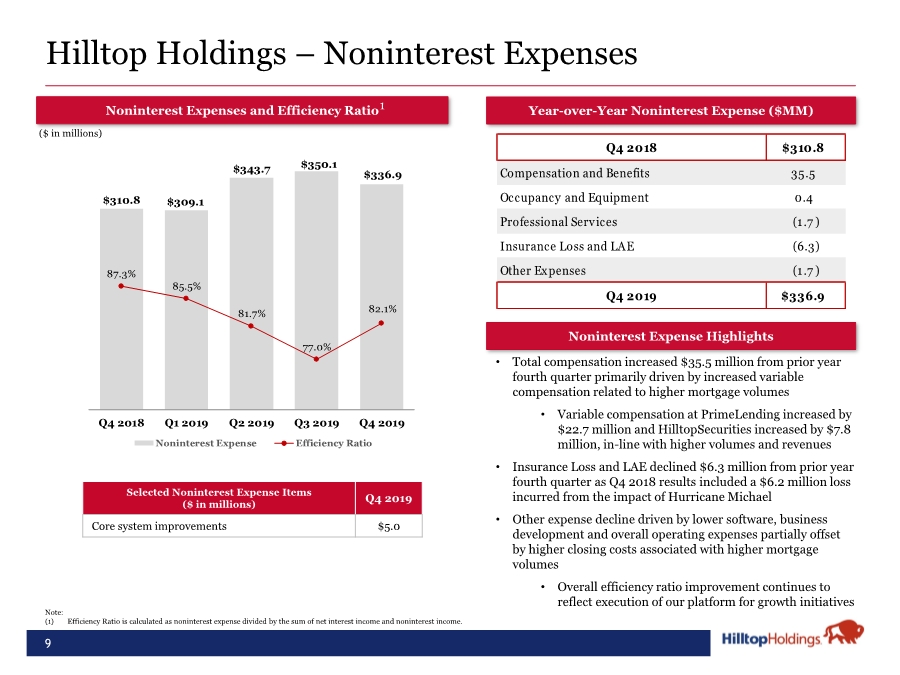
| $310.8 $309.1 $343.7 $350.1 $336.9 87.3% 85.5% 81.7% 77.0% 82.1% Q4 2018 Q1 2019 Q2 2019 Q3 2019 Q4 2019 Noninterest Expense Efficiency Ratio 9 Hilltop Holdings – Noninterest Expenses Year-over-Year Noninterest Expense ($MM) Noninterest Expenses and Efficiency Ratio Noninterest Expense Highlights • Total compensation increased $35.5 million from prior year fourth quarter primarily driven by increased variable compensation related to higher mortgage volumes • Variable compensation at PrimeLending increased by $22.7 million and HilltopSecurities increased by $7.8 million, in-line with higher volumes and revenues • Insurance Loss and LAE declined $6.3 million from prior year fourth quarter as Q4 2018 results included a $6.2 million loss incurred from the impact of Hurricane Michael • Other expense decline driven by lower software, business development and overall operating expenses partially offset by higher closing costs associated with higher mortgage volumes • Overall efficiency ratio improvement continues to reflect execution of our platform for growth initiatives Note: (1) Efficiency Ratio is calculated as noninterest expense divided by the sum of net interest income and noninterest income. 1 ($ in millions) Q4 2018 $310.8 Compensation and Benefits 35.5 Occupancy and Equipment 0.4 Professional Services (1.7 ) Insurance Loss and LAE (6.3) Other Expenses (1.7 ) Q4 2019 $336.9 Selected Noninterest Expense Items ($ in millions) Q4 2019 Core system improvements $5.0 |
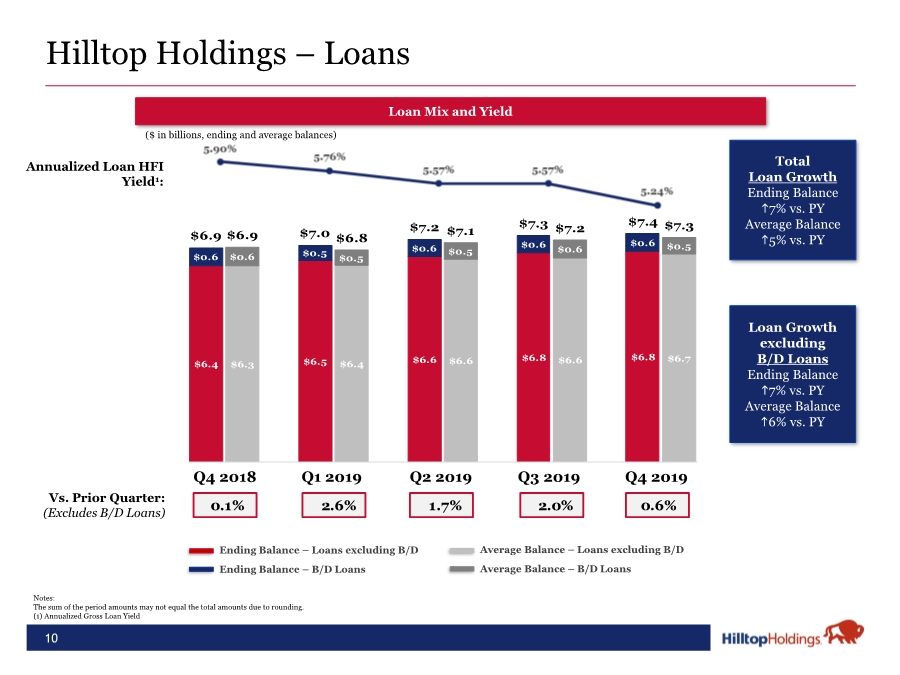
| 10 Notes: The sum of the period amounts may not equal the total amounts due to rounding. (1) Annualized Gross Loan Yield Loan Mix and Yield Total Loan Growth Ending Balance h7% vs. PY Average Balance h5% vs. PY ($ in billions, ending and average balances) Hilltop Holdings – Loans Annualized Loan HFI Yield1: Loan Growth excluding B/D Loans Ending Balance h7% vs. PY Average Balance h6% vs. PY Vs. Prior Quarter: (Excludes B/D Loans) 0.1% 6.8% 0.4% -0.6% 1.8% 0.1% 2.6% 1.7% 2.0% 0.6% Ending Balance – Loans excluding B/D Ending Balance – B/D Loans Average Balance – Loans excluding B/D Average Balance – B/D Loans $6.4 $6.3 $6.5 $6.4 $6.6 $6.6 $6.8 $6.6 $6.8 $6.7 $0.6 $0.6 $0.5 $0.5 $0.6 $0.5 $0.6 $0.6 $0.6 $0.5 $6.9 $6.9 $7.0 $6.8 $7.2 $7.1 $7.3 $7.2 $7.4 $7.3 Q4 2018 Q1 2019 Q2 2019 Q3 2019 Q4 2019 |
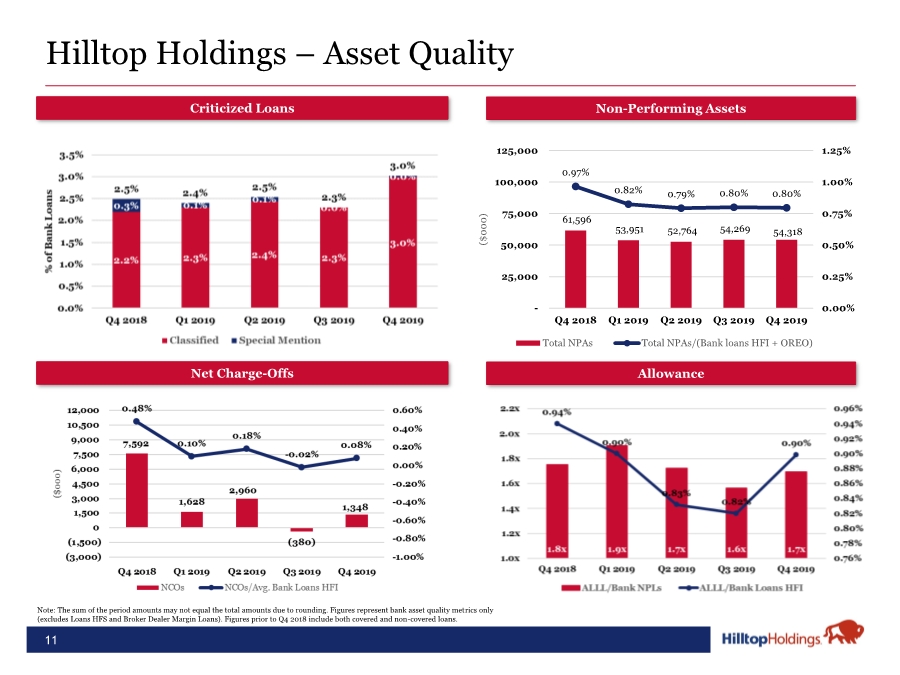
| 11 Hilltop Holdings – Asset Quality Criticized Loans Non-Performing Assets Note: The sum of the period amounts may not equal the total amounts due to rounding. Figures represent bank asset quality metrics only (excludes Loans HFS and Broker Dealer Margin Loans). Figures prior to Q4 2018 include both covered and non-covered loans. Net Charge-Offs Allowance 61,596 53,951 52,764 54,269 54,318 0.97% 0.82% 0.79% 0.80% 0.80% 0.00% 0.25% 0.50% 0.75% 1.00% 1.25% - 25,000 50,000 75,000 100,000 125,000 Q4 2018 Q1 2019 Q2 2019 Q3 2019 Q4 2019 ($000) Total NPAs Total NPAs/(Bank loans HFI + OREO) |
| 12 Vs. Prior Quarter: (Total Deposits) Deposit Mix and Cost 3.0% 4.1% ($ in billions) Notes: Noninterest-bearing deposits excludes broker-dealer sweep deposits. The sum of the period amounts may not equal the total amounts due to rounding. Total Deposit Growth Ending Balance h6% vs. PY Average Balance h6% vs. PY Cost of Interest Bearing Deposits: -0.2% Interest Bearing Deposit Growth Ending Balance h5% vs. PY Average Balance h5% vs. PY -1.8% 6.1% 3.0% -2.8% 2.0% 3.2% 3.5% Ending Balance – Broker Dealer Sweep Deposits Ending Balance – Noninterest Bearing Deposits Ending Balance – Interest Bearing Deposits Average Balance Hilltop Holdings – Deposits Q4 2018 Q1 2019 Q2 2019 Q3 2019 Q4 2019 |

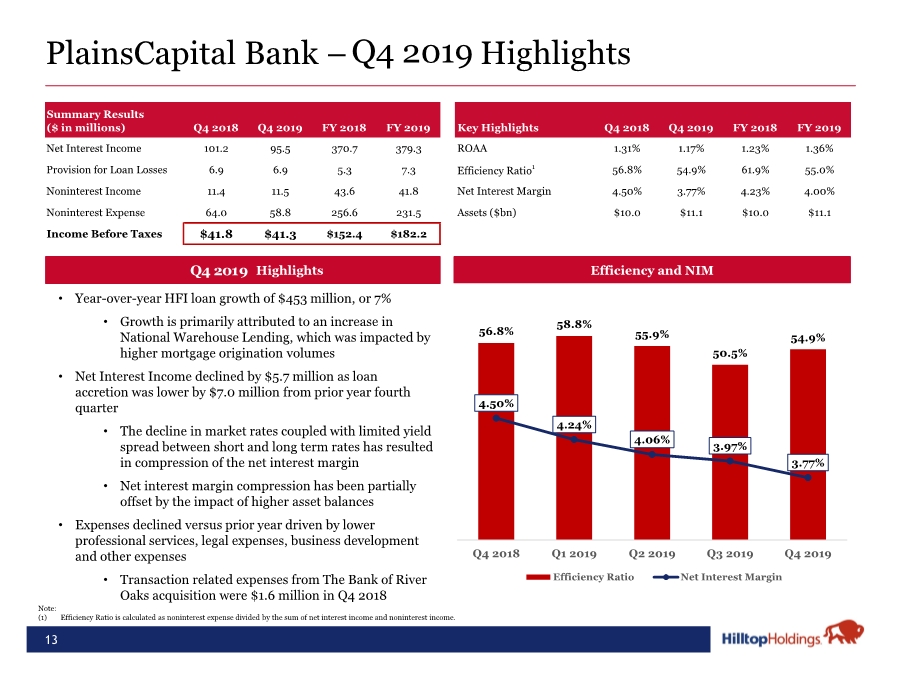
| 13 PlainsCapital Bank – Highlights Efficiency and NIM Highlights Note: (1) Efficiency Ratio is calculated as noninterest expense divided by the sum of net interest income and noninterest income. • Year-over-year HFI loan growth of $453 million, or 7% • Growth is primarily attributed to an increase in National Warehouse Lending, which was impacted by higher mortgage origination volumes • Net Interest Income declined by $5.7 million as loan accretion was lower by $7.0 million from prior year fourth quarter • The decline in market rates coupled with limited yield spread between short and long term rates has resulted in compression of the net interest margin • Net interest margin compression has been partially offset by the impact of higher asset balances • Expenses declined versus prior year driven by lower professional services, legal expenses, business development and other expenses • Transaction related expenses from The Bank of River Oaks acquisition were $1.6 million in Q4 2018 Q 4 20 1 9 Q4 2019 56.8% 58.8% 55.9% 50.5% 54.9% 4.50% 4.24% 4.06% 3.97% 3.77% Q4 2018 Q1 2019 Q2 2019 Q3 2019 Q4 2019 Efficiency Ratio Net Interest Margin Summary Results ($ in millions) Q4 2018 Q4 2019 FY 2018 FY 2019 Key Highlights Q4 2018 Q4 2019 FY 2018 FY 2019 Net Interest Income 101.2 95.5 370.7 379.3 ROAA 1.31% 1.17% 1.23% 1.36% Provision for Loan Losses 6.9 6.9 5.3 7.3 Efficiency Ratio1 56.8% 54.9% 61.9% 55.0% Noninterest Income 11.4 11.5 43.6 41.8 Net Interest Margin 4.50% 3.77% 4.23% 4.00% Noninterest Expense 64.0 58.8 256.6 231.5 Assets ($bn) $10.0 $11.1 $10.0 $11.1 Income Before Taxes $41.8 $41.3 $152.4 $182.2 |
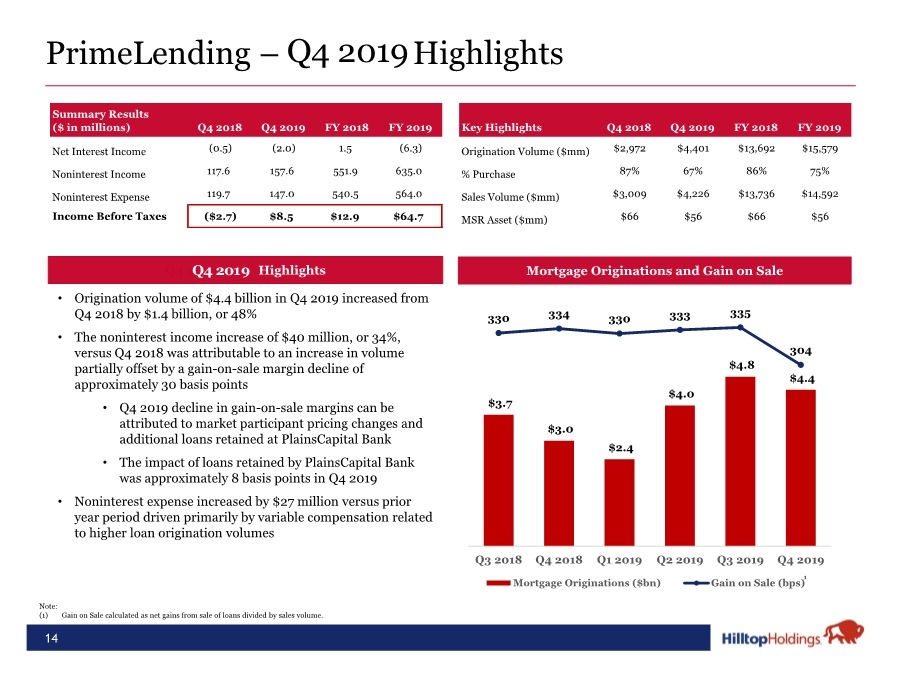
| $3.7 $3.0 $2.4 $4.0 $4.8 $4.4 330 334 330 333 335 304 150 170 190 210 230 250 270 290 310 330 350 $(0.3) $0.7 $1.7 $2.7 $3.7 $4.7 $5.7 $6.7 Q3 2018 Q4 2018 Q1 2019 Q2 2019 Q3 2019 Q4 2019 Mortgage Originations ($bn) Gain on Sale (bps) 14 PrimeLending – Highlights Mortgage Originations and Gain on Sale Q4 2018 Highlights • Origination volume of $4.4 billion in Q4 2019 increased from Q4 2018 by $1.4 billion, or 48% • The noninterest income increase of $40 million, or 34%, versus Q4 2018 was attributable to an increase in volume partially offset by a gain-on-sale margin decline of approximately 30 basis points • Q4 2019 decline in gain-on-sale margins can be attributed to market participant pricing changes and additional loans retained at PlainsCapital Bank • The impact of loans retained by PlainsCapital Bank was approximately 8 basis points in Q4 2019 • Noninterest expense increased by $27 million versus prior year period driven primarily by variable compensation related to higher loan origination volumes Note: (1) Gain on Sale calculated as net gains from sale of loans divided by sales volume. Q 4 20 1 9 Q4 2019 1 Summary Results ($ in millions) Q4 2018 Q4 2019 FY 2018 FY 2019 Key Highlights Q4 2018 Q4 2019 FY 2018 FY 2019 Net Interest Income (0.5) (2.0) 1.5 (6.3) Origination Volume ($mm) $2,972 $4,401 $13,692 $15,579 Noninterest Income 117.6 157.6 551.9 635.0 % Purchase 87% 67% 86% 75% Noninterest Expense 119.7 147.0 540.5 564.0 Sales Volume ($mm) $3,009 $4,226 $13,736 $14,592 Income Before Taxes ($2.7) $8.5 $12.9 $64.7 MSR Asset ($mm) $66 $56 $66 $56 |
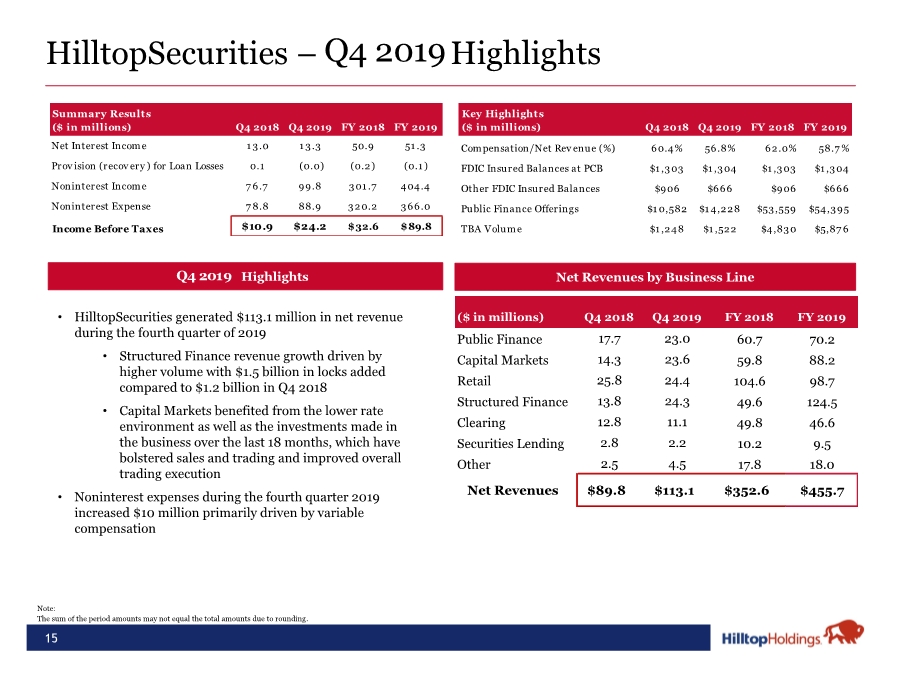
| 15 HilltopSecurities – Highlights • HilltopSecurities generated $113.1 million in net revenue during the fourth quarter of 2019 • Structured Finance revenue growth driven by higher volume with $1.5 billion in locks added compared to $1.2 billion in Q4 2018 • Capital Markets benefited from the lower rate environment as well as the investments made in the business over the last 18 months, which have bolstered sales and trading and improved overall trading execution • Noninterest expenses during the fourth quarter 2019 increased $10 million primarily driven by variable compensation Note: The sum of the period amounts may not equal the total amounts due to rounding. Q4 2018 Highlights Net Revenues by Business Line Q 4 20 1 9 Q4 2019 ($ in millions) Q4 2018 Q4 2019 FY 2018 FY 2019 Public Finance 17.7 23.0 60.7 70.2 Capital Markets 14.3 23.6 59.8 88.2 Retail 25.8 24.4 104.6 98.7 Structured Finance 13.8 24.3 49.6 124.5 Clearing 12.8 11.1 49.8 46.6 Securities Lending 2.8 2.2 10.2 9.5 Other 2.5 4.5 17.8 18.0 Net Revenues $89.8 $113.1 $352.6 $455.7 Summary Results ($ in millions) Q4 2018 Q4 2019 FY 2018 FY 2019 Key Highlights ($ in millions) Q4 2018 Q4 2019 FY 2018 FY 2019 Net Interest Income 1 3.0 1 3.3 50.9 51 .3 Compensation/Net Revenue (%) 60.4% 56.8% 62.0% 58.7 % Prov ision (recov ery ) for Loan Losses 0.1 (0.0) (0.2) (0.1 ) FDIC Insured Balances at PCB $1 ,303 $1 ,304 $1 ,303 $1 ,304 Noninterest Income 7 6.7 99.8 301 .7 404.4 Other FDIC Insured Balances $906 $666 $906 $666 Noninterest Expense 7 8.8 88.9 320.2 366.0 Public Finance Offerings $1 0,582 $1 4,228 $53,559 $54,395 Income Before Taxes $10.9 $24.2 $32.6 $89.8 TBA Volume $1 ,248 $1 ,522 $4,830 $5,87 6 |
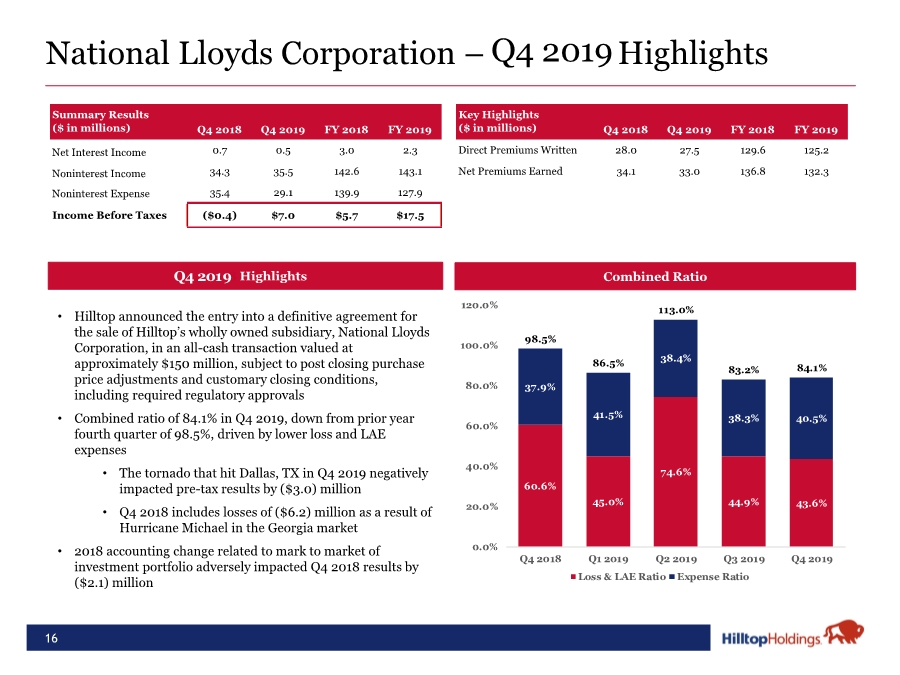
| 16 National Lloyds Corporation – Highlights • Hilltop announced the entry into a definitive agreement for the sale of Hilltop’s wholly owned subsidiary, National Lloyds Corporation, in an all-cash transaction valued at approximately $150 million, subject to post closing purchase price adjustments and customary closing conditions, including required regulatory approvals • Combined ratio of 84.1% in Q4 2019, down from prior year fourth quarter of 98.5%, driven by lower loss and LAE expenses • The tornado that hit Dallas, TX in Q4 2019 negatively impacted pre-tax results by ($3.0) million • Q4 2018 includes losses of ($6.2) million as a result of Hurricane Michael in the Georgia market • 2018 accounting change related to mark to market of investment portfolio adversely impacted Q4 2018 results by ($2.1) million Q4 2018 Highlights Combined Ratio 60.6% 45.0% 74.6% 44.9% 43.6% 37.9% 41.5% 38.4% 38.3% 40.5% 98.5% 86.5% 113.0% 83.2% 84.1% 0.0% 20.0% 40.0% 60.0% 80.0% 100.0% 120.0% Q4 2018 Q1 2019 Q2 2019 Q3 2019 Q4 2019 Loss & LAE Ratio Expense Ratio Total Q4 2019 Q 4 20 1 9 Summary Results ($ in millions) Q4 2018 Q4 2019 FY 2018 FY 2019 Key Highlights ($ in millions) Q4 2018 Q4 2019 FY 2018 FY 2019 Net Interest Income 0.7 0.5 3.0 2.3 Direct Premiums Written 28.0 27.5 129.6 125.2 Noninterest Income 34.3 35.5 142.6 143.1 Net Premiums Earned 34.1 33.0 136.8 132.3 Noninterest Expense 35.4 29.1 139.9 127.9 Income Before Taxes ($0.4) $7.0 $5.7 $17.5 |
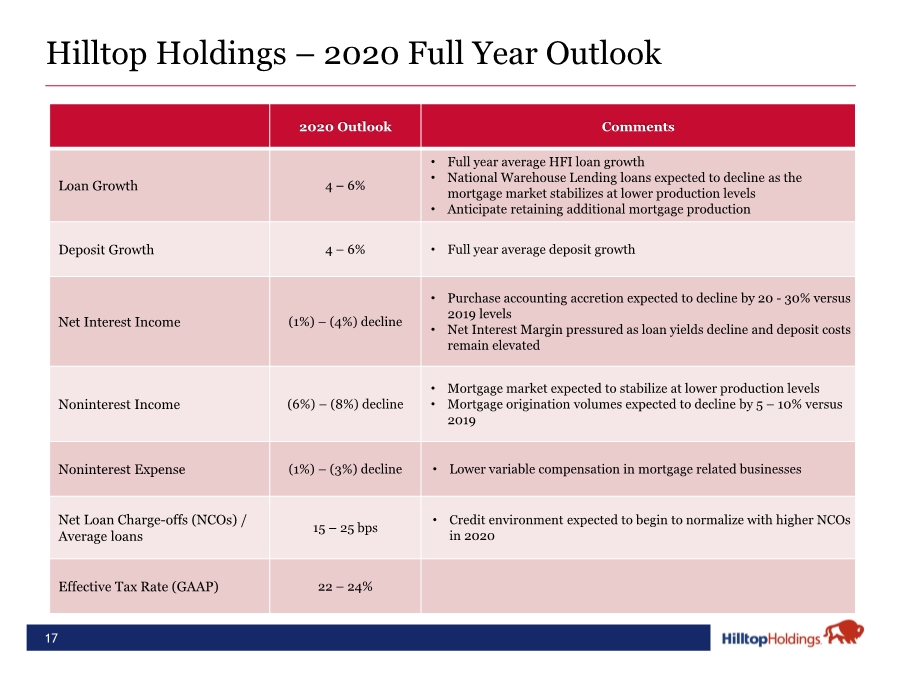
| 17 Hilltop Holdings – 2020 Full Year Outlook 2020 Outlook Comments Loan Growth 4 – 6% • Full year average HFI loan growth • National Warehouse Lending loans expected to decline as the mortgage market stabilizes at lower production levels • Anticipate retaining additional mortgage production Deposit Growth 4 – 6% • Full year average deposit growth Net Interest Income (1%) –(4%) decline • Purchase accounting accretion expected to decline by 20 - 30% versus 2019 levels • Net Interest Margin pressured as loan yields decline and deposit costs remain elevated Noninterest Income (6%) –(8%) decline • Mortgage market expected to stabilize at lower production levels • Mortgage origination volumes expected to decline by 5 – 10% versus 2019 Noninterest Expense (1%) –(3%) decline • Lower variable compensation in mortgage related businesses Net Loan Charge-offs (NCOs) / Average loans 15 – 25 bps • Credit environment expected to begin to normalize with higher NCOs in 2020 Effective Tax Rate (GAAP) 22 – 24% |
| Appendix 18 |

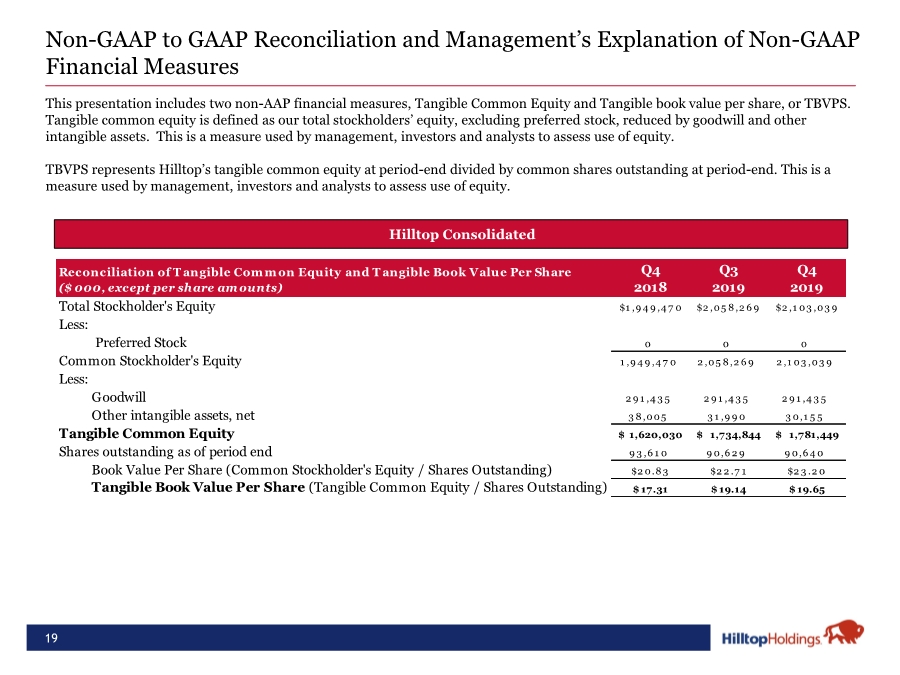
| 19 Non-GAAP to GAAP Reconciliation and Management’s Explanation of Non-GAAP Financial Measures • Hilltop Consolidated This presentation includes two non-AAP financial measures, Tangible Common Equity and Tangible book value per share, or TBVPS. Tangible common equity is defined as our total stockholders’ equity, excluding preferred stock, reduced by goodwill and other intangible assets. This is a measure used by management, investors and analysts to assess use of equity. TBVPS represents Hilltop’s tangible common equity at period-end divided by common shares outstanding at period-end. This is a measure used by management, investors and analysts to assess use of equity. Reconciliation of T angible Com m on Equity and T angible Book Value Per Share ($ 000, except per share amounts) Q4 2018 Q3 2019 Q4 2019 Total Stockholder's Equity 1 ,9 4 9 ,4 7 0 $ 2 ,05 8,2 6 9 $ 2 ,1 03 ,03 9 $ Less: Preferred Stock 0 0 0 Common Stockholder's Equity 1 ,9 4 9 ,4 7 0 2 ,05 8,2 6 9 2 ,1 03 ,03 9 Less: Goodwill 2 9 1 ,4 3 5 2 9 1 ,4 3 5 2 9 1 ,4 3 5 Other intangible assets, net 3 8,005 3 1 ,9 9 0 3 0,1 5 5 Tangible Common Equity 1,620,030 $ 1,734,844 $ 1,781,449 $ Shares outstanding as of period end 9 3 ,6 1 0 9 0,6 2 9 9 0,6 4 0 Book Value Per Share (Common Stockholder's Equity / Shares Outstanding) $2 0.83 $2 2 .7 1 $2 3 .2 0 Tangible Book Value Per Share (Tangible Common Equity / Shares Outstanding) $ 17.31 $ 19.14 $ 19.65 |