UNITED STATES
SECURITIES AND EXCHANGE COMMISSION
Washington, D.C. 20549
FORM N-CSR
CERTIFIED SHAREHOLDER REPORT OF REGISTERED
MANAGEMENT INVESTMENT COMPANIES
Investment Company Act file number | 811-21437 | |||||||
| ||||||||
Cohen & Steers REIT and Utility Income Fund, Inc. | ||||||||
(Exact name of registrant as specified in charter) | ||||||||
| ||||||||
280 Park Avenue, New York, NY |
| 10017 | ||||||
(Address of principal executive offices) |
| (Zip code) | ||||||
| ||||||||
Adam M. Derechin Cohen & Steers Capital Management, Inc. 280 Park Avenue New York, New York 10017 | ||||||||
(Name and address of agent for service) | ||||||||
| ||||||||
Registrant’s telephone number, including area code: | (212) 832-3232 |
| ||||||
| ||||||||
Date of fiscal year end: | December 31 |
| ||||||
| ||||||||
Date of reporting period: | June 30, 2006 |
| ||||||
Item 1. Reports to Stockholders.
COHEN & STEERS REIT AND UTILITY INCOME FUND, INC.
August 9, 2006
To Our Shareholders:
We are pleased to submit to you our report for the six months ended June 30, 2006. The net asset value at that date was $22.34 per common share. The fund's common stock is traded on the New York Stock Exchange and its share price can differ from its net asset value; at period end, the fund's closing price on the NYSE was $18.59. The total return, including income, for Cohen & Steers REIT and Utility Income Fund and the comparative benchmarks were:
| Six Months Ended June 30, 2006 | |||||||
| Cohen & Steers REIT and Utility Income Fund at Market Valuea | 9.24 | % | |||||
| Cohen & Steers REIT and Utility Income Fund at Net Asset Valuea | 9.05 | % | |||||
| FTSE NAREIT Equity REIT Indexb | 12.90 | % | |||||
| S&P 500 Indexb | 2.71 | % | |||||
| S&P 1500 Utilities Indexb | 5.19 | % | |||||
| Blend—40% FTSE NAREIT Equity REIT Index, 40% S&P 1500 Utilities Index, 20% Merrill Lynch Fixed Rate Preferred Indexb | 7.23 | % | |||||
Three monthly dividends of $0.1175 per common share were declared and will be paid to common shareholders on July 31, 2006, August 31, 2006 and September 29, 2006.c
Investment Review
Both REITs and utilities demonstrated strong performance for the six months ending June 30, 2006, while a bearish bond market subdued preferred securities' total returns. The FTSE NAREIT Equity REIT Index delivered a
a As a closed-end investment company, the price of the fund's New York Stock Exchange-traded shares will be set by market forces and at times may deviate from the net asset value per share of the fund.
b The FTSE NAREIT Equity REIT Index is an unmanaged, market capitalization weighted index of all publicly traded REITs that invest predominantly in the equity ownership of real estate. The index is designed to reflect the performance of all publicly traded equity REITs as a whole. The S&P 500 Index is an unmanaged index of common stocks that is frequently used as a general measure of stock market performance. The S&P 1500 Utilities Index is an unmanaged market capitalization weighted index of 81 companies whose primary business involves the generation, transmission and/or distribution of electricity and/or natural gas. The Merrill Lynch Fixed Rate Preferred Index is an unmanaged index of preferred securities.
c Please note that distributions paid by the fund to shareholders are subject to recharacterization for tax purposes. The final tax treatment of these distributions is reported to shareholders after the close of each fiscal year on form 1099-DIV. To the extent the fund pays distributions in excess of its net investment company taxable income, this excess would be a tax-free return of capital distributed from the fund's assets. To the extent this occurs, the fund's shareholders of record would be notified of the approximate amount of capital returned for each such distribution. Distributions of capital decrease the fund's total assets and, therefore, could have the effect of increasing the fund's expense ratio. In addition, in order to make these distributions, the fund may have to sell portfolio securities at a less than opportune time.
1
COHEN & STEERS REIT AND UTILITY INCOME FUND, INC.
total return of 12.9% year-to-date. Utilities, as measured by the S&P 1500 Utilities Index, delivered a total return of 5.2% for the six months, outpacing the S&P 500's 2.7%.
Strong fundamentals propelled real estate stocks to new highs in the first quarter, easily outpacing the broader markets. When concerns about inflation, Fed tightening and potentially slower economic growth spooked investors across markets, REITs also retrenched briefly. By June 30, however, the continued drumbeat of positive developments for U.S. real estate drove U.S. REIT stocks back to within a couple of percentage points of their first-quarter closing levels.
We expect the current real estate recovery to progress quite nicely, as ongoing demand in an environment of moderate economic growth should continue to outstrip the historically modest levels of new supply. In the past, inflation, an unequivocal negative for financial assets, has been a net positive for real property, and therefore REITs, relative to most other financial assets. It is not surprising, then, that real estate stocks fared better than the broader market this year. The top-performing REIT sectors for the year-to-date were apartment (21.0% total return), office (19.8%) and hotel (17.2%)—the three sectors in the fund that benefited most from the real estate recovery.
The apartment sector continued to advance as weakness in the for-sale housing markets accrued to the benefit of apartment owners. Home Properties Inc. (39.7%) was the fund's top performer. Education Realty Trust, an owner of student housing, was second, with a total return of 34.6%. Conversely, GMH Communities Trust, another student housing company, was one of the fund's worst performers (–11.8%) as it struggled with company-specific issues.
Office property benefited from strong growth in corporate profits, which was underscored by two large transactions. In March, the Blackstone Group paid $5.6 billion for CarrAmerica Realty, which had a 31.8% total return year-to-date and was one of the fund's top performers. Then, on June 5, Trizec Properties announced that it was being acquired by Brookfield Properties and the Blackstone Group for $8.9 billion—the largest REIT buyout since General Growth Properties purchased the Rouse Company in 2004.
Other top performers in the sector were Equity Office Properties (22.7%) and Highwoods Properties (30.6%). The fund's performance suffered from not holding positions in SL Green Realty (45.0%), Trizec Properties (26.8%) and Boston Properties (23.8%), as these companies do not pay sufficient dividends to meet the fund's primary income objective.
Manufactured housing, the worst-performing sector (–0.2%), continued to underperform, and free standing retail (2.6%) turned in a weak but positive performance. Regional malls (3.6%) rounded out the worst-performing sectors. Mills Corporation (–34.6%), a mall owner and our worst performer, continued to struggle to meet the obligations of a public company to its shareholders.
Utilities benefited from a strong earnings growth outlook, corporate restructuring activity and perhaps from its perceived safe haven status amidst equity market volatility and a slowing economy. During the first half of 2006,
2
COHEN & STEERS REIT AND UTILITY INCOME FUND, INC.
the fund's utilities allocation underperformed the S&P 1500 Utilities Index. The biggest contributors to performance were Fairpoint Communications and the German utility E.ON AG.
Several utilities announced initiatives this year that we believe will support longer-term earnings growth, highlighting what we see as an attractive fundamental environment for U.S. utilities and reflecting the need to invest significant capital in our aging power and natural gas infrastructure. Shares of TXU Corp. reacted favorably to their April 10 announcement of a $10 billion investment plan to build 11 new coal-fired power plants in Texas that could add more than $1 billion of incremental earnings by 2010. TXU shares rose 20.9% during the first half of 2006, compared with 5.2% for the utility index over the same period.
Duke Energy, the fund's largest holding, announced plans to separate its sizable electric power utilities from its natural gas pipeline and midstream business to unlock the higher standalone valuation afforded pure-play natural gas infrastructure companies. While we believe there is further upside, the shares delivered an attractive 9.4% return during the first half of the year.
The fund's biggest detractor from performance was the lack of ownership of AES, a global power producer that was up 16.6%, reflecting strong first-quarter earnings and a broadly positive emerging markets environment.
The fund's preferred positions, which are used with the objective of enhancing income, detracted from performance due to the better overall performance of REIT and utility stocks. Although preferreds' prices fell, their high income kept total returns in positive territory, and outpaced the Merrill Lynch Fixed Rate Preferred Index (–0.4%) but detracted from the fund's performance for the period. This took place during a rising interest-rate environment, when the yield on the 10-year U.S. Treasury bond increased from 4.4% to 5.1%. We expect better performance from REIT preferreds later in the year, following the anticipated cessation of Fed rate hikes and the economic slowing that we expect will follow.
Investment Outlook
During the second quarter, as it became apparent that rising inflation was going to require the Fed to slow U.S. GDP growth, the specter of "stagflation" reared its ugly head in the financial press for the first time since the 1970s. Indeed, recent days have marked the first time the market has had to face the combination of accelerating inflation and a potentially slower economy since that economically notorious decade. What might this imply for real estate stocks?
Land, the primary component of real estate that is responsible for the differentiated return it has provided, is a unique asset class. Habitable urban land commands an economic rental payment that is based primarily on the proximity that it provides to other economic activity—that is, its location. Unlike capital and labor—the other two inputs to economic production, whose pricing power erodes further into an economic cycle as excess capacity is created to accommodate expanding demand—land's value has typically continued to increase when the surrounding economic activity has increased, regardless of what happened to the monetary price level. Note that,
3
COHEN & STEERS REIT AND UTILITY INCOME FUND, INC.
while the past is not necessarily indicative of future results, since the beginning of the modern REIT era in 1993, REIT stocks on average have increased their dividends at greater levels than the rate of inflation in every single year.
As a result, given our view of the state of relative balance of most real estate markets in the United States, we believe that modest reflation is a net positive for real estate stocks relative to most other investments. Of course, galloping inflation would increase uncertainty in the economy and could eventually severely curtail economic growth, which would not help real estate values or the REIT market.
Utility fundamentals remain positive, in our view, and we forecast attractive earnings growth principally from two main areas. First, companies with below-market contracts that roll off over the coming years will produce earnings growth as they sell their production in higher-priced commodity markets. Second, many utilities have investment opportunities throughout the power and natural gas infrastructure. The Department of Energy estimates that up to $100 billion is needed to modernize our aging power transmission grid, to name one example. Overall, constructive regulation allows utilities to earn an attractive return on equity (ROE)—typically around 11.0%, but sometimes as high as 13.9%.
We believe attractive earnings growth should result from these wide-ranging investment opportunities and the ability to re-contract forward production in higher-priced energy markets. We expect that annual earnings growth over the next three years will be two- to three-times the long-term average of 3%. Further, we believe the price that investors must pay for this growth is very reasonable. Utility stocks trade at around 14 times 2007 earnings, which is just above the long-term average. In our opinion, a premium to the historical sector P/E multiple is warranted, considering the much-improved growth outlook.
Despite what we believe to be an attractive investment cycle for utilities, there are areas that warrant scrutiny. Near-term power and natural gas prices have declined substantially since the beginning of the year as a result of high natural gas storage levels and lower demand—driven largely by demand destruction from higher prices and by mild winter weather. However, longer-term forward power and natural gas prices have been much more resilient. It is important to note that most utilities have hedged much of their anticipated power sales for 2006, but have the ability to re-price below market hedges in the outer years, which in our view provides for meaningful earnings growth potential.
We are experiencing a transitory overlap of higher inflation and slower economic growth. Without large structural impediments to free-market economic flexibility, these two phenomena are generally incompatible. The Fed's job is to decide which of the two is less harmful to the overall economy. For utilities and real estate, neither slightly higher inflation nor slightly lower economic growth (we estimate in the 2% range) should, in our view, derail the fundamental improvements that are driving cash flow and dividend growth.
In closing, we expect REIT fundamentals to continue to improve; at June 30, 45.9% of the portfolio was allocated to REITs. Similarly, we believe that the outlook for the utility sector (46.3% of the portfolio) is strong, and that preferred securities (15.8% of the portfolio, which includes REITs and utilities) will strengthen later this year if the Federal Reserve interest-rate tightening cycle ends.
4
COHEN & STEERS REIT AND UTILITY INCOME FUND, INC.
Sincerely,
 |  | ||||||
| MARTIN COHEN | ROBERT H. STEERS | ||||||
| Co-chairman | Co-chairman | ||||||
 |  | ||||||
| ROBERT S. BECKER | WILLIAM F. SCAPELL | ||||||
| Portfolio Manager | Portfolio Manager | ||||||
 |  | ||||||
| JOSEPH M. HARVEY | JAMES S. CORL | ||||||
| Portfolio Manager | Portfolio Manager | ||||||

THOMAS N. BOHJALIAN
Portfolio Manager
The views and opinions in the preceding commentary are as of the date stated and are subject to change. This material represents an assessment of the market environment at a specific point in time, should not be relied upon as investment advice and is not intended to predict or depict performance of any investment.
Visit Cohen & Steers online at cohenandsteers.com
For more information about any of our funds, visit cohenandsteers.com, where you'll find daily net asset values, fund fact sheets and portfolio highlights. You can also access newsletters, education tools and market updates covering REIT, utility and preferred securities sectors.
In addition, our Web site contains comprehensive information about our firm, including our most recent press releases, profiles of our senior investment professionals, and an overview of our investment approach.
5
COHEN & STEERS REIT AND UTILITY INCOME FUND, INC.
Our Leverage Strategy
(Unaudited)
While we do not attempt to predict what future interest rates will be, it has been our philosophy to utilize interest rate swap transactions to seek to reduce the interest rate risk inherent in our utilization of leverage. Our leverage strategy involves issuing auction market preferred shares (AMPS) to raise additional capital for the fund, with an objective of increasing the net income available for shareholders. As of June 30, 2006, AMPS represented 35% of the fund's managed assets. Considering that AMPS have variable dividend rates, we seek to lock in the rate on a majority of this additional capital through interest rate swap agreements (where we effectively convert our variable rate obligation to a fixed rate obligation for the term of the swap agreements). Specifically, we have fixed the rate on 53% of our borrowings at an average interest rate of 3.5% for an average remaining period of 2.6 years (when we first entered into the swaps, the average term was 4.8 years). By locking in a large portion or our leveraging costs, we have endeavored to adequately protect the dividend-paying ability of the fund. The use of leverage increases the volatility of the fund's net asset value in both up and down markets. However, we believe that locking in a portion of the fund's leveraging costs for the term of the swap agreements partially protects the fund from any impact that an increase in short-term interest rates may have as a result of the use of leverage.
Leverage Factsa
| Leverage (as a % of managed assets) | 35 | % | |||||
| % Fixed Rate | 53 | % | |||||
| % Variable Rate | 47 | % | |||||
| Weighted Average Rate on Swaps | 3.5 | % | |||||
| Weighted Average Term on Swaps | 2.6 years | ||||||
| Current Rate on AMPS | 5.2 | % | |||||
a Data as of June 30, 2006. Information subject to change.
6
COHEN & STEERS REIT AND UTILITY INCOME FUND, INC.
JUNE 30, 2006
Top Ten Holdingsa
(Unaudited)
| Security | Market Value | % of Managed Assets | |||||||||
| 1. Duke Energy Corp | $ | 122,858,822 | 6.1 | % | |||||||
| 2. Ameren Corp | 61,397,900 | 3.0 | |||||||||
| 3. Progress Energy | 59,970,843 | 3.0 | |||||||||
| 4. Southern Co | 57,504,110 | 2.9 | |||||||||
| 5. Public Service Enterprise Group | 56,036,700 | 2.8 | |||||||||
| 6. Consolidated Edison | 55,972,180 | 2.8 | |||||||||
| 7. Equity Office Properties Trust | 55,005,966 | 2.7 | |||||||||
| 8. DTE Energy Co | 49,751,688 | 2.5 | |||||||||
| 9. Nationwide Health Properties | 47,583,889 | 2.4 | |||||||||
| 10. Exelon Corp | 46,339,182 | 2.3 | |||||||||
a Top ten holdings determined on the basis of the value of individual securities held.
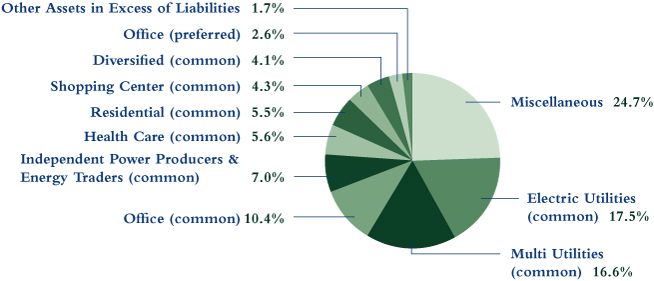
Sector Breakdown
(Based on Managed Assets)
(Unaudited)
7
COHEN & STEERS REIT AND UTILITY INCOME FUND, INC.
SCHEDULE OF INVESTMENTS
June 30, 2006 (Unaudited)
| Number of Shares | Value | ||||||||||||||
| COMMON STOCK | 121.0 | % | |||||||||||||
| ENERGY | 1.5 | % | |||||||||||||
| OIL & GAS REFINING & MARKETING | 0.5 | % | |||||||||||||
| Duke Energy Income Fund (Note 2) | 172,600 | $ | 1,816,761 | ||||||||||||
| Duke Energy Income Fund, 144Aa (Note 2) | 125,000 | 1,315,730 | |||||||||||||
| Williams Partners LP | 115,900 | 3,646,214 | |||||||||||||
| 6,778,705 | |||||||||||||||
| OIL & GAS STORAGE & TRANSPORTATION | 1.0 | % | |||||||||||||
| DCP Midstream Partners LP | 142,000 | 4,004,400 | |||||||||||||
| Kinder Morgan | 45,000 | 4,495,050 | |||||||||||||
| Magellan Midstream Holdings LP | 87,000 | 1,813,950 | |||||||||||||
| Teekay LNG Partners LP | 69,300 | 2,106,720 | |||||||||||||
| 12,420,120 | |||||||||||||||
| TOTAL ENERGY | 19,198,825 | ||||||||||||||
| REAL ESTATE | 54.6 | % | |||||||||||||
| DIVERSIFIED | 6.3 | % | |||||||||||||
| Colonial Properties Trust | 502,800 | 24,838,320 | |||||||||||||
| Entertainment Properties Trust | 178,300 | 7,675,815 | |||||||||||||
| iStar Financial | 433,000 | 16,345,750 | |||||||||||||
| Lexington Corporate Properties Trust | 723,100 | 15,618,960 | |||||||||||||
| Spirit Finance Corp. | 1,594,700 | 17,956,322 | |||||||||||||
| 82,435,167 | |||||||||||||||
| HEALTH CARE | 8.6 | % | |||||||||||||
| Health Care Property Investors | 725,300 | 19,394,522 | |||||||||||||
| Health Care REIT | 467,500 | 16,339,125 | |||||||||||||
| Healthcare Realty Trust | 258,000 | 8,217,300 | |||||||||||||
| Nationwide Health Properties | 2,113,900 | 47,583,889 | |||||||||||||
| Senior Housing Properties Trust | 477,500 | 8,552,025 | |||||||||||||
| Ventas | 400,000 | 13,552,000 | |||||||||||||
| 113,638,861 | |||||||||||||||
See accompanying notes to financial statements.
8
COHEN & STEERS REIT AND UTILITY INCOME FUND, INC.
SCHEDULE OF INVESTMENTS—(Continued)
June 30, 2006 (Unaudited)
| Number of Shares | Value | ||||||||||||||
| HOTEL | 3.1 | % | |||||||||||||
| Ashford Hospitality Trust | 662,900 | $ | 8,365,798 | ||||||||||||
| DiamondRock Hospitality Co. | 940,100 | 13,922,881 | |||||||||||||
| Hospitality Properties Trust | 284,400 | 12,490,848 | |||||||||||||
| Strategic Hotels & Resorts | 256,900 | 5,328,106 | |||||||||||||
| 40,107,633 | |||||||||||||||
| INDUSTRIAL | 0.9 | % | |||||||||||||
| First Industrial Realty Trust | 322,700 | 12,243,238 | |||||||||||||
| MORTGAGE | 2.2 | % | |||||||||||||
| Newcastle Investment Corp. | 1,164,400 | 29,482,608 | |||||||||||||
| OFFICE | 16.0 | % | |||||||||||||
| American Financial Realty Trust | 462,500 | 4,477,000 | |||||||||||||
| Brandywine Realty Trust | 763,937 | 24,575,853 | |||||||||||||
| Duke Realty Corp. | 442,800 | 15,564,420 | |||||||||||||
| Equity Office Properties Trust | 1,506,600 | 55,005,966 | |||||||||||||
| Glenborough Realty Trust | 430,100 | 9,264,354 | |||||||||||||
| Highwoods Properties | 382,200 | 13,827,996 | |||||||||||||
| HRPT Properties Trust | 1,691,800 | 19,557,208 | |||||||||||||
| Liberty Property Trust | 526,800 | 23,284,560 | |||||||||||||
| Mack-Cali Realty Corp. | 435,200 | 19,984,384 | |||||||||||||
| Reckson Associates Realty Corp. | 600,100 | 24,832,138 | |||||||||||||
| 210,373,879 | |||||||||||||||
| RESIDENTIAL | 8.4 | % | |||||||||||||
| APARTMENT | 8.2 | % | |||||||||||||
| American Campus Communities | 151,700 | 3,769,745 | |||||||||||||
| Apartment Investment & Management Co. | 471,200 | 20,473,640 | |||||||||||||
| Education Realty Trust | 487,900 | 8,123,535 | |||||||||||||
| GMH Communities Trust | 595,400 | 7,847,372 | |||||||||||||
| Home Properties | 754,200 | 41,865,642 | |||||||||||||
| Mid-America Apartment Communities | 188,700 | 10,520,025 | |||||||||||||
| United Dominion Realty Trust | 542,600 | 15,198,226 | |||||||||||||
| 107,798,185 | |||||||||||||||
See accompanying notes to financial statements.
9
COHEN & STEERS REIT AND UTILITY INCOME FUND, INC.
SCHEDULE OF INVESTMENTS—(Continued)
June 30, 2006 (Unaudited)
| Number of Shares | Value | ||||||||||||||
| MANUFACTURED HOME | 0.2 | % | |||||||||||||
| Sun Communities | 75,000 | $ | 2,439,750 | ||||||||||||
| TOTAL RESIDENTIAL | 110,237,935 | ||||||||||||||
| SELF STORAGE | 2.5 | % | |||||||||||||
| Extra Space Storage | 628,500 | 10,206,840 | |||||||||||||
| Sovran Self Storage | 180,400 | 9,162,516 | |||||||||||||
| U-Store-It Trust | 717,600 | 13,533,936 | |||||||||||||
| 32,903,292 | |||||||||||||||
| SHOPPING CENTER | 6.6 | % | |||||||||||||
| COMMUNITY CENTER | 3.0 | % | |||||||||||||
| Cedar Shopping Centers | 522,000 | 7,683,840 | |||||||||||||
| Heritage Property Investment Trust | 139,900 | 4,885,308 | |||||||||||||
| Inland Real Estate Corp. | 753,500 | 11,212,080 | |||||||||||||
| New Plan Excel Realty Trust | 328,200 | 8,103,258 | |||||||||||||
| Urstadt Biddle Properties—Class A | 425,500 | 6,931,395 | |||||||||||||
| 38,815,881 | |||||||||||||||
| FREE STANDING | 1.4 | % | |||||||||||||
| National Retail Properties | 934,200 | 18,637,290 | |||||||||||||
| REGIONAL MALL | 2.2 | % | |||||||||||||
| Glimcher Realty Trust | 305,500 | 7,579,455 | |||||||||||||
| Mills Corp. | 235,800 | 6,307,650 | |||||||||||||
| Pennsylvania REIT | 386,800 | 15,615,116 | |||||||||||||
| 29,502,221 | |||||||||||||||
| TOTAL SHOPPING CENTER | 86,955,392 | ||||||||||||||
| TOTAL REAL ESTATE | 718,378,005 | ||||||||||||||
| TELECOMMUNICATIONS SERVICES | 1.4 | % | |||||||||||||
| INTEGRATED TELECOMMUNICATIONS SERVICES | |||||||||||||||
| Citizens Communications Co. | 310,100 | 4,046,805 | |||||||||||||
| Fairpoint Communications | 986,000 | 14,198,400 | |||||||||||||
| 18,245,205 | |||||||||||||||
See accompanying notes to financial statements.
10
COHEN & STEERS REIT AND UTILITY INCOME FUND, INC.
SCHEDULE OF INVESTMENTS—(Continued)
June 30, 2006 (Unaudited)
| Number of Shares | Value | ||||||||||||||
| UTILITIES | 63.5 | % | |||||||||||||
| ELECTRIC UTILITIES | 26.9 | % | |||||||||||||
| Cleco Corp. | 243,500 | $ | 5,661,375 | ||||||||||||
| DPL | 112,900 | 3,025,720 | |||||||||||||
| E.ON AG (ADR) | 472,096 | 18,104,881 | |||||||||||||
| Edison International | 443,000 | 17,277,000 | |||||||||||||
| Entergy Corp. | 419,500 | 29,679,625 | |||||||||||||
| Exelon Corp. | 815,400 | 46,339,182 | |||||||||||||
| FirstEnergy Corp. | 457,300 | 24,790,233 | |||||||||||||
| FPL Group | 224,600 | 9,293,948 | |||||||||||||
| Hawaiian Electric Industries | 263,900 | 7,365,449 | |||||||||||||
| ITC Holdings Corp. | 167,300 | 4,446,834 | |||||||||||||
| Northeast Utilities | 259,700 | 5,367,999 | |||||||||||||
| Pepco Holdings | 990,800 | 23,363,064 | |||||||||||||
| Pinnacle West Capital Corp. | 397,500 | 15,864,225 | |||||||||||||
| PPL Corp. | 459,000 | 14,825,700 | |||||||||||||
| Progress Energy | 1,398,900 | 59,970,843 | |||||||||||||
| Scottish and Southern Energy PLC | 250,328 | 5,328,058 | |||||||||||||
| Scottish Power PLC (ADR) | 114,807 | 4,952,774 | |||||||||||||
| Southern Co. | 1,794,200 | 57,504,110 | |||||||||||||
| 353,161,020 | |||||||||||||||
| GAS UTILITIES | 0.5 | % | |||||||||||||
| AGL Resources | 175,400 | 6,686,248 | |||||||||||||
| INDEPENDENT POWER PRODUCERS & ENERGY TRADERS | 10.7 | % | |||||||||||||
| Duke Energy Corp. | 4,183,140 | 122,858,822 | |||||||||||||
| TXU Corp. | 304,900 | 18,229,971 | |||||||||||||
| 141,088,793 | |||||||||||||||
| MULTI UTILITIES | 25.4 | % | |||||||||||||
| Ameren Corp. | 1,215,800 | 61,397,900 | |||||||||||||
| Consolidated Edison | 1,259,500 | 55,972,180 | |||||||||||||
| Dominion Resources | 182,700 | 13,664,133 | |||||||||||||
| DTE Energy Co. | 1,221,200 | 49,751,688 | |||||||||||||
| Energy East Corp. | 92,100 | 2,203,953 | |||||||||||||
See accompanying notes to financial statements.
11
COHEN & STEERS REIT AND UTILITY INCOME FUND, INC.
SCHEDULE OF INVESTMENTS—(Continued)
June 30, 2006 (Unaudited)
| Number of Shares | Value | ||||||||||||||
| KeySpan Corp. | 574,800 | $ | 23,221,920 | ||||||||||||
| NSTAR | 341,374 | 9,763,297 | |||||||||||||
| PG&E Corp. | 805,000 | 31,620,400 | |||||||||||||
| Public Service Enterprise Group | 847,500 | 56,036,700 | |||||||||||||
| RWE AG | 50,483 | 4,200,299 | |||||||||||||
| SCANA Corp. | 26,400 | 1,018,512 | |||||||||||||
| United Utilities PLC | 92,301 | 1,094,932 | |||||||||||||
| Xcel Energy | 1,286,200 | 24,669,316 | |||||||||||||
| 334,615,230 | |||||||||||||||
| TOTAL UTILITIES | 835,551,291 | ||||||||||||||
| TOTAL COMMON STOCK (Identified cost—$1,402,907,215) | 1,591,373,326 | ||||||||||||||
| PREFERRED SECURITIES—$25 PAR VALUE | 17.7 | % | |||||||||||||
| BANK | 0.5 | % | |||||||||||||
| Colonial Capital Trust IV, 7.875%, due 10/1/33 | 74,100 | 1,879,917 | |||||||||||||
| U.S. Bancorp, Series B | 160,000 | 4,020,000 | |||||||||||||
| Zions Capital Trust, 8.00%, Series B | 10,000 | 258,800 | |||||||||||||
| 6,158,717 | |||||||||||||||
| BANK—FOREIGN | 0.1 | % | |||||||||||||
| Northern Rock PLC, 8.00%, Series A | 45,531 | 1,143,329 | |||||||||||||
| FINANCE | 0.7 | % | |||||||||||||
| Goldman Sachs Group, 5.878%, Series (FRN) | 80,000 | 2,028,000 | |||||||||||||
| HSBC USA, 4.9175%, Series G | 76,500 | 1,967,580 | |||||||||||||
| MBNA Capital, 8.125%, Series D (TruPS) | 105,142 | 2,703,201 | |||||||||||||
| MBNA Capital, 8.10%, due 2/15/33, Series E (TOPrS) | 64,000 | 1,675,520 | |||||||||||||
| Morgan Stanley, Series A (FRN) | 58,000 | 1,460,440 | |||||||||||||
| 9,834,741 | |||||||||||||||
| INSURANCE | 1.0 | % | |||||||||||||
| PROPERTY CASUALTY | 0.2 | % | |||||||||||||
| St Paul Capital Trust I, 7.60% (TruPS) | 24,300 | 615,762 | |||||||||||||
| XL Capital Ltd., 7.625%, Series B | 85,900 | 2,173,270 | |||||||||||||
| 2,789,032 | |||||||||||||||
See accompanying notes to financial statements.
12
COHEN & STEERS REIT AND UTILITY INCOME FUND, INC.
SCHEDULE OF INVESTMENTS—(Continued)
June 30, 2006 (Unaudited)
| Number of Shares | Value | ||||||||||||||
| PROPERTY CASUALTY—FOREIGN | 0.2 | % | |||||||||||||
| Arch Capital Group Ltd., 8.00% | 125,000 | $ | 3,180,000 | ||||||||||||
| REINSURANCE—FOREIGN | 0.6 | % | |||||||||||||
| Everest Re Capital Trust, 7.85%, due 11/15/32 | 232,280 | 5,888,298 | |||||||||||||
| PartnerRE Capital Trust I | 39,000 | 980,850 | |||||||||||||
| 6,869,148 | |||||||||||||||
| TOTAL INSURANCE | 12,838,180 | ||||||||||||||
| MEDIA | 0.1 | % | |||||||||||||
| Liberty Media Corp., 8.75%, due 2/1/30 (CBTCS) | 32,100 | 803,463 | |||||||||||||
| Liberty Media Corp., 8.75%, due 2/1/30 (PPLUS) | 54,000 | 1,357,560 | |||||||||||||
| 2,161,023 | |||||||||||||||
| REAL ESTATE | 14.5 | % | |||||||||||||
| DIVERSIFIED | 2.7 | % | |||||||||||||
| Digital Realty Trust, 8.50%, Series A | 19,000 | 480,510 | |||||||||||||
| Forest City Enterprises, 7.375%, Class A | 519,000 | 12,949,050 | |||||||||||||
| iStar Financial, 7.875%, Series E | 349,300 | 8,715,035 | |||||||||||||
| iStar Financial, 7.80%, Series F | 14,900 | 368,551 | |||||||||||||
| iStar Financial, 7.65%, Series G | 88,300 | 2,173,063 | |||||||||||||
| iStar Financial, 7.50%, Series I | 250,000 | 6,112,500 | |||||||||||||
| LBA Realty Fund LP, 7.625%, Series B | 194,600 | 3,843,350 | |||||||||||||
| Lexington Corporate Properties Trust, 8.05%, Series B | 50,000 | 1,279,750 | |||||||||||||
| 35,921,809 | |||||||||||||||
| HEALTH CARE | 3.0 | % | |||||||||||||
| Health Care REIT, 7.875%, Series D | 153,536 | 3,882,925 | |||||||||||||
| Health Care REIT, 7.625%, Series F | 305,600 | 7,679,728 | |||||||||||||
| LTC Properties, 8.00%, Series F | 600,000 | 14,964,000 | |||||||||||||
| Omega Healthcare Investors, 8.375%, Series D | 500,000 | 12,810,000 | |||||||||||||
| 39,336,653 | |||||||||||||||
| HOTEL | 1.7 | % | |||||||||||||
| Ashford Hospitality Trust, 8.55%, Series A | 40,000 | 1,006,400 | |||||||||||||
| Equity Inns, 8.00%, Series C | 115,000 | 2,883,625 | |||||||||||||
| Highland Hospitality Corp., 7.875%, Series A | 120,600 | 2,894,400 | |||||||||||||
| Host Hotels & Resorts, 8.875%, Series E | 80,000 | 2,160,000 | |||||||||||||
See accompanying notes to financial statements.
13
COHEN & STEERS REIT AND UTILITY INCOME FUND, INC.
SCHEDULE OF INVESTMENTS—(Continued)
June 30, 2006 (Unaudited)
| Number of Shares | Value | ||||||||||||||
| Innkeepers USA Trust, 8.00%, Series C | 222,900 | $ | 5,505,630 | ||||||||||||
| LaSalle Hotel Properties, 10.25%, Series A | 50,000 | 1,285,000 | |||||||||||||
| LaSalle Hotel Properties, 8.00%, Series E | 170,000 | 4,292,500 | |||||||||||||
| Strategic Hotels & Resorts, 8.25%, Series B | 90,800 | 2,254,564 | |||||||||||||
| 22,282,119 | |||||||||||||||
| INDUSTRIAL | 0.1 | % | |||||||||||||
| EastGroup Properties, 7.95%, Series D | 35,068 | 903,001 | |||||||||||||
| OFFICE | 4.0 | % | |||||||||||||
| Alexandria Real Estate Equities, 8.375%, Series C | 374,250 | 9,790,380 | |||||||||||||
| Brandywine Realty Trust, 7.50%, Series C | 177,410 | 4,366,060 | |||||||||||||
| Brandywine Realty Trust, 7.375%, Series D | 27,500 | 671,137 | |||||||||||||
| Corporate Office Properties Trust, 8.00%, Series G | 8,000 | 202,080 | |||||||||||||
| DRA CRT Acquisition Corp., 8.50%, Series A | 86,900 | 1,998,700 | |||||||||||||
| Equity Office Properties Trust, 7.75%, Series G | 24,800 | 633,640 | |||||||||||||
| Highwoods Properties, 8.00%, Series B | 80,259 | 2,014,501 | |||||||||||||
| Kilroy Realty Corp., 7.80%, Series E | 99,500 | 2,527,300 | |||||||||||||
| Maguire Properties, 7.625%, Series A | 590,400 | 14,582,880 | |||||||||||||
| SL Green Realty Corp., 7.625%, Series C | 424,500 | 10,400,250 | |||||||||||||
| SL Green Realty Corp., 7.875%, Series D | 227,650 | 5,759,545 | |||||||||||||
| 52,946,473 | |||||||||||||||
| OFFICE/INDUSTRIAL | 0.7 | % | |||||||||||||
| PS Business Parks, 7.00%, Series H | 55,959 | 1,354,208 | |||||||||||||
| PS Business Parks, 6.875%, Series I | 246,900 | 5,728,080 | |||||||||||||
| PS Business Parks, 7.95%, Series K | 65,000 | 1,677,000 | |||||||||||||
| 8,759,288 | |||||||||||||||
| RESIDENTIAL—APARTMENT | 0.6 | % | |||||||||||||
| Apartment Investment & Management Co., 9.375%, Series G | 35,000 | 910,350 | |||||||||||||
| Apartment Investment & Management Co., 8.00%, Series T | 138,400 | 3,454,464 | |||||||||||||
| Apartment Investment & Management Co., 8.00%, Series V | 47,200 | 1,177,640 | |||||||||||||
| Apartment Investment & Management Co., 7.875%, Series Y | 34,000 | 845,750 | |||||||||||||
| Colonial Properties Trust, 8.125%, Series D | 9,900 | 255,321 | |||||||||||||
| Mid-America Apartment Communities, 8.30%, Series H | 38,100 | 968,883 | |||||||||||||
| 7,612,408 | |||||||||||||||
See accompanying notes to financial statements.
14
COHEN & STEERS REIT AND UTILITY INCOME FUND, INC.
SCHEDULE OF INVESTMENTS—(Continued)
June 30, 2006 (Unaudited)
| Number of Shares | Value | ||||||||||||||
| SELF STORAGE | 0.0 | % | |||||||||||||
| Public Storage, 8.00%, Series R | 8,600 | $ | 215,860 | ||||||||||||
| SHOPPING CENTER | 1.7 | % | |||||||||||||
| COMMUNITY CENTER | 0.8 | % | |||||||||||||
| Developers Diversified Realty Corp., 8.00%, Series G | 26,500 | 681,050 | |||||||||||||
| Developers Diversified Realty Corp., 7.50%, Series I | 300,700 | 7,523,514 | |||||||||||||
| Saul Centers, 8.00%, Series A | 96,300 | 2,527,875 | |||||||||||||
| 10,732,439 | |||||||||||||||
| REGIONAL MALL | 0.9 | % | |||||||||||||
| CBL & Associates Properties, 7.75%, Series C | 114,710 | 2,896,428 | |||||||||||||
| CBL & Associates Properties, 7.375%, Series D | 60,000 | 1,485,000 | |||||||||||||
| Cedar Shopping Centers, 8.875%, Series A | 137,500 | 3,605,250 | |||||||||||||
| Mills Corp., 9.00%, Series C | 109,400 | 2,521,670 | |||||||||||||
| Mills Corp., 8.75%, Series E | 12,400 | 285,448 | |||||||||||||
| Mills Corp., 7.875%, Series G | 41,100 | 924,750 | |||||||||||||
| 11,718,546 | |||||||||||||||
| TOTAL SHOPPING CENTER | 22,450,985 | ||||||||||||||
| TOTAL REAL ESTATE | 190,428,596 | ||||||||||||||
| WIRELESS TELECOMMUNICATIONS SERVICES | 0.6 | % | |||||||||||||
| Telephone & Data Systems, 6.625%, due 3/31/45 | 30,100 | 689,591 | |||||||||||||
| Telephone & Data Systems, 7.60%, due 12/1/41, Series A | 230,500 | 5,686,435 | |||||||||||||
| United States Cellular Corp., 7.50%, due 6/15/34 | 39,700 | 999,646 | |||||||||||||
| 7,375,672 | |||||||||||||||
| UTILITIES | 0.2 | % | |||||||||||||
| ELECTRIC UTILITIES | 0.1 | % | |||||||||||||
| Entergy Corp., 7.625% | 24,800 | 1,245,456 | |||||||||||||
| MULTI UTILITIES | 0.1 | % | |||||||||||||
| Energy East Capital Trust I, 8.25%, due 7/31/31, Series | 48,200 | 1,222,834 | |||||||||||||
| Northern States Power Co., 8.00%, due 7/1/42, (PINES) | 9,500 | 241,300 | |||||||||||||
| PSEG Funding Trust II, 8.75%, due 12/31/32, Series | 8,500 | 220,065 | |||||||||||||
| 1,684,199 | |||||||||||||||
| TOTAL UTILITIES | 2,929,655 | ||||||||||||||
| TOTAL PREFERRED SECURITIES—$25 PAR VALUE (Identified cost—$233,808,439) | 232,869,913 | ||||||||||||||
See accompanying notes to financial statements.
15
COHEN & STEERS REIT AND UTILITY INCOME FUND, INC.
SCHEDULE OF INVESTMENTS—(Continued)
June 30, 2006 (Unaudited)
| Number of Shares | Value | ||||||||||||||
| PREFERRED SECURITIES—CAPITAL SECURITIES | 6.3 | % | |||||||||||||
| AUTO—FOREIGN | 0.2 | % | |||||||||||||
| Porsche International Finance PLC, 7.20%, due 2/28/49 | 2,000,000 | $ | 1,864,700 | ||||||||||||
| BANK | 0.3 | % | |||||||||||||
| Astoria Capital Trust I, 9.75%, due 11/1/29, Series B | 3,000,000 | 3,394,566 | |||||||||||||
| BANK—FOREIGN | 0.5 | % | |||||||||||||
| Washington Mutual Preferred Funding Cayman, 7.25%, due 3/29/49, Series A-1, 144Aa | 7,000,000 | 6,668,704 | |||||||||||||
| DIVERSIFIED FINANCIAL SERVICES | 1.2 | % | |||||||||||||
| Old Mutual Capital Funding, 8.00%, due 5/29/49 (Eurobond) | 15,450,000 | 15,881,951 | |||||||||||||
| ELECTRIC UTILITIES | 0.3 | % | |||||||||||||
| DPL Capital Trust II, 8.125%, due 9/1/31 | 4,000,000 | 4,460,000 | |||||||||||||
| FOOD | 0.8 | % | |||||||||||||
| Dairy Farmers of America, 7.875%, 144Aa,b | 50,000 | 4,856,065 | |||||||||||||
| Gruma S.A., 7.75%, due 12/29/49, 144Aa | 6,000,000 | 5,857,500 | |||||||||||||
| 10,713,565 | |||||||||||||||
| INSURANCE | 1.5 | % | |||||||||||||
| LIFE/HEALTH INSURANCE | 0.4 | % | |||||||||||||
| Liberty Mutual Insurance, 7.697%, due 10/15/97, 144Aa | 6,000,000 | 5,697,042 | |||||||||||||
| MULTI—LINE | 0.9 | % | |||||||||||||
| AFC Capital Trust I, 8.207%, due 2/3/27, Series B | 10,000,000 | 10,056,830 | |||||||||||||
| AXA, 7.10%, due 5/29/49 (Eurobond) | 2,000,000 | 1,972,700 | |||||||||||||
| 12,029,530 | |||||||||||||||
| REINSURANCE—FOREIGN | 0.2 | % | |||||||||||||
| Axis Capital Holdings Ltd., 7.50%, Series B | 20,000 | 1,963,052 | |||||||||||||
| TOTAL INSURANCE | 19,689,624 | ||||||||||||||
| INTEGRATED OIL & GAS | 0.7 | % | |||||||||||||
| Pemex Project Funding Master Trust, 7.75%, due 1/1/00 | 9,500,000 | 9,310,475 | |||||||||||||
| REAL ESTATE | 0.4 | % | |||||||||||||
| BF Saul REIT, 7.50%, due 3/1/14 | 5,000,000 | 5,100,000 | |||||||||||||
See accompanying notes to financial statements.
16
COHEN & STEERS REIT AND UTILITY INCOME FUND, INC.
SCHEDULE OF INVESTMENTS—(Continued)
June 30, 2006 (Unaudited)
| Number of Shares | Value | ||||||||||||||
| RETAIL | 0.2 | % | |||||||||||||
| JC Penney Co., 7.625%, due 3/1/97 | 2,000,000 | $ | 1,991,866 | ||||||||||||
| INTEGRATED TELECOMMUNICATIONS SERVICES | 0.2 | % | |||||||||||||
| Embarq Corp., 7.995%, due 6/1/36 | 3,000,000 | 3,023,886 | |||||||||||||
| TOTAL PREFERRED SECURITIES—CAPITAL SECURITIES (Identified cost—$83,297,546) | 82,099,337 | ||||||||||||||
| Principal Amount | |||||||||||||||
| CORPORATE BONDS | 5.6 | % | |||||||||||||
| CABLE TELEVISION | 1.8 | % | |||||||||||||
| Cablevision Systems Corp., 8.00%, due 4/15/12 | $ | 10,200,000 | 10,110,750 | ||||||||||||
| CSC Holdings, 7.875%, due 2/15/18 | 2,000,000 | 2,005,000 | |||||||||||||
| Rogers Cable, 8.75%, due 5/1/32 | 10,430,000 | 11,290,475 | |||||||||||||
| 23,406,225 | |||||||||||||||
| DIVERSIFIED SERVICES | 0.5 | % | |||||||||||||
| Liberty Media Corp., 8.25%, due 2/1/30 | 6,600,000 | 6,350,111 | |||||||||||||
| MULTI UTILITIES | 0.3 | % | |||||||||||||
| Dominion Resources, 7.50%, due 6/30/66 | 2,000,000 | 1,991,098 | |||||||||||||
| TXU Corp., 6.55%, due 11/15/34, Series R | 3,000,000 | 2,650,452 | |||||||||||||
| 4,641,550 | |||||||||||||||
| MEDICAL—HOSPITALS | 1.1 | % | |||||||||||||
| Columbia/HCA, 7.50%, due 11/15/95 | 9,600,000 | 8,003,674 | |||||||||||||
| Columbia/HCA, 7.69%, due 6/15/25 | 2,450,000 | 2,327,473 | |||||||||||||
| Columbia/HCA, 7.75%, due 7/15/36 | 2,325,000 | 2,172,073 | |||||||||||||
| Columbia/HCA, 8.36%, due 4/15/24 | 2,000,000 | 2,011,596 | |||||||||||||
| 14,514,816 | |||||||||||||||
| OIL & GAS EXPLORATION & PRODUCTION | 0.7 | % | |||||||||||||
| Kerr-McGee Corp., 7.875%, due 9/15/31 | 8,000,000 | 9,069,872 | |||||||||||||
| INTEGRATED TELECOMMUNICATIONS SERVICES | 1.2 | % | |||||||||||||
| Citizens Communications Co., 9.00%, due 8/15/31 | 15,500,000 | 15,771,250 | |||||||||||||
| TOTAL CORPORATE BONDS (Identified cost—$76,468,345) | 73,753,824 | ||||||||||||||
See accompanying notes to financial statements.
17
COHEN & STEERS REIT AND UTILITY INCOME FUND, INC.
SCHEDULE OF INVESTMENTS
June 30, 2006 (Unaudited)
| Principal Amount | Value | ||||||||||||||
| COMMERCIAL PAPER | 1.0 | % | |||||||||||||
| New Center Asset Trust, 4.15%, due 7/3/06 (Identified cost—$12,945,015) | $ | 12,948,000 | $ | 12,945,015 | |||||||||||
| TOTAL INVESTMENTS (Identified cost—$1,809,426,560) | 151.6 | % | 1,993,041,415 | ||||||||||||
| OTHER ASSETS IN EXCESS OF LIABILITIES | 1.7 | % | 22,013,078 | ||||||||||||
| LIQUIDATION VALUE OF PREFERRED SHARES | (53.3 | )% | (700,000,000 | ) | |||||||||||
| NET ASSETS APPLICABLE TO COMMON SHARES (Equivalent to $22.34 per share based on 58,858,135 shares of common stock outstanding) | 100.0 | % | $ | 1,315,054,493 | |||||||||||
Glossary of Portfolio Abbreviations
ADR American Depositary Receipt
CBTCS Corporate Backed Trust Certificates
FRN Floating Rate Note
PINES Public Income Notes
PPLUS Preferred Plus Trust
REIT Real Estate Investment Trust
TOPrS Trust Originated Preferred Securities
TruPS Trust Preferred Securities
Note: Percentages indicated are based on the net assets applicable to common shares of the fund.
a Resale is restricted to qualified institutional investors; aggregate holdings equal 1.9% of net assets applicable to common shares.
b Fair valued security. Total fair valued securities equals 0.4% of net assets applicable to common shares.
See accompanying notes to financial statements.
18
COHEN & STEERS REIT AND UTILITY INCOME FUND, INC.
STATEMENT OF ASSETS AND LIABILITIES
June 30, 2006 (Unaudited)
| ASSETS: | |||||||
| Investments in securities, at value (Identified cost—$1,809,426,560) | $ | 1,993,041,415 | |||||
| Unrealized appreciation on interest rate swap transactions | 18,042,828 | ||||||
| Dividends and interest receivable | 9,569,251 | ||||||
| Receivable for investment securities sold | 933,129 | ||||||
| Other assets | 139,711 | ||||||
| Total Assets | 2,021,726,334 | ||||||
| LIABILITIES: | |||||||
| Payable for investment securities purchased | 2,424,729 | ||||||
| Payable for dividends declared on preferred shares | 1,619,992 | ||||||
| Payable for dividends declared on common shares | 1,265,398 | ||||||
| Payable to investment manager | 1,057,812 | ||||||
| Payable to administrator | 73,644 | ||||||
| Payable for directors' fees | 1,771 | ||||||
| Other liabilities | 228,495 | ||||||
| Total Liabilities | 6,671,841 | ||||||
| LIQUIDATION VALUE OF PREFERRED SHARES: | |||||||
| Auction market preferred shares, Series M7, ($25,000 liquidation value, $0.001 par value, 3,360 shares issued and outstanding | 84,000,000 | ||||||
| Auction market preferred shares, Series T7, ($25,000 liquidation value, $0.001 par value, 3,360 shares issued and outstanding) | 84,000,000 | ||||||
| Auction market preferred shares, Series W7, ($25,000 liquidation value, $0.001 par value, 3,360 shares issued and outstanding | 84,000,000 | ||||||
| Auction market preferred shares, Series TH7, ($25,000 liquidation value, $0.001 par value, 3,360 shares issued and outstanding) | 84,000,000 | ||||||
| Auction market preferred shares, Series F7, ($25,000 liquidation value, $0.001 par value, 3,360 shares issued and outstanding) | 84,000,000 | ||||||
| Auction market preferred shares, Series M28, ($25,000 liquidation value, $0.001 par value, 2,200 shares issued and outstanding) | 55,000,000 | ||||||
| Auction market preferred shares, Series T28, ($25,000 liquidation value, $0.001 par value, 3,000 shares issued and outstanding | 75,000,000 | ||||||
| Auction market preferred shares, Series W28, ($25,000 liquidation value, $0.001 par value, 3,000 shares issued and outstanding) | 75,000,000 | ||||||
| Auction market preferred shares, Series F28, ($25,000 liquidation value, $0.001 par value, 3,000 shares issued and outstanding) | 75,000,000 | ||||||
| 700,000,000 | |||||||
| TOTAL NET ASSETS APPLICABLE TO COMMON SHARES | $ | 1,315,054,493 | |||||
See accompanying notes to financial statements.
19
COHEN & STEERS REIT AND UTILITY INCOME FUND, INC.
STATEMENT OF ASSETS AND LIABILITIES—(Continued)
June 30, 2006 (Unaudited)
| TOTAL NET ASSETS APPLICABLE TO COMMON SHARES consist of: | |||||||
| Common stock ($0.001 par value, 58,858,135 shares issued and outstanding) | $ | 1,087,851,046 | |||||
| Dividends in excess of net investment income | (23,335,243 | ) | |||||
| Accumulated undistributed net realized gain | 48,879,727 | ||||||
| Net unrealized appreciation | 201,658,963 | ||||||
| $ | 1,315,054,493 | ||||||
| NET ASSET VALUE PER COMMON SHARE: | |||||||
| ($1,315,054,493 ÷ 58,858,135 shares outstanding) | $ | 22.34 | |||||
| MARKET PRICE PER COMMON SHARE | $ | 18.59 | |||||
| MARKET PRICE DISCOUNT TO NET ASSET VALUE PER COMMON SHARE | (16.79 | )% | |||||
See accompanying notes to financial statements.
20
COHEN & STEERS REIT AND UTILITY INCOME FUND, INC.
STATEMENT OF OPERATIONS
For the Six Months Ended June 30, 2006 (Unaudited)
| Investment Income: | |||||||
| Dividend income (net of $263,929 of foreign withholding tax) | $ | 37,196,587 | |||||
| Interest income | 5,968,467 | ||||||
| Total Income | 43,165,054 | ||||||
| Expenses: | |||||||
| Investment management fees | 8,335,259 | ||||||
| Preferred remarketing fee | 847,466 | ||||||
| Administration fees | 604,550 | ||||||
| Reports to shareholders | 149,938 | ||||||
| Custodian fees and expenses | 107,617 | ||||||
| Professional fees | 105,310 | ||||||
| Directors' fees and expenses | 23,620 | ||||||
| Transfer agent fees and expenses | 13,466 | ||||||
| Miscellaneous | 86,440 | ||||||
| Total Expenses | 10,273,666 | ||||||
| Reduction of Expenses | (1,961,237 | ) | |||||
| Net Expenses | 8,312,429 | ||||||
| Net Investment Income | 34,852,625 | ||||||
| Net Realized and Unrealized Gain (Loss) on Investments: | |||||||
| Net realized gain on investments | 46,550,530 | ||||||
| Net realized loss on foreign currency transactions | (53,342 | ) | |||||
| Net realized gain on interest rate swap transactions | 2,394,330 | ||||||
| Net change in unrealized appreciation on investments | 33,055,700 | ||||||
| Net change in unrealized appreciation on interest rate swap transactions | 4,578,353 | ||||||
| Net change in unrealized appreciation on currency translations | 1,972 | ||||||
| Net realized and unrealized gain on investments | 86,527,543 | ||||||
| Net Increase Resulting from Operations | 121,380,168 | ||||||
| Less Dividends to Preferred Shareholders from Net Investment Income | (15,809,799 | ) | |||||
| Net Increase in Net Assets from Operations Applicable to Common Shares | $ | 105,570,369 | |||||
See accompanying notes to financial statements.
21
COHEN & STEERS REIT AND UTILITY INCOME FUND, INC.
STATEMENT OF CHANGES IN NET ASSETS APPLICABLE TO COMMON SHARES (Unaudited)
| For the Six Months Ended June 30, 2006 | For the Year Ended December 31, 2005 | ||||||||||
| Change in Net Assets Applicable to Common Shares: | |||||||||||
| From Operations: | |||||||||||
| Net investment income | $ | 34,852,625 | $ | 69,071,251 | |||||||
| Net realized gain | 48,891,518 | 33,260,783 | |||||||||
| Net change in unrealized appreciation | 37,636,025 | (692,545 | ) | ||||||||
| Net increase resulting from operations | 121,380,168 | 101,639,489 | |||||||||
| Less Dividends and Distributions to Preferred Shareholders from: | |||||||||||
| Net investment income | (15,809,799 | ) | (14,549,300 | ) | |||||||
| Net realized gain on investments | — | (7,138,640 | ) | ||||||||
| Total dividends and distributions to preferred shareholders | (15,809,799 | ) | (21,687,940 | ||||||||
| Net increase in net assets from operations applicable to common shares | 105,570,369 | 79,951,549 | |||||||||
| Less Dividends and Distributions to Common Shareholders from: | |||||||||||
| Net investment income | (41,053,553 | ) | (54,614,227 | ) | |||||||
| Net realized gain on investments | — | (26,854,886 | ) | ||||||||
| Tax return of capital | — | (12,409,612 | ) | ||||||||
| Total dividends and distributions to common shareholders | (41,053,553 | ) | (93,878,725 | ) | |||||||
| Capital Stock Transactions: | |||||||||||
| Preferred and common share offering cost adjustment | — | 282,878 | |||||||||
| Decrease in net assets from underwriting commissions and offering expenses from issuance of preferred shares | (855,487 | ) | (1,134,828 | ) | |||||||
| Net decrease in net assets from capital stock transactions | (855,487 | ) | (851,950 | ) | |||||||
| Total increase (decrease) in net assets applicable to common shares | 63,661,329 | (14,779,126 | ) | ||||||||
| Net Assets Applicable to Common Shares: | |||||||||||
| Beginning of period | 1,251,393,164 | 1,266,172,290 | |||||||||
| End of perioda | $ | 1,315,054,493 | $ | 1,251,393,164 | |||||||
a Includes dividends in excess of net investment income of $23,335,243 and $1,324,516, respectively.
See accompanying notes to financial statements.
22
COHEN & STEERS REIT AND UTILITY INCOME FUND, INC.
FINANCIAL HIGHLIGHTS (Unaudited)
The following table includes selected data for a share outstanding throughout each period and other performance information derived from the financial statements. It should be read in conjunction with the financial statements and notes thereto.
| Per Share Operating Performance: | For the Six Months Ended June 30, 2006 | For the Year Ended December 31, 2005 | For the Period January 30, 2004a through December 31, 2004 | ||||||||||||
| Net asset value per common share, beginning of period | $ | 21.26 | $ | 21.51 | $ | 19.10 | |||||||||
| Income from investment operations: | |||||||||||||||
| Net investment income | 0.59 | 1.17 | b | 0.90 | |||||||||||
| Net realized and unrealized gain on investments | 1.47 | 0.57 | 2.97 | ||||||||||||
| Total income from investment operations | 2.06 | 1.74 | 3.87 | ||||||||||||
| Less dividends and distributions to preferred shareholders from: | |||||||||||||||
| Net investment income | (0.27 | ) | (0.25 | ) | (0.12 | ) | |||||||||
| Net realized gain on investments | — | (0.12 | ) | (0.01 | ) | ||||||||||
| Total dividends and distributions to preferred shareholders | (0.27 | ) | (0.37 | ) | (0.13 | ) | |||||||||
| Total from investment operations applicable to common shares | 1.79 | 1.37 | 3.74 | ||||||||||||
| Less: Offering costs charged to paid-in capital—common shares | — | — | (0.04 | ) | |||||||||||
| Offering costs charged to paid-in capital—preferred shares | (0.01 | ) | (0.02 | ) | (0.12 | ) | |||||||||
| Dilutive effect of common share offering | — | — | (0.12 | ) | |||||||||||
| Preferred and common share offering cost adjustment | — | 0.00 | c | — | |||||||||||
| Total offering and organization costs | (0.01 | ) | (0.02 | ) | (0.28 | ) | |||||||||
| Less dividends and distributions to common shareholders from: | |||||||||||||||
| Net investment income | (0.70 | ) | (0.93 | ) | (0.79 | ) | |||||||||
| Net realized gain on investments | — | (0.46 | ) | (0.03 | ) | ||||||||||
| Tax return of capital | — | (0.21 | ) | (0.23 | ) | ||||||||||
| Total dividends and distributions to common shareholders | (0.70 | ) | (1.60 | ) | (1.05 | ) | |||||||||
| Net increase (decrease) in net asset value | 1.08 | (0.25 | ) | 2.41 | |||||||||||
| Net asset value, per common share, end of period | $ | 22.34 | $ | 21.26 | $ | 21.51 | |||||||||
| Market value, per common share, end of period | $ | 18.59 | $ | 17.66 | $ | 18.76 | |||||||||
| Net asset value total returnd | 9.05 | %e | 7.65 | % | 19.46 | %e | |||||||||
| Market value returnd | 9.24 | %e | 2.53 | % | (0.50 | )%e | |||||||||
See accompanying notes to financial statements.
23
COHEN & STEERS REIT AND UTILITY INCOME FUND, INC.
FINANCIAL HIGHLIGHTS (Unaudited)—(Continued)
| Ratios/Supplemental Data: | For the Six Months Ended June 30, 2006 | For the Year Ended December 31, 2005 | For the Period January 30, 2004a through December 31, 2004 | ||||||||||||
| Net assets applicable to common shares, end of period (in millions) | $ | 1,315.1 | $ | 1,251.4 | $ | 1,266.2 | |||||||||
| Ratio of expenses to average daily net assets applicable to common shares (before expense reduction)g | 1.60 | %f | 1.57 | % | 1.49 | %f | |||||||||
| Ratio of expenses to average daily net assets applicable to common shares (net of expense reduction)g | 1.30 | %f | 1.27 | % | 1.21 | %f | |||||||||
| Ratio of net investment income to average daily net assets applicable to common shares (before expense reduction)g | 5.13 | %f | 5.15 | % | 5.40 | %f | |||||||||
| Ratio of net investment income to average daily net assets applicable to common shares (net of expense reduction)g | 5.43 | %f | 5.45 | % | 5.68 | %f | |||||||||
| Ratio of expenses to average daily managed assets (before expense reduction)g,h | 1.05 | %f | 1.04 | % | 1.04 | %f | |||||||||
| Ratio of expenses to average daily managed assets (net of expense reduction)g,h | 0.85 | %f | 0.84 | % | 0.84 | %f | |||||||||
| Portfolio turnover rate | 12 | %e | 20 | % | 18 | %e | |||||||||
| Preferred Shares: | |||||||||||||||
| Liquidation value, end of period (in 000's) | $ | 700,000 | $ | 645,000 | $ | 570,000 | |||||||||
| Total shares outstanding (in 000's) | 28 | 26 | 23 | ||||||||||||
| Asset coverage per share | $ | 71,966 | $ | 73,504 | $ | 80,534 | |||||||||
| Liquidation preference per share | $ | 25,000 | $ | 25,000 | $ | 25,000 | |||||||||
| Average market value per sharei | $ | 25,000 | $ | 25,000 | $ | 25,000 | |||||||||
a Commencement of operations.
b Calculation based on average shares outstanding.
c Less than $0.005 per share.
d Total market value return is computed based upon the New York Stock Exchange market price of the fund's shares and excludes the effects of brokerage commissions. Dividends and distributions, if any, are assumed for purposes of this calculation, to be reinvested at prices obtained under the fund's dividend reinvestment plan. Total net asset value return measures the changes in value over the period indicated, taking into account dividends as reinvested.
e Not annualized.
f Annualized.
g Ratios do not reflect the effect of dividend payments to preferred shareholders.
h Average daily managed assets represents net assets applicable to common shares plus liquidation preference of preferred shares.
i Based on weekly prices.
See accompanying notes to financial statements.
24
COHEN & STEERS REIT AND UTILITY INCOME FUND, INC.
NOTES TO FINANCIAL STATEMENTS (Unaudited)
Note 1. Significant Accounting Policies
Cohen & Steers REIT and Utility Income Fund, Inc. (the fund) was incorporated under the laws of the State of Maryland on October 1, 2003 and is registered under the Investment Company Act of 1940, as amended, as a nondiversified, closed-end management investment company. The fund's investment objective is high current income.
The following is a summary of significant accounting policies consistently followed by the fund in the preparation of its financial statements. The policies are in conformity with accounting principles generally accepted in the United States of America (GAAP). The preparation of the financial statements in accordance with GAAP requires management to make estimates and assumptions that affect the reported amounts of assets and liabilities at the date of the financial statements and the reported amounts of income and expenses during the reporting period. Actual results could differ from those estimates.
Portfolio Valuation: Investments in securities that are listed on the New York Stock Exchange are valued, except as indicated below, at the last sale price reflected at the close of the New York Stock Exchange on the business day as of which such value is being determined. If there has been no sale on such day, the securities are valued at the mean of the closing bid and asked prices for the day or, if no asked price is available, at the bid price.
Securities not listed on the New York Stock Exchange but listed on other domestic or foreign securities exchanges or admitted to trading on the National Association of Securities Dealers Automated Quotations, Inc. (Nasdaq) national market system are valued in a similar manner. Securities traded on more than one securities exchange are valued at the last sale price on the business day as of which such value is being determined as reflected on the tape at the close of the exchange representing the principal market for such securities.
Readily marketable securities traded in the over-the-counter market, including listed securities whose primary market is believed by Cohen & Steers Capital Management, Inc. to be over-the-counter, but excluding securities admitted to trading on the Nasdaq National List, are valued at the official closing prices as reported by Nasdaq, the National Quotation Bureau, or such other comparable sources as the Board of Directors deem appropriate to reflect their fair market value. If there has been no sale on such day, the securities are valued at the mean of the closing bid and asked prices for the day, or if no asked price is available, at the bid price. However, certain fixed-income securities may be valued on the basis of prices provided by a pricing service when such prices are believed by the Board of Directors to reflect the fair market value of such securities. Where securities are traded on more than one exchange and also over-the-coun ter, the securities will generally be valued using the quotations the Board of Directors believes most closely reflect the value of such securities.
Securities for which market prices are unavailable, or securities for which the investment manager determines that bid and/or asked price does not reflect market value, will be valued at fair value pursuant to procedures approved by the fund's Board of Directors. Circumstances in which market prices may be unavailable include, but are not limited to, when trading in a security is suspended, the exchange on which the security is traded is subject to an unscheduled close or disruption or material events occur after the close of the exchange on which the security
25
COHEN & STEERS REIT AND UTILITY INCOME FUND, INC.
NOTES TO FINANCIAL STATEMENTS (Unaudited)—(Continued)
is principally traded. In these circumstances, the fund determines fair value in a manner that fairly reflects the market value of the security on the valuation date based on consideration of any information or factors it deems appropriate. These may include recent transactions in comparable securities, information relating to the specific security and developments in the markets.
The fund's use of fair value pricing may cause the net asset value of fund shares to differ from the net asset value that would be calculated using market quotations. Fair value pricing involves subjective judgments and it is possible that the fair value determined for a security may be materially different than the value that could be realized upon the sale of that security.
Short-term debt securities, which have a maturity date of 60 days or less, are valued at amortized cost, which approximates value.
Security Transactions and Investment Income: Security transactions are recorded on trade date. Realized gains and losses on investments sold are recorded on the basis of identified cost. Interest income is recorded on the accrual basis. Discounts are accreted and premiums are amortized over the life of the respective securities. Dividend income is recorded on the ex-dividend date. The fund records distributions received in excess of income from underlying investments as a reduction of cost of investments and/or realized gain. Such amounts are based on estimates if actual amounts are not available, and actual amounts of income, realized gain and return of capital may differ from the estimated amounts. The fund adjusts the estimated amounts of the components of distributions (and consequently its net investment income) as an increase to unrealized appreciation/(depr eciation) and realized gain/(loss) on investments as necessary once the issuers provide information about the actual composition of the distributions.
Foreign Currency Translation and Forward Foreign Currency Contracts: The books and records of the fund are maintained in U.S. dollars as follows: (1) the foreign currency market value of investment securities, other assets and liabilities and forward foreign currency contracts (forward contracts) are translated at the exchange rates prevailing at the end of the period; and (2) purchases, sales, income and expenses are translated at the exchange rates prevailing on the respective dates of such transactions. The resultant exchange gains and losses are recorded as realized and unrealized gain/loss on foreign exchange transactions. Pursuant to U.S. federal income tax regulations, certain foreign exchange gains/losses included in realized and unrealized gain/loss are included in or are a reduction of ordinary income for federal income tax purposes. The fund does not is olate that portion of the results of operations arising as a result of changes in the foreign exchange rates from the changes in the market prices of the securities. Forward contracts are valued daily at the appropriate exchange rates. The resultant unrealized exchange gains and losses are recorded as unrealized foreign currency gain or loss. The fund records realized gains or losses on delivery of the currency or at the time the forward contract is extinguished (compensated) by entering into a closing transaction prior to delivery.
Foreign Securities: The fund may directly purchase securities of foreign issuers. Investing in securities of foreign issuers involves special risks not typically associated with investing in securities of U.S. issuers. The risks
26
COHEN & STEERS REIT AND UTILITY INCOME FUND, INC.
NOTES TO FINANCIAL STATEMENTS (Unaudited)—(Continued)
include possible revaluation of currencies, the ability to repatriate funds, less complete financial information about companies and possible future adverse political and economic developments. Moreover, securities of many foreign issuers and their markets may be less liquid and their prices more volatile than those of securities of comparable U.S. issuers.
Interest Rate Swaps: The fund uses interest rate swaps in connection with the sale of preferred shares. The interest rate swaps are intended to reduce the risk that an increase in short-term interest rates could have on the performance of the fund's common shares as a result of the floating rate structure of the preferred shares. In these interest rate swaps, the fund agrees to pay the other party to the interest rate swap (which is known as the counterparty) a fixed rate payment in exchange for the counterparty agreeing to pay the fund a variable rate payment that is intended to approximate the fund's variable rate payment obligation on the preferred shares. The payment obligation is based on the notional amount of the swap. Depending on the state of interest rates in general, the use of interest rate swaps could enhance or harm the overall performance of the com mon shares. The market value of interest rate swaps is based on pricing models that consider the time value of money, volatility, the current market and contractual prices of the underlying financial instrument. Unrealized gains are reported as an asset and unrealized losses are reported as a liability on the Statement of Assets and Liabilities. The change in value of swaps, including the accrual of periodic amounts of interest to be paid or received on swaps, is reported as unrealized gains or losses in the Statement of Operations. A realized gain or loss is recorded upon payment or receipt of a periodic payment or termination of swap agreements. Swap agreements involve, to varying degrees, elements of market and counterparty risk, and exposure to loss in excess of the related amounts reflected in the Statement of Assets and Liabilities.
Dividends and Distributions to Shareholders: Dividends from net investment income and capital gain distributions are determined in accordance with U.S. federal income tax regulations, which may differ from GAAP. Dividends from net investment income are declared and paid monthly. Net realized capital gains, unless offset by any available capital loss carryforward, are distributed to shareholders annually. Dividends and distributions to shareholders are recorded on the ex-dividend date and are automatically reinvested in full and fractional shares of the fund unless the shareholder has elected to have them paid in cash.
Distributions paid by the fund are subject to recharacterization for tax purposes. Based upon the results of operations for the six months ended June 30, 2006, the advisor considers it likely that a portion of the dividends will be reclassified to return of capital and distributions of net realized capital gains upon the final determination of the fund's taxable income for the year. Net realized capital gains, unless offset by any available capital loss carryforward, are distributed to shareholders annually.
Series M7, Series T7, Series W7, Series TH7 and Series F7 preferred shares pay dividends based on a variable interest rate set at auctions, normally held every seven days. Dividends and distributions are declared and recorded for the subsequent seven day period on the auction date. In most instances, dividends are payable every seven days, on the first business day following the end of the dividend period.
27
COHEN & STEERS REIT AND UTILITY INCOME FUND, INC.
NOTES TO FINANCIAL STATEMENTS (Unaudited)—(Continued)
Series M28, Series T28, Series W28 and Series F28 preferred shares pay dividends based on a variable interest rate set at auctions, normally held every 28 days. The dividends are declared and recorded for the subsequent 28 day period on the auction date. In most instances, dividends are payable every 28 days, on the first business day following the end of the dividend period.
Federal Income Taxes: It is the policy of the fund to continue to qualify as a regulated investment company, if such qualification is in the best interest of the shareholders, by complying with the requirements of Subchapter M of the Internal Revenue Code applicable to regulated investment companies, and by distributing substantially all of its taxable earnings to its shareholders. Accordingly, no provision for federal income or excise tax is necessary.
Note 2. Investment Management Fees, Administration Fees and Other Transactions with Affiliates
Investment Management Fees: Cohen & Steers Capital Management, Inc. (the investment manager) serves as the fund's investment manager pursuant to an investment management agreement (the management agreement). Under the terms of the management agreement, the investment manager provides the fund with day-to-day investment decisions and generally manages the fund's investments in accordance with the stated polices of the fund, subject to the supervision of the Board of Directors
For the services under the management agreement, the fund pays the investment manager a management fee, accrued daily and paid monthly, at an annual rate of 0.85% of the fund's average daily managed asset value. Managed asset value is the net asset value of the common shares plus the liquidation preference of the preferred shares.
The investment manager has contractually agreed to waive its investment management fee in the amount of 0.20% of average daily managed asset value for the first five years of the fund's operations, 0.15% of average daily managed asset value in year six, 0.10% of average daily managed asset value in year seven and 0.05% of average daily managed asset value in year eight. During the six months ended June 30, 2006, the investment manager waived its fee at the annual rate of 0.20%.
Administration Fees: The fund has entered into an administration agreement with the investment manager under which the investment manager performs certain administrative functions for the fund and receives a fee, accrued daily and paid monthly, at the annual rate of 0.06% of the fund's average daily managed assets up to $1 billion, 0.04% of the fund's average daily managed assets in excess of $1 billion up to $1.5 billion and 0.02% of the fund's average daily managed assets in excess of $1.5 billion. For the six months ended June 30, 2006, the fund paid the investment manager $444,069 in fees under this administration agreement. Additionally, the fund has retained State Street Bank and Trust Company as sub-administrator under a fund accounting and administration agreement.
Directors' and Officers' Fees: Certain directors and officers of the fund are also directors, officers, and/or employees of the investment manager. The fund does not pay compensation to any affiliated directors and officers except for the Chief Compliance Officer, who received $6,232 from the fund for the six months ended June 30, 2006.
28
COHEN & STEERS REIT AND UTILITY INCOME FUND, INC.
NOTES TO FINANCIAL STATEMENTS (Unaudited)—(Continued)
Note 3. Purchases and Sales of Securities
Purchases and sales of securities, excluding short-term investments, for the six months ended June 30, 2006, totaled $311,365,194 and $234,790,898, respectively.
Note 4. Income Tax Information
As of June 30, 2006, the federal tax cost and net unrealized appreciation of investments were as follows:
| Cost for federal income tax purposes | $ | 1,809,426,560 | |||||
| Gross unrealized appreciation | $ | 212,386,977 | |||||
| Gross unrealized depreciation | (28,772,122 | ) | |||||
| Net unrealized appreciation | $ | 183,614,855 | |||||
Note 5. Capital Stock
The fund is authorized to issue 100 million shares of common stock at a par value of $0.001 per share.
During the six months ended June 30, 2006 and the year ended December 31, 2005, the fund issued no shares of common stock for the reinvestment of dividends.
The fund's articles of incorporation authorize the issuance of fund preferred shares, par value $0.001 per share, in one or more classes or series, with rights as determined by the Board of Directors, by action of the Board of Directors without the approval of the common shareholders.
On February 22, 2006 the fund issued 2,200 auction market preferred shares, Series M28 (par value $0.001). Proceeds paid to the fund amounted to $54,144,513 after deduction of underwriting commissions and offering expenses of $855,487. This issue has received a "AAA/Aaa" rating from Standard & Poor's and Moody's.
On January 18, 2005, the fund issued 3,000 auction market preferred shares, Series W28 (par value $0.001). Proceeds paid to the fund amounted to $73,865,172 after deduction of underwriting commissions and offering expenses of $1,134,828. This issue has received a "AAA/Aaa" rating from Standard & Poor's and Moody's.
During the year ended December 31, 2005, a $75,134 adjustment was credited to common stock for preferred offering costs and a $207,743 adjustment was credited to common stock for common offering costs.
Preferred shares are senior to the fund's common shares and will rank on a parity with shares of any other series of preferred shares, and with shares of any other series of preferred stock of the fund, as to the payment of dividends and the distribution of assets upon liquidation. If the fund does not timely cure a failure to (1) maintain a discounted value of its portfolio equal to the preferred shares basic maintenance amount, (2) maintain the 1940 Act preferred shares asset coverage, or (3) file a required certificate related to asset coverage on time, the preferred
29
COHEN & STEERS REIT AND UTILITY INCOME FUND, INC.
NOTES TO FINANCIAL STATEMENTS (Unaudited)—(Continued)
shares will be subject to a mandatory redemption at the redemption price of $25,000 per share plus an amount equal to accumulated but unpaid dividends thereon to the date fixed for redemption. To the extent permitted under the 1940 Act and Maryland Law, the fund at its option may without consent of the holders of preferred shares, redeem preferred shares having a dividend period of one year or less, in whole, or in part, on the business day after the last day of such dividend period upon not less than 15 calendar days and not more than 40 calendar days prior to notice. The optional redemption price is $25,000 per share plus an amount equal to accumulated but unpaid dividends thereon to the date fixed for redemption.
The fund's common shares and preferred shares have equal voting rights of one vote per share and vote together as a single class, except in certain circumstances regarding the election of directors. In addition, the affirmative vote of the holders of a majority, as defined in the 1940 Act, of the outstanding preferred shares shall be required to (1) approve any plan of reorganization that would adversely affect the preferred shares and (2) approve any matter that materially and adversely affects the rights, preferences, or powers of that series.
Note 6. Investments in Interest Rate Swaps
Interest rate swaps outstanding at June 30, 2006 are as follows:
| Counterparty | Notional Amount | Fixed Rate Payable | Floating Ratea (reset monthly) Receivable | Termination Date | Unrealized Appreciation | ||||||||||||||||||
| Merrill Lynch Derivative Products AG | $ | 46,000,000 | 3.228 | % | 5.350 | % | March 29, 2008 | $ | 1,761,198 | ||||||||||||||
| Merrill Lynch Derivative Products AG | $ | 34,000,000 | 3.535 | % | 5.302 | % | April 23, 2008 | 1,170,344 | |||||||||||||||
| Merrill Lynch Derivative Products AG | $ | 46,000,000 | 3.415 | % | 5.350 | % | March 29, 2009 | 2,446,806 | |||||||||||||||
| Merrill Lynch Derivative Products AG | $ | 46,000,000 | 3.461 | % | 5.350 | % | March 29, 2010 | 3,189,852 | |||||||||||||||
| Royal Bank of Canada. | $ | 68,000,000 | 2.990 | % | 5.323 | % | March 26, 2009 | 4,354,639 | |||||||||||||||
| UBS AG. | $ | 30,000,000 | 3.220 | % | 5.130 | % | May 7, 2007 | 616,310 | |||||||||||||||
| UBS AG. | $ | 34,000,000 | 3.440 | % | 5.252 | % | April 19, 2008 | 1,232,770 | |||||||||||||||
| UBS AG. | $ | 34,000,000 | 4.060 | % | 5.252 | % | April 19, 2010 | 1,701,274 | |||||||||||||||
| UBS AG | $ | 34,000,000 | 4.173 | % | 5.341 | % | April 28, 2010 | 1,569,635 | |||||||||||||||
| $ | 18,042,828 | ||||||||||||||||||||||
a Based on LIBOR (London Interbank Offered Rate). Represents rates in effect at June 30, 2006.
Note 7. Other
In the normal course of business, the fund enters into contracts that provide general indemnifications. The fund's maximum exposure under these arrangements is dependent on claims that may be made against the fund in the future and, therefore, cannot be estimated; however, based on experience, the risk of material loss from such claims is considered remote.
30
COHEN & STEERS REIT AND UTILITY INCOME FUND, INC.
NOTES TO FINANCIAL STATEMENTS (Unaudited)—(Continued)
In July 2006, the Financial Accounting Standards Board (FASB) issued Interpretation 48, Accounting for Uncertainty in Income Taxes—an interpretation of FASB Statement 109 (FIN 48). FIN 48 clarifies the accounting for income taxes by prescribing the minimum recognition threshold a tax position must meet before being recognized in the financial statements. FIN 48 is effective for fiscal years beginning after December 15, 2006. The fund will adopt FIN 48 during 2007 and the impact to the fund's financial statements, if any, is currently being assessed.
31
COHEN & STEERS REIT AND UTILITY INCOME FUND, INC.
PROXY RESULTS (Unaudited)
During the six months ended June 30, 2006, Cohen & Steers REIT and Utility Income Fund, Inc. shareholders voted on the following proposals at the annual meeting held on April 27, 2006. The description of each proposal and number of shares voted are as follows:
Common Shares
| Shares Voted For | Authority Withheld | ||||||||||
| To elect Directors | |||||||||||
| George Grossman | 53,698,277 | 881,206 | |||||||||
| Robert H. Steers | 53,716,694 | 862,789 | |||||||||
| C. Edward Ward, Jr. | 53,703,728 | 875,755 | |||||||||
Preferred Shares
| Shares Voted For | Authority Withheld | ||||||||||
| To elect Directors | |||||||||||
| George Grossman | 18,640 | 143 | |||||||||
| Robert H. Steers | 18,640 | 143 | |||||||||
| C. Edward Ward, Jr. | 18,640 | 143 | |||||||||
32
COHEN & STEERS REIT AND UTILITY INCOME FUND, INC.
AVERAGE ANNUAL TOTAL RETURNS
(periods ended June 30, 2006) (Unaudited)
| Based on Net Asset Value | Based on Market Value | ||||||||||||||
| One Year | Since Inception (1/30/04) | One Year | Since Inception (1/30/04) | ||||||||||||
| 7.69 | % | 15.00 | % | 4.87 | % | 4.58 | % | ||||||||
The performance data quoted represent past performance. Past performance is no guarantee of future results. The investment return will vary and the principal value of an investment will fluctuate and shares, if sold, may be worth more or less than their original cost. Current performance may be lower or higher than the performance data quoted. Performance results reflect the effect of leverage resulting from the issuance of preferred shares.
REINVESTMENT PLAN
We urge shareholders who want to take advantage of this plan and whose shares are held in 'Street Name' to consult your broker as soon as possible to determine if you must change registration into your own name to participate.
OTHER INFORMATION
Notice is hereby given in accordance with Section 23(c) of the Investment Company Act of 1940 that the fund may purchase, from time to time, shares of its common stock in the open market.
A description of the policies and procedures that the fund uses to determine how to vote proxies relating to portfolio securities is available (i) without charge, upon request, by calling 800-330-7348, (ii) on our Web site at cohenandsteers.com or (iii) on the Securities and Exchange Commission's Web site at http://www.sec.gov. In addition, the fund's proxy voting record for the most recent 12-month period ended June 30 is available (i) without charge, upon request, by calling 800-330-7348 or (ii) on the SEC's Web site at http://www.sec.gov.
The fund files its complete schedule of portfolio holdings with the SEC for the first and third quarters of each fiscal year on Form N-Q. The fund's Forms N-Q are available (i) without charge, upon request by calling 800-330-7348, or (ii) on the SEC's Web site at http://www.sec.gov. In addition, the Forms N-Q may be reviewed and copied at the SEC's Public Reference Room in Washington, DC. Information on the operation of the Public Reference Room may be obtained by calling 800-SEC-0330.
Thomas N. Bohjalian has been appointed as a portfolio manager of the fund. He joined the investment manager in 2002 and is currently a senior vice president. Prior to joining the investment manager, Mr. Bohjalian was a vice president and REIT analyst for five years at AEW Capital Management.
Please note that the distributions paid by the fund to shareholders are subject to recharacterization for tax purposes.
33
COHEN & STEERS REIT AND UTILITY INCOME FUND, INC.
The fund may also pay distributions in excess of the fund's net investment company taxable income and this excess would be a tax-free return of capital distributed from the fund's assets. To the extent this occurs, the fund's shareholders of record will be notified of the estimated amount of capital returned to shareholders for each such distribution and this information will also be available at cohenandsteers.com. The final tax treatment of all distributions is reported to shareholders on their 1099-DIV forms, which are mailed after the close of each calendar year. Distributions of capital decrease the fund's total assets and, therefore, could have the effect of increasing the fund's expense ratio. In addition, in order to make these distributions, the fund may have to sell portfolio securities at a less than opportune time.
34
COHEN & STEERS REIT AND UTILITY INCOME FUND, INC.
Meet the Cohen & Steers family of open-end funds:

• Designed for investors seeking maximum total return, investing primarily in REITs
• Symbol: CSRSX

• Designed for institutional investors seeking maximum total return, investing primarily in REITs
• Symbol: CSRIX

• Designed for investors seeking high current income, investing primarily in REITs
��• Symbols: CSEIX, CSBIX, CSCIX, CSDIX

• Designed for investors seeking maximum capital appreciation, investing in a limited number of REITs and other real estate securities
• Symbols: CSFAX, CSFBX, CSFCX, CSSPX

• Designed for investors seeking maximum total return, investing primarily in international real estate securities
• Symbols: IRFAX, IRFCX, IRFIX

• Designed for investors seeking maximum total return, investing primarily in utilities
• Symbols: CSUAX, CSUBX, CSUCX, CSUIX

• Designed for investors seeking high current income and long-term growth of income and capital appreciation, investing primarily in dividend paying common stocks and preferred stocks.
• Symbols: DVFAX, DVFCX, DVFIX

• Designed for investors seeking maximum total return, investing primarily in real estate securities located in the Asia Pacific region
• Symbols: APFAX, APFCX, APFIX
Please consider the investment objectives, risks, charges and expenses of the fund carefully before investing. A prospectus containing this and other information can be obtained by calling 800-330-7348 or by visiting cohenandsteers.com. Please read the prospectus carefully before investing.
Cohen & Steers Securities, LLC, Distributor
35
COHEN & STEERS REIT AND UTILITY INCOME FUND, INC.
OFFICERS AND DIRECTORS
Robert H. Steers
Director and co-chairman
Martin Cohen
Director and co-chairman
Bonnie Cohen
Director
George Grossman
Director
Richard E. Kroon
Director
Richard J. Norman
Director
Frank K. Ross
Director
Willard H. Smith Jr.
Director
C. Edward Ward, Jr.
Director
Adam M. Derechin
President and chief executive officer
Joseph M. Harvey
Vice president
James S. Corl
Vice president
William F. Scapell
Vice president
Robert S. Becker
Vice president
Thomas N. Bohjalian
Vice president
Lawrence B. Stoller
Secretary
Jay J. Chen
Treasurer and chief financial officer
Lisa D. Phelan
Chief compliance officer
John E. McLean
Assistant secretary
KEY INFORMATION
Investment Manager
Cohen & Steers Capital Management, Inc.
280 Park Avenue
New York, NY 10017
(212) 832-3232
Fund Subadministrator and Custodian
State Street Bank and Trust Company
225 Franklin Street
Boston, MA 02110
Transfer Agent—Common Shares
The Bank of New York
101 Barclay Street
New York, NY 10286
(800) 432-8224
Transfer Agent—Preferred Shares
The Bank of New York
100 Church Street
New York, NY 10007
Legal Counsel
Stroock & Stroock & Lavan LLP
180 Maiden Lane
New York, NY 10038
New York Stock Exchange Symbol: RTU
Web site: cohenandsteers.com
This report is for shareholder information. This is not a prospectus intended for use in the purchase or sale of fund shares. Past performance is of course no guarantee of future results and your investment may be worth more or less at the time you sell.
36
COHEN & STEERS
REIT AND UTILITY INCOME FUND
280 PARK AVENUE
NEW YORK, NY 10017

SEMIANNUAL REPORT
JUNE 30, 2006
Item 2. Code of Ethics.
Not applicable.
Item 3. Audit Committee Financial Expert.
Not applicable.
Item 4. Principal Accountant Fees and Services.
Not applicable.
Item 5. Audit Committee of Listed Registrants.
Not applicable.
Item 6. Schedule of Investments.
Included in Item 1 above.
Item 7. Disclosure of Proxy Voting Policies and Procedures for Closed-End Management Investment Companies.
Not applicable.
Item 8. Portfolio Managers of Closed-End Management Investment Companies.
Not applicable.
Item 9. Purchases of Equity Securities by Closed-End Management Investment Company and Affiliated Purchasers.
None.
Item 10. Submission of Matters to a Vote of Security Holders.
None.
Item 11. Controls and Procedures.
(a) The registrant’s principal executive officer and principal financial officer have concluded, based upon their evaluation of the registrant’s disclosure controls and procedures as conducted
within 90 days of the filing date of this report, that these disclosure controls and procedures provide reasonable assurance that material information required to be disclosed by the registrant in the report it files or submits on Form N-CSR is recorded, processed, summarized and reported within the time periods specified in the Securities and Exchange Commission’s rules and forms and that such material information is accumulated and communicated to the registrant’s management, including its principal executive officer and principal financial officer, as appropriate, in order to allow timely decisions regarding required disclosure.
(b) There were no changes in the registrant’s internal control over financial reporting that occurred during the second fiscal quarter of the period covered by this report that have materially affected, or are reasonably likely to materially affect, the registrant’s internal control over financial reporting.
Item 12. Exhibits.
(a)(1) Not applicable.
(a) (2) Certifications of principal executive officer and principal financial officer as required by Rule 30a-2(a) under the Investment Company Act of 1940.
(a)(3) Not applicable.
(b) Certifications of principal exe cutive officer and principal financial officer as required by Rule 30a- 2(b) under the Investment Company Act of 1940.
SIGNATURES
Pursuant to the requirements of the Securities Exchange Act of 1934 and the Investment Company Act of 1940, the registrant has duly caused this report to be signed on its behalf by the undersigned, thereunto duly authorized.
COHEN & STEERS REIT AND UTILITY INCOME FUND, INC.
|
|
|
|
| By: | /s/ Adam M. Derechin |
|
|
| Name: Adam M. Derechin | |
|
| Title: President and Chief Executive Officer | |
|
|
| |
| Date: August 28, 2006 | ||
Pursuant to the requirements of the Securities Exchange Act of 1934 and the Investment Company Act of 1940, this report has been signed below by the following persons on behalf of the registrant and in the capacities and on the dates indicated.
|
|
|
| |
| By: | /s/ Adam M. Derechin |
| |
|
| Name: | Adam M. Derechin | |
|
| Title: | President and Chief Executive Officer | |
|
|
|
| |
| By: | /s/ Jay J. Chen |
| |
|
| Name: | Jay J. Chen | |
|
| Title: | Treasurer | |
|
|
|
| |
|
|
|
| |
| Date: August 28, 2006 | |||