UNITED STATES
SECURITIES AND EXCHANGE COMMISSION
Washington, D.C. 20549
FORM N-CSR
CERTIFIED SHAREHOLDER REPORT OF REGISTERED
MANAGEMENT INVESTMENT COMPANIES
Investment Company Act file number | 811-21437 | |||||||
| ||||||||
Cohen & Steers REIT and Utility Income Fund, Inc. | ||||||||
(Exact name of registrant as specified in charter) | ||||||||
| ||||||||
280 Park Avenue, New York, NY |
| 10017 | ||||||
(Address of principal executive offices) |
| (Zip code) | ||||||
| ||||||||
Adam M. Derechin | ||||||||
(Name and address of agent for service) | ||||||||
| ||||||||
Registrant’s telephone number, including area code: | (212) 832-3232 |
| ||||||
| ||||||||
Date of fiscal year end: | December 31 |
| ||||||
| ||||||||
Date of reporting period: | June 30, 2007 |
| ||||||
Item 1. Reports to Stockholders.
COHEN & STEERS REIT AND UTILITY INCOME FUND, INC.
August 9, 2007
To Our Shareholders:
We are pleased to submit to you our report for the six months ended June 30, 2007. The net asset value at that date was $24.41 per common share. The fund's common stock is traded on the New York Stock Exchange and its share price can differ from its net asset value; at period end, the fund's closing price on the NYSE was $21.30. The total return, including income, for Cohen & Steers REIT and Utility Income Fund and the comparative benchmarks were:
| Six Months Ended June 30, 2007 | |||||||
| Cohen & Steers REIT and Utility Income Fund at Market Valuea | –1.69 | % | |||||
| Cohen & Steers REIT and Utility Income Fund at Net Asset Valuea | –0.16 | % | |||||
| FTSE NAREIT Equity REIT Indexb | –5.89 | % | |||||
| S&P 500 Indexb | 6.96 | % | |||||
| S&P 1500 Utilities Indexb | 7.50 | % | |||||
| Blend—40% NAREIT Equity REIT Index, 40% S&P 1500 Utilities Index, 20% Merrill Lynch Fixed Rate Preferred Indexb | 0.72 | % | |||||
The performance data quoted represent past performance. Past performance is no guarantee of future results. The investment return and the principal value of an investment will fluctuate and shares, if sold, may be worth more or less than their original cost. Current performance may be lower or higher than the performance data quoted. Performance results reflect the effects of leverage, resulting from the issuance of preferred shares.
Three monthly dividends of $0.1375 per common share were declared and will be paid to common shareholders on July 31, 2007, August 31, 2007 and September 28, 2007.c
a As a closed-end investment company, the price of the fund's New York Stock Exchange-traded shares will be set by market forces and at times may deviate from the net asset value per share of the fund.
b The FTSE NAREIT Equity REIT Index is an unmanaged, market capitalization weighted index of all publicly traded REITs that invest predominantly in the equity ownership of real estate. The index is designed to reflect the performance of all publicly traded equity REITs as a whole. The S&P 500 Index is an unmanaged index of common stocks that is frequently used as a general measure of stock market performance. The S&P 1500 Utilities Index is an unmanaged market capitalization weighted index of 78 companies whose primary business involves the generation, transmission and/or distribution of electricity and/or natural gas. The Merrill Lynch Fixed Rate Preferred Index is an unmanaged index of preferred securities.
c Please note that distributions paid by the fund to shareholders are subject to recharacterization for tax purposes. The final tax treatment of these distributions is reported to shareholders after the close of each fiscal year on form 1099-DIV.
1
COHEN & STEERS REIT AND UTILITY INCOME FUND, INC.
Investment Review
REITs fall back after strong start
Following four years of strong absolute and relative performance, including a 35% total return in 2006 (as measured by the FTSE NAREIT Equity REIT Index), and seven years of positive returns, REITs had generally negative returns in the first half of 2007. REITs began the year on a positive note, buoyed by a January bidding contest between Vornado and The Blackstone Group for control of Equity Office Properties (EOP). Blackstone prevailed, purchasing EOP at a sizable premium, prompting investors at that time to raise valuation estimates for publicly traded real estate securities.
REITs struggled over the remainder of the period, however, declining nearly 20% from their February highs. This reflected concerns over rising interest rates and uncertainty about whether asset pricing would suffer. Expectations for Federal Reserve monetary easing were pushed back as economic growth continued and inflation fears persisted. The possibility that the Fed might raise rates entered the picture, and the yield on the 10-year Treasury bond in June climbed to 5.26%, its highest level in five years; the yield retreated to 5.03% by period end.
Among other noteworthy merger and acquisition news, Archstone-Smith, a leading apartment REIT, agreed to be acquired by a partnership sponsored by Tishman Speyer and Lehman Brothers for $22.2 billion. This represented a 22.7% premium to the stock price before a rumor of the deal was published on May 24, 2007.
Utilities benefit from healthy fundamentals
Utilities performed well in the first half of 2007, despite a late-period decline amid rising bond yields. Utility stocks generally continued to benefit from a confluence of positive factors: economic and market uncertainty, which led investors to favor the group for its relatively high dividends and perceived defensive nature; strong fundamentals for long-term energy prices, with steady demand and limited supply growth; upward revisions in valuations for power generation assets; and earnings growth projections that remained well above utilities' historical average.
We believe that utilities are also increasingly benefiting from recognition of the growth potential of the competitive wholesale power market. This was highlighted in February, when a KKR-led consortium announced plans to purchase TXU Corp. at a 16% premium to the stock's previous closing day price (while there is some risk the deal may not be completed, we believe this development underscores the attractiveness of power generation). TXU is a Texas-based energy provider with a focus on unregulated power generation and supply. At the time, the $45 billion transaction was the largest announced LBO in history.
Preferred securities hindered by rising yields
The Merrill Lynch Fixed Rate Preferred Index had a total return of 0.1% for the period. After a positive first quarter, preferreds were buffeted by the rise in Treasury yields, along with widening credit spreads, late in the
2
COHEN & STEERS REIT AND UTILITY INCOME FUND, INC.
second quarter. The fund maintained an allocation to preferred securities, in order to enhance potential income and provide some stability. We believe that quality is a primary criterion for investment selection in the preferred market. In general, we find little value in moving down the credit scale at this point in the cycle.
The fund had a negative total return for the period, reflecting the largely offsetting performance trends in the REITs and utilities markets. The fund's holdings in the electric utilities sector hindered its relative performance, while its oil and gas storage and transportation stocks helped its performance. In the REIT portfolio of the fund, stock selection in the shopping center, hotel and regional mall sectors was favorable, while stock selection in the apartment sector detracted from performance. The fund's preferred securities contributed positively to performance in both absolute and relative terms, as security selection was favorable.
Investment Outlook
Before REITs can manage a sustainable performance recovery, investors may require more clarity on inflation and economic growth. In our opinion, if the economy gains momentum, it would likely benefit real estate companies; however, it might cause the Fed to raise interest rates, unsettling stock prices, including REITs. A cooling economy, on the other hand, would likely prompt the Fed to cut rates, which could lift stocks, as a rate reduction is not currently expected by the market.
We believe that a fair degree of pessimism has now been priced into REITs, including the possibility of some decline in property asset values. We believe REITs, on the whole, are attractively valued, with many trading at compelling discounts (more than 20% in some cases) to their underlying net asset values, compared with their long-term average of a 5% premium to NAV. The private equity market continues to value REITs more aggressively than the public market, as evidenced by the continued privatizations of real estate companies.
From a sector perspective we continue to favor apartments, and believe that the Archstone-Smith buyout supports our view that a downward trend in owner-occupied housing prices, coupled with tightening credit standards, are clear positives for the sector. Uncertainty in the housing market should ultimately result in lower overall home ownership rates in the next five years, which in turn should benefit apartment owners. We also favor the self-storage and office sectors based on company-specific factors.
Utilities earnings above historical norms
Our outlook for utility fundamentals is generally favorable. We believe that the group should continue to benefit from improving fundamentals, in part due to rising replacement costs and environmental concerns that are driving resistance to the construction of new power generation facilities. If demand continues to outstrip supply, many utilities with unregulated generation should grow earnings as they re-price below-market contracts at higher levels. We further believe that significant restrictions on carbon dioxide emissions will be introduced over time, which could potentially increase the value of carbon-free energy sources such as unregulated nuclear and wind power. Our holdings include companies that are among the largest owners of such assets.
3
COHEN & STEERS REIT AND UTILITY INCOME FUND, INC.
We also note the emergence of formal, structured capacity markets in several regions of the country. Capacity markets are designed to encourage new power plant construction by compensating plant owners solely for having the physical plant available to produce power. This earnings stream is separate from, and is designed to supplement, the earnings that companies make from selling the actual electricity produced. Successful capacity markets should support the economics of new power plant construction and eventually lead to more plants being built.
There remain risks of course, including potential for volatility during periods of rising interest rates (as occurred in early June) as well as political risks, due to utilities' quasi-regulated nature. But given increasing energy prices, strong potential earnings and stock valuations that are not excessive in historical terms, we believe utilities continue to have potential for attractive total returns. We will continue to invest in companies that we believe have attractive valuations and strong earnings and dividend growth potential.
Yields and diversification
In closing, we believe that fundamentals for both real estate and utilities securities are solid, and have the potential to drive attractive total returns over time. We also note that an allocation to both asset classes in a portfolio, along with an allocation to preferred securities, can offer the potential for both high current income and diversification. Real estate and utilities securities represent two of the higher income-producing sectors of the equity market, yet have relatively low historical correlation with each other, and preferreds can help mitigate overall volatility while also offering attractive income potential.
4
COHEN & STEERS REIT AND UTILITY INCOME FUND, INC.
Sincerely,
 |  | ||||||
| MARTIN COHEN | ROBERT H. STEERS | ||||||
| Co-chairman | Co-chairman | ||||||
 |  | ||||||
| ROBERT S. BECKER | WILLIAM F. SCAPELL | ||||||
| Portfolio Manager | Portfolio Manager | ||||||
 |  | ||||||
| JOSEPH M. HARVEY | JAMES S. CORL | ||||||
| Portfolio Manager | Portfolio Manager | ||||||

THOMAS N. BOHJALIAN
Portfolio Manager
The views and opinions in the preceding commentary are as of the date stated and are subject to change. This material represents an assessment of the market environment at a specific point in time, should not be relied upon as investment advice and is not intended to predict or depict performance of any investment.
Visit Cohen & Steers online at cohenandsteers.com
For more information about any of our funds, visit cohenandsteers.com, where you'll find daily net asset values, fund fact sheets and portfolio highlights. You can also access newsletters, education tools and market updates covering REIT, utility and preferred securities sectors.
In addition, our Web site contains comprehensive information about our firm, including our most recent press releases, profiles of our senior investment professionals, and an overview or our investment approach.
5
COHEN & STEERS REIT AND UTILITY INCOME FUND, INC.
Our Leverage Strategy
(Unaudited)
While we do not attempt to predict what future interest rates will be, it has been our philosophy to utilize interest rate swap transactions to seek to reduce the interest rate risk inherent in our utilization of leverage. Our leverage strategy involves issuing auction market preferred shares (AMPS) to raise additional capital for the fund, with an objective of increasing the net income available for shareholders. As of June 30, 2007, AMPS represented 36% of the fund's managed assets. Considering that AMPS have variable dividend rates, we seek to lock in the rate on a significant portion of this additional capital through interest rate swap agreements (where we effectively convert our variable rate obligation to a fixed rate obligation for the term of the swap agreements). Specifically, we have fixed the rate on 43% of our borrowings at an average interest rate of 3.5% for an average remaining period of 1.8 years (when we first entered into the swaps, the average term was 5.0 years). By locking in a significant portion or our leveraging costs, we have endeavored to adequately protect the dividend-paying ability of the fund. The use of leverage increases the volatility of the fund's net asset value in both up and down markets. However, we believe that locking in a portion of the fund's leveraging costs for the term of the swap agreements partially protects the fund from any impact that an increase in short-term interest rates may have as a result of the use of leverage.
Leverage Factsa
| Leverage (as a % of managed assets) | 36 | % | |||||
| % Fixed Rate | 43 | % | |||||
| % Variable Rate | 57 | % | |||||
| Weighted Average Rate on Swaps | 3.5 | % | |||||
| Weighted Average Term on Swaps | 1.8 years | ||||||
| Current Rate on AMPS | 5.2 | % | |||||
a Data as of June 30, 2007. Information subject to change.
6
COHEN & STEERS REIT AND UTILITY INCOME FUND, INC.
JUNE 30, 2007
Top Ten Holdingsa
(Unaudited)
| Security | Market Value | % of Managed Assets | |||||||||
| Duke Energy Corp. | $ | 76,551,462 | 3.4 | % | |||||||
| Public Service Enterprise Group | 66,756,690 | 3.0 | |||||||||
| Progress Energy | 64,915,601 | 2.9 | |||||||||
| Southern Co. | 59,054,238 | 2.6 | |||||||||
| Exelon Corp. | 56,366,640 | 2.5 | |||||||||
| Nationwide Health Properties | 54,712,800 | 2.5 | |||||||||
| DTE Energy Co. | 54,064,264 | 2.4 | |||||||||
| Consolidated Edison | 53,444,640 | 2.4 | |||||||||
| Spectra Energy Corp. | 52,290,449 | 2.3 | |||||||||
| Entergy Corp. | 49,960,690 | 2.2 | |||||||||
a Top ten holdings are determined on the basis of the market value of individual securities held. The fund may hold positions in other types of securities issued by the companies listed above. See the Schedule of Investments for additional details on such other positions.
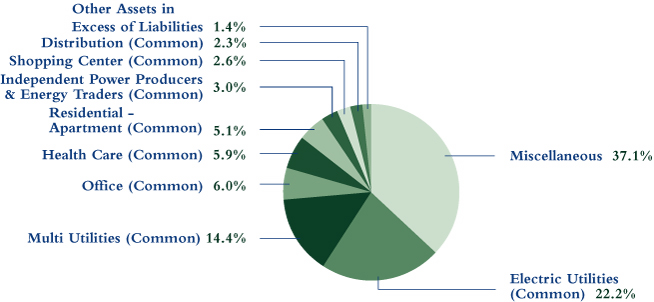
Sector Breakdown
(Based on Managed Assets)
(Unaudited)
7
COHEN & STEERS REIT AND UTILITY INCOME FUND, INC.
SCHEDULE OF INVESTMENTS
June 30, 2007 (Unaudited)
| Number of Shares | Value | ||||||||||||||
| COMMON STOCK | 119.9 | % | |||||||||||||
| ENERGY | 6.9 | % | |||||||||||||
| DISTRIBUTION | 3.7 | % | |||||||||||||
| Spectra Energy Corp. | 2,014,270 | $ | 52,290,449 | ||||||||||||
| INTEGRATED OIL & GAS | 0.3 | % | |||||||||||||
| Targa Resources Partners LP | 147,000 | 4,924,500 | |||||||||||||
| OIL & GAS EQUIPMENT & SERVICES | 0.2 | % | |||||||||||||
| Universal Compression Partners LP | 88,500 | 3,238,215 | |||||||||||||
| OIL & GAS REFINING & MARKETING | 1.6 | % | |||||||||||||
| Spectra Energy Income Fund (Canada) | 647,600 | 6,383,291 | |||||||||||||
| Williams Partners LP | 336,900 | 16,265,532 | |||||||||||||
| 22,648,823 | |||||||||||||||
| OIL & GAS STORAGE & TRANSPORTATION | 1.1 | % | |||||||||||||
| DCP Midstream Partners LP | 142,000 | 6,620,040 | |||||||||||||
| Magellan Midstream Partners LP | 97,900 | 4,560,182 | |||||||||||||
| Teekay LNG Partners LP | 69,300 | 2,500,344 | |||||||||||||
| Teekay Offshore Partners LP | 78,900 | 2,690,490 | |||||||||||||
| 16,371,056 | |||||||||||||||
| TOTAL ENERGY | 99,473,043 | ||||||||||||||
| OIL COMPANY—EXPLORATION & PRODUCTION | 0.1 | % | |||||||||||||
| Duncan Energy Partners LP | 81,000 | 2,126,250 | |||||||||||||
| REAL ESTATE | 44.7 | % | |||||||||||||
| DIVERSIFIED | 3.1 | % | |||||||||||||
| Colonial Properties Trust | 445,600 | 16,242,120 | |||||||||||||
| Entertainment Properties Trust | 161,300 | 8,674,714 | |||||||||||||
| iStar Financial | 433,000 | 19,194,890 | |||||||||||||
| 44,111,724 | |||||||||||||||
See accompanying notes to financial statements.
8
COHEN & STEERS REIT AND UTILITY INCOME FUND, INC.
SCHEDULE OF INVESTMENTS—(Continued)
June 30, 2007 (Unaudited)
| Number of Shares | Value | ||||||||||||||
| HEALTH CARE | 9.1 | % | |||||||||||||
| Health Care Property Investors | 848,100 | $ | 24,535,533 | ||||||||||||
| Health Care REIT | 467,500 | 18,868,300 | |||||||||||||
| Nationwide Health Properties | 2,011,500 | 54,712,800 | |||||||||||||
| Omega Healthcare Investors | 233,600 | 3,697,888 | |||||||||||||
| Senior Housing Properties Trust | 738,882 | 15,036,249 | |||||||||||||
| Ventas | 400,000 | 14,500,000 | |||||||||||||
| 131,350,770 | |||||||||||||||
| HOTEL | 3.1 | % | |||||||||||||
| DiamondRock Hospitality Co. | 940,100 | 17,937,108 | |||||||||||||
| Hospitality Properties Trust | 342,800 | 14,222,772 | |||||||||||||
| Strategic Hotels & Resorts | 547,800 | 12,320,022 | |||||||||||||
| 44,479,902 | |||||||||||||||
| INDUSTRIAL | 2.6 | % | |||||||||||||
| DCT Industrial Trust | 950,825 | 10,230,877 | |||||||||||||
| First Industrial Realty Trust | 230,800 | 8,945,808 | |||||||||||||
| ING Industrial Fund (Australia) | 5,754,435 | 11,415,952 | |||||||||||||
| ProLogis European Properties (Netherlands) | 390,200 | 6,839,100 | |||||||||||||
| 37,431,737 | |||||||||||||||
| MORTGAGE | 2.3 | % | |||||||||||||
| Annaly Capital Management | 301,700 | 4,350,514 | |||||||||||||
| Newcastle Investment Corp. | 1,164,400 | 29,191,508 | |||||||||||||
| 33,542,022 | |||||||||||||||
| OFFICE | 9.4 | % | |||||||||||||
| BioMed Realty Trust | 210,453 | 5,286,579 | |||||||||||||
| Brandywine Realty Trust | 763,937 | 21,833,320 | |||||||||||||
| Highwoods Properties | 382,200 | 14,332,500 | |||||||||||||
| HRPT Properties Trust | 1,691,800 | 17,594,720 | |||||||||||||
| ING Office Fund (Australia) | 5,190,800 | 7,701,334 | |||||||||||||
| Liberty Property Trust | 738,600 | 32,446,698 | |||||||||||||
| Mack-Cali Realty Corp. | 607,800 | 26,433,222 | |||||||||||||
| Mapeley Ltd. (United Kingdom) | 56,159 | 3,164,408 | |||||||||||||
See accompanying notes to financial statements.
9
COHEN & STEERS REIT AND UTILITY INCOME FUND, INC.
SCHEDULE OF INVESTMENTS—(Continued)
June 30, 2007 (Unaudited)
| Number of Shares | Value | ||||||||||||||
| Parkway Properties | 126,200 | $ | 6,061,386 | ||||||||||||
| 134,854,167 | |||||||||||||||
| OFFICE/INDUSTRIAL | 0.7 | % | |||||||||||||
| EastGroup Properties | 114,000 | 4,995,480 | |||||||||||||
| First Potomac Realty Trust | 226,271 | 5,269,851 | |||||||||||||
| 10,265,331 | |||||||||||||||
| RESIDENTIAL—APARTMENT | 8.0 | % | |||||||||||||
| American Campus Communities | 299,300 | 8,467,197 | |||||||||||||
| Apartment Investment & Management Co.a | 522,900 | 26,364,618 | |||||||||||||
| Education Realty Trust | 487,900 | 6,845,237 | |||||||||||||
| GMH Communities Trust | 469,500 | 4,549,455 | |||||||||||||
| Home Properties | 786,387 | 40,837,077 | |||||||||||||
| Mid-America Apartment Communities | 201,600 | 10,579,968 | |||||||||||||
| UDR | 632,100 | 16,624,230 | |||||||||||||
| 114,267,782 | |||||||||||||||
| SELF STORAGE | 2.3 | % | |||||||||||||
| Extra Space Storage | 628,500 | 10,370,250 | |||||||||||||
| Sovran Self Storage | 218,600 | 10,527,776 | |||||||||||||
| U-Store-It Trust | 717,600 | 11,761,464 | |||||||||||||
| 32,659,490 | |||||||||||||||
| SHOPPING CENTER | 4.1 | % | |||||||||||||
| COMMUNITY CENTER | 2.1 | % | |||||||||||||
| Cedar Shopping Centers | 627,200 | 9,000,320 | |||||||||||||
| Inland Real Estate Corp. | 753,500 | 12,794,430 | |||||||||||||
| Urstadt Biddle Properties—Class A | 517,500 | 8,802,675 | |||||||||||||
| 30,597,425 | |||||||||||||||
| FREE STANDING | 1.4 | % | |||||||||||||
| National Retail Properties | 934,200 | 20,421,612 | |||||||||||||
| REGIONAL MALL | 0.6 | % | |||||||||||||
| Glimcher Realty Trust | 305,500 | 7,637,500 | |||||||||||||
| TOTAL SHOPPING CENTER | 58,656,537 | ||||||||||||||
| TOTAL REAL ESTATE | 641,619,462 | ||||||||||||||
See accompanying notes to financial statements.
10
COHEN & STEERS REIT AND UTILITY INCOME FUND, INC.
SCHEDULE OF INVESTMENTS—(Continued)
June 30, 2007 (Unaudited)
| Number of Shares | Value | ||||||||||||||
| TELECOMMUNICATION SERVICES— INTEGRATED TELECOMMUNICATIONS SERVICES | 3.3 | % | |||||||||||||
| AT&T | 246,000 | $ | 10,209,000 | ||||||||||||
| Citizens Communications Co. | 310,100 | 4,735,227 | |||||||||||||
| Fairpoint Communications | 986,000 | 17,501,500 | |||||||||||||
| Verizon Communications | 243,118 | 10,009,168 | |||||||||||||
| Windstream Corp. | 300,000 | 4,428,000 | |||||||||||||
| 46,882,895 | |||||||||||||||
| UTILITIES | 64.9 | % | |||||||||||||
| ELECTRIC UTILITIES | 34.5 | % | |||||||||||||
| Cleco Corp. | 243,500 | 5,965,750 | |||||||||||||
| DPL | 112,900 | 3,199,586 | |||||||||||||
| Duke Energy Corp. | 4,183,140 | 76,551,462 | |||||||||||||
| E.ON AG (ADR) (Germany) | 308,096 | 17,142,461 | |||||||||||||
| Edison International | 352,000 | 19,754,240 | |||||||||||||
| Entergy Corp. | 465,400 | 49,960,690 | |||||||||||||
| Exelon Corp. | 776,400 | 56,366,640 | |||||||||||||
| FirstEnergy Corp. | 543,300 | 35,167,809 | |||||||||||||
| FPL Group | 346,497 | 19,660,240 | |||||||||||||
| ITC Holdings Corp. | 195,800 | 7,955,354 | |||||||||||||
| Northeast Utilities | 234,000 | 6,636,240 | |||||||||||||
| Pepco Holdings | �� | 990,800 | 27,940,560 | ||||||||||||
| Pinnacle West Capital Corp. | 397,500 | 15,840,375 | |||||||||||||
| PPL Corp. | 447,000 | 20,915,130 | |||||||||||||
| Progress Energy | 1,423,900 | 64,915,601 | |||||||||||||
| Scottish and Southern Energy PLC (United Kingdom) | 308,328 | 8,971,537 | |||||||||||||
| Southern Co. | 1,722,200 | 59,054,238 | |||||||||||||
| 495,997,913 | |||||||||||||||
| ELECTRIC—INTEGRATED | 2.4 | % | |||||||||||||
| American Electric Power Co. | 100,000 | 4,504,000 | |||||||||||||
| Dynegy Class Ab | 59,500 | 561,680 | |||||||||||||
| Electricite de France (France) | 151,600 | 16,472,083 | |||||||||||||
| Enel S.p.A. (Italy) | 76,700 | 4,118,790 | |||||||||||||
See accompanying notes to financial statements.
11
COHEN & STEERS REIT AND UTILITY INCOME FUND, INC.
SCHEDULE OF INVESTMENTS—(Continued)
June 30, 2007 (Unaudited)
| Number of Shares | Value | ||||||||||||||
| Fortum Oyj (Finland)b | 139,000 | $ | 4,362,722 | ||||||||||||
| Integrys Energy Group | 82,300 | 4,175,079 | |||||||||||||
| 34,194,354 | |||||||||||||||
| INDEPENDENT POWER PRODUCERS & ENERGY TRADERS | 4.7 | % | |||||||||||||
| Constellation Energy Group | 162,000 | 14,121,540 | |||||||||||||
| Mirant Corp.b | 91,000 | 3,881,150 | |||||||||||||
| NRG Energyb | 172,000 | 7,150,040 | |||||||||||||
| TXU Corp. | 620,600 | 41,766,380 | |||||||||||||
| 66,919,110 | |||||||||||||||
| MULTI UTILITIES | 22.4 | % | |||||||||||||
| Ameren Corp. | 872,800 | 42,775,928 | |||||||||||||
| Consolidated Edison | 1,184,500 | 53,444,640 | |||||||||||||
| Dominion Resources | 234,700 | 20,256,957 | |||||||||||||
| DTE Energy Co. | 1,121,200 | 54,064,264 | |||||||||||||
| NSTAR | 311,374 | 10,104,086 | |||||||||||||
| PG&E Corp. | 749,000 | 33,929,700 | |||||||||||||
| Public Service Enterprise Group | 760,500 | 66,756,690 | |||||||||||||
| RWE AG (Germany) | 50,483 | 5,397,085 | |||||||||||||
| TECO Energy | 291,100 | 5,001,098 | |||||||||||||
| United Utilities PLC (United Kingdom) | 92,301 | 1,315,056 | |||||||||||||
| Vectren Corp. | 281,100 | 7,570,023 | |||||||||||||
| Xcel Energy | 1,051,200 | 21,518,064 | |||||||||||||
| 322,133,591 | |||||||||||||||
| PIPELINES | 0.9 | % | |||||||||||||
| Enterprise Products Partners LP | 202,200 | 6,431,982 | |||||||||||||
| Kinder Morgan Energy Partners LP | 123,192 | 6,798,966 | |||||||||||||
| 13,230,948 | |||||||||||||||
| TOTAL UTILITIES | 932,475,916 | ||||||||||||||
| TOTAL COMMON STOCK (Identified cost—$1,409,793,271) | 1,722,577,566 | ||||||||||||||
See accompanying notes to financial statements.
12
COHEN & STEERS REIT AND UTILITY INCOME FUND, INC.
SCHEDULE OF INVESTMENTS—(Continued)
June 30, 2007 (Unaudited)
| Number of Shares | Value | ||||||||||||||
| PREFERRED SECURITIES—$25 PAR VALUE | 17.9 | % | |||||||||||||
| BANK | 2.0 | % | |||||||||||||
| Bank of America Corp., 5.71%, Series E (FRN) | 240,000 | $ | 6,108,000 | ||||||||||||
| Colonial Capital Trust IV, 7.875%, due 10/1/33 | 74,100 | 1,886,586 | |||||||||||||
| Countrywide Capital V, 7.00% | 392,825 | 9,671,352 | |||||||||||||
| Indymac Bank FSB, 8.50%, due 5/29/49, 144Ac | 170,000 | 4,301,000 | |||||||||||||
| KeyCorp Capital IX, 6.75% | 94,500 | 2,329,425 | |||||||||||||
| U.S. Bancorp, 5.92%, Series B (FRN) | 160,000 | 4,184,000 | |||||||||||||
| 28,480,363 | |||||||||||||||
| BANK—FOREIGN | 0.7 | % | |||||||||||||
| Northern Rock PLC, 8.00%, Series A | 45,531 | 1,143,101 | |||||||||||||
| Santander Finance Preferred, 6.50%, 144Ac | 80,000 | 1,911,000 | |||||||||||||
| Santander Finance Preferred, 5.88%, (FRN), 144Ac | 280,000 | 6,545,700 | |||||||||||||
| 9,599,801 | |||||||||||||||
| FINANCE | 0.7 | % | |||||||||||||
| Goldman Sachs Group, 6.027%, Series D (FRN) | 80,000 | 2,066,400 | |||||||||||||
| Merrill Lynch & Co., 5.86%, Series 5 (FRN) | 331,500 | 8,420,100 | |||||||||||||
| 10,486,500 | |||||||||||||||
| INSURANCE | 1.8 | % | |||||||||||||
| LIFE/HEALTH INSURANCE | 0.2 | % | |||||||||||||
| Delphi Financial Group, 7.376%, due 5/15/37 | 139,000 | 3,354,070 | |||||||||||||
| PROPERTY CASUALTY | 0.5 | % | |||||||||||||
| Berkley W R Capital Trust II, 6.75%, due 7/26/45 | 47,100 | 1,174,203 | |||||||||||||
| Markel Corp., 7.50%, due 8/22/46 | 240,000 | 6,218,400 | |||||||||||||
| 7,392,603 | |||||||||||||||
| PROPERTY CASUALTY—FOREIGN | 0.4 | % | |||||||||||||
| ACE Ltd., 7.80%, Series C | 90,000 | 2,294,100 | |||||||||||||
| Arch Capital Group Ltd., 8.00% | 125,000 | 3,187,500 | |||||||||||||
| 5,481,600 | |||||||||||||||
See accompanying notes to financial statements.
13
COHEN & STEERS REIT AND UTILITY INCOME FUND, INC.
SCHEDULE OF INVESTMENTS—(Continued)
June 30, 2007 (Unaudited)
| Number of Shares | Value | ||||||||||||||
| REINSURANCE—FOREIGN | 0.7 | % | |||||||||||||
| Aspen Insurance Holdings Ltd., 7.401%, Series A | 150,000 | $ | 3,735,000 | ||||||||||||
| Everest Re Capital Trust, 7.85%, due 11/15/32 | 232,280 | 5,897,589 | |||||||||||||
| 9,632,589 | |||||||||||||||
| TOTAL INSURANCE | 25,860,862 | ||||||||||||||
| MEDIA—DIVERSIFIED SERVICES | 1.0 | % | |||||||||||||
| Comcast Corp., 7.00%, due 9/15/55 | 390,000 | 9,757,800 | |||||||||||||
| Comcast Corp., 6.625%, due 5/15/56 | 124,837 | 2,982,356 | |||||||||||||
| Liberty Media Corp., 8.75%, due 2/1/30 (PPLUS) | 54,000 | 1,395,900 | |||||||||||||
| 14,136,056 | |||||||||||||||
| OIL—EXPLORATION AND PRODUCTION | 0.0 | % | |||||||||||||
| Nexen, 7.35%, due 11/1/43, Series B | 17,900 | 454,660 | |||||||||||||
| REAL ESTATE | 11.1 | % | |||||||||||||
| DIVERSIFIED | 2.1 | % | |||||||||||||
| Forest City Enterprises, 7.375%, Class A | 519,000 | 13,130,700 | |||||||||||||
| iStar Financial, 7.875%, Series E | 249,300 | 6,282,360 | |||||||||||||
| iStar Financial, 7.65%, Series G | 88,300 | 2,220,745 | |||||||||||||
| iStar Financial, 7.50%, Series I | 250,000 | 6,250,000 | |||||||||||||
| LBA Realty Fund LP, 7.625%, Series B | 62,920 | 1,321,320 | |||||||||||||
| Lexington Corporate Properties Trust, 8.05%, Series B | 50,000 | 1,257,500 | |||||||||||||
| 30,462,625 | |||||||||||||||
| HEALTH CARE | 2.7 | % | |||||||||||||
| Health Care REIT, 7.875%, Series D | 153,536 | 3,861,430 | |||||||||||||
| Health Care REIT, 7.625%, Series F | 305,600 | 7,707,232 | |||||||||||||
| LTC Properties, 8.00%, Series F | 600,000 | 14,880,000 | |||||||||||||
| Omega Healthcare Investors, 8.375%, Series D | 500,000 | 12,905,000 | |||||||||||||
| 39,353,662 | |||||||||||||||
| HOTEL | 1.1 | % | |||||||||||||
| Ashford Hospitality Trust, 8.55%, Series A | 40,000 | 1,028,200 | |||||||||||||
| Equity Inns, 8.00%, Series C | 77,125 | 1,808,581 | |||||||||||||
| Highland Hospitality Corp., 7.875%, Series A | 120,600 | 3,021,030 | |||||||||||||
| Host Hotels & Resorts, 8.875%, Series E | 80,000 | 2,116,800 | |||||||||||||
See accompanying notes to financial statements.
14
COHEN & STEERS REIT AND UTILITY INCOME FUND, INC.
SCHEDULE OF INVESTMENTS—(Continued)
June 30, 2007 (Unaudited)
| Number of Shares | Value | ||||||||||||||
| Innkeepers USA Trust, 8.00%, Series C | 29,400 | $ | 637,980 | ||||||||||||
| LaSalle Hotel Properties, 8.00%, Series E | 170,000 | 4,335,000 | |||||||||||||
| Strategic Hotels & Resorts, 8.25%, Series B | 90,800 | 2,265,460 | |||||||||||||
| 15,213,051 | |||||||||||||||
| INDUSTRIAL | 0.1 | % | |||||||||||||
| EastGroup Properties, 7.95%, Series D | 35,068 | 879,506 | |||||||||||||
| OFFICE | 2.8 | % | |||||||||||||
| Alexandria Real Estate Equities, 8.375%, Series C | 374,250 | 9,569,572 | |||||||||||||
| Brandywine Realty Trust, 7.50%, Series C | 177,410 | 4,403,316 | |||||||||||||
| Kilroy Realty Corp., 7.80%, Series E | 99,500 | 2,526,305 | |||||||||||||
| Maguire Properties, 7.625%, Series A | 291,500 | 7,111,143 | |||||||||||||
| SL Green Realty Corp., 7.625%, Series C | 424,500 | 10,616,745 | |||||||||||||
| SL Green Realty Corp., 7.875%, Series D | 227,650 | 5,770,928 | |||||||||||||
| 39,998,009 | |||||||||||||||
| OFFICE/INDUSTRIAL | 0.6 | % | |||||||||||||
| PS Business Parks, 7.00%, Series H | 55,959 | 1,362,602 | |||||||||||||
| PS Business Parks, 6.875%, Series I | 246,900 | 5,905,848 | |||||||||||||
| PS Business Parks, 7.95%, Series K | 65,000 | 1,712,750 | |||||||||||||
| 8,981,200 | |||||||||||||||
| RESIDENTIAL—APARTMENT | 0.4 | % | |||||||||||||
| Apartment Investment & Management Co., 9.375%, Series G | 35,000 | 894,250 | |||||||||||||
| Apartment Investment & Management Co., 8.00%, Series T | 138,400 | 3,465,536 | |||||||||||||
| Apartment Investment & Management Co., 8.00%, Series V | 47,200 | 1,196,048 | |||||||||||||
| Apartment Investment & Management Co., 7.875%, Series Y | 34,000 | 862,240 | |||||||||||||
| 6,418,074 | |||||||||||||||
| SHOPPING CENTER | 1.3 | % | |||||||||||||
| COMMUNITY CENTER | 0.7 | % | |||||||||||||
| Developers Diversified Realty Corp., 7.50%, Series I | 300,700 | 7,586,661 | |||||||||||||
| Saul Centers, 8.00%, Series A | 96,300 | 2,445,057 | |||||||||||||
| 10,031,718 | |||||||||||||||
See accompanying notes to financial statements.
15
COHEN & STEERS REIT AND UTILITY INCOME FUND, INC.
SCHEDULE OF INVESTMENTS—(Continued)
June 30, 2007 (Unaudited)
| Number of Shares | Value | ||||||||||||||
| REGIONAL MALL | 0.6 | % | |||||||||||||
| CBL & Associates Properties, 7.75%, Series C | 114,710 | $ | 2,883,809 | ||||||||||||
| CBL & Associates Properties, 7.375%, Series D | 60,000 | 1,501,200 | |||||||||||||
| Cedar Shopping Centers, 8.875%, Series A | 137,500 | 3,594,250 | |||||||||||||
| 7,979,259 | |||||||||||||||
| TOTAL SHOPPING CENTER | 18,010,977 | ||||||||||||||
| TOTAL REAL ESTATE | 159,317,104 | ||||||||||||||
| UTILITIES—ELECTRIC UTILITIES | 0.1 | % | |||||||||||||
| Entergy Corp., 7.625%, ($50 par value) | 24,800 | 1,631,592 | |||||||||||||
| WIRELESS TELECOMMUNICATIONS SERVICES | 0.5 | % | |||||||||||||
| Telephone & Data Systems, 7.60%, due 12/1/41, Series A | 230,500 | 5,647,250 | |||||||||||||
| United States Cellular Corp., 7.50%, due 6/15/34 | 39,700 | 986,545 | |||||||||||||
| 6,633,795 | |||||||||||||||
| TOTAL PREFERRED SECURITIES—$25 PAR VALUE (Identified cost—$255,169,004) | 256,600,733 | ||||||||||||||
| PREFERRED SECURITIES—CAPITAL SECURITIES | 9.5 | % | |||||||||||||
| AUTO | 0.6 | % | |||||||||||||
| Porsche International Finance PLC, 7.20%, due 2/28/49 | 8,000,000 | 8,043,200 | |||||||||||||
| BANK | 1.6 | % | |||||||||||||
| Astoria Capital Trust I, 9.75%, due 11/1/29, Series B | 3,000,000 | 3,327,405 | |||||||||||||
| CBG Florida REIT Corp., 7.114%, due 2/15/49, 144Ac | 3,000,000 | 2,965,089 | |||||||||||||
| Sovereign Capital Trust VI, 7.908%, due 6/13/36 | 6,415,000 | 6,875,212 | |||||||||||||
| State Street Capital Trust IV, 6.355%, due 6/15/37, (FRN) | 2,000,000 | 2,014,696 | |||||||||||||
| Washington Mutual Preferred Funding Cayman, 7.25%, due 3/29/49, Series A-1, 144Ac | 8,000,000 | 7,931,248 | |||||||||||||
| 23,113,650 | |||||||||||||||
| BANK—FOREIGN | 0.1 | % | |||||||||||||
| Credit Agricole SA/London, 6.637%, 144Ac | 2,000,000 | 1,947,600 | |||||||||||||
| ELECTRIC UTILITIES | 0.3 | % | |||||||||||||
| DPL Capital Trust II, 8.125%, due 9/1/31 | 4,000,000 | 4,652,824 | |||||||||||||
See accompanying notes to financial statements.
16
COHEN & STEERS REIT AND UTILITY INCOME FUND, INC.
SCHEDULE OF INVESTMENTS—(Continued)
June 30, 2007 (Unaudited)
| Number of Shares | Value | ||||||||||||||
| ELECTRIC—INTEGRATED | 0.5 | % | |||||||||||||
| PPL Capital Funding, 6.70%, due 3/30/67, Series A | 7,000,000 | $ | 6,752,270 | ||||||||||||
| FINANCE | 1.7 | % | |||||||||||||
| CREDIT CARD | 0.3 | % | |||||||||||||
| Capital One Capital III | 4,500,000 | 4,648,194 | |||||||||||||
| DIVERSIFIED FINANCIAL SERVICES | 1.3 | % | |||||||||||||
| Old Mutual Capital Funding, 8.00%, (Eurobond) | 15,450,000 | 15,836,250 | |||||||||||||
| Webster Capital Trust IV, 7.65%, due 6/15/37 | 2,000,000 | 2,005,370 | |||||||||||||
| 17,841,620 | |||||||||||||||
| INVESTMENT BANKER/BROKER | 0.1 | % | |||||||||||||
| JP Morgan Chase Capital XVIII, 6.95%, due 8/17/36, Series R | 2,000,000 | 2,027,924 | |||||||||||||
| TOTAL FINANCE | 24,517,738 | ||||||||||||||
| FOOD | 0.7 | % | |||||||||||||
| Dairy Farmers of America, 7.875%, 144Ac,d | 42,500 | 4,246,175 | |||||||||||||
| Gruma S.A., 7.75%, due 12/29/49, 144Ac | 6,000,000 | 6,150,000 | |||||||||||||
| 10,396,175 | |||||||||||||||
| INSURANCE | 2.0 | % | |||||||||||||
| FINANCIAL GUARANTEE | 0.3 | % | |||||||||||||
| Security Capital Assurance Ltd., 6.88%, due 12/31/49, 144Ac | 4,000,000 | 3,991,516 | |||||||||||||
| LIFE/HEALTH INSURANCE | 0.5 | % | |||||||||||||
| Liberty Mutual Insurance, 7.697%, due 10/15/97, 144Ac | 7,000,000 | 6,831,972 | |||||||||||||
| MULTI-LINE | 0.8 | % | |||||||||||||
| AFC Capital Trust I, 8.207%, due 2/3/27, Series B | 9,000,000 | 9,152,838 | |||||||||||||
| AXA, 7.10%, due 5/29/49, (Eurobond) | 2,000,000 | 1,987,826 | |||||||||||||
| 11,140,664 | |||||||||||||||
| MUTUAL INSURANCE | 0.1 | % | |||||||||||||
| Liberty Mutual Group, 7.50%, due 8/15/36, 144Ac | 1,750,000 | 1,780,081 | |||||||||||||
See accompanying notes to financial statements.
17
COHEN & STEERS REIT AND UTILITY INCOME FUND, INC.
SCHEDULE OF INVESTMENTS—(Continued)
June 30, 2007 (Unaudited)
| Number of Shares | Value | ||||||||||||||
| PROPERTY CASUALTY | 0.3 | % | |||||||||||||
| White Mountains Re Group Ltd., 7.506%, due 5/29/49, 144Ac | 2,000,000 | $ | 1,957,704 | ||||||||||||
| Progressive Corp. (The), 6.70%, due 6/15/37 | 3,000,000 | 2,986,956 | |||||||||||||
| 4,944,660 | |||||||||||||||
| TOTAL INSURANCE | 28,688,893 | ||||||||||||||
| INTEGRATED OIL & GAS | 0.8 | % | |||||||||||||
| Pemex Project Funding Master Trust, 7.75%, due 9/28/49 | 11,500,000 | 11,830,625 | |||||||||||||
| INTEGRATED TELECOMMUNICATIONS SERVICES | 0.6 | % | |||||||||||||
| Embarq Corp., 7.995%, due 6/1/36 | 8,000,000 | 8,141,944 | |||||||||||||
| PIPELINES | 0.2 | % | |||||||||||||
| Enterprise Products Operating LP, 7.034%, due 1/15/68 | 3,500,000 | 3,380,125 | |||||||||||||
| REAL ESTATE | 0.4 | % | |||||||||||||
| BF Saul REIT, 7.50%, due 3/1/14 | 5,000,000 | 5,043,750 | |||||||||||||
| TOTAL PREFERRED SECURITIES—CAPITAL SECURITIES (Identified cost—$136,398,293) | 136,508,794 | ||||||||||||||
| Principal Amount | |||||||||||||||
| CORPORATE BONDS | 5.9 | % | |||||||||||||
| CABLE TELEVISION | 1.2 | % | |||||||||||||
| Cablevision Systems Corp., 8.00%, due 4/15/12 | $ | 4,150,000 | 4,118,875 | ||||||||||||
| Rogers Cable, 8.75%, due 5/1/32 | 10,430,000 | 12,679,678 | |||||||||||||
| 16,798,553 | |||||||||||||||
| GAS UTILITIES | 0.6 | % | |||||||||||||
| Southern Union Co., 7.20%, due 11/1/66 | 9,000,000 | 9,056,880 | |||||||||||||
| INDEPENDENT POWER PRODUCER | 0.1 | % | |||||||||||||
| NRG Energy, 7.375%, due 1/15/17 | 2,000,000 | 2,012,500 | |||||||||||||
| INSURANCE | 1.3 | % | |||||||||||||
| MULTI-LINE | 0.6 | % | |||||||||||||
| Catlin Insurance Co., 7.249%, due 12/1/49, 144Ac | 4,000,000 | 3,812,444 | |||||||||||||
| XL Capital Ltd., 6.50%, due 4/15/17, Series E | 5,000,000 | 4,704,200 | |||||||||||||
| 8,516,644 | |||||||||||||||
See accompanying notes to financial statements.
18
COHEN & STEERS REIT AND UTILITY INCOME FUND, INC.
SCHEDULE OF INVESTMENTS—(Continued)
June 30, 2007 (Unaudited)
| Principal Amount | Value | ||||||||||||||
| MUTUAL INSURANCE | 0.7 | % | |||||||||||||
| Liberty Mutual Group, 7.80%, due 3/15/37, 144Ac | $ | 8,000,000 | $ | 7,553,096 | |||||||||||
| Liberty Mutual Group, 7.00%, due 3/15/37, 144Ac | 2,000,000 | 1,923,832 | |||||||||||||
| 9,476,928 | |||||||||||||||
| TOTAL INSURANCE | 17,993,572 | ||||||||||||||
| INTEGRATED TELECOMMUNICATIONS SERVICES | 1.3 | % | |||||||||||||
| Citizens Communications Co., 7.875%, due 1/15/27 | 2,000,000 | 1,955,000 | |||||||||||||
| Citizens Communications Co., 9.00%, due 8/15/31 | 15,500,000 | 16,042,500 | |||||||||||||
| 17,997,500 | |||||||||||||||
| MEDIA | 0.1 | % | |||||||||||||
| CSC Holdings, 7.625%, due 7/15/18 | 1,000,000 | 955,000 | |||||||||||||
| MULTI UTILITIES | 0.5 | % | |||||||||||||
| Dominion Resources, 7.50%, due 6/30/66 | 5,440,000 | 5,726,443 | |||||||||||||
| Dominion Resources Capital Trust I, 7.83%, due 12/1/27 | 2,000,000 | 2,087,890 | |||||||||||||
| 7,814,333 | |||||||||||||||
| OIL & GAS EXPLORATION & PRODUCTION | 0.6 | % | |||||||||||||
| Kerr-McGee Corp., 7.875%, due 9/15/31 | 8,000,000 | 9,271,425 | |||||||||||||
| OIL & GAS STORAGE & TRANSPORTATION | 0.2 | % | |||||||||||||
| Williams Cos. (The), 7.75%, due 6/15/31 | 3,000,000 | 3,191,250 | |||||||||||||
| TOTAL CORPORATE BONDS (Identified cost—$84,211,819) | 85,091,013 | ||||||||||||||
| COMMERCIAL PAPER | 0.6 | % | |||||||||||||
| San Paolo U.S. Finance Co., 4.15%, due 7/2/07 (Identified cost—$8,131,062) | 8,132,000 | 8,131,062 | |||||||||||||
| TOTAL INVESTMENTS (Identified cost—$1,893,703,449) | 153.8 | % | 2,208,909,168 | ||||||||||||
| OTHER ASSETS IN EXCESS OF LIABILITIES | 1.6 | % | 22,727,687 | ||||||||||||
| LIQUIDATION VALUE OF PREFERRED SHARES | (55.4 | )% | (795,000,000 | ) | |||||||||||
| NET ASSETS APPLICABLE TO COMMON SHARES (Equivalent to $24.41 per share based on 58,858,135 shares of common stock outstanding) | 100.0 | % | $ | 1,436,636,855 | |||||||||||
See accompanying notes to financial statements.
19
COHEN & STEERS REIT AND UTILITY INCOME FUND, INC.
SCHEDULE OF INVESTMENTS—(Continued)
June 30, 2007 (Unaudited)
Glossary of Portfolio Abbreviations
ADR American Depositary Receipt
FRN Floating Rate Note
PPLUS Preferred Plus Trust
REIT Real Estate Investment Trust
Note: Percentages indicated are based on the net assets applicable to common shares of the fund.
a 34,900 shares segregated as collateral for the interest rate swap transactions.
b Non-income producing security.
c Resale is restricted to qualified institutional investors. Aggregate holdings equal 4.4% of net assets applicable to common shares.
d Fair valued security. Aggregate holdings equal 0.3% of net assets applicable to common shares.
See accompanying notes to financial statements.
20
COHEN & STEERS REIT AND UTILITY INCOME FUND, INC.
SCHEDULE OF INVESTMENTS—(Continued)
June 30, 2007 (Unaudited)
Interest rate swaps outstanding at June 30, 2007 were as follows:
| Counterparty | Notional Amount | Fixed Rate Payable | Floating Ratea (reset monthly) Receivable | Termination Date | Unrealized Appreciation | ||||||||||||||||||
| Merrill Lynch Derivative Products AG | $ | 46,000,000 | 3.228 | % | 5.320 | % | March 29, 2008 | $ | 708,903 | ||||||||||||||
| Merrill Lynch Derivative Products AG | $ | 34,000,000 | 3.535 | % | 5.320 | % | April 23, 2008 | 492,288 | |||||||||||||||
| Merrill Lynch Derivative Products AG | $ | 46,000,000 | 3.415 | % | 5.320 | % | March 29, 2009 | 1,405,411 | |||||||||||||||
| Merrill Lynch Derivative Products AG | $ | 46,000,000 | 3.461 | % | 5.320 | % | March 29, 2010 | 2,127,676 | |||||||||||||||
| Royal Bank of Canada | $ | 68,000,000 | 2.990 | % | 5.320 | % | March 26, 2009 | 2,567,048 | |||||||||||||||
| UBS AG | $ | 34,000,000 | 3.440 | % | 5.320 | % | April 19, 2008 | 522,778 | |||||||||||||||
| UBS AG | $ | 34,000,000 | 4.060 | % | 5.320 | % | April 19, 2010 | 1,080,135 | |||||||||||||||
| UBS AG | $ | 34,000,000 | 4.173 | % | 5.320 | % | April 28, 2010 | 977,268 | |||||||||||||||
| $ | 9,881,507 | ||||||||||||||||||||||
a Based on LIBOR (London Interbank Offered Rate). Represents rates in effect at June 30, 2007.
21
COHEN & STEERS REIT AND UTILITY INCOME FUND, INC.
STATEMENT OF ASSETS AND LIABILITIES
June 30, 2007 (Unaudited)
| ASSETS: | |||||||
| Investments in securities, at value (Identified cost—$1,893,703,449) | $ | 2,208,909,168 | |||||
| Cash | 10,412 | ||||||
| Dividends and interest receivable | 10,273,249 | ||||||
| Receivable for investment securities sold | 10,027,423 | ||||||
| Unrealized appreciation on interest rate swap transactions | 9,881,507 | ||||||
| Other assets | 87,251 | ||||||
| Total Assets | 2,239,189,010 | ||||||
| LIABILITIES: | |||||||
| Payable for investment securities purchased | 3,142,109 | ||||||
| Payable for dividends declared on preferred shares | 1,778,818 | ||||||
| Payable for investment managent fees | 1,215,935 | ||||||
| Payable for dividends declared on common shares | 1,078,503 | ||||||
| Payable for offering costs | 81,122 | ||||||
| Payable for administration fees | 78,509 | ||||||
| Payable for directors' fees | 8,254 | ||||||
| Other liabilities | 168,905 | ||||||
| Total Liabilities | 7,552,155 | ||||||
| LIQUIDATION VALUE OF PREFERRED SHARES: | |||||||
| Auction market preferred shares, Series M7, ($25,000 liquidation value, $0.001 par value, 3,360 shares issued and outstanding) | 84,000,000 | ||||||
| Auction market preferred shares, Series M28, ($25,000 liquidation value, $0.001 par value, 2,200 shares issued and outstanding) | 55,000,000 | ||||||
| Auction market preferred shares, Series T7, ($25,000 liquidation value, $0.001 par value, 3,360 shares issued and outstanding) | 84,000,000 | ||||||
| Auction market preferred shares, Series T7-2, ($25,000 liquidation value, $0.001 par value, 3,800 shares issued and outstanding) | 95,000,000 | ||||||
| Auction market preferred shares, Series T28, ($25,000 liquidation value, $0.001 par value, 3,000 shares issued and outstanding) | 75,000,000 | ||||||
| Auction market preferred shares, Series W7, ($25,000 liquidation value, $0.001 par value, 3,360 shares issued and outstanding) | 84,000,000 | ||||||
| Auction market preferred shares, Series W28, ($25,000 liquidation value, $0.001 par value, 3,000 shares issued and outstanding) | 75,000,000 | ||||||
| Auction market preferred shares, Series TH7, ($25,000 liquidation value, $0.001 par value, 3,360 shares issued and outstanding) | 84,000,000 | ||||||
| Auction market preferred shares, Series F7, ($25,000 liquidation value, $0.001 par value, 3,360 shares issued and outstanding) | 84,000,000 | ||||||
| Auction market preferred shares, Series F28, ($25,000 liquidation value, $0.001 par value, 3,000 shares issued and outstanding) | 75,000,000 | ||||||
| 795,000,000 | |||||||
See accompanying notes to financial statements.
22
COHEN & STEERS REIT AND UTILITY INCOME FUND, INC.
STATEMENT OF ASSETS AND LIABILITIES—(Continued)
June 30, 2007 (Unaudited)
| TOTAL NET ASSETS APPLICABLE TO COMMON SHARES | $ | 1,436,636,855 | |||||
| NET ASSETS consist of: | |||||||
| Paid-in-capital | $ | 1,065,990,159 | |||||
| Dividends in excess of net investment income | (23,439,715 | ) | |||||
| Accumulated undistributed net realized gain | 68,998,912 | ||||||
| Net unrealized appreciation | 325,087,499 | ||||||
| $ | 1,436,636,855 | ||||||
| NET ASSET VALUE PER COMMON SHARE: | |||||||
| ($1,436,636,855 ÷ 58,858,135 shares outstanding) | $ | 24.41 | |||||
| MARKET PRICE PER COMMON SHARE | $ | 21.30 | |||||
| MARKET PRICE DISCOUNT TO NET ASSET VALUE PER COMMON SHARE | (12.74 | )% | |||||
See accompanying notes to financial statements.
23
COHEN & STEERS REIT AND UTILITY INCOME FUND, INC.
STATEMENT OF OPERATIONS
For the Six Months Ended June 30, 2007 (Unaudited)
| Investment Income: | |||||||
| Dividend income (net of $304,838 of foreign withholding tax) | $ | 42,583,645 | |||||
| Interest income | 7,534,978 | ||||||
| Total Income | 50,118,623 | ||||||
| Expenses: | |||||||
| Investment management fees | 9,706,805 | ||||||
| Preferred remarketing fee | 867,808 | ||||||
| Administration fees | 626,557 | ||||||
| Shareholder reporting expenses | 157,143 | ||||||
| Custodian fees and expenses | 123,454 | ||||||
| Professional fees | 114,997 | ||||||
| Directors' fees and expenses | 31,675 | ||||||
| Transfer agent fees and expenses | 10,444 | ||||||
| Miscellaneous | 78,987 | ||||||
| Total Expenses | 11,717,870 | ||||||
| Reduction of Expenses | (2,283,954 | ) | |||||
| Net Expenses | 9,433,916 | ||||||
| Net Investment Income | 40,684,707 | ||||||
| Net Realized and Unrealized Gain (Loss) on Investments: | |||||||
| Net realized gain (loss) on: | |||||||
| Investments | 65,584,571 | ||||||
| Foreign currency transactions | (54,389 | ) | |||||
| Interest rate swap transactions | 3,474,420 | ||||||
| Net realized gain | 69,004,602 | ||||||
| Net change in unrealized appreciation on: | |||||||
| Investments | (93,036,927 | ) | |||||
| Foreign currency translations | 373 | ||||||
| Interest rate swap transactions | (1,308,828 | ) | |||||
| Net change in unrealized appreciation | (94,345,382 | ) | |||||
| Net realized and unrealized loss on investments | (25,340,780 | ) | |||||
| Net Increase in Net Assets Resulting from Operations | 15,343,927 | ||||||
| Less Dividends and Distributions to Preferred Shareholders | (19,889,188 | ) | |||||
| Net Decrease in Net Assets from Operations Applicable to Common Shares | $ | (4,545,261 | ) | ||||
See accompanying notes to financial statements.
24
COHEN & STEERS REIT AND UTILITY INCOME FUND, INC.
STATEMENT OF CHANGES IN NET ASSETS (Unaudited)
| For the Six Months Ended June 30, 2007 | For the Year Ended December 31, 2006 | ||||||||||
| Change in Net Assets Applicable to Common Shares: | |||||||||||
| From Operations: | |||||||||||
| Net investment income | $ | 40,684,707 | $ | 78,650,786 | |||||||
| Net realized gain | 69,004,602 | 72,444,479 | |||||||||
| Net change in unrealized appreciation | (94,345,382 | ) | 255,409,943 | ||||||||
| Net increase in net assets resulting from operations | 15,343,927 | 406,505,208 | |||||||||
| Less Dividends and Distributions to Preferred Shareholders from: | |||||||||||
| Net investment income | (19,889,188 | ) | (19,018,097 | ) | |||||||
| Net realized gain on investments | — | (15,258,474 | ) | ||||||||
| Total dividends and distributions to preferred shareholders | (19,889,188 | ) | (34,276,571 | ) | |||||||
| Net increase (decrease) in net assets from operations applicable to common shares | (4,545,261 | ) | 372,228,637 | ||||||||
| Less Dividends and Distributions to Common Shareholders from: | |||||||||||
| Net investment income | (41,936,426 | ) | (66,563,658 | ) | |||||||
| Net realized gain on investments | — | (51,082,718 | ) | ||||||||
| Tax return of capital | — | (20,817,396 | ) | ||||||||
| Total dividends and distributions to common shareholders | (41,936,426 | ) | (138,463,772 | ) | |||||||
| Capital Stock Transactions: | |||||||||||
| Decrease in net assets from underwriting commissions and offering expenses from issuance of preferred shares | (1,184,000 | ) | (855,487 | ) | |||||||
| Total increase (decrease) in net assets applicable to common shares | (47,665,687 | ) | 232,909,378 | ||||||||
| Net Assets Applicable to Common Shares: | |||||||||||
| Beginning of period | 1,484,302,542 | 1,251,393,164 | |||||||||
| End of perioda | $ | 1,436,636,855 | $ | 1,484,302,542 | |||||||
a Includes dividends in excess of net investment income of $23,439,715 and $2,298,808, respectively.
See accompanying notes to financial statements.
25
COHEN & STEERS REIT AND UTILITY INCOME FUND, INC.
FINANCIAL HIGHLIGHTS (Unaudited)
The following table includes selected data for a common share outstanding throughout each period and other performance information derived from the financial statements. It should be read in conjunction with the financial statements and notes thereto.
| Per Share Operating Performance: | For the Six Months Ended June 30, 2007 | For the Year Ended December 31, 2006 | For the Year Ended December 31, 2005 | For the Period January 30, 2004a through December 31, 2004 | |||||||||||||||
| Net asset value per common share, beginning of period | $ | 25.22 | $ | 21.26 | $ | 21.51 | $ | 19.10 | |||||||||||
| Income from investment operations: | |||||||||||||||||||
| Net investment income | 0.69 | 1.43 | 1.17 | b | 0.90 | ||||||||||||||
| Net realized and unrealized gain (loss) on investments | (0.43 | ) | 5.47 | 0.57 | 2.97 | ||||||||||||||
| Total income from investment operations | 0.26 | 6.90 | 1.74 | 3.87 | |||||||||||||||
| Less dividends and distributions to preferred shareholders from: | |||||||||||||||||||
| Net investment income | (0.34 | ) | (0.32 | ) | (0.25 | ) | (0.12 | ) | |||||||||||
| Net realized gain on investments | — | (0.26 | ) | (0.12 | ) | (0.01 | ) | ||||||||||||
| Total dividends and distributions to preferred shareholders | (0.34 | ) | (0.58 | ) | (0.37 | ) | (0.13 | ) | |||||||||||
| Total from investment operations applicable to common shares | (0.08 | ) | 6.32 | 1.37 | 3.74 | ||||||||||||||
| Less: Offering costs charged to paid-in capital—preferred shares | (0.02 | ) | (0.01 | ) | (0.02 | ) | (0.12 | ) | |||||||||||
| Offering costs charged to paid-in capital—common shares | — | — | — | (0.04 | ) | ||||||||||||||
| Dilutive effect of common share offering | — | — | — | (0.12 | ) | ||||||||||||||
| Preferred and common share offering cost adjustment | — | — | 0.00 | c | — | ||||||||||||||
| Total offering costs | (0.02 | ) | (0.01 | ) | (0.02 | ) | (0.28 | ) | |||||||||||
| Less dividends and distributions to common shareholders from: | |||||||||||||||||||
| Net investment income | (0.71 | ) | (1.13 | ) | (0.93 | ) | (0.79 | ) | |||||||||||
| Net realized gain on investments | — | (0.87 | ) | (0.46 | ) | (0.03 | ) | ||||||||||||
| Tax return of capital | — | (0.35 | ) | (0.21 | ) | (0.23 | ) | ||||||||||||
| Total dividends and distributions to common shareholders | (0.71 | ) | (2.35 | ) | (1.60 | ) | (1.05 | ) | |||||||||||
| Net increase (decrease) in net asset value per common share | (0.81 | ) | 3.96 | (0.25 | ) | 2.41 | |||||||||||||
| Net asset value, per common share, end of period | $ | 24.41 | $ | 25.22 | $ | 21.26 | $ | 21.51 | |||||||||||
| Market value, per common share, end of period | $ | 21.30 | $ | 22.35 | $ | 17.66 | $ | 18.76 | |||||||||||
| Net asset value total returnd | –0.16 | %e | 32.65 | % | 7.65 | % | 19.46 | %e | |||||||||||
| Market value returnd | –1.69 | %e | 41.52 | % | 2.53 | % | –0.50 | %e | |||||||||||
See accompanying notes to financial statements.
26
COHEN & STEERS REIT AND UTILITY INCOME FUND, INC.
FINANCIAL HIGHLIGHTS (Unaudited)—(Continued)
| Ratios/Supplemental Data: | For the Six Months Ended June 30, 2007 | For the Year Ended December 31, 2006 | For the Year Ended December 31, 2005 | For the Period January 30, 2004a through December 31, 2004 | |||||||||||||||
| Net assets applicable to common shares, end of period (in millions) | $ | 1,436.6 | $ | 1,484.3 | $ | 1,251.4 | $ | 1,266.2 | |||||||||||
| Ratio of expenses to average daily net assets applicable to common shares (before expense reduction)f | 1.54 | %g | 1.57 | % | 1.57 | % | 1.49 | %g | |||||||||||
| Ratio of expenses to average daily net assets applicable to common shares (net of expense reduction)f | 1.24 | %g | 1.27 | % | 1.27 | % | 1.21 | %g | |||||||||||
| Ratio of net investment income to average daily net assets applicable to common shares (before expense reduction)f | 5.06 | %g | 5.47 | % | 5.15 | % | 5.40 | %g | |||||||||||
| Ratio of net investment income to average daily net assets applicable to common shares (net of expense reduction)f | 5.36 | %g | 5.77 | % | 5.45 | % | 5.68 | %g | |||||||||||
| Ratio of expenses to average daily managed assets (before expense reduction)f,h | 1.03 | %g | 1.04 | % | 1.04 | % | 1.04 | %g | |||||||||||
| Ratio of expenses to average daily managed assets (net of expense reduction)f,h | 0.83 | %g | 0.84 | % | 0.84 | % | 0.84 | %g | |||||||||||
| Portfolio turnover rate | 12 | %e | 24 | % | 20 | % | 18 | %e | |||||||||||
| Preferred Shares: | |||||||||||||||||||
| Liquidation value, end of period (in 000's) | $ | 795,000 | $ | 700,000 | $ | 645,000 | $ | 570,000 | |||||||||||
| Total shares outstanding (in 000's) | 32 | 28 | 26 | 23 | |||||||||||||||
| Asset coverage ratio | 281 | % | 312 | % | 294 | % | 322 | % | |||||||||||
| Asset coverage per share | $ | 70,177 | $ | 78,011 | $ | 73,504 | $ | 80,534 | |||||||||||
| Liquidation preference per share | $ | 25,000 | $ | 25,000 | $ | 25,000 | $ | 25,000 | |||||||||||
| Average market value per sharei | $ | 25,000 | $ | 25,000 | $ | 25,000 | $ | 25,000 | |||||||||||
a Commencement of operations.
b Calculation based on average shares outstanding.
c Amount is less than $0.005.
d Total market value return is computed based upon the New York Stock Exchange market price of the fund's shares and excludes the effects of brokerage commissions. Total net asset value return measures the changes in value over the period indicated, taking into account dividends as reinvested. Dividends and distributions, if any, are assumed for purposes of these calculations, to be reinvested at prices obtained under the fund's dividend reinvestment plan.
e Not annualized.
f Ratios do not reflect dividend payments to preferred shareholders.
g Annualized.
h Average daily managed assets represents net assets applicable to common shares plus liquidation preference of preferred shares.
i Based on weekly prices.
See accompanying notes to financial statements.
27
COHEN & STEERS REIT AND UTILITY INCOME FUND, INC.
NOTES TO FINANCIAL STATEMENTS (Unaudited)
Note 1. Significant Accounting Policies
Cohen & Steers REIT and Utility Income Fund, Inc. (the fund) was incorporated under the laws of the State of Maryland on October 1, 2003 and is registered under the Investment Company Act of 1940, as amended, as a nondiversified, closed-end management investment company. The fund's investment objective is high current income.
The following is a summary of significant accounting policies consistently followed by the fund in the preparation of its financial statements. The policies are in conformity with accounting principles generally accepted in the United States of America (GAAP). The preparation of the financial statements in accordance with GAAP requires management to make estimates and assumptions that affect the reported amounts of assets and liabilities at the date of the financial statements and the reported amounts of income and expenses during the reporting period. Actual results could differ from those estimates.
Portfolio Valuation: Investments in securities that are listed on the New York Stock Exchange are valued, except as indicated below, at the last sale price reflected at the close of the New York Stock Exchange on the business day as of which such value is being determined. If there has been no sale on such day, the securities are valued at the mean of the closing bid and asked prices for the day or, if no asked price is available, at the bid price.
Securities not listed on the New York Stock Exchange but listed on other domestic or foreign securities exchanges or admitted to trading on the National Association of Securities Dealers Automated Quotations, Inc. (Nasdaq) national market system are valued in a similar manner. Securities traded on more than one securities exchange are valued at the last sale price on the business day as of which such value is being determined as reflected on the tape at the close of the exchange representing the principal market for such securities.
Readily marketable securities traded in the over-the-counter market, including listed securities whose primary market is believed by Cohen & Steers Capital Management, Inc. (the investment manager) to be over-the-counter, but excluding securities admitted to trading on the Nasdaq National List, are valued at the official closing prices as reported by Nasdaq, the National Quotation Bureau, or such other comparable sources as the Board of Directors deem appropriate to reflect their fair market value. If there has been no sale on such day, the securities are valued at the mean of the closing bid and asked prices for the day, or if no asked price is available, at the bid price. However, certain fixed-income securities may be valued on the basis of prices provided by a pricing service when such prices are believed by the Board of Directors to reflect the fair market value of such securities. Where securities are traded on more than one exchan ge and also over-the-counter, the securities will generally be valued using the quotations the Board of Directors believes most closely reflect the value of such securities.
Securities for which market prices are unavailable, or securities for which the investment manager determines that bid and/or asked price does not reflect market value, will be valued at fair value pursuant to procedures approved by the fund's Board of Directors. Circumstances in which market prices may be unavailable include, but are not limited to, when trading in a security is suspended, the exchange on which the security is traded is subject
28
COHEN & STEERS REIT AND UTILITY INCOME FUND, INC.
NOTES TO FINANCIAL STATEMENTS (Unaudited)—(Continued)
to an unscheduled close or disruption or material events occur after the close of the exchange on which the security is principally traded. In these circumstances, the fund determines fair value in a manner that fairly reflects the market value of the security on the valuation date based on consideration of any information or factors it deems appropriate. These may include recent transactions in comparable securities, information relating to the specific security and developments in the markets.
The fund's use of fair value pricing may cause the net asset value of fund shares to differ from the net asset value that would be calculated using market quotations. Fair value pricing involves subjective judgments and it is possible that the fair value determined for a security may be materially different than the value that could be realized upon the sale of that security.
Short-term debt securities, which have a maturity date of 60 days or less, are valued at amortized cost, which approximates value.
Security Transactions and Investment Income: Security transactions are recorded on trade date. Realized gains and losses on investments sold are recorded on the basis of identified cost. Interest income is recorded on the accrual basis. Discounts are accreted and premiums are amortized over the life of the respective securities. Dividend income is recorded on the ex-dividend date except for certain dividends on foreign securities, which are recorded as soon as the fund is informed after the ex-dividend date. The fund records distributions received in excess of income from underlying investments as a reduction of cost of investments and/or realized gain. Such amounts are based on estimates if actual amounts are not available, and actual amounts of income, realized gain and return of capital may differ from the estimated amounts. The fund adjusts the estimated amoun ts of the components of distributions (and consequently its net investment income) as an increase to unrealized appreciation/(depreciation) and realized gain/(loss) on investments as necessary once the issuers provide information about the actual composition of the distributions.
Foreign Currency Translation and Forward Foreign Currency Contracts: The books and records of the fund are maintained in U.S. dollars as follows: (1) the foreign currency market value of investment securities, other assets and liabilities and forward foreign currency contracts (forward contracts) are translated at the exchange rates prevailing at the end of the period; and (2) purchases, sales, income and expenses are translated at the exchange rates prevailing on the respective dates of such transactions. The resultant exchange gains and losses are recorded as realized and unrealized gain/loss on foreign exchange transactions. Pursuant to U.S. federal income tax regulations, certain foreign exchange gains/losses included in realized and unrealized gain/loss are included in or are a reduction of ordinary income for federal income tax purposes. The fund does not is olate that portion of the results of operations arising as a result of changes in the foreign exchange rates from the changes in the market prices of the securities. Forward contracts are valued daily at the appropriate exchange rates. The resultant unrealized exchange gains and losses are recorded as unrealized foreign currency gain or loss. The fund records
29
COHEN & STEERS REIT AND UTILITY INCOME FUND, INC.
NOTES TO FINANCIAL STATEMENTS (Unaudited)—(Continued)
realized gains or losses on delivery of the currency or at the time the forward contract is extinguished (compensated) by entering into a closing transaction prior to delivery.
Foreign Securities: The fund may directly purchase securities of foreign issuers. Investing in securities of foreign issuers involves special risks not typically associated with investing in securities of U.S. issuers. The risks include possible revaluation of currencies, the ability to repatriate funds, less complete financial information about companies and possible future adverse political and economic developments. Moreover, securities of many foreign issuers and their markets may be less liquid and their prices more volatile than those of securities of comparable U.S. issuers.
Interest Rate Swaps: The fund uses interest rate swaps in connection with the sale of preferred shares. The interest rate swaps are intended to reduce the risk that an increase in short-term interest rates could have on the performance of the fund's common shares as a result of the floating rate structure of the preferred shares. In these interest rate swaps, the fund agrees to pay the other party to the interest rate swap (which is known as the counterparty) a fixed rate payment in exchange for the counterparty agreeing to pay the fund a variable rate payment that is intended to approximate the fund's variable rate payment obligation on the preferred shares. The payment obligation is based on the notional amount of the swap. Depending on the state of interest rates in general, the use of interest rate swaps could enhance or harm the overall performance of the com mon shares. The market value of interest rate swaps is based on pricing models that consider the time value of money, volatility, the current market and contractual prices of the underlying financial instrument. Unrealized gains are reported as an asset and unrealized losses are reported as a liability on the Statement of Assets and Liabilities. The change in value of swaps, including the accrual of periodic amounts of interest to be paid or received on swaps, is reported as unrealized gains or losses in the Statement of Operations. A realized gain or loss is recorded upon payment or receipt of a periodic payment or termination of swap agreements. Swap agreements involve, to varying degrees, elements of market and counterparty risk, and exposure to loss in excess of the related amounts reflected in the Statement of Assets and Liabilities.
Dividends and Distributions to Shareholders: Dividends from net investment income and capital gain distributions are determined in accordance with U.S. federal income tax regulations, which may differ from GAAP. Dividends from net investment income are declared and paid monthly. Net realized capital gains, unless offset by any available capital loss carryforward, are distributed to shareholders annually. Dividends and distributions to shareholders are recorded on the ex-dividend date and are automatically reinvested in full and fractional shares of the fund unless the shareholder has elected to have them paid in cash.
Distributions paid by the fund are subject to recharacterization for tax purposes. Based upon the results of operations for the six months ended June 30, 2007, the investment manager considers it likely that a portion of the dividends will be reclassified to return of capital and distributions of net realized capital gains upon the final determination of the fund's taxable income for the year.
30
COHEN & STEERS REIT AND UTILITY INCOME FUND, INC.
NOTES TO FINANCIAL STATEMENTS (Unaudited)—(Continued)
Series M7, Series T7, Series T7-2, Series W7, Series TH7 and Series F7 preferred shares pay dividends based on a variable interest rate set at auctions, normally held every seven days. Dividends and distributions are declared and recorded for the subsequent seven day period on the auction date. In most instances, dividends are payable every seven days, on the first business day following the end of the dividend period.
Series M28, Series T28, Series W28 and Series F28 preferred shares pay dividends based on a variable interest rate set at auctions, normally held every 28 days. The dividends are declared and recorded for the subsequent 28 day period on the auction date. In most instances, dividends are payable every 28 days, on the first business day following the end of the dividend period.
Federal Income Taxes: It is the policy of the fund to continue to qualify as a regulated investment company, if such qualification is in the best interest of the shareholders, by complying with the requirements of Subchapter M of the Internal Revenue Code applicable to regulated investment companies, and by distributing substantially all of its taxable earnings to its shareholders. Accordingly, no provision for federal income or excise tax is necessary.
Note 2. Investment Management Fees, Administration Fees and Other Transactions with Affiliates
Investment Management Fees: The investment manager serves as the fund's investment manager pursuant to an investment management agreement (the management agreement). Under the terms of the management agreement, the investment manager provides the fund with day-to-day investment decisions and generally manages the fund's investments in accordance with the stated polices of the fund, subject to the supervision of the Board of Directors
For the services under the management agreement, the fund pays the investment manager a management fee, accrued daily and paid monthly, at an annual rate of 0.85% of the fund's average daily managed asset value. Managed asset value is the net asset value of the common shares plus the liquidation preference of the preferred shares.
The investment manager has contractually agreed to waive its investment management fee in the amount of 0.20% of average daily managed asset value for the first five years of the fund's operations, 0.15% of average daily managed asset value in year six, 0.10% of average daily managed asset value in year seven and 0.05% of average daily managed asset value in year eight. During the six months ended June 30, 2007, the investment manager waived its fee at the annual rate of 0.20%.
Administration Fees: The fund has entered into an administration agreement with the investment manager under which the investment manager performs certain administrative functions for the fund and receives a fee, accrued daily and paid monthly, at the annual rate of 0.06% of the fund's average daily managed assets up to $1 billion, 0.04% of the fund's average daily managed assets in excess of $1 billion up to $1.5 billion and 0.02% of the fund's average daily managed assets in excess of $1.5 billion. For the six months ended June 30, 2007, the fund
31
COHEN & STEERS REIT AND UTILITY INCOME FUND, INC.
NOTES TO FINANCIAL STATEMENTS (Unaudited)—(Continued)
incurred $476,341 in administration fees. Additionally, the fund has retained State Street Bank and Trust Company as sub-administrator under a fund accounting and administration agreement.
Directors' and Officers' Fees: Certain directors and officers of the fund are also directors, officers, and/or employees of the investment manager. The fund does not pay compensation to any affiliated directors and officers except for the Chief Compliance Officer, who received $7,371 from the fund for the six months ended June 30, 2007.
Note 3. Purchases and Sales of Securities
Purchases and sales of securities, excluding short-term investments, for the six months ended June 30, 2007, totaled $350,549,832 and $275,592,154, respectively.
Note 4. Income Tax Information
As of June 30, 2007, the federal tax cost and net unrealized appreciation on securities were as follows:
| Cost for federal income tax purposes | $ | 1,893,703,449 | |||||
| Gross unrealized appreciation | $ | 338,332,856 | |||||
| Gross unrealized depreciation | (23,127,137 | ) | |||||
| Net unrealized appreciation | $ | 315,205,719 | |||||
Note 5. Capital Stock
The fund is authorized to issue 100 million shares of common stock at a par value of $0.001 per share.
During the six months ended June 30, 2007 and the year ended December 31, 2006, the fund issued no shares of common stock for the reinvestment of dividends.
The fund's articles of incorporation authorize the issuance of fund preferred shares, par value $0.001 per share, in one or more classes or series, with rights as determined by the Board of Directors, by action of the Board of Directors without the approval of the common shareholders.
On February 14, 2007, the fund issued 3,800 auction market preferred shares, Series T7-2 (par value $0.001). Proceeds paid to the fund amounted to $93,816,000 after deduction of underwriting commissions and offering expenses of $1,184,000. This issue has received a "AAA/Aaa" rating from Standard & Poor's and Moody's.
On February 22, 2006 the fund issued 2,200 auction market preferred shares, Series M28 (par value $0.001). Proceeds paid to the fund amounted to $54,144,513 after deduction of underwriting commissions and offering expenses of $855,487. This issue has received a "AAA/Aaa" rating from Standard & Poor's and Moody's.
32
COHEN & STEERS REIT AND UTILITY INCOME FUND, INC.
NOTES TO FINANCIAL STATEMENTS (Unaudited)—(Continued)
Preferred shares are senior to the fund's common shares and will rank on a parity with shares of any other series of preferred shares, and with shares of any other series of preferred stock of the fund, as to the payment of dividends and the distribution of assets upon liquidation. If the fund does not timely cure a failure to (1) maintain a discounted value of its portfolio equal to the preferred shares basic maintenance amount, (2) maintain the 1940 Act preferred shares asset coverage, or (3) file a required certificate related to asset coverage on time, the preferred shares will be subject to a mandatory redemption at the redemption price of $25,000 per share plus an amount equal to accumulated but unpaid dividends thereon to the date fixed for redemption. To the extent permitted under the 1940 Act and Maryland Law, the fund at its option may without consent of the holders of preferred shares, redeem preferred shares having a dividend per iod of one year or less, in whole, or in part, on the business day after the last day of such dividend period upon not less than 15 calendar days and not more than 40 calendar days prior to notice. The optional redemption price is $25,000 per share plus an amount equal to accumulated but unpaid dividends thereon to the date fixed for redemption.
The fund's common shares and preferred shares have equal voting rights of one vote per share and vote together as a single class, except in certain circumstances regarding the election of directors. In addition, the affirmative vote of the holders of a majority, as defined in the 1940 Act, of the outstanding preferred shares shall be required to (1) approve any plan of reorganization that would adversely affect the preferred shares and (2) approve any matter that materially and adversely affects the rights, preferences, or powers of that series.
Note 6. Other
In the normal course of business, the fund enters into contracts that provide general indemnifications. The fund's maximum exposure under these arrangements is dependent on claims that may be made against the fund in the future and, therefore, cannot be estimated; however, based on experience, the risk of material loss from such claims is considered remote.
Note 7. New Accounting Pronouncements
In July 2006, the Financial Accounting Standards Board (FASB) issued Interpretation 48, Accounting for Uncertainty in Income Taxes—an interpretation of FASB Statement 109 (FIN 48). FIN 48 clarifies the accounting for income taxes by prescribing the minimum recognition threshold a tax position must meet before being recognized in the financial statements. FIN 48 is effective for fiscal years beginning after December 15, 2006. An assessment of the fund's tax positions has been made and it has been determined that there is no impact to the fund's financial statements.
In September 2006, Statement of Financial Accounting Standards No. 157, Fair Value Measurements (SFAS 157), was issued and is effective for fiscal years beginning after November 15, 2007. SFAS 157 defines fair value, establishes a framework for measuring fair value and expands disclosures about fair value measurements. Management is currently evaluating the impact the adoption of SFAS 157 will have on the fund's financial statements.
33
COHEN & STEERS REIT AND UTILITY INCOME FUND, INC.
PROXY RESULTS (Unaudited)
During the six months ended June 30, 2007, Cohen & Steers Reit and Utility Income Fund, Inc. shareholders voted on the following proposals at the annual meeting held on April 19, 2007. The description of each proposal and number of shares voted are as follows:
Common Shares
| Shares Voted For | Authority Withheld | ||||||||||
| To elect Directors | |||||||||||
| Richard J. Norman | 55,237,419 | 989,563 | |||||||||
| Frank K. Ross | 55,212,102 | 1,014,880 | |||||||||
Preferred Shares
| Shares Voted For | Authority Withheld | ||||||||||
| To elect Directors | |||||||||||
| Martin Cohen | 23,909 | 142 | |||||||||
| Richard J. Norman | 23,909 | 142 | |||||||||
| Frank K. Ross | 23,909 | 142 | |||||||||
34
COHEN & STEERS REIT AND UTILITY INCOME FUND, INC.
AVERAGE ANNUAL TOTAL RETURNS
(periods ended June 30, 2007) (Unaudited)
| Based on Net Asset Value | Based on Market Value | ||||||||||||||
| One Year | Since Inception (1/30/04) | One Year | Since Inception (1/30/04) | ||||||||||||
| 21.46 | % | 16.88 | % | 27.36 | % | 10.80 | % | ||||||||
The performance data quoted represent past performance. Past performance is no guarantee of future results. The investment return will vary and the principal value of an investment will fluctuate and shares, if redeemed, may be worth more or less than their original cost. Current performance may be lower or higher than the performance data quoted. Performance results reflect the effect of leverage resulting from the issuance of preferred shares.
REINVESTMENT PLAN
We urge shareholders who want to take advantage of this plan and whose shares are held in 'Street Name' to consult your broker as soon as possible to determine if you must change registration into your own name to participate.
OTHER INFORMATION
Notice is hereby given in accordance with Section 23(c) of the Investment Company Act of 1940 that the fund may purchase, from time to time, shares of its common stock in the open market.
A description of the policies and procedures that the fund uses to determine how to vote proxies relating to portfolio securities is available (i) without charge, upon request, by calling 800-330-7348, (ii) on our Web site at cohenandsteers.com or (iii) on the Securities and Exchange Commission's Web site at http://www.sec.gov. In addition, the fund's proxy voting record for the most recent 12-month period ended June 30 is available (i) without charge, upon request, by calling 800-330-7348 or (ii) on the SEC's Web site at http://www.sec.gov.
The fund files its complete schedule of portfolio holdings with the SEC for the first and third quarters of each fiscal year on Form N-Q. The fund's Forms N-Q are available (i) without charge, upon request by calling 800-330-7348, or (ii) on the SEC's Web site at http://www.sec.gov. In addition, the Forms N-Q may be reviewed and copied at the SEC's Public Reference Room in Washington, DC. Information on the operation of the Public Reference Room may be obtained by calling 800-SEC-0330.
Please note that the distributions paid by the fund to shareholders are subject to recharacterization for tax purposes. The fund may also pay distributions in excess of the fund's net investment company taxable income and this excess would be a tax-free return of capital distributed from the fund's assets. To the extent this occurs, the fund's shareholders of record will be notified of the estimated amount of capital returned to shareholders for each
35
COHEN & STEERS REIT AND UTILITY INCOME FUND, INC.
such distribution and this information will also be available at cohenandsteers.com. The final tax treatment of all distributions is reported to shareholders on their 1099-DIV forms, which are mailed after the close of each calendar year. Distributions of capital decrease the fund's total assets and, therefore, could have the effect of increasing the fund's expense ratio. In addition, in order to make these distributions, the fund may have to sell portfolio securities at a less than opportune time.
36
COHEN & STEERS REIT AND UTILITY INCOME FUND, INC.
Meet the Cohen & Steers family of open-end funds:
COHEN & STEERS
REALTY SHARES
• Designed for investors seeking maximum total return, investing primarily in REITs
• Symbol: CSRSX
COHEN & STEERS
REALTY INCOME FUND
• Designed for investors seeking high current income, investing primarily in REITs
• Symbols: CSEIX, CSBIX, CSCIX, CSDIX
COHEN & STEERS
INTERNATIONAL REALTY FUND
• Designed for investors seeking maximum total return, investing primarily in international real estate securities
• Symbols: IRFAX, IRFCX, IRFIX
COHEN & STEERS
DIVIDEND VALUE FUND
• Designed for investors seeking high current income and long-term growth of income and capital appreciation, investing primarily in dividend paying common stocks and preferred stocks
• Symbols: DVFAX, DVFCX, DVFIX
COHEN & STEERS
INSTITUTIONAL GLOBAL REALTY SHARES
• Designed for investors seeking maximum total return, investing primarily in global real estate securities
• Symbol: GRSIX
COHEN & STEERS
INSTITUTIONAL REALTY SHARES
• Designed for institutional investors seeking maximum total return, investing primarily in REITs
• Symbol: CSRIX
COHEN & STEERS
REALTY FOCUS FUND
• Designed for investors seeking maximum capital appreciation, investing in a limited number of REITs and other real estate securities
• Symbols: CSFAX, CSFBX, CSFCX, CSSPX
COHEN & STEERS
UTILITY FUND
• Designed for investors seeking maximum total return, investing primarily in utilities
• Symbols: CSUAX, CSUBX, CSUCX, CSUIX
COHEN & STEERS
ASIA PACIFIC REALTY SHARES
• Designed for investors seeking maximum total return, investing primarily in real estate securities located in the Asia Pacific region
• Symbols: APFAX, APFCX, APFIX
COHEN & STEERS
EUROPEAN REALTY SHARES
• Designed for investors seeking maximum total return, investing primarily in real estate securities located in Europe
• Symbols: EURAX, EURCX, EURIX
Please consider the investment objectives, risks, charges and expenses of the fund carefully before investing. A prospectus containing this and other information can be obtained by calling 800-330-7348 or by visiting cohenandsteers.com. Please read the prospectus carefully before investing.
Cohen & Steers Securities, LLC, Distributor
37
COHEN & STEERS REIT AND UTILITY INCOME FUND, INC.
OFFICERS AND DIRECTORS
Robert H. Steers
Director and co-chairman
Martin Cohen
Director and co-chairman
Bonnie Cohen
Director
George Grossman
Director
Richard E. Kroon
Director
Richard J. Norman
Director
Frank K. Ross
Director
Willard H. Smith Jr.
Director
C. Edward Ward, Jr.
Director
Adam M. Derechin
President and chief executive officer
Joseph M. Harvey
Vice president
James S. Corl
Vice president
William F. Scapell
Vice president
Robert S. Becker
Vice president
Thomas N. Bohjalian
Vice president
John E. McLean
Secretary
James Giallanza
Treasurer and Chief Financial Officer
Lisa D. Phelan
Chief compliance officer
KEY INFORMATION
Investment Manager
Cohen & Steers Capital Management, Inc.
280 Park Avenue
New York, NY 10017
(212) 832-3232
Fund Subadministrator and Custodian
State Street Bank and Trust Company
One Lincoln Street
Boston, MA 02111
Transfer Agent—Common Shares
The Bank of New York
101 Barclay Street
New York, NY 10286
(800) 432-8224
Transfer Agent—Preferred Shares
The Bank of New York
100 Church Street
New York, NY 10007
Legal Counsel
Stroock & Stroock & Lavan LLP
180 Maiden Lane
New York, NY 10038
New York Stock Exchange Symbol: RTU
Web site: cohenandsteers.com
This report is for shareholder information. This is not a prospectus intended for use in the purchase or sale of fund shares. Past performance is of course no guarantee of future results and your investment may be worth more or less at the time you sell.
38
COHEN & STEERS
REIT AND UTILITY INCOME FUND
280 PARK AVENUE
NEW YORK, NY 10017

SEMIANNUAL REPORT
JUNE 30, 2007
Item 2. Code of Ethics.
Not applicable.
Item 3. Audit Committee Financial Expert.
Not applicable.
Item 4. Principal Accountant Fees and Services.
Not applicable.
Item 5. Audit Committee of Listed Registrants.
Not applicable.
Item 6. Schedule of Investments.
Included in Item 1 above.
Item 7. Disclosure of Proxy Voting Policies and Procedures for Closed-End Management Investment Companies.
Not applicable.
Item 8. Portfolio Managers of Closed-End Management Investment Companies.
Not applicable.
Item 9. Purchases of Equity Securities by Closed-End Management Investment Company and Affiliated Purchasers.
None.
Item 10. Submission of Matters to a Vote of Security Holders.
None.
Item 11. Controls and Procedures.
(a) The registrant’s principal executive officer and principal financial officer have concluded, based upon their evaluation of the registrant’s disclosure controls and procedures as conducted within 90 days of the filing date of this report, that these disclosure controls and procedures provide reasonable assurance that material information required to be disclosed by the registrant in the report it files or submits on Form N-CSR is recorded, processed, summarized and reported within the time periods specified in the Securities and Exchange Commission’s rules and forms
and that such material information is accumulated and communicated to the registrant’s management, including its principal executive officer and principal financial officer, as appropriate, in order to allow timely decisions regarding required disclosure.
(b) There were no changes in the registrant’s internal control over financial reporting that occurred during the second fiscal quarter of the period covered by this report that have materially affected, or are reasonably likely to materially affect, the registrant’s internal control over financial reporting.
Item 12. Exhibits.
(a)(1) Not applicable.
(a) (2) Certifications of principal executive officer and principal financial officer as required by Rule 30a-2(a) under the Investment Company Act of 1940.
(a)(3) Not applicable.
(b) Certifications of principal exe cutive officer and principal financial officer as required by Rule 30a- 2(b) under the Investment Company Act of 1940.
SIGNATURES
Pursuant to the requirements of the Securities Exchange Act of 1934 and the Investment Company Act of 1940, the registrant has duly caused this report to be signed on its behalf by the undersigned, thereunto duly authorized.
COHEN & STEERS REIT AND UTILITY INCOME FUND, INC.
By: | /s/ Adam M. Derechin |
| |
| Name: Adam M. Derechin | ||
| Title: President and Chief Executive Officer | ||
|
| ||
| Date: August 29, 2007 | ||
|
| ||
Pursuant to the requirements of the Securities Exchange Act of 1934 and the Investment Company Act of 1940, this report has been signed below by the following persons on behalf of the registrant and in the capacities and on the dates indicated. | |||
| |||
| |||
By: | /s/ Adam M. Derechin |
| |
| Name: Adam M. Derechin | ||
| Title: President and Chief Executive Officer | ||
| (principal executive officer) | ||
|
| ||
By: | /s/ James Giallanza |
| |
| Name: James Giallanza | ||
| Title: Treasurer | ||
| (principal financial officer) | ||
|
| ||
|
| ||
| Date: August 29, 2007 | ||