UNITED STATES
SECURITIES AND EXCHANGE COMMISSION
Washington, D.C. 20549
FORM N-CSR
CERTIFIED SHAREHOLDER REPORT OF REGISTERED
MANAGEMENT INVESTMENT COMPANIES
| | |
Investment Company Act file number | | 811-21471 |
Nuveen Tax-Advantaged Total Return Strategy Fund
(Exact name of registrant as specified in charter)
Nuveen Investments
333 West Wacker Drive
Chicago, IL 60606
(Address of principal executive offices) (Zip code)
Gifford R. Zimmerman
Nuveen Investments
333 West Wacker Drive
Chicago, IL 60606
(Name and address of agent for service)
Registrant’s telephone number, including area code: (312) 917-7700
Date of fiscal year end: December 31
Date of reporting period: December 31, 2016
Form N-CSR is to be used by management investment companies to file reports with the Commission not later than 10 days after the transmission to stockholders of any report that is required to be transmitted to stockholders under Rule 30e-1 under the Investment Company Act of 1940 (17 CFR 270.30e-1). The Commission may use the information provided on Form N-CSR in its regulatory, disclosure review, inspection, and policymaking roles.
A registrant is required to disclose the information specified by Form N-CSR, and the Commission will make this information public. A registrant is not required to respond to the collection of information contained in Form N-CSR unless the Form displays a currently valid Office of Management and Budget (“OMB”) control number. Please direct comments concerning the accuracy of the information collection burden estimate and any suggestions for reducing the burden to Secretary, Securities and Exchange Commission, 450 Fifth Street, NW, Washington, DC 20549-0609. The OMB has reviewed this collection of information under the clearance requirements of 44 U.S.C. ss. 3507.
ITEM 1. REPORTS TO STOCKHOLDERS.
| | |
| | |  |
| Closed-End Funds | |
| | | | | | |
| | | | | | | Annual Report December 31, 2016 |
| | | |
| | | | | | |
| | | | | | | |
| JTA | | | | | | |
| Nuveen Tax-Advantaged Total Return Strategy Fund | | |
| | | | | | | | | | | | |
| | | | | | |
| | | | |
| | | | | | | | |
| |
| | Life is Complex |
| |
| | Nuveen makes things e-simple. It only takes a minute to sign up for e-Reports. Once enrolled, you’ll receive an e-mail as soon as your Nuveen Fund information is ready – no more waiting for delivery by regular mail. Just click on the link within the e-mail to see the report and save it on your computer if you wish. |
| | |
| | Free e-Reports right to your e-mail! |
| |
| | www.investordelivery.com If you receive your Nuveen Fund distributions and statements from your financial advisor or brokerage account. |
| |
| or | | www.nuveen.com/accountaccess If you receive your Nuveen Fund distributions and statements directly from Nuveen. |
Table
of Contents
Chairman’s Letter
to Shareholders

Dear Shareholders,
The past year saw a striking shift in the markets’ tone. The start of 2016 was beset by China’s economic woes, growing recession fears in the U.S. and oil prices sinking to lows not seen in more than a decade. World stock markets plunged, while bonds and other safe-haven assets rallied. But, by the end of the year, optimism had taken root. Economic outlooks were more upbeat, commodity prices stabilized, equity markets rebounded and bonds retreated. Despite the initial shocks of the Brexit referendum in the U.K. and Donald Trump’s win in the U.S. presidential election, and the uncertainties posed by the implications of these votes, sentiment continued to swing toward the positive as 2016 ended.
In between the year’s turbulent start and exuberant end, markets were soothed by improving economic data out of China, as the government’s stimulus measures appeared to be working, and a recovery in the energy and commodity-related sectors. The U.S. Federal Reserve backed off its more aggressive projections from the beginning of the year, only raising the fed funds rate once during the year, in December. The central banks in Europe and Japan maintained their accommodative stances. Global economic growth remained lackluster overall, as the pace of U.S. growth remained consistently mediocre. China appeared to moderate its slowdown and low growth in Europe and Japan persisted.
Will 2017 be the year of accelerating global growth and rising inflation that the markets are expecting? President Trump’s business-friendly, pro-growth agenda has been well received by the markets, but the policy details and the timeline have yet to take shape. Furthermore, there could be potential downside risks if “Trumponomics” were to trigger a steeper rise in inflation or a trade war. Outside the U.S., political dynamics in Europe are also in flux this year, with Brexit negotiations ongoing and elections in Germany, France and the Netherlands, and possibly a snap election in Italy.
Given the slate of policy unknowns and the range of possible outcomes, we believe volatility will remain a fixture this year. In this environment, Nuveen remains committed to both managing downside risks and seeking upside potential. If you’re concerned about how resilient your investment portfolio might be, we encourage you to talk to your financial advisor. On behalf of the other members of the Nuveen Fund Board, we look forward to continuing to earn your trust in the months and years ahead.
Sincerely,

William J. Schneider
Chairman of the Board
February 23, 2017
Portfolio Managers’
Comments
Nuveen Tax-Advantaged Total Return Strategy Fund (JTA)
The Fund features portfolio management by two affiliates of Nuveen, LLC. The Fund’s investments in dividend-paying common and preferred stocks and call options written are managed by NWQ Investment Management Company, LLC (NWQ), while the Fund’s investments in senior corporate loans and other debt instruments are managed by Symphony Asset Management LLC (Symphony). James T. Stephenson, CFA, Managing Director of NWQ, along with Thomas J. Ray, CFA, and Susi Budiman, CFA, manage the NWQ portion of the Fund. The Symphony team is led by Gunther Stein, who serves as the firm’s Chief Investment Officer and Chief Executive Officer.
On December 21, 2016, a secondary blended benchmark change for the Nuveen Tax Advantaged Total Return Strategy Fund (JTA) was approved. Effective December 31, 2016, the new secondary Blended Benchmark consists of 72% MSCI World Index; 8% BofA/Merrill Lynch DRD (dividends received deduction) Eligible Preferred Securities Index; and 20% Credit Suisse First Boston (CSFB) Leveraged Loan Index
Here the portfolio management team reviews economic and market conditions, their management strategies and the performance of the Fund for the twelve-month reporting period ended December 31, 2016.
What factors affected the U.S. economy and domestic and global markets during the twelve-month reporting period ended December 31, 2016?
The restrained pace of growth that has defined the U.S. economic recovery since 2009 continued in the twelve-month reporting period. In the four calendar quarters of 2016, growth averaged below 2% (annualized), as measured by real gross domestic product (GDP), which is the value of goods and services produced by the nation’s economy less the value of the goods and services used up in production, adjusted for price changes. Weakness was more pronounced in the first half of the reporting period, as GDP growth averaged below 1.5% in the first two quarters. Although a short-term jump in exports contributed to a more robust gain of 3.5% in the third quarter, the drop in exports that followed widened the trade deficit, which dampened economic activity to a 1.9% annualized rate in the last three months of 2016, as reported by the “advance” estimate of the Bureau of Economic Analysis.
Consumers, whose purchases comprise the largest component of the U.S. economy, benefited from employment growth and firming wages over the twelve-month reporting period. As reported by the Bureau of Labor Statistics, the unemployment rate fell to 4.7% in December 2016 from 5.0% in December 2015 and job gains averaged slightly above 200,000 per month for the past twelve months. Consumer spending surged in the second quarter of 2016, then decelerated somewhat in the second half of the reporting period. Moreover, as the cost of gasoline and rents climbed over 2016, inflation ticked higher. The Consumer Price Index (CPI) rose 2.1% over the twelve-month reporting period ended
Certain statements in this report are forward-looking statements. Discussions of specific investments are for illustration only and are not intended as recommendations of individual investments. The forward-looking statements and other views expressed herein are those of the portfolio managers as of the date of this report. Actual future results or occurrences may differ significantly from those anticipated in any forward-looking statements and the views expressed herein are subject to change at any time, due to numerous market and other factors. The Fund disclaims any obligation to update publicly or revise any forward-looking statements or views expressed herein.
For financial reporting purposes, the ratings disclosed are the highest rating given by one of the following national rating agencies: Standard & Poor’s (S&P), Moody’s Investors Service, Inc. (Moody’s) or Fitch, Inc. (Fitch). This treatment of split-rated securities may differ from that used for other purposes, such as for Fund investment policies. Credit ratings are subject to change. AAA, AA, A and BBB are investment grade ratings; BB, B, CCC, CC, C and D are below investment grade ratings. Certain bonds backed by U.S. Government or agency securities are regarded as having an implied rating equal to the rating of such securities. Holdings designated N/R are not rated by these national rating agencies.
Refer to the Glossary of Terms Used in this Report for further definition of the terms used within this section.
Portfolio Managers’ Comments (continued)
December 2016 on a seasonally adjusted basis, as reported by the U.S. Bureau of Labor Statistics. The core CPI (which excludes food and energy) increased 2.2% during the same period, slightly above the Federal Reserve’s (Fed) unofficial longer term inflation objective of 2.0%.
The housing market was another bright spot in the economy. The S&P CoreLogic Case-Shiller U.S. National Home Price Index, which covers all nine U.S. census divisions, recorded a 5.6% annual gain in November 2016 (most recent data available at the time this report was prepared) (effective July 26, 2016, the S&P/Case-Shiller U.S. National Home Price Index was renamed the S&P CoreLogic Case-Shiller U.S. National Home Price Index). The 10-City and 20-City Composites reported year-over-year increases of 4.5% and 5.3%, respectively.
Business spending weakened in the first half of 2016 but modestly improved over the remainder of the year. Early in the reporting period, the energy sector’s slump, financial market turbulence and a murky outlook on U.S. and global growth weighed on business sentiment and dampened spending. However, business confidence improved in the second half of the year, as oil prices stabilized, recession fears diminished and the election of Donald Trump stoked expectations for new pro-growth fiscal policy.
Other market-moving events during the reporting period included a spike in volatility in January and February 2016 triggered by deteriorating sentiment about China’s economy, another sharp downturn in oil prices and concerns about central bank policy both in the U.S. and around the world. The Brexit referendum in June 2016 also caught investors off guard. In response, U.K. sterling fell to 30-year lows and global equities tumbled while perceived safe-haven assets such as gold, the U.S. dollar and government bonds saw large inflows. However, the markets stabilized fairly quickly post-Brexit vote, buoyed by reassurances from global central banks and a perception that the temporary price rout presented an attractive buying opportunity. Following a relatively calm July and August 2016, volatility resumed in the final months of the reporting period. Investors worried whether central banks were reaching the limits of their effectiveness as global growth continues to stagnate. The health of the European banking sector came into question, renewing concerns about the potential to trigger a wider crisis. Political uncertainty increased leading up to the November U.S. presidential election, and Trump’s unexpected win contributed to an initial sell-off across global markets. However, after digesting the “shock,” U.S. equities rallied strongly and global developed market stocks pared their losses, while emerging markets, fixed income and gold remained lower through the end of the reporting period.
Stocks moved sharply higher immediately following the U.S. elections on expectations the incoming Trump administration will focus on domestic policies that will benefit business and the economy. This was in sharp contrast to consensus thought that a Trump win would lead to an immediate panic sell-off in the markets. (Dow futures initially sold off 800 points when it emerged that had he won the election). The Russell 1000® Value Index appreciated 7.1% in the thirty-six trading days after the November election, bringing its total return to 17.3%. A major catalyst for the rally was speculation that President-elect Trump will bring about tax reform, broad deregulation and boost fiscal spending (infrastructure) that will spur higher economic growth. This resulted in a major leadership change in the market as investors purchased banks and industrials and moved away from stable, dividend paying stocks including real estate investment trusts (REITs), utilities, pharmaceuticals and consumer staples. The Russell value indexes outperformed growth for the reporting period, while small caps significantly surpassed their large and midcap counterparts as smaller companies are generally more levered to the domestic economy and more likely to benefit from potential tax relief given higher effective rates.
Overseas, the Japanese market was strong with the Nikkei 225 Index surging 16.2% higher for the fourth quarter, driven partially by a decline in the yen and an increase in interest rates. The index was up a mere 0.4% for the full reporting period, however. The outlook for Japan looks more promising than it has been in several years as the yen has weakened, economic conditions at home and abroad are improving and corporate profits are beginning to accelerate. Europe’s economy is also gaining ground, although political risks remain on the horizon with elections in France, Italy, Germany and the Netherlands taking place in 2017. Economic growth could be hurt if there is greater power going to populist parties (U.K effect), and France and the Netherlands may vote to exit the European Union.
The investment grade corporate bond market (as measured by the BofA/Merrill Lynch U.S. Corporate Index) returned 5.96% for the reporting period 2016, although the fourth quarter was the worst quarterly return since the second quarter of 2013, driven by the increase in Treasury rates. High Yield bonds (as measured by the BofA/Merrill Lynch U.S. High Yield Index) finished the reporting period up 17.49%. By ratings, CCC rated securities was the best performer, returning 36.46%. Single B rated securities were the next best performer, returning 16.94%. BB’s underperformed for the reporting period, returning 13.22% respectively. Total new issue activity for the year was $286 billion, slightly lower versus the previous year’s total of $293 billion as the high yield primary market faced a more volatile backdrop. The BofA/Merrill Lynch Fixed Rate Preferred Securities Index returned 2.32% for the reporting period. Recapping 2016, the preferred market experienced a dramatic sell off in February 2016 triggered by several factors: oil touching $26 a barrel triggering recession concerns, worries about Deutsche Bank being unable to make interest payments on its hybrid securities, volatility spiking and Treasury yields moving lower. The market quickly recovered with preferreds catching a bid from large inflows into preferred exchange traded funds (ETFs) and demand from overseas and retail accounts. The rally tapered off in September 2016, as yields on preferreds became historically low and unattractive to institutional buyers. November’s election result was the next catalyst to push preferreds prices lower. Like other incoming producing assets including REITs and high dividend yield stocks, preferreds sold off with Treasury yields as markets reacted to the election of Donald Trump.
The loan market finished a strong year in which the asset class was positive for nine of the twelve months. The market was boosted by increased demand as the reality of rising rates was more evident and the London Interbank Offered Rate (LIBOR) returned to a level where much of the asset class was once again floating as floors were broadly crested. While technicals were certainly supportive to the asset class late in the reporting period, the outlook for loans remains constructive with default rates anticipated to remain benign, and fundamentals continuing to be supportive. The broad leveraged loan market, as represented by the Credit Suisse Leveraged Loan Index, produced returns of 9.86% for the reporting period. Loan mutual funds reported an inflow of $10.5 billion during the fourth quarter to finish the reporting period net positive $6.9 billion. Collateralized loan obligation (CLO) issuance totaled $57.8 billion for the quarter and $111.8 billion for 2016. Fourth quarter new issuance was $194.1 billion, driven by refinancing and repricing related activity, bringing the total to $485.4 billion, the largest annual total since 2013. The par-weighted U.S. default rate decreased to 1.49% in December, and remains below the long-term average default rate.
What key strategies were used to manage the Fund during this twelve-month reporting period ended December 31, 2016?
The Fund is designed to seek a high level of after-tax total return consisting primarily of tax-advantaged dividend income and capital appreciation. In an effort to achieve this, the Fund invests at least 60% in common stocks whose dividends may be eligible for favorable income tax treatment. The Fund also invests to a more limited extent in preferred stocks, which can range from a minimum of 5% to a maximum of 20%, that are eligible to pay tax-advantaged dividends, as well as 20% in senior loans and other debt instruments.
NWQ Key Strategies
For the common and preferred equity portion of the Fund’s portfolio, NWQ continued to employ an opportunistic, bottom-up strategy that focused on identifying undervalued companies possessing favorable risk/reward characteristics as well as what it thought were emerging catalysts that could unlock value or improve profitability. These catalysts included management changes, restructuring efforts, recognition of hidden assets and/or a positive change in the underlying fundamentals. We also focused on downside risk management and paid a great deal of attention to a company’s balance sheet and cash flow statement, not just the income statement. NWQ believes that cash flow analysis offers a more objective picture of a company’s financial position than an evaluation based on earnings alone.
Portfolio Managers’ Comments (continued)
Within the global equity income strategy managed by NWQ, up to 70% of the Fund’s managed assets can be invested in non-U.S. issues of any currency, including up to 20% in emerging market countries. JTA’s investment objective is to achieve a high level of after-tax total return, consisting primarily of tax-advantaged dividend income and capital appreciation. The Fund focuses on obtaining a dividend yield at least 100 basis points (bps) above the MSCI World Index and employs a value based approach in our bottom up analysis. NWQ looks for attractive absolute valuation, positive risk/reward with downside risk management and catalysts that can drive a positive revaluation of companies.
For the global equity portion of the Fund’s portfolio, NWQ’s global, value based strategy gives them plenty of opportunities to find not only attractive valuations, but high yields and a diversified portfolio. The Fund currently is overweight European equities. NWQ also believes the market underestimates the inherent operating leverage in many European companies due to the length of time they have had to rationalize their cost structures. All that is needed is some slightly positive growth to see meaningful advances in earnings. Global financials also remain a target rich opportunity. NWQ focuses on companies with strong balance sheets on the cusp of returning significant amounts of cash to shareholders.
While economic concerns and persistently stubborn low interest rates have weighed on the names, NWQ feels the risk/reward is heavily skewed to the upside. Balance sheets are improved, riskier businesses have been exited and valuations remain low. NWQ has found a variety of compelling opportunities across banks, insurance and services in numerous geographies. For the preferred securities portion of the Fund’s portfolio, NWQ reviews the specific characteristics of the preferred stocks available for investment and evaluate the effect on holding such an investment. These characteristics might include price, yield, issuer, rating, liquidity premium/discount and any other potential issues that can affect the value of the position. Additionally, because the preferred market is concentrated both by issuer and industry, attention is focused on the diversification of the Fund.
Symphony Key Strategies
In the senior loan and other debt portion of the Fund’s portfolio, Symphony continued to manage and monitor senior loan market risks. The overall macroeconomic backdrop during the reporting period remained supportive of the leveraged loan asset class. The Fund’s capital remained invested in issuers with strong credit profiles among non-investment grade debt, while offering attractive current income and yield. Fundamentally, Symphony feels that many of these companies have stable businesses, good asset coverage for senior debt holders and could perform well in a stable to slow growth environment.
How did the Fund perform during this twelve-month reporting period ended December 31, 2016?
The table in the Performance Overview and Holding Summaries section of this report provides total returns for the one-year, five-year and ten-year periods ended December 31, 2016. The Fund’s total returns at net asset value (NAV) are compared with the performance of a corresponding market index. For the twelve-month reporting period ended December 31, 2016, the Fund’s common share at NAV underperformed the S&P 500® Index and both its new and old secondary Blended Benchmarks.
NWQ
The equity portion of the Fund’s portfolio, managed by NWQ, contributed most to the Fund’s underperformance versus its blended benchmark given weakness in its health care and consumer staples sector holdings. Positive stock selection in producer durables and financial services sector contributed to performance. Geographically, the Fund’s investments in the United States, Brazil and Belgium helped performance, while investments in the U.K., Israel and France detracted. NWQ’s global, value based strategy provided opportunities to find not only attractive valuations, but high yields and a diversified portfolio.
Individual holdings that positively contributed to performance included financial services sector holding Unum Group. The company provides disability insurance products in the U.S. and the U.K. The accident and health insurer’s two largest operating segments, Unum U.S. and Colonial Life, reported increased operating income and better than expected
third quarter results, despite some weakness in its U.K. segment. Time Warner Inc. contributed positively to performance during the reporting period as the company agreed to a takeover offer from AT&T. It had long been part of our thesis that Time Warner Inc., the only major media company with a single class shareholder structure, and irreplaceable assets such as HBO and Warner Bros. would be an important part of a consolidating media landscape. While the spread to the deal price remains wide, NWQ believes continued improving fundamentals at Time Warner and its positive positioning to any change in domestic tax policy limits downside should a deal not go through. Lastly, Latin American airliner, Copa Holdings SA, rebounded strongly in 2016 as both Latin American economies and their underlying currencies strengthened significantly in the second half of the year. NWQ believed that excluding Venezuela, normal system operating margins for Copa were in the 17% range. After bottoming at mid-single digit margins in the second quarter of 2016, the company capped off 2016 with an operating margin guide of 15-17% for 2017, to which the stock reacted positively.
Positions that detracted from performance include health care holdings Teva Pharmaceutical Industries Limited. Teva encountered several negative catalysts during the reporting period, including the delayed acquisition of Allergan’s generics business, the likely loss of Copaxone patent exclusivity in 2017, an investigation into generic pricing and greater than expected price declines in its generics business. French utility holding Veolia Environment S.A. detracted from performance as third quarter earnings came in below expectations. Revenues contracted slightly versus expectations of an expansion as lower power prices and currency headwinds muted growth. Going forward NWQ believes the market will focus more on free cash flow, which is only marginally impacted by these factors. Lastly, Aviva PLC detracted from performance. Aviva is a British multi-national insurance company headquartered in London. During the reporting period, the company came under pressure from fears of the impact of Brexit.
The Fund’s preferred stock holdings positively contributed to performance. Several holdings positively contributed including the preferred stock holdings of SLM Corporation, Cobank Agricultural Credit Bank and HSBC Holdings PLC. The preferred stock of SLM Corporation which engages in the origination, servicing and administration of educational loans, continued to rebound during the reporting period. Cobank preferred stock was positively impacted by approved bylaws amendments and preferred stock revolver which increased the cap from $1.5 billion to $2.5 billion and provide shareholder authorization for the bank to issue preferred stock on an as needed basis up to the new limit through December 31, 2026. Lastly, the preferred stock of HSBC also positively contributed to performance. HSBC’s capital ratio rose to well above the average of the European bank sector, giving support to their preferreds.
Specific holdings that detracted were the preferred stock holdings of Charles Schwab Corporation, Bank of America Corporation and JPMorgan Chase & Company. The preferred market began the reporting period with large inflows into preferred ETFs and demand from overseas and retail accounts. However, the rally tapered off in September 2016 as yields on preferreds became historically low and unattractive to institutional buyers. In fact, the indiscriminate buying by preferred ETFs drove a significant portion of the preferred market to trade at negative yield-to-calls. The historically low, and in several cases negative yields, left little support for preferreds prices once the ETF inflows slowed down. November’s election result was the next catalyst to push preferreds prices lower. Like other incoming producing assets including REITs and high dividend yield stocks, preferreds sold off with Treasury yields as markets reacted to the election of Donald Trump. These factors contributed to these positions selling off during the reporting period.
The Fund also writes call options on individual stocks, while investing in these same stocks, to enhance returns while foregoing some upside potential. The effect on performance for the reporting period was negligible.
Symphony
The senior loan and other debt instruments portion of the Fund’s portfolio, managed by Symphony, contributed positively to total return performance during the reporting period. All our sectors positively contributed to performance, in particular the consumer discretionary and information technology sectors.
Portfolio Managers’ Comments (continued)
The Fund’s position in the term loans of energy sector holding Fieldwood Energy LLC contributed to performance. The loans performed well during the reporting period after the oil exploration and energy company launched a multi-pronged transaction that would provide it with two years of reprieve from the borrowing base redetermination process. Also positively contributing were the loans of information technology holding BMC Software, Inc. The loans contributed nicely to returns as the market’s increased confidence in the company’s ability to deliver positive earnings and draw increased revenue from recent new products helped boost prices during the reporting period. Additionally, performance was benefited by the loan of Communications Sales & Leasing Inc., a REIT that is engaged in the acquisition and construction of mission critical communications infrastructure and is a leading provider of wireless infrastructure solutions for the communications industry. The telecommunications firm performed well as the company announced their first planned acquisition and noted a robust merger and acquisition (M&A) pipeline, which was well received by the market.
Those specific loans that detracted from performance included positions in health care sector holding Millennium Laboratories, Inc. a health care service company. Also detracting from performance was our consumer discretionary holding, Cumulus Media, Inc., a large broadcasting company. The company’s desire to enter into a deleveraging transaction with debt holders that would be advantageous to the firm long term, but was viewed as disadvantageous to current holders was frowned upon by market participants late in the reporting period and the loans experienced weakness. Lastly, energy sector holding Southcross Holdings Borrower LP loans detracted. Southcross Energy Partners, L.P. is a master limited partnership that provides natural gas gathering and processing services company. It also sources, purchases, transports and sells natural gas. Southcross implemented several key initiatives during the third quarter that are expected to reduce operating expenses and lower future capital expenditure requirements. These initiatives include the planned shut-down and sale of two of its processing facilities and the reconfiguration of assets at the Lone Star processing facility. Despite these efforts, the loans sold off during the reporting period.
Fund
Leverage
IMPACT OF THE FUND’S LEVERAGE STRATEGY ON PERFORMANCE
One important factor impacting the return of the Fund relative to its comparative benchmarks was the Fund’s use of leverage through the use of bank borrowings. The Fund uses leverage because our research has shown that, over time, leveraging provides opportunities for additional income and total return for common shareholders. However, use of leverage also can expose common shareholders to additional volatility. For example, as the prices of securities held by the Fund decline, the negative impact of these valuation changes on common share NAV and common shareholder total return is magnified by the use of leverage. Conversely, leverage may enhance common share returns during periods when the prices of securities held by the Fund generally are rising. The Fund’s use of leverage had a negative impact on performance during this reporting period.
The Fund continued to utilize forward starting interest rate swap contracts to partially hedge its future interest cost of leverage, which as mentioned previously, is through the use of bank borrowings. The swap contracts had a negative impact on performance during this reporting period.
As of December 31, 2016, the Fund’s percentages of leverage are as shown in the accompanying table.
| | | | |
| | | JTA | |
Effective Leverage* | | | 30.37 | % |
Regulatory Leverage* | | | 30.37 | % |
| * | Effective leverage is the Fund’s effective economic leverage, and includes both regulatory leverage and the leverage effects of certain derivative and other investments in a Fund’s portfolio that increase the Fund’s investment exposure. Regulatory leverage consists of preferred shares issued or borrowings of the Fund. The Fund, however, may from time to time borrow on a typically transient basis in connection with its day-to-day operations, primarily In connection with the need to settle portfolio trades. Such incidental borrowings are excluded from the calculation of the Fund’s effective leverage ratio. Both of these are part of the Fund’s capital structure. Regulatory leverage is subject to asset coverage limits set forth in the Investment Company Act of 1940. |
THE FUND’S REGULATORY LEVERAGE
Bank Borrowings
As noted above, the Fund employs leverage through the use of bank borrowings. The Fund’s bank borrowing activities are as shown in the accompanying table.
| | | | | | | | | | | | | | | | | | | | | | | | | | | | | | | | | | |
| Current Reporting Period | | | | | | Subsequent to the Close of
the Reporting Period | |
| January 1, 2016 | | | Draws | | | Paydowns | | | December 31, 2016 | | | Average Balance
Outstanding | | | | | | Draws | | | Paydowns | | | February 28, 2017 | |
| | $82,400,000 | | | | $400,000 | | | | $(6,000,000) | | | | $76,800,000 | | | | $76,889,344 | | | | | | | | $ — | | | | $ — | | | | $76,800,000 | |
Refer to Notes to Financial Statements, Note 9 – Borrowing Arrangements for further details.
Common Share
Information
DISTRIBUTION INFORMATION
The following information regarding the Fund’s distributions is current as of December 31, 2016, the Fund’s fiscal and tax year end, and may differ from previously issued distribution notifications. The Fund’s distribution levels may vary over time based on the Fund’s investment activities and portfolio investment value changes.
The Fund has adopted a managed distribution program. The goal of the Fund’s managed distribution program is to provide shareholders relatively consistent and predictable cash flow by systematically converting its expected long-term return potential into regular distributions. As a result, regular distributions throughout the year will likely include a portion of expected long-term and/or short-term gains (both realized and unrealized), along with net investment income.
Important points to understand about Nuveen fund managed distributions are:
| • | | The Fund seeks to establish a relatively stable common share distribution rate that roughly corresponds to the projected total return from its investment strategy over an extended period of time. However, you should not draw any conclusions about the Fund’s past or future investment performance from its current distribution rate. |
| • | | Actual common share returns will differ from projected long-term returns (and therefore the Fund’s distribution rate), at least over shorter time periods. Over a specific timeframe, the difference between actual returns and total distributions will be reflected in an increasing (returns exceed distributions) or a decreasing (distributions exceed returns) Fund net asset value. |
| • | | Each period’s distributions are expected to be paid from some or all of the following sources: |
| | • | | net investment income consisting of regular interest and dividends, |
| | • | | net realized gains from portfolio investments, and |
| | • | | unrealized gains, or, in certain cases, a return of principal (non-taxable distributions). |
| • | | A non-taxable distribution is a payment of a portion of the Fund’s capital. When the Fund’s returns exceed distributions, it may represent portfolio gains generated, but not realized as a taxable capital gain. In periods when the Fund’s returns fall short of distributions, it will represent a portion of your original principal unless the shortfall is offset during other time periods over the life of your investment (previous or subsequent) when the Fund’s total return exceeds distributions. |
| • | | Because distribution source estimates are updated throughout the current fiscal year based on the Fund’s performance, these estimates may differ from both the tax information reported to you in the Fund’s 1099 statement, as well as the ultimate economic sources of distributions over the life of your investment. |
The following table provides information regarding the Fund’s distributions and total return performance over various time periods. This information is intended to help you better understand whether the Fund’s returns for the specified time periods were sufficient to meet its distributions.
Data as of December 31, 2016
| | | | | | | | | | | | | | | | | | | | | | | | | | | | | | | | | | | | |
| | | Per Share
Regular Distribution | | | | | | | | | | | | | | | | | | Annualized Total
Return on NAV | |
Inception
Date | | Latest
Quarter | | | Total
Current
Year | | | Total
Current Year
Investment
Income | | | Total
Current Year
Net
Realized
Gain/Loss | | | Current
Unrealized
Gain/Loss | | | Current
Distribution
Rate on
NAV2,3 | | | Actual
Full Year
Distribution
Rate on
NAV2,3 | | | 1-Year | | | 5-Year | |
1/2004 | | | $0.2480 | | | | $1.0120 | | | | $0.4663 | | | | $0.1737 | | | | $1.1577 | | | | 7.80% | | | | 7.96% | | | | 5.10% | | | | 10.92% | |
| 1 | Current distribution per share, annualized, divided by the NAV per share on the stated date. |
| 2 | Actual total per share distributions made during the full fiscal year, divided by the NAV per share on the stated date. |
| 3 | Each distribution rate represent a “managed distribution” rate. For this fund, at least in the just completed fiscal year, distributions were predominately comprised of sources other than net investment income, as shown in the table immediately below. |
The following table provides of the Fund’s distribution sources, as of December 31, 2016.
The amounts and sources of distributions reported in this notice are for financial reporting purposes and are not being provided for tax reporting purposes. The actual amounts and character of the distributions for tax reporting purposes will be reported to shareholders on Form 1099-DIV which will be sent to shareholders shortly after calendar year-end. More details about the Fund’s distributions and the basis for these estimates are available on www.nuveen.com/cef.
Data as of December 31, 2016
| | | | | | | | | | | | | | | | | | | | | | | | | | |
| Fiscal Year | | | Fiscal Year | |
| Source of Distribution | | | Per Share Amounts | |
Net
Investment
Income | | | Realized
Gains | | | Return of
Capital1 | | | Distributions | | | Net
Investment
Income | | | Realized
Gains | | | Return of
Capital1 | |
| | 64.55% | | | | 0.00% | | | | 35.45% | | | | $1.0120 | | | | $0.6533 | | | | $0.0000 | | | | $0.3587 | |
| 1 | Return of Capital and may represent unrealized gains, return of shareholder’s principal, or both. In certain circumstances, all or a portion of the return of capital may be characterized as ordinary income under federal tax law. The acutal tax characterization will be provided to shareholders on Form 1099-DIV shortly after claendar year-end. |
COMMON SHARE REPURCHASES
During August 2016, the Fund’s Board of Trustees reauthorized an open-market share repurchase program, allowing the Fund to repurchase an aggregate of up to approximately 10% of its outstanding shares.
As of December 31, 2016, and since the inception of the Fund’s repurchase program, the Fund has cumulatively repurchased and retired its outstanding common shares as shown in the accompanying table.
| | | | |
| | | JTA | |
Common shares cumulatively repurchased and retired | | | 122,745 | |
Common shares authorized for repurchase | | | 1,385,000 | |
During the current reporting period, the Fund did not repurchase any of its outstanding common shares.
OTHER COMMON SHARE INFORMATION
As of December 31, 2016, and during the current reporting period, the Fund’s common share price was trading at a premium/(discount) to its common share NAV as shown in the accompanying table.
| | | | |
| | | JTA | |
Common share NAV | | | $12.72 | |
Common share price | | | $11.32 | |
Premium/(Discount) to NAV | | | (11.01 | )% |
12-month average premium/(discount) to NAV | | | (10.22 | )% |
Risk
Considerations
Fund shares are not guaranteed or endorsed by any bank or other insured depository institution, and are not federally insured by the Federal Deposit Insurance Corporation.
Nuveen Tax-Advantaged Total Return Strategy (JTA)
Investing in closed-end funds involves risk; principal loss is possible. There is no guarantee the Fund’s investment objectives will be achieved. Closed-end fund shares may frequently trade at a discount or premium to their net asset value. Common stock returns often have experienced significant volatility. Adjustable Rate Senior Loans may not be fully secured by collateral, generally do not trade on exchanges, and are typically issued by unrated or below-investment grade companies, and therefore are subject to greater liquidity and credit risk. Lower credit debt securities may be more likely to fail to make timely interest or principal payments. Leverage increases return volatility and magnifies the Fund’s potential return and its risks; there is no guarantee a fund’s leverage strategy will be successful. For these and other risks, including tax risk, please see the Fund’s web page at www.nuveen.com/JTA.
THIS PAGE INTENTIONALLY LEFT BLANK
JTA
Nuveen Tax-Advantaged Total Return Strategy Fund
Performance Overview and Holding Summaries as of December 31, 2016
Refer to the Glossary of Terms Used in this Report for further definition of the terms used within this section.
Average Annual Total Returns as of December 31, 2016
| | | | | | | | | | | | |
| | | Average Annual | |
| | | 1-Year | | | 5-Year | | | 10-Year | |
| JTA at Common Share NAV | | | 5.10% | | | | 10.92% | | | | 0.94% | |
| JTA at Common Share Price | | | 5.85% | | | | 12.09% | | | | 0.07% | |
| Blended Benchmark (new) | | | 7.84% | | | | 10.34% | | | | 4.57% | |
| Blended Benchmark (old) | | | 12.81% | | | | 11.08% | | | | 4.91% | |
| S&P 500® Index | | | 11.96% | | | | 14.66% | | | | 6.95% | |
Average Annual Total Returns as of December 31, 20161
(including retained gain tax credit/refund)
| | | | | | | | | | | | |
| | | Average Annual | |
| | | 1-Year | | | 5-Year | | | 10-Year | |
| JTA at Common Share NAV | | | 5.10% | | | | 10.92% | | | | 1.01% | |
| JTA at Common Share Price | | | 5.85% | | | | 12.09% | | | | 0.15% | |
Past performance is not predictive of future results. Current performance may be higher or lower than the data shown. Returns do not reflect the deduction of taxes that shareholders may have to pay on Fund distributions or upon the sale of Fund shares. Returns at NAV are net of Fund expenses, and assume reinvestment of distributions. Comparative index return information is provided for the Fund’s shares at NAV only. Indexes are not available for direct investment.
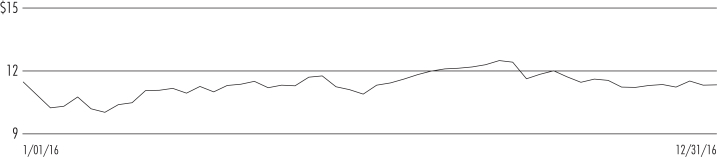
Common Share Price Performance — Weekly Closing Price
| 1 | The Fund elected to retain a portion of its realized long-term capital gains for the tax year ended December 31, 2007 and pay required federal corporate income taxes on these amounts. These standardized total returns include the economic benefit to common shareholders of record of this tax credit/refund. The Fund had no retained capital gains for the tax years ended December 31, 2008 through December 31, 2016. |
This data relates to the securities held in the Fund’s portfolio of investments as of the end of the reporting period. It should not be construed as a measure of performance for the Fund itself. Holdings are subject to change.
For financial reporting purposes, the ratings disclosed are the highest rating given by one of the following national rating agencies: Standard & Poor’s Group, Moody’s Investors Service, Inc. or Fitch, Inc. This treatment of split-rated securities may differ from that used for other purposes, such as for Fund investment policies. Credit ratings are subject to change. AAA, AA, A and BBB are investment grade ratings; BB, B, CCC, CC, C and D are below-investment grade ratings. Certain bonds backed by U.S. Government or agency securities are regarded as having an implied rating equal to the rating of such securities. Holdings designated N/R are not rated by these national rating agencies.
Fund Allocation
(% of net assets)
| | | | |
| Common Stocks | | | 92.6% | |
| Convertible Preferred Securities | | | 6.6% | |
| $25 Par (or similar) Retail Preferred | | | 7.6% | |
| Variable Rate Senior Loan Interests | | | 27.5% | |
| Corporate Bonds | | | 0.7% | |
| $1,000 Par (or similar) Institutional Preferred | | | 7.2% | |
Repurchase Agreements | | | 1.2% | |
| Other Assets Less Liabilities | | | 0.2% | |
Net Assets Plus Borrowings | | | 143.6% | |
| Borrowings | | | (43.6)% | |
Net Assets | | | 100% | |
Portfolio Credit Quality
(% of total fixed-income investments)
| | | | |
| A | | | 1.6% | |
| BBB | | | 25.2% | |
| BB or Lower | | | 56.3% | |
| N/R (not rated) | | | 16.9% | |
Total | | | 100% | |
Portfolio Composition
(% of total investments)2
| | | | |
| Banks | | | 13.0% | |
| Insurance | | | 9.0% | |
| Pharmaceuticals | | | 7.6% | |
| Media | | | 7.1% | |
| Software | | | 5.6% | |
| Capital Markets | | | 4.9% | |
| Diversified Telecommunication Services | | | 4.8% | |
| Food Products | | | 3.2% | |
| Industrial Conglomerates | | | 3.1% | |
| Chemicals | | | 2.8% | |
| Air Freight & Logistics | | | 2.7% | |
| Electric Utilities | | | 2.2% | |
| Multi-Utilities | | | 2.1% | |
| Oil, Gas & Consumable Fuels | | | 2.1% | |
| Food & Staples Retailing | | | 1.9% | |
| Tobacco | | | 1.9% | |
| Automobiles | | | 1.8% | |
| Communications Equipment | | | 1.8% | |
| Semiconductors & Semiconductor Equipment | | | 1.8% | |
| Other | | | 19.8% | |
| Repurchase Agreements | | | 0.8% | |
Total | | | 100% | |
Top Five Issuers
(% of total investments)2
| | | | |
| Oracle Corporation | | | 2.6% | |
GlaxoSmithKline PLC | | | 2.5% | |
Nippon Telegraph and Telephone Corporation | | | 2.4% | |
Teva Pharmaceutical Industries Limited | | | 2.3% | |
Unum Group | | | 2.3% | |
Country Allocation3
(% of total investments)2
| | | | |
| United States | | | 59.6% | |
| Germany | | | 8.6% | |
| United Kingdom | | | 7.4% | |
| Switzerland | | | 4.4% | |
| Netherlands | | | 3.3% | |
| Japan | | | 3.3% | |
| Other | | | 13.4% | |
Total | | | 100% | |
| 2 | Excluding investments in derivatives. |
| 3 | Includes 0.7% (as a percentage of total investments) in emerging market countries. |
Report of
Independent Registered Public Accounting Firm
To the Board of Trustees and Shareholders of
Nuveen Tax-Advantaged Total Return Strategy Fund:
We have audited the accompanying statement of assets and liabilities, including the portfolio of investments, of Nuveen Tax-Advantaged Total Return Strategy Fund (the “Fund”) as of December 31, 2016, and the related statement of operations for the year then ended, the statements of changes in net assets for each of the years in the two-year period then ended, the statement of cash flows for the year then ended, and the financial highlights for each of the years in the three-year period then ended. These financial statements and financial highlights are the responsibility of the Fund’s management. Our responsibility is to express an opinion on these financial statements and financial highlights based on our audits. The financial highlights for the periods presented through December 31, 2013 were audited by other auditors whose report dated February 27, 2014 expressed an unqualified opinion on those financial highlights.
We conducted our audits in accordance with the standards of the Public Company Accounting Oversight Board (United States). Those standards require that we plan and perform the audit to obtain reasonable assurance about whether the financial statements and financial highlights are free of material misstatement. An audit includes examining, on a test basis, evidence supporting the amounts and disclosures in the financial statements. Our procedures included confirmation of securities owned as of December 31, 2016, by correspondence with the custodian and brokers or other appropriate auditing procedures. An audit also includes assessing the accounting principles used and significant estimates made by management, as well as evaluating the overall financial statement presentation. We believe that our audits provide a reasonable basis for our opinion.
In our opinion, the financial statements and financial highlights referred to above present fairly, in all material respects, the financial position of the Fund as of December 31, 2016, the results of its operations for the year then ended, the changes in its net assets for each of the years in the two-year period then ended, its cash flows for the year then ended, and the financial highlights for each of the years in the three-year period then ended, in conformity with U.S. generally accepted accounting principles.
/s/ KPMG LLP
Chicago, Illinois
February 28, 2017
JTA
| | |
Nuveen Tax-Advantaged Total Return Strategy Fund | | |
Portfolio of Investments | | December 31, 2016 |
| | | | | | | | | | | | | | | | | | | | |
| Shares | | | Description (1) | | | | | | | | | | | Value | |
| | | | | |
| | | | LONG-TERM INVESTMENTS – 142.2% (99.2% of Total Investments) | | | | | | | | | | | | | | | | |
| | | | | |
| | | | COMMON STOCKS – 92.6% (64.4% of Total Investments) | | | | | | | | | | | | | | | | |
| | | | | |
| | | | Air Freight & Logistics – 3.9% | | | | | | | | | | | | |
| | | | | |
| | 152,200 | | | Deutsche Post AG, (2) | | | | | | | | | | | | | | $ | 4,991,404 | |
| | 15,800 | | | United Parcel Service, Inc., Class B, (3), (4) | | | | | | | | | | | | | | | 1,811,312 | |
| | | | Total Air Freight & Logistics | | | | | | | | | | | | | | | 6,802,716 | |
| | | | | |
| | | | Automobiles – 1.6% | | | | | | | | | | | | |
| | | | | |
| | 37,200 | | | Daimler AG, (2) | | | | | | | | | | | | | | | 2,765,820 | |
| | | | | |
| | | | Banks – 10.4% | | | | | | | | | | | | |
| | | | | |
| | 8,325,000 | | | Bank of Ireland, (2), (5) | | | | | | | | | | | | | | | 2,053,192 | |
| | 67,500 | | | CIT Group Inc., (3) | | | | | | | | | | | | | | | 2,880,900 | |
| | 90,500 | | | Citigroup Inc., (3) | | | | | | | | | | | | | | | 5,378,415 | |
| | 316,000 | | | ING Groep N.V, (3) | | | | | | | | | | | | | | | 4,455,600 | |
| | 40,100 | | | JPMorgan Chase & Co. | | | | | | | | | | | | | | | 3,460,229 | |
| | | | Total Banks | | | | | | | | | | | | | | | 18,228,336 | |
| | | | | |
| | | | Capital Markets – 5.7% | | | | | | | | | | | | |
| | | | | |
| | 167,500 | | | Ares Capital Corporation | | | | | | | | | | | | | | | 2,762,075 | |
| | 514,000 | | | Deutsche Boerse AG, (2) | | | | | | | | | | | | | | | 4,084,758 | |
| | 203,000 | | | UBS Group AG, (2) | | | | | | | | | | | | | | | 3,173,996 | |
| | | | Total Capital Markets | | | | | | | | | | | | | | | 10,020,829 | |
| | | | | |
| | | | Chemicals – 3.1% | | | | | | | | | | | | |
| | | | | |
| | 273,500 | | | CVR Partners LP | | | | | | | | | | | | | | | 1,643,735 | |
| | 67,000 | | | Dow Chemical Company | | | | | | | | | | | | | | | 3,833,740 | |
| | | | Total Chemicals | | | | | | | | | | | | | | | 5,477,475 | |
| | | | | |
| | | | Communications Equipment – 2.5% | | | | | | | | | | | | |
| | | | | |
| | 84,600 | | | Cisco Systems, Inc. | | | | | | | | | | | | | | | 2,556,612 | |
| | 316,000 | | | Ericsson, (3) | | | | | | | | | | | | | | | 1,842,280 | |
| | | | Total Communications Equipment | | | | | | | | | | | | | | | 4,398,892 | |
| | | | | |
| | | | Diversified Financial Services – 1.4% | | | | | | | | | | | | |
| | | | | |
| | 299,000 | | | Challenger Limited, (2) | | | | | | | | | | | | | | | 2,415,892 | |
| | | | | |
| | | | Diversified Telecommunication Services – 4.7% | | | | | | | | | | | | |
| | | | | |
| | 141,500 | | | Nippon Telegraph and Telephone Corporation, ADR, (3) | | | | | | | | | | | | | | | 5,952,905 | |
| | 173,400 | | | Telefonica Brasil SA, (2) | | | | | | | | | | | | | | | 2,343,204 | |
| | | | Total Diversified Telecommunication Services | | | | | | | | | | | | | | | 8,296,109 | |
| | | | | |
| | | | Electric Utilities – 1.2% | | | | | | | | | | | | |
| | | | | |
| | 705,000 | | | EDP – Energias de Portugal, S.A., (2) | | | | | | | | | | | | | | | 2,145,700 | |
| | | | | |
| | | | Electrical Equipment – 1.1% | | | | | | | | | | | | |
| | | | | |
| | 29,700 | | | Eaton PLC, (3) | | | | | | | | | | | | | | | 1,992,573 | |
| | | | | |
| | | | Equity Real Estate Investment Trusts – 1.9% | | | | | | | | | | | | |
| | | | | |
| | 43,500 | | | Apartment Investment & Management Company, Class A | | | | | | | | | | | | | | | 1,977,075 | |
| | 86,000 | | | Paramount Group Inc. | | | | | | | | | | | | | | | 1,375,140 | |
| | | | Total Equity Real Estate Investment Trusts | | | | | | | | | | | | | | | 3,352,215 | |
| | | | | |
| | | | Food & Staples Retailing – 2.2% | | | | | | | | | | | | |
| | | | | |
| | 48,500 | | | CVS Health Corporation, (3) | | | | | | | | | | | | | | | 3,827,135 | |
| | | | |
| JTA | | Nuveen Tax-Advantaged Total Return Strategy Fund | | |
| | Portfolio of Investments (continued) | | December 31, 2016 |
| | | | | | | | | | | | | | | | | | | | |
| Shares | | | Description (1) | | | | | | | | | | | Value | |
| | | | | |
| | | | Food Products – 2.3% | | | | | | | | | | | | |
| | | | | |
| | 443,000 | | | Orkla ASA, (2), (3) | | | | | | | | | | | | | | $ | 3,995,860 | |
| | | | | |
| | | | Health Care Providers & Services – 0.0% | | | | | | | | | | | | |
| | | | | |
| | 10,108 | | | Millenium Health LLC, (5) | | | | | | | | | | | | | | | 11,793 | |
| | | | | |
| | | | Hotels, Restaurants & Leisure – 0.8% | | | | | | | | | | | | |
| | | | | |
| | 21,400 | | | Cedar Fair LP, (4) | | | | | | | | | | | | | | | 1,373,880 | |
| | | | | |
| | | | Household Durables – 1.3% | | | | | | | | | | | | |
| | | | | |
| | 140,700 | | | Sekisui House, Ltd., (2) | | | | | | | | | | | | | | | 2,337,631 | |
| | | | | |
| | | | Industrial Conglomerates – 4.0% | | | | | | | | | | | | |
| | | | | |
| | 60,000 | | | General Electric Company, (4) | | | | | | | | | | | | | | | 1,896,000 | |
| | 103,000 | | | Philips Electronics, (3) | | | | | | | | | | | | | | | 3,148,710 | |
| | 16,100 | | | Siemens AG, Sponsored ADR, (2) | | | | | | | | | | | | | | | 1,971,283 | |
| | | | Total Industrial Conglomerates | | | | | | | | | | | | | | | 7,015,993 | |
| | | | | |
| | | | Insurance – 11.1% | | | | | | | | | | | | |
| | | | | |
| | 81,000 | | | Ageas, (2) | | | | | | | | | | | | | | | 3,201,671 | |
| | 226,000 | | | Allinaz S.E, (2), (3) | | | | | | | | | | | | | | | 3,724,480 | |
| | 50,600 | | | CNA Financial Corporation, (4) | | | | | | | | | | | | | | | 2,099,900 | |
| | 213,000 | | | Swiss Re AG, (2) | | | | | | | | | | | | | | | 5,060,880 | |
| | 130,000 | | | Unum Group, (3) | | | | | | | | | | | | | | | 5,710,900 | |
| | | | Total Insurance | | | | | | | | | | | | | | | 19,797,831 | |
| | | | | |
| | | | Media – 6.5% | | | | | | | | | | | | |
| | | | | |
| | 104,000 | | | Interpublic Group of Companies, Inc., (3) | | | | | | | | | | | | | | | 2,434,640 | |
| | 2,099 | | | Metro-Goldwyn-Mayer, (2), (5) | | | | | | | | | | | | | | | 187,861 | |
| | 89,000 | | | National CineMedia, Inc. | | | | | | | | | | | | | | | 1,310,970 | |
| | 193,000 | | | ProSiebenSat.1 Media AG, (2) | | | | | | | | | | | | | | | 1,850,870 | |
| | 33,800 | | | Time Warner Inc., (3) | | | | | | | | | | | | | | | 3,262,714 | |
| | 3,958 | | | Tribune Media Company | | | | | | | | | | | | | | | 138,451 | |
| | 3,184 | | | Tribune Media Company, (6) | | | | | | | | | | | | | | | — | |
| | 989 | | | Tronc, Inc., (5) | | | | | | | | | | | | | | | 13,717 | |
| | 66,000 | | | Viacom Inc., Class B, (3) | | | | | | | | | | | | | | | 2,316,600 | |
| | | | Total Media | | | | | | | | | | | | | | | 11,515,823 | |
| | | | | |
| | | | Mortgage Real Estate Investment Trusts – 1.2% | | | | | | | | | | | | |
| | | | | |
| | 101,000 | | | Colony Financial Inc. | | | | | | | | | | | | | | | 2,045,250 | |
| | | | | |
| | | | Multiline Retail – 0.9% | | | | | | | | | | | | |
| | | | | |
| | 21,400 | | | Target Corporation, (3) | | | | | | | | | | | | | | | 1,545,722 | |
| | | | | |
| | | | Multi-Utilities – 2.9% | | | | | | | | | | | | |
| | | | | |
| | 305,000 | | | Veolia Environment S.A., ADR, (2) | | | | | | | | | | | | | | | 5,182,515 | |
| | | | | |
| | | | Oil, Gas, & Consumable Fuels – 3.0% | | | | | | | | | | | | |
| | | | | |
| | 37,900 | | | Phillips 66, (3) | | | | | | | | | | | | | | | 3,274,939 | |
| | 9 | | | Southcross Holdings Borrower LP, (5) | | | | | | | | | | | | | | | 3,090 | |
| | 39,300 | | | Total SA, Sponsored ADR | | | | | | | | | | | | | | | 2,003,121 | |
| | | | Total Oil, Gas, & Consumable Fuels | | | | | | | | | | | | | | | 5,281,150 | |
| | | | | |
| | | | Pharmaceuticals – 7.6% | | | | | | | | | | | | |
| | | | | |
| | 151,500 | | | AstraZeneca PLC, (3) | | | | | | | | | | | | | | | 4,138,980 | |
| | 167,000 | | | GlaxoSmithKline PLC, (3) | | | | | | | | | | | | | | | 6,431,170 | |
| | 97,000 | | | Roche Holdings AG, Sponsored ADR, (2), (3) | | | | | | | | | | | | | | | 2,767,410 | |
| | | | Total Pharmaceuticals | | | | | | | | | | | | | | | 13,337,560 | |
| | | | | |
| | | | Road & Rail – 1.3% | | | | | | | | | | | | |
| | | | | |
| | 22,400 | | | Union Pacific Corporation, (3) | | | | | | | | | | | | | | | 2,322,432 | |
| | | | | | | | | | | | | | | | | | | | |
| Shares | | | Description (1) | | | | | | | | | | | Value | |
| | | | | |
| | | | Semiconductors & Semiconductor Equipment – 1.3% | | | | | | | | | | | | |
| | | | | |
| | 138,000 | | | Infineon Technologies AG, (2) | | | | | | | | | | | | | | $ | 2,387,051 | |
| | | | | |
| | | | Software – 6.0% | | | | | | | | | | | | |
| | | | | |
| | 63,500 | | | Microsoft Corporation, (3), (4) | | | | | | | | | | | | | | | 3,945,890 | |
| | 170,000 | | | Oracle Corporation | | | | | | | | | | | | | | | 6,536,500 | |
| | | | Total Software | | | | | | | | | | | | | | | 10,482,390 | |
| | | | | |
| | | | Tobacco – 2.7% | | | | | | | | | | | | |
| | | | | |
| | 109,800 | | | Imperial Brands PLC, (2) | | | | | | | | | | | | | | | 4,781,790 | |
| | | | Total Common Stocks (cost $143,480,817) | | | | | | | | | | | | | | | 163,138,363 | |
| | | | | |
| Shares | | | Description (1) | | Coupon | | | | | | Ratings (7) | | | Value | |
| | | | |
| | | | CONVERTIBLE PREFERRED SECURITIES – 6.6% (4.6% of Total Investments) | | | | | | | | | | | | | |
| | | | | |
| | | | Banks – 0.6% | | | | | | | | | | | | |
| | | | | |
| | 525 | | | Bank of America Corporation | | | 7.250% | | | | | | | | BB+ | | | $ | 612,570 | |
| | 425 | | | Wells Fargo & Company, Convertible Bond | | | 7.500% | | | | | | | | BBB | | | | 505,750 | |
| | | | Total Banks | | | | | | | | | | | | | | | 1,118,320 | |
| | | | | |
| | | | Diversified Telecommunication Services – 1.3% | | | | | | | | | | | | |
| | | | | |
| | 32,800 | | | Frontier Communications Corporation | | | 11.125% | | | | | | | | N/R | | | | 2,331,424 | |
| | | | | |
| | | | Electric Utilities – 1.4% | | | | | | | | | | | | |
| | | | | |
| | 47,100 | | | Great Plains Energy Inc. | | | 7.000% | | | | | | | | N/R | | | | 2,383,260 | |
| | | | | |
| | | | Pharmaceuticals – 3.3% | | | | | | | | | | | | |
| | | | | |
| | 9,018 | | | Teva Pharmaceutical Industries Limited, (2) | | | 7.000% | | | | | | | | N/R | | | | 5,837,351 | |
| | | | Total Convertible Preferred Securities (cost $15,030,133) | | | | | | | | | | | | | | | 11,670,355 | |
| | | | | |
| Shares | | | Description (1) | | Coupon | | | | | | Ratings (7) | | | Value | |
| | | | |
| | | | $25 PAR (OR SIMILAR) RETAIL PREFERRED – 7.6% (5.3% of Total Investments) | | | | | | | | | | | | | |
| | | | | |
| | | | Banks – 2.1% | | | | | | | | | | | | |
| | | | | |
| | 12,020 | | | Boston Private Financial Holdings Inc. | | | 6.950% | | | | | | | | N/R | | | $ | 300,981 | |
| | 4,625 | | | Cobank Agricultural Credit Bank, (2) | | | 6.250% | | | | | | | | BBB+ | | | | 469,004 | |
| | 3,250 | | | Cobank Agricultural Credit Bank, (2) | | | 6.125% | | | | | | | | BBB+ | | | | 316,875 | |
| | 14,122 | | | Fifth Third Bancorp. | | | 6.625% | | | | | | | | Baa3 | | | | 385,954 | |
| | 7,700 | | | First Republic Bank of San Francisco | | | 7.000% | | | | | | | | BBB– | | | | 209,517 | |
| | 4,450 | | | HSBC Holdings PLC | | | 8.000% | | | | | | | | Baa1 | | | | 114,810 | |
| | 15,000 | | | Huntington BancShares Inc. | | | 6.250% | | | | | | | | Baa3 | | | | 379,500 | |
| | 7,850 | | | KeyCorp Preferred Stock | | | 6.125% | | | | | | | | Baa3 | | | | 205,356 | |
| | 12,300 | | | People’s United Financial, Inc. | | | 5.625% | | | | | | | | BB+ | | | | 317,955 | |
| | 14,544 | | | Regions Financial Corporation | | | 6.375% | | | | | | | | Ba1 | | | | 385,852 | |
| | 3,821 | | | TCF Financial Corporation | | | 7.500% | | | | | | | | BB– | | | | 97,818 | |
| | 18,400 | | | U.S. Bancorp. | | | 6.500% | | | | | | | | A3 | | | | 520,536 | |
| | 1,300 | | | Zions Bancorporation | | | 7.900% | | | | | | | | BB– | | | | 33,306 | |
| | | | Total Banks | | | | | | | | | | | | | | | 3,737,464 | |
| | | | | |
| | | | Capital Markets – 1.1% | | | | | | | | | | | | |
| | | | | |
| | 11,400 | | | Charles Schwab Corporation | | | 6.000% | | | | | | | | BBB | | | | 288,078 | |
| | 3,775 | | | Charles Schwab Corporation | | | 5.950% | | | | | | | | BBB | | | | 94,337 | |
| | 20,850 | | | Ladenburg Thalmann Financial Services Inc. | | | 8.000% | | | | | | | | N/R | | | | 501,234 | |
| | 24,175 | | | Morgan Stanley | | | 7.125% | | | | | | | | Ba1 | | | | 680,043 | |
| | 16,200 | | | Stifel Financial Corporation | | | 6.250% | | | | | | | | BB– | | | | 402,732 | |
| | | | Total Capital Markets | | | | | | | | | | | | | | | 1,966,424 | |
| | | | |
| JTA | | Nuveen Tax-Advantaged Total Return Strategy Fund | | |
| | Portfolio of Investments (continued) | | December 31, 2016 |
| | | | | | | | | | | | | | | | | | | | |
| Shares | | | Description (1) | | Coupon | | | | | | Ratings (7) | | | Value | |
| | | | | |
| | | | Consumer Finance – 1.2% | | | | | | | | | | | | |
| | | | | |
| | 9,200 | | | Capital One Financial Corporation | | | 6.700% | | | | | | | | Baa3 | | | $ | 238,832 | |
| | 3,800 | | | Discover Financial Services | | | 6.500% | | | | | | | | BB– | | | | 97,584 | |
| | 56,500 | | | GMAC Capital Trust I | | | 8.125% | | | | | | | | B+ | | | | 1,435,100 | |
| | 7,130 | | | SLM Corporation, Series A | | | 6.970% | | | | | | | | Ba3 | | | | 365,056 | |
| | | | Total Consumer Finance | | | | | | | | | | | | | | | 2,136,572 | |
| | | | | |
| | | | Diversified Financial Services – 0.1% | | | | | | | | | | | | |
| | | | | |
| | 8,100 | | | KKR Financial Holdings LLC | | | 7.375% | | | | | | | | BBB | | | | 210,276 | |
| | | | | |
| | | | Electric Utilities – 0.4% | | | | | | | | | | | | |
| | | | | |
| | 3,035 | | | Alabama Power Company, (2) | | | 6.500% | | | | | | | | A3 | | | | 79,289 | |
| | 1,300 | | | Alabama Power Company, (2) | | | 6.450% | | | | | | | | A3 | | | | 33,109 | |
| | 5,000 | | | Gulf Power Company, (2) | | | 6.450% | | | | | | | | Baa1 | | | | 507,482 | |
| | | | Total Electric Utilities | | | | | | | | | | | | | | | 619,880 | |
| | | | | |
| | | | Food Products – 0.4% | | | | | | | | | | | | |
| | | | | |
| | 14,600 | | | CHS Inc. | | | 7.100% | | | | | | | | N/R | | | | 387,046 | |
| | 11,205 | | | CHS Inc. | | | 6.750% | | | | | | | | N/R | | | | 294,467 | |
| | | | Total Food Products | | | | | | | | | | | | | | | 681,513 | |
| | | | | |
| | | | Insurance – 1.7% | | | | | | | | | | | | |
| | | | | |
| | 14,089 | | | Allstate Corporation | | | 6.750% | | | | | | | | BBB– | | | | 363,214 | |
| | 13,300 | | | Arch Capital Group Limited | | | 6.750% | | | | | | | | BBB | | | | 334,761 | |
| | 4,000 | | | Aspen Insurance Holdings Limited | | | 7.401% | | | | | | | | BBB– | | | | 99,960 | |
| | 19,210 | | | Aspen Insurance Holdings Limited | | | 7.250% | | | | | | | | BBB– | | | | 488,318 | |
| | 13,193 | | | Axis Capital Holdings Limited | | | 6.875% | | | | | | | | BBB | | | | 332,596 | |
| | 19,050 | | | Endurance Specialty Holdings Limited | | | 6.350% | | | | | | | | BBB– | | | | 486,918 | |
| | 19,101 | | | Maiden Holdings Limited | | | 8.250% | | | | | | | | BB | | | | 492,806 | |
| | 9,600 | | | National General Holding Company | | | 7.500% | | | | | | | | N/R | | | | 240,768 | |
| | 8,035 | | | National General Holding Company | | | 7.500% | | | | | | | | N/R | | | | 199,348 | |
| | | | Total Insurance | | | | | | | | | | | | | | | 3,038,689 | |
| | | | | |
| | | | Thrifts & Mortgage Finance – 0.4% | | | | | | | | | | | | |
| | | | | |
| | 4,631 | | | Astoria Financial Corporation | | | 6.500% | | | | | | | | Ba2 | | | | 116,331 | |
| | 24,550 | | | Federal Agricultural Mortgage Corporation | | | 6.875% | | | | | | | | N/R | | | | 632,163 | |
| | | | Total Thrifts & Mortgage Finance | | | | | | | | | | | | | | | 748,494 | |
| | | | | |
| | | | Wireless Telecommunication Services – 0.2% | | | | | | | | | | | | |
| | | | | |
| | 11,000 | | | United States Cellular Corporation | | | 7.250% | | | | | | | | Ba1 | | | | 279,510 | |
| | | | Total $25 Par (or similar) Retail Preferred (cost $12,975,259) | | | | | | | | | | | | | | | 13,418,822 | |
| | | | | |
Principal
Amount (000) | | | Description (1) | | Coupon (8) | | | Maturity (9) | | | Ratings (7) | | | Value | |
| | | | |
| | | | VARIABLE RATE SENIOR LOAN INTERESTS – 27.5% (19.3% of Total Investments) (8) | | | | | | | | | | | | | |
| | | | | |
| | | | Aerospace & Defense – 1.2% | | | | | | | | | | | | |
| | | | | |
| $ | 610 | | | B/E Aerospace, Inc., Term Loan B | | | 3.893% | | | | 12/16/21 | | | | BB+ | | | $ | 613,721 | |
| | 1,000 | | | Leidos Holdings, Inc., Term Loan B | | | 3.520% | | | | 8/16/23 | | | | BBB– | | | | 1,010,250 | |
| | 498 | | | Transdigm, Inc., Extend Term Loan F | | | 3.770% | | | | 6/07/23 | | | | Ba2 | | | | 502,889 | |
| | 2,108 | | | Total Aerospace & Defense | | | | | | | | | | | | | | | 2,126,860 | |
| | | | | |
| | | | Airlines – 0.6% | | | | | | | | | | | | |
| | | | | |
| | 500 | | | American Airlines, Inc., Term Loan B | | | 3.250% | | | | 12/14/23 | | | | BB+ | | | | 502,969 | |
| | 481 | | | Delta Air Lines, Inc., Term Loan B1 | | | 3.250% | | | | 10/18/18 | | | | Baa2 | | | | 486,965 | |
| | 981 | | | Total Airlines | | | | | | | | | | | | | | | 989,934 | |
| | | | | | | | | | | | | | | | | | | | |
Principal
Amount (000) | | | Description (1) | | Coupon (8) | | | Maturity (9) | | | Ratings (7) | | | Value | |
| | | | | |
| | | | Automobiles – 1.0% | | | | | | | | | | | | |
| | | | | |
| $ | 574 | | | Chrysler Group LLC, Term Loan B | | | 3.500% | | | | 5/24/17 | | | | BBB– | | | $ | 576,041 | |
| | 1,113 | | | Formula One Group, Term Loan, First Lien | | | 5.068% | | | | 7/30/21 | | | | B | | | | 1,125,767 | |
| | 1,687 | | | Total Automobiles | | | | | | | | | | | | | | | 1,701,808 | |
| | | | | |
| | | | Building Products – 0.5% | | | | | | | | | | | | |
| | | | | |
| | 292 | | | Gates Global LLC, Term Loan | | | 4.250% | | | | 7/06/21 | | | | B+ | | | | 292,620 | |
| | 500 | | | Quikrete Holdings, Inc., Initial Term Loan, First Lien | | | 4.000% | | | | 11/15/23 | | | | BB- | | | | 505,625 | |
| | 792 | | | Total Building Products | | | | | | | | | | | | | | | 798,245 | |
| | | | | |
| | | | Chemicals – 0.9% | | | | | | | | | | | | |
| | | | | |
| | 672 | | | US Coatings Acquisition, Term Loan B, (WI/DD) | | | TBD | | | | TBD | | | | N/R | | | | 680,136 | |
| | 199 | | | Mineral Technologies, Inc., Term Loan B2 | | | 4.750% | | | | 5/07/21 | | | | BB+ | | | | 201,863 | |
| | 777 | | | Univar, Inc., Term Loan B, First Lien | | | 4.250% | | | | 7/01/22 | | | | BB– | | | | 783,475 | |
| | 1,648 | | | Total Chemicals | | | | | | | | | | | | | | | 1,665,474 | |
| | | | | |
| | | | Commercial Services & Supplies – 0.6% | | | | | | | | | | | | |
| | | | | |
| | 995 | | | West Corporation, Refinanced Term Loan B12 , (WI/DD) | | | TBD | | | | TBD | | | | BB | | | | 998,324 | |
| | | | | |
| | | | Communications Equipment – 0.2% | | | | | | | | | | | | |
| | | | | |
| | 267 | | | CommScope, Inc., Tranche 5, Term Loan B, First Lien | | | 3.270% | | | | 12/29/22 | | | | BB+ | | | | 270,206 | |
| | | | | |
| | | | Consumer Finance – 0.5% | | | | | | | | | | | | |
| | | | | |
| | 894 | | | First Data Corporation, Term Loan, First Lien | | | 3.756% | | | | 3/24/21 | | | | BB | | | | 903,710 | |
| | | | | |
| | | | Containers & Packaging – 1.0% | | | | | | | | | | | | |
| | | | | |
| | 429 | | | Berry Plastics Holding Corporation, Term Loan H | | | 3.750% | | | | 10/01/22 | | | | BB | | | | 432,961 | |
| | 1,273 | | | Reynolds Group Holdings, Inc., Term Loan, First Lien | | | 4.250% | | | | 2/06/23 | | | | B+ | | | | 1,288,906 | |
| | 1,702 | | | Total Containers & Packaging | | | | | | | | | | | | | | | 1,721,867 | |
| | | | | |
| | | | Diversified Consumer Services – 0.3% | | | | | | | | | | | | |
| | | | | |
| | 37 | | | Hilton Hotels Corporation, Term Loan B1 | | | 3.500% | | | | 10/26/20 | | | | BBB– | | | | 37,422 | |
| | 504 | | | Hilton Hotels Corporation, Series B2, Term Loan | | | 3.256% | | | | 10/25/23 | | | | BBB– | | | | 510,401 | |
| | 541 | | | Total Diversified Consumer Services | | | | | | | | | | | | | | | 547,823 | |
| | | | | |
| | | | Diversified Financial Services – 0.6% | | | | | | | | | | | | |
| | | | | |
| | 744 | | | MGM Growth Properties, Term Loan B | | | 3.520% | | | | 4/25/23 | | | | BB+ | | | | 751,004 | |
| | 265 | | | WideOpenWest Finance LLC, New Term Loan B | | | 4.500% | | | | 8/18/23 | | | | B1 | | | | 267,218 | |
| | 1,009 | | | Total Diversified Financial Services | | | | | | | | | | | | | | | 1,018,222 | |
| | | | | |
| | | | Diversified Telecommunication Services – 0.9% | | | | | | | | | | | | |
| | | | | |
| | 522 | | | Intelsat Jackson Holdings, S.A., Tranche B2, Term Loan | | | 3.750% | | | | 6/30/19 | | | | B1 | | | | 506,192 | |
| | 1,000 | | | Verizon Communications, Inc., Term Loan | | | 2.005% | | | | 7/31/19 | | | | N/R | | | | 1,001,042 | |
| | 1,522 | | | Total Diversified Telecommunication Services | | | | | | | | | | | | | | | 1,507,234 | |
| | | | | |
| | | | Electric Utilities – 0.3% | | | | | | | | | | | | |
| | | | | |
| | 407 | | | Texas Competitive Electric Holdings LLC, Exit Term Loan B | | | 5.000% | | | | 8/04/23 | | | | BB+ | | | | 410,960 | |
| | 93 | | | Texas Competitive Electric Holdings LLC, Exit Term Loan C | | | 5.000% | | | | 8/04/23 | | | | BB+ | | | | 94,105 | |
| | 500 | | | Total Electric Utilities | | | | | | | | | | | | | | | 505,065 | |
| | | | | |
| | | | Energy Equipment & Services – 0.1% | | | | | | | | | | | | |
| | | | | |
| | 149 | | | Drill Rigs Holdings, Inc., Tranche B1, Term Loan | | | 6.000% | | | | 3/31/21 | | | | Caa2 | | | | 97,656 | |
| | | | | |
| | | | Equity Real Estate Investment Trusts – 0.3% | | | | | | | | | | | | |
| | | | | |
| | 539 | | | Communications Sales & Leasing, Inc., Term Loan B | | | 4.500% | | | | 10/24/22 | | | | BB+ | | | | 546,171 | |
| | | | | |
| | | | Food & Staples Retailing – 0.5% | | | | | | | | | | | | |
| | | | | |
| | 869 | | | Albertson’s LLC, Term Loan B4 | | | 3.770% | | | | 8/25/21 | | | | BB | | | | 859,974 | |
| | | | |
| JTA | | Nuveen Tax-Advantaged Total Return Strategy Fund | | |
| | Portfolio of Investments (continued) | | December 31, 2016 |
| | | | | | | | | | | | | | | | | | | | |
Principal
Amount (000) | | | Description (1) | | Coupon (8) | | | Maturity (9) | | | Ratings (7) | | | Value | |
| | | | | |
| | | | Food Products – 0.6% | | | | | | | | | | | | |
| | | | | |
| $ | 520 | | | Jacobs Douwe Egberts, Term Loan B | | | 3.250% | | | | 7/04/22 | | | | BB | | | $ | 523,646 | |
| | 585 | | | US Foods, Inc., Term Loan B | | | 3.770% | | | | 6/27/23 | | | | BB– | | | | 590,995 | |
| | 1,105 | | | Total Food Products | | | | | | | | | | | | | | | 1,114,641 | |
| | | | | |
| | | | Health Care Equipment & Supplies – 1.0% | | | | | | | | | | | | |
| | | | | |
| | 1,316 | | | Acelity, Term Loan F | | | 5.000% | | | | 8/03/18 | | | | Ba3 | | | | 1,321,587 | |
| | 427 | | | Sterigenics International, Inc., Term Loan B | | | 4.250% | | | | 5/16/22 | | | | B1 | | | | 429,933 | |
| | 1,743 | | | Total Health Care Equipment & Supplies | | | | | | | | | | | | | | | 1,751,520 | |
| | | | | |
| | | | Health Care Providers & Services – 1.6% | | | | | | | | | | | | |
| | | | | |
| | 250 | | | Community Health Systems, Inc., Term Loan G | | | 3.750% | | | | 12/31/19 | | | | BB– | | | | 242,600 | |
| | 500 | | | Community Health Systems, Inc., Term Loan H | | | 4.000% | | | | 1/27/21 | | | | BB– | | | | 484,387 | |
| | 810 | | | DaVita HealthCare Partners, Inc., Tranche B, Term Loan | | | 3.520% | | | | 6/24/21 | | | | BBB– | | | | 819,983 | |
| | 500 | | | Envision Healthcare Corporation, Term Loan B, First Lien | | | 4.000% | | | | 12/01/23 | | | | BB– | | | | 504,688 | |
| | 57 | | | HCA, Inc., Term Loan B6, First Lien | | | 4.020% | | | | 3/17/23 | | | | BBB– | | | | 57,231 | |
| | 504 | | | HCA, Inc., Term Loan B7, First Lien | | | 3.520% | | | | 2/15/24 | | | | BBB– | | | | 510,538 | |
| | 333 | | | Millennium Laboratories, Inc., Term Loan B, First Lien | | | 7.500% | | | | 12/21/20 | | | | CCC+ | | | | 168,030 | |
| | 2,954 | | | Total Health Care Providers & Services | | | | | | | | | | | | | | | 2,787,457 | |
| | | | | |
| | | | Hotels, Restaurants & Leisure – 1.5% | | | | | | | | | | | | |
| | | | | |
| | 1,036 | | | Burger King Corporation, Term Loan B | | | 3.750% | | | | 12/10/21 | | | | Ba3 | | | | 1,046,765 | |
| | 1,140 | | | Seaworld Parks and Entertainment, Inc., Term Loan B2 | | | 3.248% | | | | 5/14/20 | | | | BB– | | | | 1,127,189 | |
| | 498 | | | YUM Brands, Term Loan B | | | 3.486% | | | | 6/16/23 | | | | BBB– | | | | 504,711 | |
| | 2,674 | | | Total Hotels, Restaurants & Leisure | | | | | | | | | | | | | | | 2,678,665 | |
| | | | | |
| | | | Household Products – 0.2% | | | | | | | | | | | | |
| | | | | |
| | 346 | | | Spectrum Brands, Inc., Term Loan B, First Lien | | | 3.330% | | | | 6/23/22 | | | | BB+ | | | | 350,269 | |
| | | | | |
| | | | Independent Power & Renewable Electric Producers – 0.3% | | | | | | | | | | | | |
| | | | | |
| | 500 | | | Dynegy, Inc., Term Loan B | | | 5.000% | | | | 6/27/23 | | | | BB | | | | 506,965 | |
| | | | | |
| | | | Internet and Direct Marketing Retail – 0.3% | | | | | | | | | | | | |
| | | | | |
| | 479 | | | Travelport LLC, Term Loan B | | | 5.000% | | | | 9/02/21 | | | | B+ | | | | 484,249 | |
| | | | | |
| | | | Internet Software & Services – 0.4% | | | | | | | | | | | | |
| | | | | |
| | 819 | | | Tibco Software, Inc., Term Loan B | | | 6.500% | | | | 12/04/20 | | | | B1 | | | | 823,182 | |
| | | | | |
| | | | IT Services – 0.5% | | | | | | | | | | | | |
| | | | | |
| | 478 | | | Vantiv, Inc., Term Loan B | | | 3.250% | | | | 10/06/23 | | | | BBB– | | | | 482,508 | |
| | 498 | | | WEX, Inc., Term Loan B | | | 4.270% | | | | 6/30/23 | | | | BB– | | | | 504,741 | |
| | 976 | | | Total IT Services | | | | | | | | | | | | | | | 987,249 | |
| | | | | |
| | | | Leisure Products – 0.4% | | | | | | | | | | | | |
| | | | | |
| | 678 | | | 24 Hour Fitness Worldwide, Inc., Term Loan B | | | 4.750% | | | | 5/28/21 | | | | Ba3 | | | | 674,588 | |
| | | | | |
| | | | Life Sciences Tools & Services – 0.3% | | | | | | | | | | | | |
| | | | | |
| | 500 | | | Inventiv Health, Inc., Term Loan B | | | 4.750% | | | | 11/09/23 | | | | B | | | | 501,797 | |
| | | | | |
| | | | Machinery – 0.2% | | | | | | | | | | | | |
| | | | | |
| | 412 | | | Rexnord LLC. Term Loan B, First Lien | | | 3.750% | | | | 8/21/23 | | | | BB– | | | | 414,337 | |
| | | | | |
| | | | Media – 3.5% | | | | | | | | | | | | |
| | | | | |
| | 495 | | | Cequel Communications LLC, Term Loan B | | | 3.882% | | | | 1/15/25 | | | | BB– | | | | 501,432 | |
| | 483 | | | Charter Communications Operating Holdings LLC, Term Loan E | | | 3.020% | | | | 7/01/20 | | | | BBB– | | | | 484,946 | |
| | 92 | | | Clear Channel Communications, Inc., Term Loan E | | | 8.270% | | | | 7/30/19 | | | | Caa1 | | | | 75,761 | |
| | 747 | | | Clear Channel Communications, Inc., Tranche D, Term Loan | | | 7.520% | | | | 1/30/19 | | | | Caa1 | | | | 609,643 | |
| | 690 | | | Cumulus Media, Inc., Term Loan B | | | 4.250% | | | | 12/23/20 | | | | B3 | | | | 454,372 | |
| | 1,000 | | | Lions Gate Entertainment Corporation, Term Loan B | | | 3.750% | | | | 12/08/23 | | | | BB– | | | | 1,007,338 | |
| | 41 | | | Nexstar Broadcasting Group, Term Loan B, First Lien, (WI/DD) | | | TBD | | | | TBD | | | | BB+ | | | | 41,296 | |
| | | | | | | | | | | | | | | | | | | | |
Principal
Amount (000) | | | Description (1) | | Coupon (8) | | | Maturity (9) | | | Ratings (7) | | | Value | |
| | | | | |
| | | | Media (continued) | | | | | | | | | | | | |
| $ | 459 | | | Nexstar Broadcasting Group, Term Loan B, First Lien, (WI/DD) | | | TBD | | | | TBD | | | | BB+ | | | $ | 463,436 | |
| | 543 | | | Springer Science & Business Media, Inc., Term Loan B9, First Lien | | | 4.750% | | | | 8/14/20 | | | | B | | | | 544,041 | |
| | 1,504 | | | Univision Communications, Inc., Replacement Term Loan, First Lien | | | 4.000% | | | | 3/01/20 | | | | BB– | | | | 1,512,984 | |
| | 500 | | | Virgin Media Investment Holdings, Limited Term Loan I, (WI/DD) | | | TBD | | | | TBD | | | | BB– | | | | 502,917 | |
| | 6,554 | | | Total Media | | | | | | | | | | | | | | | 6,198,166 | |
| | | | | |
| | | | Multiline Retail – 0.8% | | | | | | | | | | | | |
| | | | | |
| | 491 | | | Bass Pro Group LLC, Term Loan B, First Lien | | | 4.000% | | | | 6/05/20 | | | | B+ | | | | 490,227 | |
| | 500 | | | Bass Pro Group LLC, Term Loan B | | | 5.970% | | | | 4/01/24 | | | | B+ | | | | 496,295 | |
| | 173 | | | Dollar Tree, Inc., Term Loan B, First Lien | | | 3.250% | | | | 7/06/22 | | | | BBB– | | | | 174,527 | |
| | 240 | | | Dollar Tree, Inc., Term Loan B2 | | | 4.250% | | | | 7/06/22 | | | | BBB– | | | | 242,850 | |
| | 1,404 | | | Total Multiline Retail | | | | | | | | | | | | | | | 1,403,899 | |
| | | | | |
| | | | Oil, Gas & Consumable Fuels – 0.4% | | | | | | | | | | | | |
| | | | | |
| | 208 | | | Fieldwood Energy LLC, Term Loan, First Lien, (DD1) | | | 8.000% | | | | 8/31/20 | | | | B2 | | | | 199,804 | |
| | 134 | | | Fieldwood Energy LLC, Term Loan, Second Lien, (DD1) | | | 8.375% | | | | 9/30/20 | | | | CCC– | | | | 96,089 | |
| | 358 | | | Fieldwood Energy LLC, Term Loan, Second Lien, (DD1) | | | 8.375% | | | | 9/30/20 | | | | B– | | | | 309,701 | |
| | 190 | | | Harvey Gulf International Marine, Inc., Term Loan B | | | 5.470% | | | | 6/18/20 | | | | CCC+ | | | | 149,806 | |
| | 8 | | | Southcross Holdings Borrower L.P., Term Loan B, First Lien | | | 3.500% | | | | 4/13/23 | | | | CCC+ | | | | 6,544 | |
| | 898 | | | Total Oil, Gas & Consumable Fuels | | | | | | | | | | | | | | | 761,944 | |
| | | | | |
| | | | Pharmaceuticals – 0.1% | | | | | | | | | | | | |
| | | | | |
| | 88 | | | Valeant Pharmaceuticals International, Inc., Series E1, Tranche B Term Loan | | | 5.250% | | | | 8/05/20 | | | | BB– | | | | 88,345 | |
| | | | | |
| | | | Professional Services – 0.2% | | | | | | | | | | | | |
| | | | | |
| | 400 | | | Nielsen Finance LLC, Term Loan B3, First Lien | | | 3.154% | | | | 10/04/23 | | | | BBB- | | | | 404,094 | |
| | | | | |
| | | | Semiconductors & Semiconductor Equipment – 1.3% | | | | | | | | | | | | |
| | | | | |
| | 1,010 | | | Avago Technologies, Term Loan B3 | | | 3.704% | | | | 2/01/23 | | | | BBB | | | | 1,025,001 | |
| | 715 | | | NXP Semiconductor LLC, Term Loan D | | | 3.270% | | | | 1/11/20 | | | | Baa2 | | | | 719,429 | |
| | 532 | | | NXP Semiconductor LLC, Term Loan F | | | 3.270% | | | | 12/07/20 | | | | Baa2 | | | | 535,358 | |
| | 2,257 | | | Total Semiconductors & Semiconductor Equipment | | | | | | | | | | | | | | | 2,279,788 | |
| | | | | |
| | | | Software – 2.1% | | | | | | | | | | | | |
| | | | | |
| | 469 | | | BMC Software, Inc., Initial Term Loan | | | 5.000% | | | | 9/10/20 | | | | B+ | | | | 468,193 | |
| | 780 | | | Ellucian, Term Loan B, First Lien | | | 4.750% | | | | 9/30/22 | | | | B | | | | 786,831 | |
| | 944 | | | Emdeon Business Services LLC, Term Loan B2 | | | 3.750% | | | | 11/02/18 | | | | BB– | | | | 946,648 | |
| | 735 | | | Infor Global Solutions Intermediate Holdings, Ltd., Term Loan B5 | | | 3.750% | | | | 6/03/20 | | | | BB | | | | 736,066 | |
| | 664 | | | SS&C Technologies, Inc./ Sunshine Acquisition II, Inc., Term Loan B1 | | | 4.001% | | | | 7/08/22 | | | | BB+ | | | | 673,072 | |
| | 68 | | | SS&C Technologies, Inc./ Sunshine Acquisition II, Inc., Term Loan B2 | | | 4.002% | | | | 7/08/22 | | | | BB+ | | | | 68,684 | |
| | 3,660 | | | Total Software | | | | | | | | | | | | | | | 3,679,494 | |
| | | | | |
| | | | Specialty Retail – 1.2% | | | | | | | | | | | | |
| | | | | |
| | 559 | | | Burlington Coat Factory Warehouse Corporation, Term Loan B4 | | | 3.510% | | | | 8/13/21 | | | | BB | | | | 563,803 | |
| | 250 | | | Jo-Ann Stores, Inc., Term Loan B | | | 6.256% | | | | 10/20/23 | | | | B+ | | | | 251,354 | |
| | 943 | | | Petco Animal Supplies, Inc. Term Loan B1 | | | 5.000% | | | | 1/26/23 | | | | B1 | | | | 951,939 | |
| | 424 | | | Petsmart Inc., Term Loan B, First Lien | | | 4.000% | | | | 3/11/22 | | | | BB– | | | | 426,019 | |
| | 2,176 | | | Total Specialty Retail | | | | | | | | | | | | | | | 2,193,115 | |
| | | | | |
| | | | Technology Hardware, Storage & Peripherals – 0.9% | | | | | | | | | | | | |
| | | | | |
| | 818 | | | Dell International LLC, Term Loan B | | | 4.020% | | | | 9/07/23 | | | | BBB– | | | | 832,981 | |
| | 796 | | | Western Digital, Inc., Term Loan B1 | | | 4.520% | | | | 4/29/23 | | | | BBB– | | | | 808,082 | |
| | 1,614 | | | Total Technology Hardware, Storage & Peripherals | | | | | | | | | | | | | | | 1,641,063 | |
| | | | | |
| | | | Wireless Telecommunication Services – 0.2% | | | | | | | | | | | | |
| | | | | |
| | 445 | | | T-Mobile USA, Term Loan B | | | 3.520% | | | | 11/09/22 | | | | BBB– | | | | 451,148 | |
| | 48,885 | | | Total Variable Rate Senior Loan Interests (cost $48,619,679) | | | | | | | | | | | | | | | 48,434,548 | |
| | | | |
| JTA | | Nuveen Tax-Advantaged Total Return Strategy Fund | | |
| | Portfolio of Investments (continued) | | December 31, 2016 |
| | | | | | | | | | | | | | | | | | | | |
Principal
Amount (000) | | | Description (1) | | Coupon | | | Maturity | | | Ratings (7) | | | Value | |
| | | | | |
| | | | CORPORATE BONDS – 0.7% (0.5% of Total Investments) | | | | | | | | | | | | | | | | |
| | | | | |
| | | | Banks – 0.6% | | | | | | | | | | | | |
| | | | | |
| $ | 25 | | | Bank of America Corporation | | | 6.300% | | | | N/A (10) | | | | BB+ | | | $ | 26,125 | |
| | 250 | | | Citigroup Inc. | | | 5.950% | | | | N/A (10) | | | | BB+ | | | | 246,925 | |
| | 150 | | | JPMorgan Chase & Company | | | 6.750% | | | | N/A (10) | | | | BBB– | | | | 161,625 | |
| | 525 | | | M&T Bank Corporation | | | 6.450% | | | | N/A (10) | | | | Baa2 | | | | 561,750 | |
| | 950 | | | Total Banks | | | | | | | | | | | | | | | 996,425 | |
| | | | | |
| | | | Media – 0.1% | | | | | | | | | | | | |
| | | | | |
| | 133 | | | Clear Channel Communications, Inc. | | | 9.000% | | | | 12/15/19 | | | | Caa1 | | | | 108,728 | |
| $ | 1,083 | | | Total Corporate Bonds (cost $1,080,373) | | | | | | | | | | | | | | | 1,105,153 | |
| | | | | |
Principal
Amount (000) | | | Description (1) | | Coupon | | | Maturity | | | Ratings (7) | | | Value | |
| | | |
| | | | $1,000 PAR (OR SIMILAR) INSTITUTIONAL PREFERRED – 7.2% (5.1% of Total Investments) | | | | | | | | | |
| | | | | |
| | | | Banks – 5.0% | | | | | | | | | | | | |
| | | | | |
| $ | 1,929 | | | Bank of America Corporation | | | 6.500% | | | | N/A (10) | | | | BB+ | | | $ | 2,015,805 | |
| | 100 | | | Citigroup Inc. | | | 6.250% | | | | N/A (10) | | | | BB+ | | | | 102,900 | |
| | 1,938 | | | Citigroup Inc. | | | 5.950% | | | | N/A (10) | | | | BB+ | | | | 1,966,973 | |
| | 450 | | | Citigroup Inc. | | | 5.800% | | | | N/A (10) | | | | BB+ | | | | 453,938 | |
| | 200 | | | Citizens Financial Group Inc. | | | 5.500% | | | | N/A (10) | | | | BB+ | | | | 198,000 | |
| | 50 | | | Cobank Agricultural Credit Bank | | | 6.250% | | | | N/A (10) | | | | BBB+ | | | | 51,701 | |
| | 200 | | | JPMorgan Chase & Company | | | 7.900% | | | | N/A (10) | | | | BBB– | | | | 207,100 | |
| | 250 | | | JPMorgan Chase & Company | | | 6.100% | | | | N/A (10) | | | | BBB– | | | | 252,969 | |
| | 550 | | | PNC Financial Services Inc. | | | 6.750% | | | | N/A (10) | | | | Baa2 | | | | 591,938 | |
| | 300 | | | SunTrust Bank Inc. | | | 5.625% | | | | N/A (10) | | | | Baa3 | | | | 307,125 | |
| | 2,367 | | | Wells Fargo & Company | | | 5.875% | | | | N/A (10) | | | | BBB | | | | 2,485,113 | |
| | 225 | | | Zions Bancorporation | | | 7.200% | | | | N/A (10) | | | | BB– | | | | 236,531 | |
| | 8,559 | | | Total Banks | | | | | | | | | | | | | | | 8,870,093 | |
| | | | | |
| | | | Capital Markets – 0.2% | | | | | | | | | | | | |
| | | | | |
| | 200 | | | Goldman Sachs Group Inc. | | | 5.300% | | | | N/A (10) | | | | Ba1 | | | | 191,750 | |
| | 100 | | | Morgan Stanley | | | 5.550% | | | | N/A (10) | | | | Ba1 | | | | 101,125 | |
| | 300 | | | Total Capital Markets | | | | | | | | | | | | | | | 292,875 | |
| | | | | |
| | | | Consumer Finance – 0.4% | | | | | | | | | | | | |
| | | | | |
| | 275 | | | American Express Company | | | 5.200% | | | | N/A (10) | | | | Baa2 | | | | 272,938 | |
| | 400 | | | Capital One Financial Corporation | | | 5.550% | | | | N/A (10) | | | | Baa3 | | | | 405,000 | |
| | 675 | | | Total Consumer Finance | | | | | | | | | | | | | | | 677,938 | |
| | | | | |
| | | | Food Products – 1.2% | | | | | | | | | | | | |
| | | | | |
| | 750 | | | Land O’ Lakes Incorporated, 144A | | | 8.000% | | | | N/A (10) | | | | BB | | | | 765,000 | |
| | 1,371 | | | Land O’ Lakes Incorporated, 144A | | | 8.000% | | | | N/A (10) | | | | BB | | | | 1,398,420 | |
| | 2,121 | | | Total Food Products | | | | | | | | | | | | | | | 2,163,420 | |
| | | | | |
| | | | Industrial Conglomerates – 0.4% | | | | | | | | | | | | |
| | | | | |
| | 740 | | | General Electric Company | | | 5.000% | | | | N/A (10) | | | | A | | | | 767,898 | |
| $ | 12,395 | | | Total $1,000 Par (or similar) Institutional Preferred (cost $12,463,430) | | | | | | | | | | | | | | | 12,772,224 | |
| | | | Total Long-Term Investments (cost $233,649,691) | | | | | | | | | | | | | | | 250,539,465 | |
| | | | | | | | | | | | | | | | | | | | |
Principal
Amount (000) | | | Description (1) | | Coupon | | | Maturity | | | | | | Value | |
| | | | | |
| | | | SHORT-TERM INVESTMENTS – 1.2% (0.8% of Total Investments) | | | | | | | | | | | | | | | | |
| | | | | |
| | | | REPURCHASE AGREEMENTS – 1.2% (0.8% of Total investments) | | | | | | | | | | | | |
| | | | | |
| $ | 804 | | | Repurchase Agreement with Fixed Income Clearing Corporation,
dated 12/30/16, repurchase price $804,117,
collateralized by $815,000 U.S. Treasury Notes,
2.125%, due 6/30/22, value $824,658 | | | 0.030% | | | | 1/03/17 | | | | | | | $ | 804,114 | |
| | | | | |
| | 1,257 | | | Repurchase Agreement with Fixed Income Clearing Corporation,
dated 12/30/16, repurchase price $1,257,025,
collateralized by $1,240,000 U.S. Treasury Notes,
0.125%, due 1/15/23, value $1,285,331 | | | 0.030% | | | | 1/03/17 | | | | | | | | 1,257,021 | |
| $ | 2,061 | | | Total Short-Term Investments (cost $2,061,135) | | | | | | | | | | | | | | | 2,061,135 | |
| | | | Total Investments (cost $235,710,826) – 143.4% | | | | | | | | | | | | | | | 252,600,600 | |
| | | | Borrowings – (43.6)% (11), (12) | | | | | | | | | | | | | | | (76,800,000 | ) |
| | | | Other Assets Less Liabilities – 0.2% (13) | | | | | | | | | | | | | | | 302,362 | |
| | | | Net Assets Applicable to Common Shares – 100% | | | | | | | | | | | | | | $ | 176,102,962 | |
Investments in Derivatives as of December 31, 2016
Interest Rate Swaps
| | | | | | | | | | | | | | | | | | | | | | | | | | | | | | | | | | | | | | | | |
| Counterparty | | Notional
Amount | | | Fund
Pay/Receive
Floating Rate | | | Floating Rate Index | | | Fixed Rate
(Annualized) | | | Fixed Rate
Payment
Frequency | | | Effective
Date (14) | | | Optional
Termination
Date | | | Termination
Date | | | Value | | | Unrealized Appreciation
(Depreciation) | |
JPMorgan Chase Bank, N.A. | | $ | 18,475,000 | | | | Receive | | | | 1-Month USD-
LIBOR-ICE | | | | 1.462 | % | | | Monthly | | | | 7/03/17 | | | | 12/01/18 | | | | 12/01/20 | | | $ | (85,128 | ) | | $ | (329,973 | ) |
JPMorgan Chase Bank, N.A. | | | 18,475,000 | | | | Receive | | | | 1-Month USD-
LIBOR-ICE | | | | 1.842 | | | | Monthly | | | | 7/03/17 | | | | 12/01/20 | | | | 12/01/22 | | | | (179,181 | ) | | | (535,355 | ) |
| | | $ | 36,950,000 | | | | | | | | | | | | | | | | | | | | | | | | | | | | | | | $ | (264,309 | ) | | $ | (865,328 | ) |
| | | | |
| JTA | | Nuveen Tax-Advantaged Total Return Strategy Fund | | |
| | Portfolio of Investments (continued) | | December 31, 2016 |
For Fund portfolio compliance purposes, the Fund’s industry classifications refer to any one or more of the industry sub-classifications used by one or more widely recognized market indexes or ratings group indexes, and/or as defined by Fund management. This definition may not apply for purposes of this report, which may combine industry sub-classifications into sectors for reporting ease.
| (1) | All percentages shown in the Portfolio of Investments are based on net assets applicable to common shares unless otherwise noted. |
| (2) | For fair value measurement disclosure purposes, investment classified as Level 2. See Notes to Financial Statements, Note 2 – Investment Valuation and Fair Value Measurements for more information. |
| (3) | Investment, or portion of investment, is hypothecated as described in Notes to Financial Statements, Note 9 – Borrowing Agreements, Rehypothecation. The total value of investments hypothecated as of the end of the reporting period was $68,723,879. |
| (4) | Investment, or portion of investment, has been pledged to collateralize the net payment obligations for investments in derivatives. |
| (5) | Non-income producing; issuer has not declared a dividend within the past twelve months. |
| (6) | Investment valued at fair value using methods determined in good faith by, or at the discretion of the Board. For fair value measurement disclosure purposes, investment classified as Level 3. See Notes to Financial Statements, Note 2 – Investment Valuation and Fair Value Measurements for more information. |
| (7) | For financial reporting purposes, the ratings disclosed are the highest of Standard & Poor’s Group (“Standard & Poor’s”), Moody’s Investors Service, Inc. (“Moody’s”) or Fitch, Inc. (“Fitch”) rating. This treatment of split-rated securities may differ from that used for other purposes, such as for Fund investment policies. Ratings below BBB by Standard & Poor’s, Baa by Moody’s or BBB by Fitch are considered to be below investment grade. Holdings designated N/R are not rated by any of these national rating agencies. Rating are not covered by the report of independent registered public accounting firm. |
| (8) | Senior loans generally pay interest at rates which are periodically adjusted by reference to a base short-term, floating lending rate plus an assigned fixed rate. These floating lending rates are generally (i) the lending rate referenced by the London Inter-Bank Offered Rate (“LIBOR”), or (ii) the prime rate offered by one or more major United States banks. Senior loans may be considered restricted in that the Fund ordinarily is contractually obligated to receive approval from the agent bank and/or borrower prior to the disposition of a senior loan. The rate shown in the coupon as of the end of the reporting period. |
| (9) | Senior loans generally are subject to mandatory and/or optional prepayment. Because of these mandatory prepayment conditions and because there may be significant economic incentives for a borrower to prepay, prepayments of senior loans may occur. As a result, the actual remaining maturity of senior loans held may be substantially less than the stated maturities shown. |
| (10) | Perpetual security. Maturity date is not applicable. |
| (11) | Borrowings as a percentage of Total Investments is 30.4%. |
| (12) | The Fund may pledge up to 100% of its eligible investments (excluding any investments separately pledged as collateral for specific investments in derivatives) in the Portfolio of Investments as collateral for borrowings. As of the end of the reporting period, investments with a value of $175,692,693 have been pledged as collateral for borrowings. |
| (13) | Other assets less liabilities includes the unrealized appreciation (depreciation) of certain over-the-counter (“OTC”) derivatives as presented on the Statement of Assets and Liabilities, when applicable. The unrealized appreciation (depreciation) of OTC-cleared and exchange-traded derivatives is recognized as part of the cash collateral at brokers and/or the receivable or payable for variation margin as presented on the Statement of Assets and Liabilities, when applicable. |
| (14) | Effective date represents the date on which both the Fund and counterparty commence interest payment accruals on each contract. |
| (DD1) | Portion of investment purchased on a delayed delivery basis. |
| (WI/DD) | Purchased on a when-issued or delayed delivery basis. |
| 144A | Investment is exempt from registration under Rule 144A of the Securities Act of 1933, as amended. These investments may only be resold in transactions exempt from registration, which are normally those transactions with qualified institutional buyers. |
| ADR | American Depositary Receipt |
| TBD | Senior loan purchased on a when-issued or delayed-delivery basis. Certain details associated with this purchase are not known prior to the settlement date of the transaction. In addition, senior loans typically trade without accrued interest and therefore a coupon rate is not available prior to settlement. At settlement, if still unknown, the borrower or counterparty will provide the Fund with the final coupon rate and maturity date. |
| USD-LIBOR-ICE | United States Dollar – London Inter-Bank Offered Rate Intercontinental Exchange |
See accompanying notes to financial statements.
| | | | | | |
Statement of Assets and Liabilities | | December 31, 2016 |
| | | | |
Assets | | | | |
Long-term investments, at value (cost $233,649,691) | | $ | 250,539,465 | |
Short-term investments, at value (cost approximates value) | | | 2,061,135 | |
Cash denominated in foreign currencies (cost $101,831) | | | 101,628 | |
Interest rate swaps premiums paid | | | 601,019 | |
Receivable for: | | | | |
Dividends | | | 423,736 | |
Interest | | | 378,324 | |
Investments sold | | | 3,559,287 | |
Reclaims | | | 234,414 | |
Other assets | | | 43,241 | |
Total assets | | | 257,942,249 | |
Liabilities | | | | |
Borrowings | | | 76,800,000 | |
Unrealized depreciation on interest rate swaps | | | 865,328 | |
Payable for investments purchased | | | 3,830,600 | |
Accrued expenses: | | | | |
Interest on borrowings | | | 9,031 | |
Management fees | | | 184,533 | |
Trustees fees | | | 42,797 | |
Other | | | 106,998 | |
Total liabilities | | | 81,839,287 | |
Net assets applicable to common shares | | $ | 176,102,962 | |
Common shares outstanding | | | 13,843,146 | |
Net asset value (“NAV”) per common share outstanding | | $ | 12.72 | |
Net assets applicable to common shares consist of: | | | | |
Common shares, $0.01 par value per share | | $ | 138,431 | |
Paid-in surplus | | | 193,788,681 | |
Undistributed (Over-distribution of) net investment income | | | (93,452 | ) |
Accumulated net realized gain (loss) | | | (33,757,171 | ) |
Net unrealized appreciation (depreciation) | | | 16,026,473 | |
Net assets applicable to common shares | | $ | 176,102,962 | |
Authorized shares: | | | | |
Common | | | Unlimited | |
Preferred | | | Unlimited | |
See accompanying notes to financial statements.
| | | | | | |
Statement of Operations | | Year Ended December 31, 2016 |
| | | | |
Investment Income | | | | |
Dividends (net of foreign tax withheld of $410,781) | | $ | 6,864,790 | |
Interest | | | 2,923,562 | |
Other | | | 42,630 | |
Total investment income | | | 9,830,982 | |
Expenses | | | | |
Management fees | | | 2,171,927 | |
Interest expense on borrowings | | | 921,589 | |
Custodian fees | | | 114,113 | |
Trustees fees | | | 7,188 | |
Professional fees | | | 46,123 | |
Shareholder reporting expenses | | | 51,680 | |
Shareholder servicing agent fees | | | 704 | |
Stock exchange listing fees | | | 7,832 | |
Investor relations expenses | | | 38,971 | |
Other | | | 15,528 | |
Total expenses | | | 3,375,655 | |
Net investment income (loss) | | | 6,455,327 | |
Realized and Unrealized Gain (Loss) | | | | |
Net realized gain (loss) from: | | | | |
Investments and foreign currency | | | 2,100,108 | |
Options written | | | 301,922 | |
Swaps | | | 3,006 | |
Change in net unrealized appreciation (depreciation) of: | | | | |
Investments and foreign currency | | | 118,017 | |
Options written | | | (83,089 | ) |
Swaps | | | (136,807 | ) |
Net realized and unrealized gain (loss) | | | 2,303,157 | |
Net increase (decrease) in net assets applicable to common shares from operations | | $ | 8,758,484 | |
See accompanying notes to financial statements.
| | | | | | |
Statement of Changes in Net Assets | | |
| | | | | | | | |
| | | Year
Ended
12/31/16 | | | Year
Ended
12/31/15 | |
Operations | | | | | | | | |
Net investment income (loss) | | $ | 6,455,327 | | | $ | 6,564,381 | |
Net realized gain (loss) from: | | | | | | | | |
Investments and foreign currency | | | 2,100,108 | | | | 22,119,284 | |
Options written | | | 301,922 | | | | 295,386 | |
Swaps | | | 3,006 | | | | (3,788 | ) |
Change in net unrealized appreciation (depreciation) of: | | | | | | | | |
Investments and foreign currency | | | 118,017 | | | | (31,082,236 | ) |
Options written | | | (83,089 | ) | | | 95,815 | |
Swaps | | | (136,807 | ) | | | (828,755 | ) |
Net increase (decrease) in net assets applicable to common shares from operations | | | 8,758,484 | | | | (2,839,913 | ) |
Distributions to Common Shareholders | | | | | | | | |
From net investment income | | | (9,043,510 | ) | | | (15,061,343 | ) |
Return of capital | | | (4,965,754 | ) | | | — | |
Decrease in net assets applicable to common shares from distributions to common shareholders | | | (14,009,264 | ) | | | (15,061,343 | ) |
Net increase (decrease) in net assets applicable to common shares | | | (5,250,780 | ) | | | (17,901,256 | ) |
Net assets applicable to common shares at the beginning of period | | | 181,353,742 | | | | 199,254,998 | |
Net assets applicable to common shares at the end of period | | $ | 176,102,962 | | | $ | 181,353,742 | |
Undistributed (Over-distribution of) net investment income at the end of period | | $ | (93,452 | ) | | $ | 84,754 | |
See accompanying notes to financial statements.
| | | | | | |
Statement of Cash Flows | | Year Ended December 31, 2016 |
| | | | |
Cash Flows from Operating Activities: | | | | |
Net Increase (Decrease) in Net Assets Applicable to Common Shares from Operations | | $ | 8,758,484 | |
Adjustments to reconcile the net increase (decrease) in net assets applicable to common shares from
operations to net cash provided by (used in) operating activities: | | | | |
Purchases of investments | | | (105,693,712 | ) |
Proceeds from sales and maturities of investments | | | 116,552,046 | |
Proceeds from (Purchases of) short-term investments, net | | | 759,848 | |
Proceeds from (Payments for) cash denominated in foreign currencies, net | | | (101,831 | ) |
Proceeds from (Payments for) closed foreign currency spot contracts | | | (182,723 | ) |
Proceeds from (Payments for) swap contracts, net | | | 3,006 | |
Premiums received (paid) for interest rate swaps | | | (380,140 | ) |
Premiums received for options written | | | 151,078 | |
Cash paid for terminated options written | | | (6,395 | ) |
Capital gain and return of capital distributions from investments | | | 674,524 | |
Payment-in-kind distributions | | | (327 | ) |
Proceeds from litigation settlement | | | 42,451 | |
Amortization (Accretion) of premiums and discounts, net | | | 147,350 | |
(Increase) Decrease in: | | | | |
Receivable for dividends | | | 31,242 | |
Receivable for interest | | | (99,100 | ) |
Receivable for investments sold | | | 788,859 | |
Receivable for reclaims | | | (122,323 | ) |
Other assets | | | 305 | |
Increase (Decrease) in: | | | | |
Payable for investments purchased | | | 1,415,148 | |
Accrued management fees | | | (10,829 | ) |
Accrued interest on borrowings | | | 4,074 | |
Accrued Trustees fees | | | 176 | |
Accrued other expenses | | | 13,883 | |
Net realized (gain) loss from: | | | | |
Investments and foreign currency | | | (2,100,108 | ) |
Options written | | | (301,922 | ) |
Swaps | | | (3,006 | ) |
Change in net unrealized (appreciation) depreciation of: | | | | |
Investments and foreign currency | | | (118,017 | ) |
Options written | | | 83,089 | |
Swaps | | | 136,807 | |
Net cash provided by (used in) operating activities | | | 20,441,937 | |
Cash Flows from Financing Activities: | | | | |
Proceeds from borrowings | | | 400,000 | |
Repayments of borrowings | | | (6,000,000 | ) |
Increase (Decrease) in cash overdraft | | | (832,673 | ) |
Cash distributions paid to common shareholders | | | (14,009,264 | ) |
Net cash provided by (used in) financing activities | | | (20,441,937 | ) |
Net Increase (Decrease) in Cash | | | — | |
Cash at the beginning of period | | | — | |
Cash at the end of period | | $ | — | |
| |
| Supplemental Disclosures of Cash Flow Information | | | |
Cash paid for interest on borrowings (excluding borrowing costs) | | $ | 917,515 | |
See accompanying notes to financial statements.
THIS PAGE INTENTIONALLY LEFT BLANK
Financial
Highlights
Selected data for a share outstanding throughout each period:
| | | | | | | | | | | | | | | | | | | | | | | | | | | | | | | | | | | | | | | | | | | | |
| | | | |
| | | | | | Investment Operations | | | Less Distributions to
Common Shareholders | | | Common Share | |
| | | Beginning
Common
Share
NAV | | | Net
Investment
Income
(Loss)(a) | | | Net
Realized/
Unrealized
Gain (Loss) | | | Total | | | From
Net
Investment
Income | | | From
Accum-
ulated
Net
Realized
Gains | | | Return of
Capital | | | Total | | | Discount
from
Shares
Repurchased
and
Retired | | | Ending
NAV | | | Ending
Share
Price | |
Year Ended 12/31: | |
2016 | | $ | 13.10 | | | $ | 0.47 | | | $ | 0.16 | | | $ | 0.63 | | | $ | (0.65 | ) | | $ | — | | | $ | (0.36 | ) | | $ | (1.01 | ) | | $ | — | | | $ | 12.72 | | | $ | 11.32 | |
2015 | | | 14.39 | | | | 0.47 | | | | (0.67 | ) | | | (0.20 | ) | | | (1.09 | ) | | | — | | | | — | | | | (1.09 | ) | | | — | | | | 13.10 | | | | 11.67 | |
2014 | | | 14.71 | | | | 0.49 | | | | 0.22 | | | | 0.71 | | | | (1.03 | ) | | | — | | | | — | | | | (1.03 | ) | | | — | | | | 14.39 | | | | 13.29 | |
2013 | | | 11.67 | | | | 0.34 | | | | 3.63 | | | | 3.97 | | | | (0.87 | ) | | | — | | | | (0.06 | ) | | | (0.93 | ) | | | — | | | | 14.71 | | | | 14.10 | |
2012 | | | 10.97 | | | | 0.37 | | | | 1.21 | | | | 1.58 | | | | (0.48 | ) | | | — | | | | (0.40 | ) | | | (0.88 | ) | | | — | * | | | 11.67 | | | | 10.51 | |
| | | | | | | | |
| | | Borrowings at the End of Period | |
| | | Aggregate
Amount
Outstanding
(000) | | | Asset
Coverage
Per $1,000 | |
Year Ended 12/31: | | | | | | | | |
2016 | | $ | 76,800 | | | $ | 3,293 | |
2015 | | | 82,400 | | | | 3,201 | |
2014 | | | 89,400 | | | | 3,229 | |
2013 | | | 85,000 | | | | 3,394 | |
2012 | | | 67,900 | | | | 3,377 | |
| | | | | | | | | | | | | | | | | | | | | | | | | | | | | | |
| | | | | | | Common Share Supplemental Data/
Ratios Applicable to Common Shares | |
Common Share
Total Returns | | | | | | Ratios to Average Net Assets
Before Reimbursement(c) | | | Ratios to Average Net Assets
After Reimbursement(c)(d) | | | | |
Based
on
NAV(b) | | | Based
on
Share
Price(b) | | |
Ending
Net
Assets
(000) | | | Expenses | | | Net
Investment
Income (Loss) | | | Expenses | | | Net
Investment
Income (Loss) | | | Portfolio
Turnover
Rate(e) | |
| | | | | | | | | | | | | | | | | | | | | | | | | | | | | | |
| | 5.10 | % | | | 5.85 | % | | $ | 176,103 | | | | 1.93 | % | | | 3.69 | % | | | N/A | | | | N/A | | | | 42 | % |
| | (1.49 | ) | | | (4.17 | ) | | | 181,354 | | | | 1.87 | | | | 3.34 | | | | N/A | | | | N/A | | | | 49 | |
| | 4.91 | | | | 1.44 | | | | 199,255 | | | | 1.85 | | | | 3.35 | | | | N/A | | | | N/A | | | | 34 | |
| | 34.97 | | | | 44.22 | | | | 203,528 | | | | 1.87 | | | | 2.55 | | | | N/A | | | | N/A | | | | 39 | |
| | 14.54 | | | | 19.31 | | | | 161,395 | | | | 2.00 | | | | 3.11 | | | | 1.99 | % | | | 3.12 | % | | | 37 | |
| (a) | Per share Net Investment Income (Loss) is calculated using the average daily shares method. |
| (b) | Total Return Based on Common Share NAV is the combination of changes in common share NAV, reinvested dividend income at NAV and reinvested capital gains distributions at NAV, if any. The last dividend declared in the period, which is typically paid on the first business day of the following month, is assumed to be reinvested at the ending NAV. The actual reinvest price for the last dividend declared in the period may often be based on the Fund’s market price (and not its NAV), and therefore may be different from the price used in the calculation. Total returns are not annualized. |
Total Return Based on Common Share Price is the combination of changes in the market price per share and the effect of reinvested dividend income and reinvested capital gains distributions, if any, at the average price paid per share at the time of reinvestment. The last dividend declared in the period, which is typically paid on the first business day of the following month, is assumed to be reinvested at the ending market price. The actual reinvestment for the last dividend declared in the period takes place over several days, and in some instances may not be based on the market price, so the actual reinvestment price may be different from the price used in the calculation. Total returns are not annualized.
| (c) • | Net Investment Income (Loss) ratios reflect income earned and expenses incurred on assets attributable to borrowings (as described in Note 9 –Borrowing Arrangements). |
| | • | Each ratio includes the effect of all interest expense paid and other costs related to borrowings, as follows: |
| | | | |
Ratios of Borrowings Interest Expense to Average Net Assets Applicable
to Common Shares | |
Year Ended 12/31: | | | | |
2016 | | | 0.53 | % |
2015 | | | 0.47 | |
2014 | | | 0.45 | |
2013 | | | 0.49 | |
2012 | | | 0.58 | |
| (d) | After expense reimbursement from the Adviser, where applicable. As of January 31, 2012, the Adviser is no longer reimbursing the Fund for any fees or expenses. |
| (e) | Portfolio Turnover Rate is calculated based on the lesser of long-term purchases or sales (as disclosed in Note 5 – Investment Transactions) divided by the average long-term market value during the period. |
| * | Rounds to less than $0.01 per share. |
| N/A | Fund no longer has a contractual reimbursement agreement with the Adviser. |
See accompanying notes to financial statements.
Notes to
Financial Statements
1. General Information and Significant Accounting Policies
General Information
Fund Information
Nuveen Tax-Advantaged Total Return Strategy Fund (the “Fund”) is registered under the Investment Company Act of 1940, as amended, as a diversified closed-end management investment company. The Fund’s common shares are listed on the New York Stock Exchange (“NYSE”) and trade under the ticker symbol “JTA.” The Fund was organized as a Massachusetts business trust on October 1, 2003.
The end of the reporting period for the Fund is December 31, 2016, and the period covered by these Notes to Financial Statements is the fiscal year ended December 31, 2016 (the “current fiscal period”).
Investment Adviser
The Fund’s investment adviser is Nuveen Fund Advisors, LLC (the “Adviser”), a subsidiary of Nuveen, LLC (“Nuveen”). Nuveen is the investment management arm of Teachers Insurance and Annuity Association of America (TIAA). The Adviser has overall responsibility for management of the Fund, oversees the management of the Fund’s portfolio, manages the Fund’s business affairs and provides certain clerical, bookkeeping and other administrative services, and, if necessary, asset allocation decisions. The Adviser has entered into sub-advisory agreements with NWQ Investment Management Company, LLC (“NWQ”) and Symphony Asset Management LLC (“Symphony”) (each a “Sub-Adviser” and collectively, the “Sub-Advisers”), each an affiliate of Nuveen. NWQ manages the portion of the Fund’s investment portfolio allocated to dividend-paying common and preferred stocks, including American Depositary Receipts (“ADRs”) and the Fund’s options strategy. Symphony manages the portion of the Fund’s investment portfolio allocated to senior loans and other debt instruments. The Adviser is responsible for managing the Fund’s investments in swap contracts.
Investment Objectives and Principal Investment Strategies
The Fund’s investment objective is to achieve a high level of after-tax total return consisting primarily of tax-advantaged dividend income and capital appreciation. The Fund invests at least 60% of the Fund’s managed assets in tax-advantaged income-producing equity securities, including dividend received deduction (DRD) preferred securities. The Fund also invests 15% to 25% in senior loans and other debt instruments, as well as 5% to 15% in preferred stocks that are eligible to pay tax-advantage dividends.
Significant Accounting Policies
The Fund is an investment company and follows accounting and reporting guidance under Financial Accounting Standards Board (FASB) Accounting Standards Codification (ASC) Topic 946 “Financial Services – Investment Companies.” The following is a summary of significant accounting policies followed by the Fund in the preparation of its financial statements in accordance with U.S. generally accepted accounting principles (“U.S. GAAP”).
Investment Transactions
Investment transactions are recorded on a trade date basis. Trade date for senior and subordinated loans purchased in the “primary market” is considered the date on which the loan allocations are determined. Trade date for senior and subordinated loans purchased in the “secondary market” is the date on which the transaction is entered into. Realized gains and losses from investment transactions are determined on the specific identification method, which is the same basis used for federal income tax purposes. Investments purchased on a when-issued/delayed delivery basis may have extended settlement periods. Any investments so purchased are subject to market fluctuation during this period. The Fund has earmarked securities in it’s portfolio with a current value at least equal to the amount of the when-issued/delayed delivery purchase commitments.
As of the end of the reporting period, the Fund’s outstanding when-issued/delayed delivery purchase commitments were as follows:
| | | | |
Outstanding when-issued/delayed delivery purchase commitments | | | $2,671,692 | |
Investment Income
Dividend income is recorded on the ex-dividend date or, for foreign securities, when information is available. Interest income, which reflects the amortization of premiums and includes accretion of discounts for financial reporting purposes, is recorded on an accrual basis. Fee income consists primarily of amendment fees. Amendment fees are earned as compensation for evaluating and accepting changes to an original senior loan agreement and are recognized when received. Fee income and amendment fees are a component of “Interest income” on the Statement of Operations, if any. Other income is comprised of fees earned in connection with the rehypothecation of pledged collateral as further described in Note 9 – Borrowing Arrangements, Rehypothecation.
Professional Fees
Professional fees presented on the Statement of Operations consist of legal fees incurred in the normal course of operations, audit fees, tax consulting fees and, in some cases, workout expenditures. Workout expenditures are incurred in an attempt to protect or enhance an investment or to pursue other claims or legal actions on behalf of Fund shareholders. If a refund is received for workout expenditures paid in a prior reporting period, such amounts will be recognized as “Legal fee refund” on the Statement of Operations.
Dividends and Distributions to Common Shareholders
Distributions to common shareholders are recorded on the ex-dividend date. The amount and timing of distributions are determined in accordance with federal income tax regulations, which may differ from U.S. GAAP.
The Fund makes quarterly cash distributions to common shareholders of a stated dollar amount per share. Subject to approval and oversight by the Fund’s Board of Trustees (the “Board”), the Fund seeks to maintain a stable distribution level designed to deliver the long-term return potential of the Fund’s investment strategy through regular quarterly distributions (a “Managed Distribution Program”). Total distributions during a calendar year generally will be made from the Fund’s net investment income, net realized capital gains and net unrealized capital gains in the Fund’s portfolio, if any. The portion of distributions paid attributed to net unrealized gains, if any, is distributed from the Fund’s assets and is treated by shareholders as a nontaxable distribution (“return of capital”) for tax purposes. In the event that total distributions during a calendar year exceed the Fund’s total return on net asset value (“NAV”), the difference will reduce NAV per share. If the Fund’s total return on NAV exceeds total distributions during a calendar year, the excess will be reflected as an increase in NAV per share. The final determination of the source and character of all distributions paid by the Fund during the fiscal year is made after the end of the fiscal year and is reflected in the financial statements contained in the annual report as of December 31 each year.
The tax character of Fund distributions for a fiscal year is dependent upon the amount and tax character of distributions received from securities held in the Fund’s portfolio. Distributions received from certain securities in which the Fund invests, most notably REIT securities, may be characterized for tax purposes as ordinary income, long-term capital gain and/or a return of capital. The issuer of a security reports the tax character of its distributions only once per year, generally during the first two months of the calendar year. The distribution is included in the Fund’s ordinary income until such time the Fund is notified by the issuer of the actual tax character. For the current fiscal period dividend income, net realized gain (loss) and unrealized appreciation (depreciation) recognized on the Statement of Operations reflect the amounts of ordinary income, capital gain, and/or return of capital as reported by the issuers of such securities.
Indemnifications
Under the Fund’s organizational documents, its officers and trustees are indemnified against certain liabilities arising out of the performance of their duties to the Fund. In addition, in the normal course of business, the Fund enters into contracts that provide general indemnifications to other parties. The Fund’s maximum exposure under these arrangements is unknown as this would involve future claims that may be made against the Fund that have not yet occurred. However, the Fund has not had prior claims or losses pursuant to these contracts and expects the risk of loss to be remote.
Netting Agreements
In the ordinary course of business, the Fund may enter into transactions subject to enforceable master repurchase agreements, International Swaps and Derivative Association, Inc. (“ISDA”) master agreements or other similar arrangements (“netting agreements”). Generally, the right to offset in netting agreements allows the Fund to offset certain securities and derivatives with a specific counterparty, when applicable, as well as any collateral received or delivered to that counterparty based on the terms of the agreements. Generally, the Fund manages its cash collateral and securities collateral on a counterparty basis.
The Fund’s investments subject to netting agreements as of the end of the reporting period, if any, are further described in Note 3 – Portfolio Securities and Investments in Derivatives.
Use of Estimates
The preparation of financial statements in conformity with U.S. GAAP requires management to make estimates and assumptions that affect the reported amounts of assets and liabilities at the date of the financial statements and the reported amounts of increases and decreases in net assets applicable to common shares from operations during the current fiscal period. Actual results may differ from those estimates.
2. Investment Valuation and Fair Value Measurements
The fair valuation input levels as described below are for fair value measurement purposes.
Fair value is defined as the price that would be received upon selling an investment or transferring a liability in an orderly transaction to an independent buyer in the principal or most advantageous market for the investment. A three-tier hierarchy is used to maximize the use of observable market data and minimize the use of unobservable inputs and to establish classification of fair value measurements for disclosure purposes. Observable inputs reflect the assumptions market participants would use in pricing the asset or liability. Observable inputs are based on market data obtained from sources
Notes to Financial Statements (continued)
independent of the reporting entity. Unobservable inputs reflect the reporting entity’s own assumptions about the assumptions market participants would use in pricing the asset or liability. Unobservable inputs are based on the best information available in the circumstances. The following is a summary of the three-tiered hierarchy of valuation input levels.
| | |
| Level 1 – | | Inputs are unadjusted and prices are determined using quoted prices in active markets for identical securities. |
| Level 2 – | | Prices are determined using other significant observable inputs (including quoted prices for similar securities, interest rates, prepayment speeds, credit risk, etc.). |
| Level 3 – | | Prices are determined using significant unobservable inputs (including management’s assumptions in determining the fair value of investments). |
Common stocks and other equity-type securities are valued at the last sales price on the securities exchange on which such securities are primarily traded and are generally classified as Level 1. Securities primarily traded on the NASDAQ National Market (“NASDAQ”) are valued at the NASDAQ Official Closing Price and are generally classified as Level 1. However, securities traded on a securities exchange or NASDAQ for which there were no transactions on a given day or securities not listed on a securities exchange or NASDAQ are valued at the quoted bid price and are generally classified as Level 2. Prices of certain ADRs held by the Fund that trade in the United States are valued based on the last traded price, official closing price or the most recent bid price of the underlying non-U.S.-traded stock, adjusted as appropriate for the underlying-to-ADR conversion ratio and foreign exchange rate, and from time-to-time may also be adjusted further to take into account material events that may take place after the close of the local non-U.S. market but before the close of the NYSE, which may represent a transfer from a Level 1 to a Level 2 security.
Prices of fixed-income securities are provided by an independent pricing service (“pricing service”) approved by the Board. The pricing service establishes a security’s fair value using methods that may include consideration of the following: yields or prices of investments of comparable quality, type of issue, coupon, maturity and rating, market quotes or indications of value from security dealers, evaluations of anticipated cash flows or collateral, general market conditions and other information and analysis, including the obligor’s credit characteristics considered relevant. These securities are generally classified as Level 2. In pricing certain securities, particularly less liquid and lower quality securities, the pricing service may consider information about a security, its issuer or market activity provided by the Adviser. These securities are generally classified as Level 2 or Level 3 depending on the observability of the significant inputs.
Like most fixed-income securities, the senior and subordinated loans in which the Fund invests are not listed on an organized exchange. The secondary market of such investments may be less liquid relative to markets for other fixed-income securities. Consequently, the value of senior and subordinated loans, determined as described above, may differ significantly from the value that would have been determined had there been an active market for that senior loan. These securities are generally classified as Level 2.
Prices of swap contracts are also provided by a pricing service approved by the Board using the same methods as described above and are generally classified as Level 2.
The value of exchange-traded options are based on the mean of the closing bid and ask prices. Exchange-traded options are generally classified as Level 1. Options traded in the over-the-counter (“OTC”) market are valued using an evaluated mean price and are generally classified as Level 2.
Repurchase agreements are valued at contract amount plus accrued interest, which approximates market value. These securities are generally classified as Level 2.
Investments initially valued in currencies other than the U.S. dollar are converted to the U.S. dollar using exchange rates obtained from pricing services. As a result, the NAV of the Fund’s shares may be affected by changes in the value of currencies in relation to the U.S. dollar. The value of securities traded in markets outside the United States or denominated in currencies other than the U.S. dollar may be affected significantly on a day that the NYSE is closed and an investor is not able to purchase, redeem or exchange shares. If significant market events occur between the time of determination of the closing price of a foreign security on an exchange and the time that the Fund’s NAV is determined, or if under the Fund’s procedures, the closing price of a foreign security is not deemed to be reliable, the security would be valued at fair value as determined in accordance with procedures established in good faith by the Board. These securities are generally classified as Level 2 or Level 3 depending on the observability of the significant inputs.
Certain securities may not be able to be priced by the pre-established pricing methods as described above. Such securities may be valued by the Board and/or its appointee at fair value. These securities generally include, but are not limited to, restricted securities (securities which may not be publicly sold without registration under the Securities Act of 1933, as amended) for which a pricing service is unable to provide a market price; securities whose trading has been formally suspended; debt securities that have gone into default and for which there is no current market quotation; a security whose market price is not available from a pre-established pricing source; a security with respect to which an event has occurred that is likely to materially affect the value of the security after the market has closed but before the calculation of the Fund’s NAV (as may be the case in non-U.S. markets on which the security is primarily traded) or make it difficult or impossible to obtain a reliable market quotation; and a security whose price, as provided by the pricing service, is not deemed to reflect the security’s fair value. As a general principle, the fair value of a security would appear to be the amount that the owner might reasonably expect to receive for it in a current sale. A variety of factors may be considered in determining the fair value of such securities, which may include consideration of the following: yields or prices of investments of comparable quality, type of issue, coupon, maturity and rating, market
quotes or indications of value from security dealers, evaluations of anticipated cash flows or collateral, general market conditions and other information and analysis, including the obligor’s credit characteristics considered relevant. These securities are generally classified as Level 2 or Level 3 depending on the observability of the significant inputs. Regardless of the method employed to value a particular security, all valuations are subject to review by the Board and/or its appointee.
The inputs or methodologies used for valuing securities are not an indication of the risks associated with investing in those securities. The following is a summary of the Fund’s fair value measurements as of the end of the reporting period:
| | | | | | | | | | | | | | | | |
| | | Level 1 | | | Level 2 | | | Level 3 | | | Total | |
Long-Term Investments*: | | | | | | | | | | | | | | | | |
Common Stocks | | $ | 101,715,095 | | | $ | 61,423,268 | ** | | $ | — | *** | | $ | 163,138,363 | |
Convertible Preferred Securities | | | 5,833,004 | | | | 5,837,351 | ** | | | — | | | | 11,670,355 | |
$25 Par (or similar) Retail Preferred | | | 12,013,063 | | | | 1,405,759 | ** | | | — | | | | 13,418,822 | |
Variable Rate Senior Loan Interests | | | — | | | | 48,434,548 | | | | — | | | | 48,434,548 | |
Corporate Bonds | | | — | | | | 1,105,153 | | | | — | | | | 1,105,153 | |
$1,000 Par (or similar) Institutional Preferred | | | — | | | | 12,772,224 | | | | — | | | | 12,772,224 | |
| | | | |
Short-Term Investments: | | | | | | | | | | | | | | | | |
Repurchase Agreements | | | — | | | | 2,061,135 | | | | — | | | | 2,061,135 | |
| | | | |
Investments in Derivatives: | | | | | | | | | | | | | | | | |
Interest Rate Swaps**** | | | — | | | | (865,328 | ) | | | — | | | | (865,328 | ) |
Total | | $ | 119,561,162 | | | $ | 132,174,110 | | | $ | — | | | $ | 251,735,272 | |
| * | Refer to the Fund’s Portfolio of Investments for industry classifications. |
| ** | Refer to the Fund’s Portfolio of Investments for securities classified as Level 2. |
| *** | Refer to the Fund’s Portfolio of Investments for securities classified as Level 3. Value equals zero as of the end of the reporting period. |
| **** | Represents net unrealized appreciation (depreciation) as reported in the Fund’s Portfolio of Investments. |
The table below presents the transfers in and out of the three valuation levels for the Fund as of the end of the reporting period when compared to the valuation levels as of the end of the previous fiscal year. Changes in valuation inputs or methodologies may result in transfers into or out of an assigned level within the fair value hierarchy. Transfers in or out of levels are generally due to the availability of publicly available information and to the significance or extent the Adviser determines that the valuation inputs or methodologies may impact the valuation of those securities.
| | | | | | | | | | | | | | | | | | | | | | | | |
| | | Level 1 | | | Level 2 | | | Level 3 | |
| | | Transfers In | | | (Transfers Out) | | | Transfers In | | | (Transfers Out) | | | Transfers In | | | (Transfers Out) | |
Common Stocks | | $ | — | | | $ | (3,995,860 | ) | | $ | 3,995,860 | | | $ | — | | | $ | — | | | $ | — | |
The Board is responsible for the valuation process and has appointed the oversight of the daily valuation process to the Adviser’s Valuation Committee. The Valuation Committee, pursuant to the valuation policies and procedures adopted by the Board is responsible for making fair value determinations, evaluating the effectiveness of the Fund’s pricing policies and reporting to the Board. The Valuation Committee is aided in its efforts by the Adviser’s dedicated Securities Valuation Team, which is responsible for administering the daily valuation process and applying fair value methodologies as approved by the Valuation Committee. When determining the reliability of independent pricing services for investments owned by the Fund, the Valuation Committee, among other things, conducts due diligence reviews of the pricing services and monitors the quality of security prices received through various testing reports conducted by the Securities Valuation Team.
The Valuation Committee will consider pricing methodologies it deems relevant and appropriate when making a fair value determination, based on the facts and circumstances specific to the portfolio instrument. Fair value determinations generally will be derived as follows, using public or private market information:
| | (i) | If available, fair value determinations shall be derived by extrapolating from recent transactions or quoted prices for identical or comparable securities. |
| | (ii) | If such information is not available, an analytical valuation methodology may be used based on other available information including, but not limited to: analyst appraisals, research reports, corporate action information, issuer financial statements and shelf registration statements. Such analytical valuation methodologies may include, but are not limited to: multiple of earnings, discount from market value of a similar freely-traded security, discounted cash flow analysis, book value or a multiple thereof, risk premium/yield analysis, yield to maturity and/or fundamental investment analysis. |
The purchase price of a portfolio instrument will be used to fair value the instrument only if no other valuation methodology is available or deemed appropriate, and it is determined that the purchase price fairly reflects the instrument’s current value.
For each portfolio security that has been fair valued pursuant to the policies adopted by the Board, the fair value price is compared against the last available and next available market quotations. The Valuation Committee reviews the results of such testing and fair valuation occurrences are reported to the Board.
Notes to Financial Statements (continued)
3. Portfolio Securities and Investments in Derivatives
Portfolio Securities
Foreign Currency Transactions
To the extent that the Fund may invest in securities and/or contracts that are denominated in a currency other than U.S. dollars, the Fund will be subject to currency risk, which is the risk that an increase in the U.S. dollar relative to the foreign currency will reduce returns or portfolio value. Generally, when the U.S. dollar rises in value against a foreign currency, the Fund’s investments denominated in that currency will lose value because its currency is worth fewer U.S. dollars; the opposite effect occurs if the U.S. dollar falls in relative value. Investments and other assets and liabilities denominated in foreign currencies are converted into U.S. dollars on a spot (i.e. cash) basis at the spot rate prevailing in the foreign currency exchange market at the time of valuation. Purchases and sales of investments and income denominated in foreign currencies are translated into U.S. dollars on the respective dates of such transactions.
As of the end of the reporting period, the Fund’s investments in non-U.S. securities were as follows:
| | | | | | | | |
| | | Value | | | % of Total
Investments | |
Country: | | | | | | | | |
Germany | | $ | 21,775,667 | | | | 8.6 | % |
United Kingdom | | | 18,566,899 | | | | 7.4 | |
Switzerland | | | 11,002,286 | | | | 4.4 | |
Netherlands | | | 8,323,739 | | | | 3.3 | |
Japan | | | 8,290,536 | | | | 3.3 | |
Other | | | 34,098,038 | | | | 13.4 | |
Total non-U.S. securities | | $ | 102,057,165 | | | | 40.4 | % |
The books and records of the Fund are maintained in U.S. dollars. Foreign currencies, assets and liabilities are translated into U.S. dollars at 4:00 p.m. Eastern Time. Investment transactions, income and expenses are translated on the respective dates of such transactions. Net realized foreign currency gains and losses resulting from changes in exchange rates include foreign currency gains and losses between trade date and settlement date of the transactions, foreign currency transactions and the difference between the amounts of interest and dividends recorded on the books of the Fund and the amounts actually received.
The realized gains and losses resulting from changes in foreign currency exchange rates and changes in foreign exchange rates associated with (i) foreign currency (ii) investments, (iii) investments in derivatives and (iv) other assets and liabilities are recognized as a component of “Net realized gain (loss) from investments and foreign currency” on the Statement of Operations, when applicable.
The unrealized gains and losses resulting from changes in foreign currency exchange rates and changes in foreign exchange rates associated with (i) investments and (ii) other assets and liabilities are recognized as a component of “Change in unrealized appreciation (depreciation) of investments and foreign currency” on the Statement of Operations, when applicable. The unrealized gains and losses resulting from changes in foreign exchange rates associated with investments in derivatives are recognized as a component of the respective derivative’s related “Change in net unrealized appreciation (depreciation)” on the Statement of Operations, when applicable.
Repurchase Agreements
In connection with transactions in repurchase agreements, it is the Fund’s policy that its custodian take possession of the underlying collateral securities, the fair value of which exceeds the principal amount of the repurchase transaction, including accrued interest, at all times. If the counterparty defaults, and the fair value of the collateral declines, realization of the collateral may be delayed or limited.
The following table presents the repurchase agreements for the Fund that are subject to netting agreements as of the end of the reporting period, and the collateral delivered related to those repurchase agreements.
| | | | | | | | | | | | |
| Counterparty | | Short-Term
Investments, at Value | | | Collateral
Pledged (From)
Counterparty* | | | Net
Exposure | |
Fixed Income Clearing Corporation | | $ | 2,061,135 | | | $ | (2,061,135 | ) | | $ | — | |
| * | As of the end of the reporting period, the value of the collateral pledged from the counterparty exceeded the value of the repurchase agreements. Refer to the Fund’s Portfolio of Investments for details on the repurchase agreements. |
Zero Coupon Securities
A zero coupon security does not pay a regular interest coupon to its holders during the life of the security. Income to the holder of the security comes from accretion of the difference between the original purchase price of the security at issuance and the par value of the security at maturity and is effectively paid at maturity. The market prices of zero coupon securities generally are more volatile than the market prices of securities that pay interest periodically.
Investments in Derivatives
The Fund is authorized to invest in certain derivative instruments, such as futures, options and swap contracts. The Fund limits its investments in futures, options on futures and swap contracts to the extent necessary for the Adviser to claim the exclusion from registration by the Commodity Futures Trading Commission as a commodity pool operator with respect to the Fund. The Fund records derivative instruments at fair value, with changes in fair value recognized on the Statement of Operations, when applicable. Even though the Fund’s investments in derivatives may represent economic hedges, they are not considered to be hedge transactions for financial reporting purposes.
Options Transactions
The purchase of options involves the risk of loss of all or a part of the cash paid for the options (the premium). The market risk associated with purchasing options is limited to the premium paid. The counterparty credit risk of purchasing options, however, needs also to take into account the current value of the option, as this is the performance expected from the counterparty. When the Fund purchases an option, an amount equal to the premium paid (the premium plus commission) is recognized as a component of “Options purchased, at value” on the Statement of Assets and Liabilities. When the Fund writes an option, an amount equal to the net premium received (the premium less commission) is recognized as a component of “Options written, at value” on the Statement of Assets and Liabilities and is subsequently adjusted to reflect the current value of the written option until the option is exercised or expires or the Fund enters into a closing purchase transaction. The changes in the value of options purchased and/or written during the fiscal period are recognized as a component of “Change in net unrealized appreciation (depreciation) of options purchased and/or written” on the Statement of Operations. When an option is exercised or expires or the Fund enters into a closing purchase transaction, the difference between the net premium received and any amount paid at expiration or on executing a closing purchase transaction, including commission, is recognized as a component of “Net realized gain (loss) from options purchased and/or written” on the Statement of Operations. The Fund, as a writer of an option, has no control over whether the underlying instrument may be sold (called) or purchased (put) and as a result bears the risk of an unfavorable change in the market value of the instrument underlying the written option. There is also the risk the Fund may not be able to enter into a closing transaction because of an illiquid market.
During the current fiscal period, the Fund wrote call options on individual stocks, while investing in these same stocks, to enhance returns while foregoing some upside potential.
The average notional amount of outstanding options written during the current fiscal period was as follows:
| | | | |
Average notional amount of outstanding options written* | | | $(2,398,550) | |
| * | The average notional amount is calculated based on the outstanding notional at the beginning of the fiscal period and at the end of each fiscal quarter within the current fiscal period. |
The following table presents the amount of net realized gain (loss) and change in net unrealized appreciation (depreciation) recognized on options written on the Statement of Operations during the current fiscal period and the primary underlying risk exposure.
| | | | | | | | | | |
| Underlying Risk Exposure | | Derivative
Instrument | | Net Realized
Gain (Loss) from
Options Written | | | Change in Net
Unrealized Appreciation
(Depreciation) of
Options Written | |
Equity price | | Options written | | $ | 301,922 | | | $ | (83,089 | ) |
Interest Rate Swap Contracts
Interest rate swap contracts involve the Fund’s agreement with the counterparty to pay or receive a fixed rate payment in exchange for the counterparty receiving or paying a variable rate payment. Forward interest rate swap contracts involve the Fund’s agreement with a counterparty to pay, in the future, a fixed or variable rate payment in exchange for the counterparty paying the Fund a variable or fixed rate payment, the accruals for which would begin at a specified date in the future (the “effective date”).
The amount of the payment obligation for an interest rate swap is based on the notional amount and the termination date of the contract. Interest rate swap contracts do not involve the delivery of securities or other underlying assets or principal. Accordingly, the risk of loss with respect to the swap counterparty on such transactions is limited to the net amount of interest payments that the Fund is to receive.
Notes to Financial Statements (continued)
Interest rate swap contracts are valued daily. Upon entering into an interest rate swap contract (and beginning on the effective date for a forward interest rate swap contract), the Fund accrues the fixed rate payment expected to be paid or received and the variable rate payment expected to be received or paid on the interest rate swap contracts on a daily basis, and recognizes the daily change in the fair value of the Fund’s contractual rights and obligations under the contracts. For an OTC swap that is not cleared through a clearing house (“OTC Uncleared”), the net amount recorded on these transactions, for each counterparty, is recognized on the Statement of Assets and Liabilities as a component of “Unrealized appreciation or depreciation on interest rate swaps (, net).”
Upon the execution of an OTC swap cleared through a clearing house (“OTC Cleared”), the Fund is obligated to deposit cash or eligible securities, also known as “initial margin,” into an account at its clearing broker equal to a specified percentage of the contract amount. Cash deposited by the Fund to cover initial margin requirements on open swap contracts, if any, is recognized as a component of “Cash collateral at brokers” on the Statement of Assets and Liabilities. Investments in OTC Cleared swaps obligate the Fund and the clearing broker to settle monies on a daily basis representing changes in the prior day’s “mark-to-market” of the swap contract. If the Fund has unrealized appreciation, the clearing broker will credit the Fund’s account with an amount equal to the appreciation. Conversely, if the Fund has unrealized depreciation, the clearing broker will debit the Fund’s account with an amount equal to the depreciation. These daily cash settlements are also known as “variation margin.” Variation margin for OTC Cleared swaps is recognized as a receivable and/or payable for “Variation margin on swap contracts” on the Statement of Assets and Liabilities. Upon the execution of an OTC Uncleared swap, neither the Fund nor the counterparty is required to deposit initial margin as the trades are recorded bilaterally between both parties to the swap contract, and the terms of the variation margin are subject to a predetermined threshold negotiated by the Fund and the counterparty. Variation margin for OTC Uncleared swaps is recognized as a component of “Unrealized appreciation or depreciation on interest rate swaps (, net)” as described in the preceding paragraph.
The net amount of periodic payments settled in cash are recognized as a component of “Net realized gain (loss) from swaps” on the Statement of Operations, in addition to the net realized gain or loss recorded upon the termination of the swap contract. For tax purposes, payments expected to be received or paid on the swap contacts are treated as ordinary income or expense, respectively. Changes in the value of the swap contracts during the fiscal period are recognized as a component of “Change in net unrealized appreciation (depreciation) of swaps” on the Statement of Operations. In certain instances, payments are made or received upon entering into the swap contract to compensate for differences between the stated terms of the swap agreements and prevailing market conditions (credit spreads, currency exchange rates, interest rates, and other relevant factors). Payments received or made at the beginning of the measurement period, if any, are recognized as “Interest rate swaps premiums paid and/or received” on the Statement of Assets and Liabilities.
During the current fiscal period, the Fund continued to utilize forward starting interest rate swap contracts to partially hedge its future interest cost of leverage, which is through the use of bank borrowings.
The average notional amount of interest rate swap contracts outstanding during the current fiscal period was as follows:
| | | | |
Average notional amount of interest rate swap contracts outstanding* | | | $36,950,000 | |
| * | The average notional amount is calculated based on the outstanding notional at the beginning of the fiscal period and at the end of each fiscal quarter within the current fiscal period. |
The following table presents the fair value of all swap contracts held by the Fund as of the end of the reporting period, the location of these instruments on the Statement of Assets and Liabilities and the primary underlying risk exposure.
| | | | | | | | | | | | | | | | | | |
| | | | | Location on the Statement of Assets and Liabilities | |
Underlying Risk Exposure | | Derivative Instrument | | Asset Derivatives | | | | | | (Liability) Derivatives | |
| | | Location | | Value | | | | | | Location | | Value | |
| Interest rate | | Swaps (OTC Uncleared) | | — | | $ | — | | | | | | | Unrealized depreciation on interest rate swaps** | | $ | (865,328 | ) |
| ** | Some swap contracts require a counterparty to pay or receive a premium, which is disclosed in the Statement of Assets and Liabilities and is not reflected in the cumulative unrealized appreciation (depreciation) presented above. |
The following table presents the swap contracts subject to netting agreements and the collateral delivered related to those swap contracts as of the end of the reporting period.
| | | | | | | | | | | | | | | | | | | | | | | | | | | | |
| | | | | | | | | | | | | | | Gross Amounts Not Offset
on the Statement of Assets and Liabilities | |
| Counterparty | | Gross
Unrealized
Appreciation
on Interest
Rate Swaps*** | | | Gross
Unrealized
(Depreciation)
on Interest
Rate Swaps*** | | | Amounts
Netted on
Statement
of Assets and
Liabilities | | | Net Unrealized
Appreciation
(Depreciation) on
Interest Rate
Swaps | | | Interest
Rate Swaps
Premiums Paid | | | Collateral
Pledged
to (from)
Counterparty | | | Net
Exposure | |
JPMorgan Chase Bank, N.A. | | $ | — | | | $ | (865,328 | ) | | $ | — | | | $ | (865,328 | ) | | $ | 601,019 | | | $ | 264,309 | | | $ | — | |
| *** | Represents gross unrealized appreciation (depreciation) for the counterparty as reported in the Fund’s Portfolio of Investments. |
The following table presents the amount of net realized gain (loss) and change in net unrealized appreciation (depreciation) recognized on swap contracts on the Statement of Operations during the current fiscal period, and the primary underlying risk exposure.
| | | | | | | | | | |
| Underlying Risk Exposure | | Derivative
Instrument | | Net Realized
Gain (Loss)
from Swaps | | | Change in Net
Unrealized Appreciation
(Depreciation) of
Swaps | |
Interest rate | | Swaps | | $ | 3,006 | | | $ | (136,807 | ) |
Market and Counterparty Credit Risk
In the normal course of business the Fund may invest in financial instruments and enter into financial transactions where risk of potential loss exists due to changes in the market (market risk) or failure of the other party to the transaction to perform (counterparty credit risk). The potential loss could exceed the value of the financial assets recorded on the financial statements. Financial assets, which potentially expose the Fund to counterparty credit risk, consist principally of cash due from counterparties on forward, option and swap transactions, when applicable. The extent of the Fund’s exposure to counterparty credit risk in respect to these financial assets approximates their carrying value as recorded on the Statement of Assets and Liabilities.
The Fund helps manage counterparty credit risk by entering into agreements only with counterparties the Adviser believes have the financial resources to honor their obligations and by having the Adviser monitor the financial stability of the counterparties. Additionally, counterparties may be required to pledge collateral daily (based on the daily valuation of the financial asset) on behalf of the Fund with a value approximately equal to the amount of any unrealized gain above a pre-determined threshold. Reciprocally, when the Fund has an unrealized loss, the Fund has instructed the custodian to pledge assets of the Fund as collateral with a value approximately equal to the amount of the unrealized loss above a pre-determined threshold. Collateral pledges are monitored and subsequently adjusted if and when the valuations fluctuate, either up or down, by at least the pre-determined threshold amount.
4. Fund Shares
Common Share Transactions
The Fund did not have any transactions in common shares during current and prior fiscal periods.
5. Investment Transactions
Long-term purchases and sales (including maturities but excluding derivative transactions) during the current fiscal, aggregated $105,693,712 and $116,552,046, respectively.
Transactions in options written during the current fiscal period were as follows:
| | | | | | | | |
| | | Number of
Contracts | | | Premiums
Received | |
Options outstanding, beginning of period | | | 1,117 | | | $ | 157,239 | |
Options written | | | 2,078 | | | | 151,078 | |
Options terminated in closing purchase transactions | | | (278 | ) | | | (33,348 | ) |
Options exercised | | | (449 | ) | | | (50,435 | ) |
Options expired | | | (2,468 | ) | | | (224,534 | ) |
Options outstanding, end of period | | | — | | | $ | — | |
Notes to Financial Statements (continued)
6. Income Tax Information
The Fund intends to distribute substantially all of its net investment company taxable income to shareholders and to otherwise comply with the requirements of Subchapter M of the Internal Revenue Code applicable to regulated investment companies. In any year when the Fund realizes net capital gains, the Fund may choose to distribute all or a portion of its net capital gains to shareholders, or alternatively, to retain all or a portion of its net capital gains and pay federal corporate income taxes on such retained gains.
For all open tax years and all major taxing jurisdictions, management of the Fund has concluded that there are no significant uncertain tax positions that would require recognition in the financial statements. Open tax years are those that are open for examination by taxing authorities (i.e., generally the last four tax year ends and the interim tax period since then). Furthermore, management of the Fund is also not aware of any tax positions for which it is reasonably possible that the total amounts of unrecognized tax benefits will significantly change in the next twelve months.
The following information is presented on an income tax basis. Differences between amounts for financial statement and federal income tax purposes are primarily due to the recognition of premium amortization and timing differences in recognizing certain gains and losses on investment transactions. To the extent that differences arise that are permanent in nature, such amounts are reclassified within the capital accounts as detailed below. Temporary differences do not require reclassification. Temporary and permanent differences do not impact the NAV of the Fund.
As of December 31, 2016, the cost and unrealized appreciation (depreciation) of investments (excluding investments in derivatives), as determined on a federal income tax basis, were as follows:
| | | | |
Cost of investments | | $ | 237,403,498 | |
Gross unrealized: | | | | |
Appreciation | | $ | 27,657,157 | |
Depreciation | | | (12,460,055 | ) |
Net unrealized appreciation (depreciation) of investments | | $ | 15,197,102 | |
| | | | |
| Permanent differences, primarily due to foreign currency transactions, tax basis earnings and profits adjustments, treatment of notional principal contracts, expiration of capital loss carryforwards, complex securities character adjustments and bond premium amortization adjustments, resulted in reclassifications among the Fund’s components of common share net assets as of December 31, 2016, the Fund’s tax year end, as follows: | |
Paid-in surplus | | $ | (12,085,959 | ) |
Undistributed (Over-distribution of) net investment income | | | 2,409,977 | |
Accumulated net realized gain (loss) | | | 9,675,982 | |
|
| The tax components of undistributed net ordinary income and net long-term capital gains as of December 31, 2016, the Fund’s tax year end, were as follows: | |
Undistributed net ordinary income | | $ | — | |
Undistributed net long-term capital gains | | | — | |
The tax character of distributions paid during the Fund’s tax years ended December 31, 2016 and December 31, 2015, was designated for purposes of the dividends paid deduction as follows: | |
| 2016 | | | |
Distributions from net ordinary income1 | | $ | 9,043,510 | |
Distributions from net long-term capital gains | | | — | |
Return of capital | | | 4,965,754 | |
| 2015 | | | |
Distributions from net ordinary income1 | | | $15,061,343 | |
Distributions from net long-term capital gains | | | — | |
Return of capital | | | — | |
1 Net ordinary income consists of net taxable income derived from dividends and interest, and current year earnings and profits attributable to realized gains. | |
As of December 31, 2016, the Fund’s tax year end, the Fund had unused capital loss carryforwards available for federal income tax purposes to be applied against future capital gains, if any. If not applied, the carryforwards will expire as shown in the following table. The losses not subject to expiration will be utilized first by the Fund.
| | | | |
Expiration: | | | | |
December 31, 2017 | | $ | 32,157,951 | |
Not subject to expiration | | | — | |
Total | | $ | 32,157,951 | |
During the tax year ended December 31, 2016, the Fund utilized $2,468,137 of its capital loss carryforwards.
As of December 31, 2016, the Fund’s tax year end, $9,577,865 of the Fund’s capital loss carryforward expired.
7. Management Fees and Other Transactions with Affiliates
Management Fees
The Fund’s management fee compensates the Adviser for overall investment advisory and administrative services and general office facilities. The Sub-Advisers are compensated for their services to the Fund from the management fees paid to the Adviser.
The Fund’s management fee consists of two components – a fund-level fee, based only on the amount of assets within the Fund, and a complex-level fee, based on the aggregate amount of all eligible fund assets managed by the Adviser. This pricing structure enables Fund shareholders to benefit from growth in the assets within the Fund as well as from growth in the amount of complex-wide assets managed by the Adviser.
The annual Fund-level fee, payable monthly, is calculated according to the following schedule:
| | | | |
| Average Daily Managed Assets* | | Fund-Level Fee | |
For the first $500 million | | | 0.7000 | % |
For the next $500 million | | | 0.6750 | |
For the next $500 million | | | 0.6500 | |
For the next $500 million | | | 0.6250 | |
For managed assets over $2 billion | | | 0.6000 | |
The annual complex-level fee, payable monthly, is calculated by multiplying the current complex-wide fee rate, determined according to the following schedule by the Fund’s daily managed assets:
| | | | |
| Complex-Level Managed Asset Breakpoint Level* | | Effective Rate at Breakpoint Level | |
$55 billion | | | 0.2000 | % |
$56 billion | | | 0.1996 | |
$57 billion | | | 0.1989 | |
$60 billion | | | 0.1961 | |
$63 billion | | | 0.1931 | |
$66 billion | | | 0.1900 | |
$71 billion | | | 0.1851 | |
$76 billion | | | 0.1806 | |
$80 billion | | | 0.1773 | |
$91 billion | | | 0.1691 | |
$125 billion | | | 0.1599 | |
$200 billion | | | 0.1505 | |
$250 billion | | | 0.1469 | |
$300 billion | | | 0.1445 | |
| * | For the complex-level fees, managed assets include closed-end fund assets managed by the Adviser that are attributable to certain types of leverage. For these purposes, leverage includes the fund’s use of preferred stock and borrowings and certain investments in the residual interest certificates (also called inverse floating rate securities) in tender option bond (TOB) trusts, including the portion of assets held by a TOB trust that has been effectively financed by the trust’s issuance of floating rate securities, subject to an agreement by the Adviser as to certain funds to limit the amount of such assets for determining managed assets in certain circumstances. The complex-level fee is calculated based upon the aggregate daily managed assets of all Nuveen funds that constitute “eligible assets”. Eligible assets do not include assets attributable to investments in other Nuveen funds or assets in excess of a determined amount (originally $2 billion) added to the Nuveen fund complex in connection with the Adviser’s assumption of the management of the former First American Funds effective January 1, 2011. As of December 31, 2016, the complex-level fee for the Fund was 0.1625%. |
Other Transactions with Affiliates
The Fund pays no compensation directly to those of its trustees who are affiliated with the Adviser or to its officers, all of whom receive remuneration for their services to the Fund from the Adviser or its affiliates. The Board has adopted a deferred compensation plan for independent trustees that enables trustees to elect to defer receipt of all or a portion of the annual compensation they are entitled to receive from certain Nuveen-advised funds. Under the plan, deferred amounts are treated as though equal dollar amounts had been invested in shares of select Nuveen-advised funds.
8. Senior Loan Commitments
Unfunded Commitments
Pursuant to the terms of certain of the variable rate senior loan agreements, the Fund may have unfunded senior loan commitments. The Fund will maintain with its custodian, cash, liquid securities and/or liquid senior loans having an aggregate value at least equal to the amount of unfunded senior loan commitments. As of the end of the reporting period, the Fund had no such unfunded senior loan commitments.
Notes to Financial Statements (continued)
Participation Commitments
With respect to the senior loans held in the Fund’s portfolio, the Fund may: 1) invest in assignments; 2) act as a participant in primary lending syndicates; or 3) invest in participations. If the Fund purchases a participation of a senior loan interest, the Fund would typically enter into a contractual agreement with the lender or other third party selling the participation, rather than directly with the borrower. As such, the Fund not only assumes the credit risk of the borrower, but also that of the selling participant or other persons interpositioned between the Fund and the borrower. As of the end of the reporting period, the Fund had no such outstanding participation commitments.
9. Borrowing Arrangements
Borrowings
The Fund has entered into a borrowing arrangement as a means of leverage.
The Fund has a $87,400,000 (maximum commitment amount) committed financing agreement (“Borrowings”). As of the end of the reporting period, the outstanding balance on these Borrowings was $76,800,000.
Interest is charged on these Borrowings at 1-Month LIBOR (London Inter-Bank Offered Rate) plus 0.65% (1-month LIBOR plus 0.85% for the period January 1, 2016 through February 25, 2016) per annum on the amount borrowed and 0.50% per annum on the undrawn balance. The Fund is only charged the 0.50% per annum undrawn fee if the undrawn portion of the Borrowings on that day is more than 20% of the maximum commitment amount. During the current fiscal period, the average daily balance outstanding and average annual interest rate on these Borrowings was $76,889,344 and 1.18%, respectively.
In order to maintain these Borrowings, the Fund must meet certain collateral, asset coverage and other requirements. Borrowings outstanding are fully secured by securities held in the Fund’s portfolio of investments (“Pledged Collateral”).
Borrowings outstanding are recognized as “Borrowings” on the Statement of Assets and Liabilities. Interest expense incurred on the drawn amount and undrawn balance are recognized as a component of “Interest expense on borrowings” on the Statement of Operations.
Rehypothecation
The Fund entered into a Rehypothecation Side Letter (“Side Letter”) with its prime brokerage lender, allowing it to re-register the Pledged Collateral in its own name or in a name other than the Fund’s to pledge, repledge, hypothecate, rehypothecate, sell, lend or otherwise transfer or use the Pledged Collateral (the “Hypothecated Securities”) with all rights of ownership as described in the Side Letter. Subject to certain conditions, the total value of the outstanding Hypothecated Securities shall not exceed the lesser of (i) 98% of the outstanding balance on the Borrowings to which the Pledged Collateral relates and (ii) 33 1⁄3% of the Fund’s total assets. The Fund may designate any Pledged Collateral as ineligible for rehypothecation. The Fund may also recall Hypothecated Securities on demand.
The Fund also has the right to apply and set-off an amount equal to one-hundred percent (100%) of the then-current fair market value of such Pledged Collateral against the current Borrowings under the Side Letter in the event that BNP fails to timely return the Pledged Collateral and in certain other circumstances. In such circumstances, however, the Fund may not be able to obtain replacement financing required to purchase replacement securities and, consequently, the Fund’s income generating potential may decrease. Even if the Fund is able to obtain replacement financing, it might not be able to purchase replacement securities at favorable prices.
The Fund will receive a fee in connection with the Hypothecated Securities (“Rehypothecation Fees”) in addition to any principal, interest, dividends and other distributions paid on the Hypothecated Securities.
As of the end of the reporting period, the Fund had Hypothecated Securities totalling $68,723,879. During the current fiscal period the Fund earned Rehypothecation Fees of $42,630, which is recognized as “Other income” on the Statement of Operations.
Additional
Fund Information (Unaudited)
| | | | | | | | | | |
| Board of Trustees | | | | | | | | | | |
| William Adams IV* | | Margo Cook* | | Jack B. Evans | | William C. Hunter | | David J. Kundert | | Albin F. Moschner |
| John K. Nelson | | William J. Schneider | | Judith M. Stockdale | | Carole E. Stone | | Terence J. Toth | | Margaret L. Wolff |
| * | Interested Board Member. |
| | | | | | | | |
| | | | | |
Fund Manager Nuveen Fund Advisors, LLC
333 West Wacker Drive
Chicago, IL 60606 | | Custodian State Street Bank
& Trust Company
One Lincoln Street Boston, MA 02111 | | Legal Counsel Chapman and Cutler LLP
Chicago, IL 60603 | | Independent Registered
Public Accounting Firm KPMG LLP 200 East Randolph Drive Chicago, IL 60601 | | Transfer Agent and
Shareholder Services State Street Bank & Trust Company Nuveen Funds P.O. Box 43071 Providence, RI 02940-3071
(800) 257-8787 |
Distribution Information:
The Fund hereby designates its percentage of dividends paid from net ordinary income as dividends qualifying for the 70% dividends received deduction (“DRD”) for corporations and its percentage as qualified dividend income (“QDI”) for individuals under Section 1(h)(11) of the Internal Revenue Code as shown in the accompanying table. The actual qualified dividend income distributions will be reported to shareholders on Form 1099-DIV which will be sent to shareholders shortly after calendar year end.
Quarterly Form N-Q Portfolio of Investments Information
The Fund is required to file its complete schedule of portfolio holdings with the Securities and Exchange Commission (SEC) for the first and third quarters of each fiscal year on Form N-Q. You may obtain this information directly from the SEC. Visit the SEC on-line at http://www.sec.gov or in person at the SEC’s Public Reference Room in Washington, D.C. Call the SEC toll-free at (800) SEC-0330 for room hours and operation.
Nuveen Funds’ Proxy Voting Information
You may obtain (i) information regarding how each fund voted proxies relating to portfolio securities held during the most recent twelve-month period ended June 30, without charge, upon request, by calling Nuveen toll-free at (800) 257-8787 or on Nuveen’s website at www.nuveen.com and (ii) a description of the policies and procedures that each fund used to determine how to vote proxies relating to portfolio securities without charge, upon request, by calling Nuveen toll free at (800) 257-8787. You may also obtain this information directly from the SEC. Visit the SEC on-line at http://www.sec.gov.
CEO Certification Disclosure
The Fund’s Chief Executive Officer (CEO) has submitted to the New York Stock Exchange (NYSE) the annual CEO certification as required by Section 303A.12(a) of the NYSE Listed Company Manual. The Fund has filed with the SEC the certification of its CEO and Chief Financial Officer required by Section 302 of the Sarbanes-Oxley Act.
Common Share Repurchases
The Fund intends to repurchase, through its open-market share repurchase program, shares of its own common stock at such times and in such amounts as is deemed advisable. During the period covered by this report, the Fund repurchased shares of its common stock as shown in the accompanying table. Any future repurchases will be reported to shareholders in the next annual or semi-annual report.
| | | | |
| | | JTA | |
Common shares repurchased | | | — | |
FINRA BrokerCheck
The Financial Industry Regulatory Authority (FINRA) provides information regarding the disciplinary history of FINRA member firms and associated investment professionals. This information as well as an investor brochure describing FINRA BrokerCheck is available to the public by calling the FINRA BrokerCheck Hotline number at (800) 289-9999 or by visiting www.FlNRA.org.
Glossary of Terms
Used in this Report
| ∎ | | Average Annual Total Return: This is a commonly used method to express an investment’s performance over a particular, usually multi-year time period. It expresses the return that would have been necessary each year to equal the investment’s actual cumulative performance (including change in NAV or market price and reinvested dividends and capital gains distributions, if any) over the time period being considered. |
| ∎ | | Blended Benchmark (old): A blended return comprised of: 1) 56% of the return of the Russell 3000® Value Index, which measures the performance of those Russell 3000® Index companies with lower price-to book ratios and lower forecasted growth values, 2) 16% of the return of the MSCI EAFE ex-Japan Value Index, a capitalization weighted index that selects the lower 50% of the price-to-book ranked value stocks traded in the developed markets of Europe, Asia and the Far East, excluding Japan, 3) 8% of the return of the Merrill Lynch DRD (dividends received deduction) Preferred Index, which consists of investment-grade, DRD-eligible, exchange-traded preferred stocks with one year or more to maturity, and 4) 20% of the return of the Credit Suisse Leveraged Loan Index, which consists of approximately $150 billion of tradable term loans with at least one year to maturity and rated BBB or lower. Index returns assume reinvestment of distributions, but do not include the effects of any applicable sales charges or management fees. |
| ∎ | | Blended Benchmark (new): A blended return comprised of: 1) 72% of the return of the MSCI World Index, a free float-adjusted market capitalization weighted index that is designed to measure the equity market performance of developed markets. The MSCI World Index consists of the following 23 developed market country indexes: Australia, Austria, Belgium, Canada, Denmark, Finland, France, Germany, Hong Kong, Ireland, Israel, Italy, Japan, Netherlands, New Zealand, Norway, Portugal, Singapore, Spain, Sweden, Switzerland, the U.K. and the U.S. 2) 8% of the return of the BofA/Merrill Lynch DRD (dividends received deduction) Eligible Preferred Securities Index, which consists of investment-grade, DRD-eligible, exchange-traded preferred stocks with one year or more to maturity, and 3) 20% of the return of the Credit Suisse Leveraged Loan Index, which consists of approximately $150 billion of tradable term loans with at least one year to maturity and rated BBB or lower. Index returns assume reinvestment of distributions, but do not include the effects of any applicable sales charges or management fees. |
| ∎ | | BofA/Merrill Lynch U.S. Corporate Index: An unmanaged index comprised of U.S. dollar denominated investment grade, fixed rate corporate debt securities publicly issued in the U.S. domestic market with at least one year remaining term to final maturity and at least $250 million outstanding. The index returns assume reinvestment of dividends, but do not include the effects of any sales charges or management fees. |
| ∎ | | BofA/Merrill Lynch U.S. High Yield Index: An unmanaged index which tracks the performance of U.S. dollar-denominated below investment grade corporate debt publicly issued in the U.S. domestic market. The index returns assume reinvestment of dividends, but do not include the effects of any sales charges or management fees. |
| ∎ | | Collateralized Loan Obligation (CLO): A security backed by a pool of debt, often low rated corporate loans. Collateralized loan obligations (CLOs) are similar to collateralized mortgage obligations, except for the different type of underlying loan. |
| ∎ | | Effective Leverage: Effective leverage is a fund’s effective economic leverage, and includes both regulatory leverage (see below) and the leverage effects of certain derivative investments in the fund’s portfolio. |
| ∎ | | Gross Domestic Product (GDP): The total market value of all final goods and services produced in a country/region in a given year, equal to total consumer, investment and government spending, plus the value of exports, minus the value of imports. |
| ∎ | | Leverage: Leverage is created whenever a fund has investment exposure (both reward and/or risk) equivalent to more than 100% of the investment capital. |
| ∎ | | Morgan Stanley Capital International (MSCI) World Index: A free float-adjusted market capitalization weighted index that is designed to measure the equity market performance of developed markets. The MSCI World Index consists of the following 23 developed market country indexes: Australia, Austria, Belgium, Canada, Denmark, Finland, France, Germany, Hong Kong, Ireland, Israel, Italy, Japan, Netherlands, New Zealand, Norway, Portugal, Singapore, Spain, Sweden, Switzerland, the U.K. and the U.S. Index returns assume reinvestment of distributions, but do not reflect any applicable sales charges or management fees. |
| ∎ | | Net Asset Value (NAV) Per Share: A fund’s Net Assets is equal to its total assets (securities, cash, accrued earnings and receivables) less its total liabilities. NAV per share is equal to the fund’s Net Assets divided by its number of shares outstanding. |
| ∎ | | Regulatory Leverage: Regulatory leverage consists of preferred shares issued by or borrowings of a fund. Both of these are part of the fund’s capital structure. Regulatory leverage is subject to asset coverage limits set in the Investment Company Act of 1940. |
| ∎ | | Russell 1000® Value Index: An index that measures the performance of those Russell 1000® companies with lower price-to-book ratios and lower forecasted growth values. The index returns assume reinvestment of distributions, but do not reflect any applicable sales charges or management fees. |
| ∎ | | S&P 500® Index: An unmanaged index generally considered representative of the U.S. stock market. Index returns assume reinvestment of distributions, but do not reflect any applicable sales charges or management fees. |
Reinvest Automatically,
Easily and Conveniently
Nuveen makes reinvesting easy. A phone call is all it takes to set up your reinvestment account.
Nuveen Closed-End Funds Automatic Reinvestment Plan
Your Nuveen Closed-End Fund allows you to conveniently reinvest distributions in additional Fund shares.
By choosing to reinvest, you’ll be able to invest money regularly and automatically, and watch your investment grow through the power of compounding. Just like distributions in cash, there may be times when income or capital gains taxes may be payable on distributions that are reinvested.
It is important to note that an automatic reinvestment plan does not ensure a profit, nor does it protect you against loss in a declining market.
Easy and convenient
To make recordkeeping easy and convenient, each quarter you’ll receive a statement showing your total distributions, the date of investment, the shares acquired and the price per share, and the total number of shares you own.
How shares are purchased
The shares you acquire by reinvesting will either be purchased on the open market or newly issued by the Fund. If the shares are trading at or above net asset value at the time of valuation, the Fund will issue new shares at the greater of the net asset value or 95% of the then-current market price. If the shares are trading at less than net asset value, shares for your account will be purchased on the open market. If the Plan Agent begins purchasing Fund shares on the open market while shares are trading below net asset value, but the Fund’s shares subsequently trade at or above their net asset value before the Plan Agent is able to complete its purchases, the Plan Agent may cease open-market purchases and may invest the uninvested portion of the distribution in newly-issued Fund shares at a price equal to the greater of the shares’ net asset value or 95% of the shares’ market value on the last business day immediately prior to the purchase date. Distributions received to purchase shares in the open market will normally be invested shortly after the distribution payment date. No interest will be paid on distributions awaiting reinvestment. Because the market price of the shares may increase before purchases are completed, the average purchase price per share may exceed the market price at the time of valuation, resulting in the acquisition of fewer shares than if the distribution had been paid in shares issued by the Fund. A pro rata portion of any applicable brokerage commissions on open market purchases will be paid by Plan participants. These commissions usually will be lower than those charged on individual transactions.
Flexible
You may change your distribution option or withdraw from the Plan at any time, should your needs or situation change.
You can reinvest whether your shares are registered in your name, or in the name of a brokerage firm, bank, or other nominee. Ask your investment advisor if his or her firm will participate on your behalf. Participants whose shares are registered in the name of one firm may not be able to transfer the shares to another firm and continue to participate in the Plan.
The Fund reserves the right to amend or terminate the Plan at any time. Although the Fund reserves the right to amend the Plan to include a service charge payable by the participants, there is no direct service charge to participants in the Plan at this time.
Call today to start reinvesting distributions
For more information on the Nuveen Automatic Reinvestment Plan or to enroll in or withdraw from the Plan, speak with your financial advisor or call us at (800) 257-8787.
Board
Members & Officers (Unaudited)
| | | | | | | | |
| | | | |
| | | | | | | | | |
Name,
Year of Birth
& Address | | Position(s) Held
with the Funds | | Year First
Elected or
Appointed
and Term(1) | | Principal
Occupation(s)
Including other
Directorships
During Past 5 Years | | Number
of Portfolios
in Fund Complex
Overseen by
Board Member |
| | | | |
| | | | | | | | | |
|
| Independent Board Members: |
| | | | |
∎ WILLIAM J. SCHNEIDER | | | | | | Chairman of Miller-Valentine Partners, a real estate investment company; Board Member of WDPR Public Radio station; formerly, Senior Partner and Chief Operating Officer (retired (2004) of Miller-Valentine Group; formerly, Board member, Business Advisory Council of the Cleveland Federal Reserve Bank and University of Dayton Business School Advisory Council; past Chair and Director, Dayton Development Coalition. | | |
1944 333 W. Wacker Drive Chicago, IL 60606 | | Chairman and Board Member | |
1996 Class III | | |
182 |
| | | | | | | |
| | | | | | | |
| | | | |
∎ JACK B. EVANS | | | | | | President, The Hall-Perrine Foundation, a private philanthropic corporation (since 1996); Director and Chairman, United Fire Group, a publicly held company; Director, The Gazette Company; Life Trustee of Coe College and the Iowa College Foundation; formerly, President Pro-Tem of the Board of Regents for the State of Iowa University System; formerly, Director, Alliant Energy; formerly, Director, Federal Reserve Bank of Chicago; formerly, President and Chief Operating Officer, SCI Financial Group, Inc., a regional financial services firm. | | |
1948 333 W. Wacker Drive Chicago, IL 60606 | |
Board Member | |
1999 Class III | | |
182 |
| | | | | | | |
| | | | | | | |
| | | | |
∎ WILLIAM C. HUNTER | | | | | | Dean Emeritus, formerly, Dean, Tippie College of Business, University of Iowa (2006-2012); Director (since 2004) of Xerox Corporation; past Director (2005-2015), and past President (2010-2014) Beta Gamma Sigma, Inc., The International Business Honor Society; Director of Wellmark, Inc. (since 2009); formerly, Dean and Distinguished Professor of Finance, School of Business at the University of Connecticut (2003-2006); previously, Senior Vice President and Director of Research at the Federal Reserve Bank of Chicago (1995-2003); formerly, Director (1997-2007), Credit Research Center at Georgetown University. | | |
1948 333 W. Wacker Drive Chicago, IL 60606 | |
Board Member | |
2003 Class I | | |
182 |
| | | | | | | |
| | | | | | | |
| | | | |
∎ DAVID J. KUNDERT | | | | | | Formerly, Director, Northwestern Mutual Wealth Management Company (2006-2013), retired (since 2004) as Chairman, JPMorgan Fleming Asset Management, President and CEO, Banc One Investment Advisors Corporation, and President, One Group Mutual Funds; prior thereto, Executive Vice President, Banc One Corporation and Chairman and CEO, Banc One Investment Management Group; Regent Emeritus, Member of Investment Committee, Luther College; member of the Wisconsin Bar Association; member of Board of Directors and Chair of Investment Committee, Greater Milwaukee Foundation; member of the Board of Directors (Milwaukee), College Possible; Board member of Milwaukee Repertory Theatre (since 2016). | | |
1942 333 W. Wacker Drive Chicago, IL 60606 | |
Board Member | |
2005 Class II | | |
182 |
| | | | | | | |
| | | | | | | |
| | | | | | | |
Board Members & Officers (Unaudited) (continued)
| | | | | | | | |
| | | | |
| | | | | | | | | |
Name,
Year of Birth
& Address | | Position(s) Held
with the Funds | | Year First
Elected or
Appointed
and Term(1) | | Principal
Occupation(s)
Including other
Directorships
During Past 5 Years | | Number
of Portfolios
in Fund Complex
Overseen by
Board Member |
| | | | |
| | | | | | | | | |
|
| Independent Board Members (continued): |
| | | |
∎ ALBIN F. MOSCHNER(2) | | | | Founder and Chief Executive Officer, Northcroft Partners, LLC, a management consulting firm (since 2012); previously, held positions at Leap Wireless International, Inc., including Consultant (2011-2012), Chief Operating Officer (2008-2011), and Chief Marketing Officer (2004-2008); formerly, President, Verizon Card Services division of Verizon Communications, Inc. (2000-2003); formerly, President, One Point Services at One Point Communications (1999-2000); formerly, Vice Chairman of the Board, Diba, Incorporated (1996-1997); formerly, various executive positions with Zenith Electronics Corporation (1991-1996). Director, USA Technologies, Inc., a provider of solutions and services to facilitate electronic payment transactions (since 2012); formerly, Director, Wintrust Financial Corporation (1996-2016). | | |
1952
333 W. Wacker Drive Chicago, IL 60606 | |
Board Member | |
2016 Class III | | |
182 |
| | | | | | | |
| | | | | | | |
| | | | | | | |
| | | |
∎ JOHN K. NELSON | | | | Member of Board of Directors of Core12 LLC (since 2008), a private firm which develops branding, marketing and communications strategies for clients; Director of The Curran Center for Catholic American Studies (since 2009) and The President’s Council, Fordham University (since 2010); formerly, senior external advisor to the financial services practice of Deloitte Consulting LLP (2012-2014): formerly, Chairman of the Board of Trustees of Marian University (2010 as trustee, 2011-2014 as Chairman); formerly, Chief Executive Officer of ABN AMRO N.V. North America, and Global Head of its Financial Markets Division (2007-2008); prior senior positions held at ABN AMRO include Corporate Executive Vice President and Head of Global Markets-the Americas (2006-2007), CEO of Wholesale Banking North America and Global Head of Foreign Exchange and Futures Markets (2001-2006), and Regional Commercial Treasurer and Senior Vice President Trading-North America (1996-2001); formerly, Trustee at St. Edmund Preparatory School in New York City. | | |
1962
333 W. Wacker Drive Chicago, IL 60606 | |
Board Member | |
2013 Class II | | |
182 |
| | | | | | | |
| | | | | | | |
| | | | | | | |
| | | | | | | |
| | | | | | | |
| | | |
∎ JUDITH M. STOCKDALE | | | | Board Member, Land Trust Alliance (since 2013) and U.S. Endowment for Forestry and Communities (since 2013); formerly, Executive Director (1994-2012), Gaylord and Dorothy Donnelley Foundation; prior thereto, Executive Director, Great Lakes Protection Fund (1990-1994). | | |
1947
333 W. Wacker Drive Chicago, IL 60606 | |
Board Member | |
1997 Class I | | |
182 |
| | | | |
∎ CAROLE E. STONE | | | | | | Director, Chicago Board Options Exchange, Inc. (since 2006); Director, C2 Options Exchange, Incorporated (since 2009); Director, CBOE Holdings, Inc. (since 2010); formerly, Commissioner, New York State Commission on Public Authority Reform (2005-2010). | | |
1947
333 W. Wacker Drive Chicago, IL 60606 | |
Board Member | |
2007 Class I | | |
182 |
| | | | |
∎ TERENCE J. TOTH | | | | | | Co-Founding Partner, Promus Capital (since 2008); Director, Fulcrum IT Service LLC (since 2010) and Quality Control Corporation (since 2012); member: Catalyst Schools of Chicago Board (since 2008) and Mather Foundation Board (since 2012), and chair of its Investment Committee; formerly, Director, Legal & General Investment Management America, Inc. (2008-2013); formerly, CEO and President, Northern Trust Global Investments (2004-2007): Executive Vice President, Quantitative Management & Securities Lending (2000-2004); prior thereto, various positions with Northern Trust Company (since 1994); formerly, Member, Northern Trust Mutual Funds Board (2005-2007), Northern Trust Global Investments Board (2004-2007), Northern Trust Japan Board (2004-2007), Northern Trust Securities Inc. Board (2003-2007) and Northern Trust Hong Kong Board (1997-2004). | | |
1959
333 W. Wacker Drive Chicago, IL 60606 | |
Board Member | |
2008 Class II | | |
182 |
| | | | | | | |
| | | | | | | |
| | | | | | | |
| | | | | | | | |
| | | | |
| | | | | | | | | |
Name,
Year of Birth
& Address | | Position(s) Held
with the Funds | | Year First
Elected or
Appointed
and Term(1) | | Principal
Occupation(s)
Including other
Directorships
During Past 5 Years | | Number
of Portfolios
in Fund Complex
Overseen by
Board Member |
| | | | |
| | | | | | | | | |
|
| Independent Board Members (continued): |
| | | |
∎ MARGARET L. WOLFF | | | | Member of the Board of Directors (since 2013) of Travelers Insurance Company of Canada and The Dominion of Canada General Insurance Company (each, a part of Travelers Canada, the Canadian operation of The Travelers Companies, Inc.); formerly, Of Counsel, Skadden, Arps, Slate, Meagher & Flom LLP (Mergers & Acquisitions Group) (2005-2014); Member of the Board of Trustees of New York-Presbyterian Hospital (since 2005); Member (since 2004) and Chair (since 2015) of the Board of Trustees of The John A. Hartford Foundation (a philanthropy dedicated to improving the care of older adults); formerly, Member (2005-2015) and Vice Chair (2011-2015) of the Board of Trustees of Mt. Holyoke College. | | |
1955
333 W. Wacker Drive Chicago, IL 60606 | |
Board Member | |
2016 Class I | | |
182 |
| | | | | | | |
| | | | | | | |
| | |
| Interested Board Members: | | | | |
| | | | |
∎ WILLIAM ADAMS IV(3) | | | | | | Co-Chief Executive Officer and Co-President (since March 2016), formerly, Senior Executive Vice President, Global Structured Products (2010-2016) of Nuveen Investments, Inc.; Executive Vice President (since February 2017) of Nuveen, LLC; Co-President of Nuveen Fund Advisors, LLC (since 2011); Co- Co-President, Global Products and Solutions (since January 2017), formerly, Chief Executive Officer (2016-2017), formerly, Senior Executive Vice President of Nuveen Securities, LLC; President (since 2011), of Nuveen Commodities Asset Management, LLC; Board Member of the Chicago Symphony Orchestra and of Gilda’s Club Chicago; formerly, Executive Vice President, U.S. Structured Products, of Nuveen Investments, Inc. (1999-2010). | | |
1955 333 W. Wacker Drive Chicago, IL 60606 | |
Board Member | |
2013 Class II | | |
182 |
| | | | | | | |
| | | | | | | |
| | | | | | | |
| | | | |
∎ MARGO L. COOK(2)(3) | | | | | | Co-Chief Executive Officer and Co-President (since March 2016), formerly, Senior Executive Vice President of Nuveen Investments, Inc.; Co-President, Global Products and Solutions (since January 2017), formerly, Co-Chief Executive Officer (2015-2016), formerly, Executive Vice President (2013-2015), of Nuveen Securities, LLC; Executive Vice President (since February 2017) of Nuveen, LLC; Co-President (since October 2016), formerly Senior Executive Vice President of Nuveen Fund Advisors, LLC (Executive Vice President since 2011); formerly, Managing Director of Nuveen Commodities Asset Management, LLC (2011-2016); Chartered Financial Analyst. | | |
1964 333 W. Wacker Drive Chicago, IL 60606 | |
Board Member | |
2016 Class III | | |
182 |
| | | | | | | |
| | | | | | | |
| | | | | | | | |
| | | | |
| | | | | | | | | |
Name,
Year of Birth
& Address | | Position(s) Held
with the Funds | | Year First
Elected or
Appointed(4) | | Principal
Occupation(s)
During Past 5 Years | | Number
of Portfolios
in Fund Complex
Overseen by
Officer |
| | | | |
| | | | | | | | | |
|
| Officers of the Funds: |
| | | |
∎ CEDRIC H. ANTOSIEWICZ | | | | Senior Managing Director (since January 2017), formerly, Managing Director (2004-2017) of Nuveen Securities, LLC; Senior Managing Director (since February 2017), formerly, Managing Director (2014-2017) of Nuveen Fund Advisors, LLC. | | |
1962
333 W. Wacker Drive Chicago, IL 60606 | | Chief Administrative Officer | |
2007 | | |
75 |
| | | |
∎ LORNA C. FERGUSON | | | | Managing Director (since 2004) of Nuveen. | | |
1945 333 W. Wacker Drive Chicago, IL 60606 | |
Vice President | |
1998 | | |
183 |
Board Members & Officers (Unaudited) (continued)
| | | | | | | | |
| | | | |
| | | | | | | | | |
Name,
Year of Birth
& Address | | Position(s) Held
with the Funds | | Year First
Elected or
Appointed(4) | | Principal
Occupation(s)
During Past 5 Years | | Number
of Portfolios
in Fund Complex
Overseen by
Officer |
| | | | |
| | | | | | | | | |
|
| Officers of the Funds (continued): |
| | | | |
∎ STEPHEN D. FOY | | | | | | Managing Director (since 2014), formerly, Senior Vice President (2013-2014) and Vice President (2005-2013) of Nuveen Fund Advisors, LLC; Chief Financial Officer of Nuveen Commodities Asset Management, LLC (since 2010); Managing Director (since 2016) of Nuveen Securities, LLC; Certified Public Accountant. | | |
1954
333 W. Wacker Drive Chicago, IL 60606 | | Vice President and Controller | |
1998 | | |
183 |
| | | | | | | |
| | | | |
∎ NATHANIEL T. JONES | | | | | | Managing Director (since January 2017), formerly, Senior Vice President (2016-2017), formerly, Vice President (2011-2016) of Nuveen.; Chartered Financial Analyst. | | |
1979
333 W. Wacker Drive Chicago, IL 60606 | | Vice President and Treasurer | |
2016 | | |
183 |
| | | | |
∎ WALTER M. KELLY | | | | | | Managing Director (since January 2017), formerly, Senior Vice President (2008-2017) of Nuveen. | | |
1970
333 W. Wacker Drive Chicago, IL 60606 | | Chief Compliance Officer and Vice President | | 2003 | | |
183 |
| | | | |
∎ DAVID J. LAMB | | | | | | Managing Director (since January 2017), formerly, Senior Vice President of Nuveen Investments Holdings, Inc. (since 2006), Vice President prior to 2006. | | |
1963
333 W. Wacker Drive Chicago, IL 60606 | |
Vice President | |
2015 | | |
75 |
| | | | |
∎ TINA M. LAZAR | | | | | | Managing Director (since January 2017), formerly, Senior Vice President (2014-2017)of Nuveen Securities, LLC. | | |
1961
333 W. Wacker Drive Chicago, IL 60606 | |
Vice President | |
2002 | | |
183 |
| | | | |
∎ KEVIN J. MCCARTHY | | | | | | Senior Managing Director (since February 2017), formerly, Executive Vice President (2016-2017), Secretary (since 2016) and General Counsel (since 2016), formerly, Managing Director and Assistant Secretary of Nuveen Investments, Inc.; Senior Managing Director (since January 2017), formerly, Executive Vice President (2016-2017), formerly, Managing Director (2008-2016), and Assistant Secretary (since 2008) of Nuveen Securities, LLC; Senior Managing Director (since February 2017), formerly, Executive Vice President (2016-2017), and Secretary (since 2016), formerly, Managing Director (2008-2016) and Assistant Secretary (2007-2016), and Co-General Counsel (since 2011) of Nuveen Fund Advisors, LLC; Senior Managing Director (since February 2017), formerly, Executive Vice President (2016-2017) and Secretary (since 2016), formerly, Managing Director, Assistant Secretary (2011-2016), and Associate General Counsel (since 2011) of Nuveen Asset Management, LLC; Senior Managing Director (since February 2017), formerly, Executive Vice President (2016-2017) and Secretary (since 2016) of Nuveen Investments Advisers, LLC; Vice President (since 2007) and Secretary (since 2016) of NWQ Investment Management Company, LLC, Symphony Asset Management LLC, Santa Barbara Asset Management, LLC and Winslow Capital Management, LLC (since 2010); Vice President (since 2010) and Secretary (since 2016), formerly, Assistant Secretary of Nuveen Commodities Asset Management, LLC. | | |
1966
333 W. Wacker Drive Chicago, IL 60606 | | Vice President and Assistant Secretary | |
2007 | | |
183 |
| | | | | | | |
| | | | | | | |
| | | | | | | |
| | | | | | | |
| | | | | | | |
| | | | | | | |
| | | | | | | |
| | | | | | | |
| | | | | | | |
| | | | |
∎ KATHLEEN L. PRUDHOMME | | | | | | Managing Director, Assistant Secretary and Co-General Counsel (since 2011) of Nuveen Fund Advisors, LLC; Managing Director, Assistant Secretary and Associate General Counsel (since 2011) of Nuveen Asset Management, LLC; Managing Director and Assistant Secretary (since 2011) of Nuveen Securities, LLC; formerly, Deputy General Counsel, FAF Advisors, Inc. (2004-2010). | | |
1953
901 Marquette Avenue Minneapolis, MN 55402 | | Vice President and Assistant Secretary | |
2011 | | | 183 |
| | | | | | | |
| | | | | | | | |
| | | | |
| | | | | | | | | |
Name,
Year of Birth
& Address | | Position(s) Held
with the Funds | | Year First
Elected or
Appointed(4)
| | Principal
Occupation(s)
During Past 5 Years | | Number
of Portfolios
in Fund Complex
Overseen by
Officer |
| | | | |
| | | | | | | | | |
|
| Officers of the Funds (continued): |
| | | |
∎ CHRISTOPHER M. ROHRBACHER | | | | Managing Director (since January 2017) of Nuveen Securities, LLC; Managing Director (since January 2017), formerly, Senior Vice President (2016-2017) and Assistant Secretary (since October 2016) of Nuveen Fund Advisors, LLC; Vice President and Assistant Secretary (since 2010) of Nuveen Commodities Asset Management, LLC. | | |
1971
333 West Wacker Drive Chicago, IL 60606 | | Vice President and Assistant Secretary | | 2008 | | | 183 |
| | | | | | | |
| | | | |
∎ JOEL T. SLAGER | | | | | | Fund Tax Director for Nuveen Funds (since 2013); previously, Vice President of Morgan Stanley Investment Management, Inc., Assistant Treasurer of the Morgan Stanley Funds (from 2010 to 2013). | | |
1978
333 W. Wacker Drive Chicago, IL 60606 | | Vice President and Assistant Secretary | | 2013 | | | 183 |
| | | |
∎ GIFFORD R. ZIMMERMAN | | | | Managing Director (since 2002), and Assistant Secretary of Nuveen Securities, LLC; Managing Director (since 2004) and Assistant Secretary (since 1994) of Nuveen Investments, Inc.; Managing Director (since 2002), Assistant Secretary (since 1997) and Co-General Counsel (since 2011) of Nuveen Fund Advisors, LLC; Managing Director, Assistant Secretary and Associate General Counsel of Nuveen Asset Management, LLC (since 2011); Vice President (since February 2017), formerly, Managing Director (2003-2017) and Assistant Secretary (since 2003) of Symphony Asset Management LLC; Managing Director and Assistant Secretary (since 2002) of Nuveen Investments Advisers, LLC; Vice President and Assistant Secretary of NWQ Investment Management Company, LLC (since 2002), Santa Barbara Asset Management, LLC (since 2006), and of Winslow Capital Management, LLC, (since 2010); Chartered Financial Analyst. | | |
1956
333 W. Wacker Drive Chicago, IL 60606 | | Vice President and Secretary | |
1988 | | |
183 |
| | | | | | | |
| | | | | | | |
| | | | | | | |
| (1) | The Board Members serve three year terms. The Board of Trustees is divided into three classes. Class I, Class II, and Class III, with each being elected to serve until the third succeeding annual shareholders’ meeting subsequent to its election or thereafter in each case when its respective successors are duly elected or appointed. The first year elected or appointed represents the year in which the board member was first elected or appointed to any fund in the Nuveen Complex. |
| (2) | On June 22, 2016, Ms. Cook and Mr. Moschner were appointed as Board members, effective July 1, 2016. |
| (3) | “Interested person” as defined in the 1940 Act, by reason of his position with Nuveen Investments, Inc. and certain of its subsidiaries, which are affiliates of the Nuveen Funds. |
| (4) | Officers serve one year terms through August of each year. The year first elected or appointed represents the year in which the Officer was first elected or appointed to any fund in the Nuveen Complex. |
| | | | | | | | | | | | | | |
| | | | | | | | |
| | | | |
| | | | | | | | |
| | | | | | | | |
| | |
| | Nuveen: | | |
| | | | Serving Investors for Generations | | |
| | |
| | | | |
| | | | Since 1898, financial advisors and their clients have relied on Nuveen to provide dependable investment solutions through continued adherence to proven, long-term investing principles. Today, we offer a range of high quality equity and fixed-income solutions designed to be integral components of a well-diversified core portfolio. | | |
| | | |
| | | | | | |
| | | | | | Focused on meeting investor needs. Nuveen helps secure the long-term goals of individual investors and the advisors who serve them, providing access to investment expertise from leading asset managers and solutions across traditional and alternative asset classes. Built on more than a century of industry leadership, Nuveen’s teams of experts align with clients’ specific financial needs and goals, demonstrating commitment to advisors and investors through market perspectives and wealth management and portfolio advisory services. Nuveen manages $236 billion in assets as of December 31, 2016. | | |
| | | | |
| | | | | | | | |
| | | | | | Find out how we can help you. To learn more about how the products and services of Nuveen may be able to help you meet your financial goals, talk to your financial advisor, or call us at (800) 257-8787. Please read the information provided carefully before you invest. Investors should consider the investment objective and policies, risk considerations, charges and expenses of any investment carefully. Where applicable, be sure to obtain a prospectus, which contains this and other relevant information. To obtain a prospectus, please contact your securities representative or Nuveen, 333 W. Wacker Dr., Chicago, IL 60606. Please read the prospectus carefully before you invest or send money. Learn more about Nuveen Funds at: www.nuveen.com/cef | | |
| | | | | | |
| | | | | | | | | | | | |
Securities offered through Nuveen Securities, LLC, Member FINRA and SIPC | 333 West Wacker Drive | Chicago, IL 60606 | www.nuveen.com/cef
EAN-C-1216D 23206-INV-Y-03/18
ITEM 2. CODE OF ETHICS.
As of the end of the period covered by this report, the registrant has adopted a code of ethics that applies to the registrant’s principal executive officer, principal financial officer, principal accounting officer or controller, or persons performing similar functions. There were no amendments to or waivers from the Code during the period covered by this report. The registrant has posted the code of ethics on its website at www.nuveen.com/CEF/Shareholder/FundGovernance.aspx. (To view the code, click on Code of Conduct.)
ITEM 3. AUDIT COMMITTEE FINANCIAL EXPERT.
The registrant’s Board of Directors or Trustees (“Board”) determined that the registrant has at least one “audit committee financial expert” (as defined in Item 3 of Form N-CSR) serving on its Audit Committee. The registrant’s audit committee financial experts are Carole E. Stone and Jack B. Evans, who are “independent” for purposes of Item 3 of Form N-CSR.
Ms. Stone served for five years as Director of the New York State Division of the Budget. As part of her role as Director, Ms. Stone was actively involved in overseeing the development of the State’s operating, local assistance and capital budgets, its financial plan and related documents; overseeing the development of the State’s bond-related disclosure documents and certifying that they fairly presented the State’s financial position; reviewing audits of various State and local agencies and programs; and coordinating the State’s system of internal audit and control. Prior to serving as Director, Ms. Stone worked as a budget analyst/examiner with increasing levels of responsibility over a 30 year period, including approximately five years as Deputy Budget Director. Ms. Stone has also served as Chair of the New York State Racing Association Oversight Board, as Chair of the Public Authorities Control Board, as a Commissioner on the New York State Commission on Public Authority Reform and as a member of the Boards of Directors of several New York State public authorities. These positions have involved overseeing operations and finances of certain entities and assessing the adequacy of project/entity financing and financial reporting. Currently, Ms. Stone is on the Board of Directors of CBOE Holdings, Inc., of the Chicago Board Options Exchange, and of C2 Options Exchange. Ms. Stone’s position on the boards of these entities and as a member of both CBOE Holdings’ Audit Committee and its Finance Committee has involved, among other things, the oversight of audits, audit plans and preparation of financial statements.
Mr. Evans was formerly President and Chief Operating Officer of SCI Financial Group, Inc., a full service registered broker-dealer and registered investment adviser (“SCI”). As part of his role as President and Chief Operating Officer, Mr. Evans actively supervised the Chief Financial Officer (the “CFO”) and actively supervised the CFO’s preparation of financial statements and other filings with various regulatory authorities. In such capacity, Mr. Evans was actively involved in the preparation of SCI’s financial statements and the resolution of issues raised in connection therewith. Mr. Evans has also served on the audit committee of various reporting companies. At such companies, Mr. Evans was involved in the oversight of audits, audit plans, and the preparation of financial statements. Mr. Evans also formerly chaired the audit committee of the Federal Reserve Bank of Chicago.
ITEM 4. PRINCIPAL ACCOUNTANT FEES AND SERVICES.
Nuveen Tax-Advantaged Total Return Strategy Fund
The following tables show the amount of fees that KPMG LLP, the Funds’ auditor, billed to the Funds’ during the Funds’ last two full fiscal years. The Audit Committee approved in advance all audit services and non-audit services that KPMG LLP provided to the Funds, except for those non-audit services that were subject to the pre-approval exception under Rule 2-01 of Regulation S-X (the “pre-approval exception”). The preapproval exception for services provided directly to the Funds waives the pre-approval requirement for services other than audit, review or attest services if: (A) the aggregate amount of all such services provided constitutes no more than 5% of the total amount of revenues paid by the Funds during the fiscal year in which the services are provided; (B) the Funds did not recognize the services as non-audit services at the time of the engagement; and (C) the services are promptly brought to the Audit Committee’s attention, and the Committee (or its delegate) approves the services before the audit is completed.
The Audit Committee has delegated certain pre-approval responsibilities to its Chairman (or, in his absence, any other member of the Audit Committee).
SERVICES THAT THE FUND’S AUDITOR BILLED TO THE FUND
| | | | | | | | | | | | | | | | |
Fiscal Year Ended | | Audit Fees Billed
to Fund 1 | | | Audit-Related Fees
Billed to Fund 2 | | | Tax Fees
Billed to Fund 3 | | | All Other Fees
Billed to Fund 4 | |
December 31, 2016 | | $ | 29,480 | | | $ | 0 | | | $ | 0 | | | $ | 0 | |
| | | | | | | | | | | | | | | | |
| | | | | | | | | | | | | | | | |
Percentage approved pursuant to pre-approval exception | | | 0 | % | | | 0 | % | | | 0 | % | | | 0 | % |
| | | | | | | | | | | | | | | | |
| | | | | | | | | | | | | | | | |
December 31, 2015 | | $ | 28,500 | | | $ | 0 | | | $ | 0 | | | $ | 0 | |
| | | | | | | | | | | | | | | | |
| | | | | | | | | | | | | | | | |
Percentage approved pursuant to pre-approval exception | | | 0 | % | | | 0 | % | | | 0 | % | | | 0 | % |
| | | | | | | | | | | | | | | | |
1 “Audit Fees” are the aggregate fees billed for professional services for the audit of the Fund’s annual financial statements and services provided in connection with statutory and regulatory filings or engagements.
2 “Audit Related Fees” are the aggregate fees billed for assurance and related services reasonably related to the performance of the audit or review of financial statements that are not reported under “Audit Fees”. These fees include offerings related to the Fund’s common shares and leverage.
3 “Tax Fees” are the aggregate fees billed for professional services for tax advice, tax compliance, and tax planning. These fees include: all global withholding tax services; excise and state tax reviews; capital gain, tax equalization and taxable basis calculation performed by the principal accountant.
4 “All Other Fees” are the aggregate fees billed for products and services other than “Audit Fees”, “Audit-Related Fees” and “Tax Fees”. These fees represent all “Agreed-Upon Procedures” engagements pertaining to the Fund’s use of leverage.
SERVICES THAT THE FUND’S AUDITOR BILLED TO THE
ADVISER AND AFFILIATED FUND SERVICE PROVIDERS
The following tables show the amount of fees billed by KPMG LLP to Nuveen Fund Advisors, LLC (formerly Nuveen Fund Advisors, Inc.) (the “Adviser”), and any entity controlling, controlled by or under common control with the Adviser that provides ongoing services to the Fund (“Affiliated Fund Service Provider”), for engagements directly related to the Fund’s operations and financial reporting, during the Fund’s last two full fiscal years.
The tables also show the percentage of fees subject to the pre-approval exception. The pre-approval exception for services provided to the Adviser and any Affiliated Fund Service Provider (other than audit, review or attest services) waives the pre-approval requirement if: (A) the aggregate amount of all such services provided constitutes no more than 5% of the total amount of revenues paid to KPMG LLP by the Fund, the Adviser and Affiliated Fund Service Providers during the fiscal year in which the services are provided that would have to be pre-approved by the Audit Committee; (B) the Fund did not recognize the services as non-audit services at the time of the engagement; and (C) the services are promptly brought to the Audit Committee’s attention, and the Committee (or its delegate) approves the services before the Fund’s audit is completed.
| | | | | | | | | | | | |
Fiscal Year Ended | | Audit-Related Fees
Billed to Adviser and
Affiliated Fund Service
Providers | | | Tax Fees Billed to
Adviser and
Affiliated Fund
Service Providers | | | All Other Fees
Billed to Adviser
and Affiliated Fund
Service Providers | |
December 31, 2016 | | $ | 0 | | | $ | 0 | | | $ | 0 | |
| | | | | | | | | | | | |
| | | | | | | | | | | | |
Percentage approved pursuant to pre-approval exception | | | 0 | % | | | 0 | % | | | 0 | % |
| | | | | | | | | | | | |
| | | | | | | | | | | | |
December 31, 2015 | | $ | 0 | | | $ | 0 | | | $ | 0 | |
| | | | | | | | | | | | |
| | | | | | | | | | | | |
Percentage approved pursuant to pre-approval exception | | | 0 | % | | | 0 | % | | | 0 | % |
| | | | | | | | | | | | |
NON-AUDIT SERVICES
The following table shows the amount of fees that KPMG LLP billed during the Fund’s last two full fiscal years for non-audit services. The Audit Committee is required to pre-approve non-audit services that KPMG LLP provides to the Adviser and any Affiliated Fund Services Provider, if the engagement related directly to the Fund’s operations and financial reporting (except for those subject to the pre-approval exception described above). The Audit Committee requested and received information from KPMG LLP about any non-audit services that KPMG LLP rendered during the Fund’s last fiscal year to the Adviser and any Affiliated Fund Service Provider. The Committee considered this information in evaluating KPMG LLP’s independence.
| | | | | | | | | | | | | | | | |
Fiscal Year Ended | | Total Non-Audit Fees
Billed to Fund | | | Total Non-Audit Fees
billed to Adviser and
Affiliated Fund Service
Providers (engagements
related directly to the
operations and financial
reporting of the Fund) | | | Total Non-Audit Fees
billed to Adviser and
Affiliated Fund Service
Providers (all other
engagements) | | | Total | |
December 31, 2016 | | $ | 0 | | | $ | 0 | | | $ | 0 | | | $ | 0 | |
December 31, 2015 | | $ | 0 | | | $ | 0 | | | $ | 0 | | | $ | 0 | |
“Non-Audit Fees billed to Fund” for both fiscal year ends represent “Tax Fees” and “All Other Fees” billed to Fund in their respective amounts from the previous table.
Less than 50 percent of the hours expended on the principal accountant’s engagement to audit the registrant’s financial statements for the most recent fiscal year were attributed to work performed by persons other than the principal accountant’s full-time, permanent employees.
Audit Committee Pre-Approval Policies and Procedures. Generally, the Audit Committee must approve (i) all non-audit services to be performed for the Fund by the Fund’s independent accountants and (ii) all audit and non-audit services to be performed by the Fund’s independent accountants for the Affiliated Fund Service Providers with respect to operations and financial reporting of the Fund. Regarding tax and research projects conducted by the independent accountants for the Fund and Affiliated Fund Service Providers (with respect to operations and financial reports of the Fund) such engagements will be (i) pre-approved by the Audit Committee if they are expected to be for amounts greater than $10,000; (ii) reported to the Audit Committee chairman for his verbal approval prior to engagement if they are expected to be for amounts under $10,000 but greater than $5,000; and (iii) reported to the Audit Committee at the next Audit Committee meeting if they are expected to be for an amount under $5,000.
ITEM 5. AUDIT COMMITTEE OF LISTED REGISTRANTS.
The registrant’s Board has a separately designated Audit Committee established in accordance with Section 3(a)(58)(A) of the Securities Exchange Act of 1934, as amended (15 U.S.C. 78c(a)(58)(A)). The members of the audit committee are Jack B. Evans, David J. Kundert, John K. Nelson, Carole E. Stone and Terence J. Toth.
ITEM 6. SCHEDULE OF INVESTMENTS.
(a) See Portfolio of Investments in Item 1.
(b) Not applicable.
ITEM 7. DISCLOSURE OF PROXY VOTING POLICIES AND PROCEDURES FOR CLOSED-END MANAGEMENT INVESTMENT COMPANIES.
Nuveen Fund Advisors, LLC is the registrant’s investment adviser (also referred to as the “Adviser”). The Adviser is responsible for the on-going monitoring of the Fund’s investment portfolio, managing the Fund’s business affairs and providing certain clerical, bookkeeping and administrative services. The Adviser has engaged NWQ Investment Management Company, LLC (“NWQ”) and Symphony Asset Management, LLC (“Symphony”) (NWQ and Symphony are collectively referred to as “Sub-Advisers”) as Sub-Advisers to provide discretionary investment advisory services. As part of these services, the Adviser has delegated to each Sub-Adviser the full responsibility for proxy voting and related duties in accordance with each Sub-Adviser’s policies and procedures. The Adviser periodically monitors each Sub-Adviser’s voting to ensure that it is carrying out its duties. Each Sub-Adviser’s proxy voting policies and procedures are attached to this filing as an exhibit and incorporated herein by reference or summarized below.
Symphony
Symphony has adopted and implemented proxy voting guidelines to ensure that proxies are voted in the best interest of its Clients. These are merely guidelines and specific situations may call for a vote which does not follow the guidelines. In determining how to vote proxies, Symphony will follow the Proxy Voting Guidelines of the independent third party which Symphony has retained to provide proxy voting services (“Symphony’s Proxy Guidelines”).
Symphony has created a Proxy Voting Committee to periodically review Symphony’s Proxy Guidelines, address conflicts of interest, specific situations and any portfolio manager’s decision to deviate from Symphony’s Proxy Guideline, (including the third party’s guidelines). Under certain circumstances, Symphony may vote one way for some Clients and another way for other Clients. For example, votes for a Client who provides specific voting instructions may differ from votes for Clients who do not provide proxy voting instructions. However, when Symphony has discretion, proxies will generally be voted the same way for all Clients. In addition, conflicts of interest in voting proxies may arise between Clients, between Symphony and its employees, or a lending or other material relationship. As a general rule, conflicts will be resolved by Symphony voting in accordance with Symphony’s Proxy Guidelines when:
| | • | | Symphony manages the account of a corporation or a pension fund sponsored by a corporation in which Clients of Symphony also own stock. Symphony will vote the proxy for its other Clients in accordance with Symphony’s Proxy Guidelines and will follow any directions from the corporation or the pension plan, if different than Symphony’s Proxy Guidelines; |
| | • | | An employee or a member of his/her immediate family is on the Board of Directors or a member of senior management of the company that is the issuer of securities held in Client’s account; |
| | • | | Symphony has a borrowing or other material relationship with a corporation whose securities are the subject of the proxy. |
Proxies will always be voted in the best interest of Symphony’s Clients. Those situations that do not fit within the general rules for the resolution of conflicts of interest will be reviewed by the Proxy Voting Committee. The Proxy Voting Committee, after consulting with senior management, if appropriate, will determine how the proxy should be voted. For example, when a portfolio manager decides not to follow Symphony’s Proxy Guidelines, the Proxy Voting Committee will review a portfolio manager’s recommendation and determine how to vote the proxy. Decisions by the Proxy Voting Committee will be documented and kept with records related to the voting of proxies. A summary of specific votes will be retained in accordance with Symphony’s Books and Records Requirements which are set forth Symphony’s Compliance Manual and Code of Ethics.
ITEM 8. PORTFOLIO MANAGERS OF CLOSED-END MANAGEMENT INVESTMENT COMPANIES.
Nuveen Fund Advisors, LLC (“NFALLC”) is the registrant’s investment adviser (NFALLC is also referred to as the “Adviser”). NFALLC is responsible for the selection and on-going monitoring of the Fund’s investment portfolio, managing the Fund’s business affairs and providing certain clerical, bookkeeping and administrative services. The Adviser has engaged Symphony Asset Management LLC (“Symphony”) and NWQ Investment Management Company, LLC (“NWQ”), as Sub-Advisers to provide discretionary investment advisory services with respect to the registrant’s investments in senior loans and other debt instruments and equity investments, respectively (Symphony and NWQ are also collectively referred to as “Sub-Advisers”). The following section provides information on the portfolio managers at each Sub-Adviser:
Symphony
| Item 8(a)(1). | PORTFOLIO MANAGER BIOGRAPHY |
Gunther Stein, Chief Investment Officer and Chief Executive Officer, Portfolio Manager
Gunther Stein is Chief Investment Officer and Chief Executive Officer at Symphony. Mr. Stein is responsible for leading Symphony’s fixed-income and equity investments strategies and research and overseeing firm trading. Prior to joining Symphony in 1999, Mr. Stein was a high yield portfolio manager at Wells Fargo Bank, where he managed a high yield portfolio, was responsible for investing in public high yield bonds and bank loans and managed a team of credit analysts.
| Item 8(a)(2). | OTHER ACCOUNTS MANAGED |
| | | | |
| Other Accounts Managed by Symphony PM | |
| As of 12/31/16 | | | | |
| |
| | | Gunther Stein | |
(a) RICs | | | | |
Number of accts | | | 18 | |
Assets | | $ | 5.88 billion | |
| |
(b) Other pooled accts | | | | |
Non-performance fee accts | | | | |
Number of accts | | | 45 | |
Assets | | $ | 10.94 billion | |
Performance fee accts | | | | |
Number of accts | | | 5 | |
Assets | | $ | 1.65 billion | |
| |
(c) Other | | | | |
Non-performance fee accts | | | | |
Number of accts | | | 9 | |
Assets | | $ | 1.09 billion | |
Performance fee accts | | | | |
Number of accts | | | 0 | |
Assets | | $ | 0 | |
POTENTIAL MATERIAL CONFLICTS OF INTEREST
As described below, the portfolio manager may manage other accounts with investment strategies similar to the Fund, including other investment companies and separately managed accounts. Fees earned by the sub-adviser may vary among these accounts and the portfolio managers may personally invest in some but not all of these accounts. These factors could create conflicts of interest because a portfolio manager may have incentives to favor certain accounts over others, resulting in other accounts outperforming the Fund. A conflict may also exist if a portfolio manager identified a limited investment opportunity that may be appropriate for more than one account, but the Fund is not able to take full advantage of that opportunity due to the need to allocate that opportunity among multiple accounts. In addition, the portfolio manager may execute transactions for another account that may adversely impact the value of securities held by the Fund. However, the sub-adviser believes that these risks are mitigated by the fact that accounts with like investment strategies managed by a particular portfolio manager are generally managed in a similar fashion, subject to exceptions to account for particular investment restrictions or policies applicable only to certain accounts, differences in cash flows and account sizes, and other factors. In addition, the sub-adviser has adopted trade allocation procedures that require equitable allocation of trade orders for a particular security among participating accounts.
| Item 8(a)(3). | FUND MANAGER COMPENSATION |
Symphony investment professionals receive compensation based on three elements: fixed-base salary, participation in a bonus pool and certain long-term incentives.
The fixed-base salary is set at a level determined by Symphony and is reviewed periodically to ensure that it is competitive with base salaries paid by similar financial services companies for persons playing similar roles.
The portfolio manager is also eligible to receive an annual bonus from a pool based on Symphony’s aggregate asset-based and performance fees after all operating expenses. Bonus compensation for each individual is based on a variety of factors, including the performance of Symphony, the Fund, the team and the individual. Fund performance is assessed on a pre-tax total return risk-adjusted basis, and generally measured relative to the Fund’s primary benchmark and/or industry peer group for one, three or five year periods as applicable. Finally, certain key employees of Symphony, including the portfolio managers, have received profits interests in Symphony which entitle their holders to participate in the firm’s growth over time.
| Item 8(a)(4). | OWNERSHIP OF JTA SECURITIES AS OF DECEMBER 31, 2016 |
| | | | | | | | | | | | | | | | | | | | | | | | | | |
Name of Portfolio Manager | | None | | $1-$10,000 | | | $10,001-
$50,000 | | | $50,001-
$100,000 | | | $100,001-
$500,000 | | | $500,001-
$1,000,000 | | | Over $1,000,000 | |
Gunther Stein | | X | | | | | | | | | | | | | | | | | | | | | | | | |
NWQ
| Item 8(a)(1). | PORTFOLIO MANAGER BIOGRAPHIES |
Thomas J. Ray, CFA, Managing Director, Head of Fixed Income, and Fixed Income Portfolio Manager/Analyst
Prior to joining NWQ in 2015, Tom was a Private Investor. Prior to that, he served as Chief Investment Officer, President and founding member of Inflective Asset Management; a boutique investment firm specializing in convertible securities. Prior to founding Inflective, Tom also served as portfolio manager at Transamerica Investment Management. Tom graduated from University of Wisconsin with a B.B.A in Finance, Investment & Banking and an M.S. in Finance. He holds the Chartered Financial Analyst designation and is a member of the CFA Institute.
Susi Budiman, CFA, Managing Director and Fixed Income Portfolio Manager/Analyst
Prior to joining NWQ in 2006, Susi was Portfolio Manager for China Life Insurance Company, Ltd. in Taiwan where she managed multi-sector and multi-currency fixed income portfolios with responsibility for over $1.8 billion in assets under management.. Prior to that, she was a currency exchange sales associate at Fleet National Bank in Singapore covering Asian, Euro and other major currencies.
Susi earned her B. Comm. in Finance from the University of British Columbia and received her M.B.A. in Finance at the Marshall School of Business at the University of Southern California. She earned her Chartered Financial Analyst designation from the CFA Institute in 2006 and is a member of the Los Angeles Society of Financial Analysts. She also earned her Financial Risk Manager designation in 2003.
James T. Stephenson, CFA, Managing Director, Portfolio Manager, and Equity Analyst
Prior to joining NWQ in 2006, Jim spent seven years at Bel Air Investment Advisors, LLC, formerly a State Street Global Advisors Company, where he was a Managing Director and Partner. Most recently, Jim was Chairman of the firm’s Equity Policy Committee and the Portfolio Manager for Bel Air’s Large Cap Core and Select strategies. Previous to this, he spent five years as an Analyst and Portfolio Manager at ARCO Investment Management Company. Prior to that, he was an Equity Analyst at Trust Company of the West. Jim received his B.B.A. and M.S. in Business from the University of Wisconsin-Madison, where he participated in the Applied Security Analysis Program. In addition, he earned the designation of Chartered Financial Analyst in 1993 and is a member of the CFA Institute and the Los Angeles Society of Financial Analysts.
| Item 8(a)(2). | OTHER ACCOUNTS MANAGED as of 12/31/16 |
| | | | | | | | | | | | |
| | | Thomas Ray | | | Susi Budiman | | | James
Stephenson | |
(a) RICs | | | | | | | | | | | | |
Number of accts | | | 10 | | | | 4 | | | | 7 | |
Assets | | $ | 1.6 billion | | | $ | 1.1 billion | | | $ | 505.6 million | |
| | | |
(b) Other pooled accts | | | | | | | | | | | | |
Non-performance fee accts | | | | | | | | | | | | |
Number of accts | | | 2 | | | | 2 | | | | 1 | |
Assets | | $ | 140 million | | | $ | 140 million | | | $ | 1 million | |
(c) Other | | | | | | | | | | | | |
Non-performance fee accts | | | | | | | | | | | | |
Number of accts | | | 1807 | | | | 1802 | | | | 91 | |
Assets | | $ | 1.0 billion | * | | $ | 926.2 million | ** | | $ | 113.5 million | *** |
Performance fee accts | | | | | | | | | | | | |
Number of accts | | | 0 | | | | 0 | | | | 0 | |
| | | 0 | | | | 0 | | | | 0 | |
* includes approximately $242 million in model-based and other non-discretionary assets as of 12/31/16.
** includes approximately $215 million in model-based assets as of 12/31/16.
*** includes approximately $27 million non-discretionary assets as of 12/31/16.
POTENTIAL MATERIAL CONFLICTS OF INTEREST
Actual or perceived conflicts of interest may arise when a portfolio manager has day-to-day management responsibilities with respect to more than one account. More specifically, portfolio managers who manage multiple accounts are presented with the following potential conflicts, which are not intended to be an exhaustive list:
| • | | The management of multiple accounts may result in a portfolio manager devoting unequal time and attention to the management of each account. NWQ seeks to manage such competing interests for the time and attention of the portfolio manager by utilizing investment models for the management of most investment strategies. |
| • | | If a portfolio manager identifies a limited investment opportunity which may be suitable for more than one account, an account may not be able to take full advantage of that opportunity due to an allocation of filled purchase or sale orders across all eligible accounts. To deal with these situations, NWQ has adopted procedures for allocating limited opportunities across multiple accounts. |
| • | | With respect to many of its clients’ accounts, NWQ determines which broker to utilize when placing orders for execution, consistent with its duty to seek to obtain best execution of the transaction. However, with respect to certain other accounts, NWQ may be limited by the client with respect to the selection of brokers or may be instructed to direct trades through a particular broker. In these cases, NWQ may place separate transactions for certain accounts which may temporarily affect the market price of the security or the execution of the transaction, or both, to the detriment of other accounts. NWQ seeks to minimize market impact by using its discretion in releasing orders in a manner which seeks to cause the least possible impact while keeping within the approximate price range of the discretionary block trade. |
| • | | Finally, the appearance of a conflict of interest may arise where NWQ has an incentive, such as a performance-based management fee, which relates to the management of some accounts, with respect to which the portfolio manager has day-to-day management responsibilities. NWQ periodically performs a comparative analysis of the performance between accounts with performance fees and those without performance fees. |
NWQ has adopted certain compliance procedures which are designed to address these types of conflicts common among investment managers. However, there is no guarantee that such procedures will detect each and every situation in which a conflict arises.
| Item 8(a)(3). | FUND MANAGER COMPENSATION |
NWQ offers a highly competitive compensation structure with the purpose of attracting and retaining the most talented investment professionals. These professionals are rewarded through a combination of cash and long-term incentive compensation as determined by the firm’s executive committee. Total cash compensation (TCC) consists of both a base salary and an annual bonus that can be a multiple of the base salary.
NWQ annually benchmarks TCC to prevailing industry norms with the objective of achieving competitive levels for all contributing professionals. In addition, Nuveen annually participates in the McLagan compensation survey, and regularly benchmarks employee salaries, bonus, and total cash levels to ensure it remains competitive.
Available bonus pool compensation is primarily a function of the firm’s overall annual profitability, and in the interest of employee and client interest alliance, NWQ’s bonus pool will be augmented based on investment performance exceeding applicable benchmarks. Individual bonuses are based primarily on the following:
| • | | Overall performance of client portfolios |
| • | | Objective review of stock recommendations and the quality of primary research |
| • | | Subjective review of the professional’s contributions to portfolio strategy, teamwork, collaboration and work ethic |
To further strengthen our incentive compensation package and to create an even stronger alignment to the long-term success of the firm, NWQ provides a number of other incentive opportunities through long-term employment contracts with certain senior executives, retention agreements, and an equity incentive plan with non-solicitation and non-compete provisions for participating employees. The equity incentive plan provides meaningful equity to participating employees that is similar to restricted stock and options, and vests over the next several years. The equity ownership is large in scale, broadly distributed, and has a robust governance structure to ensure that NWQ’s professionals have a strong alignment of interests with the firm’s clients over the long term. Equity incentive plans allowing key employees of NWQ to participate in the firm’s growth over time have been in place since Nuveen’s acquisition of NWQ.
At NWQ, we believe that we are an employer of choice. Our analysts have a meaningful impact on the portfolio and, therefore, are compensated in a manner similar to portfolio managers at many other firms.
| Item 8(a)(4). | OWNERSHIP OF JTA SECURITIES AS OF DECEMBER 31, 2016 |
| | | | | | | | | | | | | | | | | | | | | | | | | | | | |
Name of Portfolio Manager | | None | | | $1 -$10,000 | | | $10,001-
$50,000 | | | $50,001-
$100,000 | | | $100,001-
$500,000 | | | $500,001-
$1,000,000 | | | Over $1,000,000 | |
Thomas Ray | | | X | | | | | | | | | | | | | | | | | | | | | | | | | |
Susi Budiman | | | X | | | | | | | | | | | | | | | | | | | | | | | | | |
James Stephenson | | | | | | | | | | | | | | | X | | | | | | | | | | | | | |
ITEM 9. PURCHASES OF EQUITY SECURITIES BY CLOSED-END MANAGEMENT INVESTMENT COMPANY AND AFFILIATED PURCHASERS.
Not applicable.
ITEM 10. SUBMISSION OF MATTERS TO A VOTE OF SECURITY HOLDERS.
There have been no material changes to the procedures by which shareholders may recommend nominees to the registrant’s Board implemented after the registrant last provided disclosure in response to this Item.
ITEM 11. CONTROLS AND PROCEDURES.
| | (a) | The registrant’s principal executive and principal financial officers, or persons performing similar functions, have concluded that the registrant’s disclosure controls and procedures (as defined in Rule 30a-3(c) under the Investment Company Act of 1940, as amended (the “1940 Act”) (17 CFR 270.30a-3(c))) are effective, as of a date within 90 days of the filing date of this report that includes the disclosure required by this paragraph, based on their evaluation of the controls and procedures required by Rule 30a-3(b) under the 1940 Act (17 CFR 270.30a-3(b)) and Rules 13a-15(b) or 15d-15 (b) under the Securities Exchange Act of 1934, as amended (the “Exchange Act”) (17 CFR 240.13a-15(b) or 240.15d-15 (b)). |
| | (b) | There were no changes in the registrant’s internal control over financial reporting (as defined in Rule 30a-3(d) under the 1940 Act (17 CFR 270.30a-3(d)) that occurred during the second fiscal quarter of the period covered by this report that has materially affected, or is reasonably likely to materially affect, the registrant’s internal control over financial reporting. |
ITEM 12. EXHIBITS.
File the exhibits listed below as part of this Form.
(a)(1) Any code of ethics, or amendment thereto, that is the subject of the disclosure required by Item 2, to the extent that the registrant intends to satisfy the Item 2 requirements through filing of an exhibit: Not applicable because the code is posted on registrant’s website at www.nuveen.com/CEF/Shareholder/FundGovernance.aspx and there were no amendments during the period covered by this report. (To view the code, click on Code of Conduct.)
(a)(2) A separate certification for each principal executive officer and principal financial officer of the registrant as required by Rule 30a-2(a) under the 1940 Act (17 CFR 270.30a-2(a)) in the exact form set forth below: Ex-99.CERT Attached hereto.
(a)(3) Any written solicitation to purchase securities under Rule 23c-1 under the 1940 Act (17 CFR 270.23c-1) sent or given during the period covered by the report by or on behalf of the registrant to 10 or more persons. Not applicable.
(b) If the report is filed under Section 13(a) or 15(d) of the Exchange Act, provide the certifications required by Rule 30a-2(b) under the 1940 Act (17 CFR 270.30a-2(b)); Rule 13a-14(b) or Rule 15d-14(b) under the Exchange Act (17 CFR 240.13a-14(b) or 240.15d-14(b)), and Section 1350 of Chapter 63 of Title 18 of the United States Code (18 U.S.C. 1350) as an exhibit. A certification furnished pursuant to this paragraph will not be deemed “filed” for purposes of Section 18 of the Exchange Act (15 U.S.C. 78r), or otherwise subject to the liability of that section. Such certification will not be deemed to be incorporated by reference into any filing under the Securities Act of 1933 or the Exchange Act, except to the extent that the registrant specifically incorporates it by reference. Ex-99.906 CERT attached hereto.
SIGNATURES
Pursuant to the requirements of the Securities Exchange Act of 1934 and the Investment Company Act of 1940, the registrant has duly caused this report to be signed on its behalf by the undersigned, thereunto duly authorized.
(Registrant) Nuveen Tax-Advantaged Total Return Strategy Fund
| | | | |
| By (Signature and Title) | | /s/ Gifford R. Zimmerman | | |
| | Gifford R. Zimmerman | | |
| | Vice President and Secretary | | |
| |
| Date: March 9, 2017 | | |
Pursuant to the requirements of the Securities Exchange Act of 1934 and the Investment Company Act of 1940, this report has been signed below by the following persons on behalf of the registrant and in the capacities and on the dates indicated.
| | | | |
| By (Signature and Title) | | /s/ Cedric H. Antosiewicz | | |
| | Cedric H. Antosiewicz | | |
| | Chief Administrative Officer | | |
| | (principal executive officer) | | |
| |
| Date: March 9, 2017 | | |
| | |
| By (Signature and Title) | | /s/ Stephen D. Foy | | |
| | Stephen D. Foy | | |
| | Vice President and Controller | | |
| | (principal financial officer) | | |
| |
| Date: March 9, 2017 | | |