UNITED STATES
SECURITIES AND EXCHANGE COMMISSION
Washington, D.C. 20549
FORM N-CSR
CERTIFIED SHAREHOLDER REPORT OF REGISTERED
MANAGEMENT INVESTMENT COMPANIES
Investment Company Act file number | 811-21471 |
|
Nuveen Tax-Advantaged Total Return Strategy Fund |
(Exact name of registrant as specified in charter) |
|
Nuveen Investments 333 West Wacker Drive Chicago, IL 60606 |
(Address of principal executive offices) (Zip code) |
|
Kevin J. McCarthy Nuveen Investments 333 West Wacker Drive Chicago, IL 60606 |
(Name and address of agent for service) |
|
Registrant’s telephone number, including area code: | (312) 917-7700 | |
|
Date of fiscal year end: | December 31 | |
|
Date of reporting period: | December 31, 2014 | |
| | | | | | |
Form N-CSR is to be used by management investment companies to file reports with the Commission not later than 10 days after the transmission to stockholders of any report that is required to be transmitted to stockholders under Rule 30e-1 under the Investment Company Act of 1940 (17 CFR 270.30e-1). The Commission may use the information provided on Form N-CSR in its regulatory, disclosure review, inspection, and policymaking roles.
A registrant is required to disclose the information specified by Form N-CSR, and the Commission will make this information public. A registrant is not required to respond to the collection of information contained in Form N-CSR unless the Form displays a currently valid Office of Management and Budget (“OMB”) control number. Please direct comments concerning the accuracy of the information collection burden estimate and any suggestions for reducing the burden to Secretary, Securities and Exchange Commission, 450 Fifth Street, NW, Washington, DC 20549-0609. The OMB has reviewed this collection of information under the clearance requirements of 44 U.S.C. ss. 3507.
ITEM 1. REPORTS TO SHAREHOLDERS

Nuveen Investments
Closed-End Funds
Annual Report December 31, 2014
JTA
Nuveen Tax-Advantaged Total Return Strategy Fund
NUVEEN INVESTMENTS ACQUIRED BY TIAA-CREF
On October 1, 2014, TIAA-CREF completed its previously announced acquisition of Nuveen Investments, Inc., the parent company of your fund's investment adviser, Nuveen Fund Advisors, LLC ("NFAL") and the Nuveen affiliates that act as sub-advisers to the majority of the Nuveen Funds. TIAA-CREF is a national financial services organization with approximately $851 billion in assets under management as of December 31, 2014 and is a leading provider of retirement services in the academic, research, medical and cultural fields. Nuveen is operating as a separate subsidiary within TIAA-CREF's asset management business.

Chairman's Letter to Shareholders | | | 4 | | |
Portfolio Managers' Comments | | | 5 | | |
Fund Leverage | | | 11 | | |
Common Share Information | | | 12 | | |
Risk Considerations | | | 15 | | |
Performance Overview and Holding Summaries | | | 17 | | |
Shareholder Meeting Report | | | 19 | | |
Report of Independent Registered Public Accounting Firm | | | 20 | | |
Portfolio of Investments | | | 21 | | |
Statement of Assets & Liabilities | | | 30 | | |
Statement of Operations | | | 31 | | |
Statement of Changes in Net Assets | | | 32 | | |
Statement of Cash Flows | | | 33 | | |
Financial Highlights | | | 34 | | |
Notes to Financial Statements | | | 36 | | |
Additional Fund Information | | | 46 | | |
Glossary of Terms Used in this Report | | | 48 | | |
Reinvest Automatically, Easily and Conveniently | | | 49 | | |
Board Members & Officers | | | 50 | | |
Nuveen Investments
3
Chairman's Letter
to Shareholders

Dear Shareholders,
A pattern of divergence has emerged in the past year. Steady and moderate growth in the U.S. economy helped sustain the stock market's bull run another year. U.S. bonds also performed well, amid subdued inflation, interest rates that remained unexpectedly low and concerns about the economic well-being of the rest of the world. The stronger domestic economy enabled the U.S. Federal Reserve (Fed) to gradually reduce its large scale bond purchases, known as quantitative easing (QE), without disruption to the markets, as well as begin to set expectations for a transition into tightening mode.
The story outside the U.S., however, was different. European growth was stagnating and Japan fell into a recession, contributing to the bouts of volatility in their markets. China's economy decelerated and, despite running well above the rate of other major global economies, investors feared it looked slow by China's standards. Compounding these concerns were a surprisingly steep decline in oil prices, the U.S. dollar's rally and an increase in geopolitical tensions, including the Russia-Ukraine crisis and terrorist attacks across the Middle East and Africa, as well as more recently in Europe.
While a backdrop of healthy economic growth in the U.S. and the continuation of accommodative monetary policy (with the central banks of Japan and potentially Europe stepping in where the Fed has left off) bodes well for the markets, the global outlook has become more uncertain. Indeed, volatility is likely to feature more prominently in the investment landscape going forward. Such conditions underscore the importance of professional investment management. Experienced investment teams have weathered the market's ups and downs in the past and emerged with a better understanding of the sensitivities of their asset class and investment style, particularly in times of turbulence. We recognize the importance of maximizing gains, while striving to minimize volatility.
And, the same is true for investors like you. Maintaining an appropriate time horizon, diversification and relying on practiced investment teams are among your best strategies for achieving your long-term investment objectives. Additionally, I encourage you to communicate with your financial consultant if you have questions about your investment in a Nuveen Fund. On behalf of the other members of the Nuveen Fund Board, we look forward to continuing to earn your trust in the months and years ahead.

William J. Schneider
Chairman of the Board
February 23, 2015
Nuveen Investments
4
Portfolio Managers'
Comments
Nuveen Tax-Advantaged Total Return Strategy Fund (JTA)
The Fund features portfolio management by two affiliates of Nuveen Investments, Inc. The Fund's investments in dividend-paying common and preferred stocks and call options written are managed by NWQ Investment Management Company, LLC (NWQ), while the Fund's investments in senior corporate loans and other debt instruments are managed by Symphony Asset Management LLC (Symphony). James T. Stephenson, CFA, Managing Director of NWQ, along with Thomas J. Ray, CFA, and Susi Budiman, CFA, manage the NWQ portion of the Fund. Effective January 6, 2015, Thomas J. Ray succeeds Michael J. Carne, CFA, who is no longer with the firm. The Symphony team is led by Gunther Stein, who serves as the firm's Chief Investment Officer.
Effective January 30, 2015 (subsequent to the close of this reporting period), the following changes have been made to the Fund:
JTA's investment objective is high after-tax total return, consisting primarily of tax-advantaged dividend income and capital appreciation. The Fund constructs its portfolio by allocating approximately 80% of its managed assets to a global equity income strategy and approximately 20% of its managed assets to a adjustable rate senior loan strategy. If the allocation varies outside a defined range, the Fund will rebalance the allocation. Over time, the Fund may change the target allocation. Each strategy is managed by a separate, specialized sub-adviser:
1) Global Equity Income: a globally diversified portfolio focused on tax-advantaged income-producing and dividend-paying equity and preferred securities, sub-advised by NWQ;
2) Adjustable Rate Senior Loans: an adjustable rate senior loan portfolio strategy, sub-advised by Symphony.
New investment policies that apply overall to the Fund as a whole:
• At least 60% of the Fund's managed assets will be invested in tax-advantaged income-producing equity securities, including DRD preferred securities;
• The Fund has greater flexibility to invest (up to 70% of the Fund's managed assets) in non-U.S. issues of any currency;
• The Fund has greater flexibility to invest (up to 20% of the Fund's managed assets) in securities of issuers of emerging market countries; and
• The Fund has flexibility to use derivatives both for hedging purposes and to enhance risk-adjusted returns, including writing (selling) covered options.
Certain statements in this report are forward-looking statements. Discussions of specific investments are for illustration only and are not intended as recommendations of individual investments. The forward-looking statements and other views expressed herein are those of the portfolio managers as of the date of this report. Actual future results or occurrences may differ significantly from those anticipated in any forward-looking statements and the views expressed herein are subject to change at any time, due to numerous market and other factors. The Fund disclaims any obligation to update publicly or revise any forward-looking statements or views expressed herein.
Ratings shown are the highest rating given by one of the following national rating agencies: Standard & Poor's (S&P), Moody's Investors Service, Inc. (Moody's) or Fitch, Inc. (Fitch). Credit ratings are subject to change. AAA, AA, A and BBB are investment grade ratings; BB, B, CCC, CC, C and D are below investment grade ratings. Certain bonds backed by U.S. Government or agency securities are regarded as having an implied rating equal to the rating of such securities. Holdings designated N/R are not rated by these national rating agencies.
Refer to the Glossary of Terms Used in this Report for further definition of the terms used within this section.
Nuveen Investments
5
Portfolio Managers' Comments (continued)
New investment policies that apply only to the Global Equity Income strategy portion of JTA:
• The Global Equity Income strategy may invest in common stocks, preferred securities, convertible securities, convertible preferred securities, real estate investment trusts (REITs), master limited partnerships (MLPs), and debt; and
• The Fund's policies regarding credit ratings as they apply to the equity securities in the Global Equity Income strategy portion of the Fund have been eliminated.
Here Jim, Thomas, Susi and Gunther review economic and market conditions, their management strategies and the performance of the Fund for the twelve-month reporting period ended December 31, 2014.
What factors affected the U.S. economy and the financial markets during the twelve-month reporting period ended December 31, 2014?
During this reporting period, the U.S. economy continued to expand at a moderate pace. The Federal Reserve (Fed) maintained efforts to bolster growth and promote progress toward its mandates of maximum employment and price stability by holding the benchmark fed funds rate at the record low level of zero to 0.25% that it established in December 2008. At its October 2014 meeting, the Fed announced that it would end its bond-buying stimulus program as of November 1, 2014, after tapering its monthly asset purchases of mortgage-backed and longer-term Treasury securities from the original $85 billion per month to $15 billion per month over the course of seven consecutive meetings (December 2013 through September 2014). In making the announcement, the Fed cited substantial improvement in the outlook for the labor market since the inception of the current asset purchase program as well as sufficient underlying strength in the broader economy to support ongoing progress toward maximum employment in a context of price stability. The Fed also reiterated that it would continue to look at a wide range of factors, including labor market conditions, indicators of inflationary pressures and readings on financial developments, in determining future actions. Additionally, the Fed stated that it would likely maintain the current target range for the fed funds rate for a considerable time after the end of the asset purchase program, especially if projected inflation continues to run below the Fed's 2% longer-run goal. However, if economic data shows faster progress toward the Fed's employment and inflation objectives than currently anticipated, the Fed indicated that the first increase in the fed funds rate since 2006 could occur sooner than expected.
In the fourth quarter of 2014, the U.S. economy, as measured by the U.S. gross domestic product (GDP), grew at a 2.6% annual rate, compared with 4.6% in the second quarter and 5.0% in the third quarter of 2014. The decline in real GDP growth rate from the third quarter to the fourth quarter primarily reflects an upturn in imports, a downturn in federal government spending, and decline in exports. These were partly offset by an upturn in consumer spending. The Consumer Price Index (CPI) rose 0.8% year-over-year as of December 2014, while the core CPI (which excludes food and energy) increased 1.6% during the same period, below the Fed's unofficial longer term inflation objective of 2.0%. As of December 31, 2014, the national unemployment rate was 5.6%, the lowest level since July 2008, down from the 6.7% reported in December 2013. The housing market continued to post gains, although price growth has shown signs of deceleration in recent months. The average home price in the S&P/Case-Shiller Index of 20 major metropolitan areas rose 4.7% for the twelve months ended November 2014 (most recent data available at the time this report was prepared).
As investor sentiment and risk aversion fluctuated throughout the reporting period, U.S. equities across the risk spectrum posted generally positive returns supported by solid corporate earnings, positive economic reports and continued accommodative monetary policy. During the first few months of this reporting period, the financial markets were unsettled in the aftermath of widespread uncertainty about the future of the Fed's quantitative easing program. Also contributing to investor concern was Congress's failure to reach agreement on the Fiscal 2014 federal budget, which had triggered sequestration, or automatic spending cuts and a 16-day federal government shutdown in October 2013. As we moved into 2014, investors quickly shook off these issues and the current bull market in the U.S. entered its sixth year. Then, midway through the first calendar quarter, investors grew concerned about the dampening effects of severe winter
Nuveen Investments
6
weather on near-term growth, firmer language from the Fed regarding potential stimulus withdrawal and mounting tensions with Russia over its territorial assertions in Ukraine. The stock market experienced a rather quick and dramatic rotation away from higher growth, higher price/earnings ratio stocks that had performed so well in 2013 and into more defensive, value-oriented stocks. As we moved into the spring and summer months, equity markets again hit new highs as U.S. data improved and policy uncertainty was reduced. Market volatility declined to levels near historical lows prompting some concern from market analysts and policymakers who believed that investors may be growing overly complacent. As conditions improved on the domestic front, however, global growth was called into question as China and the emerging markets slowed, while Europe slipped back into a recession. The U.S. dollar strengthened dramatically, which weighed on the prices of all commodities. Oil prices experienced a dramatic decline from their early June high of approximately $105/barrel and ended the reporting period at approximately $65/barrel (source: West Texas Intermediate).
During the reporting period, the best performing sectors in the Russell 3000® Value Index after technology, which posted the highest return, were the defensive/high dividend paying sectors (health care, utilities and consumer staples). Within the index's finance sector, real estate investment trusts (REITs) posted exceptionally strong returns. Given the strength of our economy and dollar, U.S. equity markets substantially outperformed returns from almost all developed equity markets with the S&P 500® Index beating the MSCI EAFE Index by more than 1800 basis points in local currency terms, the most since 1997. Despite some positive performance in local currencies, our investment in non-U.S. based companies through American Depositary Receipts (ADRs) served as a meaningful headwind to performance driven mainly by the weakening of those currencies relative to the U.S. dollar. The market was extremely narrow and defensive, particularly toward the end of the reporting period, as global economic weakness surfaced.
Despite increased market volatility, preferred securities performed exceptionally well during the reporting period. The BofA Merrill Lynch Preferred Stock Fixed Rate Index returned 15.4% for the reporting period, the best annual performance since 2009. Preferred securities handily outperformed investment grade and high yield corporate bonds. Preferred prices benefited from the market's need for long duration and yield, as evidenced by the large rally in 30 year Treasuries and the flattening of the yield curve.
Throughout much of the reporting period, the loan market was defined by continued retail mutual fund outflows being largely offset by supportive institutional demand, predominantly collateralized loan obligation (CLO) issuance. The reporting period began with most of the loan market being priced above par, with an outlook based on coupon-like return expectations. Conversely, by the end of the reporting period, the loan market experienced increased volatility, driven largely by fourth quarter weakness and finished with a vast majority of the loan market priced below par. In addition, while energy is only a fractional representation of the loan market, weakness in the sector seemingly re-priced risk across all credit assets as well as increased default concerns in the energy sector. Other notable influences came in the second half of the reporting period as net new supply within loans gained steam on the heels of merger and acquisition (M&A) activity and overall leveraged buyout (LBO) financing.
What key strategies were used to manage the Fund during this twelve-month reporting period ended December 31, 2014?
The Fund is designed to seek a high level of after-tax total return consisting primarily of tax-advantaged dividend income and capital appreciation. In an effort to achieve this, the Fund invests at least 60% in common stocks whose dividends may be eligible for favorable income tax treatment. The Fund also invests to a more limited extent in preferred stocks, which can range from a minimum of 5% to a maximum of 20%, that are eligible to pay tax-advantaged dividends, as well as 20% in senior loans and other debt instruments.
Nuveen Investments
7
Portfolio Managers' Comments (continued)
NWQ Key Strategies
For the common and preferred equity portion of the Fund's portfolio, NWQ continued to employ an opportunistic, bottom-up strategy that focused on identifying undervalued companies possessing favorable risk/reward characteristics as well as what it thought were emerging catalysts that could unlock value or improve profitability. These catalysts included management changes, restructuring efforts, recognition of hidden assets and/or a positive change in the underlying fundamentals. We also focused on downside risk management and paid a great deal of attention to a company's balance sheet and cash flow statement, not just the income statement. We believed that cash flow analysis offered a more objective picture of a company's financial position than an evaluation based on earnings alone.
Its overall goal is to provide a high total return to investors with a lower amount of risk. Managing an equity income based strategy can accomplish this through both capital appreciation and a higher than average proportion of return through dividends.
Some traditional dividend paying companies sell at historically high valuation levels both on an absolute basis and relative to history and the broader market. Therefore, the Fund has fewer holdings in utilities and U.S. telecom service companies than many of our peers, as we view those areas to be substantially fully valued.
We increased exposure to companies in developed foreign markets, namely Europe. Many of these companies pay higher levels of dividend income than similar enterprises in the U.S. and are less expensive on a valuation basis. Additionally, there exists a wider representation of industries whose companies pay dividends than in the U.S.
During the reporting period, we continued to find better values and more upside for capital return in the financial and technology sectors. Many financials' balance sheets have been over-capitalized with room for share repurchases and dividend increases as the regulatory cloud surrounding them continues to lift. Technology companies with sub-optimal capital structures and cash may receive even more pressure over time to return that capital to shareholders. We believe both sectors may potentially increase their capital returns, which could in turn allow for a re-rating of the companies.
Finally, we continued to employ a bottom-up approach. We found interesting names within a variety of industries. Rather than look for the highest dividend paying stocks, we seek to invest in the best companies at an attractive valuation with a good risk/reward profile and catalysts that can change the valuation of the company. Companies that experience renewed capital discipline can often demonstrate this through a return of capital. Increased dividend payments, as well as share repurchases, become the catalyst for re-rating when it comes from companies that previously were misallocating capital. Often this comes from a management change, for example when the CFO becomes the CEO or perhaps when an outside force such as an active investor applies the pressure needed to affect change. We are seeing an increasing amount of these types of opportunities across multiple industries.
For the preferred securities portion of the Fund's portfolio, we review the specific characteristics of the preferred stocks available for investment and evaluate the effect on holding such an investment. These characteristics might include price, yield, issuer, rating, liquidity premium/discount and any other potential issues that can affect the value of the position. Additionally, because the preferred market is concentrated both by issuer and industry, attention is focused on the diversification of the Fund.
Symphony Key Strategies
In the senior loan and other debt portion of the Fund's portfolio, Symphony continued to manage and monitor senior loan market risks. The overall macroeconomic backdrop during the reporting period remained supportive of the leveraged loan asset class. The Fund's capital remained invested in issuers with strong credit profiles among non-investment grade debt, while offering attractive current income and yield. Fundamentally, Symphony feels that many of these companies have stable businesses, good asset coverage for senior debt holders and could perform well in a stable to slow growth environment.
Nuveen Investments
8
How did the Fund perform during this twelve-month reporting period ended December 31, 2014?
The table in the Performance Overview and Holding Summaries section of this report provides total return performance for the Fund for the one-year, five-year and ten-year periods ended December 31, 2014. For the twelve-month reporting period ended December 31, 2014, the Fund's total return on common share net asset value (NAV) underperformed its Blended Benchmark and the S&P 500® Index.
NWQ Performance
For the equity portion of the Fund managed by NWQ, the Fund's performance reflects gains in several holdings, although returns did modestly trail the benchmark for the reporting period. Overweight positions in the consumer discretionary, health care and technology sectors had a positive impact on performance, as well as a smaller energy exposure relative to the benchmark. Unfavorable stock selection in the industrial and telecommunication industries detracted from returns.
Several holdings positively contributed to performance. CVS Caremark Corporation appreciated on strong fundamentals and indications that the company will see significantly less impact from reimbursement pressures and generic drug inflation than its competitors. Underlying trends remain solid as the focus on increasing store brand penetration and prudent promotions are driving growth and margins. Also contributing to performance was Teva Pharmaceutical Industries, which has embarked on an aggressive $2 billion cost cutting plan that should help maintain strong profitability in the face of the upcoming patent expiration of its multiple sclerosis drug, Copaxone. Teva received FDA approval in late January for a 3 day/week dosing for Copaxone, and is actively working to shift its patients to the new formulation. Time Warner outperformed both the index and its media peers during the reporting period as there has been a widening valuation gap between differences in quality in the industry. Time Warner has established itself as a high quality name as it continues to develop content with sports and HBO. The company rejected a takeover from Fox in July and instead laid out a plan whereby they could add more value to shareholders by going it alone.
Those positions detracting from performance included, Copa Holdings, S.A., a leading Latin American airline with a strong balance sheet and one of the most modern fleets in the industry. The company's primary hub in Panama is ideally positioned between North and South America. The shares sold off on concerns that Venezuela, a strategically important market for Copa, would devalue its currency and place restrictions on the repatriation of cash out of the country. Furthermore, Copa had to reduce service in the country and has placed limits on bolivar-denominated ticket sales. We believe that Copa's robust growth and high profitability will remain intact despite these headwinds.
Also detracting from performance was Medley Capital Corporation, a New York City based business development company (BDC) that invests in the senior secured debt of private lower middle market companies. The stock underperformed on growing concern regarding the credit quality of the company's portfolio and related potential book value deterioration and stagnation. Management is expected to reduce the company's dividend in early 2015 as a result. We continue to own this position.
Lastly, National CineMedia, Inc. (NCMI), the largest supplier of commercials in movie theaters, declined after the U.S. Justice Dept. sued to stop the company's planned acquisition of its closest competitor, Screenvision Cinema Network. NCMI management is confident that the transaction will ultimately close as it believes many of the conclusions are inaccurate, particularly the narrowly defined in-theater advertising market and cinema advertising's small share of overall domestic advertising spending. We trimmed the stake in NCMI during the reporting period.
Our preferred stock banking and insurance holdings also contributed to performance and included such names as First Republic Bank, Axis Capital Holdings Limited and Arch Capital Group Limited. First Republic Bank is a mid-tier bank heavily focused on relationship banking that targets an affluent customer base and uses jumbo residential mortgage products lending as a feeder to its private banking and wealth management activities. This business model has produced stable operating results and solid asset quality metrics through credit cycles. Axis Capital Holdings Limited is a specialty insurance and reinsurance company that provides property and catastrophe insurance. We continue to believe the
Nuveen Investments
9
Portfolio Managers' Comments (continued)
company is well positioned to benefit from rate increases in property and casualty policies and to further grow its higher margin product lines such as accident and health. Lastly, Arch Capital Group Limited contributed to performance. The company writes insurance and reinsurance on a worldwide basis through operations in the U.S., Bermuda, Canada, Europe, Australia and South Africa, with a focus on specialty lines.
Our security selection in the industrial and utilities sectors detracted from performance. These preferred stock holdings included: Teekay Offshore Partners L.P. , an international provider of marine transportation, oil production and storage services to the offshore oil industry focusing on the fast-growing, deepwater offshore oil regions of the North Sea and Brazil; Magnum Hunter Resources Corporation is an independent oil and gas company engaged in the exploration for and the exploitation, acquisition, development and production of crude oil resources in the U.S. and Canada; and Miller Energy Resources is a high growth oil and natural gas exploration, production and drilling company operating multiple projects in North America. Energy-related securities performed poorly during the reporting period as oil prices declined given negative revisions of global oil demand, weaker macroeconomic news and a surging U.S. dollar.
During the reporting period, NWQ wrote (sold) covered call options on individual stocks held in the Fund's portfolio to enhance returns while foregoing some upside potential. The effect on performance for the reporting period was a small positive one.
Symphony Performance
The senior loan and other debt instruments portion of the Fund managed by Symphony also contributed to total return performance during the reporting period. Credit selection was the primary driver of performance. Our holdings in the food & drug and health care sectors were top contributors to performance, while our financial and energy holdings detracted from performance.
The Fund's position in the term loan of U.S. Foods, Inc. contributed to the performance. We believe the food and drug sector has historically been more defensive during periods of volatility and believe this loan offers an attractive coupon relative to the rest of the sector and broad market. Both the sector and the company have performed well, especially during the fourth quarter. We anticipate the loan will continue to be a core position in our portfolios in the near term. Also contributing to the Fund's performance was a term loan of Drumm Investors LLC. Drumm specializes in health care for seniors and performance benefited as the firm completed amendments to their loans throughout the year and continue to offer healthy yields.
Also positively contributing to performance was MGM Holdings Inc. having received solid 3Q14 results and positive operating momentum in Las Vegas. The entertainment company, develops, produces and co-produces, finances and distributes film and television content worldwide.
Energy holdings, while only a modest representation of the overall markets and the Fund's portfolio, were the key detractors for the reporting period. While we began reducing our exposure to the sector ahead of the steep decline in oil prices, we continued to maintain modest exposures that detracted from overall performance. Specifically, the loan of Fieldwood Energy, LLC, and Drill Rigs Holdings, Inc. weighed on performance during the reporting period.
Nuveen Investments
10
IMPACT OF THE FUND'S LEVERAGE STRATEGY ON PERFORMANCE
One important factor impacting the return of the Fund relative to its benchmarks was the Fund's use of leverage through the use of bank borrowings. The Fund uses leverage because our research has shown that, over time, leveraging provides opportunities for additional income and total return for common shareholders. However, use of leverage also can expose common shareholders to additional volatility. For example, as the prices of securities held by the Fund decline, the negative impact of these valuation changes on common share NAV and common shareholder total return is magnified by the use of leverage. Conversely, leverage may enhance common share returns during periods when the prices of securities held by the Fund generally are rising. The Fund's use of leverage had a positive impact on performance during this reporting period.
The Fund also continued to use swap contracts to partially fix the interest cost of leverage, which as mentioned previously, the Fund uses through bank borrowings. The swap contracts impact on performance was modestly negative during this reporting period, as interest rates moved lower.
As of December 31, 2014, the Fund's percentages of leverage are as shown in the accompanying table.
| | | JTA | |
Effective Leverage* | | | 30.97 | % | |
Regulatory Leverage* | | | 30.97 | % | |
* Effective leverage is the Fund's effective economic leverage, and includes both regulatory leverage and the leverage effects of certain derivative and other investments in a Fund's portfolio that increase the Fund's investment exposure. Regulatory leverage consists of preferred shares issued or borrowings of the Fund. Both of these are part of the Fund's capital structure. Regulatory leverage is subject to asset coverage limits set forth in the Investment Company Act of 1940.
THE FUND'S REGULATORY LEVERAGE
Bank Borrowings
The Fund employs regulatory leverage through the use of bank borrowings. As of December 31, 2014, the Fund had outstanding bank borrowings of $89,400,000.
Refer to Notes to Financial Statements, Note 9 – Borrowing Arrangements for further details.
Nuveen Investments
11
DISTRIBUTION INFORMATION
The following information regarding the Fund's distributions is current as of December 31, 2014. The Fund's distribution level may vary over time based on the Fund's investment activities and portfolio investment value changes.
The Fund has a managed distribution program. The goal of this program is to provide common shareholders with relatively consistent and predictable cash flow by systematically converting the Fund's expected long-term return potential into regular distributions. As a result, regular common share distributions throughout the year are likely to include a portion of expected long-term gains (both realized and unrealized), along with net investment income.
Important points to understand about the managed distribution program are:
• The Fund seeks to establish a relatively stable common share distribution rate that roughly corresponds to the projected total return from its investment strategy over an extended period of time. However, you should not draw any conclusions about the Fund's past or future investment performance from its current distribution rate.
• Actual common share returns will differ from projected long-term returns (and therefore the Fund's distribution rate), at least over shorter time periods. Over a specific timeframe, the difference between actual returns and total distributions will be reflected in an increasing (returns exceed distributions) or a decreasing (distributions exceed returns) Fund net asset value.
• Each distribution is expected to be paid from some or all of the following sources:
• net investment income (regular interest and dividends),
• realized capital gains, and
• unrealized gains, or, in certain cases, a return of principal (non-taxable distributions).
• A non-taxable distribution is a payment of a portion of the Fund's capital. When the Fund's returns exceed distributions, it may represent portfolio gains generated, but not realized as a taxable capital gain. In periods when the Fund's returns fall short of distributions, the shortfall will represent a portion of your original principal, unless the shortfall is offset during other time periods over the life of your investment (previous or subsequent) when the Fund's total return exceeds distributions.
• Because distribution source estimates are updated during the year based on the Fund's performance and forecast for its current fiscal year (which is the calendar year for the Fund), estimates on the nature of your distributions provided at the time the distributions are paid may differ from both the tax information reported to you in your Fund's IRS Form 1099 statement provided at year end, as well as the ultimate economic sources of distributions over the life of your investment.
Nuveen Investments
12
The following table provides information regarding the Fund's common share distributions and total return performance for the fiscal year ended December 31, 2014. This information is intended to help you better understand whether the Fund's returns for the specified time period were sufficient to meet its distributions.
As of December 31, 2014 (Common Shares) | | JTA | |
Inception date | | 1/27/04 | |
Fiscal year (calendar year) ended December 31, 2014: | |
Per share distribution: | |
From net investment income | | $ | 1.03 | | |
From long-term capital gains | | | 0.00 | | |
From short-term capital gains | | | 0.00 | | |
Return of capital | | | 0.00 | | |
Total per share distribution | | $ | 1.03 | | |
Current distribution rate* | | | 8.19 | % | |
Average annual total returns: | |
Excluding retained gain tax credit/refund**: | |
| 1-Year on NAV | | | 4.91 | % | |
| 5-Year on NAV | | | 12.38 | % | |
| 10-Year on NAV | | | 3.96 | % | |
Including retained gain tax credit/refund**: | |
| 1-Year on NAV | | | 4.91 | % | |
| 5-Year on NAV | | | 12.38 | % | |
| 10-Year on NAV | | | 4.16 | % | |
* Current distribution rate is based on the Fund's current annualized quarterly distribution divided by the Fund's current market price. The Fund's quarterly distributions to its shareholders may be comprised of ordinary income, net realized capital gains and, if at the end of the fiscal year the Fund's cumulative net ordinary income and net realized gains are less than the amount of the Fund's distributions, a return of capital for tax purposes.
** The Fund elected to retain a portion of its realized long-term capital gains for the tax years ended December 31, 2007 and December 31, 2006, and pay required federal corporate income taxes on these amounts. As reported on Form 2439, common shareholders on record date must include their pro-rata share of these gains on their applicable federal tax returns, and are entitled to take offsetting tax credits, for their pro-rata share of the taxes paid by the Fund. The total returns "Including retained gain tax credit/refund" include the economic benefit to common shareholders on record date of these tax credits/refunds. The Fund had no retained capital gains for the tax years ended December 31, 2008 through December 31, 2014 or for the tax years ended prior to December 31, 2006.
Nuveen Investments
13
Common Share Information (continued)
COMMON SHARE REPURCHASES
During August 2014, the Fund's Board of Trustees reauthorized an open-market share repurchase program, allowing the Fund to repurchase an aggregate of up to approximately 10% of its outstanding shares.
As of December 31, 2014, and since the inception of the Fund's repurchase program, the Fund has cumulatively repurchased and retired common shares as shown in the accompanying table.
| | | JTA | |
Common Shares Cumulatively Repurchased and Retired | | | 122,745 | | |
Common Shares Authorized for Repurchase | | | 1,385,000 | | |
During the current reporting period, the Fund did not repurchase any of its outstanding common shares.
OTHER COMMON SHARE INFORMATION
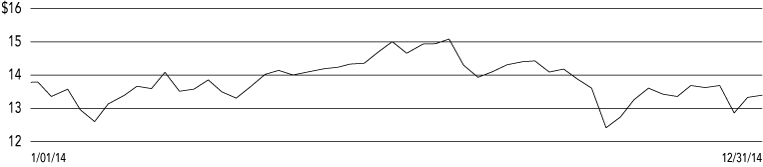
As of December 31, 2014, and during the current reporting period, the Fund's common share price was trading at a premium/(discount) to its common share NAV as shown in the accompanying table.
| | | JTA | |
Common Share NAV | | $ | 14.39 | | |
Common Share Price | | $ | 13.29 | | |
Premium/(Discount) to NAV | | | (7.64 | )% | |
12-Month Average Premium/(Discount) to NAV | | | (5.29 | )% | |
Nuveen Investments
14
Fund shares are not guaranteed or endorsed by any bank or other insured depository institution, and are not federally insured by the Federal Deposit Insurance Corporation. Shares of closed-end funds are subject to investment risks, including the possible loss of principal invested. Past performance is no guarantee of future results. Fund common shares are subject to a variety of risks, including:
Investment, Market and Price Risk. An investment in common shares is subject to investment risk, including the possible loss of the entire principal amount that you invest. Your investment in common shares represents an indirect investment in the corporate securities owned by the Fund, which generally trade in the over-the-counter markets. Shares of closed-end investment companies like the Fund frequently trade at a discount to their NAV. Your common shares at any point in time may be worth less than your original investment, even after taking into account the reinvestment of Fund dividends and distributions.
Leverage Risk. The Fund's use of leverage creates the possibility of higher volatility for the Fund's per share NAV, market price and distributions. Leverage risk can be introduced through regulatory leverage (issuing preferred shares or debt borrowings at the Fund level) or through certain derivative investments held in the Fund's portfolio. Leverage typically magnifies the total return of a Fund's portfolio, whether that return is positive or negative. The use of leverage creates an opportunity for increased common share net income, but there is no assurance that the Fund's leveraging strategy will be successful.
Tax Risk. The Fund's investment program and the tax treatment of Fund distributions may be affected by IRS interpretations of the Internal Revenue Code and future changes in tax laws and regulations that may alter the existing favorable tax treatment of tax-advantaged dividends. The American Taxpayer Relief Act of 2012 increased the maximum rate on tax-advantaged dividends to 20% effective January 1, 2013 on persons earning over $400,000 for individuals and $450,000 for married couples filing jointly. There can be no assurance as to the percentage of the Fund's distributions that will qualify as tax-advantaged dividends.
Common Stock Risk. Common stock returns often have experienced significant volatility.
Issuer Credit Risk. This is the risk that a security in the Fund's portfolio will fail to make dividend or interest payments when due.
Illiquid Securities Risk. This is the risk that the Fund may not be able to sell securities in its portfolio at the time or price desired by the Fund.
Below-Investment Grade Risk. Investments in securities below investment grade quality are predominantly speculative and subject to greater volatility and risk of default.
Unrated Investment Risk. In determining whether an unrated security is an appropriate investment for the Fund, the manager will consider information from industry sources, as well as its own quantitative and qualitative analysis, in making such a determination. However, such a determination by the manager is not the equivalent of a rating by a rating agency.
Dividend Income Risk. There is no guarantee that the issuers of common stocks in which the Fund invests will declare dividends in the future or that, if declared, they will remain at current levels or increase over time.
Nuveen Investments
15
Risk Considerations (continued)
Risks from Unsecured Adjustable Rate Loans or Insufficient Collateral Securing Adjustable Rate Loans. Some of the adjustable rate loans in which the Fund may invest will be unsecured or insufficiently collateralized, thereby increasing the risk of loss to the Fund in the event of issuer default.
Value Stock Risk. Value stocks are securities that the manager believes to be undervalued or mispriced. If the manager's assessment of a company's prospects is wrong, the price of the company's common stock or other equity securities may fall, or may not approach the value that the manager has placed on them.
Derivatives Strategy Risk. Derivative securities, such as calls, puts, warrants, swaps and forwards, carry risks different from, and possibly greater than, the risks associated with the underlying investments.
Interest Rate Swaps Risk. The risk that yields will move in the direction opposite to the direction anticipated by a Fund, which would cause a Fund to make payments to its counterparty in the transaction that could adversely affect the Fund's performance.
Reinvestment Risk. If market interest rates decline, income earned from the Fund's portfolio may be reinvested at rates below that of the original bond that generated the income.
Nuveen Investments
16
Nuveen Tax-Advantaged Total Return Strategy Fund
Performance Overview and Holding Summaries as of December 31, 2014
Refer to the Glossary of Terms Used in this Report for further definition of the terms used within this section.
Average Annual Total Returns as of December 31, 2014
| | Average Annual | |
| | 1-Year | | 5-Year | | 10-Year | |
JTA at Common Share NAV | | | 4.91 | % | | | 12.38 | % | | | 3.96 | % | |
JTA at Common Share Price | | | 1.44 | % | | | 13.11 | % | | | 4.91 | % | |
Blended Benchmark | | | 7.73 | % | | | 11.66 | % | | | 6.50 | % | |
S&P 500® Index | | | 13.69 | % | | | 15.45 | % | | | 7.67 | % | |
Average Annual Total Returns as of December 31, 20141
(including retained gain tax credit/refund)
| | Average Annual | |
| | 1-Year | | 5-Year | | 10-Year | |
JTA at Common Share NAV | | | 4.91 | % | | | 12.38 | % | | | 4.16 | % | |
JTA at Common Share Price | | | 1.44 | % | | | 13.11 | % | | | 5.12 | % | |
Past performance is not predictive of future results. Current performance may be higher or lower than the data shown. Returns do not reflect the deduction of taxes that shareholders may have to pay on Fund distributions or upon the sale of Fund shares. Returns at NAV are net of Fund expenses, and assume reinvestment of distributions. Comparative index return information is provided for the Fund's shares at NAV only. Indexes are not available for direct investment.
Common Share Price Performance — Weekly Closing Price
Nuveen Investments
17
This data relates to the securities held in the Fund's portfolio of investments as of the end of the reporting period. It should not be construed as a measure of performance for the Fund itself. Holdings are subject to change.
Fund Allocation
(% of net assets)
Common Stocks | | | 104.7 | % | |
Convertible Preferred Securities | | | 0.9 | % | |
$25 Par (or similar) Retail Preferred | | | 8.0 | % | |
Variable Rate Senior Loan Interests | | | 24.3 | % | |
Corporate Bonds | | | 0.7 | % | |
$1,000 Par (or similar) Institutional
Preferred | | | 2.1 | % | |
Short-Term Investments | | | 2.5 | % | |
Other Assets Less Liabilities | | | 1.7 | % | |
Net Assets Plus Borrowings | | | 144.9 | % | |
Borrowings | | | (44.9 | )% | |
Net Assets | | | 100 | % | |
Portfolio Composition
(% of total investments)2
Pharmaceuticals | | | 14.4 | % | |
Banks | | | 11.5 | % | |
Media | | | 10.3 | % | |
Insurance | | | 9.1 | % | |
Oil, Gas & Consumable Fuels | | | 5.1 | % | |
Software | | | 4.6 | % | |
Capital Markets | | | 4.1 | % | |
Automobiles | | | 3.7 | % | |
Communications Equipment | | | 3.2 | % | |
Food & Staples Retailing | | | 2.6 | % | |
Chemicals | | | 2.4 | % | |
Diversified Telecommunication
Services | | | 2.4 | % | |
Semiconductors & Semiconductor
Equipment | | | 2.3 | % | |
Consumer Finance | | | 2.2 | % | |
Containers & Packaging | | | 2.1 | % | |
Other | | | 18.3 | % | |
Short-Term Investments | | | 1.7 | % | |
Total | | | 100 | % | |
Top Five Issuers
(% of total investments)2
JPMorgan Chase & Co. | | | 3.0 | % | |
Wells Fargo & Company | | | 2.6 | % | |
Pfizer Inc. | | | 2.5 | % | |
Citigroup Inc. | | | 2.4 | % | |
Unum Group | | | 2.4 | % | |
1 As previously explained in the Common Share Information section of this report, the Fund elected to retain a portion of its realized long-term capital gains for the tax years ended December 31, 2007 and December 31, 2006, and pay required federal corporate income taxes on these amounts. These standardized total returns include the economic benefit to common shareholders of record of this tax credit/refund. The Fund had no retained capital gains for the tax years ended December 31, 2008 through December 31, 2014 or for the tax years ended prior to December 31, 2006.
2 Excluding investments in derivatives.
Nuveen Investments
18
Shareholder
Meeting Report
The annual meeting of shareholders was held in the offices of Nuveen Investments on August 5, 2014 for JTA; at this meeting the shareholders were asked to vote to approve a new investment management agreement, to approve new sub-advisory agreements and to elect Board Members.
| | | JTA | |
| | | Common
Shares | |
To approve a new investment management agreement
between the Fund and Nuveen Advisors, LLC. | |
For | | | 6,665,649 | | |
Against | | | 238,792 | | |
Abstain | | | 284,372 | | |
Broker Non-Votes | | | 1,921,381 | | |
Total | | | 9,110,194 | | |
To approve a new sub-advisory agreement between Nuveen Fund
Advisors and the Fund's sub-advisor(s) as follows: | |
b. Nuveen Fund Advisors and NWQ Investment Management Company, LLC. | |
For | | | 6,639,390 | | |
Against | | | 250,633 | | |
Abstain | | | 298,789 | | |
Broker Non-Votes | | | 1,921,382 | | |
Total | | | 9,110,194 | | |
d. Nuveen Fund Advisors and Symphony Asset Management LLC. | |
For | | | 6,623,770 | | |
Against | | | 258,130 | | |
Abstain | | | 306,912 | | |
Broker Non-Votes | | | 1,921,382 | | |
Total | | | 9,110,194 | | |
Approval of the Board Members was reached as follows: | |
William Adams IV | |
For | | | 8,725,084 | | |
Withhold | | | 385,110 | | |
Total | | | 9,110,194 | | |
David J. Kundert | |
For | | | 8,720,426 | | |
Withhold | | | 389,768 | | |
Total | | | 9,110,194 | | |
John K. Nelson | |
For | | | 8,720,736 | | |
Withhold | | | 389,458 | | |
Total | | | 9,110,194 | | |
Terence J. Toth | |
For | | | 8,743,788 | | |
Withhold | | | 366,406 | | |
Total | | | 9,110,194 | | |
Nuveen Investments
19
Report of
Independent Registered Public Accounting Firm
To the Board of Trustees and Shareholders of
Nuveen Tax-Advantaged Total Return Strategy Fund:
We have audited the accompanying statement of assets and liabilities, including the portfolio of investments, of Nuveen Tax-Advantaged Total Return Strategy Fund (the "Fund") as of December 31, 2014, and the related statements of operations, changes in net assets and cash flows, and the financial highlights for the year then ended. These financial statements and financial highlights are the responsibility of the Fund's management. Our responsibility is to express an opinion on these financial statements and financial highlights based on our audit. The statement of changes in net assets and the financial highlights for the periods presented through December 31, 2013, were audited by other auditors whose report dated February 27, 2014, expressed an unqualified opinion on that statement and those financial highlights.
We conducted our audit in accordance with the standards of the Public Company Accounting Oversight Board (United States). Those standards require that we plan and perform the audit to obtain reasonable assurance about whether the financial statements and financial highlights are free of material misstatement. An audit includes examining, on a test basis, evidence supporting the amounts and disclosures in the financial statements. Our procedures included confirmation of securities owned as of December 31, 2014, by correspondence with the custodian and brokers or other appropriate auditing procedures. An audit also includes assessing the accounting principles used and significant estimates made by management, as well as evaluating the overall financial statement presentation. We believe that our audit provides a reasonable basis for our opinion.
In our opinion, the financial statements and financial highlights referred to above present fairly, in all material respects, the financial position of the Fund as of December 31, 2014, the results of its operations, the changes in its net assets, its cash flows and the financial highlights for the year then ended, in conformity with U.S. generally accepted accounting principles.
/s/ KPMG LLP
Chicago, Illinois
February 25, 2015
Nuveen Investments
20
Nuveen Tax-Advantaged Total Return Strategy Fund
Portfolio of Investments December 31, 2014
| Shares | | Description (1) | | | | | | | | Value | |
| | | LONG-TERM INVESTMENTS – 140.7% (98.3% of Total Investments) | |
| | | COMMON STOCKS – 104.7% (73.1% of Total Investments) | |
| | | Airlines – 0.6% | |
| | 11,500 | | | Copa Holdings S.A. | | | | | | | | | | | | | | $ | 1,191,860 | | |
| | | Automobiles – 4.3% | |
| | 13,000 | | | Daimler AG, Sponsored ADR, (2) | | | | | | | | | | | | | | | 1,076,270 | | |
| | 200,000 | | | Ford Motor Company | | | | | | | | | | | | | | | 3,100,000 | | |
| | 123,000 | | | General Motors Company | | | | | | | | | | | | | | | 4,293,930 | | |
| | | Total Automobiles | | | 8,470,200 | | |
| | | Banks – 12.3% | |
| | 120,000 | | | Citigroup Inc. | | | | | | | | | | | | | | | 6,493,200 | | |
| | 240,000 | | | ING Groep N.V., Sponsored ADR | | | | | | | | | | | | | | | 3,112,800 | | |
| | 120,000 | | | JPMorgan Chase & Co. | | | | | | | | | | | | | | | 7,509,600 | | |
| | 135,000 | | | Wells Fargo & Company | | | | | | | | | | | | | | | 7,400,700 | | |
| | | Total Banks | | | 24,516,300 | | |
| | | Capital Markets – 5.0% | |
| | 194,000 | | | Ares Capital Corporation | | | | | | | | | | | | | | | 3,027,370 | | |
| | 131,000 | | | Bank New York Mellon | | | | | | | | | | | | | | | 5,314,670 | | |
| | 173,000 | | | Medley Capital Corporation | | | | | | | | | | | | | | | 1,598,520 | | |
| | | Total Capital Markets | | | 9,940,560 | | |
| | | Chemicals – 2.3% | |
| | 49,200 | | | Agrium Inc. | | | | | | | | | | | | | | | 4,660,224 | | |
| | | Communications Equipment – 4.5% | |
| | 170,000 | | | Cisco Systems, Inc. | | | | | | | | | | | | | | | 4,728,550 | | |
| | 355,000 | | | Ericsson, Sponsored ADR | | | | | | | | | | | | | | | 4,295,500 | | |
| | | Total Communications Equipment | | | 9,024,050 | | |
| | | Consumer Finance – 2.1% | |
| | 51,500 | | | Capital One Financial Corporation | | | | | | | | | | | | | | | 4,251,325 | | |
| | | Containers & Packaging – 2.3% | |
| | 88,200 | | | Avery Dennison Corporation | | | | | | | | | | | | | | | 4,575,816 | | |
| | | Diversified Financial Services – 1.6% | |
| | 450,000 | | | Deutsche Boerse AG, ADR, (2) | | | | | | | | | | | | | | | 3,186,000 | | |
| | | Diversified Telecommunication Services – 1.6% | |
| | 125,000 | | | Nippon Telegraph and Telephone Corporation, ADR | | | | | | | | | | | | | | | 3,201,250 | | |
| | | Food & Staples Retailing – 3.2% | |
| | 66,000 | | | CVS Caremark Corporation | | | | | | | | | | | | | | | 6,356,460 | | |
| | | Food Products – 0.5% | |
| | 158,000 | | | Orkla ASA, Sponsored ADR | | | | | | | | | | | | | | | 1,058,600 | | |
| | | Household Products – 1.1% | |
| | 23,500 | | | The Procter & Gamble Company | | | | | | | | | | | | | | | 2,140,615 | | |
Nuveen Investments
21
JTA Nuveen Tax-Advantaged Total Return Strategy Fund
Portfolio of Investments (continued) December 31, 2014
| Shares | | Description (1) | | | | | | | | Value | |
| | | Independent Power Producers & Energy Traders – 0.4% | |
| | 30,900 | | | Abengoa Yield PLC | | | | | | | | | | | | | | $ | 844,188 | | |
| | | Industrial Conglomerates – 2.8% | |
| | 82,100 | | | General Electric Company | | | | | | | | | | | | | | | 2,074,667 | | |
| | 120,000 | | | Philips Electronics | | | | | | | | | | | | | | | 3,480,000 | | |
| | | Total Industrial Conglomerates | | | 5,554,667 | | |
| | | Insurance – 10.6% | |
| | 133,800 | | | Allianz S.E., Sponsored ADR, (2) | | | | | | | | | | | | | | | 2,217,066 | | |
| | 99,500 | | | American International Group | | | | | | | | | | | | | | | 5,572,995 | | |
| | 76,900 | | | Hartford Financial Services Group, Inc. | | | | | | | | | | | | | | | 3,205,961 | | |
| | 40,000 | | | Swiss Re AG, Sponsored ADR, (2) | | | | | | | | | | | | | | | 3,367,384 | | |
| | 195,000 | | | Unum Group | | | | | | | | | | | | | | | 6,801,600 | | |
| | | Total Insurance | | | 21,165,006 | | |
| | | Machinery – 2.1% | |
| | 32,500 | | | Ingersoll-Rand PLC | | | | | | | | | | | | | | | 2,060,175 | | |
| | 31,000 | | | PACCAR Inc. | | | | | | | | | | | | | | | 2,108,310 | | |
| | | Total Machinery | | | 4,168,485 | | |
| | | Media – 11.0% | |
| | 283,000 | | | Interpublic Group Companies, Inc. | | | | | | | | | | | | | | | 5,877,910 | | |
| | 8,185 | | | Metro-Goldwyn-Mayer, (2), (3) | | | | | | | | | | | | | | | 601,598 | | |
| | 101,000 | | | National CineMedia, Inc. | | | | | | | | | | | | | | | 1,451,370 | | |
| | 205,000 | | | ProSiebenSat.1 Media AG, ADR, (2) | | | | | | | | | | | | | | | 2,155,575 | | |
| | 225,000 | | | RTL Group SA, ADR, (2) | | | | | | | | | | | | | | | 2,134,530 | | |
| | 66,400 | | | Time Warner Inc. | | | | | | | | | | | | | | | 5,671,888 | | |
| | 3,958 | | | Tribune Company, (3) | | | | | | | | | | | | | | | 236,570 | | |
| | 3,184 | | | Tribune Company, (3), (4) | | | | | | | | | | | | | | | – | | |
| | 989 | | | Tribune Publishing Company | | | | | | | | | | | | | | | 22,648 | | |
| | 50,000 | | | Viacom Inc., Class B | | | | | | | | | | | | | | | 3,762,500 | | |
| | | Total Media | | | 21,914,589 | | |
| | | Metals & Mining – 0.3% | |
| | 195,000 | | | AuRico Gold Inc. | | | | | | | | | | | | | | | 639,600 | | |
| | | Oil, Gas & Consumable Fuels – 6.6% | |
| | 54,400 | | | Phillips 66 | | | | | | | | | | | | | | | 3,900,480 | | |
| | 58,200 | | | Royal Dutch Shell PLC, Sponsored ADR | | | | | | | | | | | | | | | 3,896,490 | | |
| | 65,000 | | | Suncor Energy, Inc. | | | | | | | | | | | | | | | 2,065,700 | | |
| | 63,000 | | | Total SA, Sponsored ADR | | | | | | | | | | | | | | | 3,225,600 | | |
| | | Total Oil, Gas & Consumable Fuels | | | 13,088,270 | | |
| | | Pharmaceuticals – 19.2% | |
| | 62,000 | | | AbbVie Inc. | | | | | | | | | | | | | | | 4,057,280 | | |
| | 46,000 | | | AstraZeneca PLC, Sponsored ADR | | | | | | | | | | | | | | | 3,237,480 | | |
| | 141,000 | | | GlaxoSmithKline PLC, Sponsored ADR | | | | | | | | | | | | | | | 6,026,340 | | |
| | 61,200 | | | Merck & Company Inc. | | | | | | | | | | | | | | | 3,475,548 | | |
| | 225,000 | | | Pfizer Inc. | | | | | | | | | | | | | | | 7,008,750 | | |
| | 115,000 | | | Roche Holdings AG, Sponsored ADR, (2) | | | | | | | | | | | | | | | 3,908,850 | | |
| | 88,000 | | | Sanofi, ADR, (5) | | | | | | | | | | | | | | | 4,013,680 | | |
| | 113,500 | | | Teva Pharmaceutical Industries Limited, Sponsored ADR | | | | | | | | | | | | | | | 6,527,385 | | |
| | | Total Pharmaceuticals | | | 38,255,313 | | |
| | | Semiconductors & Semiconductor Equipment – 2.4% | |
| | 45,500 | | | Analog Devices, Inc., (6) | | | | | | | | | | | | | | | 2,526,160 | | |
| | 49,000 | | | Microchip Technology Incorporated | | | | | | | | | | | | | | | 2,210,390 | | |
| | | Total Semiconductors & Semiconductor Equipment | | | 4,736,550 | | |
Nuveen Investments
22
| Shares | | Description (1) | | | | | | | | Value | |
| | | Software – 4.9% | |
| | 102,900 | | | Microsoft Corporation | | | | | | | | | | | | | | $ | 4,779,705 | | |
| | 110,500 | | | Oracle Corporation | | | | | | | | | | | | | | | 4,969,184 | | |
| | | Total Software | | | 9,748,889 | | |
| | | Tobacco – 1.9% | |
| | 20,000 | | | Imperial Tobacco Group, Sponsored ADR, (2) | | | | | | | | | | | | | | | 1,750,000 | | |
| | 26,000 | | | Philip Morris International | | | | | | | | | | | | | | | 2,117,700 | | |
| | | Total Tobacco | | | 3,867,700 | | |
| | | Wireless Telecommunication Services – 1.1% | |
| | 61,000 | | | Vodafone Group PLC, Sponsored ADR | | | | | | | | | | | | | | | 2,084,370 | | |
| | | Total Common Stocks (cost $161,150,008) | | | 208,640,887 | | |
| Shares | | Description (1) | | Coupon | | | | Ratings (7) | | Value | |
| | | CONVERTIBLE PREFERRED SECURITIES – 0.9% (0.6% of Total Investments) | |
| | | Diversified Telecommunication Services – 0.9% | |
| | 39,000 | | | IntelSat SA | | | 5.750 | % | | | | | | N/R | | $ | 1,833,000 | | |
| | | Total Convertible Preferred Securities (cost $2,100,906) | | | 1,833,000 | | |
| Shares | | Description (1) | | Coupon | | | | Ratings (7) | | Value | |
| | | $25 PAR (OR SIMILAR) RETAIL PREFERRED – 8.0% (5.6% of Total Investments) | |
| | | Banks – 2.0% | |
| | 13,800 | | | Boston Private Financial Holdings Inc. | | | 6.950 | % | | | | | | N/R | | $ | 343,897 | | |
| | 25,445 | | | City National Corporation | | | 6.750 | % | | | | | | Baa3 | | | 707,880 | | |
| | 6,525 | | | Cobank Agricultural Credit Bank, (8) | | | 6.250 | % | | | | | | BBB+ | | | 657,598 | | |
| | 3,250 | | | Cobank Agricultural Credit Bank, (8) | | | 6.125 | % | | | | | | BBB+ | | | 294,937 | | |
| | 17,300 | | | Fifth Third Bancorp. | | | 6.625 | % | | | | | | BB+ | | | 472,809 | | |
| | 10,000 | | | First Republic Bank of San Francisco | | | 7.000 | % | | | | | | BBB– | | | 275,000 | | |
| | 6,700 | | | MB Financial Inc. | | | 8.000 | % | | | | | | N/R | | | 182,240 | | |
| | 2,873 | | | PNC Financial Services | | | 6.125 | % | | | | | | BBB– | | | 79,754 | | |
| | 17,700 | | | Regions Financial Corporation | | | 6.375 | % | | | | | | B1 | | | 449,580 | | |
| | 21 | | | TCF Financial Corporation | | | 7.500 | % | | | | | | BB– | | | 549 | | |
| | 20,400 | | | U.S. Bancorp. | | | 6.500 | % | | | | | | Baa1 | | | 600,780 | | |
| | | Total Banks | | | 4,065,024 | | |
| | | Capital Markets – 0.6% | |
| | 16,650 | | | Ladenburg Thalmann Financial Services Inc. | | | 8.000 | % | | | | | | N/R | | | 407,426 | | |
| | 25,675 | | | Morgan Stanley | | | 7.125 | % | | | | | | BB | | | 706,833 | | |
| | | Total Capital Markets | | | 1,114,259 | | |
| | | Consumer Finance – 0.6% | |
| | 9,200 | | | Capital One Financial Corporation | | | 6.700 | % | | | | | | Ba1 | | | 238,280 | | |
| | 24,160 | | | HSBC Finance Corporation | | | 6.360 | % | | | | | | BBB– | | | 612,214 | | |
| | 6,776 | | | SLM Corporation, Series A | | | 6.970 | % | | | | | | B3 | | | 334,192 | | |
| | | Total Consumer Finance | | | 1,184,686 | | |
| | | Diversified Financial Services – 0.1% | |
| | 10,000 | | | KKR Financial Holdings LLC | | | 7.375 | % | | | | | | BBB | | | 266,600 | | |
| | | Electric Utilities – 0.8% | |
| | 17,650 | | | Alabama Power Company, (8) | | | 6.500 | % | | | | | | A3 | | | 482,618 | | |
| | 9,900 | | | Alabama Power Company, (8) | | | 6.450 | % | | | | | | A3 | | | 270,085 | | |
| | 3,223 | | | Georgia Power Company, (8) | | | 6.500 | % | | | | | | A– | | | 342,041 | | |
| | 5,000 | | | Gulf Power Company, (8) | | | 6.450 | % | | | | | | BBB+ | | | 501,425 | | |
| | | Total Electric Utilities | | | 1,596,169 | | |
Nuveen Investments
23
JTA Nuveen Tax-Advantaged Total Return Strategy Fund
Portfolio of Investments (continued) December 31, 2014
| Shares | | Description (1) | | Coupon | | | | Ratings (7) | | Value | |
| | | Food Products – 0.3% | |
| | 17,700 | | | CHS Inc. | | | 7.100 | % | | | | | | N/R | | $ | 464,802 | | |
| | 9,030 | | | CHS Inc. | | | 6.750 | % | | | | | | N/R | | | 229,543 | | |
| | | Total Food Products | | | 694,345 | | |
| | | Insurance – 2.5% | |
| | 21,289 | | | Allstate Corporation | | | 6.750 | % | | | | | | BBB– | | | 573,739 | | |
| | 30,050 | | | Arch Capital Group Limited | | | 6.750 | % | | | | | | BBB | | | 810,449 | | |
| | 10,400 | | | Aspen Insurance Holdings Limited | | | 7.401 | % | | | | | | BBB– | | | 272,168 | | |
| | 25,410 | | | Aspen Insurance Holdings Limited | | | 7.250 | % | | | | | | BBB– | | | 665,234 | | |
| | 25,798 | | | Axis Capital Holdings Limited | | | 6.875 | % | | | | | | BBB | | | 689,323 | | |
| | 19,080 | | | Endurance Specialty Holdings Limited | | | 7.750 | % | | | | | | BBB– | | | 501,804 | | |
| | 15,000 | | | Endurance Specialty Holdings Limited | | | 7.500 | % | | | | | | BBB– | | | 393,600 | | |
| | 11,456 | | | Maiden Holdings Limited | | | 8.250 | % | | | | | | BB | | | 296,710 | | |
| | 11,200 | | | National General Holding Company | | | 7.500 | % | | | | | | N/R | | | 284,256 | | |
| | 17,245 | | | Principal Financial Group | | | 6.518 | % | | | | | | BBB | | | 443,197 | | |
| | | Total Insurance | | | 4,930,480 | | |
| | | Marine – 0.3% | |
| | 10,200 | | | Costamare Inc. | | | 8.500 | % | | | | | | N/R | | | 261,732 | | |
| | 3,950 | | | Navios Maritime Holdings Inc. | | | 8.750 | % | | | | | | N/R | | | 75,011 | | |
| | 7,225 | | | Navios Maritime Holdings Inc. | | | 8.625 | % | | | | | | N/R | | | 133,301 | | |
| | 8,900 | | | Seaspan Corporation | | | 8.250 | % | | | | | | N/R | | | 226,238 | | |
| | | Total Marine | | | 696,282 | | |
| | | Oil, Gas & Consumable Fuels – 0.3% | |
| | 13,437 | | | Teekay Offshore Partners L.P. | | | 7.250 | % | | | | | | N/R | | | 310,395 | | |
| | 7,565 | | | Tsakos Energy Navigation Limited | | | 8.875 | % | | | | | | N/R | | | 192,529 | | |
| | | Total Oil, Gas & Consumable Fuels | | | 502,924 | | |
| | | Thrifts & Mortgage Finance – 0.5% | |
| | 7,331 | | | Astoria Financial Corporation | | | 6.500 | % | | | | | | Ba2 | | | 181,589 | | |
| | 30,170 | | | Federal Agricultural Mortgage Corporation | | | 6.875 | % | | | | | | N/R | | | 781,702 | | |
| | | Total Thrifts & Mortgage Finance | | | 963,291 | | |
| | | Total $25 Par (or similar) Retail Preferred (cost $15,150,381) | | | | | | | | | | | | | | | 16,014,060 | | |
Principal
Amount (000) | | Description (1) | | Coupon (10) | | Maturity (9) | | Ratings (7) | | Value | |
| | | VARIABLE RATE SENIOR LOAN INTERESTS – 24.3% (17.0% of Total Investments) (10) | |
| | | Aerospace & Defense – 0.5% | |
$ | 650 | | | B/E Aerospace, Inc., Term Loan B, First Lien | | | 4.000 | % | | 12/16/21 | | BB+ | | $ | 650,000 | | |
| | 403 | | | Hamilton Sundstrand, Term Loan, First Lien | | | 4.000 | % | | 12/13/19 | | B+ | | | 375,003 | | |
| | 1,053 | | | Total Aerospace & Defense | | | | | | | | | | | | | | | 1,025,003 | | |
| | | Airlines – 0.2% | |
| | 490 | | | Delta Air Lines, Inc., Term Loan B1 | | | 3.250 | % | | 10/18/18 | | BBB– | | | 483,110 | | |
| | | Automobiles – 1.0% | |
| | 990 | | | Chrysler Group LLC, Term Loan B | | | 3.500 | % | | 5/24/17 | | BB+ | | | 988,506 | | |
| | 1,114 | | | Formula One Group, Term Loan, First Lien | | | 4.750 | % | | 7/30/21 | | B | | | 1,089,624 | | |
| | 2,104 | | | Total Automobiles | | | | | | | | | | | | | | | 2,078,130 | | |
| | | Building Products – 0.2% | |
| | 399 | | | Gates Global LLC, Term Loan | | | 4.250 | % | | 7/03/21 | | B+ | | | 389,096 | | |
| | | Capital Markets – 0.2% | |
| | 494 | | | Guggenheim Partners LLC, Initial Term Loan | | | 4.250 | % | | 7/22/20 | | N/R | | | 490,355 | | |
Nuveen Investments
24
Principal
Amount (000) | | Description (1) | | Coupon (10) | | Maturity (9) | | Ratings (7) | | Value | |
| | | Chemicals – 1.2% | |
$ | 471 | | | Mineral Technologies, Inc., Term Loan B, First Lien | | | 4.000 | % | | 5/07/21 | | BB | | $ | 467,048 | | |
| | 960 | | | Univar, Inc., Term Loan | | | 5.000 | % | | 6/30/17 | | B+ | | | 931,406 | | |
| | 942 | | | US Coatings Acquisition, Term Loan B | | | 3.750 | % | | 2/01/20 | | B+ | | | 919,749 | | |
| | 2,373 | | | Total Chemicals | | | | | | | | | | | | | | | 2,318,203 | | |
| | | Commercial Services & Supplies – 0.5% | |
| | 995 | | | Millennium Laboratories, Inc., Tranche B, Term Loan | | | 5.250 | % | | 4/16/21 | | B+ | | | 991,580 | | |
| | | Computers & Peripherals – 0.5% | |
| | 990 | | | Dell, Inc., Term Loan B | | | 4.500 | % | | 4/29/20 | | BBB | | | 988,674 | | |
| | | Containers & Packaging – 0.8% | |
| | 1,567 | | | Reynolds Group Holdings, Inc., Incremental US Term Loan, First Lien | | | 4.000 | % | | 12/01/18 | | B+ | | | 1,541,943 | | |
| | | Diversified Consumer Services – 0.5% | |
| | 658 | | | Hilton Hotels Corporation, Term Loan B2 | | | 3.500 | % | | 10/25/20 | | BB+ | | | 651,151 | | |
| | 419 | | | ServiceMaster Company, Term Loan | | | 4.250 | % | | 7/01/21 | | B+ | | | 411,737 | | |
| | 1,077 | | | Total Diversified Consumer Services | | | | | | | | | | | | | | | 1,062,888 | | |
| | | Diversified Telecommunication Services – 0.9% | |
| | 821 | | | Intelsat Jackson Holdings, S.A., Tranche B2, Term Loan | | | 3.750 | % | | 6/30/19 | | BB– | | | 810,764 | | |
| | 500 | | | Level 3 Financing, Inc., Term Loan B, First Lien | | | 4.500 | % | | 1/31/22 | | BB | | | 501,719 | | |
| | 430 | | | WideOpenWest Finance LLC, Term Loan B | | | 4.750 | % | | 4/01/19 | | Ba3 | | | 428,257 | | |
| | 1,751 | | | Total Diversified Telecommunication Services | | | | | | | | | | | | | | | 1,740,740 | | |
| | | Energy Equipment & Services – 0.1% | |
| | 152 | | | Drill Rigs Holdings, Inc., Tranche B1, Term Loan | | | 6.000 | % | | 3/31/21 | | B+ | | | 121,359 | | |
| | | Food & Staples Retailing – 0.5% | |
| | 1,000 | | | Albertson's LLC, Term Loan B4 | | | 5.500 | % | | 8/25/21 | | BB– | | | 1,001,875 | | |
| | | Food Products – 1.6% | |
| | 1,197 | | | H.J. Heinz Company, Term Loan B2 | | | 3.500 | % | | 6/05/20 | | BB | | | 1,192,212 | | |
| | 1,000 | | | Jacobs Douwe Egberts, Term Loan B | | | 3.500 | % | | 7/23/21 | | BB | | | 977,500 | | |
| | 959 | | | US Foods, Inc., Incremental Term Loan | | | 4.500 | % | | 3/31/19 | | B2 | | | 954,601 | | |
| | 3,156 | | | Total Food Products | | | | | | | | | | | | | | | 3,124,313 | | |
| | | Health Care Equipment & Supplies – 0.7% | |
| | 1,455 | | | Kinetic Concepts, Inc., Term Loan D1 | | | 4.000 | % | | 5/04/18 | | BB– | | | 1,442,128 | | |
| | | Health Care Providers & Services – 1.5% | |
| | 245 | | | Community Health Systems, Inc., Term Loan D | | | 4.250 | % | | 1/27/21 | | BB | | | 244,843 | | |
| | 827 | | | DaVita HealthCare Partners, Inc., Tranche B, Term Loan | | | 3.500 | % | | 6/24/21 | | Ba1 | | | 820,506 | | |
| | 840 | | | Drumm Investors LLC, Term Loan | | | 6.750 | % | | 5/04/18 | | B | | | 843,871 | | |
| | 987 | | | HCA, Inc., Tranche B4, Term Loan | | | 3.005 | % | | 5/01/18 | | BB | | | 981,174 | | |
| | 75 | | | HCA, Inc., Tranche B5, Term Loan | | | 2.919 | % | | 3/31/17 | | BB | | | 74,538 | | |
| | 2,974 | | | Total Health Care Providers & Services | | | | | | | | | | | | | | | 2,964,932 | | |
| | | Hotels, Restaurants & Leisure – 1.6% | |
| | 1,056 | | | Burger King Corporation, Term Loan B, First Lien | | | 4.500 | % | | 10/27/21 | | B+ | | | 1,056,026 | | |
| | 981 | | | MGM Resorts International, Term Loan B | | | 3.500 | % | | 12/20/19 | | BB | | | 959,764 | | |
| | 1,164 | | | Seaworld Parks and Entertainment, Inc., Term Loan B2 | | | 3.000 | % | | 5/14/20 | | BB | | | 1,105,693 | | |
| | 3,201 | | | Total Hotels, Restaurants & Leisure | | | | | | | | | | | | | | | 3,121,483 | | |
| | | Household Durables – 0.3% | |
| | 649 | | | Tempur-Pedic International, Inc., New Term Loan B | | | 3.500 | % | | 3/18/20 | | BB | | | 640,448 | | |
Nuveen Investments
25
JTA Nuveen Tax-Advantaged Total Return Strategy Fund
Portfolio of Investments (continued) December 31, 2014
Principal
Amount (000) | | Description (1) | | Coupon (10) | | Maturity (9) | | Ratings (7) | | Value | |
| | | Household Products – 0.2% | |
$ | 299 | | | Spectrum Brands, Inc., Term Loan A | | | 3.000 | % | | 9/04/17 | | BB | | $ | 297,691 | | |
| | | Independent Power Producers & Energy Traders – 0.5% | |
| | 990 | | | Calpine Corporation, Delayed Term Loan | | | 4.000 | % | | 10/31/20 | | BB | | | 978,398 | | |
| | | Internet & Catalog Retail – 0.3% | |
| | 500 | | | Travelport LLC, Term Loan B, First Lien | | | 6.000 | % | | 9/02/21 | | B2 | | | 500,125 | | |
| | | Internet Software & Services – 0.4% | |
| | 833 | | | Tibco Software, Inc., Term Loan B | | | 6.500 | % | | 11/25/20 | | B1 | | | 808,333 | | |
| | | IT Services – 0.4% | |
| | 871 | | | Vantiv, Inc., Term Loan B | | | 3.750 | % | | 6/13/21 | | BB+ | | | 864,770 | | |
| | | Leisure Equipment & Products – 0.5% | |
| | 995 | | | 24 Hour Fitness Worldwide, Inc., Term Loan B | | | 4.750 | % | | 5/28/21 | | Ba3 | | | 960,797 | | |
| | | Machinery – 0.5% | |
| | 612 | | | Doosan Infracore International, Inc., Term Loan | | | 4.500 | % | | 5/27/21 | | BB– | | | 608,991 | | |
| | 494 | | | Rexnord LLC, Term Loan B | | | 4.000 | % | | 8/21/20 | | BB– | | | 484,245 | | |
| | 1,106 | | | Total Machinery | | | | | | | | | | | | | | | 1,093,236 | | |
| | | Media – 3.7% | |
| | 492 | | | Charter Communications Operating Holdings LLC, Term Loan E | | | 3.000 | % | | 7/01/20 | | Baa3 | | | 483,530 | | |
| | 92 | | | Clear Channel Communications, Inc., Term Loan E | | | 7.669 | % | | 7/30/19 | | CCC+ | | | 88,541 | | |
| | 49 | | | Clear Channel Communications, Inc., Tranche B, Term Loan | | | 3.819 | % | | 1/29/16 | | CCC+ | | | 48,944 | | |
| | 747 | | | Clear Channel Communications, Inc., Tranche D, Term Loan | | | 6.919 | % | | 1/30/19 | | CCC+ | | | 705,932 | | |
| | 940 | | | Cumulus Media, Inc., Term Loan B | | | 4.250 | % | | 12/23/20 | | B+ | | | 911,392 | | |
| | 497 | | | Interactive Data Corporation, Term Loan B | | | 4.750 | % | | 5/02/21 | | B+ | | | 495,137 | | |
| | 453 | | | Media General, Inc., Delayed Draw, Term Loan | | | 4.250 | % | | 7/31/20 | | BB+ | | | 449,048 | | |
| | 536 | | | Numericable Group S.A., Term Loan B1 | | | 4.500 | % | | 5/21/20 | | Ba3 | | | 536,154 | | |
| | 464 | | | Numericable Group S.A., Term Loan B2 | | | 4.500 | % | | 5/21/20 | | Ba3 | | | 463,846 | | |
| | 404 | | | Springer Science & Business Media, Inc., Term Loan B3 | | | 4.750 | % | | 8/14/20 | | B | | | 398,786 | | |
| | 1,239 | | | Tribune Company, Term Loan B | | | 4.000 | % | | 12/27/20 | | BB+ | | | 1,222,713 | | |
| | 1,536 | | | Univision Communications, Inc., Replacement Term Loan, First Lien | | | 4.000 | % | | 3/01/20 | | B+ | | | 1,505,581 | | |
| | 7,449 | | | Total Media | | | | | | | | | | | | | | | 7,309,604 | | |
| | | Multiline Retail – 0.1% | |
| | 244 | | | Hudson's Bay Company, Term Loan B, First Lien | | | 4.750 | % | | 11/04/20 | | BB | | | 244,238 | | |
| | | Oil, Gas & Consumable Fuels – 0.5% | |
| | 500 | | | Energy Transfer Equity L.P., Term Loan, First Lien | | | 3.250 | % | | 12/02/19 | | BB | | | 486,250 | | |
| | 368 | | | Fieldwood, Energy LLC, Term Loan, Second Lien | | | 8.375 | % | | 9/30/20 | | B2 | | | 270,780 | | |
| | 121 | | | Southcross Energy Partners L.P., Opco Term Loan | | | 5.250 | % | | 8/04/21 | | B1 | | | 114,668 | | |
| | 182 | | | Southcross Holdings Borrower L.P., Holdco Term Loan | | | 6.000 | % | | 8/04/21 | | B2 | | | 162,901 | | |
| | 1,171 | | | Total Oil, Gas & Consumable Fuels | | | | | | | | | | | | | | | 1,034,599 | | |
| | | Pharmaceuticals – 1.3% | |
| | 992 | | | Grifols, Inc., Term Loan | | | 3.169 | % | | 2/27/21 | | Ba1 | | | 980,590 | | |
| | 725 | | | Quintiles Transnational Corp., Term Loan B3 | | | 3.750 | % | | 6/08/18 | | BB+ | | | 717,325 | | |
| | 994 | | | Valeant Pharmaceuticals International, Inc., Term Loan E | | | 3.500 | % | | 8/05/20 | | Ba1 | | | 986,995 | | |
| | 2,711 | | | Total Pharmaceuticals | | | | | | | | | | | | | | | 2,684,910 | | |
| | | Professional Services – 0.1% | |
| | 181 | | | Nielsen Finance LLC, Dollar Term Loan B2 | | | 3.158 | % | | 4/15/21 | | BBB– | | | 181,360 | | |
| | | Semiconductors & Semiconductor Equipment – 0.9% | |
| | 995 | | | Avago Technologies, Term Loan B | | | 3.750 | % | | 5/06/21 | | BBB– | | | 992,513 | | |
| | 730 | | | NXP Semiconductor LLC, Term Loan D | | | 3.250 | % | | 1/11/20 | | BBB– | | | 721,371 | | |
| | 1,725 | | | Total Semiconductors & Semiconductor Equipment | | | | | | | | | | | | | | | 1,713,884 | | |
Nuveen Investments
26
Principal
Amount (000) | | Description (1) | | Coupon (10) | | Maturity (9) | | Ratings (7) | | Value | |
| | | Software – 1.7% | |
$ | 424 | | | Activision Blizzard, Inc., Term Loan B | | | 3.250 | % | | 10/12/20 | | BBB | | $ | 423,537 | | |
| | 479 | | | BMC Software, Inc., Initial Term Loan | | | 5.000 | % | | 9/10/20 | | B1 | | | 465,519 | | |
| | 800 | | | Datatel Parent Corp, Term Loan B1 | | | 4.000 | % | | 7/19/18 | | BB– | | | 790,690 | | |
| | 963 | | | Emdeon Business Services LLC, Term Loan B2 | | | 3.750 | % | | 11/02/18 | | Ba3 | | | 948,358 | | |
| | 763 | | | Infor Global Solutions Intermediate Holdings, Ltd., Term Loan B5 | | | 3.750 | % | | 6/03/20 | | Ba3 | | | 741,340 | | |
| | 3,429 | | | Total Software | | | | | | | | | | | | | | | 3,369,444 | | |
| | | Specialty Retail – 0.4% | |
| | 599 | | | Burlington Coat Factory Warehouse Corporation, Term Loan B3 | | | 4.250 | % | | 8/13/21 | | B+ | | | 593,263 | | |
| | 207 | | | Gardner Denver, Inc., Term Loan | | | 4.250 | % | | 7/30/20 | | B1 | | | 195,040 | | |
| | 806 | | | Total Specialty Retail | | | | | | | | | | | | | | | 788,303 | | |
$ | 49,190 | | | Total Variable Rate Senior Loan Interests (cost $48,837,929) | | | | | | | | | | | | | | | 48,355,952 | | |
Principal
Amount (000) | | Description (1) | | Coupon | | Maturity | | Ratings (7) | | Value | |
| | | CORPORATE BONDS – 0.7% (0.5% of Total Investments) | |
| | | Banks – 0.6% | |
$ | 475 | | | Bank of America Corporation | | | 6.250 | % | | 3/05/65 | | BB | | $ | 469,508 | | |
| | 150 | | | JPMorgan Chase & Co. | | | 6.750 | % | | 12/31/49 | | BBB– | | | 158,250 | | |
| | 525 | | | M&T Bank Corporation | | | 6.450 | % | | 12/31/49 | | BBB– | | | 557,156 | | |
| | 1,150 | | | Total Banks | | | | | | | | | | | | | | | 1,184,914 | | |
| | | Media – 0.1% | |
| | 133 | | | Clear Channel Communications, Inc., 144A | | | 9.000 | % | | 12/15/19 | | CCC+ | | | 131,005 | | |
$ | 1,283 | | | Total Corporate Bonds (cost $1,274,281) | | | | | | | | | | | | | | | 1,315,919 | | |
Principal
Amount (000)/
Shares | | Description (1) | | Coupon | | Maturity | | Ratings (7) | | Value | |
| | | $1,000 PAR (OR SIMILAR) INSTITUTIONAL PREFERRED – 2.1% (1.5% of Total Investments) | |
| | | Banks – 1.5% | |
| | 475 | | | Citigroup Inc. | | | 5.800 | % | | | N/A (11) | | | BB+ | | $ | 475,000 | | |
| | 600 | | | General Electric Capital Corporation | | | 7.125 | % | | | N/A (11) | | | A+ | | | 698,250 | | |
| | 500 | | | JPMorgan Chase & Co. | | | 7.900 | % | | | N/A (11) | | | BBB– | | | 538,150 | | |
| | 250 | | | JPMorgan Chase & Co. | | | 6.100 | % | | | N/A (11) | | | BBB– | | | 249,375 | | |
| | 500 | | | PNC Financial Services Inc. | | | 6.750 | % | | | N/A (11) | | | BBB– | | | 548,750 | | |
| | 450 | | | SunTrust Bank Inc. | | | 5.625 | % | | | N/A (11) | | | BB+ | | | 452,250 | | |
| | 25 | | | Zions Bancorporation | | | 7.200 | % | | | N/A (11) | | | BB– | | | 26,275 | | |
| | | Total Banks | | | 2,988,050 | | |
| | | Capital Markets – 0.1% | |
| | 225 | | | Morgan Stanley | | | 5.450 | % | | | N/A (11) | | | BB | | | 225,405 | | |
| | | Consumer Finance – 0.5% | |
| | 450 | | | Ally Financial Inc., 144A | | | 7.000 | % | | | N/A (11) | | | B– | | | 449,817 | | |
| | 450 | | | American Express Company | | | 5.200 | % | | | N/A (11) | | | Baa3 | | | 457,016 | | |
| | | Total Consumer Finance | | | 906,833 | | |
| | | Total $1,000 Par (or similar) Institutional Preferred (cost $3,910,554) | | | | | | | | | | | | | | | 4,120,288 | | |
| | | Total Long-Term Investments (cost $232,424,059) | | | | | | | | | | | | | | | 280,280,106 | | |
Nuveen Investments
27
JTA Nuveen Tax-Advantaged Total Return Strategy Fund
Portfolio of Investments (continued) December 31, 2014
Principal
Amount (000) | | Description (1) | | Coupon | | Maturity | | | | Value | |
| | | SHORT-TERM INVESTMENTS – 2.5% (1.7% of Total Investments) | |
$ | 1,157 | | | Repurchase Agreement with Fixed Income Clearing Corporation, dated 12/31/14,
repurchase price $1,156,918, collateralized by $1,155,000 U.S. Treasury Notes, 0.125%,
due 4/15/18, value $1,180,988 | | | 0.000
| % | | 1/02/15
| | | | | | $ | 1,156,918 | | |
| 3,835 | | | Repurchase Agreement with Fixed Income Clearing Corporation, dated 12/31/14,
repurchase price $3,835,169, collateralized by $3,840,000 U.S. Treasury Notes, 2.125%,
due 6/30/21, value $3,916,800 | | | 0.000
| % | | 1/02/15
| | | | | | | 3,835,169 | | |
$ | 4,992 | | | Total Short-Term Investments (cost $4,992,087) | | | 4,992,087 | | |
| | | Total Investments (cost $237,416,146) – 143.2% | | | 285,272,193 | | |
| | | Borrowings – (44.9)% (12), (13) | | | (89,400,000 | ) | |
| | | Other Assets Less Liabilities – 1.7% (14) | | | 3,382,805 | | |
| | | Net Assets Applicable to Common Shares – 100% | | $ | 199,254,998 | | |
Investments in Derivatives as of December 31, 2014
Options Written outstanding:
Number of
Contracts | | Description | | Notional
Amount (15) | | Expiration
Date | | Strike
Price | | Value (14) | |
| | (455 | ) | | Analog Devices, Inc. | | $ | (2,502,500 | ) | | 1/17/15 | | $ | 55 | | | $ | (58,013 | ) | |
| | (455 | ) | | Total Options Written (premiums received $45,287) | | $ | (2,502,500 | ) | | | | | | | | | | $ | (58,013 | ) | |
Interest Rate Swaps outstanding:
Counterparty | | Notional
Amount | | Fund
Pay/Receive
Floating Rate | | Floating Rate Index | | Fixed Rate
(Annualized) | | Fixed Rate
Payment
Frequency | | Effective
Date (16) | | Termination
Date | | Unrealized
Appreciation
(Depreciation) (14) | |
JPMorgan | | $ | 18,475,000 | | | Receive | | 1-Month USD-LIBOR-BBA | | | 1.462 | % | | Monthly | | 12/01/15 | | 12/01/20 | | $ | 63,035 | | |
JPMorgan | | | 18,475,000 | | | Receive | | 1-Month USD-LIBOR-BBA | | | 1.842 | | | Monthly | | 12/01/15 | | 12/01/22 | | | 37,199 | | |
| | | $ | 36,950,000 | | | | | | | | | | | | | | | $ | 100,234 | | |
Nuveen Investments
28
For Fund portfolio compliance purposes, the Fund's industry classifications refer to any one or more of the industry sub-classifications used by one or more widely recognized market indexes or ratings group indexes, and/or as defined by Fund management. This definition may not apply for purposes of this report, which may combine industry sub-classifications into sectors for reporting ease.
(1) All percentages shown in the Portfolio of Investments are based on net assets applicable to common shares unless otherwise noted.
(2) For fair value measurement disclosure purposes, Common Stock classified as Level 2. See Notes to Financial Statements, Note 2– Investment Valuation and Fair Value Measurements for more information.
(3) Non-income producing; issuer has not declared a dividend within the past twelve months.
(4) Investments valued at fair value using methods determined in good faith by, or at the discretion of, the Board. For fair value measurement disclosure purposes, investment classified as Level 3. See Notes to Financial Statements, Note 2– Investment Valuation and Fair Value Measurements for more information.
(5) Investment, or portion of investment, is out on loan as described in Note 9– Borrowing Arrangements. The total value of investments out on loan as of the end of the reporting period was $72,100.
(6) Investment, or portion of investment, has been pledged to collateralize the net payment obligations for investments in derivatives.
(7) Ratings (not covered by the report of independent registered public accounting firm): Using the highest of Standard & Poor's Group ("Standard & Poor's"), Moody's Investors Service, Inc. ("Moody's") or Fitch, Inc. ("Fitch") rating. Ratings below BBB by Standard & Poor's, Baa by Moody's or BBB by Fitch are considered to be below investment grade. Holdings designated N/R are not rated by any of these national rating agencies.
(8) For fair value measurement disclosure purposes, $25 Par (or similar) Retail Preferred classified as Level 2. See Notes to Financial Statements, Note 2– Investment Valuation and Fair Value Measurements for more information.
(9) Senior loans generally are subject to mandatory and/or optional prepayment. Because of these mandatory prepayment conditions and because there may be significant economic incentives for a Borrower to prepay, prepayments of Senior loans may occur. As a result, the actual remaining maturity of Senior Loans held may be substantially less than the stated maturities shown.
(10) Senior loans generally pay interest at rates which are periodically adjusted by reference to a base short-term, floating lending rate plus an assigned fixed rate. These floating lending rates are generally (i) the lending rate referenced by the London Inter-Bank Offered Rate ("LIBOR"), or (ii) the prime rate offered by one or more major United States banks. Senior loans may be considered restricted in that the Fund ordinarily is contractually obligated to receive approval from the agent bank and/or borrower prior to the disposition of a senior loan. The rate shown is the coupon as of the end of the reporting period.
(11) Perpetual security. Maturity date is not applicable.
(12) Borrowings as a percentage of Total Investments is 31.3%.
(13) The Fund may pledge up to 100% of its eligible investments (excluding any investments separately pledged as collateral for specific investments in derivatives) in the Portfolio of Investments as collateral for Borrowings. As of the end of the reporting period, investments with a value of $185,608,871 have been pledged as collateral for Borrowings.
(14) Other Assets Less Liabilities includes the Value and the Unrealized Appreciation (Depreciation) of derivative instruments as listed within Investments in Derivatives as of the end of the reporting period.
(15) For disclosure purposes, Notional Amount is calculated by multiplying the Number of Contracts by the Strike Price by 100.
(16) Effective date represents the date on which both the Fund and Counterparty commence interest payment accruals on each contract.
N/A Not applicable.
144A Investment is exempt from registration under Rule 144A of the Securities Act of 1933, as amended. These investments may only be resold in transactions exempt from registration, which are normally those transactions with qualified institutional buyers.
ADR American Depositary Receipt.
USD-LIBOR-BBA United States Dollar – London Inter-Bank Offered Rate – British Bankers' Association.
See accompanying notes to financial statements.
Nuveen Investments
29
Statement of
Assets and Liabilities December 31, 2014
Assets | |
Long-term investments, at value (cost $232,424,059) | | $ | 280,280,106 | | |
Short-term investments, at value (cost approximates value) | | | 4,992,087 | | |
Unrealized appreciation on interest rate swaps | | | 100,234 | | |
Receivable for: | |
Dividends | | | 446,768 | | |
Interest | | | 262,490 | | |
Investments sold | | | 5,323,152 | | |
Reclaims | | | 138,567 | | |
Other assets | | | 33,934 | | |
Total assets | | | 291,577,338 | | |
Liabilities | |
Borrowings | | | 89,400,000 | | |
Cash overdraft | | | 1,111,873 | | |
Options written, at value (premiums received $45,287) | | | 58,013 | | |
Payable for investments purchased | | | 1,404,234 | | |
Accrued expenses: | |
Management fees | | | 212,921 | | |
Interest on borrowings | | | 5,008 | | |
Trustees fees | | | 33,048 | | |
Other | | | 97,243 | | |
Total liabilities | | | 92,322,340 | | |
Net assets applicable to common shares | | $ | 199,254,998 | | |
Common shares outstanding | | | 13,843,146 | | |
Net asset value ("NAV") per common share outstanding | | $ | 14.39 | | |
Net assets applicable to common shares consist of: | |
Common shares, $0.01 par value per share | | $ | 138,431 | | |
Paid-in surplus | | | 219,269,269 | | |
Undistributed (Over-distribution of) net investment income | | | 48,865 | | |
Accumulated net realized gain (loss) | | | (68,145,122 | ) | |
Net unrealized appreciation (depreciation) | | | 47,943,555 | | |
Net assets applicable to common shares | | $ | 199,254,998 | | |
Authorized shares: | |
Common | | | Unlimited | | |
Preferred | | | Unlimited | | |
See accompanying notes to financial statements.
Nuveen Investments
30
Statement of
Operations Year Ended December 31, 2014
Investment Income | |
Dividends (net of foreign tax withheld of $214,236) | | $ | 8,110,680 | | |
Interest | | | 2,279,396 | | |
Other income | | | 135,414 | | |
Total investment income | | | 10,525,490 | | |
Expenses | |
Management fees | | | 2,517,228 | | |
Interest expense on borrowings | | | 916,885 | | |
Shareholder servicing agent fees and expenses | | | 667 | | |
Custodian fees and expenses | | | 117,908 | | |
Trustees fees and expenses | | | 9,746 | | |
Professional fees | | | 44,915 | | |
Shareholder reporting expenses | | | 59,805 | | |
Stock exchange listing fees | | | 8,826 | | |
Investor relations expenses | | | 51,699 | | |
Other expenses | | | 15,033 | | |
Total expenses | | | 3,742,712 | | |
Net investment income (loss) | | | 6,782,778 | | |
Realized and Unrealized Gain (Loss) | |
Net realized gain (loss) from: | |
Investments | | | 12,890,421 | | |
Options written | | | 925,328 | | |
Swaps | | | (690,659 | ) | |
Change in net unrealized appreciation (depreciation) of: | |
Investments | | | (9,001,401 | ) | |
Options written | | | (102,575 | ) | |
Swaps | | | (937,796 | ) | |
Net realized and unrealized gain (loss) | | | 3,083,318 | | |
Net increase (decrease) in net assets applicable to common shares from operations | | $ | 9,866,096 | | |
See accompanying notes to financial statements.
Nuveen Investments
31
Statement of
Changes in Net Assets
| | Year
Ended
12/31/14 | | Year
Ended
12/31/13 | |
Operations | |
Net investment income (loss) | | $ | 6,782,778 | | | $ | 4,707,858 | | |
Net realized gain (loss) from: | |
Investments | | | 12,890,421 | | | | 7,511,763 | | |
Options written | | | 925,328 | | | | 1,281,098 | | |
Swaps | | | (690,659 | ) | | | (467,993 | ) | |
Change in net unrealized appreciation (depreciation) of: | |
Investments | | | (9,001,401 | ) | | | 39,943,674 | | |
Options written | | | (102,575 | ) | | | 72,080 | | |
Swaps | | | (937,796 | ) | | | 1,951,888 | | |
Net increase (decrease) in net assets applicable to common shares from operations | | | 9,866,096 | | | | 55,000,368 | | |
Distributions to Common Shareholders | |
From net investment income | | | (14,254,636 | ) | | | (12,096,610 | ) | |
Return of capital | | | — | | | | (770,425 | ) | |
Decrease in net assets applicable to common shares from distributions to common shareholders | | | (14,254,636 | ) | | | (12,867,035 | ) | |
Capital Share Transactions | |
Net proceeds from shares issued to shareholders due to reinvestment of distributions | | | 115,365 | | | | — | | |
Net increase (decrease) in net assets applicable to common shares from capital share transactions | | | 115,365 | | | | — | | |
Net increase (decrease) in net assets applicable to common shares | | | (4,273,175 | ) | | | 42,133,333 | | |
Net assets applicable to common shares at the beginning of period | | | 203,528,173 | | | | 161,394,840 | | |
Net assets applicable to common shares at the end of period | | $ | 199,254,998 | | | $ | 203,528,173 | | |
Undistributed (Over-distribution of) net investment income at the end of period | | $ | 48,865 | | | $ | 24,033 | | |
See accompanying notes to financial statements.
Nuveen Investments
32
Statement of
Cash Flows Year Ended December 31, 2014
Cash Flows from Operating Activities: | |
Net Increase (Decrease) in Net Assets Applicable to Common Shares from Operations | | $ | 9,866,096 | | |
Adjustments to reconcile the net increase (decrease) in net assets applicable to common shares from
operations to net cash provided by (used in) operating activities: | |
Purchases of investments | | | (96,398,242 | ) | |
Proceeds from sales and maturities of investments | | | 102,124,935 | | |
Proceeds from (Payments for) miscellaneous investment transactions | | | (721,012 | ) | |
Proceeds from (Purchases of) short-term investments, net | | | 447,811 | | |
Proceeds from (Payments for) swap contracts, net | | | (690,659 | ) | |
Premiums received for options written | | | 1,043,037 | | |
Cash paid for terminated options written | | | (168,981 | ) | |
Amortization (Accretion) of premiums and discounts, net | | | (66,700 | ) | |
(Increase) Decrease in: | |
Receivable for dividends | | | 10,167 | | |
Receivable for interest | | | (58,796 | ) | |
Receivable for investments sold | | | (2,169,376 | ) | |
Receivable for reclaims | | | (16,711 | ) | |
Other assets | | | (509 | ) | |
Increase (Decrease) in: | |
Payable for investments purchased | | | (1,629,594 | ) | |
Accrued management fees | | | 3,776 | | |
Accrued interest on borrowings | | | 140 | | |
Accrued Trustees fees | | | (60 | ) | |
Accrued other expenses | | | 13,764 | | |
Net realized (gain) loss from: | |
Investments | | | (12,890,421 | ) | |
Options written | | | (925,328 | ) | |
Swaps | | | 690,659 | | |
Change in net unrealized (appreciation) depreciation of: | |
Investments | | | 9,001,401 | | |
Options written | | | 102,575 | | |
Swaps | | | 937,796 | | |
Proceeds from litigation settlement | | | 495,275 | | |
Net cash provided by (used in) operating activities | | | 9,001,043 | | |
Cash Flows from Financing Activities: | |
Increase (Decrease) in cash overdraft | | | 738,228 | | |
Proceeds from borrowings | | | 4,400,000 | | |
Cash distributions paid to common shareholders | | | (14,139,271 | ) | |
Net cash provided by (used in) financing activities | | | (9,001,043 | ) | |
Net Increase (Decrease) in Cash | | | — | | |
Cash at the beginning of period | | | — | | |
Cash at the end of period | | $ | — | | |
Supplemental Disclosures of Cash Flow Information | |
Cash paid for interest on borrowings (excluding borrowing costs) | | $ | 907,746 | | |
Non-cash financing activities not included herein consists of reinvestments of share distributions | | | 115,365 | | |
See accompanying notes to financial statements.
Nuveen Investments
33
Selected data for a common share outstanding throughout each period:
| | | | |
| | | | | Investment Operations | | Less Distributions | | | | | | | |
| | | Beginning
Common
Share
NAV | | Net
Investment
Income
(Loss)(a) | | Net
Realized/
Unrealized
Gain (Loss) | | Total | | From Net
Investment
Income to
Common
Share-
holders | | From
Accum-
ulated
Net
Realized
Gains to
Common
Share-
holders | | Return of
Capital to
Common
Share-
holders | | Total | | Discount
from
Common
Shares
Repur-
chased
and
Retired | | Ending
Common
Share
NAV | | Ending
Market
Value | |
Year Ended 12/31: | |
| | 2014 | | | $ | 14.71 | | | $ | 0.49 | | | $ | 0.22 | | | $ | 0.71 | | | $ | (1.03 | ) | | $ | — | | | $ | — | | | $ | (1.03 | ) | | $ | — | | | $ | 14.39 | | | $ | 13.29 | | |
| | 2013 | | | | 11.67 | | | | 0.34 | | | | 3.63 | | | | 3.97 | | | | (0.87 | ) | | | — | | | | (0.06 | ) | | | (0.93 | ) | | | — | | | | 14.71 | | | | 14.10 | | |
| | 2012 | | | | 10.97 | | | | 0.37 | | | | 1.21 | | | | 1.58 | | | | (0.48 | ) | | | — | | | | (0.40 | ) | | | (0.88 | ) | | | — | * | | | 11.67 | | | | 10.51 | | |
| | 2011 | | | | 12.34 | | | | 0.36 | | | | (0.83 | ) | | | (0.47 | ) | | | (0.40 | ) | | | — | | | | (0.50 | ) | | | (0.90 | ) | | | — | * | | | 10.97 | | | | 9.56 | | |
| | 2010 | | | | 11.63 | | | | 0.27 | | | | 1.38 | | | | 1.65 | | | | (0.94 | ) | | | — | | | | — | | | | (0.94 | ) | | | — | | | | 12.34 | | | | 11.24 | | |
| | | Borrowings at the End of Period | |
| | | Aggregate
Amount
Outstanding
(000) | | Asset
Coverage
Per $1,000 | |
Year Ended 12/31: | |
| | 2014 | | | $ | 89,400 | | | $ | 3,229 | | |
| | 2013 | | | | 85,000 | | | | 3,394 | | |
| | 2012 | | | | 67,900 | | | | 3,377 | | |
| | 2011 | | | | 67,900 | | | | 3,237 | | |
| | 2010 | | | | 52,600 | | | | 4,255 | | |
Nuveen Investments
34
| | | | | Ratios/Supplemental Data | |
| | | Total Returns | | | | Ratios to Average Net Assets
Applicable to Common Shares
Before Reimbursement(c) | | Ratios to Average Net Assets
Applicable to Common Shares
After Reimbursement(c)(d) | | | |
| | | Based
on
Common
Share
NAV(b) | | Based
on
Market
Value(b) | | Ending
Net
Assets
Applicable
to Common
Shares (000) | | Expenses | | Net
Investment
Income (Loss) | | Expenses | | Net
Investment
Income (Loss) | | Portfolio
Turnover
Rate(e) | |
Year Ended 12/31: | |
| | 2014 | | | | 4.91 | % | | | 1.44 | % | | $ | 199,255 | | | | 1.85 | % | | | 3.35 | % | | | N/A | | | | N/A | | | | 34 | % | |
| | 2013 | | | | 34.97 | | | | 44.22 | | | | 203,528 | | | | 1.87 | | | | 2.55 | | | | N/A | | | | N/A | | | | 39 | | |
| | 2012 | | | | 14.54 | | | | 19.31 | | | | 161,395 | | | | 2.00 | | | | 3.11 | | | | 1.99 | % | | | 3.12 | % | | | 37 | | |
| | 2011 | | | | (3.87 | ) | | | (7.48 | ) | | | 151,890 | | | | 1.85 | | | | 2.96 | | | | 1.73 | | | | 3.08 | | | | 56 | | |
| | 2010 | | | | 14.99 | | | | 14.73 | | | | 171,220 | | | | 1.77 | | | | 2.14 | | | | 1.55 | | | | 2.36 | | | | 48 | | |
(a) Per share Net Investment Income (Loss) is calculated using the average daily shares method.
(b) Total Return Based on Market Value is the combination of changes in the market price per share and the effect of reinvested dividend income and reinvested capital gains distributions, if any, at the average price paid per share at the time of reinvestment. The last dividend declared in the period, which is typically paid on the first business day of the following month, is assumed to be reinvested at the ending market price. The actual reinvestment for the last dividend declared in the period takes place over several days, and in some instances may not be based on the market price, so the actual reinvestment price may be different from the price used in the calculation. Total returns are not annualized.
Total Return Based on Common Share NAV is the combination of changes in common share NAV, reinvested dividend income at NAV and reinvested capital gains distributions at NAV, if any. The last dividend declared in the period, which is typically paid on the first business day of the following month, is assumed to be reinvested at the ending NAV. The actual reinvest price for the last dividend declared in the period may often be based on the Fund's market price (and not its NAV), and therefore may be different from the price used in the calculation. Total returns are not annualized.
(c) • Net Investment Income (Loss) ratios reflect income earned and expenses incurred on assets attributable to borrowings, where applicable, as described in Note 9 – Borrowing Arrangements.
• Each ratio includes the effect of all interest expense paid and other costs related to borrowings, where applicable, as follows:
| | | Ratios of Borrowings Interest Expense
to Average Net Assets Applicable
to Common Shares | |
Year Ended 12/31: | | | |
| 2014 | | | 0.45 | % | |
| 2013 | | | 0.49 | | |
| 2012 | | | 0.58 | | |
| 2011 | | | 0.48 | | |
| 2010 | | | 0.45 | | |
(d) After expense reimbursement from the Adviser, where applicable. As of January 31, 2012, the Adviser is no longer reimbursing the Fund for any fees or expenses.
(e) Portfolio Turnover Rate is calculated based on the lesser of long-term purchases or sales (as disclosed in Note 5–Investment Transactions) divided by the average long-term market value during the period.
* Rounds to less than $0.01 per share.
N/A Fund no longer has a contractual reimbursement agreement with the Adviser.
See accompanying notes to financial statements.
Nuveen Investments
35
Notes to
Financial Statements
1. General Information and Significant Accounting Policies
General Information
Fund Information
Nuveen Tax-Advantaged Total Return Strategy Fund (the "Fund") is registered under the Investment Company Act of 1940, as amended, as a diversified closed-end registered investment company. The Fund's common shares are listed on the New York Stock Exchange ("NYSE") and trade under the ticker symbol "JTA." The Fund was organized as a Massachusetts business trust on October 1, 2003.
Investment Adviser
The Fund's investment adviser is Nuveen Fund Advisors, LLC (the "Adviser"), a wholly-owned subsidiary of Nuveen Investments, Inc. ("Nuveen"). The Adviser is responsible for the Fund's overall investment strategy and asset allocation decisions. The Adviser has entered into sub-advisory agreements with NWQ Investment Management Company, LLC ("NWQ") and Symphony Asset Management LLC ("Symphony") (each a "Sub-Adviser" and collectively, the "Sub-Advisers"), each an affiliate of Nuveen. NWQ manages the portion of the Fund's investment portfolio allocated to dividend-paying common and preferred stocks, including American Depositary Receipts ("ADRs") and the Fund's options strategy. Symphony manages the portion of the Fund's investment portfolio allocated to senior loans and other debt instruments. The Adviser is responsible for managing the Fund's investments in swap contracts.
Change in Control
On October 1, 2014, TIAA-CREF, a national financial services organization, completed its previously announced acquisition of Nuveen, the parent company of the Adviser.
Because the consummation of the acquisition resulted in the "assignment" (as defined in the Investment Company Act of 1940) and automatic termination of the Fund's investment management agreement and investment sub-advisory agreement, Fund shareholders were asked to approve a new investment management agreement with the Adviser and a new investment sub-advisory agreement with the Fund's Sub-Advisers. These new agreements were approved by shareholders of the Fund, and went into effect during the current fiscal period.
Investment Objectives and Principal Investment Strategies
The Fund's investment objective is to achieve a high level of after-tax total return consisting primarily of tax-advantaged dividend income and capital appreciation by investing primarily in a portfolio of dividend-paying common stocks that the Fund believes at the time of investment are eligible to pay dividends that may be eligible for favorable federal income taxation at rates applicable to long-term capital gains ("tax-advantaged dividends"). The Fund also invests, to a more limited extent, in preferred securities that are eligible to pay tax-advantaged dividends, as well as in senior loans (both secured and unsecured), domestic corporate bonds, notes and debentures, convertible debt securities and other similar types of corporate instruments, including high-yield debt securities, that are not eligible to pay tax-advantaged dividends.
Significant Accounting Policies
The Fund is an investment company and follows accounting and reporting guidance under Financial Accounting Standards Board (FASB) Accounting Standards Codification (ASC) Topic 946 "Financial Services – Investment Companies." The following is a summary of significant accounting policies followed by the Fund in the preparation of its financial statements in accordance with U.S. generally accepted accounting principles ("U.S. GAAP").
Investment Transactions
Investment transactions are recorded on a trade date basis. Trade date for senior and subordinated loans purchased in the "primary market" is considered the date on which the loan allocations are determined. Trade date for senior and subordinated loans purchased in the "secondary market" is the date on which the transaction is entered into. Realized gains and losses from investment transactions are determined on the specific identification method, which is the same basis used for federal income tax purposes. Investments purchased on a when-issued/delayed delivery basis may have extended settlement periods. Any investments so purchased are subject to market fluctuation during this period. The Fund has instructed the custodian to earmark securities in the Fund's portfolio with a current value at least equal to the amount of the when-issued/delayed delivery purchase commitments.
Nuveen Investments
36
As of December 31, 2014, the Fund's outstanding when-issued/delayed delivery purchase commitments were as follows:
Outstanding when-issued/delayed delivery purchase commitments | | $ | — | | |
Investment Income
Dividend income is recorded on the ex-dividend date or, for foreign securities, when information is available. Interest income, which reflects the amortization of premiums and accretion of discounts for financial reporting purposes, is recorded on an accrual basis. Fee income consists primarily of amendment fees. Amendment fees are earned as compensation for evaluating and accepting changes to an original senior loan agreement and are recognized when received. Fee income and amendment fees are a component of "Interest" on the Statement of Operations, if any. Other income is comprised of fees earned in connection with the rehypothecation of pledged collateral as further described in Note 9 – Borrowing Arrangements.
Professional Fees
Professional fees presented on the Statement of Operations consist of legal fees incurred in the normal course of operations, audit fees, tax consulting fees and, in some cases, workout expenditures. Workout expenditures are incurred in an attempt to protect or enhance an investment or to pursue other claims or legal actions on behalf of Fund shareholders. If a refund is received for workout expenditures paid in a prior reporting period, such amounts will be recognized as "Legal fee refund" on the Statement of Operations.
Dividends and Distributions to Common Shareholders
Distributions to common shareholders are recorded on the ex-dividend date. The amount and timing of distributions are determined in accordance with federal income tax regulations, which may differ from U.S. GAAP.
The Fund makes quarterly cash distributions to common shareholders of a stated dollar amount per share. Subject to approval and oversight by the Fund's Board of Trustees (the "Board"), the Fund seeks to maintain a stable distribution level designed to deliver the long-term return potential of the Fund's investment strategy through regular quarterly distributions (a "Managed Distribution Program"). Total distributions during a calendar year generally will be made from the Fund's net investment income, net realized capital gains and net unrealized capital gains in the Fund's portfolio, if any. The portion of distributions paid attributed to net unrealized gains, if any, is distributed from the Fund's assets and is treated by shareholders as a non-taxable distribution ("Return of Capital") for tax purposes. In the event that total distributions during a calendar year exceed the Fund's total return on net asset value ("NAV"), the difference will reduce NAV per share. If the Fund's total return on NAV exceeds total distributions during a calendar year, the excess will be reflected as an increase in NAV per share. The final determination of the source and character of all distributions for the fiscal year is made after the end of the fiscal year and is reflected in the financial statements contained in the annual report as of December 31 each year.
The actual character of distributions made by the Fund during the fiscal years ended December 31, 2014 and December 31, 2013, is reflected in the accompanying statements.
Indemnifications
Under the Fund's organizational documents, its officers and trustees are indemnified against certain liabilities arising out of the performance of their duties to the Fund. In addition, in the normal course of business, the Fund enters into contracts that provide general indemnifications to other parties. The Fund's maximum exposure under these arrangements is unknown as this would involve future claims that may be made against the Fund that have not yet occurred. However, the Fund has not had prior claims or losses pursuant to these contracts and expects the risk of loss to be remote.
Netting Agreements
In the ordinary course of business, the Fund may enter into transactions subject to enforceable master repurchase agreements, International Swaps and Derivative Association, Inc. ("ISDA") master agreements or other similar arrangements ("netting agreements"). Generally, the right to offset in netting agreements allows the Fund to offset any exposure to a specific counterparty with any collateral received or delivered to that counterparty based on the terms of the agreements. Generally, the Fund manages its cash collateral and securities collateral on a counterparty basis.
The Fund's investments subject to netting agreements as of the end of the reporting period, if any, are further described in Note 3 – Portfolio Securities and Investments in Derivatives.
Use of Estimates
The preparation of financial statements in conformity with U.S. GAAP requires management to make estimates and assumptions that affect the reported amounts of assets and liabilities at the date of the financial statements and the reported amounts of increases and decreases in net assets applicable to common shares from operations during the reporting period. Actual results may differ from those estimates.
Nuveen Investments
37
Notes to Financial Statements (continued)
2. Investment Valuation and Fair Value Measurements
The fair valuation input levels as described below are for fair value measurement purposes.
Investment Valuation
Common stocks and other equity-type securities are valued at the last sales price on the securities exchange on which such securities are primarily traded and are generally classified as Level 1. Securities primarily traded on the NASDAQ National Market ("NASDAQ") are valued at the NASDAQ Official Closing Price and are generally classified as Level 1. However, securities traded on a securities exchange or NASDAQ for which there were no transactions on a given day or securities not listed on a securities exchange or NASDAQ are valued at the quoted bid price and are generally classified as Level 2. Prices of certain ADRs held by the Fund that trade in the United States are valued based on the last traded price, official closing price or the most recent bid price of the underlying non-U.S.-traded stock, adjusted as appropriate for the underlying-to-ADR conversion ratio and foreign exchange rate, and from time-to-time may also be adjusted further to take into account material events that may take place after the close of the local non-U.S. market but before the close of the NYSE, which may represent a transfer from a Level 1 to a Level 2 security.
Prices of fixed-income securities are provided by a pricing service approved by the Board. The pricing service establishes a security's fair value using methods that may include consideration of the following: yields or prices of investments of comparable quality, type of issue, coupon, maturity and rating, market quotes or indications of value from security dealers, evaluations of anticipated cash flows or collateral, general market conditions and other information and analysis, including the obligor's credit characteristics considered relevant. These securities are generally classified as Level 2. In pricing certain securities, particularly less liquid and lower quality securities, the pricing service may consider information about a security, its issuer or market activity provided by the Adviser. These securities are generally classified as Level 2 or Level 3 depending on the priority of the significant inputs.
Like most fixed-income securities, the senior and subordinated loans in which the Fund invests are not listed on an organized exchange. The secondary market of such investments may be less liquid relative to markets for other fixed-income securities. Consequently, the value of senior and subordinated loans, determined as described above, may differ significantly from the value that would have been determined had there been an active market for that senior loan. These securities are generally classified as Level 2.
Prices of swap contracts are also provided by a pricing service approved by the Board using the same methods as described above and are generally classified as Level 2.
The value of exchange-traded options are based on the mean of the closing bid and ask prices. Exchange-traded options are generally classified as Level 1. Options traded in the over-the-counter market are valued using an evaluated mean price and are generally classified as Level 2.
Repurchase agreements are valued at contract amount plus accrued interest, which approximates market value. These securities are generally classified as Level 2.
Certain securities may not be able to be priced by the pre-established pricing methods as described above. Such securities may be valued by the Board and/or its appointee at fair value. These securities generally include, but are not limited to, restricted securities (securities which may not be publicly sold without registration under the Securities Act of 1933, as amended) for which a pricing service is unable to provide a market price; securities whose trading has been formally suspended; debt securities that have gone into default and for which there is no current market quotation; a security whose market price is not available from a pre-established pricing source; a security with respect to which an event has occurred that is likely to materially affect the value of the security after the market has closed but before the calculation of the Fund's NAV (as may be the case in non-U.S. markets on which the security is primarily traded) or make it difficult or impossible to obtain a reliable market quotation; and a security whose price, as provided by the pricing service, is not deemed to reflect the security's fair value. As a general principle, the fair value of a security would appear to be the amount that the owner might reasonably expect to receive for it in a current sale. A variety of factors may be considered in determining the fair value of such securities, which may include consideration of the following: yields or prices of investments of comparable quality, type of issue, coupon, maturity and rating, market quotes or indications of value from security dealers, evaluations of anticipated cash flows or collateral, general market conditions and other information and analysis, including the obligor's credit characteristics considered relevant. These securities are generally classified as Level 2 or Level 3 depending on the priority of the significant inputs. Regardless of the method employed to value a particular security, all valuations are subject to review by the Board and/or its appointee.
Fair Value Measurements
Fair value is defined as the price that would be received upon selling an investment or transferring a liability in an orderly transaction to an independent buyer in the principal or most advantageous market for the investment. A three-tier hierarchy is used to maximize the use of observable market data and minimize the use of unobservable inputs and to establish classification of fair value measurements for disclosure purposes. Observable inputs reflect the assumptions market participants would use in pricing the asset or liability. Observable inputs are based on market data obtained from sources independent of the reporting entity. Unobservable inputs reflect the reporting entity's own assumptions about the assumptions market participants would
Nuveen Investments
38
use in pricing the asset or liability. Unobservable inputs are based on the best information available in the circumstances. The following is a summary of the three-tiered hierarchy of valuation input levels.
Level 1 – Inputs are unadjusted and prices are determined using quoted prices in active markets for identical securities.
Level 2 – Prices are determined using other significant observable inputs (including quoted prices for similar securities, interest rates, prepayment speeds, credit risk, etc.).
Level 3 – Prices are determined using significant unobservable inputs (including management's assumptions in determining the fair value of investments).
The inputs or methodologies used for valuing securities are not an indication of the risks associated with investing in those securities. The following is a summary of the Fund's fair value measurements as of the end of the reporting period:
| | | Level 1 | | Level 2 | | Level 3 | | Total | |
Long-Term Investments*: | |
Common Stocks | | $ | 188,243,614 | | | $ | 20,397,273 | ** | | $ | — | *** | | $ | 208,640,887 | | |
Convertible Preferred Securities | | | 1,833,000 | | | | — | | | | — | | | | 1,833,000 | | |
$25 Par (or similar) Retail Preferred | | | 13,465,356 | | | | 2,548,704 | ** | | | — | | | | 16,014,060 | | |
Variable Rate Senior Loan Interests | | | — | | | | 48,355,952 | | | | — | | | | 48,355,952 | | |
Corporate Bonds | | | — | | | | 1,315,919 | | | | — | | | | 1,315,919 | | |
$1,000 Par (or similar) Institutional Preferred | | | — | | | | 4,120,288 | | | | — | | | | 4,120,288 | | |
Short-Term Investments: | |
Repurchase Agreements | | | — | | | | 4,992,087 | | | | — | | | | 4,992,087 | | |
Investments in Derivatives: | |
Options Written | | | (58,013 | ) | | | — | | | | — | | | | (58,013 | ) | |
Interest Rate Swaps**** | | | — | | | | 100,234 | | | | — | | | | 100,234 | | |
Total | | $ | 203,483,957 | | | $ | 81,830,457 | | | $ | — | *** | | $ | 285,314,414 | | |
* Refer to the Fund's Portfolio of Investments for industry classifications.
** Refer to the Fund's Portfolio of Investments for breakdown of these securities classified as Level 2.
*** Refer to the Fund's Portfolio of Investments for breakdown of these securities classified as Level 3. Value equals zero as of the end of the reporting period.
**** Represents net unrealized appreciation (depreciation) as reported in the Fund's Portfolio of Investments.
The Board is responsible for the valuation process and has appointed the oversight of the daily valuation process to the Adviser's Valuation Committee. The Valuation Committee, pursuant to the valuation policies and procedures adopted by the Board, is responsible for making fair value determinations, evaluating the effectiveness of the Fund's pricing policies and reporting to the Board. The Valuation Committee is aided in its efforts by the Adviser's dedicated Securities Valuation Team, which is responsible for administering the daily valuation process and applying fair value methodologies as approved by the Valuation Committee. When determining the reliability of independent pricing services for investments owned by the Fund, the Valuation Committee, among other things, conducts due diligence reviews of the pricing services and monitors the quality of security prices received through various testing reports conducted by the Securities Valuation Team.
The Valuation Committee will consider pricing methodologies it deems relevant and appropriate when making a fair value determination, based on the facts and circumstances specific to the portfolio instrument. Fair value determinations generally will be derived as follows, using public or private market information:
(i) If available, fair value determinations shall be derived by extrapolating from recent transactions or quoted prices for identical or comparable securities.
(ii) If such information is not available, an analytical valuation methodology may be used based on other available information including, but not limited to: analyst appraisals, research reports, corporate action information, issuer financial statements and shelf registration statements. Such analytical valuation methodologies may include, but are not limited to: multiple of earnings, discount from market value of a similar freely-traded security, discounted cash flow analysis, book value or a multiple thereof, risk premium/yield analysis, yield to maturity and/or fundamental investment analysis.
The purchase price of a portfolio instrument will be used to fair value the instrument only if no other valuation methodology is available or deemed appropriate, and it is determined that the purchase price fairly reflects the instrument's current value.
For each portfolio security that has been fair valued pursuant to the policies adopted by the Board, the fair value price is compared against the last available and next available market quotations. The Valuation Committee reviews the results of such testing and fair valuation occurrences are reported to the Board.
Nuveen Investments
39
Notes to Financial Statements (continued)
3. Portfolio Securities and Investments in Derivatives
Portfolio Securities
Repurchase Agreements
In connection with transactions in repurchase agreements, it is the Fund's policy that its custodian take possession of the underlying collateral securities, the fair value of which exceeds the principal amount of the repurchase transaction, including accrued interest, at all times. If the counterparty defaults, and the fair value of the collateral declines, realization of the collateral may be delayed or limited.
The following table presents the repurchase agreements for the Fund that are subject to netting agreements as of the end of the reporting period, and the collateral delivered related to those repurchase agreements.
Counterparty | | Short-Term
Investments, at Value | | Collateral
Pledged (From)
Counterparty* | | Net
Exposure | |
Fixed Income Clearing Corporation | | $ | 4,992,087 | | | $ | (4,992,087 | ) | | $ | — | | |
* As of the end of the reporting period, the value of the collateral pledged from the counterparty exceeded the value of the repurchase agreements. Refer to the Fund's Portfolio of Investments for details on the repurchase agreements.
Zero Coupon Securities
A zero coupon security does not pay a regular interest coupon to its holders during the life of the security. Income to the holder of the security comes from accretion of the difference between the original purchase price of the security at issuance and the par value of the security at maturity and is effectively paid at maturity. The market prices of zero coupon securities generally are more volatile than the market prices of securities that pay interest periodically.
Investments in Derivatives
The Fund is authorized to invest in certain derivative instruments, such as futures, options and swap contracts. The Fund limits its investments in futures, options on futures and swap contracts to the extent necessary for the Adviser to claim the exclusion from registration by the Commodity Futures Trading Commission as a commodity pool operator with respect to the Fund. The Fund records derivative instruments at fair value, with changes in fair value recognized on the Statement of Operations, when applicable. Even though the Fund's investments in derivatives may represent economic hedges, they are not considered to be hedge transactions for financial reporting purposes.
Options Transactions
The purchase of options involves the risk of loss of all or a part of the cash paid for the options (the premium). The market risk associated with purchasing options is limited to the premium paid. The counterparty credit risk of purchasing options, however, needs also to take into account the current value of the option, as this is the performance expected from the counterparty. When the Fund purchases an option, an amount equal to the premium paid (the premium plus commission) is recognized as a component of "Options purchased, at value" on the Statement of Assets and Liabilities. When the Fund writes an option, an amount equal to the net premium received (the premium less commission) is recognized as a component of "Options written, at value" on the Statement of Assets and Liabilities and is subsequently adjusted to reflect the current value of the written option until the option is exercised or expires or the Fund enters into a closing purchase transaction. The changes in the value of options purchased during the fiscal period are recognized as a component of "Change in net unrealized appreciation (depreciation) of options purchased" on the Statement of Operations. The changes in the value of options written during the fiscal period are recognized as a component of "Change in net unrealized appreciation (depreciation) of options written" on the Statement of Operations. When an option is exercised or expires or the Fund enters into a closing purchase transaction, the difference between the net premium received and any amount paid at expiration or on executing a closing purchase transaction, including commission, is recognized as a component of "Net realized gain (loss) from options purchased and/or written" on the Statement of Operations. The Fund, as a writer of an option, has no control over whether the underlying instrument may be sold (called) or purchased (put) and as a result bears the risk of an unfavorable change in the market value of the instrument underlying the written option. There is also the risk the Fund may not be able to enter into a closing transaction because of an illiquid market.
During the current fiscal period, the Fund continued to write call options on individual stocks, while investing in these same stocks, to enhance returns while foregoing some upside potential.
The average notional amount of outstanding options written during the current fiscal period, was as follows:
Average notional amount of outstanding options written* | | $ | (4,440,160 | ) | |
* The average notional amount is calculated based on the outstanding notional at the beginning of the fiscal year and at the end of each fiscal quarter within the current fiscal year.
Nuveen Investments
40
The following table presents the fair value of all options written by the Fund as of the end of the reporting period, the location of these instruments on the Statement of Assets and Liabilities and the primary underlying risk exposure.
| | | | | Location on the Statement of Assets and Liabilities | |
Underlying | | Derivative | | Asset Derivatives | | (Liability) Derivatives | |
Risk Exposure | | Instrument | | Location | | Value | | Location | | Value | |
Equity price | | Options written | | | — | | | $ | — | | | Options written, at value | | $ | (58,013 | ) | |
The following table presents the amount of net realized gain (loss) and change in net unrealized appreciation (depreciation) recognized on options written on the Statement of Operations during the current fiscal period, and the primary underlying risk exposure.
Underlying
Risk Exposure | | Derivative
Instrument | | Net Realized
Gain (Loss) from
Options Written | | Change in Net Unrealized
Appreciation (Depreciation) of
Options Written | |
Equity price | | Options written | | $ | 925,328 | | | $ | (102,575 | ) | |
Swap Contracts
Interest rate swap contracts involve the Fund's agreement with the counterparty to pay or receive a fixed rate payment in exchange for the counterparty receiving or paying a variable rate payment that is intended to approximate the Fund's variable rate payment obligation on any variable rate borrowing. Forward interest rate swap contracts involve the Fund's agreement with a counterparty to pay, in the future, a fixed or variable rate payment in exchange for the counterparty paying the Fund a variable or fixed rate payment, the accruals for which would begin at a specified date in the future (the "effective date"). The amount of the payment obligation is based on the notional amount of the swap contract. Swap contracts do not involve the delivery of securities or other underlying assets or principal. Accordingly, the risk of loss with respect to the swap counterparty on such transactions is limited to the net amount of interest payments that the Fund is to receive. Swap contracts are valued daily. Upon entering into an interest rate swap contract (and beginning on the effective date for a forward interest rate swap contract), the Fund accrues the fixed rate payment expected to be paid or received and the variable rate payment expected to be received or paid on a daily basis, and recognizes the daily change in the fair value of the Fund's contractual rights and obligations under the contracts. The net amount recorded for these transactions for each counterparty is recognized on the Statement of Assets and Liabilities as a component of "Unrealized appreciation or depreciation on interest rate swaps (,net)" with the change during the fiscal period recognized on the Statement of Operations as a component of "Change in net unrealized appreciation (depreciation) of swaps." Income received or paid by the Fund is recognized as a component of "Net realized gain (loss) from swaps" on the Statement of Operations, in addition to the net realized gains or losses recognized upon the termination of a swap contract and are equal to the difference between the Fund's basis in the swap contract and the proceeds from (or cost of) the closing transaction. Payments received or made at the beginning of the measurement period are recognized as a component of "Interest rate swap premiums paid and/or received" on the Statement of Assets and Liabilities, when applicable. For tax purposes, periodic payments are treated as ordinary income or expense.
During the current fiscal period, the Fund continued to utilize interest rate swap contracts to partially fix its interest cost of leverage, which the Fund employs through the use of bank borrowings.
The average notional amount of interest rate swap contracts outstanding during the current fiscal period, was as follows:
Average notional amount of interest rate swap contracts outstanding* | | $ | 50,925,000 | | |
* The average notional amount is calculated based on the outstanding notional at the beginning of the fiscal year and at the end of each fiscal quarter within the current fiscal year.
The following table presents the fair value of all interest swap contracts held by the Fund as of the end of the reporting period, the location of these instruments on the Statement of Assets and Liabilities and the primary underlying risk exposure.
| | | | | Location on the Statement of Assets and Liabilities | |
Underlying | | Derivative | | Asset Derivatives | | (Liability) Derivatives | |
Risk Exposure | | Instrument | | Location | | Value | | Location | | Value | |
Interest rate | | Swaps | | Unrealized appreciation on interest rate swaps | | $ | 100,234 | | | | — | | | $ | — | | |
The following table presents the swap contracts, which are subject to netting agreements, as well as the collateral delivered related to those swap contracts as of the end of the reporting period.
Counterparty | | Gross
Unrealized
Appreciation on
Interest Rate Swaps* | | Gross
Unrealized
(Depreciation) on
Interest Rate Swaps* | | Amounts
Netted on
Statement of
Assets and Liabilities | | Net Unrealized
Appreciation
(Depreciation) on
Interest Rate Swaps | | Collateral
Pledged
to (from)
Counterparty | | Net
Exposure | |
JPMorgan | | $ | 100,234 | | | $ | — | | | $ | — | | | $ | 100,234 | | | $ | (100,234 | ) | | $ | — | | |
* Represents gross unrealized appreciation (depreciation) for the counterparty as reported in the Fund's Portfolio of Investments.
Nuveen Investments
41
Notes to Financial Statements (continued)
The following table presents the amount of net realized gain (loss) and change in net unrealized appreciation (depreciation) recognized on swap contracts on the Statement of Operations during the current fiscal period, as well as the primary underlying risk exposure.
Underlying
Risk Exposure | | Derivative
Instrument | | Net Realized
Gain (Loss) from
Swaps | | Change in Net Unrealized
Appreciation (Depreciation) of
Swaps | |
Interest rate | | Swaps | | $ | (690,659 | ) | | $ | (937,796 | ) | |
Market and Counterparty Credit Risk
In the normal course of business the Fund may invest in financial instruments and enter into financial transactions where risk of potential loss exists due to changes in the market (market risk) or failure of the other party to the transaction to perform (counterparty credit risk). The potential loss could exceed the value of the financial assets recorded on the financial statements. Financial assets, which potentially expose the Fund to counterparty credit risk, consist principally of cash due from counterparties on forward, option and swap transactions, when applicable. The extent of the Fund's exposure to counterparty credit risk in respect to these financial assets approximates its carrying value as recorded on the Statement of Assets and Liabilities.
The Fund helps manage counterparty credit risk by entering into agreements only with counterparties the Adviser believes have the financial resources to honor their obligations and by having the Adviser monitor the financial stability of the counterparties. Additionally, counterparties may be required to pledge collateral daily (based on the daily valuation of the financial asset) on behalf of the Fund with a value approximately equal to the amount of any unrealized gain above a pre-determined threshold. Reciprocally, when the Fund has an unrealized loss, the Fund has instructed the custodian to pledge assets of the Fund as collateral with a value approximately equal to the amount of the unrealized loss above a pre-determined threshold. Collateral pledges are monitored and subsequently adjusted if and when the valuations fluctuate, either up or down, by at least the pre-determined threshold amount.
4. Fund Shares
Common Shares
Transactions in common shares were as follows:
| | | Year Ended
12/31/14 | | Year Ended
12/31/13 | |
Common shares issued to shareholders due to reinvestment of distributions | | | 7,624 | | | | — | | |
5. Investment Transactions
Long-term purchases and sales (including maturities but excluding derivative transactions) during the fiscal year ended December 31, 2014, were as follows:
Purchases | | $ | 96,398,242 | | |
Sales and maturities | | | 102,124,935 | | |
Transactions in options written during the fiscal year ended December 31, 2014, were as follows:
| | | Number of
Contracts | | Premiums
Received | |
Options outstanding, beginning of period | | | 803 | | | $ | 96,559 | | |
Options written | | | 16,275 | | | | 1,043,037 | | |
Options terminated in closing purchase transactions | | | (3,758 | ) | | | (276,214 | ) | |
Options exercised | | | (2,153 | ) | | | (228,283 | ) | |
Options expired | | | (10,712 | ) | | | (589,812 | ) | |
Options outstanding, end of period | | | 455 | | | $ | 45,287 | | |
6. Income Tax Information
The Fund intends to distribute substantially all of its net investment company taxable income to shareholders and to otherwise comply with the requirements of Subchapter M of the Internal Revenue Code applicable to regulated investment companies. In any year when the Fund realizes net capital gains, the Fund may choose to distribute all or a portion of its net capital gains to shareholders, or alternatively, to retain all or a portion of its net capital gains and pay federal corporate income taxes on such retained gains.
For all open tax years and all major taxing jurisdictions, management of the Fund has concluded that there are no significant uncertain tax positions that would require recognition in the financial statements. Open tax years are those that are open for examination by taxing authorities (i.e., generally the last four tax year ends and the interim tax period since then). Furthermore, management of the Fund is also not aware of any tax positions for which it is reasonably possible that the total amounts of unrecognized tax benefits will significantly change in the next twelve months.
Nuveen Investments
42
The following information is presented on an income tax basis. Differences between amounts for financial statement and federal income tax purposes are primarily due to the recognition of premium amortization and timing differences in recognizing certain gains and losses on investment transactions. To the extent that differences arise that are permanent in nature, such amounts are reclassified within the capital accounts as detailed below. Temporary differences do not require reclassification. Temporary and permanent differences do not impact the NAV of the Fund.
As of December 31, 2014, the cost and unrealized appreciation (depreciation) of investments (excluding investments in derivatives), as determined on a federal income tax basis, were as follows:
Cost of investments | | $ | 239,251,123 | | |
Gross unrealized: | |
Appreciation | | $ | 54,436,353 | | |
Depreciation | | | (8,415,283 | ) | |
Net unrealized appreciation (depreciation) of investments | | $ | 46,021,070 | | |
Permanent differences, primarily due to tax basis earnings and profits adjustments, treatment of notional principal contracts, complex securities character adjustments, investments in underlying funds, bond premium amortization adjustments, securities litigation settlements, and investments in preferred securities, resulted in reclassifications among the Fund's components of common share net assets as of December 31, 2014, the Fund's tax year end, as follows:
Paid-in surplus | | $ | (7,781,335 | ) | |
Undistributed (Over-distribution of) net investment income | | | 7,496,690 | | |
Accumulated net realized gain (loss) | | | 284,645 | | |
The tax components of undistributed net ordinary income and net long-term capital gains as of December 31, 2014, the Fund's tax year end, were as follows:
Undistributed net ordinary income | | $ | — | | |
Undistributed net long-term capital gains | | | — | | |
The tax character of distributions paid during the Fund's tax years ended December 31, 2014 and December 31, 2013, was designated for purposes of the dividends paid deduction as follows:
2014 | |
Distributions from net ordinary income1 | | $ | 14,254,636 | | |
Distributions from net long-term capital gains | | | — | | |
Return of capital | | | — | | |
2013 | |
Distributions from net ordinary income1 | | $ | 12,096,610 | | |
Distributions from net long-term capital gains | | | — | | |
Return of capital | | | 770,425 | | |
1 Net ordinary income consists of net taxable income derived from dividends and interest, and current year earnings and profits attributable to realized gains.
As of December 31, 2014, the Fund's tax year end, the Fund had unused capital loss carryforwards available for federal income tax purposes to be applied against future capital gains, if any. If not applied, the carryforwards will expire as shown in the following table. The losses not subject to expiration will be utilized first by the Fund.
Expiration: | |
December 31, 2016 | | $ | 34,103,330 | | |
December 31, 2017 | | | 32,157,951 | | |
Not subject to expiration | | | — | | |
Total | | $ | 66,261,281 | | |
During the tax year ended December 31, 2014, the Fund utilized $13,054,447 of its capital loss carryforwards.
7. Management Fees and Other Transactions with Affiliates
The Fund's management fee compensates the Adviser for overall investment advisory and administrative services and general office facilities. The Sub-Advisers are compensated for their services to the Fund from the management fees paid to the Adviser.
Nuveen Investments
43
Notes to Financial Statements (continued)
The Fund's management fee consists of two components – a fund-level fee, based only on the amount of assets within the Fund, and a complex-level fee, based on the aggregate amount of all eligible fund assets managed by the Adviser. This pricing structure enables Fund shareholders to benefit from growth in the assets within the Fund as well as from growth in the amount of complex-wide assets managed by the Adviser.
The annual fund-level fee, payable monthly, is calculated according to the following schedule:
Average Daily Managed Assets* | | Fund-Level Fee Rate | |
For the first $500 million | | | 0.7000 | % | |
For the next $500 million | | | 0.6750 | | |
For the next $500 million | | | 0.6500 | | |
For the next $500 million | | | 0.6250 | | |
For managed assets over $2 billion | | | 0.6000 | | |
The annual complex-level fee, payable monthly, is calculated according to the following schedule:
Complex-Level Managed Asset Breakpoint Level* | | Effective Rate at Breakpoint Level | |
| $55 billion | | | 0.2000 | % | |
| $56 billion | | | 0.1996 | | |
| $57 billion | | | 0.1989 | | |
| $60 billion | | | 0.1961 | | |
| $63 billion | | | 0.1931 | | |
| $66 billion | | | 0.1900 | | |
| $71 billion | | | 0.1851 | | |
| $76 billion | | | 0.1806 | | |
| $80 billion | | | 0.1773 | | |
| $91 billion | | | 0.1691 | | |
| $125 billion | | | 0.1599 | | |
| $200 billion | | | 0.1505 | | |
| $250 billion | | | 0.1469 | | |
| $300 billion | | | 0.1445 | | |
* For the fund-level and complex-level fees, managed assets include closed-end fund assets managed by the Adviser that are attributable to certain types of leverage. For these purposes, leverage includes the funds' use of preferred stock and borrowings and certain investments in the residual interest certificates (also called inverse floating rate securities) in tender option bond (TOB) trusts, including the portion of assets held by a TOB trust that has been effectively financed by the trust's issuance of floating rate securities, subject to an agreement by the Adviser as to certain funds to limit the amount of such assets for determining managed assets in certain circumstances. The complex-level fee is calculated based upon the aggregate daily managed assets of all Nuveen funds that constitute "eligible assets". Eligible assets do not include assets attributable to investments in other Nuveen funds or assets in excess of $2 billion added to the Nuveen fund complex in connection with the Adviser's assumption of the management of the former First American Funds effective January 1, 2011. As of December 31, 2014, the complex-level fee rate for the Fund was 0.1639%.
The Fund pays no compensation directly to those of its trustees who are affiliated with the Adviser or to its officers, all of whom receive remuneration for their services to the Fund from the Adviser or its affiliates. The Board has adopted a deferred compensation plan for independent trustees that enables trustees to elect to defer receipt of all or a portion of the annual compensation they are entitled to receive from certain Nuveen-advised funds. Under the plan, deferred amounts are treated as though equal dollar amounts had been invested in shares of select Nuveen-advised funds.
8. Senior Loan Commitments
Unfunded Commitments
Pursuant to the terms of certain of the variable rate senior loan agreements, the Fund may have unfunded senior loan commitments. The Fund will maintain with its custodian, cash, liquid securities and/or liquid senior loans having an aggregate value at least equal to the amount of unfunded senior loan commitments. As of December 31, 2014, the Fund had no unfunded senior loan commitments.
Participation Commitments
With respect to the senior loans held in the Fund's portfolio, the Fund may: 1) invest in assignments; 2) act as a participant in primary lending syndicates; or 3) invest in participations. If the Fund purchases a participation of a senior loan interest, the Fund would typically enter into a contractual agreement with the lender or other third party selling the participation, rather than directly with the borrower. As such, the Fund not only assumes the credit risk of the borrower, but also that of the selling participant or other persons interpositioned between the Fund and the borrower. As of December 31, 2014, there were no such outstanding participation commitments.
9. Borrowing Arrangements
Borrowings
The Fund has entered into a $93 million (maximum commitment amount) prime brokerage facility ("Borrowings") with BNP Paribas Prime Brokerage, Inc. ("BNP") as a means of leverage. As of December 31, 2014, the outstanding balance on these Borrowings was $89.4 million. During the fiscal year ended
Nuveen Investments
44
December 31, 2014, the average daily balance outstanding and average annual interest rate on these Borrowings were $88.3 million and 1.01%, respectively.
On June 24, 2014, the Fund increased its maximum commitment amount from $87 million to $93 million. The Fund also incurred a one-time 0.15% amendment fee on the increase to the maximum commitment amount, which was fully expensed during the current fiscal period. All other terms remained unchanged.
In order to maintain these Borrowings, the Fund must meet certain collateral, asset coverage and other requirements. Borrowings outstanding are fully secured by securities held in the Fund's portfolio of investments ("Pledged Collateral"). Interest is charged on these Borrowings at 1-Month LIBOR (London Inter-Bank Offered Rate) plus 0.85% per annum on the amount borrowed and 0.50% per annum on the undrawn balance. Effective December 4, 2014, the Fund is only charged the 0.50% per annum undrawn fee if the undrawn portion of the Borrowings on that day is more than 20% of the maximum commitment amount.
Borrowings outstanding are recognized as "Borrowings" on the Statement of Assets and Liabilities. Interest expense incurred on the borrowed amount and undrawn balance and the one-time amendment fee are recognized as a component of "Interest expense on borrowings" on the Statement of Operations.
Rehypothecation
The Adviser entered into a Rehypothecation Side Letter ("Side Letter") with BNP, allowing BNP to re-register the Pledged Collateral in its own name or in a name other than the Fund's to pledge, repledge, hypothecate, rehyphothecate, sell, lend or otherwise transfer or use the Pledged Collateral (the "Hypothecated Securities") with all rights of ownership as described in the Side Letter. Subject to certain conditions, the total value of the outstanding Hypothecated Securities shall not exceed the lesser of (i) 98% of the outstanding balance on the Borrowings to which the Pledged Collateral relates and (ii) 33 1/3% of the Fund's total assets. The Fund may designate any Pledged Collateral as ineligible for rehypothecation. The Fund may also recall Hypothecated Securities on demand.
The Fund also has the right to apply and set-off an amount equal to one-hundred percent (100%) of the then-current fair market value of such Pledged Collateral against the current Borrowings under the Side Letter in the event that BNP fails to timely return the Pledged Collateral and in certain other circumstances. In such circumstances, however, the Fund may not be able to obtain replacement financing required to purchase replacement securities and, consequently, the Fund's income generating potential may decrease. Even if the Fund is able to obtain replacement financing, it might not be able to purchase replacement securities at favorable prices.
The Fund will receive a fee in connection with the Hypothecated Securities ("Rehypothecation Fees") in addition to any principal, interest, dividends and other distributions paid on the Hypothecated Securities.
As of December 31, 2014, the Fund had Hypothecated Securities totalling $72,100. During the fiscal year ended December 31, 2014 the Fund earned Rehypothecation Fees of $135,414, which is recognized as "Other income" on the Statement of Operations.
10. Subsequent Events
Investment Policy Changes
During January 2015, the Board approved changes to the Fund's investment policies, which are primarily intended to update and clarify the investment parameters used to manage the global equity income portion of the Fund sub-advised by NWQ although some policy changes apply to the Fund as a whole. The clarifications and changes to the Fund's investment policies that apply to the Fund as a whole, and that apply only to the global equity income strategy portion of the Fund are detailed below. The policy changes will be effective January 30, 2015.
The following summarizes the clarifications and changes that apply at the overall Fund level:
• At least 60% of the Fund's managed assets will be invested in tax-advantaged income-producing equity securities, including dividends received deduction preferred securities;
• The Fund has greater flexibility to invest (up to 70% of the Fund's managed assets) in non-U.S. issues of any currency;
• The Fund has greater flexibility to invest (up to 20% of the Fund's managed assets) in securities of issuers of emerging market countries; and
• The Fund has flexibility to use derivatives both for hedging purposes and to enhance risk-adjusted returns, including writing (selling) covered options.
The following summarizes the clarifications and changes that apply only to the global equity income strategy portion of the Fund:
• The global equity income strategy may invest in common stocks, preferred securities, convertible securities, convertible preferred securities, real estate investment trusts (REITs), master limited partnerships (MLPs), and debt; and
• The Fund's policies regarding credit ratings as they apply to the equity securities in the global equity income strategy portion of the Fund have been eliminated.
Nuveen Investments
45
Additional
Fund Information (Unaudited)
Board of Trustees
William Adams IV* | | Jack B. Evans | | William C. Hunter | | David J. Kundert | | John K. Nelson | | William J. Schneider | |
Thomas S. Schreier, Jr.* | | Judith M. Stockdale | | Carole E. Stone | | Virginia L. Stringer | | Terence J. Toth | | | |
* Interested Board Member.
Fund Manager
Nuveen Fund Advisors, LLC
333 West Wacker Drive
Chicago, IL 60606 | | Custodian
State Street Bank
& Trust Company
Boston, MA 02111 | | Legal Counsel
Chapman and Cutler LLP
Chicago, IL 60603 | | Independent Registered
Public Accounting Firm
KPMG LLP
Chicago, IL 60601 | | Transfer Agent and
Shareholder Services
State Street Bank &
Trust Company
Nuveen Funds
P.O. Box 43071
Providence, RI 02940-3071
(800) 257-8787 | |
Quarterly Form N-Q Portfolio of Investments Information
The Fund is required to file its complete schedule of portfolio holdings with the Securities and Exchange Commission (SEC) for the first and third quarters of each fiscal year on Form N-Q. You may obtain this information directly from the SEC. Visit the SEC on-line at http://www.sec.gov or in person at the SEC's Public Reference Room in Washington, D.C. Call the SEC toll-free at (800) SEC -0330 for room hours and operation.
Nuveen Funds' Proxy Voting Information
You may obtain (i) information regarding how each fund voted proxies relating to portfolio securities held during the most recent twelve-month period ended June 30, without charge, upon request, by calling Nuveen Investments toll-free at (800) 257-8787 or on Nuveen's website at www.nuveen.com and (ii) a description of the policies and procedures that each fund used to determine how to vote proxies relating to portfolio securities without charge, upon request, by calling Nuveen Investments toll free at (800) 257-8787. You may also obtain this information directly from the SEC. Visit the SEC on-line at http://www.sec.gov.
CEO Certification Disclosure
The Fund's Chief Executive Officer (CEO) has submitted to the New York Stock Exchange (NYSE) the annual CEO certification as required by Section 303A.12(a) of the NYSE Listed Company Manual. The Fund has filed with the SEC the certification of its CEO and Chief Financial Officer required by Section 302 of the Sarbanes-Oxley Act.
Common Share Information
The Fund intends to repurchase shares of its own common stock at such times and in such amounts as is deemed advisable. During the period covered by this report, the Fund repurchased shares of its common stock as shown in the accompanying table. Any future repurchases will be reported to shareholders in the next annual or semi-annual report.
| | | JTA | |
Common shares repurchased | | | — | | |
Nuveen Investments
46
Distribution Information
The Fund hereby designates its percentage of dividends paid from net ordinary income as dividends qualifying for the 70% dividends received deduction (DRD) for corporations and its percentage as qualified dividend income (QDI) for individuals under Section 1(h)(11) of the Internal Revenue Code as shown in the accompanying table. The actual qualified dividend income distributions will be reported to shareholders on Form 1099-DIV which will be sent to shareholders shortly after calendar year end.
| | JTA | |
| % QDI | | | 51.70 | % | |
| % DRD | | | 26.97 | % | |
FINRA BrokerCheck: The Financial Industry Regulatory Authority (FINRA) provides information regarding the disciplinary history of FINRA member firms and associated investment professionals. This information as well as an investor brochure describing FINRA BrokerCheck is available to the public by calling the FINRA BrokerCheck Hotline number at (800) 289-9999 or by visiting www.FlNRA.org.
Nuveen Investments
47
Glossary of Terms
Used in this Report
n Average Annual Total Return: This is a commonly used method to express an investment's performance over a particular, usually multi-year time period. It expresses the return that would have been necessary each year to equal the investment's actual cumulative performance (including change in NAV or market price and reinvested dividends and capital gains distributions, if any) over the time period being considered.
n Blended Benchmark: A blended return comprised of: 1) 56% of the return of the Russell 3000® Value Index, which measures the performance of those Russell 3000® Index companies with lower price-to book ratios and lower forecasted growth values, 2) 16% of the return of the MSCI EAFE ex-Japan Value Index, a capitalization weighted index that selects the lower 50% of the price-to-book ranked value stocks traded in the developed markets of Europe, Asia and the Far East, excluding Japan, 3) 8% of the return of the Merrill Lynch DRD (dividends received deduction) Preferred Index, which consists of investment-grade, DRD-eligible, exchange-traded preferred stocks with one year or more to maturity, and 4) 20% of the return of the CSFB Leveraged Loan Index, which consists of approximately $150 billion of tradable term loans with at least one year to maturity and rated BBB or lower. Index returns assume reinvestment of distributions, but do not include the effects of any applicable sales charges or management fees.
n Collateralized Loan Obligation (CLO): A security backed by a pool of debt, often low rated corporate loans. Collateralized loan obligations (CLOs) are similar to collateralized mortgage obligations, except for the different type of underlying loan.
n Dow Jones Industrial Average: A price-weighted index of the 30 largest, most widely held stocks traded on the New York Stock Exchange. The index returns assume reinvestment of distributions, but do not reflect any applicable sales charges or management fees.
n Effective Leverage: Effective leverage is a fund's effective economic leverage, and includes both regulatory leverage (see below) and the leverage effects of certain derivative investments in the fund's portfolio.
n Gross Domestic Product (GDP): The total market value of all final goods and services produced in a country/region in a given year, equal to total consumer, investment and government spending, plus the value of exports, minus the value of imports.
n Leverage: Leverage is created whenever a fund has investment exposure (both reward and/or risk) equivalent to more than 100% of the investment capital.
n Net Asset Value (NAV) Per Share: A fund's Net Assets is equal to its total assets (securities, cash, accrued earnings and receivables) less its total liabilities. NAV per share is equal to the fund's Net Assets divided by its number of shares outstanding.
n Regulatory Leverage: Regulatory leverage consists of preferred shares issued by or borrowings of a fund. Both of these are part of the fund's capital structure. Regulatory leverage is subject to asset coverage limits set in the Investment Company Act of 1940.
n S&P 500® Index: An unmanaged index generally considered representative of the U.S. stock market. Index returns assume reinvestment of distributions, but do not reflect any applicable sales charges or management fees.
Nuveen Investments
48
Reinvest Automatically,
Easily and Conveniently
Nuveen makes reinvesting easy. A phone call is all it takes to set up your reinvestment account.
Nuveen Closed-End Funds Automatic Reinvestment Plan
Your Nuveen Closed-End Fund allows you to conveniently reinvest distributions in additional Fund shares.
By choosing to reinvest, you'll be able to invest money regularly and automatically, and watch your investment grow through the power of compounding. Just like distributions in cash, there may be times when income or capital gains taxes may be payable on distributions that are reinvested.
It is important to note that an automatic reinvestment plan does not ensure a profit, nor does it protect you against loss in a declining market.
Easy and convenient
To make recordkeeping easy and convenient, each quarter you'll receive a statement showing your total distributions, the date of investment, the shares acquired and the price per share, and the total number of shares you own.
How shares are purchased
The shares you acquire by reinvesting will either be purchased on the open market or newly issued by the Fund. If the shares are trading at or above net asset value at the time of valuation, the Fund will issue new shares at the greater of the net asset value or 95% of the then-current market price. If the shares are trading at less than net asset value, shares for your account will be purchased on the open market. If the Plan Agent begins purchasing Fund shares on the open market while shares are trading below net asset value, but the Fund's shares subsequently trade at or above their net asset value before the Plan Agent is able to complete its purchases, the Plan Agent may cease open-market purchases and may invest the uninvested portion of the distribution in newly-issued Fund shares at a price equal to the greater of the shares' net asset value or 95% of the shares' market value on the last business day immediately prior to the purchase date. Distributions received to purchase shares in the open market will normally be invested shortly after the distribution payment date. No interest will be paid on distributions awaiting reinvestment. Because the market price of the shares may increase before purchases are completed, the average purchase price per share may exceed the market price at the time of valuation, resulting in the acquisition of fewer shares than if the distribution had been paid in shares issued by the Fund. A pro rata portion of any applicable brokerage commissions on open market purchases will be paid by Plan participants. These commissions usually will be lower than those charged on individual transactions.
Flexible
You may change your distribution option or withdraw from the Plan at any time, should your needs or situation change.
You can reinvest whether your shares are registered in your name, or in the name of a brokerage firm, bank, or other nominee. Ask your investment advisor if his or her firm will participate on your behalf. Participants whose shares are registered in the name of one firm may not be able to transfer the shares to another firm and continue to participate in the Plan.
The Fund reserves the right to amend or terminate the Plan at any time. Although the Fund reserves the right to amend the Plan to include a service charge payable by the participants, there is no direct service charge to participants in the Plan at this time.
Call today to start reinvesting distributions
For more information on the Nuveen Automatic Reinvestment Plan or to enroll in or withdraw from the Plan, speak with your financial advisor or call us at (800) 257-8787.
Nuveen Investments
49
The management of the Funds, including general supervision of the duties performed for the Funds by the Adviser, is the responsibility of the Board of Trustees of the Funds. The number of trustees of the Funds is currently set at eleven. None of the trustees who are not "interested" persons of the Funds (referred to herein as "independent trustees") has ever been a director or employee of, or consultant to, Nuveen or its affiliates. The names and business addresses of the trustees and officers of the Funds, their principal occupations and other affiliations during the past five years, the number of portfolios each oversees and other directorships they hold are set forth below.
Name,
Year of Birth
& Address | | Position(s) Held
with the Funds | | Year First
Elected or
Appointed
and Term(1) | | Principal
Occupation(s)
Including other
Directorships
During Past 5 Years | | Number
of Portfolios
in Fund Complex
Overseen by
Board Member | |
Independent Board Members: | | | | | |
| nWILLIAM J. SCHNEIDER | | | |
1944
333 W. Wacker Drive
Chicago, IL 60606 | | Chairman and
Board Member | | 1996
Class III | | Chairman of Miller-Valentine Partners, a real estate investment company; formerly, Senior Partner and Chief Operating Officer (retired (2004) of Miller-Valentine Group; an owner in several other Miller Valentine entities; Board Member of Med-America Health System, Tech Town, Inc., a not-for-profit community development company, Board Member of WDPR Public Radio station; formerly, member, Business Advisory Council, Cleveland Federal Reserve Bank and University of Dayton Business School Advisory Council. | | |
195 | | |
| nJACK B. EVANS | | | |
1948
333 W. Wacker Drive
Chicago, IL 60606 | |
Board Member | | 1999
Class III | | President, The Hall-Perrine Foundation, a private philanthropic corporation (since 1996); Chairman, United Fire Group, a publicly held company; formerly, President Pro-Tem of the Board of Regents for the State of Iowa University System; Director, Source Media Group; Life Trustee of Coe College; formerly, Director, Alliant Energy; formerly, Director, Federal Reserve Bank of Chicago; formerly, President and Chief Operating Officer, SCI Financial Group, Inc., a regional financial services firm. | | |
195 | | |
| nWILLIAM C. HUNTER | | | |
1948
333 W. Wacker Drive
Chicago, IL 60606 | |
Board Member | | 2004
Class I | | Dean Emeritus (since June 30, 2012), formerly, Dean, Tippie College of Business, University of Iowa (2006-2012); Director (since 2004) of Xerox Corporation; Director (since 2005), and President (since July 2012) Beta Gamma Sigma, Inc., The International Business Honor Society; Director of Wellmark, Inc. (since 2009); formerly, Dean and Distinguished Professor of Finance, School of Business at the University of Connecticut (2003-2006); previously, Senior Vice President and Director of Research at the Federal Reserve Bank of Chicago (1995-2003); formerly, Director (1997-2007), Credit Research Center at Georgetown University. | | |
195 | | |
| nDAVID J. KUNDERT | | | |
1942
333 W. Wacker Drive
Chicago, IL 60606 | |
Board Member | | 2005
Class II | | Formerly, Director, Northwestern Mutual Wealth Management Company (2006-2013), retired (since 2004) as Chairman, JPMorgan Fleming Asset Management, President and CEO, Banc One Investment Advisors Corporation, and President, One Group Mutual Funds; prior thereto, Executive Vice President, Banc One Corporation and Chairman and CEO, Banc One Investment Management Group; Regent Emeritus, Member of Investment Committee, Luther College; member of the Wisconsin Bar Association; member of Board of Directors and Chair of Investment Committee, Greater Milwaukee Foundation; member of the Board of Directors (Milwaukee), College Possible. | | |
195 | | |
Nuveen Investments
50
Name,
Year of Birth
& Address | | Position(s) Held
with the Funds | | Year First
Elected or
Appointed
and Term(1) | | Principal
Occupation(s)
Including other
Directorships
During Past 5 Years | | Number
of Portfolios
in Fund Complex
Overseen by
Board Member | |
Independent Board Members (continued): | | | | | |
| nJOHN K. NELSON | | | |
1962
333 West Wacker Drive
Chicago, IL 60606 | |
Board Member | | 2013
Class II | | Senior external advisor to the financial services practice of Deloitte Consulting LLP (since 2012); Member of Board of Directors of Core12 LLC since 2008), a private firm which develops branding, marketing and communications strategies for clients; Director of The Curran Center for Catholic American Studies (since 2009) and The President's Council, Fordham University (since 2010); formerly, Chairman of the Board of Trustees of Marian University (2010 as trustee, 2011-2014 as Chairman); formerly, Chief Executive Officer of ABN AMRO N.V. North America, and Global Head of its Financial Markets Division (2007-2008); prior senior positions held at ABN AMRO include Corporate Executive Vice President and Head of Global Markets-the Americas (2006-2007), CEO of Wholesale Banking North America and Global Head of Foreign Exchange and Futures Markets (2001-2006), and Regional Commercial Treasurer and Senior Vice President Trading-North America (1996-2001); formerly, Trustee at St. Edmund Preparatory School in New York City. | | |
195 | | |
| nJUDITH M. STOCKDALE | | | |
1947
333 W. Wacker Drive
Chicago, IL 60606 | |
Board Member | | 1997
Class I | | Board Member, Land Trust Alliance (since June 2013) and U.S. Endowment for Forestry and Communities (since November 2013); formerly, Executive Director (1994-2012), Gaylord and Dorothy Donnelley Foundation; prior thereto, Executive Director, Great Lakes Protection Fund (1990-1994). | | |
195 | | |
| nCAROLE E. STONE | | | |
1947
333 W. Wacker Drive
Chicago, IL 60606 | |
Board Member | | 2007
Class I | | Director, Chicago Board Options Exchange (since 2006); Director, C2 Options Exchange, Incorporated (since 2009); Director, CBOE Holdings, Inc. (since 2010); formerly, Commissioner, New York State Commission on Public Authority Reform (2005-2010). | | |
195 | | |
| nVIRGINIA L. STRINGER | | | |
1944
333 W. Wacker Drive
Chicago, IL 60606 | |
Board Member | | 2011
Class I | | Board Member, Mutual Fund Directors Forum; former governance consultant and non-profit board member; former Owner and President, Strategic Management Resources, Inc., a management consulting firm; former Member, Governing Board, Investment Company Institute's Independent Directors Council; previously, held several executive positions in general management, marketing and human resources at IBM and The Pillsbury Company; Independent Director, First American Fund Complex (1987-2010) and Chair (1997-2010). | | |
195 | | |
| nTERENCE J. TOTH | | | |
1959
333 W. Wacker Drive
Chicago, IL 60606 | |
Board Member | | 2008
Class II | | Managing Partner, Promus Capital (since 2008); Director, Fulcrum IT Service LLC (since 2010), Quality Control Corporation (since 2012) and LogicMark LLC (since 2012); formerly, Director, Legal & General Investment Management America, Inc. (2008-2013); formerly, CEO and President, Northern Trust Global Investments (2004-2007); Executive Vice President, Quantitative Management & Securities Lending (2000-2004); prior thereto, various positions with Northern Trust Company (since 1994); member: Chicago Fellowship Board (since 2005), Catalyst Schools of Chicago Board (since 2008) and Chairman, and Mather Foundation Board (since 2012), and a member of its investment committee; formerly, Member, Northern Trust Mutual Funds Board (2005-2007), Northern Trust Global Investments Board (2004-2007), Northern Trust Japan Board (2004-2007), Northern Trust Securities Inc. Board (2003-2007) and Northern Trust Hong Kong Board (1997-2004). | | |
195 | | |
Nuveen Investments
51
Board Members & Officers (Unaudited) (continued)
Name,
Year of Birth
& Address | | Position(s) Held
with the Funds | | Year First
Elected or
Appointed
and Term(1) | | Principal
Occupation(s)
Including other
Directorships
During Past 5 Years | | Number
of Portfolios
in Fund Complex
Overseen by
Board Member | |
Interested Board Members: | | | | | |
| nWILLIAM ADAMS IV(2) | | | |
1955
333 W. Wacker Drive
Chicago, IL 60606 | |
Board Member | | 2013
Class II | | Senior Executive Vice President, Global Structured Products (since 2010); formerly, Executive Vice President, U.S. Structured Products, of Nuveen Investments, Inc. (1999-2010); Co-President of Nuveen Fund Advisors, LLC (since 2011); President (since 2011), formerly, Managing Director (2010-2011) of Nuveen Commodities Asset Management, LLC; Board Member of the Chicago Symphony Orchestra and of Gilda's Club Chicago. | | |
195 | | |
| nTHOMAS S. SCHREIER, JR.(2) | | | |
1962
333 W. Wacker Drive
Chicago, IL 60606 | |
Board Member | | 2013
Class III | | Vice Chairman, Wealth Management of Nuveen Investments, Inc. (since 2011); Co-President of Nuveen Fund Advisors, LLC; Chairman of Nuveen Asset Management, LLC (since 2011); Co-Chief Executive Officer of Nuveen Securities, LLC (since 2011); Member of Board of Governors and Chairman's Council of the Investment Company Institute; formerly, Chief Executive Officer (2000-2010) and Chief Investment Officer (2007-2010) of FAF Advisors, Inc.; formerly, President of First American Funds (2001-2010). | | |
195 | | |
Name,
Year of Birth
and Address | | Position(s) Held
with the Funds | | Year First
Elected or
Appointed(3) | | Principal
Occupation(s)
During Past 5 Years | | Number
of Portfolios
in Fund Complex
Overseen
by Officer | |
Officers of the Funds: | | | | | |
| nGIFFORD R. ZIMMERMAN | | | |
1956
333 W. Wacker Drive
Chicago, IL 60606 | | Chief
Administrative
Officer | | 1988 | | Managing Director (since 2002), and Assistant Secretary of Nuveen Securities, LLC; Managing Director (since 2004) and Assistant Secretary (since 1994) of Nuveen Investments, Inc.; Managing Director (since 2002), Assistant Secretary (since 1997) and Co-General Counsel (since 2011) of Nuveen Fund Advisors, LLC; Managing Director, Assistant Secretary and Associate General Counsel of Nuveen Asset Management, LLC (since 2011); Managing Director, Associate General Counsel and Assistant Secretary, of Symphony Asset Management LLC (since 2003); Vice President and Assistant Secretary of NWQ Investment Management Company, LLC (since 2002), Nuveen Investments Advisers Inc. (since 2002), Santa Barbara Asset Management, LLC (since 2006), and of Winslow Capital Management, LLC, (since 2010); Vice President and Assistant Secretary (since 2013), formerly, Chief Administrative Officer and Chief Compliance Officer (2006-2013) of Nuveen Commodities Asset Management, LLC; Chartered Financial Analyst. | | |
196 | | |
| nCEDRIC H. ANTOSIEWICZ | | | |
1962
333 W. Wacker Drive
Chicago, IL 60606 | |
Vice President | | 2007 | | Managing Director of Nuveen Securities, LLC. (since 2004); Managing Director of Nuveen Fund Advisors, LLC (since 2014) | | |
89 | | |
| nMARGO L. COOK | | | |
1964
333 W. Wacker Drive
Chicago, IL 60606 | |
Vice President | | 2009 | | Executive Vice President (since 2008) of Nuveen Investments, Inc. and of Nuveen Fund Advisors, LLC (since 2011); Managing Director-Investment Services of Nuveen Commodities Asset Management, LLC (since August 2011), previously, Head of Institutional Asset Management (2007-2008) of Bear Stearns Asset Management; Head of Institutional Asset Management (1986-2007) of Bank of NY Mellon; Chartered Financial Analyst. | | |
196 | | |
Nuveen Investments
52
Name,
Year of Birth
and Address | | Position(s) Held
with the Funds | | Year First
Elected or
Appointed(3) | | Principal
Occupation(s)
During Past 5 Years | | Number
of Portfolios
in Fund Complex
Overseen
by Officer | |
Officers of the Funds (continued): | | | | | |
| nLORNA C. FERGUSON | | | |
1945
333 W. Wacker Drive
Chicago, IL 60606 | |
Vice President | | 1998 | | Managing Director (since 2005) of Nuveen Fund Advisors, LLC and Nuveen Securities, LLC (since 2004). | | |
196 | | |
| nSTEPHEN D. FOY | | | |
1954
333 W. Wacker Drive
Chicago, IL 60606 | | Vice President
and Controller | | 1998 | | Managing Director (since 2014), formerly, Senior Vice President
(2013-2014), and Vice President of Nuveen Fund Advisors, LLC; Chief Financial Officer of Nuveen Commodities Asset Management, LLC (since 2010); Senior Vice President (2010-2011), Formerly Vice President (2005-2010) and Funds Controller of Nuveen Securities, LLC; Certified Public Accountant. | | |
196 | | |
| nSCOTT S. GRACE | | | |
1970
333 W. Wacker Drive
Chicago, IL 60606 | | Vice President
and Treasurer | | 2009 | | Managing Director, Corporate Finance & Development, Treasurer (since 2009) of Nuveen Securities, LLC; Managing Director and Treasurer (since 2009) of Nuveen Fund Advisors, LLC, Nuveen Investments Advisers, Inc., Nuveen Investments Holdings Inc. and (since 2011) Nuveen Asset Management, LLC; Vice President and Treasurer of NWQ Investment Management Company, LLC, Tradewinds Global Investors, LLC, Symphony Asset Management LLC and Winslow Capital Management, LLC.; Vice President of Santa Barbara Asset Management, LLC; formerly, Treasurer (2006-2009), Senior Vice President (2008-2009), previously, Vice President (2006-2008) of Janus Capital Group, Inc.; formerly, Senior Associate in Morgan Stanley's Global Financial Services Group (2000-2003); Chartered Accountant Designation. | | |
196 | | |
| nWALTER M. KELLY | | | |
1970
333 W. Wacker Drive
Chicago, IL 60606 | | Chief Compliance
Officer and
Vice President | | 2003 | | Senior Vice President (since 2008) of Nuveen Investment Holdings, Inc. | | |
196 | | |
| nTINA M. LAZAR | | | |
1961
333 W. Wacker Drive
Chicago, IL 60606 | |
Vice President | | 2002 | | Senior Vice President of Nuveen Investment Holdings, Inc. | | |
196 | | |
| nKEVIN J. MCCARTHY | | | |
1966
333 W. Wacker Drive
Chicago, IL 60606 | | Vice President
and Secretary | | 2007 | | Managing Director and Assistant Secretary (since 2008), Nuveen Securities, LLC; Managing Director (since 2008), Assistant Secretary since 2007) and Co-General Counsel (since 2011) of Nuveen Fund Advisors, LLC; Managing Director, Assistant Secretary and Associate General Counsel (since 2011) of Nuveen Asset Management, LLC; Managing Director (since 2008), and Assistant Secretary, Nuveen Investment Holdings, Inc.; Vice President (since 2007) and Assistant Secretary of Nuveen Investments Advisers Inc., NWQ Investment Management Company, LLC, NWQ Holdings, LLC, Symphony Asset Management LLC, Santa Barbara Asset Management, LLC, and of Winslow Capital Management, LLC. (since 2010); Vice President and Secretary (since 2010) of Nuveen Commodities Asset Management, LLC. | | |
196 | | |
Nuveen Investments
53
Board Members & Officers (Unaudited) (continued)
Name,
Year of Birth
and Address | | Position(s) Held
with the Funds | | Year First
Elected or
Appointed(3) | | Principal
Occupation(s)
During Past 5 Years | | Number
of Portfolios
in Fund Complex
Overseen
by Officer | |
Officers of the Funds (continued): | | | | | |
| nKATHLEEN L. PRUDHOMME | | | |
1953
901 Marquette Avenue
Minneapolis, MN 55402 | | Vice President and
Assistant Secretary | | 2011 | | Managing Director, Assistant Secretary and Co-General Counsel (since 2011) of Nuveen Fund Advisors, LLC; Managing Director, Assistant Secretary and Associate General Counsel (since 2011) of Nuveen Asset Management, LLC; Managing Director and Assistant Secretary (since 2011) of Nuveen Securities, LLC; formerly, Deputy General Counsel, FAF Advisors, Inc. (2004-2010). | | |
196 | | |
| nJOEL T. SLAGER | | | |
1978
333 West Wacker Drive
Chicago, IL 60606 | | Vice President and
Assistant Secretary | | 2013 | | Fund Tax Director for Nuveen Funds (since May, 2013); previously, Vice President of Morgan Stanley Investment Management, Inc., Assistant Treasurer of the Morgan Stanley Funds (from 2010 to 2013); Tax Director at PricewaterhouseCoopers LLP (from 2008 to 2010). | | |
196 | | |
(1) The Board Members serve three year terms. The Board of Trustees is divided into three classes. Class I, Class II, and Class III, with each being elected to serve until the third succeeding annual shareholders' meeting subsequent to its election or thereafter in each case when its respective successors are duly elected or appointed. The first year elected or appointed represents the year in which the board member was first elected or appointed to any fund in the Nuveen Complex.
(2) "Interested person" as defined in the 1940 Act, by reason of his position with Nuveen Investments, Inc. and certain of its subsidiaries, which are affiliates of the Nuveen Funds.
(3) Officers serve one year terms through August of each year. The year first elected or appointed represents the year in which the Officer was first elected or appointed to any fund in the Nuveen Complex.
Nuveen Investments
54

Nuveen Investments:
Serving Investors for Generations
Since 1898, financial advisors and their clients have relied on Nuveen Investments to provide dependable investment solutions through continued adherence to proven, long-term investing principles. Today, we offer a range of high quality equity and fixed-income solutions designed to be integral components of a well-diversified core portfolio.
Focused on meeting investor needs.
Nuveen Investments provides high-quality investment services designed to help secure the long-term goals of institutional and individual investors as well as the consultants and financial advisors who serve them. Nuveen Investments markets a wide range of specialized investment solutions which provide investors access to capabilities of its high-quality boutique investment affiliates—Nuveen Asset Management, Symphony Asset Management, NWQ Investment Management Company, Santa Barbara Asset Management, Tradewinds Global Investors, Winslow Capital Management and Gresham Investment Management. In total, Nuveen Investments managed $230 billion as of December 31, 2014.
Find out how we can help you.
To learn more about how the products and services of Nuveen Investments may be able to help you meet your financial goals, talk to your financial advisor, or call us at (800) 257-8787. Please read the information provided carefully before you invest. Investors should consider the investment objective and policies, risk considerations, charges and expenses of any investment carefully. Where applicable, be sure to obtain a prospectus, which contains this and other relevant information. To obtain a prospectus, please contact your securities representative or Nuveen Investments, 333 W. Wacker Dr., Chicago, IL 60606. Please read the prospectus carefully before you invest or send money.
Learn more about Nuveen Funds at: www.nuveen.com/cef
Distributed by Nuveen Securities, LLC | 333 West Wacker Drive | Chicago, IL 60606 | www.nuveen.com/cef
EAN-C-1214D 6243-INV-Y02/16
ITEM 2. CODE OF ETHICS.
As of the end of the period covered by this report, the registrant has adopted a code of ethics that applies to the registrant’s principal executive officer, principal financial officer, principal accounting officer or controller, or persons performing similar functions. There were no amendments to or waivers from the Code during the period covered by this report. The registrant has posted the code of ethics on its website at www.nuveen.com/CEF/Shareholder/FundGovernance.aspx. (To view the code, click on Code of Conduct.)
ITEM 3. AUDIT COMMITTEE FINANCIAL EXPERT.
The registrant’s Board of Directors or Trustees (“Board”) determined that the registrant has at least one “audit committee financial expert” (as defined in Item 3 of Form N-CSR) serving on its Audit Committee. The registrant’s audit committee financial experts are Carole E. Stone and Jack B. Evans, who are “independent” for purposes of Item 3 of Form N-CSR.
Ms. Stone served for five years as Director of the New York State Division of the Budget. As part of her role as Director, Ms. Stone was actively involved in overseeing the development of the State’s operating, local assistance and capital budgets, its financial plan and related documents; overseeing the development of the State’s bond-related disclosure documents and certifying that they fairly presented the State’s financial position; reviewing audits of various State and local agencies and programs; and coordinating the State’s system of internal audit and control. Prior to serving as Director, Ms. Stone worked as a budget analyst/examiner with increasing levels of responsibility over a 30 year period, including approximately five years as Deputy Budget Director. Ms. Stone has also served as Chair of the New York State Racing Association Oversight Board, as Chair of the Public Authorities Control Board, as a Commissioner on the New York State Commission on Public Authority Reform and as a member of the Boards of Directors of several New York State public authorities. These positions have involved overseeing operations and finances of certain entities and assessing the adequacy of project/entity financing and financial reporting. Currently, Ms. Stone is on the Board of Directors of CBOE Holdings, Inc., of the Chicago Board Options Exchange, and of C2 Options Exchange. Ms. Stone’s position on the boards of these entities and as a member of both CBOE Holdings’ Audit Committee and its Finance Committee has involved, among other things, the oversight of audits, audit plans and preparation of financial statements.
Mr. Evans was formerly President and Chief Operating Officer of SCI Financial Group, Inc., a full service registered broker-dealer and registered investment adviser (“SCI”). As part of his role as President and Chief Operating Officer, Mr. Evans actively supervised the Chief Financial Officer (the “CFO”) and actively supervised the CFO’s preparation of financial statements and other filings with various regulatory authorities. In such capacity, Mr. Evans was actively involved in the preparation of SCI’s financial statements and the resolution of issues raised in connection therewith. Mr. Evans has also served on the audit committee of various reporting companies. At such companies, Mr. Evans was involved in the oversight of audits, audit plans, and the preparation of financial statements. Mr. Evans also formerly chaired the audit committee of the Federal Reserve Bank of Chicago.
ITEM 4. PRINCIPAL ACCOUNTANT FEES AND SERVICES.
NUVEEN TAX-ADVANTAGED TOTAL RETURN STRATEGY FUND
The following tables show the amount of fees billed to the Fund during the Fund’s last two fiscal years by KPMG LLP, the fund’s current auditor, and Ernst & Young LLP, the fund’s former auditor. The audit fees billed to the fund for the fiscal year 2014 are the only fees that have been billed to the fund by KPMG LLC. All other fees listed in the tables below were billed to the fund by Ernst & Young. For engagements with KPMG LLP and Ernst & Young LLP the Audit Committee approved in advance all audit services and non-audit services that KPMG LLP and Ernst & Young LLP provided to the Fund, except for those non-audit services that were subject to the pre-approval exception under Rule 2-01 of Regulation S-X (the “pre-approval exception”). The pre-approval exception for services provided directly to the Fund waives the pre-approval requirement for services other than audit, review or attest services if: (A) the aggregate amount of all such services provided constitutes no more than 5% of the total amount of revenues paid by the Fund to its accountant during the fiscal year in which the services are provided; (B) the Fund did not recognize the services as non-audit services at the time of the engagement; and (C) the services are promptly brought to the Audit Committee’s attention, and the Committee (or its delegate) approves the services before the audit is completed.
The Audit Committee has delegated certain pre-approval responsibilities to its Chairman (or, in his absence, any other member of the Audit Committee).
SERVICES THAT THE FUND’S AUDITOR BILLED TO THE FUND
| | Audit Fees Billed | | Audit-Related Fees | | Tax Fees | | All Other Fees | |
Fiscal Year Ended | | to Fund (1) | | Billed to Fund (2) | | Billed to Fund (3) | | Billed to Fund (4) | |
December 31, 2014 | | $ | 28,500 | | $ | 0 | | $ | 0 | | $ | 0 | |
| | | | | | | | | |
Percentage approved pursuant to pre-approval exception | | 0 | % | 0 | % | 0 | % | 0 | % |
| | | | | | | | | |
December 31, 2013 | | $ | 28,250 | | $ | 0 | | $ | 0 | | $ | 0 | |
| | | | | | | | | |
Percentage approved pursuant to pre-approval exception | | 0 | % | 0 | % | 0 | % | 0 | % |
(1) “Audit Fees” are the aggregate fees billed for professional services for the audit of the Fund’s annual financial statements and services provided in connection with statutory and regulatory filings or engagements.
(2) “Audit Related Fees” are the aggregate fees billed for assurance and related services reasonably related to the performance of the audit or review of financial statements that are not reported under “Audit Fees”. These fees include offerings related to the Fund’s common shares and leverage.
(3) “Tax Fees” are the aggregate fees billed for professional services for tax advice, tax compliance, and tax planning. These fees include: all global withholding tax services; excise and state tax reviews; capital gain, tax equalization and taxable basis calculation performed by the principal accountant.
(4) “All Other Fees” are the aggregate fees billed for products and services other than “Audit Fees”, “Audit-Related Fees” and “Tax Fees”. These fees represent all “Agreed-Upon Procedures” engagements pertaining to the Fund’s use of leverage.
SERVICES THAT THE FUND’S AUDITOR BILLED TO THE
ADVISER AND AFFILIATED FUND SERVICE PROVIDERS
The following tables show the amount of fees billed by KPMG LLP and Ernst & Young LLP to Nuveen Fund Advisors, LLC (formerly Nuveen Fund Advisors, Inc.) (the “Adviser”), and any entity controlling, controlled by or under common control with the Adviser that provides ongoing services to the Fund (“Affiliated Fund Service Provider”), for engagements directly related to the Fund’s operations and financial reporting, during the Fund’s last two full fiscal years.
The tables also show the percentage of fees subject to the pre-approval exception. The pre-approval exception for services provided to the Adviser and any Affiliated Fund Service Provider (other than audit, review or attest services) waives the pre-approval requirement if: (A) the aggregate amount of all such services provided constitutes no more than 5% of the total amount of revenues paid to KPMG LLP and Ernst & Young LLP by the Fund, the Adviser and Affiliated Fund Service Providers during the fiscal year in which the services are provided that would have to be pre-approved by the Audit Committee; (B) the Fund did not recognize the services as non-audit services at the time of the engagement; and (C) the services are promptly brought to the Audit Committee’s attention, and the Committee (or its delegate) approves the services before the Fund’s audit is completed.
| | Audit-Related Fees | | Tax Fees Billed to | | All Other Fees | |
| | Billed to Adviser and | | Adviser and | | Billed to Adviser | |
| | Affiliated Fund | | Affiliated Fund | | and Affiliated Fund | |
Fiscal Year Ended | | Service Providers | | Service Providers | | Service Providers | |
December 31, 2014 | | $ | 0 | | $ | 0 | | $ | 0 | |
| | | | | | | |
Percentage approved pursuant to pre-approval exception | | 0 | % | 0 | % | 0 | % |
| | | | | | | | | | |
December 31, 2013 | | $ | 0 | | $ | 0 | | $ | 0 | |
| | | | | | | |
Percentage approved pursuant to pre-approval exception | | 0 | % | 0 | % | 0 | % |
NON-AUDIT SERVICES
The following table shows the amount of fees that KPMG LLP and Ernst & Young LLP billed during the Fund’s last two full fiscal years for non-audit services. The Audit Committee is required to pre-approve non-audit services that KPMG LLP and Ernst & Young LLP provides to the Adviser and any Affiliated Fund Services Provider, if the engagement related directly to the Fund’s operations and financial reporting (except for those subject to the pre-approval exception described above). The Audit Committee requested and received information from KPMG LLP and Ernst & Young LLP about any non-audit services that KPMG LLP and Ernst & Young LLP rendered during the Fund’s last fiscal year to the Adviser and any Affiliated Fund Service Provider. The Committee considered this information in evaluating KPMG LLP and Ernst & Young LLP’s independence.
| | | | Total Non-Audit Fees | | | | | |
| | | | billed to Adviser and | | | | | |
| | | | Affiliated Fund Service | | Total Non-Audit Fees | | | |
| | | | Providers (engagements | | billed to Adviser and | | | |
| | | | related directly to the | | Affiliated Fund Service | | | |
| | Total Non-Audit Fees | | operations and financial | | Providers (all other | | | |
Fiscal Year Ended | | Billed to Fund | | reporting of the Fund) | | engagements) | | Total | |
December 31, 2014 | | $ | 0 | | $ | 0 | | $ | 0 | | $ | 0 | |
December 31, 2013 | | $ | 0 | | $ | 0 | | $ | 0 | | $ | 0 | |
“Non-Audit Fees billed to Fund” for both fiscal year ends represent “Tax Fees” and “All Other Fees” billed to Fund in their respective amounts from the previous table.
Less than 50 percent of the hours expended on the principal accountant’s engagement to audit the registrant’s financial statements for the most recent fiscal year were attributed to work performed by persons other than the principal accountant’s full-time, permanent employees.
Audit Committee Pre-Approval Policies and Procedures. Generally, the Audit Committee must approve (i) all non-audit services to be performed for the Fund by the Fund’s independent accountants and (ii) all audit and non-audit services to be performed by the Fund’s independent accountants for the Affiliated Fund Service Providers with respect to operations and financial reporting of the Fund. Regarding tax and research projects conducted by the independent accountants for the Fund and Affiliated Fund Service Providers (with respect to operations and financial reports of the Fund) such engagements will be (i) pre-approved by the Audit Committee if they are expected to be for amounts greater than $10,000; (ii) reported to the Audit Committee chairman for his verbal approval prior to engagement if they are expected to be for amounts under $10,000 but greater than $5,000; and (iii) reported to the Audit Committee at the next Audit Committee meeting if they are expected to be for an amount under $5,000.
ITEM 5. AUDIT COMMITTEE OF LISTED REGISTRANTS.
The registrant’s Board has a separately designated Audit Committee established in accordance with Section 3(a)(58)(A) of the Securities Exchange Act of 1934, as amended (15 U.S.C. 78c(a)(58)(A)). The members of the audit committee are Jack B. Evans, David J. Kundert, John K. Nelson, Carole E. Stone and Terence J. Toth.
ITEM 6. SCHEDULE OF INVESTMENTS.
(a) See Portfolio of Investments in Item 1.
(b) Not applicable.
ITEM 7. DISCLOSURE OF PROXY VOTING POLICIES AND PROCEDURES FOR CLOSED-END MANAGEMENT INVESTMENT COMPANIES.
Nuveen Fund Advisors, LLC, formerly known as Nuveen Fund Advisors, Inc., is the registrant’s investment adviser (also referred to as the “Adviser”). The Adviser is responsible for the on-going monitoring of the Fund’s investment portfolio, managing the Fund’s business affairs and providing certain clerical, bookkeeping and administrative services. The Adviser has engaged NWQ Investment Management Company, LLC (“NWQ”) and Symphony Asset Management, LLC (“Symphony”) (NWQ and Symphony are collectively referred to as “Sub-Advisers”) as Sub-Advisers to provide discretionary investment advisory services. As part of these services, the Adviser has delegated to each Sub-Adviser the full responsibility for proxy voting and related duties in accordance with each Sub-Adviser’s policies and procedures. The Adviser periodically monitors each Sub-Adviser’s voting to ensure that it is carrying out its duties. Each Sub-Adviser’s proxy voting policies and procedures are attached to this filing as an exhibit and incorporated herein by reference or summarized below.
SYMPHONY
Symphony has adopted and implemented proxy voting guidelines to ensure that proxies are voted in the best interest of its Clients. These are merely guidelines and specific situations may call for a vote which does not follow the guidelines. In determining how to vote proxies, Symphony will follow the Proxy Voting Guidelines of the independent third party which Symphony has retained to provide proxy voting services (“Symphony’s Proxy Guidelines”).
Symphony has created a Proxy Voting Committee to periodically review Symphony’s Proxy Guidelines, address conflicts of interest, specific situations and any portfolio manager’s decision to deviate from Symphony’s Proxy Guideline, (including the third party’s guidelines). Under certain circumstances, Symphony may vote one way for some Clients and another way for other Clients. For example, votes for a Client who provides specific voting instructions may differ from votes for Clients who do not provide proxy voting instructions. However, when Symphony has discretion, proxies will generally be voted the same way for all Clients. In addition, conflicts of interest in voting proxies may arise between Clients, between Symphony and its employees, or a lending or other material relationship. As a general rule, conflicts will be resolved by Symphony voting in accordance with Symphony’s Proxy Guidelines when:
· Symphony manages the account of a corporation or a pension fund sponsored by a corporation in which Clients of Symphony also own stock. Symphony will vote the proxy for its other Clients in accordance with Symphony’s Proxy Guidelines and will follow any directions from the corporation or the pension plan, if different than Symphony’s Proxy Guidelines;
· An employee or a member of his/her immediate family is on the Board of Directors or a member of senior management of the company that is the issuer of securities held in Client’s account;
· Symphony has a borrowing or other material relationship with a corporation whose securities are the subject of the proxy.
Proxies will always be voted in the best interest of Symphony’s Clients. Those situations that do not fit within the general rules for the resolution of conflicts of interest will be reviewed by the Proxy Voting Committee. The Proxy Voting Committee, after consulting with senior management, if appropriate, will determine how the proxy should be voted. For example, when a portfolio manager decides not to follow Symphony’s Proxy Guidelines, the Proxy Voting Committee will review a portfolio manager’s recommendation and determine how to vote the proxy. Decisions by the Proxy Voting Committee will be documented and kept with records related to the voting of proxies. A summary of specific votes will be retained in accordance with Symphony’s Books and Records Requirements which are set forth Symphony’s Compliance Manual and Code of Ethics.
ITEM 8. PORTFOLIO MANAGERS OF CLOSED-END MANAGEMENT INVESTMENT COMPANIES.
Nuveen Fund Advisors, LLC (“NFALLC”) is the registrant’s investment adviser (NFALLC is also referred to as the “Adviser”). NFALLC is responsible for the selection and on-going monitoring of the Fund’s investment portfolio, managing the Fund’s business affairs and providing certain clerical, bookkeeping and administrative services. The Adviser has engaged Symphony Asset Management LLC (“Symphony”) and NWQ Investment Management Company, LLC (“NWQ”), as Sub-Advisers to provide discretionary investment advisory services with respect to the registrant’s investments in senior loans and other debt instruments and equity investments, respectively (Symphony and NWQ are also collectively referred to as “Sub-Advisers”). The following section provides information on the portfolio managers at each Sub-Adviser:
Symphony
Item 8(a)(1). PORTFOLIO MANAGER BIOGRAPHY
Gunther Stein, Chief Investment Officer and Chief Executive Officer, Portfolio Manager
Gunther Stein is Chief Investment Officer and Chief Executive Officer at Symphony. Mr. Stein is responsible for leading Symphony’s fixed-income and equity investments strategies and research and overseeing firm trading. Prior to joining Symphony in 1999, Mr. Stein was a high yield portfolio manager at Wells Fargo Bank, where he managed a high yield portfolio, was responsible for investing in public high yield bonds and bank loans and managed a team of credit analysts.
Item 8(a)(2). OTHER ACCOUNTS MANAGED
Other Accounts Managed by Symphony PM As of 12/31/14
| | Gunther Stein | |
(a) RICs | | | |
Number of accts | | 18 | |
Assets | | $ | 3.778 billion | |
| | | |
(b) Other pooled accts | | | |
Non-performance fee accts | | | |
Number of accts | | 10 | |
Assets | | $ | 425 million | |
Performance fee accts | | | |
Number of accts | | 18 | |
Assets | | $ | 2.683 billion | |
| | | |
(c) Other | | | |
Non-performance fee accts | | | |
Number of accts | | 12 | |
Assets | | $ | 181 million | |
Performance fee accts | | | |
Number of accts | | 6 | |
Assets | | $ | 194 million | |
POTENTIAL MATERIAL CONFLICTS OF INTEREST
As described below, the portfolio manager may manage other accounts with investment strategies similar to the Fund, including other investment companies and separately managed accounts. Fees earned by the sub-adviser may vary among these accounts and the portfolio managers may personally invest in some but not all of these accounts. These factors could create conflicts of interest because a portfolio manager may have incentives to favor certain accounts over others, resulting in other accounts outperforming the Fund. A conflict may also exist if a portfolio manager identified a limited investment opportunity that may be appropriate for more than one account, but the Fund is not able to take full advantage of that opportunity due to the need to allocate that opportunity among multiple accounts. In addition, the portfolio manager may execute transactions for another account that may adversely impact the value of securities held by the Fund. However, the sub-adviser believes that these risks are mitigated by the fact that accounts with like investment strategies managed by a particular portfolio manager are generally managed in a similar fashion, subject to exceptions to account for particular investment restrictions or policies applicable only to certain accounts, differences in cash flows and account sizes, and other factors. In addition, the sub-adviser has adopted trade allocation procedures that require equitable allocation of trade orders for a particular security among participating accounts.
Item 8(a)(3). FUND MANAGER COMPENSATION
Symphony investment professionals receive compensation based on three elements: fixed-base salary, participation in a bonus pool and certain long-term incentives.
The fixed-base salary is set at a level determined by Symphony and is reviewed periodically to ensure that it is competitive with base salaries paid by similar financial services companies for persons playing similar roles.
The portfolio manager is also eligible to receive an annual bonus from a pool based on Symphony’s aggregate asset-based and performance fees after all operating expenses. Bonus compensation for each individual is based on a variety of factors, including the performance of Symphony, the Fund, the team and the individual. Fund performance is assessed on a pre-tax total return risk-adjusted basis, and generally measured relative to the Fund’s primary benchmark and/or industry peer group for one, three or five year periods as applicable. Finally, certain key employees of Symphony, including the portfolio managers, have received profits interests in Symphony which entitle their holders to participate in the firm’s growth over time.
Item 8(a)(4).
OWNERSHIP OF JTA SECURITIES AS OF DECEMBER 31, 2014
Name of Portfolio
Manager | | None | | $1 -
$10,000 | | $10,001
-
$50,000 | | $50,001-
$100,000 | | $100,001-
$500,000 | | $500,001-
$1,000,000 | | Over
$1,000,000 | |
Gunther Stein | | X | | | | | | | | | | | | | |
| | | | | | | | | | | | | | | |
| | | | | | | | | | | | | | | |
NWQ
Item 8(a)(1). PORTFOLIO MANAGER BIOGRAPHIES
Thomas J. Ray, CFA, Managing Director, Head of Fixed Income, and Fixed Income Portfolio Manager
Prior to joining NWQ in 2015, Tom was a Private Investor. Prior to that, he served as Chief Investment Officer, President and founding member of Inflective Asset Management; a boutique investment firm specializing in convertible securities. Prior to founding Inflective, Tom also served as portfolio manager at Transamerica Investment Management. Tom graduated from University of Wisconsin with a B.B.A in Finance, Investment & Banking and an M.S. in Finance. He holds the Chartered Financial Analyst designation and is a member of the CFA Institute.
Susi Budiman, CFA, Managing Director and Fixed Income Portfolio Manager
Prior to joining NWQ in 2006, Susi was Portfolio Manager for China Life Insurance Company, Ltd. in Taiwan. She managed US dollar and Euro denominated fixed income portfolios for insurance funds for six years with responsibility for assets of approximately $1.8 billion. Prior to the fixed income portfolio management position, Susi was a currency exchange sales associate at Fleet National Bank in Singapore covering Asian, Euro, UK and other major currencies.
Susi graduated from the University of British Columbia, Canada with a B.Com. in Finance and received her M.B.A. from the University of Southern California. She earned the designations of Financial Risk Manager in 2003, and Fellow, Life Management Institute in 2004. She earned her Chartered Financial Analyst designation from the CFA Institute in 2006 and is a member of the Los Angeles Society of Financial Analysts.
James Stephenson, CFA, Managing Director, Portfolio Manager, and Equity Analyst
Prior to joining NWQ in 2006, Mr. Stephenson spent seven years at Bel Air Investment Advisors, LLC, a State Street Global Advisors Company, where he was a Managing Director and Partner. Most recently, Mr. Stephenson was Chairman of the firm’s Equity Policy Committee and the Portfolio Manager for Bel Air’s Large Cap Core and Select strategies. Previous to this, he spent five years as an Analyst and Portfolio Manager at ARCO Investment Management Company. Prior to that, he was an Equity Analyst at Trust Company of the West. Mr. Stephenson received his B.B.A. and M.S. in Business from the University of Wisconsin-Madison, where he participated in the Applied Security Analysis Program. In addition, he earned the designation of Chartered Financial Analyst in 1993 and is a member of the CFA Institute and the Los Angeles Society of Financial Analysts.
Item 8(a)(2). OTHER ACCOUNTS MANAGED
| | Thomas Ray* | | Susi Budiman | | James
Stephenson | |
(a) RICs | | | | | | | |
Number of accts | | 4 | | 4 | | 2 | |
Assets ($000s) | | $ | 979 million | | $ | 979 million | | $ | 95 million | |
| | | | | | | |
(b) Other pooled accts | | | | | | | |
Non-performance fee accts | | | | | | | |
Number of accts | | 2 | | 2 | | 0 | |
Assets ($000s) | | $ | 59 million | | $ | 59 million | | 0 | |
| | | | | | | |
(c) Other | | | | | | | |
Non-performance fee accts | | | | | | | |
Number of accts | | 4,842 | ** | 4,842 | ** | 1 | |
Assets ($000s) | | $ | 1.80 billion | ** | $ | 1.80 billion | ** | $ | 1 million | |
Performance fee accts | | | | | | | |
Number of accts | | 0 | | 0 | | 0 | |
Assets ($000s) | | 0 | | 0 | | 0 | |
* As of January 6, 2015.
** Includes model-based accounts and assets.
POTENTIAL MATERIAL CONFLICTS OF INTEREST
Actual or perceived conflicts of interest may arise when a portfolio manager has day-to-day management responsibilities with respect to more than one account. More specifically, portfolio managers who manage multiple accounts are presented with the following potential conflicts, which are not intended to be an exhaustive list:
· The management of multiple accounts may result in a portfolio manager devoting unequal time and attention to the management of each account. NWQ seeks to manage such competing interests for the time and attention of the portfolio manager by utilizing investment models for the management of most investment strategies.
· If a portfolio manager identifies a limited investment opportunity which may be suitable for more than one account, an account may not be able to take full advantage of that opportunity due to an allocation of filled purchase or sale orders across all eligible accounts. To deal with these situations, NWQ has adopted procedures for allocating limited opportunities across multiple accounts.
· With respect to many of its clients’ accounts, NWQ determines which broker to utilize when placing orders for execution, consistent with its duty to seek to obtain best execution of the transaction. However, with respect to certain other accounts, NWQ may be limited by the client with respect to the selection of brokers or may be instructed to direct trades through a particular broker. In these cases, NWQ may place separate transactions for certain accounts which may temporarily affect the market price of the security or the execution of the transaction, or both, to the detriment of other accounts. NWQ seeks to minimize market impact by using its discretion in releasing orders in a manner which seeks to cause the least possible impact while keeping within the approximate price range of the discretionary block trade.
· Finally, the appearance of a conflict of interest may arise where NWQ has an incentive, such as a performance-based management fee, which relates to the management of some accounts, with respect to which the portfolio manager has day-to-day management responsibilities. NWQ periodically performs a comparative analysis of the performance between accounts with performance fees and those without performance fees.
NWQ has adopted certain compliance procedures which are designed to address these types of conflicts common among investment managers. However, there is no guarantee that such procedures will detect each and every situation in which a conflict arises.
Item 8(a)(3). FUND MANAGER COMPENSATION
NWQ offers a highly competitive compensation structure with the purpose of attracting and retaining the most talented investment professionals. These professionals are rewarded through a combination of cash and long-term incentive compensation as determined by the firm’s executive committee. Total cash compensation (TCC) consists of both a base salary and an annual bonus that can be a multiple of the base salary.
NWQ annually benchmarks TCC to prevailing industry norms with the objective of achieving competitive levels for all contributing professionals. In addition, Nuveen annually participates in the McLagan compensation survey, and regularly benchmarks employee salaries, bonus, and total cash levels to ensure it remains competitive.
Available bonus pool compensation is primarily a function of the firm’s overall annual profitability, and in the interest of employee and client interest alliance, NWQ’s bonus pool will be augmented should the firm outperform its benchmarks on a 1, 2 and 3 year basis. Individual bonuses are based primarily on the following:
· Overall performance of client portfolios
· Objective review of stock recommendations and the quality of primary research
· Subjective review of the professional’s contributions to portfolio strategy, teamwork, collaboration and work ethic
To further strengthen our incentive compensation package and to create an even stronger alignment to the long-term success of the firm, NWQ provides a number of other incentive opportunities through long-term employment contracts with senior executives, retention agreements, and an equity incentive plan with non-solicitation and non-compete provisions for participating employees. The equity incentive plan provides meaningful equity to employees which is similar to restricted stock and options and which vests over the next 5 to 7 years. Equity incentive plans allowing key employees of NWQ to participate in the firm’s growth over time have been in place since Nuveen’s acquisition of NWQ.
At NWQ, we believe that we are an employer of choice. Our analysts have a meaningful impact on the portfolio and, therefore, are compensated in a manner similar to portfolio managers at many other firms. Benefits besides compensation include a college tuition program for the children of all full-time employees whereby they are eligible for reimbursement of tuition and other mandatory fees, among others.
Item 8(a)(4). OWNERSHIP OF JTA SECURITIES AS OF DECEMBER 31, 2014
Name of Portfolio
Manager | | None | | $1 -
$10,000 | | $10,001
-
$50,000 | | $50,001-
$100,000 | | $100,001-
$500,000 | | $500,001-
$1,000,000 | | Over
$1,000,000 | |
Thomas Ray* | | X | | | | | | | | | | | | | |
Susi Budiman | | X | | | | | | | | | | | | | |
James Stephenson | | X | | | | | | | | | | | | | |
*As of January 6, 2015
ITEM 9. PURCHASES OF EQUITY SECURITIES BY CLOSED-END MANAGEMENT INVESTMENT COMPANY AND AFFILIATED PURCHASERS.
Not Applicable.
ITEM 10. SUBMISSION OF MATTERS TO A VOTE OF SECURITY HOLDERS.
There have been no material changes to the procedures by which shareholders may recommend nominees to the registrant’s Board implemented after the registrant last provided disclosure in response to this Item.
ITEM 11. CONTROLS AND PROCEDURES.
(a) | The registrant’s principal executive and principal financial officers, or persons performing similar functions, have concluded that the registrant’s disclosure controls and procedures (as defined in Rule 30a-3(c) under the Investment Company Act of 1940, as amended (the “1940 Act”) (17 CFR 270.30a-3(c))) are effective, as of a date within 90 days of the filing date of this report that includes the disclosure required by this paragraph, based on their evaluation of the controls and procedures required by Rule 30a-3(b) under the 1940 Act (17 CFR 270.30a-3(b)) and Rules 13a-15(b) or 15d-15(b) under the Securities Exchange Act of 1934, as amended (the “Exchange Act”) (17 CFR 240.13a-15(b) or 240.15d-15(b)). |
| |
(b) | There were no changes in the registrant’s internal control over financial reporting (as defined in Rule 30a-3(d) under the 1940 Act (17 CFR 270.30a-3(d)) that occurred during the second fiscal quarter of the period covered by this report that has materially affected, or is reasonably likely to materially affect, the registrant’s internal control over financial reporting. |
ITEM 12. EXHIBITS.
File the exhibits listed below as part of this Form.
(a)(1) Any code of ethics, or amendment thereto, that is the subject of the disclosure required by Item 2, to the extent that the registrant intends to satisfy the Item 2 requirements through filing of an exhibit: Not applicable because the code is posted on registrant’s website at www.nuveen.com/CEF/Shareholder/FundGovernance.aspx and there were no amendments during the period covered by this report. (To view the code, click on Code of Conduct.)
(a)(2) A separate certification for each principal executive officer and principal financial officer of the registrant as required by Rule 30a-2(a) under the 1940 Act (17 CFR 270.30a-2(a)) in the exact form set forth below: Ex-99.CERT Attached hereto.
(a)(3) Any written solicitation to purchase securities under Rule 23c-1 under the 1940 Act (17 CFR 270.23c-1) sent or given during the period covered by the report by or on behalf of the registrant to 10 or more persons. Not applicable.
(b) If the report is filed under Section 13(a) or 15(d) of the Exchange Act, provide the certifications required by Rule 30a-2(b) under the 1940 Act (17 CFR 270.30a-2(b)); Rule 13a-14(b) or Rule 15d-14(b) under the Exchange Act (17 CFR 240.13a-14(b) or 240.15d-14(b)), and Section 1350 of Chapter 63 of Title 18 of the United States Code (18 U.S.C. 1350) as an exhibit. A certification furnished pursuant to this paragraph will not be deemed “filed” for purposes of Section 18 of the Exchange Act (15 U.S.C. 78r), or otherwise subject to the liability of that section. Such certification will not be deemed to be incorporated by reference into any filing under the Securities Act of 1933 or the Exchange Act, except to the extent that the registrant specifically incorporates it by reference. Ex-99.906 CERT attached hereto.
SIGNATURES
Pursuant to the requirements of the Securities Exchange Act of 1934 and the Investment Company Act of 1940, the registrant has duly caused this report to be signed on its behalf by the undersigned, thereunto duly authorized.
(Registrant) Nuveen Tax-Advantaged Total Return Strategy Fund
By (Signature and Title) | /s/ Kevin J. McCarthy | |
| Kevin J. McCarthy | |
| Vice President and Secretary | |
Date: March 6, 2015
Pursuant to the requirements of the Securities Exchange Act of 1934 and the Investment Company Act of 1940, this report has been signed below by the following persons on behalf of the registrant and in the capacities and on the dates indicated.
By (Signature and Title) | /s/ Gifford R. Zimmerman | |
| Gifford R. Zimmerman | |
| Chief Administrative Officer | |
| (principal executive officer) | |
Date: March 6, 2015
By (Signature and Title) | /s/ Stephen D. Foy | |
| Stephen D. Foy | |
| Vice President and Controller | |
| (principal financial officer) | |
Date: March 6, 2015