UNITED STATES
SECURITIES AND EXCHANGE COMMISSION
Washington, D.C. 20549
FORM N-CSR
CERTIFIED SHAREHOLDER REPORT OF REGISTERED
MANAGEMENT INVESTMENT COMPANIES
Investment Company Act file number | 811-21471 |
|
Nuveen Tax-Advantaged Total Return Strategy Fund |
(Exact name of registrant as specified in charter) |
|
Nuveen Investments 333 West Wacker Drive Chicago, IL 60606 |
(Address of principal executive offices) (Zip code) |
|
Kevin J. McCarthy Nuveen Investments 333 West Wacker Drive Chicago, IL 60606 |
(Name and address of agent for service) |
|
Registrant’s telephone number, including area code: | (312) 917-7700 | |
|
Date of fiscal year end: | December 31 | |
|
Date of reporting period: | December 31, 2011 | |
| | | | | | |
Form N-CSR is to be used by management investment companies to file reports with the Commission not later than 10 days after the transmission to stockholders of any report that is required to be transmitted to stockholders under Rule 30e-1 under the Investment Company Act of 1940 (17 CFR 270.30e-1). The Commission may use the information provided on Form N-CSR in its regulatory, disclosure review, inspection, and policymaking roles.
A registrant is required to disclose the information specified by Form N-CSR, and the Commission will make this information public. A registrant is not required to respond to the collection of information contained in Form N-CSR unless the Form displays a currently valid Office of Management and Budget (“OMB”) control number. Please direct comments concerning the accuracy of the information collection burden estimate and any suggestions for reducing the burden to Secretary, Securities and Exchange Commission, 450 Fifth Street, NW, Washington, DC 20549-0609. The OMB has reviewed this collection of information under the clearance requirements of 44 U.S.C. ss. 3507.
ITEM 1. REPORTS TO SHAREHOLDERS

Closed-End Funds
Nuveen Investments
Closed-End Funds
Seeks Opportunities for Capital Appreciation and Tax-Advantaged Distributions
from a Portfolio of Value Equities and Senior Loans
Annual Report
December 31, 2011

Nuveen Tax-Advantaged
Total Return Strategy
Fund
JTA

LIFE IS COMPLEX.
Nuveen makes things e-simple.
It only takes a minute to sign up for e-Reports. Once enrolled, you'll receive an e-mail as soon as your Nuveen Fund information is ready. No more waiting for delivery by regular mail. Just click on the link within the e-mail to see the report and save it on your computer if you wish.
Free e-Reports right to your e-mail!
www.investordelivery.com
If you receive your Nuveen Fund distributions and statements from your financial advisor or brokerage account.
OR
www.nuveen.com/accountaccess
If you receive your Nuveen Fund distributions and statements directly from Nuveen.

Table of Contents
| Chairman's Letter to Shareholders | | | 4 | | |
|
| Portfolio Managers' Comments | | | 5 | | |
|
| Fund Leverage and Other Information | | | 10 | | |
|
| Common Share Distribution and Price Information | | | 13 | | |
|
| Performance Overview | | | 16 | | |
|
| Report of Registered Public Independent Accounting Firm | | | 17 | | |
|
| Portfolio of Investments | | | 18 | | |
|
| Statement of Assets & Liabilities | | | 24 | | |
|
| Statement of Operations | | | 25 | | |
|
| Statement of Changes in Net Assets | | | 26 | | |
|
| Statement of Cash Flows | | | 27 | | |
|
| Financial Highlights | | | 28 | | |
|
| Notes to Financial Statements | | | 30 | | |
|
| Board Members & Officers | | | 40 | | |
|
| Reinvest Automatically Easily and Conveniently | | | 45 | | |
|
| Glossary of Terms Used in this Report | | | 47 | | |
|
| Additional Fund Information | | | 51 | | |
|
Chairman's
Letter to Shareholders

Dear Shareholders,
These are perplexing times for investors. The global economy continues to struggle. The solutions being implemented in the eurozone to deal with the debt crises of many of its member countries are not yet seen as sufficient by the financial markets. The political paralysis in the U.S. has prevented the compromises necessary to deal with the fiscal imbalance and government spending priorities. The efforts by individual consumers, governments and financial institutions to reduce their debts are increasing savings but reducing demand for the goods and services that drive employment. These developments are undermining the rebuilding of confidence by consumers, corporations and investors that is so essential to a resumption of economic growth.
Although it is painfully slow, progress is being made. In Europe, the turnover of a number of national governments reflects the realization by politicians and voters alike that leaders who practiced business as usual had to be replaced by leaders willing to face problems and accept the hard choices needed to resolve them. The recent coordinated efforts by central banks in the U.S. and Europe to provide liquidity to the largest European banks indicates that these monetary authorities are committed to facilitating a recovery in the European banking sector.
In the U.S., the failure of the congressionally appointed Debt Reduction Committee was a blow to those who hoped for a bipartisan effort to finally begin addressing the looming fiscal crisis. Nevertheless, Congress and the administration cannot ignore the issue for long. The Bush era tax cuts are scheduled to expire on December 31, 2012, and six months later the $1.2 trillion of mandatory across-the-board spending cuts under the Budget Control Act of 2011 begin to go into effect. Any legislative modification would require bipartisan support and the prospects for a bipartisan solution are unclear. The impact of these two developments would be a mixed blessing: a meaningful reduction in the annual budget deficit at the cost of slowing the economic recovery.
It is in these particularly volatile markets that professional investment management is most important. Skillful investment teams who have experienced challenging markets and remain committed to their investment disciplines are critical to the success of an investor's long-term objectives. In fact, many long-term investment track records are built during challenging markets when managers are able to protect investors against these economic crosscurrents. Experienced investment teams know that volatile markets put a premium on companies and investment ideas that will weather the short-term volatility and that compelling values and opportunities are opened up when markets overreact to negative developments. By maintaining appropriate time horizons, diversification and relying on practiced investment teams, we believe that investors can achieve their long-term investment objectives.
As always, I encourage you to contact your financial consultant if you have any questions about your investment in a Nuveen Fund. On behalf of the other members of your Fund Board, we look forward to continuing to earn your trust in the months and years ahead.
Sincerely,

Robert P. Bremner
Chairman of the Board
February 22, 2012
Nuveen Investments
4
Portfolio Managers' Comments
Certain statements in this report are forward-looking statements. Discussions of specific investments are for illustration only and are not intended as recommendations of individual investments. The forward-looking statements and other views expressed herein are those of the portfolio managers as of the date of this report. Actual future results or occurrences may differ significantly from those anticipated in any forward-looking statements and the views expressed herein are subject to change at any time, due to numerous market and other factors. The Fund disclaims any obligation to update publicly or revise any forward-looking statements or views expressed herein.
Ratings shown are the highest rating given by one of the following national rating agencies: Standard & Poor's Group, Moody's Investors Service, Inc. or Fitch, Inc. Credit ratings are subject to change. AAA, AA, A, and BBB are investment grade ratings; BB, B, CCC, CC, C and D are below investment grade ratings. Certain bonds backed by U.S. Government or agency securities are regarded as having an implied rating equal to the rating of such securities. Holdings designated N/R are not rated by a national rating agency.
Nuveen Tax-Advantaged Total Return Strategy Fund (JTA)
The Fund features management by two affiliates of Nuveen Investments. The Fund's investments in dividend-paying common and preferred stocks are managed by NWQ Investment Management Company, LLC (NWQ), while the Fund's investments in senior corporate loans and other debt instruments are managed by Symphony Asset Management LLC (Symphony).
Jon Bosse, Chief Investment Officer of NWQ, leads the Fund's management team at that firm. He has approximately 30 years of corporate finance and investment management experience.
The Symphony team is led by Gunther Stein, who serves as that firm's Chief Investment Officer. Gunther has more than 20 years of investment management experience, much of it in evaluating and purchasing senior corporate loans and other high-yield debt.
Here Jon and Gunther talk about general economic and market conditions, their management strategies and the performance of the Fund for twelve-month period ended December 31, 2011.
What were the general market conditions for the reporting period?
During this period, the U.S. economy continued to recover from the recent recession, but progress remained slow. The country's gross domestic product (GDP) grew in 2011, but at a slower rate than in 2010 (1.7% vs. 3.0%). The unemployment picture showed some improvement, with the national unemployment rate standing at 8.5% as of December 2011, compared with 9.4% one year earlier. However, the housing market continued to be a weak spot. For the twelve months ended November 2011 (the most recent data available at the time this report was prepared), the average home price in the Standard & Poor's (S&P)/Case-Shiller Index lost 1.3%, with 18 of the 20 major metropolitan areas reporting lower values. In addition, the U.S. economic picture continued to be clouded by concerns about the European debt crisis and efforts to reduce the federal deficit.
In an attempt to improve the overall economic environment, the Federal Reserve (Fed) continued to hold the benchmark fed funds rate at the record low level of zero to 0.25% that it had established in December 2008. In January 2012 (following the end of this reporting period), the central bank stated that economic conditions would likely warrant maintaining this low rate through 2014. The Fed also implemented a program to extend the average maturity of its U.S. Treasury holdings by purchasing $400 billion of these securities with maturities of six to thirty years and selling an equal amount of U.S. Treasury securities with maturities of three years or less. The goals of this program, which
Nuveen Investments
5
the Fed expects to complete by the end of June 2012, are to lower longer-term interest rates, support a stronger economic recovery and help ensure that inflation remains at levels consistent with the Fed's mandates of maximum employment and price stability.
The U.S. equity markets experienced periods of extreme volatility over the twelve-month reporting period, and posted mixed results for the full year. The Dow Jones Industrial Average gained 8.38% in 2011, and the broader S&P 500 Index ended the year up 2.11%. The NASDAQ Composite Index finished in the red, slipping 0.83% during 2011.
What key strategies were used to manage the Fund during this reporting period?
The Fund is designed to seek a high level of after-tax total return consisting primarily of tax-advantaged dividend income and capital appreciation. In an effort to achieve this, the Fund invests primarily in common stocks whose dividends may be eligible for favorable income tax treatment. The Fund also invests to a more limited extent in preferred stocks that are eligible to pay tax-advantaged dividends, as well as in senior loans and other debt instruments.
For the common and preferred equity portion of the Fund's portfolio, we continued to employ an opportunistic, bottom-up strategy that focused on identifying undervalued companies possessing favorable risk/reward characteristics as well as what we thought were emerging catalysts that could unlock value or improve profitability. These catalysts included management changes, restructuring efforts, recognition of hidden assets, or a positive change in the underlying fundamentals. We also focused on downside risk management and paid a great deal of attention to a company's balance sheet and cash flow statement, not just the income statement. We believed that cash flow analysis offered a more objective and truer picture of a company's financial position than an evaluation based on earnings alone.
During this period, we also wrote (sold) covered call options on individual stocks held in the Fund's portfolio to enhance returns while foregoing some upside potential of its equity portfolio.
In the senior loan and other debt portion of the Fund's portfolio, we continued to position the portfolio conservatively with senior loans and similar assets. During the second half of 2011, the senior loan market experienced significant volatility following Federal Reserve comments suggesting that interest rates would remain low. This made floating rate loans generally less attractive to retail buyers, despite the fact that current yields remain above historical averages and we believe in the consensus view that default risk remains quite low. Despite significant volatility in August, the senior loan market finished the year on a positive note. While prices have not reacted to a general rally in risk assets, overall market prices have stabilized.
Nuveen Investments
6
Past performance is not predictive of future results. Current performance may be higher or lower than the data shown. Returns do not reflect the deduction of taxes that shareholders may have to pay on Fund distributions or upon the sale of Fund shares.
For additional information, see the Performance Overview page in this report.
* Refer to Glossary of Terms Used in this Report for definitions.
How did the Fund perform over this period?
The performance of the Fund, as well as for a comparative benchmark and index, is presented in the accompanying table.
Average Annual Total Returns on Common Share Net Asset Value
For periods ended 12/31/11
| | | 1-Year | | 5-Year | |
| JTA | | | -3.87 | % | | | -8.15 | % | |
| Comparative Benchmark* | | | -0.07 | % | | | -1.31 | % | |
| S&P 500 Index* | | | 2.11 | % | | | -0.25 | % | |
For the twelve-month period ended December 31, 2011, the total return on common share net asset value (NAV) for the Fund underperformed its comparative benchmark and the general market index. Despite the comparatively weak return, several portfolio investments appreciated during the year, given depressed initial valuations and individual catalysts. Holdings worth highlighting include Motorola Mobility, CVS Caremark, Pfizer, and Philip Morris International. Motorola Mobility received an all cash takeover offer from Google Inc. at $40 per share, which represented a 63% premium to the stock's previous day closing price. The catalyst for the acquisition was Motorola's extensive patent portfolio, which Google plans to use to protect its Android franchise. We had increased our position in Motorola Mobility in March 2011 based on valuation given the attractiveness of its patent portfolio, and subsequently eliminated the entire position after the acquisition was announced.
CVS Caremark Corp. outperformed in our view and we believe the company is well-positioned to have another strong selling season in its Caremark pharmacy benefit manager, given dislocations caused by the proposed merger of its competitors Express Scripts and Medco. Additionally, we expect the company will deliver attractive growth in the second half of 2012 from ongoing streamlining benefits and a sequential ramp in profitability as several blockbuster drugs such as Lipitor, Lexapro, Seroquel, and Plavix go generic.
Pfizer Inc. outperformed as the company has been active in addressing ongoing and future challenges by shaking up its management team, stabilizing its core earnings, and beginning the process of divesting several divisions. We trimmed our position in Philip Morris International Inc. after yet another year of significant outperformance brought its valuation to levels where we believed that the stock's risk/reward profile had become less compelling.
In general, many of the Fund's holdings struggled during the period due to tough market conditions and investor skittishness. In particular, stocks of large multi-national banks, including Citigroup, have continued to be pressured by concerns such as the European debt crisis, ongoing implementation of new regulations, and overall weak capital markets and trading environment. For the banking sector, although economic uncertainty and the low interest rate environment continues to weigh on the group, many operating metrics continue to strengthen as capital and reserve levels are near all-time highs and loan growth is emerging. We continue to like our bank holdings given gradually improving fundamentals, extremely low expectations, and valuations that are well below historical
Nuveen Investments
7
levels. Despite stability in its life insurance and international mortgage insurance divisions, Genworth Financial declined as its U.S. mortgage insurance business struggled given the lingering softness in the housing market. Genworth is on track for a partial IPO of its Australian mortgage insurance business in the first half of 2012, with proceeds that could be used for debt repayment or share buyback. We believe there is an increasing sense of urgency by management to address the company's business mix, balance sheet, and financial flexibility to increase shareholder value. The company has recently taken action to monetize additional assets as well. General Motors declined as the company provided cautious guidance due to struggles with restructuring efforts at its European and Brazilian operations. While GM Europe remains a challenge as weak demand and structural overcapacity are pressuring margins, a new product lineup coming out in 2013 that will replace the GMT900 truck platform looks very promising. Overall, we believe the GM investment case remains attractive as the company has a healthy balance sheet and is well positioned in emerging markets, particularly China.
We purchased Cisco Systems, as we believed the share price discounted lower future operating margins and gave little value to the company's core franchise or management's ability to successfully restructure its businesses. With a cash rich balance sheet and 9% adjusted free cash flow yield, we felt that shares of Cisco offer potential upside through stock repurchases, increased dividends, and successful reorganization and product repositioning efforts. We purchased Goldman Sachs as we do not believe financial regulatory reform will meaningfully affect the company's future earnings power or its ability to grow its book value. The company has arguably the strongest global banking franchise. We also bought Interpublic Group of Companies, which provides advertising and marketing services worldwide. The company was plagued by accounting irregularities, as well as poor cost controls, following a series of acquisitions made over the years. A new management team has fixed the accounting issues and implemented controls and other important business systems for managing and monitoring costs.
We initiated a position in Paccar, the fifth largest manufacturer of medium and heavy trucks worldwide. Historically, the company has been recognized for its premium brands (DAF, Kenworth, Peterbilt) and stronger profitability. The stock has been pressured by declining incremental margins, causing investors to question the structural profitability of the firm. We believe profitability remains intact given an expected truck replacement cycle due to an aging in-force fleet as well as recent cost reductions and restructuring efforts. Talisman Energy was purchased on price weakness that was brought on by lowered production results due to short-term operational issues at its Yme project in the North Sea. We believe that the company continues to demonstrate solid execution on many key projects and that its valuation does not reflect its resource potential, both in shale gas and international exploration. We also purchased Teva Pharmaceutical Industries, which we think is well-positioned to benefit from the upcoming wave of major branded drugs with expiring patents. Also added to the portfolio during the year were JP Morgan, Lincoln National, National CineMedia, Nielsen Holdings, and Viacom.
During the period we tendered 85% of our Amgen stock in a Dutch auction at $60 per share, and sold the remaining shares shortly thereafter. Although we believe Amgen has an attractive valuation with a solid drug pipeline that includes denosumab for the
Nuveen Investments
8
treatment of bone loss, the company faces a number of regulatory and competitive headwinds going forward that caused us to be more cautious. Kroger Co. was eliminated on concerns that the supermarket group will be unable to pass through upcoming food price inflation as consumers simultaneously digest higher gas prices and a sluggish employment outlook. Kimberly-Clark Corp. was sold based on valuation and concerns stemming from the announced restructuring of its pulp and paper operations. We eliminated defense contractor Lockheed Martin on concerns that reductions in defense spending by the U.S. government will result in margin headwinds. We exited Valeant Pharmaceutical International following significant appreciation as investors became more comfortable with the company's business model and the sustainability of its growth prospects. Hewlett Packard, ENI SPA., Nucor Corp, Packaging Corp. of America, and Union Pacific were also sold as we felt the risk/reward for continuing to own the stocks was no longer attractive.
During the reporting period, the preferred sleeve of the Fund slightly detracted from performance. Our holdings in the banking sector contributed to this underperformance. In particular, Bank of America, US Bancorp, and HSBC issues were among the largest detractors for the period. Additionally, an Allianz issue in the insurance sector was also one of the largest detractors for the period.
The senior loan portion of the Fund benefited during the month of August from a positioning in lower volatility names, many of which have lower leverage and less cyclicality to their businesses than the overall market. Generally speaking, having a higher quality portfolio during the period helped performance, as mutual funds continued to favor higher quality more liquid assets as volatility remained high and outflows within the senior loan asset class persisted. We have continued to favor new issue within this market, which have generally performed well but have not kept pace with lower quality issues in the secondary market. Positions such as Go Daddy and Federal Mogul continue to provide attractive yield with lower overall risk than the market and have performed well throughout the volatile period.
Nuveen Investments
9
Fund Leverage
and Other Information
IMPACT OF THE FUND'S LEVERAGE STRATEGY ON PERFORMANCE
One important factor impacting the return of the Fund relative to its benchmarks was the Fund's use of financial leverage through the use of bank borrowings. The Fund uses leverage because its managers believe that, over time, leveraging provides opportunities for additional income and total return for common shareholders. However, use of leverage also can expose common shareholders to additional volatility. For example, as the prices of securities held by the Fund decline, the negative impact of these valuation changes on common share net asset value and common shareholder total return is magnified by the use of leverage. Conversely, leverage may enhance common share returns during periods when the prices of securities held by the Fund generally are rising. Leverage had a positive impact on the performance of the Fund over this reporting period. During the period, the Fund entered into interest rate swap contracts to partially fix the interest cost of the Fund's leverage. This activity detracted modestly from the overall positive impact of leverage, as rates declined slightly while the position was in place, meaning it would have been better had the interest rates of the leverage floated rather than being partially fixed in the period.
RECENT DEVELOPMENTS REGARDING THE FUND'S REDEMPTION OF AUCTION RATE PREFERRED SHARES
Shortly after its inception, the Fund issued auction rate preferred shares (ARPS) to create leverage. As noted in past shareholder reports, the weekly auctions for those ARPS shares began in February 2008 to consistently fail, causing the Fund to pay the so called "maximum rate" to ARPS shareholders under the terms of the ARPS in the Fund's charter documents. The Fund redeemed its ARPS at par in 2009 and since then has relied upon bank borrowings to create effective leverage.
During 2010 and 2011, certain Nuveen leveraged closed-end funds (not including this Fund) received a demand letter from a law firm on behalf of purported holders of common shares of each such fund, alleging that Nuveen and the funds' officers and Board of Directors/Trustees breached their fiduciary duties related to the redemption at par of the funds' ARPS. In response, the Board established an ad hoc Demand Committee consisting of certain of its disinterested and independent Board members to investigate the claims. The Demand Committee retained independent counsel to assist it in conducting an extensive investigation. Based upon its investigation, the Demand Committee found that it was not in the best interests of each fund or its shareholders to take the actions suggested in the demand letters, and recommended that the full Board
Nuveen Investments
10
reject the demands made in the demand letters. After reviewing the findings and recommendation of the Demand Committee, the full Board of each fund unanimously adopted the Demand Committee's recommendation.
Subsequently, the funds that received demand letters were named in a consolidated complaint as nominal defendants in a putative shareholder derivative action captioned Martin Safier, et al. v. Nuveen Asset Management, et al. that was filed in the Circuit Court of Cook County, Illinois, Chancery Division (the "Cook County Chancery Court") on February 18, 2011 (the "Complaint"). The Complaint, filed on behalf of purported holders of each fund's common shares, also named Nuveen Fund Advisors, Inc. as a defendant, together with current and former Officers and interested Directors/Trustees of each of the funds (together with the nominal defendants, collectively, the "Defendants"). The Complaint contained the same basic allegations contained in the demand letters. The Defendants filed a motion to dismiss the suit and on December 16, 2011, the court granted that motion dismissing the Complaint. The plaintiffs failed to file an appeal of the court's decision within the required time period, resulting in the final disposition of the suit.
RISK CONSIDERATIONS
Fund shares are not guaranteed or endorsed by any bank or other insured depository institution, and are not federally insured by the Federal Deposit Insurance Corporation. Past performance is no guarantee of future results. Fund common shares are subject to a variety of risks, including:
Investment Risk. The possible loss of the entire principal amount that you invest.
Price Risk. Shares of closed-end investment companies like the Fund frequently trade at a discount to their NAV. Your common shares at any point in time may be worth less than your original investment, even after taking into account the reinvestment of Fund dividends and distributions.
Leverage Risk. The Fund's use of leverage creates the possibility of higher volatility for the Fund's per share NAV, market price, distributions and returns. There is no assurance that a Fund's leveraging strategy will be successful.
Tax Risk. The tax treatment of Fund distributions may be affected by new IRS interpretations of the Internal Revenue Code and future changes in tax laws and regulations. This is particularly true for funds employing a managed distribution program.
Common Stock Risk. Common stock returns often have experienced significant volatility.
Issuer Credit Risk. This is the risk that a security in the Fund's portfolio will fail to make dividend or interest payments when due.
Illiquid Securities Risk. This is the risk that the Fund may not be able to sell securities in its portfolio at the time or price desired by the Fund.
Below-Investment Grade Risk. Investments in securities below investment grade quality are predominantly speculative and subject to greater volatility and risk of default.
Nuveen Investments
11
Unrated Investment Risk. In determining whether an unrated security is an appropriate investment for the Fund, the manager will consider information from industry sources, as well as its own quantitative and qualitative analysis, in making such a determination. However, such a determination by the manager is not the equivalent of a rating by a rating agency.
Dividend Income Risk. There is no guarantee that the issuers of common stocks in which the Fund invests will declare dividends in the future or that, if declared, they will remain at current levels or increase over time.
Risks from Unsecured Adjustable Rate Loans or Insufficient Collateral Securing Adjustable Rate Loans. Some of the adjustable rate loans in which the Fund may invest will be unsecured or insufficiently collateralized, thereby increasing the risk of loss to the Fund in the event of issuer default.
Value Stock Risks. Value stocks are securities that the portfolio manager believes to be undervalued, or mispriced. If the manager's assessment of a company's prospects is wrong, the price of the company's common stock or other equity securities may fall, or may not approach the value that the manager has placed on them.
Nuveen Investments
12
Common Share Distribution
and Price Information
Distribution Information
The following information regarding the Fund's distributions is current as of December 31, 2011, and likely will vary over time based on the Fund's investment activities and portfolio investment changes.
During the twelve-month reporting period, the Fund reduced its quarterly distribution to common shareholders in September. Some of the important factors affecting the amount and composition of these distributions are summarized below.
The Fund employs financial leverage through the use of bank borrowings. Financial leverage provides the potential for higher earnings (net investment income), total returns and distributions over time, but also increases the variability of common shareholders' net asset value per share in response to changing market conditions.
The Fund has a managed distribution program. The goal of this program is to provide common shareholders relatively consistent and predictable cash flow by systematically converting the Fund's expected long-term return potential into regular distributions. As a result, regular distributions throughout the year are likely to include a portion of expected long-term gains (both realized and unrealized), along with net investment income.
Important points to understand about the managed distribution program are:
• The Fund seeks to establish a relatively stable common share distribution rate that roughly corresponds to the projected total return from its investment strategy over an extended period of time. However, you should not draw any conclusions about the Fund's past or future investment performance from its current distribution rate.
• Actual common share returns will differ from projected long-term returns (and therefore the Fund's distribution rate), at least over shorter time periods. Over a specific timeframe, the difference between actual returns and total distributions will be reflected in an increasing (returns exceed distributions) or a decreasing (distributions exceed returns) Fund net asset value.
• Each distribution is expected to be paid from some or all of the following sources:
• net investment income (regular interest and dividends),
• realized capital gains, and
• unrealized gains, or, in certain cases, a return of principal (non-taxable distributions).
• A non-taxable distribution is a payment of a portion of the Fund's capital. When the Fund's returns exceed distributions, it may represent portfolio gains generated, but
Nuveen Investments
13
** The Fund elected to retain a portion of its realized long-term capital gains for the tax years ended December 31, 2007 and December 31, 2006, and pay required federal corporate income taxes on these amounts. As reported on Form 2439, Common shareholders on record date must include their pro-rata share of these gains on their applicable federal tax returns, and are entitled to take offsetting tax credits, for their pro-rata share of the taxes paid by the Fund. The total returns "Including retained gain tax credit/refund" include the economic benefit to Common shareholders on record date of these tax credits/refunds. The Fund had no retained capital gains for the tax years ended December 31, 2011 through December 31, 2008 or for the tax years ended prior to December 31, 2006.
not realized as a taxable capital gain. In periods when the Fund's returns fall short of distributions, the shortfall will represent a portion of your original principal, unless the shortfall is offset during other time periods over the life of your investment (previous or subsequent) when the Fund's total return exceeds distributions.
• Because distribution source estimates are updated during the year based on the Fund's performance and forecast for its current fiscal year (which is the calendar year for the Fund), these estimates may differ from both the tax information reported to you in your Fund's IRS Form 1099 statement provided at year end, as well as the ultimate economic sources of distributions over the life of your investment.
The following table provides information regarding the Fund's common share distributions and total return performance for the fiscal year ended December 31, 2011. This information is intended to help you better understand whether the Fund's returns for the specified time period were sufficient to meet the Fund's distributions.
| As of 12/31/11 (Common Shares) | | JTA | |
| Inception date | | 1/27/04 | |
| Fiscal year (calendar year) ended December 31, 2011: | |
| Per share distribution: | |
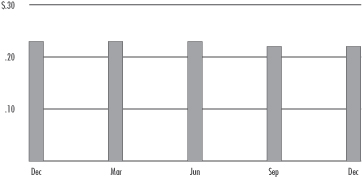
| From net investment income | | $ | 0.40 | | |
| From long-term capital gains | | | 0.00 | | |
| From short-term capital gains | | | 0.00 | | |
| Return of capital | | | 0.50 | | |
| Total per share distribution | | $ | 0.90 | | |
| Distribution rate on NAV | | | 8.20 | % | |
| Average annual total returns: | |
| Excluding retained gain tax credit/refund**: | |
| 1-Year on NAV | | | -3.87 | % | |
| 5-Year on NAV | | | -8.15 | % | |
| Since inception on NAV | | | 0.80 | % | |
| Including retained gain tax credit/refund**: | |
| 1-Year on NAV | | | -3.87 | % | |
| 5-Year on NAV | | | -7.42 | % | |
| Since inception on NAV | | | 1.20 | % | |
The qualified dividend income provisions of the federal tax code are set to expire on December 31, 2012. In the event that Congress does not further extend (or make permanent) these provisions, beginning in calendar 2013, dividends previously referred to as "qualified dividends" would be taxed at normal marginal tax rates.
Nuveen Investments
14
Common Share Repurchases and Price Information
As of December 31, 2011, and since the inception of the Fund's repurchase program, the Fund has cumulatively repurchased and retired common shares as shown in the accompanying table.
Common Shares
Repurchased and Retired | | % of Outstanding
Common Shares | |
| | 109,762 | | | | 0.8 | % | |
During the twelve-month reporting period, the Fund repurchased and retired shares at a weighted average price and a weighted average discount per share as shown in the accompanying table.
Common Shares
Repurchased and Retired | | Weighted Average Price
Per Common Share
Repurchased and Retired | | Weighted Average Discount
Per Common Share
Repurchased and Retired | |
| | 30,062 | | | $ | 9.43 | | | | 14.39 | % | |
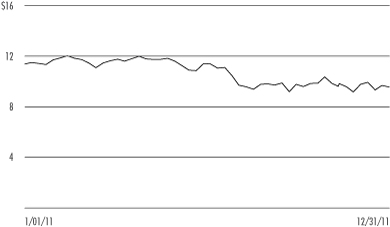
As of December 31, 2011, the Fund's common share price was trading at a discount of -12.85% to its NAV, compared with an average discount of -9.67% for the entire twelve-month period.
Nuveen Investments
15
Fund Snapshot
| Common Share Price | | $ | 9.56 | | |
| Common Share Net Asset Value (NAV) | | $ | 10.97 | | |
| Premium/(Discount) to NAV | | | -12.85 | % | |
| Current Distribution Rate1 | | | 9.21 | % | |
Net Assets Applicable to
Common Shares ($000) | | $ | 151,890 | | |
Leverage
| Regulatory Leverage | | | 30.89 | % | |
| Effective Leverage | | | 30.89 | % | |
Portfolio Composition
(as a % of total investments)2,3
| Pharmaceuticals | | | 13.4 | % | |
| Insurance | | | 10.9 | % | |
| Media | | | 10.5 | % | |
| Oil, Gas & Consumable Fuels | | | 6.5 | % | |
| Software | | | 5.5 | % | |
| Diversified Financial Services | | | 4.5 | % | |
| Metals & Mining | | | 4.1 | % | |
| Communications Equipment | | | 3.2 | % | |
| Hotels, Restaurants & Leisure | | | 2.9 | % | |
| Machinery | | | 2.7 | % | |
| Commercial Banks | | | 2.6 | % | |
| Electric Utilities | | | 2.5 | % | |
| Health Care Providers & Services | | | 2.3 | % | |
| Food & Staples Retailing | | | 2.2 | % | |
| Wireless Telecommunication Services | | | 2.1 | % | |
| Short-Term Investments | | | 4.5 | % | |
| Other | | | 19.6 | % | |
Average Annual Total Returns
(Inception 1/27/04)
| | | On Share Price | | On NAV | |
| 1-Year | | | -7.48 | % | | | -3.87 | % | |
| 5-Year | | | -10.66 | % | | | -8.15 | % | |
| Since Inception | | | -0.86 | % | | | 0.80 | % | |
Average Annual Total Returns4
(Including retained gain tax credit/refund)
| | | On Share Price | | On NAV | |
| 1-Year | | | -7.48 | % | | | 3.87 | % | |
| 5-Year | | | -9.86 | % | | | -7.42 | % | |
| Since Inception | | | -0.42 | % | | | 1.20 | % | |
JTA
Performance
OVERVIEW
(Unaudited)
Nuveen Tax-Advantaged Total Return Strategy Fund
December 31, 2011
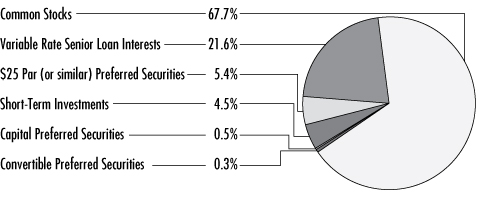
Portfolio Allocation (as a % of total investments)2,3
2010-2011 Distributions Per Common Share
Share Price Performance — Weekly Closing Price
Refer to the Glossary of Terms Used in this Report for further definition of the terms used within this Fund's Performance Overview page.
1 Current Distribution Rate is based on the Fund's current annualized quarterly distribution divided by the Fund's current market price. The Fund's quarterly distributions to its shareholders may be comprised of ordinary income, net realized capital gains and, if at the end of the calendar year the Fund's cumulative net ordinary income and net realized gains are less than the amount of the Fund's distributions, a return of capital for tax purposes.
2 Excluding investments in derivatives.
3 Holdings are subject to change.
4 As previously explained in the Common Share Distribution and Price Information section of this report, the Fund elected to retain a portion of its realized long-term capital gains for the tax years ended December 31, 2007 and December 31, 2006, and pay required federal corporate income taxes on these amounts. These standardized total returns include the economic benefit to Common shareholders of record of this tax credit/refund. The Fund had no retained capital gains for the tax years ended December 31, 2011 through December 31, 2008 or for the tax years ended prior to December 31, 2006.
Nuveen Investments
16
Report of INDEPENDENT REGISTERED
PUBLIC ACCOUNTING FIRM
The Board of Trustees and Shareholders
Nuveen Tax-Advantaged Total Return Strategy Fund
We have audited the accompanying statement of assets and liabilities, including the portfolio of investments, of Nuveen Tax-Advantaged Total Return Strategy Fund (the "Fund") as of December 31, 2011, and the related statements of operations and cash flows for the year then ended, the statements of changes in net assets for each of the two years in the period then ended and the financial highlights for each of the five years in the period then ended. These financial statements and financial highlights are the responsibility of the Fund's management. Our responsibility is to express an opinion on these financial statements and financial highlights based on our audit.
We conducted our audit in accordance with the standards of the Public Company Accounting Oversight Board (United States). Those standards require that we plan and perform the audit to obtain reasonable assurance about whether the financial statements and financial highlights are free of material misstatement. We were not engaged to perform an audit of the Fund's internal control over financial reporting. Our audit included consideration of internal control over financial reporting as a basis for designing audit procedures that are appropriate in the circumstances, but not for the purpose of expressing an opinion on the effectiveness of the Fund's internal control over financial reporting. Accordingly, we express no such opinion. An audit also includes examining, on a test basis, evidence supporting the amounts and disclosures in the financial statements and financial highlights, assessing the accounting principles used and significant estimates made by management and evaluating the overall financial statement presentation. Our procedures included confirmation of securities owned as of December 31, 2011, by correspondence with the custodian, counterparty, selling or agent banks and brokers or by other appropriate auditing procedures where replies from selling or agent banks or brokers were not received. We believe that our audit provides a reasonable basis for our opinion.
In our opinion, the financial statements and financial highlights referred to above present fairly, in all material respects, the financial position of Nuveen Tax-Advantaged Total Return Strategy Fund at December 31, 2011, and the results of its operations and its cash flows for the year then ended, the changes in its net assets for each of the two years in the period then ended and the financial highlights for each of the five years in the period then ended in conformity with U.S. generally accepted accounting principles.

Chicago, Illinois
February 27, 2012
Nuveen Investments
17
JTA
Nuveen Tax-Advantaged Total Return Strategy Fund
Portfolio of Investments
December 31, 2011
| Shares | | Description (1) | | Value | |
| | | Common Stocks – 99.0% (67.7% of Total Investments) | |
| | | Aerospace & Defense – 2.6% | |
| | 80,000 | | | Raytheon Company | | $ | 3,870,400 | | |
| | | Automobiles – 1.7% | |
| | 124,400 | | | General Motors Company, (2) | | | 2,521,588 | | |
| | | Capital Markets – 1.2% | |
| | 20,000 | | | Goldman Sachs Group, Inc. | | | 1,808,600 | | |
| | | Commercial Banks – 2.7% | |
| | 150,900 | | | Wells Fargo & Company | | | 4,158,804 | | |
| | | Commercial Services & Supplies – 1.8% | |
| | 146,000 | | | Pitney Bowes Inc. | | | 2,706,840 | | |
| | | Communications Equipment – 4.7% | |
| | 229,000 | | | Cisco Systems, Inc. | | | 4,140,320 | | |
| | 65,585 | | | Motorola Solutions Inc. | | | 3,035,930 | | |
| | | Total Communications Equipment | | | 7,176,250 | | |
| | | Diversified Financial Services – 5.4% | |
| | 179,600 | | | Citigroup Inc. | | | 4,725,276 | | |
| | 102,000 | | | JPMorgan Chase & Co. | | | 3,391,500 | | |
| | | Total Diversified Financial Services | | | 8,116,776 | | |
| | | Diversified Telecommunication Services – 1.3% | |
| | 369,000 | | | Frontier Communications Corporation | | | 1,900,350 | | |
| | | Food & Staples Retailing – 2.1% | |
| | 78,000 | | | CVS Caremark Corporation | | | 3,180,840 | | |
| | | Industrial Conglomerates – 1.0% | |
| | 87,600 | | | General Electric Company | | | 1,568,916 | | |
| | | Insurance – 13.1% | |
| | 365,900 | | | Genworth Financial Inc., Class A, (2) | | | 2,396,645 | | |
| | 234,000 | | | Hartford Financial Services Group, Inc. | | | 3,802,500 | | |
| | 95,000 | | | Lincoln National Corporation | | | 1,844,900 | | |
| | 63,000 | | | Loews Corporation | | | 2,371,950 | | |
| | 135,900 | | | MetLife, Inc., (3) | | | 4,237,362 | | |
| | 177,444 | | | Symetra Financial Corporation | | | 1,609,417 | | |
| | 172,700 | | | Unum Group | | | 3,638,789 | | |
| | | Total Insurance | | | 19,901,563 | | |
| | | Machinery – 3.9% | |
| | 75,000 | | | Ingersoll Rand Company Limited, Class A | | | 2,285,250 | | |
| | 98,000 | | | PACCAR Inc. | | | 3,672,060 | | |
| | | Total Machinery | | | 5,957,310 | | |
Nuveen Investments
18
| Shares | | Description (1) | | Value | |
| | | Media – 10.0% | |
| | 286,000 | | | Interpublic Group Companies, Inc. | | $ | 2,782,780 | | |
| | 17,337 | | | Metro-Goldwyn-Mayer, (2), (4) | | | 353,964 | | |
| | 265,000 | | | National CineMedia, Inc. | | | 3,286,000 | | |
| | 140,400 | | | Time Warner Inc. | | | 5,074,056 | | |
| | 81,000 | | | Viacom Inc., Class B | | | 3,678,210 | | |
| | | Total Media | | | 15,175,010 | | |
| | | Metals & Mining – 6.0% | |
| | 112,300 | | | AngloGold Ashanti Limited, Sponsored ADR | | | 4,767,135 | | |
| | 97,200 | | | Barrick Gold Corporation | | | 4,398,300 | | |
| | | Total Metals & Mining | | | 9,165,435 | | |
| | | Oil, Gas & Consumable Fuels – 9.1% | |
| | 28,000 | | | Exxon Mobil Corporation | | | 2,373,280 | | |
| | 32,400 | | | Occidental Petroleum Corporation | | | 3,035,880 | | |
| | 337,000 | | | Talisman Energy Inc. | | | 4,296,750 | | |
| | 81,600 | | | Total S.A., Sponsored ADR | | | 4,170,576 | | |
| | | Total Oil, Gas & Consumable Fuels | | | 13,876,486 | | |
| | | Pharmaceuticals – 19.0% | |
| | 94,500 | | | GlaxoSmithKline PLC, ADR | | | 4,312,035 | | |
| | 111,700 | | | Merck & Company Inc. | | | 4,211,090 | | |
| | 410,000 | | | Pfizer Inc. | | | 8,872,400 | | |
| | 228,000 | | | Sanofi-Aventis, ADR | | | 8,331,120 | | |
| | 78,200 | | | Teva Pharmaceutical Industries Limited, Sponsored ADR | | | 3,156,152 | | |
| | | Total Pharmaceuticals | | | 28,882,797 | | |
| | | Professional Services – 1.0% | |
| | 52,200 | | | Nielsen Holdings BV, (2) | | | 1,549,818 | | |
| | | Software – 7.4% | |
| | 346,000 | | | CA Inc. | | | 6,994,390 | | |
| | 163,000 | | | Microsoft Corporation, (3) | | | 4,231,480 | | |
| | | Total Software | | | 11,225,870 | | |
| | | Tobacco – 1.9% | |
| | 37,600 | | | Philip Morris International | | | 2,950,848 | | |
| | | Wireless Telecommunication Services – 3.1% | |
| | 170,000 | | | Vodafone Group PLC, Sponsored ADR | | | 4,765,100 | | |
| | | Total Common Stocks (cost $148,267,810) | | | 150,459,601 | | |
| Shares | | Description (1) | | Coupon | | | | Ratings (5) | | Value | |
| | | Convertible Preferred Securities – 0.5% (0.3% of Total Investments) | |
| | | Commercial Banks – 0.5% | |
| | 700 | | | Wells Fargo & Company | | | 7.500 | % | | | | | | | A | | | $ | 737,800 | | |
| | | | | Total Convertible Preferred Securities (cost $635,761) | | | | | | | | | | | | | | | 737,800 | | |
| Shares | | Description (1) | | Coupon | | | | Ratings (5) | | Value | |
| | | $25 Par (or similar) Preferred Securities – 7.8% (5.4% of Total Investments) | |
| | | Commercial Banks – 0.2% | |
| | 500 | | | HSBC Holdings PLC | | | 8.000 | % | | | | | | A+ | | $ | 13,030 | | |
| | 420 | | | U.S. Bancorp. | | | 3.500 | % | | | | | | | A | | | | 301,560 | | |
| | | Total Commercial Banks | | | | | | | | | | | | | | | 314,590 | | |
Nuveen Investments
19
JTA
Nuveen Tax-Advantaged Total Return Strategy Fund (continued)
Portfolio of Investments December 31, 2011
| Shares | | Description (1) | | Coupon | | | | Ratings (5) | | Value | |
| | | Consumer Finance – 0.4% | |
| | 28,500 | | | HSBC Finance Corporation | | | 6.360 | % | | | | | | | A | | | $ | 605,625 | | |
| | | Diversified Financial Services – 0.9% | |
| | 15,000 | | | Bank of America Corporation | | | 8.200 | % | | | | | | BBB- | | | 331,500 | | |
| | 300 | | | Bank of America Corporation | | | 7.250 | % | | | | | | BBB- | | | 236,406 | | |
| | 26,300 | | | Citigroup Inc. | | | 8.500 | % | | | | | | BBB | | | 683,800 | | |
| | 1,888 | | | Citigroup Inc. | | | 6.500 | % | | | | | | BBB | | | 76,502 | | |
| | | | | Total Diversified Financial Services | | | | | | | | | | | | | | | 1,328,208 | | |
| | | Electric Utilities – 2.8% | |
| | 18,150 | | | Alabama Power Company | | | 6.500 | % | | | | | | A- | | | 555,844 | | |
| | 10,000 | | | Alabama Power Company | | | 6.450 | % | | | | | | A- | | | 276,250 | | |
| | 12,000 | | | Connecticut Power & Light Company | | | 4.960 | % | | | | | | Baa3 | | | 574,126 | | |
| | 5,000 | | | Georgia Power Company | | | 6.500 | % | | | | | | A- | | | 545,157 | | |
| | 5,000 | | | Gulf Power Company | | | 6.450 | % | | | | | | BBB+ | | | 533,440 | | |
| | 30,000 | | | PPL Electric Utilities Corporation | | | 6.250 | % | | | | | | BBB- | | | 760,314 | | |
| | 5,000 | | | Southern California Edison Company | | | 6.500 | % | | | | | | Baa2 | | | 521,250 | | |
| | 5,000 | | | Southern California Edison Company | | | 6.125 | % | | | | | | BBB+ | | | 499,844 | | |
| | | | | Total Electric Utilities | | | | | | | | | | | | | | | 4,266,225 | | |
| | | Insurance – 2.9% | |
| | 25,000 | | | Aspen Insurance Holdings Limited | | | 7.401 | % | | | | | | BBB- | | | 617,500 | | |
| | 25,000 | | | Axis Capital Holdings Limited | | | 7.250 | % | | | | | | BBB | | | 628,000 | | |
| | 25,000 | | | Endurance Specialty Holdings Limited | | | 7.750 | % | | | | | | BBB- | | | 638,250 | | |
| | 3,500 | | | Endurance Specialty Holdings Limited | | | 7.500 | % | | | | | | BBB- | | | 89,215 | | |
| | 25,000 | | | MetLife Inc., Series B | | | 6.500 | % | | | | | | Baa2 | | | 637,000 | | |
| | 16,501 | | | PartnerRe Limited | | | 7.250 | % | | | | | | BBB+ | | | 437,277 | | |
| | 25,000 | | | Principal Financial Group | | | 6.518 | % | | | | | | BBB | | | 629,250 | | |
| | 28,500 | | | Prudential PLC | | | 6.750 | % | | | | | | A- | | | 723,615 | | |
| | | | | Total Insurance | | | | | | | | | | | | | | | 4,400,107 | | |
| | | Oil, Gas & Consumable Fuels – 0.4% | |
| | 25,000 | | | Kayne Anderson MLP Trust, (3) | | | 4.950 | % | | | | | | AA | | | 637,499 | | |
| | | Thrifts & Mortgage Finance – 0.2% | |
| | 12,796 | | | Santander Holdings USA | | | 7.300 | % | | | | | | BBB+ | | | 319,899 | | |
| | | | | Total $25 Par (or similar) Preferred Securities (cost $11,563,534) | | | | | | | | | | | | | | | 11,872,153 | | |
Principal
Amount (000) | | Description (1) | | Weighted
Average
Coupon | | Maturity (6) | | Ratings (5) | | Value | |
| | | Variable Rate Senior Loan Interests – 31.7% (21.6% of Total Investments) (7) | |
| | | Auto Components – 1.2% | |
| $ | 1,314 | | | Federal-Mogul Corporation, Tranche B, Term Loan | | | 2.209 | % | | 12/29/14 | | Ba3 | | $ | 1,219,337 | | |
| | 670 | | | Federal-Mogul Corporation, Tranche C, Term Loan | | | 2.216 | % | | 12/28/15 | | Ba3 | | | 622,111 | | |
| | 1,984 | | | Total Auto Components | | | 1,841,448 | | |
| | | Biotechnology – 0.6% | |
| | 896 | | | Grifols, Term Loan | | | 6.000 | % | | 6/01/17 | | BB | | | 894,661 | | |
| | | Building Products – 0.6% | |
| | 931 | | | Goodman Global Inc., Term Loan | | | 5.750 | % | | 10/28/16 | | B+ | | | 931,849 | | |
| | | Chemicals – 1.7% | |
| | 1,620 | | | Ashland, Inc., Term Loan | | | 3.750 | % | | 8/23/18 | | Baa3 | | | 1,628,546 | | |
| | 990 | | | Univar, Inc., Term Loan | | | 5.000 | % | | 6/30/17 | | B+ | | | 957,825 | | |
| | 2,610 | | | Total Chemicals | | | | | | | | | | | | | | | 2,586,371 | | |
Nuveen Investments
20
Principal
Amount (000) | | Description (1) | | Weighted
Average
Coupon | | Maturity (6) | | Ratings (5) | | Value | |
| | | Communications Equipment – 1.2% | |
| $ | 987 | | | Avaya, Inc., Term Loan | | | 3.256 | % | | 10/27/14 | | B1 | | $ | 947,546 | | |
| | 862 | | | Intelsat, Term Loan | | | 5.250 | % | | 4/02/18 | | BB- | | | 860,537 | | |
| | 1,849 | | | Total Communications Equipment | | | 1,808,083 | | |
| | | Consumer Finance – 0.4% | |
| | 750 | | | Springleaf Financial Funding Company, Term Loan | | | 5.500 | % | | 5/10/17 | | B+ | | | 654,610 | | |
| | | Containers & Packaging – 0.3% | |
| | 463 | | | Sealed Air Corporation, Term Loan | | | 4.750 | % | | 10/03/18 | | Ba1 | | | 468,387 | | |
| | | Electric Utilities – 0.9% | |
| | 1,860 | | | TXU Corporation, 2014 Term Loan | | | 3.776 | % | | 10/10/14 | | B2 | | | 1,305,109 | | |
| | | Food & Staples Retailing – 1.2% | |
| | 855 | | | Reynolds Group Holdings, Inc., Add on Term Loan | | | 6.500 | % | | 8/09/18 | | BB- | | | 851,749 | | |
| | 987 | | | U.S. Foodservice, Inc., Term Loan | | | 2.795 | % | | 7/03/14 | | | B | | | | 915,693 | | |
| | 1,842 | | | Total Food & Staples Retailing | | | 1,767,442 | | |
| | | Food Products – 1.5% | |
| | 998 | | | JBS USA LLC, Term Loan | | | 4.250 | % | | 5/25/18 | | BB | | | 975,056 | | |
| | 1,324 | | | Michael Foods Group, Inc., Term Loan | | | 4.250 | % | | 2/25/18 | | B+ | | | 1,308,734 | | |
| | 2,322 | | | Total Food Products | | | 2,283,790 | | |
| | | Health Care Equipment & Supplies – 1.0% | |
| | 1,500 | | | Chiron Merger Sub, Inc., Term Loan | | | 7.000 | % | | 5/04/18 | | Ba2 | | | 1,515,412 | | |
| | | Health Care Providers & Services – 3.3% | |
| | 1,265 | | | Community Health Systems, Inc., Term Loan | | | 2.757 | % | | 7/25/14 | | BB | | | 1,230,677 | | |
| | 65 | | | Community Health Systems, Inc., Delayed Term Loan | | | 2.546 | % | | 7/25/14 | | BB | | | 63,193 | | |
| | 141 | | | Community Health Systems, Inc., Extended Term Loan | | | 3.965 | % | | 1/25/17 | | BB | | | 136,528 | | |
| | 995 | | | Golden Living, Term Loan | | | 5.000 | % | | 5/04/18 | | B+ | | | 870,023 | | |
| | 76 | | | HCA, Inc., Tranche B2, Term Loan | | | 3.829 | % | | 3/31/17 | | BB | | | 72,217 | | |
| | 914 | | | Kindred Healthcare, Term Loan | | | 5.250 | % | | 6/01/18 | | Ba3 | | | 854,179 | | |
| | 1,826 | | | Universal Health Services, Inc., Term Loan B | | | 3.750 | % | | 11/15/16 | | BB | | | 1,825,434 | | |
| | 5,282 | | | Total Health Care Providers & Services | | | 5,052,251 | | |
| | | Health Care Technology – 0.7% | |
| | 1,000 | | | Emdeon Business Services LLC, Term Loan | | | 6.750 | % | | 11/02/18 | | BB- | | | 1,009,844 | | |
| | | Hotels, Restaurants & Leisure – 4.3% | |
| | 1,970 | | | 24 Hour Fitness Worldwide, Inc., New Term Loan | | | 7.500 | % | | 4/22/16 | | Ba3 | | | 1,890,379 | | |
| | 1,056 | | | Reynolds Group Holdings, Inc., US Term Loan | | | 6.500 | % | | 2/09/18 | | BB | | | 1,047,935 | | |
| | 2,047 | | | Seaworld Parks and Entertainment, Inc., Term Loan B | | | 4.000 | % | | 8/17/17 | | BB+ | | | 2,040,572 | | |
| | 1,500 | | | Six Flags Theme Parks, Inc., Term Loan B, WI/DD | | TBD | | TBD | | BB+ | | | 1,495,312 | | |
| | 6,573 | | | Total Hotels, Restaurants & Leisure | | | 6,474,198 | | |
| | | Household Products – 0.4% | |
| | 724 | | | Visant Corporation, Term Loan | | | 5.260 | % | | 12/22/16 | | BB- | | | 680,900 | | |
| | | Internet Software & Services – 0.4% | |
| | 632 | | | Go Daddy Operating Co., LLC, Term Loan, First Lien | | | 7.000 | % | | 12/16/18 | | Ba3 | | | 632,856 | | |
| | | IT Services – 2.4% | |
| | 1,377 | | | First Data Corporation, Term Loan B1 | | | 3.044 | % | | 9/24/14 | | B+ | | | 1,246,846 | | |
| | 372 | | | First Data Corporation, Term Loan B2 | | | 3.044 | % | | 9/24/14 | | B+ | | | 336,952 | | |
| | 662 | | | Frac Tech International LLC, Term Loan | | | 6.250 | % | | 5/06/16 | | B+ | | | 654,289 | | |
| | 746 | | | Infor Global Solutions Intermediate Holdings, Ltd., Term Loan B2 | | | 7.250 | % | | 7/28/15 | | B+ | | | 711,965 | | |
| | 687 | | | SunGard Data Systems, Inc., Term Loan B | | | 2.029 | % | | 2/28/14 | | BB | | | 671,229 | | |
| | 3,844 | | | Total IT Services | | | 3,621,281 | | |
Nuveen Investments
21
JTA
Nuveen Tax-Advantaged Total Return Strategy Fund (continued)
Portfolio of Investments December 31, 2011
Principal
Amount (000) | | Description (1) | | Weighted
Average
Coupon | | Maturity (6) | | Ratings (5) | | Value | |
| | | Media – 5.4% | |
| $ | 619 | | | Bresnan Broadband Holdings LLC, Term Loan B | | | 4.500 | % | | 12/14/17 | | BB+ | | $ | 613,530 | | |
| | 1,000 | | | Cumulus Media, Inc., Term Loan, First Lien | | | 5.750 | % | | 9/16/18 | | Ba2 | | | 981,042 | | |
| | 750 | | | Cumulus Media, Inc., Term Loan, Second Lien | | | 7.500 | % | | 3/18/19 | | B2 | | | 728,750 | | |
| | 1,291 | | | Interactive Data Corporation, Term Loan B | | | 4.500 | % | | 2/11/18 | | Ba3 | | | 1,280,520 | | |
| | 293 | | | Mediacom Broadband LLC, Tranche D, Term Loan | | | 5.500 | % | | 3/31/17 | | BB- | | | 290,226 | | |
| | 1,970 | | | Mediacom Broadband LLC, Tranche F, Term Loan | | | 4.500 | % | | 10/23/17 | | BB- | | | 1,928,138 | | |
| | 267 | | | Nielsen Finance LLC, Term Loan C | | | 3.440 | % | | 5/02/16 | | B+ | | | 260,529 | | |
| | 619 | | | SuperMedia, Term Loan | | | 11.000 | % | | 12/31/15 | | Caa1 | | | 292,786 | | |
| | 1,956 | | | Univision Communications, Inc., Term Loan | | | 4.546 | % | | 3/31/17 | | B+ | | | 1,751,197 | | |
| | 8,765 | | | Total Media | | | 8,126,718 | | |
| | | Multiline Retail – 0.6% | |
| | 995 | | | Bass Pro Group LLC, Term Loan B | | | 5.250 | % | | 6/13/17 | | BB- | | | 987,123 | | |
| | | Pharmaceuticals – 0.6% | |
| | 417 | | | Warner Chilcott Corporation, Term Loan B1 | | | 4.250 | % | | 3/15/18 | | BBB- | | | 412,393 | | |
| | 208 | | | Warner Chilcott Corporation, Term Loan B2 | | | 4.250 | % | | 3/15/18 | | BBB- | | | 206,197 | | |
| | 287 | | | Warner Chilcott Corporation, Term Loan B3 | | | 4.250 | % | | 3/15/18 | | BBB- | | | 283,521 | | |
| | 912 | | | Total Pharmaceuticals | | | 902,111 | | |
| | | Real Estate Investment Trust – 0.4% | |
| | 641 | | | iStar Financial, Inc., Tranche A1 | | | 5.000 | % | | 6/28/13 | | B+ | | | 637,733 | | |
| | | Real Estate Management & Development – 0.3% | |
| | 416 | | | LNR Property Corporation, Term Loan | | | 4.750 | % | | 4/29/16 | | BB+ | | | 410,949 | | |
| | | Road & Rail – 0.6% | |
| | 900 | | | Swift Transportation Company, Inc., Term Loan | | | 6.000 | % | | 12/21/16 | | B1 | | | 903,551 | | |
| | | Semiconductors & Equipment – 0.6% | |
| | 993 | | | NXP Semiconductor LLC, Term Loan | | | 4.500 | % | | 3/04/17 | | B2 | | | 946,597 | | |
| | | Software – 0.6% | |
| | 902 | | | DataTel Inc., Term Loan B, WI/DD | | TBD | | TBD | | B1 | | | 904,132 | | |
| | | Specialty Retail – 0.5% | |
| | 741 | | | Burlington Coat Factory Warehouse Corporation, Term Loan B | | | 6.250 | % | | 2/23/17 | | B- | | | 728,694 | | |
| $ | 50,327 | | | Total Variable Rate Senior Loan Interests (cost $49,604,538) | | | | | | | | | | | | | | | 48,076,100 | | |
Principal
Amount (000)/
Shares | | Description (1) | | Coupon | | Maturity | | Ratings (5) | | Value | |
| | | Capital Preferred Securities – 0.7% (0.5% of Total Investments) | |
| | | Commercial Banks – 0.3% | |
| | 500 | | | PNC Financial Services Inc. | | | 6.750 | % | | 8/01/21 | | A- | | $ | 488,965 | | |
| | | Diversified Financial Services – 0.4% | |
| | 500 | | | JPMorgan Chase & Company | | | 7.900 | % | | 4/30/18 | | | A | | | | 532,345 | | |
| | | Total Capital Preferred Securities (cost $972,742) | | | | | | | | | | | | | | | 1,021,310 | | |
Nuveen Investments
22
Principal
Amount (000) | | Description (1) | | Coupon | | Maturity | | | | Value | |
| | | Short-Term Investments – 6.6% (4.5% of Total Investments) | |
| $ | 7,871
| | | Repurchase Agreement with Fixed Income Clearing Corporation, dated
12/30/11, repurchase price $7,870,940, collateralized by $7,185,000
U.S. Treasury Notes, 3.125%, due 5/15/21, value $8,029,238 | | | 0.010
| % | | 1/03/12
| |
| | $ | 7,870,931
| | |
| 2,203
| | | Repurchase Agreement with Fixed Income Clearing Corporation, dated
12/30/11, repurchase price $2,203,018, collateralized by $2,000,000
U.S. Treasury Notes, 4.000%, due 2/15/15, value $2,249,470 | | | 0.010
| % | | 1/03/12
| |
| | | 2,203,016
| | |
| $ | 10,074 | | | Total Short-Term Investments (cost $10,073,947) | | | | | | | | | 10,073,947 | | |
| | | | | Total Investments (cost $221,118,332) – 146.3% | | | | | | | | | | | | | | | 222,240,911 | | |
| | | | | Borrowings – (44.7)% (8), (9) | | | | | | | | | | | | | | | (67,900,000 | ) | |
| | | | | Other Assets Less Liabilities – (1.6)% (10) | | | | | | | | | | | | | | | (2,450,647 | ) | |
| | | | | Net Assets Applicable to Common Shares – 100% | | | | | | | | | | | | | | $ | 151,890,264 | | |
Investments in Derivatives at December 31, 2011
Call Options Written outstanding:
Number of
Contracts | | Type | | Notional
Amount (11) | | Expiration
Date | | Strike
Price | | Value | |
| | (400 | ) | | Barrick Gold Corporation | | $ | (2,100,000 | ) | | 1/21/12 | | $ | 52.5 | | | $ | (3,400 | ) | |
| | (950 | ) | | Lincoln National Corporation | | | (1,900,000 | ) | | 4/21/12 | | | 20.0 | | | | (162,450 | ) | |
| | (1,350 | ) | | Total Call Options Written (premiums received $385,614) | | $ | (4,000,000 | ) | | | | | | | | | | $ | (165,850 | ) | |
Interest Rate Swaps outstanding:
| Counterparty | | Notional
Amount | | Fund
Pay/Receive
Floating Rate | | Floating Rate
Index | | Fixed Rate* | | Fixed Rate
Payment
Frequency | | Termination
Date | | Unrealized
Appreciation
(Depreciation) | |
| JPMorgan | | $ | 13,975,000 | | | Receive | | 1-Month USD-LIBOR | | | 1.412 | % | | Monthly | | 3/29/14 | | $ | (271,439 | ) | |
| Morgan Stanley | | | 13,975,000 | | | Receive | | 1-Month USD-LIBOR | | | 0.409 | | | Monthly | | 3/29/12 | | | 2,292 | | |
| Morgan Stanley | | | 13,975,000 | | | Receive | | 1-Month USD-LIBOR | | | 2.323 | | | Monthly | | 3/29/16 | | | (824,323 | ) | |
| | | | | | | | | | | | | | | $ | (1,093,470 | ) | |
* Annualized.
For Fund portfolio compliance purposes, the Fund's industry classifications refer to any one or more of the industry sub-classifications used by one or more widely recognized market indexes or ratings group indexes, and/or as defined by Fund management. This definition may not apply for purposes of this report, which may combine industry sub-classifications into sectors for reporting ease.
(1) All percentages shown in the Portfolio of Investments are based on net assets applicable to Common shares unless otherwise noted.
(2) Non-income producing; issuer has not declared a dividend within the past twelve months.
(3) Investment, or portion of investment, has been pledged to collateralize the net payment obligations for investments in derivatives.
(4) For fair value measurement disclosure purposes, Common Stock categorized as Level 2. See Notes to Financial Statements, Footnote 1—General Information and Significant Accounting Policies, Investment Valuation for more information.
(5) Ratings (not covered by the report of independent registered public accounting firm): Using the highest of Standard & Poor's Group ("Standard & Poor's"), Moody's Investors Service, Inc. ("Moody's") or Fitch, Inc. ("Fitch") rating. Ratings below BBB by Standard & Poor's, Baa by Moody's or BBB by Fitch are considered to be below investment grade. Holdings designated N/R are not rated by any of these national rating agencies.
(6) Senior Loans generally are subject to mandatory and/or optional prepayment. Because of these mandatory prepayment conditions and because there may be significant economic incentives for a borrower to prepay, prepayments of Senior Loans may occur. As a result, the actual remaining maturity of Senior Loans held may be substantially less than the stated maturities shown.
(7) Senior Loans generally pay interest at rates which are periodically adjusted by reference to a base short-term, floating lending rate plus an assigned fixed rate. These floating lending rates are generally (i) the lending rate referenced by the London Inter-Bank Offered Rate ("LIBOR"), or (ii) the prime rate offered by one or more major United States banks.
Senior Loans may be considered restricted in that the Fund ordinarily is contractually obligated to receive approval from the Agent Bank and/or Borrower prior to the disposition of a Senior Loan.
(8) Borrowings Payable as a percentage of Total Investments is 30.6%.
(9) The Fund may pledge up to 100% of its eligible investments in the Portfolio of Investments as collateral for Borrowings. As of December 31, 2011, investments with a value of $150,009,981 have been pledged as collateral for Borrowings.
(10) Other Assets Less Liabilities includes the Value and the Net Unrealized Appreciation (Depreciation) of derivative instruments as listed within Investments in Derivatives at December 31, 2011.
(11) For disclosure purposes, Notional Amount is calculated by multiplying the Number of Contracts by the Strike Price by 100.
N/R Not rated.
WI/DD Purchased on a when-issued or delayed delivery basis.
ADR American Depositary Receipt.
TBD Senior Loan purchased on a when-issued or delayed-delivery basis. Certain details associated with this purchase are not known prior to the settlement date of the transaction. In addition, Senior Loans typically trade without accrued interest and therefore a weighted average coupon rate is not available prior to settlement. At settlement, if still unknown, the borrower or counterparty will provide the Fund with the final weighted average coupon rate and maturity date.
USD-LIBOR United States Dollar–London Inter-Bank Offered Rate.
See accompanying notes to financial statements.
Nuveen Investments
23
Statement of
ASSETS & LIABILITIES
December 31, 2011
| Assets | |
| Investments, at value (cost $221,118,332) | | $ | 222,240,911 | | |
| Cash | | | 21,481 | | |
| Receivables: | |
| Dividends | | | 628,726 | | |
| Interest | | | 326,758 | | |
| Investments sold | | | 192,125 | | |
| Matured senior loans | | | 193,778 | | |
| Reclaims | | | 44,276 | | |
| Other assets | | | 25,057 | | |
| Total assets | | | 223,673,112 | | |
| Liabilities | |
| Borrowings | | | 67,900,000 | | |
| Call options written, at value (premiums received $385,614) | | | 165,850 | | |
| Unrealized depreciation on interest rate swaps, net | | | 1,093,470 | | |
| Payable for investments purchased | | | 2,373,903 | | |
| Accrued expenses: | |
| Interest on borrowings | | | 5,799 | | |
| Management fees | | | 144,377 | | |
| Other | | | 99,449 | | |
| Total liabilities | | | 71,782,848 | | |
| Net assets applicable to Common shares | | $ | 151,890,264 | | |
| Common shares outstanding | | | 13,848,505 | | |
| Net asset value per Common share outstanding (net assets applicable to Common shares, divided by Common shares outstanding) | | $ | 10.97 | | |
| Net assets applicable to Common shares consist of: | |
| Common shares, $.01 par value per share | | $ | 138,485 | | |
| Paid-in surplus | | | 243,370,922 | | |
| Undistributed (Over-distribution of) net investment income | | | (19,970 | ) | |
| Accumulated net realized gain (loss) | | | (91,848,046 | ) | |
| Net unrealized appreciation (depreciation) | | | 248,873 | | |
| Net assets applicable to Common shares | | $ | 151,890,264 | | |
| Authorized shares: | |
| Common | | | Unlimited | | |
| FundPreferred | | | Unlimited | | |
See accompanying notes to financial statements.
Nuveen Investments
24
Statement of
OPERATIONS
Year Ended December 31, 2011
| Investment Income | |
| Dividends (net of foreign tax withheld of $156,017) | | $ | 4,914,536 | | |
| Interest | | | 2,967,056 | | |
| Total investment income | | | 7,881,592 | | |
| Expenses | |
| Management fees | | | 1,939,099 | | |
| Interest expense on borrowings | | | 790,541 | | |
| Shareholders' servicing agent fees and expenses | | | 716 | | |
| Custodian's fees and expenses | | | 66,238 | | |
| Trustees' fees and expenses | | | 6,333 | | |
| Professional fees | | | 27,172 | | |
| Shareholders' reports — printing and mailing expenses | | | 71,898 | | |
| Stock exchange listing fees | | | 8,918 | | |
| Investor relations expense | | | 43,665 | | |
| Other expenses | | | 76,267 | | |
| Total expenses before custodian fee credit and expense reimbursement | | | 3,030,847 | | |
| Custodian fee credit | | | (28 | ) | |
| Expense reimbursement | | | (198,619 | ) | |
| Net expenses | | | 2,832,200 | | |
| Net investment income (loss) | | | 5,049,392 | | |
| Realized and Unrealized Gain (Loss) | |
| Net realized gain (loss) from: | |
| Investments | | | 41,011 | | |
| Call options written | | | 1,495,405 | | |
| Interest rate swaps | | | (366,793 | ) | |
| Change in net unrealized appreciation (depreciation) of: | |
| Investments | | | (12,125,906 | ) | |
| Call options written | | | 435,726 | | |
| Interest rate swaps | | | (1,093,470 | ) | |
| Net realized and unrealized gain (loss) | | | (11,614,027 | ) | |
| Net increase (decrease) in net assets applicable to Common shares from operations | | $ | (6,564,635 | ) | |
See accompanying notes to financial statements.
Nuveen Investments
25
Statement of
CHANGES in NET ASSETS
| | | Year Ended
12/31/11 | | Year Ended
12/31/10 | |
| Operations | |
| Net investment income (loss) | | $ | 5,049,392 | | | $ | 3,789,759 | | |
| Net realized gain (loss) from: | |
| Investments | | | 41,011 | | | | 9,304,719 | | |
| Call options written | | | 1,495,405 | | | | 197,127 | | |
| Interest rate swaps | | | (366,793 | ) | | | — | | |
| Change in net unrealized appreciation (depreciation) of: | |
| Investments | | | (12,125,906 | ) | | | 10,008,032 | | |
| Call options written | | | 435,726 | | | | (437,284 | ) | |
| Interest rate swaps | | | (1,093,470 | ) | | | — | | |
Net increase (decrease) in net assets applicable to Common shares from
operations | | | (6,564,635 | ) | | | 22,862,353 | | |
| Distributions to Common Shareholders | |
| From net investment income | | | (5,537,134 | ) | | | (13,045,853 | ) | |
| Return of capital | | | (6,944,101 | ) | | | — | | |
Decrease in net assets applicable to Common shares from distributions to
Common shareholders | | | (12,481,235 | ) | | | (13,045,853 | ) | |
| Capital Share Transactions | |
| Common shares repurchased and retired | | | (284,003 | ) | | | — | | |
Net increase (decrease) in net assets applicable to Common shares from
capital share transactions | | | (284,003 | ) | | | — | | |
| Net increase (decrease) in net assets applicable to Common shares | | | (19,329,873 | ) | | | 9,816,500 | | |
| Net assets applicable to Common shares at the beginning of period | | | 171,220,137 | | | | 161,403,637 | | |
| Net assets applicable to Common shares at the end of period | | $ | 151,890,264 | | | $ | 171,220,137 | | |
Undistributed (Over-distribution of) net investment income at
the end of period | | $ | (19,970 | ) | | $ | (77,697 | ) | |
See accompanying notes to financial statements.
Nuveen Investments
26
Statement of
CASH FLOWS
Year Ended December 31, 2011
| Cash Flows from Operating Activities: | |
| Net Increase (Decrease) in Net Assets Applicable to Common Shares from Operations | | $ | (6,564,635 | ) | |
Adjustments to reconcile the net increase (decrease) in net assets applicable to Common shares
from operations to net cash provided by (used in) operating activities: | |
| Purchases of investments | | | (132,526,803 | ) | |
| Proceeds from sales and maturities of investments | | | 124,880,572 | | |
| Proceeds from (Purchases of) short-term investments, net | | | 636,085 | | |
| Proceeds from (Payments for) interest rate swap contracts, net | | | (366,793 | ) | |
| Premiums received for call options written | | | 1,395,421 | | |
| Cash paid for terminated call options written | | | (168,530 | ) | |
| Amortization (Accretion) of premiums and discounts, net | | | (144,299 | ) | |
| (Increase) Decrease in: | |
| Receivable for dividends | | | (307,120 | ) | |
| Receivable for interest | | | (31,510 | ) | |
| Receivable for investments sold | | | 1,042,645 | | |
| Receivable for matured senior loans | | | 37,048 | | |
| Receivable for reclaims | | | 30,761 | | |
| Other assets | | | 23,437 | | |
| Increase (Decrease) in: | |
| Payable for investments purchased | | | (1,782,672 | ) | |
| Accrued interest on borrowings | | | 1,932 | | |
| Accrued management fees | | | 8,217 | | |
| Accrued other expenses | | | (21,714 | ) | |
| Net realized (gain) loss from: | |
| Investments | | | (41,011 | ) | |
| Call options written | | | (1,495,405 | ) | |
| Interest rate swaps | | | 366,793 | | |
| Paydowns | | | (358,047 | ) | |
| Change in net unrealized (appreciation) depreciation of: | |
| Investments | | | 12,125,906 | | |
| Call options written | | | (435,726 | ) | |
| Interest rate swaps | | | 1,093,470 | | |
| Proceeds from litigation settlement | | | 88,697 | | |
| Net cash provided by (used in) operating activities | | | (2,513,281 | ) | |
| Cash Flows from Financing Activities: | |
| Increase (Decrease) in borrowings | | | 15,300,000 | | |
| Cash distributions paid to Common shareholders | | | (12,481,235 | ) | |
| Cost of Common shares repurchased and retired | | | (284,003 | ) | |
| Net cash provided by (used in) financing activities | | | 2,534,762 | | |
| Net Increase (Decrease) in Cash | | | 21,481 | | |
| Cash at the beginning of the period | | | — | | |
| Cash at the End of the Period | | $ | 21,481 | | |
Supplemental Disclosure of Cash Flow Information
Cash paid for interest on borrowings (excluding borrowing costs) during the fiscal year ended December 31, 2011, was $781,109.
See accompanying notes to financial statements.
Nuveen Investments
27
Financial
HIGHLIGHTS
Selected data for a Common share outstanding throughout each period:
| | | | | | |
| | | | | Investment Operations | | Less Distributions | | | | | |
| | | Beginning
Common
Share
Net Asset
Value | | Net
Investment
Income
(Loss)(a) | | Net
Realized/
Unrealized
Gain
(Loss)(b) | | Distributions
from Net
Investment
Income to
FundPreferred
Share-
holders(c) | | Distributions
from Capital
Gains to
FundPreferred
Share-
holders(c) | | Total | | Net
Investment
Income to
Common
Share-
holders | | Capital
Gains to
Common
Share-
holders | | Return of
Capital to
Common
Share-
holders | | Total | | Discount
from
Common
Shares
Repurchased
and
Retired | | Offering
Costs
and
FundPreferred
Share
Underwriting
Discounts | |
| Year Ended 12/31: | |
| | 2011 | | | $ | 12.34 | | | $ | .36 | | | $ | (.83 | ) | | $ | — | | | $ | — | | | $ | (0.47 | ) | | $ | (.40 | ) | | $ | — | | | $ | (.50 | ) | | $ | (.90 | ) | | $ | — | * | | $ | — | | |
| | 2010 | | | | 11.63 | | | | .27 | | | | 1.38 | | | | — | | | | — | | | | 1.65 | | | | (.94 | ) | | | — | | | | — | | | | (.94 | ) | | | — | | | | — | | |
| | 2009 | | | | 9.42 | | | | .40 | | | | 2.75 | | | | (.02 | ) | | | — | | | | 3.13 | | | | (.38 | ) | | | — | | | | (.55 | ) | | | (.93 | ) | | | .01 | | | | — | | |
| | 2008 | | | | 23.54 | | | | .77 | | | | (13.06 | ) | | | (.12 | ) | | | — | | | | (12.41 | ) | | | (.70 | ) | | | (.21 | ) | | | (.80 | ) | | | (1.71 | ) | | | — | | | | — | | |
| | 2007 | | | | 25.98 | | | | .90 | | | | (1.22 | ) | | | (.05 | ) | | | (.11 | ) | | | (.48 | ) | | | (.82 | ) | | | (1.14 | ) | | | — | | | | (1.96 | ) | | | — | | | | — | | |
| | | FundNotes at the End of Period | | FundPreferred Shares at the End of Period | | Borrowings at the End of Period | |
| | | Aggregate
Amount
Outstanding
(000) | | Average Market
Value Per
$25,000 of
Principal
Amount | | Asset
Coverage Per
$1,000 of
Principal
Amount | | Aggregate
Amount
Outstanding
(000) | | Liquidation
and Market
Value
Per Share | | Asset
Coverage
Per Share | | Aggregate
Amount
Outstanding
(000) | | Asset
Coverage
Per $1,000 | |
| Year Ended 12/31: | |
| | 2011 | | | $ | — | | | $ | — | | | $ | — | | | $ | — | | | $ | — | | | $ | — | | | $ | 67,900 | | | $ | 3,237 | | |
| | 2010 | | | | — | | | | — | | | | — | | | | — | | | | — | | | | — | | | | 52,600 | | | | 4,255 | | |
| | 2009 | | | | — | | | | — | | | | — | | | | — | | | | — | | | | — | | | | 52,600 | | | | 4,069 | | |
| | 2008 | | | | — | | | | — | | | | — | | | | 28,850 | | | | 25,000 | | | | 138,992 | | | | 35,000 | | | | 5,583 | | |
| | 2007 | | | | 78,000 | | | | 25,000 | | | | 5,789 | | | | 45,000 | | | | 25,000 | | | | 207,531 | | | | 33,000 | | | | 14,684 | | |
(a) Per share Net Investment Income (Loss) is calculated using the average daily shares method.
(b) Net of federal corporate income taxes on long-term capital gains retained by the Fund per share as follows:
| | | Long-Term
Capital Gains
Retained | |
| Year Ended 12/31: | | | |
| | 2011 | | | | N/A | | |
| | 2010 | | | | N/A | | |
| | 2009 | | | | N/A | | |
| | 2008 | | | | N/A | | |
| | 2007 | | | $ | .21 | | |
(c) The amounts shown are based on Common share equivalents.
(d) • Total Return Based on Market Value is the combination of changes in the market price per share and the effect of reinvested dividend income and reinvested capital gains distributions, if any, at the average price paid per share at the time of reinvestment. The last dividend declared in the period, which is typically paid on the first business day of the following month, is assumed to be reinvested at the ending market price. The actual reinvestment for the last dividend declared in the period takes place over several days, and in some instances may not be based on the market price, so the actual reinvestment price may be different from the price used in the calculation. Total returns are not annualized.
Total Return Based on Common Share Net Asset Value is the combination of changes in Common share net asset value, reinvested dividend income at net asset value and reinvested capital gains distributions at net asset value, if any. The last dividend declared in the period, which is typically paid on the first business day of the following month, is assumed to be reinvested at the ending net asset value. The actual reinvest price for the last dividend declared in the period may often be based on the Fund's market price (and not its net asset value), and therefore may be different from the price used in the calculation. Total returns are not annualized.
Nuveen Investments
28
| | | | | Ratios/Supplemental Data | |
| | | | | | | Total Returns | | | | Ratios to Average Net Assets
Applicable to Common Shares
Before Reimbursement(e) | | Ratios to Average Net Assets
Applicable to Common Shares
After Reimbursement(e)(f) | | | |
| | | Ending
Common
Share
Net Asset
Value | | Ending
Market
Value | | Based on
Market
Value(d) | | Based on
Common
Share
Net
Asset
Value(d) | | Ending
Net Assets
Applicable to
Common
Shares (000) | | Expenses | | Net
Investment
Income (Loss) | | Expenses | | Net
Investment
Income (Loss) | | Portfolio
Turnover
Rate | |
| Year Ended 12/31: | |
| | 2011 | | | $ | 10.97 | | | $ | 9.56 | | | | (7.48 | )% | | | (3.87 | )% | | $ | 151,890 | | | | 1.85 | % | | | 2.96 | % | | | 1.73 | % | | | 3.08 | % | | | 56 | % | |
| | 2010 | | | | 12.34 | | | | 11.24 | | | | 14.73 | | | | 14.99 | | | | 171,220 | | | | 1.77 | | | | 2.14 | | | | 1.55 | | | | 2.36 | | | | 48 | | |
| | 2009 | | | | 11.63 | | | | 10.66 | | | | 56.47 | | | | 35.50 | | | | 161,404 | | | | 1.86 | | | | 3.71 | | | | 1.53 | | | | 4.04 | | | | 55 | | |
| | 2008 | | | | 9.42 | | | | 7.58 | | | | (60.54 | ) | | | (55.29 | ) | | | 131,546 | | | | 3.74 | | | | 4.03 | | | | 3.24 | | | | 4.53 | | | | 24 | | |
| | 2007 | | | | 23.54 | | | | 21.81 | | | | (12.99 | ) | | | (2.38 | ) | | | 328,557 | | | | 3.10 | | | | 2.99 | | | | 2.64 | | | | 3.45 | | | | 25 | | |
• The Fund elected to retain a portion of its realized long-term capital gains for the following tax years ended December 31, (which is the fiscal year end for the Fund) and pay required federal corporate income taxes on these amounts. As reported on Form 2439, Common shareholders on record date must include their pro-rata share of these gains on their applicable federal tax returns, and are entitled to take offsetting tax credits, for their pro-rata share of the taxes paid by the Fund. The standardized total returns shown above do not include the economic benefit to Common shareholders on record date of these tax credits/refunds. The Fund's corresponding Total Returns Based on Market Value and Common Share Net Asset Value when these benefits are included are as follows:
| | | | | Total Returns | |
| | | Common
Shareholders
of Record on | | Based on
Market Value | | Based on
Common Share
Net Asset Value | |
| Year Ended 12/31: | |
| | 2011 | | | | N/A | | | | (7.48 | )% | | | (3.87 | )% | |
| | 2010 | | | | N/A | | | | 14.73 | | | | 14.99 | | |
| | 2009 | | | | N/A | | | | 56.47 | | | | 35.50 | | |
| | 2008 | | | | N/A | | | | (60.54 | ) | | | (55.29 | ) | |
| | 2007 | | | December 31 | | | (12.18 | ) | | | (1.54 | ) | |
(e) • Ratios do not reflect the effect of dividend payments to FundPreferred shareholders, where applicable.
• Net Investment Income (Loss) ratios reflect income earned and expenses incurred on assets attributable to FundPreferred Shares, FundNotes and/or borrowings, where applicable.
• Each Ratio of Expenses to Average Net Assets Applicable to Common Shares and each Ratio of Net Investment Income (Loss) to Average Net Assets Applicable to Common Shares includes the effect of interest expense paid on FundNotes and all interest expense and other costs related to borrowings, where applicable as follows:
| | | Ratios of FundNotes Interest Expense to
Average Net Assets Applicable Common Shares(g) | | Ratios of Borrowings Interest Expense to
Average Net Assets Applicable to Common Shares | |
| Year Ended 12/31: | |
| | 2011 | | | | — | % | | | .48 | % | |
| | 2010 | | | | — | | | | .45 | | |
| | 2009 | | | | — | | | | .44 | | |
| | 2008 | | | | 1.12 | | | | 1.00 | | |
| | 2007 | | | | 1.11 | | | | .51 | | |
(f) After expense reimbursement from the Adviser, where applicable. Ratios do not reflect the effect of custodian fee credits earned on the Fund's net cash on deposit with the custodian bank, where applicable.
(g) The Fund redeemed all $78 million of its outstanding FundNotes during the fiscal year ended December 31, 2008.
N/A The Fund had no retained capital gains for the tax years ended December 31, 2011, December 31, 2010, December 31, 2009 and December 31, 2008.
* Rounds to less than $.01 per share.
See accompanying notes to financial statements.
Nuveen Investments
29
Notes to
FINANCIAL STATEMENTS
1. General Information and Significant Accounting Policies
General Information
Nuveen Tax-Advantaged Total Return Strategy Fund (the "Fund") is a closed-end registered investment company registered under the Investment Company Act of 1940, as amended. The Fund's Common shares are listed on the New York Stock Exchange ("NYSE") and trade under the ticker symbol "JTA." The Fund was organized as a Massachusetts business trust on October 1, 2003.
Effective January 1, 2011, the Fund's adviser, Nuveen Asset Management, a wholly-owned subsidiary of Nuveen Investments, Inc. ("Nuveen"), changed its name to Nuveen Fund Advisors, Inc. ("the Adviser").
The Fund's investment objective is to achieve a high level of after-tax total return consisting primarily of tax-advantaged dividend income and capital appreciation by investing primarily in a portfolio of dividend-paying common stocks that the Fund believes at the time of investment are eligible to pay dividends that may be eligible for favorable federal income taxation at rates applicable to long-term capital gains ("tax-advantaged dividends"). The Fund also invests, to a more limited extent, in preferred securities that are eligible to pay tax-advantaged dividends, as well as in senior loans (both secured and unsecured), domestic corporate bonds, notes and debentures, convertible debt securities and other similar types of corporate instruments, including high-yield debt securities, that are not eligible to pay tax-advantaged dividends. The qualified dividend income provisions of the federal tax code are set to expire on December 31, 2012. In the event that Congress does not extend these provisions, beginning in calendar 2013, dividends previously referred to as "qualified dividends" would be taxed at normal marginal tax rates.
Significant Accounting Policies
The following is a summary of significant accounting policies followed by the Fund in the preparation of its financial statements in accordance with U.S. generally accepted accounting principles ("U.S. GAAP").
Investment Valuation
Common stocks and other equity-type securities are valued at the last sales price on the securities exchange on which such securities are primarily traded and are generally classified as Level 1 for fair value measurement purposes. Securities primarily traded on the NASDAQ National Market ("NASDAQ") are valued, except as indicated below, at the NASDAQ Official Closing Price and are generally classified as Level 1. However, securities traded on a securities exchange or NASDAQ for which there were no transactions on a given day or securities not listed on a securities exchange or NASDAQ are valued at the quoted bid price and are generally classified as Level 2. Prices of certain American Depositary Receipts ("ADR") held by the Fund that trade in only limited volume in the United States are valued based on the last traded price, official closing price, or the most recent bid price of the underlying non-U.S.-traded stock, adjusted as appropriate for the underlying-to-ADR conversion ratio and foreign exchange rate, and from time-to-time may also be adjusted further to take into account material events that may take place after the close of the local non-U.S. market but before the close of the NYSE, which generally represents a transfer from a Level 1 to a Level 2 security.
Prices of fixed-income securities and interest rate swap contracts are provided by a pricing service approved by the Fund's Board of Trustees. These securities are generally classified as Level 2. When price quotes are not readily available, the pricing service establishes a security's fair value using methods that may include consideration of the following: yields or prices of investments of comparable quality, type of issue, coupon, maturity and rating, market quotes or indications of value from security dealers, evaluations of anticipated cash flows or collateral, general market conditions and other information and analysis, including the obligor's credit characteristics considered relevant. In pricing certain securities, particularly less liquid and lower quality securities, the pricing service may consider information about a security, its issuer, or market activity provided by the Adviser. These securities are generally classified as Level 2 or Level 3 depending on the priority of the significant inputs.
Like most fixed-income instruments, the senior and subordinated loans in which the Fund invests are not listed on an organized exchange. The secondary market of such investments may be less liquid relative to markets for other fixed-income securities. Consequently, the value of senior and subordinated loans, determined as described above, may differ significantly from the value
Nuveen Investments
30
that would have been determined had there been an active market for that senior loan. These securities are generally classified as Level 2.
The value of exchange-traded options are based on the mean of the closing bid and ask prices. Exchange-traded options are generally classified as Level 1. Options traded in the over-the-counter market are valued using an evaluated mean price and are generally classified as Level 2.
Repurchase agreements are valued at contract amount plus accrued interest, which approximates market value. These securities are generally classified as Level 2.
Certain securities may not be able to be priced by the pre-established pricing methods as described above. Such securities may be valued by the Fund's Board of Trustees or its designee at fair value. These securities generally include, but are not limited to, restricted securities (securities which may not be publicly sold without registration under the Securities Act of 1933, as amended) for which a pricing service is unable to provide a market price; securities whose trading has been formally suspended; debt securities that have gone into default and for which there is no current market quotation; a security whose market price is not available from a pre-established pricing source; a security with respect to which an event has occurred that is likely to materially affect the value of the security after the market has closed but before the calculation of a Fund's net asset value (as may be the case in non-U.S. markets on which the security is primarily traded) or make it difficult or impossible to obtain a reliable market quotation; and a security whose price, as provided by the pricing service, is not deemed to reflect the security's fair value. As a general principle, the fair value of a security would appear to be the amount that the owner might reasonably expect to receive for it in a current sale. A variety of factors may be considered in determining the fair value of such securities, which may include consideration of the following: yields or prices of investments of comparable quality, type of issue, coupon, maturity and rating, market quotes or indications of value from security dealers, evaluations of anticipated cash flows or collateral, general market conditions and other information and analysis, including the obligor's credit characteristics considered relevant. These securities are generally classified as Level 2 or Level 3 depending on the priority of the significant inputs. Regardless of the method employed to value a particular security, all valuations are subject to review by the Fund's Board of Trustees or its designee.
Refer to Footnote 2—Fair Value Measurements for further details on the leveling of securities held by the Fund as of the end of the reporting period.
Investment Transactions
Investment transactions are recorded on a trade date basis. Trade date for senior and subordinated loans purchased in the "primary market" is considered the date on which the loan allocations are determined. Trade date for senior and subordinated loans purchased in the "secondary market" is the date on which the transaction is entered into. Realized gains and losses from investment transactions are determined on the specific identification method, which is the same basis used for federal income tax purposes. Investments purchased on a when-issued/delayed delivery basis may have extended settlement periods. Any investments so purchased are subject to market fluctuation during this period. The Fund has instructed the custodian to segregate assets with a current value at least equal to the amount of the when-issued/delayed delivery purchase commitments. At December 31, 2011, the Fund had outstanding when-issued/delayed delivery purchase commitments of $2,373,903.
Investment Income
Dividend income is recorded on the ex-dividend date or, for foreign securities, when information is available. Interest income, which reflects the amortization of premiums and includes accretion of discounts for financial reporting purposes, is recorded on an accrual basis. Interest income also reflects paydown gains and losses and fee income, if any. Fee income consists primarily of amendment fees. Amendment fees are earned as compensation for evaluating and accepting changes to an original senior loan agreement and are recognized when received. Other income includes the increase of the net realizable value of the receivable for matured senior loans recognized during the current fiscal period, when applicable.
Income Taxes
The Fund intends to distribute substantially all of its investment company taxable income to shareholders and to otherwise comply with the requirements of Subchapter M of the Internal Revenue Code applicable to regulated investment companies ("RICs"). In any year when the Fund realizes net capital gains, the Fund may choose to distribute all or a portion of its net capital gains to shareholders, or alternatively, to retain all or a portion of its net capital gains and pay federal corporate income taxes on such retained gains.
For all open tax years and all major taxing jurisdictions, management of the Fund has concluded that there are no significant uncertain tax positions that would require recognition in the financial statements. Open tax years are those that are open for examination by taxing authorities (i.e., generally the last four tax year ends and the interim tax period since then). Furthermore, management of the Fund is also not aware of any tax positions for which it is reasonably possible that the total amounts of unrecognized tax benefits will significantly change in the next twelve months.
Nuveen Investments
31
Notes to
FINANCIAL STATEMENTS (continued)
Dividends and Distributions to Common Shareholders
Distributions to Common shareholders are recorded on the ex-dividend date. The amount and timing of distributions are determined in accordance with federal income tax regulations, which may differ from U.S. GAAP.
The Fund makes quarterly cash distributions to Common shareholders of a stated dollar amount per share. Subject to approval and oversight by the Fund's Board of Trustees, the Fund seeks to maintain a stable distribution level designed to deliver the long-term return potential of the Fund's investment strategy through regular quarterly distributions (a "Managed Distribution Program"). Total distributions during a calendar year generally will be made from the Fund's net investment income, net realized capital gains and net unrealized capital gains in the Fund's portfolio, if any. The portion of distributions paid attributed to net unrealized gains, if any, is distributed from the Fund's assets and is treated by shareholders as a non-taxable distribution ("Return of Capital") for tax purposes. In the event that total distributions during a calendar year exceed the Fund's total return on net asset value, the difference will reduce net asset value per share. If the Fund's total return on net asset value exceeds total distributions during a calendar year, the excess will be reflected as an increase in net asset value per share. The final determination of the source and character of all distributions for the fiscal year are made after the end of the fiscal year and are reflected in the financial statements contained in the annual report as of December 31 each year.
The actual character of distributions made by the Fund during the fiscal years ended December 31, 2011 and December 31, 2010, are reflected in the accompanying statements.
FundPreferred Shares
The Fund is authorized to issue auction rate preferred ("FundPreferred") shares. During the fiscal year ended December 31, 2009, the Fund redeemed all $45,000,000 of its outstanding FundPreferred shares, at liquidation value.
Options Transactions
The Fund is subject to equity price risk in the normal course of pursuing its investment objectives and is authorized to purchase and write (sell) call and put options on securities, futures, swaps ("swaptions") or currencies, in an attempt to manage such risk. The purchase of options involves the risk of loss of all or a part of the cash paid for the options (the premium). The market risk associated with purchasing options is limited to the premium paid. The counterparty credit risk of purchasing options, however, needs also to take into account the current value of the option, as this is the performance expected from the counterparty. When the Fund purchases an option, an amount equal to the premium paid (the premium plus commission) is recognized as a component of "Call and/or Put options purchased, at value" on the Statement of Assets and Liabilities. When the Fund writes an option, an amount equal to the net premium received (the premium less commission) is recognized as a component of "Call and/or Put options written, at value" on the Statement of Assets and Liabilities and is subsequently adjusted to reflect the current value of the written option until the option is exercised or expires or the Fund enters into a closing purchase transaction. The changes in the value of options purchased during the fiscal period are recognized as a component of "Change in net unrealized appreciation (depreciation) of call and/or put options purchased" on the Statement of Operations. The changes in the value of options written during the fiscal period are recognized as a component of "Change in net unrealized appreciation (depreciation) of call and/or put options written" on the Statement of Operations. When an option is exercised or expires or a Fund enters into a closing purchase transaction, the difference between the net premium received and any amount paid at expiration or on executing a closing purchase transaction, including commission, is recognized as a component of "Net realized gain (loss) from call/put options purchased and/or written" on the Statement of Operations. The Fund, as a writer of an option, has no control over whether the underlying instrument may be sold (called) or purchased (put) and as a result bears the risk of an unfavorable change in the market value of the instrument underlying the written option. There is also the risk the Fund may not be able to enter into a closing transaction because of an illiquid market.
During the fiscal year ended December 31, 2011, the Fund wrote covered call options on individual stocks held in its portfolio to enhance returns while foregoing some upside potential of its equity portfolio.
Nuveen Investments
32
The Fund did not purchase call or put options or write put options during the fiscal year ended December 31, 2011. The average notional amount of call options written during the fiscal year ended December 31, 2011, was as follows:
| Average notional amount of call options written* | | $ | (5,453,860 | ) | |
* The average notional amount is calculated based on the outstanding notional at the beginning of the fiscal year and at the end of each fiscal quarter within the current fiscal year.
Refer to Footnote 3—Derivative Instruments and Hedging Activities and Footnote 5—Investment Transactions for further details on options activity.
Interest Rate Swap Contracts
The Fund is subject to interest rate risk in the normal course of pursuing its investment objectives and is authorized to invest in interest rate swap transactions in an attempt to manage such risk. The Fund's use of interest rate swap contracts is intended to mitigate the negative impact that an increase in short-term interest rates could have on Common share net earnings as a result of leverage. Interest rate swap contracts involve the Fund's agreement with the counterparty to pay or receive a fixed rate payment in exchange for the counterparty receiving or paying a variable rate payment that is intended to approximate the Fund's variable rate payment obligation on FundPreferred shares or any variable rate borrowing. The payment obligation is based on the notional amount of the interest rate swap contract. Interest rate swap contracts do not involve the delivery of securities or other underlying assets or principal. Accordingly, the risk of loss with respect to the swap counterparty on such transactions is limited to the net amount of interest payments that the Fund is to receive. Interest rate swap positions are valued daily. The Fund accrues the fixed rate payment expected to be paid or received and the variable rate payment expected to be received or paid on interest rate swap contracts on a daily basis, and recognizes the daily change in the fair value of the Fund's contractual rights and obligations under the contracts. The net amount recorded for these transactions for each counterparty is recognized on the Statement of Assets and Liabilities as a component of "Unrealized appreciation or depreciation on interest rate swaps, net" with the change during the fiscal period recognized on the Statement of Operations as a component of "Change in net unrealized appreciation (depreciation) of interest rate swaps." Income received or paid by the Fund is recognized as a component of "Net realized gain (loss) from interest rate swaps" on the Statement of Operations, in addition to the net realized gains or losses recognized upon the termination of an interest rate swap contract and are equal to the difference between the Fund's basis in the interest rate swap and the proceeds from (or cost of) the closing transaction. Payments received or made at the beginning of the measurement period are recognized as a component of "Interest rate swap premiums paid and/or received" on the Statement of Assets and Liabilities. For tax purposes, periodic payments are treated as ordinary income or expense.
During the fiscal year ended December 31, 2011, the Fund entered into interest rate swap contracts to partially fix the interest cost of leverage, which the Fund uses through the use of bank borrowings.
The average notional amount of interest rate swap contracts outstanding during the fiscal year ended December 31, 2011, was as follows:
| Average notional amount of interest rate swap contracts outstanding* | | $ | 33,540,000 | | |
* The average notional amount is calculated based on the outstanding notional at the beginning of the fiscal year and at the end of each fiscal quarter within the current fiscal year.
Refer to Footnote 3—Derivative Instruments and Hedging Activities for further details on interest rate swap contract activity.
Market and Counterparty Credit Risk
In the normal course of business the Fund may invest in financial instruments and enter into financial transactions where risk of potential loss exists due to changes in the market (market risk) or failure of the other party to the transaction to perform (counterparty credit risk). The potential loss could exceed the value of the financial assets recorded on the financial statements. Financial assets, which potentially expose the Fund to counterparty credit risk, consist principally of cash due from counterparties on forward, option and swap transactions, when applicable. The extent of the Fund's exposure to counterparty credit risk in respect to these financial assets approximates their carrying value as recorded on the Statement of Assets and Liabilities. Futures contracts, when applicable, expose the Fund to minimal counterparty credit risk as they are exchange traded and the exchange's clearinghouse, which is counterparty to all exchange traded futures, guarantees the futures contract against default.
The Fund helps manage counterparty credit risk by entering into agreements only with counterparties the Adviser believes have the financial resources to honor their obligations and by having the Adviser monitor the financial stability of the counterparties. Additionally, counterparties may be required to pledge collateral daily (based on the daily valuation of the financial asset) on behalf of the Fund with a value approximately equal to the amount of any unrealized gain above a pre-determined threshold. Reciprocally, when the Fund has an unrealized loss, the Fund has instructed the custodian to pledge assets of the Fund as collateral with a value approximately equal to the amount of the unrealized loss above a pre-determined threshold. Collateral pledges are monitored and subsequently adjusted if and when the valuations fluctuate, either up or down, by at least the pre-determined threshold amount.
Nuveen Investments
33
Notes to
FINANCIAL STATEMENTS (continued)
Repurchase Agreements
In connection with transactions in repurchase agreements, it is the Fund's policy that its custodian take possession of the underlying collateral securities, the fair value of which exceeds the principal amount of the repurchase transaction, including accrued interest, at all times. If the counterparty defaults, and the fair value of the collateral declines, realization of the collateral may be delayed or limited.
Zero Coupon Securities
The Fund is authorized to invest in zero coupon securities. A zero coupon security does not pay a regular interest coupon to its holders during the life of the security. Tax-exempt income to the holder of the security comes from accretion of the difference between the original purchase price of the security at issuance and the par value of the security at maturity and is effectively paid at maturity. The market prices of zero coupon securities generally are more volatile than the market prices of securities that pay interest periodically.
Custodian Fee Credit
The Fund has an arrangement with the custodian bank whereby certain custodian fees and expenses are reduced by net credits earned on the Fund's cash on deposit with the bank. Such deposit arrangements are an alternative to overnight investments. Credits for cash balances may be offset by charges for any days on which the Fund overdraws its account at the custodian bank.
Indemnifications
Under the Fund's organizational documents, its officers and trustees are indemnified against certain liabilities arising out of the performance of their duties to the Fund. In addition, in the normal course of business, the Fund enters into contracts that provide general indemnifications to other parties. The Fund's maximum exposure under these arrangements is unknown as this would involve future claims that may be made against the Fund that have not yet occurred. However, the Fund has not had prior claims or losses pursuant to these contracts and expects the risk of loss to be remote.
Use of Estimates
The preparation of financial statements in conformity with U.S. GAAP requires management to make estimates and assumptions that affect the reported amounts of assets and liabilities at the date of the financial statements and the reported amounts of increases and decreases in net assets applicable to Common shares from operations during the reporting period. Actual results may differ from those estimates.
2. Fair Value Measurements
Fair value is defined as the price that the Fund would receive upon selling an investment or transferring a liability in an orderly transaction to an independent buyer in the principal or most advantageous market for the investment. A three-tier hierarchy is used to maximize the use of observable market data and minimize the use of unobservable inputs and to establish classification of fair value measurements for disclosure purposes. Observable inputs reflect the assumptions market participants would use in pricing the asset or liability. Observable inputs are based on market data obtained from sources independent of the reporting entity. Unobservable inputs reflect the reporting entity's own assumptions about the assumptions market participants would use in pricing the asset or liability. Unobservable inputs are based on the best information available in the circumstances. The three-tier hierarchy of inputs is summarized in the three broad levels listed below:
Level 1 — Quoted prices in active markets for identical securities.
Level 2 — Other significant observable inputs (including quoted prices for similar securities, interest rates, prepayment speeds, credit risk, etc.).
Level 3 — Significant unobservable inputs (including management's assumptions in determining the fair value of investments).
Nuveen Investments
34
The inputs or methodologies used for valuing securities are not an indication of the risk associated with investing in those securities. The following is a summary of the Fund's fair value measurements as of December 31, 2011:
| | | Level 1 | | Level 2 | | Level 3 | | Total | |
| Investments: | |
| Common Stocks* | | $ | 150,105,637 | | | $ | 353,964 | | | $ | — | | | $ | 150,459,601 | | |
| Convertible Preferred Securities | | | 737,800 | | | | — | | | | — | | | | 737,800 | | |
| $25 Par (or similar) Preferred Securities | | | 7,605,928 | | | | 4,266,225 | | | | — | | | | 11,872,153 | | |
| Variable Rate Senior Loan Interests | | | — | | | | 48,076,100 | | | | — | | | | 48,076,100 | | |
| Capital Preferred Securities | | | — | | | | 1,021,310 | | | | — | | | | 1,021,310 | | |
| Short-Term Investments | | | — | | | | 10,073,947 | | | | — | | | | 10,073,947 | | |
| Derivatives: | |
| Interest Rate Swaps** | | | — | | | | (1,093,470 | ) | | | — | | | | (1,093,470 | ) | |
| Call Options Written | | | (165,850 | ) | | | — | | | | — | | | | (165,850 | ) | |
| Total | | $ | 158,283,515 | | | $ | 62,698,076 | | | $ | — | | | $ | 220,981,591 | | |
* Refer to the Fund's Portfolio of Investments for industry breakdown of Common Stocks classified as Level 2.
** Represents net unrealized appreciation (depreciation) as reported in the Fund's Portfolio of Investments.
During the fiscal year ended December 31, 2011, the Fund recognized no significant transfers to or from Level 1, Level 2 or Level 3.
3. Derivative Instruments and Hedging Activities
The Fund records derivative instruments at fair value, with changes in fair value recognized on the Statement of Operations, when applicable. Even though the Fund's investments in derivatives may represent economic hedges, they are not considered to be hedge transactions for financial reporting purposes. For additional information on the derivative instruments in which the Fund was invested during and at the end of the reporting period, refer to the Portfolio of Investments, Financial Statements and Footnote 1—General Information and Significant Accounting Policies.
The following table presents the fair value of all derivative instruments held by the Fund as of December 31, 2011, the location of these instruments on the Statement of Assets and Liabilities, and the primary underlying risk exposure.
| | | | | Location on the Statement of Assets and Liabilities | |
| Underlying | | Derivative | | Asset Derivatives | | Liability Derivatives | |
| Risk Exposure | | Instrument | | Location | | Value | | Location | | Value | |
| Equity Price | | Options | | | — | | | $ | — | | | Call options written, at value | | $ | 165,850 | | |
| Interest Rate | | Swaps | | Unrealized depreciation on
interest rate swaps, net* | | | 2,292
| | | Unrealized depreciation on
interest rate swaps, net* | | | 1,095,762 | | |
| Total | | | | | | $ | 2,292 | | | | | $ | 1,261,612 | | |
* Value represents cumulative gross appreciation (depreciation) of interest rate swap contracts as reported in the Fund's Portfolio of Investments. The Statement of Assets and Liabilities presents the net unrealized appreciation (depreciation) of all interest rate swap contracts as "Unrealized depreciation on interest rate swaps, net."
The following tables present the amount of net realized gain (loss) and change in net unrealized appreciation (depreciation) recognized for the fiscal year ended December 31, 2011, on derivative instruments, as well as the primary risk exposure associated with each.
| Net Realized Gain (Loss) from Call Options Written | |
| Risk Exposure | |
| Equity Price | | $ | 1,495,405 | | |
| Net Realized Gain (Loss) from Interest Rate Swaps | |
| Risk Exposure | |
| Interest Rate | | $ | (366,793 | ) | |
| Change in Net Unrealized Appreciation (Depreciation) of Call Options Written | |
| Risk Exposure | |
| Equity Price | | $ | 435,726 | | |
| Change in Net Unrealized Appreciation (Depreciation) of Interest Rate Swaps | |
| Risk Exposure | |
| Interest Rate | | $ | (1,093,470 | ) | |
Nuveen Investments
35
Notes to
FINANCIAL STATEMENTS (continued)
4. Fund Shares
Common Shares
Transactions in Common shares were as follows:
| | | Year Ended
12/31/11 | | Year Ended
12/31/10 | |
| Common shares repurchased and retired | | | (30,062 | ) | | | — | | |
| Weighted average: | |
| Price per Common share repurchased and retired | | $ | 9.43 | | | $ | — | | |
| Discount per Common share repurchased and retired | | | 14.39 | % | | | — | | |
5. Investment Transactions
Purchases and sales (including maturities but excluding short-term investments and derivative transactions) during the fiscal year ended December 31, 2011, aggregated $132,526,803 and $124,880,572, respectively.
Transactions in call options written during the fiscal year ended December 31, 2011, were as follows:
| | | Number of
Contracts | | Premiums
Received | |
| Options outstanding, beginning of the year | | | 8,577 | | | $ | 654,128 | | |
| Options written | | | 6,348 | | | | 1,395,421 | | |
| Options terminated in closing purchase transactions | | | (7,532 | ) | | | (978,085 | ) | |
| Options exercised | | | (706 | ) | | | (177,621 | ) | |
| Options expired | | | (5,337 | ) | | | (508,229 | ) | |
| Options outstanding, end of the year | | | 1,350 | | | $ | 385,614 | | |
6. Income Tax Information
The following information is presented on an income tax basis. Differences between amounts for financial statement and federal income tax purposes are primarily due to the treatment of paydown gains and losses, recognition of premium amortization and timing differences in recognizing certain gains and losses on investment transactions. To the extent that differences arise that are permanent in nature, such amounts are reclassified within the capital accounts as detailed below. Temporary differences do not require reclassification. Temporary and permanent differences do not impact the net asset value of the Fund.
At December 31, 2011, the cost and unrealized appreciation (depreciation) of investments (excluding investments in derivatives), as determined on a federal income tax basis, were as follows:
| Cost of investments | | $ | 223,668,418 | | |
| Gross unrealized: | |
| Appreciation | | $ | 16,899,376 | | |
| Depreciation | | | (18,326,883 | ) | |
| Net unrealized appreciation (depreciation) of investments | | $ | (1,427,507 | ) | |
Permanent differences, primarily due to paydowns and tax basis earnings and profits adjustments, resulted in reclassifications among the Fund's components of Common share net assets at December 31, 2011, the Fund's tax year end, as follows:
| Paid-in-surplus | | $ | (1,256,953 | ) | |
| Undistributed (Over-distribution) of net investment income | | | 545,469 | | |
| Accumulated net realized gain (loss) | | | 711,484 | | |
Nuveen Investments
36
The tax components of undistributed net ordinary income and net long-term capital gains at December 31, 2011, the Fund's tax year end, were as follows:
| Undistributed net ordinary income | | $ | — | | |
| Undistributed net long-term capital gains | | | — | | |
The tax character of distributions paid during the Fund's tax years ended December 31, 2011 and December 31, 2010, was designated for purposes of the dividends paid deduction as follows:
| 2011 | |
| Distributions from net ordinary income* | | $ | 5,537,134 | | |
| Distributions from net long-term capital gains | | | — | | |
| Return of capital | | | 6,944,101 | | |
| 2010 | |
| Distributions from net ordinary income* | | $ | 13,045,853 | | |
| Distributions from net long-term capital gains | | | — | | |
| Return of capital | | | — | | |
* Net ordinary income consists of net taxable income derived from dividends and interest, and current year earnings and profits attributable to realized gains.
At December 31, 2011, the Fund's tax year end, the Fund had unused capital loss carryforwards available for federal income tax purposes to be applied against future capital gains, if any. If not applied, the carryforwards will expire as follows:
| Expiration: | |
| December 31, 2016 | | $ | 57,123,966 | | |
| December 31, 2017 | | | 32,157,951 | | |
| Total | | $ | 89,281,917 | | |
During the tax year ended December 31, 2011, the Fund utilized $1,256,953 of its capital loss carryforwards.
On December 22, 2010, the Regulated Investment Company Modernization Act of 2010 (the "Act") was enacted, which changed various technical rules governing the tax treatment of RICs. The changes are generally effective for taxable years beginning after the date of enactment. One of the more prominent changes addresses capital loss carryforwards. Under the Act, the Fund will be permitted to carry forward capital losses incurred in taxable years beginning after the date of enactment for an unlimited period. However, any losses incurred during those future taxable years will be required to be utilized prior to the losses incurred in pre-enactment taxable years, which carry an expiration date. As a result of this ordering rule, pre-enactment capital loss carryforwards may be more likely to expire unused. Additionally, post-enactment capital loss carryforwards will retain their character as either short-term or long-term capital losses rather than being considered all short-term as permitted under previous regulation.
The Act also contains several provisions aimed at preserving the character of distributions made by fiscal year RICs during the portion of its taxable year ending after October 31 or December 31, reducing the circumstances under which RICs might be required to file amended Forms 1099 to restate previously reported distributions.
During the Fund's tax year ended December 31, 2011, there were no post-enactment capital losses generated.
7. Management Fees and Other Transactions with Affiliates
The Fund's management fee consists of two components—a fund-level fee, based only on the amount of assets within the Fund, and a complex-level fee, based on the aggregate amount of all eligible fund assets managed by the Adviser. This pricing structure enables Fund shareholders to benefit from growth in the assets within the Fund as well as from growth in the amount of complex-wide assets managed by the Adviser.
The annual fund-level fee, payable monthly, is calculated according to the following schedule:
| Average Daily Managed Assets * | | Fund-Level Fee Rate | |
| For the first $500 million | | | .7000 | % | |
| For the next $500 million | | | .6750 | | |
| For the next $500 million | | | .6500 | | |
| For the next $500 million | | | .6250 | | |
| For managed assets over $2 billion | | | .6000 | | |
Nuveen Investments
37
Notes to
FINANCIAL STATEMENTS (continued)
The annual complex-level fee, payable monthly, is calculated according to the following schedule:
| Complex-Level Managed Asset Breakpoint Level * | | Effective Rate at Breakpoint Level | |
| $55 billion | | | .2000 | % | |
| $56 billion | | | .1996 | | |
| $57 billion | | | .1989 | | |
| $60 billion | | | .1961 | | |
| $63 billion | | | .1931 | | |
| $66 billion | | | .1900 | | |
| $71 billion | | | .1851 | | |
| $76 billion | | | .1806 | | |
| $80 billion | | | .1773 | | |
| $91 billion | | | .1691 | | |
| $125 billion | | | .1599 | | |
| $200 billion | | | .1505 | | |
| $250 billion | | | .1469 | | |
| $300 billion | | | .1445 | | |
* For the fund-level and complex-level fees, managed assets include closed-end fund assets managed by the Adviser that are attributable to financial leverage. For these purposes, financial leverage includes the funds' use of preferred stock and borrowings and certain investments in the residual interest certificates (also called inverse floating rate securities) in tender option bond (TOB) trusts, including the portion of assets held by a TOB trust that has been effectively financed by the trust's issuance of floating rate securities, subject to an agreement by the Adviser as to certain funds to limit the amount of such assets for determining managed assets in certain circumstances. The complex-level fee is calculated based upon the aggregate daily managed assets of all Nuveen Funds that constitute "eligible assets". Eligible assets do not include assets attributable to investments in other Nuveen Funds or assets in excess of $2 billion added to the Nuveen Fund complex in connection with the Adviser's assumption of the management of the former First American Funds effective January 1, 2011. As of December 31, 2011, the complex-level fee rate for the Fund was .1767%.
The management fee compensates the Adviser for overall investment advisory and administrative services and general office facilities. The Adviser is responsible for the Fund's overall strategy and asset allocation decisions. The Adviser has entered into sub-advisory agreements with NWQ Investment Management Company, LLC ("NWQ") and Symphony Asset Management LLC ("Symphony"), each a subsidiary of Nuveen. The Adviser is responsible for overseeing the Fund's investments in interest rate swap contracts. NWQ manages the portion of the Fund's investment portfolio allocated to dividend-paying common and preferred stocks, including ADRs and the Fund's options strategy. Symphony manages the portion of the Fund's investment portfolio allocated to senior loans and other debt instruments. NWQ and Symphony are compensated for their services to the Fund from the management fees paid to the Adviser.
The Fund pays no compensation directly to those of its trustees who are affiliated with the Adviser or to its officers, all of whom receive remuneration for their services to the Fund from the Adviser or its affiliates. The Board of Trustees has adopted a deferred compensation plan for independent trustees that enables trustees to elect to defer receipt of all or a portion of the annual compensation they are entitled to receive from certain Nuveen-advised funds. Under the plan, deferred amounts are treated as though equal dollar amounts had been invested in shares of select Nuveen-advised funds.
For the first eight years of the Fund's operations, the Adviser has agreed to reimburse the Fund, as a percentage of average daily managed assets, for fees and expenses in the amounts and for the time periods set forth below:
Year Ending
January 31, | | Year Ending
January 31, | |
| | 2004 | * | | | .32 | % | | | 2009 | | | | .32 | % | |
| | 2005 | | | | .32 | | | | 2010 | | | | .24 | | |
| | 2006 | | | | .32 | | | | 2011 | | | | .16 | | |
| | 2007 | | | | .32 | | | | 2012 | | | | .08 | | |
| | 2008 | | | | .32 | | | | | | | | | | |
* From the commencement of operations.
Nuveen Investments
38
The Adviser has not agreed to reimburse the Fund for any portion of its fees and expenses beyond January 31, 2012.
During the fiscal year ended December 31, 2011, the Fund was reimbursed $6,469 by Nuveen to offset a portion of expenses incurred as a result of the Fund's anticipated Common share shelf offering filing with the Securities and Exchange Commission, which ultimately did not occur.
8. Senior Loan Commitments
Unfunded Commitments
Pursuant to the terms of certain of the variable rate senior loan agreements, the Fund may have unfunded senior loan commitments. The Fund will maintain with its custodian, cash, liquid securities and/or liquid senior loans having an aggregate value at least equal to the amount of unfunded senior loan commitments. At December 31, 2011, the Fund had no unfunded senior loan commitments.
Participation Commitments
With respect to the senior loans held in the Fund's portfolio, the Fund may: 1) invest in assignments; 2) act as a participant in primary lending syndicates; or 3) invest in participations. If the Fund purchases a participation of a senior loan interest, the Fund would typically enter into a contractual agreement with the lender or other third party selling the participation, rather than directly with the Borrower. As such, the Fund not only assumes the credit risk of the Borrower, but also that of the selling participant or other persons interpositioned between the Fund and the Borrower. At December 31, 2011, there were no such outstanding participation commitments.
9. Borrowing Arrangements
The Fund has entered into $69 million (maximum commitment amount) prime brokerage facility with BNP Paribas Prime Brokerage, Inc. ("BNP") as a means of financial leverage. On January 19, 2011, the Fund amended its prime brokerage facility with BNP and increased its maximum commitment amount from $60 million to $66 million and on November 9, 2011, increased its maximum commitment amount from $66 million to $69 million. As of December 31, 2011, the Fund's outstanding balance on these borrowings was $67.9 million. During the fiscal year ended December 31, 2011, the average daily balance outstanding and average annual interest rate on these borrowings were $56.3 million and 1.29%, respectively.
In order to maintain this borrowing facility, the Fund must meet certain collateral, asset coverage and other requirements. Borrowings outstanding are fully secured by securities held in the Fund's portfolio of investments. Interest is charged on these borrowings at 3-Month LIBOR (London Inter-bank Offered Rate) plus .95% on the amount borrowed and .50% on the undrawn balance. The Fund also incurred a one-time .25% amendment fee on each increase to the maximum commitment amount, which was fully expensed during the current reporting period.
Effective January 9, 2012, interest charged on the amount borrowed changed from 3-Month LIBOR plus .95% to 3-Month LIBOR plus .85%. All other terms remain unchanged.
Borrowings outstanding are recognized as "Borrowings" on the Statement of Assets and Liabilities. Interest expense incurred on the borrowed amount and undrawn balance and the one-time amendment fee are recognized as a component of "Interest expense on borrowings" on the Statement of Operations.
10. New Accounting Pronouncements
Financial Accounting Standards Board ("FASB") Transfers and Servicing (Topic 860): Reconsideration of Effective Control for Repurchase Agreements
On April 15, 2011, the FASB issued Accounting Standards Update ("ASU") No. 2011-03 ("ASU No. 2011-03"). The guidance in ASU No. 2011-03 is intended to improve the accounting for repurchase agreements and other similar agreements. Specifically, ASU No. 2011-03 modifies the criteria for determining when these transactions would be accounted for as financings transactions (secured borrowings/lending agreements) as opposed to sales (purchases) transactions with commitments to repurchase (resell). The effective date of ASU No. 2011-03 is for interim and annual periods beginning on or after December 15, 2011. At this time, management is evaluating the implications of this guidance and the impact it will have to the financial statement amounts and footnote disclosures, if any.
Fair Value Measurements and Disclosures
On May 12, 2011, the FASB issued ASU No. 2011-04 modifying Topic 820, Fair Value Measurements and Disclosures. At the same time, the International Accounting Standards Board ("IASB") issued International Financial Reporting Standard ("IFRS") 13, Fair Value Measurement. The objective of the FASB and IASB is convergence of their guidance on fair value measurements and disclosures. Specifically, ASU No. 2011-04 requires reporting entities to disclose i) the amounts of any transfers between Level 1 and Level 2 and the reasons for the transfers and ii) for Level 3 fair value measurements, a) quantitative information about significant unobservable inputs used, b) a description of the valuation processes used by the reporting entity and c) a narrative description of the sensitivity of the fair value measurement to changes in unobservable inputs if a change in those inputs might result in a significantly higher or lower fair value measurement. The effective date of ASU No. 2011-04 is for interim and annual periods beginning after December 15, 2011. At this time, management is evaluating the implications of this guidance and the impact it will have to the financial statement amounts and footnote disclosures, if any.
Nuveen Investments
39
Board Members & Officers (Unaudited)
The management of the Funds, including general supervision of the duties performed for the Funds by the Adviser, is the responsibility of the Board Members of the Funds. The number of board members of the Fund is currently set at ten. None of the board members who are not "interested" persons of the Funds (referred to herein as "independent board members") has ever been a director or employee of, or consultant to, Nuveen or its affiliates. The names and business addresses of the board members and officers of the Funds, their principal occupations and other affiliations during the past five years, the number of portfolios each oversees and other directorships they hold are set forth below.
Name, Birthdate
and Address
| | Position(s) Held with
the Funds
| | Year First
Elected or
Appointed
and Term(1) | | Principal Occupation(s)
Including other Directorships
During Past 5 Years
| | Number of Portfolios
in Fund Complex
Overseen by
Board Member | |
| Independent Board Members: | | | | | |
|
| g ROBERT P. BREMNER(2) | | | |
|
8/22/40
333 W. Wacker Drive
Chicago, IL 60606 | | Chairman of
the Board
and Board Member | | 1996
Class III | | Private Investor and Management Consultant; Treasurer and Director, Humanities Council of Washington, D.C.; Board Member, Independent Directors Council (affiliated with the Investment Company Institute.) | | | 238 | | |
|
| g JACK B. EVANS | | | |
|
10/22/48
333 W. Wacker Drive
Chicago, IL 60606 | | Board Member | | 1999
Class III | | President, The Hall-Perrine Foundation, a private philanthropic corporation (since 1996); Director and Chairman, United Fire Group, a publicly held company; member of the Board of Regents for the State of Iowa University System; Director, Source Media Group; Life Trustee of Coe College and the Iowa College Foundation; formerly, Director, Alliant Energy; formerly, Director, Federal Reserve Bank of Chicago; formerly, President and Chief Operating Officer, SCI Financial Group, Inc., a regional financial services firm. | | | 238 | | |
|
| g WILLIAM C. HUNTER | | | |
|
3/6/48
333 W. Wacker Drive
Chicago, IL 60606 | | Board Member | | 2004
Class I | | Dean, Tippie College of Business, University of Iowa (since 2006); Director (since 2004) of Xerox Corporation; Director (since 2005), Beta Gamma Sigma International Honor Society; Director of Wellmark, Inc. (since 2009); formerly, Dean and Distinguished Professor of Finance, School of Business at the University of Connecticut (2003-2006); previously, Senior Vice President and Director of Research at the Federal Reserve Bank of Chicago (1995-2003); formerly, Director (1997-2007), Credit Research Center at Georgetown University. | | | 238 | | |
|
Nuveen Investments
40
Name, Birthdate
and Address
| | Position(s) Held with
the Funds
| | Year First
Elected or
Appointed
and Term(1) | | Principal Occupation(s)
Including other Directorships
During Past 5 Years
| | Number of Portfolios
in Fund Complex
Overseen by
Board Member | |
| Independent Board Members (continued): | | | | | |
|
| g DAVID J. KUNDERT(2) | | | |
|
10/28/42
333 W. Wacker Drive
Chicago, IL 60606 | | Board Member | | 2005
Class II | | Director, Northwestern Mutual Wealth Management Company; retired (since 2004) as Chairman, JPMorgan Fleming Asset Management, President and CEO, Banc One Investment Advisors Corporation, and President, One Group Mutual Funds; prior thereto, Executive Vice President, Banc One Corporation and Chairman and CEO, Banc One Investment Management Group; Member, Board of Regents, Luther College; member of the Wisconsin Bar Association; member of Board of Directors, Friends of Boerner Botanical Gardens; member of Board of Directors and Chair of Investment Committee, Greater Milwaukee Foundation. | | | 238 | | |
|
| g WILLIAM J. SCHNEIDER(2) | | | |
|
9/24/44
333 W. Wacker Drive
Chicago, IL 60606 | | Board Member | | 1997
Class III | | Chairman of Miller-Valentine Partners Ltd., a real estate investment company; formerly, Senior Partner and Chief Operating Officer (retired 2004) of Miller- Valentine Group; member, University of Dayton Business School Advisory Council; member, Mid-America Health System Board; formerly, member and chair, Dayton Philharmonic Orchestra Association; formerly, member, Business Advisory Council, Cleveland Federal Reserve Bank. | | | 238 | | |
|
| g JUDITH M. STOCKDALE | | | |
|
12/29/47
333 W. Wacker Drive
Chicago, IL 60606 | | Board Member | | 1997
Class I | | Executive Director, Gaylord and Dorothy Donnelley Foundation (since 1994); prior thereto, Executive Director, Great Lakes Protection Fund (1990-1994). | | | 238 | | |
|
| g CAROLE E. STONE(2) | | | |
|
6/28/47
333 W. Wacker Drive
Chicago, IL 60606 | | Board Member | | 2007
Class I | | Director, Chicago Board Options Exchange (since 2006); Director, C2 Options Exchange, Incorporated (since 2009); formerly, Commissioner, New York State Commission on Public Authority Reform (2005-2010); formerly, Chair, New York Racing Association Oversight Board (2005-2007). | | | 238 | | |
|
| g VIRGINIA L. STRINGER | | | |
|
8/16/44
333 W. Wacker Drive
Chicago, IL 60606 | | Board Member | | | 2011 | | | Board Member, Mutual Fund Directors Forum; Member, Governing Board, Investment Company Institute's Independent Directors Council; governance consultant and non-profit board member; former Owner and President, Strategic Management Resources, Inc. a management consulting firm; previously, held several executive positions in general management, marketing and human resources at IBM and The Pillsbury Company; Independent Director, First American Fund Complex (1987-2010) and Chair (1997-2010). | | | 238 | | |
|
Nuveen Investments
41
Board Members & Officers (Unaudited) (continued)
Name, Birthdate
and Address
| | Position(s) Held with
the Funds
| | Year First
Elected or
Appointed
and Term(1) | | Principal Occupation(s)
Including other Directorships
During Past 5 Years
| | Number of Portfolios
in Fund Complex
Overseen by
Board Member | |
| Independent Board Members (continued): | | | | | |
|
| g TERENCE J. TOTH(2) | | | |
|
9/29/59
333 W. Wacker Drive
Chicago, IL 60606 | | Board Member | | 2008
Class II | | Director, Legal & General Investment Management America, Inc. (since 2008); Managing Partner, Promus Capital (since 2008); formerly, CEO and President, Northern Trust Global Investments (2004-2007); Executive Vice President, Quantitative Management & Securities Lending (2000-2004); prior thereto, various positions with Northern Trust Company (since 1994); member: Goodman Theatre Board (since 2004), Chicago Fellowship Board (since 2005) and Catalyst Schools of Chicago Board (since 2008); formerly, member: Northern Trust Mutual Funds Board (2005-2007), Northern Trust Global Investments Board (2004-2007), Northern Trust Japan Board (2004-2007), Northern Trust Securities Inc. Board (2003-2007) and Northern Trust Hong Kong Board (1997-2004). | | | 238 | | |
|
| Interested Board Member: | | | | | |
|
| g JOHN P. AMBOIAN(3) | | | | | |
|
6/14/61
333 W. Wacker Drive
Chicago, IL 60606 | | Board Member | | 2008
Class II | | Chief Executive Officer and Chairman (since 2007) and Director (since 1999) of Nuveen Investments, Inc., formerly, President (1999-2007); Chief Executive Officer (since 2007) of Nuveen Investments Advisers, Inc.; Director (since 1998) formerly, Chief Executive Officer (2007-2010) of Nuveen Fund Advisors, Inc. | | | 238 | | |
|
Name, Birthdate
and Address
| | Position(s) Held with
the Funds
| | Year First
Elected or
Appointed(4)
| | Principal Occupation(s)
During Past 5 Years
| | Number of Portfolios
in Fund Complex
Overseen by
Officer | |
| Officers of the Funds: | | | | | |
|
| g GIFFORD R. ZIMMERMAN | | | |
|
9/9/56
333 W. Wacker Drive
Chicago, IL 60606 | | Chief
Administrative
Officer | | | 1988 | | | Managing Director (since 2002), Assistant Secretary and Associate General Counsel of Nuveen Securities, LLC; Managing Director (since 2004) and Assistant Secretary (since 1994) of Nuveen Investments, Inc.; Managing Director (since 2002), Assistant Secretary (since 1997) and Co-General Counsel (since 2011) of Nuveen Fund Advisors, Inc.; Managing Director, Assistant Secretary and Associate General Counsel of Nuveen Asset Management, LLC (since 2011); Managing Director, Associate General Counsel and Assistant Secretary, of Symphony Asset Management LLC (since 2003); Vice President and Assistant Secretary of NWQ Investment Management Company, LLC (since 2002), Nuveen Investments Advisers Inc. (since 2002), Tradewinds Global Investors LLC, and Santa Barbara Asset Management, LLC (since 2006), Nuveen HydePark Group LLC and Nuveen Investment Solutions, Inc. (since 2007) and of Winslow Capital Management Inc. (since 2010); Chief Administrative Officer and Chief Compliance Officer (since 2006) of Nuveen Commodities Asset Management, LLC; Chartered Financial Analyst. | | | 238 | | |
|
Nuveen Investments
42
Name, Birthdate
and Address
| | Position(s) Held with
the Funds
| | Year First
Elected or
Appointed(4)
| | Principal Occupation(s)
During Past 5 Years
| | Number of Portfolios
in Fund Complex
Overseen by
Officer | |
| Officers of the Funds (continued): | | | | | |
|
| g WILLIAM ADAMS IV | | | |
|
6/9/55
333 W. Wacker Drive
Chicago, IL 60606 | | Vice President | | | 2007 | | | Senior Executive Vice President, Global Structured Products (since 2010), formerly, Executive Vice President (1999-2010) of Nuveen Securities, LLC; Co-President of Nuveen Fund Advisors, Inc. (since 2011); President (since August 2011), formerly, Managing Director (2010-2011) of Nuveen Commodities Asset Management, LLC. | | | 133 | | |
|
| g CEDRIC H. ANTOSIEWICZ | | | |
|
1/11/62
333 W. Wacker Drive
Chicago, IL 60606 | | Vice President | | | 2007 | | | Managing Director of Nuveen Securities, LLC. | | | 133 | | |
|
| g MARGO L. COOK | | | |
|
4/11/64
333 W. Wacker Drive
Chicago, IL 60606 | | Vice President | | | 2009 | | | Executive Vice President (since 2008) of Nuveen Investments, Inc. and of Nuveen Fund Advisors, Inc. (since 2011); Managing Director-Investment Services of Nuveen Commodities Asset Management, LLC (since August 2011), previously, Head of Institutional Asset Management (2007-2008) of Bear Stearns Asset Management; Head of Institutional Asset Management (1986-2007) of Bank of NY Mellon; Chartered Financial Analyst. | | | 238 | | |
|
| g LORNA C. FERGUSON | | | |
|
10/24/45
333 W. Wacker Drive
Chicago, IL 60606 | | Vice President | | | 1998 | | | Managing Director (since 2005) of Nuveen Fund Advisors, Inc. and Nuveen Securities, LLC (since 2004). | | | 238 | | |
|
| g STEPHEN D. FOY | | | |
|
5/31/54
333 W. Wacker Drive
Chicago, IL 60606 | | Vice President
and Controller | | | 1998 | | | Senior Vice President (since 2010), formerly, Vice President (2005-2010) and Funds Controller of Nuveen Securities, LLC; Vice President of Nuveen Fund Advisors, Inc.; Chief Financial Officer of Nuveen Commodities Asset Management, LLC; (since 2010) Certified Public Accountant. | | | 238 | | |
|
| g SCOTT S. GRACE | | | |
|
8/20/70
333 W. Wacker Drive
Chicago, IL 60606 | | Vice President
and Treasurer | | | 2009 | | | Managing Director, Corporate Finance & Development, Treasurer (since 2009) of Nuveen Securities, LLC; Managing Director and Treasurer (since 2009) of Nuveen Fund Advisors, Inc., Nuveen Investment Solutions, Inc., Nuveen Investments Advisers, Inc., Nuveen Investments Holdings Inc. and (since 2011) Nuveen Asset Management, LLC; Vice President and Treasurer of NWQ Investment Management Company, LLC, Tradewinds Global Investors, LLC, Symphony Asset Management LLC and Winslow Capital Management, Inc.; Vice President of Santa Barbara Asset Management, LLC; formerly, Treasurer (2006-2009), Senior Vice President (2008-2009), previously, Vice President (2006-2008) of Janus Capital Group, Inc.; formerly, Senior Associate in Morgan Stanley's Global Financial Services Group (2000-2003); Chartered Accountant Designation. | | | 238 | | |
|
Nuveen Investments
43
Board Members & Officers (Unaudited) (continued)
Name, Birthdate
and Address
| | Position(s) Held with
the Funds
| | Year First
Elected or
Appointed(4)
| | Principal Occupation(s)
During Past 5 Years
| | Number of Portfolios
in Fund Complex
Overseen by
Officer | |
| Officers of the Funds (continued): | | | | | |
|
| g WALTER M. KELLY | | | |
|
2/24/70
333 W. Wacker Drive
Chicago, IL 60606 | | Chief Compliance
Officer and
Vice President | | | 2003 | | | Senior Vice President (since 2008) and Assistant Secretary (since 2003) of Nuveen Fund Advisors, Inc. | | | 238 | | |
|
| g TINA M. LAZAR | | | |
|
8/27/61
333 W. Wacker Drive
Chicago, IL 60606 | | Vice President | | | 2002 | | | Senior Vice President (since 2010), formerly, Vice President (2005-2010) of Nuveen Fund Advisors, Inc. | | | 238 | | |
|
| g KEVIN J. MCCARTHY | | | |
|
3/26/66
333 W. Wacker Drive
Chicago, IL 60606 | | Vice President
and Secretary | | | 2007 | | | Managing Director (since 2008), formerly, Vice President (2007-2008), Nuveen Securities, LLC; Managing Director (since 2008), Assistant Secretary (since 2007) and Co-General Counsel (since 2011) of Nuveen Fund Advisors, Inc.; Managing Director, Assistant Secretary and Associate General Counsel (since 2011) of Nuveen Asset Management, LLC; Managing Director (since 2008), and Assistant Secretary, Nuveen Investment Holdings, Inc.; Vice President (since 2007) and Assistant Secretary of Nuveen Investments Advisers Inc., NWQ Investment Management Company, LLC, Tradewinds Global Investors LLC, NWQ Holdings, LLC, Symphony Asset Management LLC, Santa Barbara Asset Management, LLC, Nuveen HydePark Group, LLC, Nuveen Investment Solutions, Inc. (since 2007) and of Winslow Capital Management, Inc. (since 2010); Vice President and Secretary (since 2010) of Nuveen Commodities Asset Management, LLC; prior thereto, Partner, Bell, Boyd & Lloyd LLP (1997-2007). | | | 238 | | |
|
| g KATHLEEN L. PRUDHOMME | | | |
|
3/30/53
901 Marquette Avenue
Minneapolis, MN 55402 | | Vice President and Assistant Secretary | | | 2011 | | | Managing Director, Assistant Secretary and Co-General Counsel (since 2011) of Nuveen Fund Advisors, Inc.; Managing Director, Assistant Secretary and Associate General Counsel (since 2011) of Nuveen Asset Management, LLC; Managing Director and Assistant Secretary (since 2011) of Nuveen Securities, LLC; formerly, Deputy General Counsel, FAF Advisors, Inc. (2004-2010). | | | 238 | | |
|
(1) The Board Members serve three year terms. The Board of Trustees is divided into three classes. Class I, Class II, and Class III, with each being elected to serve until the third succeeding annual shareholders' meeting subsequent to its election or thereafter in each case when its respective successors are duly elected or appointed. The first year elected or appointed represents the year in which the board member was first elected or appointed to any fund in the Nuveen Complex.
(2) Also serves as a trustee of the Nuveen Diversified Commodity Fund, an exchange-traded commodity pool managed by Nuveen Commodities Asset Management, LLC, an affiliate of the Adviser.
(3) Mr. Amboian is an interested Trustee because of his position with Nuveen Investments, Inc. and certain of its subsidiaries, which are affiliates of the Nuveen Funds.
(4) Officers serve one year terms through August of each year. The year first elected or appointed represents the year in which the Officer was first elected or appointed to any fund in the Nuveen Complex.
Nuveen Investments
44
Reinvest Automatically
Easily and Conveniently
Nuveen makes reinvesting easy. A phone call is all it takes to set up your reinvestment account.
Nuveen Closed-End Funds Automatic Reinvestment Plan
Your Nuveen Closed-End Fund allows you to conveniently reinvest distributions in additional Fund shares.
By choosing to reinvest, you'll be able to invest money regularly and automatically, and watch your investment grow through the power of compounding. Just like distributions in cash, there may be times when income or capital gains taxes may be payable on distributions that are reinvested.
It is important to note that an automatic reinvestment plan does not ensure a profit, nor does it protect you against loss in a declining market.
Easy and convenient
To make recordkeeping easy and convenient, each quarter you'll receive a statement showing your total distributions, the date of investment, the shares acquired and the price per share, and the total number of shares you own.
How shares are purchased
The shares you acquire by reinvesting will either be purchased on the open market or newly issued by the Fund. If the shares are trading at or above net asset value at the time of valuation, the Fund will issue new shares at the greater of the net asset value or 95% of the then-current market price. If the shares are trading at less than net asset value, shares for your account will be purchased on the open market. If the Plan Agent begins purchasing Fund shares on the open market while shares are trading below net asset value, but the Fund's shares subsequently trade at or above their net asset value before the Plan Agent is able to complete its purchases, the Plan Agent may cease open-market purchases and may invest the uninvested portion of the distribution in newly-issued Fund shares at a price equal to the greater of the shares' net asset value or 95% of the shares' market value on the last business day immediately prior to the purchase date. Distributions received to purchase shares in the open market will normally be invested shortly after the distribution payment date. No interest will be paid on distributions awaiting reinvestment. Because the market price of the shares may increase before purchases are completed, the average purchase price per share may exceed the market price at the time of valuation, resulting in the acquisition of fewer shares than if the distribution had been paid in shares issued by the Fund. A pro rata portion of any applicable brokerage commissions on open market purchases will be paid
Nuveen Investments
45
Reinvest Automatically
Easily and Conveniently (continued)
by Plan participants. These commissions usually will be lower than those charged on individual transactions.
Flexible
You may change your distribution option or withdraw from the Plan at any time, should your needs or situation change.
You can reinvest whether your shares are registered in your name, or in the name of a brokerage firm, bank, or other nominee. Ask your financial advisor if his or her firm will participate on your behalf. Participants whose shares are registered in the name of one firm may not be able to transfer the shares to another firm and continue to participate in the Plan.
The Fund reserves the right to amend or terminate the Plan at any time. Although the Fund reserves the right to amend the Plan to include a service charge payable by the participants, there is no direct service charge to participants in the Plan at this time.
Call today to start reinvesting distributions
For more information on the Nuveen Automatic Reinvestment Plan or to enroll in or withdraw from the Plan, speak with your financial advisor or call us at (800) 257-8787.
Nuveen Investments
46
Glossary of Terms
Used in this Report
• Average Annual Total Return: This is a commonly used method to express an investment's performance over a particular, usually multi-year time period. It expresses the return that would have been necessary each year to equal the investment's actual cumulative performance (including change in NAV or market price and reinvested dividends and capital gains distributions, if any) over the time period being considered.
• Collateralized Debt Obligations (CDOs): Collateralized debt obligations are a type of asset-backed security constructed from a portfolio of fixed-income assets. CDOs usually are divided into different tranches having different ratings and paying different interest rates. Losses, if any, are applied in reverse order of seniority and so junior tranches generally offer higher coupons to compensate for added default risk.
• Comparative Benchmark: A blended return comprised of: 1) 56% of the return of the Russell 3000 Value Index, which measures the performance of those Russell 3000 Index companies with lower price-to book ratios and lower forecasted growth values, 2) 16% of the return of the MSCI EAFE ex-Japan Value Index, a capitalization weighted index that selects the lower 50% of the price-to-book ranked value stocks traded in the developed markets of Europe, Asia and the Far East, excluding Japan, 3) 8% of the return of the Merrill Lynch DRD (dividends received deduction) Preferred Index, which consists of investment-grade, DRD-eligible, exchange-traded preferred stocks with one year or more to maturity, and 4) 20% of the return of the CSFB Leveraged Loan Index, which consists of approximately $150 billion of tradable term loans with at least one year to maturity and rated BBB or lower. Index returns assume the reinvestment of distributions, but do not include the effects of any applicable sales charges or management fees. It is not possible to invest directly in an index.
• Current Distribution Rate: Current distribution rate is based on the Fund's current annualized quarterly distribution divided by the Fund's current market price. The Fund's quarterly distributions to its shareholders may be comprised of ordinary income, net realized capital gains and, if at the end of the calendar year the Fund's cumulative net ordinary income and net realized gains are less than the amount of the Fund's distributions, a tax return of capital.
• Effective Leverage: Effective leverage is a Fund's effective economic leverage, and includes both regulatory leverage and the leverage effects of certain derivative investments in the Fund's portfolio.
• Leverage: Using borrowed money to invest in securities or other assets.
• Net Asset Value (NAV): The net market value of all securities held in a portfolio.
Nuveen Investments
47
Glossary of Terms
Used in this Report (continued)
• Net Asset Value (NAV) Per Share: The market value of one share of a mutual fund or closed-end fund. For a Fund, the NAV is calculated daily by taking the Fund's total assets (securities, cash, and accrued earnings), subtracting the Fund's liabilities, and dividing by the number of shares outstanding.
• Regulatory Leverage: Regulatory Leverage consists of preferred shares or debt issued by the Fund. Both of these are part of the Fund's capital structure. Regulatory leverage is sometimes referred to as "'40 Act Leverage" and is subject to asset coverage limits set in the Investment Company Act of 1940.
• S&P 500 Index: An unmanaged index generally considered representative of the U.S. stock market. Index returns assume reinvestment of distributions, but do not include the effects of any applicable sales charges or management fees. It is not possible to invest directly in an index.
Nuveen Investments
48
Notes
Nuveen Investments
49
Notes
Nuveen Investments
50
Other Useful Information
Board of Trustees
John P. Amboian
Robert P. Bremner
Jack B. Evans
William C. Hunter
David J. Kundert
William J. Schneider
Judith M. Stockdale
Carole E. Stone
Virginia L. Stringer
Terence J. Toth
Fund Manager
Nuveen Fund Advisors, Inc.
333 West Wacker Drive
Chicago, IL 60606
Custodian
State Street Bank & Trust Company
Boston, MA
Transfer Agent and
Shareholder Services
State Street Bank & Trust Company
Nuveen Funds
P.O. Box 43071
Providence, RI 02940-3071
(800) 257-8787
Legal Counsel
Chapman and Cutler LLP
Chicago, IL
Independent Registered
Public Accounting Firm
Ernst & Young LLP
Chicago, IL
Quarterly Portfolio of Investments and Proxy Voting Information
You may obtain (i) the Fund's quarterly portfolio of investments, (ii) information regarding how the Fund voted proxies relating to portfolio securities held during the most recent twelve-month period ended June 30, and (iii) a description of the policies and procedures that the Fund used to determine how to vote proxies relating to portfolio securities without charge, upon request, by calling Nuveen Investments toll-free at (800) 257-8787 or on Nuveen's website at www.nuveen.com.
You may also obtain this and other Fund information directly from the Securities and Exchange Commission (SEC). The SEC may charge a copying fee for this information. Visit the SEC on-line at http://www.sec.gov or in person at the SEC's Public Reference Room in Washington, D.C. Call the SEC at (202) 942-8090 for room hours and operation. You may also request Fund information by sending an e-mail request to publicinfo@sec.gov or by writing to the SEC's Public Reference Section at 100 F Street NE, Washington, D.C. 20549.
CEO Certification Disclosure
The Fund's Chief Executive Officer has submitted to the New York Stock Exchange (NYSE) the annual CEO certification as required by Section 303A.12(a) of the NYSE Listed Company Manual.
The Fund has filed with the SEC the certification of its Chief Executive Officer and Chief Financial Officer required by Section 302 of the Sarbanes-Oxley Act.
Distribution Information
The Fund hereby designates its percentages of dividends paid from net ordinary income as dividends qualifying for the 70% dividends received deduction (DRD) for corporations and its percentages as qualified dividend income (QDI) for individuals under Section 1(h)(11) of the Internal Revenue Code as shown in the accompanying table. The actual qualified dividend income distributions will be reported to shareholders on Form 1099-DIV which will be sent to shareholders shortly after calendar year end.
| | | % of DRD | | % of QDI | |
| JTA | | | 61.59 | % | | | 87.96 | % | |
Common Share Information
The Fund intends to repurchase shares of its own common stock in the future at such times and in such amounts as is deemed advisable. During the period covered by this report, the Fund repurchased shares of its common stock as shown in the accompanying table.
| | | Common Shares
Repurchased | |
| JTA | | | 30,062 | | |
Any future repurchases will be reported to shareholders in the next annual or semi-annual report.
Nuveen Investments
51
Nuveen Investments:
Serving Investors for Generations
Since 1898, financial advisors and their clients have relied on Nuveen Investments to provide dependable investment solutions through continued adherence to proven, long-term investing principles. Today, we offer a range of high quality equity and fixed-income solutions designed to be integral components of a well-diversified core portfolio.
Focused on meeting investor needs.
Nuveen Investments provides high-quality investment services designed to help secure the long-term goals of institutional and individual investors as well as the consultants and financial advisors who serve them. Nuveen Investments markets a wide range of specialized investment solutions which provide investors access to capabilities of its high-quality boutique investment affiliates—Nuveen Asset Management, Symphony Asset Management, NWQ Investment Management Company, Santa Barbara Asset Management, Tradewinds Global Investors, Winslow Capital Management and Gresham Investment Management. In total, Nuveen Investments managed $220 billion as of December 31, 2011.
Find out how we can help you.
To learn more about how the products and services of Nuveen Investments may be able to help you meet your financial goals, talk to your financial advisor, or call us at (800) 257-8787. Please read the information provided carefully before you invest. Investors should consider the investment objective and policies, risk considerations, charges and expenses of any investment carefully. Where applicable, be sure to obtain a prospectus, which contains this and other relevant information. To obtain a prospectus, please contact your securities representative or Nuveen Investments, 333 W. Wacker Dr., Chicago, IL 60606. Please read the prospectus carefully before you invest or send money.
Learn more about Nuveen Funds at: www.nuveen.com/cef
Distributed by
Nuveen Securities, LLC
333 West Wacker Drive
Chicago, IL 60606
www.nuveen.com/cef
EAN-C-1211D
ITEM 2. CODE OF ETHICS.
As of the end of the period covered by this report, the registrant has adopted a code of ethics that applies to the registrant’s principal executive officer, principal financial officer, principal accounting officer or controller, or persons performing similar functions. There were no amendments to or waivers from the Code during the period covered by this report. The registrant has posted the code of ethics on its website at www.nuveen.com/CEF/Info/Shareholder/. (To view the code, click on Fund Governance and then click on Code of Conduct.)
ITEM 3. AUDIT COMMITTEE FINANCIAL EXPERT.
The registrant’s Board of Directors or Trustees (“Board”) determined that the registrant has at least one “audit committee financial expert” (as defined in Item 3 of Form N-CSR) serving on its Audit Committee. The registrant’s audit committee financial expert is Carole E. Stone, who is “independent” for purposes of Item 3 of Form N-CSR.
Ms. Stone served for five years as Director of the New York State Division of the Budget. As part of her role as Director, Ms. Stone was actively involved in overseeing the development of the State’s operating, local assistance and capital budgets, its financial plan and related documents; overseeing the development of the State’s bond-related disclosure documents and certifying that they fairly presented the State’s financial position; reviewing audits of various State and local agencies and programs; and coordinating the State’s system of internal audit and control. Prior to serving as Director, Ms Stone worked as a budget analyst/examiner with increasing levels of responsibility over a 30 year period, including approximately five years as Deputy Budget Director. Ms. Stone has also served as Chair of the New York State Racing Association Oversight Board, as Chair of the Public Authorities Control Board, as a Commissioner on the New York State Commission on Public Authority Reform and as a member of the Boards of Directors of several New York State public authorities. These positions have involved overseeing operations and finances of certain entities and assessing the adequacy of project/entity financing and financial reporting. Currently, Ms. Stone is on the Board of Directors of CBOE Holdings, Inc., of the Chicago Board Options Exchange, and of C2 Options Exchange. Ms. Stone’s position on the boards of these entities and as a member of both CBOE Holdings’ Audit Committee and its Finance Committee has involved, among other things, the oversight of audits, audit plans and preparation of financial statements.
ITEM 4. PRINCIPAL ACCOUNTANT FEES AND SERVICES.
NUVEEN TAX-ADVANTAGED TOTAL RETURN STRATEGY FUND
The following tables show the amount of fees that Ernst & Young LLP, the Fund’s auditor, billed to the Fund during the Fund’s last two full fiscal years. For engagements with Ernst & Young LLP the Audit Committee approved in advance all audit services and non-audit services that Ernst & Young LLP provided to the Fund, except for those non-audit services that were subject to the pre-approval exception under Rule 2-01 of Regulation S-X (the “pre-approval exception”). The pre-approval exception for services provided directly to the Fund waives the pre-approval requirement for services other than audit, review or attest services if: (A) the aggregate amount of all such services provided constitutes no more than 5% of the total amount of revenues paid by the Fund to its accountant during the fiscal year in which the services are provided; (B) the Fund did not recognize the services as non-audit services at the time of the engagement; and (C) the services are promptly brought to the Audit Committee’s attention, and the Committee (or its delegate) approves the services before the audit is completed.
The Audit Committee has delegated certain pre-approval responsibilities to its Chairman (or, in his absence, any other member of the Audit Committee).
SERVICES THAT THE FUND’S AUDITOR BILLED TO THE FUND
| | Audit Fees Billed | | Audit-Related Fees | | Tax Fees | | All Other Fees | |
Fiscal Year Ended | | to Fund (1) | | Billed to Fund (2) | | Billed to Fund (3) | | Billed to Fund (4) | |
December 31, 2011 | | $ | 26,100 | | $ | 0 | | $ | 0 | | $ | 0 | |
| | | | | | | | | |
Percentage approved pursuant to pre-approval exception | | 0 | % | 0 | % | 0 | % | 0 | % |
| | | | | | | | | |
December 31, 2010 | | $ | 26,100 | | $ | 0 | | $ | 0 | | $ | 0 | |
| | | | | | | | | |
Percentage approved pursuant to pre-approval exception | | 0 | % | 0 | % | 0 | % | 0 | % |
(1) | “Audit Fees” are the aggregate fees billed for professional services for the audit of the Fund’s annual financial statements and services provided in connection with statutory and regulatory filings or engagements. |
| |
(2) | “Audit Related Fees” are the aggregate fees billed for assurance and related services reasonably related to the performance of the audit or review of financial statements and are not reported under “Audit Fees”. |
| |
(3) | “Tax Fees” are the aggregate fees billed for professional services for tax advice, tax compliance, and tax planning. |
| |
(4) | “All Other Fees” are the aggregate fees billed for products and services for agreed upon procedures engagements performed for leveraged funds. |
SERVICES THAT THE FUND’S AUDITOR BILLED TO THE
ADVISER AND AFFILIATED FUND SERVICE PROVIDERS
The following tables show the amount of fees billed by Ernst & Young LLP to Nuveen Fund Advisors, Inc. (formerly Nuveen Asset Management) (the “Adviser”), and any entity controlling, controlled by or under common control with the Advisor that provides ongoing services to the Fund (“Affiliated Fund Service Provider”), for engagements directly related to the Fund’s operations and financial reporting, during the Fund’s last two full fiscal years.
The tables also show the percentage of fees subject to the pre-approval exception. The pre-approval exception for services provided to the Adviser and any Affiliated Fund Service Provider (other than audit, review or attest services) waives the pre-approval requirement if: (A) the aggregate amount of all such services provided constitutes no more than 5% of the total amount of revenues paid to Ernst & Young LLP by the Fund, the Adviser and Affiliated Fund Service Providers during the fiscal year in which the services are provided that would have to be pre-approved by the Audit Committee; (B) the Fund did not recognize the services as non-audit services at the time of the engagement; and (C) the services are promptly brought to the Audit Committee’s attention, and the Committee (or its delegate) approves the services before the Fund’s audit is completed.
| | Audit-Related Fees | | Tax Fees Billed to | | All Other Fees | |
| | Billed to Adviser and | | Adviser and | | Billed to Adviser | |
| | Affiliated Fund | | Affiliated Fund | | and Affiliated Fund | |
Fiscal Year Ended | | Service Providers | | Service Providers | | Service Providers | |
December 31, 2011 | | $ | 0 | | $ | 0 | | $ | 0 | |
| | | | | | | |
Percentage approved pursuant to pre-approval exception | | 0 | % | 0 | % | 0 | % |
| | | | | | | |
December 31, 2010 | | $ | 0 | | $ | 0 | | $ | 0 | |
| | | | | | | |
Percentage approved pursuant to pre-approval exception | | 0 | % | 0 | % | 0 | % |
NON-AUDIT SERVICES
The following table shows the amount of fees that Ernst & Young LLP billed during the Fund’s last two full fiscal years for non-audit services. The Audit Committee is required to pre-approve non-audit services that Ernst & Young LLP provides to the Adviser and any Affiliated Fund Services Provider, if the engagement related directly to the Fund’s operations and financial reporting (except for those subject to the pre-approval exception described above). The Audit Committee requested and received information from Ernst & Young LLP about any non-audit services that Ernst & Young LLP rendered during the Fund’s last fiscal year to the Adviser and any Affiliated Fund Service Provider. The Committee considered this information in evaluating Ernst & Young LLP’s independence.
| | | | Total Non-Audit Fees | | | | | |
| | | | billed to Adviser and | | | | | |
| | | | Affiliated Fund Service | | Total Non-Audit Fees | | | |
| | | | Providers (engagements | | billed to Adviser and | | | |
| | | | related directly to the | | Affiliated Fund Service | | | |
| | Total Non-Audit Fees | | operations and financial | | Providers (all other | | | |
Fiscal Year Ended | | Billed to Fund | | reporting of the Fund) | | engagements) | | Total | |
December 31, 2011 | | $ | 0 | | $ | 0 | | $ | 0 | | $ | 0 | |
December 31, 2010 | | $ | 0 | | $ | 0 | | $ | 0 | | $ | 0 | |
“Non-Audit Fees billed to Fund” for both fiscal year ends represent “Tax Fees” and “All Other Fees” billed to Fund in their respective amounts from the previous table.
Audit Committee Pre-Approval Policies and Procedures. Generally, the Audit Committee must approve (i) all non-audit services to be performed for the Fund by the Fund’s independent accountants and (ii) all audit and non-audit services to be performed by the Fund’s independent accountants for the Affiliated Fund Service Providers with respect to operations and financial reporting of the Fund. Regarding tax and research projects conducted by the independent accountants for the Fund and Affiliated Fund Service Providers (with respect to operations and financial reports of the Fund) such engagements will be (i) pre-approved by the Audit Committee if they are expected to be for amounts greater than $10,000; (ii) reported to the Audit Committee chairman for his verbal approval prior to engagement if they are expected to be for amounts under $10,000 but greater than $5,000; and (iii) reported to the Audit Committee at the next Audit Committee meeting if they are expected to be for an amount under $5,000.
ITEM 5. AUDIT COMMITTEE OF LISTED REGISTRANTS.
The registrant’s Board has a separately designated Audit Committee established in accordance with Section 3(a)(58)(A) of the Securities Exchange Act of 1934, as amended (15 U.S.C. 78c(a)(58)(A)). The members of the audit committee are Robert P. Bremner, David J. Kundert, William J. Schneider, Carole E. Stone and Terence J. Toth.
ITEM 6. SCHEDULE OF INVESTMENTS.
(a) See Portfolio of Investments in Item 1.
(b) Not applicable.
ITEM 7. DISCLOSURE OF PROXY VOTING POLICIES AND PROCEDURES FOR CLOSED-END MANAGEMENT INVESTMENT COMPANIES.
The Adviser, Nuveen Fund Advisors, Inc., has engaged NWQ Investment Management Company, LLC (“NWQ”) and Symphony Asset Management, LLC (“Symphony”), as Sub-Advisers to provide discretionary investment advisory services (NWQ and Symphony are also collectively referred to as “Sub-Advisers”). As part of these services, the Adviser has also delegated to each Sub-Adviser the full responsibility for proxy voting and related duties in accordance with the Sub-Adviser’s policy and procedures. The Adviser periodically will monitor each Sub-Adviser’s voting to ensure that they are carrying out their duties. The Sub-Advisers’ proxy voting policies and procedures are summarized as follows:
NWQ
With respect to NWQ, NWQ’s Proxy Voting Committee (the “Committee”) is responsible for supervision of the proxy voting process, including identification of material conflicts of interest involving NWQ and the proxy voting process in respect of securities owned on behalf of clients, and circumstances when NWQ may deviate from its policies and procedures. Unless otherwise determined by the Committee, NWQ will cause proxies to be voted consistent with the recommendations or guidelines of an independent third party proxy service or other third party, and in most cases, votes generally in accordance with the recommendations of MSCI Institutional Shareholder Services (“ISS”) on the voting of proxies relating to securities held on behalf of clients’ accounts. Unless otherwise restricted, the Committee reserves the right to override the specific recommendations in any situation where it believes such recommendation is not in its clients’ best interests. The Committee oversees the identification of material conflicts of interest, and where such matter is covered by the recommendations or guidelines of a third party proxy service, it shall cause proxies to be voted in accordance with the applicable recommendation or guidelines, to avoid such conflict. If a material conflict of interest matter is not covered by the third party service provider recommendations, NWQ may (i) vote in accordance with the recommendations of an alternative independent third party or (ii) disclose the conflict to the client, and with their consent, make the proxy voting determination and document the basis for such determination.
NWQ generally does not intend to vote proxies associated with the securities of any issuer if as a result of voting, the issuer restricts such securities from being transacted for a period (this occurs for issuers in a few foreign countries), or where the voting would in NWQ’s judgment result in some other financial, legal, regulatory disability or burden to NWQ or the client (such as imputing control with respect to the issuer).
SYMPHONY
Symphony votes proxies with the objective of maximizing shareholder value for its clients and in accordance with the firm’s Policies and Procedures for Proxy Voting. Symphony’s Proxy Voting Committee is responsible for establishing proxy voting guidelines; review and oversight of the firm’s Policies and Procedures for Proxy Voting; oversight of day-to-day proxy voting related activities; and, for overseeing the activities of proxy service providers utilized by the firm.
Symphony has established guidelines for proxy voting based on the recommendations of an independent third-party proxy service provider. Symphony utilizes one or more independent third-party service providers to vote proxy in accordance with Symphony’s guidelines. Service providers also provide proxy voting related research material as required.
In its Policies and Procedures for Proxy Voting, Symphony specifies a process for identifying and managing conflicts of interest in the proxy voting process so that votes are cast in the best interests of clients. Conflicts of interest may arise from relationships Symphony has with its clients, vendors and lenders. Symphony portfolio managers may change a proxy vote recommended by the firm’s guidelines to resolve a conflict of interest or for other reasons in the best economic interests of clients. Symphony’s Proxy Voting Committee reviews vote changes.
ITEM 8. PORTFOLIO MANAGERS OF CLOSED-END MANAGEMENT INVESTMENT COMPANIES.
Nuveen Fund Advisors, Inc. (NFA) is the registrant’s investment adviser (NFA is also referred to as the “Adviser”). NFA, as Adviser, provides discretionary investment advisory services. NFA is responsible for the selection and on-going monitoring of the Fund’s sub-advisers, managing the Fund’s business affairs and providing certain clerical, bookkeeping and administrative services. The Adviser has engaged Symphony Asset Management, LLC (“Symphony”) and NWQ Investment Management Company, LLC (“NWQ”), as Sub-Advisers to provide discretionary investment advisory services with respect to the registrant’s investments in senior loans and other debt instruments and equity investments, respectively (Symphony and NWQ are also collectively referred to as “Sub-Advisers”). The following section provides information on the portfolio managers at each Sub-Adviser:
Symphony
Item 8(a)(1). PORTFOLIO MANAGER BIOGRAPHIES
Gunther Stein
Mr. Stein, Chief Executive Officer and Chief Investment Officer at Symphony, is responsible for leading Symphony’s fixed-income and equity investments strategies and research and overseeing firm trading. Prior to joining Symphony in 1999, he was a high-yield portfolio manager at Wells Fargo Bank, where he managed a high yield portfolio, was responsible for investing in public high yield bonds and bank loans and managed a team of credit analysts.
Item 8(a)(2). OTHER ACCOUNTS MANAGED
Other Accounts Managed by Symphony PM As of 12/31/11
| | Gunther Stein | |
(a) RICs | | | |
Number of accts | | 18 | |
Assets | | $ | 2,767,586,171 | |
| | | |
(b) Other pooled accts | | | |
Non-performance fee accts | | | |
Number of accts | | 8 | |
Assets | | $ | 66,628,302 | |
Performance fee accts | | | |
Number of accts | | 15 | |
Assets | | $ | 1,066,497,261 | |
| | | |
(c) Other | | | |
Non-performance fee accts | | | |
Number of accts | | 5 | |
Assets | | $ | 52,063,712 | |
Performance fee accts | | | |
Number of accts | | 3 | |
Assets | | $ | 723,157,955 | |
POTENTIAL MATERIAL CONFLICTS OF INTEREST
As described above, the portfolio manager may manage other accounts with investment strategies similar to the Fund, including other investment companies and separately managed accounts. Fees earned by the sub-advisers may vary among these accounts and the portfolio managers may personally invest in some but not all of these accounts. In addition, certain accounts may be subject to performance-based fees. These factors could create conflicts of interest because a portfolio manager may have incentives to favor certain accounts over others, resulting in other accounts outperforming the Fund. A conflict may also exist if a portfolio manager identified a limited investment opportunity that may be appropriate for more than one account, but the Fund is not able to take full advantage of that opportunity due to the need to allocate that opportunity among multiple accounts. In addition, the portfolio manger may execute transactions for another account that may adversely impact the value of securities held by the Fund. However, the sub-advisers believe that these risks are mitigated by the fact that accounts with like investment strategies managed by a particular portfolio manager are generally managed in a similar fashion, subject to exceptions to account for particular investment restrictions or policies applicable only to certain accounts, differences in cash flows and account sizes, and other factors. In addition, each sub-adviser has adopted trade allocation procedures that require equitable allocation of trade orders for a particular security among participating accounts.
Item 8(a)(3). FUND MANAGER COMPENSATION
Symphony investment professionals receive compensation based on three elements: fixed-base salary, participation in a bonus pool and certain long-term incentives.
The fixed-base salary is set at a level determined by Symphony and is reviewed periodically to ensure that it is competitive with base salaries paid by similar financial services companies for persons playing similar roles.
The portfolio manager is also eligible to receive an annual bonus from a pool based on Symphony’s aggregate asset-based and performance fees after all operating expenses. The level of this bonus to each individual portfolio manager is determined by senior management’s assessment of the team’s performance, and the individual’s contribution to and performance on that team. Factors considered in that assessment include the total return and risk-adjusted total return performance of the accounts for which the individual serves as portfolio manager relative to any benchmarks established for those accounts; the individual’s effectiveness in communicating investment performance to investors and/or their advisors; and the individual’s contribution to the firm’s overall investment process and to the execution of investment strategies.
Finally, certain key employees of Symphony, including the portfolio managers, have received profits interests in Symphony which entitle their holders to participate in the firm’s growth over time.
Item 8(a)(4). OWNERSHIP OF JTA SECURITIES AS OF DECEMBER 31, 2011
Name of Portfolio
Manager | | None | | $1 -
$10,000 | | $10,001-
$50,000 | | $50,001-
$100,000 | | $100,001-
$500,000 | | $500,001-
$1,000,000 | | Over
$1,000,000 | |
Gunther Stein | | X | | | | | | | | | | | | | |
NWQ
Item 8(a)(1). PORTFOLIO MANAGER BIOGRAPHIES
Jon D. Bosse, CFA, Chief Investment Officer, Co-President of NWQ, and Portfolio Manager
Prior to joining NWQ in 1996, Mr. Bosse spent ten years with ARCO Investment Management Company where, in addition to managing a value-oriented fund, he was the Director of Equity Research. Previously, he spent four years with ARCO in Corporate Finance. Mr. Bosse received his B.A. in Economics from Washington University, St. Louis, where he was awarded the John M. Olin Award for excellence in economics, and graduated summa cum laude. He received his M.B.A. from the Wharton Business School, University of Pennsylvania. In addition, he received his Chartered Financial Analyst designation in 1992 and is a member of the CFA Institute and the Los Angeles Society of Financial Analysts.
Michael Carne, CFA, Managing Director and Fixed Income Portfolio Manager
Prior to joining NWQ in 2002, Mr. Carne managed institutional, private client fixed income and balanced portfolios for over twenty years. During this time, he held assignments as Director of Global Fixed Income at Aetna Capital Management, as Chief Investment Officer of a Phoenix Home Life affiliate and was a principal in Standard Asset Group. Mr. Carne graduated from the University of Massachusetts with a B.B.A. degree in Finance and received his M.B.A. from Harvard University. He earned the designation of Chartered Financial Analyst in 1989.
Item 8(a)(2). OTHER ACCOUNTS MANAGED
| | Jon Bosse | | Michael Carne | |
(a) RICs | | | | | |
Number of accts | | 7 | | 3 | |
Assets ($000s) | | $ | 1,233,672,612 | | $ | 637,724,585 | |
| | | | | |
(b) Other pooled accts | | | | | |
Non-performance fee accts | | | | | |
Number of accts | | 15 | | 0 | |
Assets ($000s) | | $ | 1,432,630,580 | | 0 | |
(c) Other | | | | | |
Non-performance fee accts | | | | | |
Number of accts | | 23,197 | | 6,729 | |
Assets ($000s) | | $ | 12,353,570,682 | * | $ | 1,217,237,095 | |
Performance fee accts | | | | | |
Number of accts | | 9 | | 0 | |
Assets ($000s) | | $ | 1,671,074,961 | | 0 | |
*Includes $742,670,192 of model program assets.
POTENTIAL MATERIAL CONFLICTS OF INTEREST
Actual or apparent conflicts of interest may arise when a portfolio manager has day-to-day management responsibilities with respect to more than one account. More specifically, portfolio managers who manage multiple accounts are presented with the following potential conflicts, which are not intended to be an exhaustive list:
· The management of multiple accounts may result in a portfolio manager devoting unequal time and attention to the management of each account. NWQ seeks to manage such competing interests for the time and attention of portfolio managers by having portfolio managers focus on a particular investment discipline. Most accounts managed by a portfolio manager in a particular investment strategy are managed using the same investment models.
· If a portfolio manager identifies a limited investment opportunity which may be suitable for more than one account, an account may not be able to take full advantage of that opportunity due to an allocation of filled purchase or sale orders across all eligible accounts. To deal with these situations, NWQ has adopted procedures for allocating limited opportunities across multiple accounts.
· With respect to many of its clients’ accounts, NWQ determines which broker to use to execute transaction orders, consistent with its duty to seek to obtain best execution of the transaction. However, with respect to certain other accounts, NWQ may be limited by the client with respect to the selection of brokers or may be instructed to direct trades through a particular broker. In these cases, NWQ may place separate, non-simultaneous, transactions for a Fund and other accounts which may temporarily affect the market price of the security or the execution of the transactions, or both, to the detriment of the Fund or the other accounts.
· The Fund is subject to different regulation than other pooled investment vehicles and other accounts managed by the portfolio managers. As a consequence of this difference in regulatory requirements, the Fund may not be permitted to engage in all the investment techniques or transactions or to engage in these transactions to the same extent as the other accounts managed by the portfolio managers. Finally, the appearance of a conflict of interest may arise where NWQ has an incentive, such as a performance-based management fee, which relates to the management of some accounts, with respect to which a portfolio manager has day-to-day management responsibilities.
NWQ has adopted certain compliance procedures which are designed to address these types of conflicts common among investment managers. However, there is no guarantee that such procedures will detect each and every situation in which a conflict arises.
Item 8(a)(3). FUND MANAGER COMPENSATION
NWQ offers a highly competitive compensation structure with the purpose of attracting and retaining the most talented investment professionals. These professionals are rewarded through a combination of cash and long-term incentive compensation as determined by the firm’s executive committee. Total cash compensation (TCC) consists of both a base salary and an annual bonus that can be a multiple of the base salary. The firm annually benchmarks TCC to prevailing industry norms with the objective of achieving competitive levels for all contributing professionals.
Available bonus pool compensation is primarily a function of the firm’s overall annual profitability, and in the interest of employee and client interest alliance, NWQ’s bonus pool will be augmented should the firm outperform its benchmarks on a 1, 2 and 3 year basis. Individual bonuses are based primarily on the following:
· Overall performance of client portfolios
· Objective review of stock recommendations and the quality of primary research
· Subjective review of the professional’s contributions to portfolio strategy, teamwork, collaboration and work ethic
To further strengthen our incentive compensation package and to create an even stronger alignment to the long-term success of the firm, NWQ provides a number of other incentive opportunities through long-term employment contracts with senior executives, retention agreements, and an equity incentive plan with non-solicitation and non-compete provisions for participating employees. The equity incentive plan provides meaningful equity to employees which is similar to restricted stock and options and which vests over the next 5 to 7 years. Equity incentive plans allowing key employees of NWQ to participate in the firm’s growth over time have been in place since Nuveen’s acquisition of NWQ.
At NWQ, we believe that we are an employer of choice. Our analysts have a meaningful impact on the portfolio and, therefore, are compensated in a manner similar to portfolio managers at many other firms. Benefits besides compensation include a college tuition program for the children of all full-time employees whereby they are eligible for reimbursement of tuition and other mandatory fees, among others.
Item 8(a)(4). OWNERSHIP OF JTA SECURITIES AS OF DECEMBER 31, 2011
Name of Portfolio
Manager | | None | | $1 -
$10,000 | | $10,001-
$50,000 | | $50,001-
$100,000 | | $100,001-
$500,000 | | $500,001-
$1,000,000 | | Over
$1,000,000 | |
Jon Bosse | | X | | | | | | | | | | | | | |
Mike Carne | | X | | | | | | | | | | | | | |
ITEM 9. PURCHASES OF EQUITY SECURITIES BY CLOSED-END MANAGEMENT INVESTMENT COMPANY AND AFFILIATED PURCHASERS.
| | | | (b) | | (c) | | (d)* | |
| | (a) | | AVERAGE | | TOTAL NUMBER OF SHARES | | MAXIMUM NUMBER (OR | |
| | TOTAL NUMBER OF | | PRICE | | (OR UNITS) PURCHASED AS | | APPROXIMATE DOLLAR VALUE) OF | |
| | SHARES (OR | | PAID PER | | PART OF PUBLICLY | | SHARES (OR UNITS) THAT MAY YET | |
| | UNITS) | | SHARE (OR | | ANNOUNCED PLANS OR | | BE PURCHASED UNDER THE PLANS OR | |
Period* | | PURCHASED | | UNIT) | | PROGRAMS | | PROGRAMS | |
| | | | | | | | | |
JANUARY 1-31, 2011 | | 0 | | | | 0 | | 1,390,000 | |
| | | | | | | | | |
FEBRUARY 1-28, 2011 | | 0 | | | | 0 | | 1,390,000 | |
| | | | | | | | | |
MARCH 1-31, 2011 | | 0 | | | | 0 | | 1,390,000 | |
| | | | | | | | | |
APRIL 1-30, 2011 | | 0 | | | | 0 | | 1,390,000 | |
| | | | | | | | | |
MAY 1-31, 2011 | | 0 | | | | 0 | | 1,390,000 | |
| | | | | | | | | |
JUNE 1-30, 2011 | | 0 | | | | 0 | | 1,390,000 | |
| | | | | | | | | |
JULY 1-31, 2011 | | 0 | | | | 0 | | 1,390,000 | |
| | | | | | | | | |
AUGUST 1-31, 2011 | | 13,722 | | $ | 9.17 | | 13,722 | | 1,376,278 | |
| | | | | | | | | |
SEPTEMBER 1-30, 2011 | | 0 | | | | 0 | | 1,376,278 | |
| | | | | | | | | |
OCTOBER 1-31, 2011 | | 0 | | | | 0 | | 1,376,278 | |
| | | | | | | | | |
NOVEMBER 1-30, 2011 | | 13,825 | | $ | 9.62 | | 13,825 | | 1,366,175 | |
| | | | | | | | | |
DECEMBER 1-31, 2011 | | 2,515 | | $ | 9.80 | | 2,515 | | 1,363,660 | |
| | | | | | | | | |
TOTAL | | 30,062 | | | | | | | |
* The registrant’s repurchase program, for the repurchase of 1,390,000 shares, was authorized November 16, 2010. The program was reauthorized for a maximum repurchase amount of 1,380,000 shares on November 16, 2011. Any repurchases made by the registrant pursuant to the program were made through open-market transactions.
ITEM 10. SUBMISSION OF MATTERS TO A VOTE OF SECURITY HOLDERS.
There have been no material changes to the procedures by which shareholders may recommend nominees to the registrant’s Board implemented after the registrant last provided disclosure in response to this Item.
ITEM 11. CONTROLS AND PROCEDURES.
(a) | The registrant’s principal executive and principal financial officers, or persons performing similar functions, have concluded that the registrant’s disclosure controls and procedures (as defined in Rule 30a-3(c) under the Investment Company Act of 1940, as amended (the “1940 Act”) (17 CFR 270.30a-3(c))) are effective, as of a date within 90 days of the filing date of this report that includes the disclosure required by this paragraph, based on their evaluation of the controls and procedures required by Rule 30a-3(b) under the 1940 Act (17 CFR 270.30a-3(b)) and Rules 13a-15(b) or 15d-15(b) under the Securities Exchange Act of 1934, as amended (the “Exchange Act”) (17 CFR 240.13a-15(b) or 240.15d-15(b)). |
| |
(b) | There were no changes in the registrant’s internal control over financial reporting (as defined in Rule 30a-3(d) under the 1940 Act (17 CFR 270.30a-3(d)) that occurred during the second fiscal quarter of the period covered by this report that has materially affected, or is reasonably likely to materially affect, the registrant’s internal control over financial reporting. |
ITEM 12. EXHIBITS.
File the exhibits listed below as part of this Form. Letter or number the exhibits in the sequence indicated.
(a)(1) Any code of ethics, or amendment thereto, that is the subject of the disclosure required by Item 2, to the extent that the registrant intends to satisfy the Item 2 requirements through filing of an exhibit: Not applicable because the code is posted on registrant’s website at www.nuveen.com/CEF/Info/Shareholder/ and there were no amendments during the period covered by this report. (To view the code, click on Fund Governance and then Code of Conduct.)
(a)(2) A separate certification for each principal executive officer and principal financial officer of the registrant as required by Rule 30a-2(a) under the 1940 Act (17 CFR 270.30a-2(a)) in the exact form set forth below: Ex-99.CERT Attached hereto.
(a)(3) Any written solicitation to purchase securities under Rule 23c-1 under the 1940 Act (17 CFR 270.23c-1) sent or given during the period covered by the report by or on behalf of the registrant to 10 or more persons. Not applicable.
(b) If the report is filed under Section 13(a) or 15(d) of the Exchange Act, provide the certifications required by Rule 30a-2(b) under the 1940 Act (17 CFR 270.30a-2(b)); Rule 13a-14(b) or Rule 15d-14(b) under the Exchange Act (17 CFR 240.13a-14(b) or 240.15d-14(b)), and Section 1350 of Chapter 63 of Title 18 of the United States Code (18 U.S.C. 1350) as an exhibit. A certification furnished pursuant to this paragraph will not be deemed “filed” for purposes of Section 18 of the Exchange Act (15 U.S.C. 78r), or otherwise subject to the liability of that section. Such certification will not be deemed to be incorporated by reference into any filing under the Securities Act of 1933 or the Exchange Act, except to the extent that the registrant specifically incorporates it by reference. Ex-99.906 CERT attached hereto.
SIGNATURES
Pursuant to the requirements of the Securities Exchange Act of 1934 and the Investment Company Act of 1940, the registrant has duly caused this report to be signed on its behalf by the undersigned, thereunto duly authorized.
(Registrant) Nuveen Tax-Advantaged Total Return Strategy Fund
By (Signature and Title) | /s/ Kevin J. McCarthy | |
| Kevin J. McCarthy | |
| Vice President and Secretary | |
Date: March 9, 2012
Pursuant to the requirements of the Securities Exchange Act of 1934 and the Investment Company Act of 1940, this report has been signed below by the following persons on behalf of the registrant and in the capacities and on the dates indicated.
By (Signature and Title) | /s/ Gifford R. Zimmerman | |
| Gifford R. Zimmerman | |
| Chief Administrative Officer | |
| (principal executive officer) | |
Date: March 9, 2012
By (Signature and Title) | /s/ Stephen D. Foy | |
| Stephen D. Foy | |
| Vice President and Controller | |
| (principal financial officer) | |
Date: March 9, 2012